Hughes Springs, TX Map & Demographics
Hughes Springs Map
Hughes Springs Overview
$23,647
PER CAPITA INCOME
$50,341
AVG FAMILY INCOME
$53,551
AVG HOUSEHOLD INCOME
35.1%
WAGE / INCOME GAP [ % ]
64.9¢/ $1
WAGE / INCOME GAP [ $ ]
0.42
INEQUALITY / GINI INDEX
1,621
TOTAL POPULATION
757
MALE POPULATION
864
FEMALE POPULATION
87.62
MALES / 100 FEMALES
114.13
FEMALES / 100 MALES
35.7
MEDIAN AGE
2.6
AVG FAMILY SIZE
2.3
AVG HOUSEHOLD SIZE
744
LABOR FORCE [ PEOPLE ]
56.8%
PERCENT IN LABOR FORCE
1.1%
UNEMPLOYMENT RATE
Hughes Springs Zip Codes
Income in Hughes Springs
Income Overview in Hughes Springs
Per Capita Income in Hughes Springs is $23,647, while median incomes of families and households are $50,341 and $53,551 respectively.
| Characteristic | Number | Measure |
| Per Capita Income | 1,621 | $23,647 |
| Median Family Income | 439 | $50,341 |
| Mean Family Income | 439 | $56,445 |
| Median Household Income | 673 | $53,551 |
| Mean Household Income | 673 | $55,152 |
| Income Deficit | 439 | $0 |
| Wage / Income Gap (%) | 1,621 | 35.08% |
| Wage / Income Gap ($) | 1,621 | 64.92¢ per $1 |
| Gini / Inequality Index | 1,621 | 0.42 |
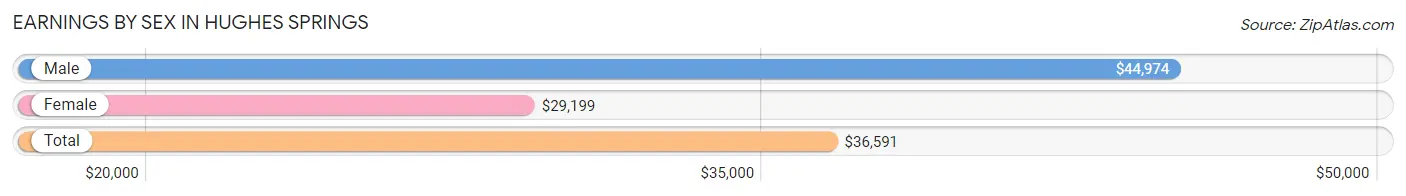
Earnings by Sex in Hughes Springs
Average Earnings in Hughes Springs are $36,591, $44,974 for men and $29,199 for women, a difference of 35.1%.
| Sex | Number | Average Earnings |
| Male | 367 (47.9%) | $44,974 |
| Female | 399 (52.1%) | $29,199 |
| Total | 766 (100.0%) | $36,591 |
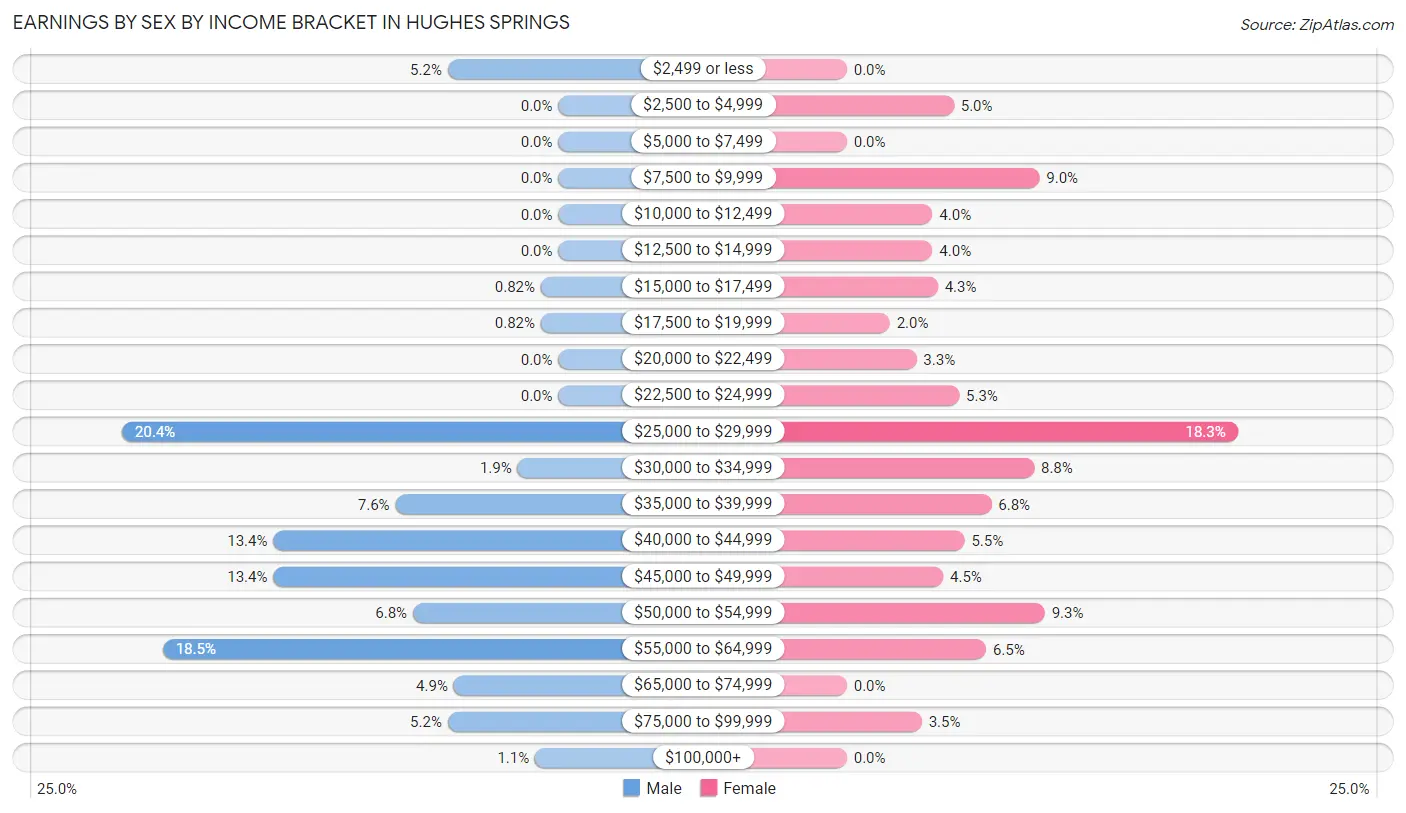
Earnings by Sex by Income Bracket in Hughes Springs
The most common earnings brackets in Hughes Springs are $25,000 to $29,999 for men (75 | 20.4%) and $25,000 to $29,999 for women (73 | 18.3%).
| Income | Male | Female |
| $2,499 or less | 19 (5.2%) | 0 (0.0%) |
| $2,500 to $4,999 | 0 (0.0%) | 20 (5.0%) |
| $5,000 to $7,499 | 0 (0.0%) | 0 (0.0%) |
| $7,500 to $9,999 | 0 (0.0%) | 36 (9.0%) |
| $10,000 to $12,499 | 0 (0.0%) | 16 (4.0%) |
| $12,500 to $14,999 | 0 (0.0%) | 16 (4.0%) |
| $15,000 to $17,499 | 3 (0.8%) | 17 (4.3%) |
| $17,500 to $19,999 | 3 (0.8%) | 8 (2.0%) |
| $20,000 to $22,499 | 0 (0.0%) | 13 (3.3%) |
| $22,500 to $24,999 | 0 (0.0%) | 21 (5.3%) |
| $25,000 to $29,999 | 75 (20.4%) | 73 (18.3%) |
| $30,000 to $34,999 | 7 (1.9%) | 35 (8.8%) |
| $35,000 to $39,999 | 28 (7.6%) | 27 (6.8%) |
| $40,000 to $44,999 | 49 (13.4%) | 22 (5.5%) |
| $45,000 to $49,999 | 49 (13.4%) | 18 (4.5%) |
| $50,000 to $54,999 | 25 (6.8%) | 37 (9.3%) |
| $55,000 to $64,999 | 68 (18.5%) | 26 (6.5%) |
| $65,000 to $74,999 | 18 (4.9%) | 0 (0.0%) |
| $75,000 to $99,999 | 19 (5.2%) | 14 (3.5%) |
| $100,000+ | 4 (1.1%) | 0 (0.0%) |
| Total | 367 (100.0%) | 399 (100.0%) |
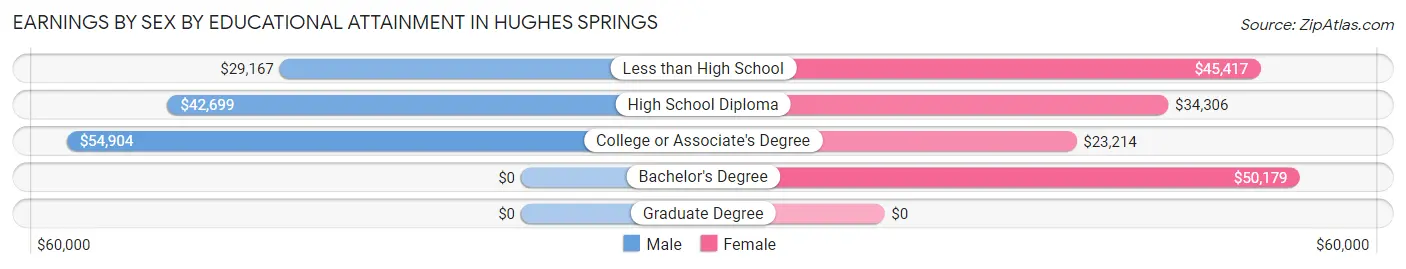
Earnings by Sex by Educational Attainment in Hughes Springs
Average earnings in Hughes Springs are $43,807 for men and $29,808 for women, a difference of 32.0%. Men with an educational attainment of college or associate's degree enjoy the highest average annual earnings of $54,904, while those with less than high school education earn the least with $29,167. Women with an educational attainment of bachelor's degree earn the most with the average annual earnings of $50,179, while those with college or associate's degree education have the smallest earnings of $23,214.
| Educational Attainment | Male Income | Female Income |
| Less than High School | $29,167 | $45,417 |
| High School Diploma | $42,699 | $34,306 |
| College or Associate's Degree | $54,904 | $23,214 |
| Bachelor's Degree | - | - |
| Graduate Degree | - | - |
| Total | $43,807 | $29,808 |
Family Income in Hughes Springs
Family Income Brackets in Hughes Springs
According to the Hughes Springs family income data, there are 87 families falling into the $50,000 to $74,999 income range, which is the most common income bracket and makes up 19.8% of all families.
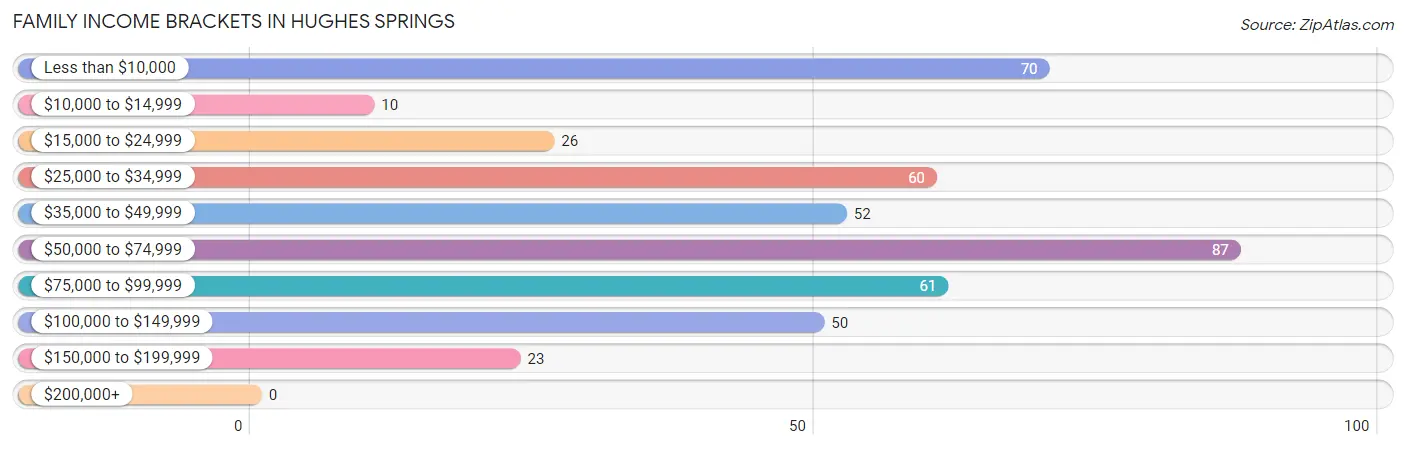
| Income Bracket | # Families | % Families |
| Less than $10,000 | 70 | 15.9% |
| $10,000 to $14,999 | 10 | 2.3% |
| $15,000 to $24,999 | 26 | 5.9% |
| $25,000 to $34,999 | 60 | 13.7% |
| $35,000 to $49,999 | 52 | 11.8% |
| $50,000 to $74,999 | 87 | 19.8% |
| $75,000 to $99,999 | 61 | 13.9% |
| $100,000 to $149,999 | 50 | 11.4% |
| $150,000 to $199,999 | 23 | 5.2% |
| $200,000+ | 0 | 0.0% |
Family Income by Famaliy Size in Hughes Springs
5-person families (27 | 6.1%) account for the highest median family income in Hughes Springs with $150,250 per family, while 5-person families (27 | 6.1%) have the highest median income of $30,050 per family member.
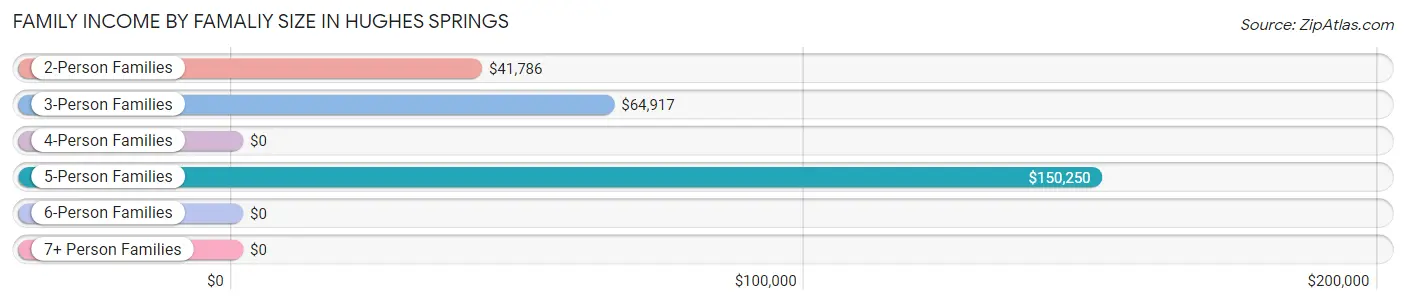
| Income Bracket | # Families | Median Income |
| 2-Person Families | 220 (50.1%) | $41,786 |
| 3-Person Families | 75 (17.1%) | $64,917 |
| 4-Person Families | 114 (26.0%) | $0 |
| 5-Person Families | 27 (6.1%) | $150,250 |
| 6-Person Families | 3 (0.7%) | $0 |
| 7+ Person Families | 0 (0.0%) | $0 |
| Total | 439 (100.0%) | $50,341 |
Family Income by Number of Earners in Hughes Springs
The median family income in Hughes Springs is $50,341, with families comprising 3+ earners (22) having the highest median family income of $150,667, while families with no earners (92) have the lowest median family income of $22,206, accounting for 5.0% and 21.0% of families, respectively.
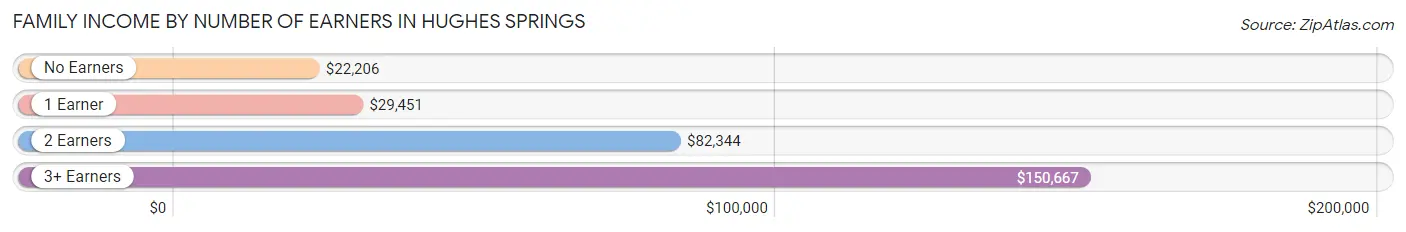
| Number of Earners | # Families | Median Income |
| No Earners | 92 (21.0%) | $22,206 |
| 1 Earner | 180 (41.0%) | $29,451 |
| 2 Earners | 145 (33.0%) | $82,344 |
| 3+ Earners | 22 (5.0%) | $150,667 |
| Total | 439 (100.0%) | $50,341 |
Household Income in Hughes Springs
Household Income Brackets in Hughes Springs
With 183 households falling in the category, the $50,000 to $74,999 income range is the most frequent in Hughes Springs, accounting for 27.2% of all households.
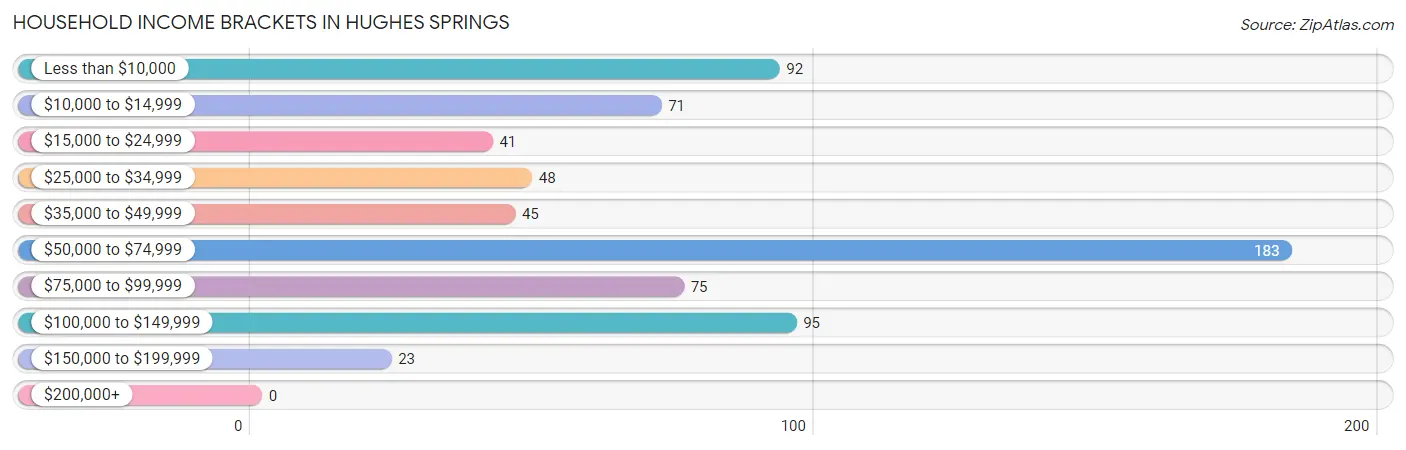
| Income Bracket | # Households | % Households |
| Less than $10,000 | 92 | 13.7% |
| $10,000 to $14,999 | 71 | 10.5% |
| $15,000 to $24,999 | 41 | 6.1% |
| $25,000 to $34,999 | 48 | 7.1% |
| $35,000 to $49,999 | 45 | 6.7% |
| $50,000 to $74,999 | 183 | 27.2% |
| $75,000 to $99,999 | 75 | 11.1% |
| $100,000 to $149,999 | 95 | 14.1% |
| $150,000 to $199,999 | 23 | 3.4% |
| $200,000+ | 0 | 0.0% |
Household Income by Householder Age in Hughes Springs
The median household income in Hughes Springs is $53,551, with the highest median household income of $64,028 found in the 45 to 64 years age bracket for the primary householder. A total of 207 households (30.8%) fall into this category. Meanwhile, the 65+ years age bracket for the primary householder has the lowest median household income of $29,531, with 155 households (23.0%) in this group.
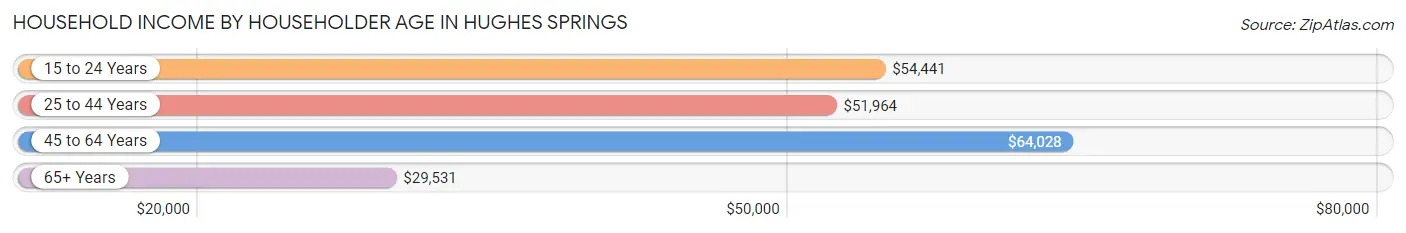
| Income Bracket | # Households | Median Income |
| 15 to 24 Years | 69 (10.2%) | $54,441 |
| 25 to 44 Years | 242 (36.0%) | $51,964 |
| 45 to 64 Years | 207 (30.8%) | $64,028 |
| 65+ Years | 155 (23.0%) | $29,531 |
| Total | 673 (100.0%) | $53,551 |
Poverty in Hughes Springs
Income Below Poverty by Sex and Age in Hughes Springs
With 19.8% poverty level for males and 23.7% for females among the residents of Hughes Springs, 5 year old males and 5 year old females are the most vulnerable to poverty, with 33 males (91.7%) and 7 females (100.0%) in their respective age groups living below the poverty level.
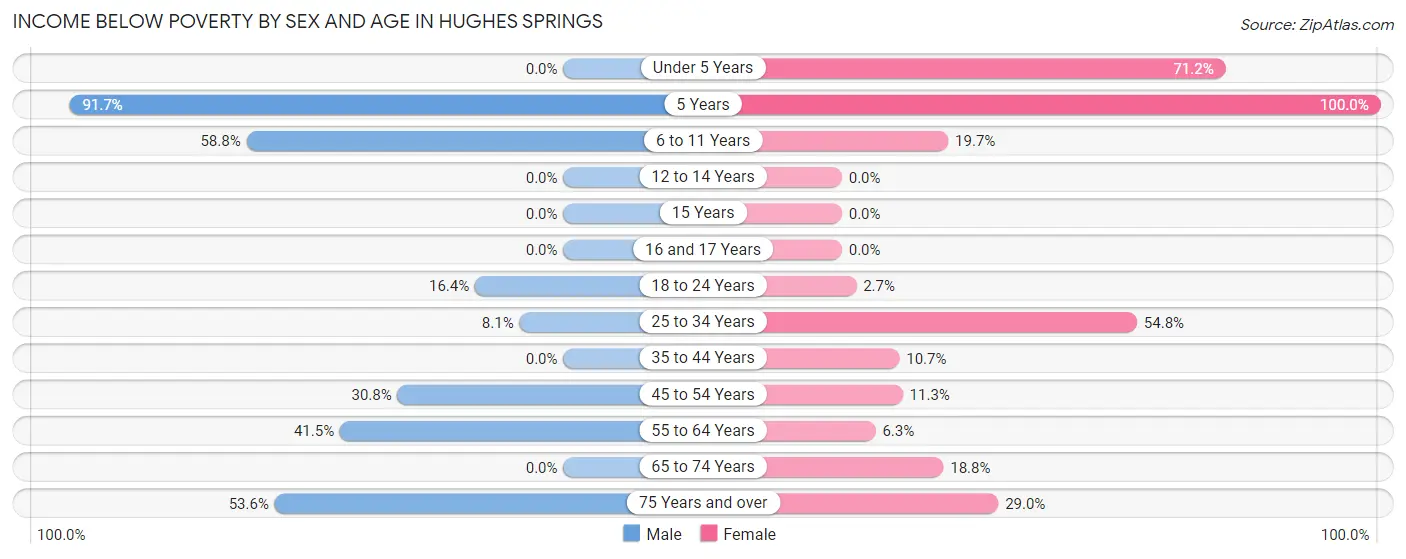
| Age Bracket | Male | Female |
| Under 5 Years | 0 (0.0%) | 47 (71.2%) |
| 5 Years | 33 (91.7%) | 7 (100.0%) |
| 6 to 11 Years | 20 (58.8%) | 15 (19.7%) |
| 12 to 14 Years | 0 (0.0%) | 0 (0.0%) |
| 15 Years | 0 (0.0%) | 0 (0.0%) |
| 16 and 17 Years | 0 (0.0%) | 0 (0.0%) |
| 18 to 24 Years | 10 (16.4%) | 3 (2.7%) |
| 25 to 34 Years | 14 (8.1%) | 63 (54.8%) |
| 35 to 44 Years | 0 (0.0%) | 11 (10.7%) |
| 45 to 54 Years | 32 (30.8%) | 13 (11.3%) |
| 55 to 64 Years | 17 (41.5%) | 4 (6.2%) |
| 65 to 74 Years | 0 (0.0%) | 13 (18.8%) |
| 75 Years and over | 15 (53.6%) | 18 (29.0%) |
| Total | 141 (19.8%) | 194 (23.7%) |
Income Above Poverty by Sex and Age in Hughes Springs
According to the poverty statistics in Hughes Springs, males aged under 5 years and females aged 12 to 14 years are the age groups that are most secure financially, with 100.0% of males and 100.0% of females in these age groups living above the poverty line.
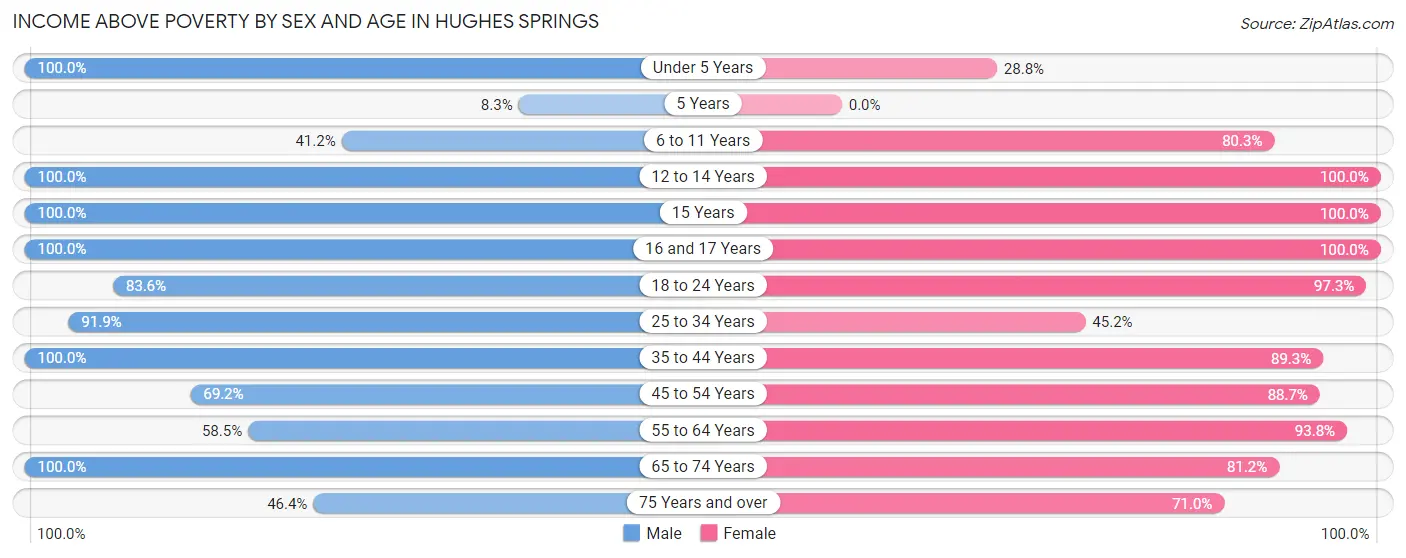
| Age Bracket | Male | Female |
| Under 5 Years | 65 (100.0%) | 19 (28.8%) |
| 5 Years | 3 (8.3%) | 0 (0.0%) |
| 6 to 11 Years | 14 (41.2%) | 61 (80.3%) |
| 12 to 14 Years | 9 (100.0%) | 8 (100.0%) |
| 15 Years | 6 (100.0%) | 5 (100.0%) |
| 16 and 17 Years | 5 (100.0%) | 18 (100.0%) |
| 18 to 24 Years | 51 (83.6%) | 109 (97.3%) |
| 25 to 34 Years | 158 (91.9%) | 52 (45.2%) |
| 35 to 44 Years | 74 (100.0%) | 92 (89.3%) |
| 45 to 54 Years | 72 (69.2%) | 102 (88.7%) |
| 55 to 64 Years | 24 (58.5%) | 60 (93.8%) |
| 65 to 74 Years | 77 (100.0%) | 56 (81.2%) |
| 75 Years and over | 13 (46.4%) | 44 (71.0%) |
| Total | 571 (80.2%) | 626 (76.3%) |
Income Below Poverty Among Married-Couple Families in Hughes Springs
The poverty statistics for married-couple families in Hughes Springs show that 5.6% or 15 of the total 269 families live below the poverty line. Families with no children have the highest poverty rate of 6.8%, comprising of 11 families. On the other hand, families with 3 or 4 children have the lowest poverty rate of 0.0%, which includes 0 families.
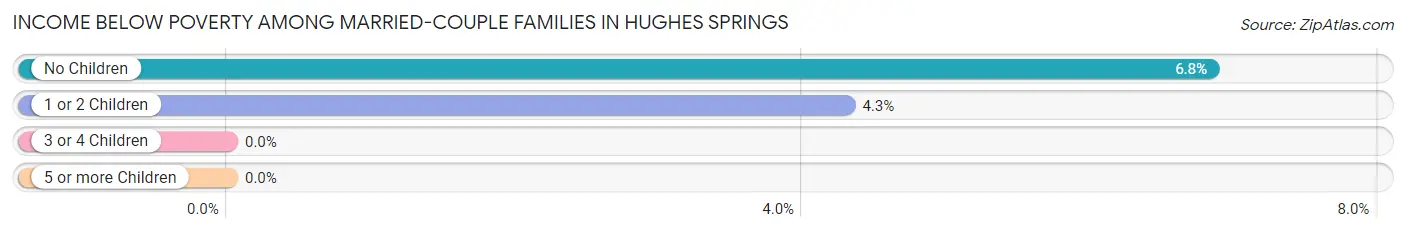
| Children | Above Poverty | Below Poverty |
| No Children | 150 (93.2%) | 11 (6.8%) |
| 1 or 2 Children | 89 (95.7%) | 4 (4.3%) |
| 3 or 4 Children | 15 (100.0%) | 0 (0.0%) |
| 5 or more Children | 0 (0.0%) | 0 (0.0%) |
| Total | 254 (94.4%) | 15 (5.6%) |
Income Below Poverty Among Single-Parent Households in Hughes Springs
According to the poverty data in Hughes Springs, 25.0% or 3 single-father households and 44.3% or 70 single-mother households are living below the poverty line. Among single-father households, those with 1 or 2 children have the highest poverty rate, with 3 households (37.5%) experiencing poverty. Likewise, among single-mother households, those with 3 or 4 children have the highest poverty rate, with 23 households (100.0%) falling below the poverty line.
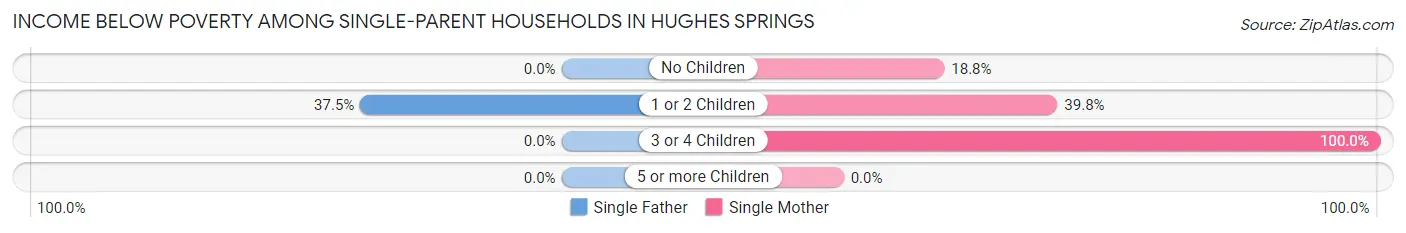
| Children | Single Father | Single Mother |
| No Children | 0 (0.0%) | 6 (18.8%) |
| 1 or 2 Children | 3 (37.5%) | 41 (39.8%) |
| 3 or 4 Children | 0 (0.0%) | 23 (100.0%) |
| 5 or more Children | 0 (0.0%) | 0 (0.0%) |
| Total | 3 (25.0%) | 70 (44.3%) |
Income Below Poverty Among Married-Couple vs Single-Parent Households in Hughes Springs
The poverty data for Hughes Springs shows that 15 of the married-couple family households (5.6%) and 73 of the single-parent households (42.9%) are living below the poverty level. Within the married-couple family households, those with no children have the highest poverty rate, with 11 households (6.8%) falling below the poverty line. Among the single-parent households, those with 3 or 4 children have the highest poverty rate, with 23 household (100.0%) living below poverty.
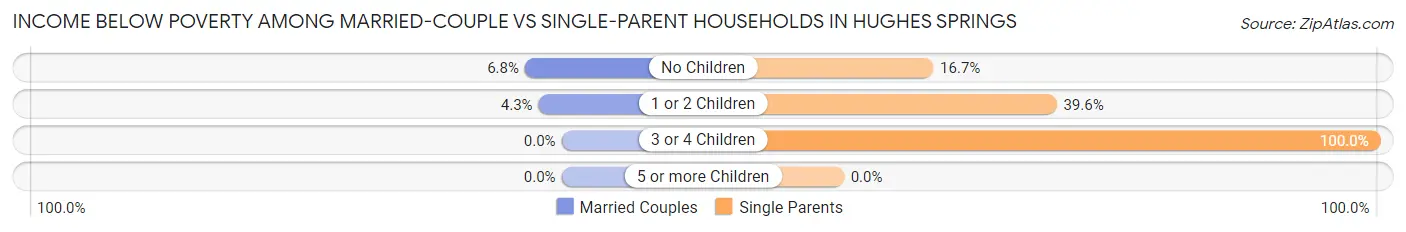
| Children | Married-Couple Families | Single-Parent Households |
| No Children | 11 (6.8%) | 6 (16.7%) |
| 1 or 2 Children | 4 (4.3%) | 44 (39.6%) |
| 3 or 4 Children | 0 (0.0%) | 23 (100.0%) |
| 5 or more Children | 0 (0.0%) | 0 (0.0%) |
| Total | 15 (5.6%) | 73 (42.9%) |
Race in Hughes Springs
The most populous races in Hughes Springs are White / Caucasian (1,264 | 78.0%), Hispanic or Latino (242 | 14.9%), and Black / African American (166 | 10.2%).
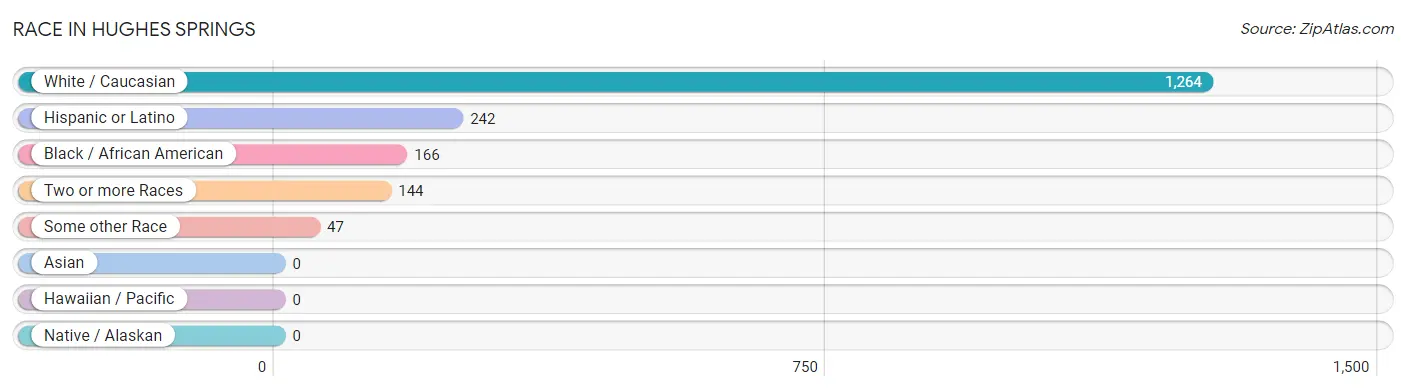
| Race | # Population | % Population |
| Asian | 0 | 0.0% |
| Black / African American | 166 | 10.2% |
| Hawaiian / Pacific | 0 | 0.0% |
| Hispanic or Latino | 242 | 14.9% |
| Native / Alaskan | 0 | 0.0% |
| White / Caucasian | 1,264 | 78.0% |
| Two or more Races | 144 | 8.9% |
| Some other Race | 47 | 2.9% |
| Total | 1,621 | 100.0% |
Ancestry in Hughes Springs
The most populous ancestries reported in Hughes Springs are American (619 | 38.2%), Mexican (214 | 13.2%), Irish (81 | 5.0%), English (73 | 4.5%), and German (63 | 3.9%), together accounting for 64.8% of all Hughes Springs residents.
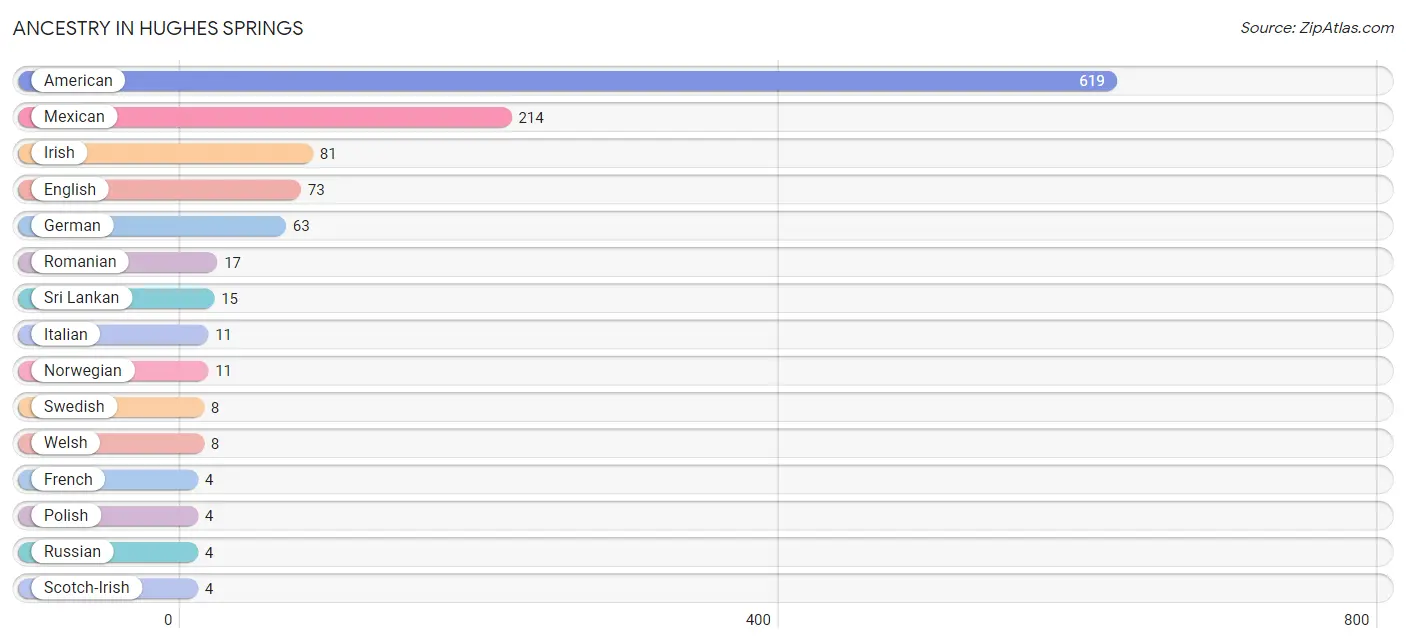
| Ancestry | # Population | % Population |
| American | 619 | 38.2% |
| English | 73 | 4.5% |
| European | 1 | 0.1% |
| French | 4 | 0.3% |
| German | 63 | 3.9% |
| Irish | 81 | 5.0% |
| Italian | 11 | 0.7% |
| Mexican | 214 | 13.2% |
| Norwegian | 11 | 0.7% |
| Polish | 4 | 0.3% |
| Romanian | 17 | 1.1% |
| Russian | 4 | 0.3% |
| Scotch-Irish | 4 | 0.3% |
| Sri Lankan | 15 | 0.9% |
| Swedish | 8 | 0.5% |
| Welsh | 8 | 0.5% | View All 16 Rows |
Immigrants in Hughes Springs
The most numerous immigrant groups reported in Hughes Springs came from Central America (65 | 4.0%), Latin America (65 | 4.0%), Mexico (65 | 4.0%), Eastern Europe (17 | 1.1%), and Europe (17 | 1.1%), together accounting for 14.1% of all Hughes Springs residents.
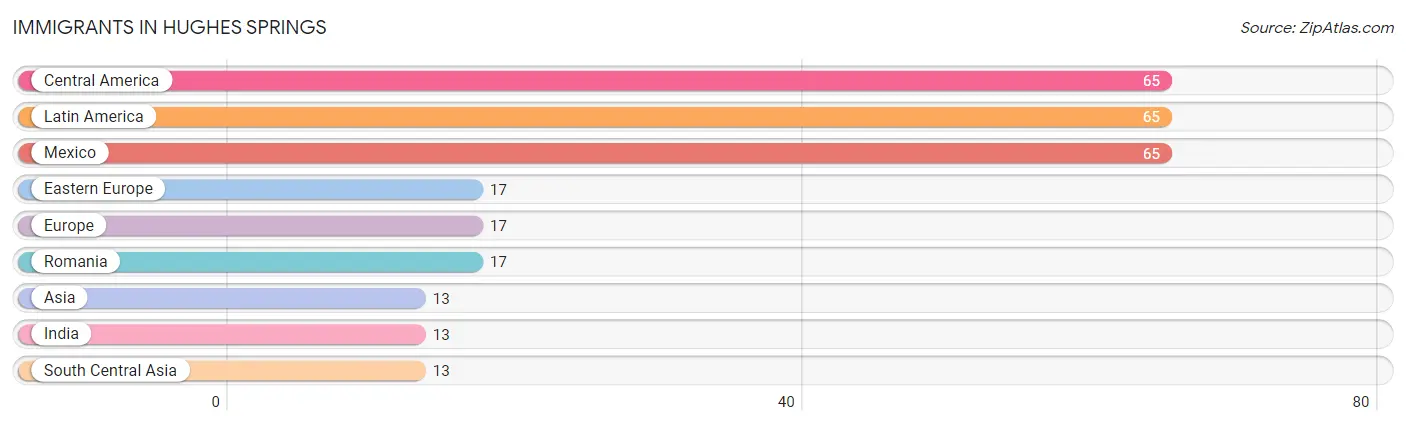
| Immigration Origin | # Population | % Population |
| Asia | 13 | 0.8% |
| Central America | 65 | 4.0% |
| Eastern Europe | 17 | 1.1% |
| Europe | 17 | 1.1% |
| India | 13 | 0.8% |
| Latin America | 65 | 4.0% |
| Mexico | 65 | 4.0% |
| Romania | 17 | 1.1% |
| South Central Asia | 13 | 0.8% | View All 9 Rows |
Sex and Age in Hughes Springs
Sex and Age in Hughes Springs
The most populous age groups in Hughes Springs are 30 to 34 Years (103 | 13.6%) for men and 25 to 29 Years (85 | 9.8%) for women.
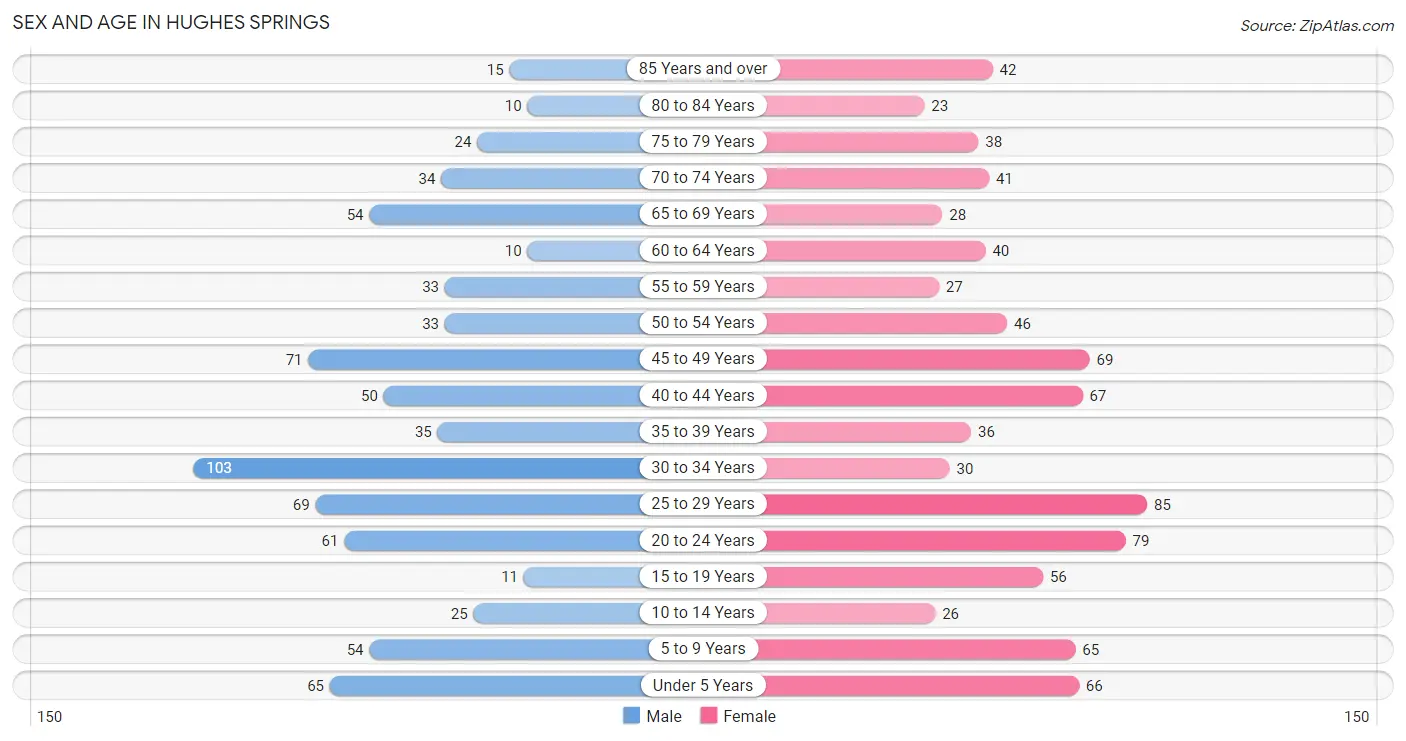
| Age Bracket | Male | Female |
| Under 5 Years | 65 (8.6%) | 66 (7.6%) |
| 5 to 9 Years | 54 (7.1%) | 65 (7.5%) |
| 10 to 14 Years | 25 (3.3%) | 26 (3.0%) |
| 15 to 19 Years | 11 (1.5%) | 56 (6.5%) |
| 20 to 24 Years | 61 (8.1%) | 79 (9.1%) |
| 25 to 29 Years | 69 (9.1%) | 85 (9.8%) |
| 30 to 34 Years | 103 (13.6%) | 30 (3.5%) |
| 35 to 39 Years | 35 (4.6%) | 36 (4.2%) |
| 40 to 44 Years | 50 (6.6%) | 67 (7.7%) |
| 45 to 49 Years | 71 (9.4%) | 69 (8.0%) |
| 50 to 54 Years | 33 (4.4%) | 46 (5.3%) |
| 55 to 59 Years | 33 (4.4%) | 27 (3.1%) |
| 60 to 64 Years | 10 (1.3%) | 40 (4.6%) |
| 65 to 69 Years | 54 (7.1%) | 28 (3.2%) |
| 70 to 74 Years | 34 (4.5%) | 41 (4.8%) |
| 75 to 79 Years | 24 (3.2%) | 38 (4.4%) |
| 80 to 84 Years | 10 (1.3%) | 23 (2.7%) |
| 85 Years and over | 15 (2.0%) | 42 (4.9%) |
| Total | 757 (100.0%) | 864 (100.0%) |
Families and Households in Hughes Springs
Median Family Size in Hughes Springs
The median family size in Hughes Springs is 2.64 persons per family, with married-couple families (269 | 61.3%) accounting for the largest median family size of 2.74 persons per family. On the other hand, single male/father families (12 | 2.7%) represent the smallest median family size with 2.50 persons per family.
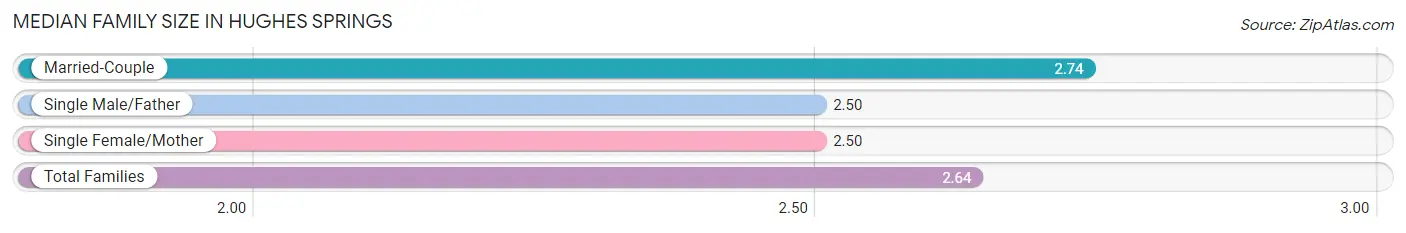
| Family Type | # Families | Family Size |
| Married-Couple | 269 (61.3%) | 2.74 |
| Single Male/Father | 12 (2.7%) | 2.50 |
| Single Female/Mother | 158 (36.0%) | 2.50 |
| Total Families | 439 (100.0%) | 2.64 |
Median Household Size in Hughes Springs
The median household size in Hughes Springs is 2.28 persons per household, with single male/father households (12 | 1.8%) accounting for the largest median household size of 3.08 persons per household. non-family households (234 | 34.8%) represent the smallest median household size with 1.28 persons per household.
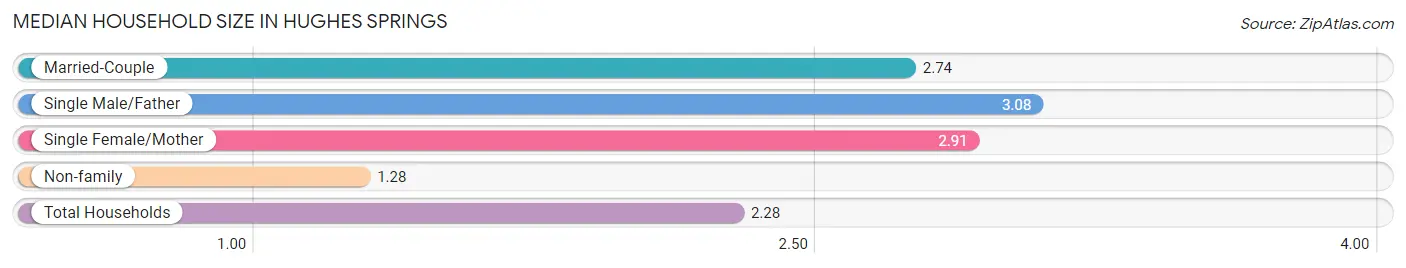
| Household Type | # Households | Household Size |
| Married-Couple | 269 (40.0%) | 2.74 |
| Single Male/Father | 12 (1.8%) | 3.08 |
| Single Female/Mother | 158 (23.5%) | 2.91 |
| Non-family | 234 (34.8%) | 1.28 |
| Total Households | 673 (100.0%) | 2.28 |
Household Size by Marriage Status in Hughes Springs
Out of a total of 673 households in Hughes Springs, 439 (65.2%) are family households, while 234 (34.8%) are nonfamily households. The most numerous type of family households are 2-person households, comprising 163, and the most common type of nonfamily households are 1-person households, comprising 189.
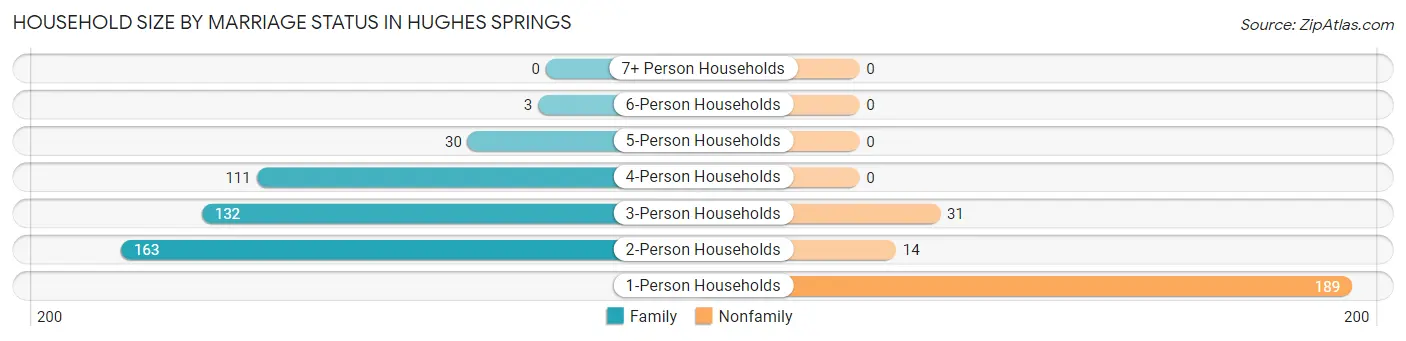
| Household Size | Family Households | Nonfamily Households |
| 1-Person Households | - | 189 (28.1%) |
| 2-Person Households | 163 (24.2%) | 14 (2.1%) |
| 3-Person Households | 132 (19.6%) | 31 (4.6%) |
| 4-Person Households | 111 (16.5%) | 0 (0.0%) |
| 5-Person Households | 30 (4.5%) | 0 (0.0%) |
| 6-Person Households | 3 (0.4%) | 0 (0.0%) |
| 7+ Person Households | 0 (0.0%) | 0 (0.0%) |
| Total | 439 (65.2%) | 234 (34.8%) |
Female Fertility in Hughes Springs
Fertility by Age in Hughes Springs
Average fertility rate in Hughes Springs is 146.0 births per 1,000 women. Women in the age bracket of 20 to 34 years have the highest fertility rate with 325.0 births per 1,000 women. Women in the age bracket of 20 to 34 years acount for 100.0% of all women with births.
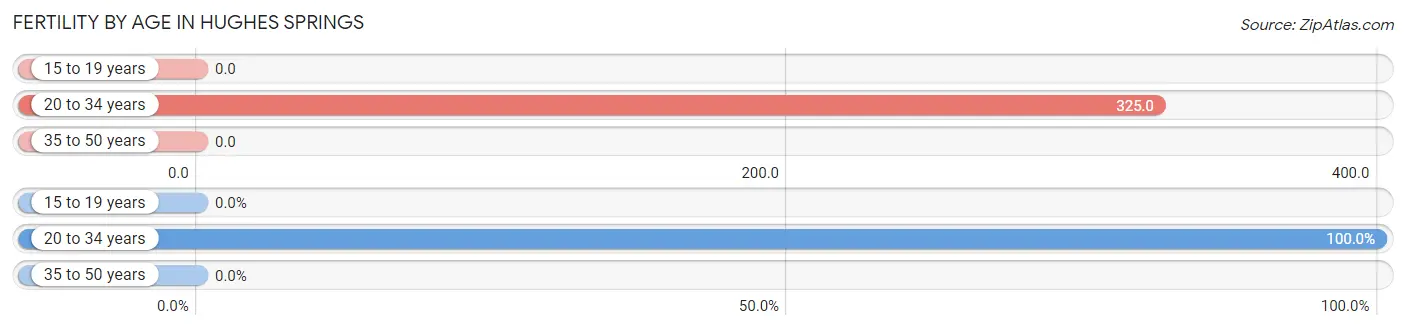
| Age Bracket | Women with Births | Births / 1,000 Women |
| 15 to 19 years | 0 (0.0%) | 0.0 |
| 20 to 34 years | 63 (100.0%) | 325.0 |
| 35 to 50 years | 0 (0.0%) | 0.0 |
| Total | 63 (100.0%) | 146.0 |
Fertility by Age by Marriage Status in Hughes Springs
6.3% of women with births (63) in Hughes Springs are married. The highest percentage of unmarried women with births falls into 20 to 34 years age bracket with 93.6% of them unmarried at the time of birth, while the lowest percentage of unmarried women with births belong to 20 to 34 years age bracket with 93.6% of them unmarried.
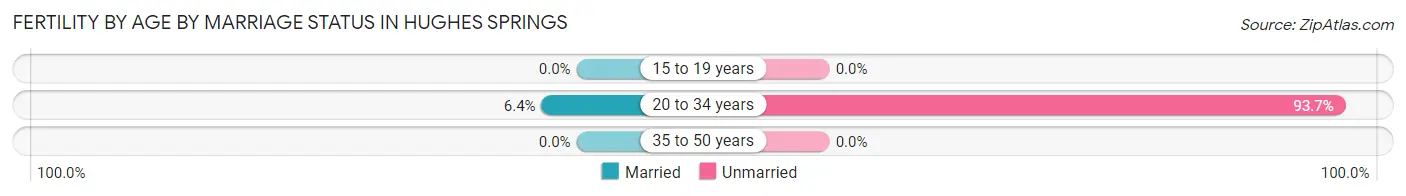
| Age Bracket | Married | Unmarried |
| 15 to 19 years | 0 (0.0%) | 0 (0.0%) |
| 20 to 34 years | 4 (6.4%) | 59 (93.6%) |
| 35 to 50 years | 0 (0.0%) | 0 (0.0%) |
| Total | 4 (6.4%) | 59 (93.6%) |
Fertility by Education in Hughes Springs
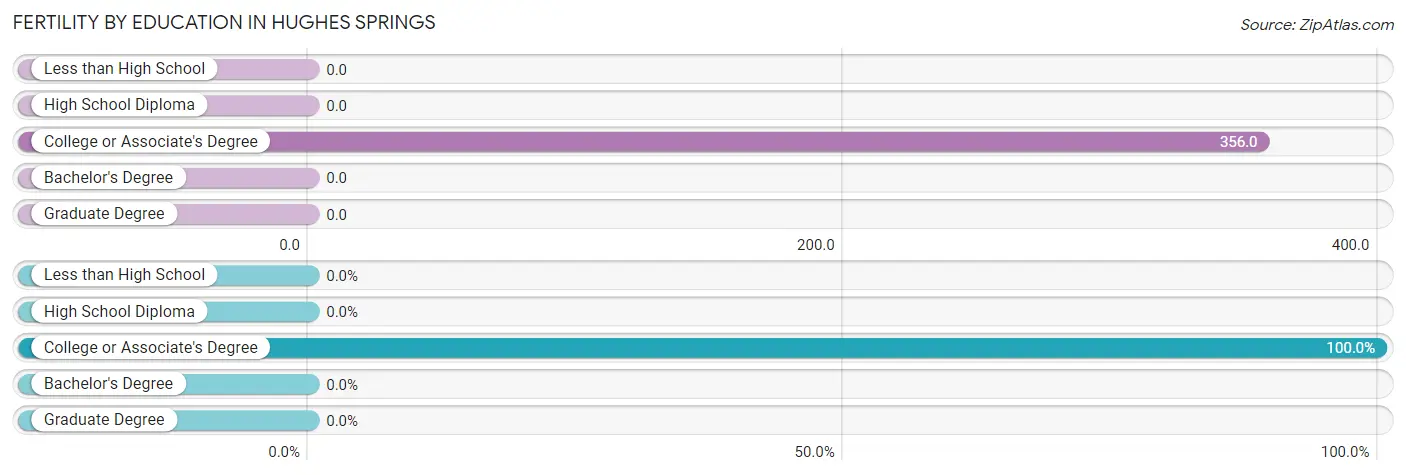
| Educational Attainment | Women with Births | Births / 1,000 Women |
| Less than High School | 0 (0.0%) | 0.0 |
| High School Diploma | 0 (0.0%) | 0.0 |
| College or Associate's Degree | 63 (100.0%) | 356.0 |
| Bachelor's Degree | 0 (0.0%) | 0.0 |
| Graduate Degree | 0 (0.0%) | 0.0 |
| Total | 63 (100.0%) | 146.0 |
Fertility by Education by Marriage Status in Hughes Springs
93.6% of women with births in Hughes Springs are unmarried. Women with the educational attainment of college or associate's degree are most likely to be married with 6.4% of them married at childbirth, while women with the educational attainment of college or associate's degree are least likely to be married with 93.6% of them unmarried at childbirth.
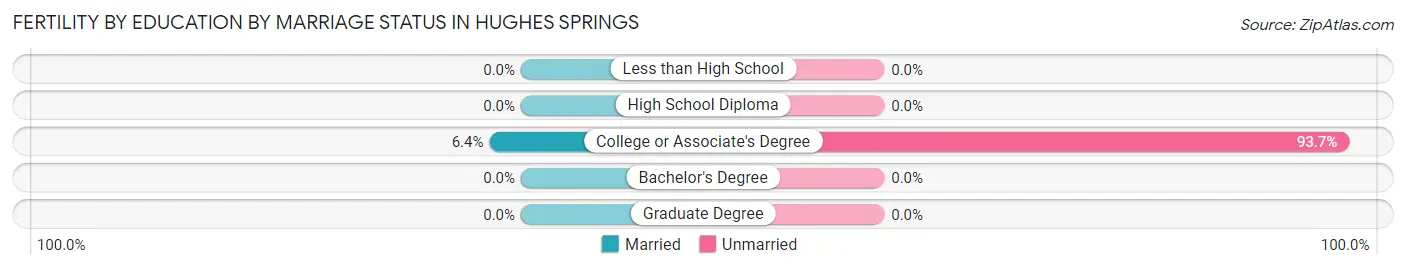
| Educational Attainment | Married | Unmarried |
| Less than High School | 0 (0.0%) | 0 (0.0%) |
| High School Diploma | 0 (0.0%) | 0 (0.0%) |
| College or Associate's Degree | 4 (6.4%) | 59 (93.6%) |
| Bachelor's Degree | 0 (0.0%) | 0 (0.0%) |
| Graduate Degree | 0 (0.0%) | 0 (0.0%) |
| Total | 4 (6.4%) | 59 (93.6%) |
Employment Characteristics in Hughes Springs
Employment by Class of Employer in Hughes Springs
Among the 733 employed individuals in Hughes Springs, private company employees (556 | 75.8%), state government employees (65 | 8.9%), and local government employees (46 | 6.3%) make up the most common classes of employment.
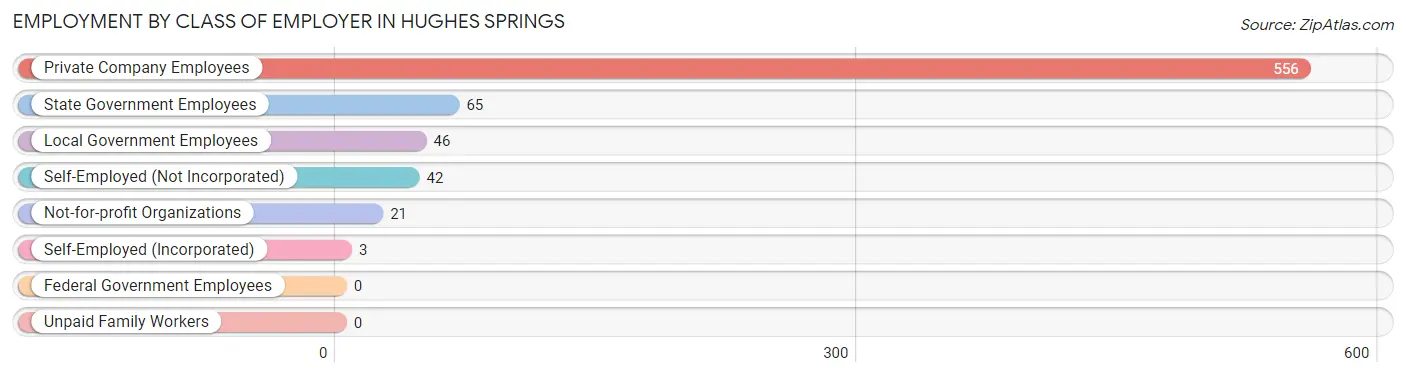
| Employer Class | # Employees | % Employees |
| Private Company Employees | 556 | 75.8% |
| Self-Employed (Incorporated) | 3 | 0.4% |
| Self-Employed (Not Incorporated) | 42 | 5.7% |
| Not-for-profit Organizations | 21 | 2.9% |
| Local Government Employees | 46 | 6.3% |
| State Government Employees | 65 | 8.9% |
| Federal Government Employees | 0 | 0.0% |
| Unpaid Family Workers | 0 | 0.0% |
| Total | 733 | 100.0% |
Employment Status by Age in Hughes Springs
According to the labor force statistics for Hughes Springs, out of the total population over 16 years of age (1,309), 56.8% or 744 individuals are in the labor force, with 1.1% or 8 of them unemployed. The age group with the highest labor force participation rate is 30 to 34 years, with 93.2% or 124 individuals in the labor force. Within the labor force, the 20 to 24 years age range has the highest percentage of unemployed individuals, with 4.0% or 5 of them being unemployed.
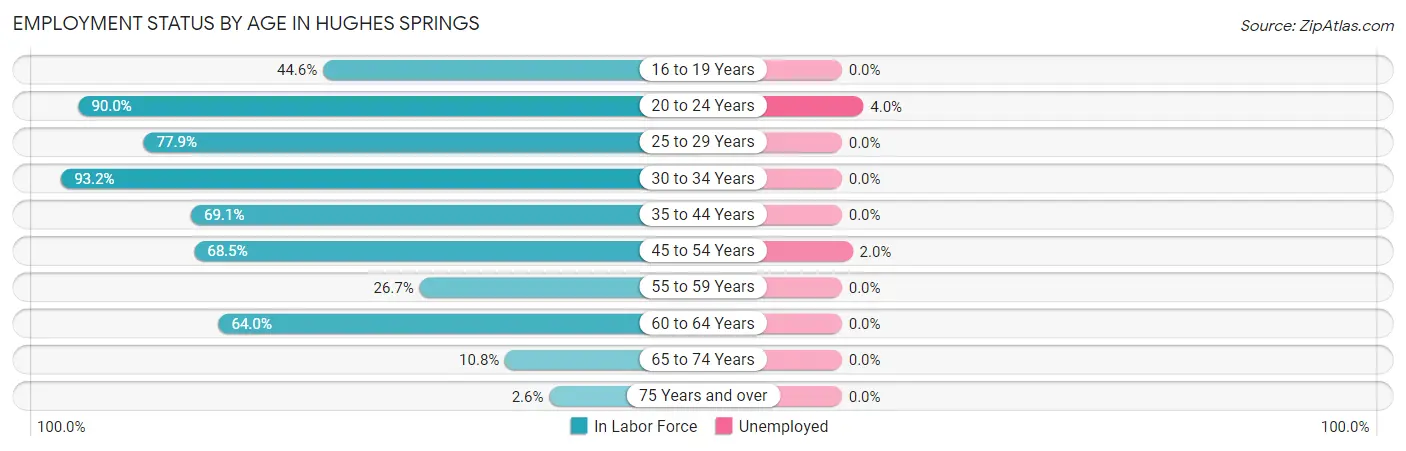
| Age Bracket | In Labor Force | Unemployed |
| 16 to 19 Years | 25 (44.6%) | 0 (0.0%) |
| 20 to 24 Years | 126 (90.0%) | 5 (4.0%) |
| 25 to 29 Years | 120 (77.9%) | 0 (0.0%) |
| 30 to 34 Years | 124 (93.2%) | 0 (0.0%) |
| 35 to 44 Years | 130 (69.1%) | 0 (0.0%) |
| 45 to 54 Years | 150 (68.5%) | 3 (2.0%) |
| 55 to 59 Years | 16 (26.7%) | 0 (0.0%) |
| 60 to 64 Years | 32 (64.0%) | 0 (0.0%) |
| 65 to 74 Years | 17 (10.8%) | 0 (0.0%) |
| 75 Years and over | 4 (2.6%) | 0 (0.0%) |
| Total | 744 (56.8%) | 8 (1.1%) |
Employment Status by Educational Attainment in Hughes Springs
According to labor force statistics for Hughes Springs, 71.1% of individuals (572) out of the total population between 25 and 64 years of age (804) are in the labor force, with 0.5% or 3 of them being unemployed. The group with the highest labor force participation rate are those with the educational attainment of high school diploma, with 84.4% or 249 individuals in the labor force. Within the labor force, individuals with college / associate degree education have the highest percentage of unemployment, with 1.4% or 3 of them being unemployed.
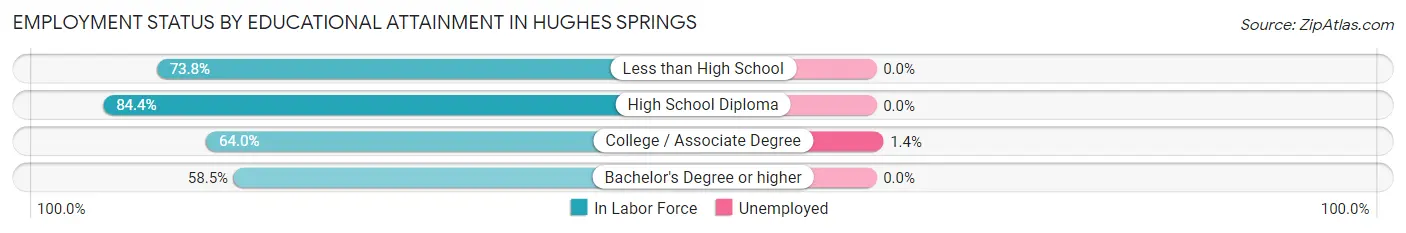
| Educational Attainment | In Labor Force | Unemployed |
| Less than High School | 31 (73.8%) | 0 (0.0%) |
| High School Diploma | 249 (84.4%) | 0 (0.0%) |
| College / Associate Degree | 220 (64.0%) | 5 (1.4%) |
| Bachelor's Degree or higher | 72 (58.5%) | 0 (0.0%) |
| Total | 572 (71.1%) | 4 (0.5%) |
Employment Occupations by Sex in Hughes Springs
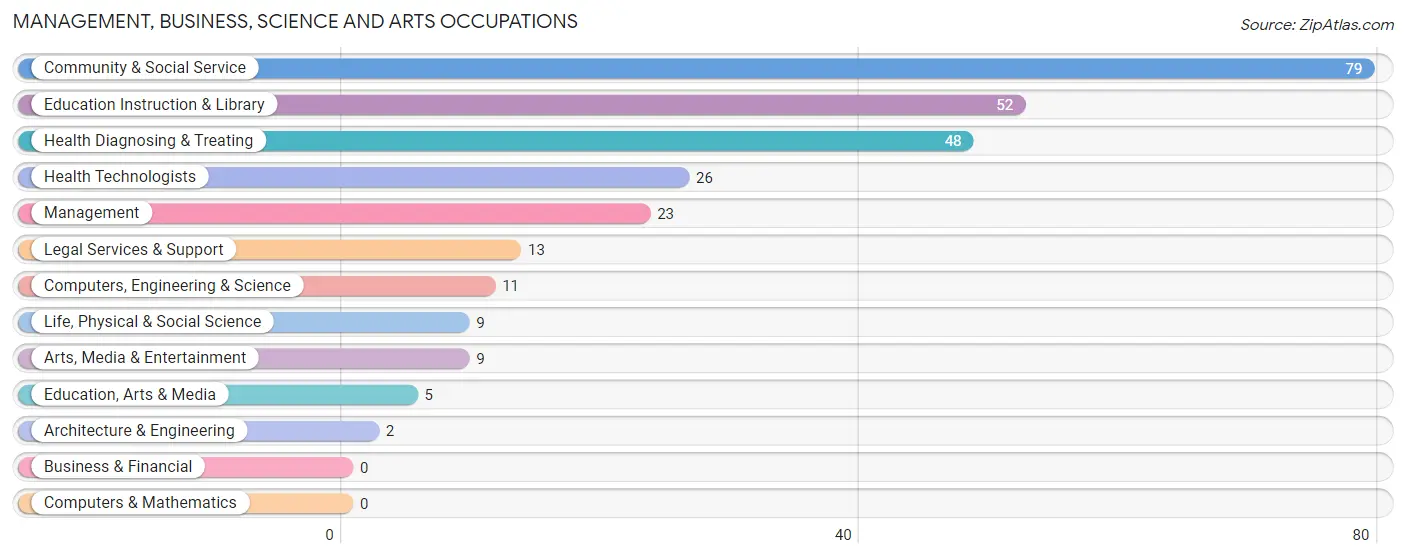
Management, Business, Science and Arts Occupations
The most common Management, Business, Science and Arts occupations in Hughes Springs are Community & Social Service (79 | 10.7%), Education Instruction & Library (52 | 7.1%), Health Diagnosing & Treating (48 | 6.5%), Health Technologists (26 | 3.5%), and Management (23 | 3.1%).
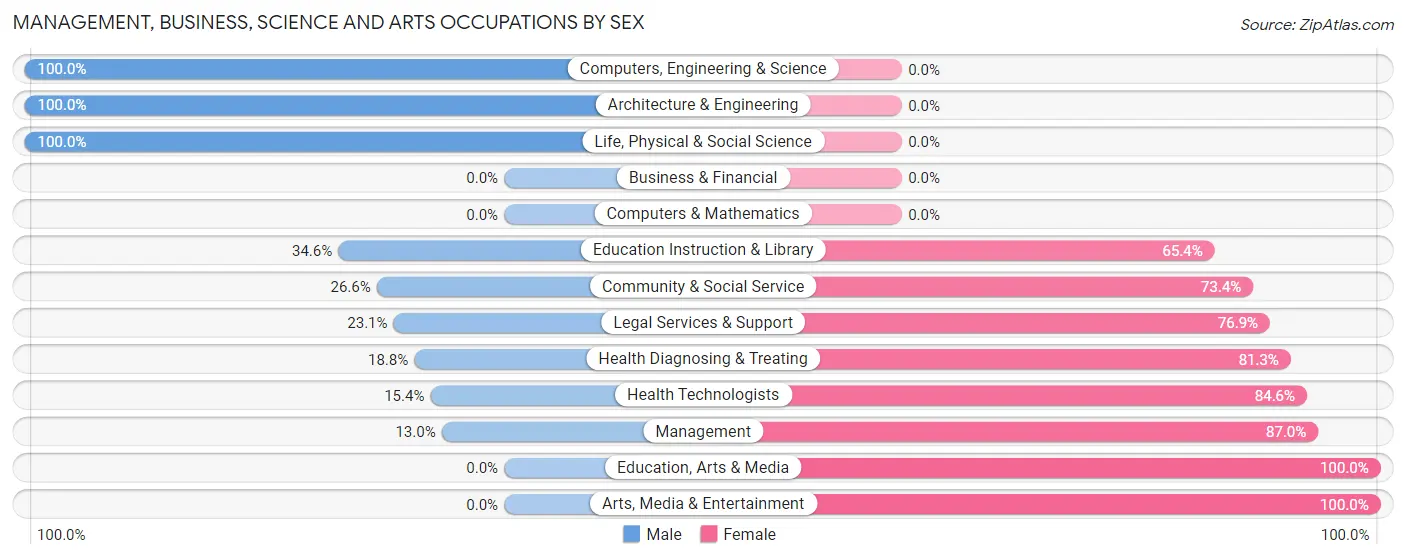
Management, Business, Science and Arts Occupations by Sex
Within the Management, Business, Science and Arts occupations in Hughes Springs, the most male-oriented occupations are Computers, Engineering & Science (100.0%), Architecture & Engineering (100.0%), and Life, Physical & Social Science (100.0%), while the most female-oriented occupations are Education, Arts & Media (100.0%), Arts, Media & Entertainment (100.0%), and Management (87.0%).
| Occupation | Male | Female |
| Management | 3 (13.0%) | 20 (87.0%) |
| Business & Financial | 0 (0.0%) | 0 (0.0%) |
| Computers, Engineering & Science | 11 (100.0%) | 0 (0.0%) |
| Computers & Mathematics | 0 (0.0%) | 0 (0.0%) |
| Architecture & Engineering | 2 (100.0%) | 0 (0.0%) |
| Life, Physical & Social Science | 9 (100.0%) | 0 (0.0%) |
| Community & Social Service | 21 (26.6%) | 58 (73.4%) |
| Education, Arts & Media | 0 (0.0%) | 5 (100.0%) |
| Legal Services & Support | 3 (23.1%) | 10 (76.9%) |
| Education Instruction & Library | 18 (34.6%) | 34 (65.4%) |
| Arts, Media & Entertainment | 0 (0.0%) | 9 (100.0%) |
| Health Diagnosing & Treating | 9 (18.8%) | 39 (81.2%) |
| Health Technologists | 4 (15.4%) | 22 (84.6%) |
| Total (Category) | 44 (27.3%) | 117 (72.7%) |
| Total (Overall) | 360 (48.9%) | 376 (51.1%) |
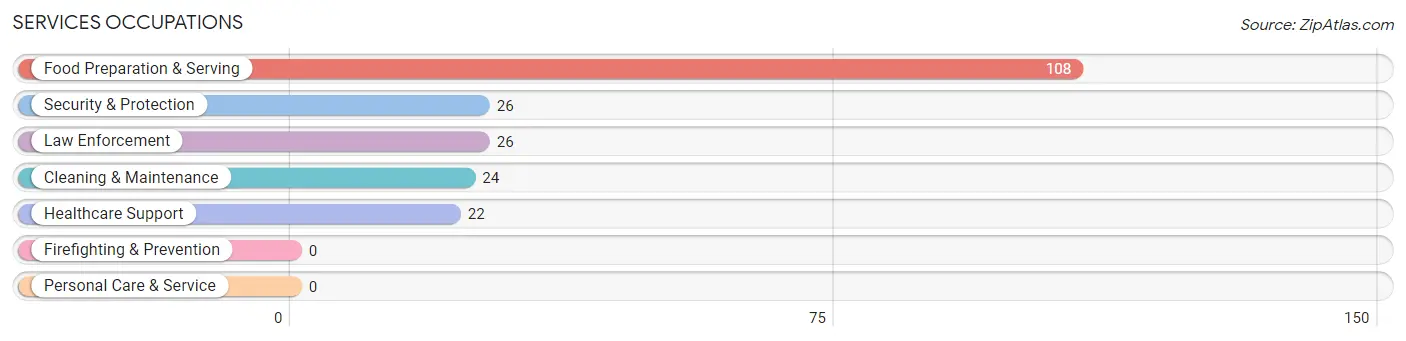
Services Occupations
The most common Services occupations in Hughes Springs are Food Preparation & Serving (108 | 14.7%), Security & Protection (26 | 3.5%), Law Enforcement (26 | 3.5%), Cleaning & Maintenance (24 | 3.3%), and Healthcare Support (22 | 3.0%).
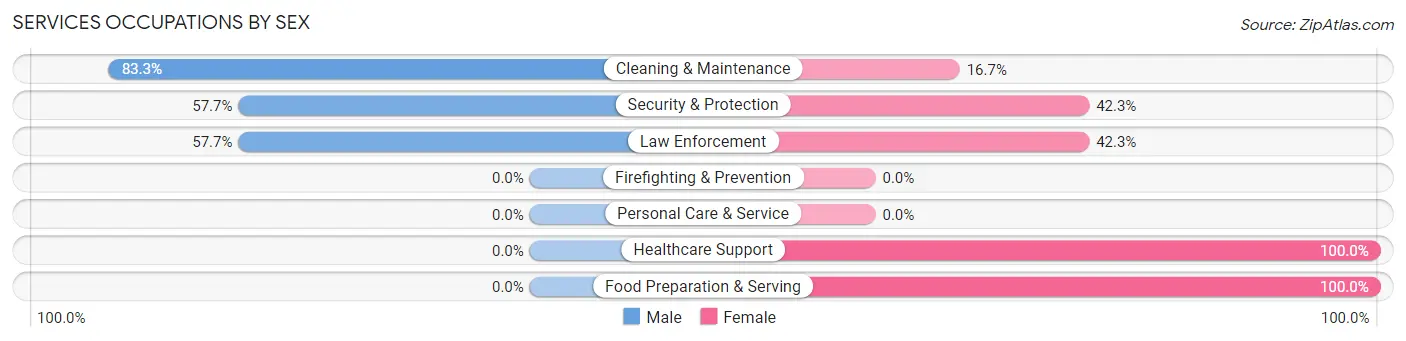
Services Occupations by Sex
Within the Services occupations in Hughes Springs, the most male-oriented occupations are Cleaning & Maintenance (83.3%), Security & Protection (57.7%), and Law Enforcement (57.7%), while the most female-oriented occupations are Healthcare Support (100.0%), Food Preparation & Serving (100.0%), and Security & Protection (42.3%).
| Occupation | Male | Female |
| Healthcare Support | 0 (0.0%) | 22 (100.0%) |
| Security & Protection | 15 (57.7%) | 11 (42.3%) |
| Firefighting & Prevention | 0 (0.0%) | 0 (0.0%) |
| Law Enforcement | 15 (57.7%) | 11 (42.3%) |
| Food Preparation & Serving | 0 (0.0%) | 108 (100.0%) |
| Cleaning & Maintenance | 20 (83.3%) | 4 (16.7%) |
| Personal Care & Service | 0 (0.0%) | 0 (0.0%) |
| Total (Category) | 35 (19.4%) | 145 (80.6%) |
| Total (Overall) | 360 (48.9%) | 376 (51.1%) |
Sales and Office Occupations
The most common Sales and Office occupations in Hughes Springs are Sales & Related (112 | 15.2%), and Office & Administration (58 | 7.9%).
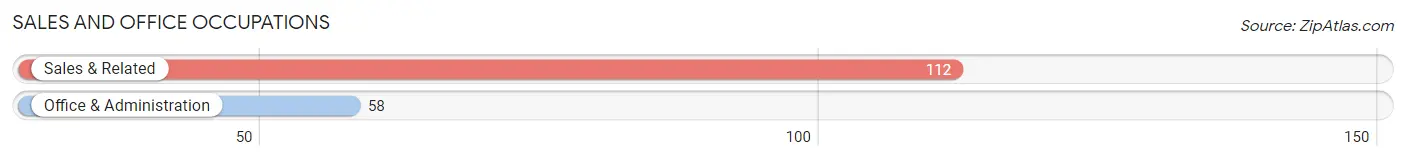
Sales and Office Occupations by Sex

| Occupation | Male | Female |
| Sales & Related | 79 (70.5%) | 33 (29.5%) |
| Office & Administration | 3 (5.2%) | 55 (94.8%) |
| Total (Category) | 82 (48.2%) | 88 (51.8%) |
| Total (Overall) | 360 (48.9%) | 376 (51.1%) |
Natural Resources, Construction and Maintenance Occupations
The most common Natural Resources, Construction and Maintenance occupations in Hughes Springs are Construction & Extraction (21 | 2.9%), and Installation, Maintenance & Repair (20 | 2.7%).
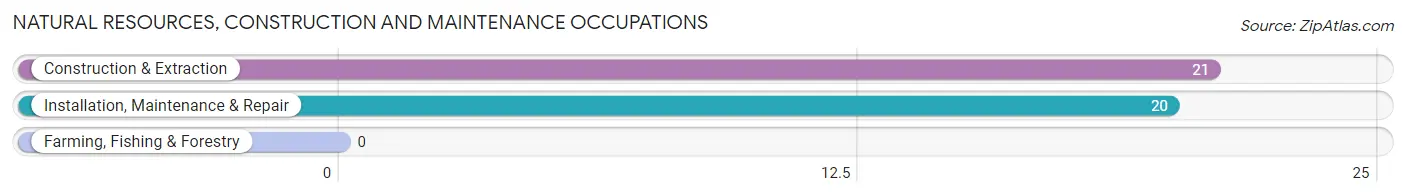
Natural Resources, Construction and Maintenance Occupations by Sex
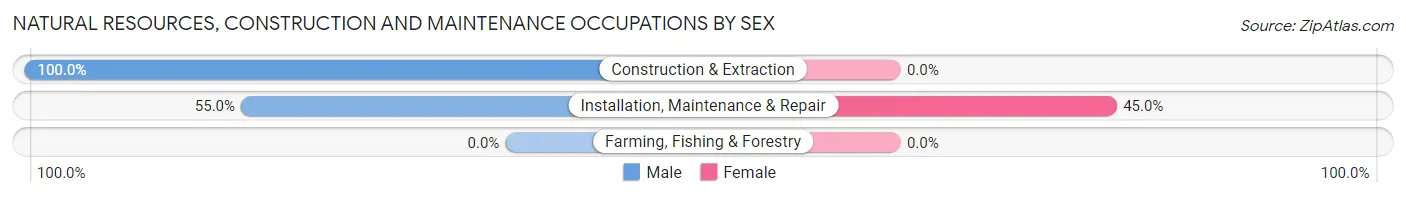
| Occupation | Male | Female |
| Farming, Fishing & Forestry | 0 (0.0%) | 0 (0.0%) |
| Construction & Extraction | 21 (100.0%) | 0 (0.0%) |
| Installation, Maintenance & Repair | 11 (55.0%) | 9 (45.0%) |
| Total (Category) | 32 (78.0%) | 9 (22.0%) |
| Total (Overall) | 360 (48.9%) | 376 (51.1%) |
Production, Transportation and Moving Occupations
The most common Production, Transportation and Moving occupations in Hughes Springs are Production (95 | 12.9%), Material Moving (76 | 10.3%), and Transportation (13 | 1.8%).
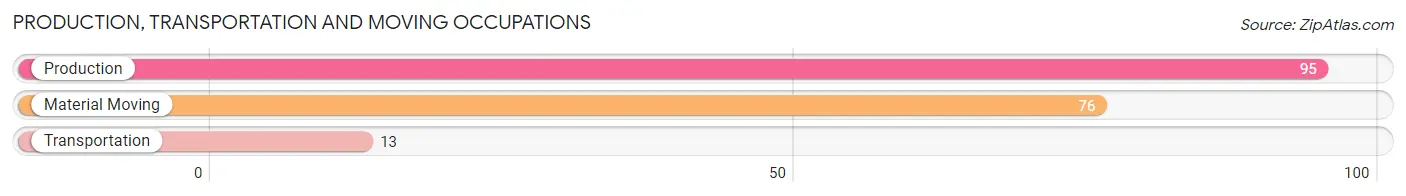
Production, Transportation and Moving Occupations by Sex
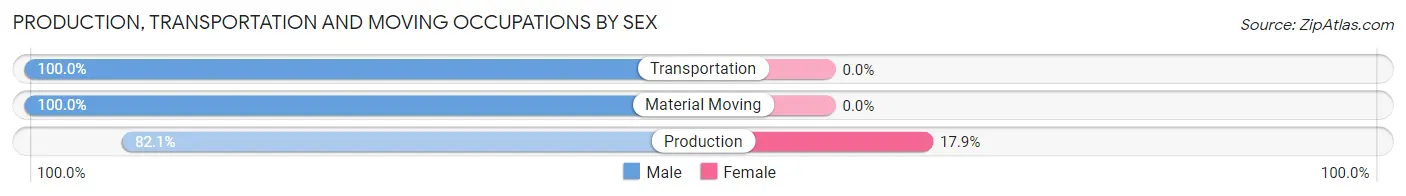
| Occupation | Male | Female |
| Production | 78 (82.1%) | 17 (17.9%) |
| Transportation | 13 (100.0%) | 0 (0.0%) |
| Material Moving | 76 (100.0%) | 0 (0.0%) |
| Total (Category) | 167 (90.8%) | 17 (9.2%) |
| Total (Overall) | 360 (48.9%) | 376 (51.1%) |
Employment Industries by Sex in Hughes Springs
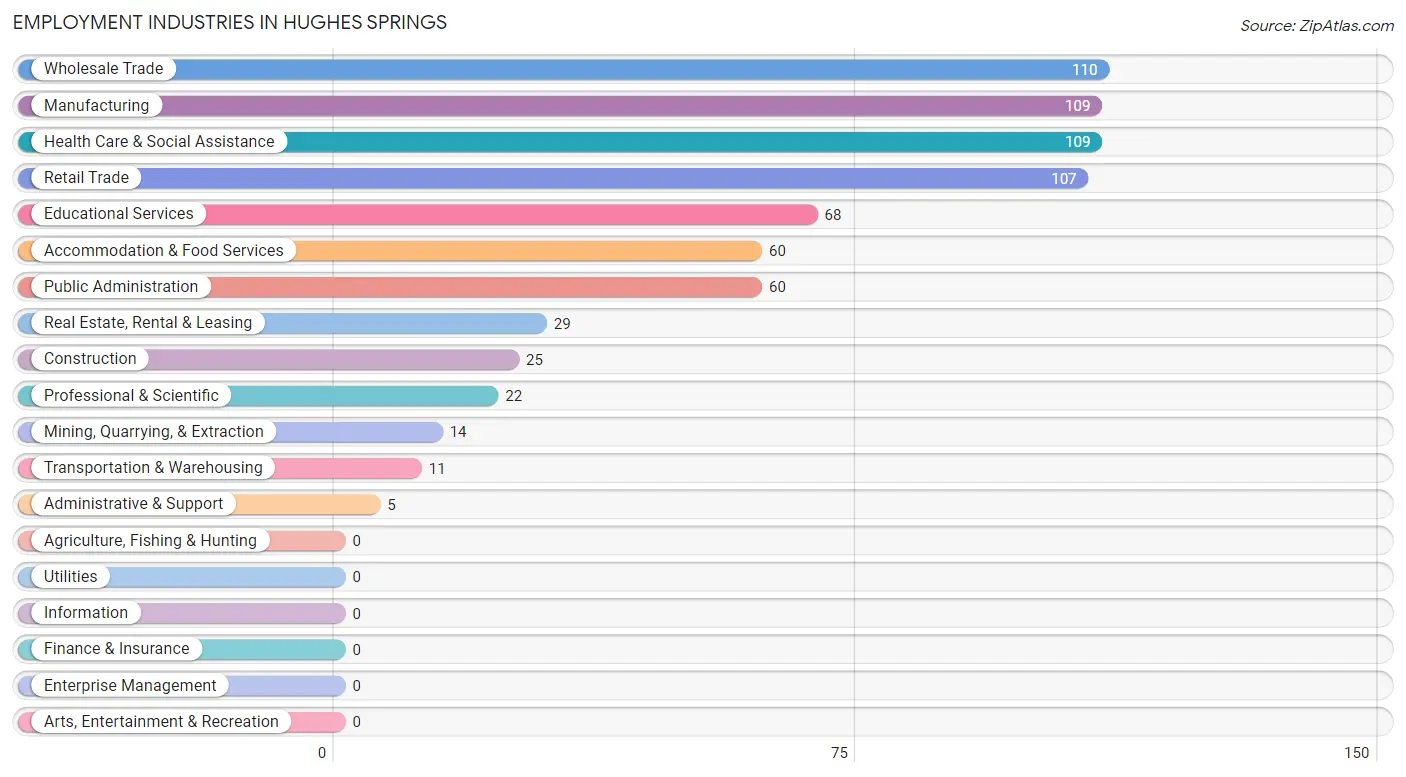
Employment Industries in Hughes Springs
The major employment industries in Hughes Springs include Wholesale Trade (110 | 14.9%), Manufacturing (109 | 14.8%), Health Care & Social Assistance (109 | 14.8%), Retail Trade (107 | 14.5%), and Educational Services (68 | 9.2%).
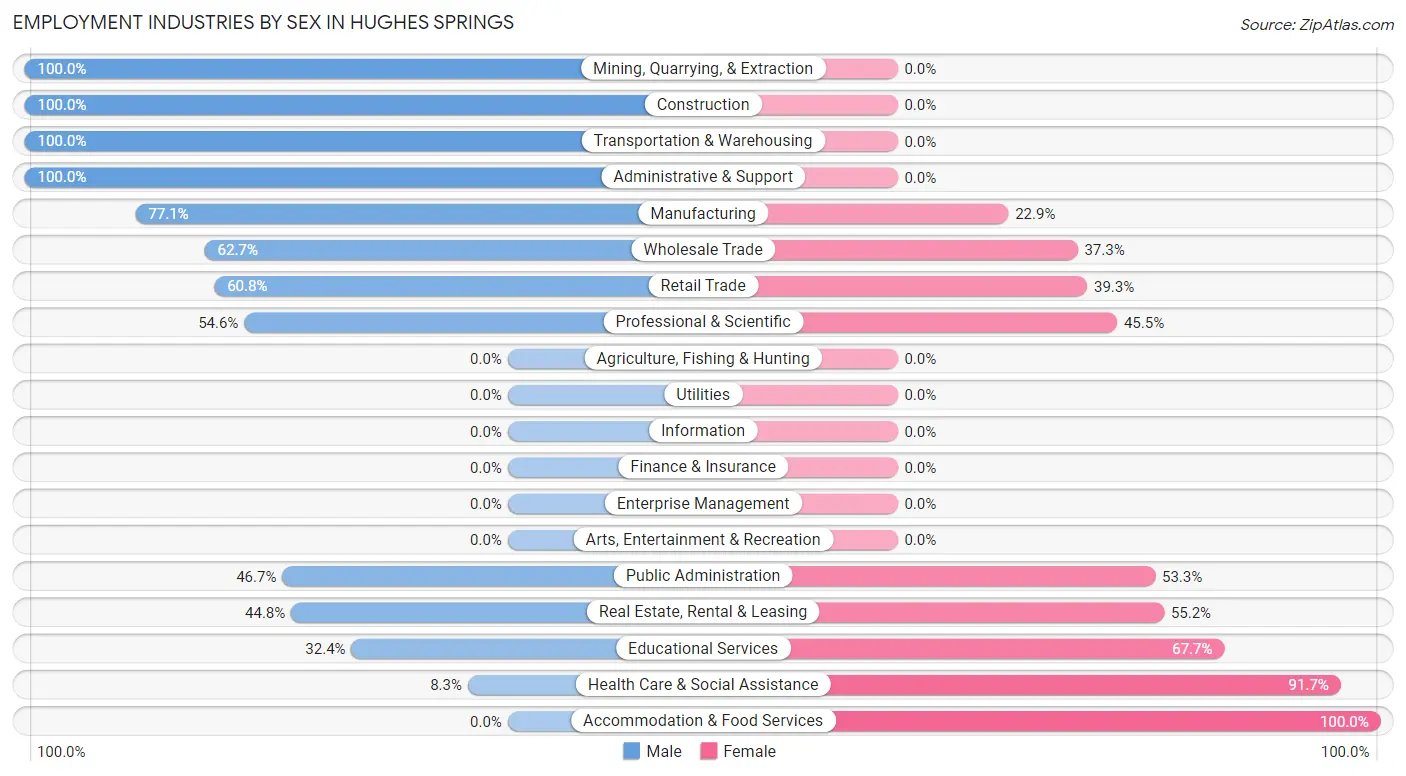
Employment Industries by Sex in Hughes Springs
The Hughes Springs industries that see more men than women are Mining, Quarrying, & Extraction (100.0%), Construction (100.0%), and Transportation & Warehousing (100.0%), whereas the industries that tend to have a higher number of women are Accommodation & Food Services (100.0%), Health Care & Social Assistance (91.7%), and Educational Services (67.6%).
| Industry | Male | Female |
| Agriculture, Fishing & Hunting | 0 (0.0%) | 0 (0.0%) |
| Mining, Quarrying, & Extraction | 14 (100.0%) | 0 (0.0%) |
| Construction | 25 (100.0%) | 0 (0.0%) |
| Manufacturing | 84 (77.1%) | 25 (22.9%) |
| Wholesale Trade | 69 (62.7%) | 41 (37.3%) |
| Retail Trade | 65 (60.8%) | 42 (39.3%) |
| Transportation & Warehousing | 11 (100.0%) | 0 (0.0%) |
| Utilities | 0 (0.0%) | 0 (0.0%) |
| Information | 0 (0.0%) | 0 (0.0%) |
| Finance & Insurance | 0 (0.0%) | 0 (0.0%) |
| Real Estate, Rental & Leasing | 13 (44.8%) | 16 (55.2%) |
| Professional & Scientific | 12 (54.5%) | 10 (45.5%) |
| Enterprise Management | 0 (0.0%) | 0 (0.0%) |
| Administrative & Support | 5 (100.0%) | 0 (0.0%) |
| Educational Services | 22 (32.4%) | 46 (67.6%) |
| Health Care & Social Assistance | 9 (8.3%) | 100 (91.7%) |
| Arts, Entertainment & Recreation | 0 (0.0%) | 0 (0.0%) |
| Accommodation & Food Services | 0 (0.0%) | 60 (100.0%) |
| Public Administration | 28 (46.7%) | 32 (53.3%) |
| Total | 360 (48.9%) | 376 (51.1%) |
Education in Hughes Springs
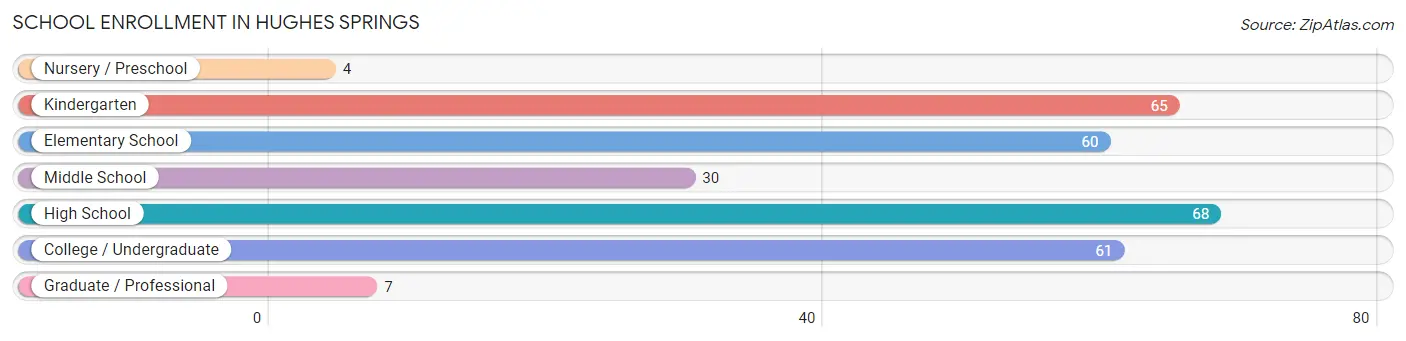
School Enrollment in Hughes Springs
The most common levels of schooling among the 295 students in Hughes Springs are high school (68 | 23.1%), kindergarten (65 | 22.0%), and college / undergraduate (61 | 20.7%).
| School Level | # Students | % Students |
| Nursery / Preschool | 4 | 1.4% |
| Kindergarten | 65 | 22.0% |
| Elementary School | 60 | 20.3% |
| Middle School | 30 | 10.2% |
| High School | 68 | 23.1% |
| College / Undergraduate | 61 | 20.7% |
| Graduate / Professional | 7 | 2.4% |
| Total | 295 | 100.0% |
School Enrollment by Age by Funding Source in Hughes Springs
Out of a total of 295 students who are enrolled in schools in Hughes Springs, 23 (7.8%) attend a private institution, while the remaining 272 (92.2%) are enrolled in public schools. The age group of 25 to 34 year olds has the highest likelihood of being enrolled in private schools, with 3 (100.0% in the age bracket) enrolled. Conversely, the age group of 3 to 4 year olds has the lowest likelihood of being enrolled in a private school, with 4 (100.0% in the age bracket) attending a public institution.
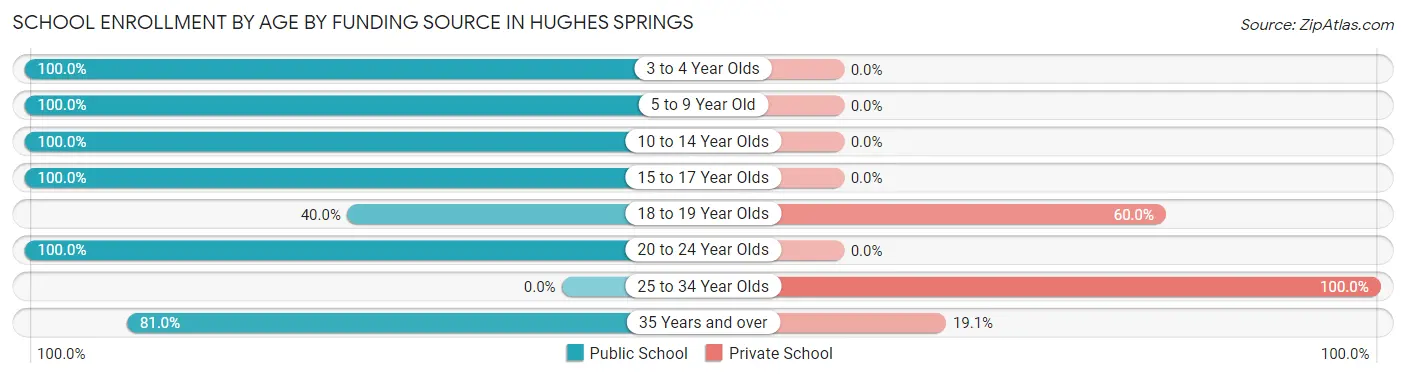
| Age Bracket | Public School | Private School |
| 3 to 4 Year Olds | 4 (100.0%) | 0 (0.0%) |
| 5 to 9 Year Old | 109 (100.0%) | 0 (0.0%) |
| 10 to 14 Year Olds | 51 (100.0%) | 0 (0.0%) |
| 15 to 17 Year Olds | 34 (100.0%) | 0 (0.0%) |
| 18 to 19 Year Olds | 8 (40.0%) | 12 (60.0%) |
| 20 to 24 Year Olds | 32 (100.0%) | 0 (0.0%) |
| 25 to 34 Year Olds | 0 (0.0%) | 3 (100.0%) |
| 35 Years and over | 34 (80.9%) | 8 (19.1%) |
| Total | 272 (92.2%) | 23 (7.8%) |
Educational Attainment by Field of Study in Hughes Springs
Education (50 | 29.6%), business (33 | 19.5%), science & technology (31 | 18.3%), bio, nature & agricultural (11 | 6.5%), and social sciences (11 | 6.5%) are the most common fields of study among 169 individuals in Hughes Springs who have obtained a bachelor's degree or higher.
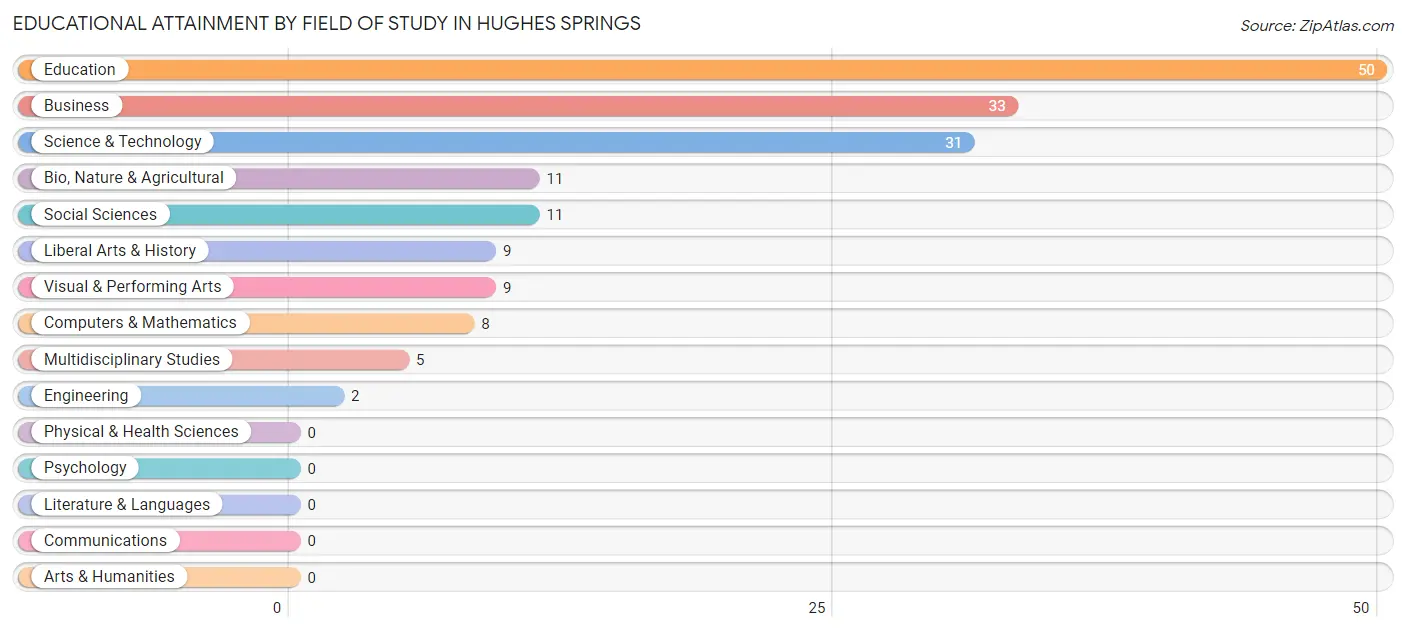
| Field of Study | # Graduates | % Graduates |
| Computers & Mathematics | 8 | 4.7% |
| Bio, Nature & Agricultural | 11 | 6.5% |
| Physical & Health Sciences | 0 | 0.0% |
| Psychology | 0 | 0.0% |
| Social Sciences | 11 | 6.5% |
| Engineering | 2 | 1.2% |
| Multidisciplinary Studies | 5 | 3.0% |
| Science & Technology | 31 | 18.3% |
| Business | 33 | 19.5% |
| Education | 50 | 29.6% |
| Literature & Languages | 0 | 0.0% |
| Liberal Arts & History | 9 | 5.3% |
| Visual & Performing Arts | 9 | 5.3% |
| Communications | 0 | 0.0% |
| Arts & Humanities | 0 | 0.0% |
| Total | 169 | 100.0% |
Transportation & Commute in Hughes Springs
Vehicle Availability by Sex in Hughes Springs
The most prevalent vehicle ownership categories in Hughes Springs are males with 2 vehicles (151, accounting for 42.3%) and females with 2 vehicles (215, making up 40.2%).
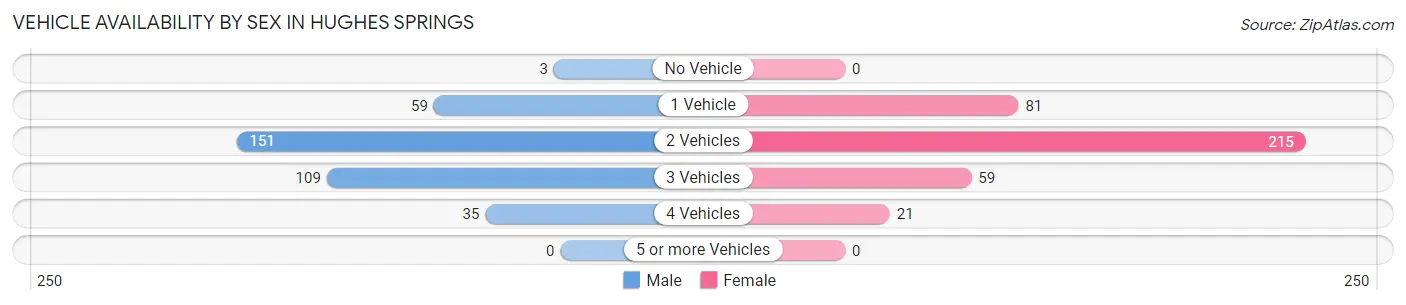
| Vehicles Available | Male | Female |
| No Vehicle | 3 (0.8%) | 0 (0.0%) |
| 1 Vehicle | 59 (16.5%) | 81 (21.5%) |
| 2 Vehicles | 151 (42.3%) | 215 (57.2%) |
| 3 Vehicles | 109 (30.5%) | 59 (15.7%) |
| 4 Vehicles | 35 (9.8%) | 21 (5.6%) |
| 5 or more Vehicles | 0 (0.0%) | 0 (0.0%) |
| Total | 357 (100.0%) | 376 (100.0%) |
Commute Time in Hughes Springs
The most frequently occuring commute durations in Hughes Springs are 5 to 9 minutes (212 commuters, 29.1%), 10 to 14 minutes (119 commuters, 16.4%), and 15 to 19 minutes (108 commuters, 14.8%).
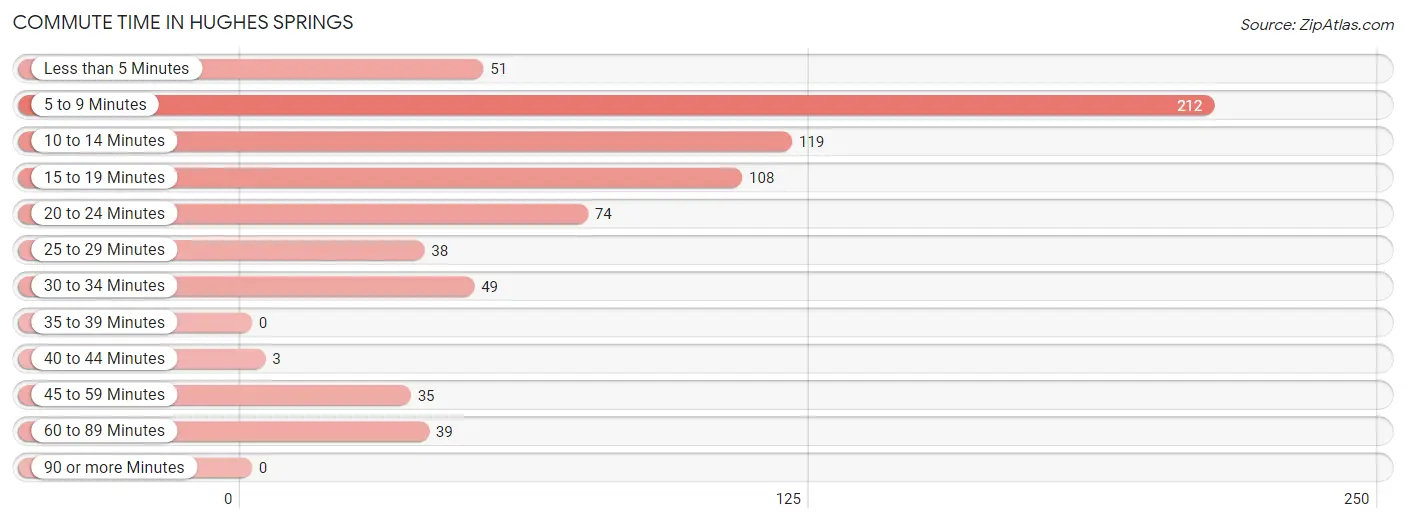
| Commute Time | # Commuters | % Commuters |
| Less than 5 Minutes | 51 | 7.0% |
| 5 to 9 Minutes | 212 | 29.1% |
| 10 to 14 Minutes | 119 | 16.4% |
| 15 to 19 Minutes | 108 | 14.8% |
| 20 to 24 Minutes | 74 | 10.2% |
| 25 to 29 Minutes | 38 | 5.2% |
| 30 to 34 Minutes | 49 | 6.7% |
| 35 to 39 Minutes | 0 | 0.0% |
| 40 to 44 Minutes | 3 | 0.4% |
| 45 to 59 Minutes | 35 | 4.8% |
| 60 to 89 Minutes | 39 | 5.4% |
| 90 or more Minutes | 0 | 0.0% |
Commute Time by Sex in Hughes Springs
The most common commute times in Hughes Springs are 5 to 9 minutes (86 commuters, 24.4%) for males and 5 to 9 minutes (126 commuters, 33.5%) for females.
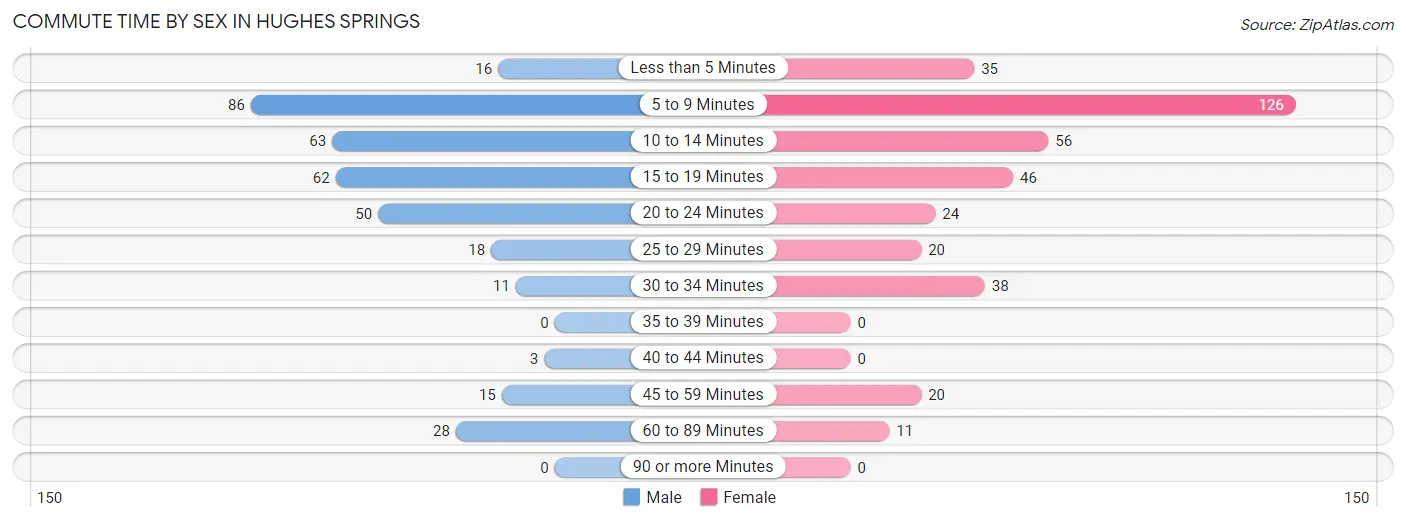
| Commute Time | Male | Female |
| Less than 5 Minutes | 16 (4.5%) | 35 (9.3%) |
| 5 to 9 Minutes | 86 (24.4%) | 126 (33.5%) |
| 10 to 14 Minutes | 63 (17.9%) | 56 (14.9%) |
| 15 to 19 Minutes | 62 (17.6%) | 46 (12.2%) |
| 20 to 24 Minutes | 50 (14.2%) | 24 (6.4%) |
| 25 to 29 Minutes | 18 (5.1%) | 20 (5.3%) |
| 30 to 34 Minutes | 11 (3.1%) | 38 (10.1%) |
| 35 to 39 Minutes | 0 (0.0%) | 0 (0.0%) |
| 40 to 44 Minutes | 3 (0.9%) | 0 (0.0%) |
| 45 to 59 Minutes | 15 (4.3%) | 20 (5.3%) |
| 60 to 89 Minutes | 28 (8.0%) | 11 (2.9%) |
| 90 or more Minutes | 0 (0.0%) | 0 (0.0%) |
Time of Departure to Work by Sex in Hughes Springs
The most frequent times of departure to work in Hughes Springs are 7:00 AM to 7:29 AM (77, 21.9%) for males and 7:00 AM to 7:29 AM (89, 23.7%) for females.
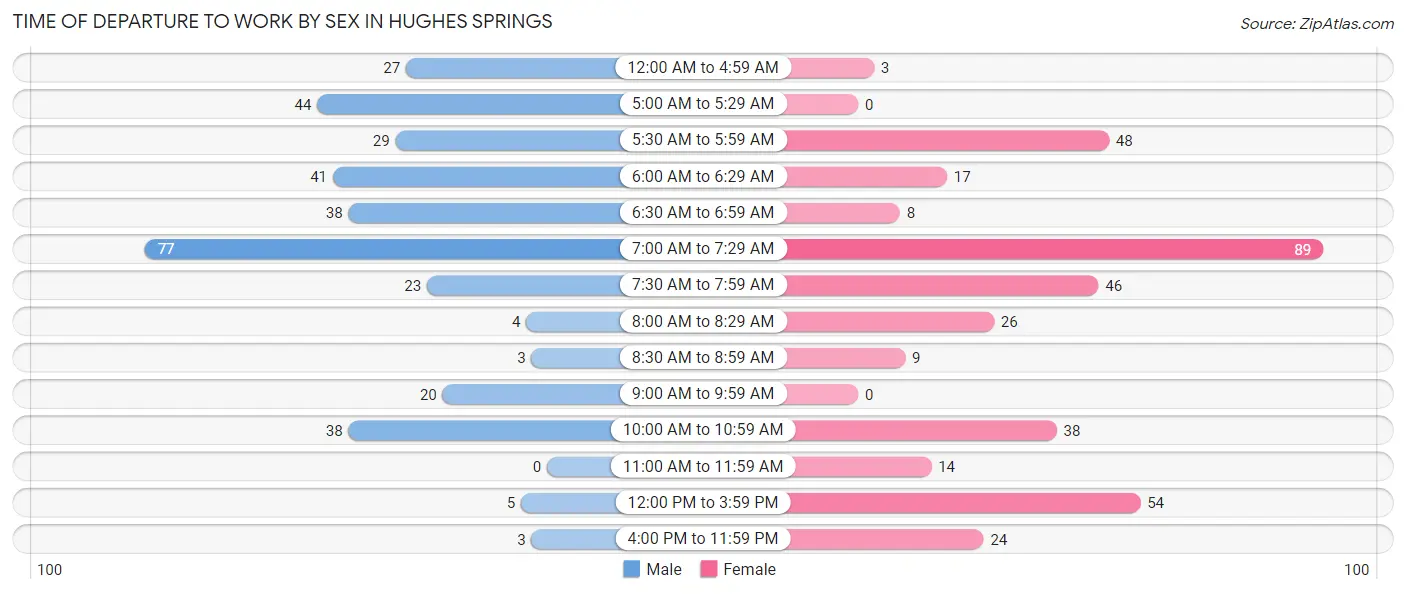
| Time of Departure | Male | Female |
| 12:00 AM to 4:59 AM | 27 (7.7%) | 3 (0.8%) |
| 5:00 AM to 5:29 AM | 44 (12.5%) | 0 (0.0%) |
| 5:30 AM to 5:59 AM | 29 (8.2%) | 48 (12.8%) |
| 6:00 AM to 6:29 AM | 41 (11.7%) | 17 (4.5%) |
| 6:30 AM to 6:59 AM | 38 (10.8%) | 8 (2.1%) |
| 7:00 AM to 7:29 AM | 77 (21.9%) | 89 (23.7%) |
| 7:30 AM to 7:59 AM | 23 (6.5%) | 46 (12.2%) |
| 8:00 AM to 8:29 AM | 4 (1.1%) | 26 (6.9%) |
| 8:30 AM to 8:59 AM | 3 (0.9%) | 9 (2.4%) |
| 9:00 AM to 9:59 AM | 20 (5.7%) | 0 (0.0%) |
| 10:00 AM to 10:59 AM | 38 (10.8%) | 38 (10.1%) |
| 11:00 AM to 11:59 AM | 0 (0.0%) | 14 (3.7%) |
| 12:00 PM to 3:59 PM | 5 (1.4%) | 54 (14.4%) |
| 4:00 PM to 11:59 PM | 3 (0.9%) | 24 (6.4%) |
| Total | 352 (100.0%) | 376 (100.0%) |
Housing Occupancy in Hughes Springs
Occupancy by Ownership in Hughes Springs
Of the total 673 dwellings in Hughes Springs, owner-occupied units account for 421 (62.6%), while renter-occupied units make up 252 (37.4%).
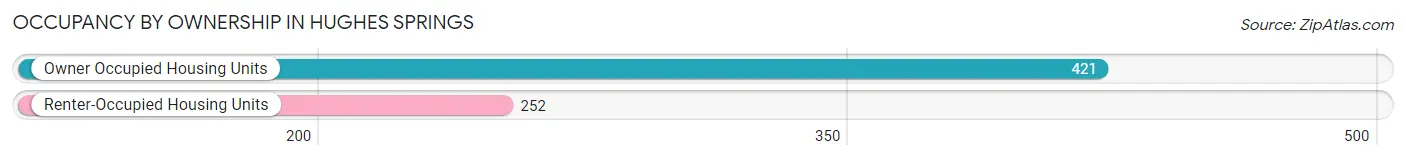
| Occupancy | # Housing Units | % Housing Units |
| Owner Occupied Housing Units | 421 | 62.6% |
| Renter-Occupied Housing Units | 252 | 37.4% |
| Total Occupied Housing Units | 673 | 100.0% |
Occupancy by Household Size in Hughes Springs
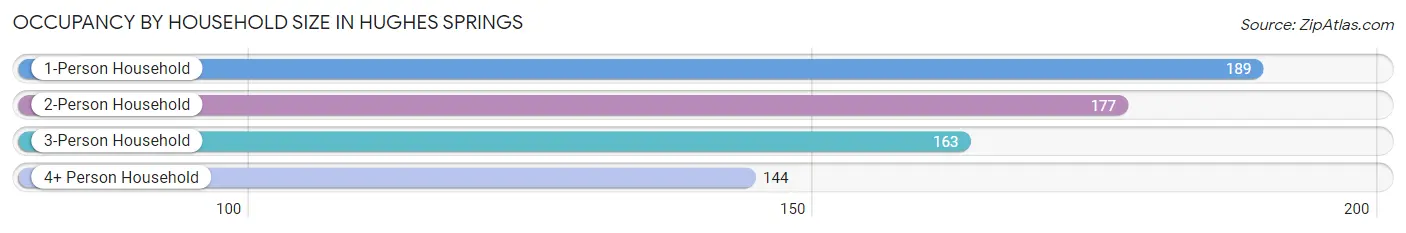
| Household Size | # Housing Units | % Housing Units |
| 1-Person Household | 189 | 28.1% |
| 2-Person Household | 177 | 26.3% |
| 3-Person Household | 163 | 24.2% |
| 4+ Person Household | 144 | 21.4% |
| Total Housing Units | 673 | 100.0% |
Occupancy by Ownership by Household Size in Hughes Springs
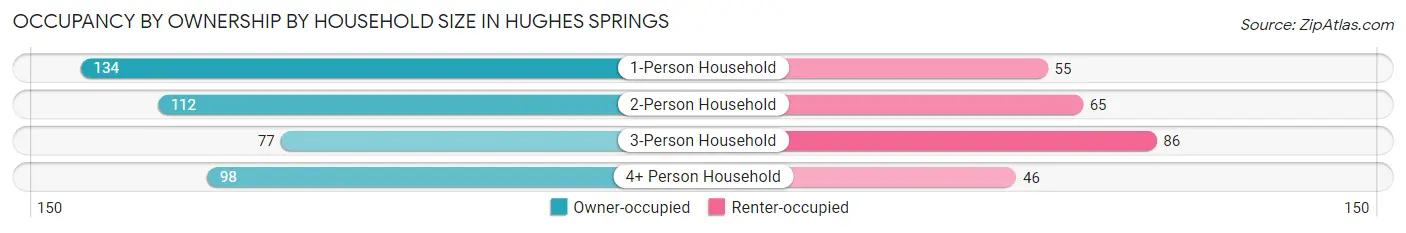
| Household Size | Owner-occupied | Renter-occupied |
| 1-Person Household | 134 (70.9%) | 55 (29.1%) |
| 2-Person Household | 112 (63.3%) | 65 (36.7%) |
| 3-Person Household | 77 (47.2%) | 86 (52.8%) |
| 4+ Person Household | 98 (68.1%) | 46 (31.9%) |
| Total Housing Units | 421 (62.6%) | 252 (37.4%) |
Occupancy by Educational Attainment in Hughes Springs
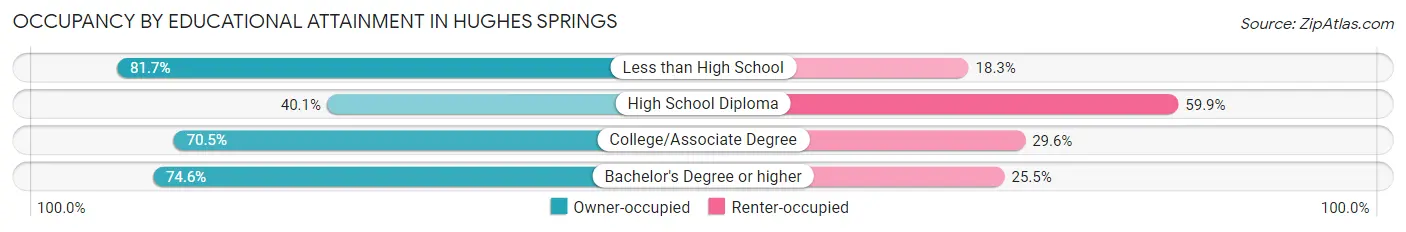
| Household Size | Owner-occupied | Renter-occupied |
| Less than High School | 49 (81.7%) | 11 (18.3%) |
| High School Diploma | 85 (40.1%) | 127 (59.9%) |
| College/Associate Degree | 205 (70.5%) | 86 (29.5%) |
| Bachelor's Degree or higher | 82 (74.6%) | 28 (25.5%) |
Occupancy by Age of Householder in Hughes Springs
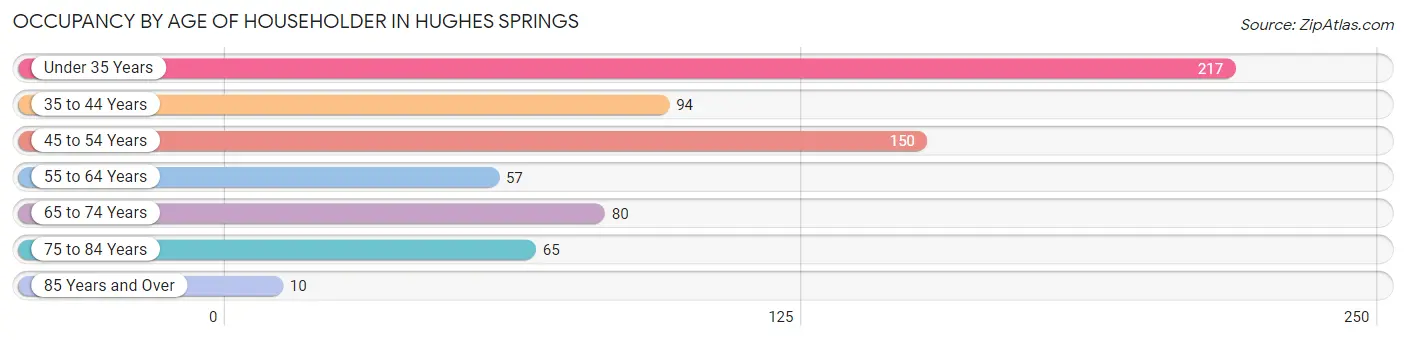
| Age Bracket | # Households | % Households |
| Under 35 Years | 217 | 32.2% |
| 35 to 44 Years | 94 | 14.0% |
| 45 to 54 Years | 150 | 22.3% |
| 55 to 64 Years | 57 | 8.5% |
| 65 to 74 Years | 80 | 11.9% |
| 75 to 84 Years | 65 | 9.7% |
| 85 Years and Over | 10 | 1.5% |
| Total | 673 | 100.0% |
Housing Finances in Hughes Springs
Median Income by Occupancy in Hughes Springs
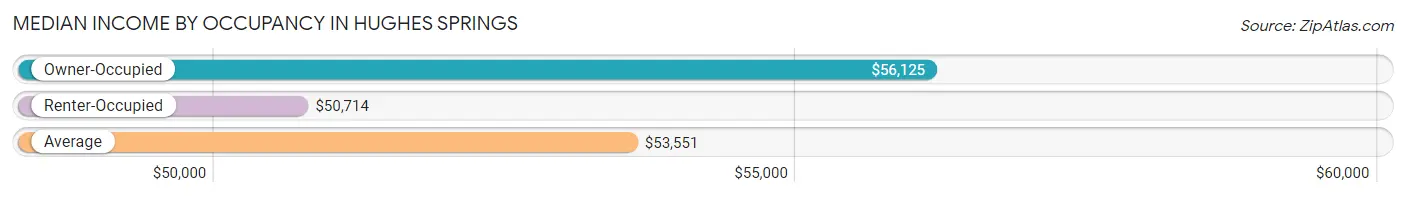
| Occupancy Type | # Households | Median Income |
| Owner-Occupied | 421 (62.6%) | $56,125 |
| Renter-Occupied | 252 (37.4%) | $50,714 |
| Average | 673 (100.0%) | $53,551 |
Occupancy by Householder Income Bracket in Hughes Springs
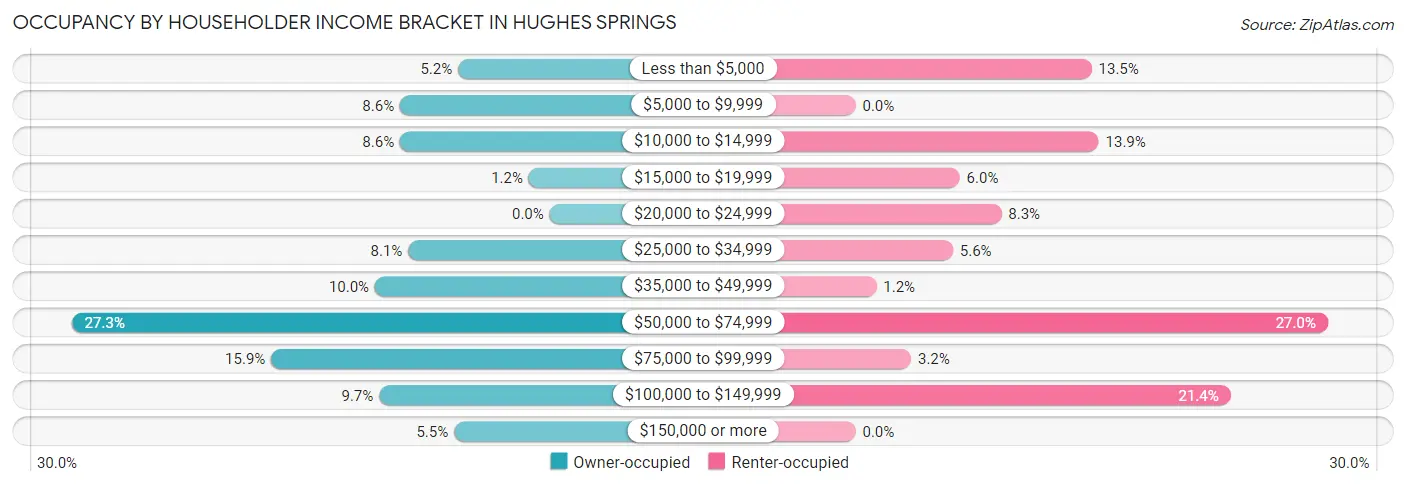
| Income Bracket | Owner-occupied | Renter-occupied |
| Less than $5,000 | 22 (5.2%) | 34 (13.5%) |
| $5,000 to $9,999 | 36 (8.6%) | 0 (0.0%) |
| $10,000 to $14,999 | 36 (8.6%) | 35 (13.9%) |
| $15,000 to $19,999 | 5 (1.2%) | 15 (5.9%) |
| $20,000 to $24,999 | 0 (0.0%) | 21 (8.3%) |
| $25,000 to $34,999 | 34 (8.1%) | 14 (5.6%) |
| $35,000 to $49,999 | 42 (10.0%) | 3 (1.2%) |
| $50,000 to $74,999 | 115 (27.3%) | 68 (27.0%) |
| $75,000 to $99,999 | 67 (15.9%) | 8 (3.2%) |
| $100,000 to $149,999 | 41 (9.7%) | 54 (21.4%) |
| $150,000 or more | 23 (5.5%) | 0 (0.0%) |
| Total | 421 (100.0%) | 252 (100.0%) |
Monthly Housing Cost Tiers in Hughes Springs
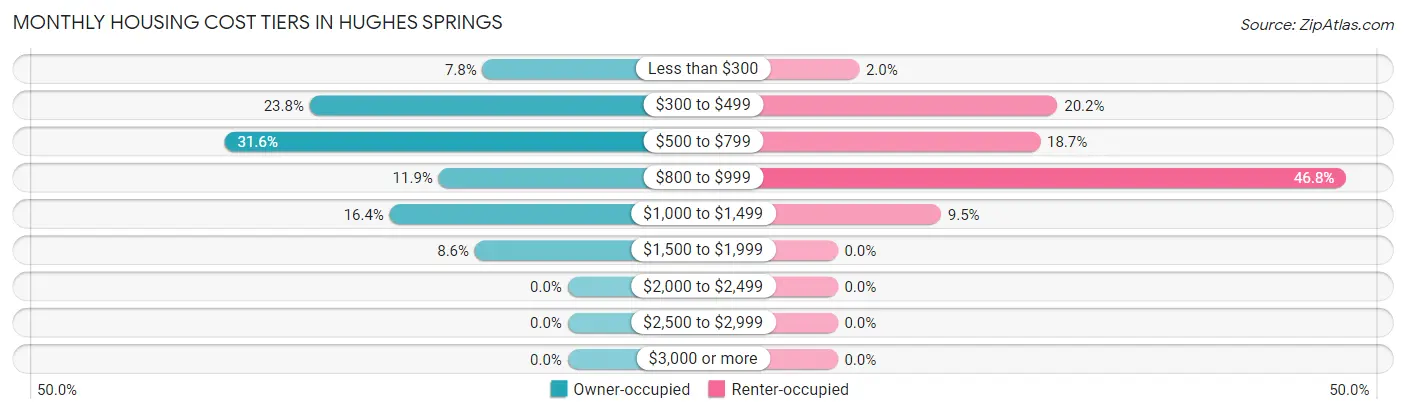
| Monthly Cost | Owner-occupied | Renter-occupied |
| Less than $300 | 33 (7.8%) | 5 (2.0%) |
| $300 to $499 | 100 (23.7%) | 51 (20.2%) |
| $500 to $799 | 133 (31.6%) | 47 (18.6%) |
| $800 to $999 | 50 (11.9%) | 118 (46.8%) |
| $1,000 to $1,499 | 69 (16.4%) | 24 (9.5%) |
| $1,500 to $1,999 | 36 (8.6%) | 0 (0.0%) |
| $2,000 to $2,499 | 0 (0.0%) | 0 (0.0%) |
| $2,500 to $2,999 | 0 (0.0%) | 0 (0.0%) |
| $3,000 or more | 0 (0.0%) | 0 (0.0%) |
| Total | 421 (100.0%) | 252 (100.0%) |
Physical Housing Characteristics in Hughes Springs
Housing Structures in Hughes Springs
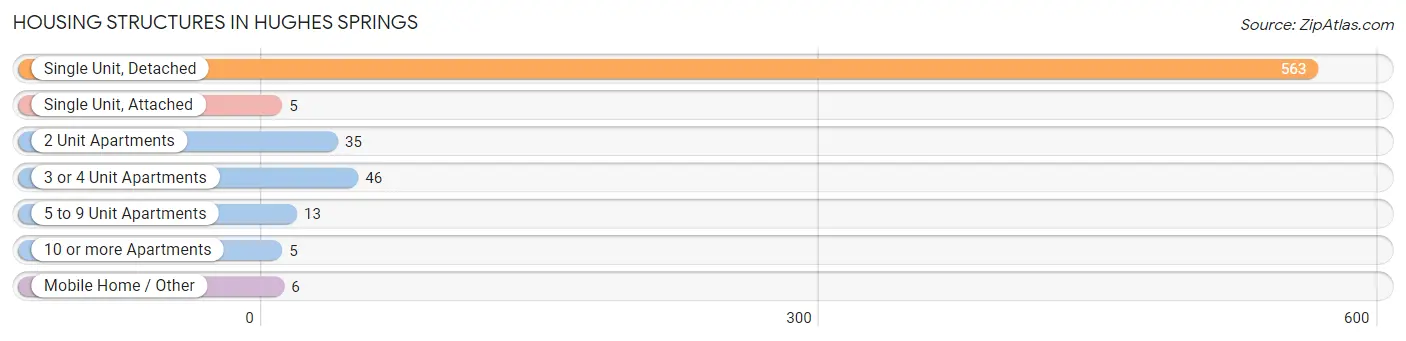
| Structure Type | # Housing Units | % Housing Units |
| Single Unit, Detached | 563 | 83.7% |
| Single Unit, Attached | 5 | 0.7% |
| 2 Unit Apartments | 35 | 5.2% |
| 3 or 4 Unit Apartments | 46 | 6.8% |
| 5 to 9 Unit Apartments | 13 | 1.9% |
| 10 or more Apartments | 5 | 0.7% |
| Mobile Home / Other | 6 | 0.9% |
| Total | 673 | 100.0% |
Housing Structures by Occupancy in Hughes Springs
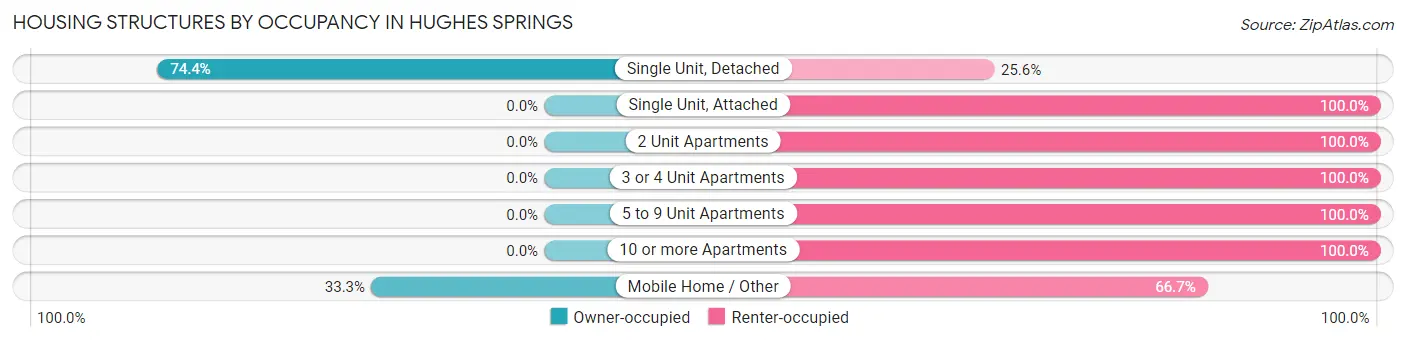
| Structure Type | Owner-occupied | Renter-occupied |
| Single Unit, Detached | 419 (74.4%) | 144 (25.6%) |
| Single Unit, Attached | 0 (0.0%) | 5 (100.0%) |
| 2 Unit Apartments | 0 (0.0%) | 35 (100.0%) |
| 3 or 4 Unit Apartments | 0 (0.0%) | 46 (100.0%) |
| 5 to 9 Unit Apartments | 0 (0.0%) | 13 (100.0%) |
| 10 or more Apartments | 0 (0.0%) | 5 (100.0%) |
| Mobile Home / Other | 2 (33.3%) | 4 (66.7%) |
| Total | 421 (62.6%) | 252 (37.4%) |
Housing Structures by Number of Rooms in Hughes Springs
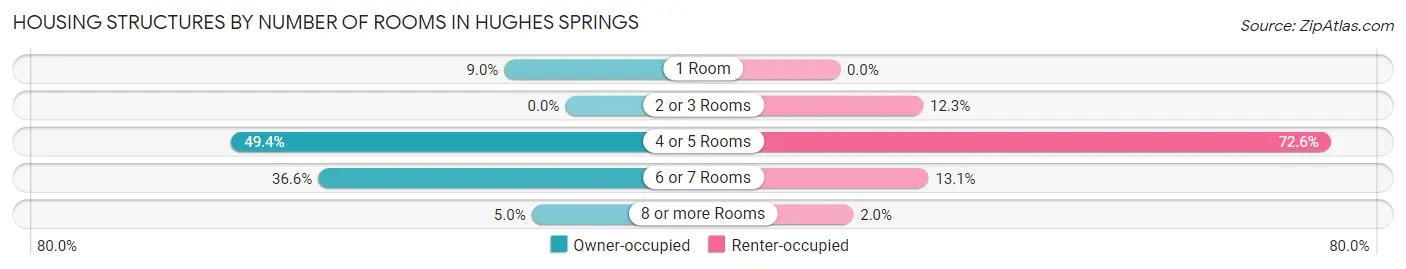
| Number of Rooms | Owner-occupied | Renter-occupied |
| 1 Room | 38 (9.0%) | 0 (0.0%) |
| 2 or 3 Rooms | 0 (0.0%) | 31 (12.3%) |
| 4 or 5 Rooms | 208 (49.4%) | 183 (72.6%) |
| 6 or 7 Rooms | 154 (36.6%) | 33 (13.1%) |
| 8 or more Rooms | 21 (5.0%) | 5 (2.0%) |
| Total | 421 (100.0%) | 252 (100.0%) |
Housing Structure by Heating Type in Hughes Springs
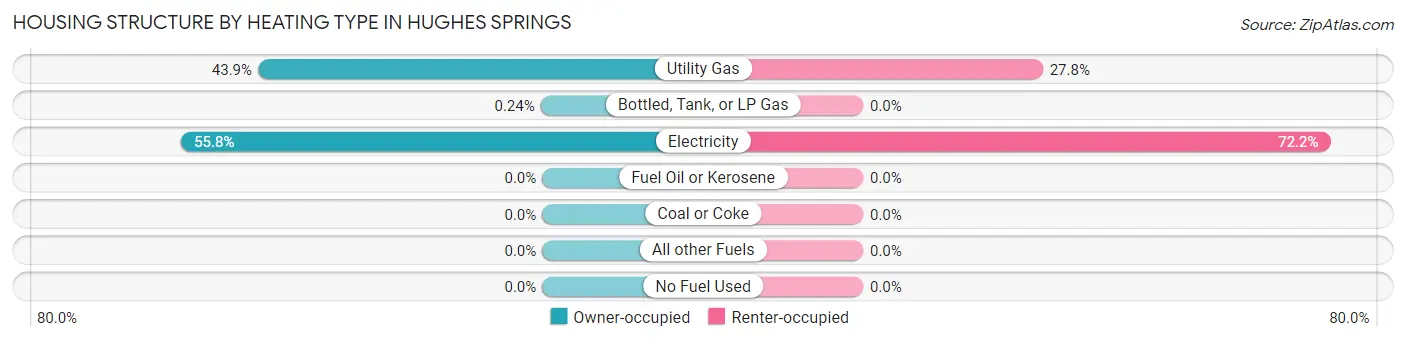
| Heating Type | Owner-occupied | Renter-occupied |
| Utility Gas | 185 (43.9%) | 70 (27.8%) |
| Bottled, Tank, or LP Gas | 1 (0.2%) | 0 (0.0%) |
| Electricity | 235 (55.8%) | 182 (72.2%) |
| Fuel Oil or Kerosene | 0 (0.0%) | 0 (0.0%) |
| Coal or Coke | 0 (0.0%) | 0 (0.0%) |
| All other Fuels | 0 (0.0%) | 0 (0.0%) |
| No Fuel Used | 0 (0.0%) | 0 (0.0%) |
| Total | 421 (100.0%) | 252 (100.0%) |
Household Vehicle Usage in Hughes Springs
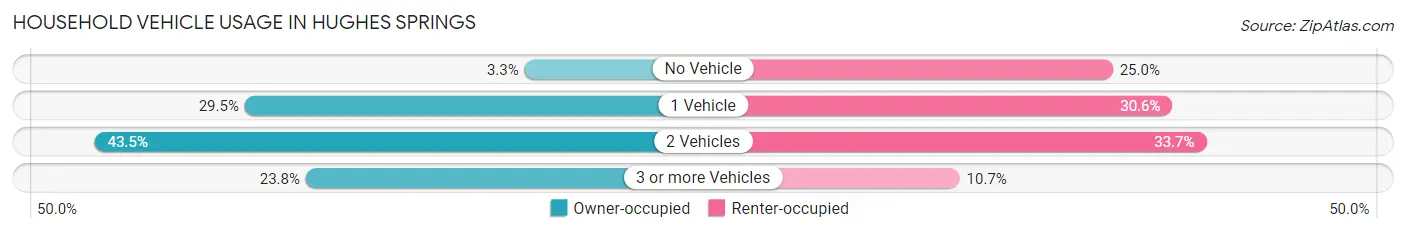
| Vehicles per Household | Owner-occupied | Renter-occupied |
| No Vehicle | 14 (3.3%) | 63 (25.0%) |
| 1 Vehicle | 124 (29.4%) | 77 (30.6%) |
| 2 Vehicles | 183 (43.5%) | 85 (33.7%) |
| 3 or more Vehicles | 100 (23.7%) | 27 (10.7%) |
| Total | 421 (100.0%) | 252 (100.0%) |
Real Estate & Mortgages in Hughes Springs
Real Estate and Mortgage Overview in Hughes Springs
| Characteristic | Without Mortgage | With Mortgage |
| Housing Units | 188 | 233 |
| Median Property Value | $113,200 | $138,100 |
| Median Household Income | $52,143 | $20 |
| Monthly Housing Costs | $445 | $0 |
| Real Estate Taxes | $1,212 | $6 |
Property Value by Mortgage Status in Hughes Springs
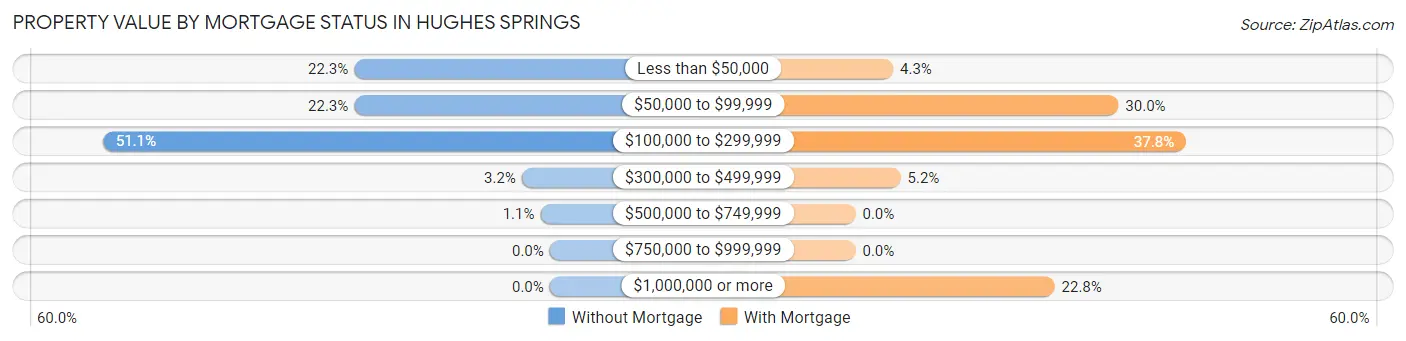
| Property Value | Without Mortgage | With Mortgage |
| Less than $50,000 | 42 (22.3%) | 10 (4.3%) |
| $50,000 to $99,999 | 42 (22.3%) | 70 (30.0%) |
| $100,000 to $299,999 | 96 (51.1%) | 88 (37.8%) |
| $300,000 to $499,999 | 6 (3.2%) | 12 (5.1%) |
| $500,000 to $749,999 | 2 (1.1%) | 0 (0.0%) |
| $750,000 to $999,999 | 0 (0.0%) | 0 (0.0%) |
| $1,000,000 or more | 0 (0.0%) | 53 (22.8%) |
| Total | 188 (100.0%) | 233 (100.0%) |
Household Income by Mortgage Status in Hughes Springs
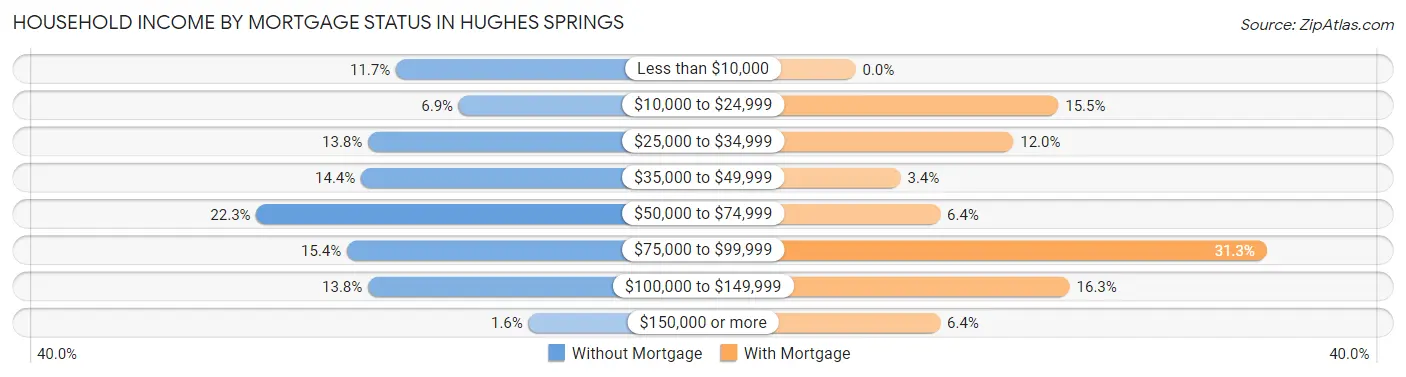
| Household Income | Without Mortgage | With Mortgage |
| Less than $10,000 | 22 (11.7%) | 0 (0.0%) |
| $10,000 to $24,999 | 13 (6.9%) | 36 (15.4%) |
| $25,000 to $34,999 | 26 (13.8%) | 28 (12.0%) |
| $35,000 to $49,999 | 27 (14.4%) | 8 (3.4%) |
| $50,000 to $74,999 | 42 (22.3%) | 15 (6.4%) |
| $75,000 to $99,999 | 29 (15.4%) | 73 (31.3%) |
| $100,000 to $149,999 | 26 (13.8%) | 38 (16.3%) |
| $150,000 or more | 3 (1.6%) | 15 (6.4%) |
| Total | 188 (100.0%) | 233 (100.0%) |
Property Value to Household Income Ratio in Hughes Springs
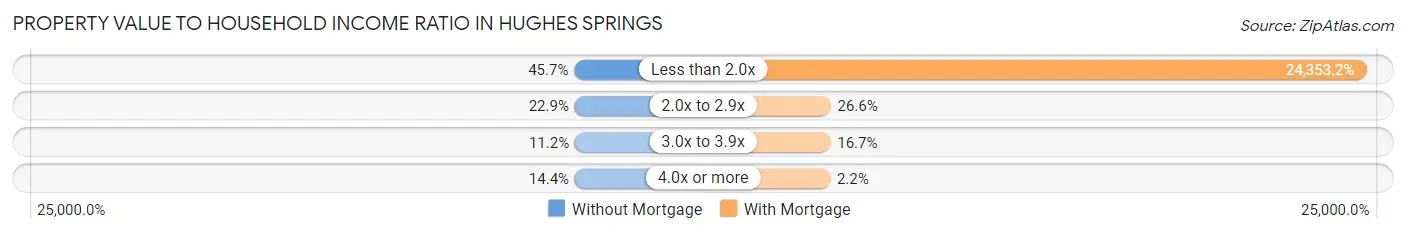
| Value-to-Income Ratio | Without Mortgage | With Mortgage |
| Less than 2.0x | 86 (45.7%) | 56,743 (24,353.2%) |
| 2.0x to 2.9x | 43 (22.9%) | 62 (26.6%) |
| 3.0x to 3.9x | 21 (11.2%) | 39 (16.7%) |
| 4.0x or more | 27 (14.4%) | 5 (2.1%) |
| Total | 188 (100.0%) | 233 (100.0%) |
Real Estate Taxes by Mortgage Status in Hughes Springs
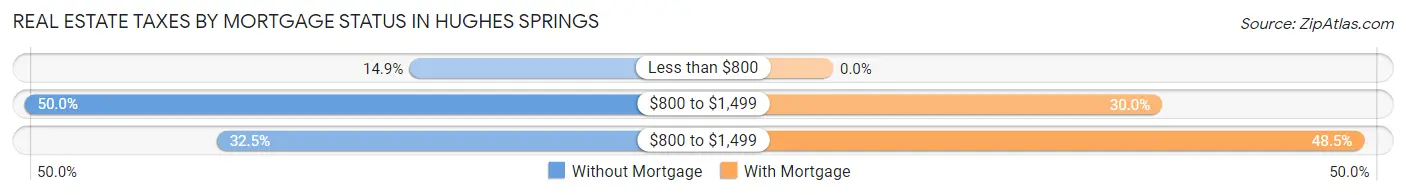
| Property Taxes | Without Mortgage | With Mortgage |
| Less than $800 | 28 (14.9%) | 0 (0.0%) |
| $800 to $1,499 | 94 (50.0%) | 70 (30.0%) |
| $800 to $1,499 | 61 (32.5%) | 113 (48.5%) |
| Total | 188 (100.0%) | 233 (100.0%) |
Health & Disability in Hughes Springs
Health Insurance Coverage by Age in Hughes Springs
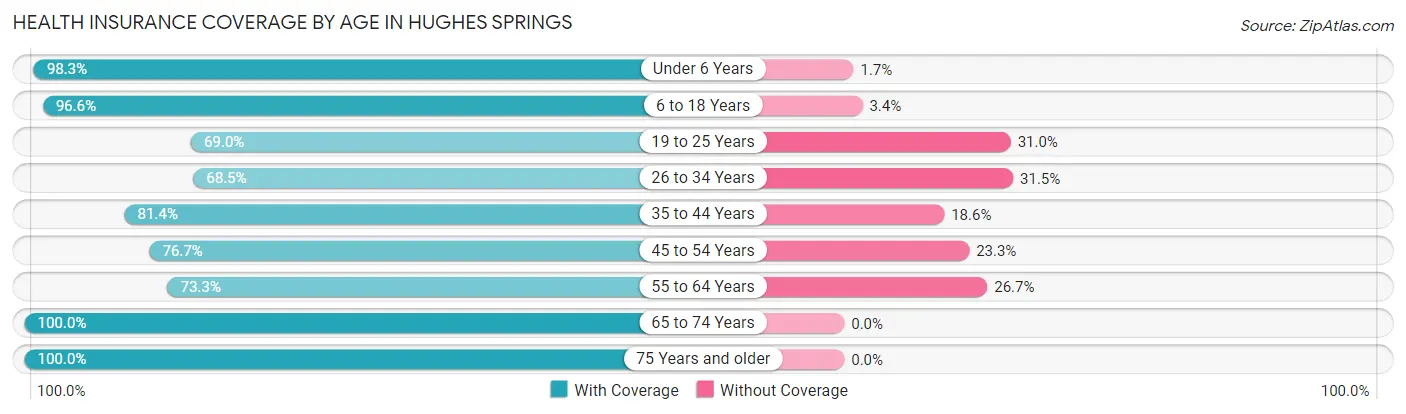
| Age Bracket | With Coverage | Without Coverage |
| Under 6 Years | 171 (98.3%) | 3 (1.7%) |
| 6 to 18 Years | 171 (96.6%) | 6 (3.4%) |
| 19 to 25 Years | 120 (69.0%) | 54 (31.0%) |
| 26 to 34 Years | 185 (68.5%) | 85 (31.5%) |
| 35 to 44 Years | 144 (81.4%) | 33 (18.6%) |
| 45 to 54 Years | 168 (76.7%) | 51 (23.3%) |
| 55 to 64 Years | 77 (73.3%) | 28 (26.7%) |
| 65 to 74 Years | 146 (100.0%) | 0 (0.0%) |
| 75 Years and older | 90 (100.0%) | 0 (0.0%) |
| Total | 1,272 (83.0%) | 260 (17.0%) |
Health Insurance Coverage by Citizenship Status in Hughes Springs
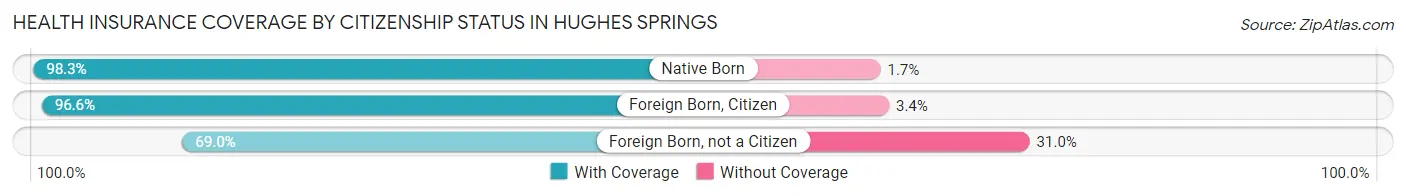
| Citizenship Status | With Coverage | Without Coverage |
| Native Born | 171 (98.3%) | 3 (1.7%) |
| Foreign Born, Citizen | 171 (96.6%) | 6 (3.4%) |
| Foreign Born, not a Citizen | 120 (69.0%) | 54 (31.0%) |
Health Insurance Coverage by Household Income in Hughes Springs
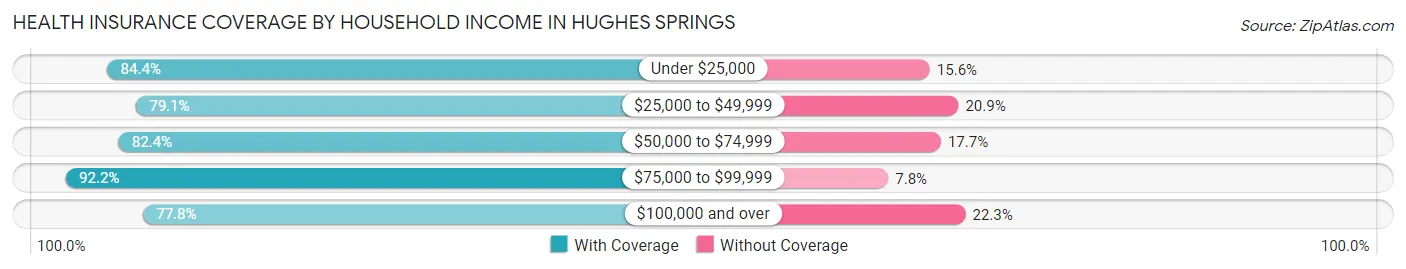
| Household Income | With Coverage | Without Coverage |
| Under $25,000 | 320 (84.4%) | 59 (15.6%) |
| $25,000 to $49,999 | 136 (79.1%) | 36 (20.9%) |
| $50,000 to $74,999 | 322 (82.4%) | 69 (17.6%) |
| $75,000 to $99,999 | 225 (92.2%) | 19 (7.8%) |
| $100,000 and over | 269 (77.7%) | 77 (22.3%) |
Public vs Private Health Insurance Coverage by Age in Hughes Springs
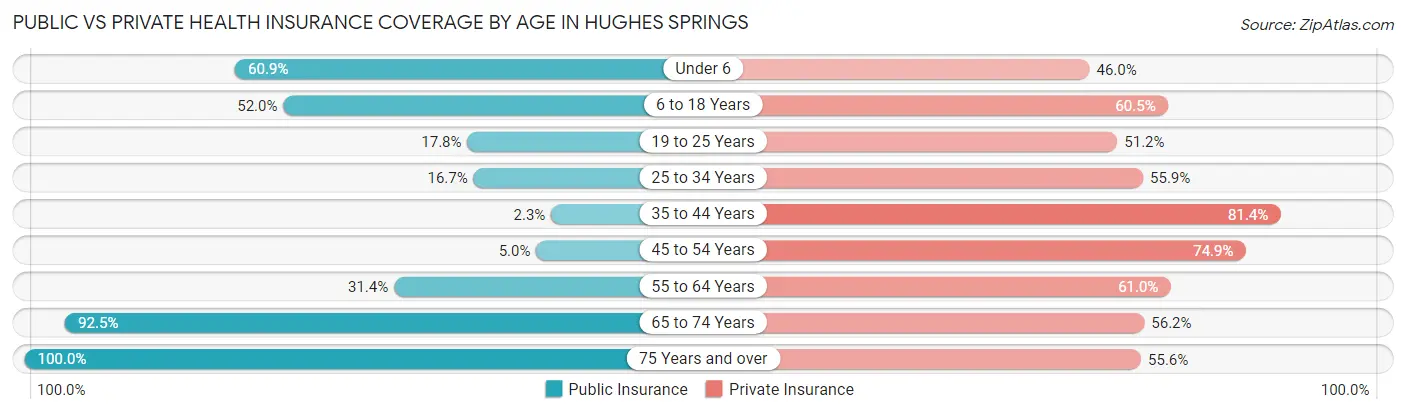
| Age Bracket | Public Insurance | Private Insurance |
| Under 6 | 106 (60.9%) | 80 (46.0%) |
| 6 to 18 Years | 92 (52.0%) | 107 (60.5%) |
| 19 to 25 Years | 31 (17.8%) | 89 (51.1%) |
| 25 to 34 Years | 45 (16.7%) | 151 (55.9%) |
| 35 to 44 Years | 4 (2.3%) | 144 (81.4%) |
| 45 to 54 Years | 11 (5.0%) | 164 (74.9%) |
| 55 to 64 Years | 33 (31.4%) | 64 (61.0%) |
| 65 to 74 Years | 135 (92.5%) | 82 (56.2%) |
| 75 Years and over | 90 (100.0%) | 50 (55.6%) |
| Total | 547 (35.7%) | 931 (60.8%) |
Disability Status by Sex by Age in Hughes Springs
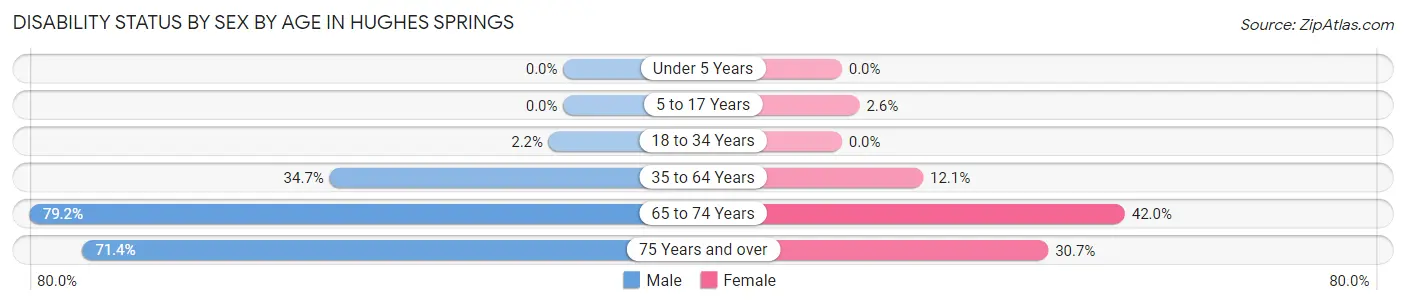
| Age Bracket | Male | Female |
| Under 5 Years | 0 (0.0%) | 0 (0.0%) |
| 5 to 17 Years | 0 (0.0%) | 3 (2.6%) |
| 18 to 34 Years | 5 (2.1%) | 0 (0.0%) |
| 35 to 64 Years | 76 (34.7%) | 34 (12.1%) |
| 65 to 74 Years | 61 (79.2%) | 29 (42.0%) |
| 75 Years and over | 20 (71.4%) | 19 (30.6%) |
Disability Class by Sex by Age in Hughes Springs
Disability Class: Hearing Difficulty
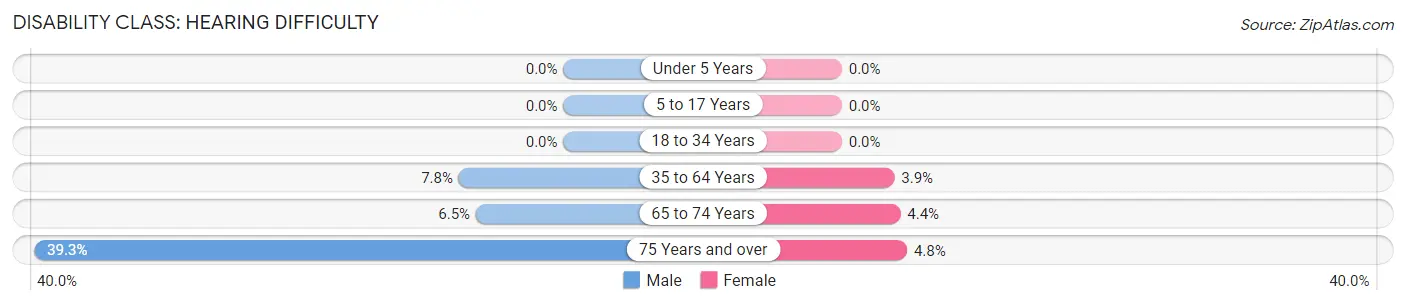
| Age Bracket | Male | Female |
| Under 5 Years | 0 (0.0%) | 0 (0.0%) |
| 5 to 17 Years | 0 (0.0%) | 0 (0.0%) |
| 18 to 34 Years | 0 (0.0%) | 0 (0.0%) |
| 35 to 64 Years | 17 (7.8%) | 11 (3.9%) |
| 65 to 74 Years | 5 (6.5%) | 3 (4.3%) |
| 75 Years and over | 11 (39.3%) | 3 (4.8%) |
Disability Class: Vision Difficulty
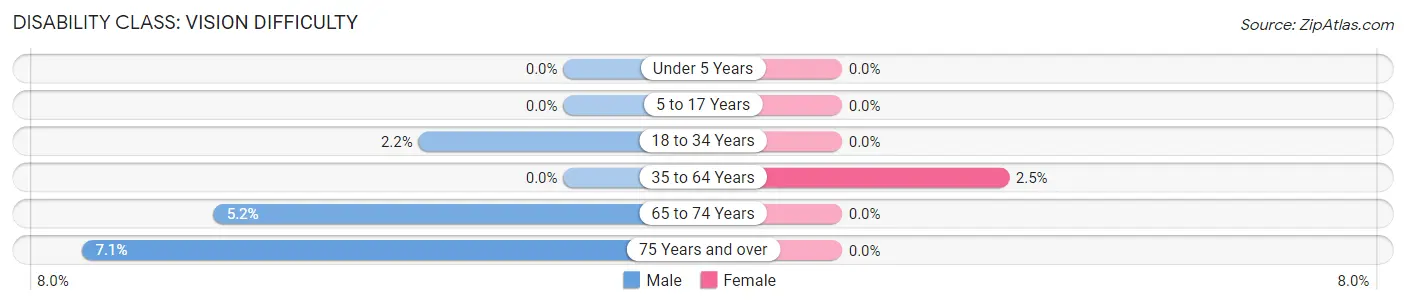
| Age Bracket | Male | Female |
| Under 5 Years | 0 (0.0%) | 0 (0.0%) |
| 5 to 17 Years | 0 (0.0%) | 0 (0.0%) |
| 18 to 34 Years | 5 (2.1%) | 0 (0.0%) |
| 35 to 64 Years | 0 (0.0%) | 7 (2.5%) |
| 65 to 74 Years | 4 (5.2%) | 0 (0.0%) |
| 75 Years and over | 2 (7.1%) | 0 (0.0%) |
Disability Class: Cognitive Difficulty
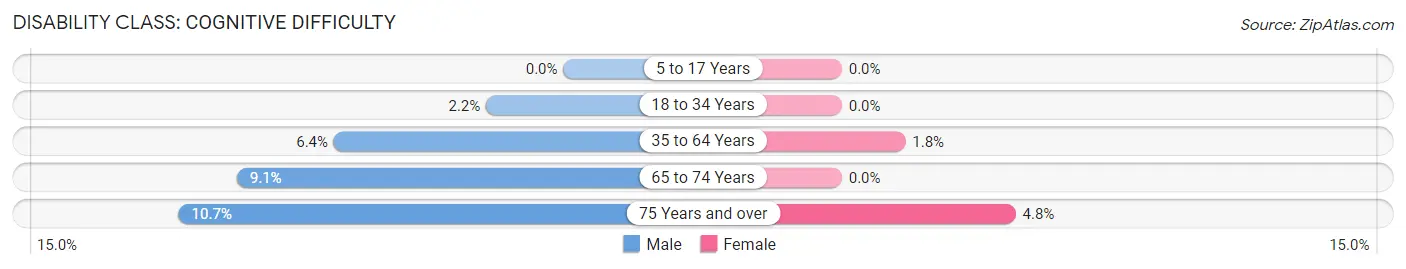
| Age Bracket | Male | Female |
| 5 to 17 Years | 0 (0.0%) | 0 (0.0%) |
| 18 to 34 Years | 5 (2.1%) | 0 (0.0%) |
| 35 to 64 Years | 14 (6.4%) | 5 (1.8%) |
| 65 to 74 Years | 7 (9.1%) | 0 (0.0%) |
| 75 Years and over | 3 (10.7%) | 3 (4.8%) |
Disability Class: Ambulatory Difficulty
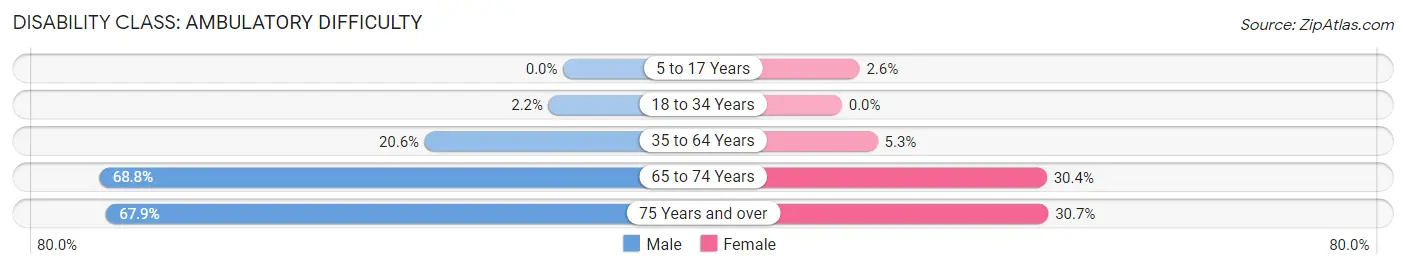
| Age Bracket | Male | Female |
| 5 to 17 Years | 0 (0.0%) | 3 (2.6%) |
| 18 to 34 Years | 5 (2.1%) | 0 (0.0%) |
| 35 to 64 Years | 45 (20.5%) | 15 (5.3%) |
| 65 to 74 Years | 53 (68.8%) | 21 (30.4%) |
| 75 Years and over | 19 (67.9%) | 19 (30.6%) |
Disability Class: Self-Care Difficulty
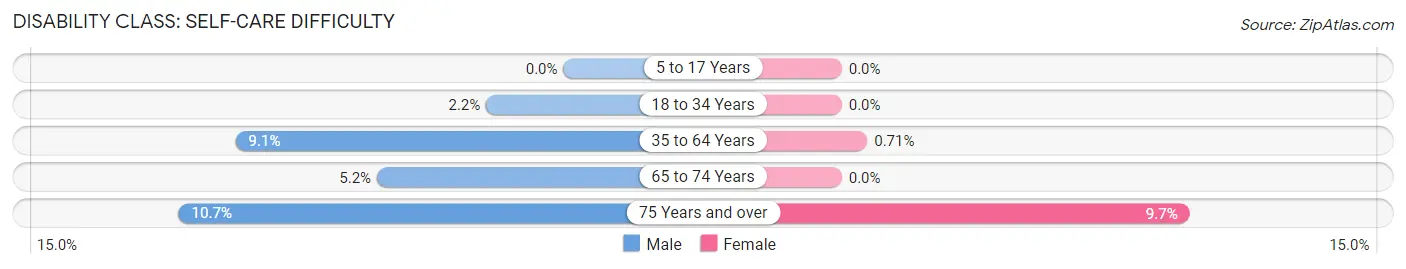
| Age Bracket | Male | Female |
| 5 to 17 Years | 0 (0.0%) | 0 (0.0%) |
| 18 to 34 Years | 5 (2.1%) | 0 (0.0%) |
| 35 to 64 Years | 20 (9.1%) | 2 (0.7%) |
| 65 to 74 Years | 4 (5.2%) | 0 (0.0%) |
| 75 Years and over | 3 (10.7%) | 6 (9.7%) |
Technology Access in Hughes Springs
Computing Device Access in Hughes Springs
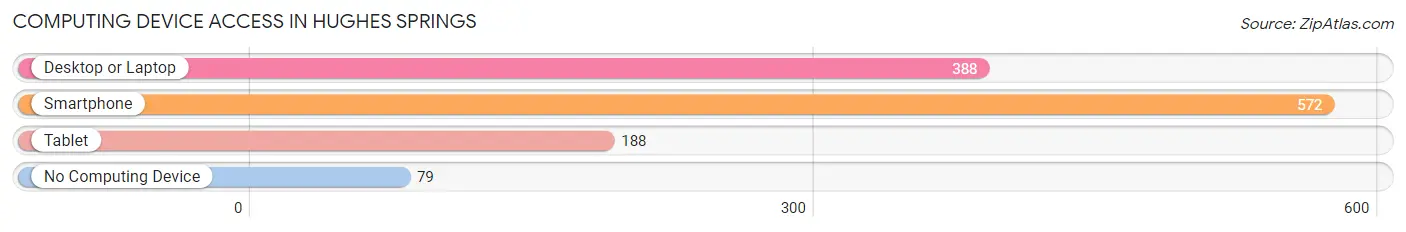
| Device Type | # Households | % Households |
| Desktop or Laptop | 388 | 57.7% |
| Smartphone | 572 | 85.0% |
| Tablet | 188 | 27.9% |
| No Computing Device | 79 | 11.7% |
| Total | 673 | 100.0% |
Internet Access in Hughes Springs
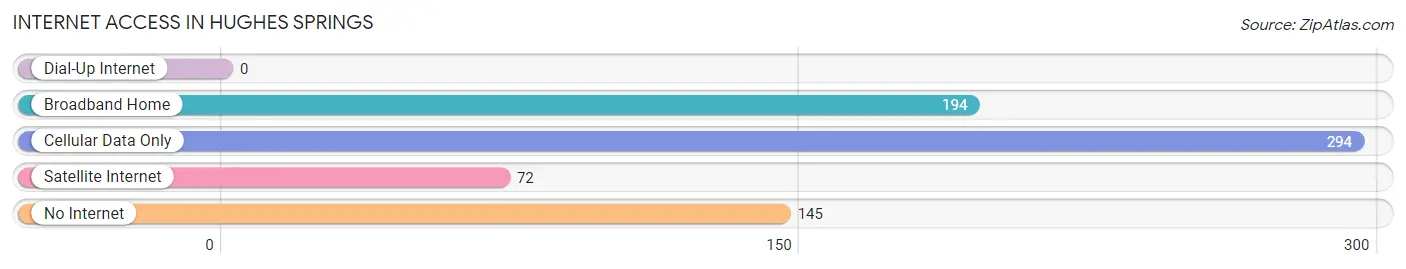
| Internet Type | # Households | % Households |
| Dial-Up Internet | 0 | 0.0% |
| Broadband Home | 194 | 28.8% |
| Cellular Data Only | 294 | 43.7% |
| Satellite Internet | 72 | 10.7% |
| No Internet | 145 | 21.5% |
| Total | 673 | 100.0% |
Hughes Springs Summary
Hughes Springs is a small city located in Cass County, Texas, United States. It is situated approximately 100 miles east of Dallas and is part of the Texarkana metropolitan area. The population of Hughes Springs was 1,945 at the 2010 census.
History
The area that is now Hughes Springs was first settled in the late 1840s by a group of settlers from Arkansas. The settlement was originally known as "Hickory Hill" and was located near the present-day intersection of FM 991 and FM 250. In 1872, the settlement was renamed "Hughes Springs" after the Hughes family, who had moved to the area from Arkansas.
The town was officially incorporated in 1876 and was home to a variety of businesses, including a cotton gin, a grist mill, and a blacksmith shop. The town also had a post office, a school, and a church.
In the early 1900s, the town began to grow rapidly due to the discovery of oil in the area. The population of Hughes Springs increased from 500 in 1910 to 1,500 in 1920. The town was also home to a variety of businesses, including a bank, a hotel, a movie theater, and a variety of stores.
Geography
Hughes Springs is located at 33°14'25" North, 94°25'45" West (33.240278, -94.429167). According to the United States Census Bureau, the city has a total area of 1.3 square miles (3.4 km2), all of it land.
Economy
The economy of Hughes Springs is largely based on agriculture and oil production. The town is home to a variety of businesses, including a bank, a hotel, a movie theater, and a variety of stores. The town is also home to a number of oil and gas production companies.
Demographics
As of the census of 2000, there were 1,945 people, 745 households, and 517 families residing in the city. The population density was 1,521.2 people per square mile (586.3/km2). There were 845 housing units at an average density of 654.3 per square mile (252.3/km2). The racial makeup of the city was 79.17% White, 17.90% African American, 0.36% Native American, 0.36% Asian, 0.05% Pacific Islander, 1.02% from other races, and 1.14% from two or more races. Hispanic or Latino of any race were 2.90% of the population.
There were 745 households, out of which 33.2% had children under the age of 18 living with them, 48.2% were married couples living together, 16.2% had a female householder with no husband present, and 31.2% were non-families. 28.2% of all households were made up of individuals, and 15.2% had someone living alone who was 65 years of age or older. The average household size was 2.60 and the average family size was 3.17.
In the city, the population was spread out, with 28.2% under the age of 18, 8.2% from 18 to 24, 25.2% from 25 to 44, 22.2% from 45 to 64, and 16.2% who were 65 years of age or older. The median age was 37 years. For every 100 females, there were 87.2 males. For every 100 females age 18 and over, there were 81.2 males.
The median income for a household in the city was $27,500, and the median income for a family was $32,500. Males had a median income of $30,000 versus $20,000 for females. The per capita income for the city was $14,845. About 15.2% of families and 17.2% of the population were below the poverty line, including 22.2% of those under age 18 and 16.2% of those age 65 or over.
Common Questions
What is Per Capita Income in Hughes Springs?
Per Capita income in Hughes Springs is $23,647.
What is the Median Family Income in Hughes Springs?
Median Family Income in Hughes Springs is $50,341.
What is the Median Household income in Hughes Springs?
Median Household Income in Hughes Springs is $53,551.
What is Income or Wage Gap in Hughes Springs?
Income or Wage Gap in Hughes Springs is 35.1%.
Women in Hughes Springs earn 64.9 cents for every dollar earned by a man.
What is Inequality or Gini Index in Hughes Springs?
Inequality or Gini Index in Hughes Springs is 0.42.
What is the Total Population of Hughes Springs?
Total Population of Hughes Springs is 1,621.
What is the Total Male Population of Hughes Springs?
Total Male Population of Hughes Springs is 757.
What is the Total Female Population of Hughes Springs?
Total Female Population of Hughes Springs is 864.
What is the Ratio of Males per 100 Females in Hughes Springs?
There are 87.62 Males per 100 Females in Hughes Springs.
What is the Ratio of Females per 100 Males in Hughes Springs?
There are 114.13 Females per 100 Males in Hughes Springs.
What is the Median Population Age in Hughes Springs?
Median Population Age in Hughes Springs is 35.7 Years.
What is the Average Family Size in Hughes Springs
Average Family Size in Hughes Springs is 2.6 People.
What is the Average Household Size in Hughes Springs
Average Household Size in Hughes Springs is 2.3 People.
How Large is the Labor Force in Hughes Springs?
There are 744 People in the Labor Forcein in Hughes Springs.
What is the Percentage of People in the Labor Force in Hughes Springs?
56.8% of People are in the Labor Force in Hughes Springs.
What is the Unemployment Rate in Hughes Springs?
Unemployment Rate in Hughes Springs is 1.1%.