Hondo, TX Map & Demographics
Hondo Map
Hondo Overview
$20,796
PER CAPITA INCOME
$57,068
AVG FAMILY INCOME
$57,819
AVG HOUSEHOLD INCOME
47.1%
WAGE / INCOME GAP [ % ]
52.9¢/ $1
WAGE / INCOME GAP [ $ ]
$11,625
FAMILY INCOME DEFICIT
0.36
INEQUALITY / GINI INDEX
8,424
TOTAL POPULATION
5,084
MALE POPULATION
3,340
FEMALE POPULATION
152.22
MALES / 100 FEMALES
65.70
FEMALES / 100 MALES
31.3
MEDIAN AGE
3.1
AVG FAMILY SIZE
2.5
AVG HOUSEHOLD SIZE
3,055
LABOR FORCE [ PEOPLE ]
44.6%
PERCENT IN LABOR FORCE
2.9%
UNEMPLOYMENT RATE
Hondo Zip Codes
Hondo Area Codes
Income in Hondo
Income Overview in Hondo
Per Capita Income in Hondo is $20,796, while median incomes of families and households are $57,068 and $57,819 respectively.
| Characteristic | Number | Measure |
| Per Capita Income | 8,424 | $20,796 |
| Median Family Income | 1,662 | $57,068 |
| Mean Family Income | 1,662 | $73,000 |
| Median Household Income | 2,541 | $57,819 |
| Mean Household Income | 2,541 | $67,446 |
| Income Deficit | 1,662 | $11,625 |
| Wage / Income Gap (%) | 8,424 | 47.05% |
| Wage / Income Gap ($) | 8,424 | 52.95¢ per $1 |
| Gini / Inequality Index | 8,424 | 0.36 |
Earnings by Sex in Hondo
Average Earnings in Hondo are $33,750, $45,787 for men and $24,244 for women, a difference of 47.0%.
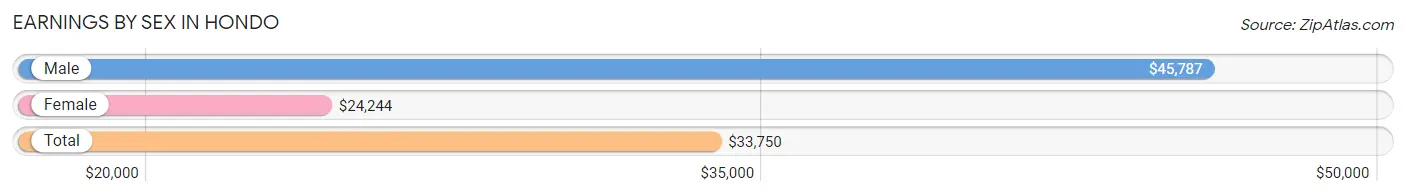
| Sex | Number | Average Earnings |
| Male | 1,648 (50.0%) | $45,787 |
| Female | 1,646 (50.0%) | $24,244 |
| Total | 3,294 (100.0%) | $33,750 |
Earnings by Sex by Income Bracket in Hondo
The most common earnings brackets in Hondo are $65,000 to $74,999 for men (294 | 17.8%) and $25,000 to $29,999 for women (131 | 8.0%).
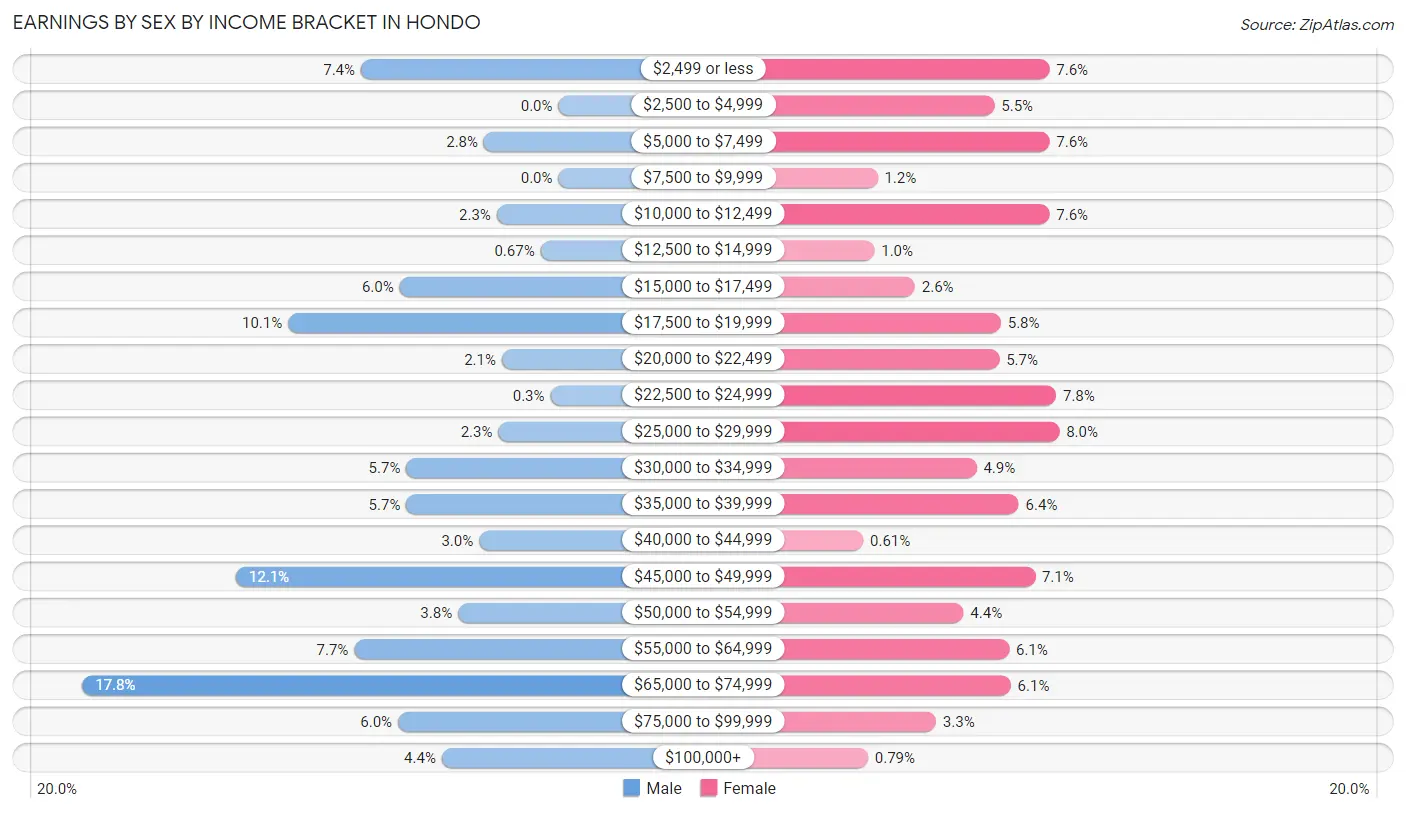
| Income | Male | Female |
| $2,499 or less | 122 (7.4%) | 125 (7.6%) |
| $2,500 to $4,999 | 0 (0.0%) | 91 (5.5%) |
| $5,000 to $7,499 | 46 (2.8%) | 125 (7.6%) |
| $7,500 to $9,999 | 0 (0.0%) | 19 (1.1%) |
| $10,000 to $12,499 | 38 (2.3%) | 125 (7.6%) |
| $12,500 to $14,999 | 11 (0.7%) | 17 (1.0%) |
| $15,000 to $17,499 | 98 (5.9%) | 42 (2.5%) |
| $17,500 to $19,999 | 167 (10.1%) | 95 (5.8%) |
| $20,000 to $22,499 | 35 (2.1%) | 94 (5.7%) |
| $22,500 to $24,999 | 5 (0.3%) | 129 (7.8%) |
| $25,000 to $29,999 | 37 (2.2%) | 131 (8.0%) |
| $30,000 to $34,999 | 94 (5.7%) | 80 (4.9%) |
| $35,000 to $39,999 | 94 (5.7%) | 106 (6.4%) |
| $40,000 to $44,999 | 49 (3.0%) | 10 (0.6%) |
| $45,000 to $49,999 | 199 (12.1%) | 116 (7.0%) |
| $50,000 to $54,999 | 62 (3.8%) | 72 (4.4%) |
| $55,000 to $64,999 | 126 (7.6%) | 100 (6.1%) |
| $65,000 to $74,999 | 294 (17.8%) | 101 (6.1%) |
| $75,000 to $99,999 | 99 (6.0%) | 55 (3.3%) |
| $100,000+ | 72 (4.4%) | 13 (0.8%) |
| Total | 1,648 (100.0%) | 1,646 (100.0%) |
Earnings by Sex by Educational Attainment in Hondo
Average earnings in Hondo are $41,944 for men and $26,234 for women, a difference of 37.4%. Men with an educational attainment of bachelor's degree enjoy the highest average annual earnings of $67,083, while those with college or associate's degree education earn the least with $44,318. Women with an educational attainment of graduate degree earn the most with the average annual earnings of $65,161, while those with college or associate's degree education have the smallest earnings of $23,211.
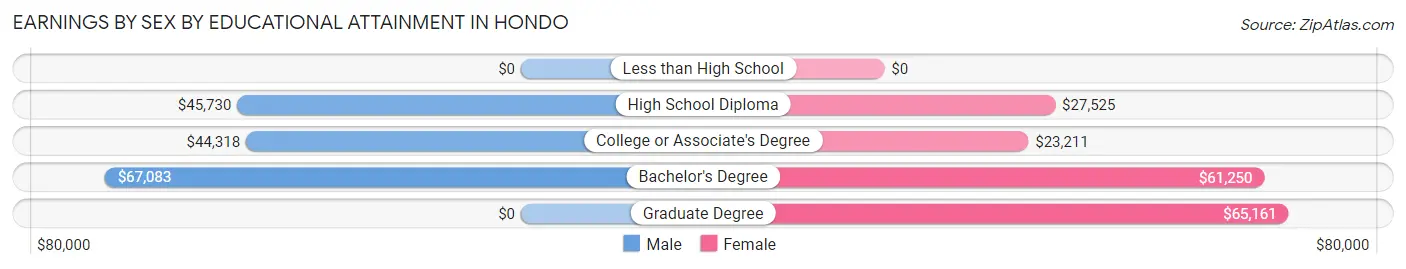
| Educational Attainment | Male Income | Female Income |
| Less than High School | - | - |
| High School Diploma | $45,730 | $27,525 |
| College or Associate's Degree | $44,318 | $23,211 |
| Bachelor's Degree | $67,083 | $61,250 |
| Graduate Degree | - | - |
| Total | $41,944 | $26,234 |
Family Income in Hondo
Family Income Brackets in Hondo
According to the Hondo family income data, there are 475 families falling into the $50,000 to $74,999 income range, which is the most common income bracket and makes up 28.6% of all families. Conversely, the $200,000+ income bracket is the least frequent group with only 15 families (0.9%) belonging to this category.
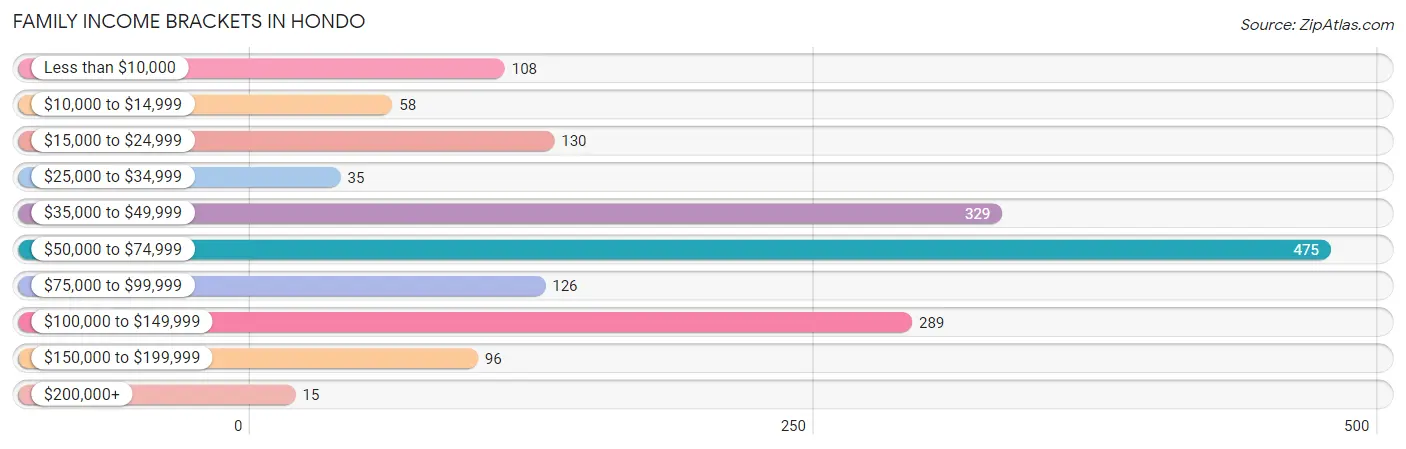
| Income Bracket | # Families | % Families |
| Less than $10,000 | 108 | 6.5% |
| $10,000 to $14,999 | 58 | 3.5% |
| $15,000 to $24,999 | 130 | 7.8% |
| $25,000 to $34,999 | 35 | 2.1% |
| $35,000 to $49,999 | 329 | 19.8% |
| $50,000 to $74,999 | 475 | 28.6% |
| $75,000 to $99,999 | 126 | 7.6% |
| $100,000 to $149,999 | 289 | 17.4% |
| $150,000 to $199,999 | 96 | 5.8% |
| $200,000+ | 15 | 0.9% |
Family Income by Famaliy Size in Hondo
4-person families (265 | 15.9%) account for the highest median family income in Hondo with $113,578 per family, while 2-person families (803 | 48.3%) have the highest median income of $29,018 per family member.
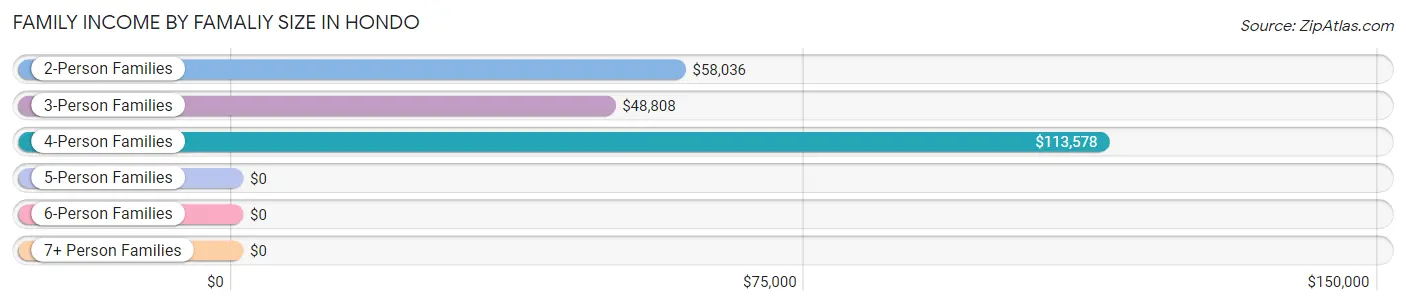
| Income Bracket | # Families | Median Income |
| 2-Person Families | 803 (48.3%) | $58,036 |
| 3-Person Families | 378 (22.7%) | $48,808 |
| 4-Person Families | 265 (15.9%) | $113,578 |
| 5-Person Families | 153 (9.2%) | $0 |
| 6-Person Families | 36 (2.2%) | $0 |
| 7+ Person Families | 27 (1.6%) | $0 |
| Total | 1,662 (100.0%) | $57,068 |
Family Income by Number of Earners in Hondo
The median family income in Hondo is $57,068, with families comprising 3+ earners (170) having the highest median family income of $129,758, while families with 1 earner (620) have the lowest median family income of $41,463, accounting for 10.2% and 37.3% of families, respectively.
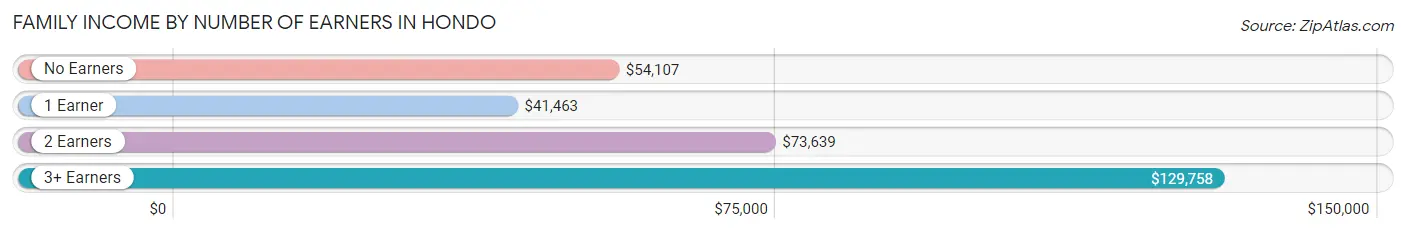
| Number of Earners | # Families | Median Income |
| No Earners | 281 (16.9%) | $54,107 |
| 1 Earner | 620 (37.3%) | $41,463 |
| 2 Earners | 591 (35.6%) | $73,639 |
| 3+ Earners | 170 (10.2%) | $129,758 |
| Total | 1,662 (100.0%) | $57,068 |
Household Income in Hondo
Household Income Brackets in Hondo
With 1,044 households falling in the category, the $50,000 to $74,999 income range is the most frequent in Hondo, accounting for 41.1% of all households. In contrast, only 15 households (0.6%) fall into the $200,000+ income bracket, making it the least populous group.
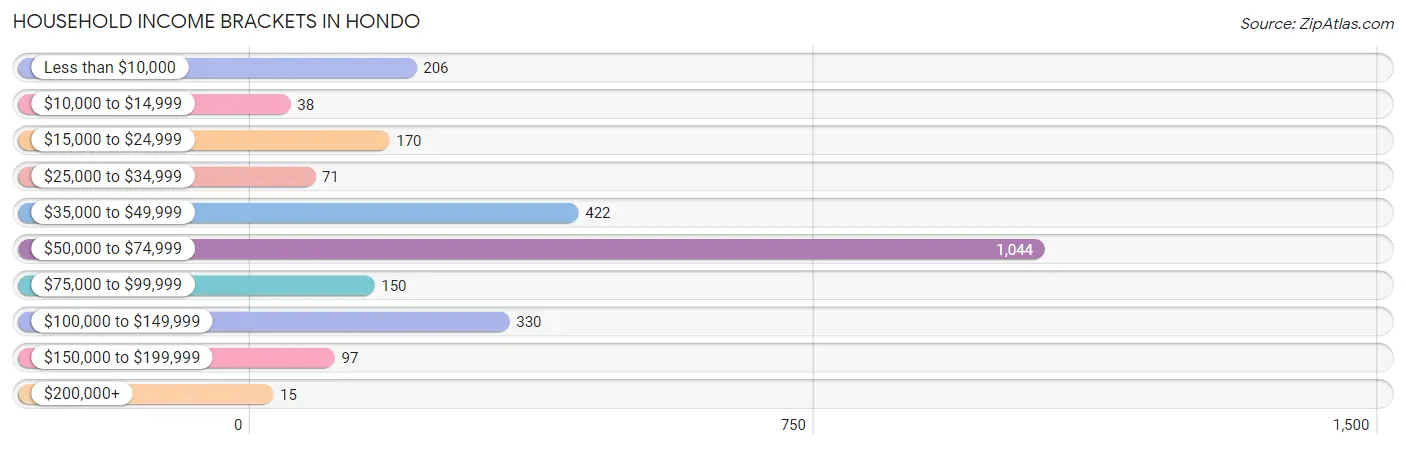
| Income Bracket | # Households | % Households |
| Less than $10,000 | 206 | 8.1% |
| $10,000 to $14,999 | 38 | 1.5% |
| $15,000 to $24,999 | 170 | 6.7% |
| $25,000 to $34,999 | 71 | 2.8% |
| $35,000 to $49,999 | 422 | 16.6% |
| $50,000 to $74,999 | 1,044 | 41.1% |
| $75,000 to $99,999 | 150 | 5.9% |
| $100,000 to $149,999 | 330 | 13.0% |
| $150,000 to $199,999 | 97 | 3.8% |
| $200,000+ | 15 | 0.6% |
Household Income by Householder Age in Hondo
The median household income in Hondo is $57,819, with the highest median household income of $60,903 found in the 45 to 64 years age bracket for the primary householder. A total of 848 households (33.4%) fall into this category. Meanwhile, the 15 to 24 years age bracket for the primary householder has the lowest median household income of $0, with 201 households (7.9%) in this group.
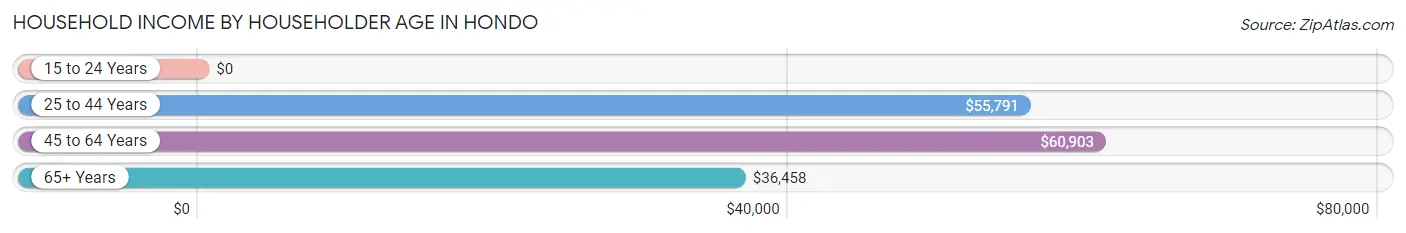
| Income Bracket | # Households | Median Income |
| 15 to 24 Years | 201 (7.9%) | $0 |
| 25 to 44 Years | 845 (33.3%) | $55,791 |
| 45 to 64 Years | 848 (33.4%) | $60,903 |
| 65+ Years | 647 (25.5%) | $36,458 |
| Total | 2,541 (100.0%) | $57,819 |
Poverty in Hondo
Income Below Poverty by Sex and Age in Hondo
With 12.2% poverty level for males and 24.6% for females among the residents of Hondo, 5 year old males and 6 to 11 year old females are the most vulnerable to poverty, with 23 males (100.0%) and 100 females (54.6%) in their respective age groups living below the poverty level.
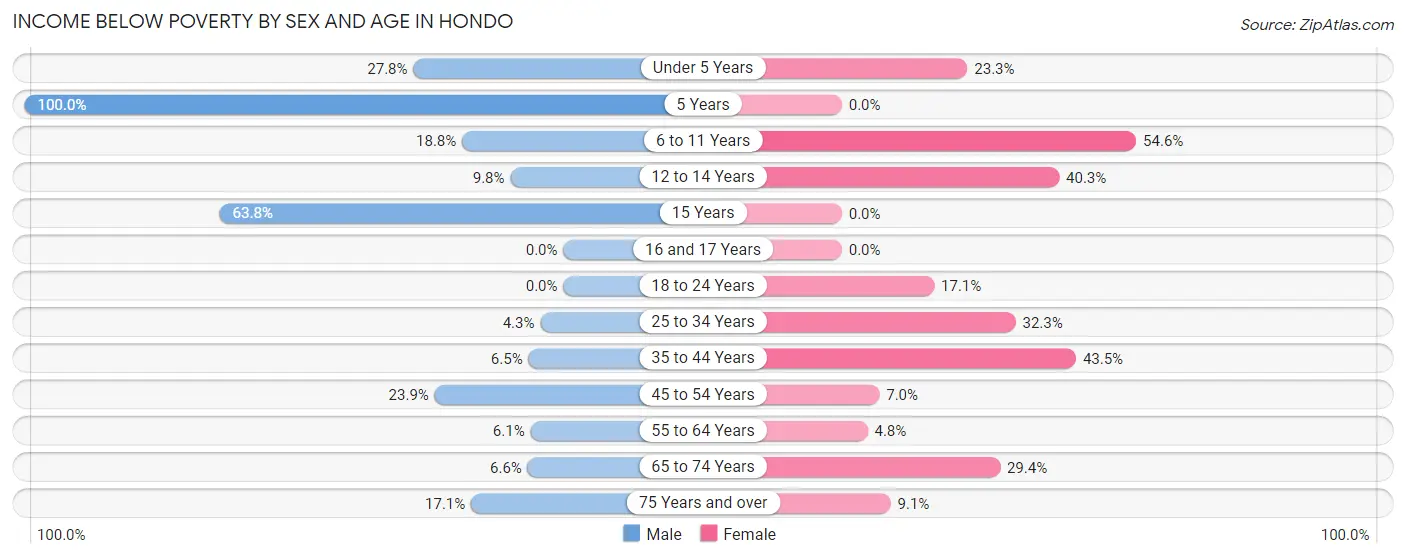
| Age Bracket | Male | Female |
| Under 5 Years | 81 (27.8%) | 76 (23.3%) |
| 5 Years | 23 (100.0%) | 0 (0.0%) |
| 6 to 11 Years | 59 (18.8%) | 100 (54.6%) |
| 12 to 14 Years | 17 (9.8%) | 71 (40.3%) |
| 15 Years | 37 (63.8%) | 0 (0.0%) |
| 16 and 17 Years | 0 (0.0%) | 0 (0.0%) |
| 18 to 24 Years | 0 (0.0%) | 30 (17.1%) |
| 25 to 34 Years | 25 (4.3%) | 198 (32.3%) |
| 35 to 44 Years | 24 (6.5%) | 166 (43.5%) |
| 45 to 54 Years | 59 (23.9%) | 24 (7.0%) |
| 55 to 64 Years | 23 (6.1%) | 16 (4.8%) |
| 65 to 74 Years | 18 (6.6%) | 101 (29.4%) |
| 75 Years and over | 19 (17.1%) | 24 (9.1%) |
| Total | 385 (12.2%) | 806 (24.6%) |
Income Above Poverty by Sex and Age in Hondo
According to the poverty statistics in Hondo, males aged 18 to 24 years and females aged 5 years are the age groups that are most secure financially, with 100.0% of males and 100.0% of females in these age groups living above the poverty line.
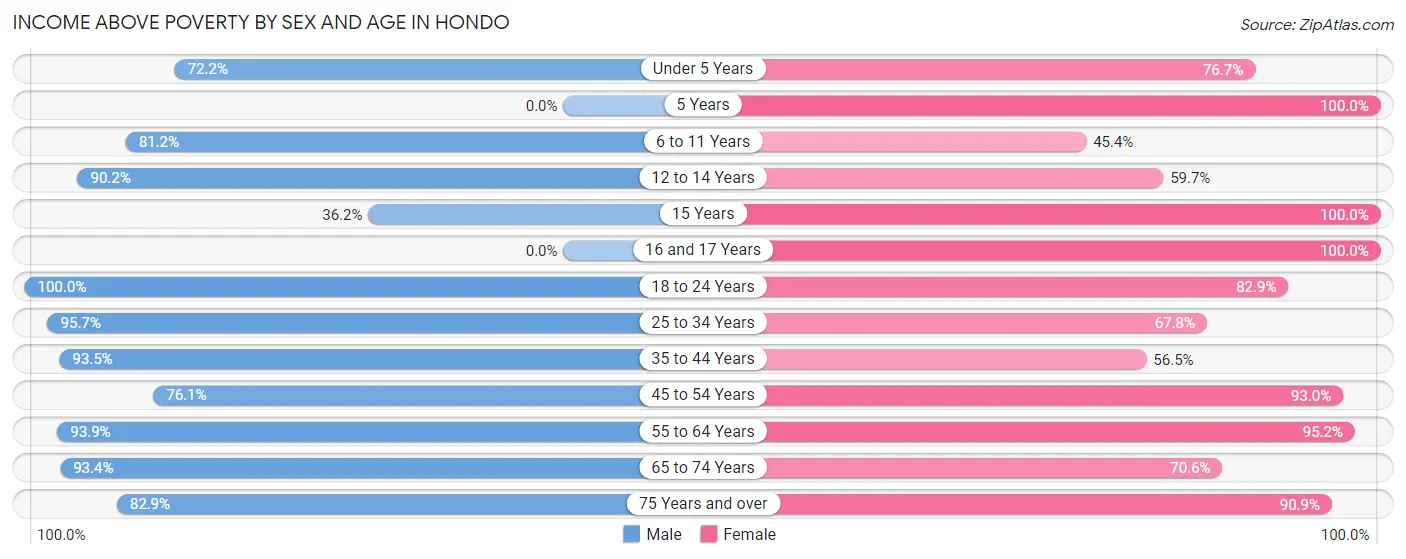
| Age Bracket | Male | Female |
| Under 5 Years | 210 (72.2%) | 250 (76.7%) |
| 5 Years | 0 (0.0%) | 16 (100.0%) |
| 6 to 11 Years | 255 (81.2%) | 83 (45.4%) |
| 12 to 14 Years | 156 (90.2%) | 105 (59.7%) |
| 15 Years | 21 (36.2%) | 15 (100.0%) |
| 16 and 17 Years | 0 (0.0%) | 102 (100.0%) |
| 18 to 24 Years | 342 (100.0%) | 145 (82.9%) |
| 25 to 34 Years | 559 (95.7%) | 416 (67.7%) |
| 35 to 44 Years | 347 (93.5%) | 216 (56.5%) |
| 45 to 54 Years | 188 (76.1%) | 321 (93.0%) |
| 55 to 64 Years | 354 (93.9%) | 319 (95.2%) |
| 65 to 74 Years | 254 (93.4%) | 243 (70.6%) |
| 75 Years and over | 92 (82.9%) | 241 (90.9%) |
| Total | 2,778 (87.8%) | 2,472 (75.4%) |
Income Below Poverty Among Married-Couple Families in Hondo
The poverty statistics for married-couple families in Hondo show that 4.7% or 51 of the total 1,093 families live below the poverty line. Families with 5 or more children have the highest poverty rate of 100.0%, comprising of 12 families. On the other hand, families with 1 or 2 children have the lowest poverty rate of 0.0%, which includes 0 families.
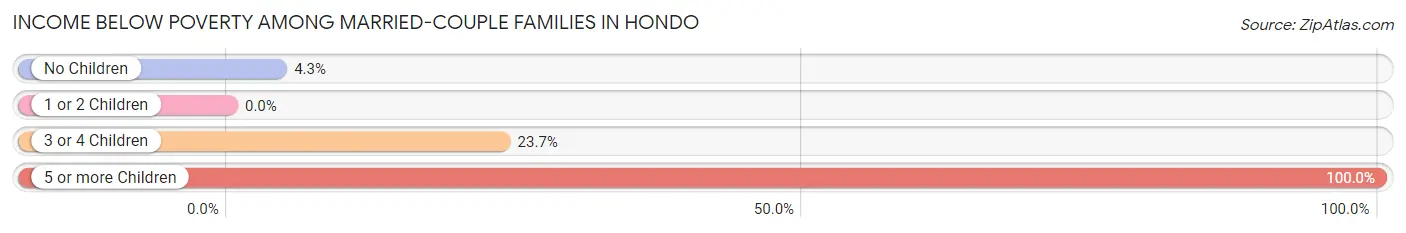
| Children | Above Poverty | Below Poverty |
| No Children | 559 (95.7%) | 25 (4.3%) |
| 1 or 2 Children | 438 (100.0%) | 0 (0.0%) |
| 3 or 4 Children | 45 (76.3%) | 14 (23.7%) |
| 5 or more Children | 0 (0.0%) | 12 (100.0%) |
| Total | 1,042 (95.3%) | 51 (4.7%) |
Income Below Poverty Among Single-Parent Households in Hondo
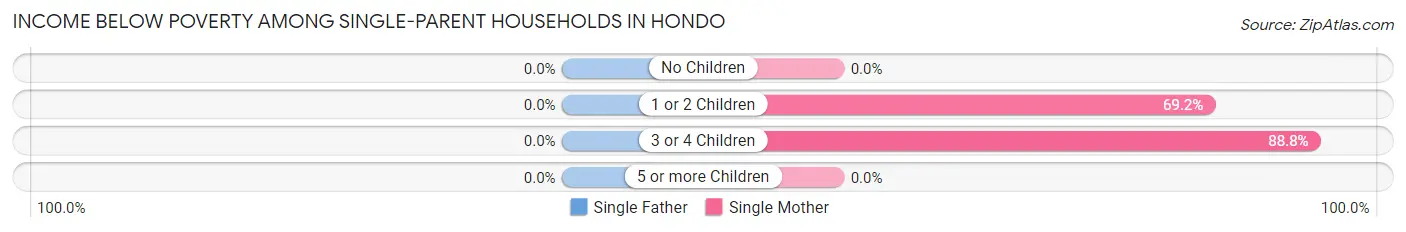
| Children | Single Father | Single Mother |
| No Children | 0 (0.0%) | 0 (0.0%) |
| 1 or 2 Children | 0 (0.0%) | 146 (69.2%) |
| 3 or 4 Children | 0 (0.0%) | 95 (88.8%) |
| 5 or more Children | 0 (0.0%) | 0 (0.0%) |
| Total | 0 (0.0%) | 241 (57.0%) |
Income Below Poverty Among Married-Couple vs Single-Parent Households in Hondo
The poverty data for Hondo shows that 51 of the married-couple family households (4.7%) and 241 of the single-parent households (42.4%) are living below the poverty level. Within the married-couple family households, those with 5 or more children have the highest poverty rate, with 12 households (100.0%) falling below the poverty line. Among the single-parent households, those with 3 or 4 children have the highest poverty rate, with 95 household (77.9%) living below poverty.
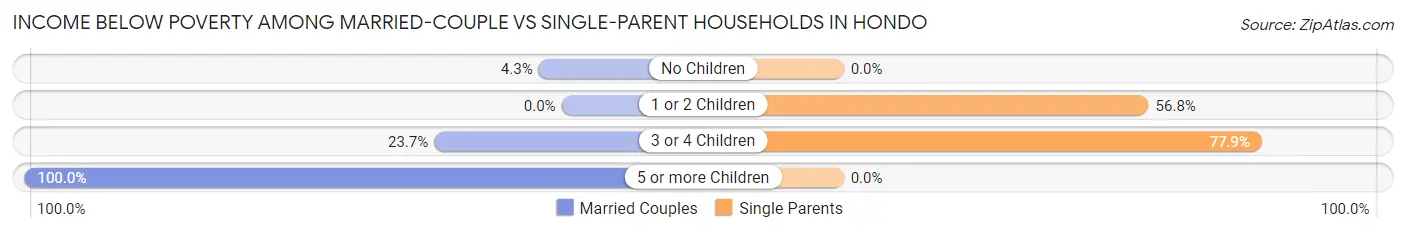
| Children | Married-Couple Families | Single-Parent Households |
| No Children | 25 (4.3%) | 0 (0.0%) |
| 1 or 2 Children | 0 (0.0%) | 146 (56.8%) |
| 3 or 4 Children | 14 (23.7%) | 95 (77.9%) |
| 5 or more Children | 12 (100.0%) | 0 (0.0%) |
| Total | 51 (4.7%) | 241 (42.4%) |
Race in Hondo
The most populous races in Hondo are White / Caucasian (5,306 | 63.0%), Hispanic or Latino (5,270 | 62.6%), and Two or more Races (1,235 | 14.7%).
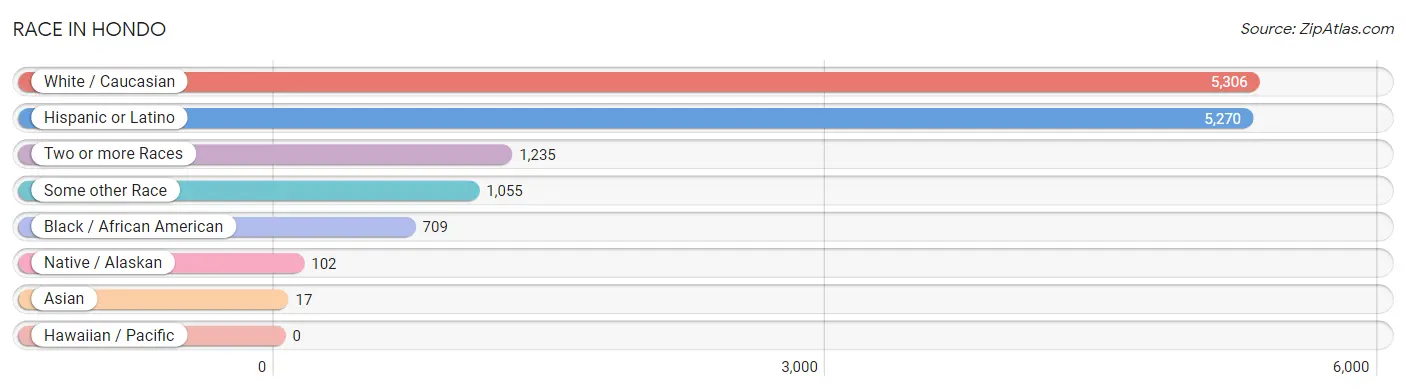
| Race | # Population | % Population |
| Asian | 17 | 0.2% |
| Black / African American | 709 | 8.4% |
| Hawaiian / Pacific | 0 | 0.0% |
| Hispanic or Latino | 5,270 | 62.6% |
| Native / Alaskan | 102 | 1.2% |
| White / Caucasian | 5,306 | 63.0% |
| Two or more Races | 1,235 | 14.7% |
| Some other Race | 1,055 | 12.5% |
| Total | 8,424 | 100.0% |
Ancestry in Hondo
The most populous ancestries reported in Hondo are Mexican (3,936 | 46.7%), English (470 | 5.6%), German (405 | 4.8%), Irish (282 | 3.4%), and French (227 | 2.7%), together accounting for 63.2% of all Hondo residents.
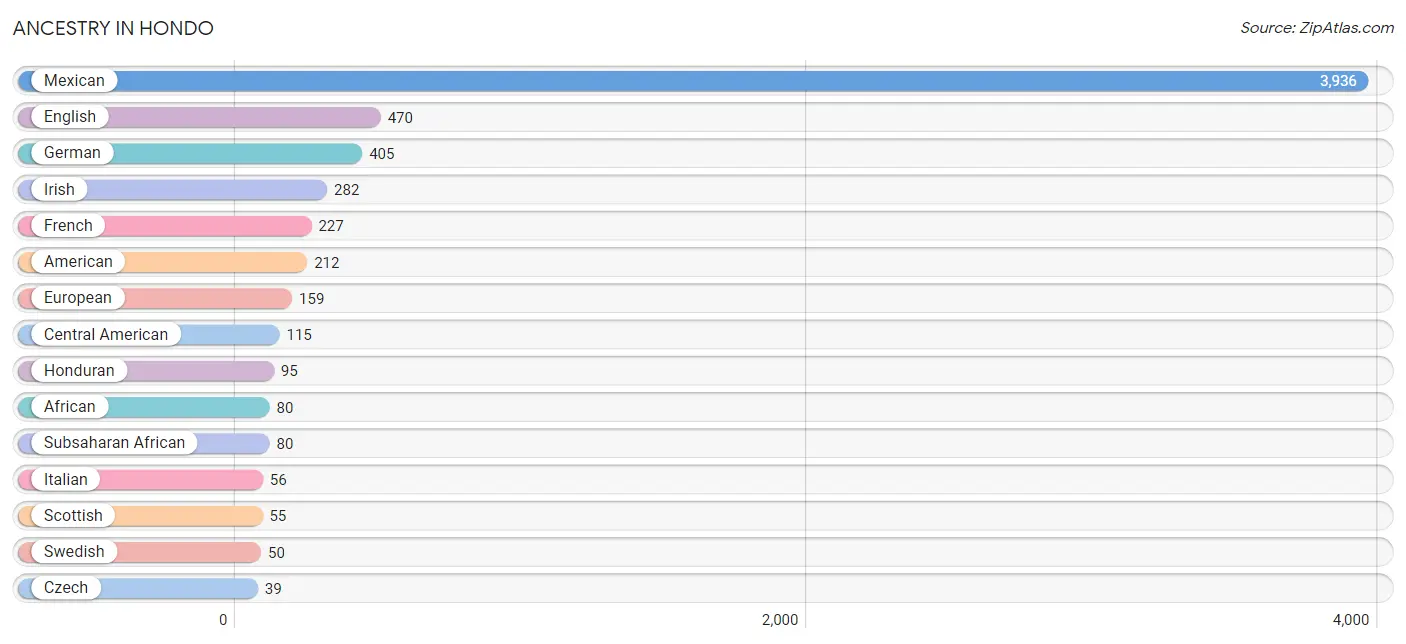
| Ancestry | # Population | % Population |
| African | 80 | 0.9% |
| American | 212 | 2.5% |
| British | 20 | 0.2% |
| Burmese | 7 | 0.1% |
| Central American | 115 | 1.4% |
| Cherokee | 10 | 0.1% |
| Czech | 39 | 0.5% |
| Dutch | 7 | 0.1% |
| English | 470 | 5.6% |
| European | 159 | 1.9% |
| French | 227 | 2.7% |
| French Canadian | 8 | 0.1% |
| German | 405 | 4.8% |
| Haitian | 20 | 0.2% |
| Honduran | 95 | 1.1% |
| Indonesian | 5 | 0.1% |
| Iranian | 3 | 0.0% |
| Irish | 282 | 3.4% |
| Italian | 56 | 0.7% |
| Kiowa | 8 | 0.1% |
| Mexican | 3,936 | 46.7% |
| Nicaraguan | 5 | 0.1% |
| Northern European | 12 | 0.1% |
| Polish | 13 | 0.2% |
| Puerto Rican | 36 | 0.4% |
| Salvadoran | 15 | 0.2% |
| Scandinavian | 13 | 0.2% |
| Scotch-Irish | 22 | 0.3% |
| Scottish | 55 | 0.6% |
| Spanish | 4 | 0.1% |
| Sri Lankan | 5 | 0.1% |
| Subsaharan African | 80 | 0.9% |
| Swedish | 50 | 0.6% |
| Ukrainian | 23 | 0.3% |
| Welsh | 10 | 0.1% | View All 35 Rows |
Immigrants in Hondo
The most numerous immigrant groups reported in Hondo came from Central America (373 | 4.4%), Latin America (373 | 4.4%), Mexico (279 | 3.3%), Honduras (70 | 0.8%), and Guatemala (24 | 0.3%), together accounting for 13.3% of all Hondo residents.
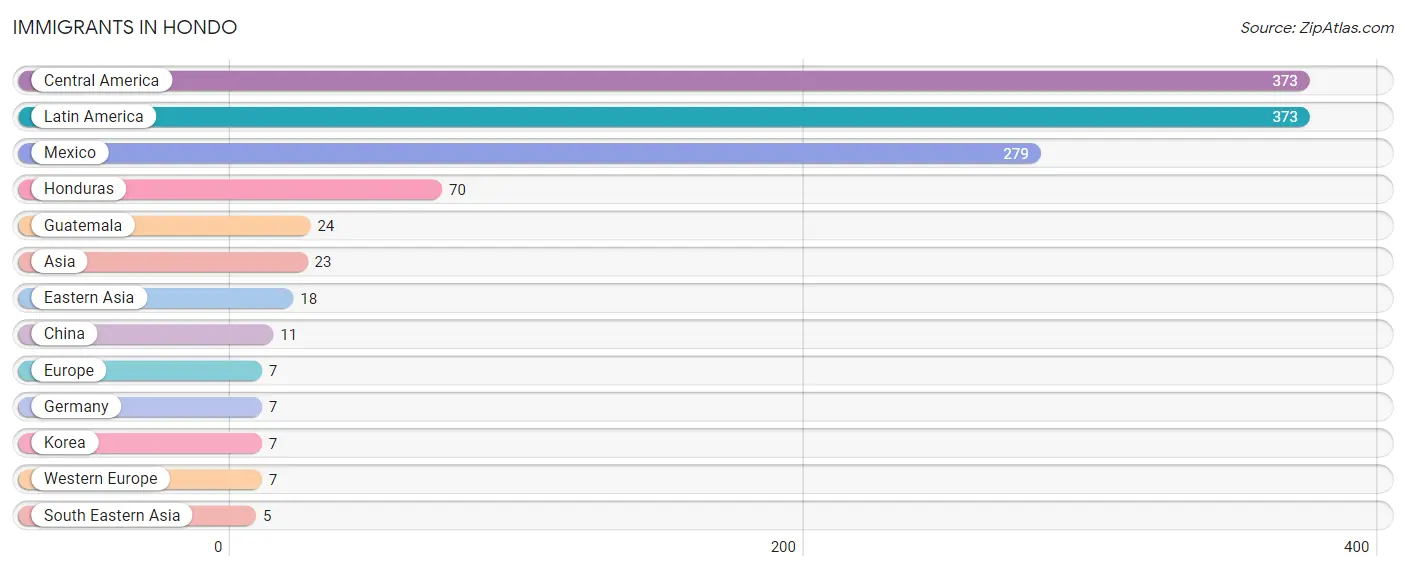
| Immigration Origin | # Population | % Population |
| Asia | 23 | 0.3% |
| Central America | 373 | 4.4% |
| China | 11 | 0.1% |
| Eastern Asia | 18 | 0.2% |
| Europe | 7 | 0.1% |
| Germany | 7 | 0.1% |
| Guatemala | 24 | 0.3% |
| Honduras | 70 | 0.8% |
| Korea | 7 | 0.1% |
| Latin America | 373 | 4.4% |
| Mexico | 279 | 3.3% |
| South Eastern Asia | 5 | 0.1% |
| Western Europe | 7 | 0.1% | View All 13 Rows |
Sex and Age in Hondo
Sex and Age in Hondo
The most populous age groups in Hondo are 25 to 29 Years (809 | 15.9%) for men and 25 to 29 Years (416 | 12.5%) for women.
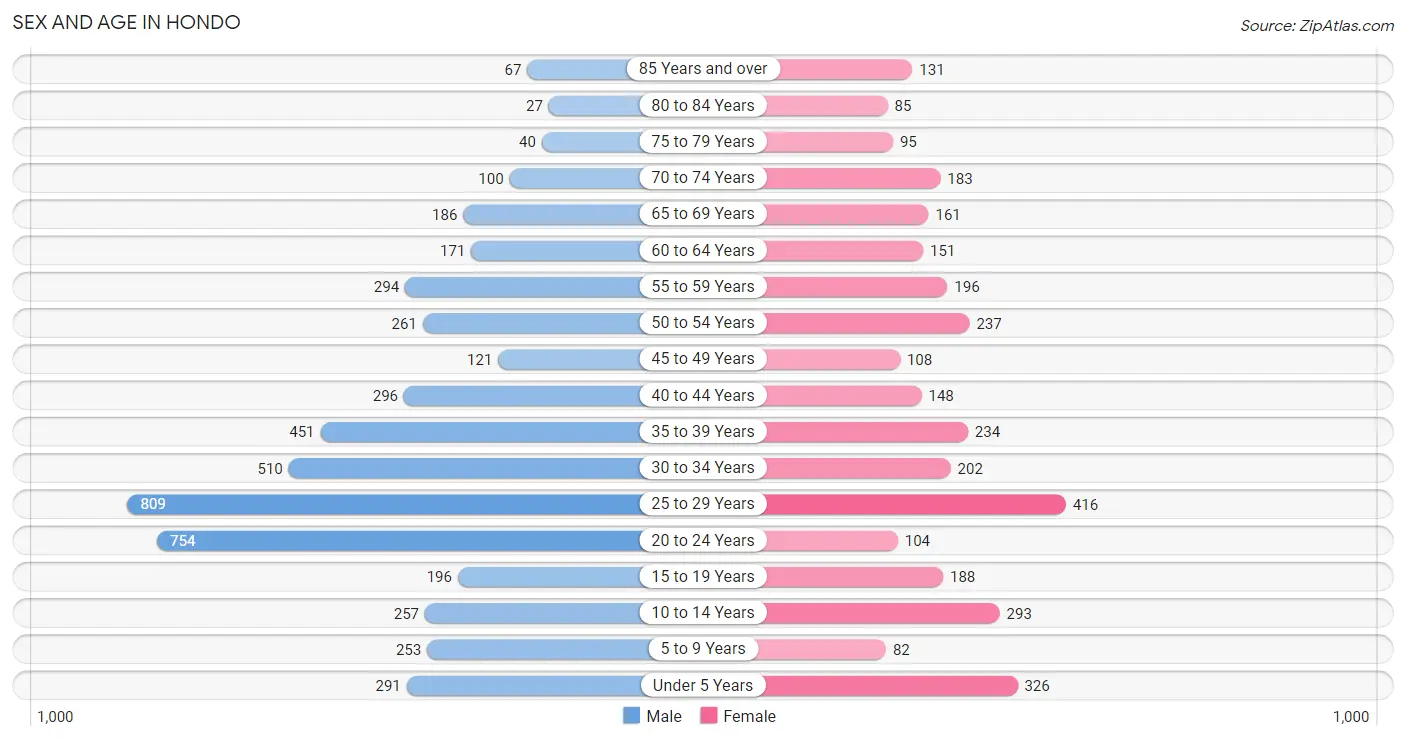
| Age Bracket | Male | Female |
| Under 5 Years | 291 (5.7%) | 326 (9.8%) |
| 5 to 9 Years | 253 (5.0%) | 82 (2.5%) |
| 10 to 14 Years | 257 (5.1%) | 293 (8.8%) |
| 15 to 19 Years | 196 (3.9%) | 188 (5.6%) |
| 20 to 24 Years | 754 (14.8%) | 104 (3.1%) |
| 25 to 29 Years | 809 (15.9%) | 416 (12.5%) |
| 30 to 34 Years | 510 (10.0%) | 202 (6.0%) |
| 35 to 39 Years | 451 (8.9%) | 234 (7.0%) |
| 40 to 44 Years | 296 (5.8%) | 148 (4.4%) |
| 45 to 49 Years | 121 (2.4%) | 108 (3.2%) |
| 50 to 54 Years | 261 (5.1%) | 237 (7.1%) |
| 55 to 59 Years | 294 (5.8%) | 196 (5.9%) |
| 60 to 64 Years | 171 (3.4%) | 151 (4.5%) |
| 65 to 69 Years | 186 (3.7%) | 161 (4.8%) |
| 70 to 74 Years | 100 (2.0%) | 183 (5.5%) |
| 75 to 79 Years | 40 (0.8%) | 95 (2.8%) |
| 80 to 84 Years | 27 (0.5%) | 85 (2.5%) |
| 85 Years and over | 67 (1.3%) | 131 (3.9%) |
| Total | 5,084 (100.0%) | 3,340 (100.0%) |
Families and Households in Hondo
Median Family Size in Hondo
The median family size in Hondo is 3.12 persons per family, with single male/father families (146 | 8.8%) accounting for the largest median family size of 3.45 persons per family. On the other hand, single female/mother families (423 | 25.5%) represent the smallest median family size with 2.70 persons per family.
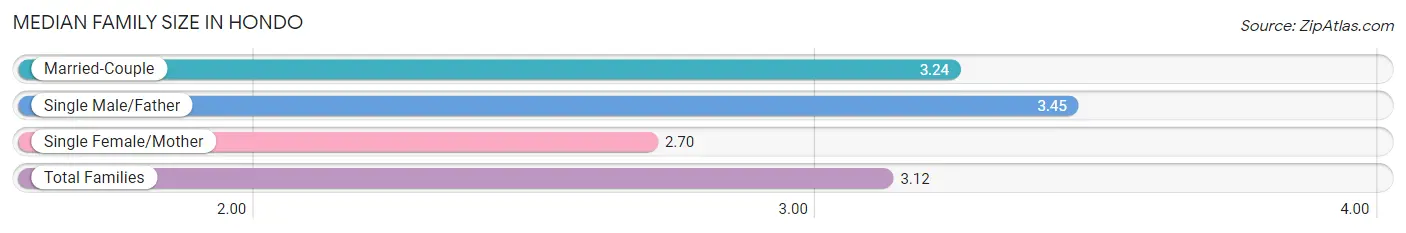
| Family Type | # Families | Family Size |
| Married-Couple | 1,093 (65.8%) | 3.24 |
| Single Male/Father | 146 (8.8%) | 3.45 |
| Single Female/Mother | 423 (25.5%) | 2.70 |
| Total Families | 1,662 (100.0%) | 3.12 |
Median Household Size in Hondo
The median household size in Hondo is 2.53 persons per household, with single male/father households (146 | 5.8%) accounting for the largest median household size of 3.58 persons per household. non-family households (879 | 34.6%) represent the smallest median household size with 1.23 persons per household.
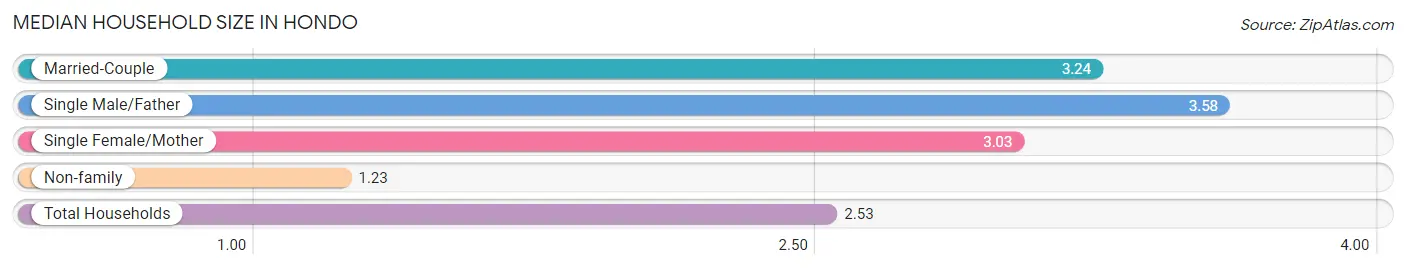
| Household Type | # Households | Household Size |
| Married-Couple | 1,093 (43.0%) | 3.24 |
| Single Male/Father | 146 (5.8%) | 3.58 |
| Single Female/Mother | 423 (16.7%) | 3.03 |
| Non-family | 879 (34.6%) | 1.23 |
| Total Households | 2,541 (100.0%) | 2.53 |
Household Size by Marriage Status in Hondo
Out of a total of 2,541 households in Hondo, 1,662 (65.4%) are family households, while 879 (34.6%) are nonfamily households. The most numerous type of family households are 2-person households, comprising 721, and the most common type of nonfamily households are 1-person households, comprising 682.
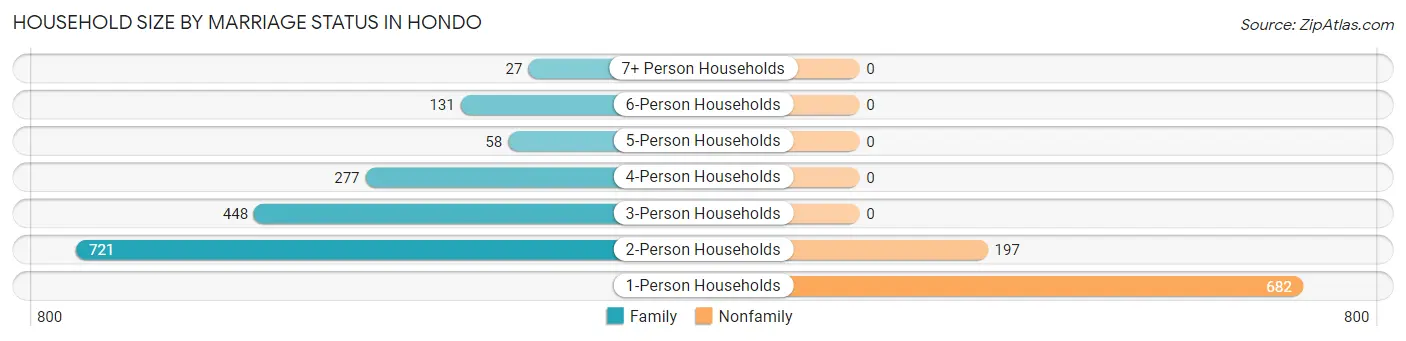
| Household Size | Family Households | Nonfamily Households |
| 1-Person Households | - | 682 (26.8%) |
| 2-Person Households | 721 (28.4%) | 197 (7.7%) |
| 3-Person Households | 448 (17.6%) | 0 (0.0%) |
| 4-Person Households | 277 (10.9%) | 0 (0.0%) |
| 5-Person Households | 58 (2.3%) | 0 (0.0%) |
| 6-Person Households | 131 (5.2%) | 0 (0.0%) |
| 7+ Person Households | 27 (1.1%) | 0 (0.0%) |
| Total | 1,662 (65.4%) | 879 (34.6%) |
Female Fertility in Hondo
Fertility by Age in Hondo
Average fertility rate in Hondo is 58.0 births per 1,000 women. Women in the age bracket of 20 to 34 years have the highest fertility rate with 118.0 births per 1,000 women. Women in the age bracket of 20 to 34 years acount for 100.0% of all women with births.
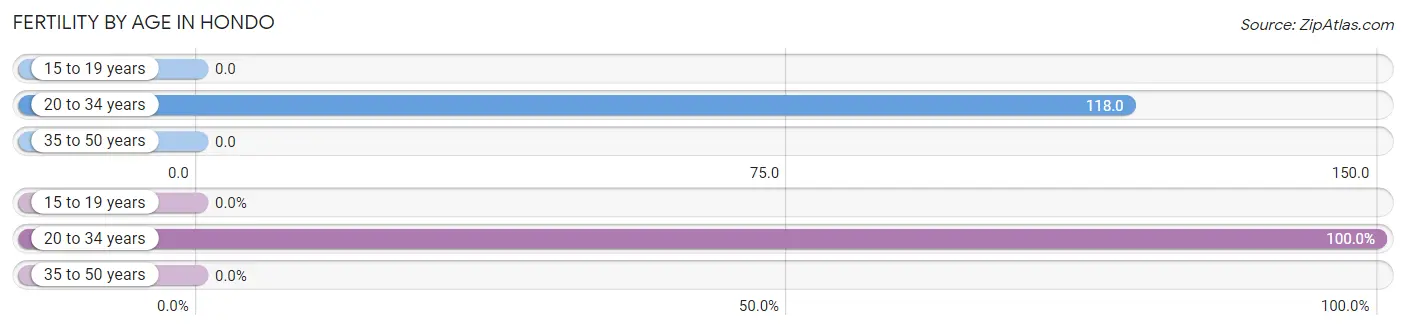
| Age Bracket | Women with Births | Births / 1,000 Women |
| 15 to 19 years | 0 (0.0%) | 0.0 |
| 20 to 34 years | 85 (100.0%) | 118.0 |
| 35 to 50 years | 0 (0.0%) | 0.0 |
| Total | 85 (100.0%) | 58.0 |
Fertility by Age by Marriage Status in Hondo
31.8% of women with births (85) in Hondo are married. The highest percentage of unmarried women with births falls into 20 to 34 years age bracket with 68.2% of them unmarried at the time of birth, while the lowest percentage of unmarried women with births belong to 20 to 34 years age bracket with 68.2% of them unmarried.
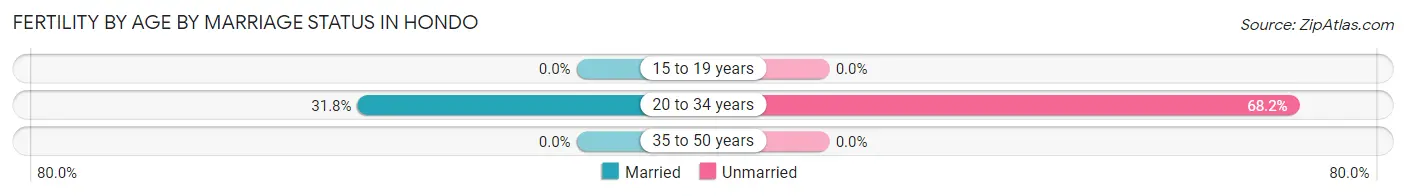
| Age Bracket | Married | Unmarried |
| 15 to 19 years | 0 (0.0%) | 0 (0.0%) |
| 20 to 34 years | 27 (31.8%) | 58 (68.2%) |
| 35 to 50 years | 0 (0.0%) | 0 (0.0%) |
| Total | 27 (31.8%) | 58 (68.2%) |
Fertility by Education in Hondo
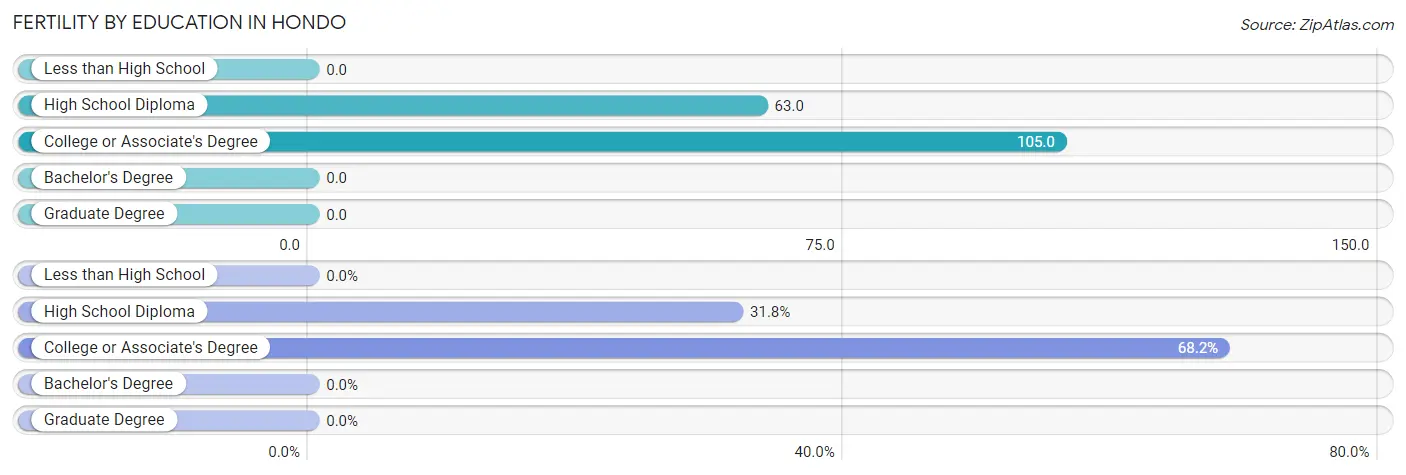
| Educational Attainment | Women with Births | Births / 1,000 Women |
| Less than High School | 0 (0.0%) | 0.0 |
| High School Diploma | 27 (31.8%) | 63.0 |
| College or Associate's Degree | 58 (68.2%) | 105.0 |
| Bachelor's Degree | 0 (0.0%) | 0.0 |
| Graduate Degree | 0 (0.0%) | 0.0 |
| Total | 85 (100.0%) | 58.0 |
Fertility by Education by Marriage Status in Hondo
68.2% of women with births in Hondo are unmarried. Women with the educational attainment of high school diploma are most likely to be married with 100.0% of them married at childbirth, while women with the educational attainment of college or associate's degree are least likely to be married with 100.0% of them unmarried at childbirth.
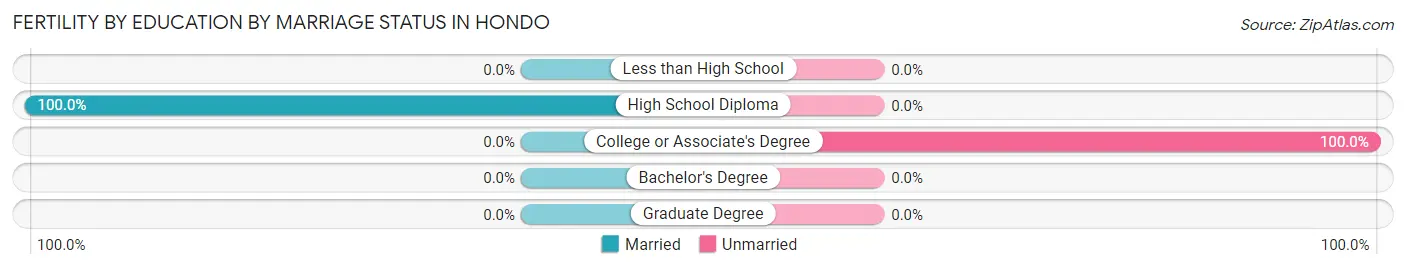
| Educational Attainment | Married | Unmarried |
| Less than High School | 0 (0.0%) | 0 (0.0%) |
| High School Diploma | 27 (100.0%) | 0 (0.0%) |
| College or Associate's Degree | 0 (0.0%) | 58 (100.0%) |
| Bachelor's Degree | 0 (0.0%) | 0 (0.0%) |
| Graduate Degree | 0 (0.0%) | 0 (0.0%) |
| Total | 27 (31.8%) | 58 (68.2%) |
Employment Characteristics in Hondo
Employment by Class of Employer in Hondo
Among the 2,888 employed individuals in Hondo, private company employees (1,278 | 44.3%), local government employees (759 | 26.3%), and self-employed (not incorporated) (295 | 10.2%) make up the most common classes of employment.
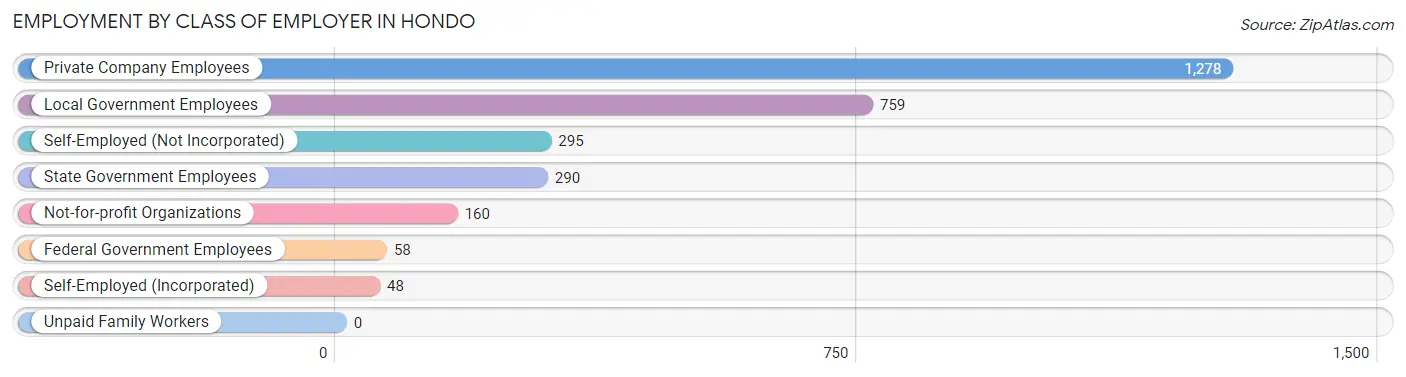
| Employer Class | # Employees | % Employees |
| Private Company Employees | 1,278 | 44.3% |
| Self-Employed (Incorporated) | 48 | 1.7% |
| Self-Employed (Not Incorporated) | 295 | 10.2% |
| Not-for-profit Organizations | 160 | 5.5% |
| Local Government Employees | 759 | 26.3% |
| State Government Employees | 290 | 10.0% |
| Federal Government Employees | 58 | 2.0% |
| Unpaid Family Workers | 0 | 0.0% |
| Total | 2,888 | 100.0% |
Employment Status by Age in Hondo
According to the labor force statistics for Hondo, out of the total population over 16 years of age (6,849), 44.6% or 3,055 individuals are in the labor force, with 2.9% or 89 of them unemployed. The age group with the highest labor force participation rate is 55 to 59 years, with 63.7% or 312 individuals in the labor force. Within the labor force, the 25 to 29 years age range has the highest percentage of unemployed individuals, with 9.4% or 59 of them being unemployed.
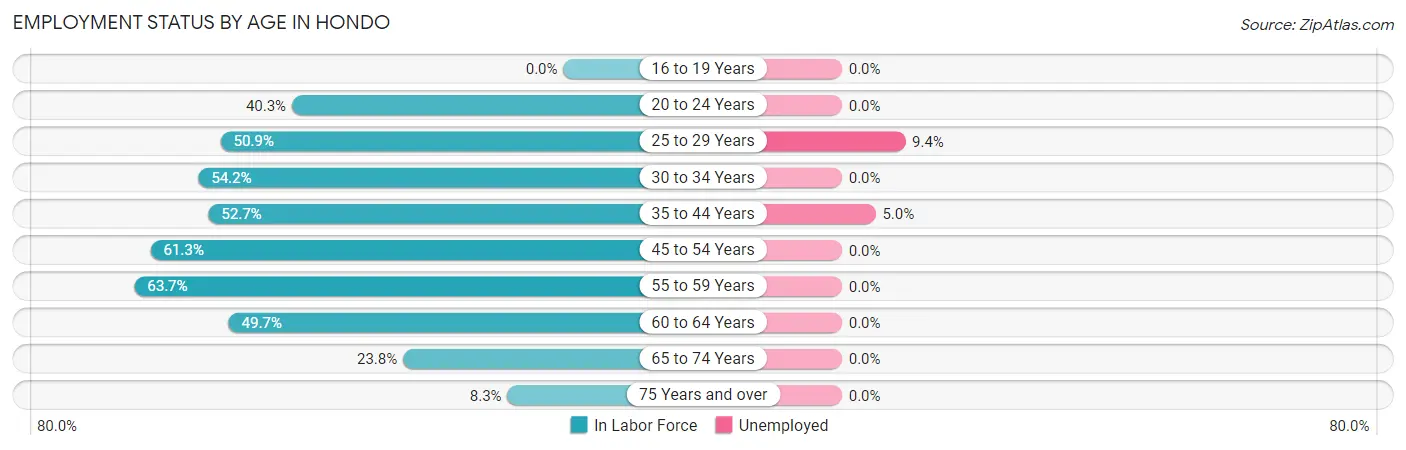
| Age Bracket | In Labor Force | Unemployed |
| 16 to 19 Years | 0 (0.0%) | 0 (0.0%) |
| 20 to 24 Years | 346 (40.3%) | 0 (0.0%) |
| 25 to 29 Years | 624 (50.9%) | 59 (9.4%) |
| 30 to 34 Years | 386 (54.2%) | 0 (0.0%) |
| 35 to 44 Years | 595 (52.7%) | 30 (5.0%) |
| 45 to 54 Years | 446 (61.3%) | 0 (0.0%) |
| 55 to 59 Years | 312 (63.7%) | 0 (0.0%) |
| 60 to 64 Years | 160 (49.7%) | 0 (0.0%) |
| 65 to 74 Years | 150 (23.8%) | 0 (0.0%) |
| 75 Years and over | 37 (8.3%) | 0 (0.0%) |
| Total | 3,055 (44.6%) | 89 (2.9%) |
Employment Status by Educational Attainment in Hondo
According to labor force statistics for Hondo, 54.8% of individuals (2,524) out of the total population between 25 and 64 years of age (4,605) are in the labor force, with 3.5% or 88 of them being unemployed. The group with the highest labor force participation rate are those with the educational attainment of bachelor's degree or higher, with 81.8% or 383 individuals in the labor force. Within the labor force, individuals with high school diploma education have the highest percentage of unemployment, with 7.5% or 88 of them being unemployed.
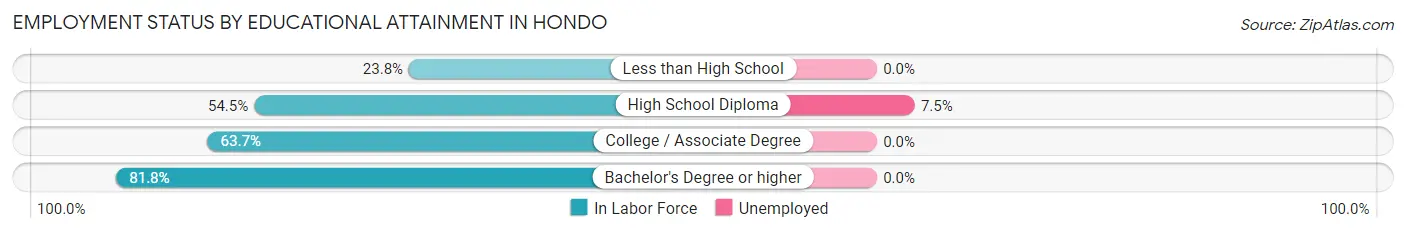
| Educational Attainment | In Labor Force | Unemployed |
| Less than High School | 179 (23.8%) | 0 (0.0%) |
| High School Diploma | 1,170 (54.5%) | 161 (7.5%) |
| College / Associate Degree | 789 (63.7%) | 0 (0.0%) |
| Bachelor's Degree or higher | 383 (81.8%) | 0 (0.0%) |
| Total | 2,524 (54.8%) | 161 (3.5%) |
Employment Occupations by Sex in Hondo
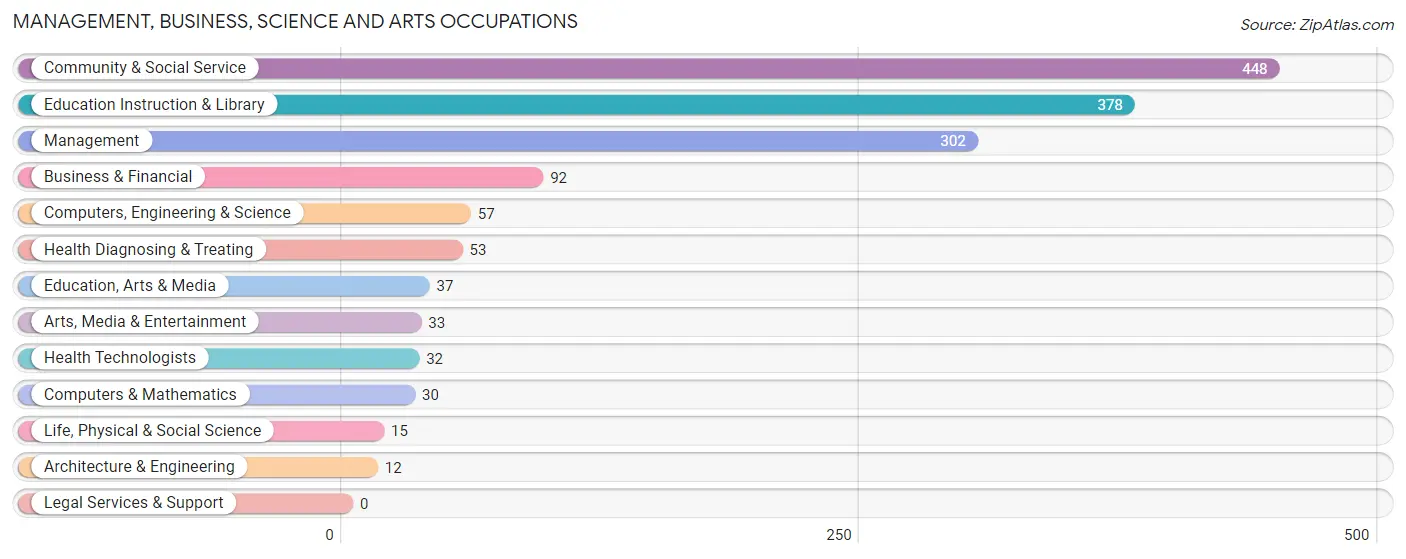
Management, Business, Science and Arts Occupations
The most common Management, Business, Science and Arts occupations in Hondo are Community & Social Service (448 | 15.1%), Education Instruction & Library (378 | 12.8%), Management (302 | 10.2%), Business & Financial (92 | 3.1%), and Computers, Engineering & Science (57 | 1.9%).
Management, Business, Science and Arts Occupations by Sex
Within the Management, Business, Science and Arts occupations in Hondo, the most male-oriented occupations are Computers, Engineering & Science (100.0%), Computers & Mathematics (100.0%), and Architecture & Engineering (100.0%), while the most female-oriented occupations are Health Diagnosing & Treating (100.0%), Health Technologists (100.0%), and Business & Financial (77.2%).
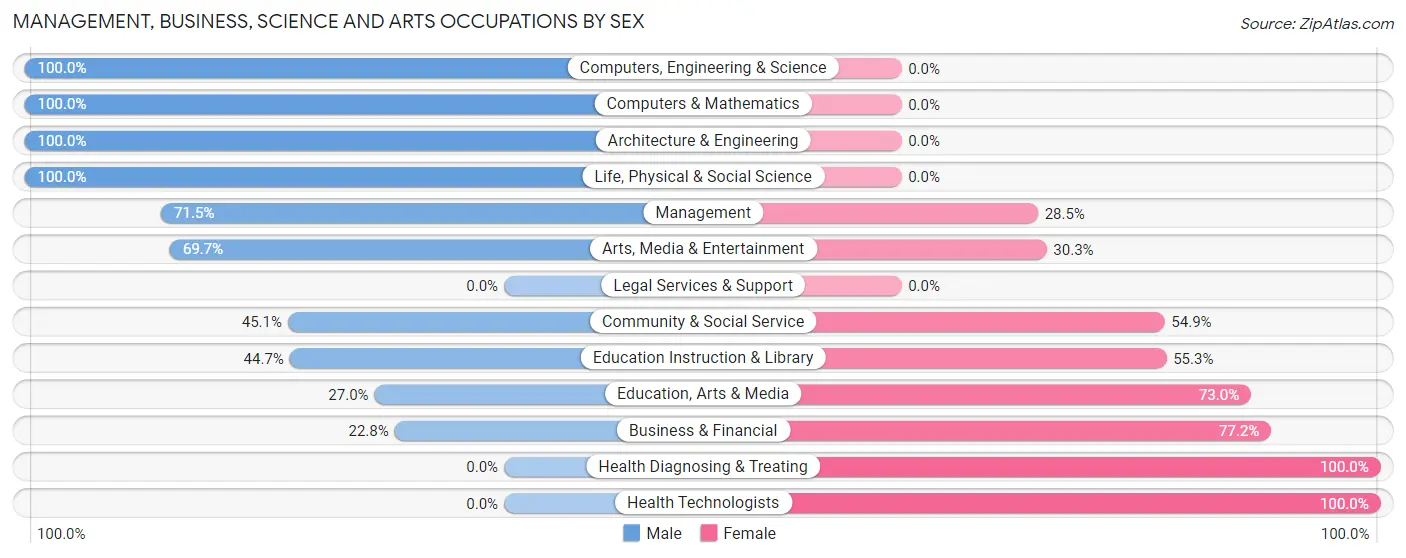
| Occupation | Male | Female |
| Management | 216 (71.5%) | 86 (28.5%) |
| Business & Financial | 21 (22.8%) | 71 (77.2%) |
| Computers, Engineering & Science | 57 (100.0%) | 0 (0.0%) |
| Computers & Mathematics | 30 (100.0%) | 0 (0.0%) |
| Architecture & Engineering | 12 (100.0%) | 0 (0.0%) |
| Life, Physical & Social Science | 15 (100.0%) | 0 (0.0%) |
| Community & Social Service | 202 (45.1%) | 246 (54.9%) |
| Education, Arts & Media | 10 (27.0%) | 27 (73.0%) |
| Legal Services & Support | 0 (0.0%) | 0 (0.0%) |
| Education Instruction & Library | 169 (44.7%) | 209 (55.3%) |
| Arts, Media & Entertainment | 23 (69.7%) | 10 (30.3%) |
| Health Diagnosing & Treating | 0 (0.0%) | 53 (100.0%) |
| Health Technologists | 0 (0.0%) | 32 (100.0%) |
| Total (Category) | 496 (52.1%) | 456 (47.9%) |
| Total (Overall) | 1,460 (49.4%) | 1,498 (50.6%) |
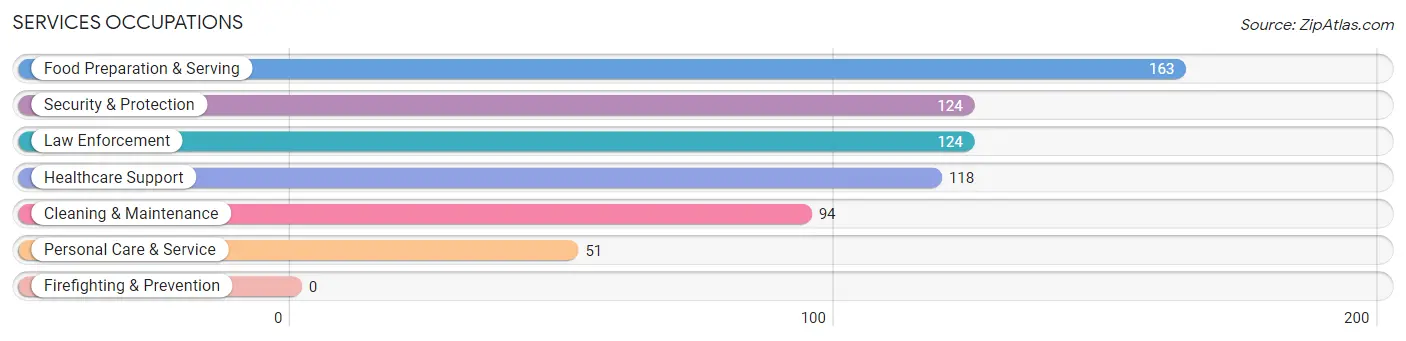
Services Occupations
The most common Services occupations in Hondo are Food Preparation & Serving (163 | 5.5%), Security & Protection (124 | 4.2%), Law Enforcement (124 | 4.2%), Healthcare Support (118 | 4.0%), and Cleaning & Maintenance (94 | 3.2%).
Services Occupations by Sex
Within the Services occupations in Hondo, the most male-oriented occupations are Security & Protection (87.1%), Law Enforcement (87.1%), and Cleaning & Maintenance (69.2%), while the most female-oriented occupations are Healthcare Support (100.0%), Food Preparation & Serving (100.0%), and Personal Care & Service (31.4%).
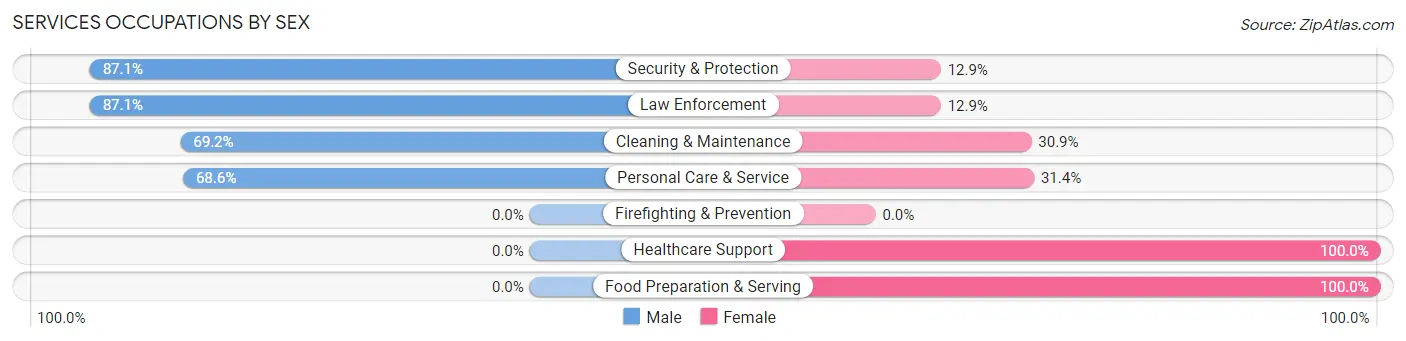
| Occupation | Male | Female |
| Healthcare Support | 0 (0.0%) | 118 (100.0%) |
| Security & Protection | 108 (87.1%) | 16 (12.9%) |
| Firefighting & Prevention | 0 (0.0%) | 0 (0.0%) |
| Law Enforcement | 108 (87.1%) | 16 (12.9%) |
| Food Preparation & Serving | 0 (0.0%) | 163 (100.0%) |
| Cleaning & Maintenance | 65 (69.2%) | 29 (30.8%) |
| Personal Care & Service | 35 (68.6%) | 16 (31.4%) |
| Total (Category) | 208 (37.8%) | 342 (62.2%) |
| Total (Overall) | 1,460 (49.4%) | 1,498 (50.6%) |
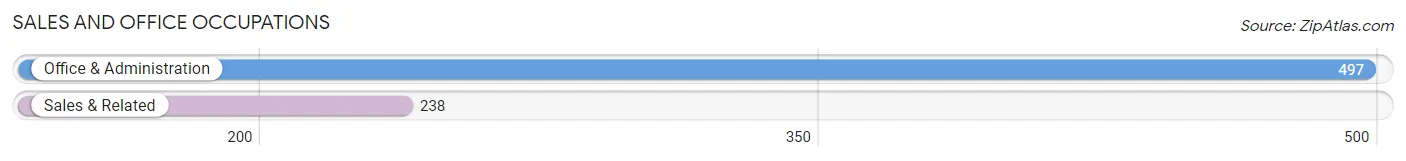
Sales and Office Occupations
The most common Sales and Office occupations in Hondo are Office & Administration (497 | 16.8%), and Sales & Related (238 | 8.1%).
Sales and Office Occupations by Sex
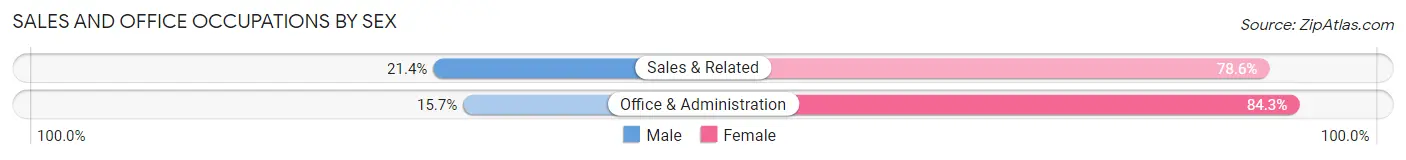
| Occupation | Male | Female |
| Sales & Related | 51 (21.4%) | 187 (78.6%) |
| Office & Administration | 78 (15.7%) | 419 (84.3%) |
| Total (Category) | 129 (17.5%) | 606 (82.5%) |
| Total (Overall) | 1,460 (49.4%) | 1,498 (50.6%) |
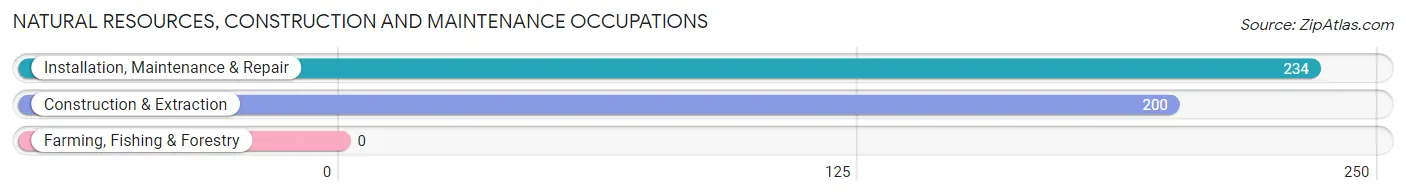
Natural Resources, Construction and Maintenance Occupations
The most common Natural Resources, Construction and Maintenance occupations in Hondo are Installation, Maintenance & Repair (234 | 7.9%), and Construction & Extraction (200 | 6.8%).
Natural Resources, Construction and Maintenance Occupations by Sex
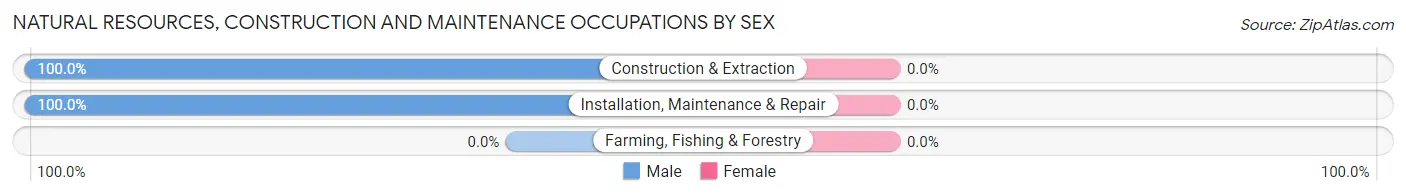
| Occupation | Male | Female |
| Farming, Fishing & Forestry | 0 (0.0%) | 0 (0.0%) |
| Construction & Extraction | 200 (100.0%) | 0 (0.0%) |
| Installation, Maintenance & Repair | 234 (100.0%) | 0 (0.0%) |
| Total (Category) | 434 (100.0%) | 0 (0.0%) |
| Total (Overall) | 1,460 (49.4%) | 1,498 (50.6%) |
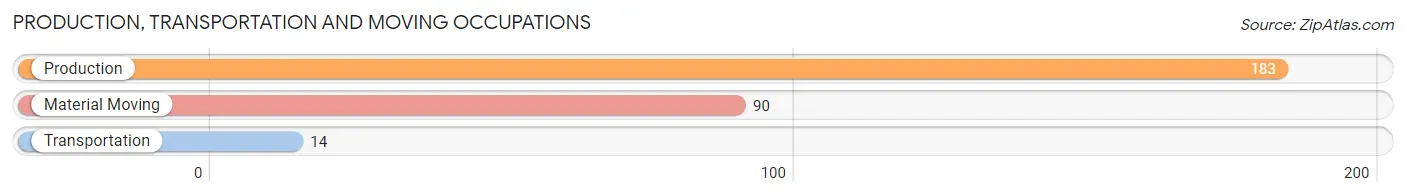
Production, Transportation and Moving Occupations
The most common Production, Transportation and Moving occupations in Hondo are Production (183 | 6.2%), Material Moving (90 | 3.0%), and Transportation (14 | 0.5%).
Production, Transportation and Moving Occupations by Sex
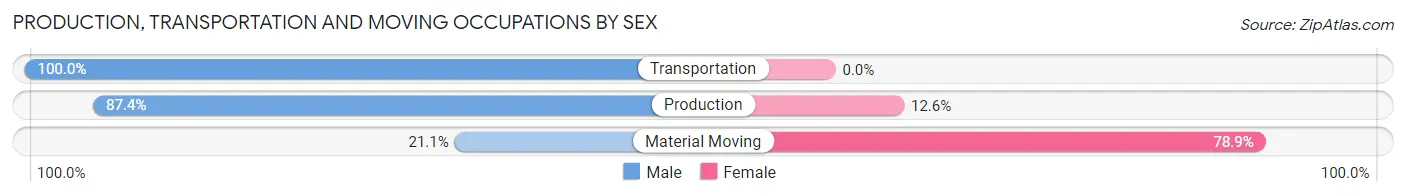
| Occupation | Male | Female |
| Production | 160 (87.4%) | 23 (12.6%) |
| Transportation | 14 (100.0%) | 0 (0.0%) |
| Material Moving | 19 (21.1%) | 71 (78.9%) |
| Total (Category) | 193 (67.2%) | 94 (32.8%) |
| Total (Overall) | 1,460 (49.4%) | 1,498 (50.6%) |
Employment Industries by Sex in Hondo
Employment Industries in Hondo
The major employment industries in Hondo include Educational Services (475 | 16.1%), Construction (465 | 15.7%), Health Care & Social Assistance (454 | 15.3%), Public Administration (454 | 15.3%), and Utilities (186 | 6.3%).
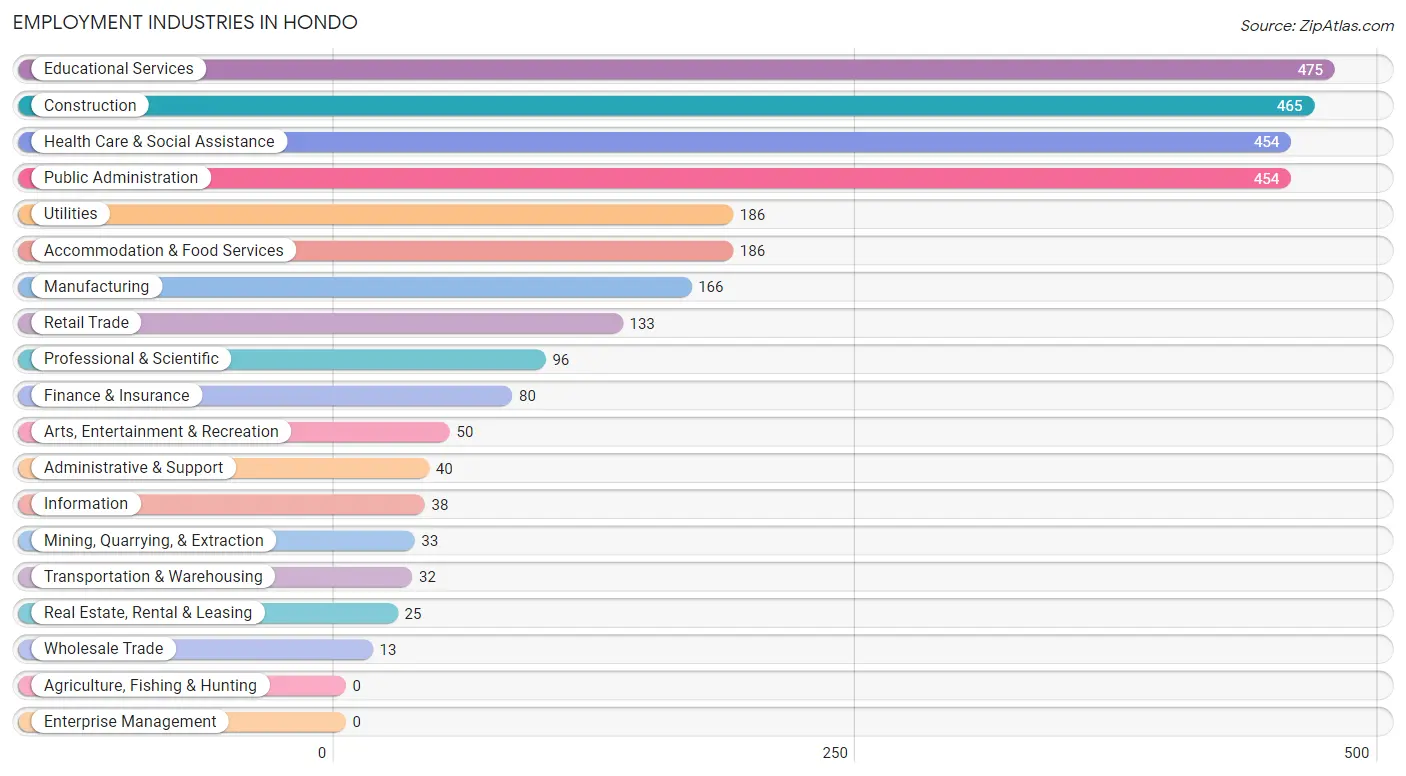
Employment Industries by Sex in Hondo
The Hondo industries that see more men than women are Mining, Quarrying, & Extraction (100.0%), Wholesale Trade (100.0%), and Information (100.0%), whereas the industries that tend to have a higher number of women are Accommodation & Food Services (89.8%), Health Care & Social Assistance (78.6%), and Finance & Insurance (76.2%).
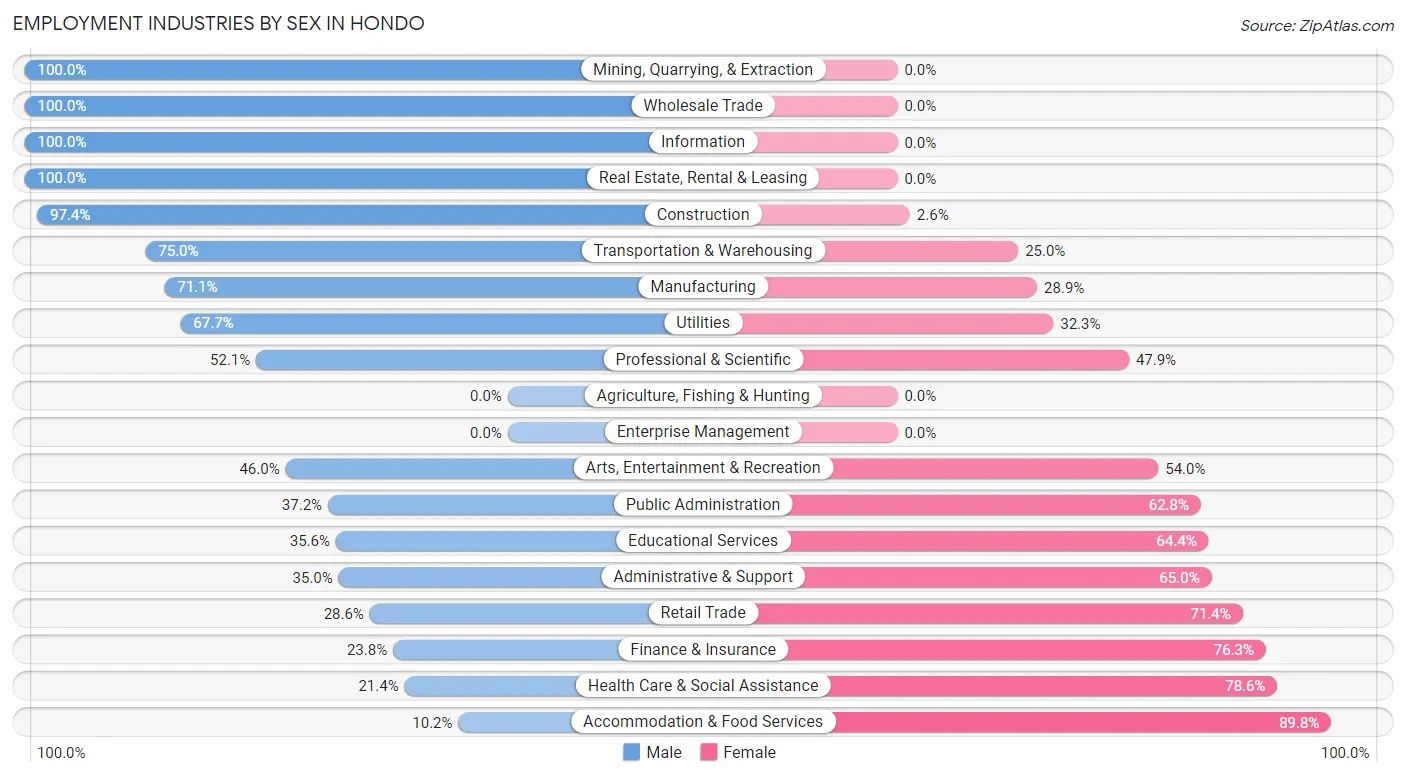
| Industry | Male | Female |
| Agriculture, Fishing & Hunting | 0 (0.0%) | 0 (0.0%) |
| Mining, Quarrying, & Extraction | 33 (100.0%) | 0 (0.0%) |
| Construction | 453 (97.4%) | 12 (2.6%) |
| Manufacturing | 118 (71.1%) | 48 (28.9%) |
| Wholesale Trade | 13 (100.0%) | 0 (0.0%) |
| Retail Trade | 38 (28.6%) | 95 (71.4%) |
| Transportation & Warehousing | 24 (75.0%) | 8 (25.0%) |
| Utilities | 126 (67.7%) | 60 (32.3%) |
| Information | 38 (100.0%) | 0 (0.0%) |
| Finance & Insurance | 19 (23.7%) | 61 (76.2%) |
| Real Estate, Rental & Leasing | 25 (100.0%) | 0 (0.0%) |
| Professional & Scientific | 50 (52.1%) | 46 (47.9%) |
| Enterprise Management | 0 (0.0%) | 0 (0.0%) |
| Administrative & Support | 14 (35.0%) | 26 (65.0%) |
| Educational Services | 169 (35.6%) | 306 (64.4%) |
| Health Care & Social Assistance | 97 (21.4%) | 357 (78.6%) |
| Arts, Entertainment & Recreation | 23 (46.0%) | 27 (54.0%) |
| Accommodation & Food Services | 19 (10.2%) | 167 (89.8%) |
| Public Administration | 169 (37.2%) | 285 (62.8%) |
| Total | 1,460 (49.4%) | 1,498 (50.6%) |
Education in Hondo
School Enrollment in Hondo
The most common levels of schooling among the 1,841 students in Hondo are high school (613 | 33.3%), middle school (460 | 25.0%), and elementary school (315 | 17.1%).
| School Level | # Students | % Students |
| Nursery / Preschool | 166 | 9.0% |
| Kindergarten | 16 | 0.9% |
| Elementary School | 315 | 17.1% |
| Middle School | 460 | 25.0% |
| High School | 613 | 33.3% |
| College / Undergraduate | 213 | 11.6% |
| Graduate / Professional | 58 | 3.2% |
| Total | 1,841 | 100.0% |
School Enrollment by Age by Funding Source in Hondo
Out of a total of 1,841 students who are enrolled in schools in Hondo, 153 (8.3%) attend a private institution, while the remaining 1,688 (91.7%) are enrolled in public schools. The age group of 18 to 19 year olds has the highest likelihood of being enrolled in private schools, with 41 (33.1% in the age bracket) enrolled. Conversely, the age group of 15 to 17 year olds has the lowest likelihood of being enrolled in a private school, with 175 (100.0% in the age bracket) attending a public institution.
| Age Bracket | Public School | Private School |
| 3 to 4 Year Olds | 130 (90.9%) | 13 (9.1%) |
| 5 to 9 Year Old | 269 (80.3%) | 66 (19.7%) |
| 10 to 14 Year Olds | 534 (97.1%) | 16 (2.9%) |
| 15 to 17 Year Olds | 175 (100.0%) | 0 (0.0%) |
| 18 to 19 Year Olds | 83 (66.9%) | 41 (33.1%) |
| 20 to 24 Year Olds | 245 (100.0%) | 0 (0.0%) |
| 25 to 34 Year Olds | 147 (96.7%) | 5 (3.3%) |
| 35 Years and over | 105 (89.7%) | 12 (10.3%) |
| Total | 1,688 (91.7%) | 153 (8.3%) |
Educational Attainment by Field of Study in Hondo
Education (170 | 27.1%), business (142 | 22.7%), arts & humanities (62 | 9.9%), literature & languages (42 | 6.7%), and bio, nature & agricultural (37 | 5.9%) are the most common fields of study among 627 individuals in Hondo who have obtained a bachelor's degree or higher.
| Field of Study | # Graduates | % Graduates |
| Computers & Mathematics | 0 | 0.0% |
| Bio, Nature & Agricultural | 37 | 5.9% |
| Physical & Health Sciences | 24 | 3.8% |
| Psychology | 0 | 0.0% |
| Social Sciences | 30 | 4.8% |
| Engineering | 12 | 1.9% |
| Multidisciplinary Studies | 13 | 2.1% |
| Science & Technology | 35 | 5.6% |
| Business | 142 | 22.7% |
| Education | 170 | 27.1% |
| Literature & Languages | 42 | 6.7% |
| Liberal Arts & History | 36 | 5.7% |
| Visual & Performing Arts | 0 | 0.0% |
| Communications | 24 | 3.8% |
| Arts & Humanities | 62 | 9.9% |
| Total | 627 | 100.0% |
Transportation & Commute in Hondo
Vehicle Availability by Sex in Hondo
The most prevalent vehicle ownership categories in Hondo are males with 2 vehicles (618, accounting for 43.2%) and females with 2 vehicles (471, making up 42.4%).
| Vehicles Available | Male | Female |
| No Vehicle | 38 (2.7%) | 41 (2.8%) |
| 1 Vehicle | 315 (22.0%) | 488 (33.5%) |
| 2 Vehicles | 618 (43.2%) | 471 (32.3%) |
| 3 Vehicles | 312 (21.8%) | 359 (24.6%) |
| 4 Vehicles | 148 (10.3%) | 98 (6.7%) |
| 5 or more Vehicles | 0 (0.0%) | 0 (0.0%) |
| Total | 1,431 (100.0%) | 1,457 (100.0%) |
Commute Time in Hondo
The most frequently occuring commute durations in Hondo are 5 to 9 minutes (846 commuters, 30.6%), 60 to 89 minutes (374 commuters, 13.6%), and less than 5 minutes (269 commuters, 9.7%).

| Commute Time | # Commuters | % Commuters |
| Less than 5 Minutes | 269 | 9.7% |
| 5 to 9 Minutes | 846 | 30.6% |
| 10 to 14 Minutes | 192 | 7.0% |
| 15 to 19 Minutes | 234 | 8.5% |
| 20 to 24 Minutes | 162 | 5.9% |
| 25 to 29 Minutes | 177 | 6.4% |
| 30 to 34 Minutes | 44 | 1.6% |
| 35 to 39 Minutes | 38 | 1.4% |
| 40 to 44 Minutes | 221 | 8.0% |
| 45 to 59 Minutes | 175 | 6.3% |
| 60 to 89 Minutes | 374 | 13.6% |
| 90 or more Minutes | 29 | 1.1% |
Commute Time by Sex in Hondo
The most common commute times in Hondo are 60 to 89 minutes (374 commuters, 26.1%) for males and 5 to 9 minutes (639 commuters, 48.0%) for females.
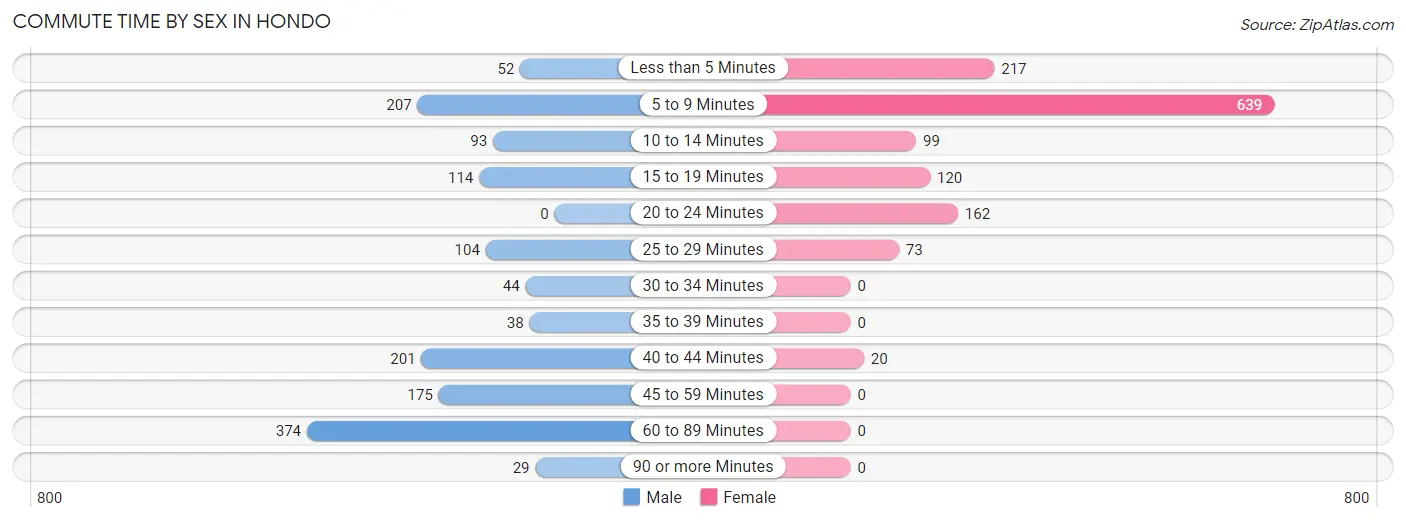
| Commute Time | Male | Female |
| Less than 5 Minutes | 52 (3.6%) | 217 (16.3%) |
| 5 to 9 Minutes | 207 (14.5%) | 639 (48.0%) |
| 10 to 14 Minutes | 93 (6.5%) | 99 (7.4%) |
| 15 to 19 Minutes | 114 (8.0%) | 120 (9.0%) |
| 20 to 24 Minutes | 0 (0.0%) | 162 (12.2%) |
| 25 to 29 Minutes | 104 (7.3%) | 73 (5.5%) |
| 30 to 34 Minutes | 44 (3.1%) | 0 (0.0%) |
| 35 to 39 Minutes | 38 (2.7%) | 0 (0.0%) |
| 40 to 44 Minutes | 201 (14.1%) | 20 (1.5%) |
| 45 to 59 Minutes | 175 (12.2%) | 0 (0.0%) |
| 60 to 89 Minutes | 374 (26.1%) | 0 (0.0%) |
| 90 or more Minutes | 29 (2.0%) | 0 (0.0%) |
Time of Departure to Work by Sex in Hondo
The most frequent times of departure to work in Hondo are 12:00 AM to 4:59 AM (447, 31.2%) for males and 7:30 AM to 7:59 AM (415, 31.2%) for females.
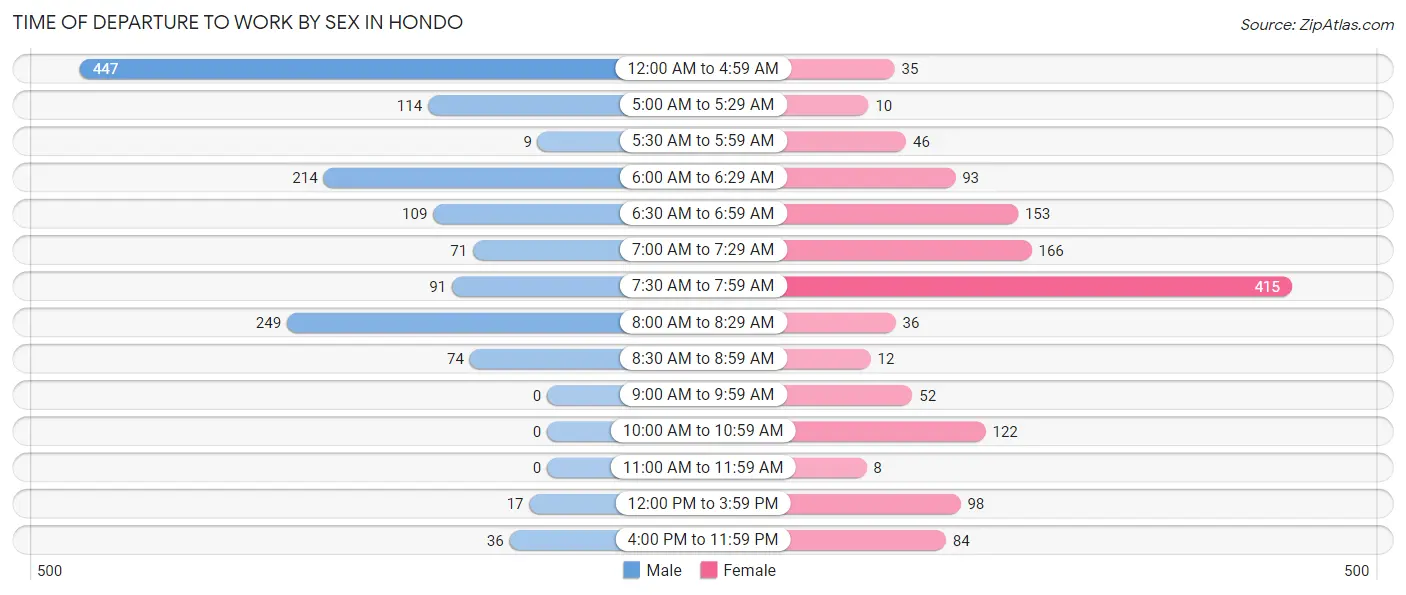
| Time of Departure | Male | Female |
| 12:00 AM to 4:59 AM | 447 (31.2%) | 35 (2.6%) |
| 5:00 AM to 5:29 AM | 114 (8.0%) | 10 (0.7%) |
| 5:30 AM to 5:59 AM | 9 (0.6%) | 46 (3.5%) |
| 6:00 AM to 6:29 AM | 214 (14.9%) | 93 (7.0%) |
| 6:30 AM to 6:59 AM | 109 (7.6%) | 153 (11.5%) |
| 7:00 AM to 7:29 AM | 71 (5.0%) | 166 (12.5%) |
| 7:30 AM to 7:59 AM | 91 (6.4%) | 415 (31.2%) |
| 8:00 AM to 8:29 AM | 249 (17.4%) | 36 (2.7%) |
| 8:30 AM to 8:59 AM | 74 (5.2%) | 12 (0.9%) |
| 9:00 AM to 9:59 AM | 0 (0.0%) | 52 (3.9%) |
| 10:00 AM to 10:59 AM | 0 (0.0%) | 122 (9.2%) |
| 11:00 AM to 11:59 AM | 0 (0.0%) | 8 (0.6%) |
| 12:00 PM to 3:59 PM | 17 (1.2%) | 98 (7.4%) |
| 4:00 PM to 11:59 PM | 36 (2.5%) | 84 (6.3%) |
| Total | 1,431 (100.0%) | 1,330 (100.0%) |
Housing Occupancy in Hondo
Occupancy by Ownership in Hondo
Of the total 2,541 dwellings in Hondo, owner-occupied units account for 1,625 (63.9%), while renter-occupied units make up 916 (36.0%).
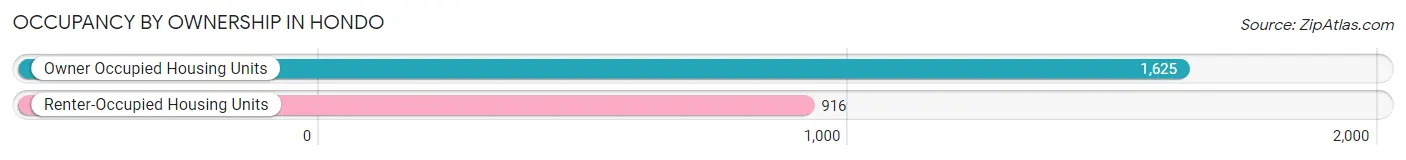
| Occupancy | # Housing Units | % Housing Units |
| Owner Occupied Housing Units | 1,625 | 63.9% |
| Renter-Occupied Housing Units | 916 | 36.0% |
| Total Occupied Housing Units | 2,541 | 100.0% |
Occupancy by Household Size in Hondo
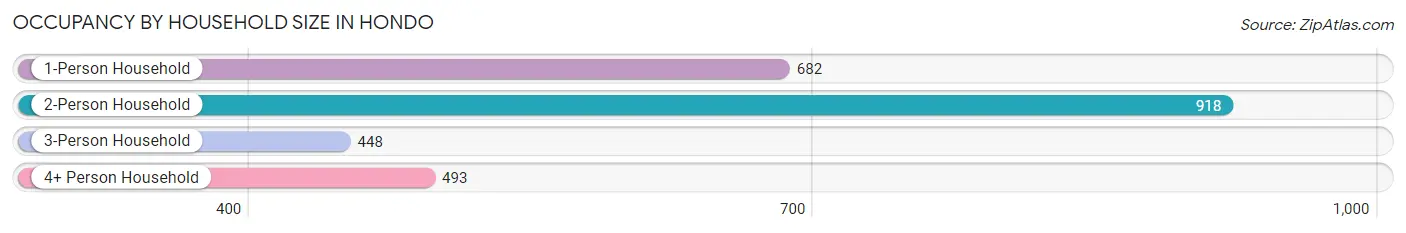
| Household Size | # Housing Units | % Housing Units |
| 1-Person Household | 682 | 26.8% |
| 2-Person Household | 918 | 36.1% |
| 3-Person Household | 448 | 17.6% |
| 4+ Person Household | 493 | 19.4% |
| Total Housing Units | 2,541 | 100.0% |
Occupancy by Ownership by Household Size in Hondo
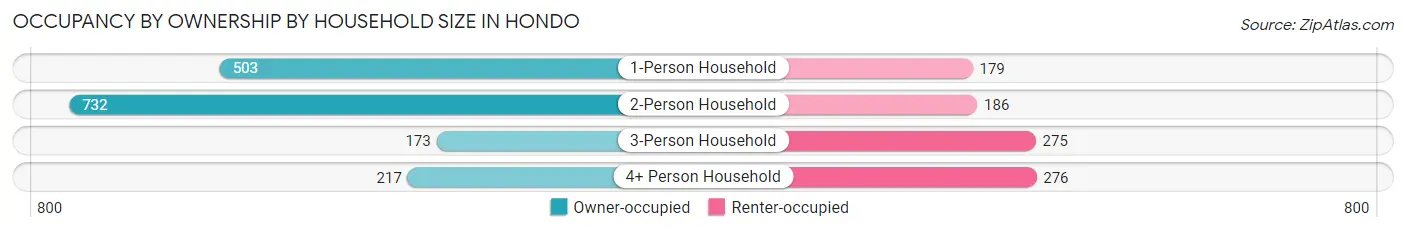
| Household Size | Owner-occupied | Renter-occupied |
| 1-Person Household | 503 (73.8%) | 179 (26.3%) |
| 2-Person Household | 732 (79.7%) | 186 (20.3%) |
| 3-Person Household | 173 (38.6%) | 275 (61.4%) |
| 4+ Person Household | 217 (44.0%) | 276 (56.0%) |
| Total Housing Units | 1,625 (63.9%) | 916 (36.0%) |
Occupancy by Educational Attainment in Hondo
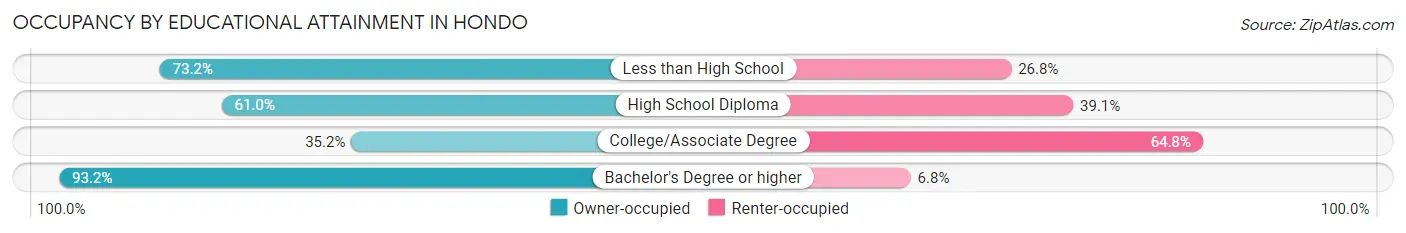
| Household Size | Owner-occupied | Renter-occupied |
| Less than High School | 290 (73.2%) | 106 (26.8%) |
| High School Diploma | 490 (61.0%) | 314 (39.1%) |
| College/Associate Degree | 246 (35.2%) | 452 (64.8%) |
| Bachelor's Degree or higher | 599 (93.2%) | 44 (6.8%) |
Occupancy by Age of Householder in Hondo
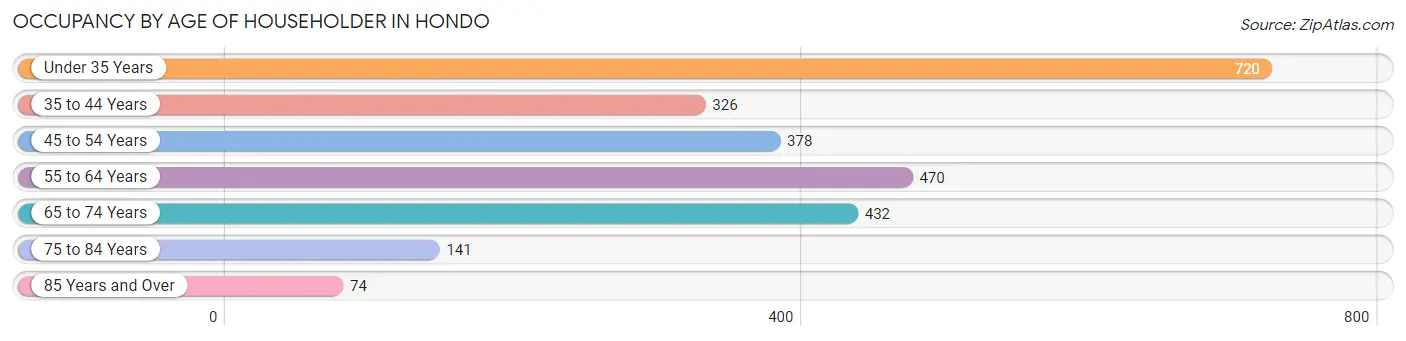
| Age Bracket | # Households | % Households |
| Under 35 Years | 720 | 28.3% |
| 35 to 44 Years | 326 | 12.8% |
| 45 to 54 Years | 378 | 14.9% |
| 55 to 64 Years | 470 | 18.5% |
| 65 to 74 Years | 432 | 17.0% |
| 75 to 84 Years | 141 | 5.6% |
| 85 Years and Over | 74 | 2.9% |
| Total | 2,541 | 100.0% |
Housing Finances in Hondo
Median Income by Occupancy in Hondo
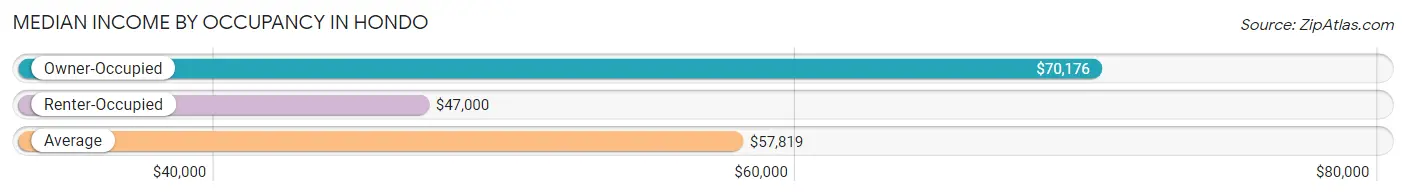
| Occupancy Type | # Households | Median Income |
| Owner-Occupied | 1,625 (63.9%) | $70,176 |
| Renter-Occupied | 916 (36.0%) | $47,000 |
| Average | 2,541 (100.0%) | $57,819 |
Occupancy by Householder Income Bracket in Hondo
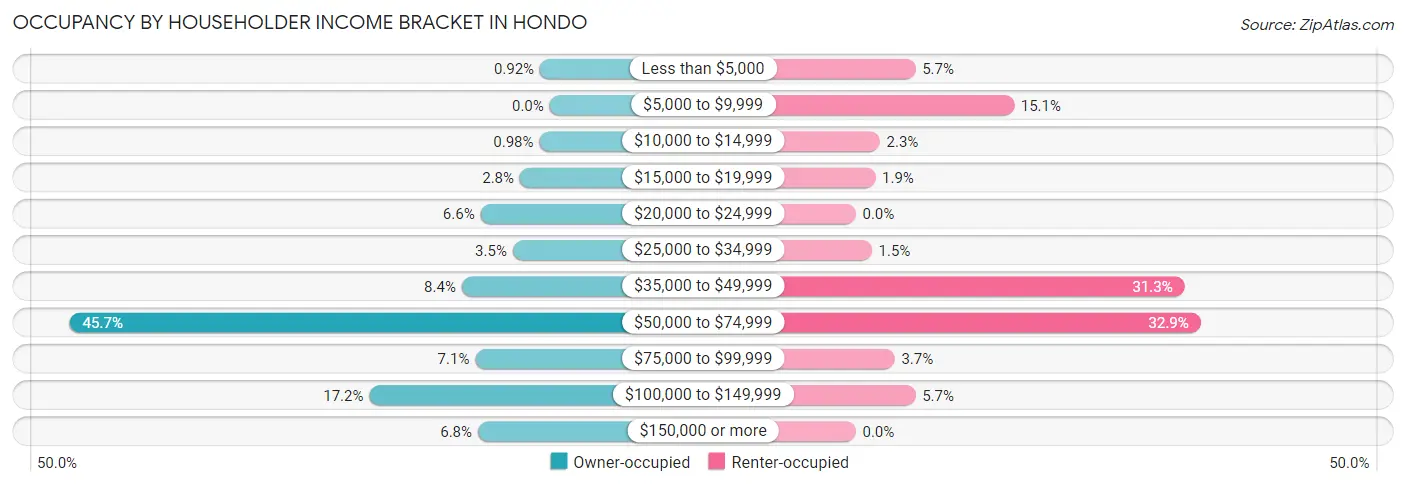
| Income Bracket | Owner-occupied | Renter-occupied |
| Less than $5,000 | 15 (0.9%) | 52 (5.7%) |
| $5,000 to $9,999 | 0 (0.0%) | 138 (15.1%) |
| $10,000 to $14,999 | 16 (1.0%) | 21 (2.3%) |
| $15,000 to $19,999 | 46 (2.8%) | 17 (1.9%) |
| $20,000 to $24,999 | 107 (6.6%) | 0 (0.0%) |
| $25,000 to $34,999 | 57 (3.5%) | 14 (1.5%) |
| $35,000 to $49,999 | 136 (8.4%) | 287 (31.3%) |
| $50,000 to $74,999 | 743 (45.7%) | 301 (32.9%) |
| $75,000 to $99,999 | 115 (7.1%) | 34 (3.7%) |
| $100,000 to $149,999 | 279 (17.2%) | 52 (5.7%) |
| $150,000 or more | 111 (6.8%) | 0 (0.0%) |
| Total | 1,625 (100.0%) | 916 (100.0%) |
Monthly Housing Cost Tiers in Hondo
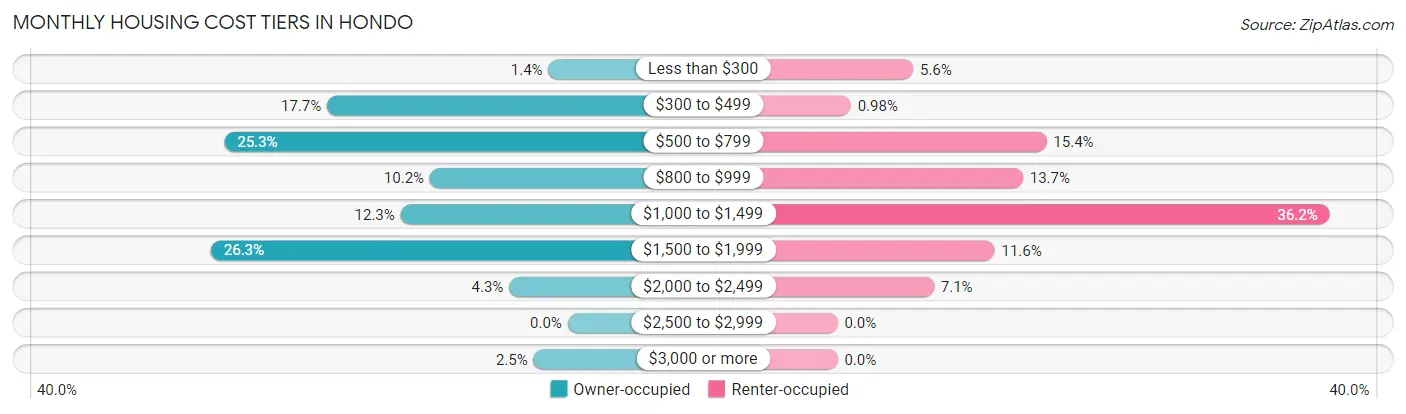
| Monthly Cost | Owner-occupied | Renter-occupied |
| Less than $300 | 23 (1.4%) | 51 (5.6%) |
| $300 to $499 | 288 (17.7%) | 9 (1.0%) |
| $500 to $799 | 411 (25.3%) | 141 (15.4%) |
| $800 to $999 | 165 (10.2%) | 125 (13.7%) |
| $1,000 to $1,499 | 200 (12.3%) | 332 (36.2%) |
| $1,500 to $1,999 | 427 (26.3%) | 106 (11.6%) |
| $2,000 to $2,499 | 70 (4.3%) | 65 (7.1%) |
| $2,500 to $2,999 | 0 (0.0%) | 0 (0.0%) |
| $3,000 or more | 41 (2.5%) | 0 (0.0%) |
| Total | 1,625 (100.0%) | 916 (100.0%) |
Physical Housing Characteristics in Hondo
Housing Structures in Hondo
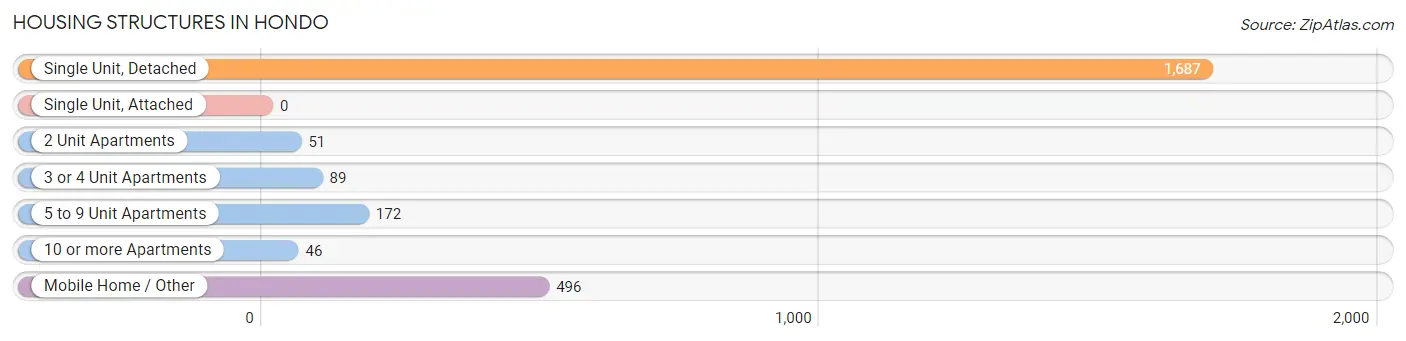
| Structure Type | # Housing Units | % Housing Units |
| Single Unit, Detached | 1,687 | 66.4% |
| Single Unit, Attached | 0 | 0.0% |
| 2 Unit Apartments | 51 | 2.0% |
| 3 or 4 Unit Apartments | 89 | 3.5% |
| 5 to 9 Unit Apartments | 172 | 6.8% |
| 10 or more Apartments | 46 | 1.8% |
| Mobile Home / Other | 496 | 19.5% |
| Total | 2,541 | 100.0% |
Housing Structures by Occupancy in Hondo
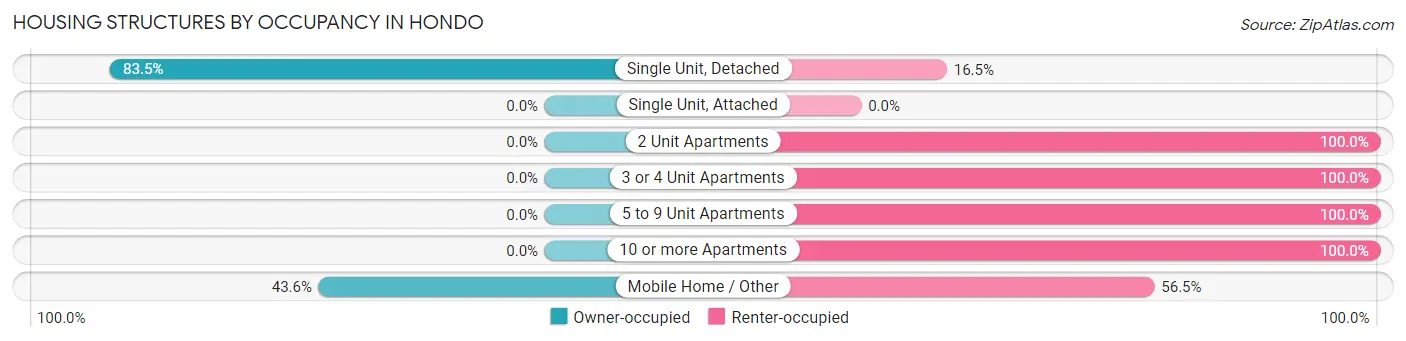
| Structure Type | Owner-occupied | Renter-occupied |
| Single Unit, Detached | 1,409 (83.5%) | 278 (16.5%) |
| Single Unit, Attached | 0 (0.0%) | 0 (0.0%) |
| 2 Unit Apartments | 0 (0.0%) | 51 (100.0%) |
| 3 or 4 Unit Apartments | 0 (0.0%) | 89 (100.0%) |
| 5 to 9 Unit Apartments | 0 (0.0%) | 172 (100.0%) |
| 10 or more Apartments | 0 (0.0%) | 46 (100.0%) |
| Mobile Home / Other | 216 (43.5%) | 280 (56.5%) |
| Total | 1,625 (63.9%) | 916 (36.0%) |
Housing Structures by Number of Rooms in Hondo
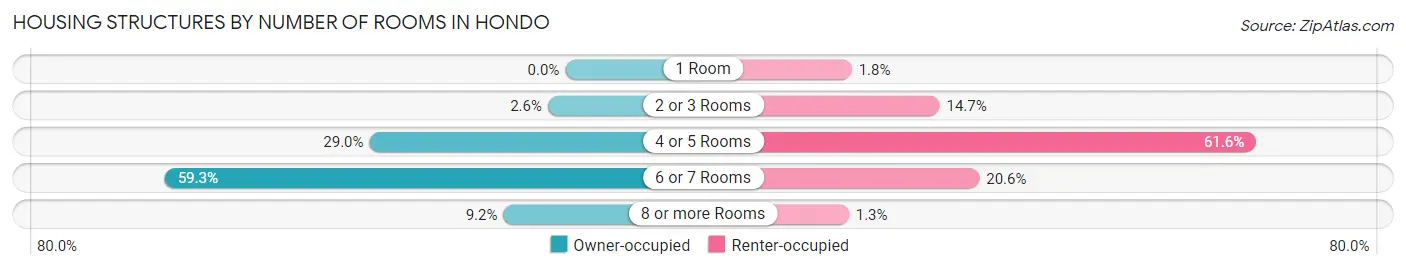
| Number of Rooms | Owner-occupied | Renter-occupied |
| 1 Room | 0 (0.0%) | 16 (1.8%) |
| 2 or 3 Rooms | 42 (2.6%) | 135 (14.7%) |
| 4 or 5 Rooms | 471 (29.0%) | 564 (61.6%) |
| 6 or 7 Rooms | 963 (59.3%) | 189 (20.6%) |
| 8 or more Rooms | 149 (9.2%) | 12 (1.3%) |
| Total | 1,625 (100.0%) | 916 (100.0%) |
Housing Structure by Heating Type in Hondo
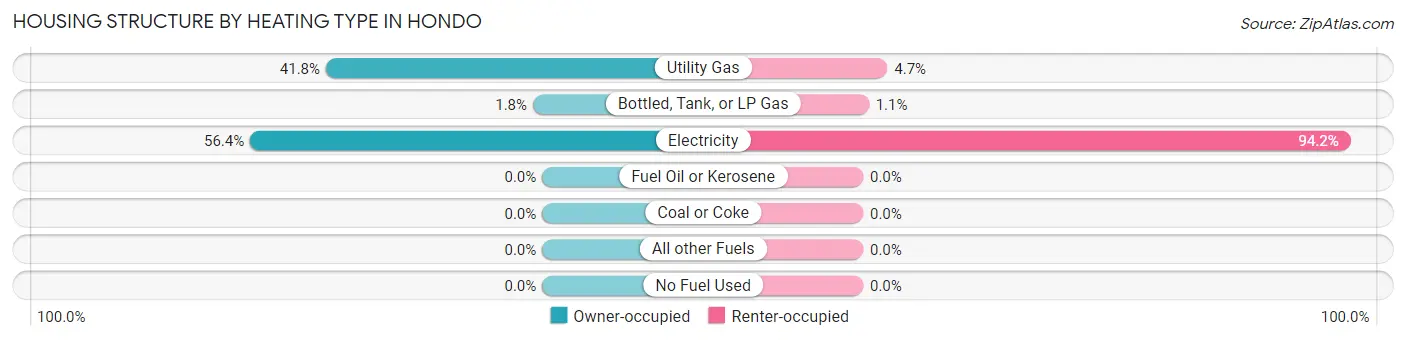
| Heating Type | Owner-occupied | Renter-occupied |
| Utility Gas | 679 (41.8%) | 43 (4.7%) |
| Bottled, Tank, or LP Gas | 29 (1.8%) | 10 (1.1%) |
| Electricity | 917 (56.4%) | 863 (94.2%) |
| Fuel Oil or Kerosene | 0 (0.0%) | 0 (0.0%) |
| Coal or Coke | 0 (0.0%) | 0 (0.0%) |
| All other Fuels | 0 (0.0%) | 0 (0.0%) |
| No Fuel Used | 0 (0.0%) | 0 (0.0%) |
| Total | 1,625 (100.0%) | 916 (100.0%) |
Household Vehicle Usage in Hondo
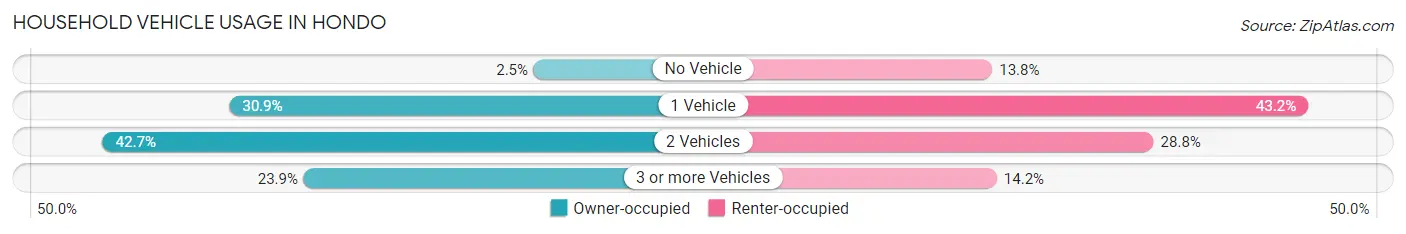
| Vehicles per Household | Owner-occupied | Renter-occupied |
| No Vehicle | 40 (2.5%) | 126 (13.8%) |
| 1 Vehicle | 502 (30.9%) | 396 (43.2%) |
| 2 Vehicles | 694 (42.7%) | 264 (28.8%) |
| 3 or more Vehicles | 389 (23.9%) | 130 (14.2%) |
| Total | 1,625 (100.0%) | 916 (100.0%) |
Real Estate & Mortgages in Hondo
Real Estate and Mortgage Overview in Hondo
| Characteristic | Without Mortgage | With Mortgage |
| Housing Units | 762 | 863 |
| Median Property Value | $83,400 | $207,800 |
| Median Household Income | $60,650 | $79 |
| Monthly Housing Costs | $532 | $41 |
| Real Estate Taxes | $1,196 | $0 |
Property Value by Mortgage Status in Hondo
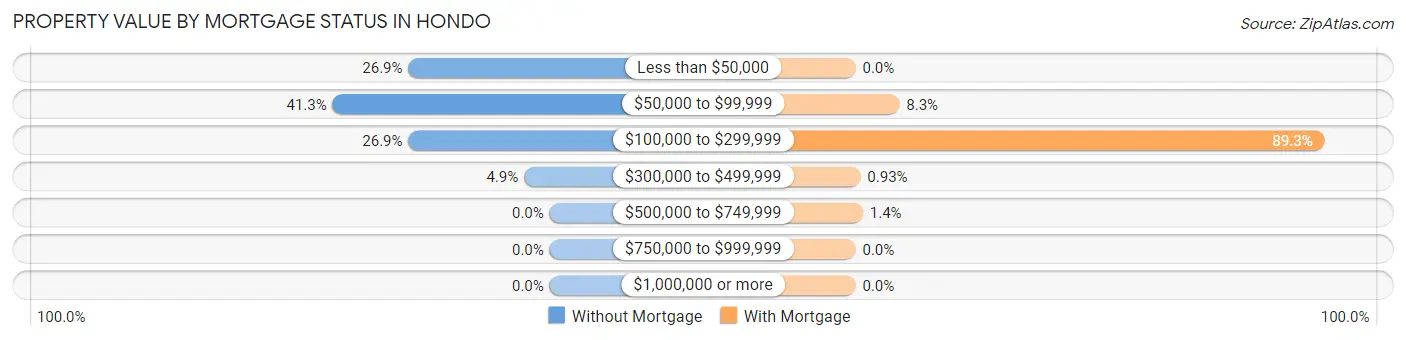
| Property Value | Without Mortgage | With Mortgage |
| Less than $50,000 | 205 (26.9%) | 0 (0.0%) |
| $50,000 to $99,999 | 315 (41.3%) | 72 (8.3%) |
| $100,000 to $299,999 | 205 (26.9%) | 771 (89.3%) |
| $300,000 to $499,999 | 37 (4.9%) | 8 (0.9%) |
| $500,000 to $749,999 | 0 (0.0%) | 12 (1.4%) |
| $750,000 to $999,999 | 0 (0.0%) | 0 (0.0%) |
| $1,000,000 or more | 0 (0.0%) | 0 (0.0%) |
| Total | 762 (100.0%) | 863 (100.0%) |
Household Income by Mortgage Status in Hondo
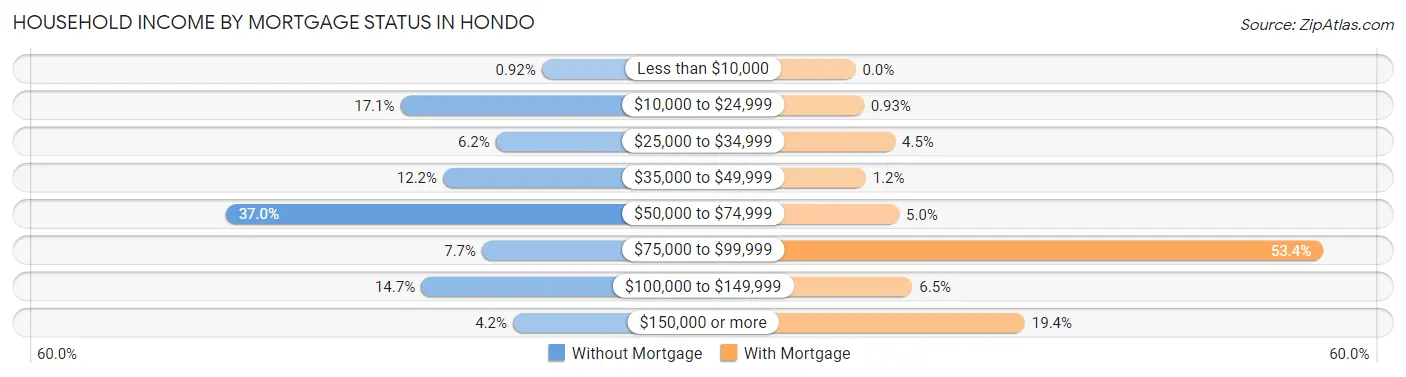
| Household Income | Without Mortgage | With Mortgage |
| Less than $10,000 | 7 (0.9%) | 0 (0.0%) |
| $10,000 to $24,999 | 130 (17.1%) | 8 (0.9%) |
| $25,000 to $34,999 | 47 (6.2%) | 39 (4.5%) |
| $35,000 to $49,999 | 93 (12.2%) | 10 (1.2%) |
| $50,000 to $74,999 | 282 (37.0%) | 43 (5.0%) |
| $75,000 to $99,999 | 59 (7.7%) | 461 (53.4%) |
| $100,000 to $149,999 | 112 (14.7%) | 56 (6.5%) |
| $150,000 or more | 32 (4.2%) | 167 (19.4%) |
| Total | 762 (100.0%) | 863 (100.0%) |
Property Value to Household Income Ratio in Hondo
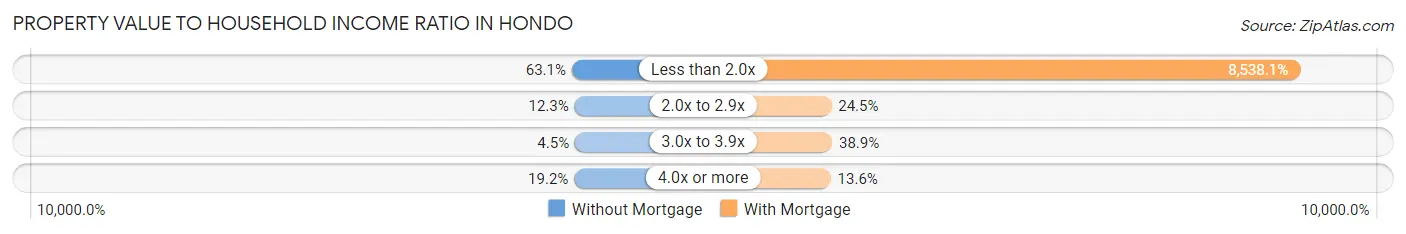
| Value-to-Income Ratio | Without Mortgage | With Mortgage |
| Less than 2.0x | 481 (63.1%) | 73,684 (8,538.1%) |
| 2.0x to 2.9x | 94 (12.3%) | 211 (24.4%) |
| 3.0x to 3.9x | 34 (4.5%) | 336 (38.9%) |
| 4.0x or more | 146 (19.2%) | 117 (13.6%) |
| Total | 762 (100.0%) | 863 (100.0%) |
Real Estate Taxes by Mortgage Status in Hondo
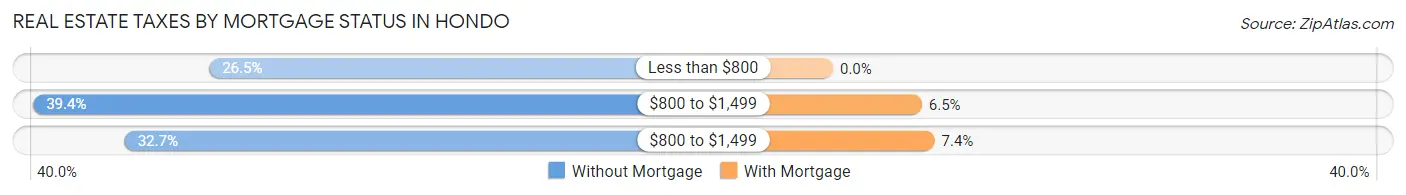
| Property Taxes | Without Mortgage | With Mortgage |
| Less than $800 | 202 (26.5%) | 0 (0.0%) |
| $800 to $1,499 | 300 (39.4%) | 56 (6.5%) |
| $800 to $1,499 | 249 (32.7%) | 64 (7.4%) |
| Total | 762 (100.0%) | 863 (100.0%) |
Health & Disability in Hondo
Health Insurance Coverage by Age in Hondo
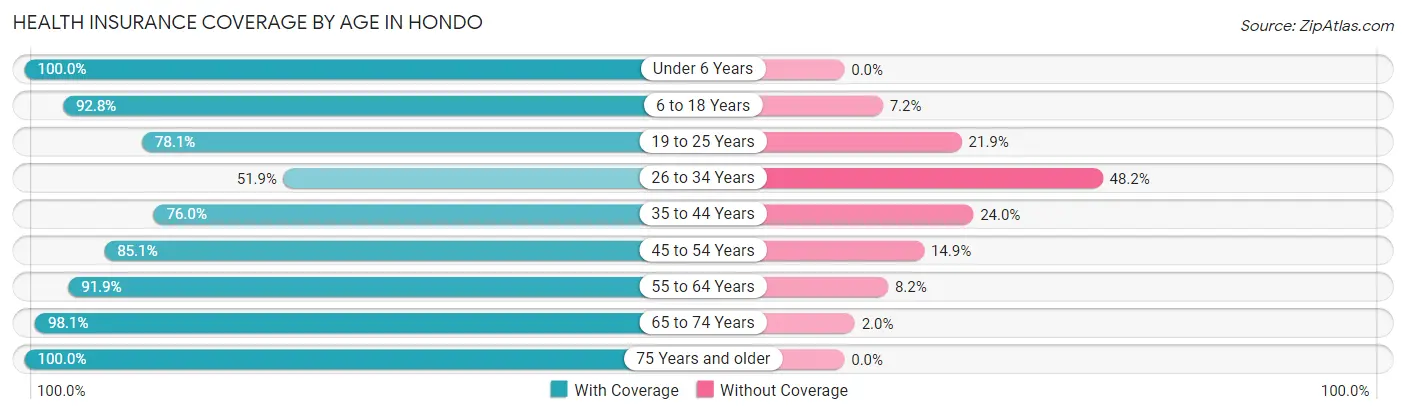
| Age Bracket | With Coverage | Without Coverage |
| Under 6 Years | 656 (100.0%) | 0 (0.0%) |
| 6 to 18 Years | 1,012 (92.8%) | 78 (7.2%) |
| 19 to 25 Years | 432 (78.1%) | 121 (21.9%) |
| 26 to 34 Years | 562 (51.8%) | 522 (48.1%) |
| 35 to 44 Years | 572 (76.0%) | 181 (24.0%) |
| 45 to 54 Years | 504 (85.1%) | 88 (14.9%) |
| 55 to 64 Years | 654 (91.8%) | 58 (8.2%) |
| 65 to 74 Years | 604 (98.1%) | 12 (1.9%) |
| 75 Years and older | 376 (100.0%) | 0 (0.0%) |
| Total | 5,372 (83.5%) | 1,060 (16.5%) |
Health Insurance Coverage by Citizenship Status in Hondo
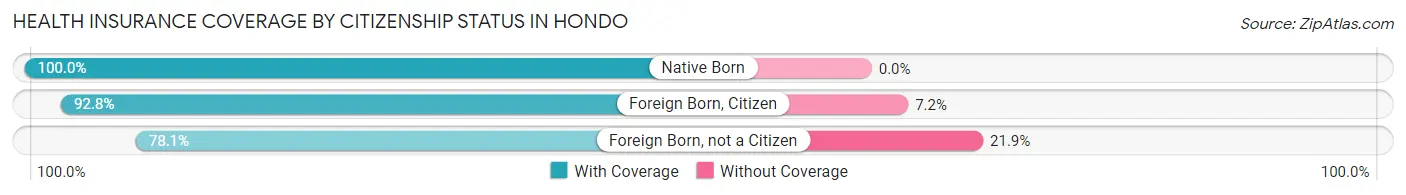
| Citizenship Status | With Coverage | Without Coverage |
| Native Born | 656 (100.0%) | 0 (0.0%) |
| Foreign Born, Citizen | 1,012 (92.8%) | 78 (7.2%) |
| Foreign Born, not a Citizen | 432 (78.1%) | 121 (21.9%) |
Health Insurance Coverage by Household Income in Hondo
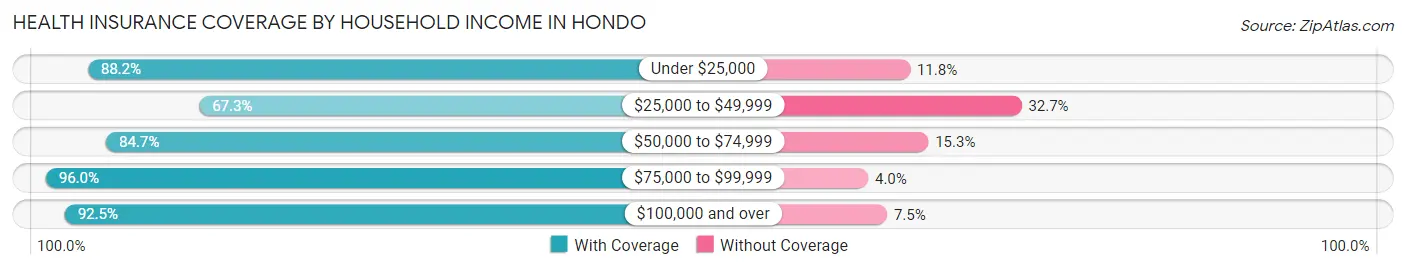
| Household Income | With Coverage | Without Coverage |
| Under $25,000 | 715 (88.2%) | 96 (11.8%) |
| $25,000 to $49,999 | 1,053 (67.3%) | 512 (32.7%) |
| $50,000 to $74,999 | 1,761 (84.7%) | 317 (15.3%) |
| $75,000 to $99,999 | 362 (96.0%) | 15 (4.0%) |
| $100,000 and over | 1,463 (92.5%) | 119 (7.5%) |
Public vs Private Health Insurance Coverage by Age in Hondo
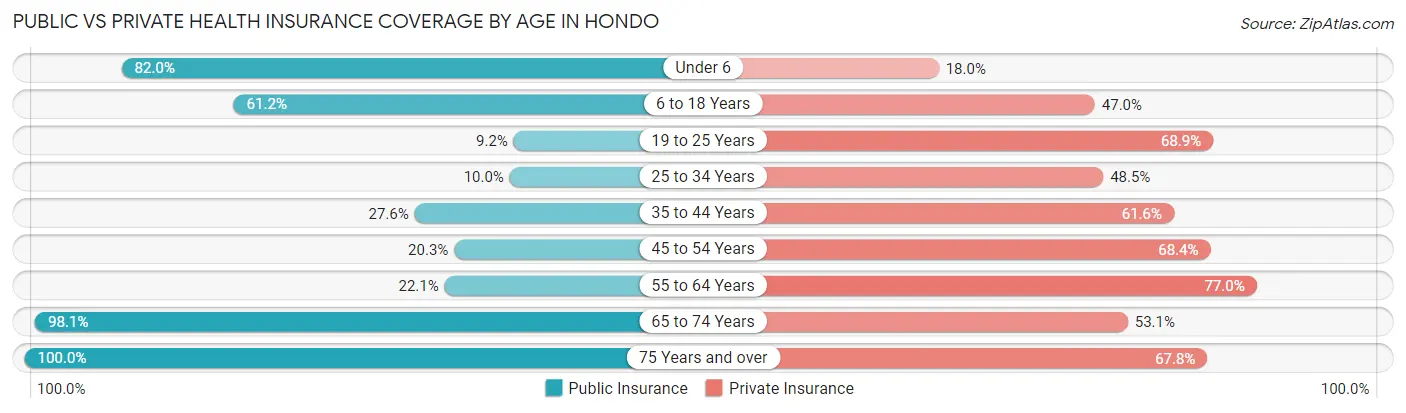
| Age Bracket | Public Insurance | Private Insurance |
| Under 6 | 538 (82.0%) | 118 (18.0%) |
| 6 to 18 Years | 667 (61.2%) | 512 (47.0%) |
| 19 to 25 Years | 51 (9.2%) | 381 (68.9%) |
| 25 to 34 Years | 108 (10.0%) | 526 (48.5%) |
| 35 to 44 Years | 208 (27.6%) | 464 (61.6%) |
| 45 to 54 Years | 120 (20.3%) | 405 (68.4%) |
| 55 to 64 Years | 157 (22.1%) | 548 (77.0%) |
| 65 to 74 Years | 604 (98.1%) | 327 (53.1%) |
| 75 Years and over | 376 (100.0%) | 255 (67.8%) |
| Total | 2,829 (44.0%) | 3,536 (55.0%) |
Disability Status by Sex by Age in Hondo
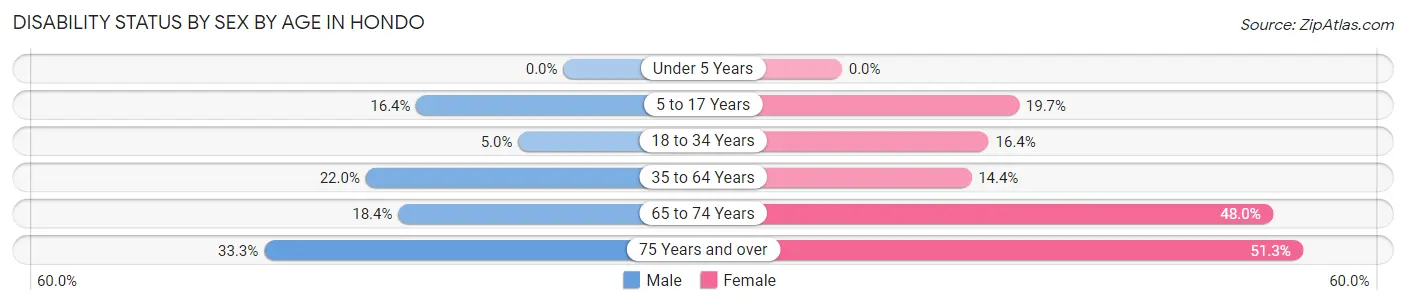
| Age Bracket | Male | Female |
| Under 5 Years | 0 (0.0%) | 0 (0.0%) |
| 5 to 17 Years | 93 (16.4%) | 97 (19.7%) |
| 18 to 34 Years | 46 (5.0%) | 129 (16.4%) |
| 35 to 64 Years | 219 (22.0%) | 153 (14.4%) |
| 65 to 74 Years | 50 (18.4%) | 165 (48.0%) |
| 75 Years and over | 37 (33.3%) | 136 (51.3%) |
Disability Class by Sex by Age in Hondo
Disability Class: Hearing Difficulty
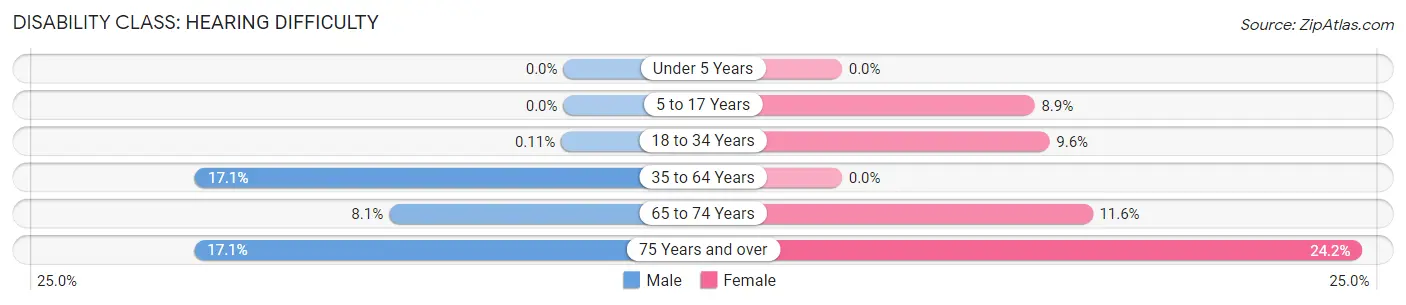
| Age Bracket | Male | Female |
| Under 5 Years | 0 (0.0%) | 0 (0.0%) |
| 5 to 17 Years | 0 (0.0%) | 44 (8.9%) |
| 18 to 34 Years | 1 (0.1%) | 76 (9.6%) |
| 35 to 64 Years | 170 (17.1%) | 0 (0.0%) |
| 65 to 74 Years | 22 (8.1%) | 40 (11.6%) |
| 75 Years and over | 19 (17.1%) | 64 (24.1%) |
Disability Class: Vision Difficulty
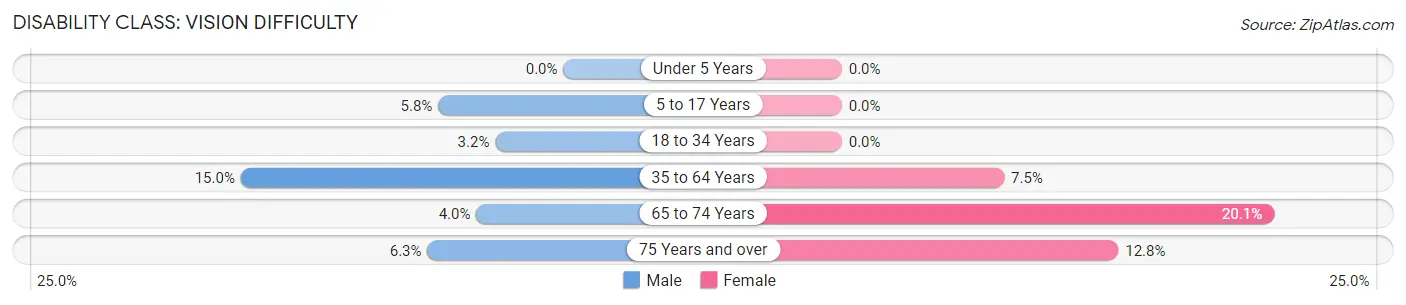
| Age Bracket | Male | Female |
| Under 5 Years | 0 (0.0%) | 0 (0.0%) |
| 5 to 17 Years | 33 (5.8%) | 0 (0.0%) |
| 18 to 34 Years | 29 (3.2%) | 0 (0.0%) |
| 35 to 64 Years | 149 (15.0%) | 80 (7.5%) |
| 65 to 74 Years | 11 (4.0%) | 69 (20.1%) |
| 75 Years and over | 7 (6.3%) | 34 (12.8%) |
Disability Class: Cognitive Difficulty
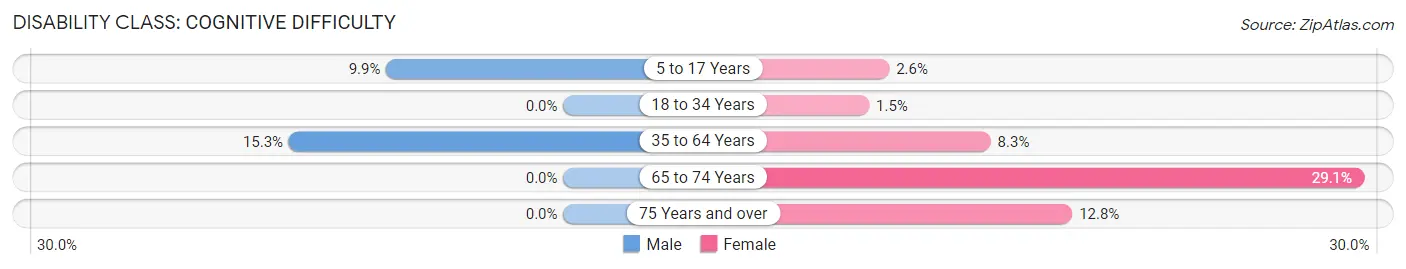
| Age Bracket | Male | Female |
| 5 to 17 Years | 56 (9.9%) | 13 (2.6%) |
| 18 to 34 Years | 0 (0.0%) | 12 (1.5%) |
| 35 to 64 Years | 152 (15.3%) | 88 (8.3%) |
| 65 to 74 Years | 0 (0.0%) | 100 (29.1%) |
| 75 Years and over | 0 (0.0%) | 34 (12.8%) |
Disability Class: Ambulatory Difficulty
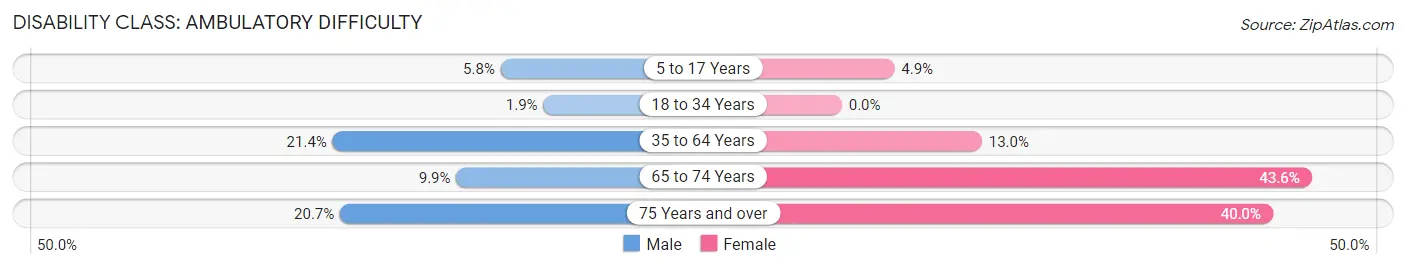
| Age Bracket | Male | Female |
| 5 to 17 Years | 33 (5.8%) | 24 (4.9%) |
| 18 to 34 Years | 17 (1.8%) | 0 (0.0%) |
| 35 to 64 Years | 213 (21.4%) | 138 (13.0%) |
| 65 to 74 Years | 27 (9.9%) | 150 (43.6%) |
| 75 Years and over | 23 (20.7%) | 106 (40.0%) |
Disability Class: Self-Care Difficulty
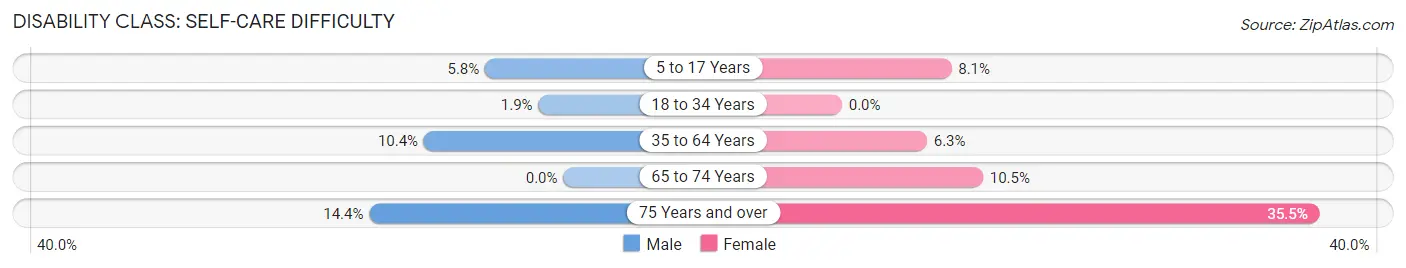
| Age Bracket | Male | Female |
| 5 to 17 Years | 33 (5.8%) | 40 (8.1%) |
| 18 to 34 Years | 17 (1.8%) | 0 (0.0%) |
| 35 to 64 Years | 103 (10.3%) | 67 (6.3%) |
| 65 to 74 Years | 0 (0.0%) | 36 (10.5%) |
| 75 Years and over | 16 (14.4%) | 94 (35.5%) |
Technology Access in Hondo
Computing Device Access in Hondo
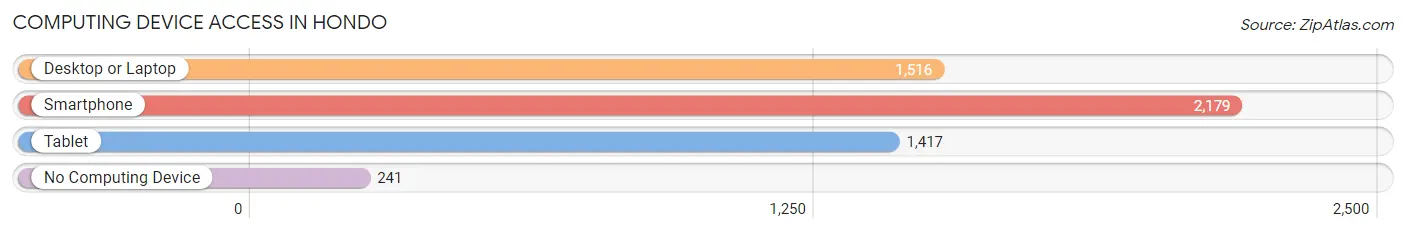
| Device Type | # Households | % Households |
| Desktop or Laptop | 1,516 | 59.7% |
| Smartphone | 2,179 | 85.8% |
| Tablet | 1,417 | 55.8% |
| No Computing Device | 241 | 9.5% |
| Total | 2,541 | 100.0% |
Internet Access in Hondo
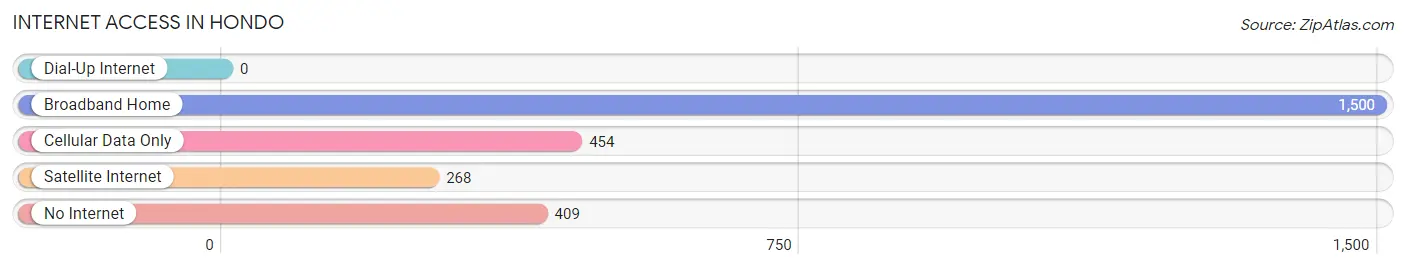
| Internet Type | # Households | % Households |
| Dial-Up Internet | 0 | 0.0% |
| Broadband Home | 1,500 | 59.0% |
| Cellular Data Only | 454 | 17.9% |
| Satellite Internet | 268 | 10.5% |
| No Internet | 409 | 16.1% |
| Total | 2,541 | 100.0% |
Hondo Summary
Hondo, Texas is a small city located in Medina County, Texas. It is situated on the banks of the Hondo Creek, approximately 40 miles west of San Antonio. The city has a population of approximately 8,000 people and is part of the San Antonio-New Braunfels Metropolitan Statistical Area.
History
Hondo was founded in 1881 by John James and named after the nearby Hondo Creek. The city was originally a stop on the San Antonio and Aransas Pass Railway. The city was incorporated in 1909 and has since grown to become a major agricultural center in the region.
Geography
Hondo is located in Medina County, Texas, approximately 40 miles west of San Antonio. The city is situated on the banks of the Hondo Creek, which is a tributary of the Medina River. The city has a total area of 4.2 square miles, all of which is land. The terrain is mostly flat with some rolling hills.
Economy
Hondo’s economy is largely based on agriculture. The city is home to several large farms and ranches, as well as a number of smaller farms and ranches. The city is also home to several manufacturing and industrial businesses, including a large poultry processing plant. The city also has a number of retail stores and restaurants.
Demographics
As of the 2010 census, Hondo had a population of 8,000 people. The racial makeup of the city was 75.3% White, 0.7% African American, 0.7% Native American, 0.3% Asian, 0.1% Pacific Islander, 19.7% from other races, and 3.0% from two or more races. Hispanic or Latino of any race were 57.2% of the population.
The median income for a household in the city was $30,938, and the median income for a family was $35,938. The per capita income for the city was $15,938. About 18.2% of families and 22.2% of the population were below the poverty line, including 28.2% of those under age 18 and 16.2% of those age 65 or over.
Conclusion
Hondo, Texas is a small city located in Medina County, Texas. It is situated on the banks of the Hondo Creek, approximately 40 miles west of San Antonio. The city has a population of approximately 8,000 people and is part of the San Antonio-New Braunfels Metropolitan Statistical Area. The city’s economy is largely based on agriculture, with several large farms and ranches, as well as a number of smaller farms and ranches. The city also has a number of manufacturing and industrial businesses, as well as retail stores and restaurants. The racial makeup of the city is mostly White, with a significant Hispanic or Latino population. The median income for a household in the city is $30,938, and the median income for a family is $35,938.
Common Questions
What is Per Capita Income in Hondo?
Per Capita income in Hondo is $20,796.
What is the Median Family Income in Hondo?
Median Family Income in Hondo is $57,068.
What is the Median Household income in Hondo?
Median Household Income in Hondo is $57,819.
What is Income or Wage Gap in Hondo?
Income or Wage Gap in Hondo is 47.1%.
Women in Hondo earn 52.9 cents for every dollar earned by a man.
What is Family Income Deficit in Hondo?
Family Income Deficit in Hondo is $11,625.
Families that are below poverty line in Hondo earn $11,625 less on average than the poverty threshold level.
What is Inequality or Gini Index in Hondo?
Inequality or Gini Index in Hondo is 0.36.
What is the Total Population of Hondo?
Total Population of Hondo is 8,424.
What is the Total Male Population of Hondo?
Total Male Population of Hondo is 5,084.
What is the Total Female Population of Hondo?
Total Female Population of Hondo is 3,340.
What is the Ratio of Males per 100 Females in Hondo?
There are 152.22 Males per 100 Females in Hondo.
What is the Ratio of Females per 100 Males in Hondo?
There are 65.70 Females per 100 Males in Hondo.
What is the Median Population Age in Hondo?
Median Population Age in Hondo is 31.3 Years.
What is the Average Family Size in Hondo
Average Family Size in Hondo is 3.1 People.
What is the Average Household Size in Hondo
Average Household Size in Hondo is 2.5 People.
How Large is the Labor Force in Hondo?
There are 3,055 People in the Labor Forcein in Hondo.
What is the Percentage of People in the Labor Force in Hondo?
44.6% of People are in the Labor Force in Hondo.
What is the Unemployment Rate in Hondo?
Unemployment Rate in Hondo is 2.9%.