Hitchcock, TX Map & Demographics
Hitchcock Map
Hitchcock Overview
$32,130
PER CAPITA INCOME
$79,738
AVG FAMILY INCOME
$75,741
AVG HOUSEHOLD INCOME
36.9%
WAGE / INCOME GAP [ % ]
63.1¢/ $1
WAGE / INCOME GAP [ $ ]
0.45
INEQUALITY / GINI INDEX
7,398
TOTAL POPULATION
3,423
MALE POPULATION
3,975
FEMALE POPULATION
86.11
MALES / 100 FEMALES
116.13
FEMALES / 100 MALES
35.2
MEDIAN AGE
3.3
AVG FAMILY SIZE
2.8
AVG HOUSEHOLD SIZE
3,517
LABOR FORCE [ PEOPLE ]
63.7%
PERCENT IN LABOR FORCE
5.1%
UNEMPLOYMENT RATE
Hitchcock Zip Codes
Hitchcock Area Codes
Income in Hitchcock
Income Overview in Hitchcock
Per Capita Income in Hitchcock is $32,130, while median incomes of families and households are $79,738 and $75,741 respectively.
| Characteristic | Number | Measure |
| Per Capita Income | 7,398 | $32,130 |
| Median Family Income | 1,931 | $79,738 |
| Mean Family Income | 1,931 | $100,612 |
| Median Household Income | 2,642 | $75,741 |
| Mean Household Income | 2,642 | $91,078 |
| Income Deficit | 1,931 | $0 |
| Wage / Income Gap (%) | 7,398 | 36.88% |
| Wage / Income Gap ($) | 7,398 | 63.12¢ per $1 |
| Gini / Inequality Index | 7,398 | 0.45 |
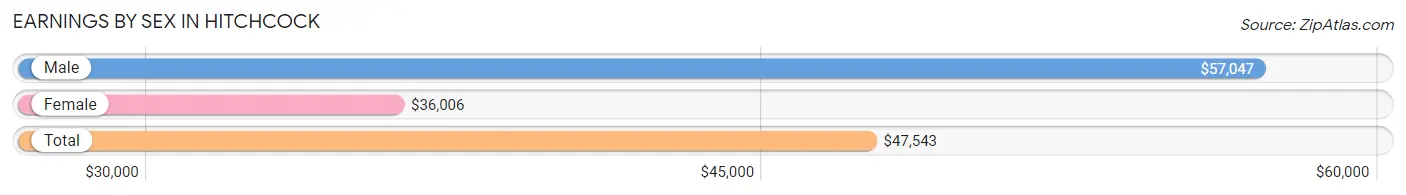
Earnings by Sex in Hitchcock
Average Earnings in Hitchcock are $47,543, $57,047 for men and $36,006 for women, a difference of 36.9%.
| Sex | Number | Average Earnings |
| Male | 1,789 (51.4%) | $57,047 |
| Female | 1,692 (48.6%) | $36,006 |
| Total | 3,481 (100.0%) | $47,543 |
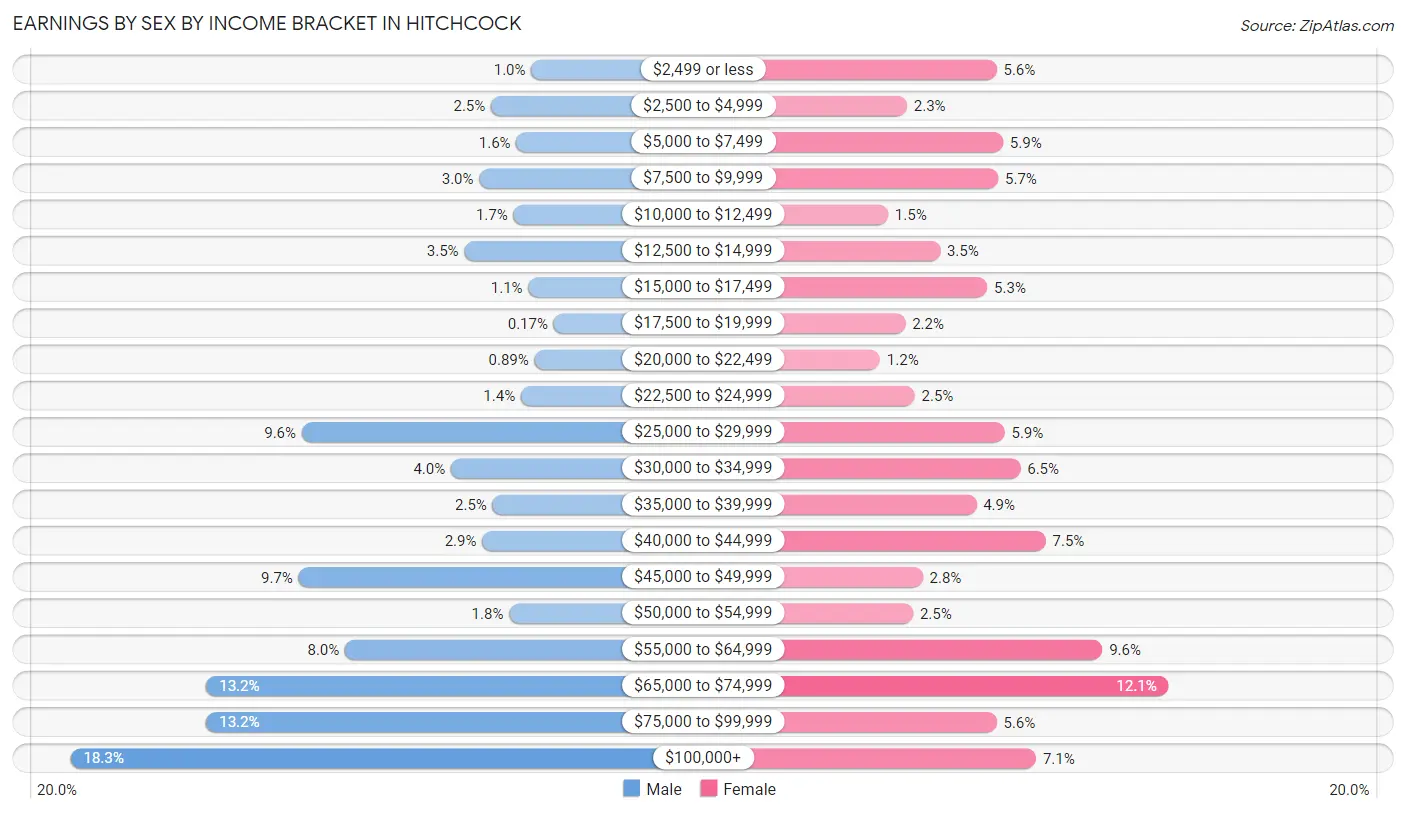
Earnings by Sex by Income Bracket in Hitchcock
The most common earnings brackets in Hitchcock are $100,000+ for men (327 | 18.3%) and $65,000 to $74,999 for women (204 | 12.1%).
| Income | Male | Female |
| $2,499 or less | 18 (1.0%) | 95 (5.6%) |
| $2,500 to $4,999 | 45 (2.5%) | 38 (2.2%) |
| $5,000 to $7,499 | 28 (1.6%) | 99 (5.9%) |
| $7,500 to $9,999 | 53 (3.0%) | 96 (5.7%) |
| $10,000 to $12,499 | 30 (1.7%) | 26 (1.5%) |
| $12,500 to $14,999 | 63 (3.5%) | 59 (3.5%) |
| $15,000 to $17,499 | 20 (1.1%) | 89 (5.3%) |
| $17,500 to $19,999 | 3 (0.2%) | 37 (2.2%) |
| $20,000 to $22,499 | 16 (0.9%) | 21 (1.2%) |
| $22,500 to $24,999 | 25 (1.4%) | 43 (2.5%) |
| $25,000 to $29,999 | 172 (9.6%) | 100 (5.9%) |
| $30,000 to $34,999 | 72 (4.0%) | 110 (6.5%) |
| $35,000 to $39,999 | 44 (2.5%) | 82 (4.9%) |
| $40,000 to $44,999 | 51 (2.9%) | 126 (7.4%) |
| $45,000 to $49,999 | 174 (9.7%) | 48 (2.8%) |
| $50,000 to $54,999 | 33 (1.8%) | 42 (2.5%) |
| $55,000 to $64,999 | 143 (8.0%) | 162 (9.6%) |
| $65,000 to $74,999 | 236 (13.2%) | 204 (12.1%) |
| $75,000 to $99,999 | 236 (13.2%) | 95 (5.6%) |
| $100,000+ | 327 (18.3%) | 120 (7.1%) |
| Total | 1,789 (100.0%) | 1,692 (100.0%) |
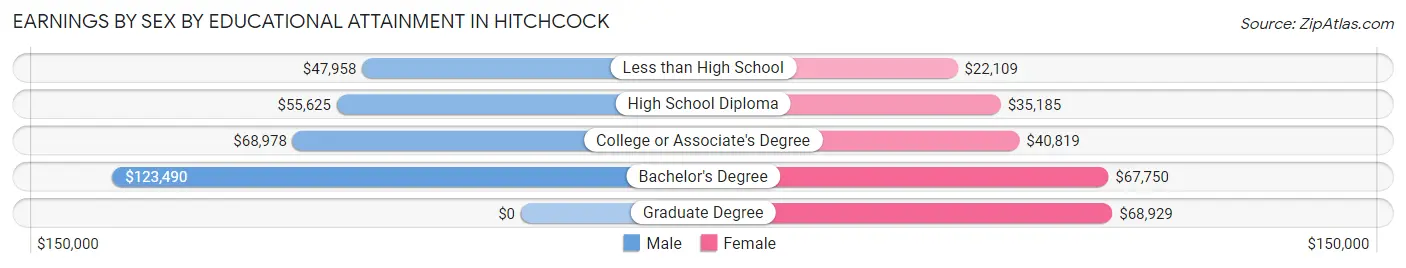
Earnings by Sex by Educational Attainment in Hitchcock
Average earnings in Hitchcock are $65,586 for men and $41,936 for women, a difference of 36.1%. Men with an educational attainment of bachelor's degree enjoy the highest average annual earnings of $123,490, while those with less than high school education earn the least with $47,958. Women with an educational attainment of graduate degree earn the most with the average annual earnings of $68,929, while those with less than high school education have the smallest earnings of $22,109.
| Educational Attainment | Male Income | Female Income |
| Less than High School | $47,958 | $22,109 |
| High School Diploma | $55,625 | $35,185 |
| College or Associate's Degree | $68,978 | $40,819 |
| Bachelor's Degree | $123,490 | $67,750 |
| Graduate Degree | - | - |
| Total | $65,586 | $41,936 |
Family Income in Hitchcock
Family Income Brackets in Hitchcock
According to the Hitchcock family income data, there are 359 families falling into the $75,000 to $99,999 income range, which is the most common income bracket and makes up 18.6% of all families. Conversely, the $10,000 to $14,999 income bracket is the least frequent group with only 17 families (0.9%) belonging to this category.
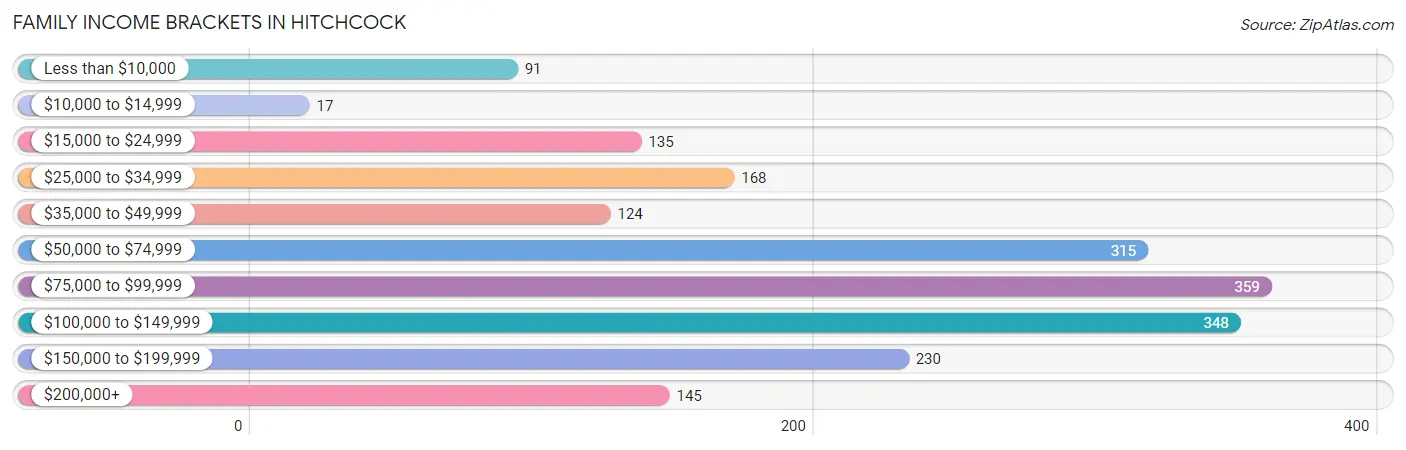
| Income Bracket | # Families | % Families |
| Less than $10,000 | 91 | 4.7% |
| $10,000 to $14,999 | 17 | 0.9% |
| $15,000 to $24,999 | 135 | 7.0% |
| $25,000 to $34,999 | 168 | 8.7% |
| $35,000 to $49,999 | 124 | 6.4% |
| $50,000 to $74,999 | 315 | 16.3% |
| $75,000 to $99,999 | 359 | 18.6% |
| $100,000 to $149,999 | 348 | 18.0% |
| $150,000 to $199,999 | 230 | 11.9% |
| $200,000+ | 145 | 7.5% |
Family Income by Famaliy Size in Hitchcock
6-person families (83 | 4.3%) account for the highest median family income in Hitchcock with $203,406 per family, while 2-person families (848 | 43.9%) have the highest median income of $38,366 per family member.
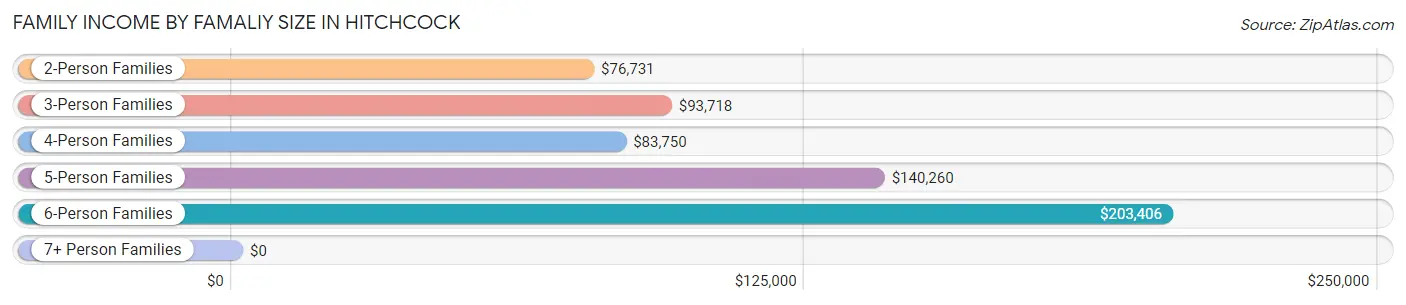
| Income Bracket | # Families | Median Income |
| 2-Person Families | 848 (43.9%) | $76,731 |
| 3-Person Families | 382 (19.8%) | $93,718 |
| 4-Person Families | 349 (18.1%) | $83,750 |
| 5-Person Families | 216 (11.2%) | $140,260 |
| 6-Person Families | 83 (4.3%) | $203,406 |
| 7+ Person Families | 53 (2.7%) | $0 |
| Total | 1,931 (100.0%) | $79,738 |
Family Income by Number of Earners in Hitchcock
The median family income in Hitchcock is $79,738, with families comprising 3+ earners (177) having the highest median family income of $159,938, while families with no earners (291) have the lowest median family income of $35,625, accounting for 9.2% and 15.1% of families, respectively.
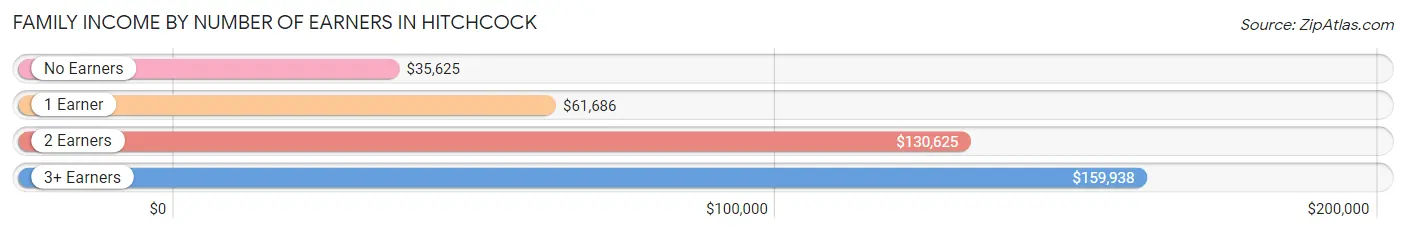
| Number of Earners | # Families | Median Income |
| No Earners | 291 (15.1%) | $35,625 |
| 1 Earner | 730 (37.8%) | $61,686 |
| 2 Earners | 733 (38.0%) | $130,625 |
| 3+ Earners | 177 (9.2%) | $159,938 |
| Total | 1,931 (100.0%) | $79,738 |
Household Income in Hitchcock
Household Income Brackets in Hitchcock
With 481 households falling in the category, the $100,000 to $149,999 income range is the most frequent in Hitchcock, accounting for 18.2% of all households. In contrast, only 45 households (1.7%) fall into the $10,000 to $14,999 income bracket, making it the least populous group.
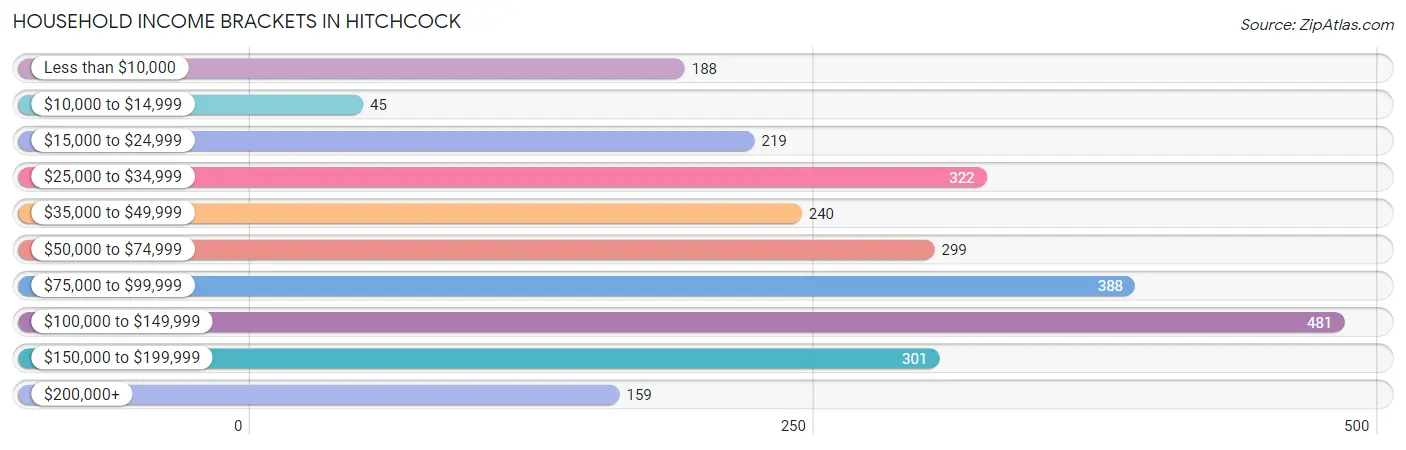
| Income Bracket | # Households | % Households |
| Less than $10,000 | 188 | 7.1% |
| $10,000 to $14,999 | 45 | 1.7% |
| $15,000 to $24,999 | 219 | 8.3% |
| $25,000 to $34,999 | 322 | 12.2% |
| $35,000 to $49,999 | 240 | 9.1% |
| $50,000 to $74,999 | 299 | 11.3% |
| $75,000 to $99,999 | 388 | 14.7% |
| $100,000 to $149,999 | 481 | 18.2% |
| $150,000 to $199,999 | 301 | 11.4% |
| $200,000+ | 159 | 6.0% |
Household Income by Householder Age in Hitchcock
The median household income in Hitchcock is $75,741, with the highest median household income of $94,391 found in the 25 to 44 years age bracket for the primary householder. A total of 1,057 households (40.0%) fall into this category. Meanwhile, the 15 to 24 years age bracket for the primary householder has the lowest median household income of $25,327, with 73 households (2.8%) in this group.
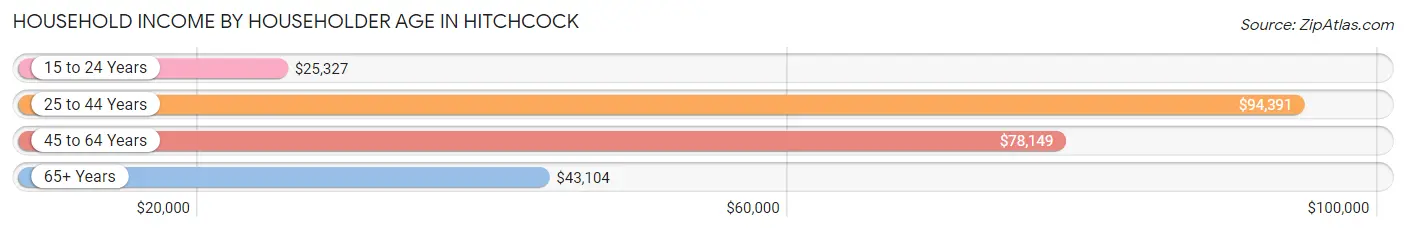
| Income Bracket | # Households | Median Income |
| 15 to 24 Years | 73 (2.8%) | $25,327 |
| 25 to 44 Years | 1,057 (40.0%) | $94,391 |
| 45 to 64 Years | 835 (31.6%) | $78,149 |
| 65+ Years | 677 (25.6%) | $43,104 |
| Total | 2,642 (100.0%) | $75,741 |
Poverty in Hitchcock
Income Below Poverty by Sex and Age in Hitchcock
With 13.9% poverty level for males and 17.1% for females among the residents of Hitchcock, 5 year old males and 12 to 14 year old females are the most vulnerable to poverty, with 21 males (52.5%) and 72 females (29.4%) in their respective age groups living below the poverty level.
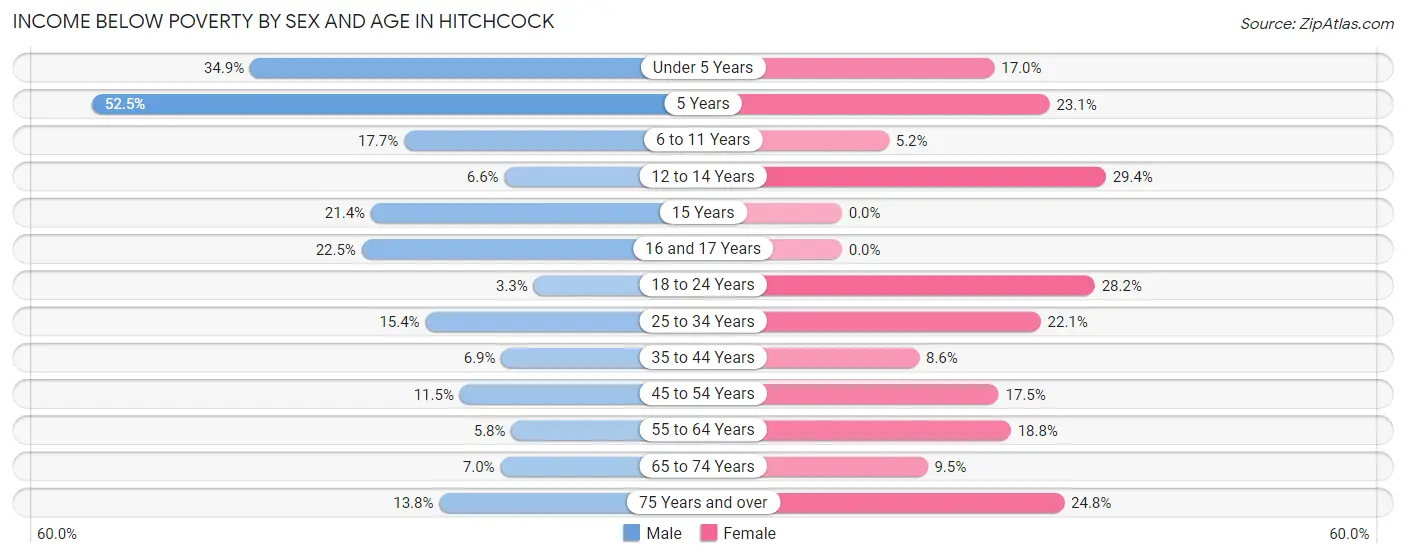
| Age Bracket | Male | Female |
| Under 5 Years | 112 (34.9%) | 45 (17.0%) |
| 5 Years | 21 (52.5%) | 31 (23.1%) |
| 6 to 11 Years | 80 (17.7%) | 16 (5.2%) |
| 12 to 14 Years | 4 (6.6%) | 72 (29.4%) |
| 15 Years | 6 (21.4%) | 0 (0.0%) |
| 16 and 17 Years | 42 (22.5%) | 0 (0.0%) |
| 18 to 24 Years | 8 (3.3%) | 111 (28.2%) |
| 25 to 34 Years | 59 (15.4%) | 114 (22.1%) |
| 35 to 44 Years | 32 (6.9%) | 49 (8.6%) |
| 45 to 54 Years | 48 (11.5%) | 55 (17.5%) |
| 55 to 64 Years | 21 (5.8%) | 92 (18.8%) |
| 65 to 74 Years | 22 (7.0%) | 44 (9.5%) |
| 75 Years and over | 21 (13.8%) | 52 (24.8%) |
| Total | 476 (13.9%) | 681 (17.1%) |
Income Above Poverty by Sex and Age in Hitchcock
According to the poverty statistics in Hitchcock, males aged 18 to 24 years and females aged 15 years are the age groups that are most secure financially, with 96.7% of males and 100.0% of females in these age groups living above the poverty line.
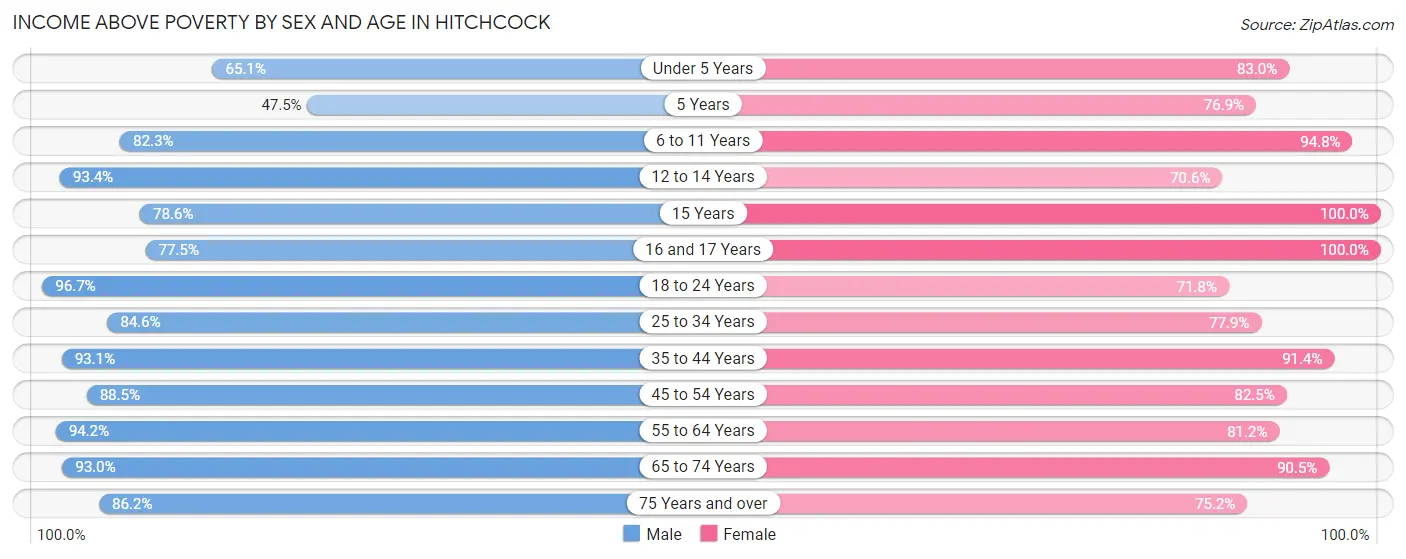
| Age Bracket | Male | Female |
| Under 5 Years | 209 (65.1%) | 220 (83.0%) |
| 5 Years | 19 (47.5%) | 103 (76.9%) |
| 6 to 11 Years | 371 (82.3%) | 290 (94.8%) |
| 12 to 14 Years | 57 (93.4%) | 173 (70.6%) |
| 15 Years | 22 (78.6%) | 26 (100.0%) |
| 16 and 17 Years | 145 (77.5%) | 45 (100.0%) |
| 18 to 24 Years | 234 (96.7%) | 283 (71.8%) |
| 25 to 34 Years | 325 (84.6%) | 401 (77.9%) |
| 35 to 44 Years | 432 (93.1%) | 521 (91.4%) |
| 45 to 54 Years | 368 (88.5%) | 260 (82.5%) |
| 55 to 64 Years | 342 (94.2%) | 397 (81.2%) |
| 65 to 74 Years | 292 (93.0%) | 417 (90.5%) |
| 75 Years and over | 131 (86.2%) | 158 (75.2%) |
| Total | 2,947 (86.1%) | 3,294 (82.9%) |
Income Below Poverty Among Married-Couple Families in Hitchcock
The poverty statistics for married-couple families in Hitchcock show that 9.6% or 130 of the total 1,357 families live below the poverty line. Families with 5 or more children have the highest poverty rate of 100.0%, comprising of 21 families. On the other hand, families with 3 or 4 children have the lowest poverty rate of 0.0%, which includes 0 families.
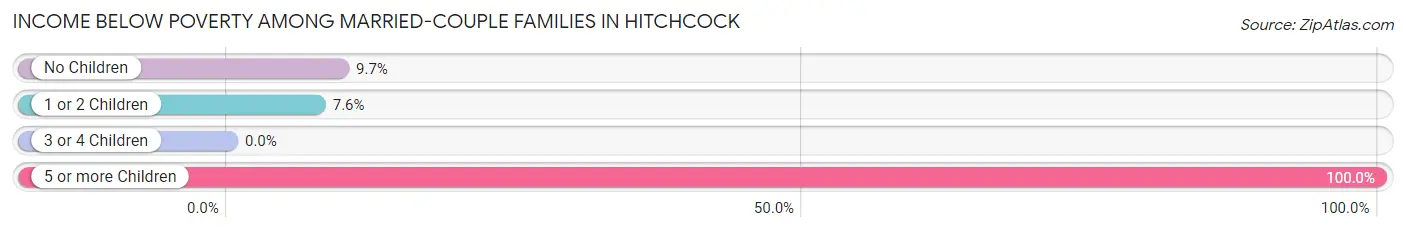
| Children | Above Poverty | Below Poverty |
| No Children | 691 (90.3%) | 74 (9.7%) |
| 1 or 2 Children | 423 (92.4%) | 35 (7.6%) |
| 3 or 4 Children | 113 (100.0%) | 0 (0.0%) |
| 5 or more Children | 0 (0.0%) | 21 (100.0%) |
| Total | 1,227 (90.4%) | 130 (9.6%) |
Income Below Poverty Among Single-Parent Households in Hitchcock
According to the poverty data in Hitchcock, 7.1% or 13 single-father households and 23.3% or 91 single-mother households are living below the poverty line. Among single-father households, those with 1 or 2 children have the highest poverty rate, with 13 households (14.0%) experiencing poverty. Likewise, among single-mother households, those with 3 or 4 children have the highest poverty rate, with 44 households (54.3%) falling below the poverty line.
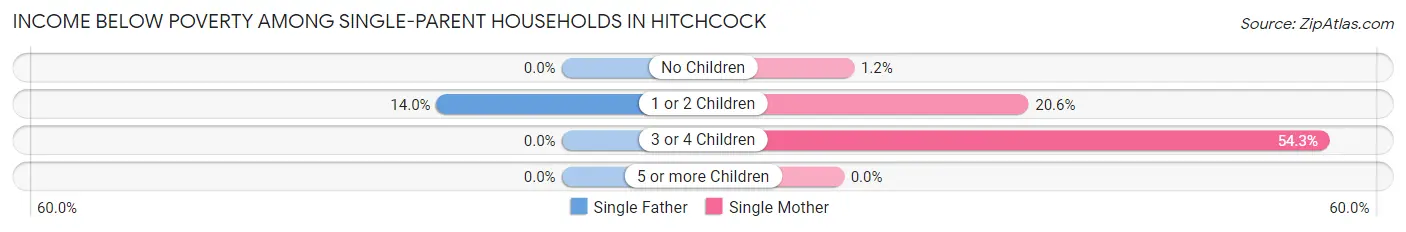
| Children | Single Father | Single Mother |
| No Children | 0 (0.0%) | 1 (1.1%) |
| 1 or 2 Children | 13 (14.0%) | 46 (20.6%) |
| 3 or 4 Children | 0 (0.0%) | 44 (54.3%) |
| 5 or more Children | 0 (0.0%) | 0 (0.0%) |
| Total | 13 (7.1%) | 91 (23.3%) |
Income Below Poverty Among Married-Couple vs Single-Parent Households in Hitchcock
The poverty data for Hitchcock shows that 130 of the married-couple family households (9.6%) and 104 of the single-parent households (18.1%) are living below the poverty level. Within the married-couple family households, those with 5 or more children have the highest poverty rate, with 21 households (100.0%) falling below the poverty line. Among the single-parent households, those with 3 or 4 children have the highest poverty rate, with 44 household (37.3%) living below poverty.
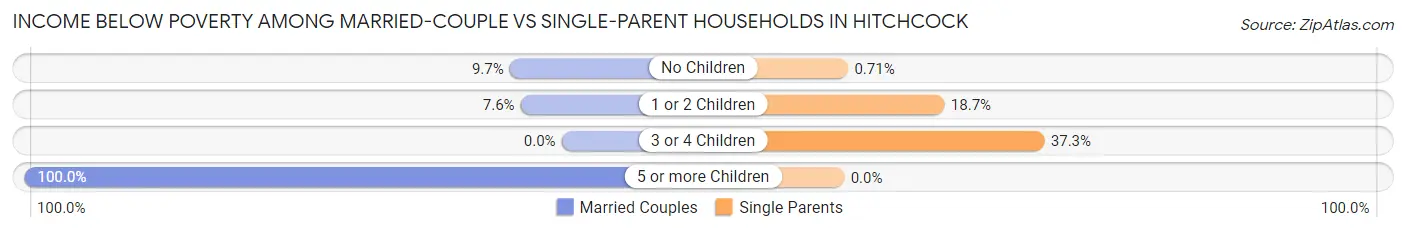
| Children | Married-Couple Families | Single-Parent Households |
| No Children | 74 (9.7%) | 1 (0.7%) |
| 1 or 2 Children | 35 (7.6%) | 59 (18.7%) |
| 3 or 4 Children | 0 (0.0%) | 44 (37.3%) |
| 5 or more Children | 21 (100.0%) | 0 (0.0%) |
| Total | 130 (9.6%) | 104 (18.1%) |
Race in Hitchcock
The most populous races in Hitchcock are White / Caucasian (4,459 | 60.3%), Hispanic or Latino (2,523 | 34.1%), and Black / African American (1,493 | 20.2%).
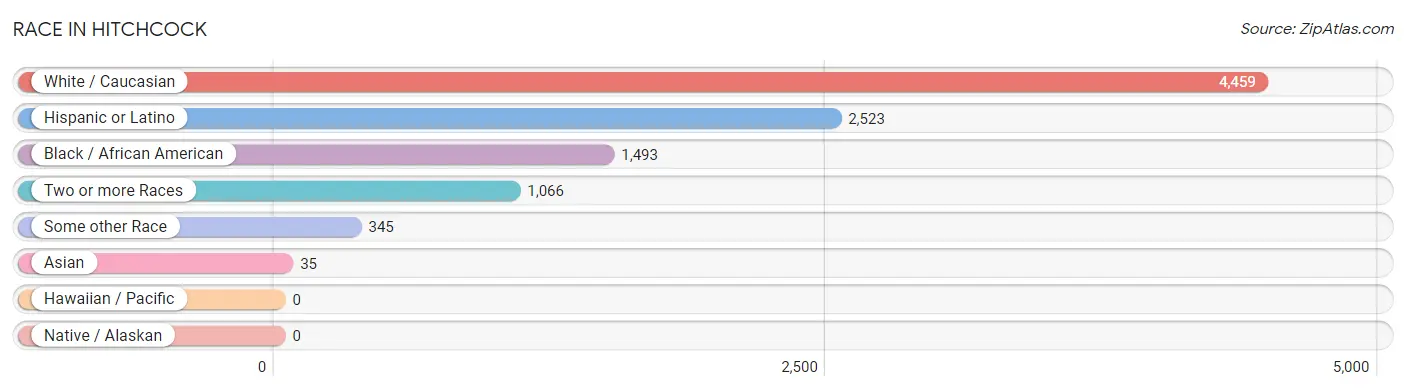
| Race | # Population | % Population |
| Asian | 35 | 0.5% |
| Black / African American | 1,493 | 20.2% |
| Hawaiian / Pacific | 0 | 0.0% |
| Hispanic or Latino | 2,523 | 34.1% |
| Native / Alaskan | 0 | 0.0% |
| White / Caucasian | 4,459 | 60.3% |
| Two or more Races | 1,066 | 14.4% |
| Some other Race | 345 | 4.7% |
| Total | 7,398 | 100.0% |
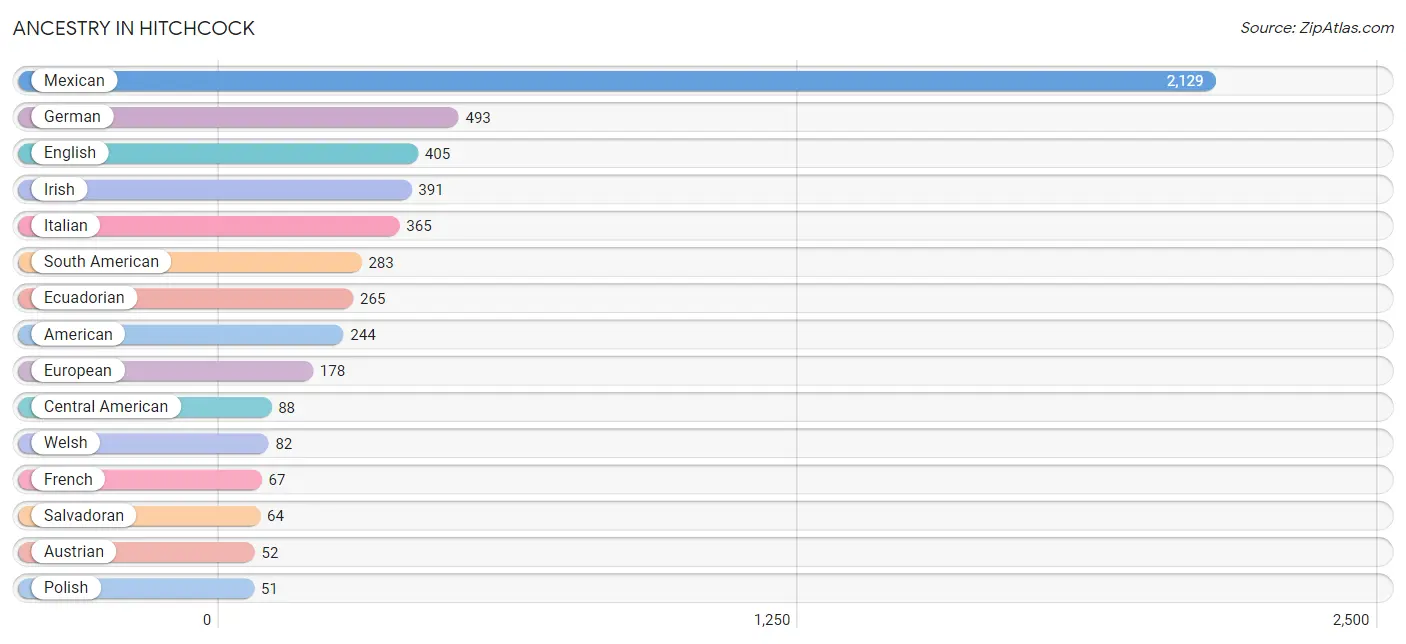
Ancestry in Hitchcock
The most populous ancestries reported in Hitchcock are Mexican (2,129 | 28.8%), German (493 | 6.7%), English (405 | 5.5%), Irish (391 | 5.3%), and Italian (365 | 4.9%), together accounting for 51.1% of all Hitchcock residents.
| Ancestry | # Population | % Population |
| African | 9 | 0.1% |
| American | 244 | 3.3% |
| Austrian | 52 | 0.7% |
| Bhutanese | 12 | 0.2% |
| Blackfeet | 6 | 0.1% |
| British | 11 | 0.2% |
| Central American | 88 | 1.2% |
| Cherokee | 17 | 0.2% |
| Choctaw | 7 | 0.1% |
| Colombian | 18 | 0.2% |
| Costa Rican | 24 | 0.3% |
| Czech | 30 | 0.4% |
| Czechoslovakian | 9 | 0.1% |
| Danish | 8 | 0.1% |
| Dutch | 23 | 0.3% |
| Eastern European | 8 | 0.1% |
| Ecuadorian | 265 | 3.6% |
| English | 405 | 5.5% |
| European | 178 | 2.4% |
| Finnish | 32 | 0.4% |
| French | 67 | 0.9% |
| French Canadian | 33 | 0.4% |
| German | 493 | 6.7% |
| Greek | 8 | 0.1% |
| Irish | 391 | 5.3% |
| Italian | 365 | 4.9% |
| Jamaican | 30 | 0.4% |
| Korean | 43 | 0.6% |
| Mexican | 2,129 | 28.8% |
| Polish | 51 | 0.7% |
| Portuguese | 27 | 0.4% |
| Puerto Rican | 3 | 0.0% |
| Salvadoran | 64 | 0.9% |
| Scandinavian | 10 | 0.1% |
| Scotch-Irish | 19 | 0.3% |
| Scottish | 22 | 0.3% |
| South American | 283 | 3.8% |
| Spaniard | 7 | 0.1% |
| Sri Lankan | 10 | 0.1% |
| Subsaharan African | 9 | 0.1% |
| Swedish | 29 | 0.4% |
| Welsh | 82 | 1.1% | View All 42 Rows |
Immigrants in Hitchcock
The most numerous immigrant groups reported in Hitchcock came from Latin America (635 | 8.6%), Central America (558 | 7.5%), Mexico (542 | 7.3%), South America (77 | 1.0%), and Ecuador (68 | 0.9%), together accounting for 25.4% of all Hitchcock residents.
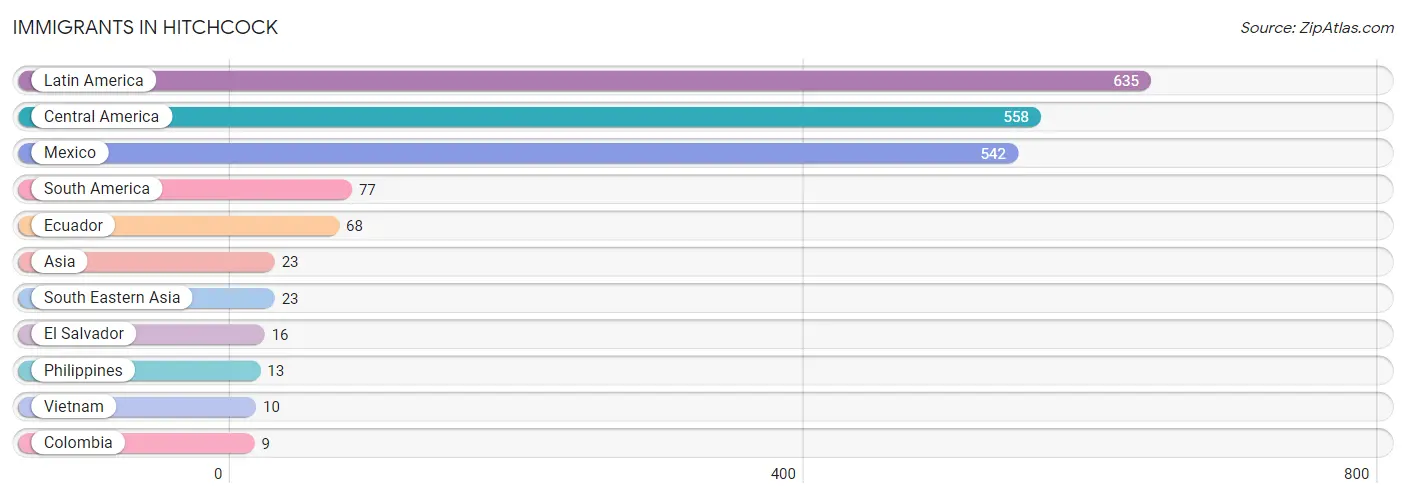
| Immigration Origin | # Population | % Population |
| Asia | 23 | 0.3% |
| Central America | 558 | 7.5% |
| Colombia | 9 | 0.1% |
| Ecuador | 68 | 0.9% |
| El Salvador | 16 | 0.2% |
| Latin America | 635 | 8.6% |
| Mexico | 542 | 7.3% |
| Philippines | 13 | 0.2% |
| South America | 77 | 1.0% |
| South Eastern Asia | 23 | 0.3% |
| Vietnam | 10 | 0.1% | View All 11 Rows |
Sex and Age in Hitchcock
Sex and Age in Hitchcock
The most populous age groups in Hitchcock are 5 to 9 Years (356 | 10.4%) for men and 10 to 14 Years (382 | 9.6%) for women.
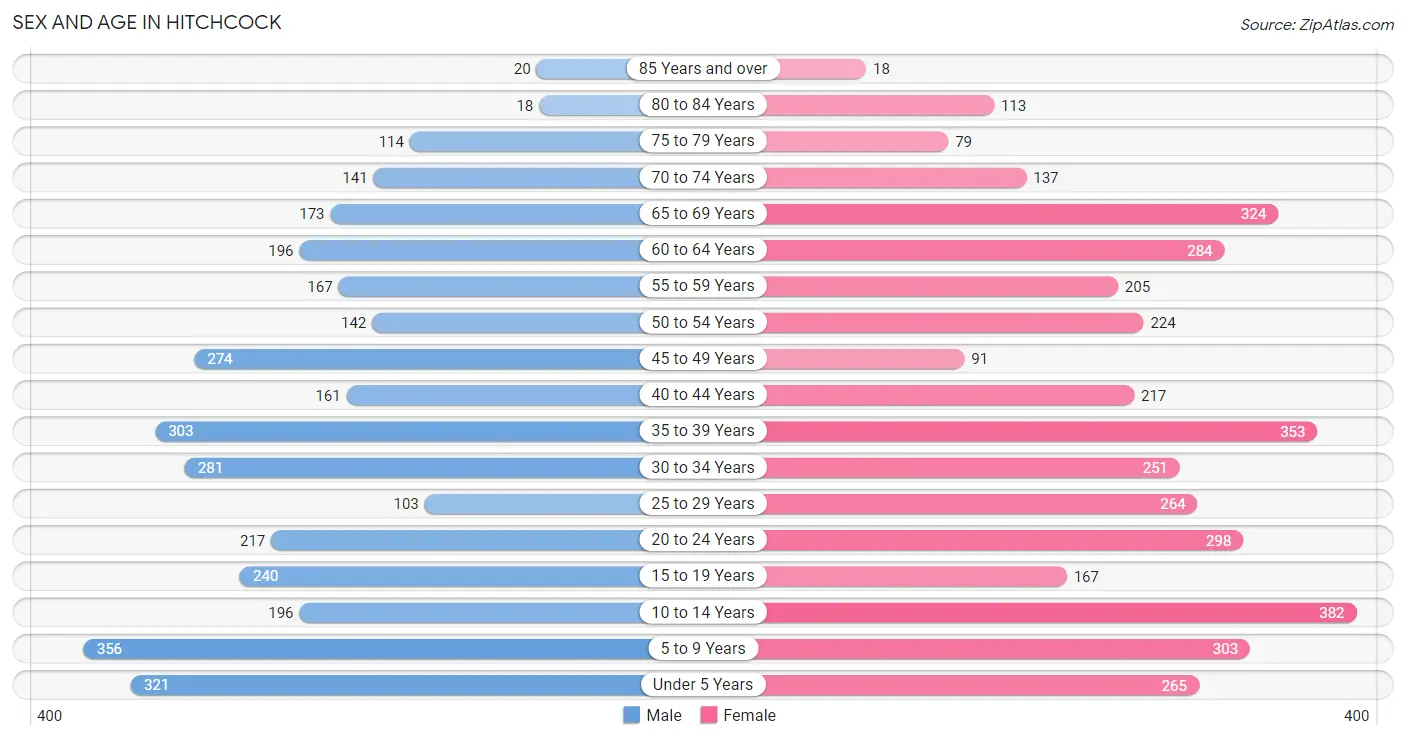
| Age Bracket | Male | Female |
| Under 5 Years | 321 (9.4%) | 265 (6.7%) |
| 5 to 9 Years | 356 (10.4%) | 303 (7.6%) |
| 10 to 14 Years | 196 (5.7%) | 382 (9.6%) |
| 15 to 19 Years | 240 (7.0%) | 167 (4.2%) |
| 20 to 24 Years | 217 (6.3%) | 298 (7.5%) |
| 25 to 29 Years | 103 (3.0%) | 264 (6.6%) |
| 30 to 34 Years | 281 (8.2%) | 251 (6.3%) |
| 35 to 39 Years | 303 (8.8%) | 353 (8.9%) |
| 40 to 44 Years | 161 (4.7%) | 217 (5.5%) |
| 45 to 49 Years | 274 (8.0%) | 91 (2.3%) |
| 50 to 54 Years | 142 (4.2%) | 224 (5.6%) |
| 55 to 59 Years | 167 (4.9%) | 205 (5.2%) |
| 60 to 64 Years | 196 (5.7%) | 284 (7.1%) |
| 65 to 69 Years | 173 (5.1%) | 324 (8.2%) |
| 70 to 74 Years | 141 (4.1%) | 137 (3.5%) |
| 75 to 79 Years | 114 (3.3%) | 79 (2.0%) |
| 80 to 84 Years | 18 (0.5%) | 113 (2.8%) |
| 85 Years and over | 20 (0.6%) | 18 (0.4%) |
| Total | 3,423 (100.0%) | 3,975 (100.0%) |
Families and Households in Hitchcock
Median Family Size in Hitchcock
The median family size in Hitchcock is 3.27 persons per family, with married-couple families (1,357 | 70.3%) accounting for the largest median family size of 3.38 persons per family. On the other hand, single male/father families (183 | 9.5%) represent the smallest median family size with 2.78 persons per family.
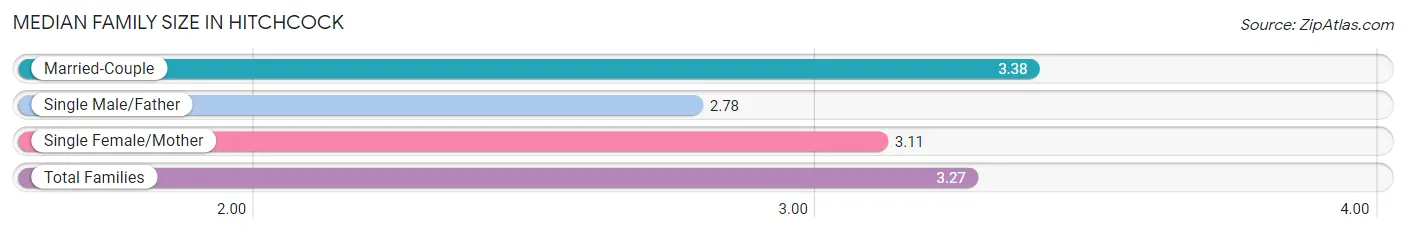
| Family Type | # Families | Family Size |
| Married-Couple | 1,357 (70.3%) | 3.38 |
| Single Male/Father | 183 (9.5%) | 2.78 |
| Single Female/Mother | 391 (20.3%) | 3.11 |
| Total Families | 1,931 (100.0%) | 3.27 |
Median Household Size in Hitchcock
The median household size in Hitchcock is 2.80 persons per household, with married-couple households (1,357 | 51.4%) accounting for the largest median household size of 3.45 persons per household. non-family households (711 | 26.9%) represent the smallest median household size with 1.11 persons per household.
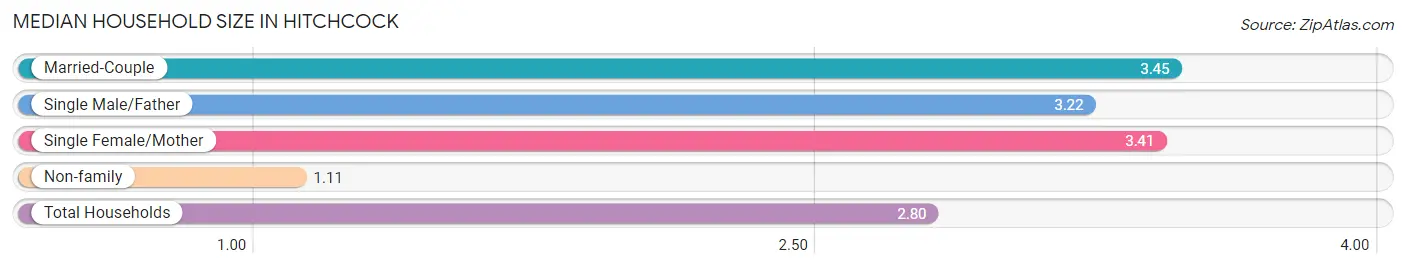
| Household Type | # Households | Household Size |
| Married-Couple | 1,357 (51.4%) | 3.45 |
| Single Male/Father | 183 (6.9%) | 3.22 |
| Single Female/Mother | 391 (14.8%) | 3.41 |
| Non-family | 711 (26.9%) | 1.11 |
| Total Households | 2,642 (100.0%) | 2.80 |
Household Size by Marriage Status in Hitchcock
Out of a total of 2,642 households in Hitchcock, 1,931 (73.1%) are family households, while 711 (26.9%) are nonfamily households. The most numerous type of family households are 2-person households, comprising 781, and the most common type of nonfamily households are 1-person households, comprising 631.
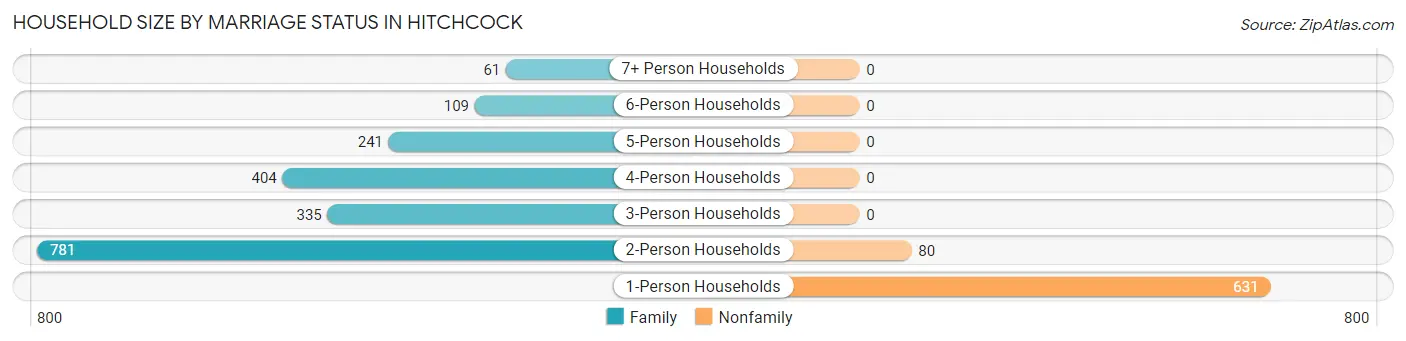
| Household Size | Family Households | Nonfamily Households |
| 1-Person Households | - | 631 (23.9%) |
| 2-Person Households | 781 (29.6%) | 80 (3.0%) |
| 3-Person Households | 335 (12.7%) | 0 (0.0%) |
| 4-Person Households | 404 (15.3%) | 0 (0.0%) |
| 5-Person Households | 241 (9.1%) | 0 (0.0%) |
| 6-Person Households | 109 (4.1%) | 0 (0.0%) |
| 7+ Person Households | 61 (2.3%) | 0 (0.0%) |
| Total | 1,931 (73.1%) | 711 (26.9%) |
Female Fertility in Hitchcock
Fertility by Age in Hitchcock
Average fertility rate in Hitchcock is 73.0 births per 1,000 women. Women in the age bracket of 20 to 34 years have the highest fertility rate with 128.0 births per 1,000 women. Women in the age bracket of 20 to 34 years acount for 85.3% of all women with births.
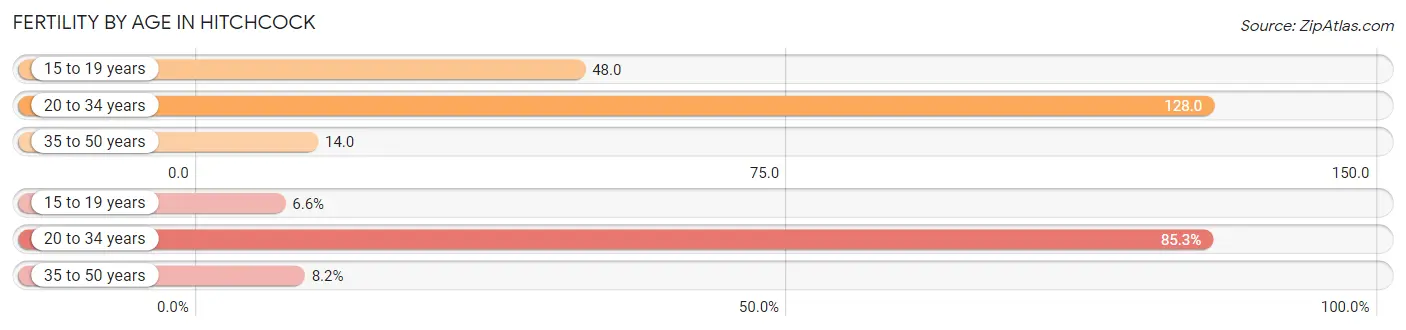
| Age Bracket | Women with Births | Births / 1,000 Women |
| 15 to 19 years | 8 (6.6%) | 48.0 |
| 20 to 34 years | 104 (85.3%) | 128.0 |
| 35 to 50 years | 10 (8.2%) | 14.0 |
| Total | 122 (100.0%) | 73.0 |
Fertility by Age by Marriage Status in Hitchcock
59.0% of women with births (122) in Hitchcock are married. The highest percentage of unmarried women with births falls into 15 to 19 years age bracket with 100.0% of them unmarried at the time of birth, while the lowest percentage of unmarried women with births belong to 35 to 50 years age bracket with 0.0% of them unmarried.
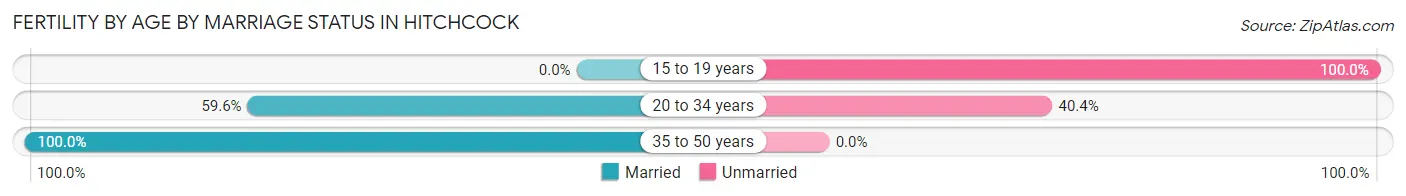
| Age Bracket | Married | Unmarried |
| 15 to 19 years | 0 (0.0%) | 8 (100.0%) |
| 20 to 34 years | 62 (59.6%) | 42 (40.4%) |
| 35 to 50 years | 10 (100.0%) | 0 (0.0%) |
| Total | 72 (59.0%) | 50 (41.0%) |
Fertility by Education in Hitchcock
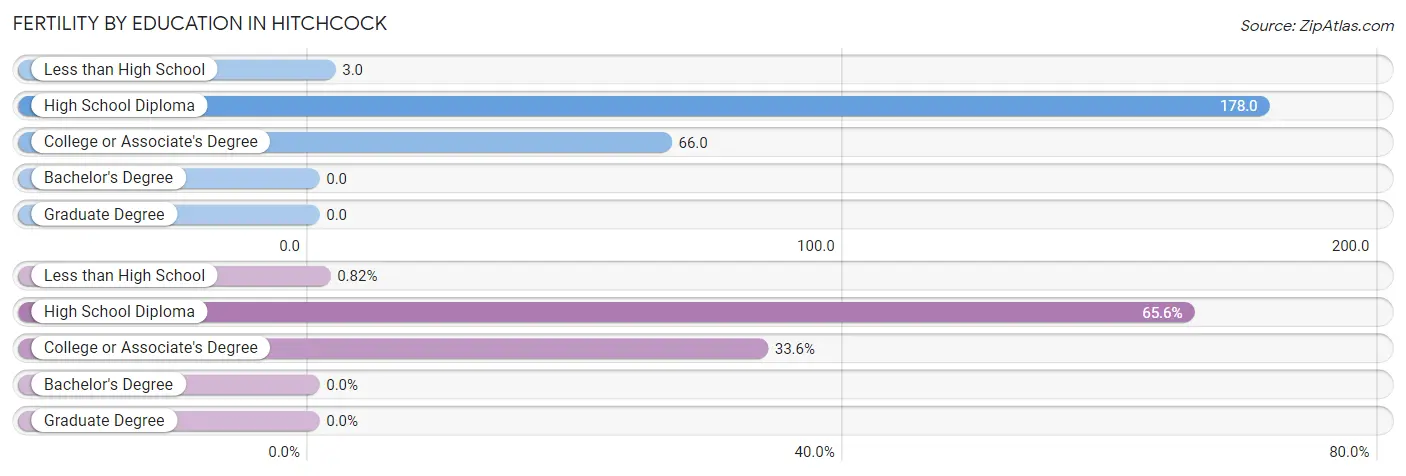
| Educational Attainment | Women with Births | Births / 1,000 Women |
| Less than High School | 1 (0.8%) | 3.0 |
| High School Diploma | 80 (65.6%) | 178.0 |
| College or Associate's Degree | 41 (33.6%) | 66.0 |
| Bachelor's Degree | 0 (0.0%) | 0.0 |
| Graduate Degree | 0 (0.0%) | 0.0 |
| Total | 122 (100.0%) | 73.0 |
Fertility by Education by Marriage Status in Hitchcock
41.0% of women with births in Hitchcock are unmarried. Women with the educational attainment of less than high school are most likely to be married with 100.0% of them married at childbirth, while women with the educational attainment of high school diploma are least likely to be married with 62.5% of them unmarried at childbirth.
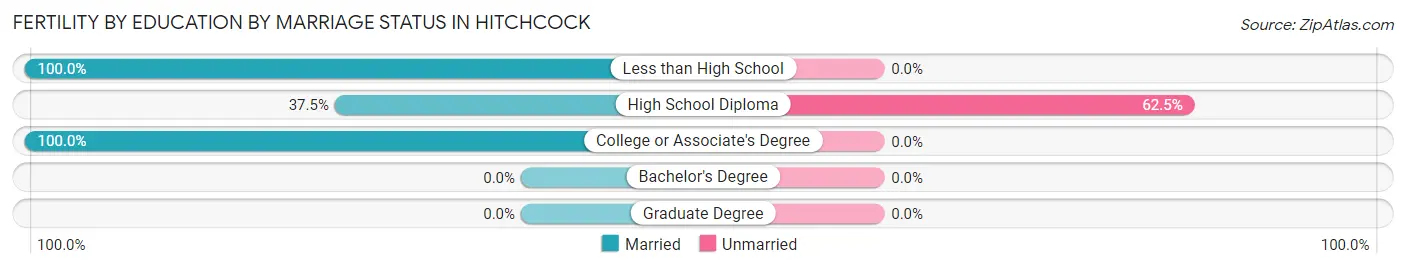
| Educational Attainment | Married | Unmarried |
| Less than High School | 1 (100.0%) | 0 (0.0%) |
| High School Diploma | 30 (37.5%) | 50 (62.5%) |
| College or Associate's Degree | 41 (100.0%) | 0 (0.0%) |
| Bachelor's Degree | 0 (0.0%) | 0 (0.0%) |
| Graduate Degree | 0 (0.0%) | 0 (0.0%) |
| Total | 72 (59.0%) | 50 (41.0%) |
Employment Characteristics in Hitchcock
Employment by Class of Employer in Hitchcock
Among the 3,279 employed individuals in Hitchcock, private company employees (2,226 | 67.9%), not-for-profit organizations (308 | 9.4%), and local government employees (279 | 8.5%) make up the most common classes of employment.
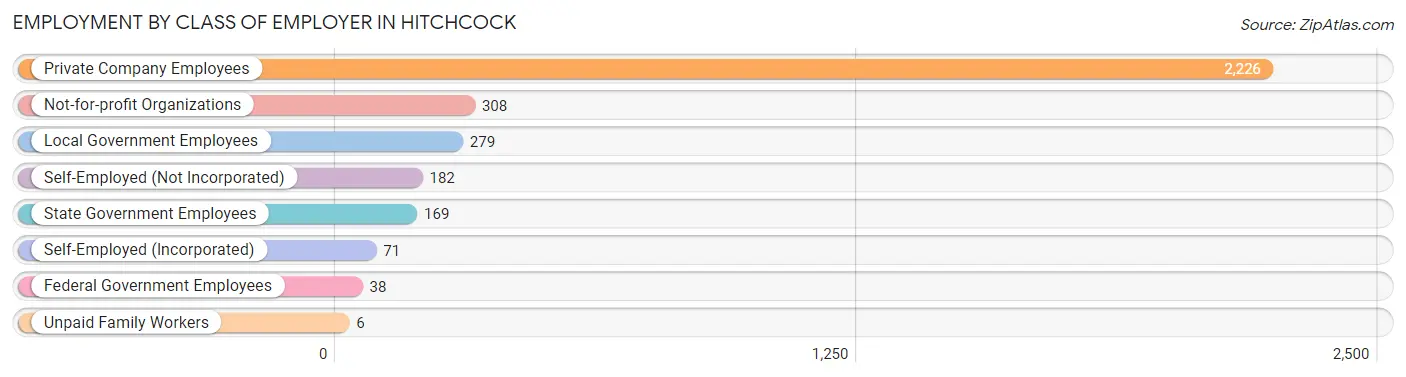
| Employer Class | # Employees | % Employees |
| Private Company Employees | 2,226 | 67.9% |
| Self-Employed (Incorporated) | 71 | 2.2% |
| Self-Employed (Not Incorporated) | 182 | 5.6% |
| Not-for-profit Organizations | 308 | 9.4% |
| Local Government Employees | 279 | 8.5% |
| State Government Employees | 169 | 5.1% |
| Federal Government Employees | 38 | 1.2% |
| Unpaid Family Workers | 6 | 0.2% |
| Total | 3,279 | 100.0% |
Employment Status by Age in Hitchcock
According to the labor force statistics for Hitchcock, out of the total population over 16 years of age (5,521), 63.7% or 3,517 individuals are in the labor force, with 5.1% or 179 of them unemployed. The age group with the highest labor force participation rate is 30 to 34 years, with 85.9% or 457 individuals in the labor force. Within the labor force, the 16 to 19 years age range has the highest percentage of unemployed individuals, with 13.3% or 30 of them being unemployed.
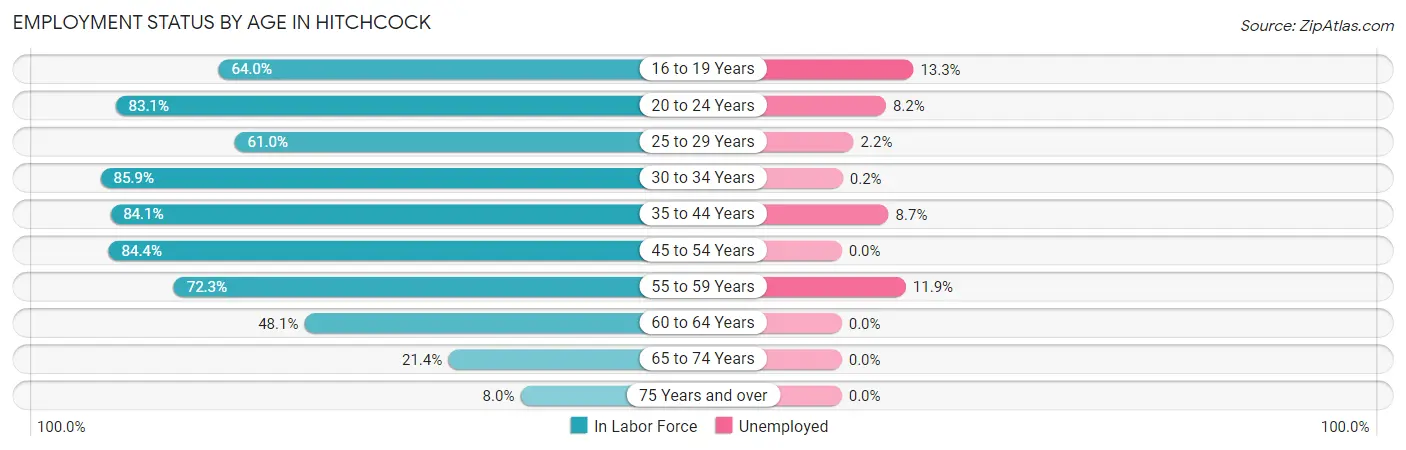
| Age Bracket | In Labor Force | Unemployed |
| 16 to 19 Years | 226 (64.0%) | 30 (13.3%) |
| 20 to 24 Years | 428 (83.1%) | 35 (8.2%) |
| 25 to 29 Years | 224 (61.0%) | 5 (2.2%) |
| 30 to 34 Years | 457 (85.9%) | 1 (0.2%) |
| 35 to 44 Years | 870 (84.1%) | 76 (8.7%) |
| 45 to 54 Years | 617 (84.4%) | 0 (0.0%) |
| 55 to 59 Years | 269 (72.3%) | 32 (11.9%) |
| 60 to 64 Years | 231 (48.1%) | 0 (0.0%) |
| 65 to 74 Years | 166 (21.4%) | 0 (0.0%) |
| 75 Years and over | 29 (8.0%) | 0 (0.0%) |
| Total | 3,517 (63.7%) | 179 (5.1%) |
Employment Status by Educational Attainment in Hitchcock
According to labor force statistics for Hitchcock, 75.9% of individuals (2,669) out of the total population between 25 and 64 years of age (3,516) are in the labor force, with 4.3% or 115 of them being unemployed. The group with the highest labor force participation rate are those with the educational attainment of bachelor's degree or higher, with 86.5% or 602 individuals in the labor force. Within the labor force, individuals with less than high school education have the highest percentage of unemployment, with 8.5% or 36 of them being unemployed.
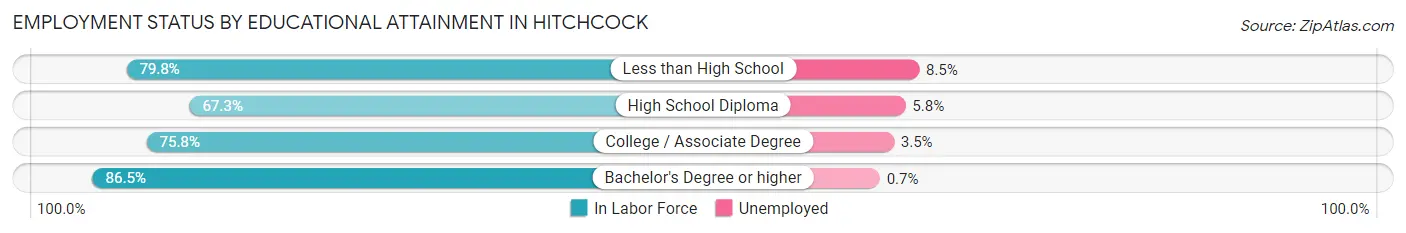
| Educational Attainment | In Labor Force | Unemployed |
| Less than High School | 423 (79.8%) | 45 (8.5%) |
| High School Diploma | 728 (67.3%) | 63 (5.8%) |
| College / Associate Degree | 916 (75.8%) | 42 (3.5%) |
| Bachelor's Degree or higher | 602 (86.5%) | 5 (0.7%) |
| Total | 2,669 (75.9%) | 151 (4.3%) |
Employment Occupations by Sex in Hitchcock
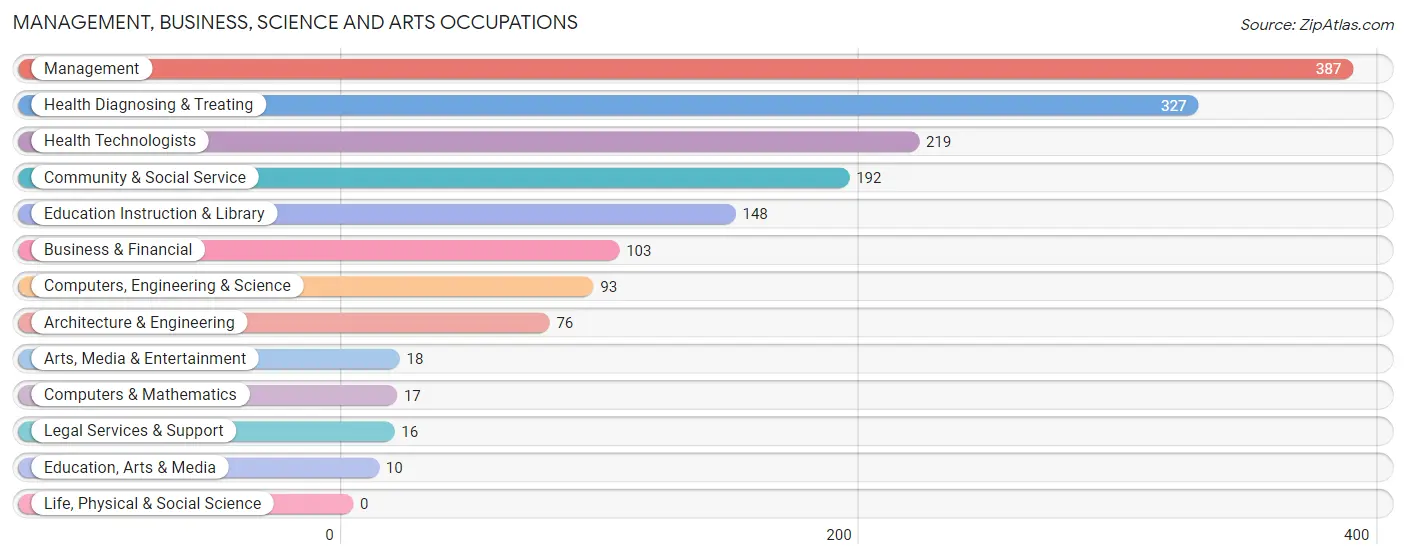
Management, Business, Science and Arts Occupations
The most common Management, Business, Science and Arts occupations in Hitchcock are Management (387 | 11.7%), Health Diagnosing & Treating (327 | 9.9%), Health Technologists (219 | 6.6%), Community & Social Service (192 | 5.8%), and Education Instruction & Library (148 | 4.5%).
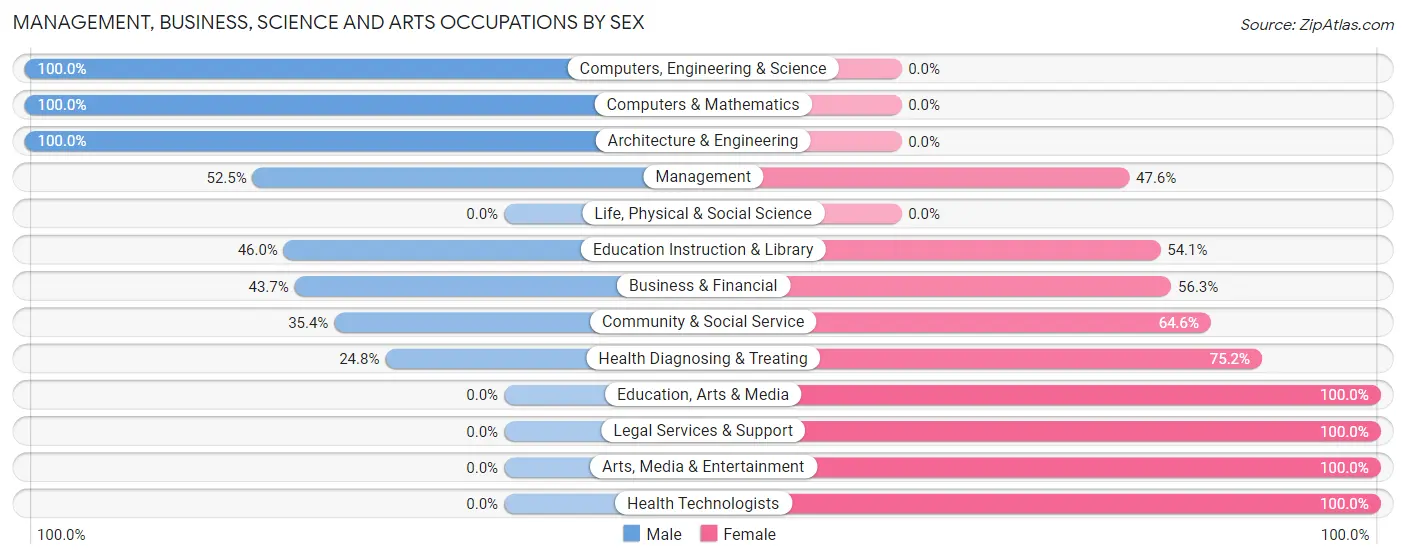
Management, Business, Science and Arts Occupations by Sex
Within the Management, Business, Science and Arts occupations in Hitchcock, the most male-oriented occupations are Computers, Engineering & Science (100.0%), Computers & Mathematics (100.0%), and Architecture & Engineering (100.0%), while the most female-oriented occupations are Education, Arts & Media (100.0%), Legal Services & Support (100.0%), and Arts, Media & Entertainment (100.0%).
| Occupation | Male | Female |
| Management | 203 (52.4%) | 184 (47.5%) |
| Business & Financial | 45 (43.7%) | 58 (56.3%) |
| Computers, Engineering & Science | 93 (100.0%) | 0 (0.0%) |
| Computers & Mathematics | 17 (100.0%) | 0 (0.0%) |
| Architecture & Engineering | 76 (100.0%) | 0 (0.0%) |
| Life, Physical & Social Science | 0 (0.0%) | 0 (0.0%) |
| Community & Social Service | 68 (35.4%) | 124 (64.6%) |
| Education, Arts & Media | 0 (0.0%) | 10 (100.0%) |
| Legal Services & Support | 0 (0.0%) | 16 (100.0%) |
| Education Instruction & Library | 68 (46.0%) | 80 (54.0%) |
| Arts, Media & Entertainment | 0 (0.0%) | 18 (100.0%) |
| Health Diagnosing & Treating | 81 (24.8%) | 246 (75.2%) |
| Health Technologists | 0 (0.0%) | 219 (100.0%) |
| Total (Category) | 490 (44.5%) | 612 (55.5%) |
| Total (Overall) | 1,745 (52.7%) | 1,568 (47.3%) |
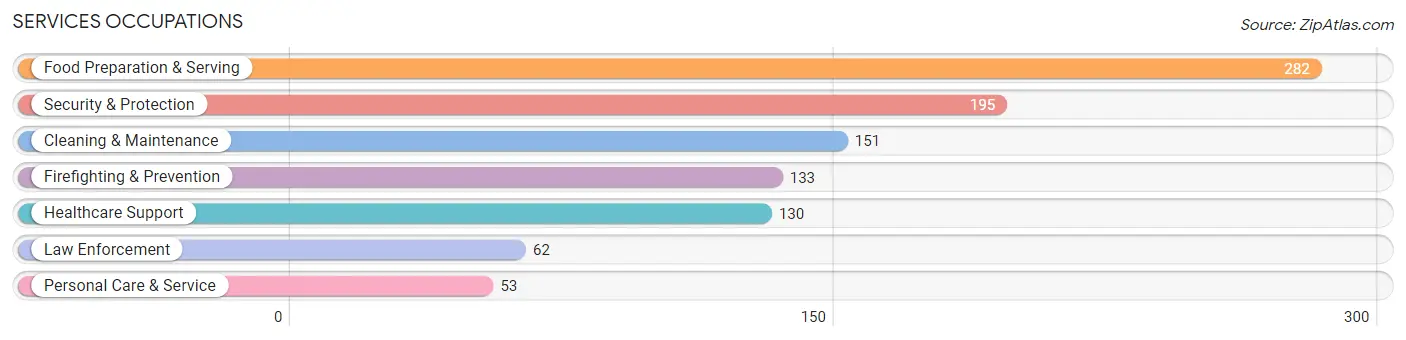
Services Occupations
The most common Services occupations in Hitchcock are Food Preparation & Serving (282 | 8.5%), Security & Protection (195 | 5.9%), Cleaning & Maintenance (151 | 4.6%), Firefighting & Prevention (133 | 4.0%), and Healthcare Support (130 | 3.9%).
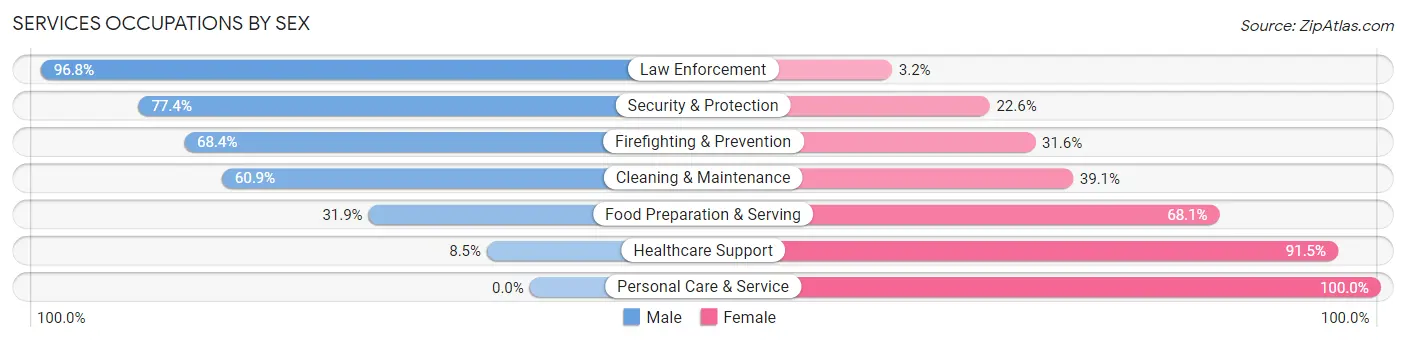
Services Occupations by Sex
Within the Services occupations in Hitchcock, the most male-oriented occupations are Law Enforcement (96.8%), Security & Protection (77.4%), and Firefighting & Prevention (68.4%), while the most female-oriented occupations are Personal Care & Service (100.0%), Healthcare Support (91.5%), and Food Preparation & Serving (68.1%).
| Occupation | Male | Female |
| Healthcare Support | 11 (8.5%) | 119 (91.5%) |
| Security & Protection | 151 (77.4%) | 44 (22.6%) |
| Firefighting & Prevention | 91 (68.4%) | 42 (31.6%) |
| Law Enforcement | 60 (96.8%) | 2 (3.2%) |
| Food Preparation & Serving | 90 (31.9%) | 192 (68.1%) |
| Cleaning & Maintenance | 92 (60.9%) | 59 (39.1%) |
| Personal Care & Service | 0 (0.0%) | 53 (100.0%) |
| Total (Category) | 344 (42.4%) | 467 (57.6%) |
| Total (Overall) | 1,745 (52.7%) | 1,568 (47.3%) |
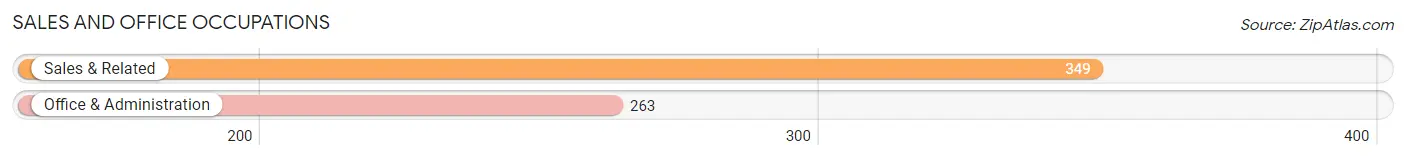
Sales and Office Occupations
The most common Sales and Office occupations in Hitchcock are Sales & Related (349 | 10.5%), and Office & Administration (263 | 7.9%).
Sales and Office Occupations by Sex
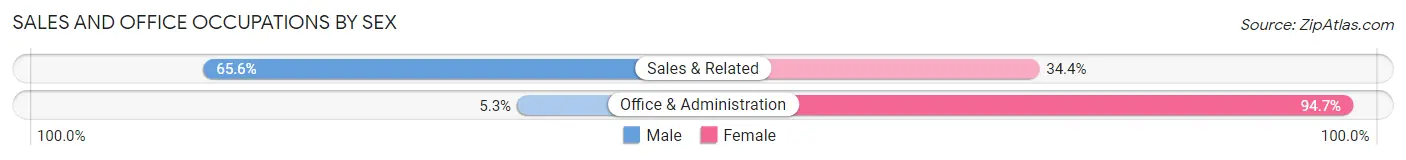
| Occupation | Male | Female |
| Sales & Related | 229 (65.6%) | 120 (34.4%) |
| Office & Administration | 14 (5.3%) | 249 (94.7%) |
| Total (Category) | 243 (39.7%) | 369 (60.3%) |
| Total (Overall) | 1,745 (52.7%) | 1,568 (47.3%) |
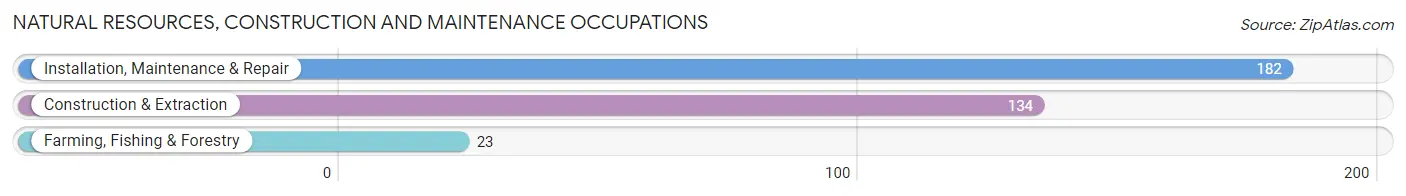
Natural Resources, Construction and Maintenance Occupations
The most common Natural Resources, Construction and Maintenance occupations in Hitchcock are Installation, Maintenance & Repair (182 | 5.5%), Construction & Extraction (134 | 4.0%), and Farming, Fishing & Forestry (23 | 0.7%).
Natural Resources, Construction and Maintenance Occupations by Sex
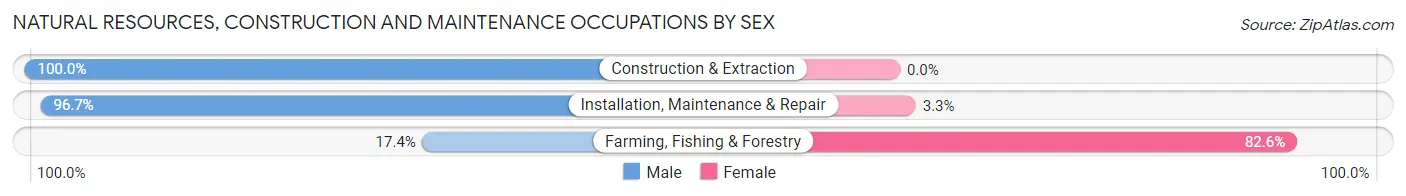
| Occupation | Male | Female |
| Farming, Fishing & Forestry | 4 (17.4%) | 19 (82.6%) |
| Construction & Extraction | 134 (100.0%) | 0 (0.0%) |
| Installation, Maintenance & Repair | 176 (96.7%) | 6 (3.3%) |
| Total (Category) | 314 (92.6%) | 25 (7.4%) |
| Total (Overall) | 1,745 (52.7%) | 1,568 (47.3%) |
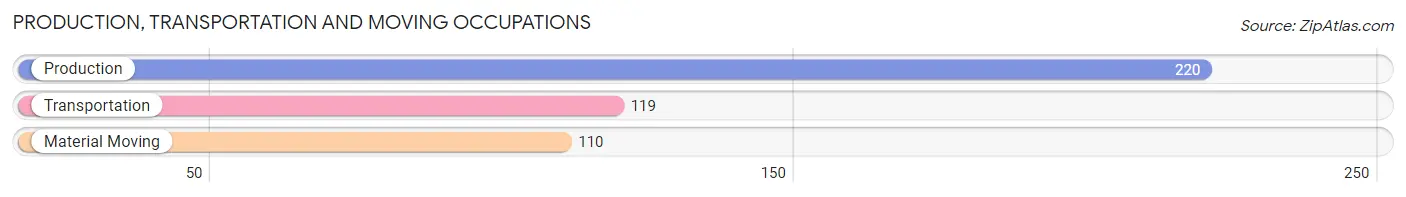
Production, Transportation and Moving Occupations
The most common Production, Transportation and Moving occupations in Hitchcock are Production (220 | 6.6%), Transportation (119 | 3.6%), and Material Moving (110 | 3.3%).
Production, Transportation and Moving Occupations by Sex
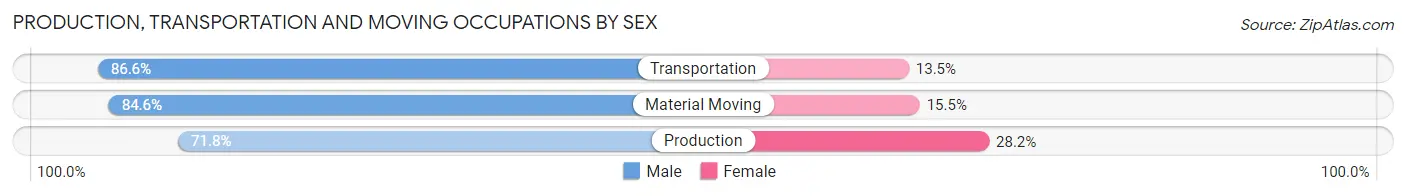
| Occupation | Male | Female |
| Production | 158 (71.8%) | 62 (28.2%) |
| Transportation | 103 (86.6%) | 16 (13.5%) |
| Material Moving | 93 (84.6%) | 17 (15.4%) |
| Total (Category) | 354 (78.8%) | 95 (21.2%) |
| Total (Overall) | 1,745 (52.7%) | 1,568 (47.3%) |
Employment Industries by Sex in Hitchcock
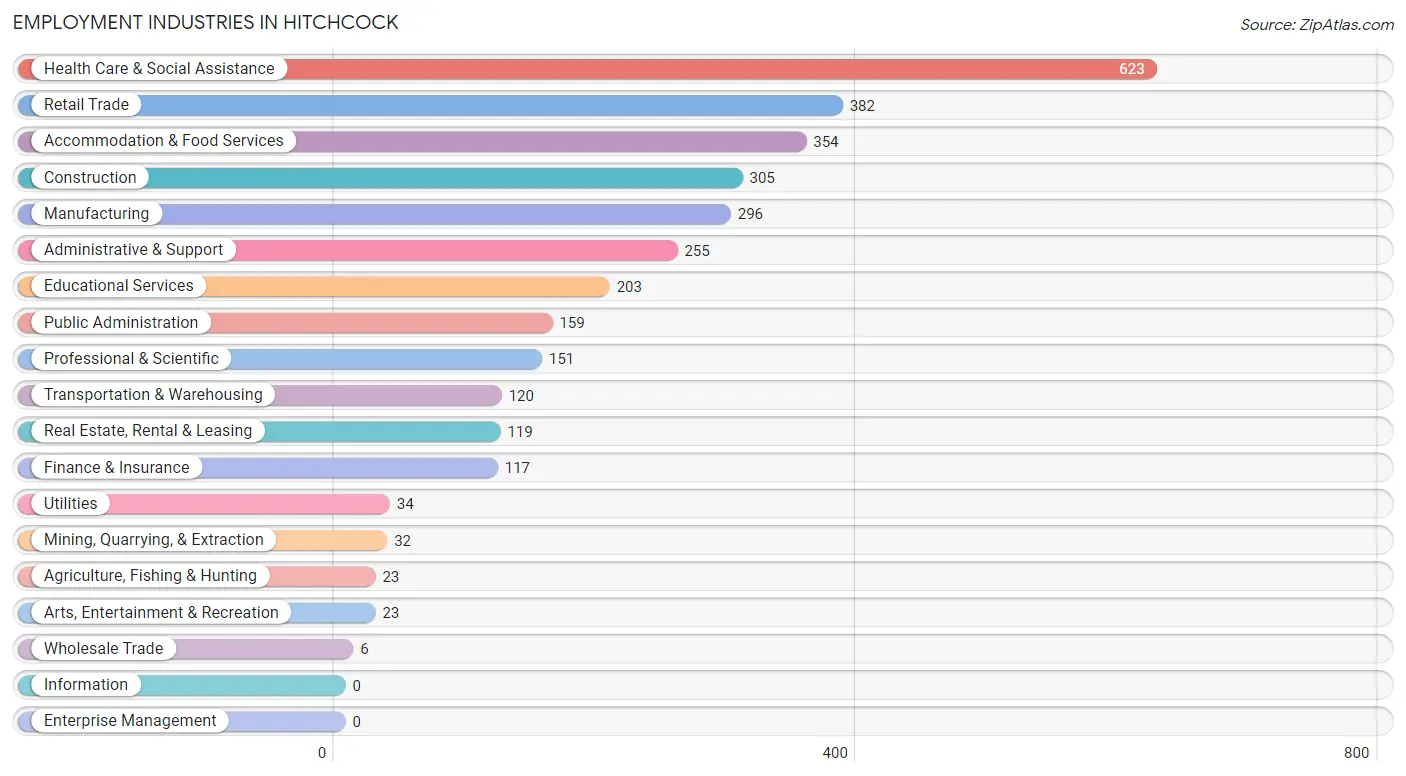
Employment Industries in Hitchcock
The major employment industries in Hitchcock include Health Care & Social Assistance (623 | 18.8%), Retail Trade (382 | 11.5%), Accommodation & Food Services (354 | 10.7%), Construction (305 | 9.2%), and Manufacturing (296 | 8.9%).
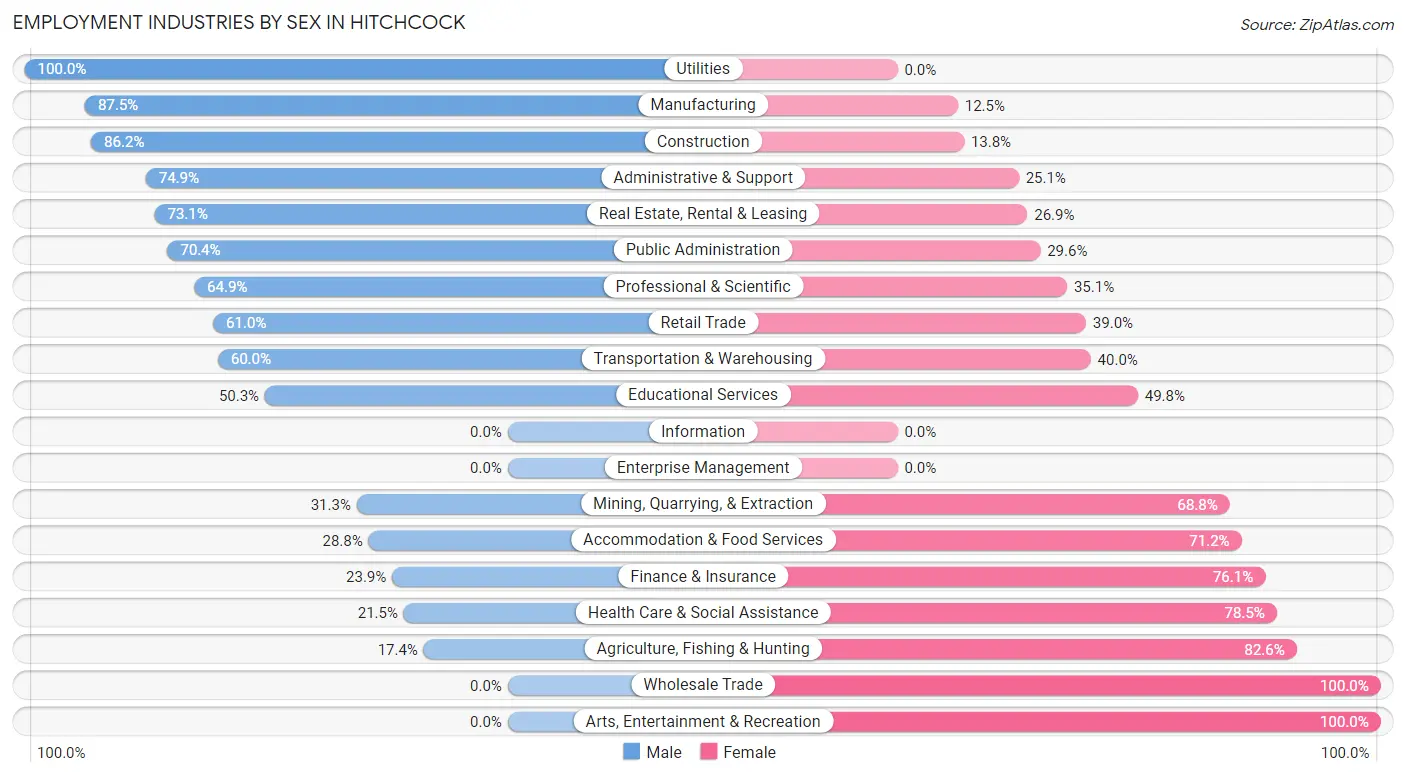
Employment Industries by Sex in Hitchcock
The Hitchcock industries that see more men than women are Utilities (100.0%), Manufacturing (87.5%), and Construction (86.2%), whereas the industries that tend to have a higher number of women are Wholesale Trade (100.0%), Arts, Entertainment & Recreation (100.0%), and Agriculture, Fishing & Hunting (82.6%).
| Industry | Male | Female |
| Agriculture, Fishing & Hunting | 4 (17.4%) | 19 (82.6%) |
| Mining, Quarrying, & Extraction | 10 (31.2%) | 22 (68.8%) |
| Construction | 263 (86.2%) | 42 (13.8%) |
| Manufacturing | 259 (87.5%) | 37 (12.5%) |
| Wholesale Trade | 0 (0.0%) | 6 (100.0%) |
| Retail Trade | 233 (61.0%) | 149 (39.0%) |
| Transportation & Warehousing | 72 (60.0%) | 48 (40.0%) |
| Utilities | 34 (100.0%) | 0 (0.0%) |
| Information | 0 (0.0%) | 0 (0.0%) |
| Finance & Insurance | 28 (23.9%) | 89 (76.1%) |
| Real Estate, Rental & Leasing | 87 (73.1%) | 32 (26.9%) |
| Professional & Scientific | 98 (64.9%) | 53 (35.1%) |
| Enterprise Management | 0 (0.0%) | 0 (0.0%) |
| Administrative & Support | 191 (74.9%) | 64 (25.1%) |
| Educational Services | 102 (50.2%) | 101 (49.7%) |
| Health Care & Social Assistance | 134 (21.5%) | 489 (78.5%) |
| Arts, Entertainment & Recreation | 0 (0.0%) | 23 (100.0%) |
| Accommodation & Food Services | 102 (28.8%) | 252 (71.2%) |
| Public Administration | 112 (70.4%) | 47 (29.6%) |
| Total | 1,745 (52.7%) | 1,568 (47.3%) |
Education in Hitchcock
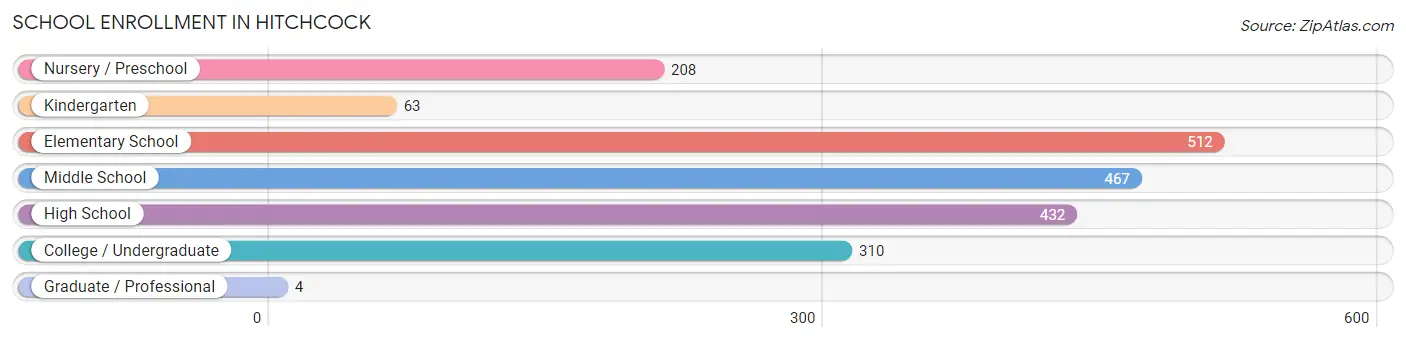
School Enrollment in Hitchcock
The most common levels of schooling among the 1,996 students in Hitchcock are elementary school (512 | 25.7%), middle school (467 | 23.4%), and high school (432 | 21.6%).
| School Level | # Students | % Students |
| Nursery / Preschool | 208 | 10.4% |
| Kindergarten | 63 | 3.2% |
| Elementary School | 512 | 25.7% |
| Middle School | 467 | 23.4% |
| High School | 432 | 21.6% |
| College / Undergraduate | 310 | 15.5% |
| Graduate / Professional | 4 | 0.2% |
| Total | 1,996 | 100.0% |
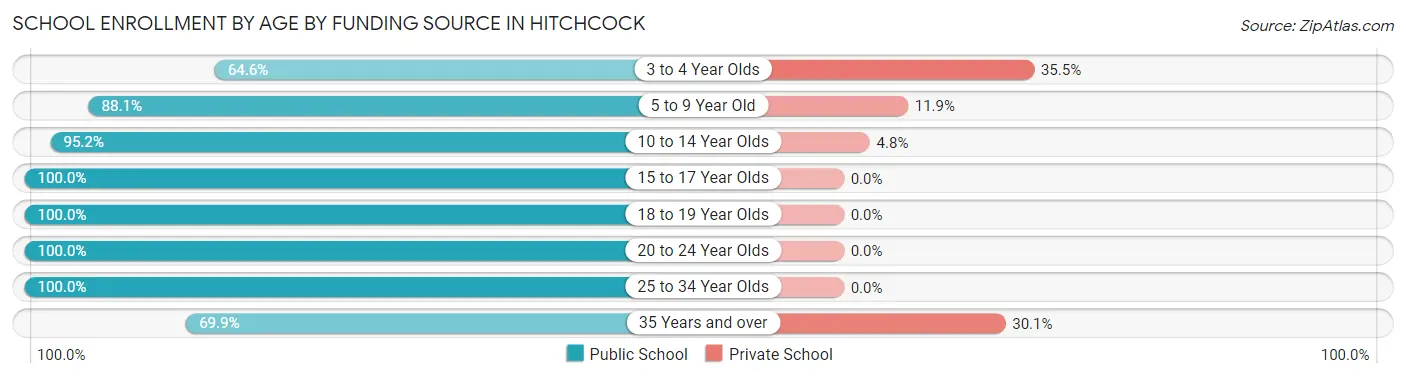
School Enrollment by Age by Funding Source in Hitchcock
Out of a total of 1,996 students who are enrolled in schools in Hitchcock, 170 (8.5%) attend a private institution, while the remaining 1,826 (91.5%) are enrolled in public schools. The age group of 3 to 4 year olds has the highest likelihood of being enrolled in private schools, with 39 (35.4% in the age bracket) enrolled. Conversely, the age group of 15 to 17 year olds has the lowest likelihood of being enrolled in a private school, with 286 (100.0% in the age bracket) attending a public institution.
| Age Bracket | Public School | Private School |
| 3 to 4 Year Olds | 71 (64.5%) | 39 (35.4%) |
| 5 to 9 Year Old | 553 (88.1%) | 75 (11.9%) |
| 10 to 14 Year Olds | 550 (95.2%) | 28 (4.8%) |
| 15 to 17 Year Olds | 286 (100.0%) | 0 (0.0%) |
| 18 to 19 Year Olds | 80 (100.0%) | 0 (0.0%) |
| 20 to 24 Year Olds | 145 (100.0%) | 0 (0.0%) |
| 25 to 34 Year Olds | 76 (100.0%) | 0 (0.0%) |
| 35 Years and over | 65 (69.9%) | 28 (30.1%) |
| Total | 1,826 (91.5%) | 170 (8.5%) |
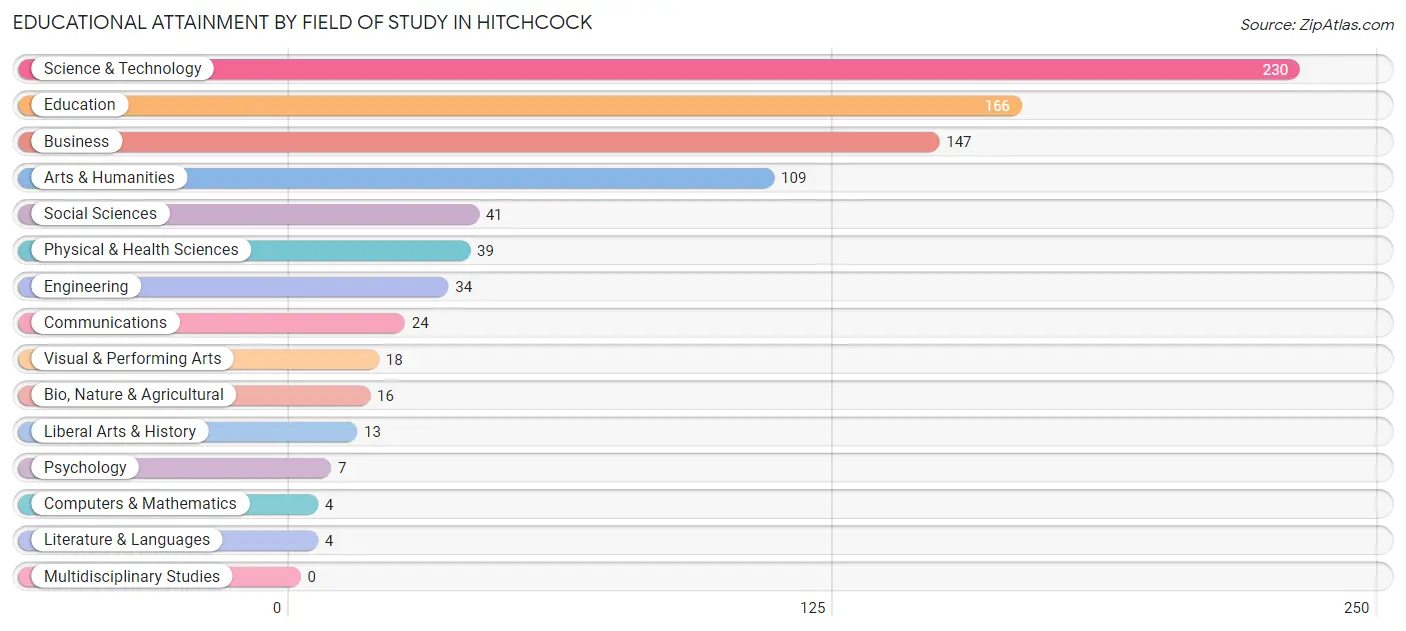
Educational Attainment by Field of Study in Hitchcock
Science & technology (230 | 27.0%), education (166 | 19.5%), business (147 | 17.2%), arts & humanities (109 | 12.8%), and social sciences (41 | 4.8%) are the most common fields of study among 852 individuals in Hitchcock who have obtained a bachelor's degree or higher.
| Field of Study | # Graduates | % Graduates |
| Computers & Mathematics | 4 | 0.5% |
| Bio, Nature & Agricultural | 16 | 1.9% |
| Physical & Health Sciences | 39 | 4.6% |
| Psychology | 7 | 0.8% |
| Social Sciences | 41 | 4.8% |
| Engineering | 34 | 4.0% |
| Multidisciplinary Studies | 0 | 0.0% |
| Science & Technology | 230 | 27.0% |
| Business | 147 | 17.2% |
| Education | 166 | 19.5% |
| Literature & Languages | 4 | 0.5% |
| Liberal Arts & History | 13 | 1.5% |
| Visual & Performing Arts | 18 | 2.1% |
| Communications | 24 | 2.8% |
| Arts & Humanities | 109 | 12.8% |
| Total | 852 | 100.0% |
Transportation & Commute in Hitchcock
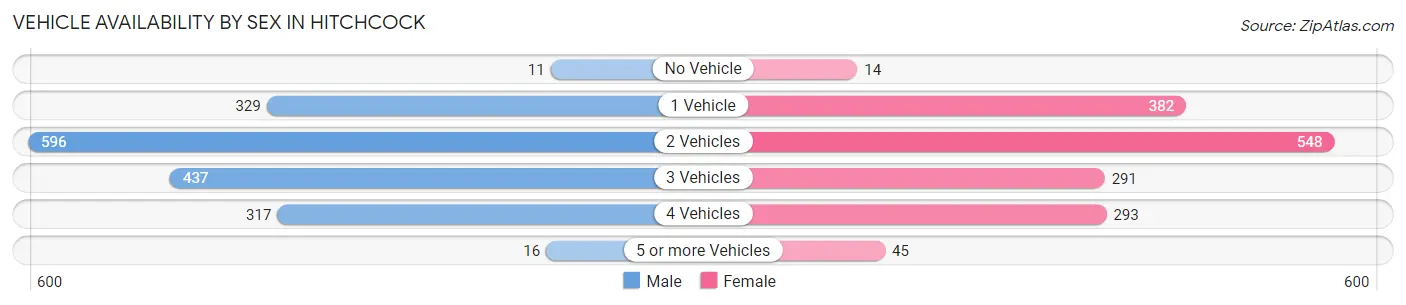
Vehicle Availability by Sex in Hitchcock
The most prevalent vehicle ownership categories in Hitchcock are males with 2 vehicles (596, accounting for 34.9%) and females with 2 vehicles (548, making up 37.9%).
| Vehicles Available | Male | Female |
| No Vehicle | 11 (0.6%) | 14 (0.9%) |
| 1 Vehicle | 329 (19.3%) | 382 (24.3%) |
| 2 Vehicles | 596 (34.9%) | 548 (34.8%) |
| 3 Vehicles | 437 (25.6%) | 291 (18.5%) |
| 4 Vehicles | 317 (18.6%) | 293 (18.6%) |
| 5 or more Vehicles | 16 (0.9%) | 45 (2.9%) |
| Total | 1,706 (100.0%) | 1,573 (100.0%) |
Commute Time in Hitchcock
The most frequently occuring commute durations in Hitchcock are 20 to 24 minutes (695 commuters, 21.9%), 30 to 34 minutes (413 commuters, 13.0%), and 10 to 14 minutes (406 commuters, 12.8%).
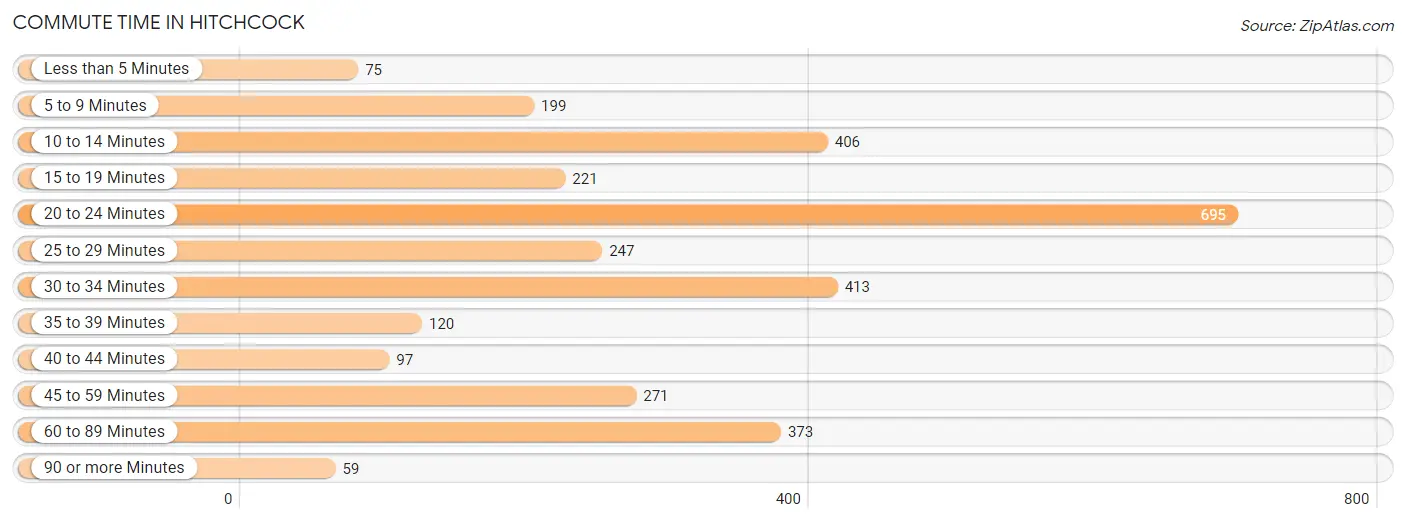
| Commute Time | # Commuters | % Commuters |
| Less than 5 Minutes | 75 | 2.4% |
| 5 to 9 Minutes | 199 | 6.3% |
| 10 to 14 Minutes | 406 | 12.8% |
| 15 to 19 Minutes | 221 | 7.0% |
| 20 to 24 Minutes | 695 | 21.9% |
| 25 to 29 Minutes | 247 | 7.8% |
| 30 to 34 Minutes | 413 | 13.0% |
| 35 to 39 Minutes | 120 | 3.8% |
| 40 to 44 Minutes | 97 | 3.0% |
| 45 to 59 Minutes | 271 | 8.5% |
| 60 to 89 Minutes | 373 | 11.7% |
| 90 or more Minutes | 59 | 1.9% |
Commute Time by Sex in Hitchcock
The most common commute times in Hitchcock are 20 to 24 minutes (414 commuters, 24.7%) for males and 20 to 24 minutes (281 commuters, 18.7%) for females.
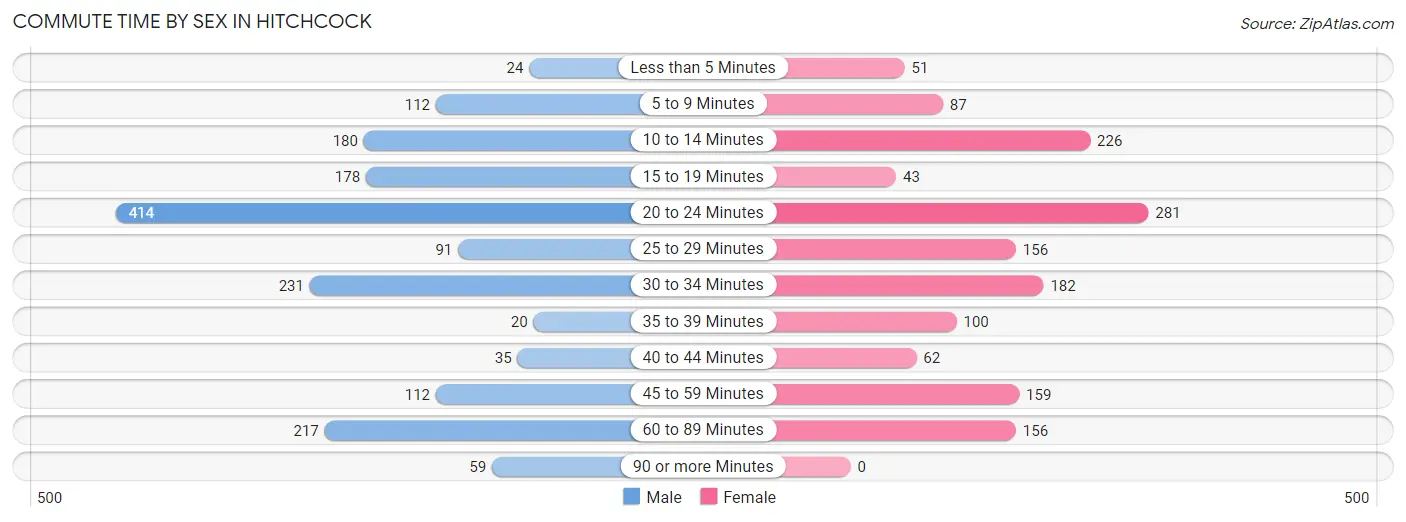
| Commute Time | Male | Female |
| Less than 5 Minutes | 24 (1.4%) | 51 (3.4%) |
| 5 to 9 Minutes | 112 (6.7%) | 87 (5.8%) |
| 10 to 14 Minutes | 180 (10.8%) | 226 (15.0%) |
| 15 to 19 Minutes | 178 (10.6%) | 43 (2.9%) |
| 20 to 24 Minutes | 414 (24.7%) | 281 (18.7%) |
| 25 to 29 Minutes | 91 (5.4%) | 156 (10.4%) |
| 30 to 34 Minutes | 231 (13.8%) | 182 (12.1%) |
| 35 to 39 Minutes | 20 (1.2%) | 100 (6.7%) |
| 40 to 44 Minutes | 35 (2.1%) | 62 (4.1%) |
| 45 to 59 Minutes | 112 (6.7%) | 159 (10.6%) |
| 60 to 89 Minutes | 217 (13.0%) | 156 (10.4%) |
| 90 or more Minutes | 59 (3.5%) | 0 (0.0%) |
Time of Departure to Work by Sex in Hitchcock
The most frequent times of departure to work in Hitchcock are 7:00 AM to 7:29 AM (338, 20.2%) for males and 7:00 AM to 7:29 AM (287, 19.1%) for females.
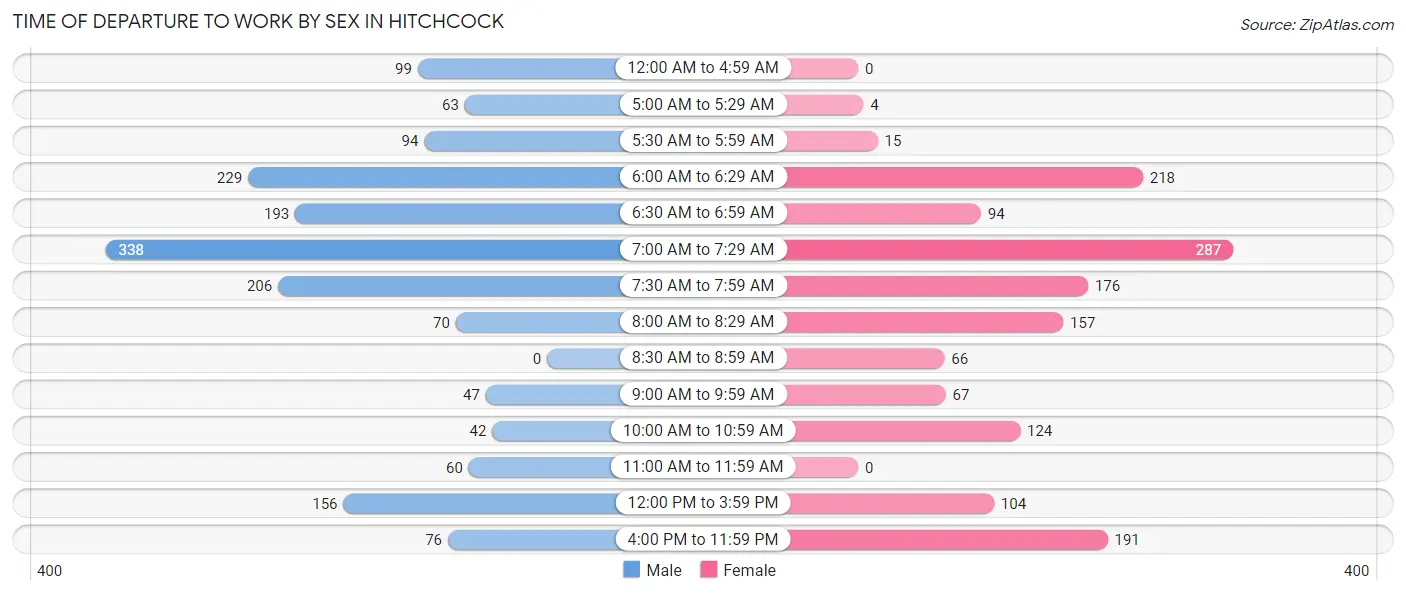
| Time of Departure | Male | Female |
| 12:00 AM to 4:59 AM | 99 (5.9%) | 0 (0.0%) |
| 5:00 AM to 5:29 AM | 63 (3.8%) | 4 (0.3%) |
| 5:30 AM to 5:59 AM | 94 (5.6%) | 15 (1.0%) |
| 6:00 AM to 6:29 AM | 229 (13.7%) | 218 (14.5%) |
| 6:30 AM to 6:59 AM | 193 (11.5%) | 94 (6.2%) |
| 7:00 AM to 7:29 AM | 338 (20.2%) | 287 (19.1%) |
| 7:30 AM to 7:59 AM | 206 (12.3%) | 176 (11.7%) |
| 8:00 AM to 8:29 AM | 70 (4.2%) | 157 (10.4%) |
| 8:30 AM to 8:59 AM | 0 (0.0%) | 66 (4.4%) |
| 9:00 AM to 9:59 AM | 47 (2.8%) | 67 (4.5%) |
| 10:00 AM to 10:59 AM | 42 (2.5%) | 124 (8.3%) |
| 11:00 AM to 11:59 AM | 60 (3.6%) | 0 (0.0%) |
| 12:00 PM to 3:59 PM | 156 (9.3%) | 104 (6.9%) |
| 4:00 PM to 11:59 PM | 76 (4.5%) | 191 (12.7%) |
| Total | 1,673 (100.0%) | 1,503 (100.0%) |
Housing Occupancy in Hitchcock
Occupancy by Ownership in Hitchcock
Of the total 2,642 dwellings in Hitchcock, owner-occupied units account for 1,912 (72.4%), while renter-occupied units make up 730 (27.6%).
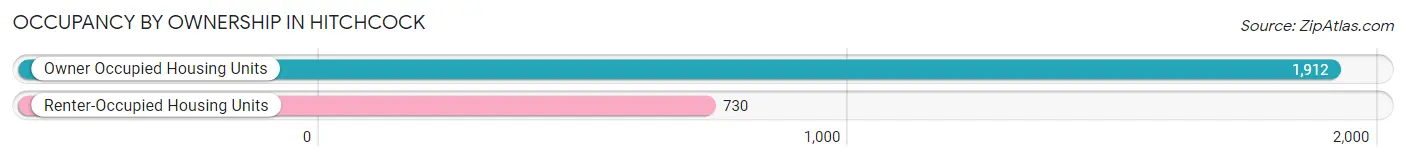
| Occupancy | # Housing Units | % Housing Units |
| Owner Occupied Housing Units | 1,912 | 72.4% |
| Renter-Occupied Housing Units | 730 | 27.6% |
| Total Occupied Housing Units | 2,642 | 100.0% |
Occupancy by Household Size in Hitchcock
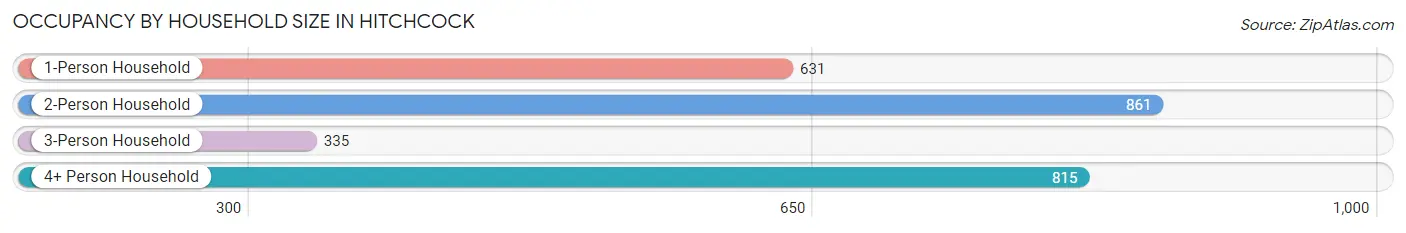
| Household Size | # Housing Units | % Housing Units |
| 1-Person Household | 631 | 23.9% |
| 2-Person Household | 861 | 32.6% |
| 3-Person Household | 335 | 12.7% |
| 4+ Person Household | 815 | 30.8% |
| Total Housing Units | 2,642 | 100.0% |
Occupancy by Ownership by Household Size in Hitchcock
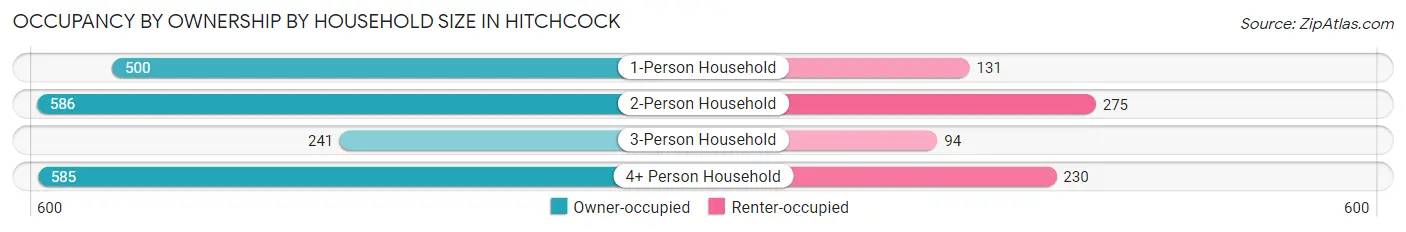
| Household Size | Owner-occupied | Renter-occupied |
| 1-Person Household | 500 (79.2%) | 131 (20.8%) |
| 2-Person Household | 586 (68.1%) | 275 (31.9%) |
| 3-Person Household | 241 (71.9%) | 94 (28.1%) |
| 4+ Person Household | 585 (71.8%) | 230 (28.2%) |
| Total Housing Units | 1,912 (72.4%) | 730 (27.6%) |
Occupancy by Educational Attainment in Hitchcock
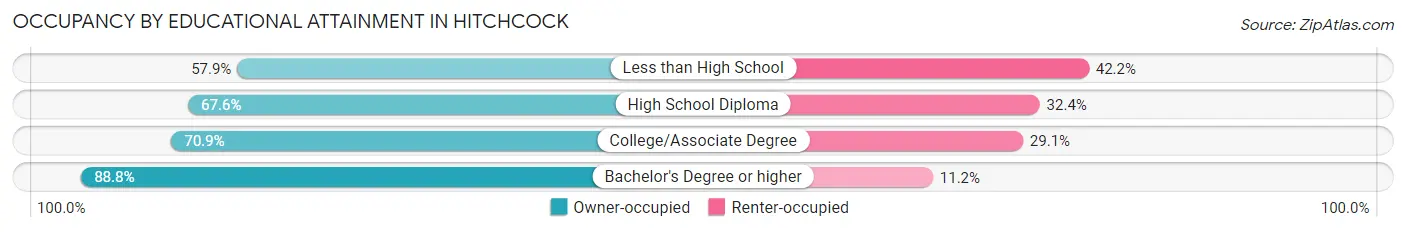
| Household Size | Owner-occupied | Renter-occupied |
| Less than High School | 151 (57.9%) | 110 (42.1%) |
| High School Diploma | 463 (67.6%) | 222 (32.4%) |
| College/Associate Degree | 824 (70.9%) | 338 (29.1%) |
| Bachelor's Degree or higher | 474 (88.8%) | 60 (11.2%) |
Occupancy by Age of Householder in Hitchcock
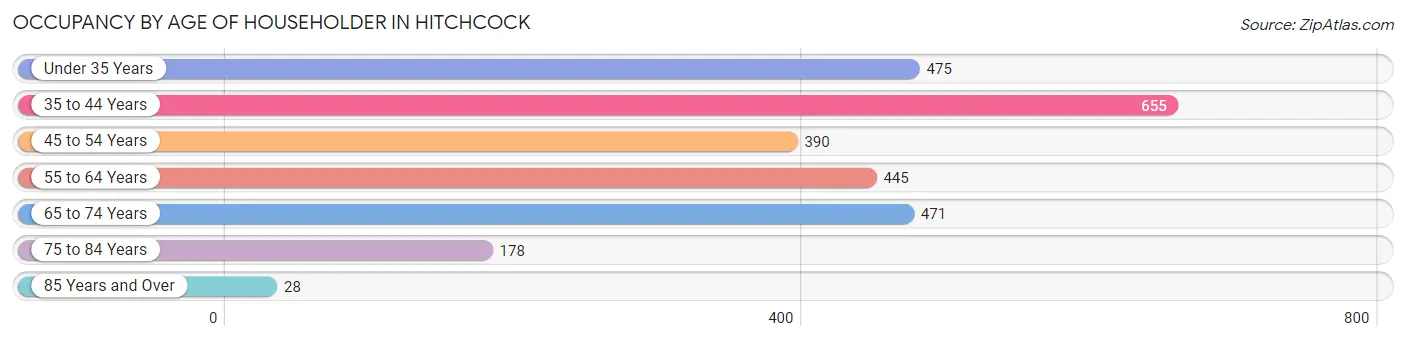
| Age Bracket | # Households | % Households |
| Under 35 Years | 475 | 18.0% |
| 35 to 44 Years | 655 | 24.8% |
| 45 to 54 Years | 390 | 14.8% |
| 55 to 64 Years | 445 | 16.8% |
| 65 to 74 Years | 471 | 17.8% |
| 75 to 84 Years | 178 | 6.7% |
| 85 Years and Over | 28 | 1.1% |
| Total | 2,642 | 100.0% |
Housing Finances in Hitchcock
Median Income by Occupancy in Hitchcock
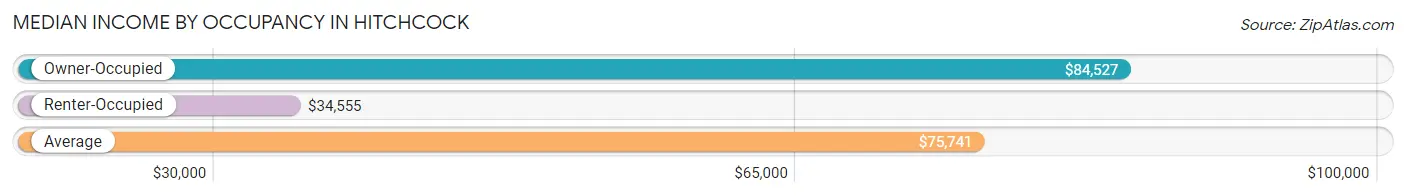
| Occupancy Type | # Households | Median Income |
| Owner-Occupied | 1,912 (72.4%) | $84,527 |
| Renter-Occupied | 730 (27.6%) | $34,555 |
| Average | 2,642 (100.0%) | $75,741 |
Occupancy by Householder Income Bracket in Hitchcock
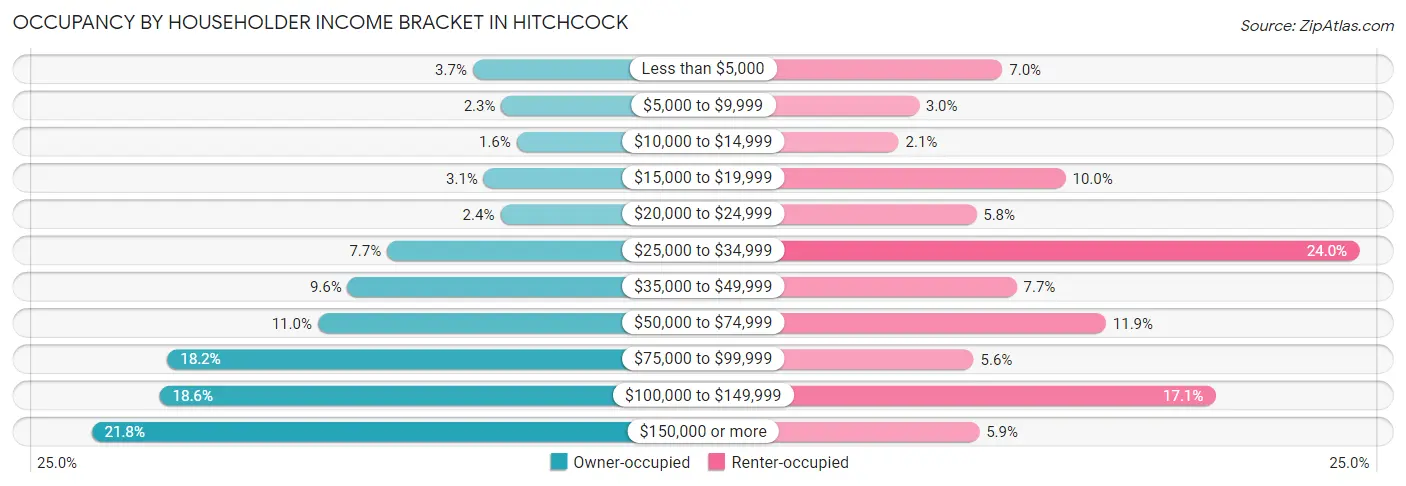
| Income Bracket | Owner-occupied | Renter-occupied |
| Less than $5,000 | 70 (3.7%) | 51 (7.0%) |
| $5,000 to $9,999 | 44 (2.3%) | 22 (3.0%) |
| $10,000 to $14,999 | 30 (1.6%) | 15 (2.1%) |
| $15,000 to $19,999 | 60 (3.1%) | 73 (10.0%) |
| $20,000 to $24,999 | 45 (2.4%) | 42 (5.8%) |
| $25,000 to $34,999 | 148 (7.7%) | 175 (24.0%) |
| $35,000 to $49,999 | 184 (9.6%) | 56 (7.7%) |
| $50,000 to $74,999 | 211 (11.0%) | 87 (11.9%) |
| $75,000 to $99,999 | 348 (18.2%) | 41 (5.6%) |
| $100,000 to $149,999 | 355 (18.6%) | 125 (17.1%) |
| $150,000 or more | 417 (21.8%) | 43 (5.9%) |
| Total | 1,912 (100.0%) | 730 (100.0%) |
Monthly Housing Cost Tiers in Hitchcock
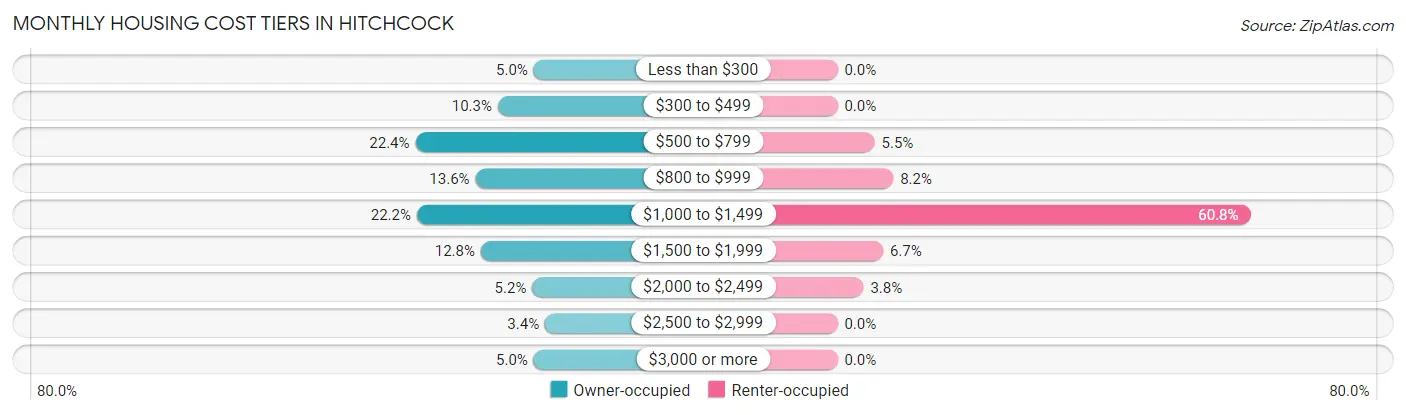
| Monthly Cost | Owner-occupied | Renter-occupied |
| Less than $300 | 96 (5.0%) | 0 (0.0%) |
| $300 to $499 | 197 (10.3%) | 0 (0.0%) |
| $500 to $799 | 429 (22.4%) | 40 (5.5%) |
| $800 to $999 | 260 (13.6%) | 60 (8.2%) |
| $1,000 to $1,499 | 425 (22.2%) | 444 (60.8%) |
| $1,500 to $1,999 | 245 (12.8%) | 49 (6.7%) |
| $2,000 to $2,499 | 100 (5.2%) | 28 (3.8%) |
| $2,500 to $2,999 | 64 (3.4%) | 0 (0.0%) |
| $3,000 or more | 96 (5.0%) | 0 (0.0%) |
| Total | 1,912 (100.0%) | 730 (100.0%) |
Physical Housing Characteristics in Hitchcock
Housing Structures in Hitchcock
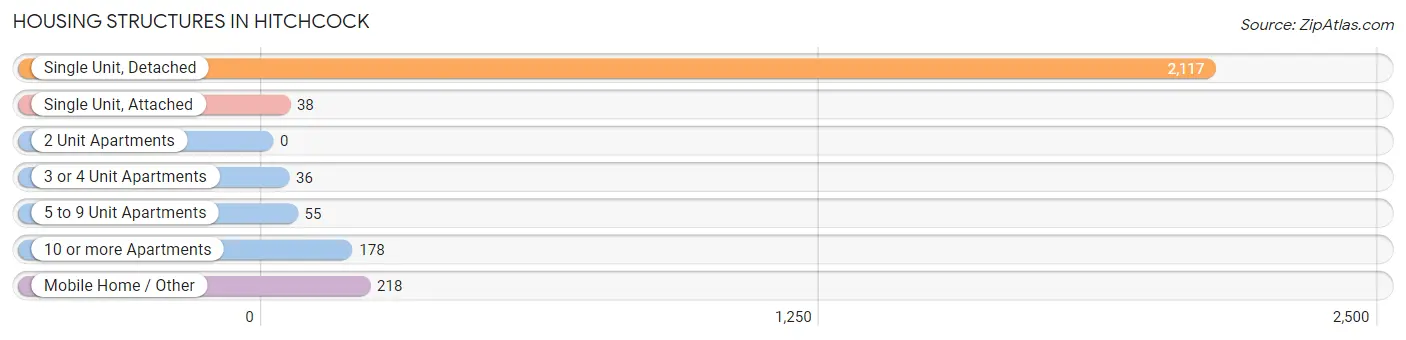
| Structure Type | # Housing Units | % Housing Units |
| Single Unit, Detached | 2,117 | 80.1% |
| Single Unit, Attached | 38 | 1.4% |
| 2 Unit Apartments | 0 | 0.0% |
| 3 or 4 Unit Apartments | 36 | 1.4% |
| 5 to 9 Unit Apartments | 55 | 2.1% |
| 10 or more Apartments | 178 | 6.7% |
| Mobile Home / Other | 218 | 8.3% |
| Total | 2,642 | 100.0% |
Housing Structures by Occupancy in Hitchcock
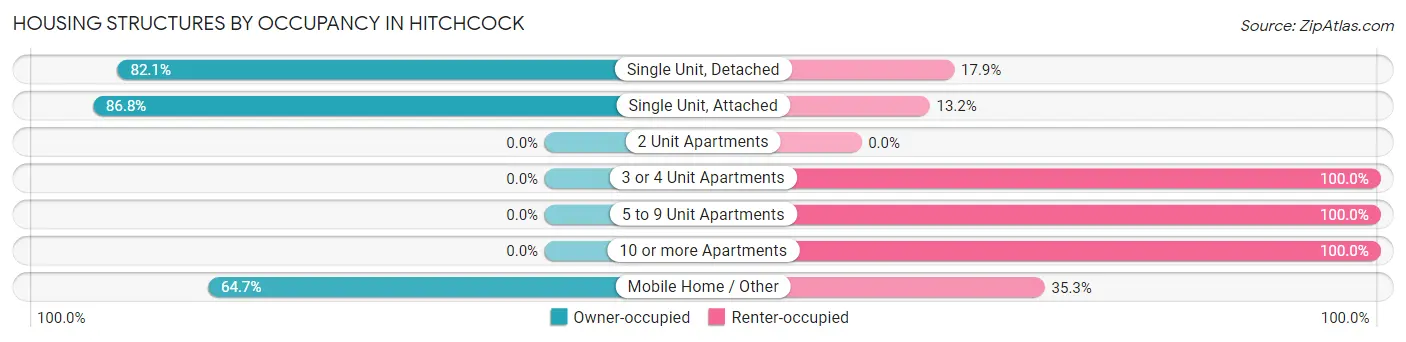
| Structure Type | Owner-occupied | Renter-occupied |
| Single Unit, Detached | 1,738 (82.1%) | 379 (17.9%) |
| Single Unit, Attached | 33 (86.8%) | 5 (13.2%) |
| 2 Unit Apartments | 0 (0.0%) | 0 (0.0%) |
| 3 or 4 Unit Apartments | 0 (0.0%) | 36 (100.0%) |
| 5 to 9 Unit Apartments | 0 (0.0%) | 55 (100.0%) |
| 10 or more Apartments | 0 (0.0%) | 178 (100.0%) |
| Mobile Home / Other | 141 (64.7%) | 77 (35.3%) |
| Total | 1,912 (72.4%) | 730 (27.6%) |
Housing Structures by Number of Rooms in Hitchcock
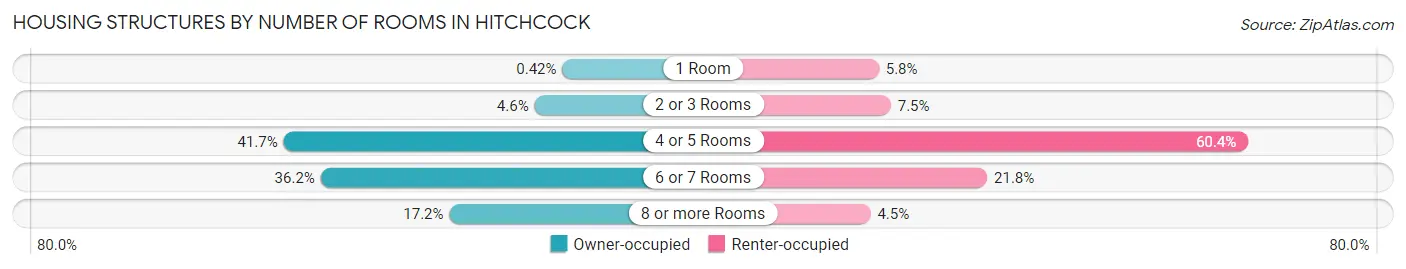
| Number of Rooms | Owner-occupied | Renter-occupied |
| 1 Room | 8 (0.4%) | 42 (5.8%) |
| 2 or 3 Rooms | 87 (4.5%) | 55 (7.5%) |
| 4 or 5 Rooms | 797 (41.7%) | 441 (60.4%) |
| 6 or 7 Rooms | 692 (36.2%) | 159 (21.8%) |
| 8 or more Rooms | 328 (17.2%) | 33 (4.5%) |
| Total | 1,912 (100.0%) | 730 (100.0%) |
Housing Structure by Heating Type in Hitchcock
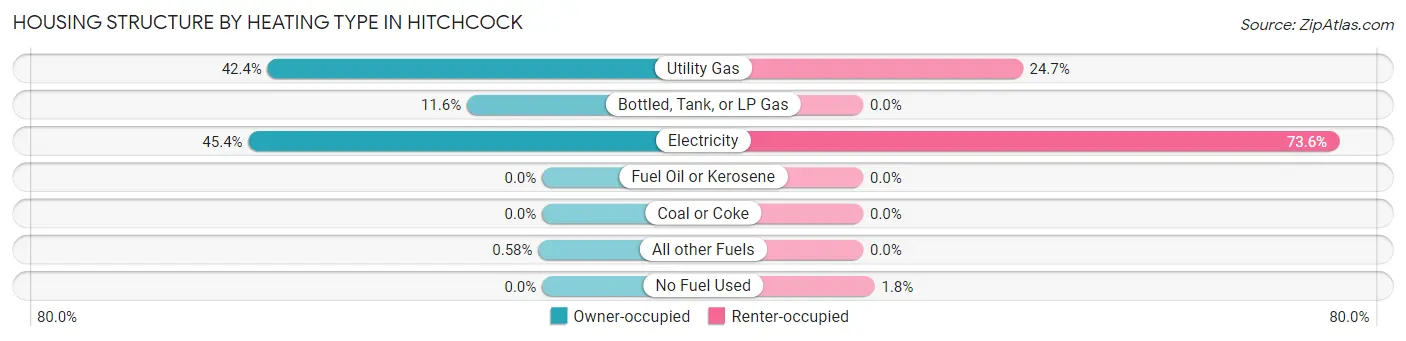
| Heating Type | Owner-occupied | Renter-occupied |
| Utility Gas | 811 (42.4%) | 180 (24.7%) |
| Bottled, Tank, or LP Gas | 222 (11.6%) | 0 (0.0%) |
| Electricity | 868 (45.4%) | 537 (73.6%) |
| Fuel Oil or Kerosene | 0 (0.0%) | 0 (0.0%) |
| Coal or Coke | 0 (0.0%) | 0 (0.0%) |
| All other Fuels | 11 (0.6%) | 0 (0.0%) |
| No Fuel Used | 0 (0.0%) | 13 (1.8%) |
| Total | 1,912 (100.0%) | 730 (100.0%) |
Household Vehicle Usage in Hitchcock
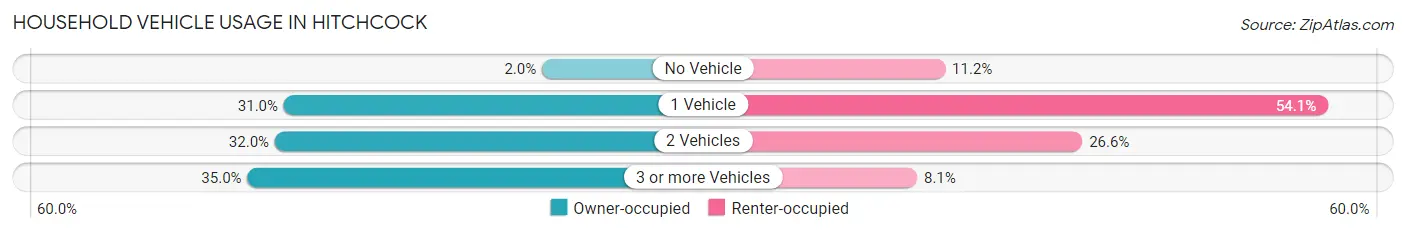
| Vehicles per Household | Owner-occupied | Renter-occupied |
| No Vehicle | 39 (2.0%) | 82 (11.2%) |
| 1 Vehicle | 592 (31.0%) | 395 (54.1%) |
| 2 Vehicles | 611 (32.0%) | 194 (26.6%) |
| 3 or more Vehicles | 670 (35.0%) | 59 (8.1%) |
| Total | 1,912 (100.0%) | 730 (100.0%) |
Real Estate & Mortgages in Hitchcock
Real Estate and Mortgage Overview in Hitchcock
| Characteristic | Without Mortgage | With Mortgage |
| Housing Units | 966 | 946 |
| Median Property Value | $148,900 | $170,500 |
| Median Household Income | $76,528 | $224 |
| Monthly Housing Costs | $617 | $96 |
| Real Estate Taxes | $1,770 | $112 |
Property Value by Mortgage Status in Hitchcock
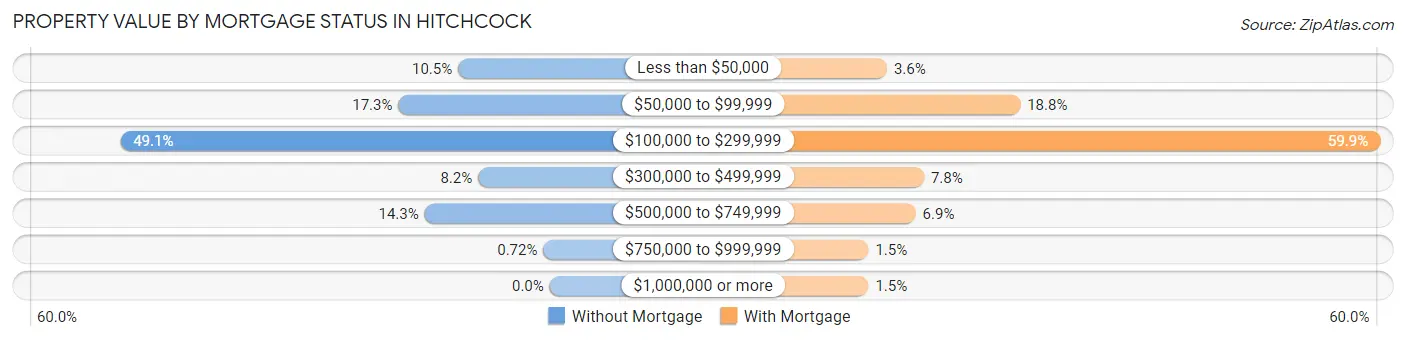
| Property Value | Without Mortgage | With Mortgage |
| Less than $50,000 | 101 (10.5%) | 34 (3.6%) |
| $50,000 to $99,999 | 167 (17.3%) | 178 (18.8%) |
| $100,000 to $299,999 | 474 (49.1%) | 567 (59.9%) |
| $300,000 to $499,999 | 79 (8.2%) | 74 (7.8%) |
| $500,000 to $749,999 | 138 (14.3%) | 65 (6.9%) |
| $750,000 to $999,999 | 7 (0.7%) | 14 (1.5%) |
| $1,000,000 or more | 0 (0.0%) | 14 (1.5%) |
| Total | 966 (100.0%) | 946 (100.0%) |
Household Income by Mortgage Status in Hitchcock
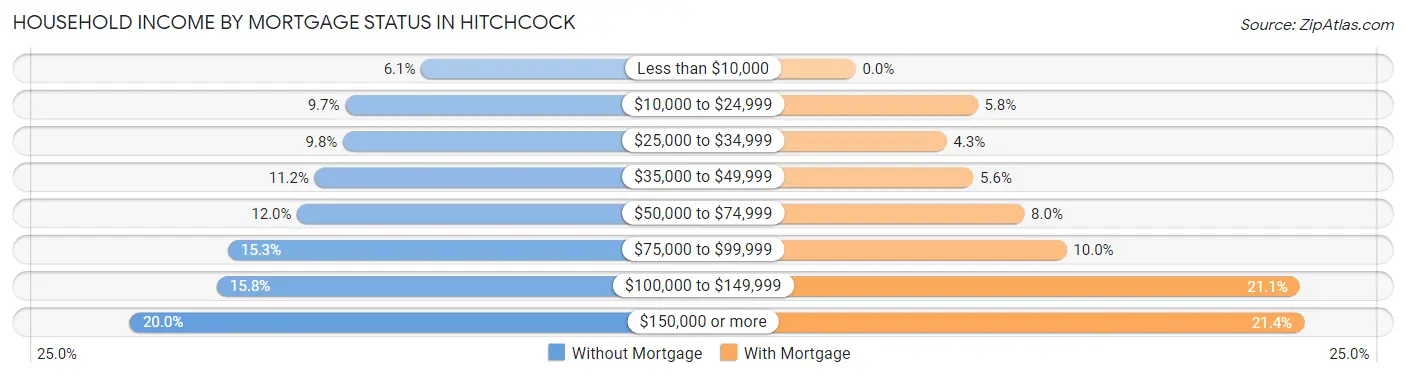
| Household Income | Without Mortgage | With Mortgage |
| Less than $10,000 | 59 (6.1%) | 0 (0.0%) |
| $10,000 to $24,999 | 94 (9.7%) | 55 (5.8%) |
| $25,000 to $34,999 | 95 (9.8%) | 41 (4.3%) |
| $35,000 to $49,999 | 108 (11.2%) | 53 (5.6%) |
| $50,000 to $74,999 | 116 (12.0%) | 76 (8.0%) |
| $75,000 to $99,999 | 148 (15.3%) | 95 (10.0%) |
| $100,000 to $149,999 | 153 (15.8%) | 200 (21.1%) |
| $150,000 or more | 193 (20.0%) | 202 (21.3%) |
| Total | 966 (100.0%) | 946 (100.0%) |
Property Value to Household Income Ratio in Hitchcock
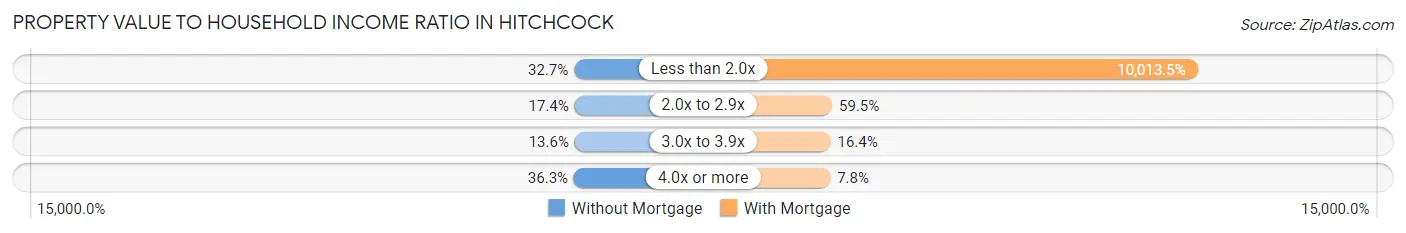
| Value-to-Income Ratio | Without Mortgage | With Mortgage |
| Less than 2.0x | 316 (32.7%) | 94,728 (10,013.5%) |
| 2.0x to 2.9x | 168 (17.4%) | 563 (59.5%) |
| 3.0x to 3.9x | 131 (13.6%) | 155 (16.4%) |
| 4.0x or more | 351 (36.3%) | 74 (7.8%) |
| Total | 966 (100.0%) | 946 (100.0%) |
Real Estate Taxes by Mortgage Status in Hitchcock
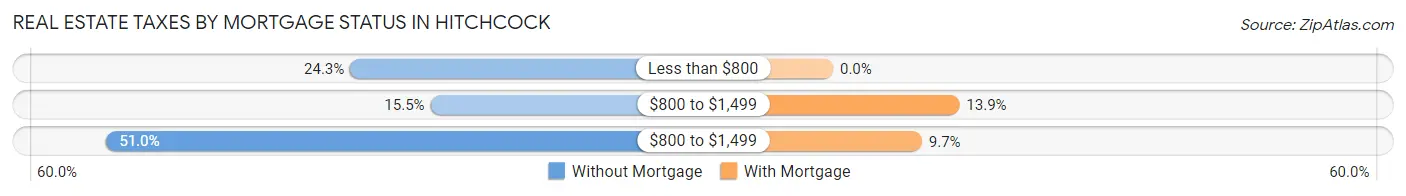
| Property Taxes | Without Mortgage | With Mortgage |
| Less than $800 | 235 (24.3%) | 0 (0.0%) |
| $800 to $1,499 | 150 (15.5%) | 131 (13.9%) |
| $800 to $1,499 | 493 (51.0%) | 92 (9.7%) |
| Total | 966 (100.0%) | 946 (100.0%) |
Health & Disability in Hitchcock
Health Insurance Coverage by Age in Hitchcock
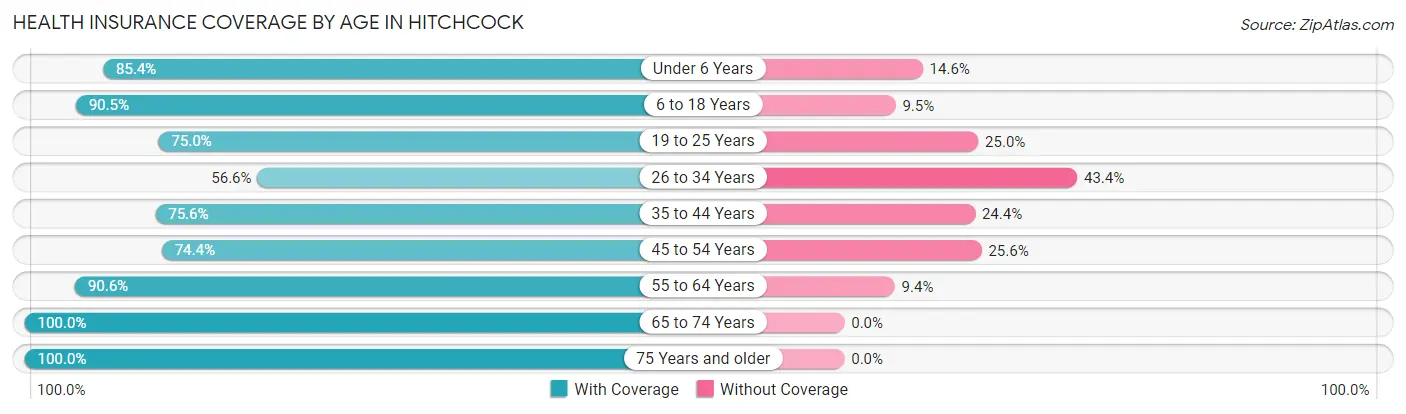
| Age Bracket | With Coverage | Without Coverage |
| Under 6 Years | 649 (85.4%) | 111 (14.6%) |
| 6 to 18 Years | 1,271 (90.5%) | 134 (9.5%) |
| 19 to 25 Years | 448 (75.0%) | 149 (25.0%) |
| 26 to 34 Years | 485 (56.6%) | 372 (43.4%) |
| 35 to 44 Years | 782 (75.6%) | 252 (24.4%) |
| 45 to 54 Years | 544 (74.4%) | 187 (25.6%) |
| 55 to 64 Years | 772 (90.6%) | 80 (9.4%) |
| 65 to 74 Years | 775 (100.0%) | 0 (0.0%) |
| 75 Years and older | 362 (100.0%) | 0 (0.0%) |
| Total | 6,088 (82.6%) | 1,285 (17.4%) |
Health Insurance Coverage by Citizenship Status in Hitchcock
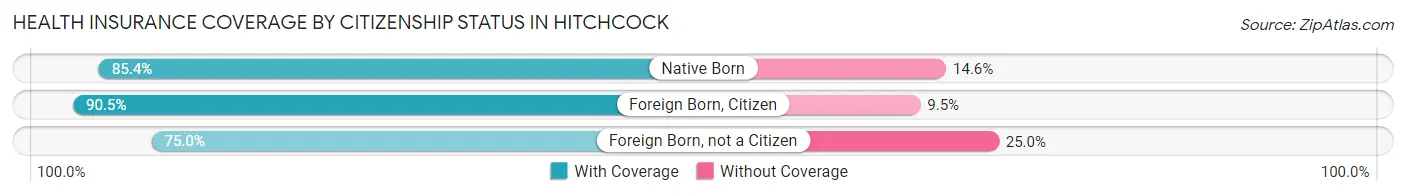
| Citizenship Status | With Coverage | Without Coverage |
| Native Born | 649 (85.4%) | 111 (14.6%) |
| Foreign Born, Citizen | 1,271 (90.5%) | 134 (9.5%) |
| Foreign Born, not a Citizen | 448 (75.0%) | 149 (25.0%) |
Health Insurance Coverage by Household Income in Hitchcock
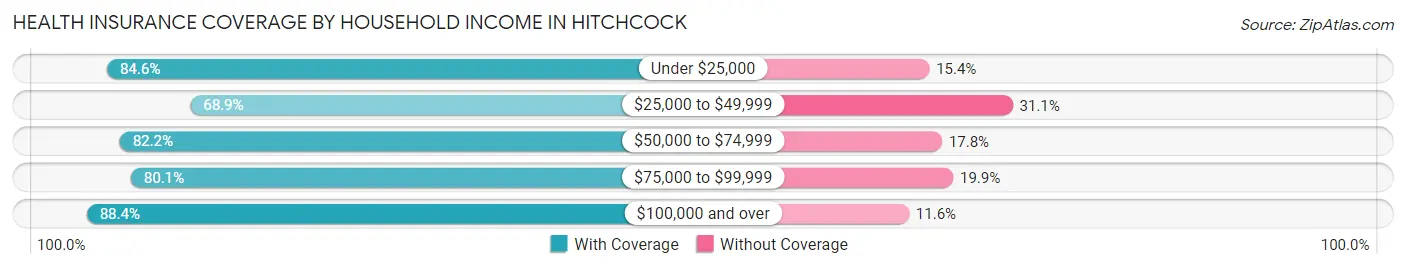
| Household Income | With Coverage | Without Coverage |
| Under $25,000 | 794 (84.6%) | 145 (15.4%) |
| $25,000 to $49,999 | 890 (68.9%) | 401 (31.1%) |
| $50,000 to $74,999 | 645 (82.2%) | 140 (17.8%) |
| $75,000 to $99,999 | 849 (80.1%) | 211 (19.9%) |
| $100,000 and over | 2,907 (88.4%) | 383 (11.6%) |
Public vs Private Health Insurance Coverage by Age in Hitchcock
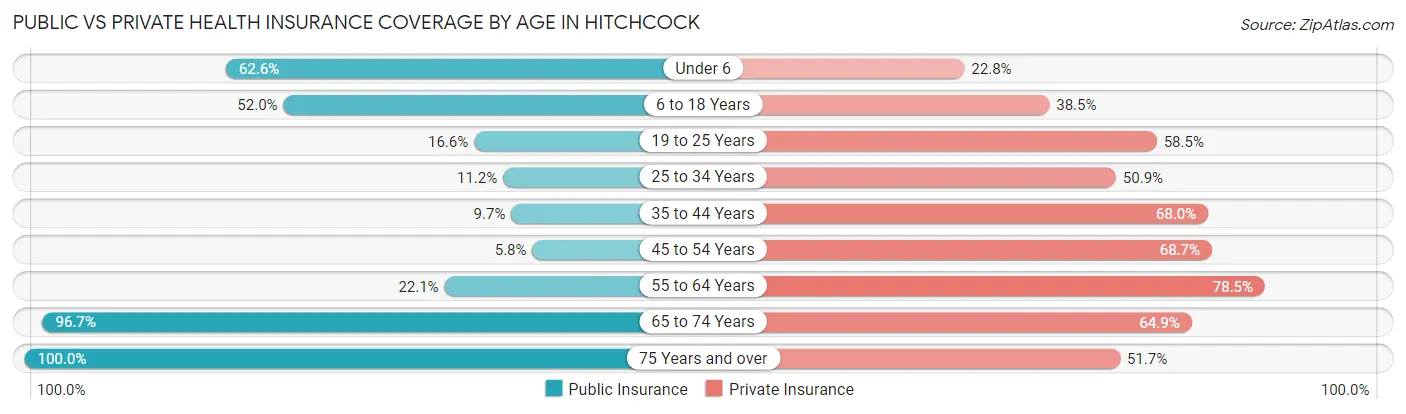
| Age Bracket | Public Insurance | Private Insurance |
| Under 6 | 476 (62.6%) | 173 (22.8%) |
| 6 to 18 Years | 730 (52.0%) | 541 (38.5%) |
| 19 to 25 Years | 99 (16.6%) | 349 (58.5%) |
| 25 to 34 Years | 96 (11.2%) | 436 (50.9%) |
| 35 to 44 Years | 100 (9.7%) | 703 (68.0%) |
| 45 to 54 Years | 42 (5.8%) | 502 (68.7%) |
| 55 to 64 Years | 188 (22.1%) | 669 (78.5%) |
| 65 to 74 Years | 749 (96.7%) | 503 (64.9%) |
| 75 Years and over | 362 (100.0%) | 187 (51.7%) |
| Total | 2,842 (38.6%) | 4,063 (55.1%) |
Disability Status by Sex by Age in Hitchcock
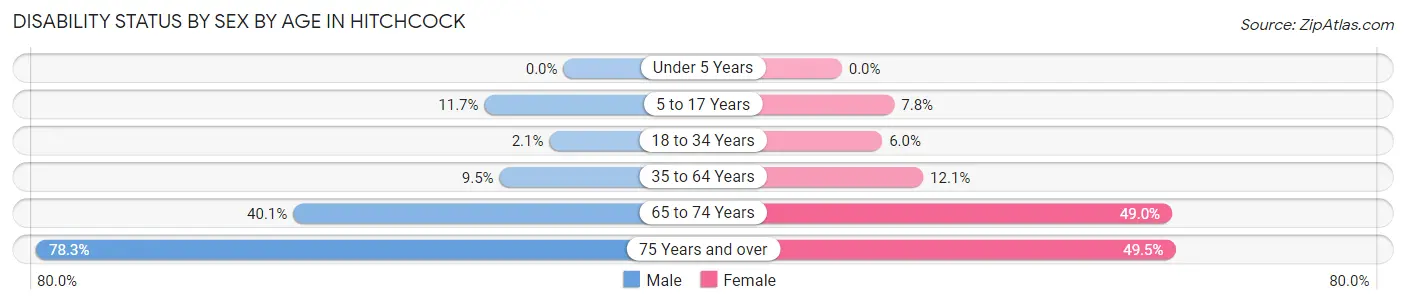
| Age Bracket | Male | Female |
| Under 5 Years | 0 (0.0%) | 0 (0.0%) |
| 5 to 17 Years | 90 (11.7%) | 59 (7.8%) |
| 18 to 34 Years | 13 (2.1%) | 53 (6.0%) |
| 35 to 64 Years | 118 (9.5%) | 166 (12.1%) |
| 65 to 74 Years | 126 (40.1%) | 226 (49.0%) |
| 75 Years and over | 119 (78.3%) | 104 (49.5%) |
Disability Class by Sex by Age in Hitchcock
Disability Class: Hearing Difficulty
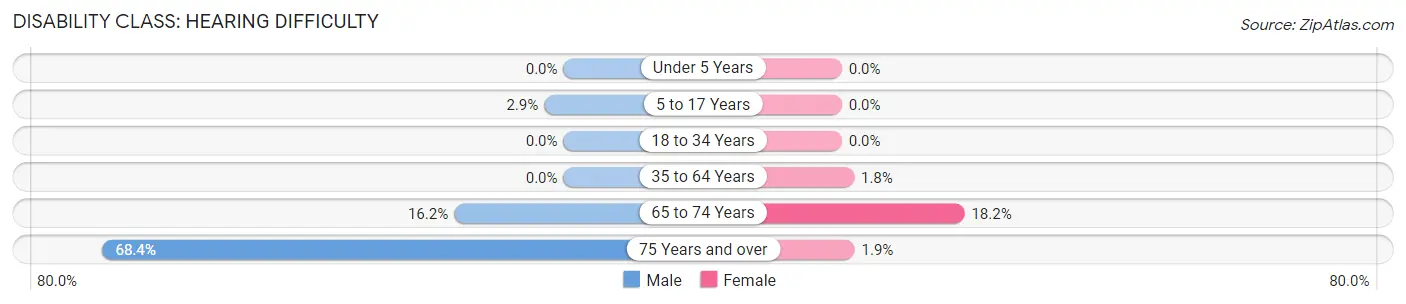
| Age Bracket | Male | Female |
| Under 5 Years | 0 (0.0%) | 0 (0.0%) |
| 5 to 17 Years | 22 (2.9%) | 0 (0.0%) |
| 18 to 34 Years | 0 (0.0%) | 0 (0.0%) |
| 35 to 64 Years | 0 (0.0%) | 25 (1.8%) |
| 65 to 74 Years | 51 (16.2%) | 84 (18.2%) |
| 75 Years and over | 104 (68.4%) | 4 (1.9%) |
Disability Class: Vision Difficulty
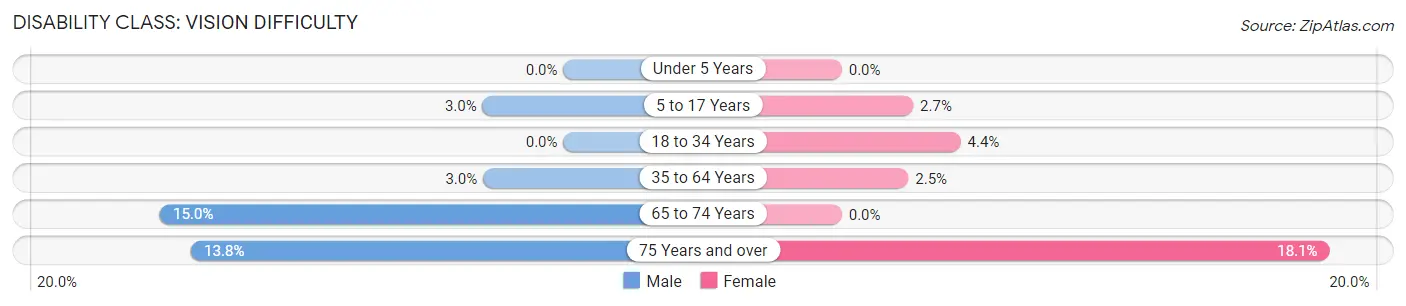
| Age Bracket | Male | Female |
| Under 5 Years | 0 (0.0%) | 0 (0.0%) |
| 5 to 17 Years | 23 (3.0%) | 20 (2.6%) |
| 18 to 34 Years | 0 (0.0%) | 39 (4.4%) |
| 35 to 64 Years | 37 (3.0%) | 34 (2.5%) |
| 65 to 74 Years | 47 (15.0%) | 0 (0.0%) |
| 75 Years and over | 21 (13.8%) | 38 (18.1%) |
Disability Class: Cognitive Difficulty
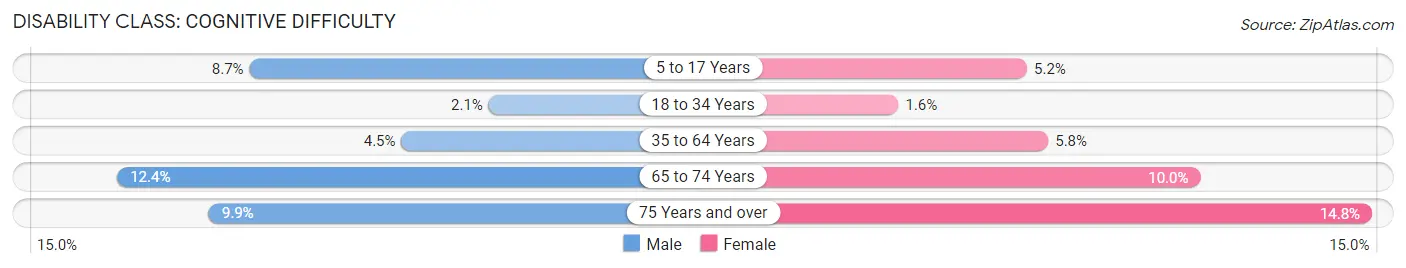
| Age Bracket | Male | Female |
| 5 to 17 Years | 67 (8.7%) | 39 (5.2%) |
| 18 to 34 Years | 13 (2.1%) | 14 (1.6%) |
| 35 to 64 Years | 56 (4.5%) | 79 (5.8%) |
| 65 to 74 Years | 39 (12.4%) | 46 (10.0%) |
| 75 Years and over | 15 (9.9%) | 31 (14.8%) |
Disability Class: Ambulatory Difficulty
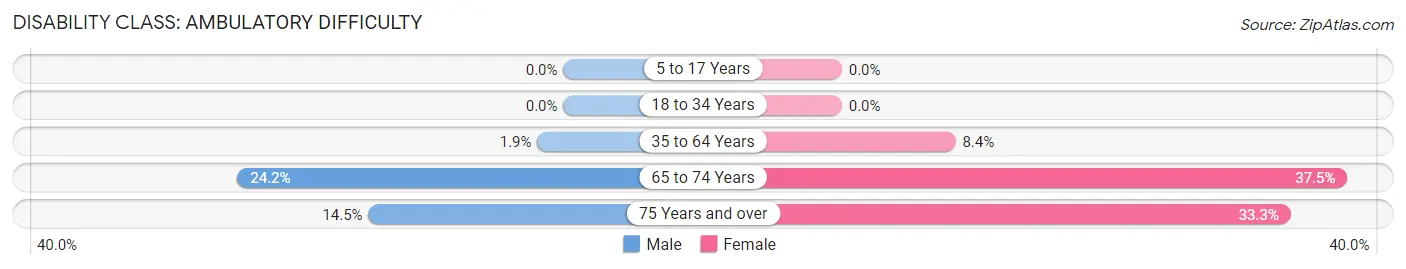
| Age Bracket | Male | Female |
| 5 to 17 Years | 0 (0.0%) | 0 (0.0%) |
| 18 to 34 Years | 0 (0.0%) | 0 (0.0%) |
| 35 to 64 Years | 24 (1.9%) | 116 (8.4%) |
| 65 to 74 Years | 76 (24.2%) | 173 (37.5%) |
| 75 Years and over | 22 (14.5%) | 70 (33.3%) |
Disability Class: Self-Care Difficulty
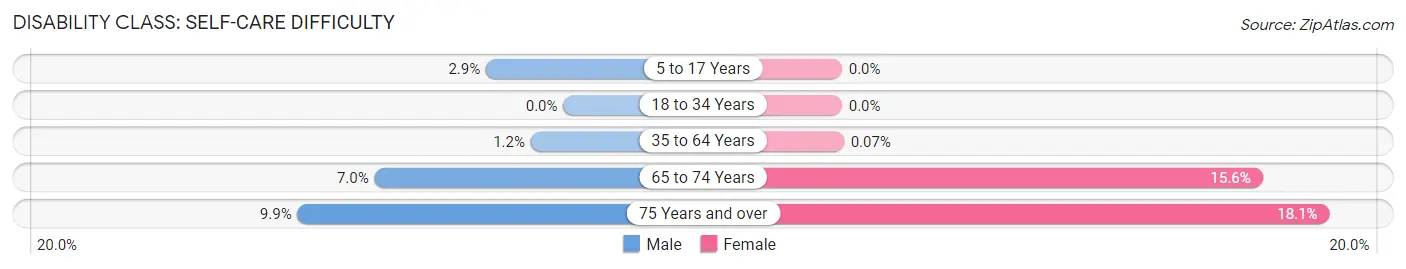
| Age Bracket | Male | Female |
| 5 to 17 Years | 22 (2.9%) | 0 (0.0%) |
| 18 to 34 Years | 0 (0.0%) | 0 (0.0%) |
| 35 to 64 Years | 15 (1.2%) | 1 (0.1%) |
| 65 to 74 Years | 22 (7.0%) | 72 (15.6%) |
| 75 Years and over | 15 (9.9%) | 38 (18.1%) |
Technology Access in Hitchcock
Computing Device Access in Hitchcock
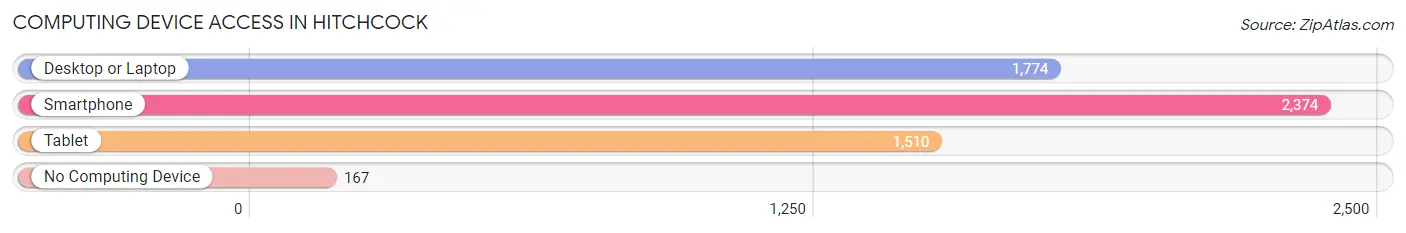
| Device Type | # Households | % Households |
| Desktop or Laptop | 1,774 | 67.1% |
| Smartphone | 2,374 | 89.9% |
| Tablet | 1,510 | 57.2% |
| No Computing Device | 167 | 6.3% |
| Total | 2,642 | 100.0% |
Internet Access in Hitchcock
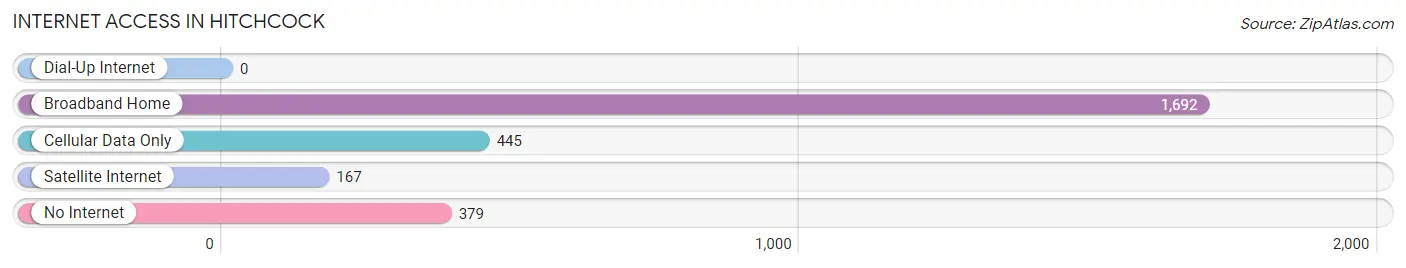
| Internet Type | # Households | % Households |
| Dial-Up Internet | 0 | 0.0% |
| Broadband Home | 1,692 | 64.0% |
| Cellular Data Only | 445 | 16.8% |
| Satellite Internet | 167 | 6.3% |
| No Internet | 379 | 14.3% |
| Total | 2,642 | 100.0% |
Hitchcock Summary
Hitchcock, Texas is a small city located in Galveston County, Texas. It is situated on the Gulf Coast, approximately 30 miles south of Houston. The city has a population of approximately 8,000 people and is part of the Houston–The Woodlands–Sugar Land metropolitan area.
History
Hitchcock was founded in 1873 by a group of settlers from the nearby town of Galveston. The town was named after the first postmaster, William Hitchcock. The town was originally a farming community, but it soon developed into a small commercial center. In the early 1900s, the town was home to a number of businesses, including a cotton gin, a sawmill, and a brickyard.
In the 1920s, the town began to experience a period of growth and development. The Galveston and Houston Electric Railway was extended to Hitchcock in 1923, and the town was incorporated in 1925. The town continued to grow throughout the 20th century, and by the 2000s, it had become a popular tourist destination.
Geography
Hitchcock is located in Galveston County, Texas, on the Gulf Coast. It is situated approximately 30 miles south of Houston. The city has a total area of 4.2 square miles, all of which is land. The terrain is mostly flat, with some rolling hills. The climate is humid subtropical, with hot, humid summers and mild winters.
Economy
Hitchcock’s economy is largely based on tourism. The city is home to a number of attractions, including the Galveston Island State Park, the Galveston Island Historic Pleasure Pier, and the Galveston Island Railroad Museum. The city also has a number of restaurants, shops, and other businesses.
The city is also home to a number of industries, including oil and gas production, manufacturing, and shipping. The city is home to a number of companies, including the Galveston-Houston Electric Railway, the Galveston-Houston Ship Channel, and the Galveston-Houston Shipbuilding Company.
Demographics
As of the 2010 census, the population of Hitchcock was 8,000. The racial makeup of the city was 79.2% White, 15.2% African American, 0.7% Native American, 0.7% Asian, 0.1% Pacific Islander, and 4.1% from other races. Hispanic or Latino of any race were 11.2% of the population.
The median household income in Hitchcock was $37,917, and the median family income was $45,938. The per capita income was $19,945. About 16.2% of the population was below the poverty line.
Hitchcock is a small city with a rich history and a vibrant economy. It is home to a number of attractions and businesses, and it is a popular tourist destination. The city has a diverse population and a strong economy, and it is a great place to live and work.
Common Questions
What is Per Capita Income in Hitchcock?
Per Capita income in Hitchcock is $32,130.
What is the Median Family Income in Hitchcock?
Median Family Income in Hitchcock is $79,738.
What is the Median Household income in Hitchcock?
Median Household Income in Hitchcock is $75,741.
What is Income or Wage Gap in Hitchcock?
Income or Wage Gap in Hitchcock is 36.9%.
Women in Hitchcock earn 63.1 cents for every dollar earned by a man.
What is Inequality or Gini Index in Hitchcock?
Inequality or Gini Index in Hitchcock is 0.45.
What is the Total Population of Hitchcock?
Total Population of Hitchcock is 7,398.
What is the Total Male Population of Hitchcock?
Total Male Population of Hitchcock is 3,423.
What is the Total Female Population of Hitchcock?
Total Female Population of Hitchcock is 3,975.
What is the Ratio of Males per 100 Females in Hitchcock?
There are 86.11 Males per 100 Females in Hitchcock.
What is the Ratio of Females per 100 Males in Hitchcock?
There are 116.13 Females per 100 Males in Hitchcock.
What is the Median Population Age in Hitchcock?
Median Population Age in Hitchcock is 35.2 Years.
What is the Average Family Size in Hitchcock
Average Family Size in Hitchcock is 3.3 People.
What is the Average Household Size in Hitchcock
Average Household Size in Hitchcock is 2.8 People.
How Large is the Labor Force in Hitchcock?
There are 3,517 People in the Labor Forcein in Hitchcock.
What is the Percentage of People in the Labor Force in Hitchcock?
63.7% of People are in the Labor Force in Hitchcock.
What is the Unemployment Rate in Hitchcock?
Unemployment Rate in Hitchcock is 5.1%.