Hico, TX Map & Demographics
Hico Map
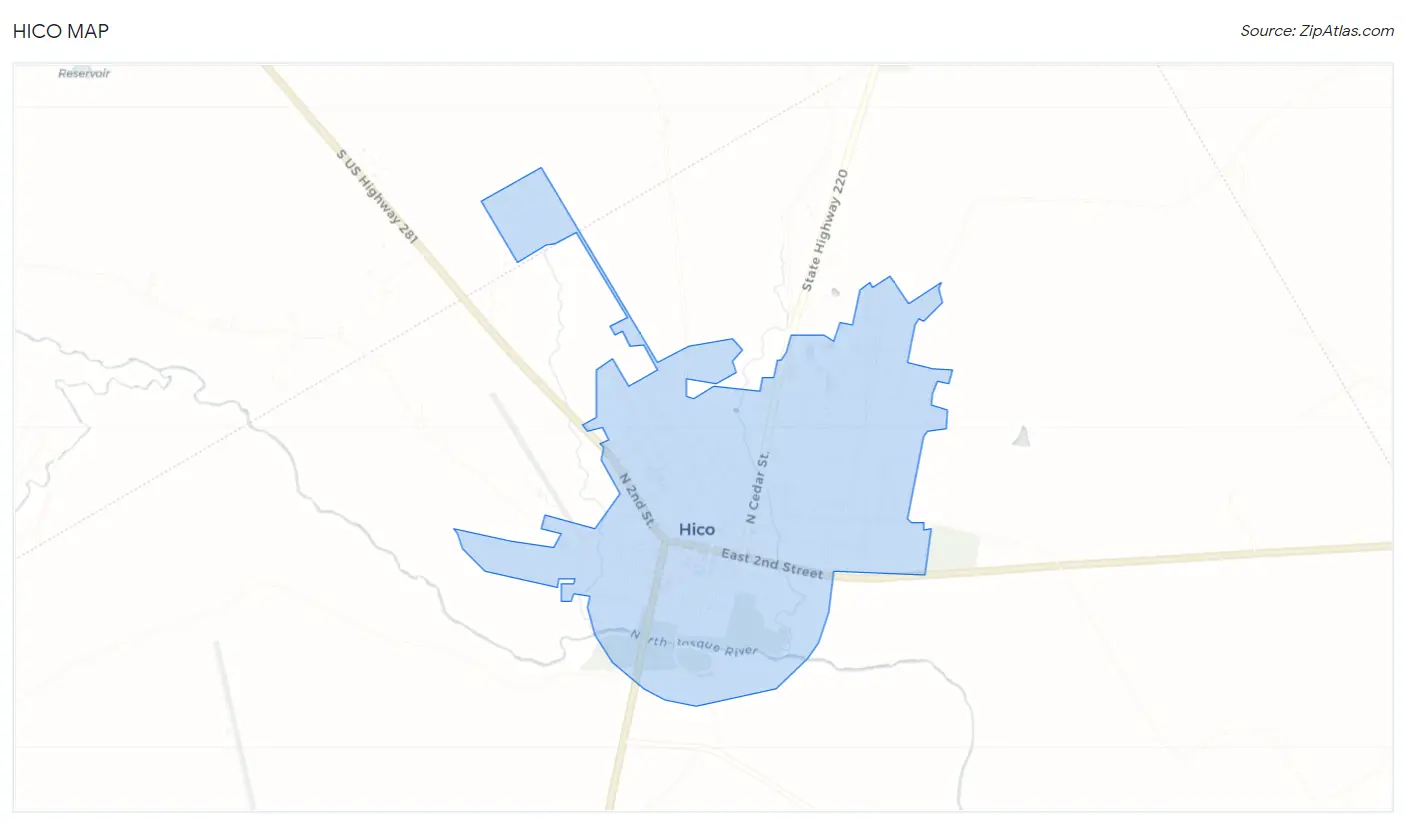
Hico Overview
$23,633
PER CAPITA INCOME
$77,344
AVG FAMILY INCOME
$44,191
AVG HOUSEHOLD INCOME
63.5%
WAGE / INCOME GAP [ % ]
36.5¢/ $1
WAGE / INCOME GAP [ $ ]
0.43
INEQUALITY / GINI INDEX
1,627
TOTAL POPULATION
708
MALE POPULATION
919
FEMALE POPULATION
77.04
MALES / 100 FEMALES
129.80
FEMALES / 100 MALES
33.0
MEDIAN AGE
5.0
AVG FAMILY SIZE
2.9
AVG HOUSEHOLD SIZE
544
LABOR FORCE [ PEOPLE ]
47.8%
PERCENT IN LABOR FORCE
4.2%
UNEMPLOYMENT RATE
Hico Zip Codes
Hico Area Codes
Income in Hico
Income Overview in Hico
Per Capita Income in Hico is $23,633, while median incomes of families and households are $77,344 and $44,191 respectively.
| Characteristic | Number | Measure |
| Per Capita Income | 1,627 | $23,633 |
| Median Family Income | 255 | $77,344 |
| Mean Family Income | 255 | $89,276 |
| Median Household Income | 555 | $44,191 |
| Mean Household Income | 555 | $60,680 |
| Income Deficit | 255 | $0 |
| Wage / Income Gap (%) | 1,627 | 63.49% |
| Wage / Income Gap ($) | 1,627 | 36.51¢ per $1 |
| Gini / Inequality Index | 1,627 | 0.43 |
Earnings by Sex in Hico
Average Earnings in Hico are $31,985, $53,125 for men and $19,398 for women, a difference of 63.5%.
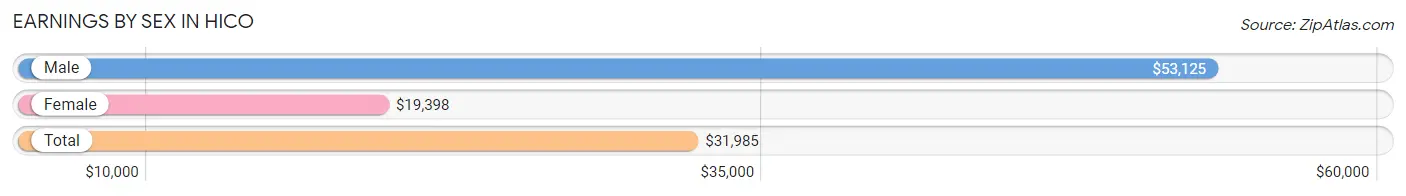
| Sex | Number | Average Earnings |
| Male | 321 (57.1%) | $53,125 |
| Female | 241 (42.9%) | $19,398 |
| Total | 562 (100.0%) | $31,985 |
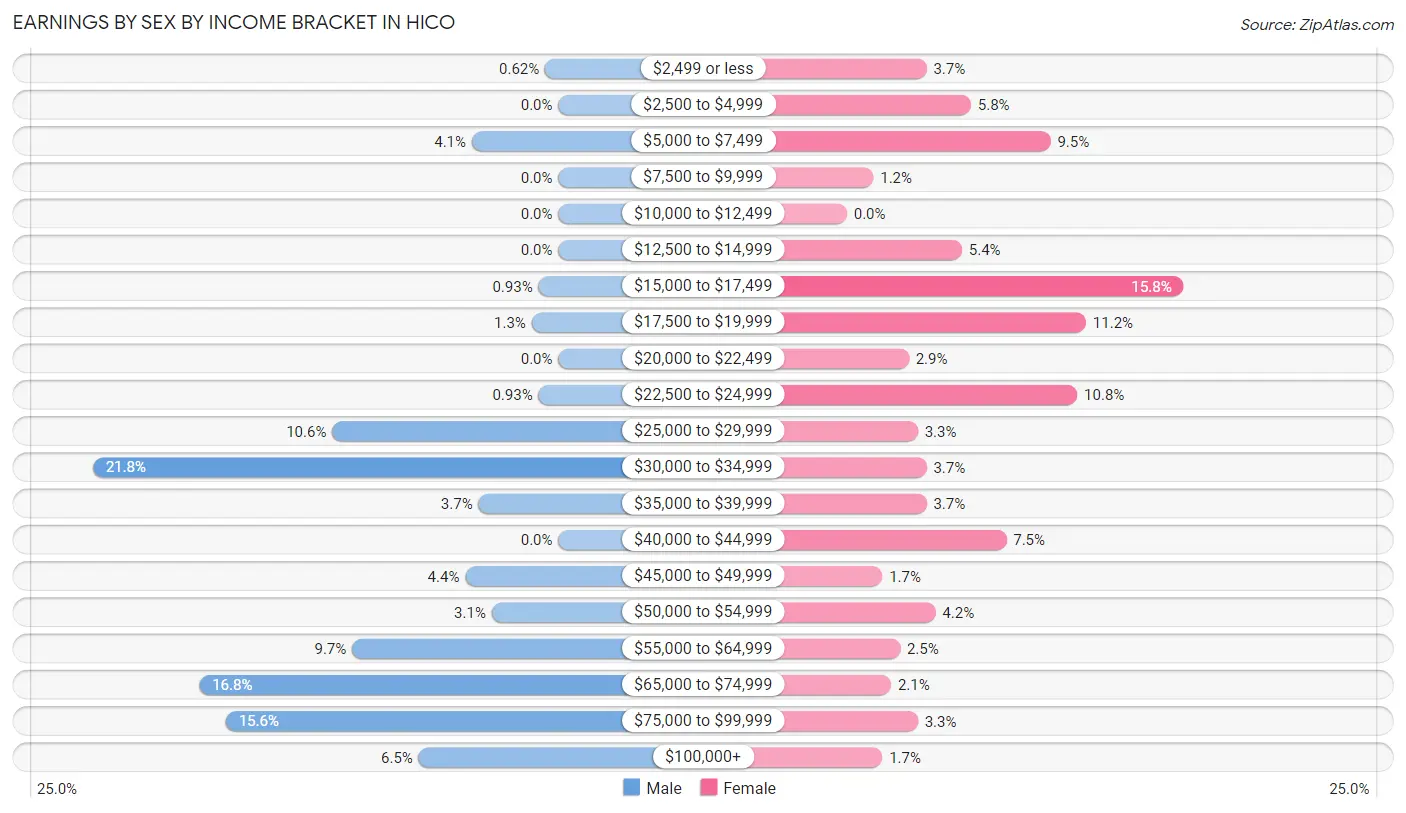
Earnings by Sex by Income Bracket in Hico
The most common earnings brackets in Hico are $30,000 to $34,999 for men (70 | 21.8%) and $15,000 to $17,499 for women (38 | 15.8%).
| Income | Male | Female |
| $2,499 or less | 2 (0.6%) | 9 (3.7%) |
| $2,500 to $4,999 | 0 (0.0%) | 14 (5.8%) |
| $5,000 to $7,499 | 13 (4.1%) | 23 (9.5%) |
| $7,500 to $9,999 | 0 (0.0%) | 3 (1.2%) |
| $10,000 to $12,499 | 0 (0.0%) | 0 (0.0%) |
| $12,500 to $14,999 | 0 (0.0%) | 13 (5.4%) |
| $15,000 to $17,499 | 3 (0.9%) | 38 (15.8%) |
| $17,500 to $19,999 | 4 (1.3%) | 27 (11.2%) |
| $20,000 to $22,499 | 0 (0.0%) | 7 (2.9%) |
| $22,500 to $24,999 | 3 (0.9%) | 26 (10.8%) |
| $25,000 to $29,999 | 34 (10.6%) | 8 (3.3%) |
| $30,000 to $34,999 | 70 (21.8%) | 9 (3.7%) |
| $35,000 to $39,999 | 12 (3.7%) | 9 (3.7%) |
| $40,000 to $44,999 | 0 (0.0%) | 18 (7.5%) |
| $45,000 to $49,999 | 14 (4.4%) | 4 (1.7%) |
| $50,000 to $54,999 | 10 (3.1%) | 10 (4.2%) |
| $55,000 to $64,999 | 31 (9.7%) | 6 (2.5%) |
| $65,000 to $74,999 | 54 (16.8%) | 5 (2.1%) |
| $75,000 to $99,999 | 50 (15.6%) | 8 (3.3%) |
| $100,000+ | 21 (6.5%) | 4 (1.7%) |
| Total | 321 (100.0%) | 241 (100.0%) |
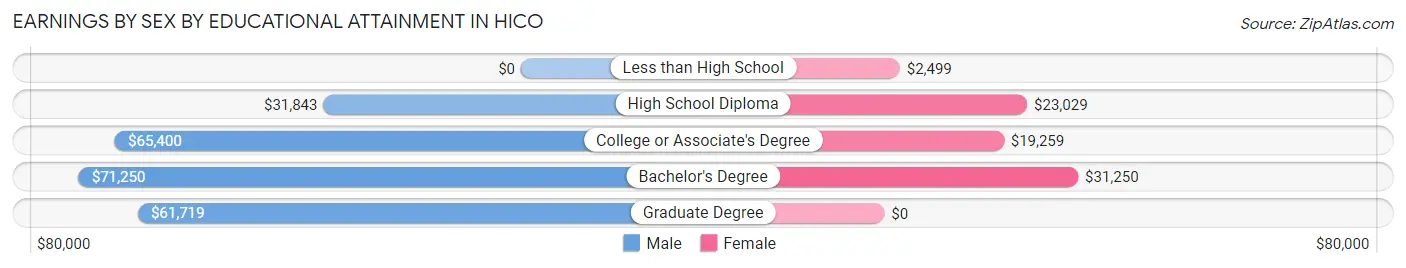
Earnings by Sex by Educational Attainment in Hico
Average earnings in Hico are $58,403 for men and $19,352 for women, a difference of 66.9%. Men with an educational attainment of bachelor's degree enjoy the highest average annual earnings of $71,250, while those with high school diploma education earn the least with $31,843. Women with an educational attainment of bachelor's degree earn the most with the average annual earnings of $31,250, while those with less than high school education have the smallest earnings of $2,499.
| Educational Attainment | Male Income | Female Income |
| Less than High School | - | - |
| High School Diploma | $31,843 | $23,029 |
| College or Associate's Degree | $65,400 | $19,259 |
| Bachelor's Degree | $71,250 | $31,250 |
| Graduate Degree | $61,719 | $0 |
| Total | $58,403 | $19,352 |
Family Income in Hico
Family Income Brackets in Hico
According to the Hico family income data, there are 75 families falling into the $100,000 to $149,999 income range, which is the most common income bracket and makes up 29.4% of all families. Conversely, the $10,000 to $14,999 income bracket is the least frequent group with only 2 families (0.8%) belonging to this category.
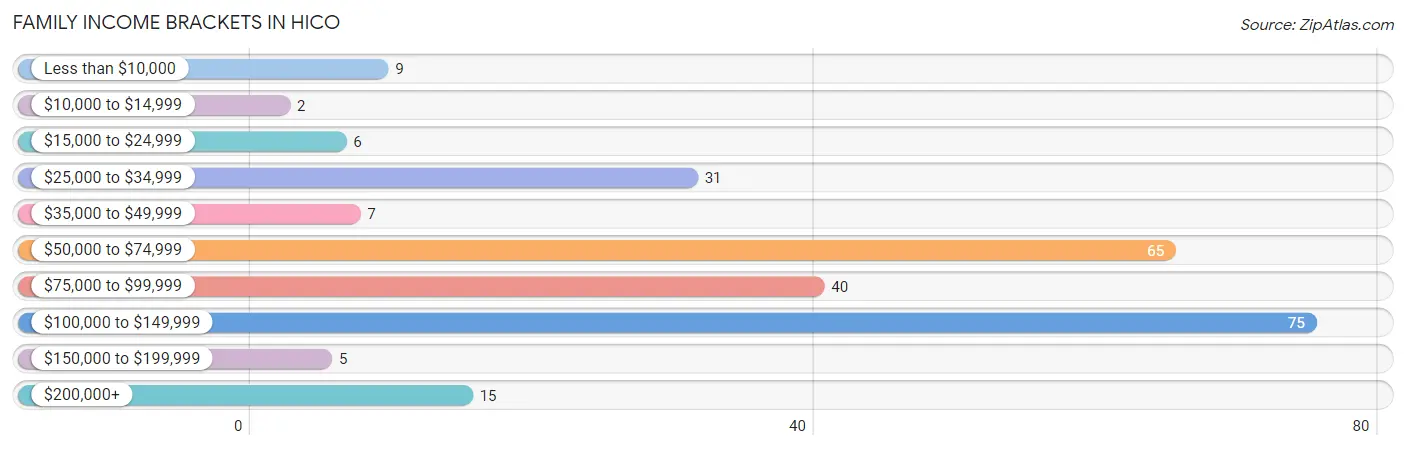
| Income Bracket | # Families | % Families |
| Less than $10,000 | 9 | 3.5% |
| $10,000 to $14,999 | 2 | 0.8% |
| $15,000 to $24,999 | 6 | 2.4% |
| $25,000 to $34,999 | 31 | 12.2% |
| $35,000 to $49,999 | 7 | 2.7% |
| $50,000 to $74,999 | 65 | 25.5% |
| $75,000 to $99,999 | 40 | 15.7% |
| $100,000 to $149,999 | 75 | 29.4% |
| $150,000 to $199,999 | 5 | 2.0% |
| $200,000+ | 15 | 5.9% |
Family Income by Famaliy Size in Hico
5-person families (31 | 12.2%) account for the highest median family income in Hico with $137,321 per family, while 2-person families (136 | 53.3%) have the highest median income of $33,348 per family member.
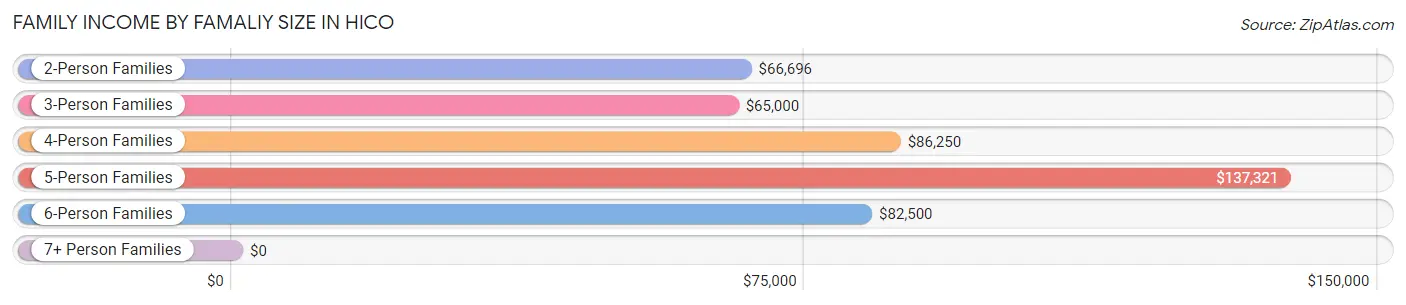
| Income Bracket | # Families | Median Income |
| 2-Person Families | 136 (53.3%) | $66,696 |
| 3-Person Families | 44 (17.2%) | $65,000 |
| 4-Person Families | 22 (8.6%) | $86,250 |
| 5-Person Families | 31 (12.2%) | $137,321 |
| 6-Person Families | 10 (3.9%) | $82,500 |
| 7+ Person Families | 12 (4.7%) | $0 |
| Total | 255 (100.0%) | $77,344 |
Family Income by Number of Earners in Hico
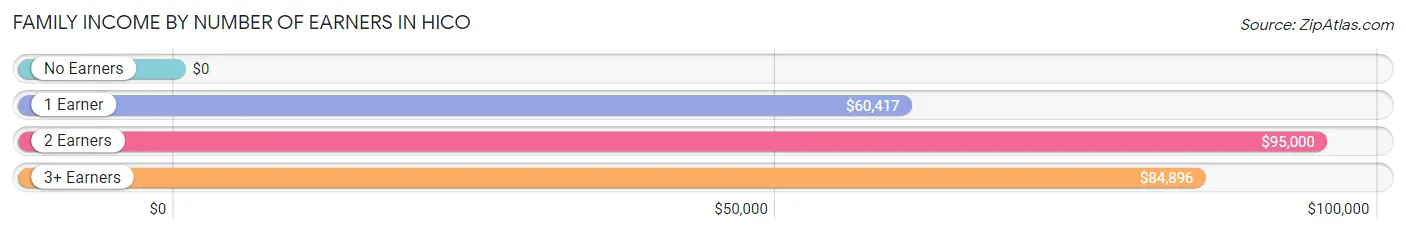
| Number of Earners | # Families | Median Income |
| No Earners | 47 (18.4%) | $0 |
| 1 Earner | 69 (27.1%) | $60,417 |
| 2 Earners | 116 (45.5%) | $95,000 |
| 3+ Earners | 23 (9.0%) | $84,896 |
| Total | 255 (100.0%) | $77,344 |
Household Income in Hico
Household Income Brackets in Hico
With 125 households falling in the category, the $25,000 to $34,999 income range is the most frequent in Hico, accounting for 22.5% of all households. In contrast, only 7 households (1.3%) fall into the $150,000 to $199,999 income bracket, making it the least populous group.
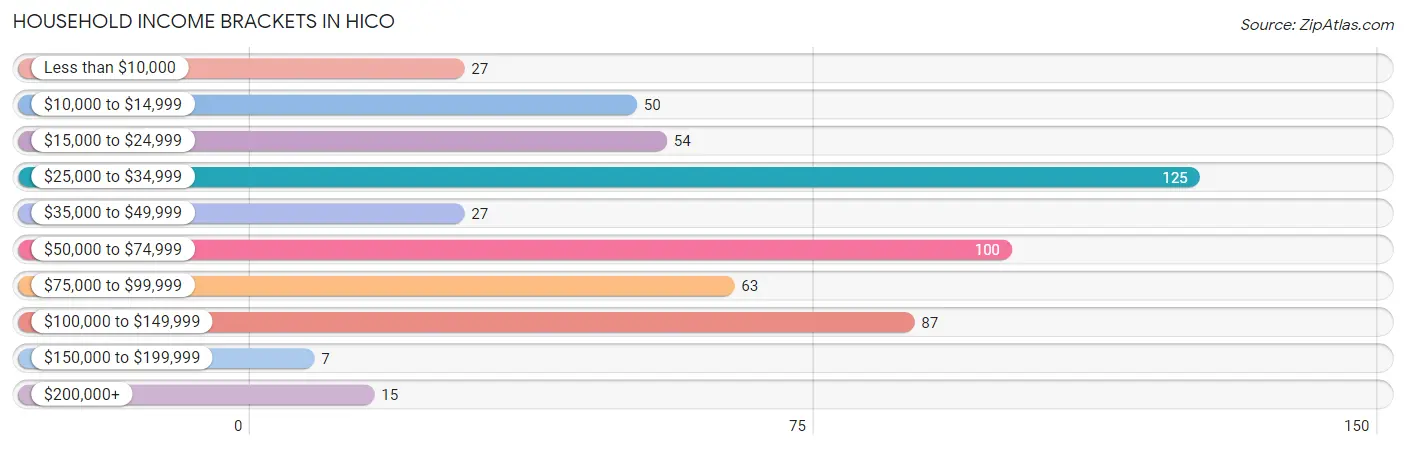
| Income Bracket | # Households | % Households |
| Less than $10,000 | 27 | 4.9% |
| $10,000 to $14,999 | 50 | 9.0% |
| $15,000 to $24,999 | 54 | 9.7% |
| $25,000 to $34,999 | 125 | 22.5% |
| $35,000 to $49,999 | 27 | 4.9% |
| $50,000 to $74,999 | 100 | 18.0% |
| $75,000 to $99,999 | 63 | 11.4% |
| $100,000 to $149,999 | 87 | 15.7% |
| $150,000 to $199,999 | 7 | 1.3% |
| $200,000+ | 15 | 2.7% |
Household Income by Householder Age in Hico
The median household income in Hico is $44,191, with the highest median household income of $88,056 found in the 25 to 44 years age bracket for the primary householder. A total of 118 households (21.3%) fall into this category. Meanwhile, the 15 to 24 years age bracket for the primary householder has the lowest median household income of $0, with 8 households (1.4%) in this group.
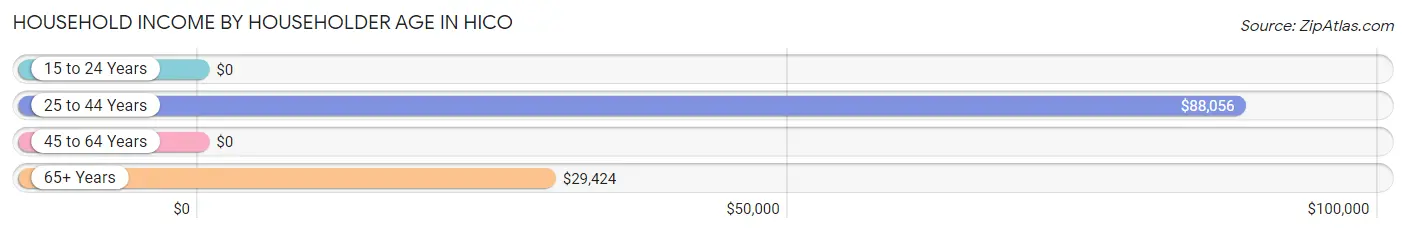
| Income Bracket | # Households | Median Income |
| 15 to 24 Years | 8 (1.4%) | $0 |
| 25 to 44 Years | 118 (21.3%) | $88,056 |
| 45 to 64 Years | 166 (29.9%) | $0 |
| 65+ Years | 263 (47.4%) | $29,424 |
| Total | 555 (100.0%) | $44,191 |
Poverty in Hico
Income Below Poverty by Sex and Age in Hico
With 4.7% poverty level for males and 11.3% for females among the residents of Hico, 25 to 34 year old males and 15 year old females are the most vulnerable to poverty, with 28 males (20.0%) and 8 females (66.7%) in their respective age groups living below the poverty level.
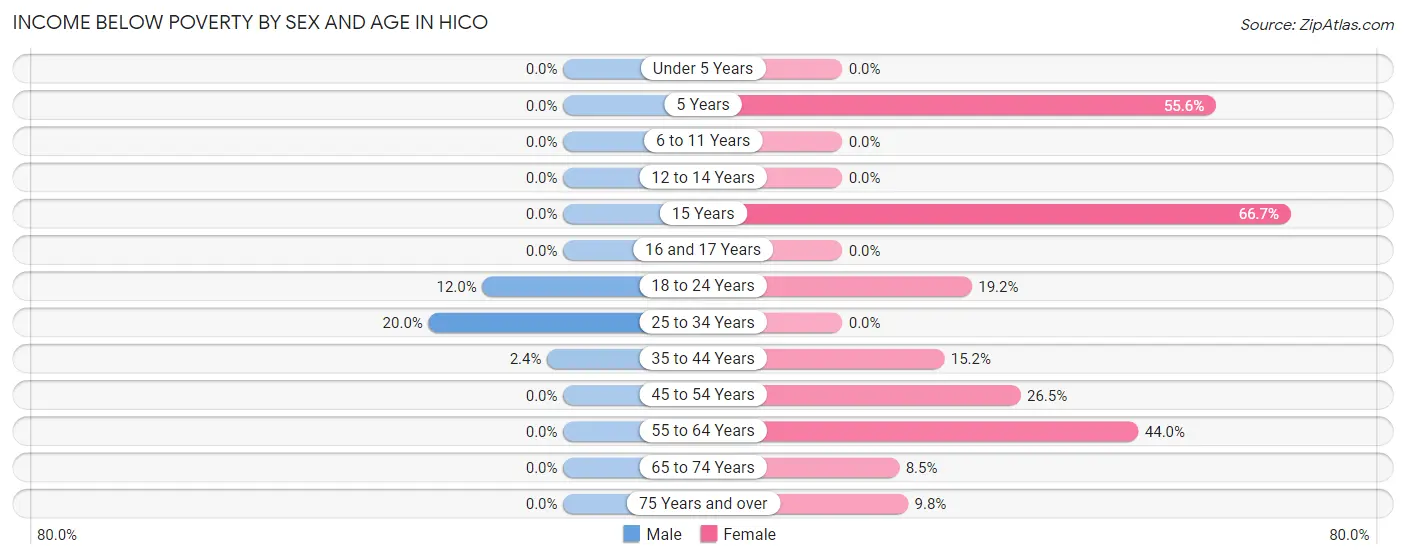
| Age Bracket | Male | Female |
| Under 5 Years | 0 (0.0%) | 0 (0.0%) |
| 5 Years | 0 (0.0%) | 5 (55.6%) |
| 6 to 11 Years | 0 (0.0%) | 0 (0.0%) |
| 12 to 14 Years | 0 (0.0%) | 0 (0.0%) |
| 15 Years | 0 (0.0%) | 8 (66.7%) |
| 16 and 17 Years | 0 (0.0%) | 0 (0.0%) |
| 18 to 24 Years | 3 (12.0%) | 5 (19.2%) |
| 25 to 34 Years | 28 (20.0%) | 0 (0.0%) |
| 35 to 44 Years | 2 (2.4%) | 10 (15.1%) |
| 45 to 54 Years | 0 (0.0%) | 9 (26.5%) |
| 55 to 64 Years | 0 (0.0%) | 40 (44.0%) |
| 65 to 74 Years | 0 (0.0%) | 6 (8.5%) |
| 75 Years and over | 0 (0.0%) | 17 (9.8%) |
| Total | 33 (4.7%) | 100 (11.3%) |
Income Above Poverty by Sex and Age in Hico
According to the poverty statistics in Hico, males aged under 5 years and females aged under 5 years are the age groups that are most secure financially, with 100.0% of males and 100.0% of females in these age groups living above the poverty line.
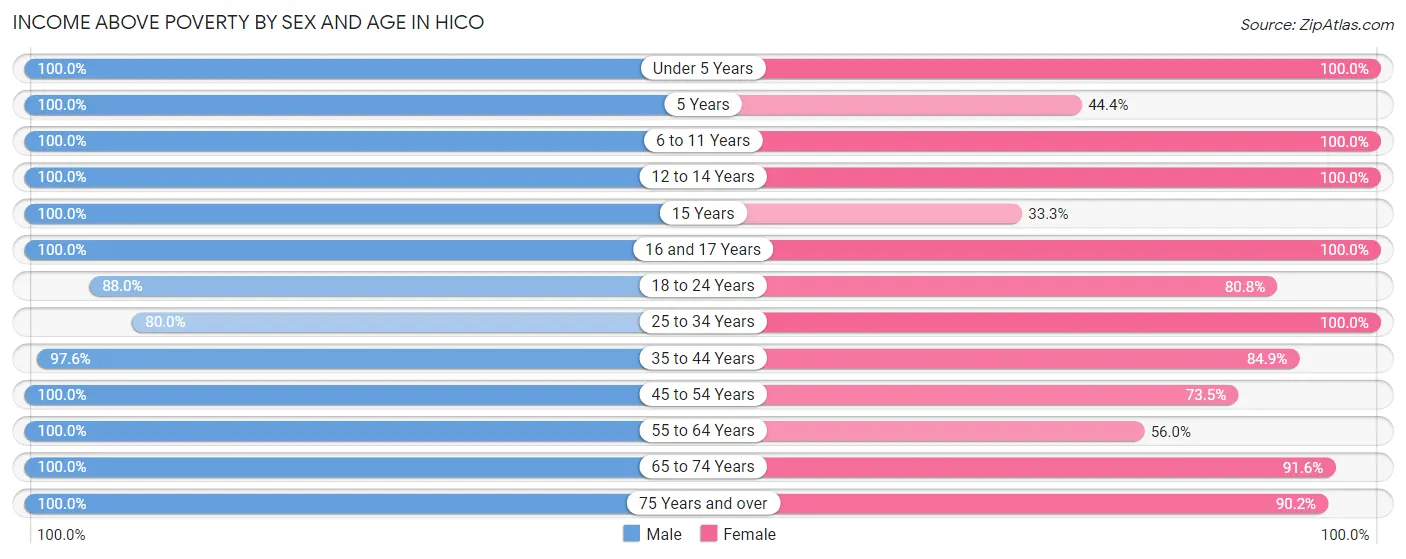
| Age Bracket | Male | Female |
| Under 5 Years | 29 (100.0%) | 172 (100.0%) |
| 5 Years | 74 (100.0%) | 4 (44.4%) |
| 6 to 11 Years | 70 (100.0%) | 73 (100.0%) |
| 12 to 14 Years | 22 (100.0%) | 13 (100.0%) |
| 15 Years | 14 (100.0%) | 4 (33.3%) |
| 16 and 17 Years | 11 (100.0%) | 28 (100.0%) |
| 18 to 24 Years | 22 (88.0%) | 21 (80.8%) |
| 25 to 34 Years | 112 (80.0%) | 114 (100.0%) |
| 35 to 44 Years | 82 (97.6%) | 56 (84.9%) |
| 45 to 54 Years | 61 (100.0%) | 25 (73.5%) |
| 55 to 64 Years | 72 (100.0%) | 51 (56.0%) |
| 65 to 74 Years | 34 (100.0%) | 65 (91.5%) |
| 75 Years and over | 60 (100.0%) | 157 (90.2%) |
| Total | 663 (95.3%) | 783 (88.7%) |
Income Below Poverty Among Married-Couple Families in Hico
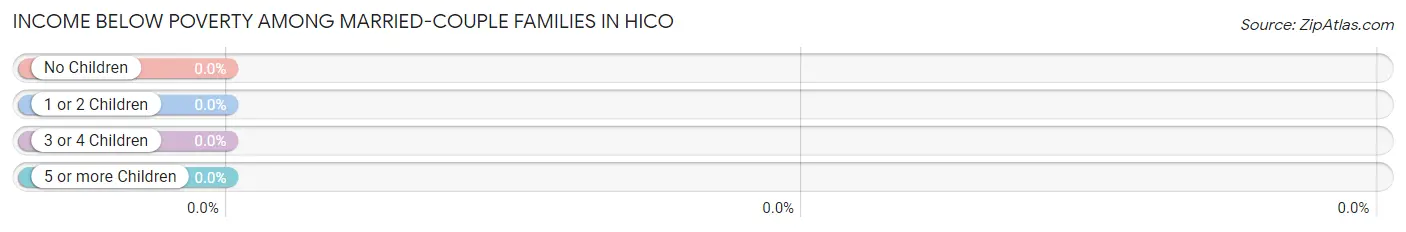
| Children | Above Poverty | Below Poverty |
| No Children | 121 (100.0%) | 0 (0.0%) |
| 1 or 2 Children | 49 (100.0%) | 0 (0.0%) |
| 3 or 4 Children | 31 (100.0%) | 0 (0.0%) |
| 5 or more Children | 0 (0.0%) | 0 (0.0%) |
| Total | 201 (100.0%) | 0 (0.0%) |
Income Below Poverty Among Single-Parent Households in Hico
According to the poverty data in Hico, 16.7% or 2 single-father households and 35.7% or 15 single-mother households are living below the poverty line. Among single-father households, those with no children have the highest poverty rate, with 2 households (33.3%) experiencing poverty. Likewise, among single-mother households, those with no children have the highest poverty rate, with 9 households (56.2%) falling below the poverty line.
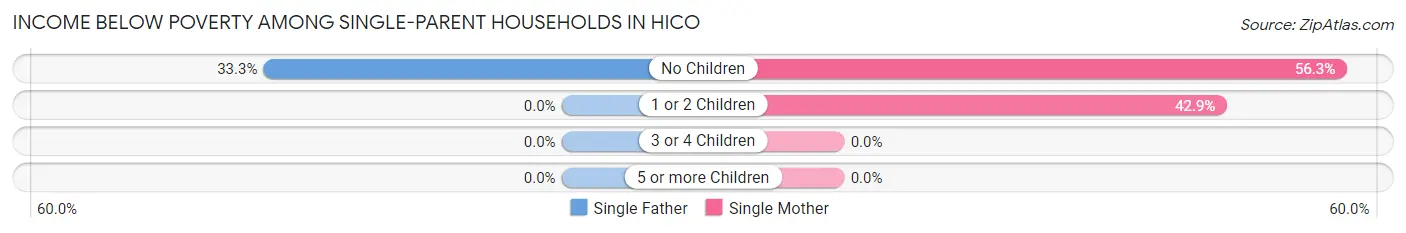
| Children | Single Father | Single Mother |
| No Children | 2 (33.3%) | 9 (56.2%) |
| 1 or 2 Children | 0 (0.0%) | 6 (42.9%) |
| 3 or 4 Children | 0 (0.0%) | 0 (0.0%) |
| 5 or more Children | 0 (0.0%) | 0 (0.0%) |
| Total | 2 (16.7%) | 15 (35.7%) |
Income Below Poverty Among Married-Couple vs Single-Parent Households in Hico
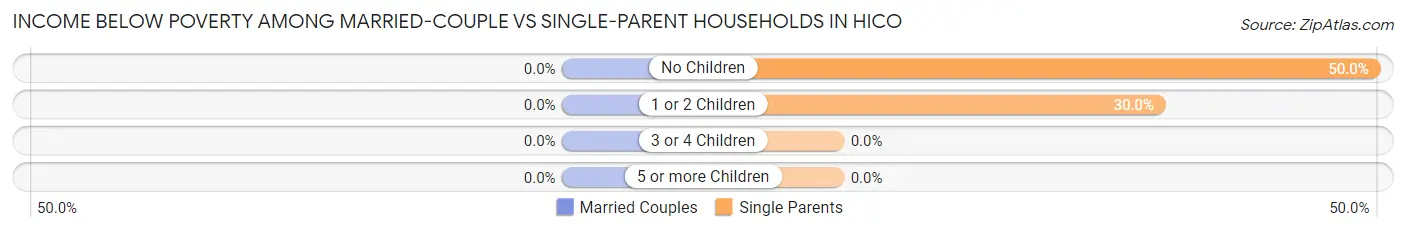
| Children | Married-Couple Families | Single-Parent Households |
| No Children | 0 (0.0%) | 11 (50.0%) |
| 1 or 2 Children | 0 (0.0%) | 6 (30.0%) |
| 3 or 4 Children | 0 (0.0%) | 0 (0.0%) |
| 5 or more Children | 0 (0.0%) | 0 (0.0%) |
| Total | 0 (0.0%) | 17 (31.5%) |
Race in Hico
The most populous races in Hico are White / Caucasian (1,513 | 93.0%), Hispanic or Latino (130 | 8.0%), and Two or more Races (57 | 3.5%).
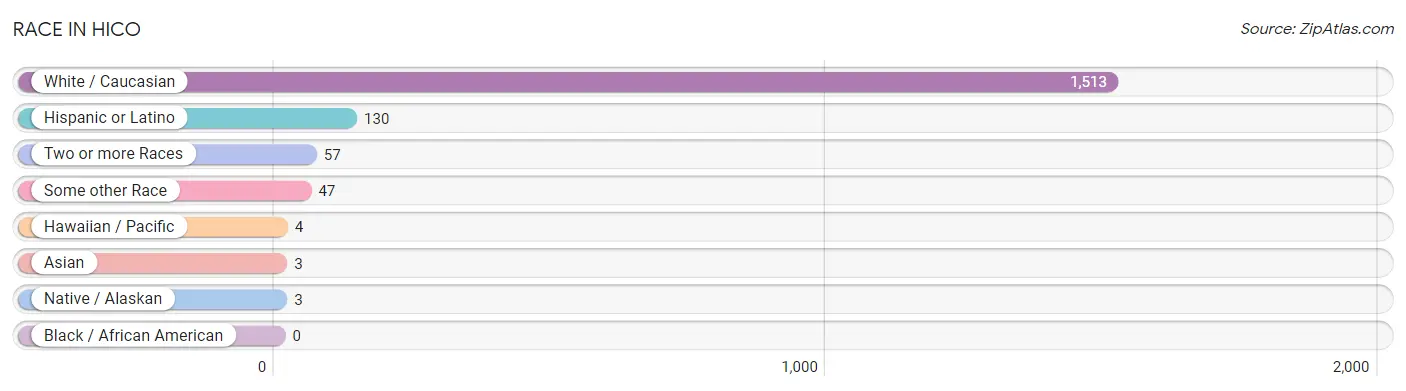
| Race | # Population | % Population |
| Asian | 3 | 0.2% |
| Black / African American | 0 | 0.0% |
| Hawaiian / Pacific | 4 | 0.3% |
| Hispanic or Latino | 130 | 8.0% |
| Native / Alaskan | 3 | 0.2% |
| White / Caucasian | 1,513 | 93.0% |
| Two or more Races | 57 | 3.5% |
| Some other Race | 47 | 2.9% |
| Total | 1,627 | 100.0% |
Ancestry in Hico
The most populous ancestries reported in Hico are English (139 | 8.5%), Mexican (130 | 8.0%), German (93 | 5.7%), European (67 | 4.1%), and American (63 | 3.9%), together accounting for 30.2% of all Hico residents.
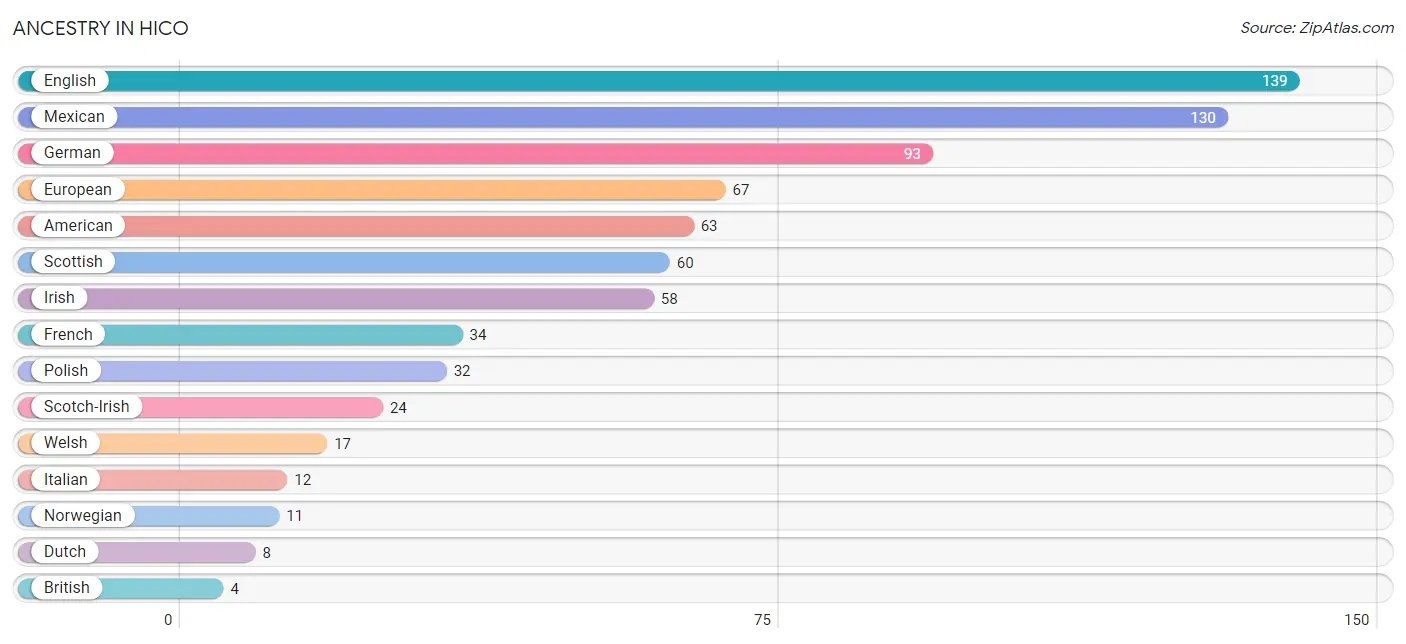
| Ancestry | # Population | % Population |
| American | 63 | 3.9% |
| Bhutanese | 1 | 0.1% |
| British | 4 | 0.3% |
| Choctaw | 3 | 0.2% |
| Comanche | 2 | 0.1% |
| Dutch | 8 | 0.5% |
| English | 139 | 8.5% |
| European | 67 | 4.1% |
| French | 34 | 2.1% |
| German | 93 | 5.7% |
| Greek | 2 | 0.1% |
| Indian (Asian) | 2 | 0.1% |
| Irish | 58 | 3.6% |
| Italian | 12 | 0.7% |
| Mexican | 130 | 8.0% |
| Native Hawaiian | 4 | 0.3% |
| Norwegian | 11 | 0.7% |
| Polish | 32 | 2.0% |
| Portuguese | 4 | 0.3% |
| Scotch-Irish | 24 | 1.5% |
| Scottish | 60 | 3.7% |
| Welsh | 17 | 1.0% | View All 22 Rows |
Immigrants in Hico
The most numerous immigrant groups reported in Hico came from Central America (51 | 3.1%), Latin America (51 | 3.1%), Mexico (51 | 3.1%), Asia (3 | 0.2%), and Eastern Asia (3 | 0.2%), together accounting for 9.8% of all Hico residents.
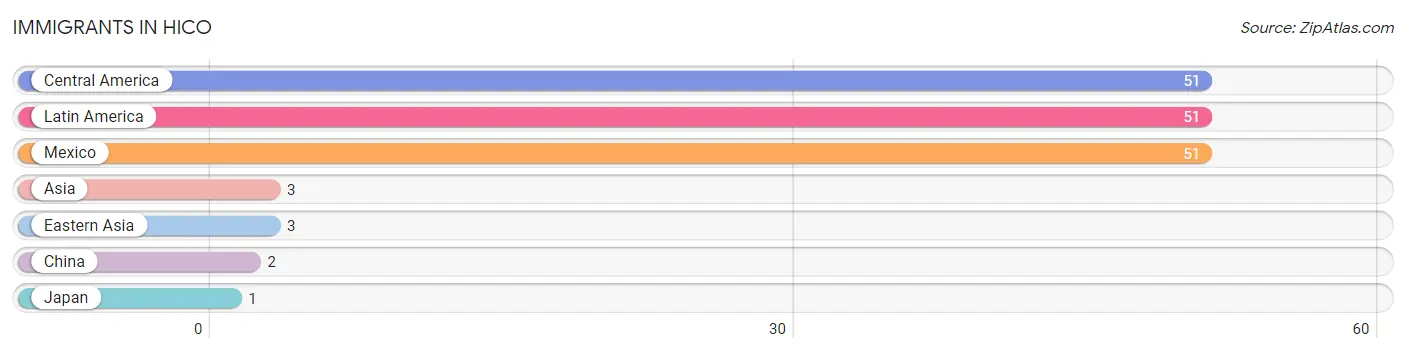
| Immigration Origin | # Population | % Population |
| Asia | 3 | 0.2% |
| Central America | 51 | 3.1% |
| China | 2 | 0.1% |
| Eastern Asia | 3 | 0.2% |
| Japan | 1 | 0.1% |
| Latin America | 51 | 3.1% |
| Mexico | 51 | 3.1% | View All 7 Rows |
Sex and Age in Hico
Sex and Age in Hico
The most populous age groups in Hico are 5 to 9 Years (133 | 18.8%) for men and Under 5 Years (172 | 18.7%) for women.
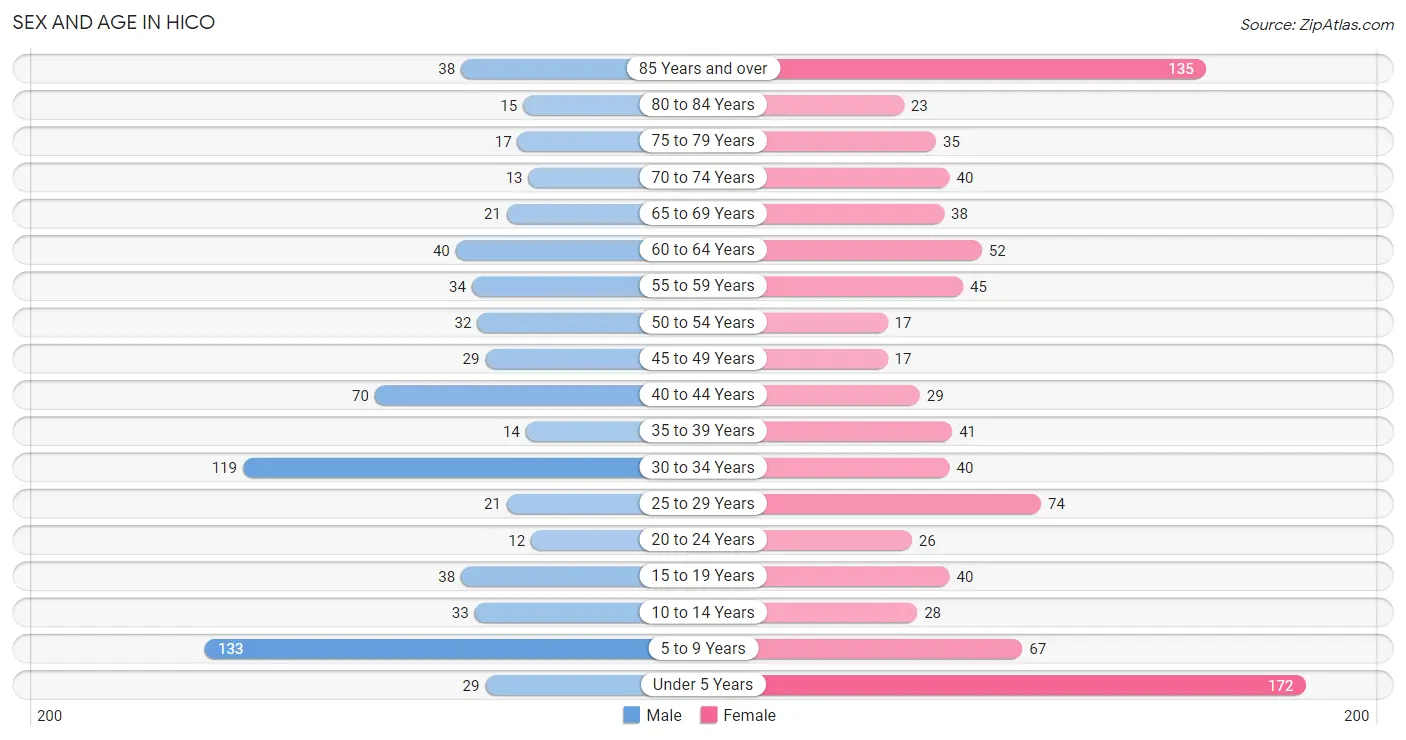
| Age Bracket | Male | Female |
| Under 5 Years | 29 (4.1%) | 172 (18.7%) |
| 5 to 9 Years | 133 (18.8%) | 67 (7.3%) |
| 10 to 14 Years | 33 (4.7%) | 28 (3.0%) |
| 15 to 19 Years | 38 (5.4%) | 40 (4.3%) |
| 20 to 24 Years | 12 (1.7%) | 26 (2.8%) |
| 25 to 29 Years | 21 (3.0%) | 74 (8.1%) |
| 30 to 34 Years | 119 (16.8%) | 40 (4.3%) |
| 35 to 39 Years | 14 (2.0%) | 41 (4.5%) |
| 40 to 44 Years | 70 (9.9%) | 29 (3.2%) |
| 45 to 49 Years | 29 (4.1%) | 17 (1.8%) |
| 50 to 54 Years | 32 (4.5%) | 17 (1.8%) |
| 55 to 59 Years | 34 (4.8%) | 45 (4.9%) |
| 60 to 64 Years | 40 (5.7%) | 52 (5.7%) |
| 65 to 69 Years | 21 (3.0%) | 38 (4.1%) |
| 70 to 74 Years | 13 (1.8%) | 40 (4.3%) |
| 75 to 79 Years | 17 (2.4%) | 35 (3.8%) |
| 80 to 84 Years | 15 (2.1%) | 23 (2.5%) |
| 85 Years and over | 38 (5.4%) | 135 (14.7%) |
| Total | 708 (100.0%) | 919 (100.0%) |
Families and Households in Hico
Median Family Size in Hico
The median family size in Hico is 4.96 persons per family, with single female/mother families (42 | 16.5%) accounting for the largest median family size of 7.33 persons per family. On the other hand, single male/father families (12 | 4.7%) represent the smallest median family size with 3.58 persons per family.
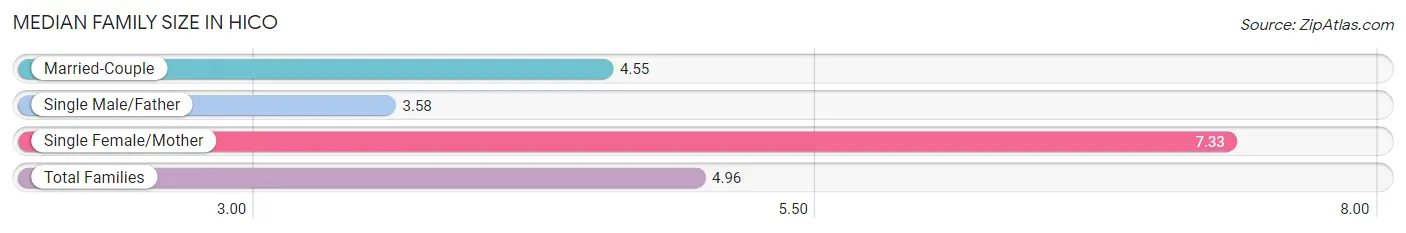
| Family Type | # Families | Family Size |
| Married-Couple | 201 (78.8%) | 4.55 |
| Single Male/Father | 12 (4.7%) | 3.58 |
| Single Female/Mother | 42 (16.5%) | 7.33 |
| Total Families | 255 (100.0%) | 4.96 |
Median Household Size in Hico
The median household size in Hico is 2.85 persons per household, with single female/mother households (42 | 7.6%) accounting for the largest median household size of 7.43 persons per household. non-family households (300 | 54.0%) represent the smallest median household size with 1.01 persons per household.
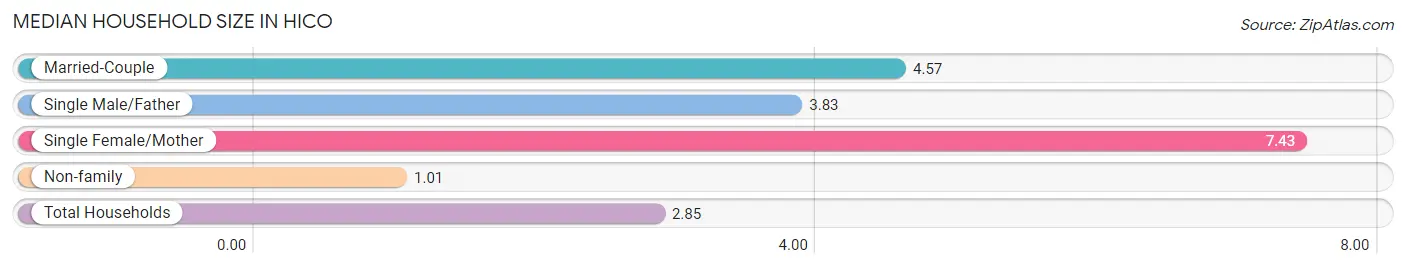
| Household Type | # Households | Household Size |
| Married-Couple | 201 (36.2%) | 4.57 |
| Single Male/Father | 12 (2.2%) | 3.83 |
| Single Female/Mother | 42 (7.6%) | 7.43 |
| Non-family | 300 (54.0%) | 1.01 |
| Total Households | 555 (100.0%) | 2.85 |
Household Size by Marriage Status in Hico
Out of a total of 555 households in Hico, 255 (46.0%) are family households, while 300 (54.0%) are nonfamily households. The most numerous type of family households are 2-person households, comprising 136, and the most common type of nonfamily households are 1-person households, comprising 298.
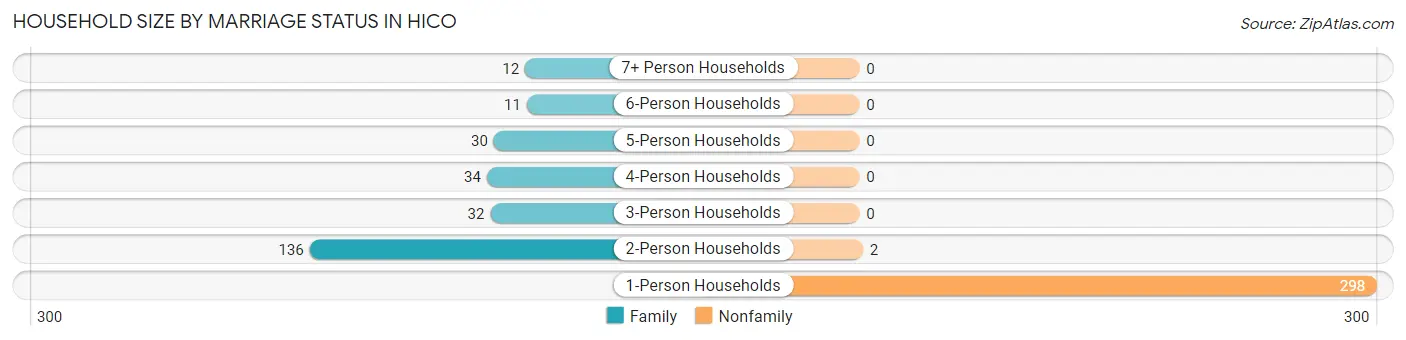
| Household Size | Family Households | Nonfamily Households |
| 1-Person Households | - | 298 (53.7%) |
| 2-Person Households | 136 (24.5%) | 2 (0.4%) |
| 3-Person Households | 32 (5.8%) | 0 (0.0%) |
| 4-Person Households | 34 (6.1%) | 0 (0.0%) |
| 5-Person Households | 30 (5.4%) | 0 (0.0%) |
| 6-Person Households | 11 (2.0%) | 0 (0.0%) |
| 7+ Person Households | 12 (2.2%) | 0 (0.0%) |
| Total | 255 (46.0%) | 300 (54.0%) |
Female Fertility in Hico
Fertility by Age in Hico
Average fertility rate in Hico is 41.0 births per 1,000 women. Women in the age bracket of 20 to 34 years have the highest fertility rate with 79.0 births per 1,000 women. Women in the age bracket of 20 to 34 years acount for 100.0% of all women with births.
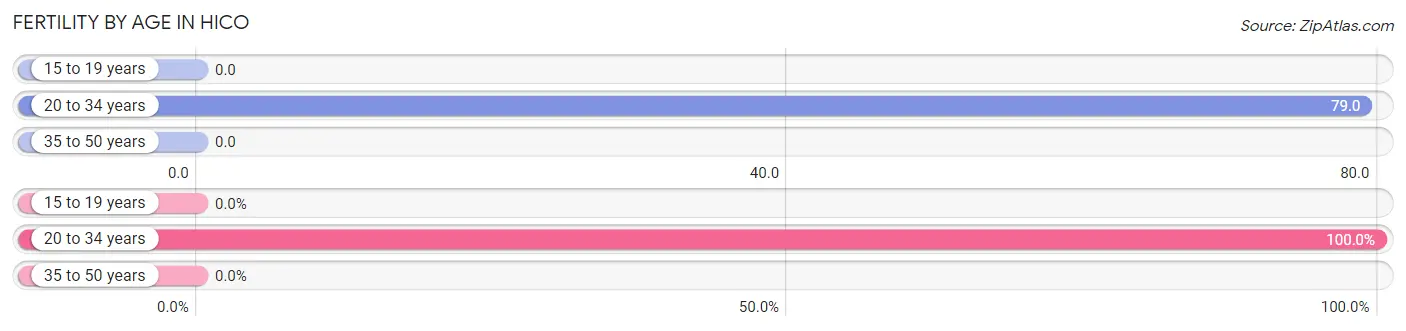
| Age Bracket | Women with Births | Births / 1,000 Women |
| 15 to 19 years | 0 (0.0%) | 0.0 |
| 20 to 34 years | 11 (100.0%) | 79.0 |
| 35 to 50 years | 0 (0.0%) | 0.0 |
| Total | 11 (100.0%) | 41.0 |
Fertility by Age by Marriage Status in Hico
72.7% of women with births (11) in Hico are married. The highest percentage of unmarried women with births falls into 20 to 34 years age bracket with 27.3% of them unmarried at the time of birth, while the lowest percentage of unmarried women with births belong to 20 to 34 years age bracket with 27.3% of them unmarried.
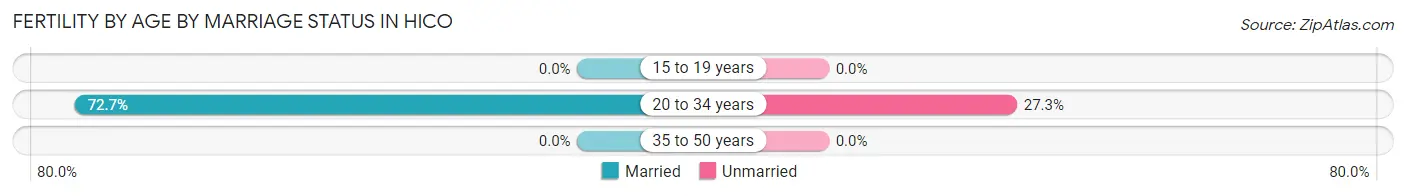
| Age Bracket | Married | Unmarried |
| 15 to 19 years | 0 (0.0%) | 0 (0.0%) |
| 20 to 34 years | 8 (72.7%) | 3 (27.3%) |
| 35 to 50 years | 0 (0.0%) | 0 (0.0%) |
| Total | 8 (72.7%) | 3 (27.3%) |
Fertility by Education in Hico
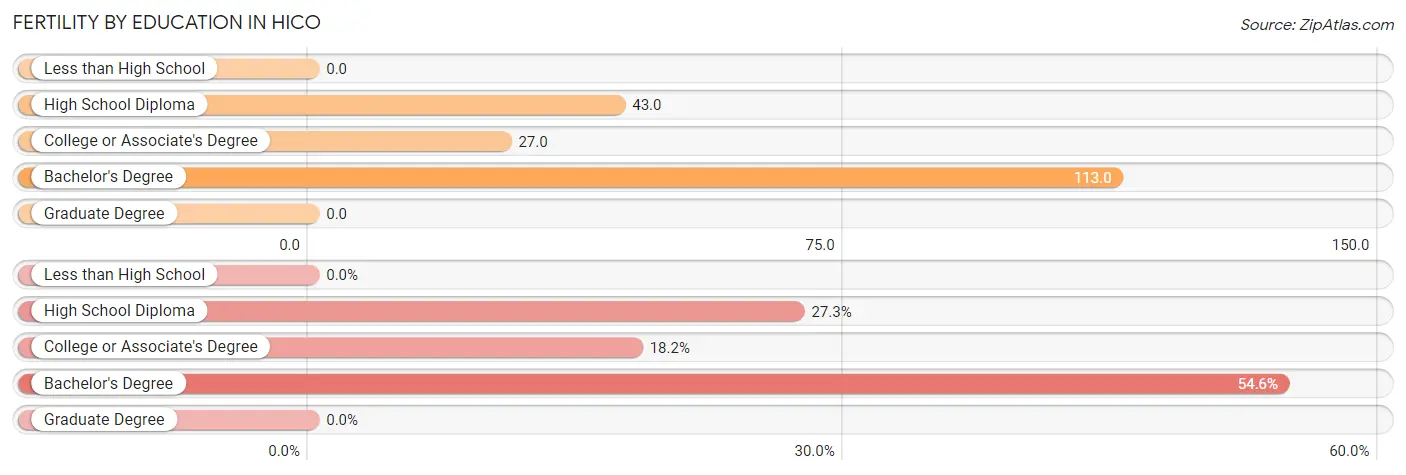
| Educational Attainment | Women with Births | Births / 1,000 Women |
| Less than High School | 0 (0.0%) | 0.0 |
| High School Diploma | 3 (27.3%) | 43.0 |
| College or Associate's Degree | 2 (18.2%) | 27.0 |
| Bachelor's Degree | 6 (54.5%) | 113.0 |
| Graduate Degree | 0 (0.0%) | 0.0 |
| Total | 11 (100.0%) | 41.0 |
Fertility by Education by Marriage Status in Hico
27.3% of women with births in Hico are unmarried. Women with the educational attainment of college or associate's degree are most likely to be married with 100.0% of them married at childbirth, while women with the educational attainment of high school diploma are least likely to be married with 100.0% of them unmarried at childbirth.
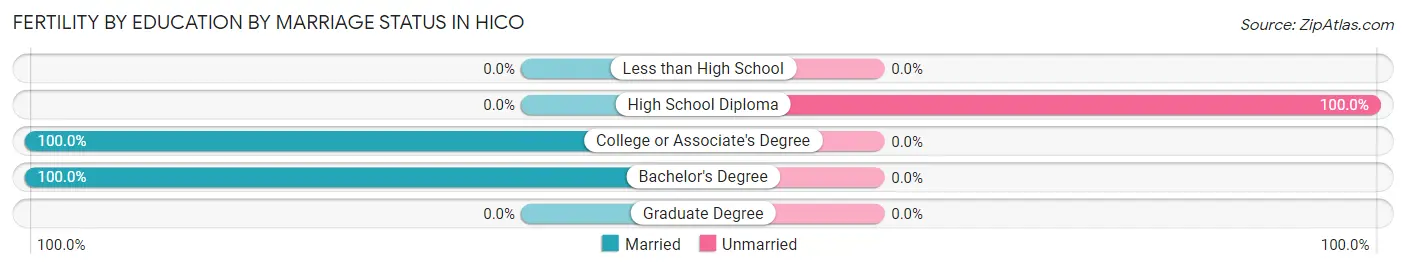
| Educational Attainment | Married | Unmarried |
| Less than High School | 0 (0.0%) | 0 (0.0%) |
| High School Diploma | 0 (0.0%) | 3 (100.0%) |
| College or Associate's Degree | 2 (100.0%) | 0 (0.0%) |
| Bachelor's Degree | 6 (100.0%) | 0 (0.0%) |
| Graduate Degree | 0 (0.0%) | 0 (0.0%) |
| Total | 8 (72.7%) | 3 (27.3%) |
Employment Characteristics in Hico
Employment by Class of Employer in Hico
Among the 479 employed individuals in Hico, private company employees (349 | 72.9%), self-employed (not incorporated) (40 | 8.4%), and state government employees (36 | 7.5%) make up the most common classes of employment.
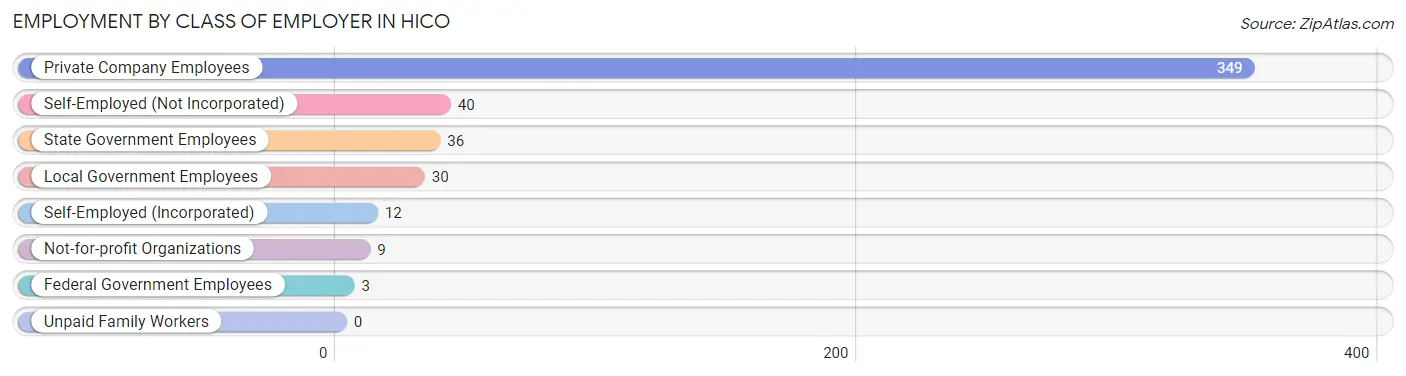
| Employer Class | # Employees | % Employees |
| Private Company Employees | 349 | 72.9% |
| Self-Employed (Incorporated) | 12 | 2.5% |
| Self-Employed (Not Incorporated) | 40 | 8.4% |
| Not-for-profit Organizations | 9 | 1.9% |
| Local Government Employees | 30 | 6.3% |
| State Government Employees | 36 | 7.5% |
| Federal Government Employees | 3 | 0.6% |
| Unpaid Family Workers | 0 | 0.0% |
| Total | 479 | 100.0% |
Employment Status by Age in Hico
According to the labor force statistics for Hico, out of the total population over 16 years of age (1,139), 47.8% or 544 individuals are in the labor force, with 4.2% or 23 of them unemployed. The age group with the highest labor force participation rate is 25 to 29 years, with 94.7% or 90 individuals in the labor force. Within the labor force, the 16 to 19 years age range has the highest percentage of unemployed individuals, with 63.9% or 23 of them being unemployed.
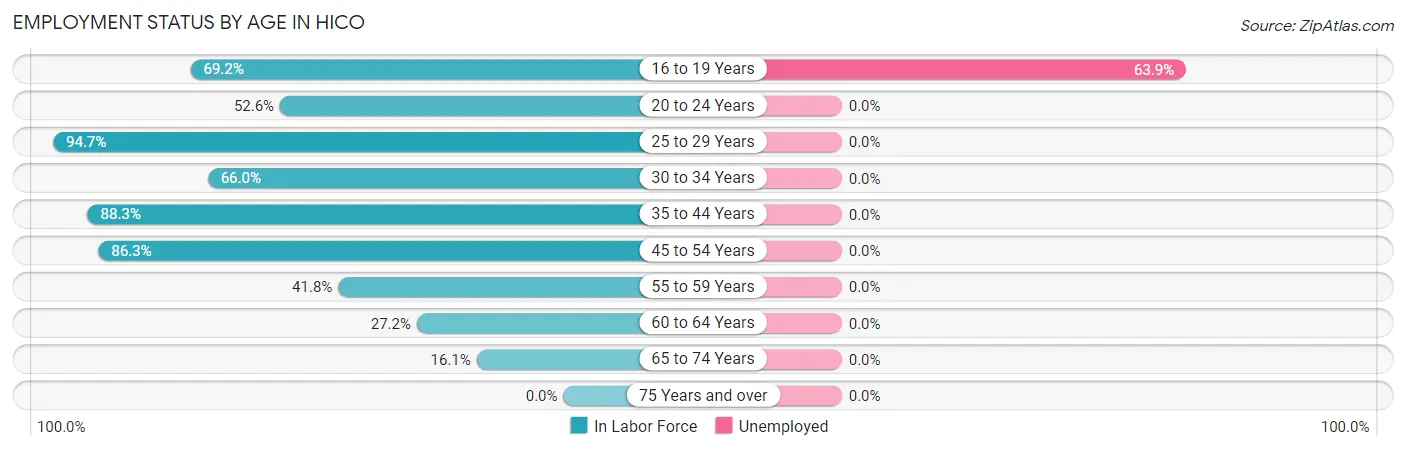
| Age Bracket | In Labor Force | Unemployed |
| 16 to 19 Years | 36 (69.2%) | 23 (63.9%) |
| 20 to 24 Years | 20 (52.6%) | 0 (0.0%) |
| 25 to 29 Years | 90 (94.7%) | 0 (0.0%) |
| 30 to 34 Years | 105 (66.0%) | 0 (0.0%) |
| 35 to 44 Years | 136 (88.3%) | 0 (0.0%) |
| 45 to 54 Years | 82 (86.3%) | 0 (0.0%) |
| 55 to 59 Years | 33 (41.8%) | 0 (0.0%) |
| 60 to 64 Years | 25 (27.2%) | 0 (0.0%) |
| 65 to 74 Years | 18 (16.1%) | 0 (0.0%) |
| 75 Years and over | 0 (0.0%) | 0 (0.0%) |
| Total | 544 (47.8%) | 23 (4.2%) |
Employment Status by Educational Attainment in Hico
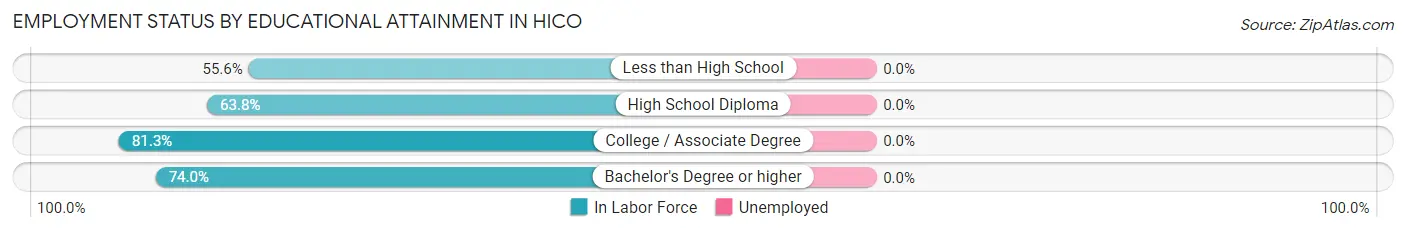
| Educational Attainment | In Labor Force | Unemployed |
| Less than High School | 40 (55.6%) | 0 (0.0%) |
| High School Diploma | 180 (63.8%) | 0 (0.0%) |
| College / Associate Degree | 157 (81.3%) | 0 (0.0%) |
| Bachelor's Degree or higher | 94 (74.0%) | 0 (0.0%) |
| Total | 471 (69.9%) | 0 (0.0%) |
Employment Occupations by Sex in Hico
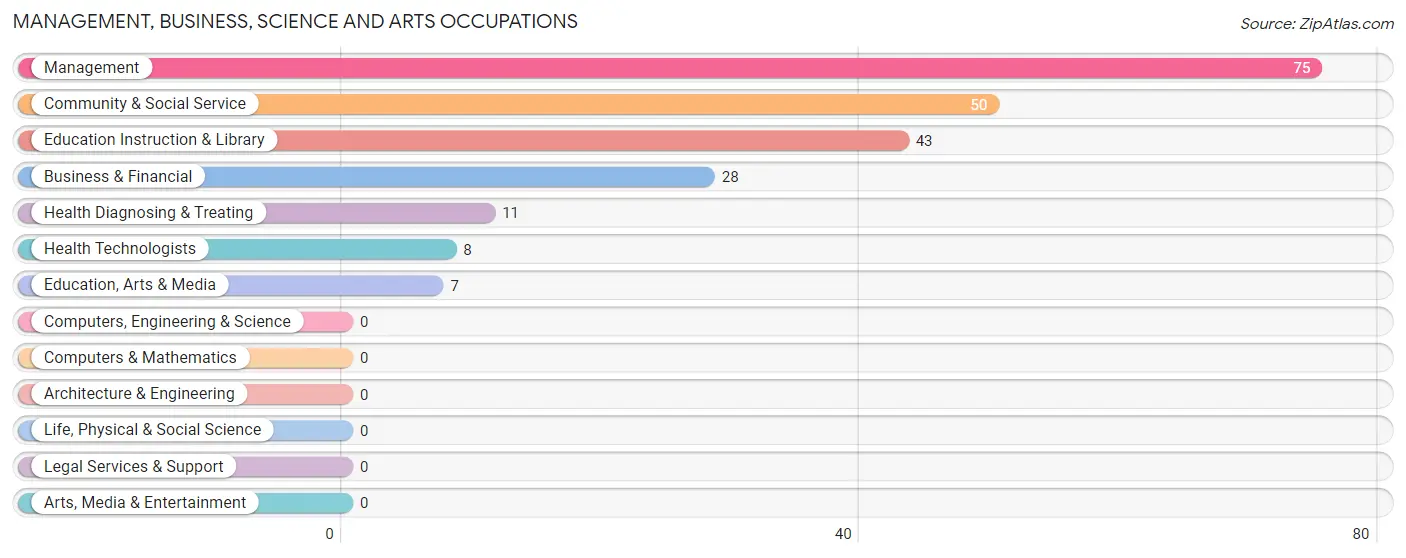
Management, Business, Science and Arts Occupations
The most common Management, Business, Science and Arts occupations in Hico are Management (75 | 14.4%), Community & Social Service (50 | 9.6%), Education Instruction & Library (43 | 8.2%), Business & Financial (28 | 5.4%), and Health Diagnosing & Treating (11 | 2.1%).
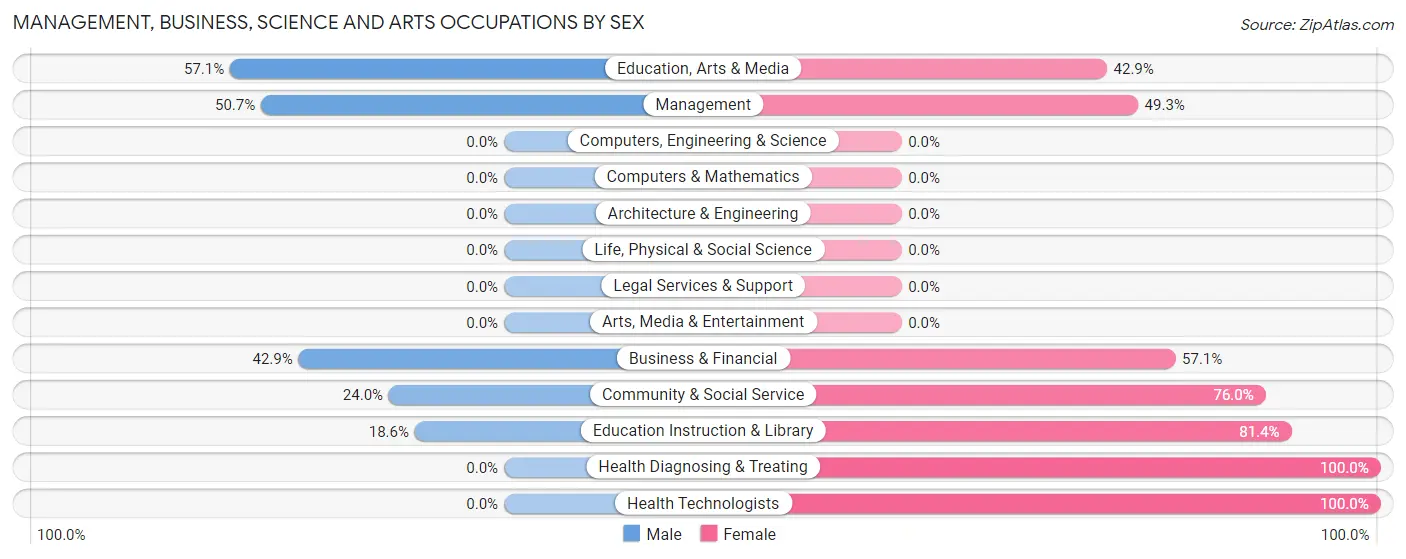
Management, Business, Science and Arts Occupations by Sex
Within the Management, Business, Science and Arts occupations in Hico, the most male-oriented occupations are Education, Arts & Media (57.1%), Management (50.7%), and Business & Financial (42.9%), while the most female-oriented occupations are Health Diagnosing & Treating (100.0%), Health Technologists (100.0%), and Education Instruction & Library (81.4%).
| Occupation | Male | Female |
| Management | 38 (50.7%) | 37 (49.3%) |
| Business & Financial | 12 (42.9%) | 16 (57.1%) |
| Computers, Engineering & Science | 0 (0.0%) | 0 (0.0%) |
| Computers & Mathematics | 0 (0.0%) | 0 (0.0%) |
| Architecture & Engineering | 0 (0.0%) | 0 (0.0%) |
| Life, Physical & Social Science | 0 (0.0%) | 0 (0.0%) |
| Community & Social Service | 12 (24.0%) | 38 (76.0%) |
| Education, Arts & Media | 4 (57.1%) | 3 (42.9%) |
| Legal Services & Support | 0 (0.0%) | 0 (0.0%) |
| Education Instruction & Library | 8 (18.6%) | 35 (81.4%) |
| Arts, Media & Entertainment | 0 (0.0%) | 0 (0.0%) |
| Health Diagnosing & Treating | 0 (0.0%) | 11 (100.0%) |
| Health Technologists | 0 (0.0%) | 8 (100.0%) |
| Total (Category) | 62 (37.8%) | 102 (62.2%) |
| Total (Overall) | 313 (60.0%) | 209 (40.0%) |
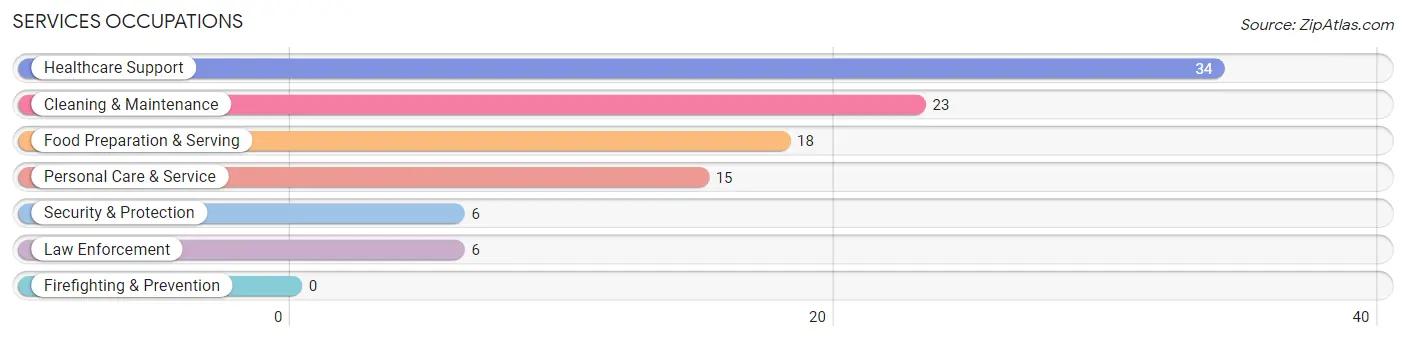
Services Occupations
The most common Services occupations in Hico are Healthcare Support (34 | 6.5%), Cleaning & Maintenance (23 | 4.4%), Food Preparation & Serving (18 | 3.5%), Personal Care & Service (15 | 2.9%), and Security & Protection (6 | 1.1%).
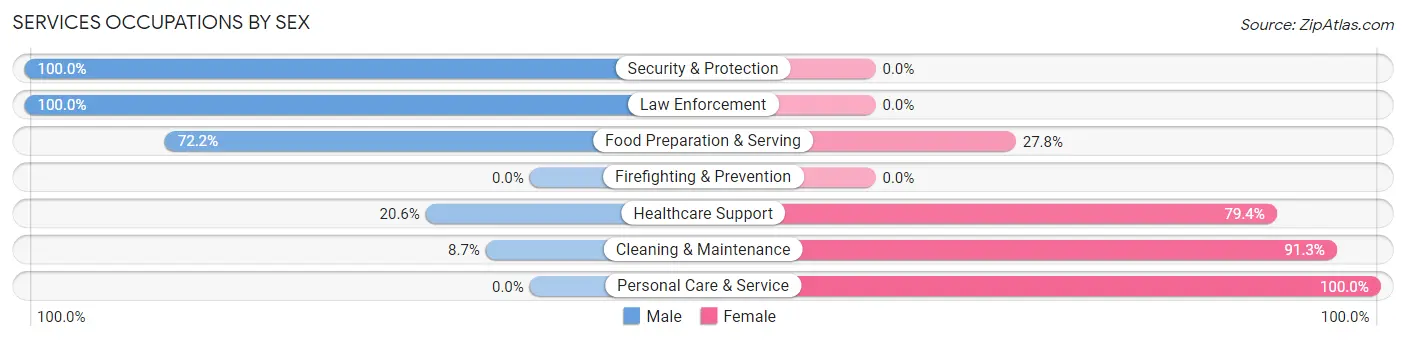
Services Occupations by Sex
Within the Services occupations in Hico, the most male-oriented occupations are Security & Protection (100.0%), Law Enforcement (100.0%), and Food Preparation & Serving (72.2%), while the most female-oriented occupations are Personal Care & Service (100.0%), Cleaning & Maintenance (91.3%), and Healthcare Support (79.4%).
| Occupation | Male | Female |
| Healthcare Support | 7 (20.6%) | 27 (79.4%) |
| Security & Protection | 6 (100.0%) | 0 (0.0%) |
| Firefighting & Prevention | 0 (0.0%) | 0 (0.0%) |
| Law Enforcement | 6 (100.0%) | 0 (0.0%) |
| Food Preparation & Serving | 13 (72.2%) | 5 (27.8%) |
| Cleaning & Maintenance | 2 (8.7%) | 21 (91.3%) |
| Personal Care & Service | 0 (0.0%) | 15 (100.0%) |
| Total (Category) | 28 (29.2%) | 68 (70.8%) |
| Total (Overall) | 313 (60.0%) | 209 (40.0%) |
Sales and Office Occupations
The most common Sales and Office occupations in Hico are Sales & Related (38 | 7.3%), and Office & Administration (26 | 5.0%).
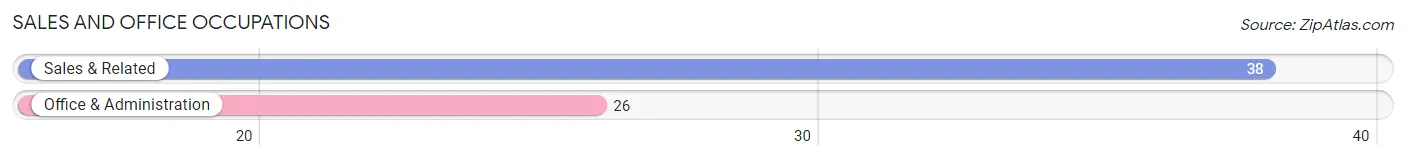
Sales and Office Occupations by Sex
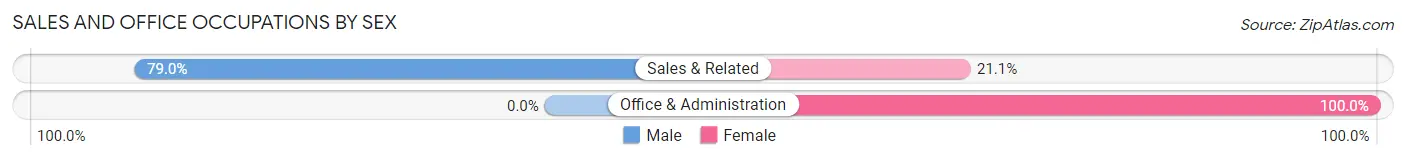
| Occupation | Male | Female |
| Sales & Related | 30 (78.9%) | 8 (21.0%) |
| Office & Administration | 0 (0.0%) | 26 (100.0%) |
| Total (Category) | 30 (46.9%) | 34 (53.1%) |
| Total (Overall) | 313 (60.0%) | 209 (40.0%) |
Natural Resources, Construction and Maintenance Occupations
The most common Natural Resources, Construction and Maintenance occupations in Hico are Installation, Maintenance & Repair (28 | 5.4%), Farming, Fishing & Forestry (22 | 4.2%), and Construction & Extraction (14 | 2.7%).
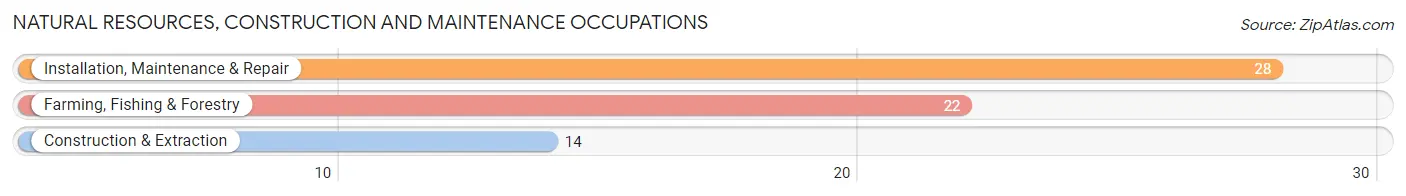
Natural Resources, Construction and Maintenance Occupations by Sex
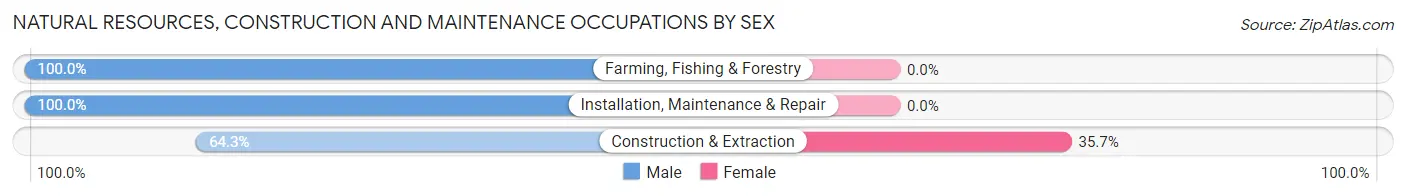
| Occupation | Male | Female |
| Farming, Fishing & Forestry | 22 (100.0%) | 0 (0.0%) |
| Construction & Extraction | 9 (64.3%) | 5 (35.7%) |
| Installation, Maintenance & Repair | 28 (100.0%) | 0 (0.0%) |
| Total (Category) | 59 (92.2%) | 5 (7.8%) |
| Total (Overall) | 313 (60.0%) | 209 (40.0%) |
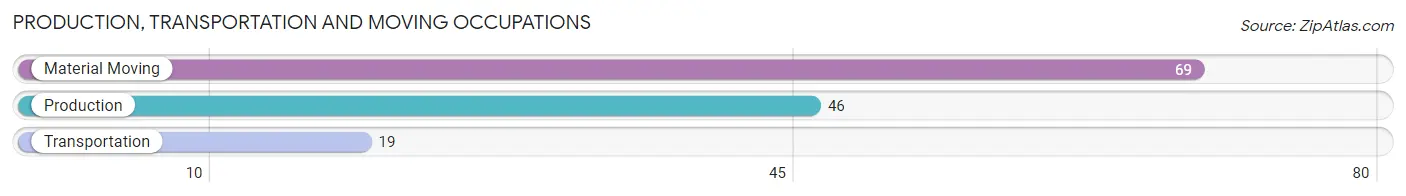
Production, Transportation and Moving Occupations
The most common Production, Transportation and Moving occupations in Hico are Material Moving (69 | 13.2%), Production (46 | 8.8%), and Transportation (19 | 3.6%).
Production, Transportation and Moving Occupations by Sex
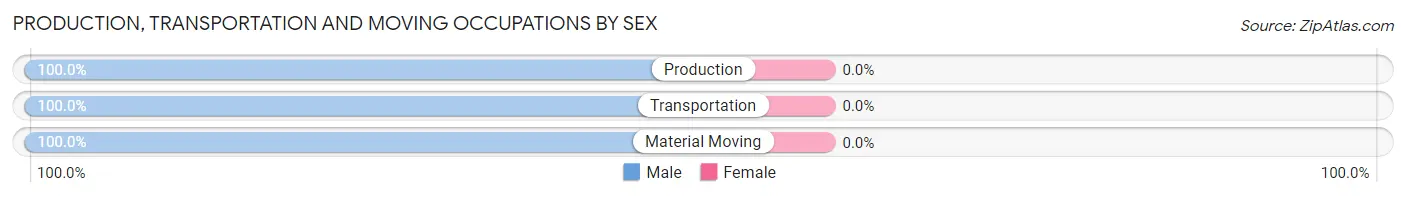
| Occupation | Male | Female |
| Production | 46 (100.0%) | 0 (0.0%) |
| Transportation | 19 (100.0%) | 0 (0.0%) |
| Material Moving | 69 (100.0%) | 0 (0.0%) |
| Total (Category) | 134 (100.0%) | 0 (0.0%) |
| Total (Overall) | 313 (60.0%) | 209 (40.0%) |
Employment Industries by Sex in Hico
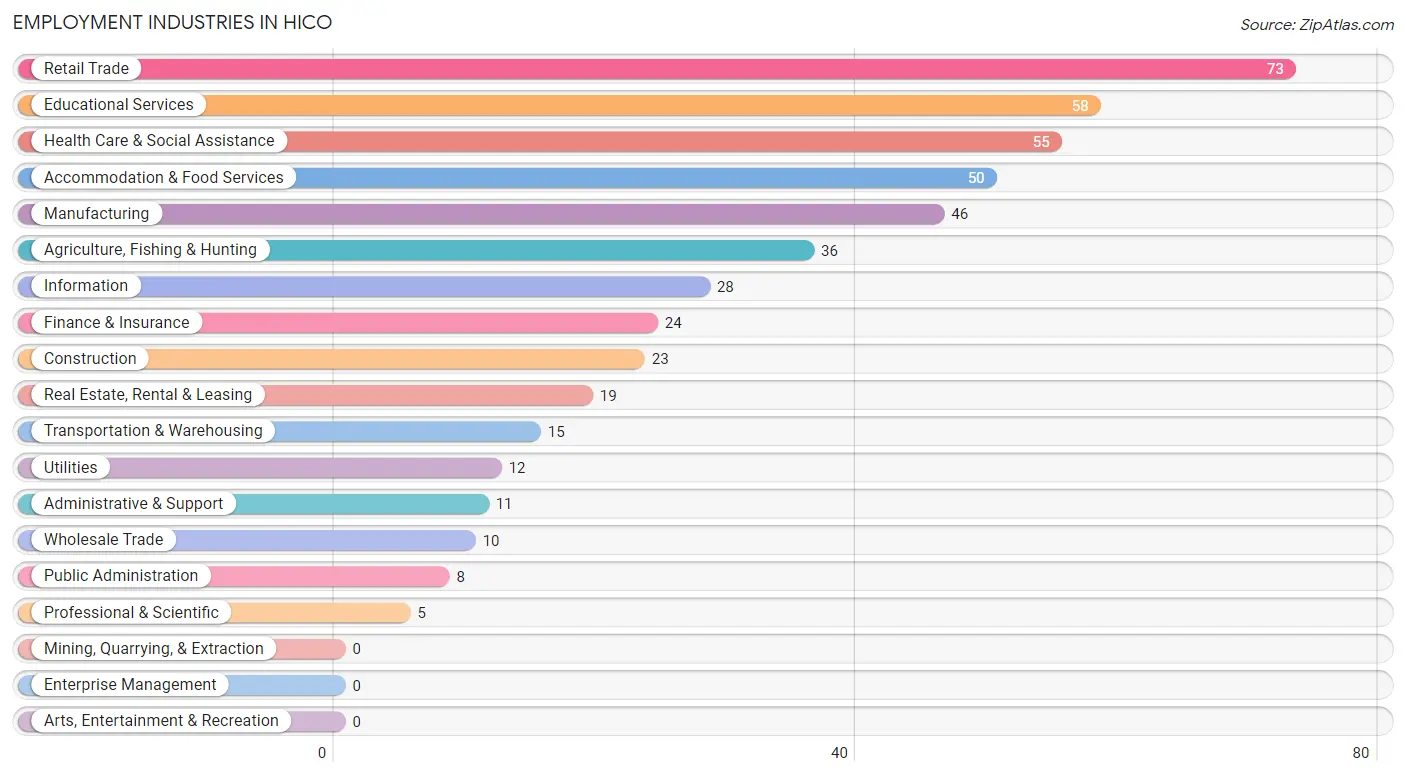
Employment Industries in Hico
The major employment industries in Hico include Retail Trade (73 | 14.0%), Educational Services (58 | 11.1%), Health Care & Social Assistance (55 | 10.5%), Accommodation & Food Services (50 | 9.6%), and Manufacturing (46 | 8.8%).
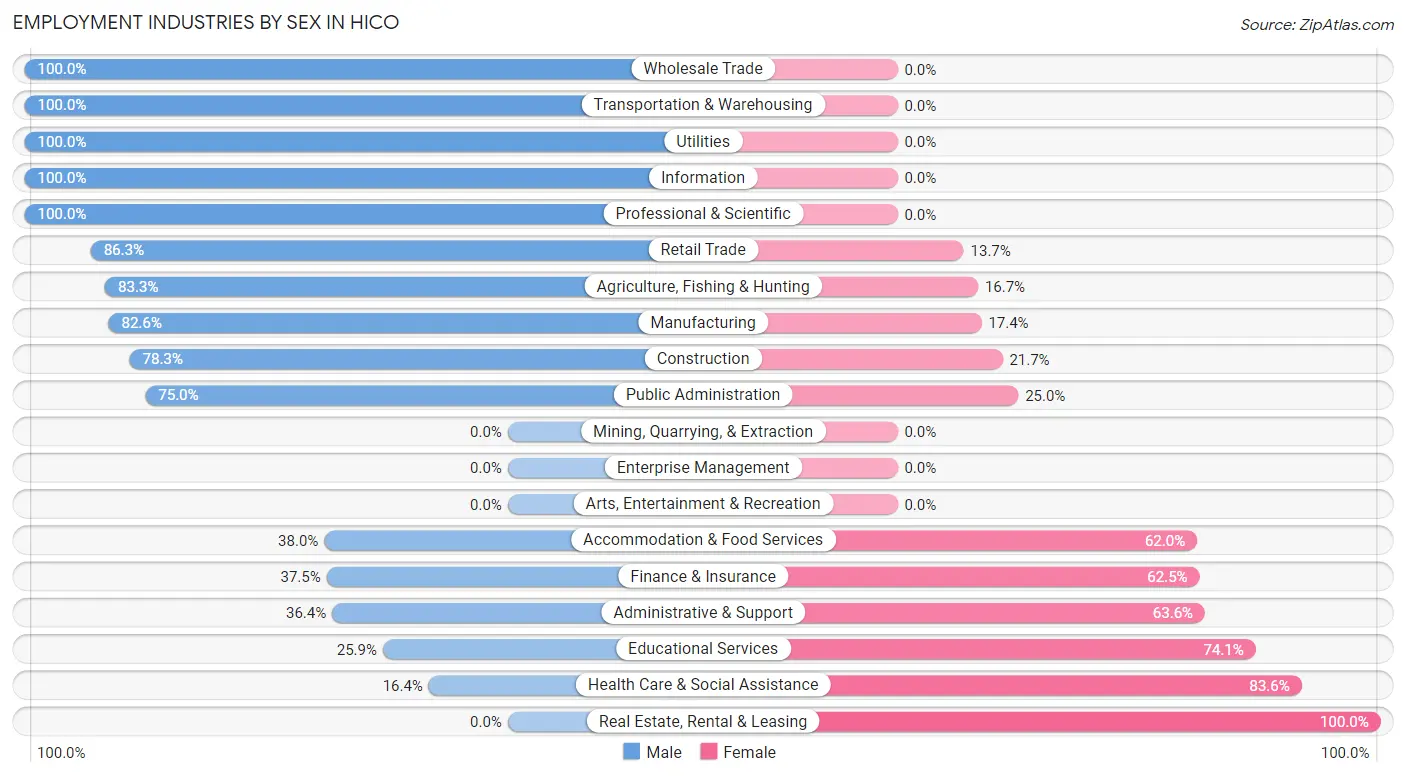
Employment Industries by Sex in Hico
The Hico industries that see more men than women are Wholesale Trade (100.0%), Transportation & Warehousing (100.0%), and Utilities (100.0%), whereas the industries that tend to have a higher number of women are Real Estate, Rental & Leasing (100.0%), Health Care & Social Assistance (83.6%), and Educational Services (74.1%).
| Industry | Male | Female |
| Agriculture, Fishing & Hunting | 30 (83.3%) | 6 (16.7%) |
| Mining, Quarrying, & Extraction | 0 (0.0%) | 0 (0.0%) |
| Construction | 18 (78.3%) | 5 (21.7%) |
| Manufacturing | 38 (82.6%) | 8 (17.4%) |
| Wholesale Trade | 10 (100.0%) | 0 (0.0%) |
| Retail Trade | 63 (86.3%) | 10 (13.7%) |
| Transportation & Warehousing | 15 (100.0%) | 0 (0.0%) |
| Utilities | 12 (100.0%) | 0 (0.0%) |
| Information | 28 (100.0%) | 0 (0.0%) |
| Finance & Insurance | 9 (37.5%) | 15 (62.5%) |
| Real Estate, Rental & Leasing | 0 (0.0%) | 19 (100.0%) |
| Professional & Scientific | 5 (100.0%) | 0 (0.0%) |
| Enterprise Management | 0 (0.0%) | 0 (0.0%) |
| Administrative & Support | 4 (36.4%) | 7 (63.6%) |
| Educational Services | 15 (25.9%) | 43 (74.1%) |
| Health Care & Social Assistance | 9 (16.4%) | 46 (83.6%) |
| Arts, Entertainment & Recreation | 0 (0.0%) | 0 (0.0%) |
| Accommodation & Food Services | 19 (38.0%) | 31 (62.0%) |
| Public Administration | 6 (75.0%) | 2 (25.0%) |
| Total | 313 (60.0%) | 209 (40.0%) |
Education in Hico
School Enrollment in Hico
The most common levels of schooling among the 379 students in Hico are elementary school (123 | 32.5%), high school (78 | 20.6%), and middle school (59 | 15.6%).
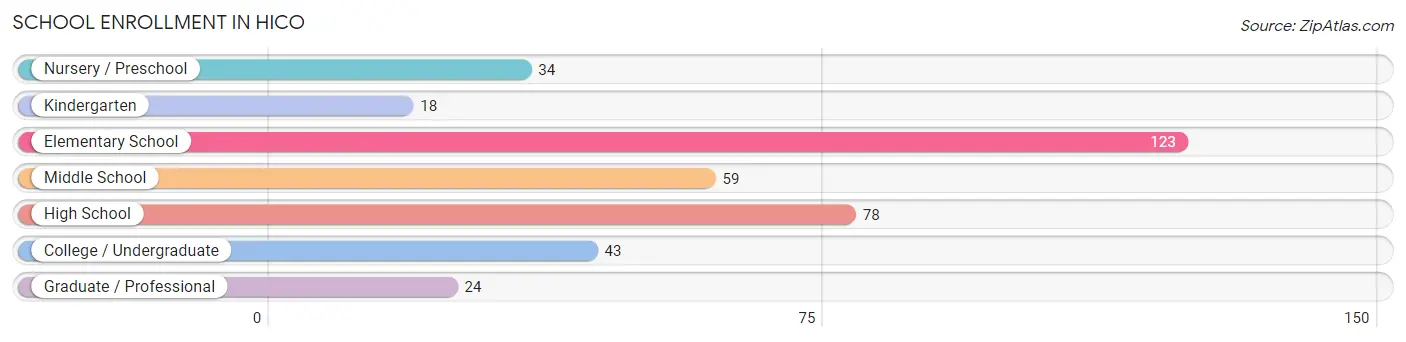
| School Level | # Students | % Students |
| Nursery / Preschool | 34 | 9.0% |
| Kindergarten | 18 | 4.8% |
| Elementary School | 123 | 32.5% |
| Middle School | 59 | 15.6% |
| High School | 78 | 20.6% |
| College / Undergraduate | 43 | 11.4% |
| Graduate / Professional | 24 | 6.3% |
| Total | 379 | 100.0% |
School Enrollment by Age by Funding Source in Hico
Out of a total of 379 students who are enrolled in schools in Hico, 41 (10.8%) attend a private institution, while the remaining 338 (89.2%) are enrolled in public schools. The age group of 25 to 34 year olds has the highest likelihood of being enrolled in private schools, with 27 (60.0% in the age bracket) enrolled. Conversely, the age group of 10 to 14 year olds has the lowest likelihood of being enrolled in a private school, with 61 (100.0% in the age bracket) attending a public institution.
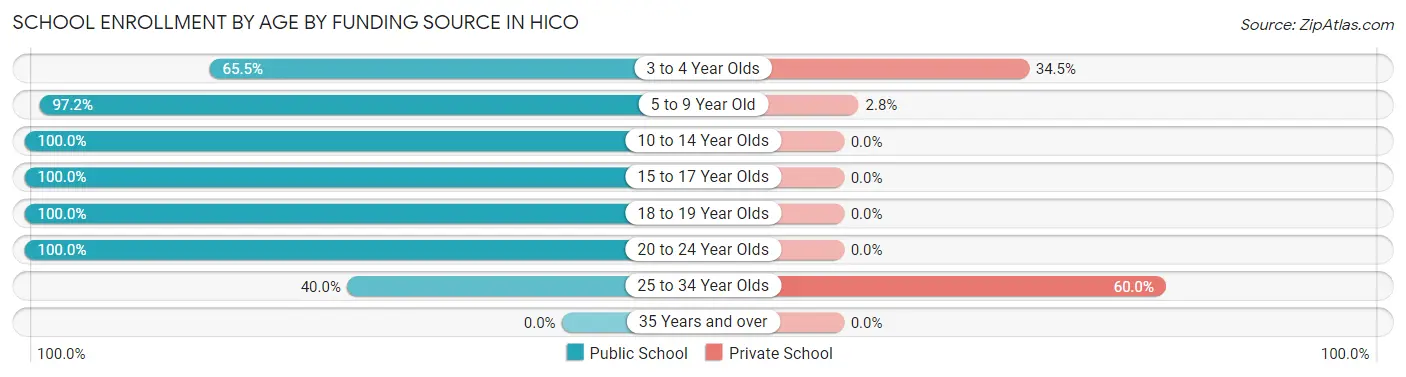
| Age Bracket | Public School | Private School |
| 3 to 4 Year Olds | 19 (65.5%) | 10 (34.5%) |
| 5 to 9 Year Old | 140 (97.2%) | 4 (2.8%) |
| 10 to 14 Year Olds | 61 (100.0%) | 0 (0.0%) |
| 15 to 17 Year Olds | 65 (100.0%) | 0 (0.0%) |
| 18 to 19 Year Olds | 13 (100.0%) | 0 (0.0%) |
| 20 to 24 Year Olds | 22 (100.0%) | 0 (0.0%) |
| 25 to 34 Year Olds | 18 (40.0%) | 27 (60.0%) |
| 35 Years and over | 0 (0.0%) | 0 (0.0%) |
| Total | 338 (89.2%) | 41 (10.8%) |
Educational Attainment by Field of Study in Hico
Education (58 | 26.1%), bio, nature & agricultural (53 | 23.9%), literature & languages (21 | 9.5%), arts & humanities (19 | 8.6%), and business (17 | 7.7%) are the most common fields of study among 222 individuals in Hico who have obtained a bachelor's degree or higher.
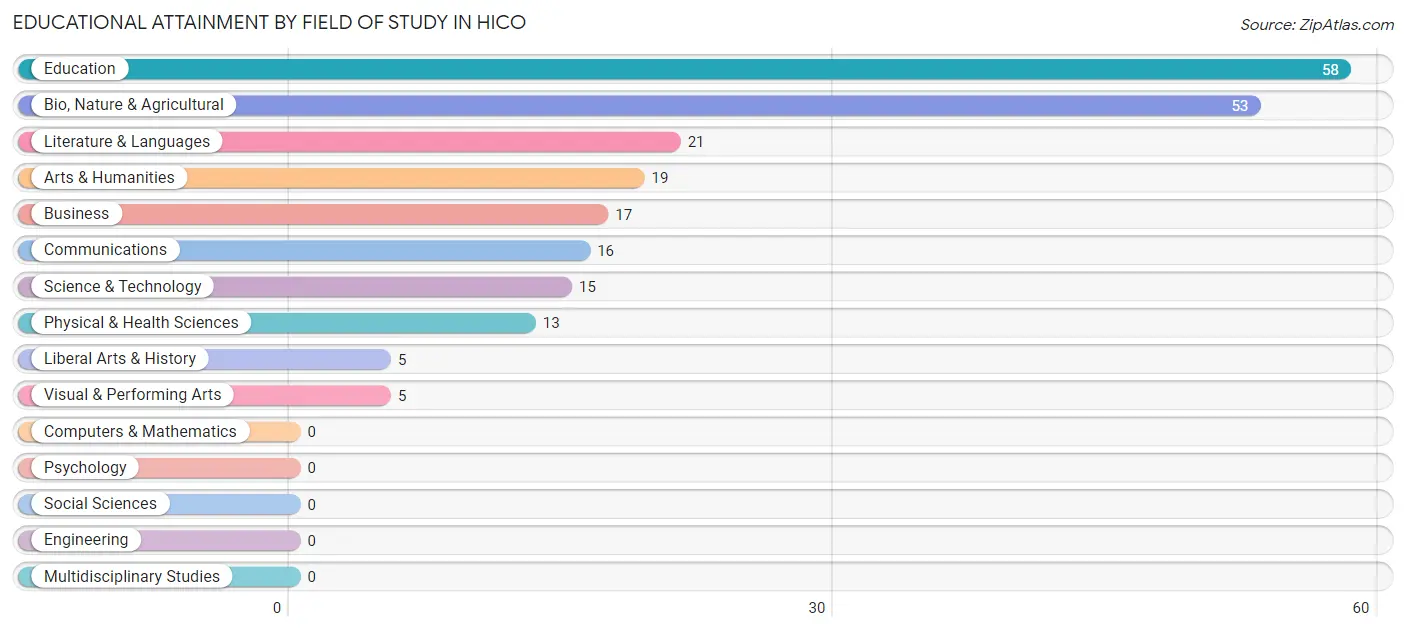
| Field of Study | # Graduates | % Graduates |
| Computers & Mathematics | 0 | 0.0% |
| Bio, Nature & Agricultural | 53 | 23.9% |
| Physical & Health Sciences | 13 | 5.9% |
| Psychology | 0 | 0.0% |
| Social Sciences | 0 | 0.0% |
| Engineering | 0 | 0.0% |
| Multidisciplinary Studies | 0 | 0.0% |
| Science & Technology | 15 | 6.8% |
| Business | 17 | 7.7% |
| Education | 58 | 26.1% |
| Literature & Languages | 21 | 9.5% |
| Liberal Arts & History | 5 | 2.2% |
| Visual & Performing Arts | 5 | 2.2% |
| Communications | 16 | 7.2% |
| Arts & Humanities | 19 | 8.6% |
| Total | 222 | 100.0% |
Transportation & Commute in Hico
Vehicle Availability by Sex in Hico
The most prevalent vehicle ownership categories in Hico are males with 2 vehicles (113, accounting for 41.1%) and females with 2 vehicles (96, making up 55.4%).
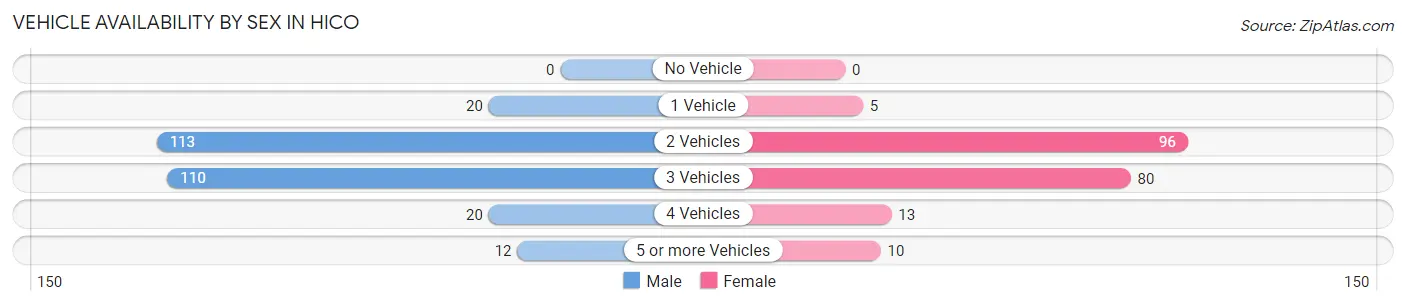
| Vehicles Available | Male | Female |
| No Vehicle | 0 (0.0%) | 0 (0.0%) |
| 1 Vehicle | 20 (7.3%) | 5 (2.5%) |
| 2 Vehicles | 113 (41.1%) | 96 (47.1%) |
| 3 Vehicles | 110 (40.0%) | 80 (39.2%) |
| 4 Vehicles | 20 (7.3%) | 13 (6.4%) |
| 5 or more Vehicles | 12 (4.4%) | 10 (4.9%) |
| Total | 275 (100.0%) | 204 (100.0%) |
Commute Time in Hico
The most frequently occuring commute durations in Hico are less than 5 minutes (181 commuters, 38.4%), 25 to 29 minutes (77 commuters, 16.4%), and 5 to 9 minutes (43 commuters, 9.1%).
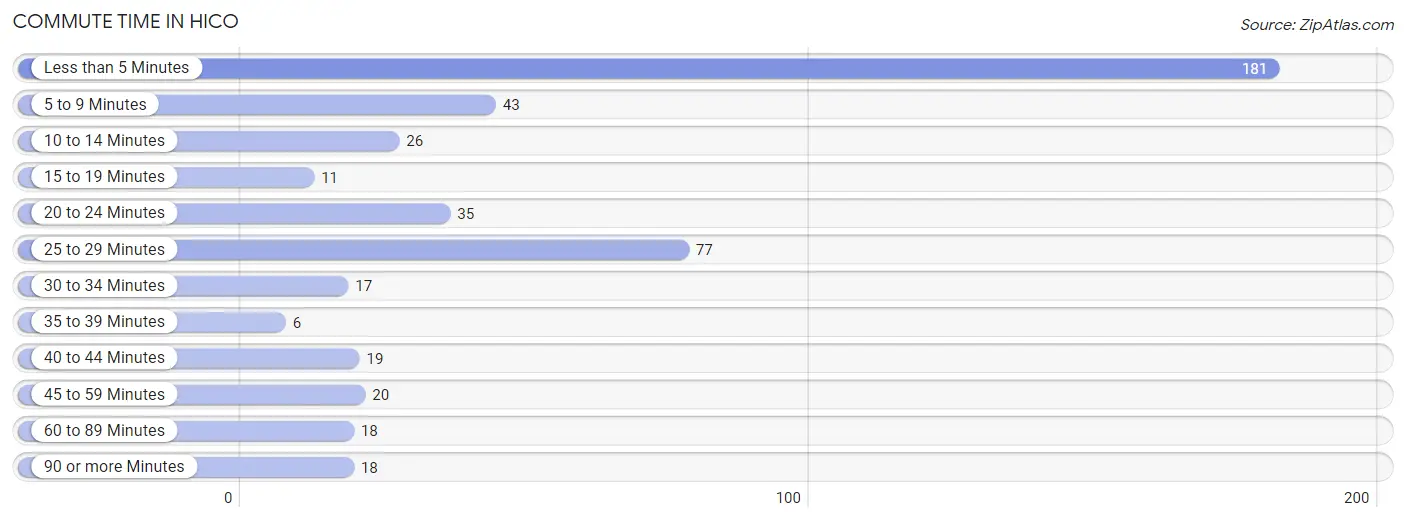
| Commute Time | # Commuters | % Commuters |
| Less than 5 Minutes | 181 | 38.4% |
| 5 to 9 Minutes | 43 | 9.1% |
| 10 to 14 Minutes | 26 | 5.5% |
| 15 to 19 Minutes | 11 | 2.3% |
| 20 to 24 Minutes | 35 | 7.4% |
| 25 to 29 Minutes | 77 | 16.4% |
| 30 to 34 Minutes | 17 | 3.6% |
| 35 to 39 Minutes | 6 | 1.3% |
| 40 to 44 Minutes | 19 | 4.0% |
| 45 to 59 Minutes | 20 | 4.3% |
| 60 to 89 Minutes | 18 | 3.8% |
| 90 or more Minutes | 18 | 3.8% |
Commute Time by Sex in Hico
The most common commute times in Hico are less than 5 minutes (101 commuters, 36.7%) for males and less than 5 minutes (80 commuters, 40.8%) for females.
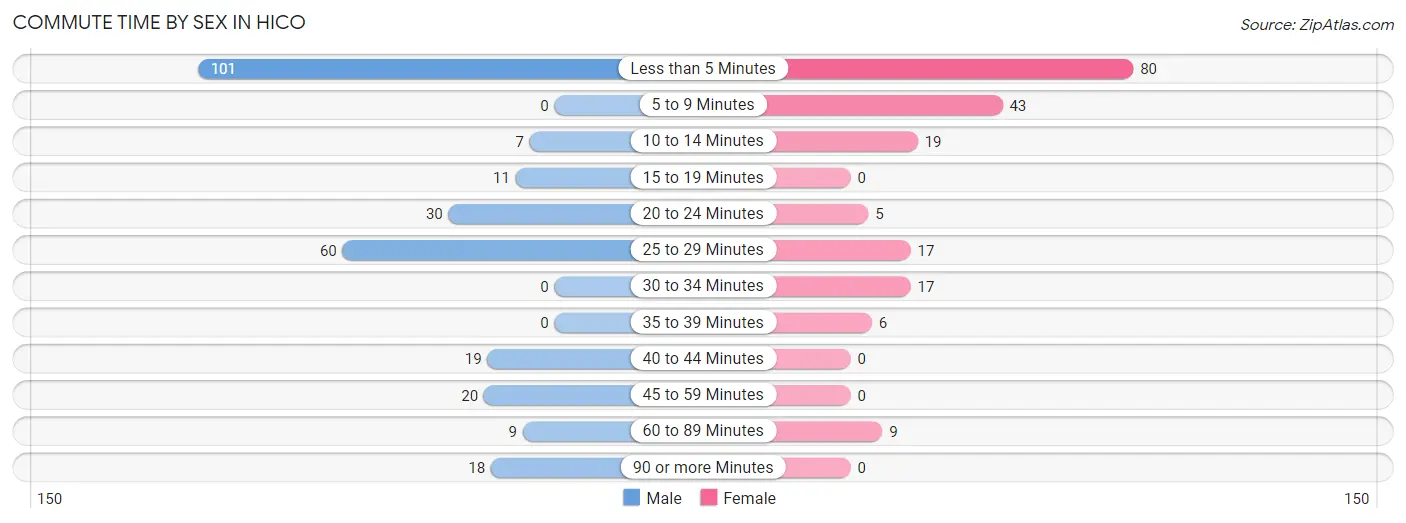
| Commute Time | Male | Female |
| Less than 5 Minutes | 101 (36.7%) | 80 (40.8%) |
| 5 to 9 Minutes | 0 (0.0%) | 43 (21.9%) |
| 10 to 14 Minutes | 7 (2.5%) | 19 (9.7%) |
| 15 to 19 Minutes | 11 (4.0%) | 0 (0.0%) |
| 20 to 24 Minutes | 30 (10.9%) | 5 (2.5%) |
| 25 to 29 Minutes | 60 (21.8%) | 17 (8.7%) |
| 30 to 34 Minutes | 0 (0.0%) | 17 (8.7%) |
| 35 to 39 Minutes | 0 (0.0%) | 6 (3.1%) |
| 40 to 44 Minutes | 19 (6.9%) | 0 (0.0%) |
| 45 to 59 Minutes | 20 (7.3%) | 0 (0.0%) |
| 60 to 89 Minutes | 9 (3.3%) | 9 (4.6%) |
| 90 or more Minutes | 18 (6.6%) | 0 (0.0%) |
Time of Departure to Work by Sex in Hico
The most frequent times of departure to work in Hico are 7:30 AM to 7:59 AM (87, 31.6%) for males and 7:00 AM to 7:29 AM (55, 28.1%) for females.
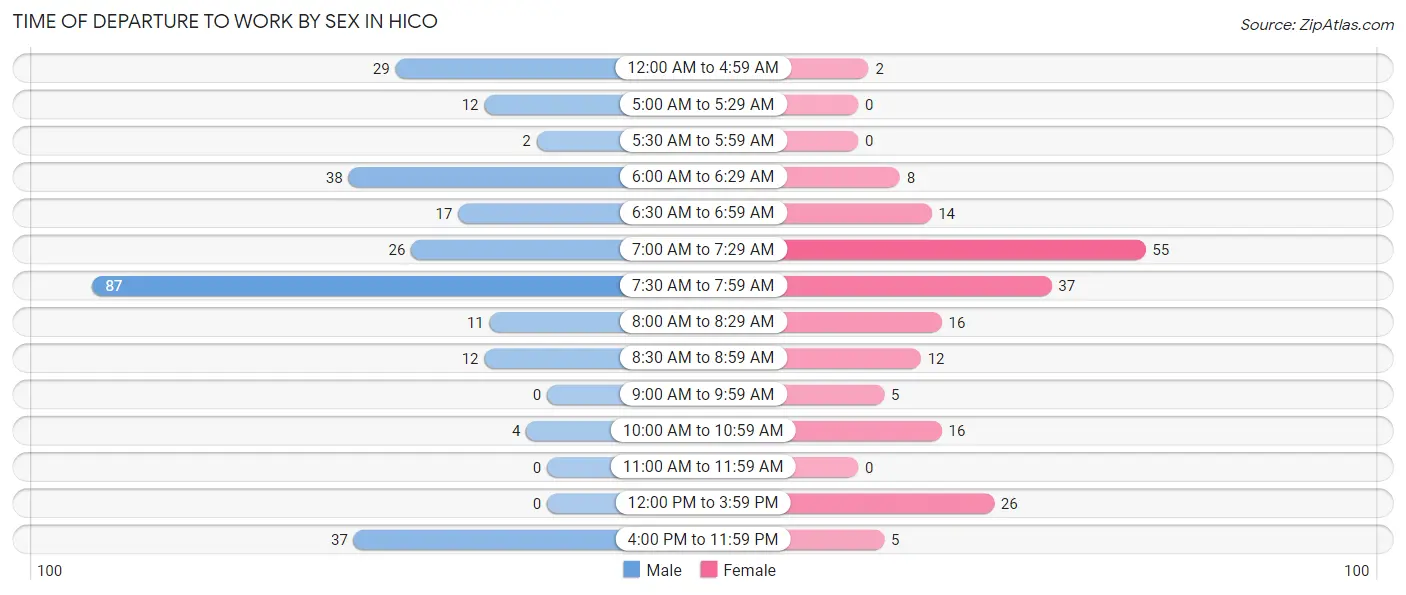
| Time of Departure | Male | Female |
| 12:00 AM to 4:59 AM | 29 (10.5%) | 2 (1.0%) |
| 5:00 AM to 5:29 AM | 12 (4.4%) | 0 (0.0%) |
| 5:30 AM to 5:59 AM | 2 (0.7%) | 0 (0.0%) |
| 6:00 AM to 6:29 AM | 38 (13.8%) | 8 (4.1%) |
| 6:30 AM to 6:59 AM | 17 (6.2%) | 14 (7.1%) |
| 7:00 AM to 7:29 AM | 26 (9.5%) | 55 (28.1%) |
| 7:30 AM to 7:59 AM | 87 (31.6%) | 37 (18.9%) |
| 8:00 AM to 8:29 AM | 11 (4.0%) | 16 (8.2%) |
| 8:30 AM to 8:59 AM | 12 (4.4%) | 12 (6.1%) |
| 9:00 AM to 9:59 AM | 0 (0.0%) | 5 (2.5%) |
| 10:00 AM to 10:59 AM | 4 (1.5%) | 16 (8.2%) |
| 11:00 AM to 11:59 AM | 0 (0.0%) | 0 (0.0%) |
| 12:00 PM to 3:59 PM | 0 (0.0%) | 26 (13.3%) |
| 4:00 PM to 11:59 PM | 37 (13.5%) | 5 (2.5%) |
| Total | 275 (100.0%) | 196 (100.0%) |
Housing Occupancy in Hico
Occupancy by Ownership in Hico
Of the total 555 dwellings in Hico, owner-occupied units account for 425 (76.6%), while renter-occupied units make up 130 (23.4%).
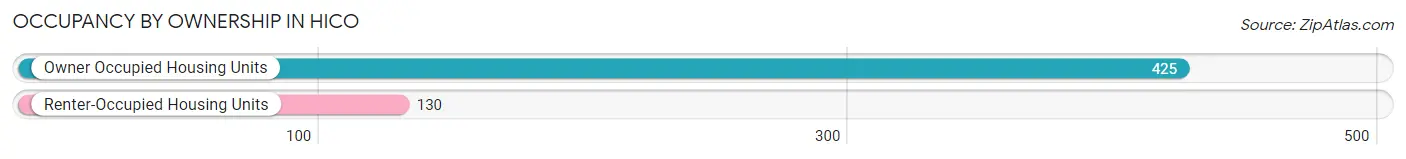
| Occupancy | # Housing Units | % Housing Units |
| Owner Occupied Housing Units | 425 | 76.6% |
| Renter-Occupied Housing Units | 130 | 23.4% |
| Total Occupied Housing Units | 555 | 100.0% |
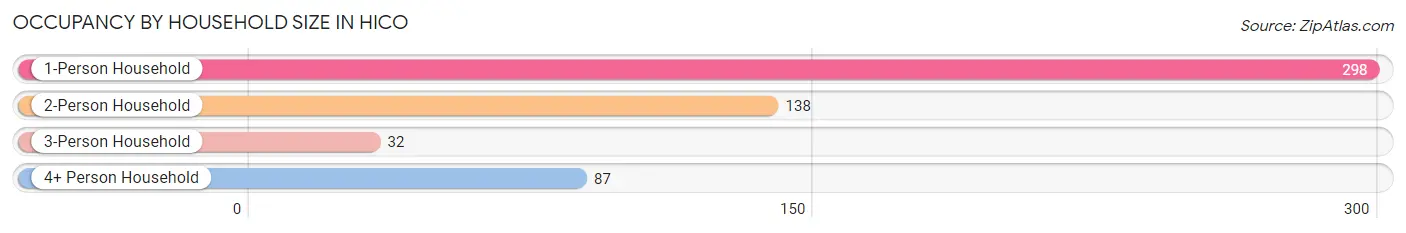
Occupancy by Household Size in Hico
| Household Size | # Housing Units | % Housing Units |
| 1-Person Household | 298 | 53.7% |
| 2-Person Household | 138 | 24.9% |
| 3-Person Household | 32 | 5.8% |
| 4+ Person Household | 87 | 15.7% |
| Total Housing Units | 555 | 100.0% |
Occupancy by Ownership by Household Size in Hico
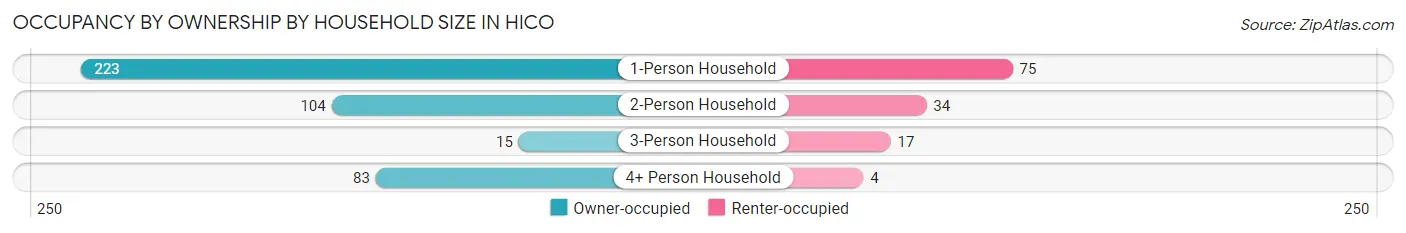
| Household Size | Owner-occupied | Renter-occupied |
| 1-Person Household | 223 (74.8%) | 75 (25.2%) |
| 2-Person Household | 104 (75.4%) | 34 (24.6%) |
| 3-Person Household | 15 (46.9%) | 17 (53.1%) |
| 4+ Person Household | 83 (95.4%) | 4 (4.6%) |
| Total Housing Units | 425 (76.6%) | 130 (23.4%) |
Occupancy by Educational Attainment in Hico
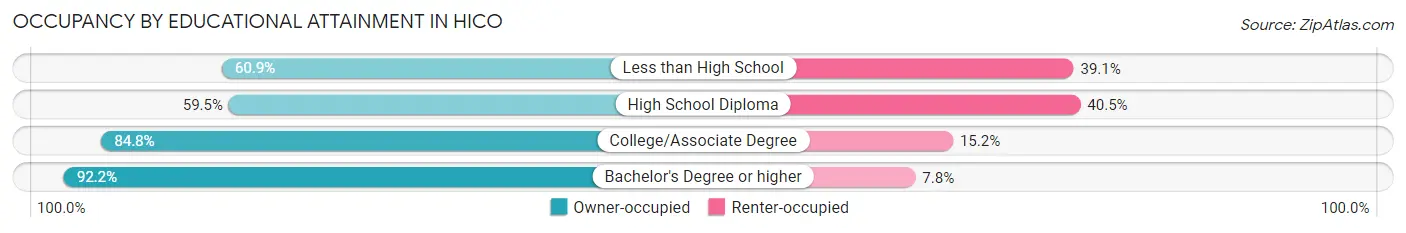
| Household Size | Owner-occupied | Renter-occupied |
| Less than High School | 28 (60.9%) | 18 (39.1%) |
| High School Diploma | 97 (59.5%) | 66 (40.5%) |
| College/Associate Degree | 217 (84.8%) | 39 (15.2%) |
| Bachelor's Degree or higher | 83 (92.2%) | 7 (7.8%) |
Occupancy by Age of Householder in Hico
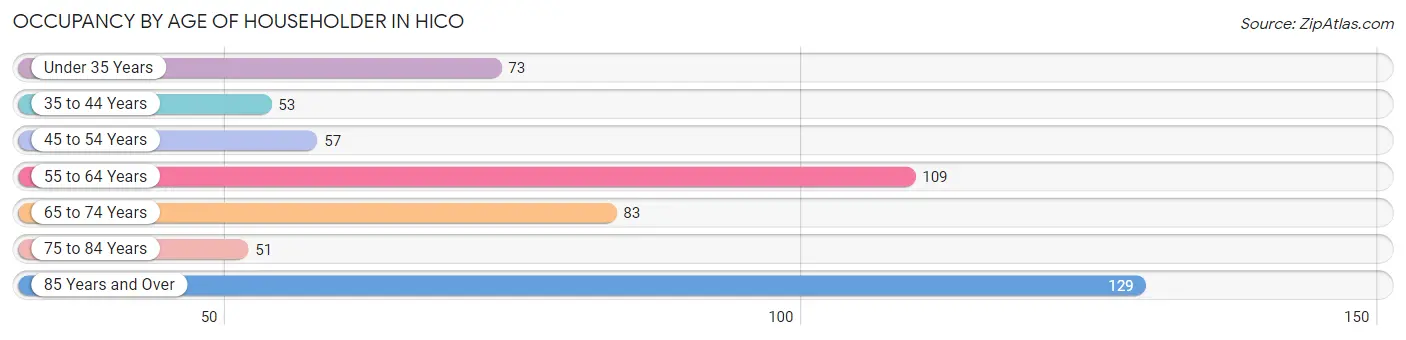
| Age Bracket | # Households | % Households |
| Under 35 Years | 73 | 13.2% |
| 35 to 44 Years | 53 | 9.6% |
| 45 to 54 Years | 57 | 10.3% |
| 55 to 64 Years | 109 | 19.6% |
| 65 to 74 Years | 83 | 14.9% |
| 75 to 84 Years | 51 | 9.2% |
| 85 Years and Over | 129 | 23.2% |
| Total | 555 | 100.0% |
Housing Finances in Hico
Median Income by Occupancy in Hico
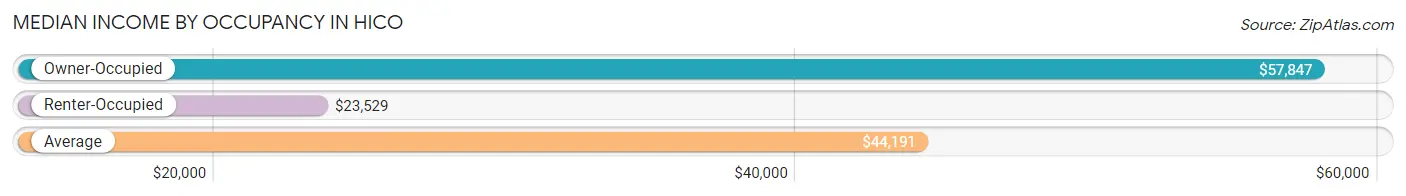
| Occupancy Type | # Households | Median Income |
| Owner-Occupied | 425 (76.6%) | $57,847 |
| Renter-Occupied | 130 (23.4%) | $23,529 |
| Average | 555 (100.0%) | $44,191 |
Occupancy by Householder Income Bracket in Hico
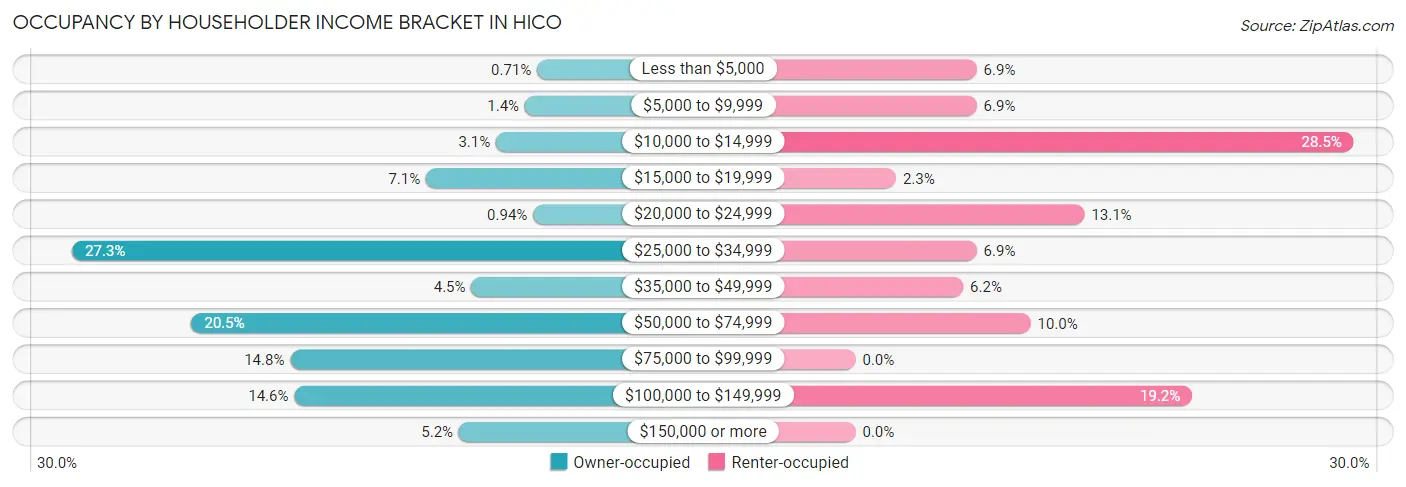
| Income Bracket | Owner-occupied | Renter-occupied |
| Less than $5,000 | 3 (0.7%) | 9 (6.9%) |
| $5,000 to $9,999 | 6 (1.4%) | 9 (6.9%) |
| $10,000 to $14,999 | 13 (3.1%) | 37 (28.5%) |
| $15,000 to $19,999 | 30 (7.1%) | 3 (2.3%) |
| $20,000 to $24,999 | 4 (0.9%) | 17 (13.1%) |
| $25,000 to $34,999 | 116 (27.3%) | 9 (6.9%) |
| $35,000 to $49,999 | 19 (4.5%) | 8 (6.1%) |
| $50,000 to $74,999 | 87 (20.5%) | 13 (10.0%) |
| $75,000 to $99,999 | 63 (14.8%) | 0 (0.0%) |
| $100,000 to $149,999 | 62 (14.6%) | 25 (19.2%) |
| $150,000 or more | 22 (5.2%) | 0 (0.0%) |
| Total | 425 (100.0%) | 130 (100.0%) |
Monthly Housing Cost Tiers in Hico
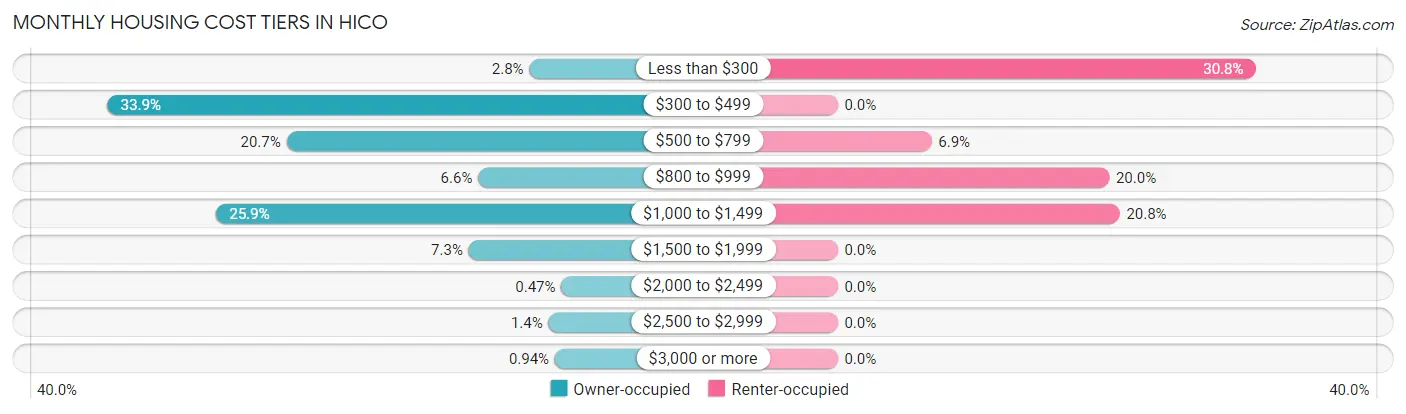
| Monthly Cost | Owner-occupied | Renter-occupied |
| Less than $300 | 12 (2.8%) | 40 (30.8%) |
| $300 to $499 | 144 (33.9%) | 0 (0.0%) |
| $500 to $799 | 88 (20.7%) | 9 (6.9%) |
| $800 to $999 | 28 (6.6%) | 26 (20.0%) |
| $1,000 to $1,499 | 110 (25.9%) | 27 (20.8%) |
| $1,500 to $1,999 | 31 (7.3%) | 0 (0.0%) |
| $2,000 to $2,499 | 2 (0.5%) | 0 (0.0%) |
| $2,500 to $2,999 | 6 (1.4%) | 0 (0.0%) |
| $3,000 or more | 4 (0.9%) | 0 (0.0%) |
| Total | 425 (100.0%) | 130 (100.0%) |
Physical Housing Characteristics in Hico
Housing Structures in Hico
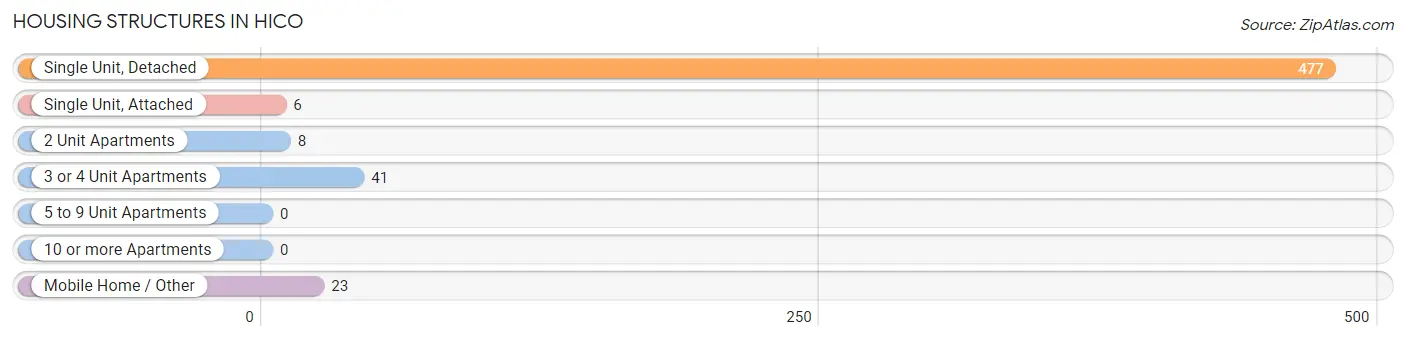
| Structure Type | # Housing Units | % Housing Units |
| Single Unit, Detached | 477 | 86.0% |
| Single Unit, Attached | 6 | 1.1% |
| 2 Unit Apartments | 8 | 1.4% |
| 3 or 4 Unit Apartments | 41 | 7.4% |
| 5 to 9 Unit Apartments | 0 | 0.0% |
| 10 or more Apartments | 0 | 0.0% |
| Mobile Home / Other | 23 | 4.1% |
| Total | 555 | 100.0% |
Housing Structures by Occupancy in Hico
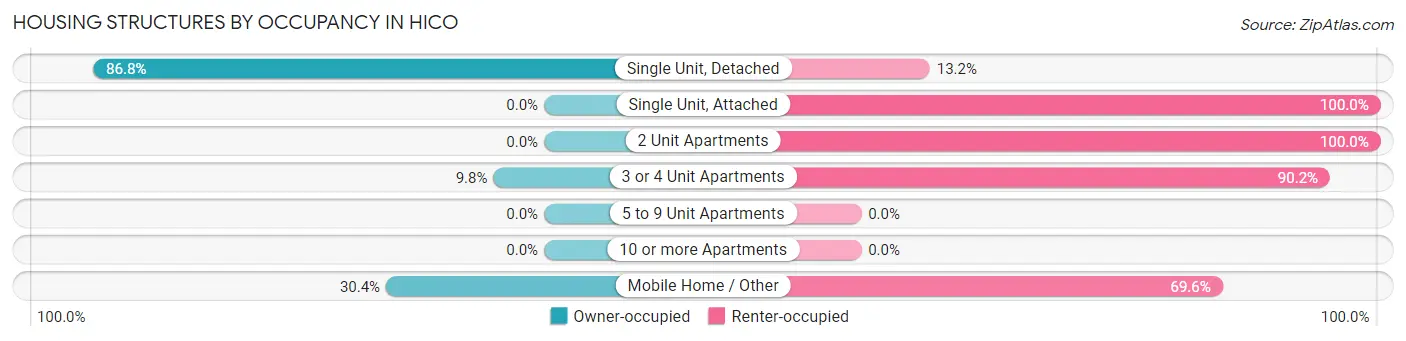
| Structure Type | Owner-occupied | Renter-occupied |
| Single Unit, Detached | 414 (86.8%) | 63 (13.2%) |
| Single Unit, Attached | 0 (0.0%) | 6 (100.0%) |
| 2 Unit Apartments | 0 (0.0%) | 8 (100.0%) |
| 3 or 4 Unit Apartments | 4 (9.8%) | 37 (90.2%) |
| 5 to 9 Unit Apartments | 0 (0.0%) | 0 (0.0%) |
| 10 or more Apartments | 0 (0.0%) | 0 (0.0%) |
| Mobile Home / Other | 7 (30.4%) | 16 (69.6%) |
| Total | 425 (76.6%) | 130 (23.4%) |
Housing Structures by Number of Rooms in Hico
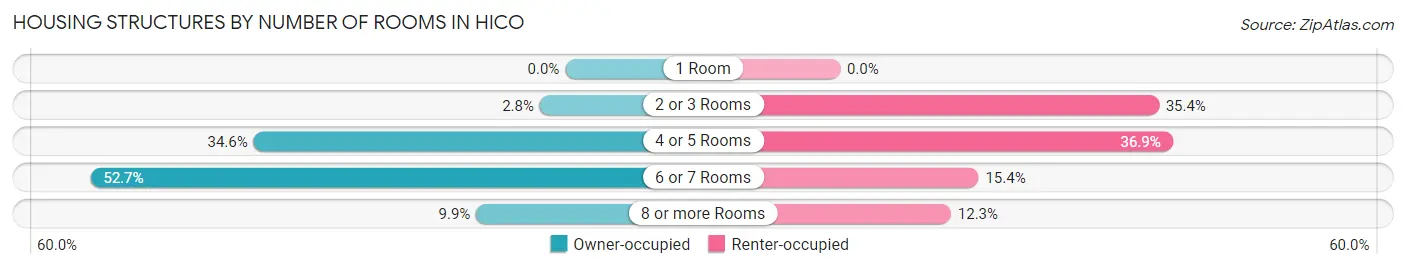
| Number of Rooms | Owner-occupied | Renter-occupied |
| 1 Room | 0 (0.0%) | 0 (0.0%) |
| 2 or 3 Rooms | 12 (2.8%) | 46 (35.4%) |
| 4 or 5 Rooms | 147 (34.6%) | 48 (36.9%) |
| 6 or 7 Rooms | 224 (52.7%) | 20 (15.4%) |
| 8 or more Rooms | 42 (9.9%) | 16 (12.3%) |
| Total | 425 (100.0%) | 130 (100.0%) |
Housing Structure by Heating Type in Hico
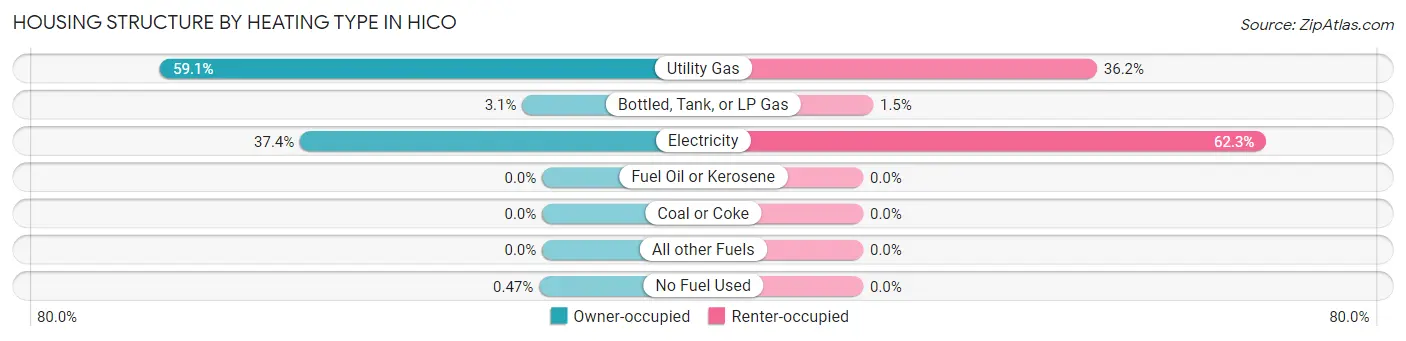
| Heating Type | Owner-occupied | Renter-occupied |
| Utility Gas | 251 (59.1%) | 47 (36.1%) |
| Bottled, Tank, or LP Gas | 13 (3.1%) | 2 (1.5%) |
| Electricity | 159 (37.4%) | 81 (62.3%) |
| Fuel Oil or Kerosene | 0 (0.0%) | 0 (0.0%) |
| Coal or Coke | 0 (0.0%) | 0 (0.0%) |
| All other Fuels | 0 (0.0%) | 0 (0.0%) |
| No Fuel Used | 2 (0.5%) | 0 (0.0%) |
| Total | 425 (100.0%) | 130 (100.0%) |
Household Vehicle Usage in Hico
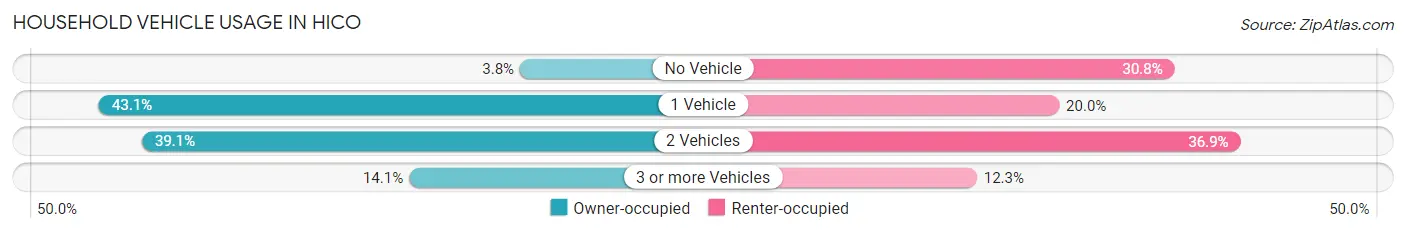
| Vehicles per Household | Owner-occupied | Renter-occupied |
| No Vehicle | 16 (3.8%) | 40 (30.8%) |
| 1 Vehicle | 183 (43.1%) | 26 (20.0%) |
| 2 Vehicles | 166 (39.1%) | 48 (36.9%) |
| 3 or more Vehicles | 60 (14.1%) | 16 (12.3%) |
| Total | 425 (100.0%) | 130 (100.0%) |
Real Estate & Mortgages in Hico
Real Estate and Mortgage Overview in Hico
| Characteristic | Without Mortgage | With Mortgage |
| Housing Units | 267 | 158 |
| Median Property Value | $112,200 | $109,400 |
| Median Household Income | $29,608 | $17 |
| Monthly Housing Costs | $483 | $0 |
| Real Estate Taxes | $2,311 | $0 |
Property Value by Mortgage Status in Hico
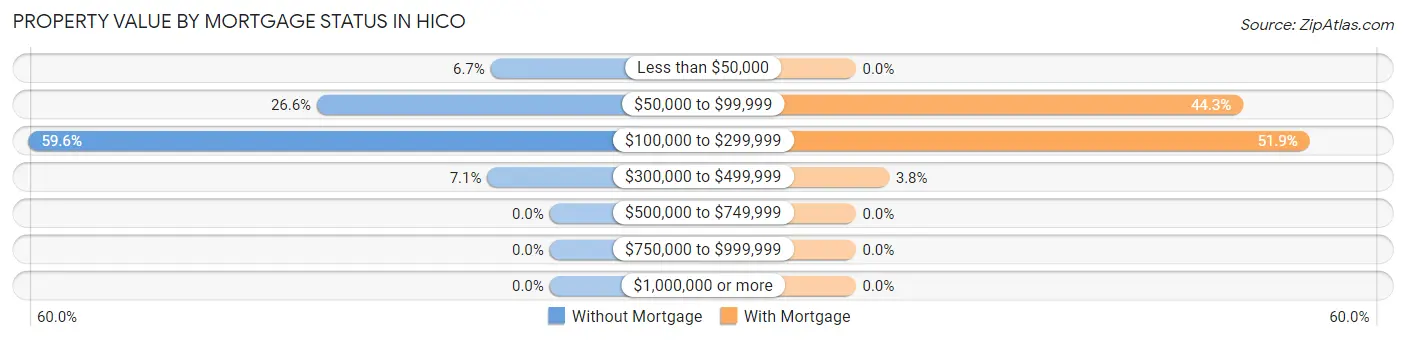
| Property Value | Without Mortgage | With Mortgage |
| Less than $50,000 | 18 (6.7%) | 0 (0.0%) |
| $50,000 to $99,999 | 71 (26.6%) | 70 (44.3%) |
| $100,000 to $299,999 | 159 (59.6%) | 82 (51.9%) |
| $300,000 to $499,999 | 19 (7.1%) | 6 (3.8%) |
| $500,000 to $749,999 | 0 (0.0%) | 0 (0.0%) |
| $750,000 to $999,999 | 0 (0.0%) | 0 (0.0%) |
| $1,000,000 or more | 0 (0.0%) | 0 (0.0%) |
| Total | 267 (100.0%) | 158 (100.0%) |
Household Income by Mortgage Status in Hico
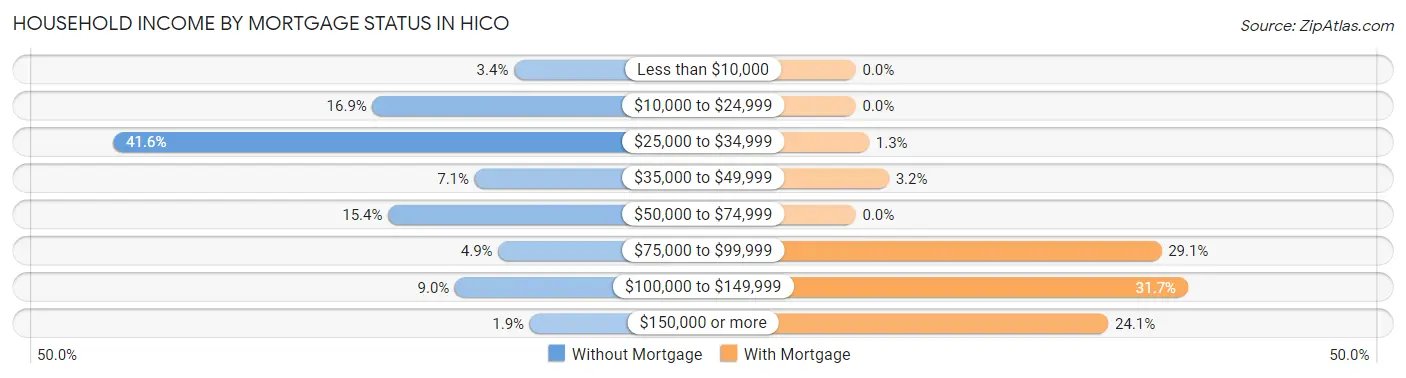
| Household Income | Without Mortgage | With Mortgage |
| Less than $10,000 | 9 (3.4%) | 0 (0.0%) |
| $10,000 to $24,999 | 45 (16.9%) | 0 (0.0%) |
| $25,000 to $34,999 | 111 (41.6%) | 2 (1.3%) |
| $35,000 to $49,999 | 19 (7.1%) | 5 (3.2%) |
| $50,000 to $74,999 | 41 (15.4%) | 0 (0.0%) |
| $75,000 to $99,999 | 13 (4.9%) | 46 (29.1%) |
| $100,000 to $149,999 | 24 (9.0%) | 50 (31.7%) |
| $150,000 or more | 5 (1.9%) | 38 (24.0%) |
| Total | 267 (100.0%) | 158 (100.0%) |
Property Value to Household Income Ratio in Hico
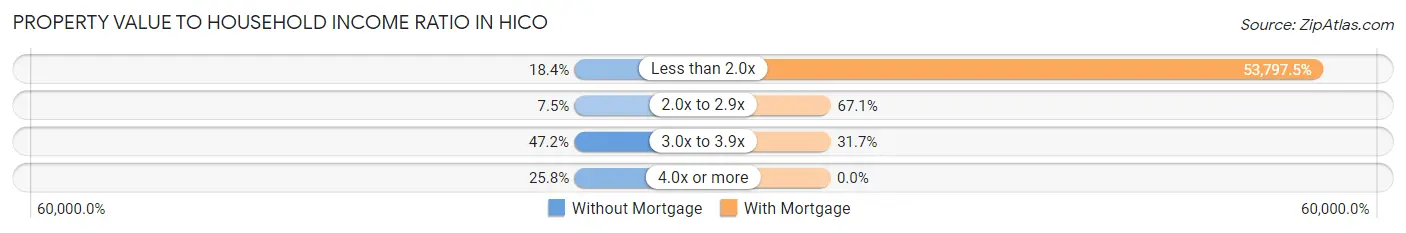
| Value-to-Income Ratio | Without Mortgage | With Mortgage |
| Less than 2.0x | 49 (18.3%) | 85,000 (53,797.5%) |
| 2.0x to 2.9x | 20 (7.5%) | 106 (67.1%) |
| 3.0x to 3.9x | 126 (47.2%) | 50 (31.7%) |
| 4.0x or more | 69 (25.8%) | 0 (0.0%) |
| Total | 267 (100.0%) | 158 (100.0%) |
Real Estate Taxes by Mortgage Status in Hico
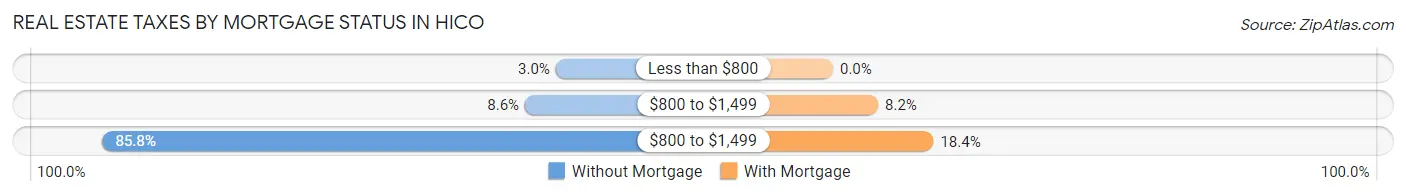
| Property Taxes | Without Mortgage | With Mortgage |
| Less than $800 | 8 (3.0%) | 0 (0.0%) |
| $800 to $1,499 | 23 (8.6%) | 13 (8.2%) |
| $800 to $1,499 | 229 (85.8%) | 29 (18.3%) |
| Total | 267 (100.0%) | 158 (100.0%) |
Health & Disability in Hico
Health Insurance Coverage by Age in Hico
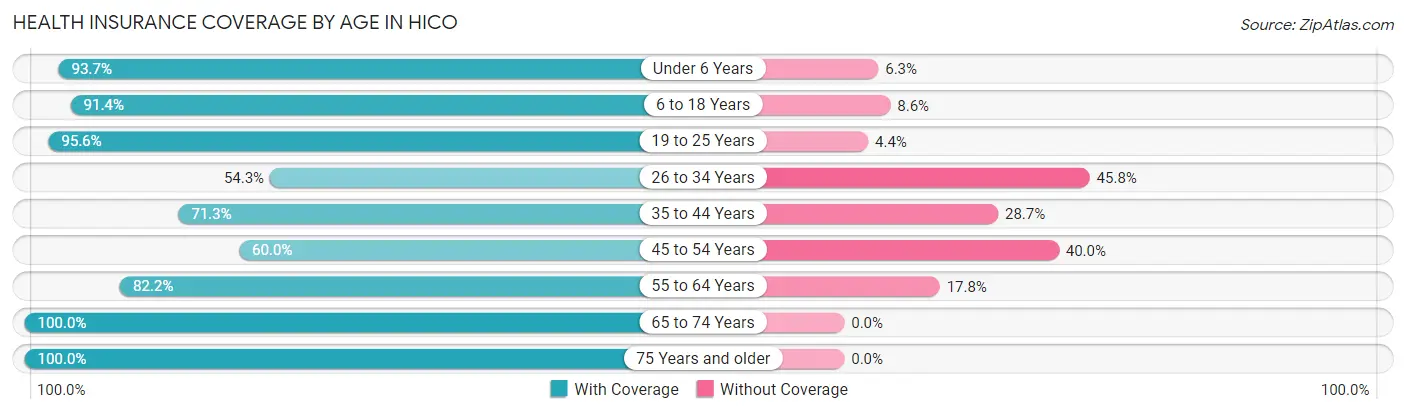
| Age Bracket | With Coverage | Without Coverage |
| Under 6 Years | 266 (93.7%) | 18 (6.3%) |
| 6 to 18 Years | 234 (91.4%) | 22 (8.6%) |
| 19 to 25 Years | 43 (95.6%) | 2 (4.4%) |
| 26 to 34 Years | 134 (54.2%) | 113 (45.8%) |
| 35 to 44 Years | 107 (71.3%) | 43 (28.7%) |
| 45 to 54 Years | 57 (60.0%) | 38 (40.0%) |
| 55 to 64 Years | 134 (82.2%) | 29 (17.8%) |
| 65 to 74 Years | 105 (100.0%) | 0 (0.0%) |
| 75 Years and older | 234 (100.0%) | 0 (0.0%) |
| Total | 1,314 (83.2%) | 265 (16.8%) |
Health Insurance Coverage by Citizenship Status in Hico
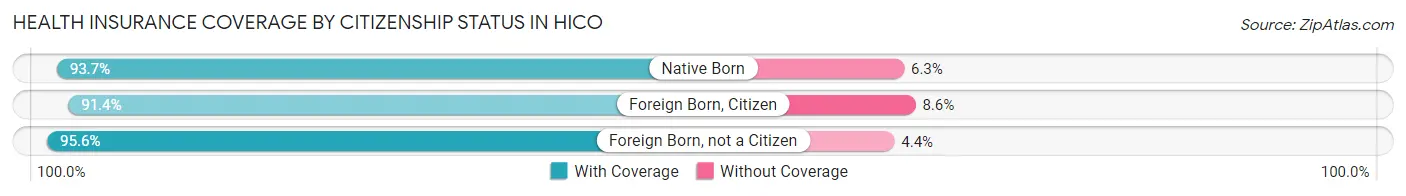
| Citizenship Status | With Coverage | Without Coverage |
| Native Born | 266 (93.7%) | 18 (6.3%) |
| Foreign Born, Citizen | 234 (91.4%) | 22 (8.6%) |
| Foreign Born, not a Citizen | 43 (95.6%) | 2 (4.4%) |
Health Insurance Coverage by Household Income in Hico
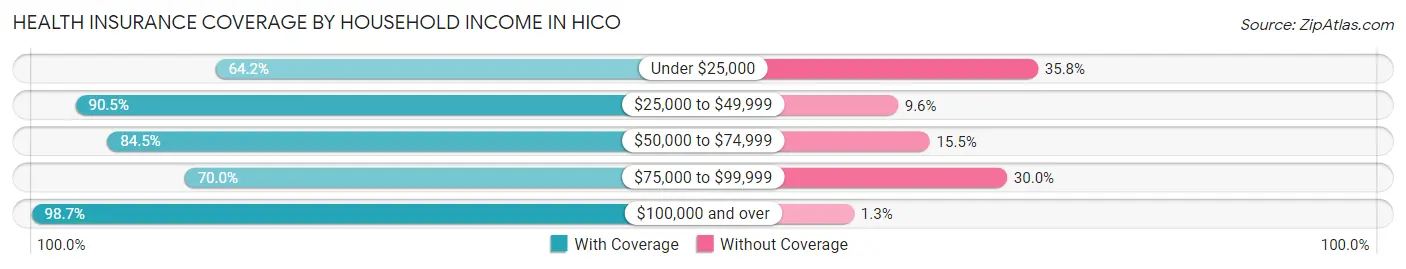
| Household Income | With Coverage | Without Coverage |
| Under $25,000 | 104 (64.2%) | 58 (35.8%) |
| $25,000 to $49,999 | 199 (90.4%) | 21 (9.6%) |
| $50,000 to $74,999 | 381 (84.5%) | 70 (15.5%) |
| $75,000 to $99,999 | 259 (70.0%) | 111 (30.0%) |
| $100,000 and over | 371 (98.7%) | 5 (1.3%) |
Public vs Private Health Insurance Coverage by Age in Hico
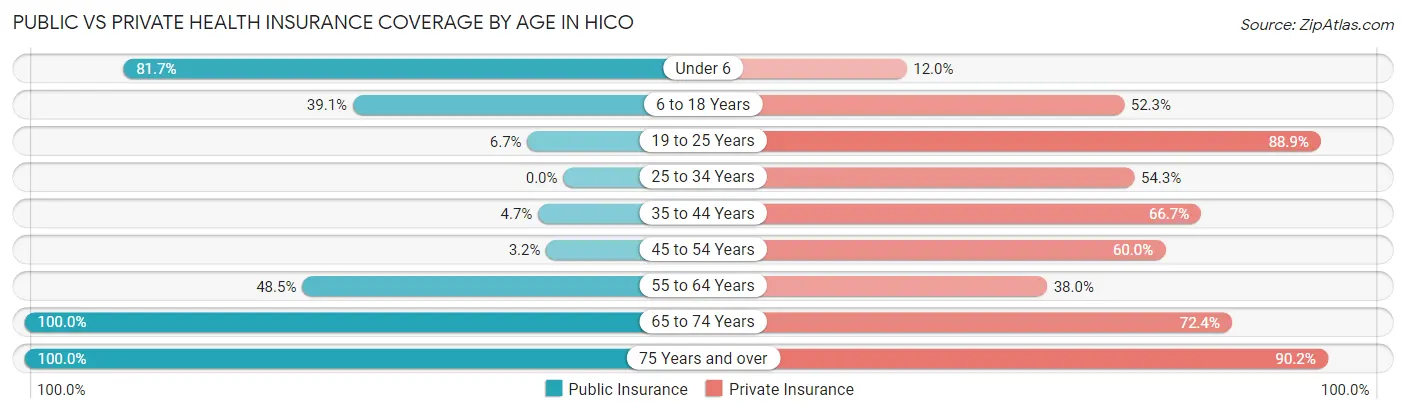
| Age Bracket | Public Insurance | Private Insurance |
| Under 6 | 232 (81.7%) | 34 (12.0%) |
| 6 to 18 Years | 100 (39.1%) | 134 (52.3%) |
| 19 to 25 Years | 3 (6.7%) | 40 (88.9%) |
| 25 to 34 Years | 0 (0.0%) | 134 (54.2%) |
| 35 to 44 Years | 7 (4.7%) | 100 (66.7%) |
| 45 to 54 Years | 3 (3.2%) | 57 (60.0%) |
| 55 to 64 Years | 79 (48.5%) | 62 (38.0%) |
| 65 to 74 Years | 105 (100.0%) | 76 (72.4%) |
| 75 Years and over | 234 (100.0%) | 211 (90.2%) |
| Total | 763 (48.3%) | 848 (53.7%) |
Disability Status by Sex by Age in Hico
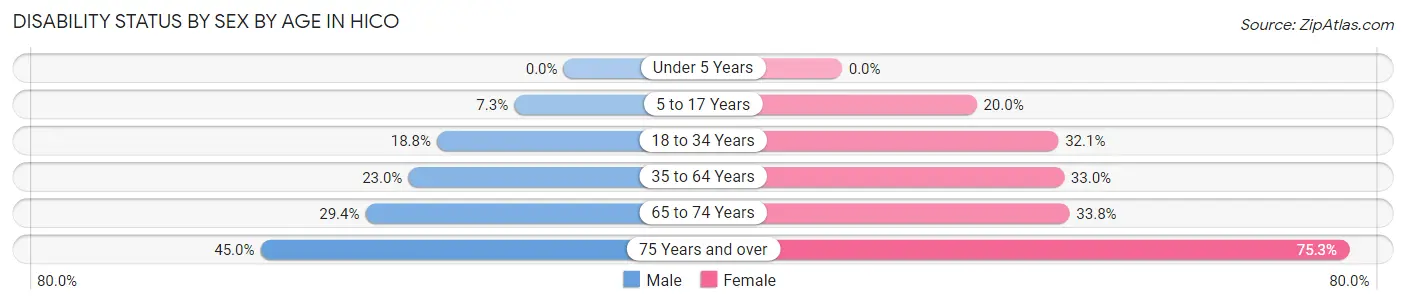
| Age Bracket | Male | Female |
| Under 5 Years | 0 (0.0%) | 0 (0.0%) |
| 5 to 17 Years | 14 (7.3%) | 27 (20.0%) |
| 18 to 34 Years | 31 (18.8%) | 45 (32.1%) |
| 35 to 64 Years | 50 (23.0%) | 63 (33.0%) |
| 65 to 74 Years | 10 (29.4%) | 24 (33.8%) |
| 75 Years and over | 27 (45.0%) | 131 (75.3%) |
Disability Class by Sex by Age in Hico
Disability Class: Hearing Difficulty
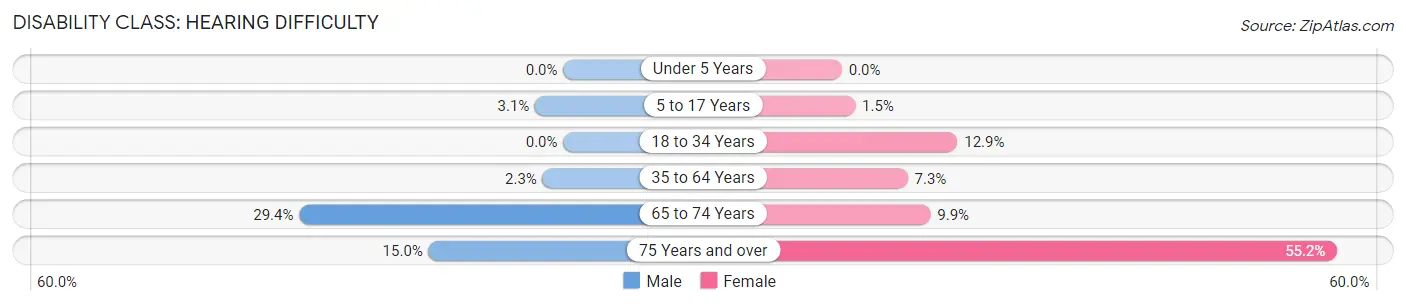
| Age Bracket | Male | Female |
| Under 5 Years | 0 (0.0%) | 0 (0.0%) |
| 5 to 17 Years | 6 (3.1%) | 2 (1.5%) |
| 18 to 34 Years | 0 (0.0%) | 18 (12.9%) |
| 35 to 64 Years | 5 (2.3%) | 14 (7.3%) |
| 65 to 74 Years | 10 (29.4%) | 7 (9.9%) |
| 75 Years and over | 9 (15.0%) | 96 (55.2%) |
Disability Class: Vision Difficulty
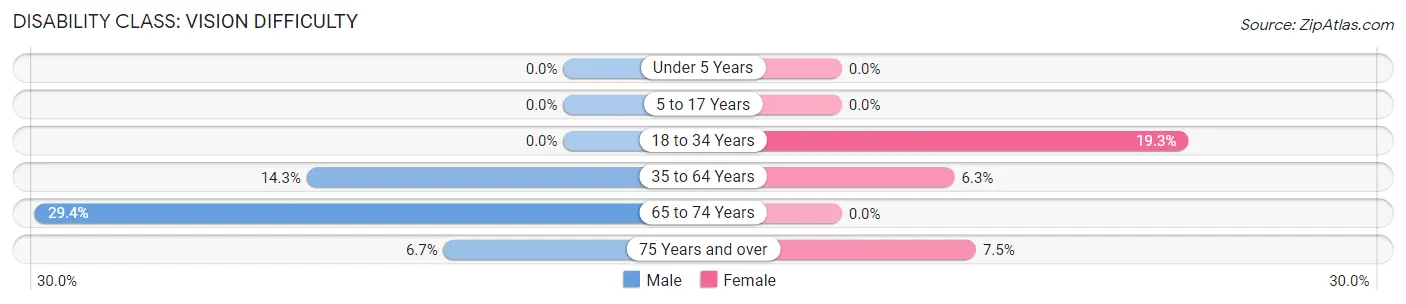
| Age Bracket | Male | Female |
| Under 5 Years | 0 (0.0%) | 0 (0.0%) |
| 5 to 17 Years | 0 (0.0%) | 0 (0.0%) |
| 18 to 34 Years | 0 (0.0%) | 27 (19.3%) |
| 35 to 64 Years | 31 (14.3%) | 12 (6.3%) |
| 65 to 74 Years | 10 (29.4%) | 0 (0.0%) |
| 75 Years and over | 4 (6.7%) | 13 (7.5%) |
Disability Class: Cognitive Difficulty
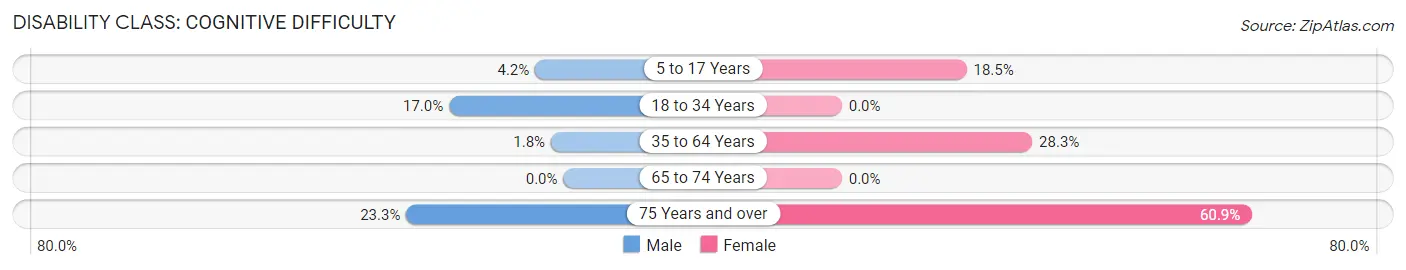
| Age Bracket | Male | Female |
| 5 to 17 Years | 8 (4.2%) | 25 (18.5%) |
| 18 to 34 Years | 28 (17.0%) | 0 (0.0%) |
| 35 to 64 Years | 4 (1.8%) | 54 (28.3%) |
| 65 to 74 Years | 0 (0.0%) | 0 (0.0%) |
| 75 Years and over | 14 (23.3%) | 106 (60.9%) |
Disability Class: Ambulatory Difficulty
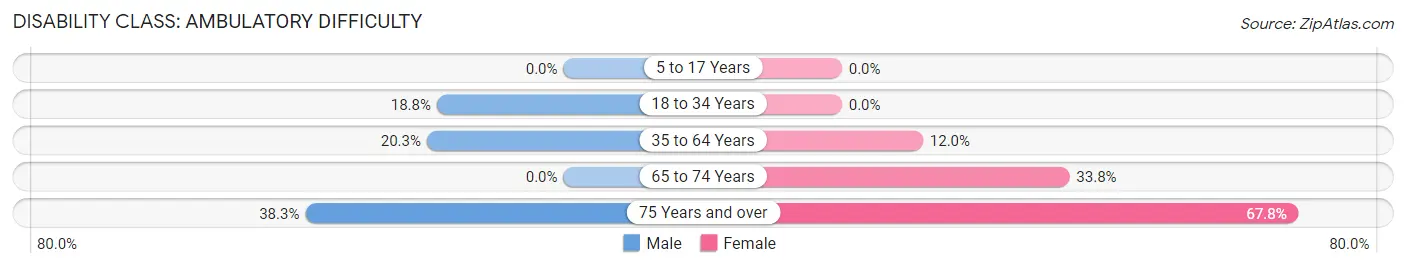
| Age Bracket | Male | Female |
| 5 to 17 Years | 0 (0.0%) | 0 (0.0%) |
| 18 to 34 Years | 31 (18.8%) | 0 (0.0%) |
| 35 to 64 Years | 44 (20.3%) | 23 (12.0%) |
| 65 to 74 Years | 0 (0.0%) | 24 (33.8%) |
| 75 Years and over | 23 (38.3%) | 118 (67.8%) |
Disability Class: Self-Care Difficulty
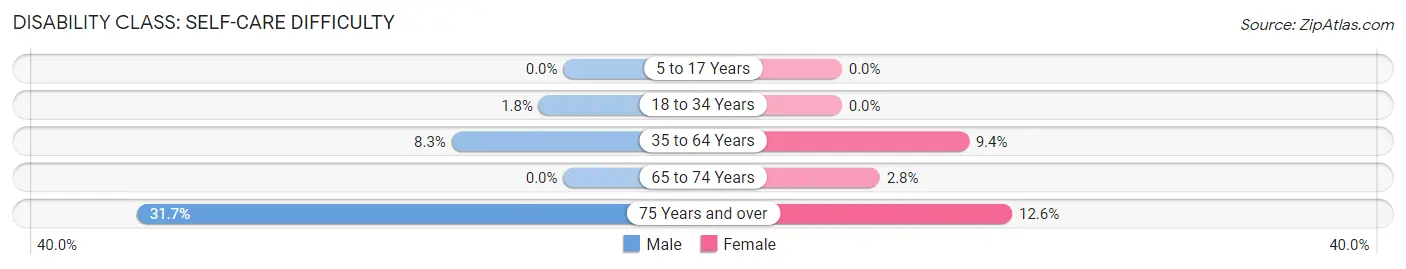
| Age Bracket | Male | Female |
| 5 to 17 Years | 0 (0.0%) | 0 (0.0%) |
| 18 to 34 Years | 3 (1.8%) | 0 (0.0%) |
| 35 to 64 Years | 18 (8.3%) | 18 (9.4%) |
| 65 to 74 Years | 0 (0.0%) | 2 (2.8%) |
| 75 Years and over | 19 (31.7%) | 22 (12.6%) |
Technology Access in Hico
Computing Device Access in Hico
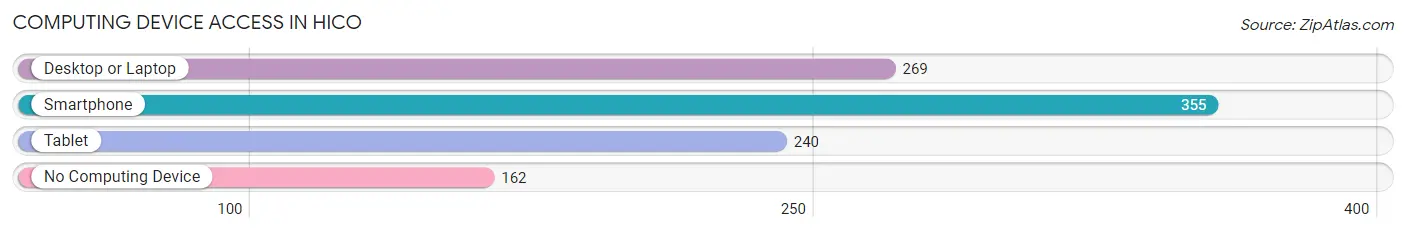
| Device Type | # Households | % Households |
| Desktop or Laptop | 269 | 48.5% |
| Smartphone | 355 | 64.0% |
| Tablet | 240 | 43.2% |
| No Computing Device | 162 | 29.2% |
| Total | 555 | 100.0% |
Internet Access in Hico
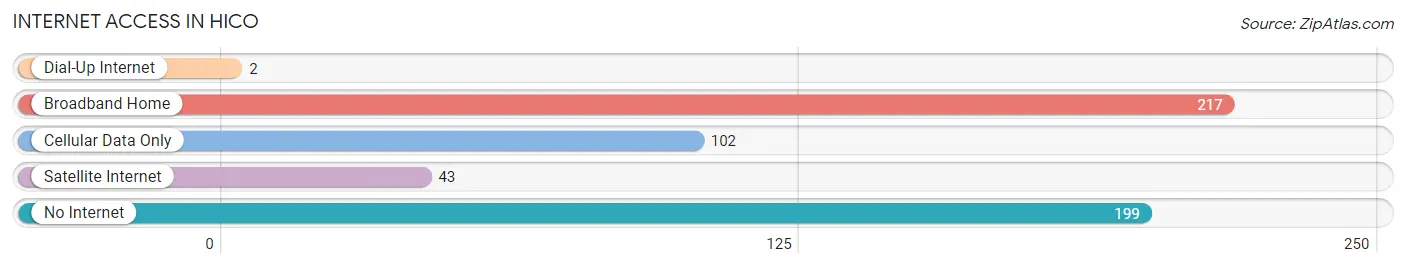
| Internet Type | # Households | % Households |
| Dial-Up Internet | 2 | 0.4% |
| Broadband Home | 217 | 39.1% |
| Cellular Data Only | 102 | 18.4% |
| Satellite Internet | 43 | 7.7% |
| No Internet | 199 | 35.9% |
| Total | 555 | 100.0% |
Hico Summary
Hico, Texas is a small town located in Hamilton County, Texas, United States. It is situated about 70 miles southwest of Fort Worth and is part of the Waco Metropolitan Statistical Area. The population of Hico was 1,126 at the 2010 census.
History
Hico was founded in 1881 by a group of settlers from Missouri. The town was named after the Hico River, which was named after a Native American chief. The town was incorporated in 1883 and quickly became a center for ranching and farming. The town was also known for its mineral springs, which were believed to have healing properties.
In the early 1900s, Hico was a popular tourist destination, with many visitors coming to take advantage of the mineral springs. The town also had a number of hotels, restaurants, and other businesses catering to the tourists.
In the 1920s, Hico was a major center for the oil industry. The town was home to several oil refineries and was the site of the first oil well in Hamilton County.
Geography
Hico is located in central Hamilton County at 31°45'25" North, 98°2'25" West (31.7569, -98.0401). It is situated on the Hico River, which flows south to the Leon River.
The town is located in the rolling hills of the Texas Hill Country. The terrain is mostly flat, with some hills and valleys. The climate is semi-arid, with hot summers and mild winters.
Economy
The economy of Hico is largely based on agriculture and ranching. The town is home to several large ranches, and the surrounding area is used for cattle and sheep grazing.
The town also has a number of small businesses, including restaurants, stores, and other services. The town is also home to a number of oil and gas companies, which are involved in the exploration and production of oil and gas in the area.
Demographics
As of the 2010 census, there were 1,126 people living in Hico. The racial makeup of the town was 94.2% White, 0.2% African American, 0.2% Native American, 0.2% Asian, 0.2% Pacific Islander, 3.3% from other races, and 1.9% from two or more races. Hispanic or Latino of any race were 8.2% of the population.
The median income for a household in Hico was $31,250, and the median income for a family was $37,500. The per capita income for the town was $17,845. About 15.2% of families and 17.2% of the population were below the poverty line, including 22.2% of those under age 18 and 11.3% of those age 65 or over.
Common Questions
What is Per Capita Income in Hico?
Per Capita income in Hico is $23,633.
What is the Median Family Income in Hico?
Median Family Income in Hico is $77,344.
What is the Median Household income in Hico?
Median Household Income in Hico is $44,191.
What is Income or Wage Gap in Hico?
Income or Wage Gap in Hico is 63.5%.
Women in Hico earn 36.5 cents for every dollar earned by a man.
What is Inequality or Gini Index in Hico?
Inequality or Gini Index in Hico is 0.43.
What is the Total Population of Hico?
Total Population of Hico is 1,627.
What is the Total Male Population of Hico?
Total Male Population of Hico is 708.
What is the Total Female Population of Hico?
Total Female Population of Hico is 919.
What is the Ratio of Males per 100 Females in Hico?
There are 77.04 Males per 100 Females in Hico.
What is the Ratio of Females per 100 Males in Hico?
There are 129.80 Females per 100 Males in Hico.
What is the Median Population Age in Hico?
Median Population Age in Hico is 33.0 Years.
What is the Average Family Size in Hico
Average Family Size in Hico is 5.0 People.
What is the Average Household Size in Hico
Average Household Size in Hico is 2.9 People.
How Large is the Labor Force in Hico?
There are 544 People in the Labor Forcein in Hico.
What is the Percentage of People in the Labor Force in Hico?
47.8% of People are in the Labor Force in Hico.
What is the Unemployment Rate in Hico?
Unemployment Rate in Hico is 4.2%.