Henrietta, TX Map & Demographics
Henrietta Map
Henrietta Overview
$31,378
PER CAPITA INCOME
$90,823
AVG FAMILY INCOME
$61,317
AVG HOUSEHOLD INCOME
38.4%
WAGE / INCOME GAP [ % ]
61.6¢/ $1
WAGE / INCOME GAP [ $ ]
0.42
INEQUALITY / GINI INDEX
3,115
TOTAL POPULATION
1,447
MALE POPULATION
1,668
FEMALE POPULATION
86.75
MALES / 100 FEMALES
115.27
FEMALES / 100 MALES
41.1
MEDIAN AGE
3.1
AVG FAMILY SIZE
2.4
AVG HOUSEHOLD SIZE
1,354
LABOR FORCE [ PEOPLE ]
54.6%
PERCENT IN LABOR FORCE
1.3%
UNEMPLOYMENT RATE
Henrietta Zip Codes
Henrietta Area Codes
Income in Henrietta
Income Overview in Henrietta
Per Capita Income in Henrietta is $31,378, while median incomes of families and households are $90,823 and $61,317 respectively.
| Characteristic | Number | Measure |
| Per Capita Income | 3,115 | $31,378 |
| Median Family Income | 811 | $90,823 |
| Mean Family Income | 811 | $98,289 |
| Median Household Income | 1,276 | $61,317 |
| Mean Household Income | 1,276 | $72,993 |
| Income Deficit | 811 | $0 |
| Wage / Income Gap (%) | 3,115 | 38.41% |
| Wage / Income Gap ($) | 3,115 | 61.59¢ per $1 |
| Gini / Inequality Index | 3,115 | 0.42 |
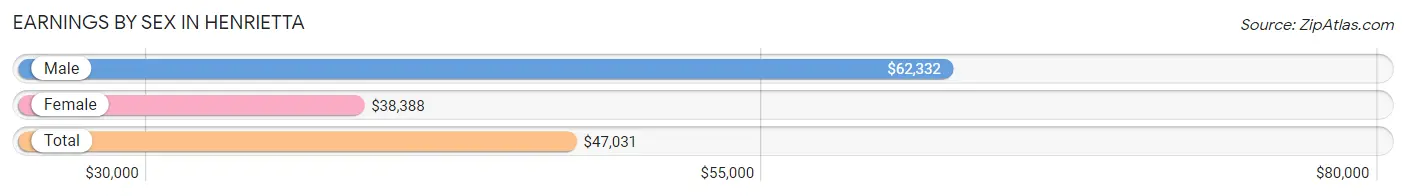
Earnings by Sex in Henrietta
Average Earnings in Henrietta are $47,031, $62,332 for men and $38,388 for women, a difference of 38.4%.
| Sex | Number | Average Earnings |
| Male | 683 (46.0%) | $62,332 |
| Female | 801 (54.0%) | $38,388 |
| Total | 1,484 (100.0%) | $47,031 |
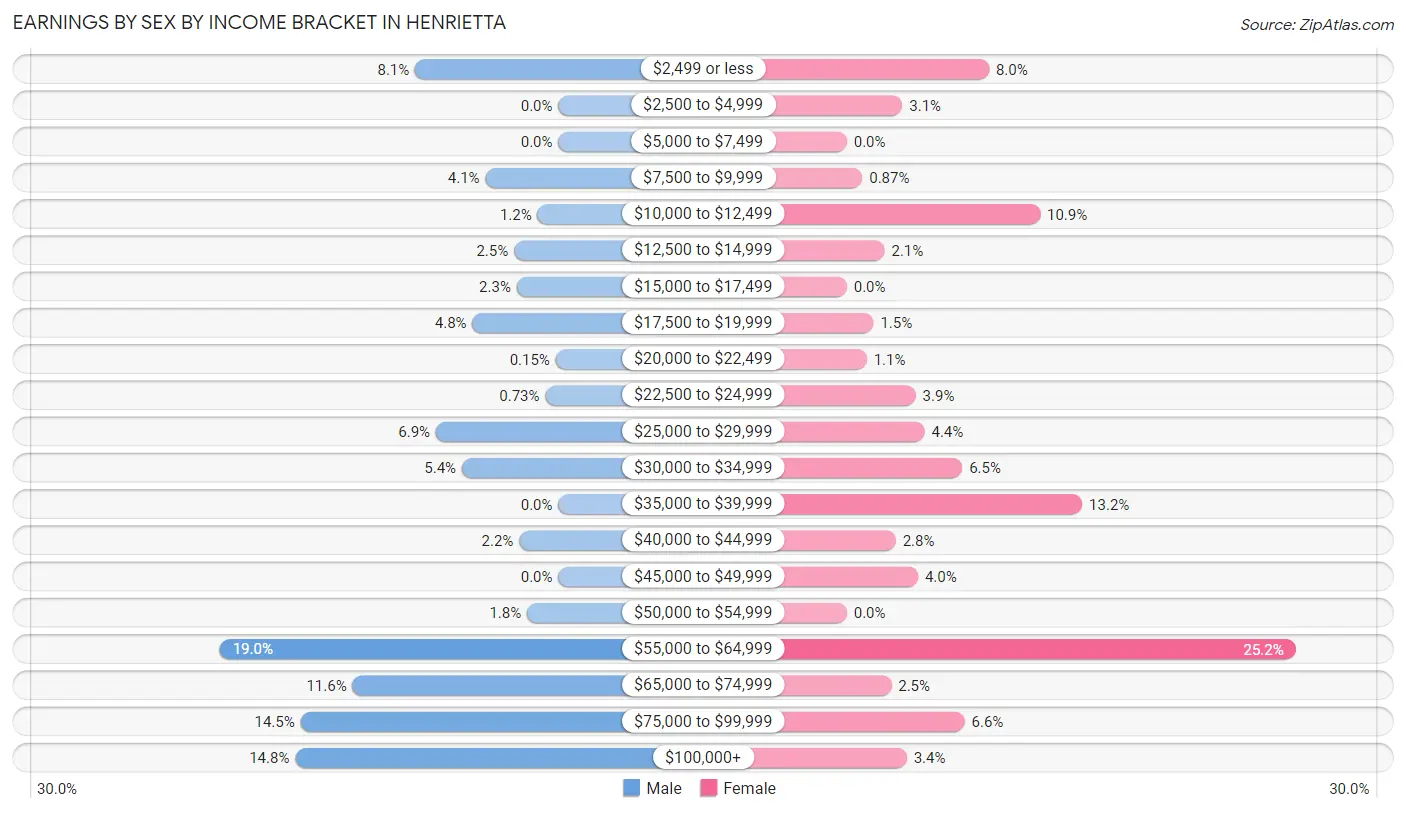
Earnings by Sex by Income Bracket in Henrietta
The most common earnings brackets in Henrietta are $55,000 to $64,999 for men (130 | 19.0%) and $55,000 to $64,999 for women (202 | 25.2%).
| Income | Male | Female |
| $2,499 or less | 55 (8.1%) | 64 (8.0%) |
| $2,500 to $4,999 | 0 (0.0%) | 25 (3.1%) |
| $5,000 to $7,499 | 0 (0.0%) | 0 (0.0%) |
| $7,500 to $9,999 | 28 (4.1%) | 7 (0.9%) |
| $10,000 to $12,499 | 8 (1.2%) | 87 (10.9%) |
| $12,500 to $14,999 | 17 (2.5%) | 17 (2.1%) |
| $15,000 to $17,499 | 16 (2.3%) | 0 (0.0%) |
| $17,500 to $19,999 | 33 (4.8%) | 12 (1.5%) |
| $20,000 to $22,499 | 1 (0.2%) | 9 (1.1%) |
| $22,500 to $24,999 | 5 (0.7%) | 31 (3.9%) |
| $25,000 to $29,999 | 47 (6.9%) | 35 (4.4%) |
| $30,000 to $34,999 | 37 (5.4%) | 52 (6.5%) |
| $35,000 to $39,999 | 0 (0.0%) | 106 (13.2%) |
| $40,000 to $44,999 | 15 (2.2%) | 22 (2.8%) |
| $45,000 to $49,999 | 0 (0.0%) | 32 (4.0%) |
| $50,000 to $54,999 | 12 (1.8%) | 0 (0.0%) |
| $55,000 to $64,999 | 130 (19.0%) | 202 (25.2%) |
| $65,000 to $74,999 | 79 (11.6%) | 20 (2.5%) |
| $75,000 to $99,999 | 99 (14.5%) | 53 (6.6%) |
| $100,000+ | 101 (14.8%) | 27 (3.4%) |
| Total | 683 (100.0%) | 801 (100.0%) |
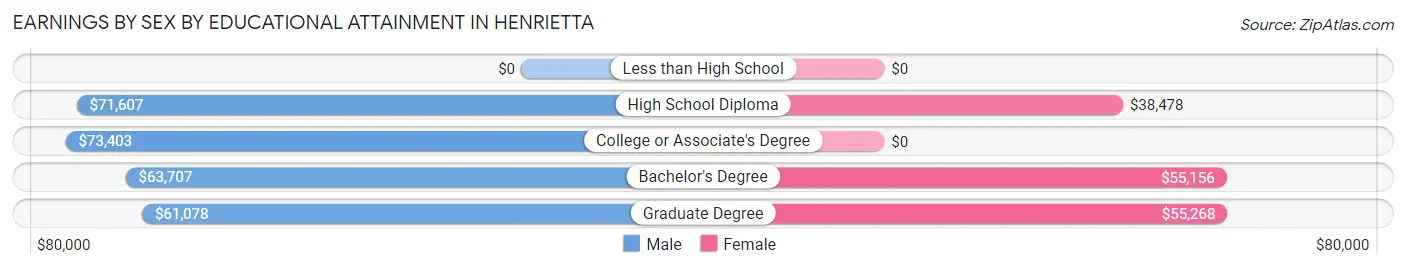
Earnings by Sex by Educational Attainment in Henrietta
Average earnings in Henrietta are $64,030 for men and $42,727 for women, a difference of 33.3%. Men with an educational attainment of college or associate's degree enjoy the highest average annual earnings of $73,403, while those with graduate degree education earn the least with $61,078. Women with an educational attainment of graduate degree earn the most with the average annual earnings of $55,268, while those with high school diploma education have the smallest earnings of $38,478.
| Educational Attainment | Male Income | Female Income |
| Less than High School | - | - |
| High School Diploma | $71,607 | $38,478 |
| College or Associate's Degree | $73,403 | $0 |
| Bachelor's Degree | $63,707 | $55,156 |
| Graduate Degree | $61,078 | $55,268 |
| Total | $64,030 | $42,727 |
Family Income in Henrietta
Family Income Brackets in Henrietta
According to the Henrietta family income data, there are 237 families falling into the $100,000 to $149,999 income range, which is the most common income bracket and makes up 29.2% of all families.
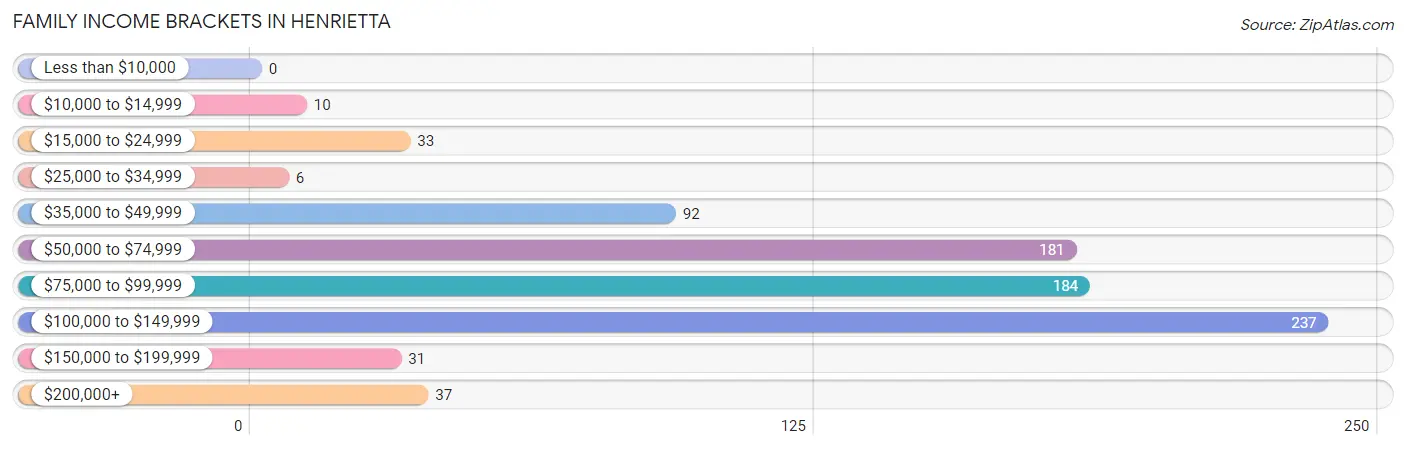
| Income Bracket | # Families | % Families |
| Less than $10,000 | 0 | 0.0% |
| $10,000 to $14,999 | 10 | 1.2% |
| $15,000 to $24,999 | 33 | 4.1% |
| $25,000 to $34,999 | 6 | 0.7% |
| $35,000 to $49,999 | 92 | 11.3% |
| $50,000 to $74,999 | 181 | 22.3% |
| $75,000 to $99,999 | 184 | 22.7% |
| $100,000 to $149,999 | 237 | 29.2% |
| $150,000 to $199,999 | 31 | 3.8% |
| $200,000+ | 37 | 4.6% |
Family Income by Famaliy Size in Henrietta
4-person families (111 | 13.7%) account for the highest median family income in Henrietta with $101,587 per family, while 2-person families (380 | 46.9%) have the highest median income of $44,822 per family member.
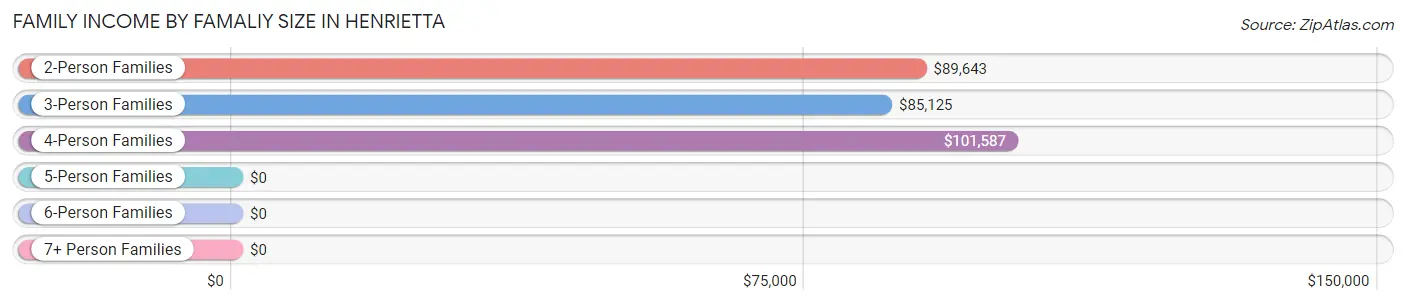
| Income Bracket | # Families | Median Income |
| 2-Person Families | 380 (46.9%) | $89,643 |
| 3-Person Families | 201 (24.8%) | $85,125 |
| 4-Person Families | 111 (13.7%) | $101,587 |
| 5-Person Families | 94 (11.6%) | $0 |
| 6-Person Families | 0 (0.0%) | $0 |
| 7+ Person Families | 25 (3.1%) | $0 |
| Total | 811 (100.0%) | $90,823 |
Family Income by Number of Earners in Henrietta
The median family income in Henrietta is $90,823, with families comprising 2 earners (337) having the highest median family income of $117,853, while families with no earners (134) have the lowest median family income of $53,750, accounting for 41.5% and 16.5% of families, respectively.
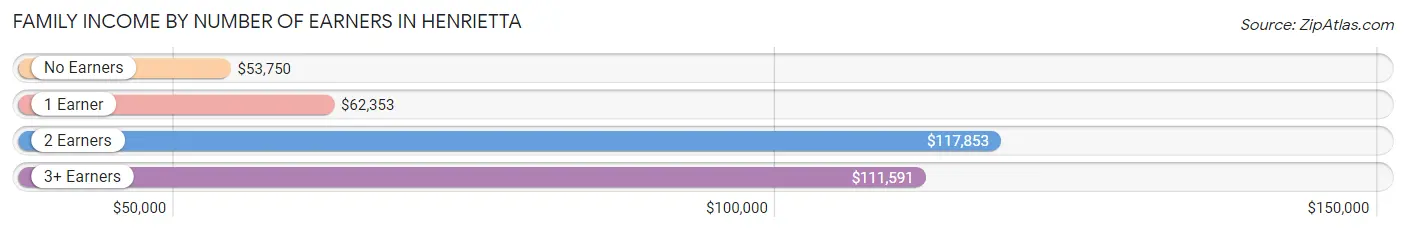
| Number of Earners | # Families | Median Income |
| No Earners | 134 (16.5%) | $53,750 |
| 1 Earner | 248 (30.6%) | $62,353 |
| 2 Earners | 337 (41.5%) | $117,853 |
| 3+ Earners | 92 (11.3%) | $111,591 |
| Total | 811 (100.0%) | $90,823 |
Household Income in Henrietta
Household Income Brackets in Henrietta
With 258 households falling in the category, the $50,000 to $74,999 income range is the most frequent in Henrietta, accounting for 20.2% of all households. In contrast, only 31 households (2.4%) fall into the $150,000 to $199,999 income bracket, making it the least populous group.
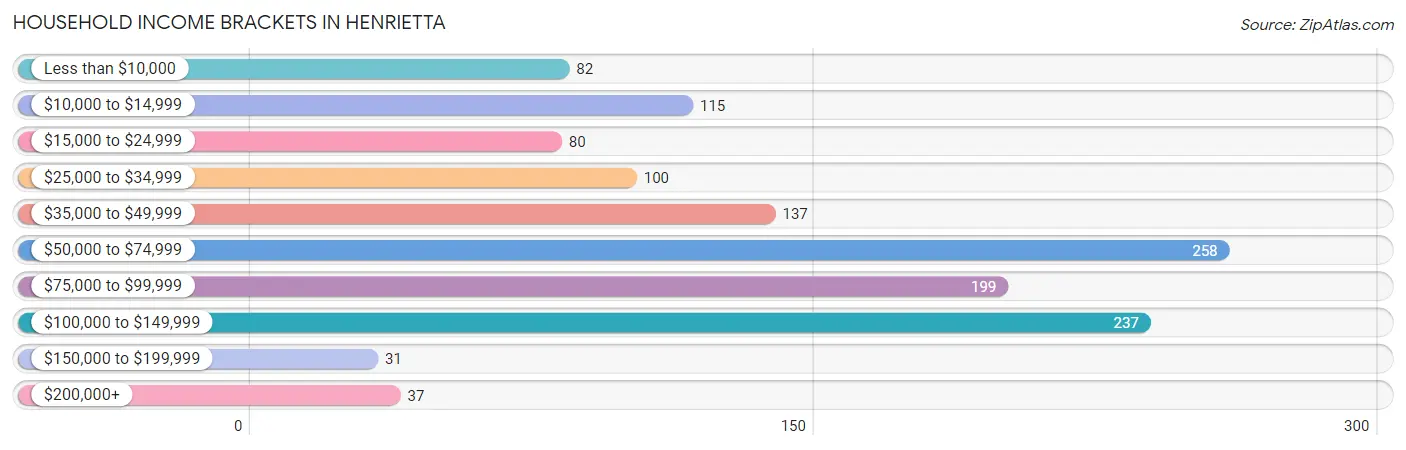
| Income Bracket | # Households | % Households |
| Less than $10,000 | 82 | 6.4% |
| $10,000 to $14,999 | 115 | 9.0% |
| $15,000 to $24,999 | 80 | 6.3% |
| $25,000 to $34,999 | 100 | 7.8% |
| $35,000 to $49,999 | 137 | 10.7% |
| $50,000 to $74,999 | 258 | 20.2% |
| $75,000 to $99,999 | 199 | 15.6% |
| $100,000 to $149,999 | 237 | 18.6% |
| $150,000 to $199,999 | 31 | 2.4% |
| $200,000+ | 37 | 2.9% |
Household Income by Householder Age in Henrietta
The median household income in Henrietta is $61,317, with the highest median household income of $98,233 found in the 25 to 44 years age bracket for the primary householder. A total of 297 households (23.3%) fall into this category. Meanwhile, the 15 to 24 years age bracket for the primary householder has the lowest median household income of $0, with 52 households (4.1%) in this group.
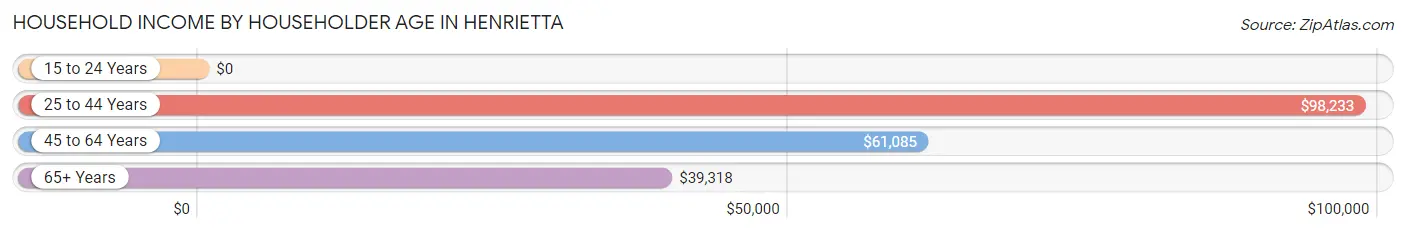
| Income Bracket | # Households | Median Income |
| 15 to 24 Years | 52 (4.1%) | $0 |
| 25 to 44 Years | 297 (23.3%) | $98,233 |
| 45 to 64 Years | 477 (37.4%) | $61,085 |
| 65+ Years | 450 (35.3%) | $39,318 |
| Total | 1,276 (100.0%) | $61,317 |
Poverty in Henrietta
Income Below Poverty by Sex and Age in Henrietta
With 11.0% poverty level for males and 8.9% for females among the residents of Henrietta, 45 to 54 year old males and 65 to 74 year old females are the most vulnerable to poverty, with 56 males (39.4%) and 55 females (23.3%) in their respective age groups living below the poverty level.
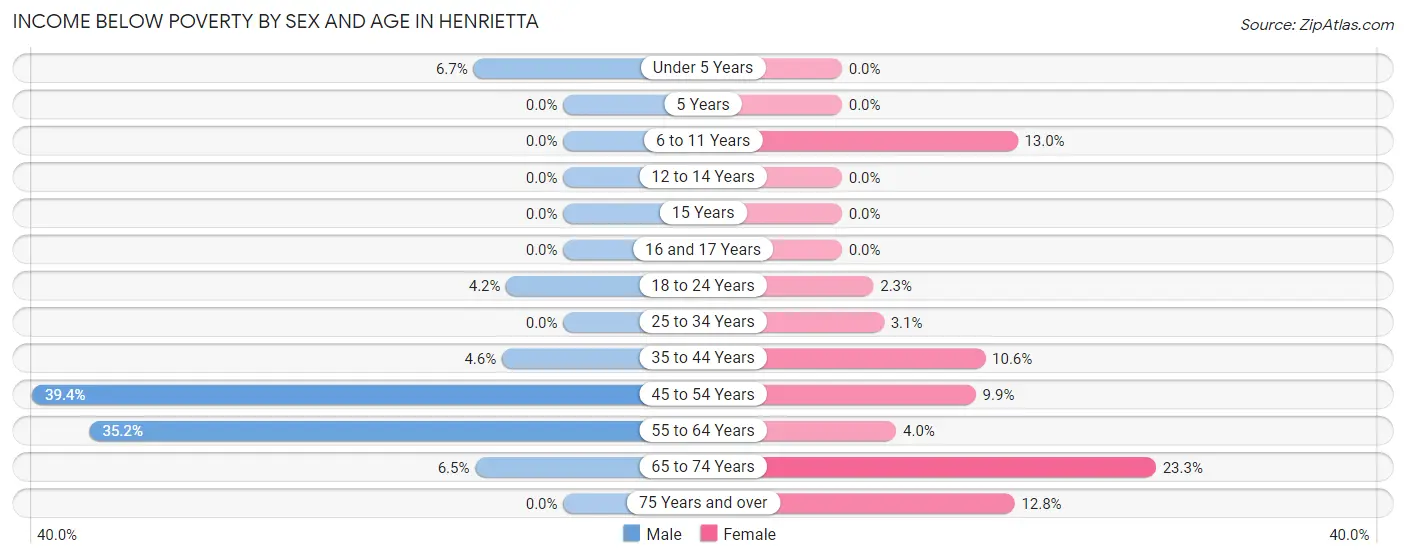
| Age Bracket | Male | Female |
| Under 5 Years | 6 (6.7%) | 0 (0.0%) |
| 5 Years | 0 (0.0%) | 0 (0.0%) |
| 6 to 11 Years | 0 (0.0%) | 15 (13.0%) |
| 12 to 14 Years | 0 (0.0%) | 0 (0.0%) |
| 15 Years | 0 (0.0%) | 0 (0.0%) |
| 16 and 17 Years | 0 (0.0%) | 0 (0.0%) |
| 18 to 24 Years | 6 (4.2%) | 3 (2.3%) |
| 25 to 34 Years | 0 (0.0%) | 5 (3.1%) |
| 35 to 44 Years | 6 (4.5%) | 25 (10.6%) |
| 45 to 54 Years | 56 (39.4%) | 16 (9.9%) |
| 55 to 64 Years | 70 (35.2%) | 10 (4.0%) |
| 65 to 74 Years | 10 (6.5%) | 55 (23.3%) |
| 75 Years and over | 0 (0.0%) | 15 (12.8%) |
| Total | 154 (11.0%) | 144 (8.9%) |
Income Above Poverty by Sex and Age in Henrietta
According to the poverty statistics in Henrietta, males aged 5 years and females aged under 5 years are the age groups that are most secure financially, with 100.0% of males and 100.0% of females in these age groups living above the poverty line.
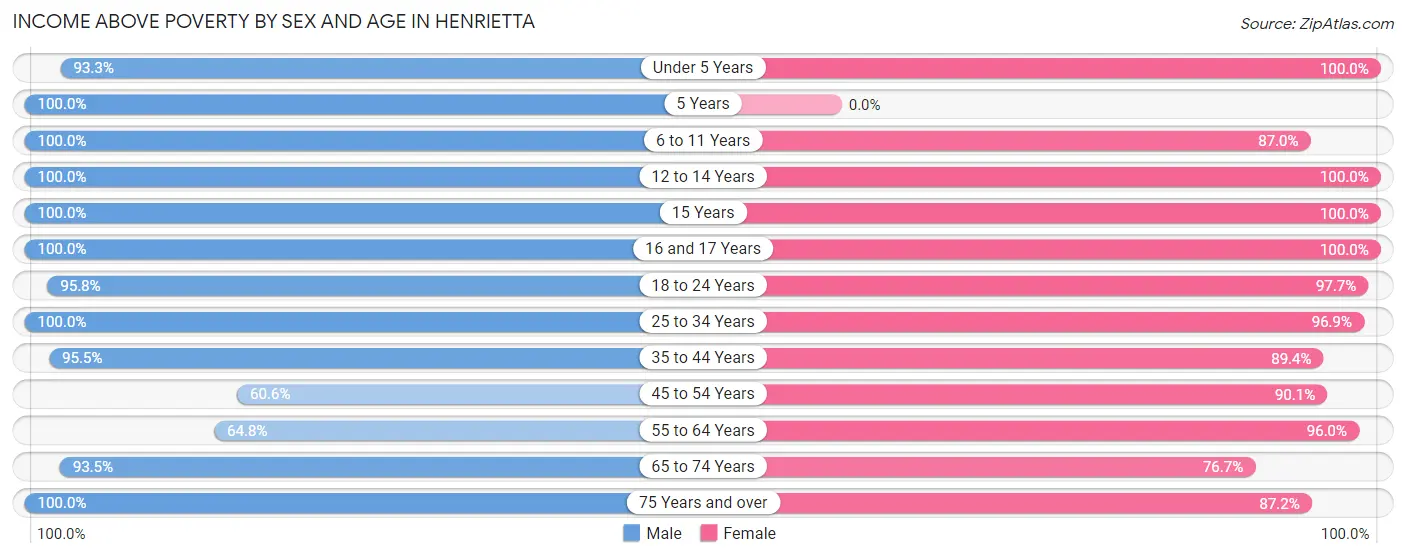
| Age Bracket | Male | Female |
| Under 5 Years | 84 (93.3%) | 62 (100.0%) |
| 5 Years | 18 (100.0%) | 0 (0.0%) |
| 6 to 11 Years | 75 (100.0%) | 100 (87.0%) |
| 12 to 14 Years | 142 (100.0%) | 77 (100.0%) |
| 15 Years | 5 (100.0%) | 45 (100.0%) |
| 16 and 17 Years | 44 (100.0%) | 39 (100.0%) |
| 18 to 24 Years | 136 (95.8%) | 125 (97.7%) |
| 25 to 34 Years | 115 (100.0%) | 156 (96.9%) |
| 35 to 44 Years | 126 (95.5%) | 210 (89.4%) |
| 45 to 54 Years | 86 (60.6%) | 145 (90.1%) |
| 55 to 64 Years | 129 (64.8%) | 238 (96.0%) |
| 65 to 74 Years | 143 (93.5%) | 181 (76.7%) |
| 75 Years and over | 140 (100.0%) | 102 (87.2%) |
| Total | 1,243 (89.0%) | 1,480 (91.1%) |
Income Below Poverty Among Married-Couple Families in Henrietta
The poverty statistics for married-couple families in Henrietta show that 3.1% or 20 of the total 653 families live below the poverty line. Families with 3 or 4 children have the highest poverty rate of 6.7%, comprising of 5 families. On the other hand, families with 1 or 2 children have the lowest poverty rate of 0.0%, which includes 0 families.
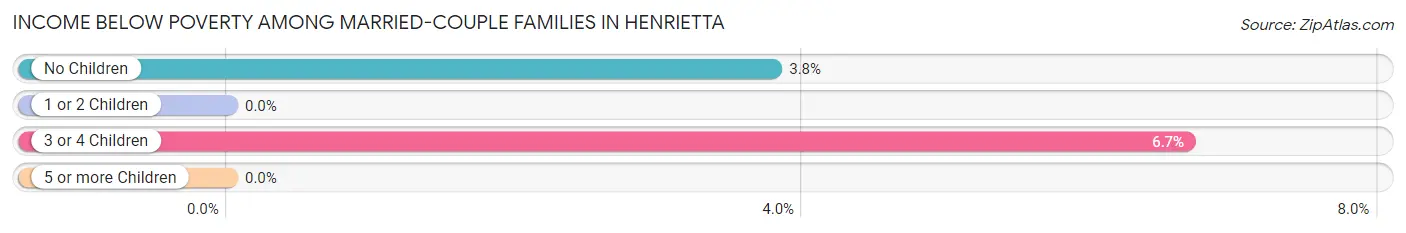
| Children | Above Poverty | Below Poverty |
| No Children | 381 (96.2%) | 15 (3.8%) |
| 1 or 2 Children | 182 (100.0%) | 0 (0.0%) |
| 3 or 4 Children | 70 (93.3%) | 5 (6.7%) |
| 5 or more Children | 0 (0.0%) | 0 (0.0%) |
| Total | 633 (96.9%) | 20 (3.1%) |
Income Below Poverty Among Single-Parent Households in Henrietta
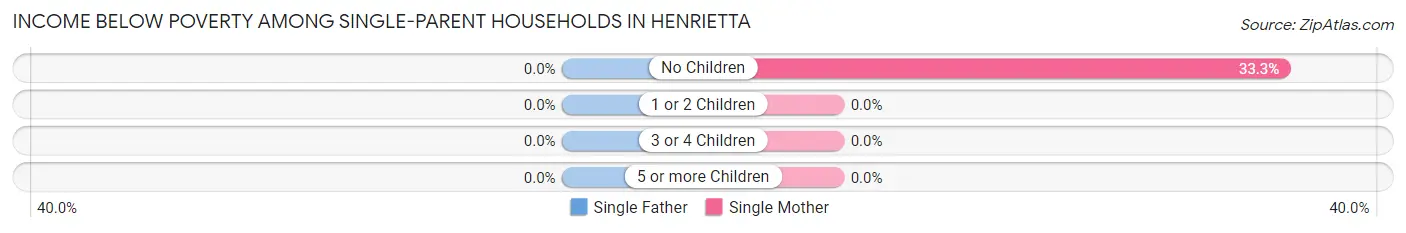
| Children | Single Father | Single Mother |
| No Children | 0 (0.0%) | 5 (33.3%) |
| 1 or 2 Children | 0 (0.0%) | 0 (0.0%) |
| 3 or 4 Children | 0 (0.0%) | 0 (0.0%) |
| 5 or more Children | 0 (0.0%) | 0 (0.0%) |
| Total | 0 (0.0%) | 5 (3.4%) |
Income Below Poverty Among Married-Couple vs Single-Parent Households in Henrietta
The poverty data for Henrietta shows that 20 of the married-couple family households (3.1%) and 5 of the single-parent households (3.2%) are living below the poverty level. Within the married-couple family households, those with 3 or 4 children have the highest poverty rate, with 5 households (6.7%) falling below the poverty line. Among the single-parent households, those with no children have the highest poverty rate, with 5 household (33.3%) living below poverty.
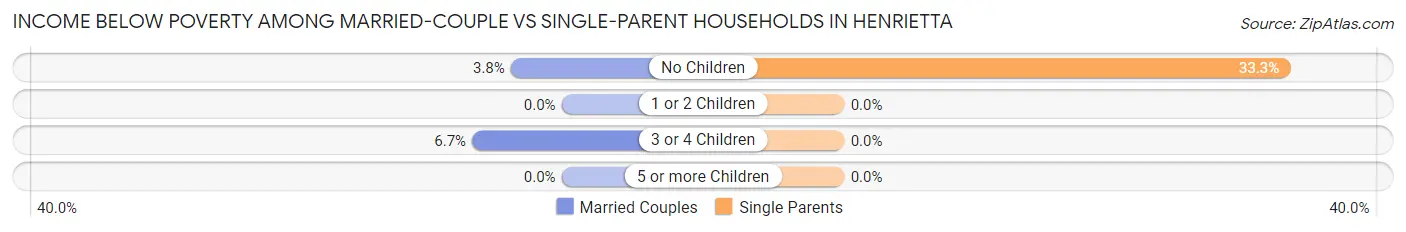
| Children | Married-Couple Families | Single-Parent Households |
| No Children | 15 (3.8%) | 5 (33.3%) |
| 1 or 2 Children | 0 (0.0%) | 0 (0.0%) |
| 3 or 4 Children | 5 (6.7%) | 0 (0.0%) |
| 5 or more Children | 0 (0.0%) | 0 (0.0%) |
| Total | 20 (3.1%) | 5 (3.2%) |
Race in Henrietta
The most populous races in Henrietta are White / Caucasian (2,875 | 92.3%), Hispanic or Latino (124 | 4.0%), and Two or more Races (120 | 3.8%).
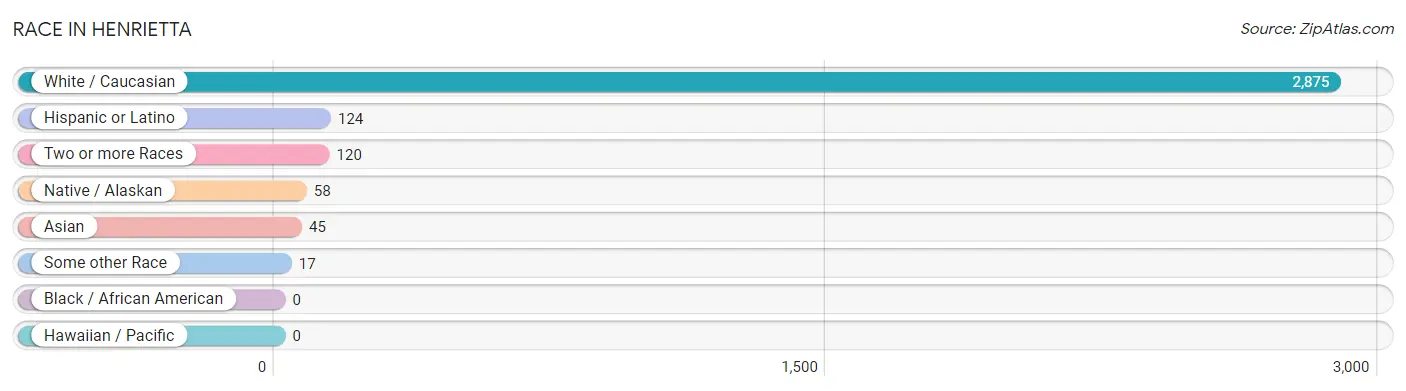
| Race | # Population | % Population |
| Asian | 45 | 1.4% |
| Black / African American | 0 | 0.0% |
| Hawaiian / Pacific | 0 | 0.0% |
| Hispanic or Latino | 124 | 4.0% |
| Native / Alaskan | 58 | 1.9% |
| White / Caucasian | 2,875 | 92.3% |
| Two or more Races | 120 | 3.8% |
| Some other Race | 17 | 0.5% |
| Total | 3,115 | 100.0% |
Ancestry in Henrietta
The most populous ancestries reported in Henrietta are English (448 | 14.4%), German (411 | 13.2%), Irish (395 | 12.7%), American (217 | 7.0%), and Czechoslovakian (132 | 4.2%), together accounting for 51.5% of all Henrietta residents.
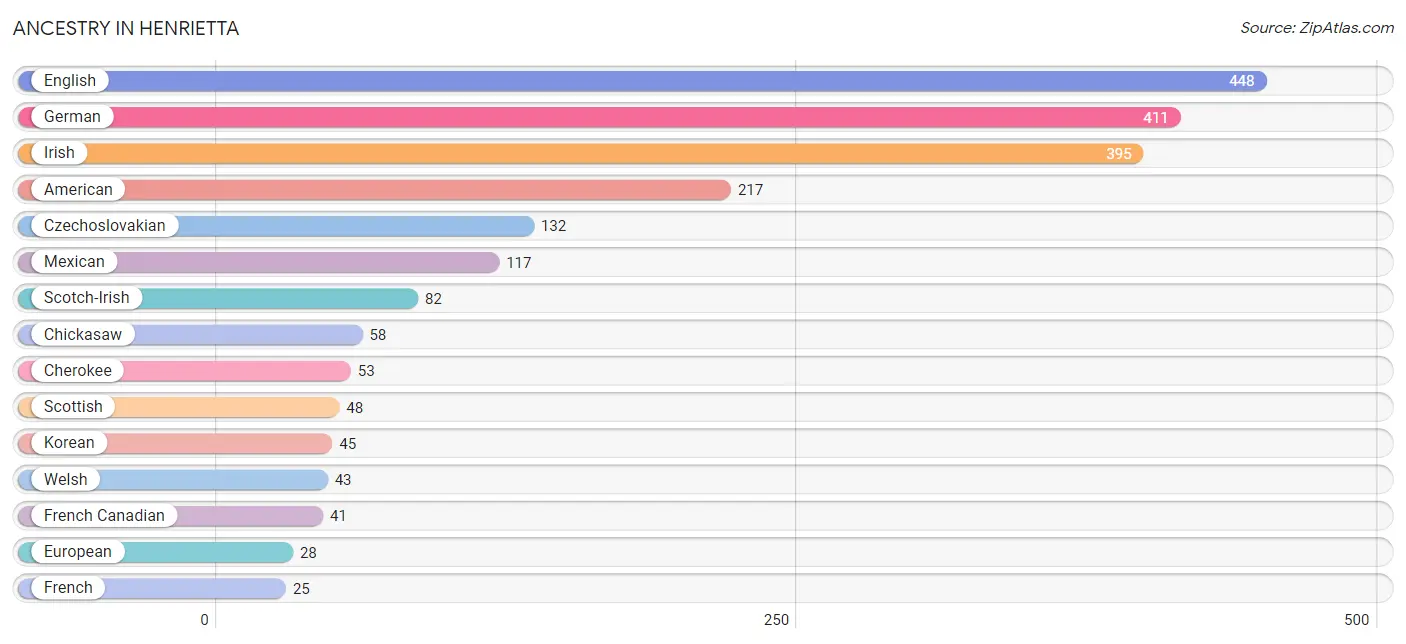
| Ancestry | # Population | % Population |
| American | 217 | 7.0% |
| Cherokee | 53 | 1.7% |
| Chickasaw | 58 | 1.9% |
| Czechoslovakian | 132 | 4.2% |
| Eastern European | 7 | 0.2% |
| English | 448 | 14.4% |
| European | 28 | 0.9% |
| French | 25 | 0.8% |
| French Canadian | 41 | 1.3% |
| German | 411 | 13.2% |
| Hopi | 25 | 0.8% |
| Irish | 395 | 12.7% |
| Italian | 3 | 0.1% |
| Korean | 45 | 1.4% |
| Mexican | 117 | 3.8% |
| Norwegian | 4 | 0.1% |
| Portuguese | 5 | 0.2% |
| Scotch-Irish | 82 | 2.6% |
| Scottish | 48 | 1.5% |
| Swedish | 21 | 0.7% |
| Welsh | 43 | 1.4% | View All 21 Rows |
Immigrants in Henrietta
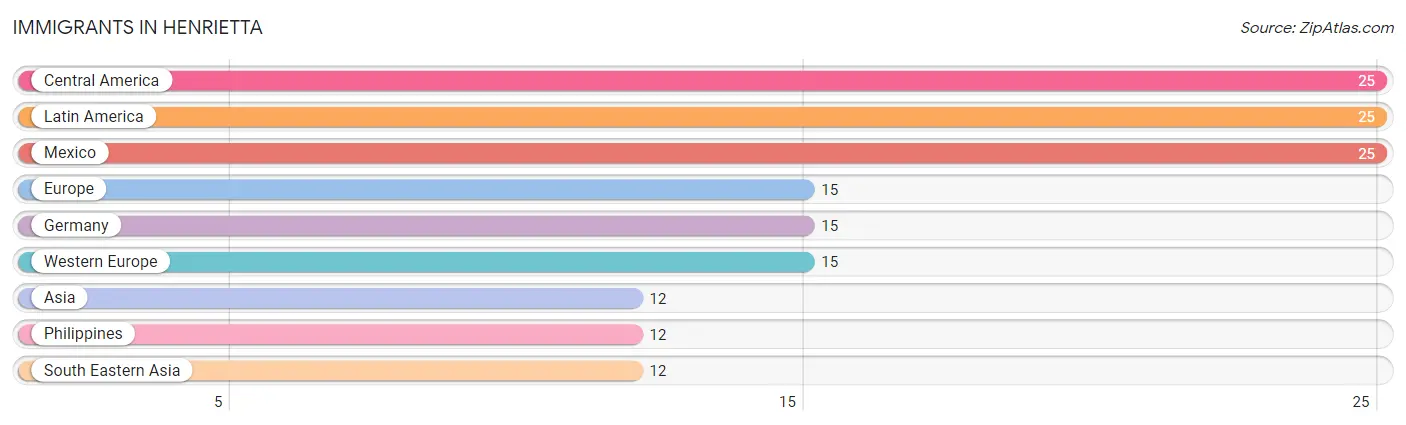
The most numerous immigrant groups reported in Henrietta came from Central America (25 | 0.8%), Latin America (25 | 0.8%), Mexico (25 | 0.8%), Europe (15 | 0.5%), and Germany (15 | 0.5%), together accounting for 3.4% of all Henrietta residents.
| Immigration Origin | # Population | % Population |
| Asia | 12 | 0.4% |
| Central America | 25 | 0.8% |
| Europe | 15 | 0.5% |
| Germany | 15 | 0.5% |
| Latin America | 25 | 0.8% |
| Mexico | 25 | 0.8% |
| Philippines | 12 | 0.4% |
| South Eastern Asia | 12 | 0.4% |
| Western Europe | 15 | 0.5% | View All 9 Rows |
Sex and Age in Henrietta
Sex and Age in Henrietta
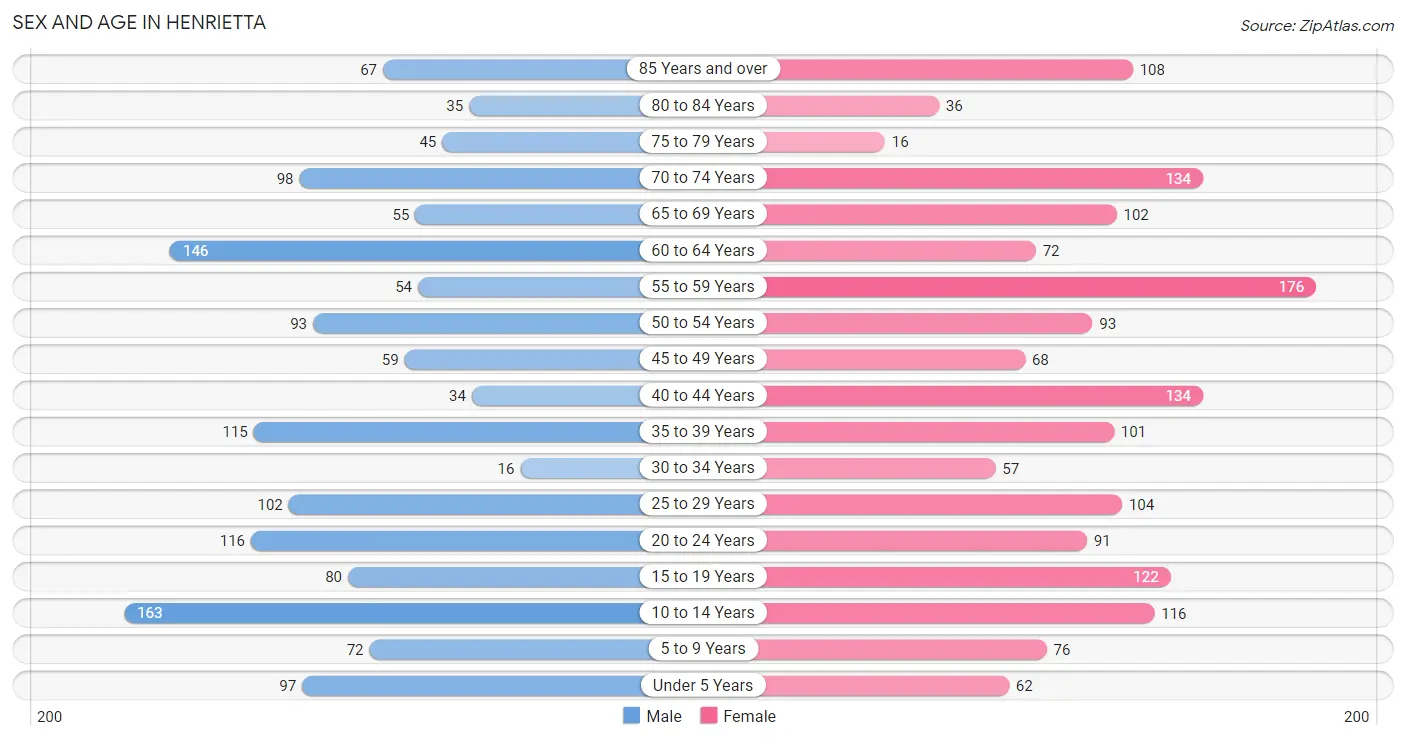
The most populous age groups in Henrietta are 10 to 14 Years (163 | 11.3%) for men and 55 to 59 Years (176 | 10.5%) for women.
| Age Bracket | Male | Female |
| Under 5 Years | 97 (6.7%) | 62 (3.7%) |
| 5 to 9 Years | 72 (5.0%) | 76 (4.6%) |
| 10 to 14 Years | 163 (11.3%) | 116 (7.0%) |
| 15 to 19 Years | 80 (5.5%) | 122 (7.3%) |
| 20 to 24 Years | 116 (8.0%) | 91 (5.5%) |
| 25 to 29 Years | 102 (7.0%) | 104 (6.2%) |
| 30 to 34 Years | 16 (1.1%) | 57 (3.4%) |
| 35 to 39 Years | 115 (8.0%) | 101 (6.1%) |
| 40 to 44 Years | 34 (2.4%) | 134 (8.0%) |
| 45 to 49 Years | 59 (4.1%) | 68 (4.1%) |
| 50 to 54 Years | 93 (6.4%) | 93 (5.6%) |
| 55 to 59 Years | 54 (3.7%) | 176 (10.5%) |
| 60 to 64 Years | 146 (10.1%) | 72 (4.3%) |
| 65 to 69 Years | 55 (3.8%) | 102 (6.1%) |
| 70 to 74 Years | 98 (6.8%) | 134 (8.0%) |
| 75 to 79 Years | 45 (3.1%) | 16 (1.0%) |
| 80 to 84 Years | 35 (2.4%) | 36 (2.2%) |
| 85 Years and over | 67 (4.6%) | 108 (6.5%) |
| Total | 1,447 (100.0%) | 1,668 (100.0%) |
Families and Households in Henrietta
Median Family Size in Henrietta
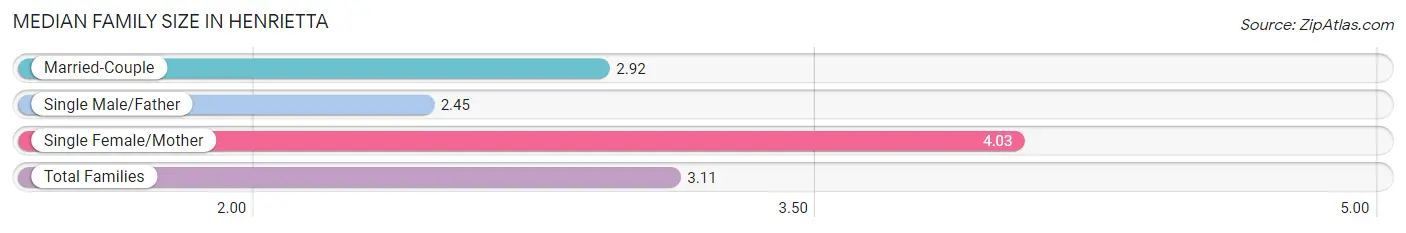
The median family size in Henrietta is 3.11 persons per family, with single female/mother families (147 | 18.1%) accounting for the largest median family size of 4.03 persons per family. On the other hand, single male/father families (11 | 1.4%) represent the smallest median family size with 2.45 persons per family.
| Family Type | # Families | Family Size |
| Married-Couple | 653 (80.5%) | 2.92 |
| Single Male/Father | 11 (1.4%) | 2.45 |
| Single Female/Mother | 147 (18.1%) | 4.03 |
| Total Families | 811 (100.0%) | 3.11 |
Median Household Size in Henrietta
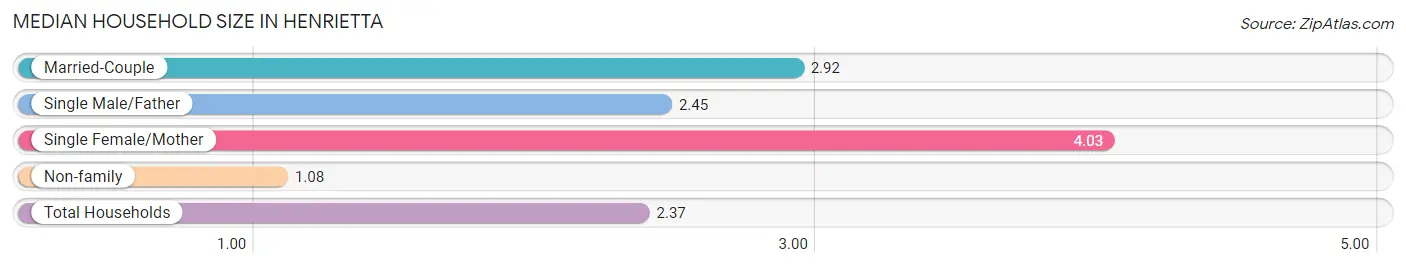
The median household size in Henrietta is 2.37 persons per household, with single female/mother households (147 | 11.5%) accounting for the largest median household size of 4.03 persons per household. non-family households (465 | 36.4%) represent the smallest median household size with 1.08 persons per household.
| Household Type | # Households | Household Size |
| Married-Couple | 653 (51.2%) | 2.92 |
| Single Male/Father | 11 (0.9%) | 2.45 |
| Single Female/Mother | 147 (11.5%) | 4.03 |
| Non-family | 465 (36.4%) | 1.08 |
| Total Households | 1,276 (100.0%) | 2.37 |
Household Size by Marriage Status in Henrietta
Out of a total of 1,276 households in Henrietta, 811 (63.6%) are family households, while 465 (36.4%) are nonfamily households. The most numerous type of family households are 2-person households, comprising 380, and the most common type of nonfamily households are 1-person households, comprising 448.
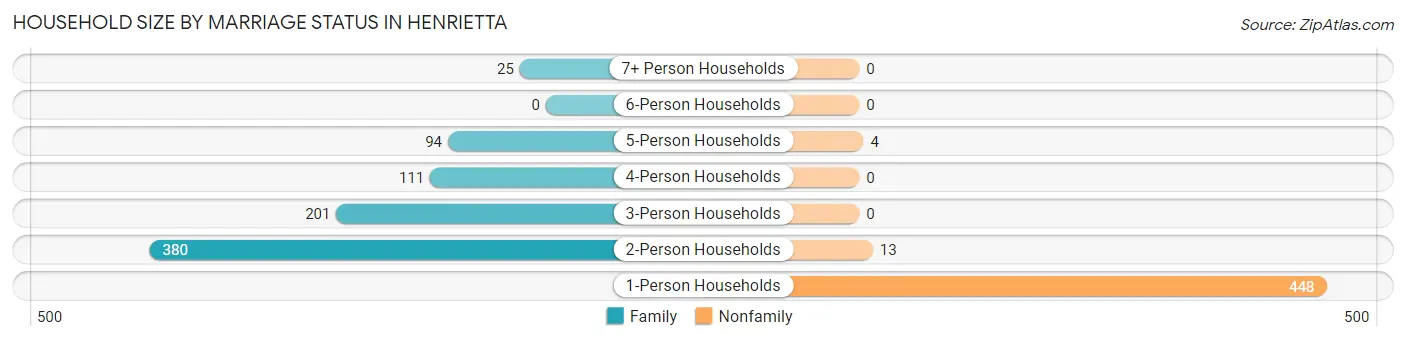
| Household Size | Family Households | Nonfamily Households |
| 1-Person Households | - | 448 (35.1%) |
| 2-Person Households | 380 (29.8%) | 13 (1.0%) |
| 3-Person Households | 201 (15.8%) | 0 (0.0%) |
| 4-Person Households | 111 (8.7%) | 0 (0.0%) |
| 5-Person Households | 94 (7.4%) | 4 (0.3%) |
| 6-Person Households | 0 (0.0%) | 0 (0.0%) |
| 7+ Person Households | 25 (2.0%) | 0 (0.0%) |
| Total | 811 (63.6%) | 465 (36.4%) |
Female Fertility in Henrietta
Fertility by Age in Henrietta
Average fertility rate in Henrietta is 121.0 births per 1,000 women. Women in the age bracket of 15 to 19 years have the highest fertility rate with 344.0 births per 1,000 women. Women in the age bracket of 15 to 19 years acount for 47.7% of all women with births.
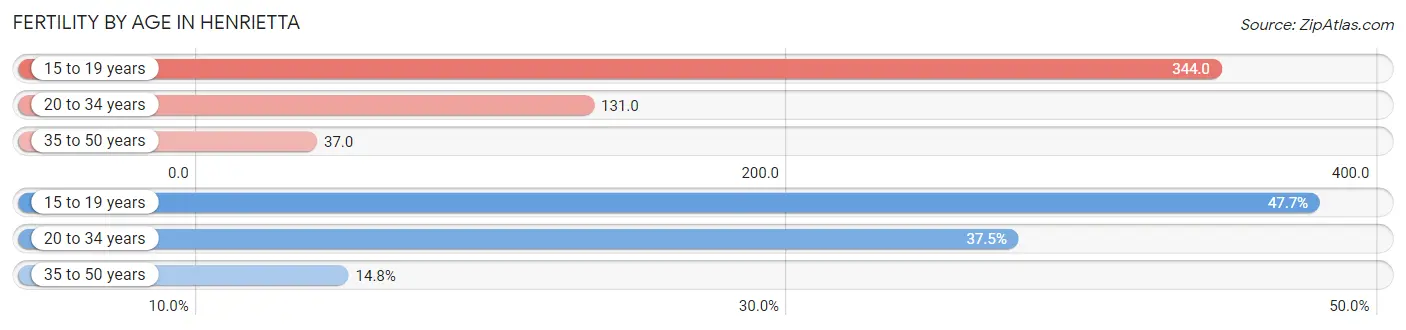
| Age Bracket | Women with Births | Births / 1,000 Women |
| 15 to 19 years | 42 (47.7%) | 344.0 |
| 20 to 34 years | 33 (37.5%) | 131.0 |
| 35 to 50 years | 13 (14.8%) | 37.0 |
| Total | 88 (100.0%) | 121.0 |
Fertility by Age by Marriage Status in Henrietta
37.5% of women with births (88) in Henrietta are married. The highest percentage of unmarried women with births falls into 15 to 19 years age bracket with 100.0% of them unmarried at the time of birth, while the lowest percentage of unmarried women with births belong to 20 to 34 years age bracket with 0.0% of them unmarried.
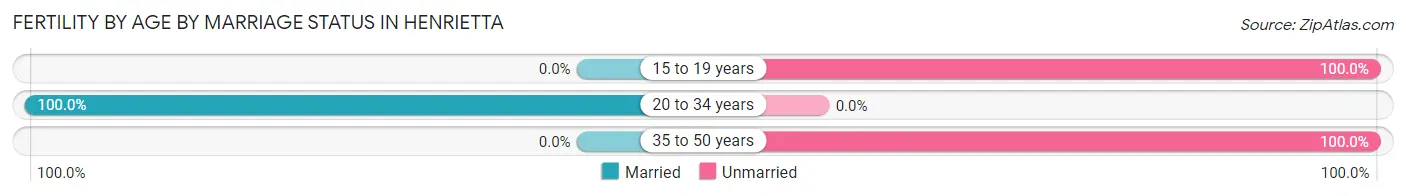
| Age Bracket | Married | Unmarried |
| 15 to 19 years | 0 (0.0%) | 42 (100.0%) |
| 20 to 34 years | 33 (100.0%) | 0 (0.0%) |
| 35 to 50 years | 0 (0.0%) | 13 (100.0%) |
| Total | 33 (37.5%) | 55 (62.5%) |
Fertility by Education in Henrietta
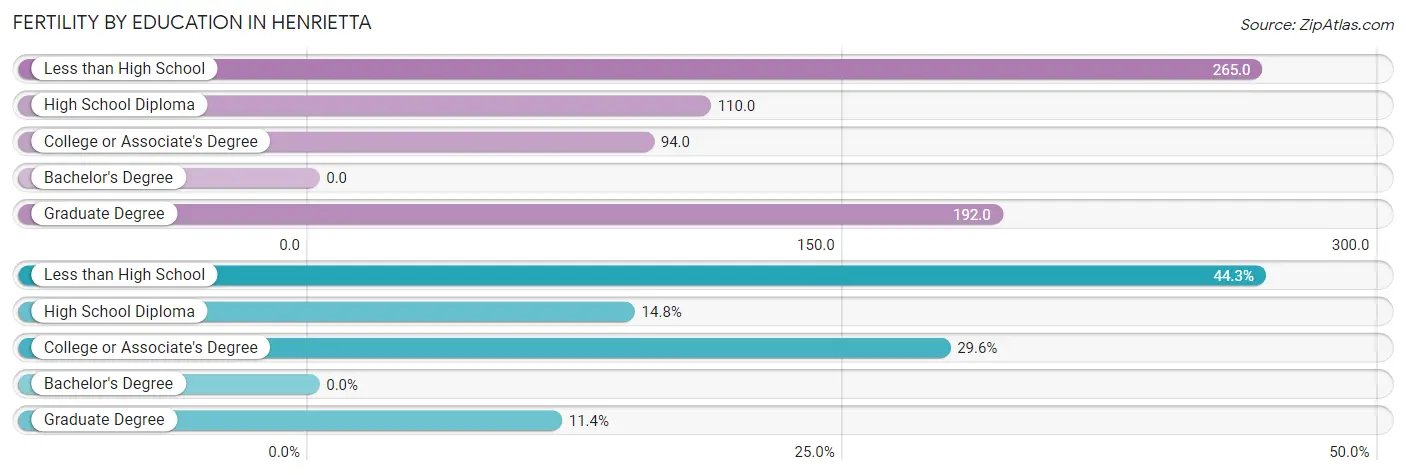
| Educational Attainment | Women with Births | Births / 1,000 Women |
| Less than High School | 39 (44.3%) | 265.0 |
| High School Diploma | 13 (14.8%) | 110.0 |
| College or Associate's Degree | 26 (29.5%) | 94.0 |
| Bachelor's Degree | 0 (0.0%) | 0.0 |
| Graduate Degree | 10 (11.4%) | 192.0 |
| Total | 88 (100.0%) | 121.0 |
Fertility by Education by Marriage Status in Henrietta
62.5% of women with births in Henrietta are unmarried. Women with the educational attainment of graduate degree are most likely to be married with 100.0% of them married at childbirth, while women with the educational attainment of less than high school are least likely to be married with 100.0% of them unmarried at childbirth.
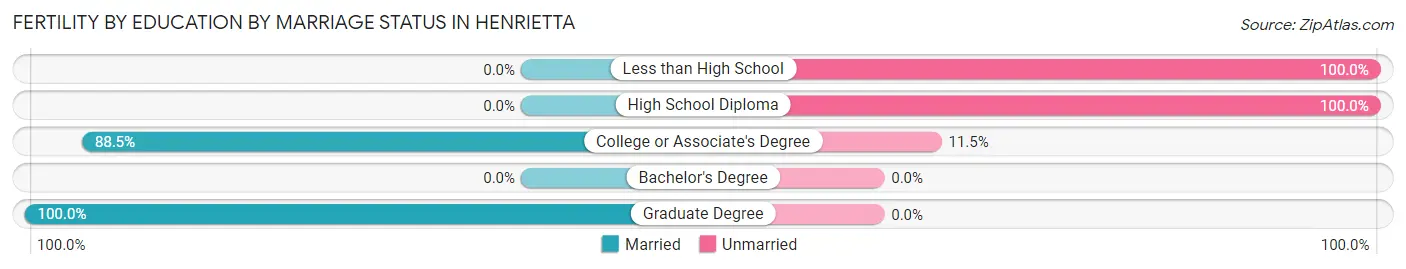
| Educational Attainment | Married | Unmarried |
| Less than High School | 0 (0.0%) | 39 (100.0%) |
| High School Diploma | 0 (0.0%) | 13 (100.0%) |
| College or Associate's Degree | 23 (88.5%) | 3 (11.5%) |
| Bachelor's Degree | 0 (0.0%) | 0 (0.0%) |
| Graduate Degree | 10 (100.0%) | 0 (0.0%) |
| Total | 33 (37.5%) | 55 (62.5%) |
Employment Characteristics in Henrietta
Employment by Class of Employer in Henrietta
Among the 1,326 employed individuals in Henrietta, private company employees (772 | 58.2%), local government employees (202 | 15.2%), and state government employees (130 | 9.8%) make up the most common classes of employment.
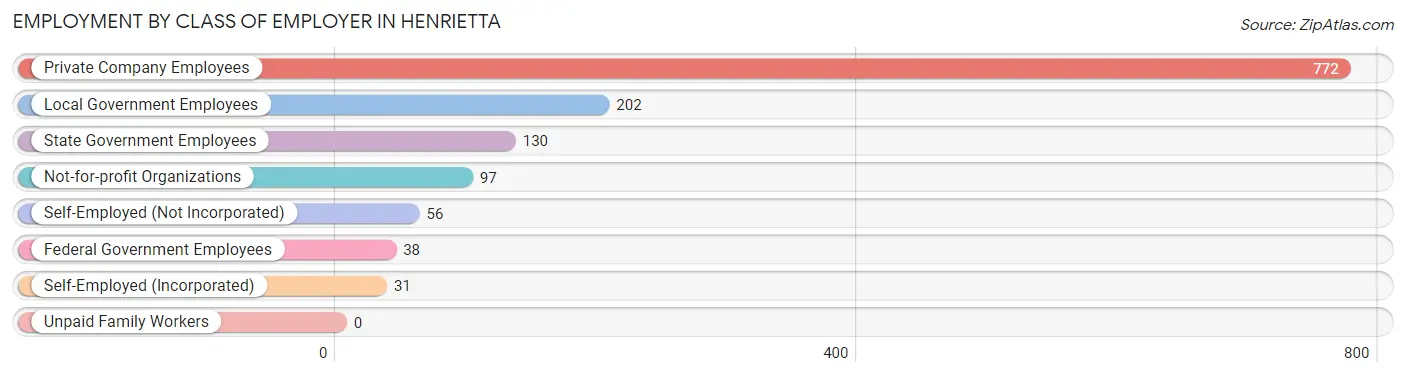
| Employer Class | # Employees | % Employees |
| Private Company Employees | 772 | 58.2% |
| Self-Employed (Incorporated) | 31 | 2.3% |
| Self-Employed (Not Incorporated) | 56 | 4.2% |
| Not-for-profit Organizations | 97 | 7.3% |
| Local Government Employees | 202 | 15.2% |
| State Government Employees | 130 | 9.8% |
| Federal Government Employees | 38 | 2.9% |
| Unpaid Family Workers | 0 | 0.0% |
| Total | 1,326 | 100.0% |
Employment Status by Age in Henrietta
According to the labor force statistics for Henrietta, out of the total population over 16 years of age (2,479), 54.6% or 1,354 individuals are in the labor force, with 1.3% or 18 of them unemployed. The age group with the highest labor force participation rate is 25 to 29 years, with 99.5% or 205 individuals in the labor force. Within the labor force, the 16 to 19 years age range has the highest percentage of unemployed individuals, with 6.4% or 3 of them being unemployed.
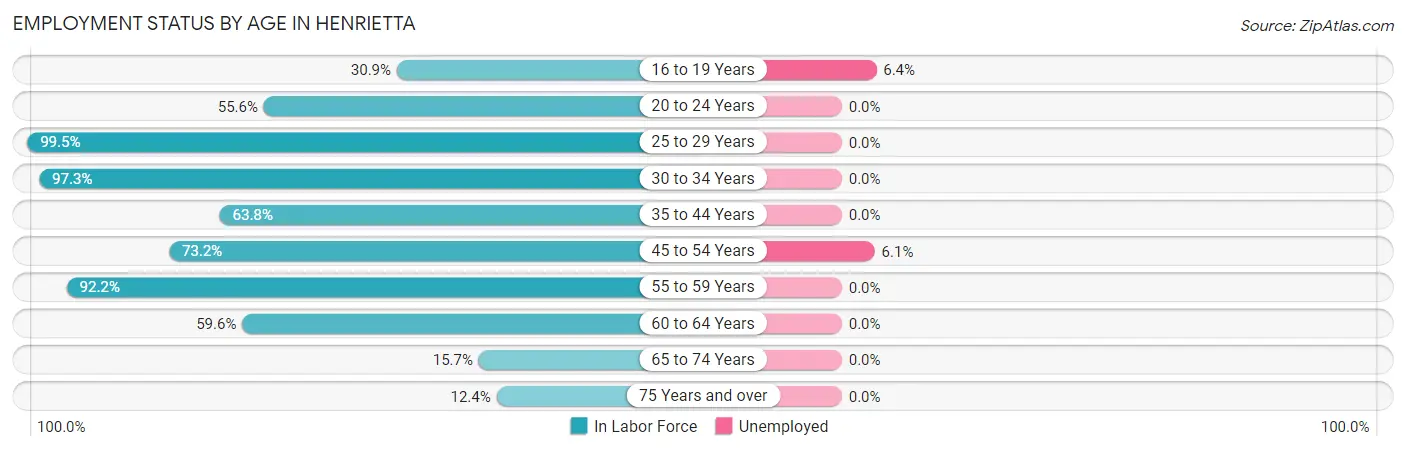
| Age Bracket | In Labor Force | Unemployed |
| 16 to 19 Years | 47 (30.9%) | 3 (6.4%) |
| 20 to 24 Years | 115 (55.6%) | 0 (0.0%) |
| 25 to 29 Years | 205 (99.5%) | 0 (0.0%) |
| 30 to 34 Years | 71 (97.3%) | 0 (0.0%) |
| 35 to 44 Years | 245 (63.8%) | 0 (0.0%) |
| 45 to 54 Years | 229 (73.2%) | 14 (6.1%) |
| 55 to 59 Years | 212 (92.2%) | 0 (0.0%) |
| 60 to 64 Years | 130 (59.6%) | 0 (0.0%) |
| 65 to 74 Years | 61 (15.7%) | 0 (0.0%) |
| 75 Years and over | 38 (12.4%) | 0 (0.0%) |
| Total | 1,354 (54.6%) | 18 (1.3%) |
Employment Status by Educational Attainment in Henrietta
According to labor force statistics for Henrietta, 76.7% of individuals (1,092) out of the total population between 25 and 64 years of age (1,424) are in the labor force, with 1.3% or 14 of them being unemployed. The group with the highest labor force participation rate are those with the educational attainment of bachelor's degree or higher, with 98.0% or 402 individuals in the labor force. Within the labor force, individuals with less than high school education have the highest percentage of unemployment, with 51.9% or 14 of them being unemployed.
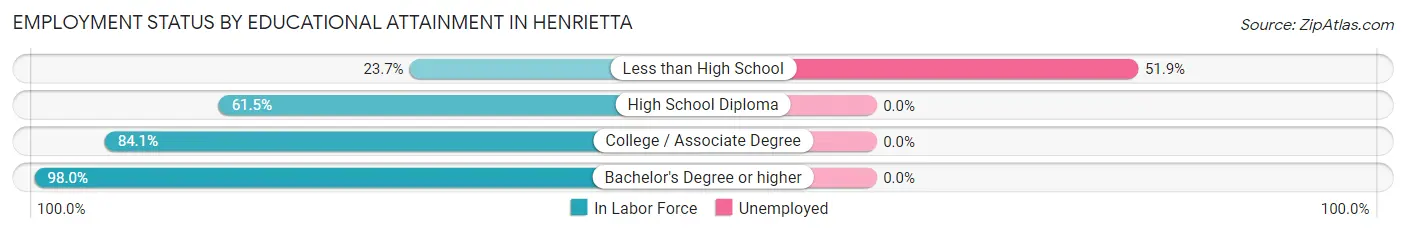
| Educational Attainment | In Labor Force | Unemployed |
| Less than High School | 27 (23.7%) | 59 (51.9%) |
| High School Diploma | 256 (61.5%) | 0 (0.0%) |
| College / Associate Degree | 407 (84.1%) | 0 (0.0%) |
| Bachelor's Degree or higher | 402 (98.0%) | 0 (0.0%) |
| Total | 1,092 (76.7%) | 19 (1.3%) |
Employment Occupations by Sex in Henrietta
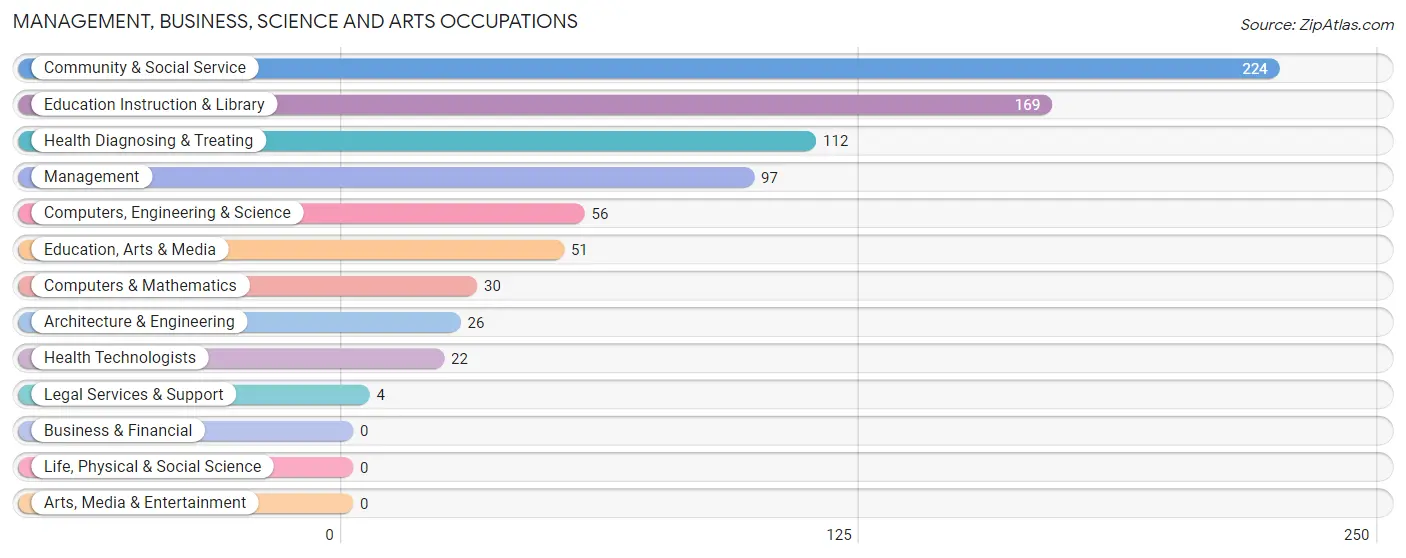
Management, Business, Science and Arts Occupations
The most common Management, Business, Science and Arts occupations in Henrietta are Community & Social Service (224 | 16.8%), Education Instruction & Library (169 | 12.7%), Health Diagnosing & Treating (112 | 8.4%), Management (97 | 7.3%), and Computers, Engineering & Science (56 | 4.2%).
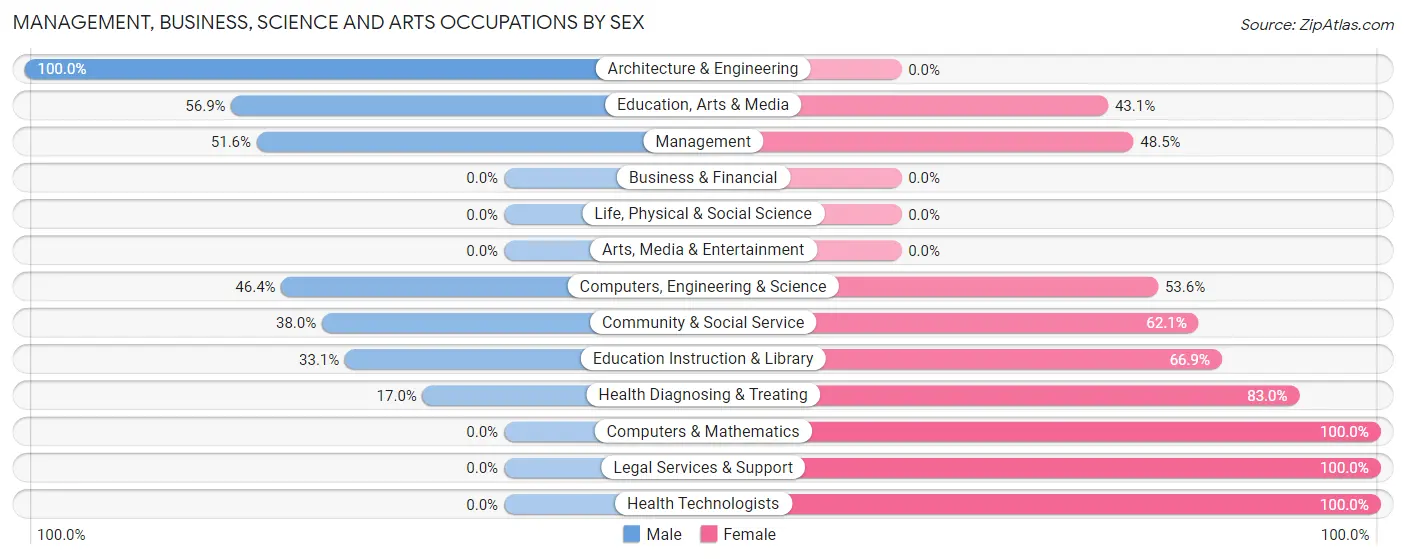
Management, Business, Science and Arts Occupations by Sex
Within the Management, Business, Science and Arts occupations in Henrietta, the most male-oriented occupations are Architecture & Engineering (100.0%), Education, Arts & Media (56.9%), and Management (51.5%), while the most female-oriented occupations are Computers & Mathematics (100.0%), Legal Services & Support (100.0%), and Health Technologists (100.0%).
| Occupation | Male | Female |
| Management | 50 (51.5%) | 47 (48.4%) |
| Business & Financial | 0 (0.0%) | 0 (0.0%) |
| Computers, Engineering & Science | 26 (46.4%) | 30 (53.6%) |
| Computers & Mathematics | 0 (0.0%) | 30 (100.0%) |
| Architecture & Engineering | 26 (100.0%) | 0 (0.0%) |
| Life, Physical & Social Science | 0 (0.0%) | 0 (0.0%) |
| Community & Social Service | 85 (38.0%) | 139 (62.1%) |
| Education, Arts & Media | 29 (56.9%) | 22 (43.1%) |
| Legal Services & Support | 0 (0.0%) | 4 (100.0%) |
| Education Instruction & Library | 56 (33.1%) | 113 (66.9%) |
| Arts, Media & Entertainment | 0 (0.0%) | 0 (0.0%) |
| Health Diagnosing & Treating | 19 (17.0%) | 93 (83.0%) |
| Health Technologists | 0 (0.0%) | 22 (100.0%) |
| Total (Category) | 180 (36.8%) | 309 (63.2%) |
| Total (Overall) | 580 (43.4%) | 756 (56.6%) |
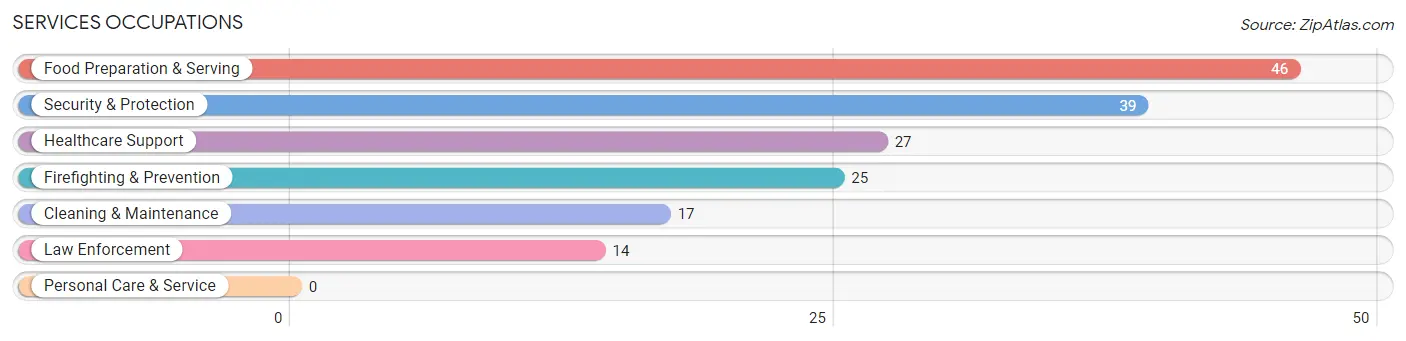
Services Occupations
The most common Services occupations in Henrietta are Food Preparation & Serving (46 | 3.4%), Security & Protection (39 | 2.9%), Healthcare Support (27 | 2.0%), Firefighting & Prevention (25 | 1.9%), and Cleaning & Maintenance (17 | 1.3%).
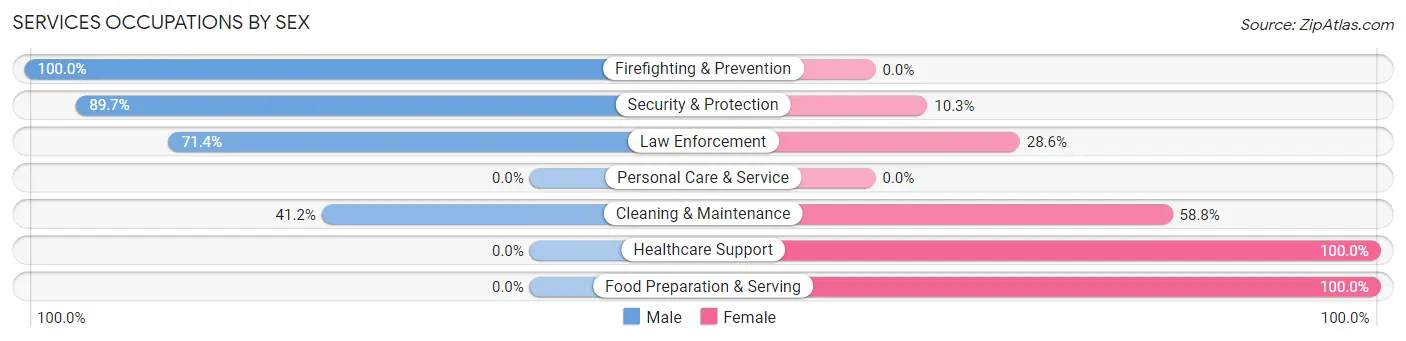
Services Occupations by Sex
Within the Services occupations in Henrietta, the most male-oriented occupations are Firefighting & Prevention (100.0%), Security & Protection (89.7%), and Law Enforcement (71.4%), while the most female-oriented occupations are Healthcare Support (100.0%), Food Preparation & Serving (100.0%), and Cleaning & Maintenance (58.8%).
| Occupation | Male | Female |
| Healthcare Support | 0 (0.0%) | 27 (100.0%) |
| Security & Protection | 35 (89.7%) | 4 (10.3%) |
| Firefighting & Prevention | 25 (100.0%) | 0 (0.0%) |
| Law Enforcement | 10 (71.4%) | 4 (28.6%) |
| Food Preparation & Serving | 0 (0.0%) | 46 (100.0%) |
| Cleaning & Maintenance | 7 (41.2%) | 10 (58.8%) |
| Personal Care & Service | 0 (0.0%) | 0 (0.0%) |
| Total (Category) | 42 (32.6%) | 87 (67.4%) |
| Total (Overall) | 580 (43.4%) | 756 (56.6%) |
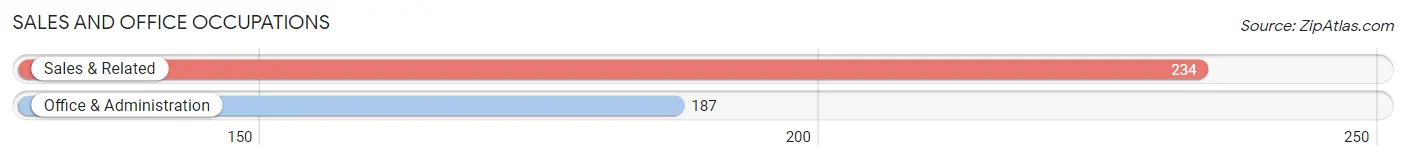
Sales and Office Occupations
The most common Sales and Office occupations in Henrietta are Sales & Related (234 | 17.5%), and Office & Administration (187 | 14.0%).
Sales and Office Occupations by Sex
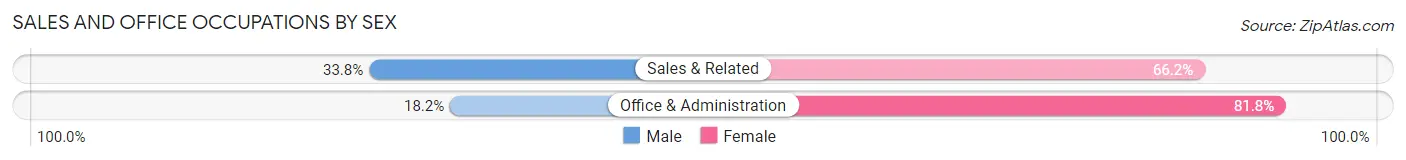
| Occupation | Male | Female |
| Sales & Related | 79 (33.8%) | 155 (66.2%) |
| Office & Administration | 34 (18.2%) | 153 (81.8%) |
| Total (Category) | 113 (26.8%) | 308 (73.2%) |
| Total (Overall) | 580 (43.4%) | 756 (56.6%) |
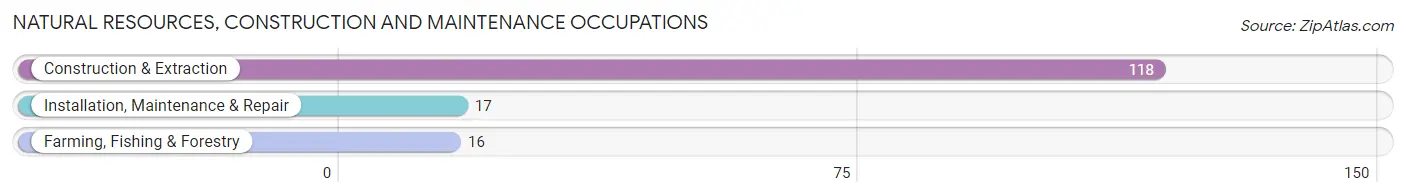
Natural Resources, Construction and Maintenance Occupations
The most common Natural Resources, Construction and Maintenance occupations in Henrietta are Construction & Extraction (118 | 8.8%), Installation, Maintenance & Repair (17 | 1.3%), and Farming, Fishing & Forestry (16 | 1.2%).
Natural Resources, Construction and Maintenance Occupations by Sex
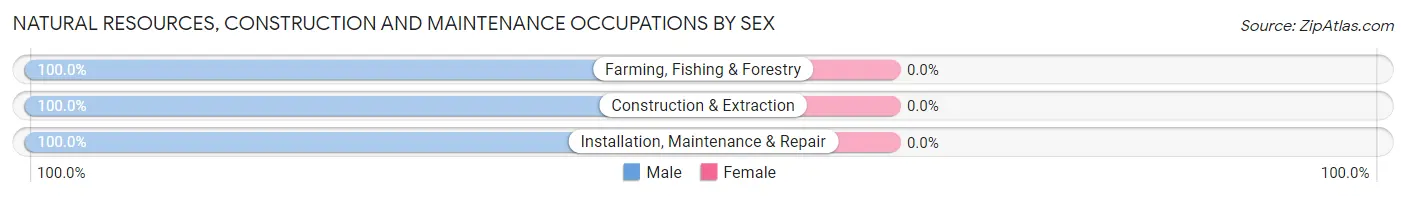
| Occupation | Male | Female |
| Farming, Fishing & Forestry | 16 (100.0%) | 0 (0.0%) |
| Construction & Extraction | 118 (100.0%) | 0 (0.0%) |
| Installation, Maintenance & Repair | 17 (100.0%) | 0 (0.0%) |
| Total (Category) | 151 (100.0%) | 0 (0.0%) |
| Total (Overall) | 580 (43.4%) | 756 (56.6%) |
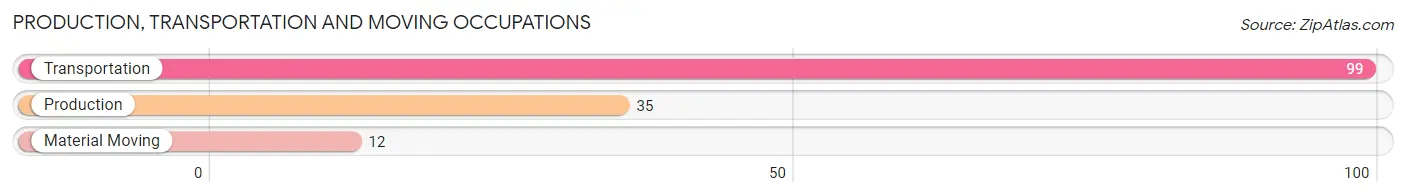
Production, Transportation and Moving Occupations
The most common Production, Transportation and Moving occupations in Henrietta are Transportation (99 | 7.4%), Production (35 | 2.6%), and Material Moving (12 | 0.9%).
Production, Transportation and Moving Occupations by Sex
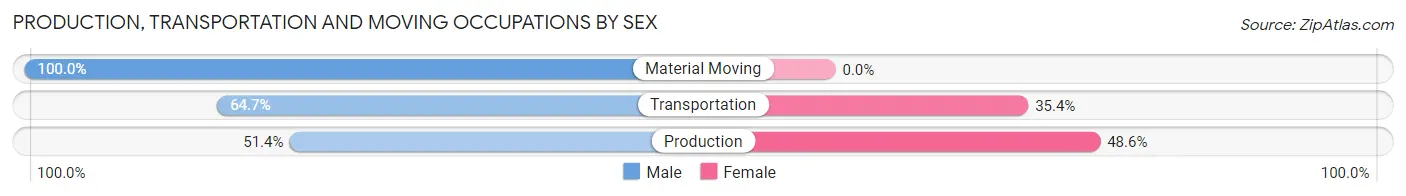
| Occupation | Male | Female |
| Production | 18 (51.4%) | 17 (48.6%) |
| Transportation | 64 (64.6%) | 35 (35.3%) |
| Material Moving | 12 (100.0%) | 0 (0.0%) |
| Total (Category) | 94 (64.4%) | 52 (35.6%) |
| Total (Overall) | 580 (43.4%) | 756 (56.6%) |
Employment Industries by Sex in Henrietta
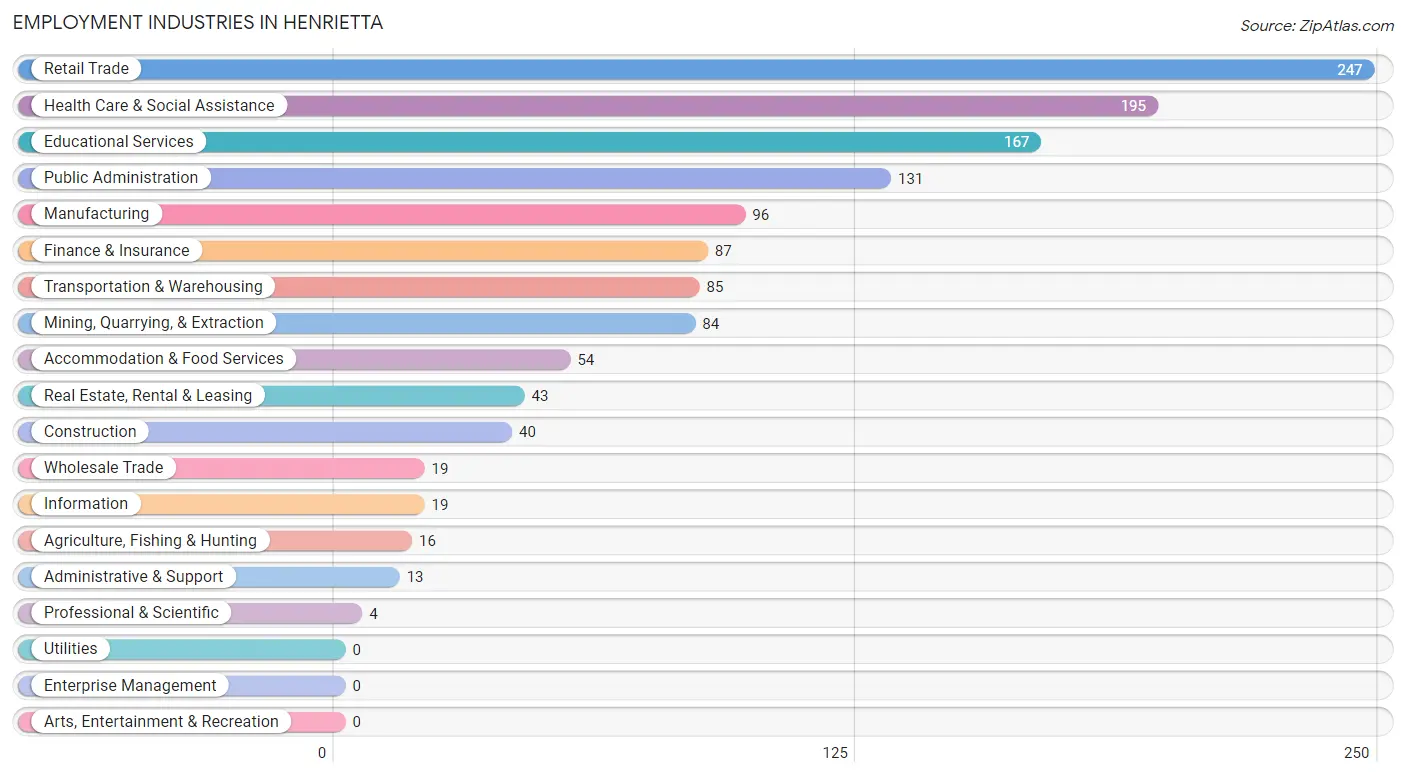
Employment Industries in Henrietta
The major employment industries in Henrietta include Retail Trade (247 | 18.5%), Health Care & Social Assistance (195 | 14.6%), Educational Services (167 | 12.5%), Public Administration (131 | 9.8%), and Manufacturing (96 | 7.2%).
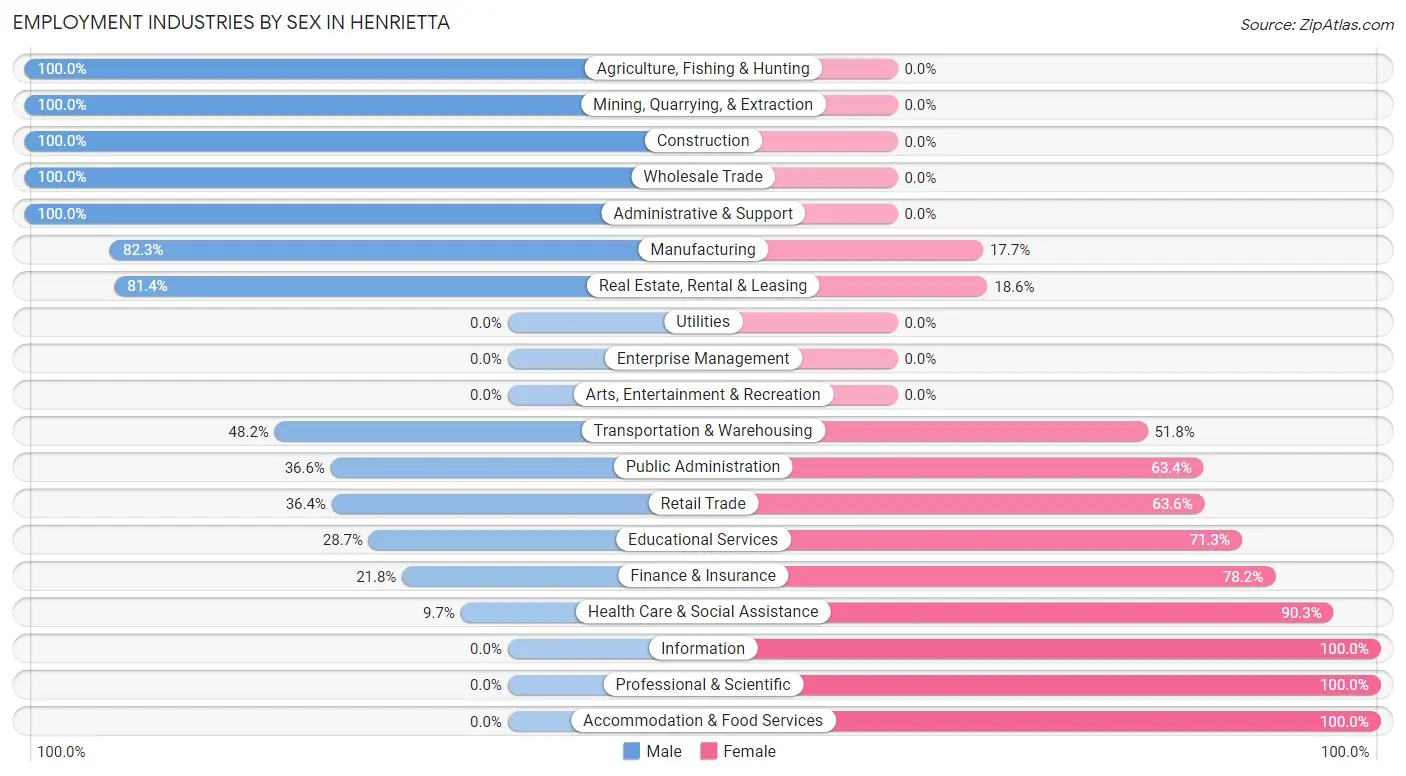
Employment Industries by Sex in Henrietta
The Henrietta industries that see more men than women are Agriculture, Fishing & Hunting (100.0%), Mining, Quarrying, & Extraction (100.0%), and Construction (100.0%), whereas the industries that tend to have a higher number of women are Information (100.0%), Professional & Scientific (100.0%), and Accommodation & Food Services (100.0%).
| Industry | Male | Female |
| Agriculture, Fishing & Hunting | 16 (100.0%) | 0 (0.0%) |
| Mining, Quarrying, & Extraction | 84 (100.0%) | 0 (0.0%) |
| Construction | 40 (100.0%) | 0 (0.0%) |
| Manufacturing | 79 (82.3%) | 17 (17.7%) |
| Wholesale Trade | 19 (100.0%) | 0 (0.0%) |
| Retail Trade | 90 (36.4%) | 157 (63.6%) |
| Transportation & Warehousing | 41 (48.2%) | 44 (51.8%) |
| Utilities | 0 (0.0%) | 0 (0.0%) |
| Information | 0 (0.0%) | 19 (100.0%) |
| Finance & Insurance | 19 (21.8%) | 68 (78.2%) |
| Real Estate, Rental & Leasing | 35 (81.4%) | 8 (18.6%) |
| Professional & Scientific | 0 (0.0%) | 4 (100.0%) |
| Enterprise Management | 0 (0.0%) | 0 (0.0%) |
| Administrative & Support | 13 (100.0%) | 0 (0.0%) |
| Educational Services | 48 (28.7%) | 119 (71.3%) |
| Health Care & Social Assistance | 19 (9.7%) | 176 (90.3%) |
| Arts, Entertainment & Recreation | 0 (0.0%) | 0 (0.0%) |
| Accommodation & Food Services | 0 (0.0%) | 54 (100.0%) |
| Public Administration | 48 (36.6%) | 83 (63.4%) |
| Total | 580 (43.4%) | 756 (56.6%) |
Education in Henrietta
School Enrollment in Henrietta
The most common levels of schooling among the 646 students in Henrietta are middle school (237 | 36.7%), high school (167 | 25.9%), and elementary school (138 | 21.4%).
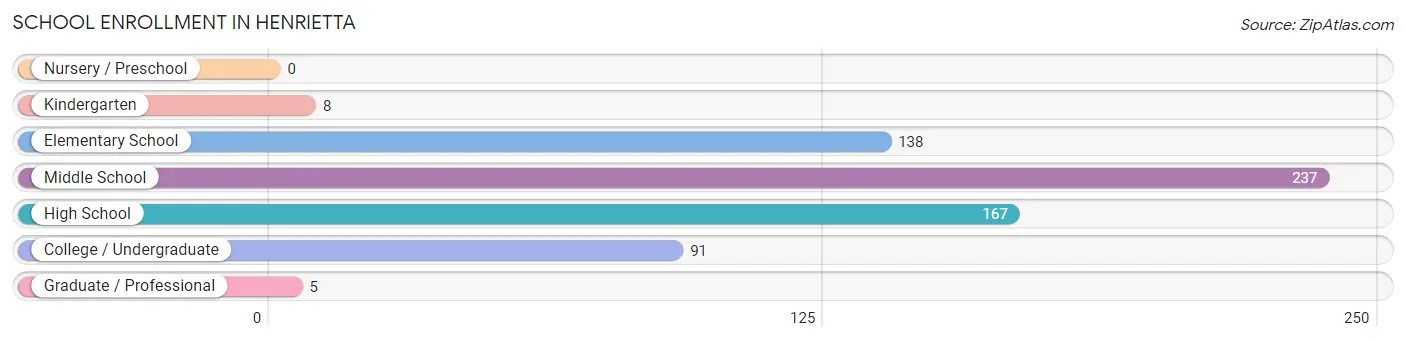
| School Level | # Students | % Students |
| Nursery / Preschool | 0 | 0.0% |
| Kindergarten | 8 | 1.2% |
| Elementary School | 138 | 21.4% |
| Middle School | 237 | 36.7% |
| High School | 167 | 25.9% |
| College / Undergraduate | 91 | 14.1% |
| Graduate / Professional | 5 | 0.8% |
| Total | 646 | 100.0% |
School Enrollment by Age by Funding Source in Henrietta
Out of a total of 646 students who are enrolled in schools in Henrietta, 16 (2.5%) attend a private institution, while the remaining 630 (97.5%) are enrolled in public schools. The age group of 5 to 9 year old has the highest likelihood of being enrolled in private schools, with 16 (11.6% in the age bracket) enrolled. Conversely, the age group of 10 to 14 year olds has the lowest likelihood of being enrolled in a private school, with 279 (100.0% in the age bracket) attending a public institution.
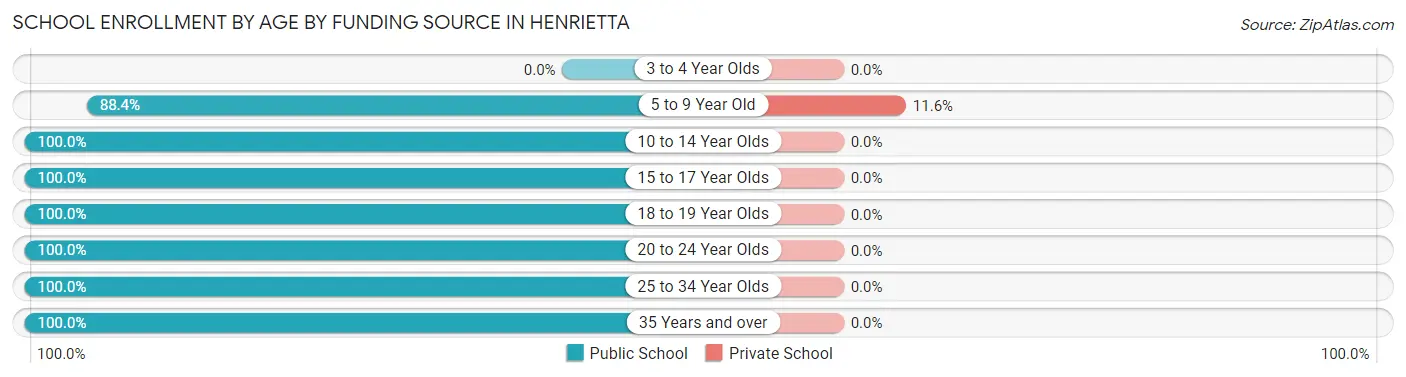
| Age Bracket | Public School | Private School |
| 3 to 4 Year Olds | 0 (0.0%) | 0 (0.0%) |
| 5 to 9 Year Old | 122 (88.4%) | 16 (11.6%) |
| 10 to 14 Year Olds | 279 (100.0%) | 0 (0.0%) |
| 15 to 17 Year Olds | 133 (100.0%) | 0 (0.0%) |
| 18 to 19 Year Olds | 38 (100.0%) | 0 (0.0%) |
| 20 to 24 Year Olds | 40 (100.0%) | 0 (0.0%) |
| 25 to 34 Year Olds | 5 (100.0%) | 0 (0.0%) |
| 35 Years and over | 13 (100.0%) | 0 (0.0%) |
| Total | 630 (97.5%) | 16 (2.5%) |
Educational Attainment by Field of Study in Henrietta
Education (177 | 25.6%), business (150 | 21.7%), arts & humanities (83 | 12.0%), bio, nature & agricultural (70 | 10.1%), and computers & mathematics (60 | 8.7%) are the most common fields of study among 691 individuals in Henrietta who have obtained a bachelor's degree or higher.
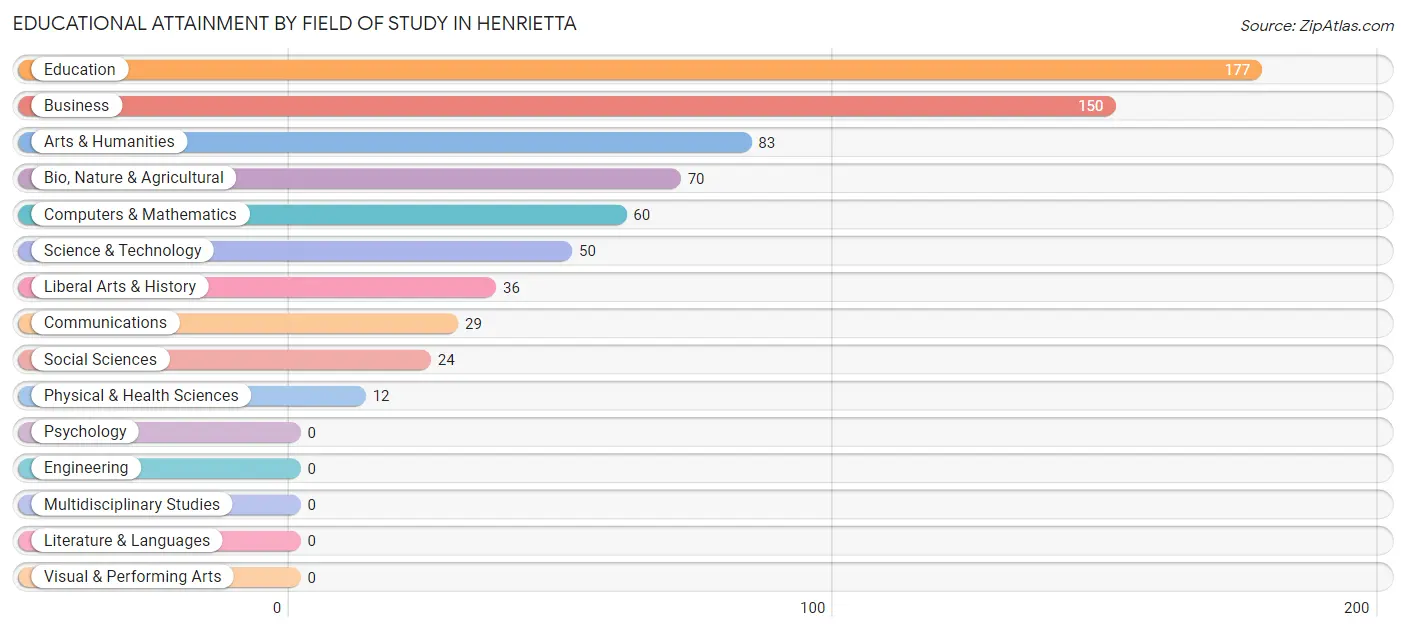
| Field of Study | # Graduates | % Graduates |
| Computers & Mathematics | 60 | 8.7% |
| Bio, Nature & Agricultural | 70 | 10.1% |
| Physical & Health Sciences | 12 | 1.7% |
| Psychology | 0 | 0.0% |
| Social Sciences | 24 | 3.5% |
| Engineering | 0 | 0.0% |
| Multidisciplinary Studies | 0 | 0.0% |
| Science & Technology | 50 | 7.2% |
| Business | 150 | 21.7% |
| Education | 177 | 25.6% |
| Literature & Languages | 0 | 0.0% |
| Liberal Arts & History | 36 | 5.2% |
| Visual & Performing Arts | 0 | 0.0% |
| Communications | 29 | 4.2% |
| Arts & Humanities | 83 | 12.0% |
| Total | 691 | 100.0% |
Transportation & Commute in Henrietta
Vehicle Availability by Sex in Henrietta
The most prevalent vehicle ownership categories in Henrietta are males with 2 vehicles (272, accounting for 46.9%) and females with 2 vehicles (409, making up 36.5%).
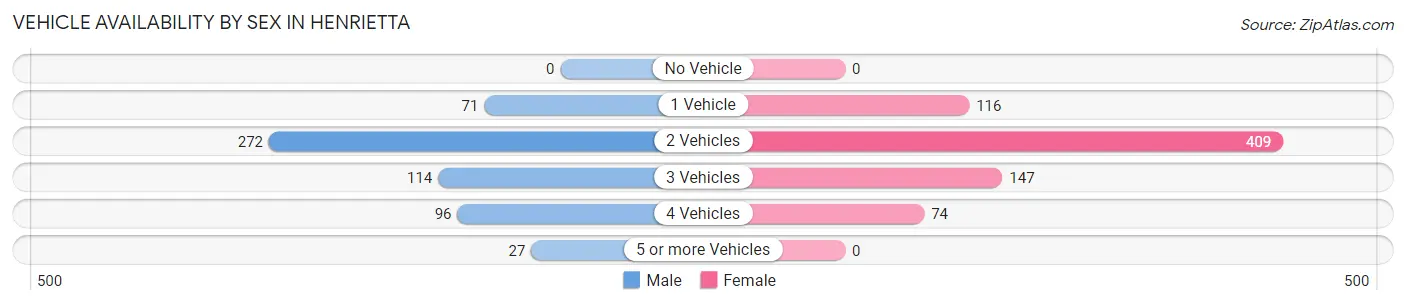
| Vehicles Available | Male | Female |
| No Vehicle | 0 (0.0%) | 0 (0.0%) |
| 1 Vehicle | 71 (12.2%) | 116 (15.5%) |
| 2 Vehicles | 272 (46.9%) | 409 (54.8%) |
| 3 Vehicles | 114 (19.7%) | 147 (19.7%) |
| 4 Vehicles | 96 (16.6%) | 74 (9.9%) |
| 5 or more Vehicles | 27 (4.7%) | 0 (0.0%) |
| Total | 580 (100.0%) | 746 (100.0%) |
Commute Time in Henrietta
The most frequently occuring commute durations in Henrietta are 25 to 29 minutes (331 commuters, 26.2%), 20 to 24 minutes (215 commuters, 17.0%), and 5 to 9 minutes (194 commuters, 15.4%).
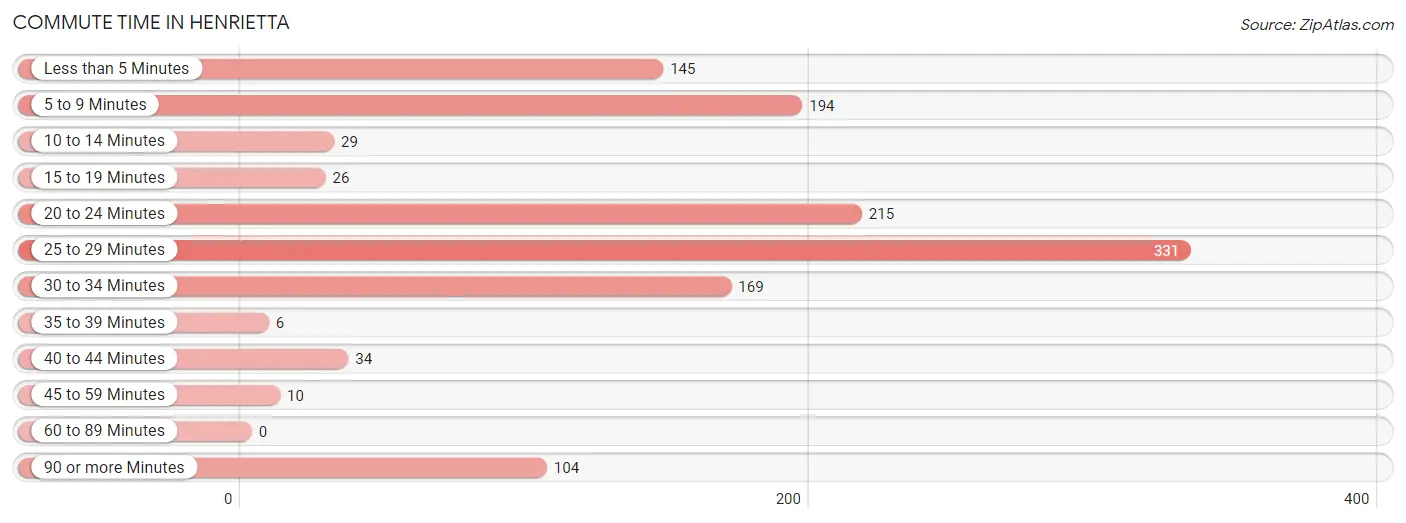
| Commute Time | # Commuters | % Commuters |
| Less than 5 Minutes | 145 | 11.5% |
| 5 to 9 Minutes | 194 | 15.4% |
| 10 to 14 Minutes | 29 | 2.3% |
| 15 to 19 Minutes | 26 | 2.1% |
| 20 to 24 Minutes | 215 | 17.0% |
| 25 to 29 Minutes | 331 | 26.2% |
| 30 to 34 Minutes | 169 | 13.4% |
| 35 to 39 Minutes | 6 | 0.5% |
| 40 to 44 Minutes | 34 | 2.7% |
| 45 to 59 Minutes | 10 | 0.8% |
| 60 to 89 Minutes | 0 | 0.0% |
| 90 or more Minutes | 104 | 8.2% |
Commute Time by Sex in Henrietta
The most common commute times in Henrietta are 20 to 24 minutes (138 commuters, 23.8%) for males and 25 to 29 minutes (251 commuters, 36.7%) for females.
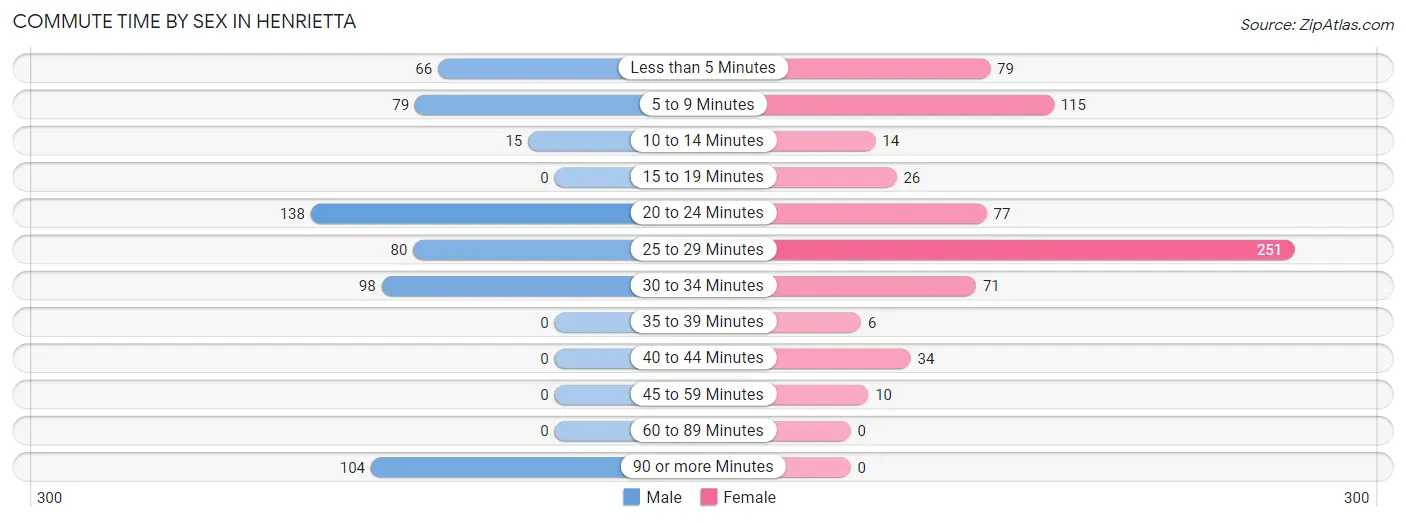
| Commute Time | Male | Female |
| Less than 5 Minutes | 66 (11.4%) | 79 (11.6%) |
| 5 to 9 Minutes | 79 (13.6%) | 115 (16.8%) |
| 10 to 14 Minutes | 15 (2.6%) | 14 (2.1%) |
| 15 to 19 Minutes | 0 (0.0%) | 26 (3.8%) |
| 20 to 24 Minutes | 138 (23.8%) | 77 (11.3%) |
| 25 to 29 Minutes | 80 (13.8%) | 251 (36.7%) |
| 30 to 34 Minutes | 98 (16.9%) | 71 (10.4%) |
| 35 to 39 Minutes | 0 (0.0%) | 6 (0.9%) |
| 40 to 44 Minutes | 0 (0.0%) | 34 (5.0%) |
| 45 to 59 Minutes | 0 (0.0%) | 10 (1.5%) |
| 60 to 89 Minutes | 0 (0.0%) | 0 (0.0%) |
| 90 or more Minutes | 104 (17.9%) | 0 (0.0%) |
Time of Departure to Work by Sex in Henrietta
The most frequent times of departure to work in Henrietta are 6:30 AM to 6:59 AM (115, 19.8%) for males and 7:00 AM to 7:29 AM (142, 20.8%) for females.
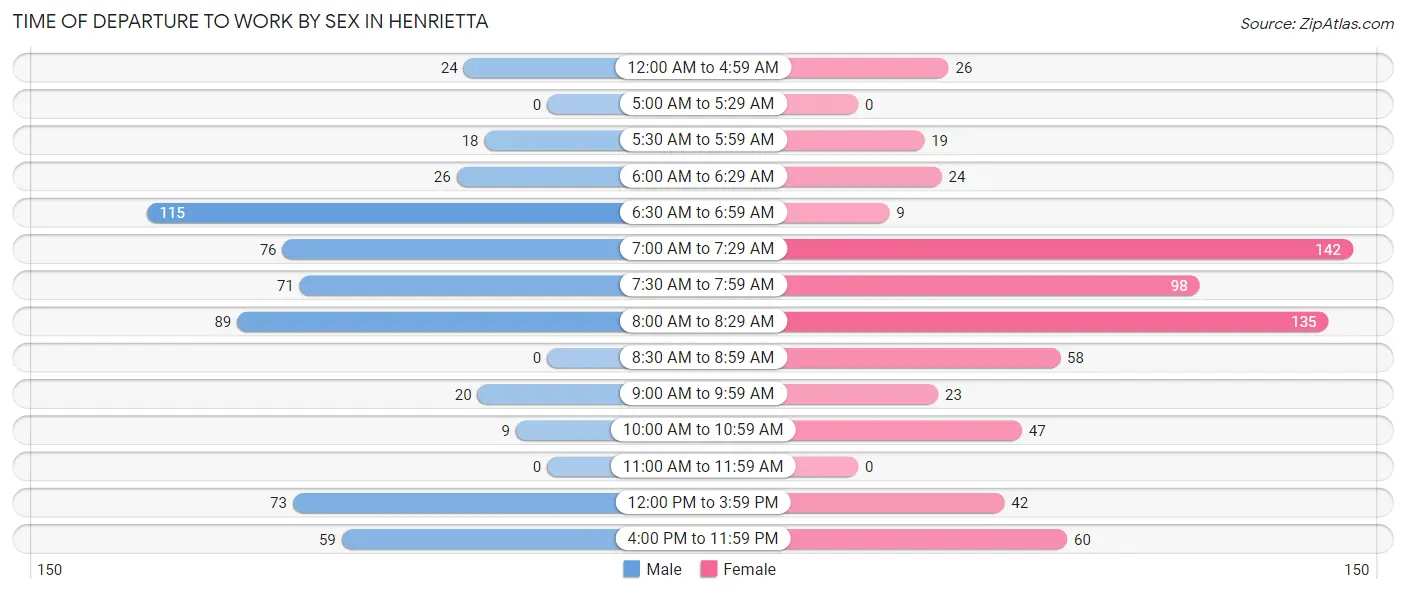
| Time of Departure | Male | Female |
| 12:00 AM to 4:59 AM | 24 (4.1%) | 26 (3.8%) |
| 5:00 AM to 5:29 AM | 0 (0.0%) | 0 (0.0%) |
| 5:30 AM to 5:59 AM | 18 (3.1%) | 19 (2.8%) |
| 6:00 AM to 6:29 AM | 26 (4.5%) | 24 (3.5%) |
| 6:30 AM to 6:59 AM | 115 (19.8%) | 9 (1.3%) |
| 7:00 AM to 7:29 AM | 76 (13.1%) | 142 (20.8%) |
| 7:30 AM to 7:59 AM | 71 (12.2%) | 98 (14.3%) |
| 8:00 AM to 8:29 AM | 89 (15.3%) | 135 (19.8%) |
| 8:30 AM to 8:59 AM | 0 (0.0%) | 58 (8.5%) |
| 9:00 AM to 9:59 AM | 20 (3.5%) | 23 (3.4%) |
| 10:00 AM to 10:59 AM | 9 (1.5%) | 47 (6.9%) |
| 11:00 AM to 11:59 AM | 0 (0.0%) | 0 (0.0%) |
| 12:00 PM to 3:59 PM | 73 (12.6%) | 42 (6.1%) |
| 4:00 PM to 11:59 PM | 59 (10.2%) | 60 (8.8%) |
| Total | 580 (100.0%) | 683 (100.0%) |
Housing Occupancy in Henrietta
Occupancy by Ownership in Henrietta
Of the total 1,276 dwellings in Henrietta, owner-occupied units account for 969 (75.9%), while renter-occupied units make up 307 (24.1%).
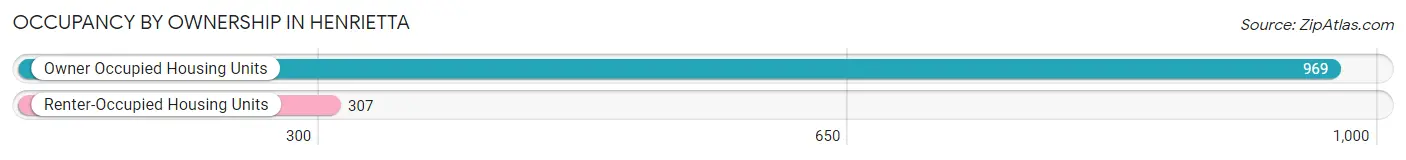
| Occupancy | # Housing Units | % Housing Units |
| Owner Occupied Housing Units | 969 | 75.9% |
| Renter-Occupied Housing Units | 307 | 24.1% |
| Total Occupied Housing Units | 1,276 | 100.0% |
Occupancy by Household Size in Henrietta
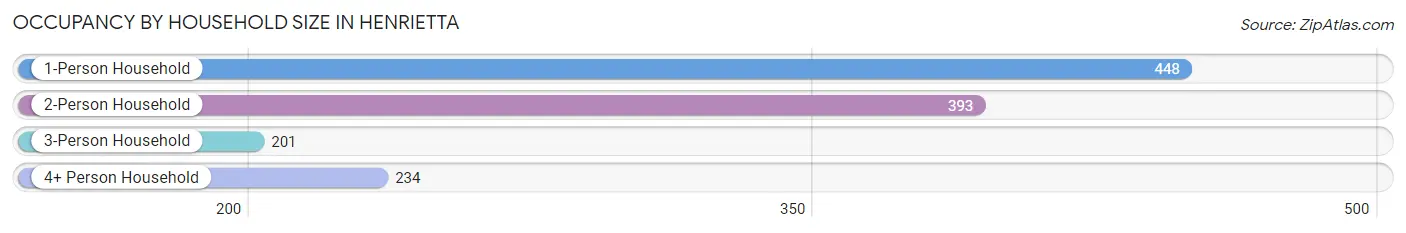
| Household Size | # Housing Units | % Housing Units |
| 1-Person Household | 448 | 35.1% |
| 2-Person Household | 393 | 30.8% |
| 3-Person Household | 201 | 15.8% |
| 4+ Person Household | 234 | 18.3% |
| Total Housing Units | 1,276 | 100.0% |
Occupancy by Ownership by Household Size in Henrietta
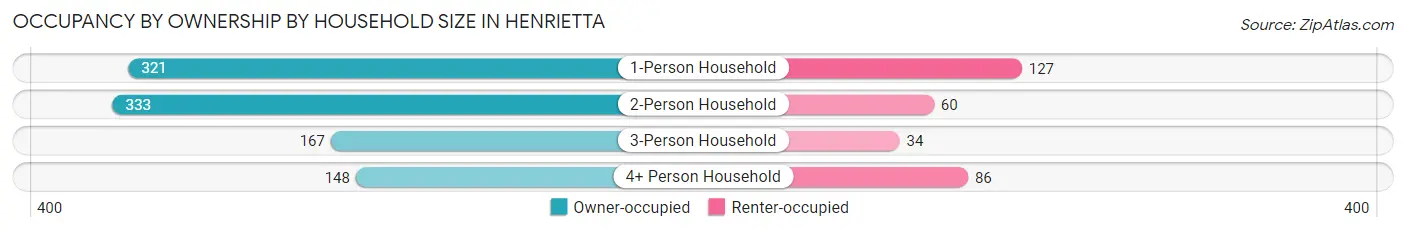
| Household Size | Owner-occupied | Renter-occupied |
| 1-Person Household | 321 (71.7%) | 127 (28.3%) |
| 2-Person Household | 333 (84.7%) | 60 (15.3%) |
| 3-Person Household | 167 (83.1%) | 34 (16.9%) |
| 4+ Person Household | 148 (63.2%) | 86 (36.7%) |
| Total Housing Units | 969 (75.9%) | 307 (24.1%) |
Occupancy by Educational Attainment in Henrietta
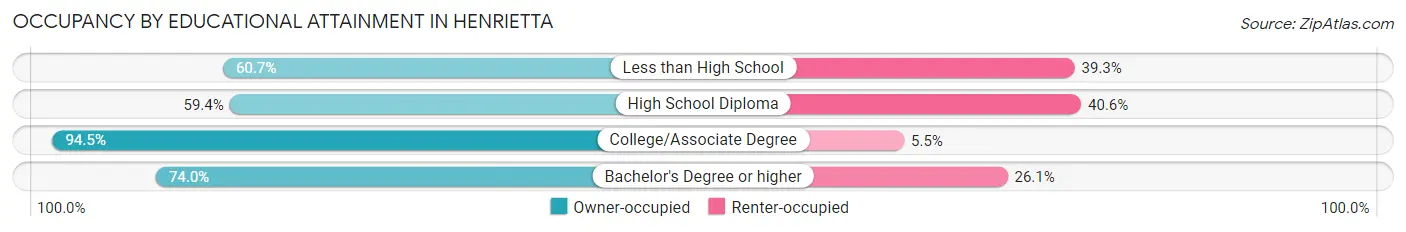
| Household Size | Owner-occupied | Renter-occupied |
| Less than High School | 37 (60.7%) | 24 (39.3%) |
| High School Diploma | 225 (59.4%) | 154 (40.6%) |
| College/Associate Degree | 409 (94.5%) | 24 (5.5%) |
| Bachelor's Degree or higher | 298 (74.0%) | 105 (26.1%) |
Occupancy by Age of Householder in Henrietta
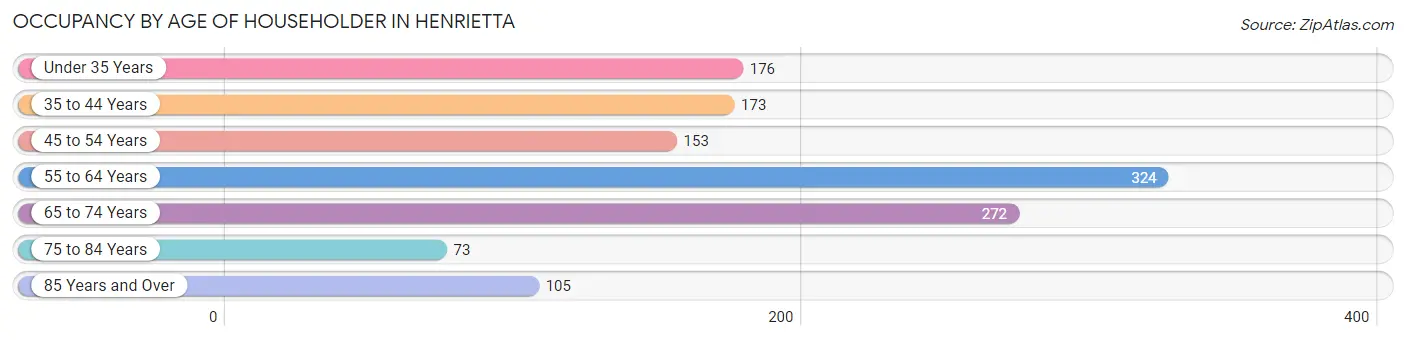
| Age Bracket | # Households | % Households |
| Under 35 Years | 176 | 13.8% |
| 35 to 44 Years | 173 | 13.6% |
| 45 to 54 Years | 153 | 12.0% |
| 55 to 64 Years | 324 | 25.4% |
| 65 to 74 Years | 272 | 21.3% |
| 75 to 84 Years | 73 | 5.7% |
| 85 Years and Over | 105 | 8.2% |
| Total | 1,276 | 100.0% |
Housing Finances in Henrietta
Median Income by Occupancy in Henrietta
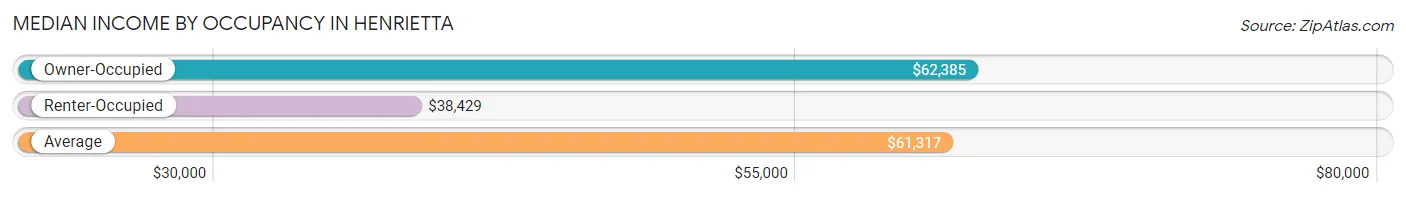
| Occupancy Type | # Households | Median Income |
| Owner-Occupied | 969 (75.9%) | $62,385 |
| Renter-Occupied | 307 (24.1%) | $38,429 |
| Average | 1,276 (100.0%) | $61,317 |
Occupancy by Householder Income Bracket in Henrietta
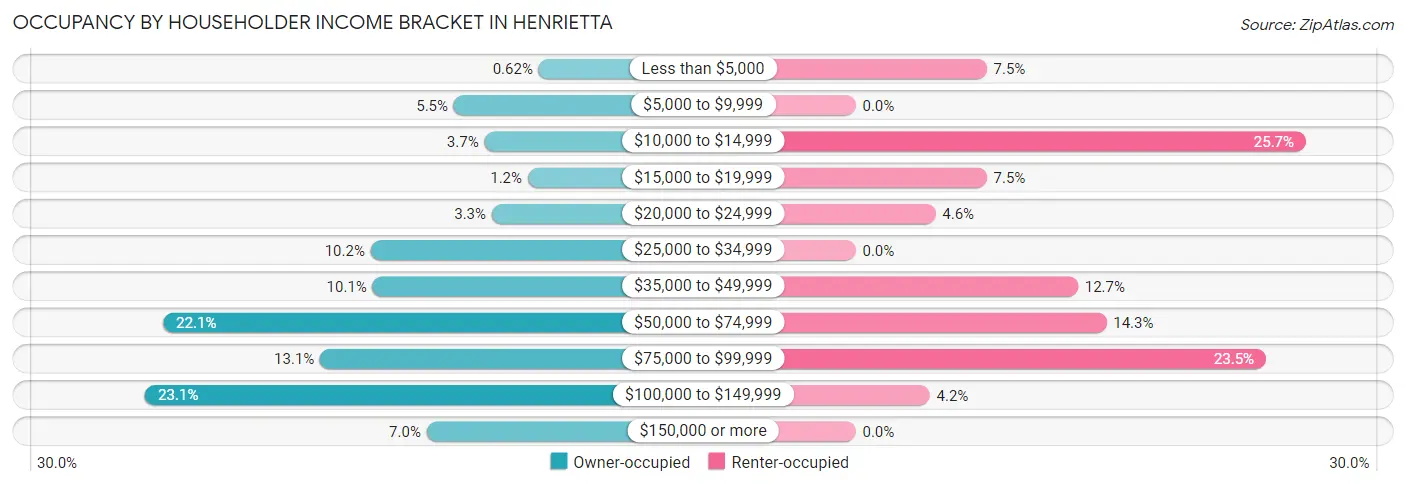
| Income Bracket | Owner-occupied | Renter-occupied |
| Less than $5,000 | 6 (0.6%) | 23 (7.5%) |
| $5,000 to $9,999 | 53 (5.5%) | 0 (0.0%) |
| $10,000 to $14,999 | 36 (3.7%) | 79 (25.7%) |
| $15,000 to $19,999 | 12 (1.2%) | 23 (7.5%) |
| $20,000 to $24,999 | 32 (3.3%) | 14 (4.6%) |
| $25,000 to $34,999 | 99 (10.2%) | 0 (0.0%) |
| $35,000 to $49,999 | 98 (10.1%) | 39 (12.7%) |
| $50,000 to $74,999 | 214 (22.1%) | 44 (14.3%) |
| $75,000 to $99,999 | 127 (13.1%) | 72 (23.4%) |
| $100,000 to $149,999 | 224 (23.1%) | 13 (4.2%) |
| $150,000 or more | 68 (7.0%) | 0 (0.0%) |
| Total | 969 (100.0%) | 307 (100.0%) |
Monthly Housing Cost Tiers in Henrietta
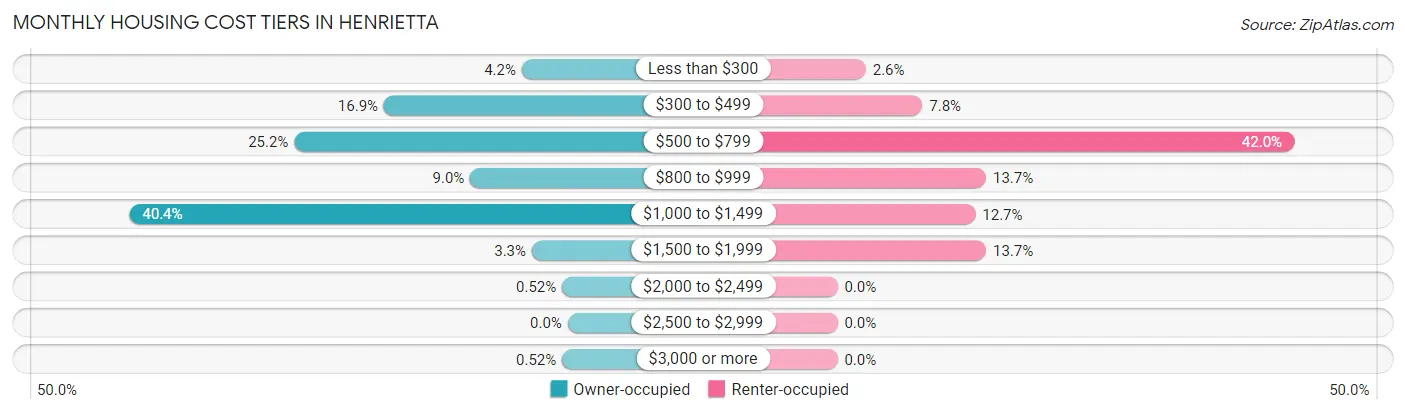
| Monthly Cost | Owner-occupied | Renter-occupied |
| Less than $300 | 41 (4.2%) | 8 (2.6%) |
| $300 to $499 | 164 (16.9%) | 24 (7.8%) |
| $500 to $799 | 244 (25.2%) | 129 (42.0%) |
| $800 to $999 | 87 (9.0%) | 42 (13.7%) |
| $1,000 to $1,499 | 391 (40.4%) | 39 (12.7%) |
| $1,500 to $1,999 | 32 (3.3%) | 42 (13.7%) |
| $2,000 to $2,499 | 5 (0.5%) | 0 (0.0%) |
| $2,500 to $2,999 | 0 (0.0%) | 0 (0.0%) |
| $3,000 or more | 5 (0.5%) | 0 (0.0%) |
| Total | 969 (100.0%) | 307 (100.0%) |
Physical Housing Characteristics in Henrietta
Housing Structures in Henrietta
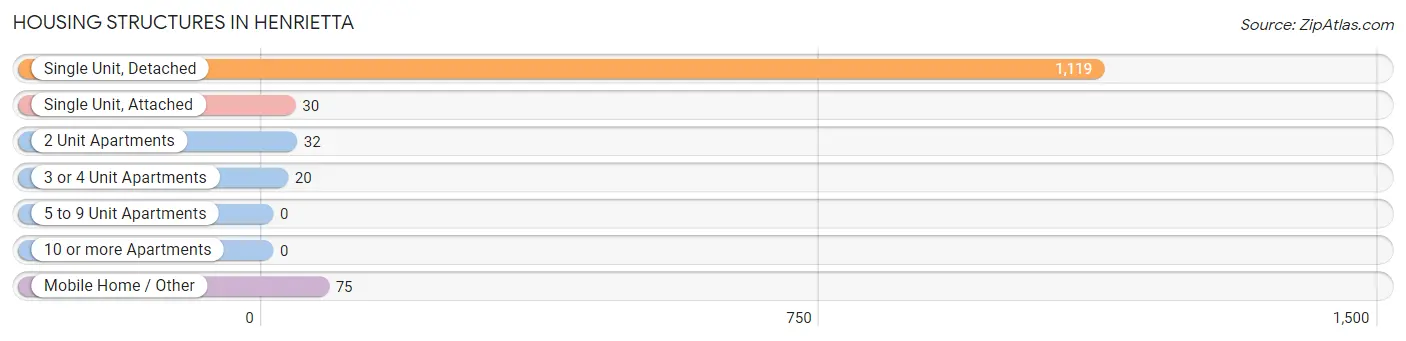
| Structure Type | # Housing Units | % Housing Units |
| Single Unit, Detached | 1,119 | 87.7% |
| Single Unit, Attached | 30 | 2.4% |
| 2 Unit Apartments | 32 | 2.5% |
| 3 or 4 Unit Apartments | 20 | 1.6% |
| 5 to 9 Unit Apartments | 0 | 0.0% |
| 10 or more Apartments | 0 | 0.0% |
| Mobile Home / Other | 75 | 5.9% |
| Total | 1,276 | 100.0% |
Housing Structures by Occupancy in Henrietta
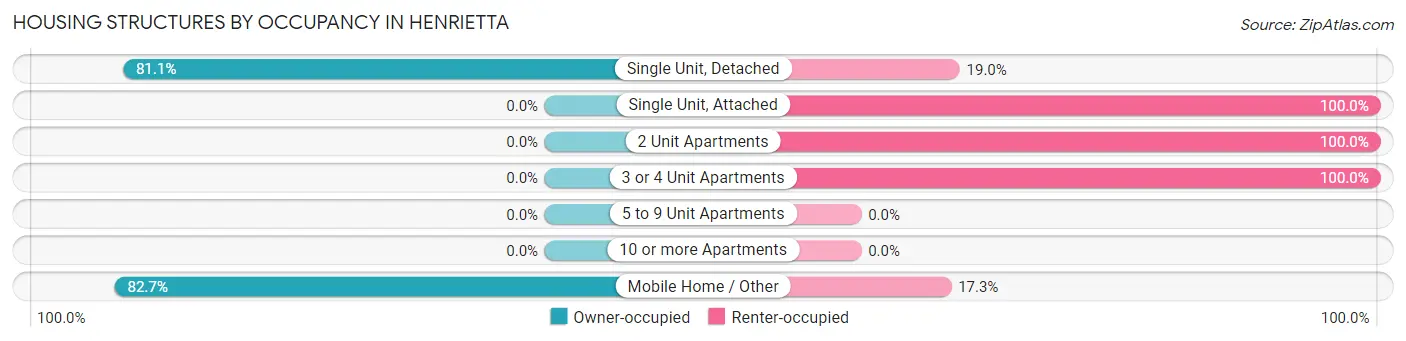
| Structure Type | Owner-occupied | Renter-occupied |
| Single Unit, Detached | 907 (81.0%) | 212 (19.0%) |
| Single Unit, Attached | 0 (0.0%) | 30 (100.0%) |
| 2 Unit Apartments | 0 (0.0%) | 32 (100.0%) |
| 3 or 4 Unit Apartments | 0 (0.0%) | 20 (100.0%) |
| 5 to 9 Unit Apartments | 0 (0.0%) | 0 (0.0%) |
| 10 or more Apartments | 0 (0.0%) | 0 (0.0%) |
| Mobile Home / Other | 62 (82.7%) | 13 (17.3%) |
| Total | 969 (75.9%) | 307 (24.1%) |
Housing Structures by Number of Rooms in Henrietta
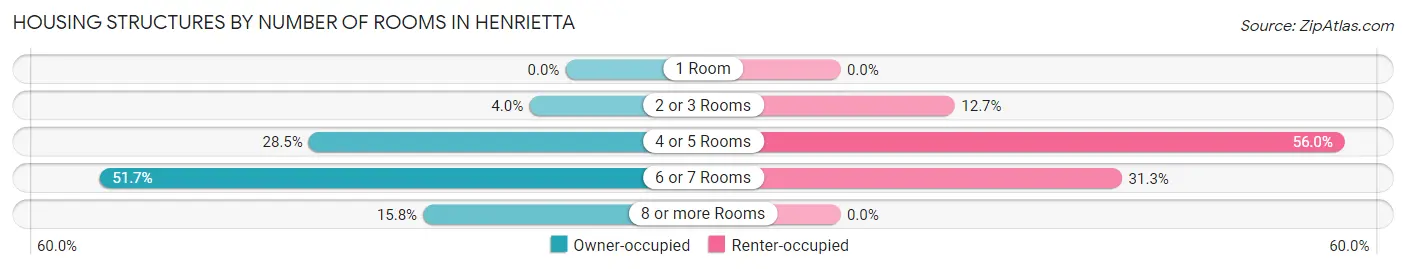
| Number of Rooms | Owner-occupied | Renter-occupied |
| 1 Room | 0 (0.0%) | 0 (0.0%) |
| 2 or 3 Rooms | 39 (4.0%) | 39 (12.7%) |
| 4 or 5 Rooms | 276 (28.5%) | 172 (56.0%) |
| 6 or 7 Rooms | 501 (51.7%) | 96 (31.3%) |
| 8 or more Rooms | 153 (15.8%) | 0 (0.0%) |
| Total | 969 (100.0%) | 307 (100.0%) |
Housing Structure by Heating Type in Henrietta
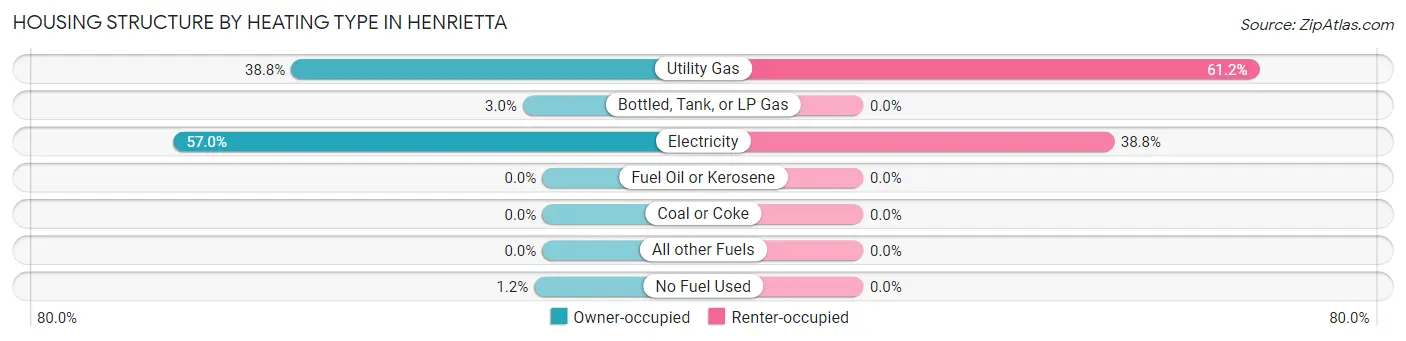
| Heating Type | Owner-occupied | Renter-occupied |
| Utility Gas | 376 (38.8%) | 188 (61.2%) |
| Bottled, Tank, or LP Gas | 29 (3.0%) | 0 (0.0%) |
| Electricity | 552 (57.0%) | 119 (38.8%) |
| Fuel Oil or Kerosene | 0 (0.0%) | 0 (0.0%) |
| Coal or Coke | 0 (0.0%) | 0 (0.0%) |
| All other Fuels | 0 (0.0%) | 0 (0.0%) |
| No Fuel Used | 12 (1.2%) | 0 (0.0%) |
| Total | 969 (100.0%) | 307 (100.0%) |
Household Vehicle Usage in Henrietta
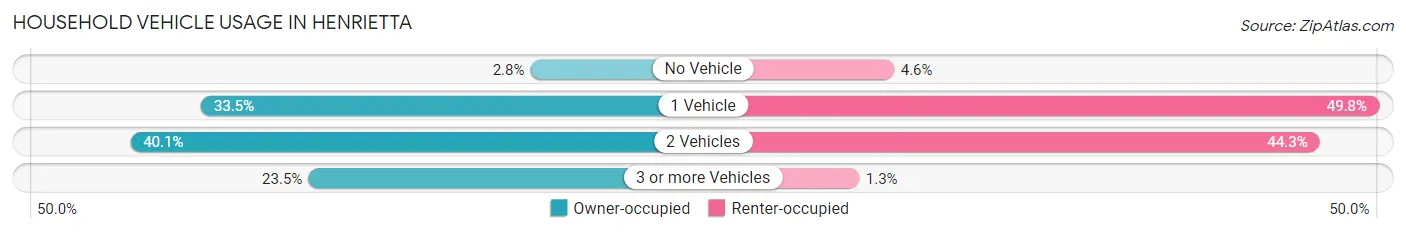
| Vehicles per Household | Owner-occupied | Renter-occupied |
| No Vehicle | 27 (2.8%) | 14 (4.6%) |
| 1 Vehicle | 325 (33.5%) | 153 (49.8%) |
| 2 Vehicles | 389 (40.1%) | 136 (44.3%) |
| 3 or more Vehicles | 228 (23.5%) | 4 (1.3%) |
| Total | 969 (100.0%) | 307 (100.0%) |
Real Estate & Mortgages in Henrietta
Real Estate and Mortgage Overview in Henrietta
| Characteristic | Without Mortgage | With Mortgage |
| Housing Units | 517 | 452 |
| Median Property Value | $93,100 | $140,000 |
| Median Household Income | $44,811 | $31 |
| Monthly Housing Costs | $544 | $5 |
| Real Estate Taxes | $1,406 | $39 |
Property Value by Mortgage Status in Henrietta
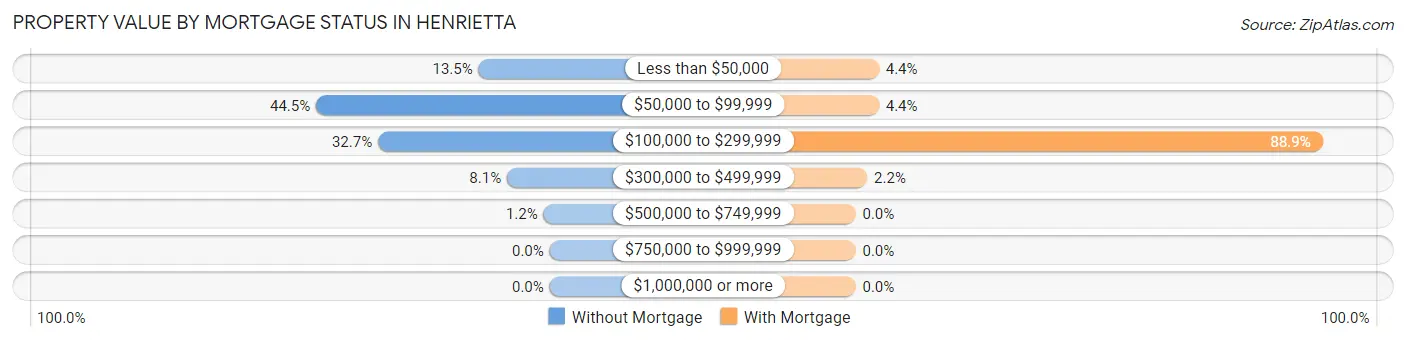
| Property Value | Without Mortgage | With Mortgage |
| Less than $50,000 | 70 (13.5%) | 20 (4.4%) |
| $50,000 to $99,999 | 230 (44.5%) | 20 (4.4%) |
| $100,000 to $299,999 | 169 (32.7%) | 402 (88.9%) |
| $300,000 to $499,999 | 42 (8.1%) | 10 (2.2%) |
| $500,000 to $749,999 | 6 (1.2%) | 0 (0.0%) |
| $750,000 to $999,999 | 0 (0.0%) | 0 (0.0%) |
| $1,000,000 or more | 0 (0.0%) | 0 (0.0%) |
| Total | 517 (100.0%) | 452 (100.0%) |
Household Income by Mortgage Status in Henrietta
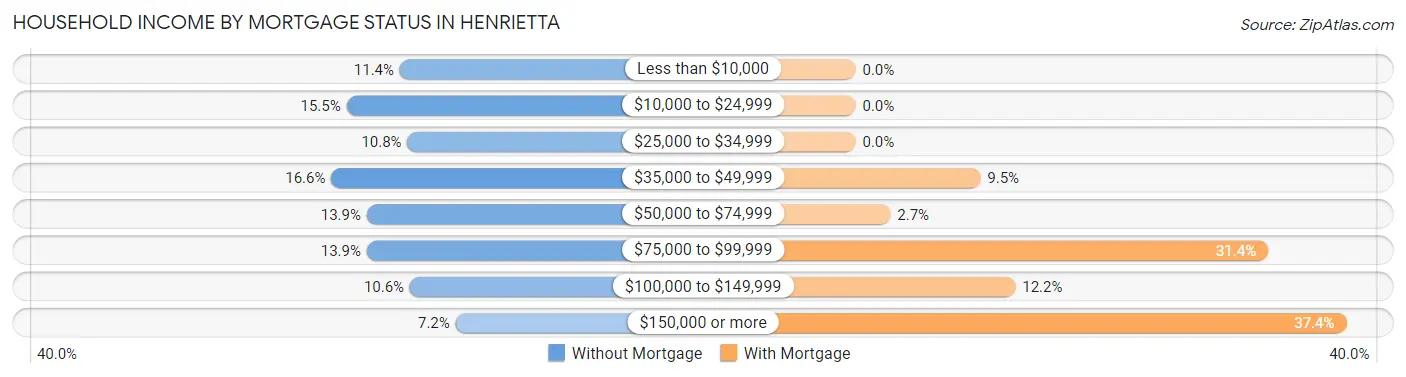
| Household Income | Without Mortgage | With Mortgage |
| Less than $10,000 | 59 (11.4%) | 0 (0.0%) |
| $10,000 to $24,999 | 80 (15.5%) | 0 (0.0%) |
| $25,000 to $34,999 | 56 (10.8%) | 0 (0.0%) |
| $35,000 to $49,999 | 86 (16.6%) | 43 (9.5%) |
| $50,000 to $74,999 | 72 (13.9%) | 12 (2.6%) |
| $75,000 to $99,999 | 72 (13.9%) | 142 (31.4%) |
| $100,000 to $149,999 | 55 (10.6%) | 55 (12.2%) |
| $150,000 or more | 37 (7.2%) | 169 (37.4%) |
| Total | 517 (100.0%) | 452 (100.0%) |
Property Value to Household Income Ratio in Henrietta
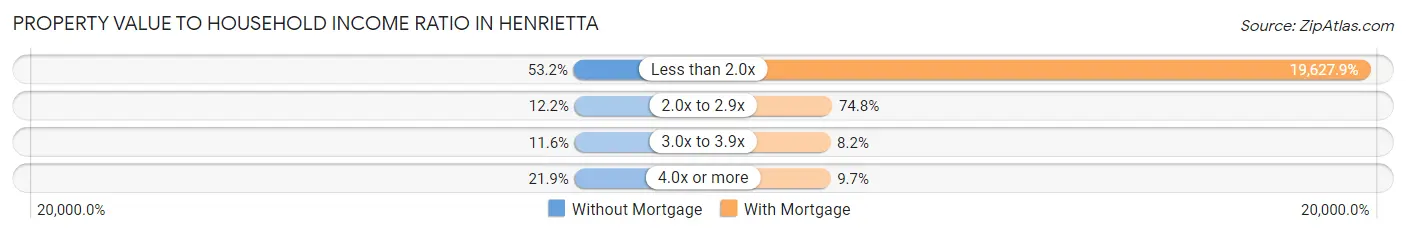
| Value-to-Income Ratio | Without Mortgage | With Mortgage |
| Less than 2.0x | 275 (53.2%) | 88,718 (19,627.9%) |
| 2.0x to 2.9x | 63 (12.2%) | 338 (74.8%) |
| 3.0x to 3.9x | 60 (11.6%) | 37 (8.2%) |
| 4.0x or more | 113 (21.9%) | 44 (9.7%) |
| Total | 517 (100.0%) | 452 (100.0%) |
Real Estate Taxes by Mortgage Status in Henrietta
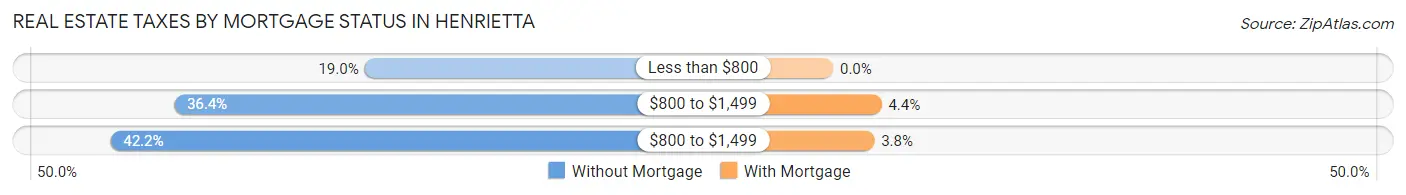
| Property Taxes | Without Mortgage | With Mortgage |
| Less than $800 | 98 (19.0%) | 0 (0.0%) |
| $800 to $1,499 | 188 (36.4%) | 20 (4.4%) |
| $800 to $1,499 | 218 (42.2%) | 17 (3.8%) |
| Total | 517 (100.0%) | 452 (100.0%) |
Health & Disability in Henrietta
Health Insurance Coverage by Age in Henrietta
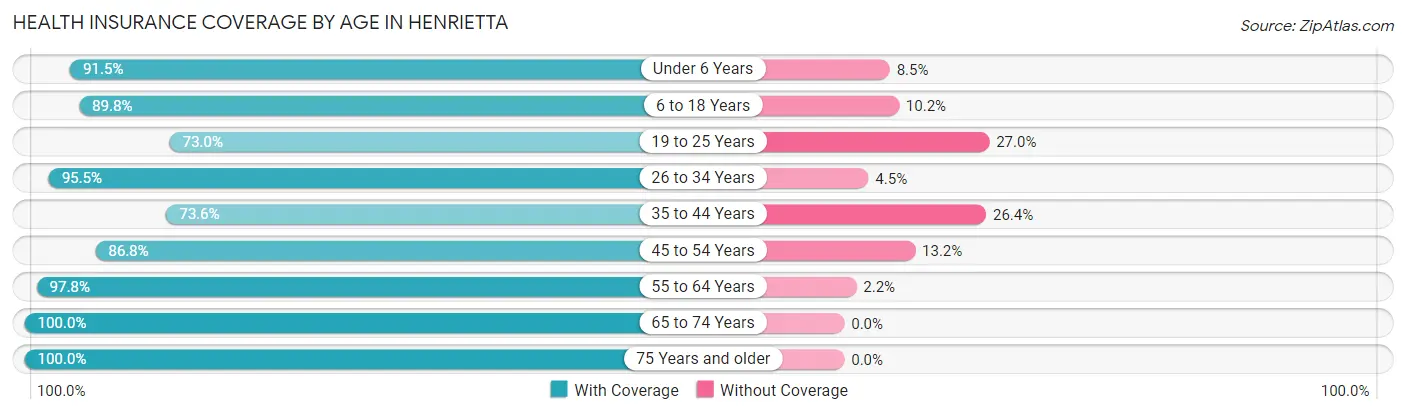
| Age Bracket | With Coverage | Without Coverage |
| Under 6 Years | 162 (91.5%) | 15 (8.5%) |
| 6 to 18 Years | 512 (89.8%) | 58 (10.2%) |
| 19 to 25 Years | 216 (73.0%) | 80 (27.0%) |
| 26 to 34 Years | 212 (95.5%) | 10 (4.5%) |
| 35 to 44 Years | 270 (73.6%) | 97 (26.4%) |
| 45 to 54 Years | 263 (86.8%) | 40 (13.2%) |
| 55 to 64 Years | 437 (97.8%) | 10 (2.2%) |
| 65 to 74 Years | 389 (100.0%) | 0 (0.0%) |
| 75 Years and older | 257 (100.0%) | 0 (0.0%) |
| Total | 2,718 (89.8%) | 310 (10.2%) |
Health Insurance Coverage by Citizenship Status in Henrietta
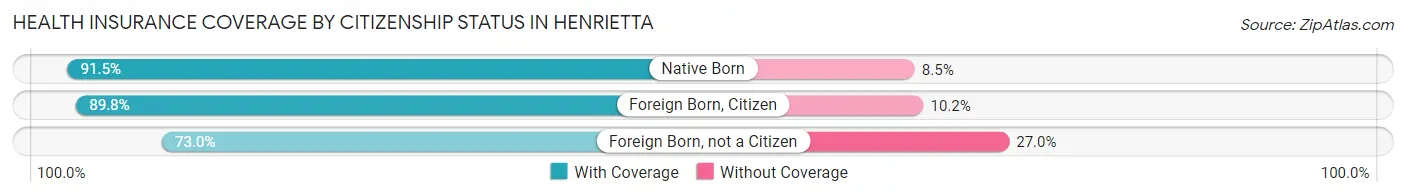
| Citizenship Status | With Coverage | Without Coverage |
| Native Born | 162 (91.5%) | 15 (8.5%) |
| Foreign Born, Citizen | 512 (89.8%) | 58 (10.2%) |
| Foreign Born, not a Citizen | 216 (73.0%) | 80 (27.0%) |
Health Insurance Coverage by Household Income in Henrietta
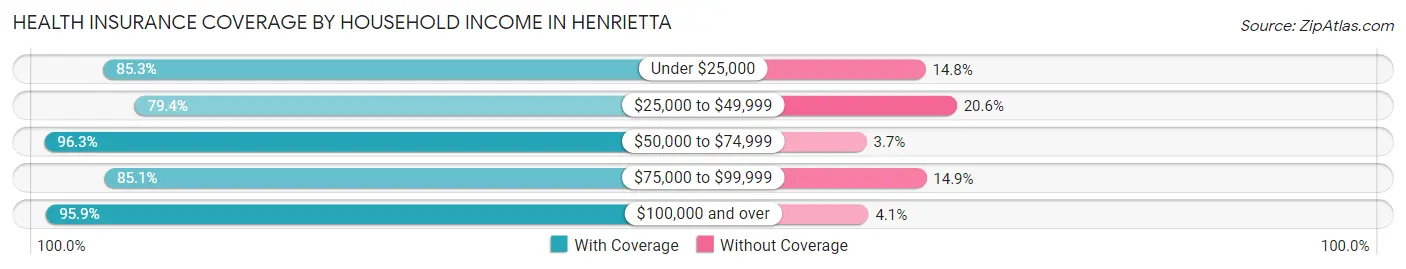
| Household Income | With Coverage | Without Coverage |
| Under $25,000 | 341 (85.3%) | 59 (14.7%) |
| $25,000 to $49,999 | 370 (79.4%) | 96 (20.6%) |
| $50,000 to $74,999 | 520 (96.3%) | 20 (3.7%) |
| $75,000 to $99,999 | 542 (85.1%) | 95 (14.9%) |
| $100,000 and over | 945 (95.9%) | 40 (4.1%) |
Public vs Private Health Insurance Coverage by Age in Henrietta
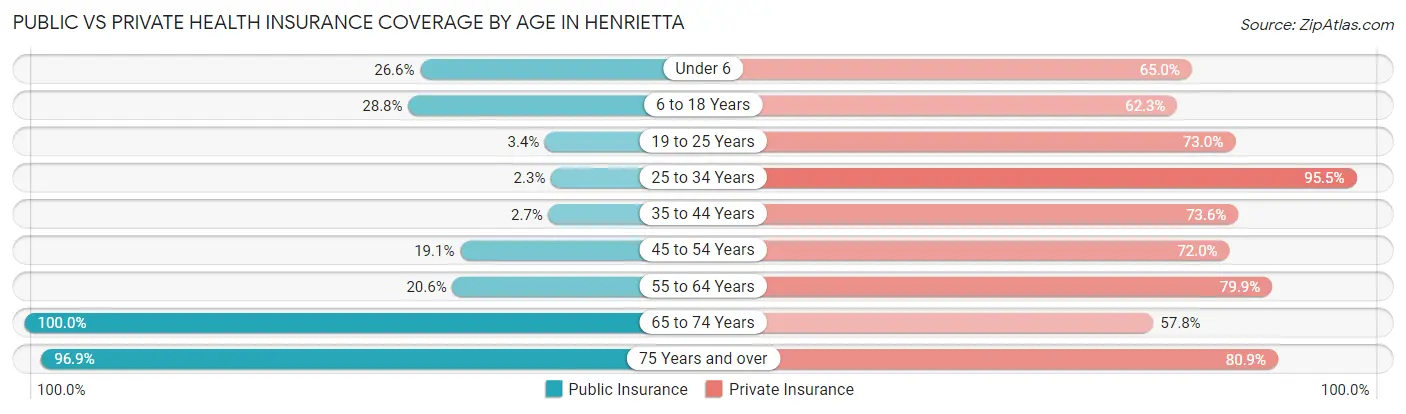
| Age Bracket | Public Insurance | Private Insurance |
| Under 6 | 47 (26.6%) | 115 (65.0%) |
| 6 to 18 Years | 164 (28.8%) | 355 (62.3%) |
| 19 to 25 Years | 10 (3.4%) | 216 (73.0%) |
| 25 to 34 Years | 5 (2.2%) | 212 (95.5%) |
| 35 to 44 Years | 10 (2.7%) | 270 (73.6%) |
| 45 to 54 Years | 58 (19.1%) | 218 (72.0%) |
| 55 to 64 Years | 92 (20.6%) | 357 (79.9%) |
| 65 to 74 Years | 389 (100.0%) | 225 (57.8%) |
| 75 Years and over | 249 (96.9%) | 208 (80.9%) |
| Total | 1,024 (33.8%) | 2,176 (71.9%) |
Disability Status by Sex by Age in Henrietta
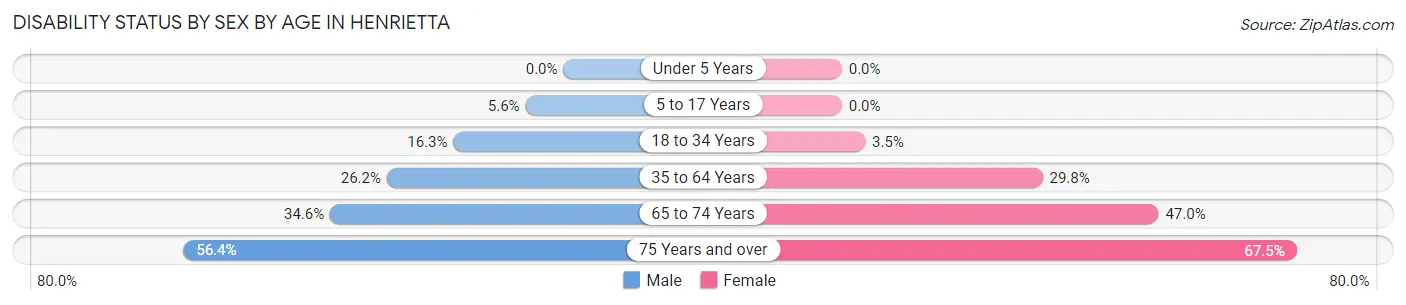
| Age Bracket | Male | Female |
| Under 5 Years | 0 (0.0%) | 0 (0.0%) |
| 5 to 17 Years | 16 (5.6%) | 0 (0.0%) |
| 18 to 34 Years | 42 (16.3%) | 10 (3.5%) |
| 35 to 64 Years | 124 (26.2%) | 192 (29.8%) |
| 65 to 74 Years | 53 (34.6%) | 111 (47.0%) |
| 75 Years and over | 79 (56.4%) | 79 (67.5%) |
Disability Class by Sex by Age in Henrietta
Disability Class: Hearing Difficulty
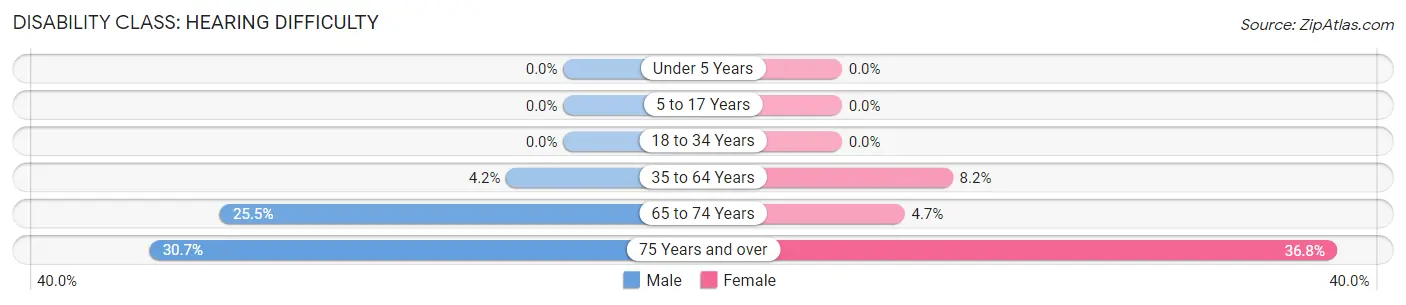
| Age Bracket | Male | Female |
| Under 5 Years | 0 (0.0%) | 0 (0.0%) |
| 5 to 17 Years | 0 (0.0%) | 0 (0.0%) |
| 18 to 34 Years | 0 (0.0%) | 0 (0.0%) |
| 35 to 64 Years | 20 (4.2%) | 53 (8.2%) |
| 65 to 74 Years | 39 (25.5%) | 11 (4.7%) |
| 75 Years and over | 43 (30.7%) | 43 (36.7%) |
Disability Class: Vision Difficulty
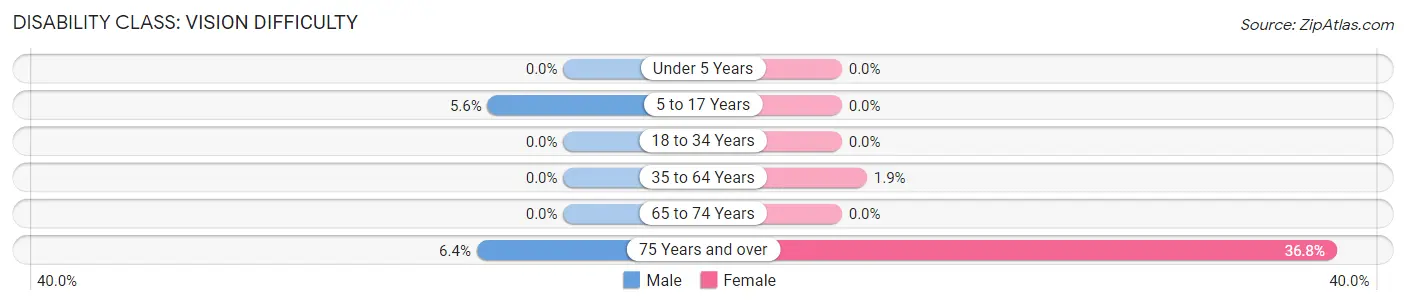
| Age Bracket | Male | Female |
| Under 5 Years | 0 (0.0%) | 0 (0.0%) |
| 5 to 17 Years | 16 (5.6%) | 0 (0.0%) |
| 18 to 34 Years | 0 (0.0%) | 0 (0.0%) |
| 35 to 64 Years | 0 (0.0%) | 12 (1.9%) |
| 65 to 74 Years | 0 (0.0%) | 0 (0.0%) |
| 75 Years and over | 9 (6.4%) | 43 (36.7%) |
Disability Class: Cognitive Difficulty
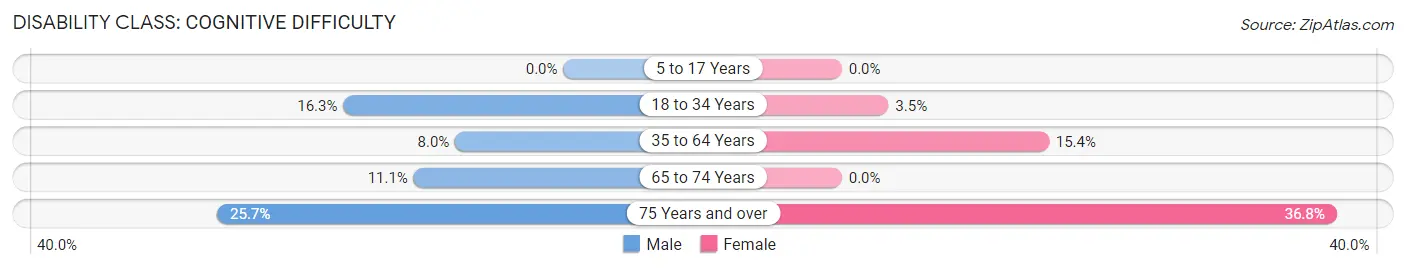
| Age Bracket | Male | Female |
| 5 to 17 Years | 0 (0.0%) | 0 (0.0%) |
| 18 to 34 Years | 42 (16.3%) | 10 (3.5%) |
| 35 to 64 Years | 38 (8.0%) | 99 (15.4%) |
| 65 to 74 Years | 17 (11.1%) | 0 (0.0%) |
| 75 Years and over | 36 (25.7%) | 43 (36.7%) |
Disability Class: Ambulatory Difficulty
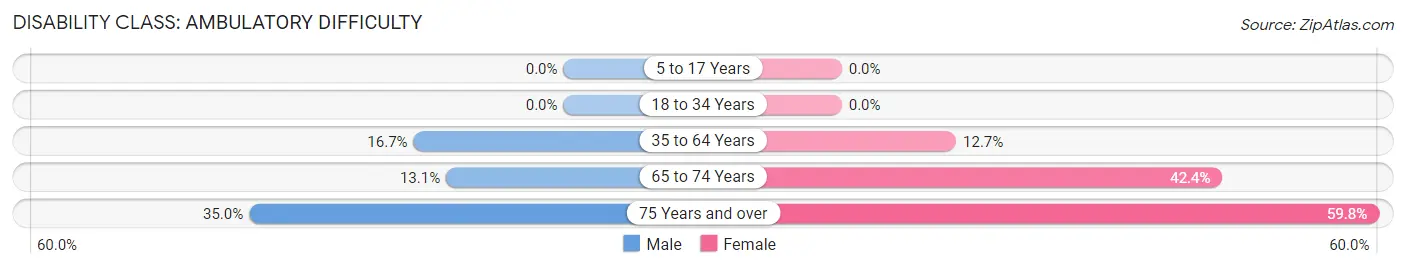
| Age Bracket | Male | Female |
| 5 to 17 Years | 0 (0.0%) | 0 (0.0%) |
| 18 to 34 Years | 0 (0.0%) | 0 (0.0%) |
| 35 to 64 Years | 79 (16.7%) | 82 (12.7%) |
| 65 to 74 Years | 20 (13.1%) | 100 (42.4%) |
| 75 Years and over | 49 (35.0%) | 70 (59.8%) |
Disability Class: Self-Care Difficulty
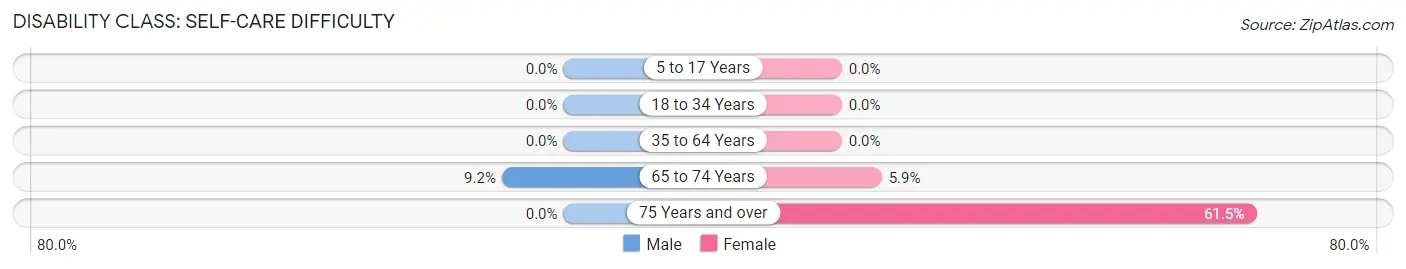
| Age Bracket | Male | Female |
| 5 to 17 Years | 0 (0.0%) | 0 (0.0%) |
| 18 to 34 Years | 0 (0.0%) | 0 (0.0%) |
| 35 to 64 Years | 0 (0.0%) | 0 (0.0%) |
| 65 to 74 Years | 14 (9.1%) | 14 (5.9%) |
| 75 Years and over | 0 (0.0%) | 72 (61.5%) |
Technology Access in Henrietta
Computing Device Access in Henrietta
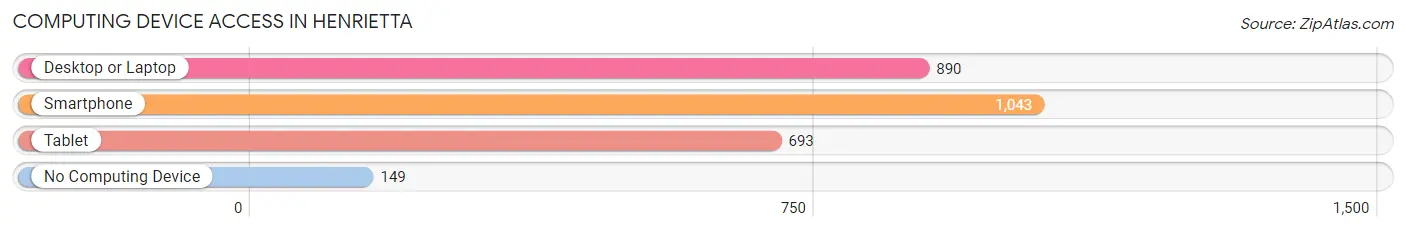
| Device Type | # Households | % Households |
| Desktop or Laptop | 890 | 69.8% |
| Smartphone | 1,043 | 81.7% |
| Tablet | 693 | 54.3% |
| No Computing Device | 149 | 11.7% |
| Total | 1,276 | 100.0% |
Internet Access in Henrietta
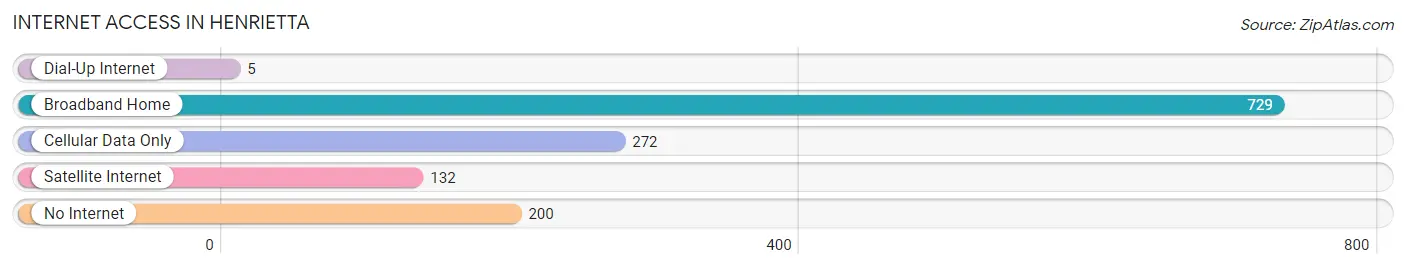
| Internet Type | # Households | % Households |
| Dial-Up Internet | 5 | 0.4% |
| Broadband Home | 729 | 57.1% |
| Cellular Data Only | 272 | 21.3% |
| Satellite Internet | 132 | 10.3% |
| No Internet | 200 | 15.7% |
| Total | 1,276 | 100.0% |
Henrietta Summary
Henrietta, Texas is a small town located in Clay County, Texas, United States. It is situated in the Red River Valley, approximately 100 miles northwest of Dallas. The town was founded in 1882 and named after Henrietta King, the daughter of a prominent Texas rancher. The population of Henrietta was 2,845 at the 2010 census.
Geography
Henrietta is located at 33°45'25" North, 98°10'25" West (33.756944, -98.173611). It is situated in the Red River Valley, approximately 100 miles northwest of Dallas. The town is located on the banks of the Red River, which forms the border between Texas and Oklahoma. The terrain is mostly flat, with some rolling hills in the area. The climate is semi-arid, with hot summers and mild winters.
Economy
Henrietta's economy is largely based on agriculture and ranching. The town is home to several large ranches, including the King Ranch, which is one of the largest ranches in the United States. The town also has a strong manufacturing sector, with several factories producing a variety of products, including furniture, clothing, and automotive parts.
Demographics
As of the 2010 census, the population of Henrietta was 2,845. The racial makeup of the town was 94.2% White, 0.7% African American, 0.3% Native American, 0.2% Asian, 0.1% Pacific Islander, 3.2% from other races, and 1.4% from two or more races. Hispanic or Latino of any race were 6.7% of the population.
The median income for a household in Henrietta was $37,917, and the median income for a family was $45,000. The per capita income for the town was $18,945. About 11.2% of families and 14.2% of the population were below the poverty line, including 18.2% of those under age 18 and 11.2% of those age 65 or over.
Education
Henrietta is served by the Henrietta Independent School District. The district has one elementary school, one middle school, and one high school. The town is also home to North Central Texas College, a two-year community college.
Conclusion
Henrietta, Texas is a small town located in Clay County, Texas, United States. It is situated in the Red River Valley, approximately 100 miles northwest of Dallas. The town was founded in 1882 and named after Henrietta King, the daughter of a prominent Texas rancher. The population of Henrietta was 2,845 at the 2010 census. The town's economy is largely based on agriculture and ranching, and it is home to several large ranches, including the King Ranch. The town also has a strong manufacturing sector, with several factories producing a variety of products. The town is served by the Henrietta Independent School District, and is home to North Central Texas College, a two-year community college.
Common Questions
What is Per Capita Income in Henrietta?
Per Capita income in Henrietta is $31,378.
What is the Median Family Income in Henrietta?
Median Family Income in Henrietta is $90,823.
What is the Median Household income in Henrietta?
Median Household Income in Henrietta is $61,317.
What is Income or Wage Gap in Henrietta?
Income or Wage Gap in Henrietta is 38.4%.
Women in Henrietta earn 61.6 cents for every dollar earned by a man.
What is Inequality or Gini Index in Henrietta?
Inequality or Gini Index in Henrietta is 0.42.
What is the Total Population of Henrietta?
Total Population of Henrietta is 3,115.
What is the Total Male Population of Henrietta?
Total Male Population of Henrietta is 1,447.
What is the Total Female Population of Henrietta?
Total Female Population of Henrietta is 1,668.
What is the Ratio of Males per 100 Females in Henrietta?
There are 86.75 Males per 100 Females in Henrietta.
What is the Ratio of Females per 100 Males in Henrietta?
There are 115.27 Females per 100 Males in Henrietta.
What is the Median Population Age in Henrietta?
Median Population Age in Henrietta is 41.1 Years.
What is the Average Family Size in Henrietta
Average Family Size in Henrietta is 3.1 People.
What is the Average Household Size in Henrietta
Average Household Size in Henrietta is 2.4 People.
How Large is the Labor Force in Henrietta?
There are 1,354 People in the Labor Forcein in Henrietta.
What is the Percentage of People in the Labor Force in Henrietta?
54.6% of People are in the Labor Force in Henrietta.
What is the Unemployment Rate in Henrietta?
Unemployment Rate in Henrietta is 1.3%.