Hedley, TX Map & Demographics
Hedley Map
Hedley Overview
$33,133
PER CAPITA INCOME
$64,750
AVG FAMILY INCOME
$42,344
AVG HOUSEHOLD INCOME
51.1%
WAGE / INCOME GAP [ % ]
48.9¢/ $1
WAGE / INCOME GAP [ $ ]
0.45
INEQUALITY / GINI INDEX
254
TOTAL POPULATION
115
MALE POPULATION
139
FEMALE POPULATION
82.73
MALES / 100 FEMALES
120.87
FEMALES / 100 MALES
52.6
MEDIAN AGE
3.1
AVG FAMILY SIZE
2.4
AVG HOUSEHOLD SIZE
146
LABOR FORCE [ PEOPLE ]
63.8%
PERCENT IN LABOR FORCE
Hedley Zip Codes
Hedley Area Codes
Income in Hedley
Income Overview in Hedley
Per Capita Income in Hedley is $33,133, while median incomes of families and households are $64,750 and $42,344 respectively.
| Characteristic | Number | Measure |
| Per Capita Income | 254 | $33,133 |
| Median Family Income | 69 | $64,750 |
| Mean Family Income | 69 | $83,474 |
| Median Household Income | 105 | $42,344 |
| Mean Household Income | 105 | $69,030 |
| Income Deficit | 69 | $0 |
| Wage / Income Gap (%) | 254 | 51.15% |
| Wage / Income Gap ($) | 254 | 48.85¢ per $1 |
| Gini / Inequality Index | 254 | 0.45 |
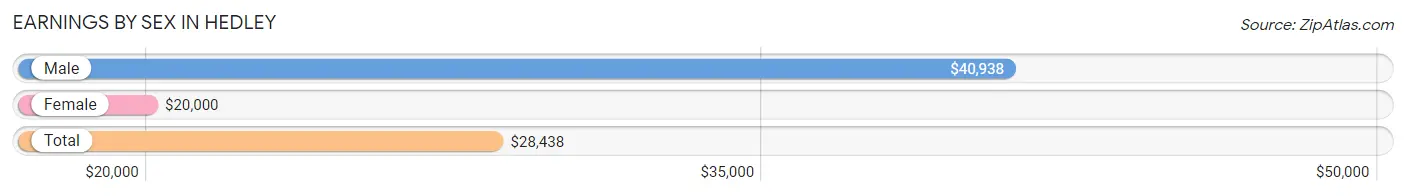
Earnings by Sex in Hedley
Average Earnings in Hedley are $28,438, $40,938 for men and $20,000 for women, a difference of 51.1%.
| Sex | Number | Average Earnings |
| Male | 71 (47.0%) | $40,938 |
| Female | 80 (53.0%) | $20,000 |
| Total | 151 (100.0%) | $28,438 |
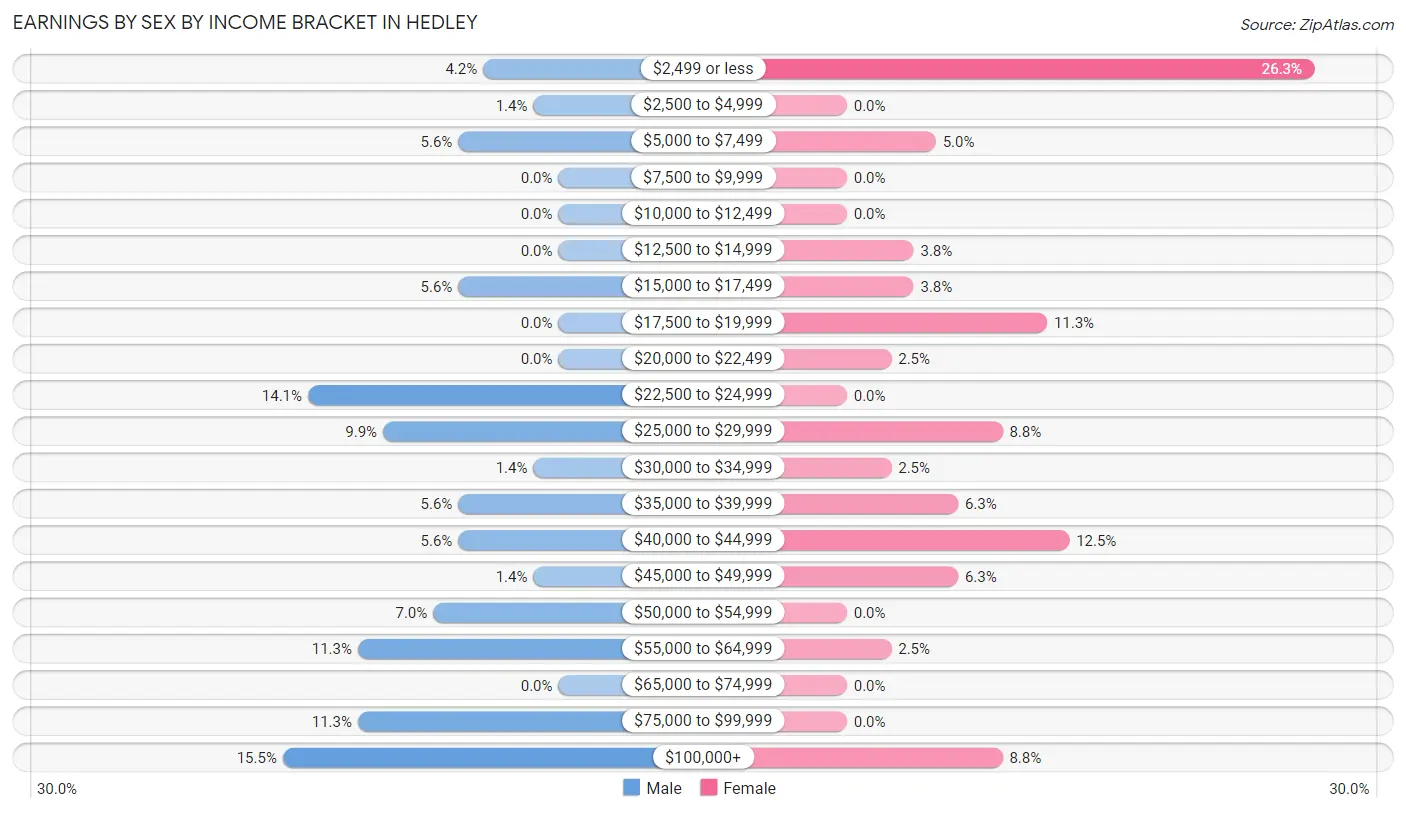
Earnings by Sex by Income Bracket in Hedley
The most common earnings brackets in Hedley are $100,000+ for men (11 | 15.5%) and $2,499 or less for women (21 | 26.3%).
| Income | Male | Female |
| $2,499 or less | 3 (4.2%) | 21 (26.3%) |
| $2,500 to $4,999 | 1 (1.4%) | 0 (0.0%) |
| $5,000 to $7,499 | 4 (5.6%) | 4 (5.0%) |
| $7,500 to $9,999 | 0 (0.0%) | 0 (0.0%) |
| $10,000 to $12,499 | 0 (0.0%) | 0 (0.0%) |
| $12,500 to $14,999 | 0 (0.0%) | 3 (3.7%) |
| $15,000 to $17,499 | 4 (5.6%) | 3 (3.7%) |
| $17,500 to $19,999 | 0 (0.0%) | 9 (11.3%) |
| $20,000 to $22,499 | 0 (0.0%) | 2 (2.5%) |
| $22,500 to $24,999 | 10 (14.1%) | 0 (0.0%) |
| $25,000 to $29,999 | 7 (9.9%) | 7 (8.7%) |
| $30,000 to $34,999 | 1 (1.4%) | 2 (2.5%) |
| $35,000 to $39,999 | 4 (5.6%) | 5 (6.2%) |
| $40,000 to $44,999 | 4 (5.6%) | 10 (12.5%) |
| $45,000 to $49,999 | 1 (1.4%) | 5 (6.2%) |
| $50,000 to $54,999 | 5 (7.0%) | 0 (0.0%) |
| $55,000 to $64,999 | 8 (11.3%) | 2 (2.5%) |
| $65,000 to $74,999 | 0 (0.0%) | 0 (0.0%) |
| $75,000 to $99,999 | 8 (11.3%) | 0 (0.0%) |
| $100,000+ | 11 (15.5%) | 7 (8.7%) |
| Total | 71 (100.0%) | 80 (100.0%) |
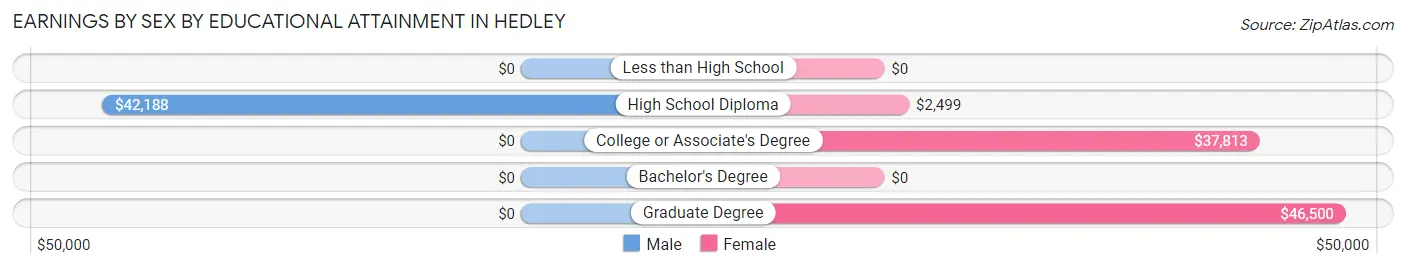
Earnings by Sex by Educational Attainment in Hedley
Average earnings in Hedley are $52,000 for men and $26,875 for women, a difference of 48.3%. Men with an educational attainment of high school diploma enjoy the highest average annual earnings of $42,188, while those with high school diploma education earn the least with $42,188. Women with an educational attainment of graduate degree earn the most with the average annual earnings of $46,500, while those with high school diploma education have the smallest earnings of $2,499.
| Educational Attainment | Male Income | Female Income |
| Less than High School | - | - |
| High School Diploma | $42,188 | $2,499 |
| College or Associate's Degree | - | - |
| Bachelor's Degree | - | - |
| Graduate Degree | - | - |
| Total | $52,000 | $26,875 |
Family Income in Hedley
Family Income Brackets in Hedley
According to the Hedley family income data, there are 17 families falling into the $50,000 to $74,999 income range, which is the most common income bracket and makes up 24.6% of all families.
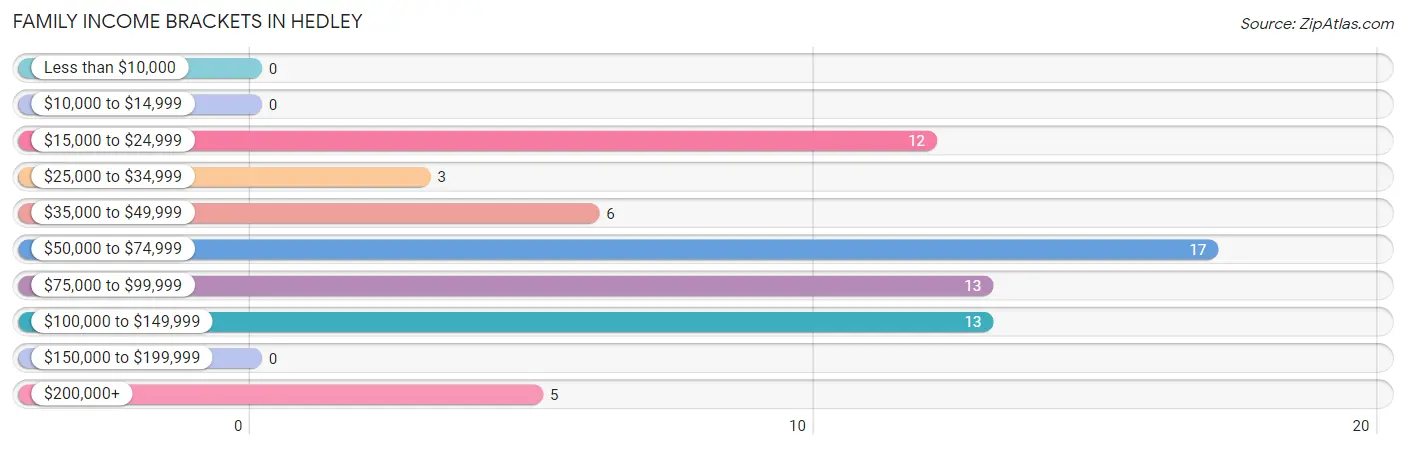
| Income Bracket | # Families | % Families |
| Less than $10,000 | 0 | 0.0% |
| $10,000 to $14,999 | 0 | 0.0% |
| $15,000 to $24,999 | 12 | 17.4% |
| $25,000 to $34,999 | 3 | 4.3% |
| $35,000 to $49,999 | 6 | 8.7% |
| $50,000 to $74,999 | 17 | 24.6% |
| $75,000 to $99,999 | 13 | 18.8% |
| $100,000 to $149,999 | 13 | 18.8% |
| $150,000 to $199,999 | 0 | 0.0% |
| $200,000+ | 5 | 7.2% |
Family Income by Famaliy Size in Hedley
4-person families (9 | 13.0%) account for the highest median family income in Hedley with $127,917 per family, while 4-person families (9 | 13.0%) have the highest median income of $31,979 per family member.
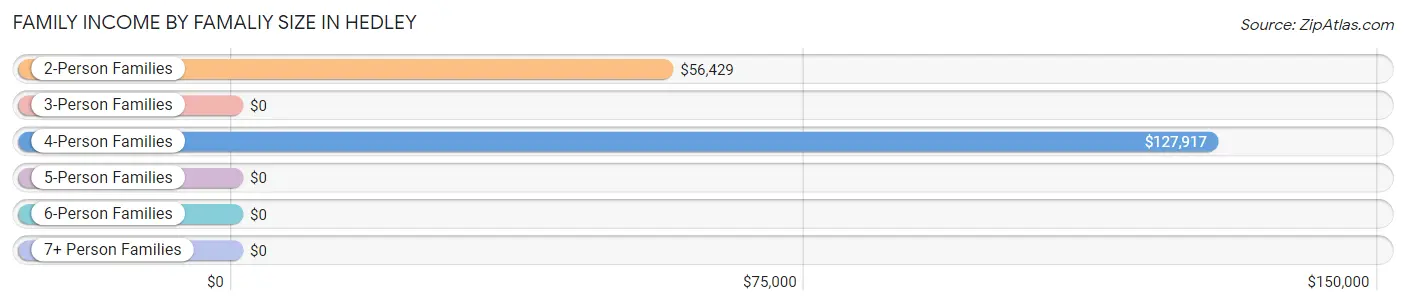
| Income Bracket | # Families | Median Income |
| 2-Person Families | 46 (66.7%) | $56,429 |
| 3-Person Families | 12 (17.4%) | $0 |
| 4-Person Families | 9 (13.0%) | $127,917 |
| 5-Person Families | 2 (2.9%) | $0 |
| 6-Person Families | 0 (0.0%) | $0 |
| 7+ Person Families | 0 (0.0%) | $0 |
| Total | 69 (100.0%) | $64,750 |
Family Income by Number of Earners in Hedley
The median family income in Hedley is $64,750, with families comprising 3+ earners (12) having the highest median family income of $128,333, while families with no earners (14) have the lowest median family income of $24,688, accounting for 17.4% and 20.3% of families, respectively.
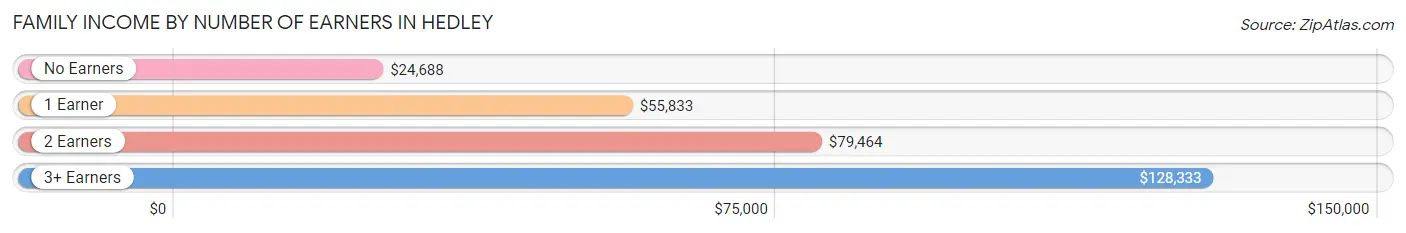
| Number of Earners | # Families | Median Income |
| No Earners | 14 (20.3%) | $24,688 |
| 1 Earner | 18 (26.1%) | $55,833 |
| 2 Earners | 25 (36.2%) | $79,464 |
| 3+ Earners | 12 (17.4%) | $128,333 |
| Total | 69 (100.0%) | $64,750 |
Household Income in Hedley
Household Income Brackets in Hedley
With 18 households falling in the category, the $15,000 to $24,999 income range is the most frequent in Hedley, accounting for 17.1% of all households.
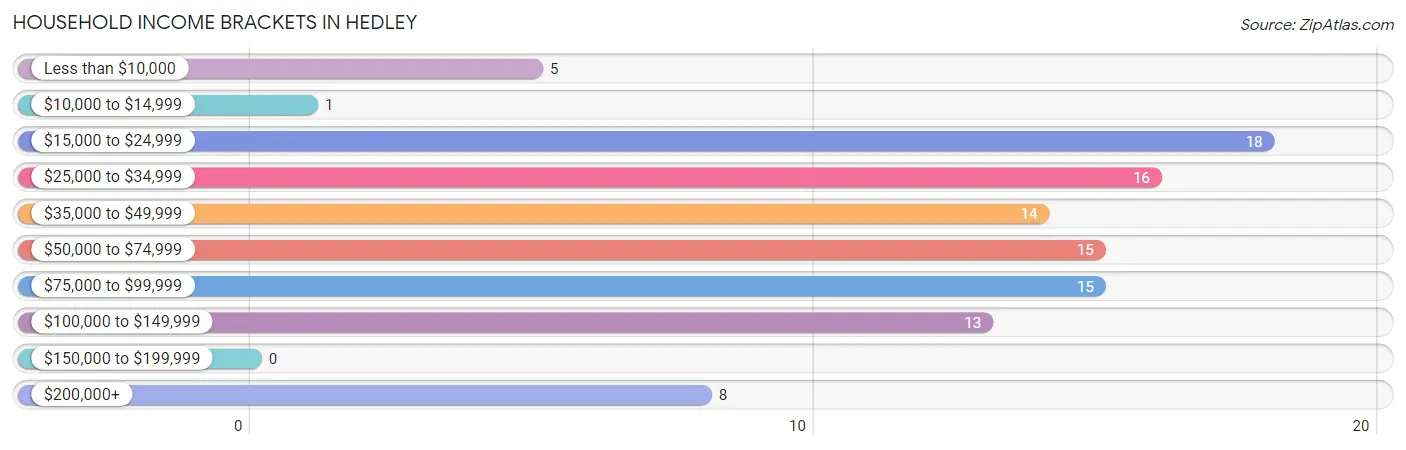
| Income Bracket | # Households | % Households |
| Less than $10,000 | 5 | 4.8% |
| $10,000 to $14,999 | 1 | 1.0% |
| $15,000 to $24,999 | 18 | 17.1% |
| $25,000 to $34,999 | 16 | 15.2% |
| $35,000 to $49,999 | 14 | 13.3% |
| $50,000 to $74,999 | 15 | 14.3% |
| $75,000 to $99,999 | 15 | 14.3% |
| $100,000 to $149,999 | 13 | 12.4% |
| $150,000 to $199,999 | 0 | 0.0% |
| $200,000+ | 8 | 7.6% |
Household Income by Householder Age in Hedley
The median household income in Hedley is $42,344, with the highest median household income of $77,917 found in the 45 to 64 years age bracket for the primary householder. A total of 49 households (46.7%) fall into this category. Meanwhile, the 15 to 24 years age bracket for the primary householder has the lowest median household income of $0, with 2 households (1.9%) in this group.
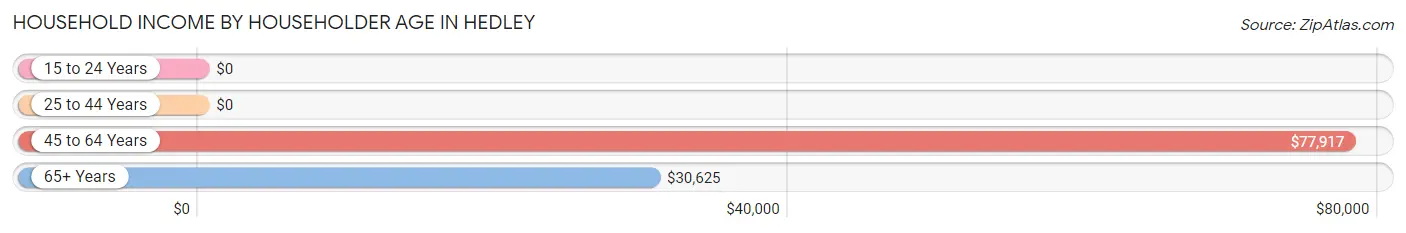
| Income Bracket | # Households | Median Income |
| 15 to 24 Years | 2 (1.9%) | $0 |
| 25 to 44 Years | 22 (20.9%) | $0 |
| 45 to 64 Years | 49 (46.7%) | $77,917 |
| 65+ Years | 32 (30.5%) | $30,625 |
| Total | 105 (100.0%) | $42,344 |
Poverty in Hedley
Income Below Poverty by Sex and Age in Hedley
With 8.7% poverty level for males and 13.7% for females among the residents of Hedley, 5 year old males and under 5 year old females are the most vulnerable to poverty, with 2 males (100.0%) and 2 females (100.0%) in their respective age groups living below the poverty level.
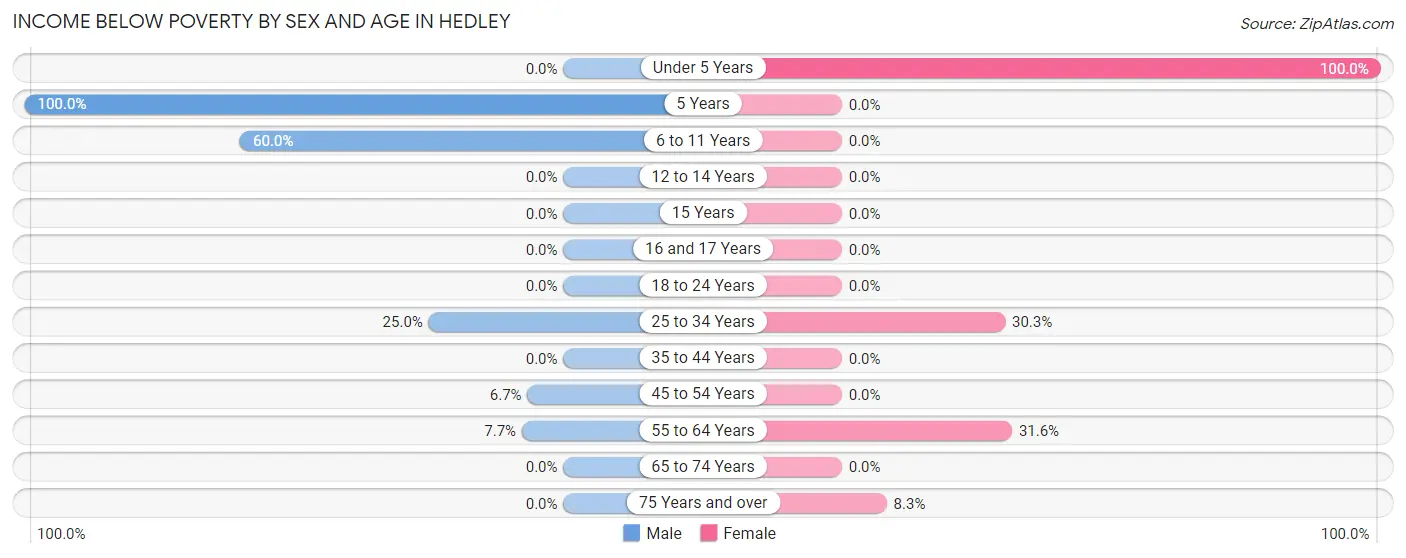
| Age Bracket | Male | Female |
| Under 5 Years | 0 (0.0%) | 2 (100.0%) |
| 5 Years | 2 (100.0%) | 0 (0.0%) |
| 6 to 11 Years | 3 (60.0%) | 0 (0.0%) |
| 12 to 14 Years | 0 (0.0%) | 0 (0.0%) |
| 15 Years | 0 (0.0%) | 0 (0.0%) |
| 16 and 17 Years | 0 (0.0%) | 0 (0.0%) |
| 18 to 24 Years | 0 (0.0%) | 0 (0.0%) |
| 25 to 34 Years | 2 (25.0%) | 10 (30.3%) |
| 35 to 44 Years | 0 (0.0%) | 0 (0.0%) |
| 45 to 54 Years | 1 (6.7%) | 0 (0.0%) |
| 55 to 64 Years | 2 (7.7%) | 6 (31.6%) |
| 65 to 74 Years | 0 (0.0%) | 0 (0.0%) |
| 75 Years and over | 0 (0.0%) | 1 (8.3%) |
| Total | 10 (8.7%) | 19 (13.7%) |
Income Above Poverty by Sex and Age in Hedley
According to the poverty statistics in Hedley, males aged under 5 years and females aged 5 years are the age groups that are most secure financially, with 100.0% of males and 100.0% of females in these age groups living above the poverty line.
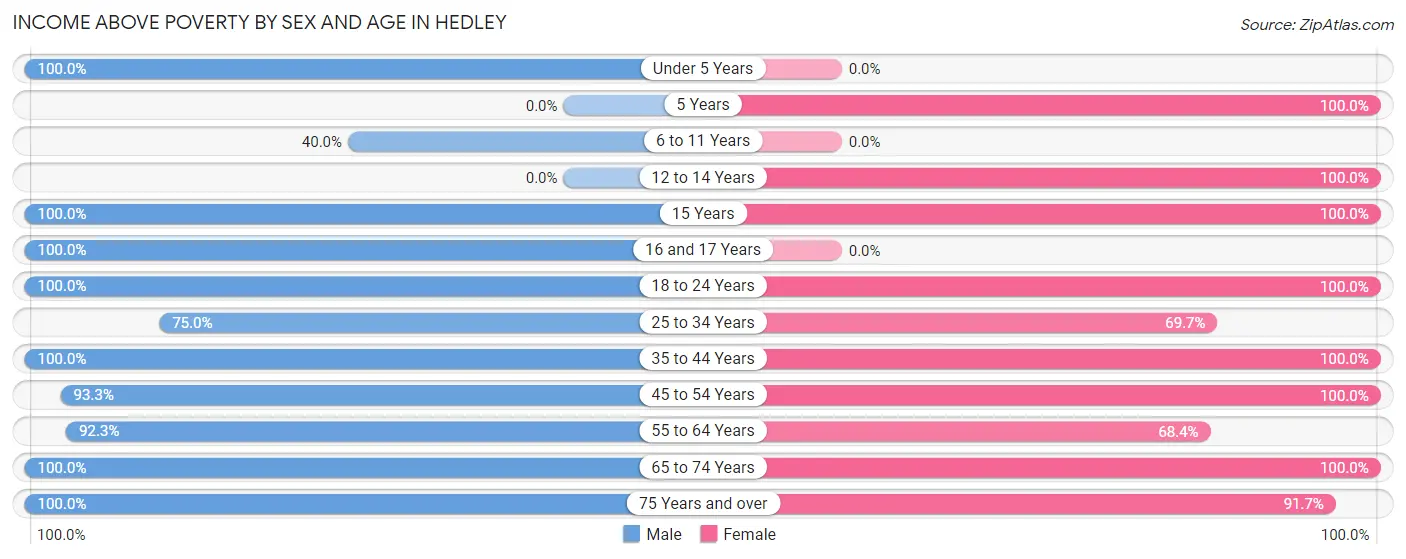
| Age Bracket | Male | Female |
| Under 5 Years | 7 (100.0%) | 0 (0.0%) |
| 5 Years | 0 (0.0%) | 1 (100.0%) |
| 6 to 11 Years | 2 (40.0%) | 0 (0.0%) |
| 12 to 14 Years | 0 (0.0%) | 3 (100.0%) |
| 15 Years | 4 (100.0%) | 1 (100.0%) |
| 16 and 17 Years | 3 (100.0%) | 0 (0.0%) |
| 18 to 24 Years | 12 (100.0%) | 10 (100.0%) |
| 25 to 34 Years | 6 (75.0%) | 23 (69.7%) |
| 35 to 44 Years | 11 (100.0%) | 5 (100.0%) |
| 45 to 54 Years | 14 (93.3%) | 26 (100.0%) |
| 55 to 64 Years | 24 (92.3%) | 13 (68.4%) |
| 65 to 74 Years | 17 (100.0%) | 27 (100.0%) |
| 75 Years and over | 5 (100.0%) | 11 (91.7%) |
| Total | 105 (91.3%) | 120 (86.3%) |
Income Below Poverty Among Married-Couple Families in Hedley
The poverty statistics for married-couple families in Hedley show that 3.3% or 2 of the total 60 families live below the poverty line. Families with 3 or 4 children have the highest poverty rate of 50.0%, comprising of 1 families. On the other hand, families with no children have the lowest poverty rate of 0.0%, which includes 0 families.
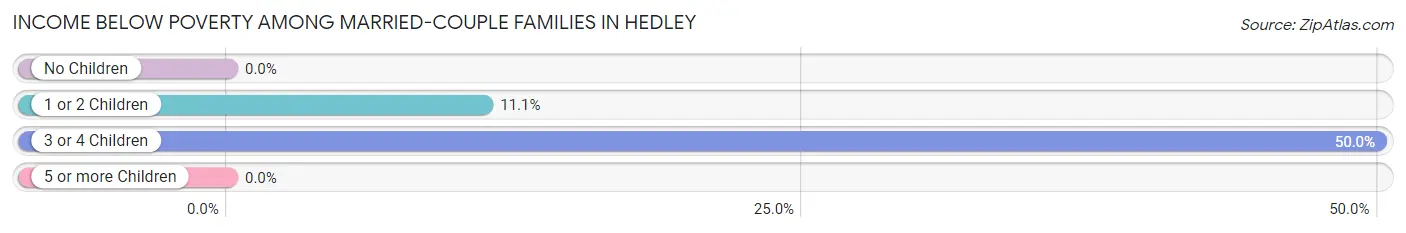
| Children | Above Poverty | Below Poverty |
| No Children | 49 (100.0%) | 0 (0.0%) |
| 1 or 2 Children | 8 (88.9%) | 1 (11.1%) |
| 3 or 4 Children | 1 (50.0%) | 1 (50.0%) |
| 5 or more Children | 0 (0.0%) | 0 (0.0%) |
| Total | 58 (96.7%) | 2 (3.3%) |
Income Below Poverty Among Single-Parent Households in Hedley
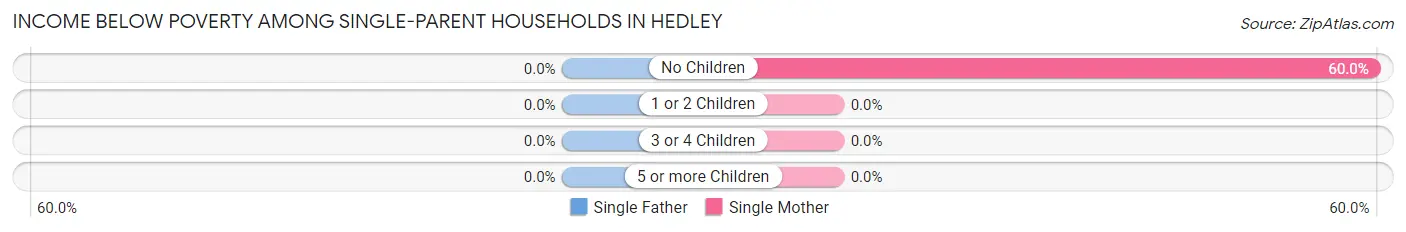
| Children | Single Father | Single Mother |
| No Children | 0 (0.0%) | 3 (60.0%) |
| 1 or 2 Children | 0 (0.0%) | 0 (0.0%) |
| 3 or 4 Children | 0 (0.0%) | 0 (0.0%) |
| 5 or more Children | 0 (0.0%) | 0 (0.0%) |
| Total | 0 (0.0%) | 3 (37.5%) |
Income Below Poverty Among Married-Couple vs Single-Parent Households in Hedley
The poverty data for Hedley shows that 2 of the married-couple family households (3.3%) and 3 of the single-parent households (33.3%) are living below the poverty level. Within the married-couple family households, those with 3 or 4 children have the highest poverty rate, with 1 households (50.0%) falling below the poverty line. Among the single-parent households, those with no children have the highest poverty rate, with 3 household (50.0%) living below poverty.
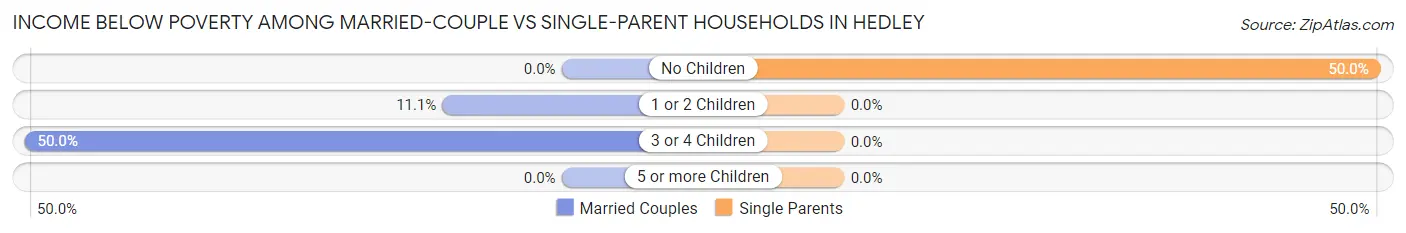
| Children | Married-Couple Families | Single-Parent Households |
| No Children | 0 (0.0%) | 3 (50.0%) |
| 1 or 2 Children | 1 (11.1%) | 0 (0.0%) |
| 3 or 4 Children | 1 (50.0%) | 0 (0.0%) |
| 5 or more Children | 0 (0.0%) | 0 (0.0%) |
| Total | 2 (3.3%) | 3 (33.3%) |
Race in Hedley
The most populous races in Hedley are White / Caucasian (241 | 94.9%), Hispanic or Latino (13 | 5.1%), and Two or more Races (12 | 4.7%).
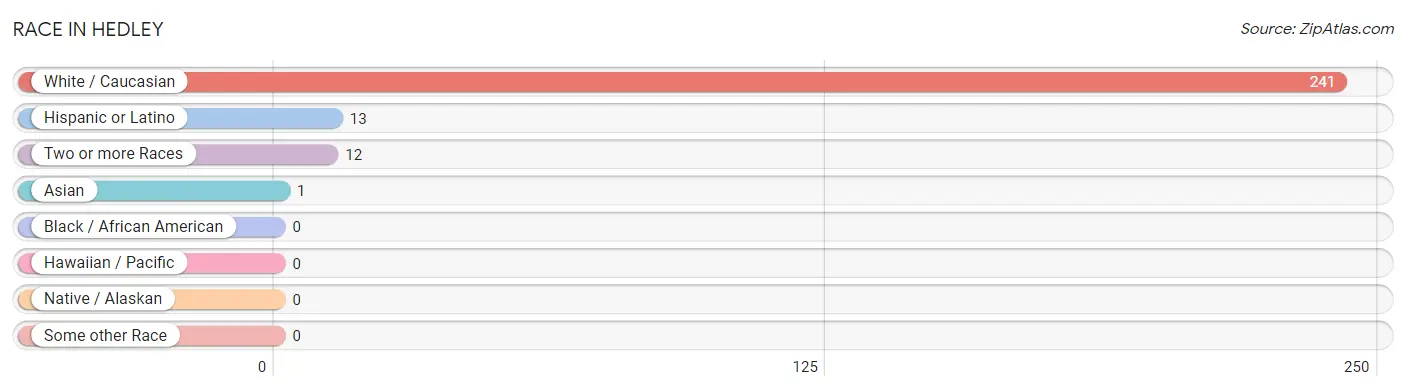
| Race | # Population | % Population |
| Asian | 1 | 0.4% |
| Black / African American | 0 | 0.0% |
| Hawaiian / Pacific | 0 | 0.0% |
| Hispanic or Latino | 13 | 5.1% |
| Native / Alaskan | 0 | 0.0% |
| White / Caucasian | 241 | 94.9% |
| Two or more Races | 12 | 4.7% |
| Some other Race | 0 | 0.0% |
| Total | 254 | 100.0% |
Ancestry in Hedley
The most populous ancestries reported in Hedley are English (65 | 25.6%), Irish (63 | 24.8%), German (26 | 10.2%), Mexican (13 | 5.1%), and American (11 | 4.3%), together accounting for 70.1% of all Hedley residents.
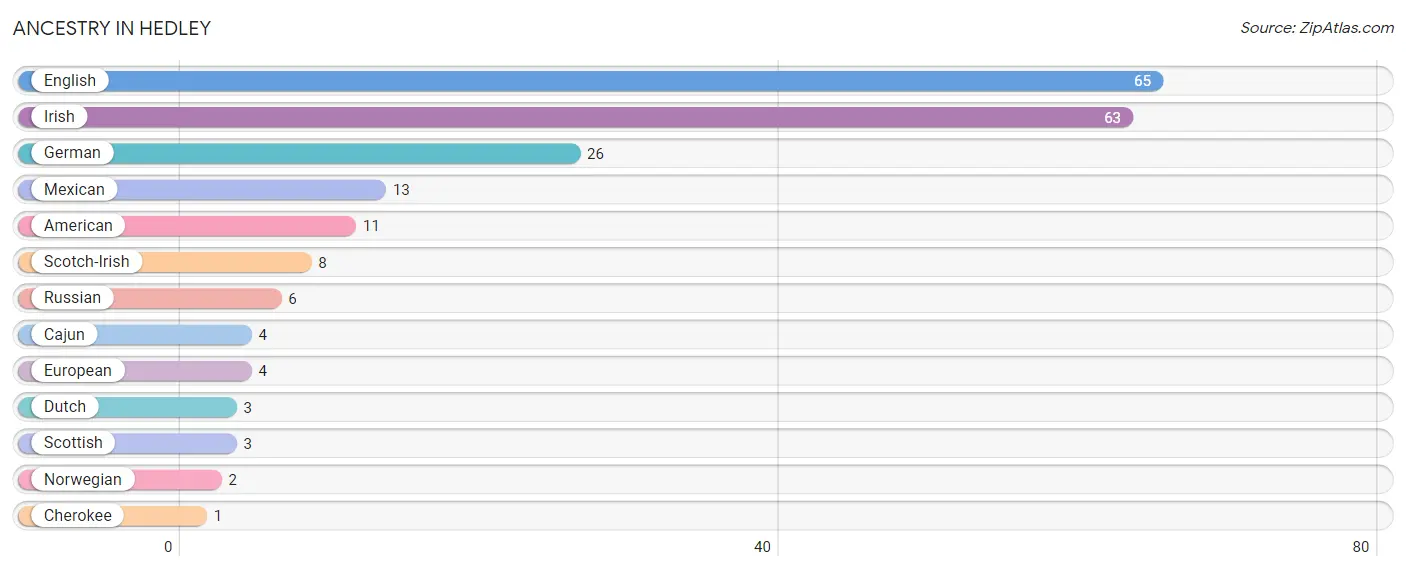
| Ancestry | # Population | % Population |
| American | 11 | 4.3% |
| Cajun | 4 | 1.6% |
| Cherokee | 1 | 0.4% |
| Dutch | 3 | 1.2% |
| English | 65 | 25.6% |
| European | 4 | 1.6% |
| German | 26 | 10.2% |
| Irish | 63 | 24.8% |
| Mexican | 13 | 5.1% |
| Norwegian | 2 | 0.8% |
| Russian | 6 | 2.4% |
| Scotch-Irish | 8 | 3.2% |
| Scottish | 3 | 1.2% | View All 13 Rows |
Immigrants in Hedley
The most numerous immigrant groups reported in Hedley came from Central America (10 | 3.9%), Latin America (10 | 3.9%), Mexico (10 | 3.9%), Asia (1 | 0.4%), and Eastern Asia (1 | 0.4%), together accounting for 12.6% of all Hedley residents.
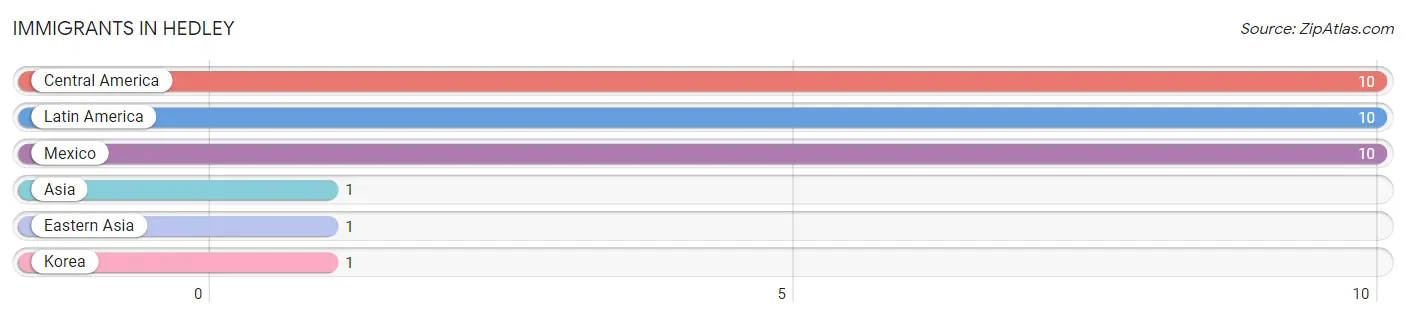
| Immigration Origin | # Population | % Population |
| Asia | 1 | 0.4% |
| Central America | 10 | 3.9% |
| Eastern Asia | 1 | 0.4% |
| Korea | 1 | 0.4% |
| Latin America | 10 | 3.9% |
| Mexico | 10 | 3.9% | View All 6 Rows |
Sex and Age in Hedley
Sex and Age in Hedley
The most populous age groups in Hedley are 50 to 54 Years (14 | 12.2%) for men and 25 to 29 Years (30 | 21.6%) for women.
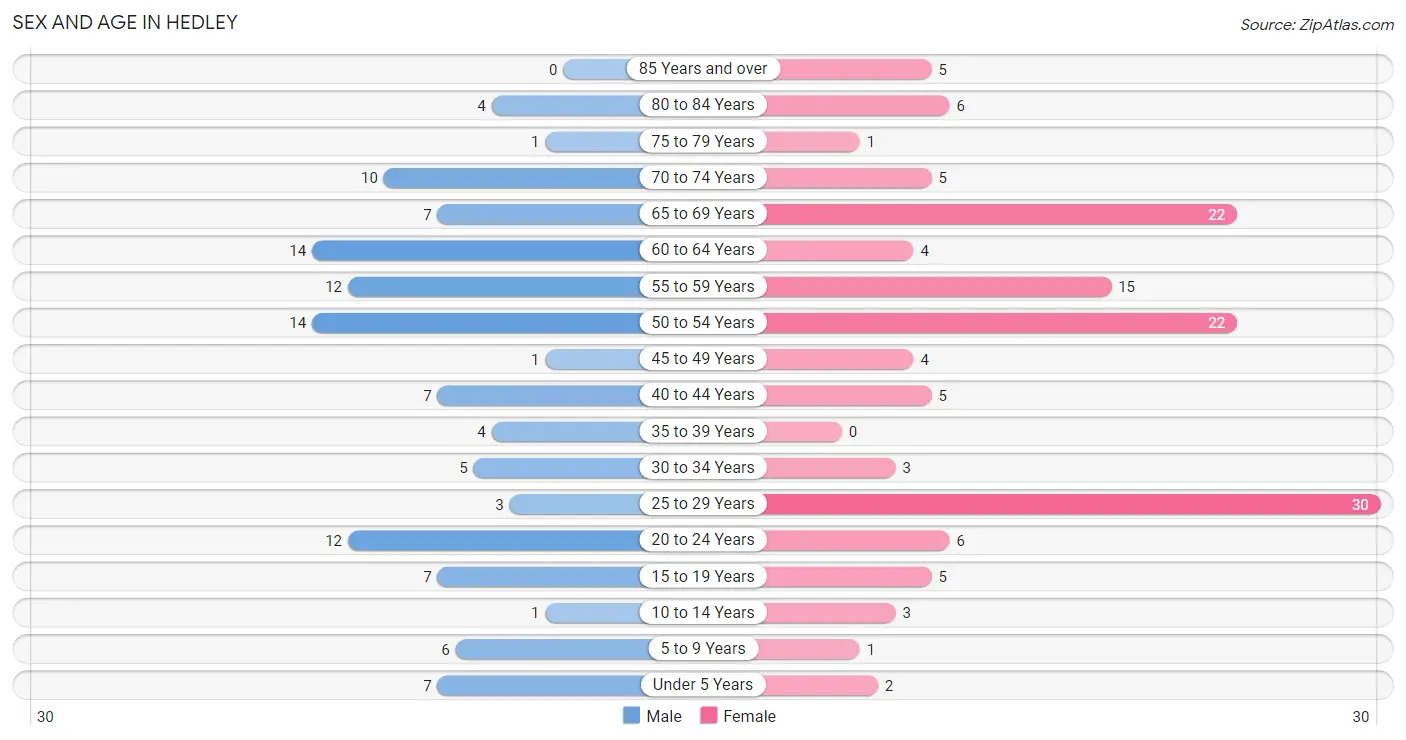
| Age Bracket | Male | Female |
| Under 5 Years | 7 (6.1%) | 2 (1.4%) |
| 5 to 9 Years | 6 (5.2%) | 1 (0.7%) |
| 10 to 14 Years | 1 (0.9%) | 3 (2.2%) |
| 15 to 19 Years | 7 (6.1%) | 5 (3.6%) |
| 20 to 24 Years | 12 (10.4%) | 6 (4.3%) |
| 25 to 29 Years | 3 (2.6%) | 30 (21.6%) |
| 30 to 34 Years | 5 (4.3%) | 3 (2.2%) |
| 35 to 39 Years | 4 (3.5%) | 0 (0.0%) |
| 40 to 44 Years | 7 (6.1%) | 5 (3.6%) |
| 45 to 49 Years | 1 (0.9%) | 4 (2.9%) |
| 50 to 54 Years | 14 (12.2%) | 22 (15.8%) |
| 55 to 59 Years | 12 (10.4%) | 15 (10.8%) |
| 60 to 64 Years | 14 (12.2%) | 4 (2.9%) |
| 65 to 69 Years | 7 (6.1%) | 22 (15.8%) |
| 70 to 74 Years | 10 (8.7%) | 5 (3.6%) |
| 75 to 79 Years | 1 (0.9%) | 1 (0.7%) |
| 80 to 84 Years | 4 (3.5%) | 6 (4.3%) |
| 85 Years and over | 0 (0.0%) | 5 (3.6%) |
| Total | 115 (100.0%) | 139 (100.0%) |
Families and Households in Hedley
Median Family Size in Hedley
The median family size in Hedley is 3.10 persons per family, with single male/father families (1 | 1.5%) accounting for the largest median family size of 4 persons per family. On the other hand, married-couple families (60 | 87.0%) represent the smallest median family size with 3.03 persons per family.
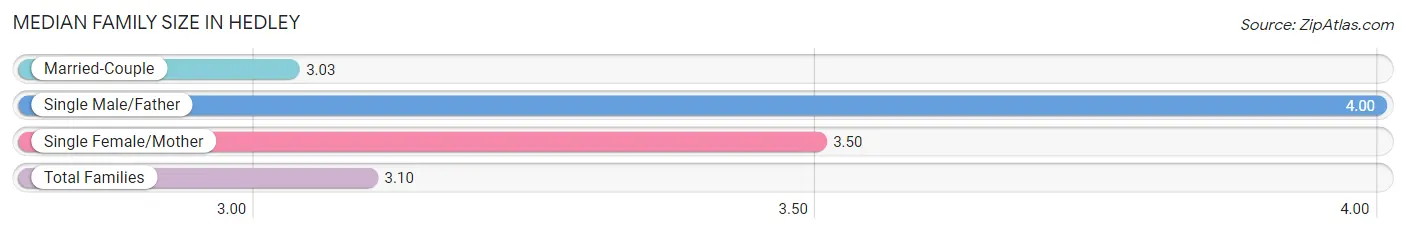
| Family Type | # Families | Family Size |
| Married-Couple | 60 (87.0%) | 3.03 |
| Single Male/Father | 1 (1.5%) | 4.00 |
| Single Female/Mother | 8 (11.6%) | 3.50 |
| Total Families | 69 (100.0%) | 3.10 |
Median Household Size in Hedley
The median household size in Hedley is 2.42 persons per household, with single male/father households (1 | 0.9%) accounting for the largest median household size of 4 persons per household. non-family households (36 | 34.3%) represent the smallest median household size with 1.08 persons per household.
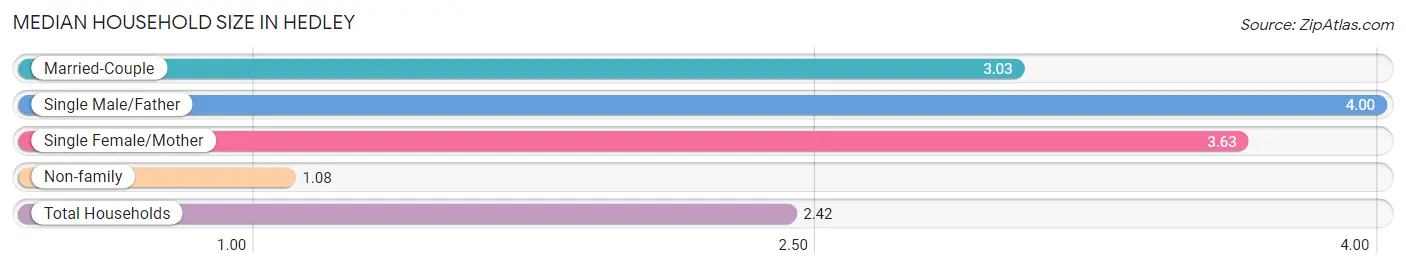
| Household Type | # Households | Household Size |
| Married-Couple | 60 (57.1%) | 3.03 |
| Single Male/Father | 1 (0.9%) | 4.00 |
| Single Female/Mother | 8 (7.6%) | 3.63 |
| Non-family | 36 (34.3%) | 1.08 |
| Total Households | 105 (100.0%) | 2.42 |
Household Size by Marriage Status in Hedley
Out of a total of 105 households in Hedley, 69 (65.7%) are family households, while 36 (34.3%) are nonfamily households. The most numerous type of family households are 2-person households, comprising 46, and the most common type of nonfamily households are 1-person households, comprising 35.
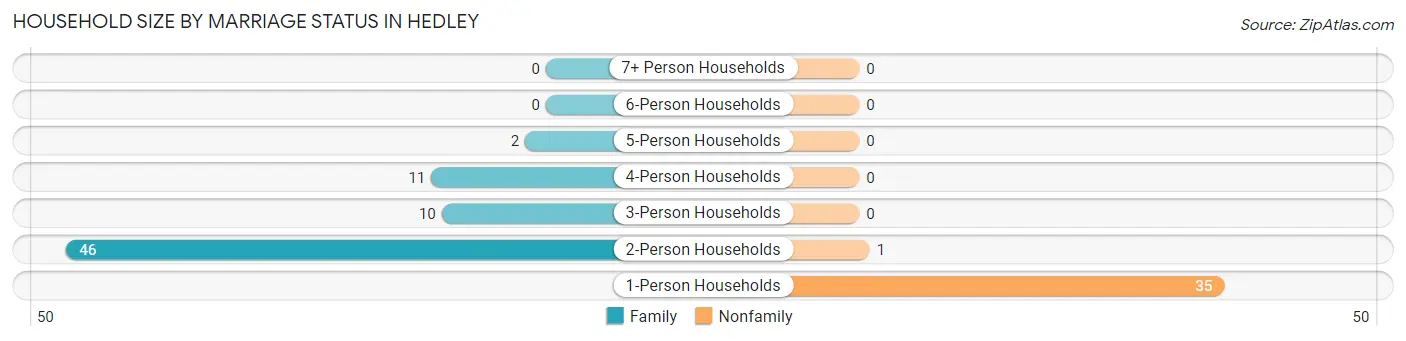
| Household Size | Family Households | Nonfamily Households |
| 1-Person Households | - | 35 (33.3%) |
| 2-Person Households | 46 (43.8%) | 1 (0.9%) |
| 3-Person Households | 10 (9.5%) | 0 (0.0%) |
| 4-Person Households | 11 (10.5%) | 0 (0.0%) |
| 5-Person Households | 2 (1.9%) | 0 (0.0%) |
| 6-Person Households | 0 (0.0%) | 0 (0.0%) |
| 7+ Person Households | 0 (0.0%) | 0 (0.0%) |
| Total | 69 (65.7%) | 36 (34.3%) |
Female Fertility in Hedley
Fertility by Age in Hedley
| Age Bracket | Women with Births | Births / 1,000 Women |
| 15 to 19 years | 0 (0.0%) | 0.0 |
| 20 to 34 years | 0 (0.0%) | 0.0 |
| 35 to 50 years | 0 (0.0%) | 0.0 |
| Total | 0 (0.0%) | 0.0 |
Fertility by Age by Marriage Status in Hedley
| Age Bracket | Married | Unmarried |
| 15 to 19 years | 0 (0.0%) | 0 (0.0%) |
| 20 to 34 years | 0 (0.0%) | 0 (0.0%) |
| 35 to 50 years | 0 (0.0%) | 0 (0.0%) |
| Total | 0 (0.0%) | 0 (0.0%) |
Fertility by Education in Hedley
| Educational Attainment | Women with Births | Births / 1,000 Women |
| Less than High School | 0 (0.0%) | 0.0 |
| High School Diploma | 0 (0.0%) | 0.0 |
| College or Associate's Degree | 0 (0.0%) | 0.0 |
| Bachelor's Degree | 0 (0.0%) | 0.0 |
| Graduate Degree | 0 (0.0%) | 0.0 |
| Total | 0 (0.0%) | 0.0 |
Fertility by Education by Marriage Status in Hedley
| Educational Attainment | Married | Unmarried |
| Less than High School | 0 (0.0%) | 0 (0.0%) |
| High School Diploma | 0 (0.0%) | 0 (0.0%) |
| College or Associate's Degree | 0 (0.0%) | 0 (0.0%) |
| Bachelor's Degree | 0 (0.0%) | 0 (0.0%) |
| Graduate Degree | 0 (0.0%) | 0 (0.0%) |
| Total | 0 (0.0%) | 0 (0.0%) |
Employment Characteristics in Hedley
Employment by Class of Employer in Hedley
Among the 146 employed individuals in Hedley, private company employees (87 | 59.6%), local government employees (24 | 16.4%), and not-for-profit organizations (14 | 9.6%) make up the most common classes of employment.
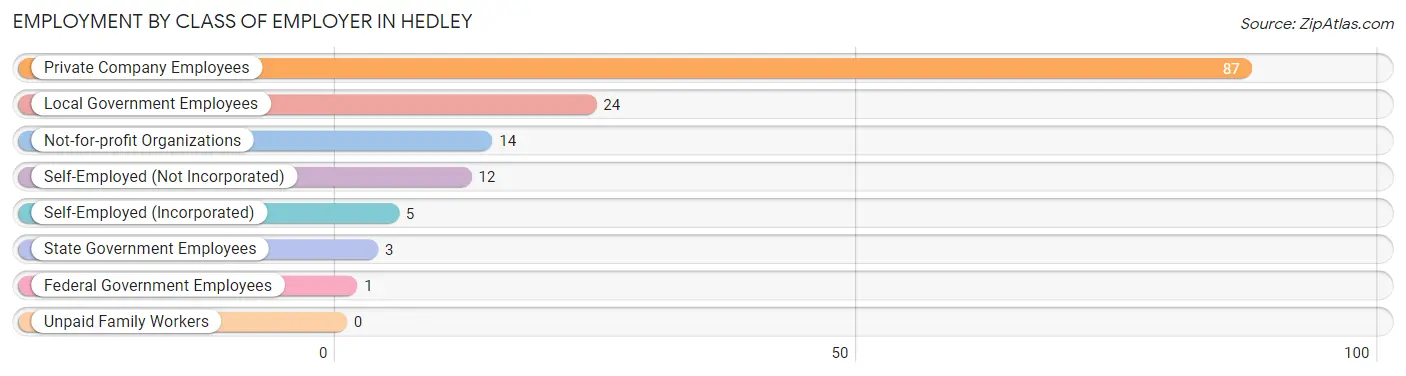
| Employer Class | # Employees | % Employees |
| Private Company Employees | 87 | 59.6% |
| Self-Employed (Incorporated) | 5 | 3.4% |
| Self-Employed (Not Incorporated) | 12 | 8.2% |
| Not-for-profit Organizations | 14 | 9.6% |
| Local Government Employees | 24 | 16.4% |
| State Government Employees | 3 | 2.1% |
| Federal Government Employees | 1 | 0.7% |
| Unpaid Family Workers | 0 | 0.0% |
| Total | 146 | 100.0% |
Employment Status by Age in Hedley
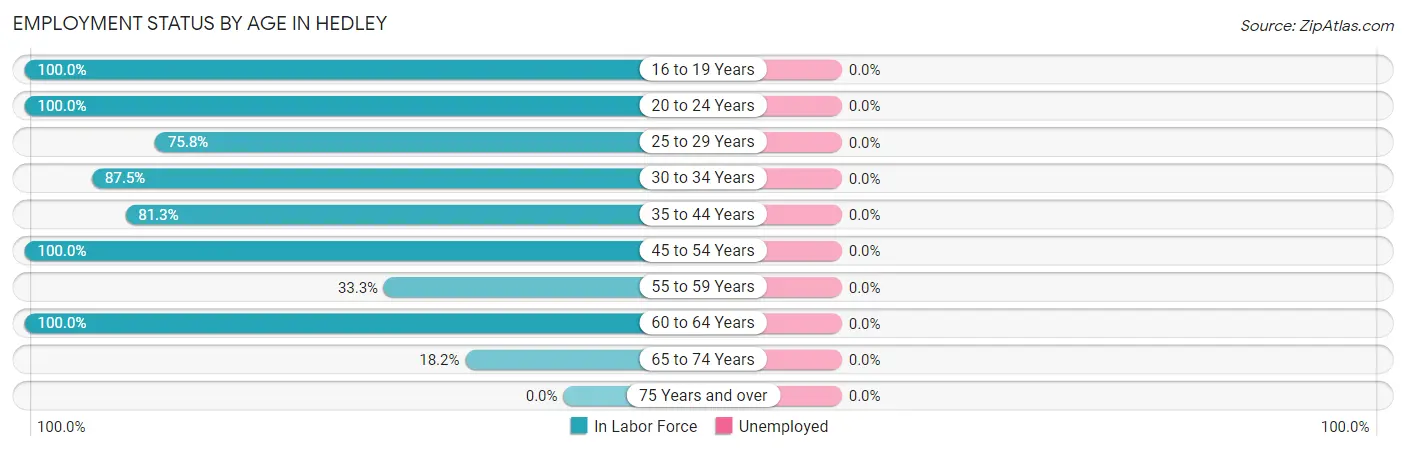
| Age Bracket | In Labor Force | Unemployed |
| 16 to 19 Years | 7 (100.0%) | 0 (0.0%) |
| 20 to 24 Years | 18 (100.0%) | 0 (0.0%) |
| 25 to 29 Years | 25 (75.8%) | 0 (0.0%) |
| 30 to 34 Years | 7 (87.5%) | 0 (0.0%) |
| 35 to 44 Years | 13 (81.3%) | 0 (0.0%) |
| 45 to 54 Years | 41 (100.0%) | 0 (0.0%) |
| 55 to 59 Years | 9 (33.3%) | 0 (0.0%) |
| 60 to 64 Years | 18 (100.0%) | 0 (0.0%) |
| 65 to 74 Years | 8 (18.2%) | 0 (0.0%) |
| 75 Years and over | 0 (0.0%) | 0 (0.0%) |
| Total | 146 (63.8%) | 0 (0.0%) |
Employment Status by Educational Attainment in Hedley
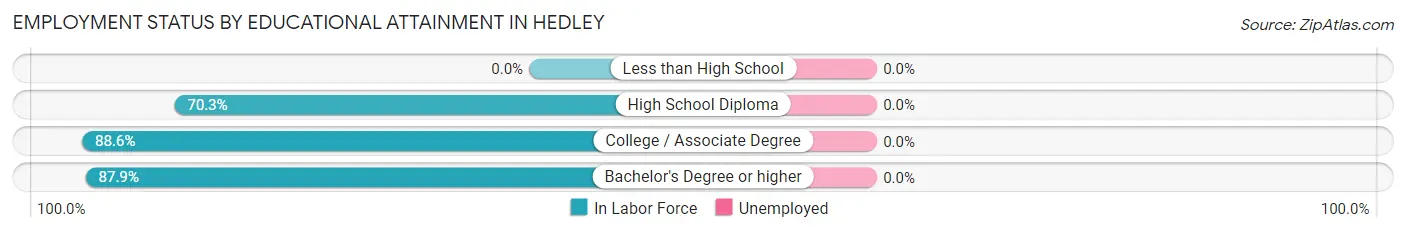
| Educational Attainment | In Labor Force | Unemployed |
| Less than High School | 0 (0.0%) | 0 (0.0%) |
| High School Diploma | 45 (70.3%) | 0 (0.0%) |
| College / Associate Degree | 39 (88.6%) | 0 (0.0%) |
| Bachelor's Degree or higher | 29 (87.9%) | 0 (0.0%) |
| Total | 113 (79.0%) | 0 (0.0%) |
Employment Occupations by Sex in Hedley
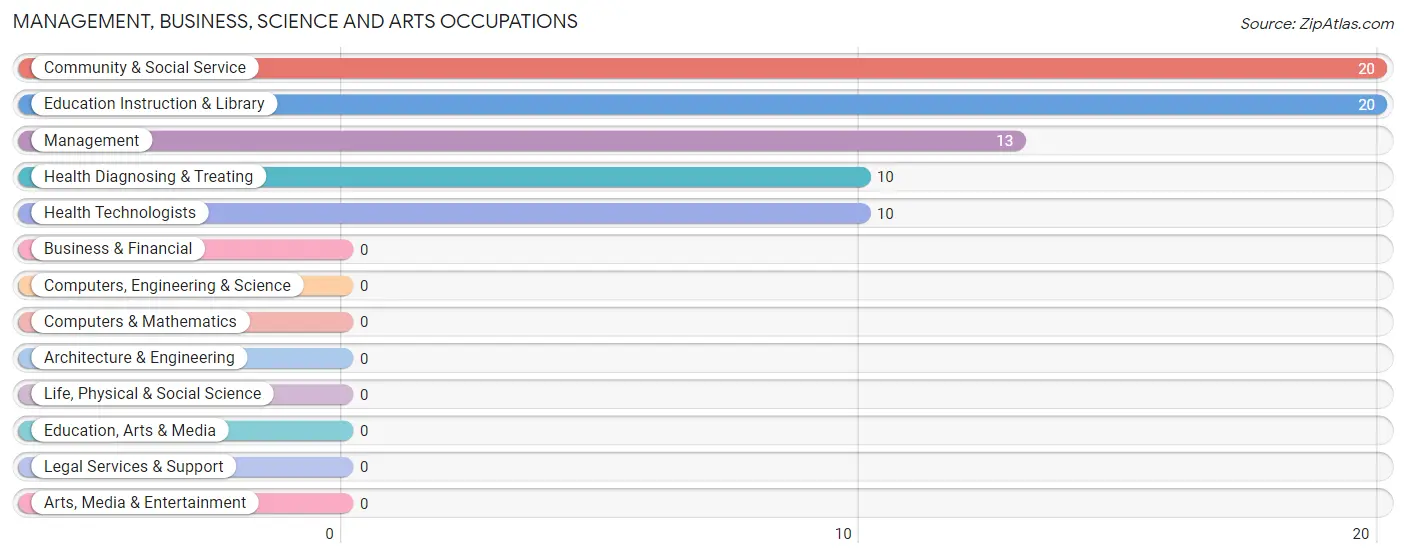
Management, Business, Science and Arts Occupations
The most common Management, Business, Science and Arts occupations in Hedley are Community & Social Service (20 | 13.7%), Education Instruction & Library (20 | 13.7%), Management (13 | 8.9%), Health Diagnosing & Treating (10 | 6.9%), and Health Technologists (10 | 6.9%).
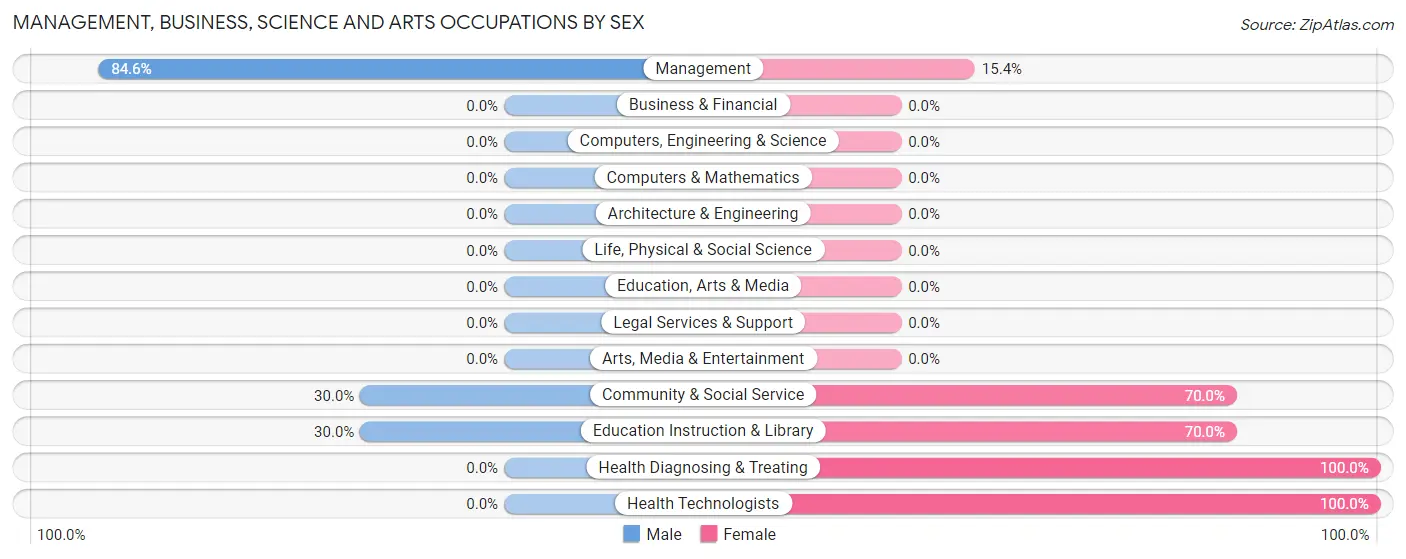
Management, Business, Science and Arts Occupations by Sex
Within the Management, Business, Science and Arts occupations in Hedley, the most male-oriented occupations are Management (84.6%), Community & Social Service (30.0%), and Education Instruction & Library (30.0%), while the most female-oriented occupations are Health Diagnosing & Treating (100.0%), Health Technologists (100.0%), and Community & Social Service (70.0%).
| Occupation | Male | Female |
| Management | 11 (84.6%) | 2 (15.4%) |
| Business & Financial | 0 (0.0%) | 0 (0.0%) |
| Computers, Engineering & Science | 0 (0.0%) | 0 (0.0%) |
| Computers & Mathematics | 0 (0.0%) | 0 (0.0%) |
| Architecture & Engineering | 0 (0.0%) | 0 (0.0%) |
| Life, Physical & Social Science | 0 (0.0%) | 0 (0.0%) |
| Community & Social Service | 6 (30.0%) | 14 (70.0%) |
| Education, Arts & Media | 0 (0.0%) | 0 (0.0%) |
| Legal Services & Support | 0 (0.0%) | 0 (0.0%) |
| Education Instruction & Library | 6 (30.0%) | 14 (70.0%) |
| Arts, Media & Entertainment | 0 (0.0%) | 0 (0.0%) |
| Health Diagnosing & Treating | 0 (0.0%) | 10 (100.0%) |
| Health Technologists | 0 (0.0%) | 10 (100.0%) |
| Total (Category) | 17 (39.5%) | 26 (60.5%) |
| Total (Overall) | 69 (47.3%) | 77 (52.7%) |
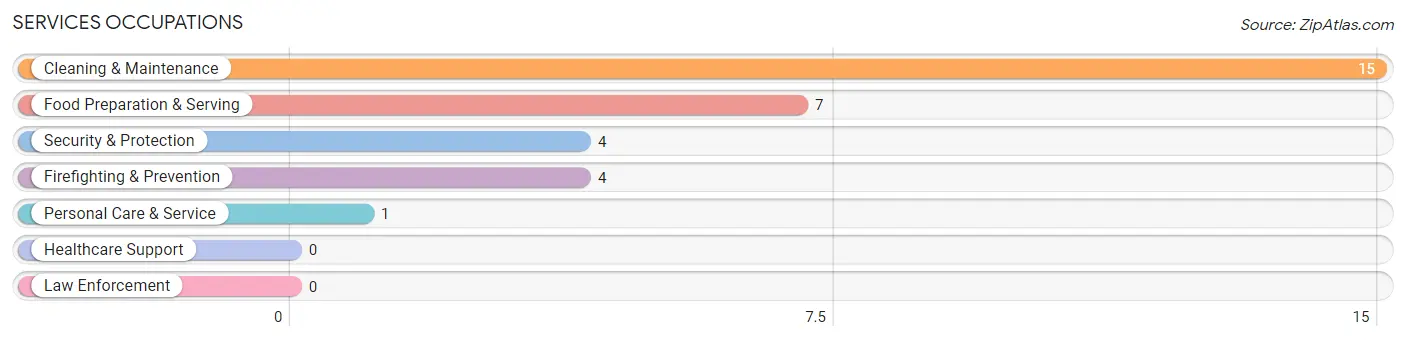
Services Occupations
The most common Services occupations in Hedley are Cleaning & Maintenance (15 | 10.3%), Food Preparation & Serving (7 | 4.8%), Security & Protection (4 | 2.7%), Firefighting & Prevention (4 | 2.7%), and Personal Care & Service (1 | 0.7%).
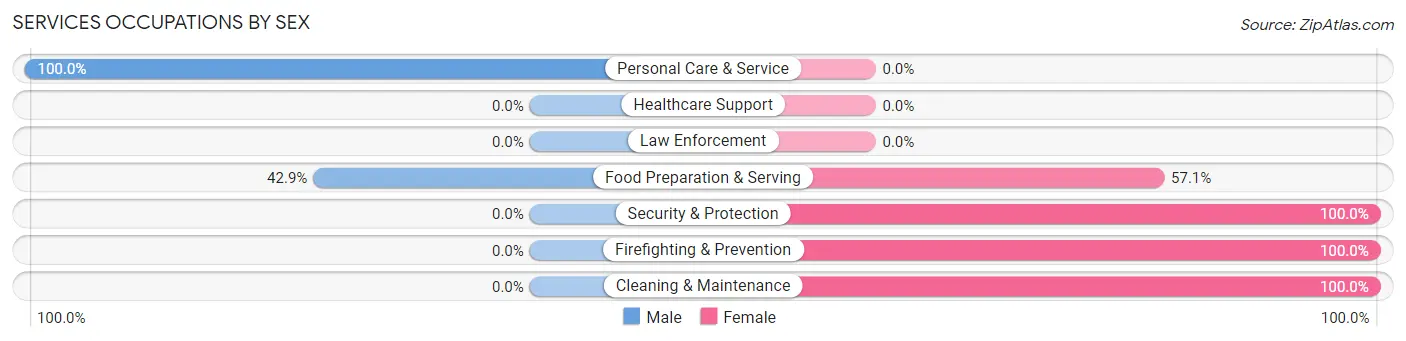
Services Occupations by Sex
Within the Services occupations in Hedley, the most male-oriented occupations are Personal Care & Service (100.0%), and Food Preparation & Serving (42.9%), while the most female-oriented occupations are Security & Protection (100.0%), Firefighting & Prevention (100.0%), and Cleaning & Maintenance (100.0%).
| Occupation | Male | Female |
| Healthcare Support | 0 (0.0%) | 0 (0.0%) |
| Security & Protection | 0 (0.0%) | 4 (100.0%) |
| Firefighting & Prevention | 0 (0.0%) | 4 (100.0%) |
| Law Enforcement | 0 (0.0%) | 0 (0.0%) |
| Food Preparation & Serving | 3 (42.9%) | 4 (57.1%) |
| Cleaning & Maintenance | 0 (0.0%) | 15 (100.0%) |
| Personal Care & Service | 1 (100.0%) | 0 (0.0%) |
| Total (Category) | 4 (14.8%) | 23 (85.2%) |
| Total (Overall) | 69 (47.3%) | 77 (52.7%) |
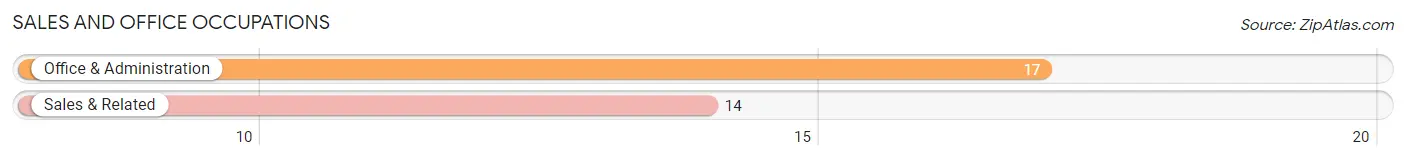
Sales and Office Occupations
The most common Sales and Office occupations in Hedley are Office & Administration (17 | 11.6%), and Sales & Related (14 | 9.6%).
Sales and Office Occupations by Sex
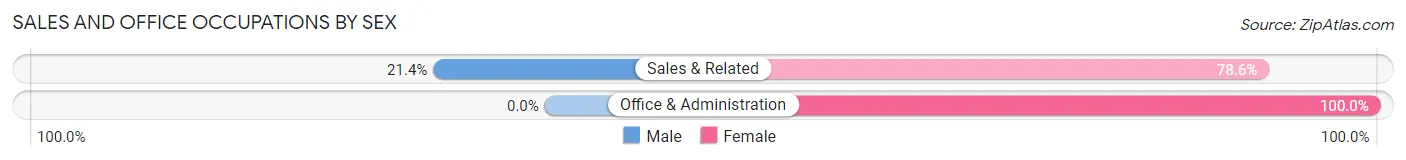
| Occupation | Male | Female |
| Sales & Related | 3 (21.4%) | 11 (78.6%) |
| Office & Administration | 0 (0.0%) | 17 (100.0%) |
| Total (Category) | 3 (9.7%) | 28 (90.3%) |
| Total (Overall) | 69 (47.3%) | 77 (52.7%) |
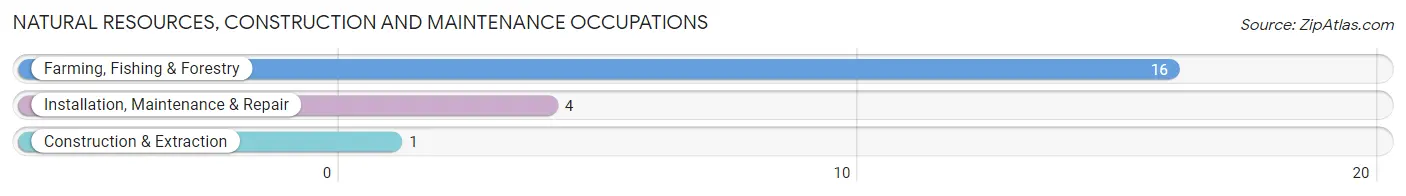
Natural Resources, Construction and Maintenance Occupations
The most common Natural Resources, Construction and Maintenance occupations in Hedley are Farming, Fishing & Forestry (16 | 11.0%), Installation, Maintenance & Repair (4 | 2.7%), and Construction & Extraction (1 | 0.7%).
Natural Resources, Construction and Maintenance Occupations by Sex
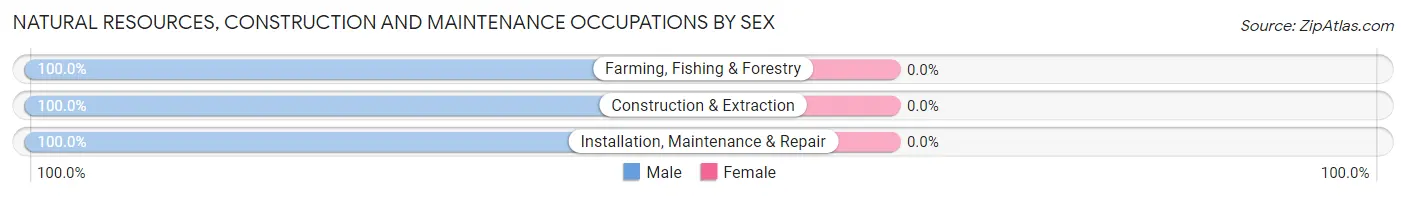
| Occupation | Male | Female |
| Farming, Fishing & Forestry | 16 (100.0%) | 0 (0.0%) |
| Construction & Extraction | 1 (100.0%) | 0 (0.0%) |
| Installation, Maintenance & Repair | 4 (100.0%) | 0 (0.0%) |
| Total (Category) | 21 (100.0%) | 0 (0.0%) |
| Total (Overall) | 69 (47.3%) | 77 (52.7%) |
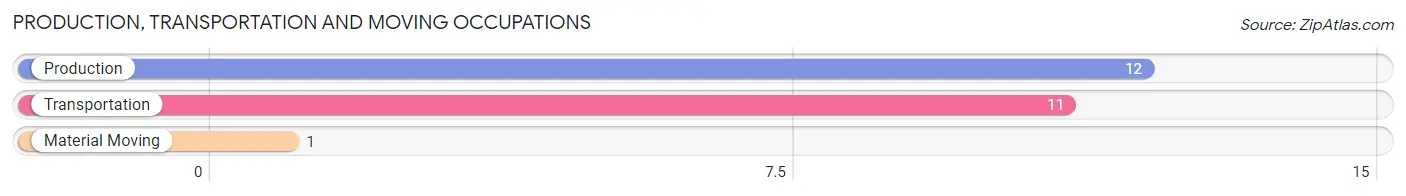
Production, Transportation and Moving Occupations
The most common Production, Transportation and Moving occupations in Hedley are Production (12 | 8.2%), Transportation (11 | 7.5%), and Material Moving (1 | 0.7%).
Production, Transportation and Moving Occupations by Sex
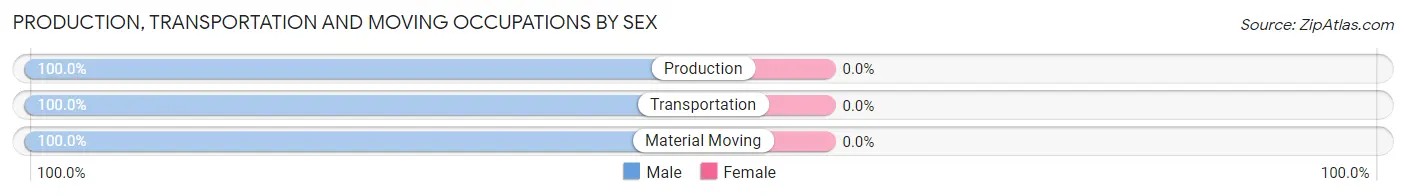
| Occupation | Male | Female |
| Production | 12 (100.0%) | 0 (0.0%) |
| Transportation | 11 (100.0%) | 0 (0.0%) |
| Material Moving | 1 (100.0%) | 0 (0.0%) |
| Total (Category) | 24 (100.0%) | 0 (0.0%) |
| Total (Overall) | 69 (47.3%) | 77 (52.7%) |
Employment Industries by Sex in Hedley
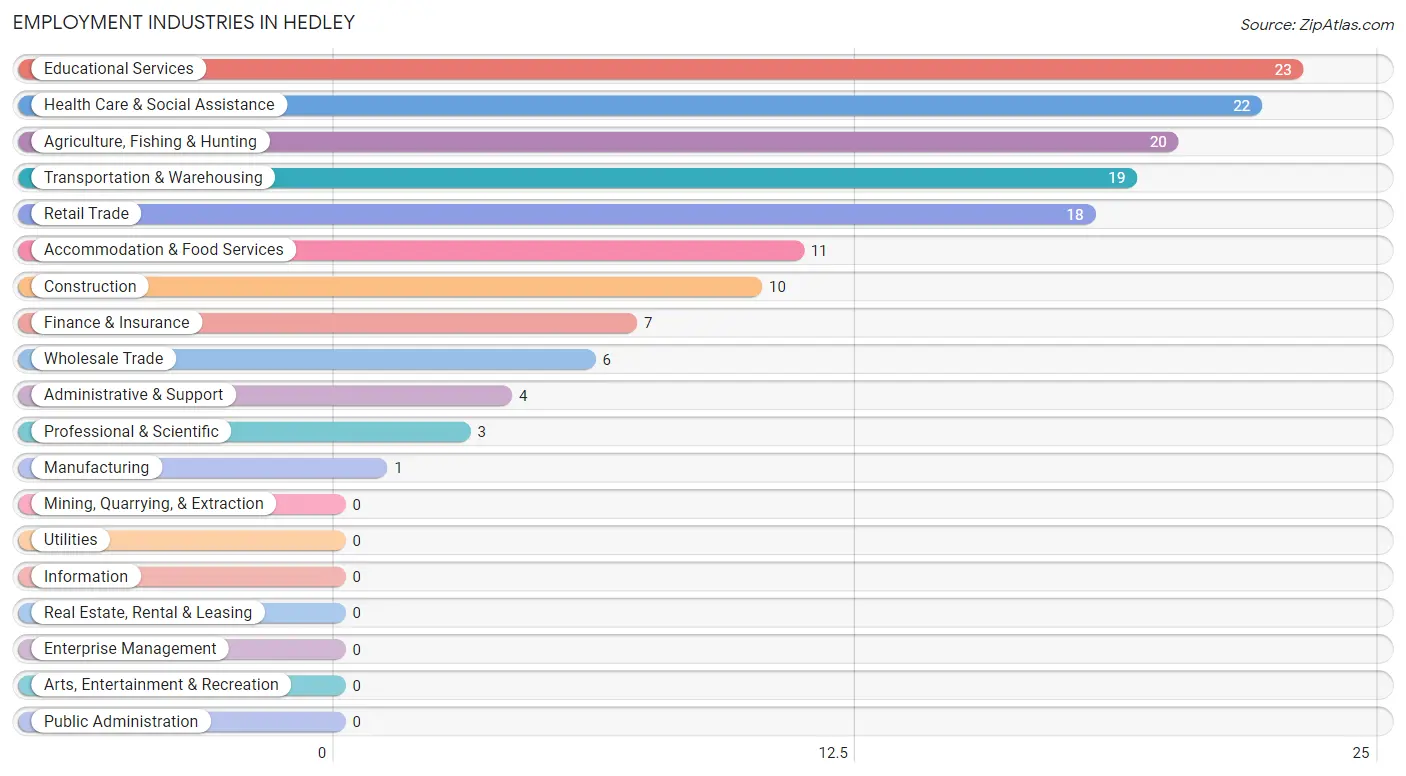
Employment Industries in Hedley
The major employment industries in Hedley include Educational Services (23 | 15.8%), Health Care & Social Assistance (22 | 15.1%), Agriculture, Fishing & Hunting (20 | 13.7%), Transportation & Warehousing (19 | 13.0%), and Retail Trade (18 | 12.3%).
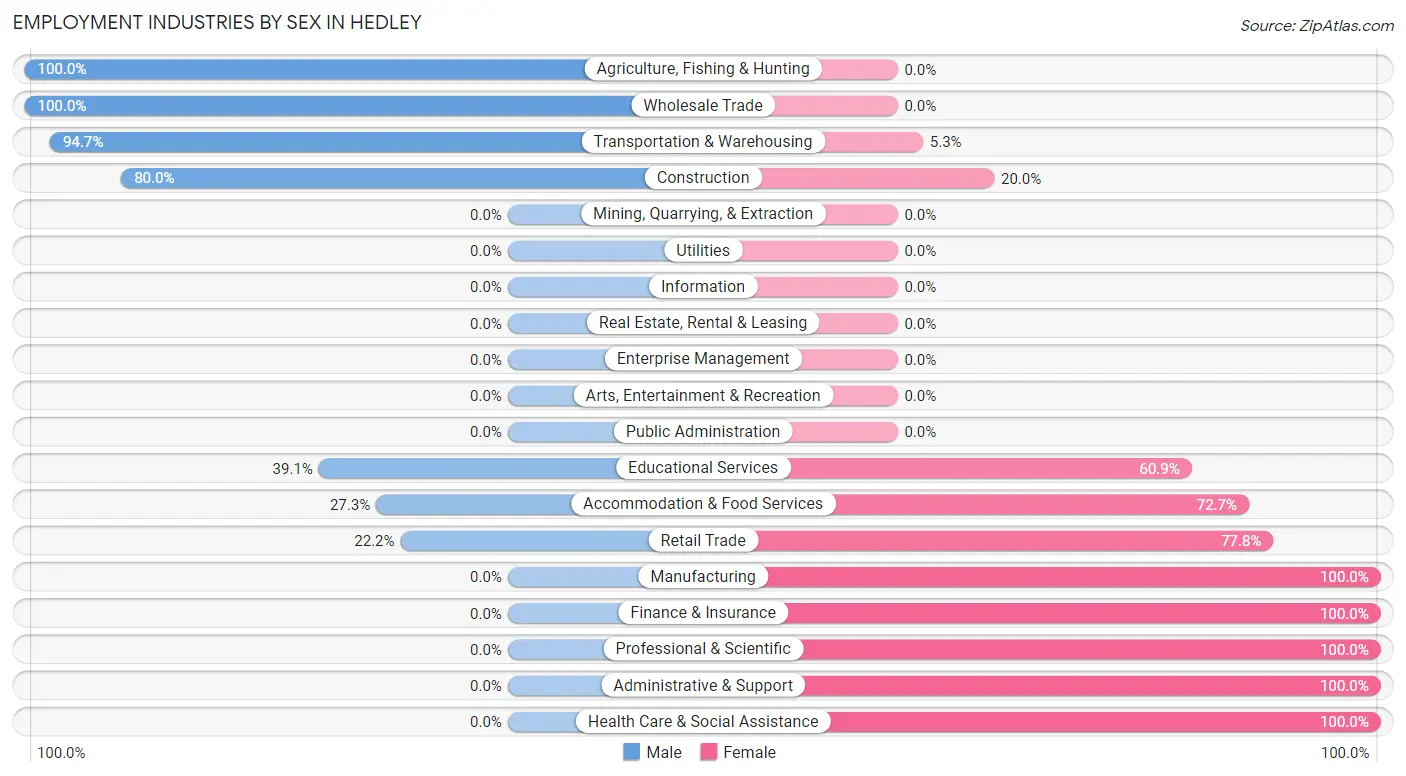
Employment Industries by Sex in Hedley
The Hedley industries that see more men than women are Agriculture, Fishing & Hunting (100.0%), Wholesale Trade (100.0%), and Transportation & Warehousing (94.7%), whereas the industries that tend to have a higher number of women are Manufacturing (100.0%), Finance & Insurance (100.0%), and Professional & Scientific (100.0%).
| Industry | Male | Female |
| Agriculture, Fishing & Hunting | 20 (100.0%) | 0 (0.0%) |
| Mining, Quarrying, & Extraction | 0 (0.0%) | 0 (0.0%) |
| Construction | 8 (80.0%) | 2 (20.0%) |
| Manufacturing | 0 (0.0%) | 1 (100.0%) |
| Wholesale Trade | 6 (100.0%) | 0 (0.0%) |
| Retail Trade | 4 (22.2%) | 14 (77.8%) |
| Transportation & Warehousing | 18 (94.7%) | 1 (5.3%) |
| Utilities | 0 (0.0%) | 0 (0.0%) |
| Information | 0 (0.0%) | 0 (0.0%) |
| Finance & Insurance | 0 (0.0%) | 7 (100.0%) |
| Real Estate, Rental & Leasing | 0 (0.0%) | 0 (0.0%) |
| Professional & Scientific | 0 (0.0%) | 3 (100.0%) |
| Enterprise Management | 0 (0.0%) | 0 (0.0%) |
| Administrative & Support | 0 (0.0%) | 4 (100.0%) |
| Educational Services | 9 (39.1%) | 14 (60.9%) |
| Health Care & Social Assistance | 0 (0.0%) | 22 (100.0%) |
| Arts, Entertainment & Recreation | 0 (0.0%) | 0 (0.0%) |
| Accommodation & Food Services | 3 (27.3%) | 8 (72.7%) |
| Public Administration | 0 (0.0%) | 0 (0.0%) |
| Total | 69 (47.3%) | 77 (52.7%) |
Education in Hedley
School Enrollment in Hedley
The most common levels of schooling among the 39 students in Hedley are college / undergraduate (13 | 33.3%), high school (8 | 20.5%), and graduate / professional (7 | 17.9%).
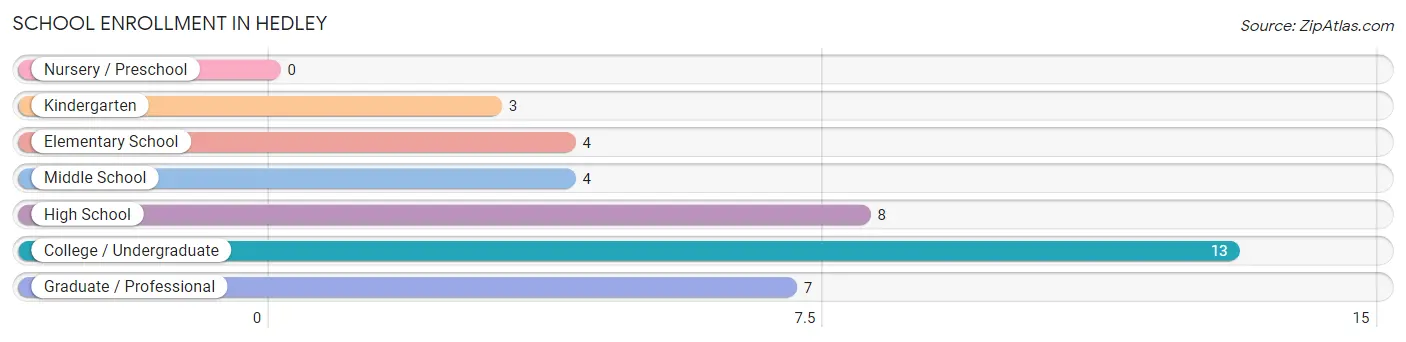
| School Level | # Students | % Students |
| Nursery / Preschool | 0 | 0.0% |
| Kindergarten | 3 | 7.7% |
| Elementary School | 4 | 10.3% |
| Middle School | 4 | 10.3% |
| High School | 8 | 20.5% |
| College / Undergraduate | 13 | 33.3% |
| Graduate / Professional | 7 | 17.9% |
| Total | 39 | 100.0% |
School Enrollment by Age by Funding Source in Hedley
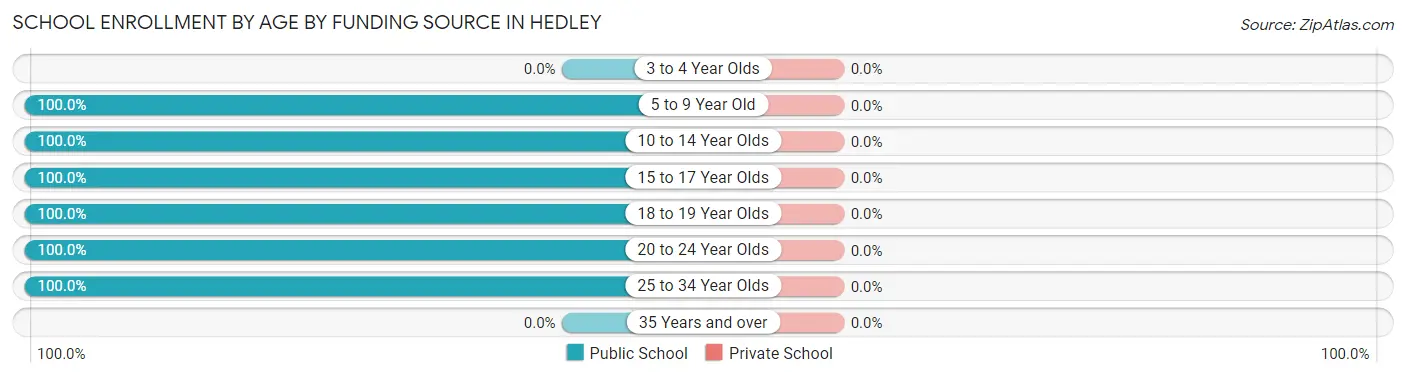
| Age Bracket | Public School | Private School |
| 3 to 4 Year Olds | 0 (0.0%) | 0 (0.0%) |
| 5 to 9 Year Old | 7 (100.0%) | 0 (0.0%) |
| 10 to 14 Year Olds | 4 (100.0%) | 0 (0.0%) |
| 15 to 17 Year Olds | 8 (100.0%) | 0 (0.0%) |
| 18 to 19 Year Olds | 4 (100.0%) | 0 (0.0%) |
| 20 to 24 Year Olds | 7 (100.0%) | 0 (0.0%) |
| 25 to 34 Year Olds | 9 (100.0%) | 0 (0.0%) |
| 35 Years and over | 0 (0.0%) | 0 (0.0%) |
| Total | 39 (100.0%) | 0 (0.0%) |
Educational Attainment by Field of Study in Hedley
Science & technology (14 | 25.5%), education (12 | 21.8%), business (8 | 14.5%), liberal arts & history (7 | 12.7%), and social sciences (6 | 10.9%) are the most common fields of study among 55 individuals in Hedley who have obtained a bachelor's degree or higher.
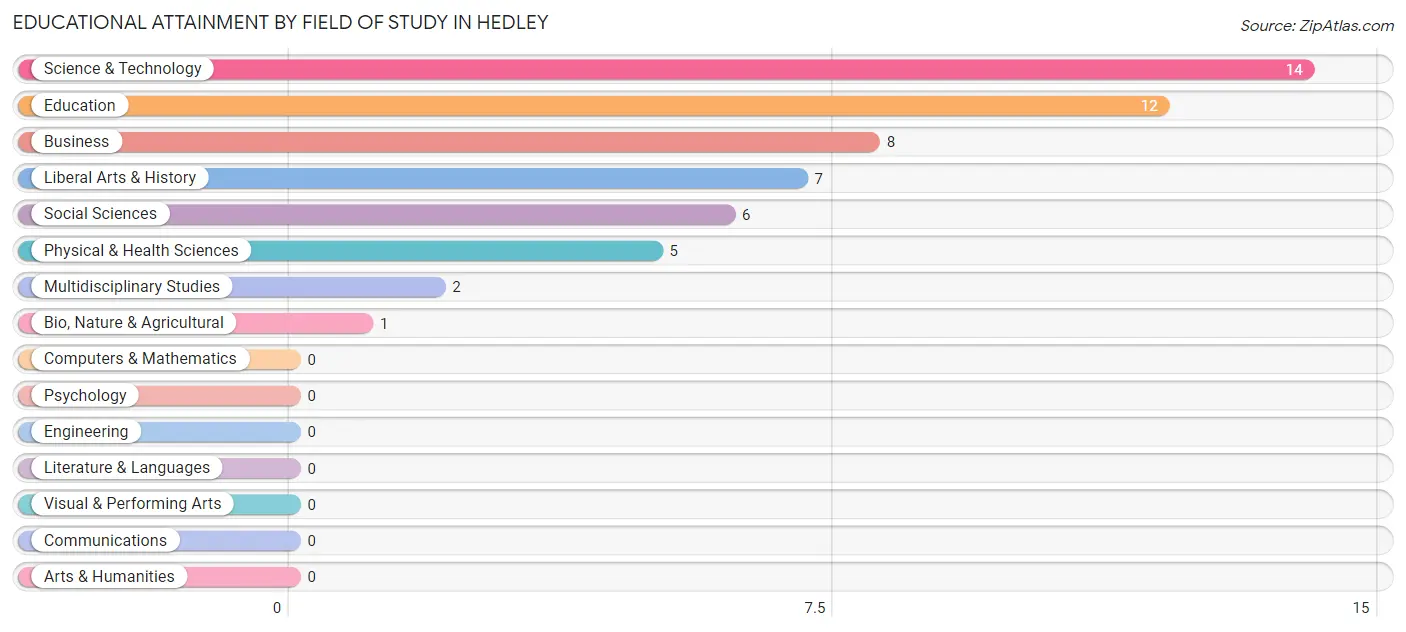
| Field of Study | # Graduates | % Graduates |
| Computers & Mathematics | 0 | 0.0% |
| Bio, Nature & Agricultural | 1 | 1.8% |
| Physical & Health Sciences | 5 | 9.1% |
| Psychology | 0 | 0.0% |
| Social Sciences | 6 | 10.9% |
| Engineering | 0 | 0.0% |
| Multidisciplinary Studies | 2 | 3.6% |
| Science & Technology | 14 | 25.5% |
| Business | 8 | 14.5% |
| Education | 12 | 21.8% |
| Literature & Languages | 0 | 0.0% |
| Liberal Arts & History | 7 | 12.7% |
| Visual & Performing Arts | 0 | 0.0% |
| Communications | 0 | 0.0% |
| Arts & Humanities | 0 | 0.0% |
| Total | 55 | 100.0% |
Transportation & Commute in Hedley
Vehicle Availability by Sex in Hedley
The most prevalent vehicle ownership categories in Hedley are males with 3 vehicles (31, accounting for 44.9%) and females with 3 vehicles (24, making up 40.3%).
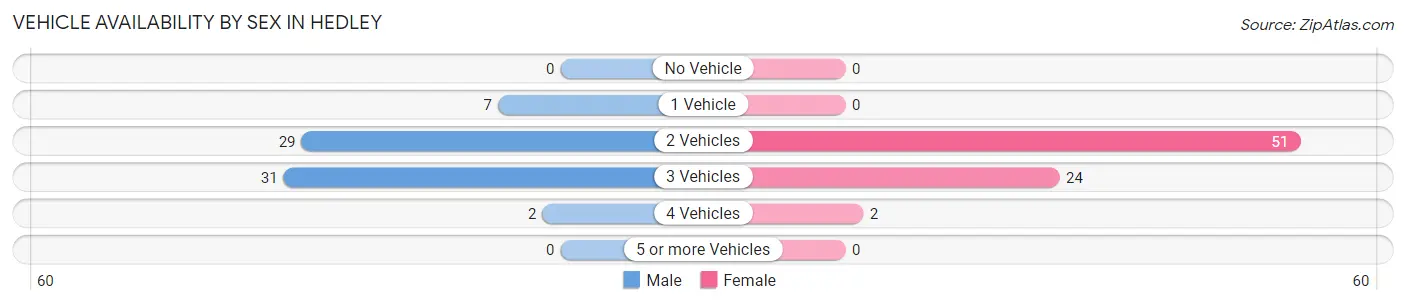
| Vehicles Available | Male | Female |
| No Vehicle | 0 (0.0%) | 0 (0.0%) |
| 1 Vehicle | 7 (10.1%) | 0 (0.0%) |
| 2 Vehicles | 29 (42.0%) | 51 (66.2%) |
| 3 Vehicles | 31 (44.9%) | 24 (31.2%) |
| 4 Vehicles | 2 (2.9%) | 2 (2.6%) |
| 5 or more Vehicles | 0 (0.0%) | 0 (0.0%) |
| Total | 69 (100.0%) | 77 (100.0%) |
Commute Time in Hedley
The most frequently occuring commute durations in Hedley are 15 to 19 minutes (40 commuters, 29.4%), less than 5 minutes (26 commuters, 19.1%), and 20 to 24 minutes (20 commuters, 14.7%).
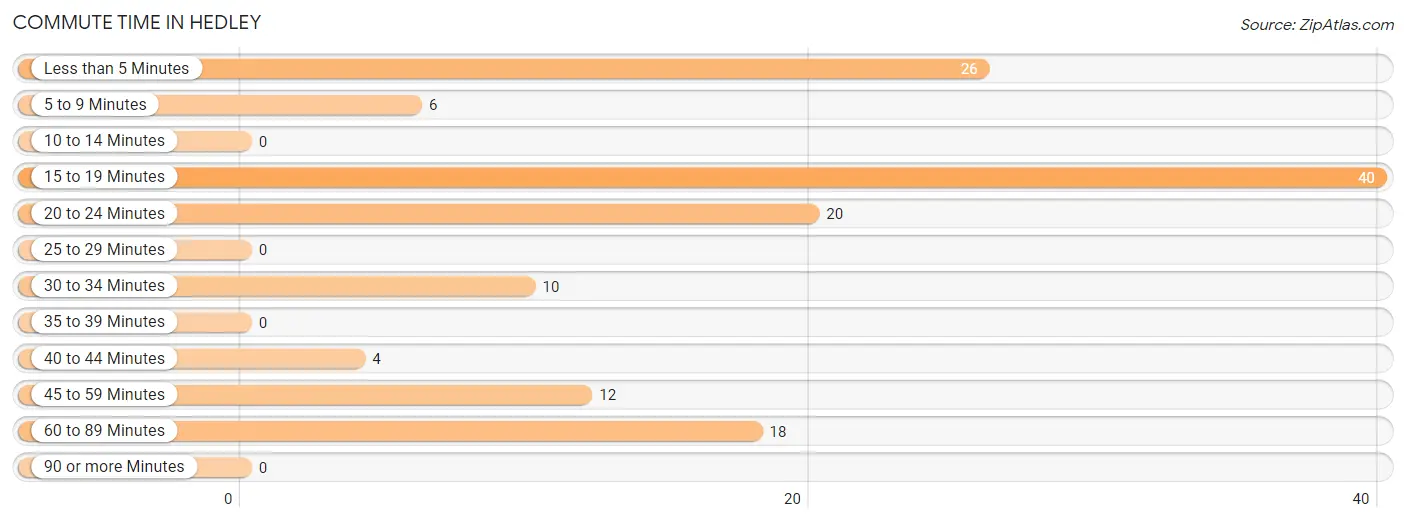
| Commute Time | # Commuters | % Commuters |
| Less than 5 Minutes | 26 | 19.1% |
| 5 to 9 Minutes | 6 | 4.4% |
| 10 to 14 Minutes | 0 | 0.0% |
| 15 to 19 Minutes | 40 | 29.4% |
| 20 to 24 Minutes | 20 | 14.7% |
| 25 to 29 Minutes | 0 | 0.0% |
| 30 to 34 Minutes | 10 | 7.3% |
| 35 to 39 Minutes | 0 | 0.0% |
| 40 to 44 Minutes | 4 | 2.9% |
| 45 to 59 Minutes | 12 | 8.8% |
| 60 to 89 Minutes | 18 | 13.2% |
| 90 or more Minutes | 0 | 0.0% |
Commute Time by Sex in Hedley
The most common commute times in Hedley are 15 to 19 minutes (12 commuters, 20.3%) for males and 15 to 19 minutes (28 commuters, 36.4%) for females.
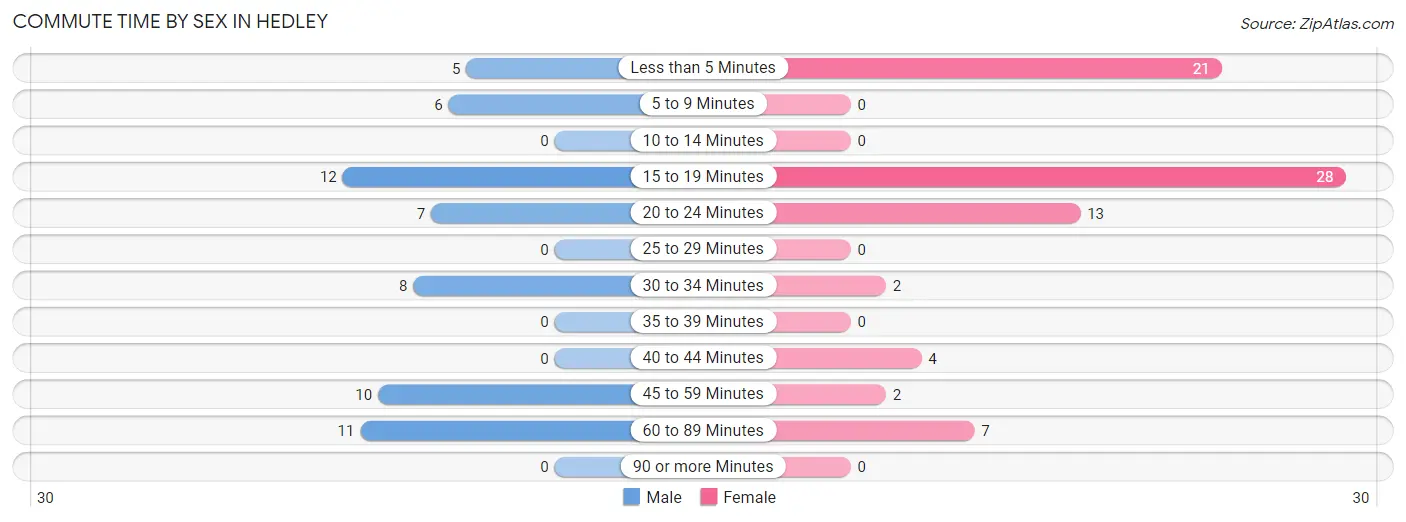
| Commute Time | Male | Female |
| Less than 5 Minutes | 5 (8.5%) | 21 (27.3%) |
| 5 to 9 Minutes | 6 (10.2%) | 0 (0.0%) |
| 10 to 14 Minutes | 0 (0.0%) | 0 (0.0%) |
| 15 to 19 Minutes | 12 (20.3%) | 28 (36.4%) |
| 20 to 24 Minutes | 7 (11.9%) | 13 (16.9%) |
| 25 to 29 Minutes | 0 (0.0%) | 0 (0.0%) |
| 30 to 34 Minutes | 8 (13.6%) | 2 (2.6%) |
| 35 to 39 Minutes | 0 (0.0%) | 0 (0.0%) |
| 40 to 44 Minutes | 0 (0.0%) | 4 (5.2%) |
| 45 to 59 Minutes | 10 (17.0%) | 2 (2.6%) |
| 60 to 89 Minutes | 11 (18.6%) | 7 (9.1%) |
| 90 or more Minutes | 0 (0.0%) | 0 (0.0%) |
Time of Departure to Work by Sex in Hedley
The most frequent times of departure to work in Hedley are 7:00 AM to 7:29 AM (15, 25.4%) for males and 8:00 AM to 8:29 AM (21, 27.3%) for females.
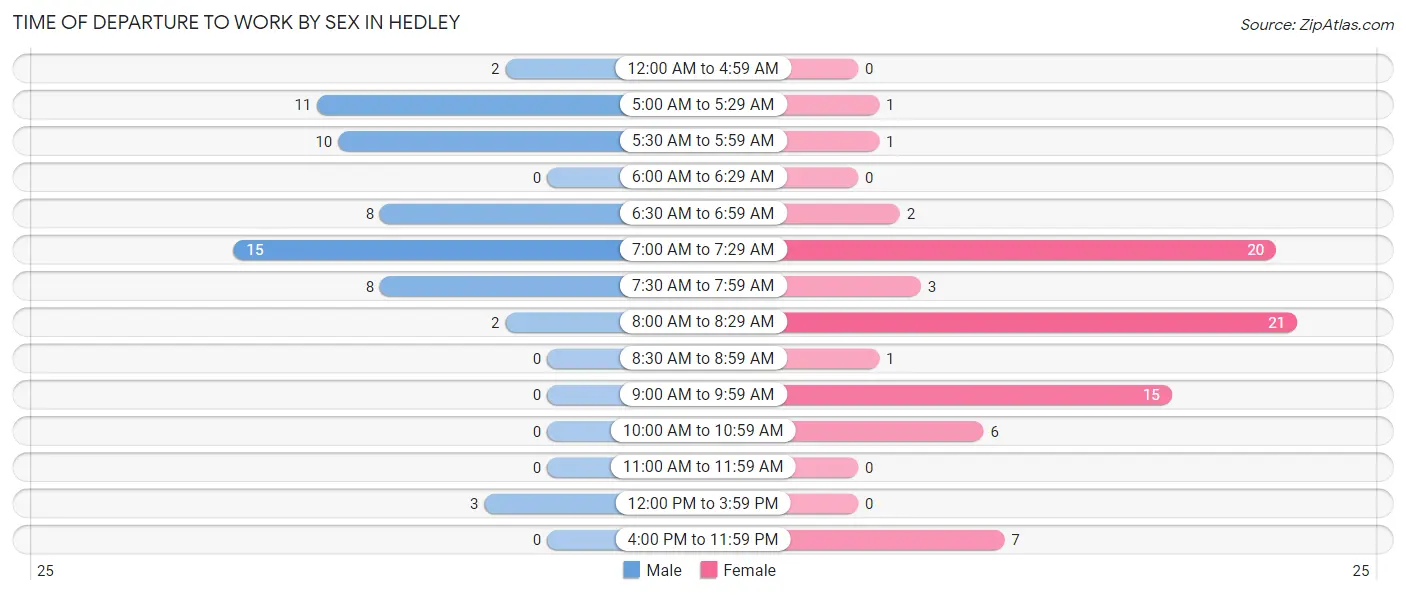
| Time of Departure | Male | Female |
| 12:00 AM to 4:59 AM | 2 (3.4%) | 0 (0.0%) |
| 5:00 AM to 5:29 AM | 11 (18.6%) | 1 (1.3%) |
| 5:30 AM to 5:59 AM | 10 (17.0%) | 1 (1.3%) |
| 6:00 AM to 6:29 AM | 0 (0.0%) | 0 (0.0%) |
| 6:30 AM to 6:59 AM | 8 (13.6%) | 2 (2.6%) |
| 7:00 AM to 7:29 AM | 15 (25.4%) | 20 (26.0%) |
| 7:30 AM to 7:59 AM | 8 (13.6%) | 3 (3.9%) |
| 8:00 AM to 8:29 AM | 2 (3.4%) | 21 (27.3%) |
| 8:30 AM to 8:59 AM | 0 (0.0%) | 1 (1.3%) |
| 9:00 AM to 9:59 AM | 0 (0.0%) | 15 (19.5%) |
| 10:00 AM to 10:59 AM | 0 (0.0%) | 6 (7.8%) |
| 11:00 AM to 11:59 AM | 0 (0.0%) | 0 (0.0%) |
| 12:00 PM to 3:59 PM | 3 (5.1%) | 0 (0.0%) |
| 4:00 PM to 11:59 PM | 0 (0.0%) | 7 (9.1%) |
| Total | 59 (100.0%) | 77 (100.0%) |
Housing Occupancy in Hedley
Occupancy by Ownership in Hedley
Of the total 105 dwellings in Hedley, owner-occupied units account for 92 (87.6%), while renter-occupied units make up 13 (12.4%).
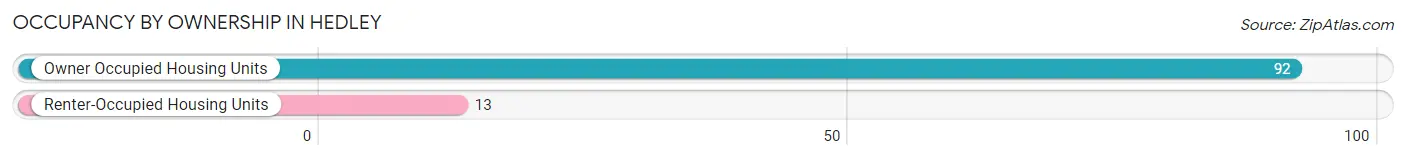
| Occupancy | # Housing Units | % Housing Units |
| Owner Occupied Housing Units | 92 | 87.6% |
| Renter-Occupied Housing Units | 13 | 12.4% |
| Total Occupied Housing Units | 105 | 100.0% |
Occupancy by Household Size in Hedley
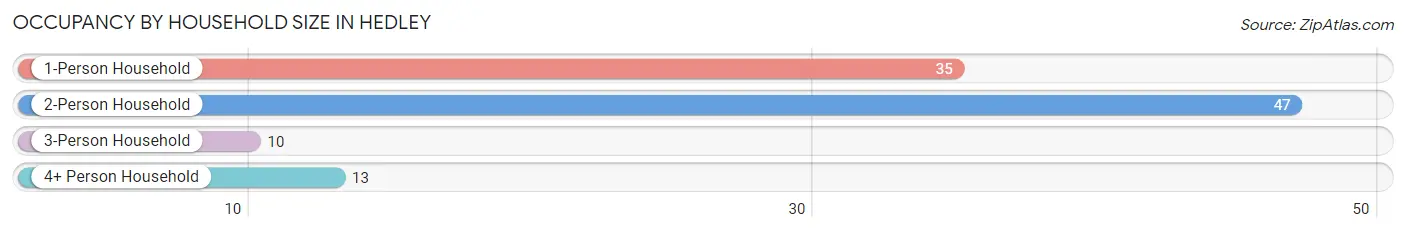
| Household Size | # Housing Units | % Housing Units |
| 1-Person Household | 35 | 33.3% |
| 2-Person Household | 47 | 44.8% |
| 3-Person Household | 10 | 9.5% |
| 4+ Person Household | 13 | 12.4% |
| Total Housing Units | 105 | 100.0% |
Occupancy by Ownership by Household Size in Hedley
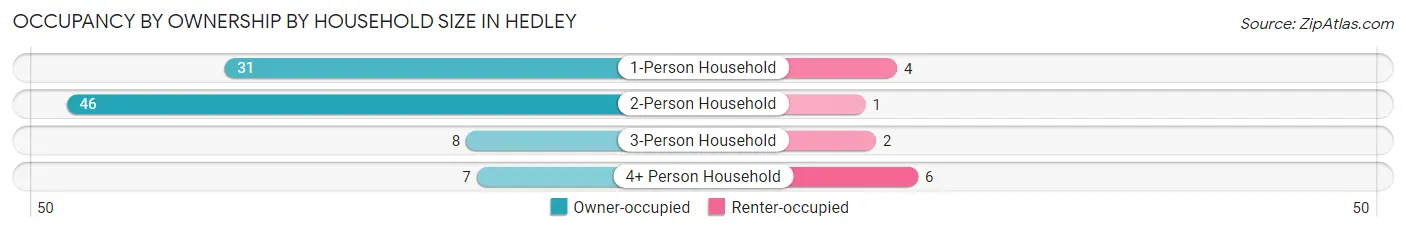
| Household Size | Owner-occupied | Renter-occupied |
| 1-Person Household | 31 (88.6%) | 4 (11.4%) |
| 2-Person Household | 46 (97.9%) | 1 (2.1%) |
| 3-Person Household | 8 (80.0%) | 2 (20.0%) |
| 4+ Person Household | 7 (53.8%) | 6 (46.2%) |
| Total Housing Units | 92 (87.6%) | 13 (12.4%) |
Occupancy by Educational Attainment in Hedley
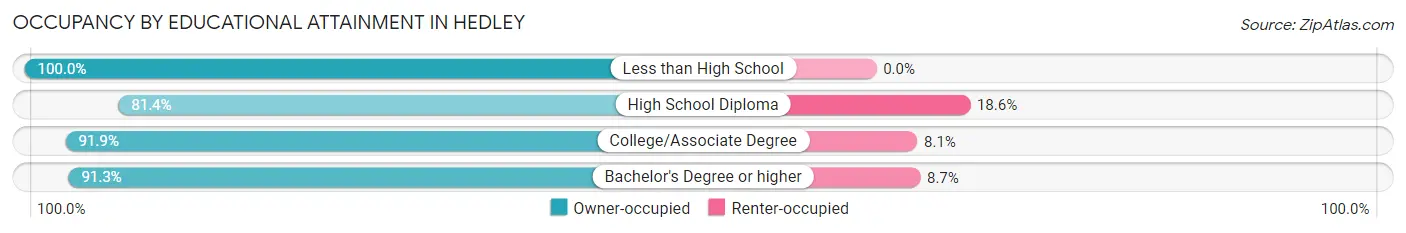
| Household Size | Owner-occupied | Renter-occupied |
| Less than High School | 2 (100.0%) | 0 (0.0%) |
| High School Diploma | 35 (81.4%) | 8 (18.6%) |
| College/Associate Degree | 34 (91.9%) | 3 (8.1%) |
| Bachelor's Degree or higher | 21 (91.3%) | 2 (8.7%) |
Occupancy by Age of Householder in Hedley
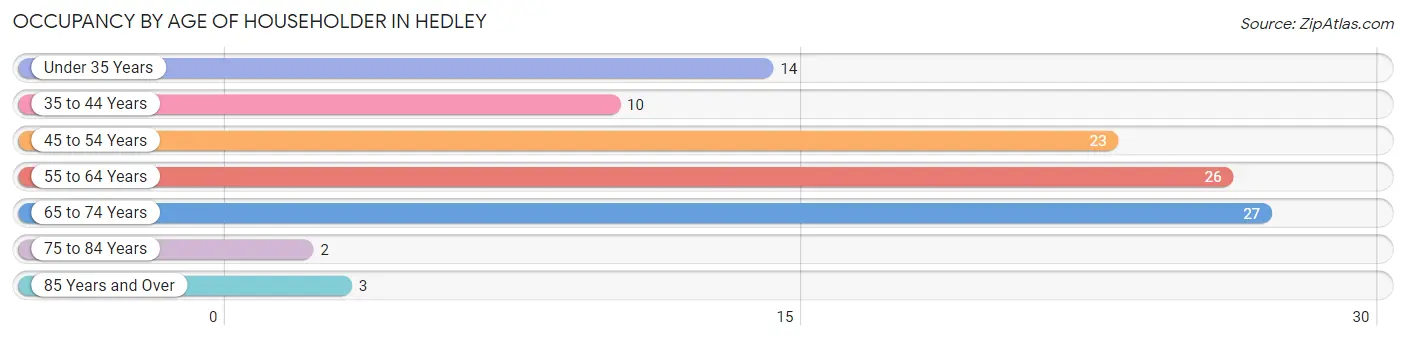
| Age Bracket | # Households | % Households |
| Under 35 Years | 14 | 13.3% |
| 35 to 44 Years | 10 | 9.5% |
| 45 to 54 Years | 23 | 21.9% |
| 55 to 64 Years | 26 | 24.8% |
| 65 to 74 Years | 27 | 25.7% |
| 75 to 84 Years | 2 | 1.9% |
| 85 Years and Over | 3 | 2.9% |
| Total | 105 | 100.0% |
Housing Finances in Hedley
Median Income by Occupancy in Hedley
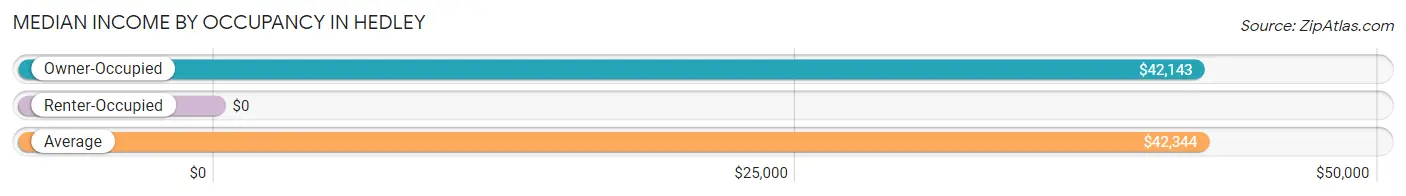
| Occupancy Type | # Households | Median Income |
| Owner-Occupied | 92 (87.6%) | $42,143 |
| Renter-Occupied | 13 (12.4%) | $0 |
| Average | 105 (100.0%) | $42,344 |
Occupancy by Householder Income Bracket in Hedley
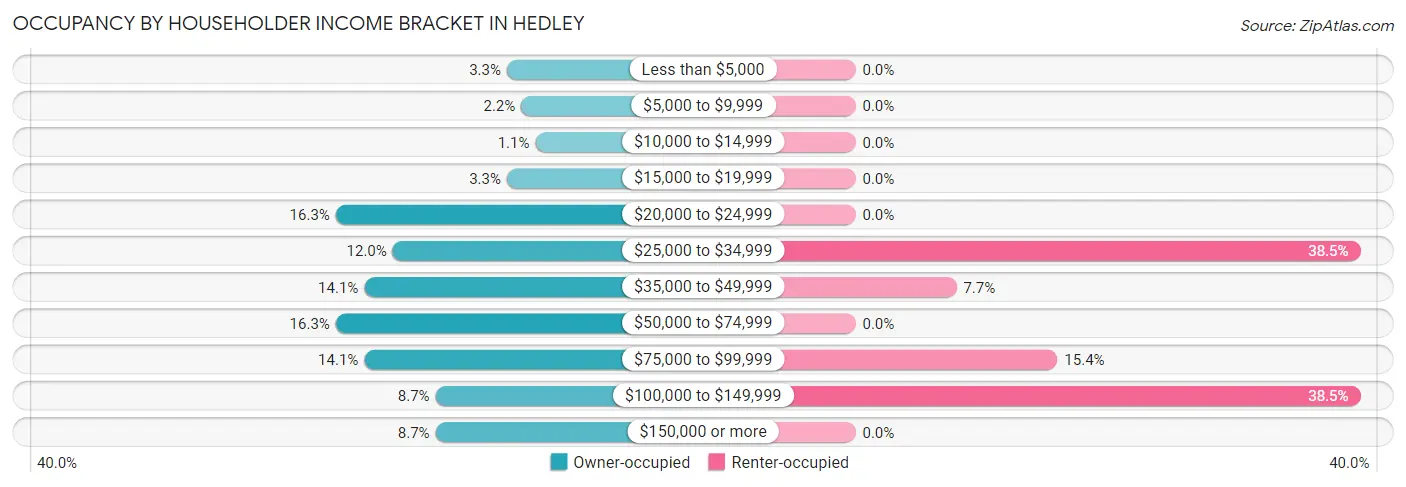
| Income Bracket | Owner-occupied | Renter-occupied |
| Less than $5,000 | 3 (3.3%) | 0 (0.0%) |
| $5,000 to $9,999 | 2 (2.2%) | 0 (0.0%) |
| $10,000 to $14,999 | 1 (1.1%) | 0 (0.0%) |
| $15,000 to $19,999 | 3 (3.3%) | 0 (0.0%) |
| $20,000 to $24,999 | 15 (16.3%) | 0 (0.0%) |
| $25,000 to $34,999 | 11 (12.0%) | 5 (38.5%) |
| $35,000 to $49,999 | 13 (14.1%) | 1 (7.7%) |
| $50,000 to $74,999 | 15 (16.3%) | 0 (0.0%) |
| $75,000 to $99,999 | 13 (14.1%) | 2 (15.4%) |
| $100,000 to $149,999 | 8 (8.7%) | 5 (38.5%) |
| $150,000 or more | 8 (8.7%) | 0 (0.0%) |
| Total | 92 (100.0%) | 13 (100.0%) |
Monthly Housing Cost Tiers in Hedley
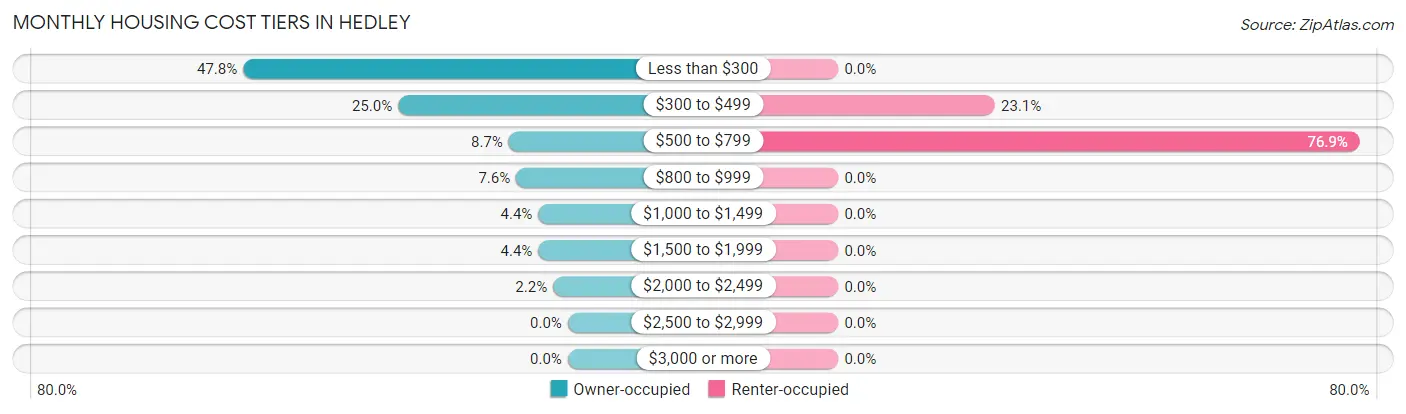
| Monthly Cost | Owner-occupied | Renter-occupied |
| Less than $300 | 44 (47.8%) | 0 (0.0%) |
| $300 to $499 | 23 (25.0%) | 3 (23.1%) |
| $500 to $799 | 8 (8.7%) | 10 (76.9%) |
| $800 to $999 | 7 (7.6%) | 0 (0.0%) |
| $1,000 to $1,499 | 4 (4.3%) | 0 (0.0%) |
| $1,500 to $1,999 | 4 (4.3%) | 0 (0.0%) |
| $2,000 to $2,499 | 2 (2.2%) | 0 (0.0%) |
| $2,500 to $2,999 | 0 (0.0%) | 0 (0.0%) |
| $3,000 or more | 0 (0.0%) | 0 (0.0%) |
| Total | 92 (100.0%) | 13 (100.0%) |
Physical Housing Characteristics in Hedley
Housing Structures in Hedley
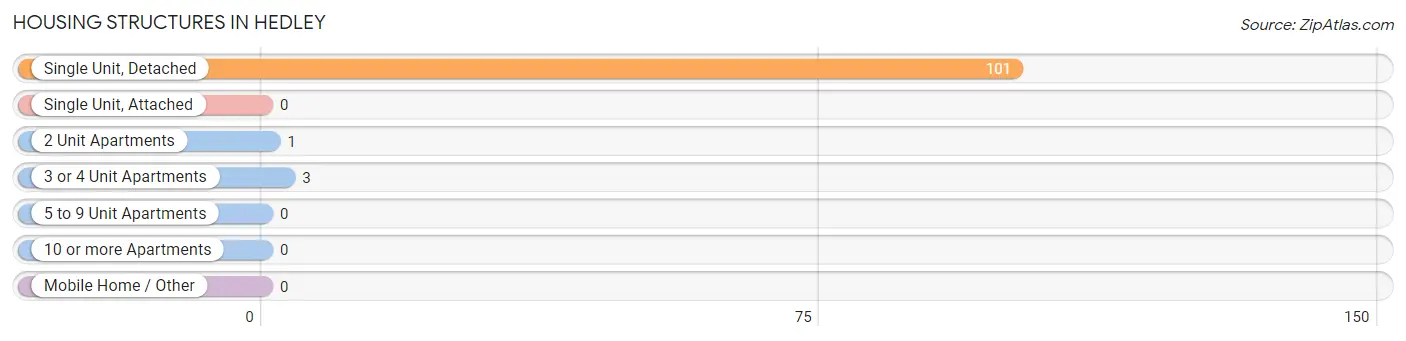
| Structure Type | # Housing Units | % Housing Units |
| Single Unit, Detached | 101 | 96.2% |
| Single Unit, Attached | 0 | 0.0% |
| 2 Unit Apartments | 1 | 0.9% |
| 3 or 4 Unit Apartments | 3 | 2.9% |
| 5 to 9 Unit Apartments | 0 | 0.0% |
| 10 or more Apartments | 0 | 0.0% |
| Mobile Home / Other | 0 | 0.0% |
| Total | 105 | 100.0% |
Housing Structures by Occupancy in Hedley
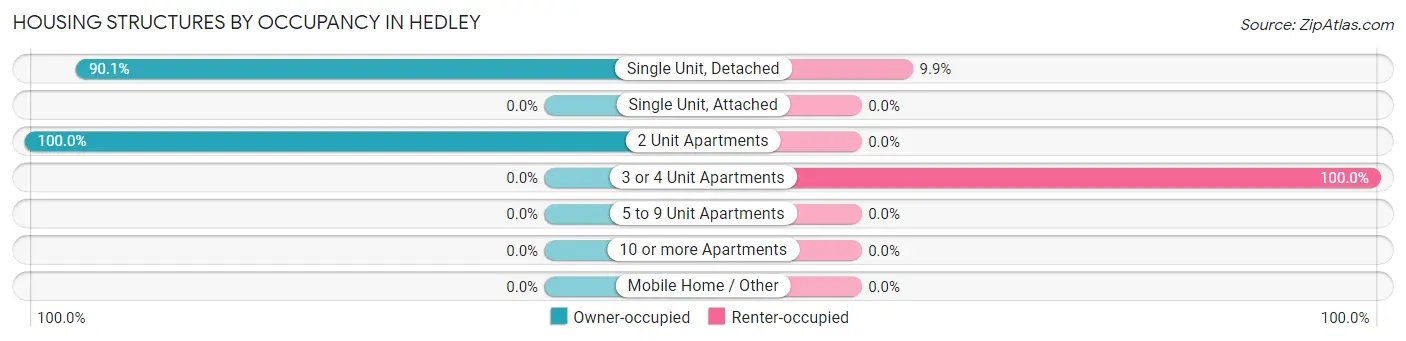
| Structure Type | Owner-occupied | Renter-occupied |
| Single Unit, Detached | 91 (90.1%) | 10 (9.9%) |
| Single Unit, Attached | 0 (0.0%) | 0 (0.0%) |
| 2 Unit Apartments | 1 (100.0%) | 0 (0.0%) |
| 3 or 4 Unit Apartments | 0 (0.0%) | 3 (100.0%) |
| 5 to 9 Unit Apartments | 0 (0.0%) | 0 (0.0%) |
| 10 or more Apartments | 0 (0.0%) | 0 (0.0%) |
| Mobile Home / Other | 0 (0.0%) | 0 (0.0%) |
| Total | 92 (87.6%) | 13 (12.4%) |
Housing Structures by Number of Rooms in Hedley
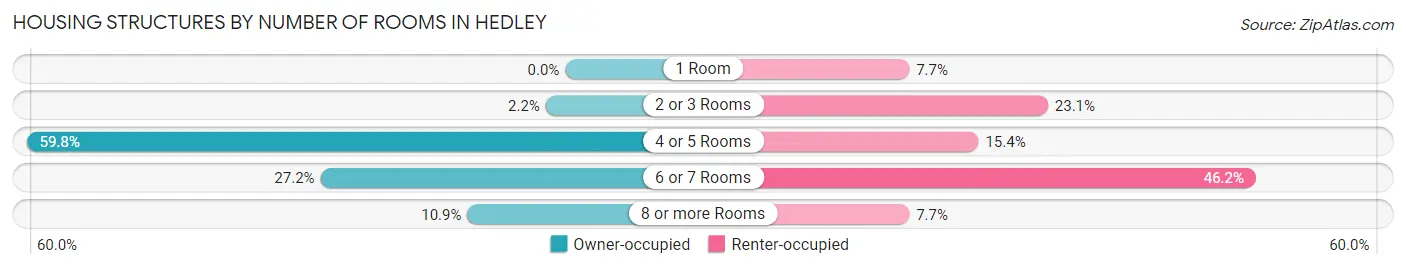
| Number of Rooms | Owner-occupied | Renter-occupied |
| 1 Room | 0 (0.0%) | 1 (7.7%) |
| 2 or 3 Rooms | 2 (2.2%) | 3 (23.1%) |
| 4 or 5 Rooms | 55 (59.8%) | 2 (15.4%) |
| 6 or 7 Rooms | 25 (27.2%) | 6 (46.2%) |
| 8 or more Rooms | 10 (10.9%) | 1 (7.7%) |
| Total | 92 (100.0%) | 13 (100.0%) |
Housing Structure by Heating Type in Hedley
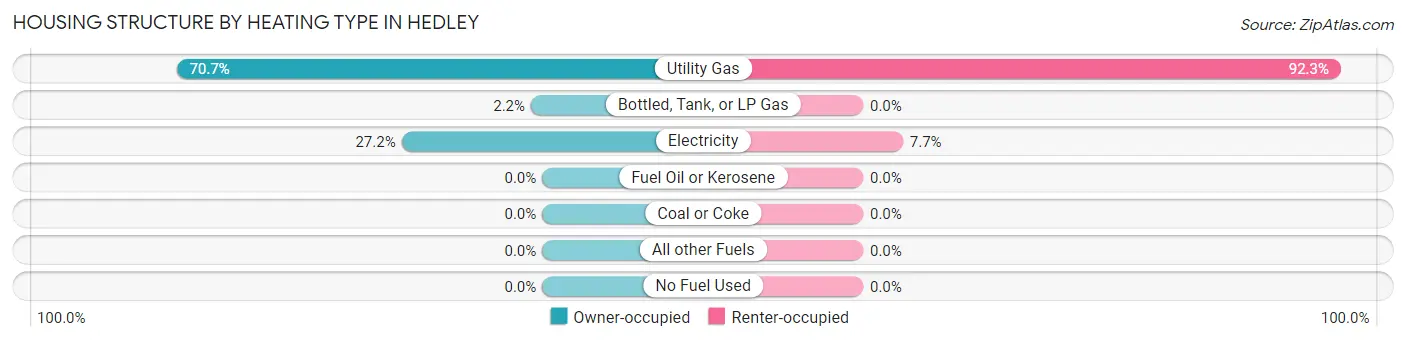
| Heating Type | Owner-occupied | Renter-occupied |
| Utility Gas | 65 (70.7%) | 12 (92.3%) |
| Bottled, Tank, or LP Gas | 2 (2.2%) | 0 (0.0%) |
| Electricity | 25 (27.2%) | 1 (7.7%) |
| Fuel Oil or Kerosene | 0 (0.0%) | 0 (0.0%) |
| Coal or Coke | 0 (0.0%) | 0 (0.0%) |
| All other Fuels | 0 (0.0%) | 0 (0.0%) |
| No Fuel Used | 0 (0.0%) | 0 (0.0%) |
| Total | 92 (100.0%) | 13 (100.0%) |
Household Vehicle Usage in Hedley
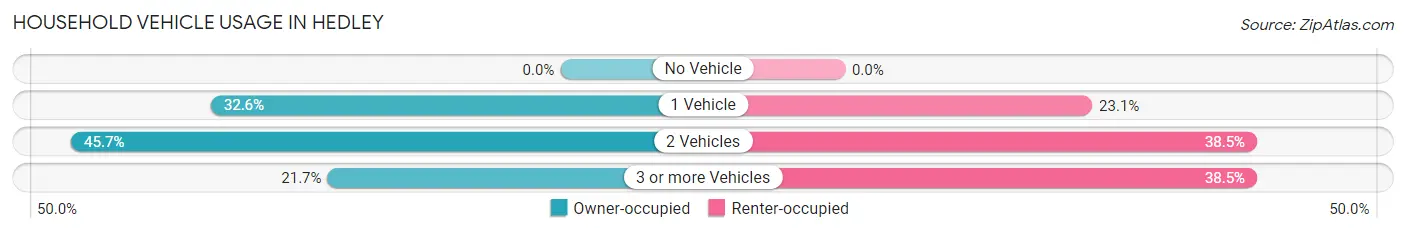
| Vehicles per Household | Owner-occupied | Renter-occupied |
| No Vehicle | 0 (0.0%) | 0 (0.0%) |
| 1 Vehicle | 30 (32.6%) | 3 (23.1%) |
| 2 Vehicles | 42 (45.7%) | 5 (38.5%) |
| 3 or more Vehicles | 20 (21.7%) | 5 (38.5%) |
| Total | 92 (100.0%) | 13 (100.0%) |
Real Estate & Mortgages in Hedley
Real Estate and Mortgage Overview in Hedley
| Characteristic | Without Mortgage | With Mortgage |
| Housing Units | 65 | 27 |
| Median Property Value | $35,800 | $50,700 |
| Median Household Income | $37,188 | $3 |
| Monthly Housing Costs | $252 | $0 |
| Real Estate Taxes | $500 | $0 |
Property Value by Mortgage Status in Hedley
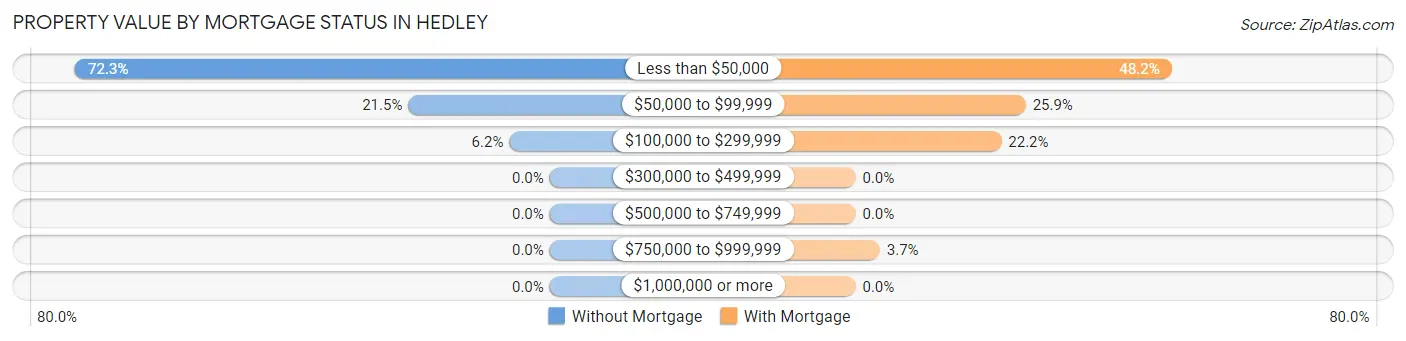
| Property Value | Without Mortgage | With Mortgage |
| Less than $50,000 | 47 (72.3%) | 13 (48.1%) |
| $50,000 to $99,999 | 14 (21.5%) | 7 (25.9%) |
| $100,000 to $299,999 | 4 (6.1%) | 6 (22.2%) |
| $300,000 to $499,999 | 0 (0.0%) | 0 (0.0%) |
| $500,000 to $749,999 | 0 (0.0%) | 0 (0.0%) |
| $750,000 to $999,999 | 0 (0.0%) | 1 (3.7%) |
| $1,000,000 or more | 0 (0.0%) | 0 (0.0%) |
| Total | 65 (100.0%) | 27 (100.0%) |
Household Income by Mortgage Status in Hedley
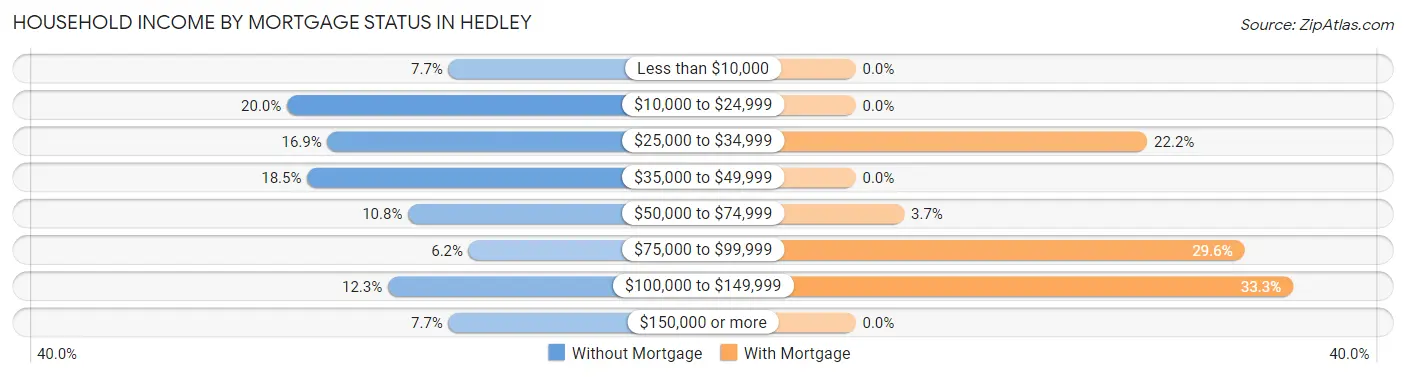
| Household Income | Without Mortgage | With Mortgage |
| Less than $10,000 | 5 (7.7%) | 0 (0.0%) |
| $10,000 to $24,999 | 13 (20.0%) | 0 (0.0%) |
| $25,000 to $34,999 | 11 (16.9%) | 6 (22.2%) |
| $35,000 to $49,999 | 12 (18.5%) | 0 (0.0%) |
| $50,000 to $74,999 | 7 (10.8%) | 1 (3.7%) |
| $75,000 to $99,999 | 4 (6.1%) | 8 (29.6%) |
| $100,000 to $149,999 | 8 (12.3%) | 9 (33.3%) |
| $150,000 or more | 5 (7.7%) | 0 (0.0%) |
| Total | 65 (100.0%) | 27 (100.0%) |
Property Value to Household Income Ratio in Hedley

| Value-to-Income Ratio | Without Mortgage | With Mortgage |
| Less than 2.0x | 49 (75.4%) | 58,125 (215,277.8%) |
| 2.0x to 2.9x | 12 (18.5%) | 21 (77.8%) |
| 3.0x to 3.9x | 1 (1.5%) | 2 (7.4%) |
| 4.0x or more | 0 (0.0%) | 0 (0.0%) |
| Total | 65 (100.0%) | 27 (100.0%) |
Real Estate Taxes by Mortgage Status in Hedley
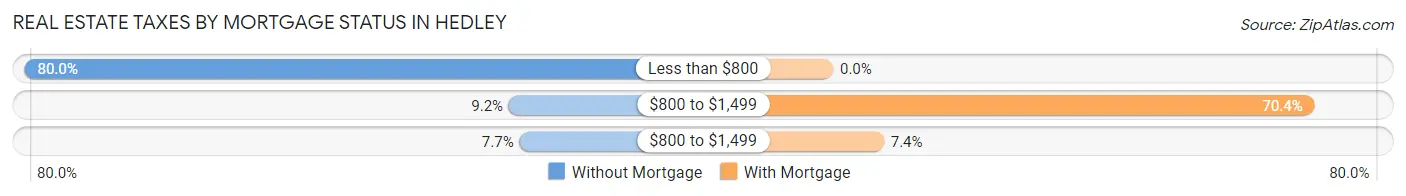
| Property Taxes | Without Mortgage | With Mortgage |
| Less than $800 | 52 (80.0%) | 0 (0.0%) |
| $800 to $1,499 | 6 (9.2%) | 19 (70.4%) |
| $800 to $1,499 | 5 (7.7%) | 2 (7.4%) |
| Total | 65 (100.0%) | 27 (100.0%) |
Health & Disability in Hedley
Health Insurance Coverage by Age in Hedley
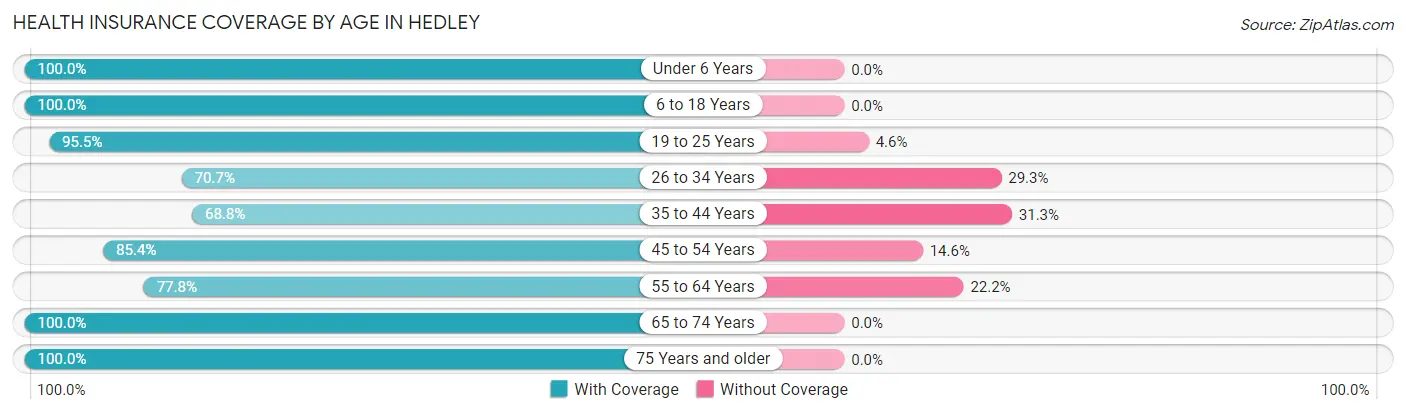
| Age Bracket | With Coverage | Without Coverage |
| Under 6 Years | 12 (100.0%) | 0 (0.0%) |
| 6 to 18 Years | 16 (100.0%) | 0 (0.0%) |
| 19 to 25 Years | 21 (95.5%) | 1 (4.5%) |
| 26 to 34 Years | 29 (70.7%) | 12 (29.3%) |
| 35 to 44 Years | 11 (68.8%) | 5 (31.2%) |
| 45 to 54 Years | 35 (85.4%) | 6 (14.6%) |
| 55 to 64 Years | 35 (77.8%) | 10 (22.2%) |
| 65 to 74 Years | 44 (100.0%) | 0 (0.0%) |
| 75 Years and older | 17 (100.0%) | 0 (0.0%) |
| Total | 220 (86.6%) | 34 (13.4%) |
Health Insurance Coverage by Citizenship Status in Hedley
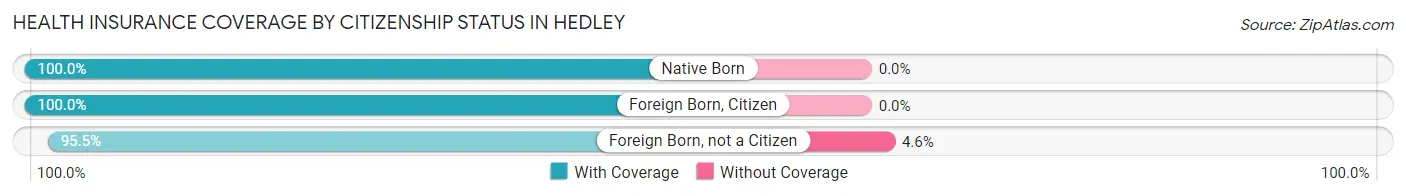
| Citizenship Status | With Coverage | Without Coverage |
| Native Born | 12 (100.0%) | 0 (0.0%) |
| Foreign Born, Citizen | 16 (100.0%) | 0 (0.0%) |
| Foreign Born, not a Citizen | 21 (95.5%) | 1 (4.5%) |
Health Insurance Coverage by Household Income in Hedley
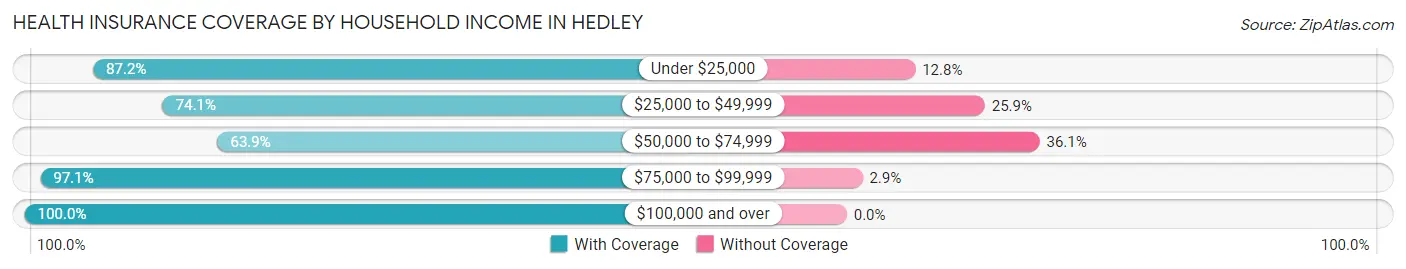
| Household Income | With Coverage | Without Coverage |
| Under $25,000 | 34 (87.2%) | 5 (12.8%) |
| $25,000 to $49,999 | 43 (74.1%) | 15 (25.9%) |
| $50,000 to $74,999 | 23 (63.9%) | 13 (36.1%) |
| $75,000 to $99,999 | 33 (97.1%) | 1 (2.9%) |
| $100,000 and over | 87 (100.0%) | 0 (0.0%) |
Public vs Private Health Insurance Coverage by Age in Hedley
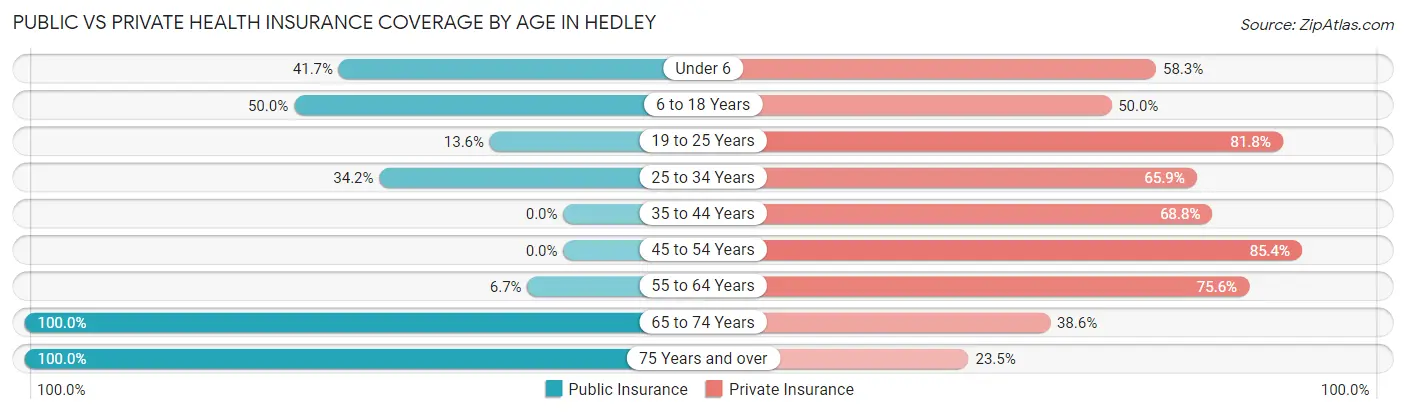
| Age Bracket | Public Insurance | Private Insurance |
| Under 6 | 5 (41.7%) | 7 (58.3%) |
| 6 to 18 Years | 8 (50.0%) | 8 (50.0%) |
| 19 to 25 Years | 3 (13.6%) | 18 (81.8%) |
| 25 to 34 Years | 14 (34.2%) | 27 (65.8%) |
| 35 to 44 Years | 0 (0.0%) | 11 (68.8%) |
| 45 to 54 Years | 0 (0.0%) | 35 (85.4%) |
| 55 to 64 Years | 3 (6.7%) | 34 (75.6%) |
| 65 to 74 Years | 44 (100.0%) | 17 (38.6%) |
| 75 Years and over | 17 (100.0%) | 4 (23.5%) |
| Total | 94 (37.0%) | 161 (63.4%) |
Disability Status by Sex by Age in Hedley
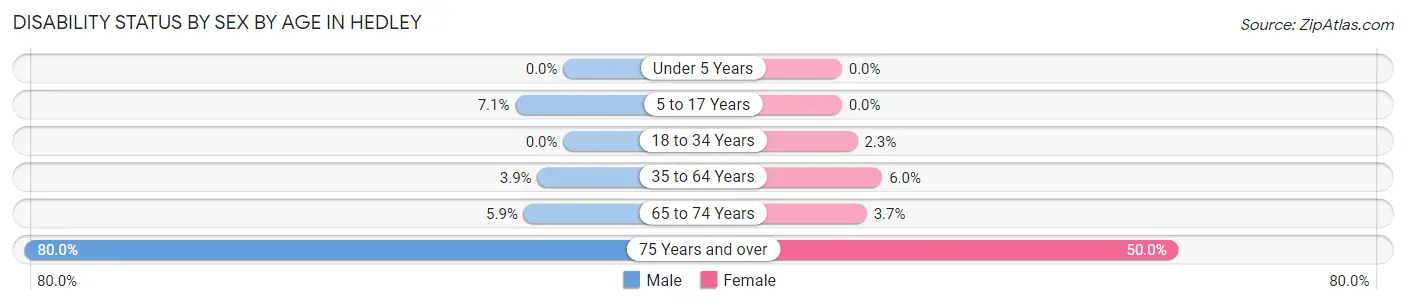
| Age Bracket | Male | Female |
| Under 5 Years | 0 (0.0%) | 0 (0.0%) |
| 5 to 17 Years | 1 (7.1%) | 0 (0.0%) |
| 18 to 34 Years | 0 (0.0%) | 1 (2.3%) |
| 35 to 64 Years | 2 (3.8%) | 3 (6.0%) |
| 65 to 74 Years | 1 (5.9%) | 1 (3.7%) |
| 75 Years and over | 4 (80.0%) | 6 (50.0%) |
Disability Class by Sex by Age in Hedley
Disability Class: Hearing Difficulty
| Age Bracket | Male | Female |
| Under 5 Years | 0 (0.0%) | 0 (0.0%) |
| 5 to 17 Years | 0 (0.0%) | 0 (0.0%) |
| 18 to 34 Years | 0 (0.0%) | 0 (0.0%) |
| 35 to 64 Years | 0 (0.0%) | 0 (0.0%) |
| 65 to 74 Years | 0 (0.0%) | 0 (0.0%) |
| 75 Years and over | 0 (0.0%) | 0 (0.0%) |
Disability Class: Vision Difficulty
| Age Bracket | Male | Female |
| Under 5 Years | 0 (0.0%) | 0 (0.0%) |
| 5 to 17 Years | 0 (0.0%) | 0 (0.0%) |
| 18 to 34 Years | 0 (0.0%) | 1 (2.3%) |
| 35 to 64 Years | 0 (0.0%) | 0 (0.0%) |
| 65 to 74 Years | 0 (0.0%) | 0 (0.0%) |
| 75 Years and over | 0 (0.0%) | 0 (0.0%) |
Disability Class: Cognitive Difficulty
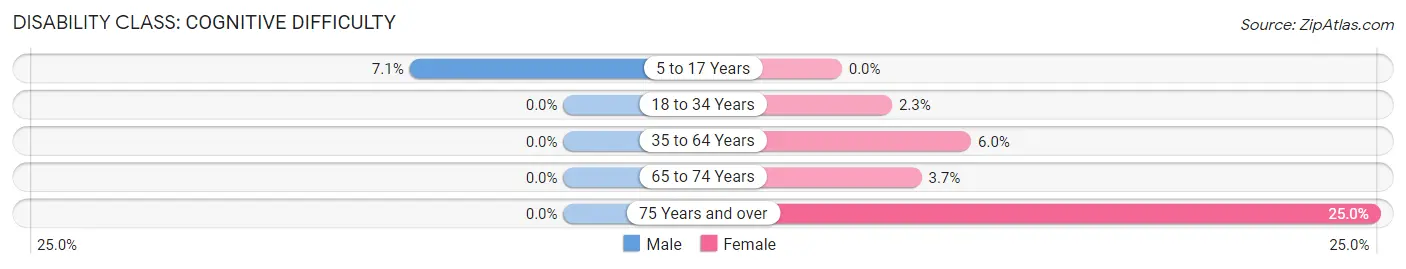
| Age Bracket | Male | Female |
| 5 to 17 Years | 1 (7.1%) | 0 (0.0%) |
| 18 to 34 Years | 0 (0.0%) | 1 (2.3%) |
| 35 to 64 Years | 0 (0.0%) | 3 (6.0%) |
| 65 to 74 Years | 0 (0.0%) | 1 (3.7%) |
| 75 Years and over | 0 (0.0%) | 3 (25.0%) |
Disability Class: Ambulatory Difficulty
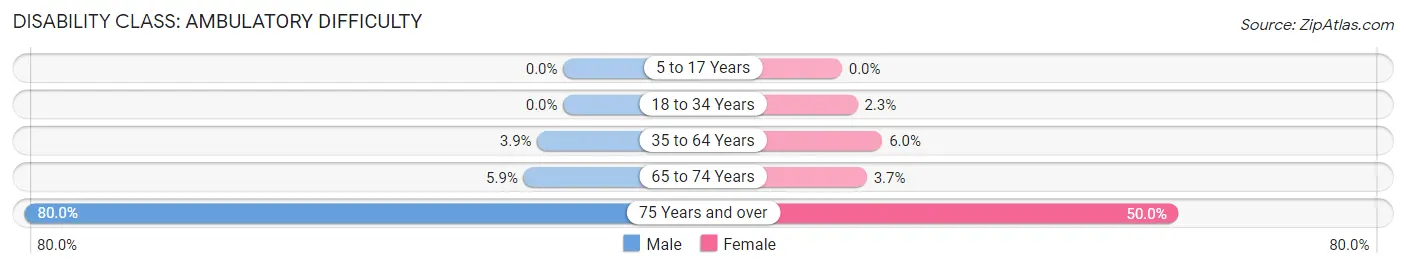
| Age Bracket | Male | Female |
| 5 to 17 Years | 0 (0.0%) | 0 (0.0%) |
| 18 to 34 Years | 0 (0.0%) | 1 (2.3%) |
| 35 to 64 Years | 2 (3.8%) | 3 (6.0%) |
| 65 to 74 Years | 1 (5.9%) | 1 (3.7%) |
| 75 Years and over | 4 (80.0%) | 6 (50.0%) |
Disability Class: Self-Care Difficulty
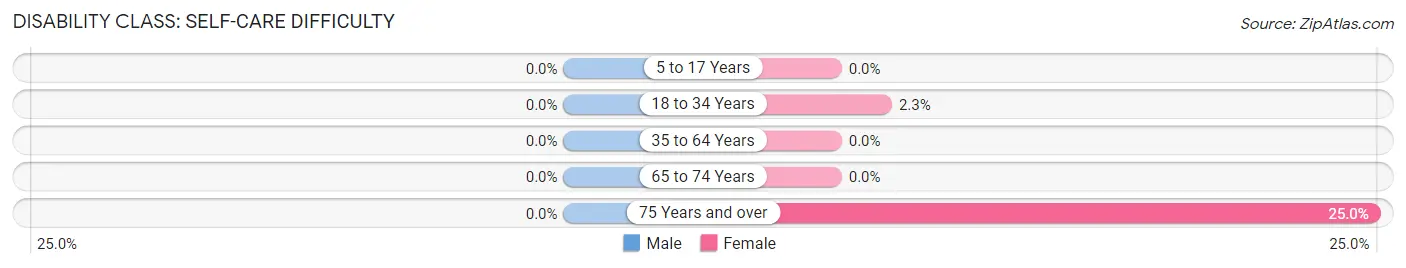
| Age Bracket | Male | Female |
| 5 to 17 Years | 0 (0.0%) | 0 (0.0%) |
| 18 to 34 Years | 0 (0.0%) | 1 (2.3%) |
| 35 to 64 Years | 0 (0.0%) | 0 (0.0%) |
| 65 to 74 Years | 0 (0.0%) | 0 (0.0%) |
| 75 Years and over | 0 (0.0%) | 3 (25.0%) |
Technology Access in Hedley
Computing Device Access in Hedley
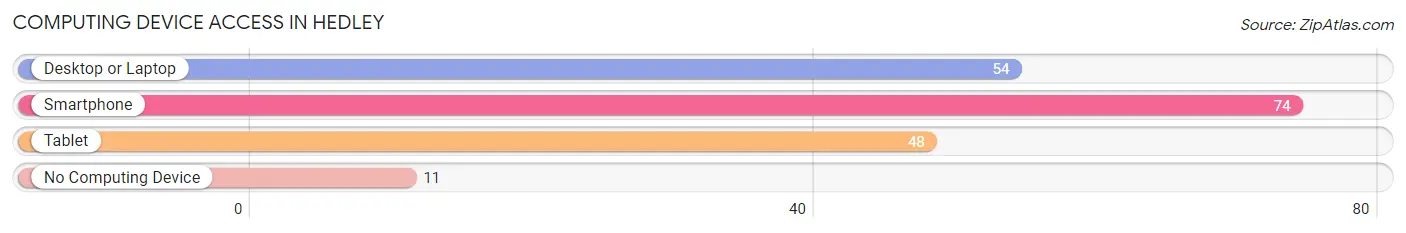
| Device Type | # Households | % Households |
| Desktop or Laptop | 54 | 51.4% |
| Smartphone | 74 | 70.5% |
| Tablet | 48 | 45.7% |
| No Computing Device | 11 | 10.5% |
| Total | 105 | 100.0% |
Internet Access in Hedley
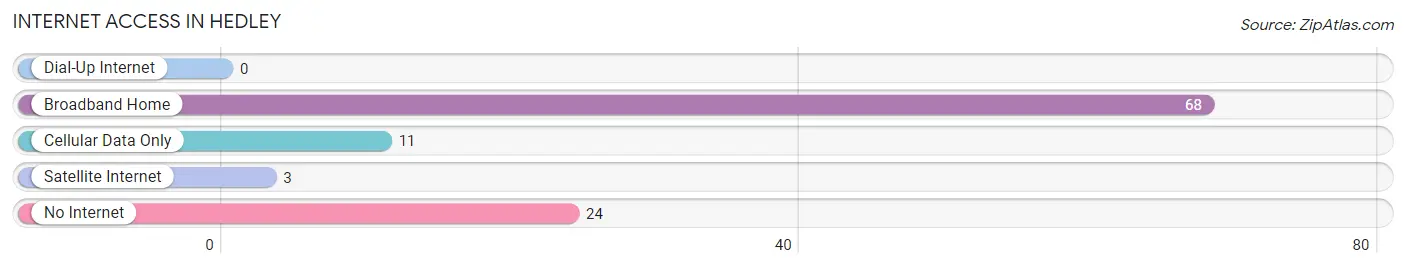
| Internet Type | # Households | % Households |
| Dial-Up Internet | 0 | 0.0% |
| Broadband Home | 68 | 64.8% |
| Cellular Data Only | 11 | 10.5% |
| Satellite Internet | 3 | 2.9% |
| No Internet | 24 | 22.9% |
| Total | 105 | 100.0% |
Hedley Summary
Hedley is a small town located in Donley County, Texas, United States. It is situated on the western edge of the Texas Panhandle, approximately 25 miles east of Amarillo. The population of Hedley was estimated to be around 200 people in 2020.
History
Hedley was founded in 1909 by the Santa Fe Railroad. The town was named after the Hedley family, who were early settlers in the area. The town was originally a stop on the railroad, and it quickly grew into a small farming community. The town was incorporated in 1911.
In the early 1900s, Hedley was a thriving agricultural community. Cotton was the main crop, and the town had several cotton gins and a cottonseed oil mill. The town also had a bank, a hotel, a general store, and a post office.
In the 1920s, the town began to decline as the railroad moved its operations elsewhere. The Great Depression further weakened the town's economy, and by the 1940s, the population had dropped to around 200 people.
Geography
Hedley is located in the Texas Panhandle, approximately 25 miles east of Amarillo. The town is situated on the western edge of Donley County, and is surrounded by flat, open plains. The town is located at an elevation of 2,845 feet above sea level.
The climate in Hedley is semi-arid, with hot summers and cold winters. The average annual temperature is around 64°F, and the average annual precipitation is around 17 inches.
Economy
The economy of Hedley is largely based on agriculture. Cotton is the main crop, and the town also produces wheat, sorghum, and hay. The town also has a few small businesses, including a general store, a gas station, and a restaurant.
Demographics
As of the 2010 census, the population of Hedley was estimated to be around 200 people. The racial makeup of the town was 97.5% White, 0.5% African American, 0.5% Native American, and 1.5% from other races. The median household income was $30,000, and the median home value was $50,000.
Conclusion
Hedley is a small town located in Donley County, Texas. It was founded in 1909 by the Santa Fe Railroad, and it quickly grew into a thriving agricultural community. The town has since declined, and the population is now estimated to be around 200 people. The economy of Hedley is largely based on agriculture, and the town also has a few small businesses. The racial makeup of the town is predominantly White, with a small percentage of African American, Native American, and other races.
Common Questions
What is Per Capita Income in Hedley?
Per Capita income in Hedley is $33,133.
What is the Median Family Income in Hedley?
Median Family Income in Hedley is $64,750.
What is the Median Household income in Hedley?
Median Household Income in Hedley is $42,344.
What is Income or Wage Gap in Hedley?
Income or Wage Gap in Hedley is 51.1%.
Women in Hedley earn 48.9 cents for every dollar earned by a man.
What is Inequality or Gini Index in Hedley?
Inequality or Gini Index in Hedley is 0.45.
What is the Total Population of Hedley?
Total Population of Hedley is 254.
What is the Total Male Population of Hedley?
Total Male Population of Hedley is 115.
What is the Total Female Population of Hedley?
Total Female Population of Hedley is 139.
What is the Ratio of Males per 100 Females in Hedley?
There are 82.73 Males per 100 Females in Hedley.
What is the Ratio of Females per 100 Males in Hedley?
There are 120.87 Females per 100 Males in Hedley.
What is the Median Population Age in Hedley?
Median Population Age in Hedley is 52.6 Years.
What is the Average Family Size in Hedley
Average Family Size in Hedley is 3.1 People.
What is the Average Household Size in Hedley
Average Household Size in Hedley is 2.4 People.
How Large is the Labor Force in Hedley?
There are 146 People in the Labor Forcein in Hedley.
What is the Percentage of People in the Labor Force in Hedley?
63.8% of People are in the Labor Force in Hedley.