Hawkins, TX Map & Demographics
Hawkins Map
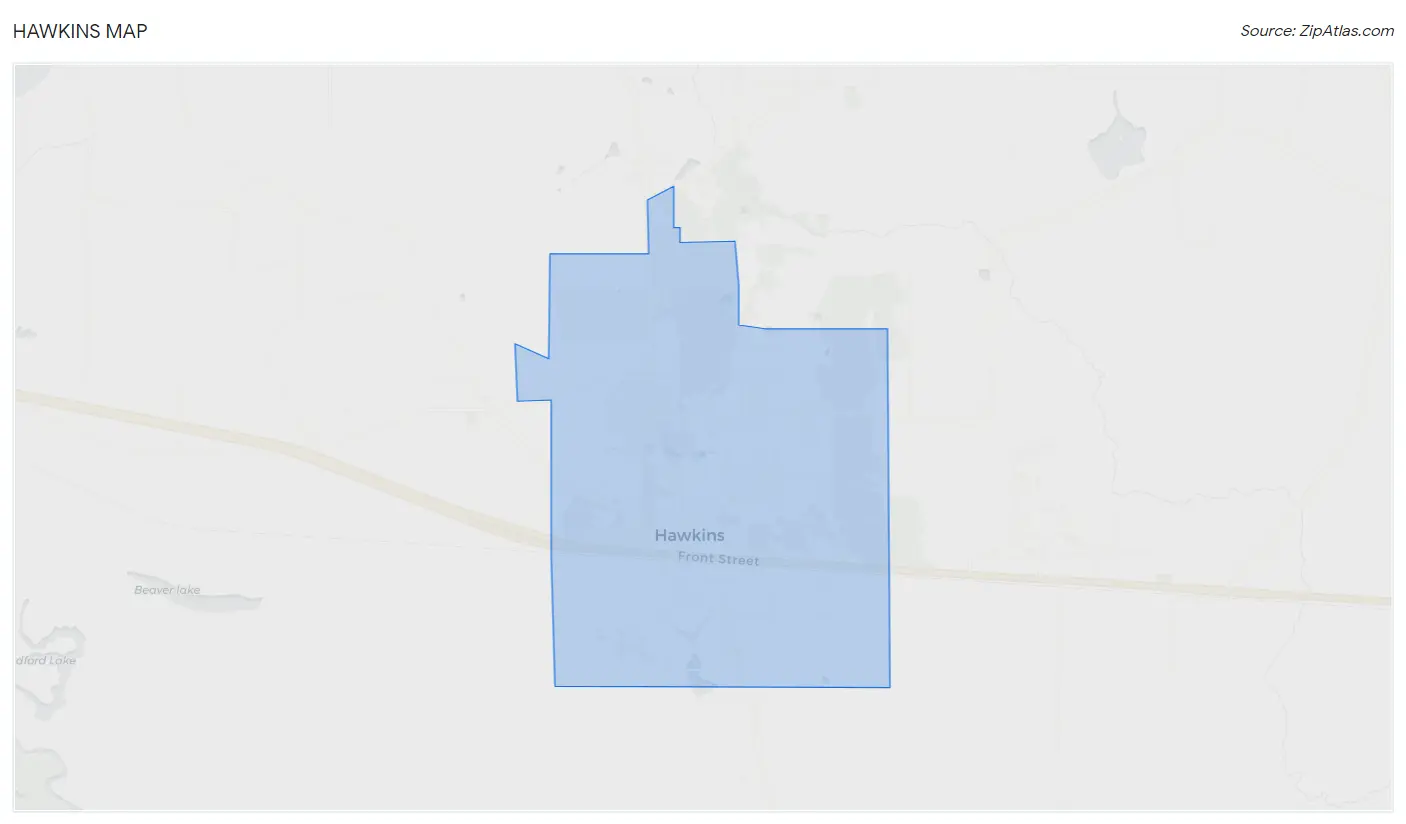
Hawkins Overview
$28,288
PER CAPITA INCOME
$69,779
AVG FAMILY INCOME
$66,310
AVG HOUSEHOLD INCOME
8.8%
WAGE / INCOME GAP [ % ]
91.2¢/ $1
WAGE / INCOME GAP [ $ ]
0.37
INEQUALITY / GINI INDEX
1,743
TOTAL POPULATION
865
MALE POPULATION
878
FEMALE POPULATION
98.52
MALES / 100 FEMALES
101.50
FEMALES / 100 MALES
36.5
MEDIAN AGE
3.6
AVG FAMILY SIZE
2.7
AVG HOUSEHOLD SIZE
967
LABOR FORCE [ PEOPLE ]
68.5%
PERCENT IN LABOR FORCE
8.4%
UNEMPLOYMENT RATE
Hawkins Zip Codes
Income in Hawkins
Income Overview in Hawkins
Per Capita Income in Hawkins is $28,288, while median incomes of families and households are $69,779 and $66,310 respectively.
| Characteristic | Number | Measure |
| Per Capita Income | 1,743 | $28,288 |
| Median Family Income | 363 | $69,779 |
| Mean Family Income | 363 | $90,398 |
| Median Household Income | 628 | $66,310 |
| Mean Household Income | 628 | $71,845 |
| Income Deficit | 363 | $0 |
| Wage / Income Gap (%) | 1,743 | 8.80% |
| Wage / Income Gap ($) | 1,743 | 91.20¢ per $1 |
| Gini / Inequality Index | 1,743 | 0.37 |
Earnings by Sex in Hawkins
Average Earnings in Hawkins are $33,661, $32,411 for men and $35,538 for women, a difference of 8.8%.
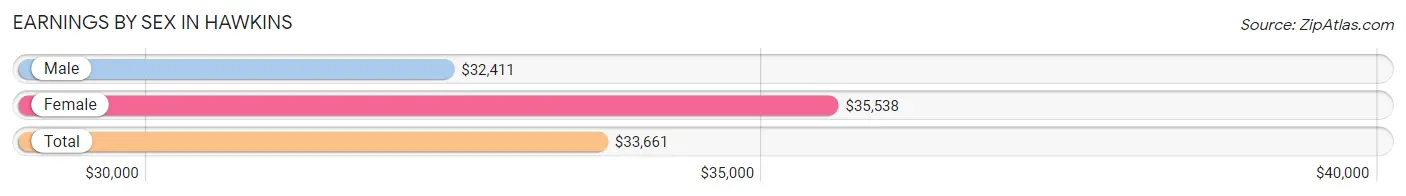
| Sex | Number | Average Earnings |
| Male | 502 (52.0%) | $32,411 |
| Female | 464 (48.0%) | $35,538 |
| Total | 966 (100.0%) | $33,661 |
Earnings by Sex by Income Bracket in Hawkins
The most common earnings brackets in Hawkins are $22,500 to $24,999 for men (110 | 21.9%) and $35,000 to $39,999 for women (85 | 18.3%).
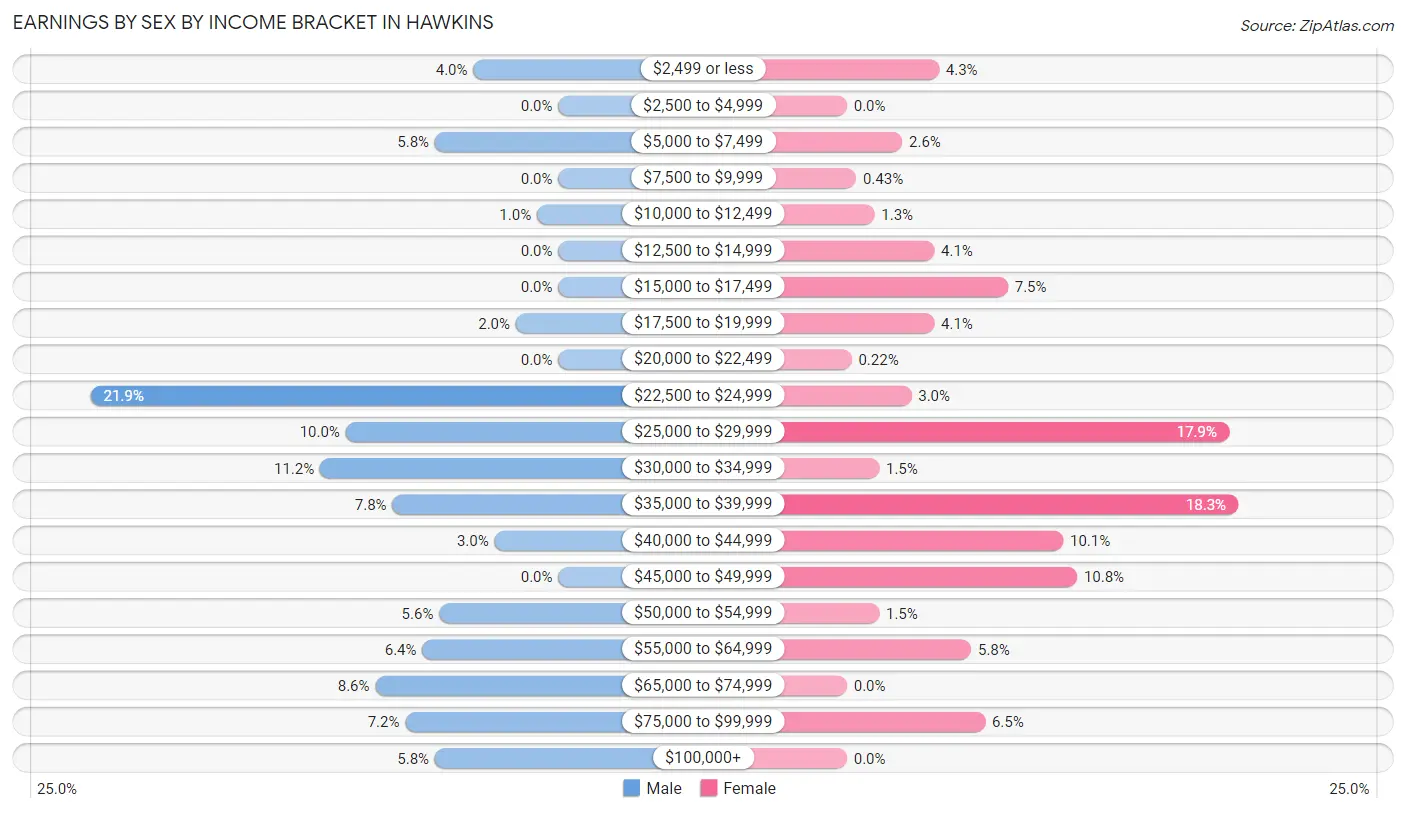
| Income | Male | Female |
| $2,499 or less | 20 (4.0%) | 20 (4.3%) |
| $2,500 to $4,999 | 0 (0.0%) | 0 (0.0%) |
| $5,000 to $7,499 | 29 (5.8%) | 12 (2.6%) |
| $7,500 to $9,999 | 0 (0.0%) | 2 (0.4%) |
| $10,000 to $12,499 | 5 (1.0%) | 6 (1.3%) |
| $12,500 to $14,999 | 0 (0.0%) | 19 (4.1%) |
| $15,000 to $17,499 | 0 (0.0%) | 35 (7.5%) |
| $17,500 to $19,999 | 10 (2.0%) | 19 (4.1%) |
| $20,000 to $22,499 | 0 (0.0%) | 1 (0.2%) |
| $22,500 to $24,999 | 110 (21.9%) | 14 (3.0%) |
| $25,000 to $29,999 | 50 (10.0%) | 83 (17.9%) |
| $30,000 to $34,999 | 56 (11.2%) | 7 (1.5%) |
| $35,000 to $39,999 | 39 (7.8%) | 85 (18.3%) |
| $40,000 to $44,999 | 15 (3.0%) | 47 (10.1%) |
| $45,000 to $49,999 | 0 (0.0%) | 50 (10.8%) |
| $50,000 to $54,999 | 28 (5.6%) | 7 (1.5%) |
| $55,000 to $64,999 | 32 (6.4%) | 27 (5.8%) |
| $65,000 to $74,999 | 43 (8.6%) | 0 (0.0%) |
| $75,000 to $99,999 | 36 (7.2%) | 30 (6.5%) |
| $100,000+ | 29 (5.8%) | 0 (0.0%) |
| Total | 502 (100.0%) | 464 (100.0%) |
Earnings by Sex by Educational Attainment in Hawkins
Average earnings in Hawkins are $35,950 for men and $36,519 for women, a difference of 1.6%. Men with an educational attainment of bachelor's degree enjoy the highest average annual earnings of $65,403, while those with less than high school education earn the least with $29,583. Women with an educational attainment of bachelor's degree earn the most with the average annual earnings of $46,625, while those with less than high school education have the smallest earnings of $25,288.
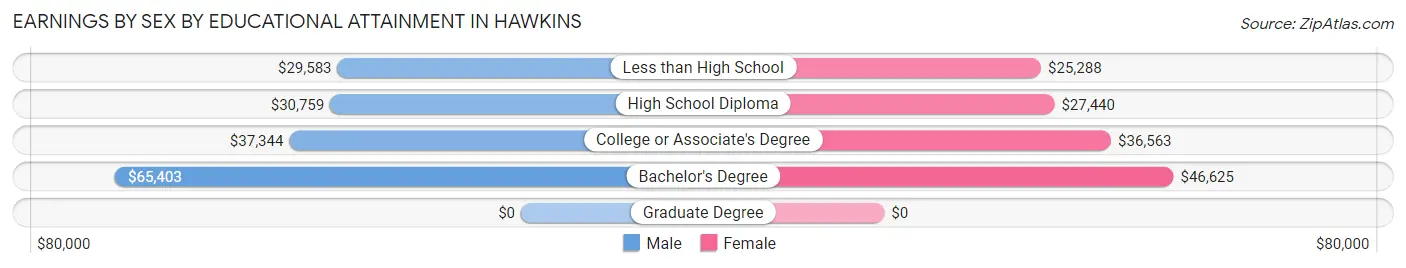
| Educational Attainment | Male Income | Female Income |
| Less than High School | $29,583 | $25,288 |
| High School Diploma | $30,759 | $27,440 |
| College or Associate's Degree | $37,344 | $36,563 |
| Bachelor's Degree | $65,403 | $46,625 |
| Graduate Degree | - | - |
| Total | $35,950 | $36,519 |
Family Income in Hawkins
Family Income Brackets in Hawkins
According to the Hawkins family income data, there are 129 families falling into the $50,000 to $74,999 income range, which is the most common income bracket and makes up 35.5% of all families.
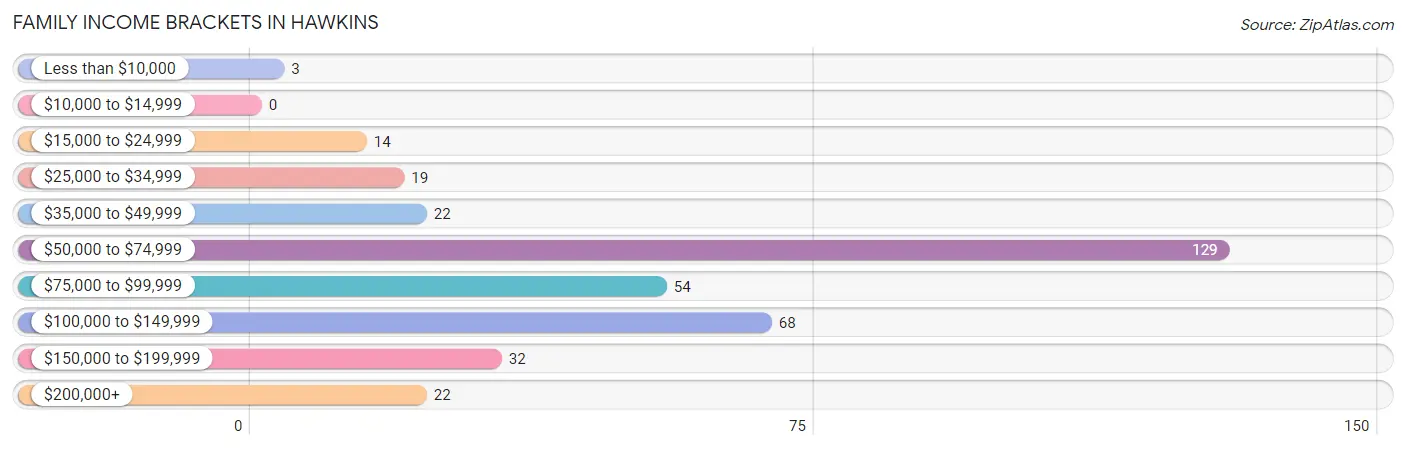
| Income Bracket | # Families | % Families |
| Less than $10,000 | 3 | 0.8% |
| $10,000 to $14,999 | 0 | 0.0% |
| $15,000 to $24,999 | 14 | 3.9% |
| $25,000 to $34,999 | 19 | 5.2% |
| $35,000 to $49,999 | 22 | 6.1% |
| $50,000 to $74,999 | 129 | 35.5% |
| $75,000 to $99,999 | 54 | 14.9% |
| $100,000 to $149,999 | 68 | 18.7% |
| $150,000 to $199,999 | 32 | 8.8% |
| $200,000+ | 22 | 6.1% |
Family Income by Famaliy Size in Hawkins
4-person families (48 | 13.2%) account for the highest median family income in Hawkins with $157,600 per family, while 4-person families (48 | 13.2%) have the highest median income of $39,400 per family member.
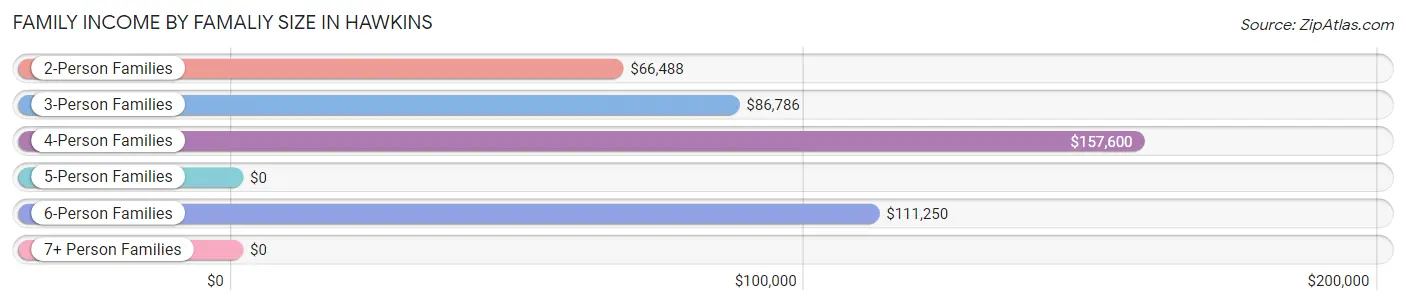
| Income Bracket | # Families | Median Income |
| 2-Person Families | 149 (41.0%) | $66,488 |
| 3-Person Families | 96 (26.5%) | $86,786 |
| 4-Person Families | 48 (13.2%) | $157,600 |
| 5-Person Families | 5 (1.4%) | $0 |
| 6-Person Families | 65 (17.9%) | $111,250 |
| 7+ Person Families | 0 (0.0%) | $0 |
| Total | 363 (100.0%) | $69,779 |
Family Income by Number of Earners in Hawkins
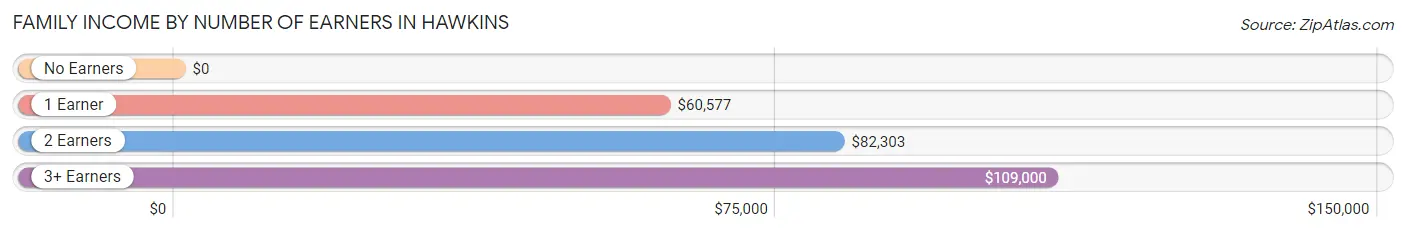
| Number of Earners | # Families | Median Income |
| No Earners | 32 (8.8%) | $0 |
| 1 Earner | 98 (27.0%) | $60,577 |
| 2 Earners | 169 (46.6%) | $82,303 |
| 3+ Earners | 64 (17.6%) | $109,000 |
| Total | 363 (100.0%) | $69,779 |
Household Income in Hawkins
Household Income Brackets in Hawkins
With 188 households falling in the category, the $50,000 to $74,999 income range is the most frequent in Hawkins, accounting for 29.9% of all households. In contrast, only 7 households (1.1%) fall into the $10,000 to $14,999 income bracket, making it the least populous group.
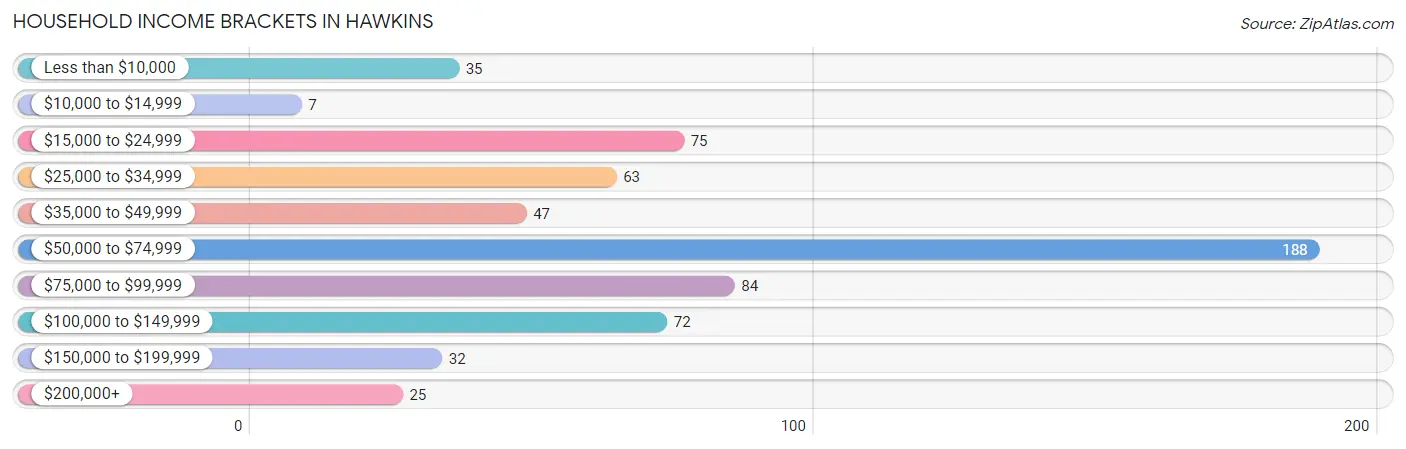
| Income Bracket | # Households | % Households |
| Less than $10,000 | 35 | 5.6% |
| $10,000 to $14,999 | 7 | 1.1% |
| $15,000 to $24,999 | 75 | 11.9% |
| $25,000 to $34,999 | 63 | 10.0% |
| $35,000 to $49,999 | 47 | 7.5% |
| $50,000 to $74,999 | 188 | 29.9% |
| $75,000 to $99,999 | 84 | 13.4% |
| $100,000 to $149,999 | 72 | 11.5% |
| $150,000 to $199,999 | 32 | 5.1% |
| $200,000+ | 25 | 4.0% |
Household Income by Householder Age in Hawkins
The median household income in Hawkins is $66,310, with the highest median household income of $78,750 found in the 25 to 44 years age bracket for the primary householder. A total of 238 households (37.9%) fall into this category. Meanwhile, the 15 to 24 years age bracket for the primary householder has the lowest median household income of $0, with 16 households (2.5%) in this group.
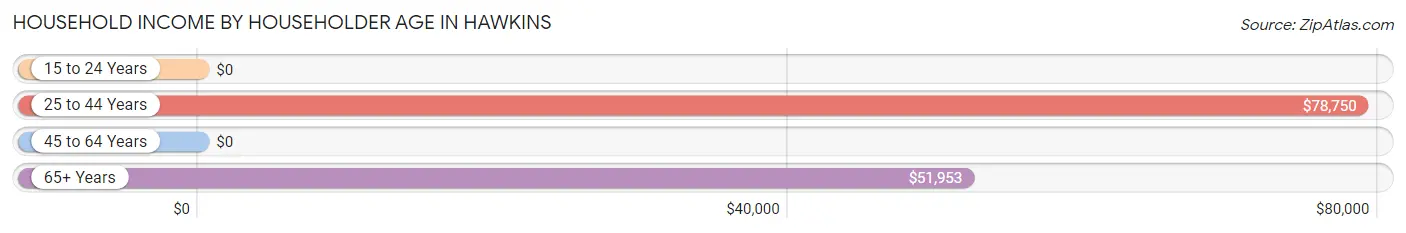
| Income Bracket | # Households | Median Income |
| 15 to 24 Years | 16 (2.5%) | $0 |
| 25 to 44 Years | 238 (37.9%) | $78,750 |
| 45 to 64 Years | 205 (32.6%) | $0 |
| 65+ Years | 169 (26.9%) | $51,953 |
| Total | 628 (100.0%) | $66,310 |
Poverty in Hawkins
Income Below Poverty by Sex and Age in Hawkins
With 14.2% poverty level for males and 12.9% for females among the residents of Hawkins, 5 year old males and 55 to 64 year old females are the most vulnerable to poverty, with 1 males (100.0%) and 79 females (63.2%) in their respective age groups living below the poverty level.
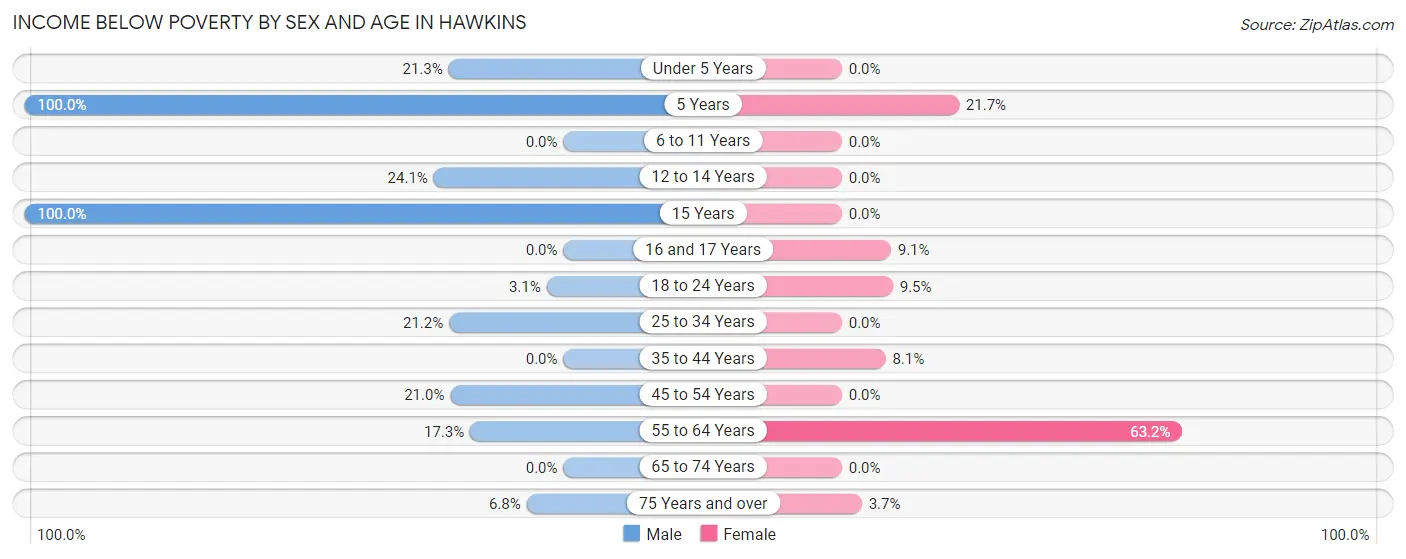
| Age Bracket | Male | Female |
| Under 5 Years | 13 (21.3%) | 0 (0.0%) |
| 5 Years | 1 (100.0%) | 5 (21.7%) |
| 6 to 11 Years | 0 (0.0%) | 0 (0.0%) |
| 12 to 14 Years | 13 (24.1%) | 0 (0.0%) |
| 15 Years | 11 (100.0%) | 0 (0.0%) |
| 16 and 17 Years | 0 (0.0%) | 3 (9.1%) |
| 18 to 24 Years | 4 (3.1%) | 7 (9.5%) |
| 25 to 34 Years | 35 (21.2%) | 0 (0.0%) |
| 35 to 44 Years | 0 (0.0%) | 15 (8.1%) |
| 45 to 54 Years | 21 (21.0%) | 0 (0.0%) |
| 55 to 64 Years | 22 (17.3%) | 79 (63.2%) |
| 65 to 74 Years | 0 (0.0%) | 0 (0.0%) |
| 75 Years and over | 3 (6.8%) | 3 (3.7%) |
| Total | 123 (14.2%) | 112 (12.9%) |
Income Above Poverty by Sex and Age in Hawkins
According to the poverty statistics in Hawkins, males aged 6 to 11 years and females aged under 5 years are the age groups that are most secure financially, with 100.0% of males and 100.0% of females in these age groups living above the poverty line.
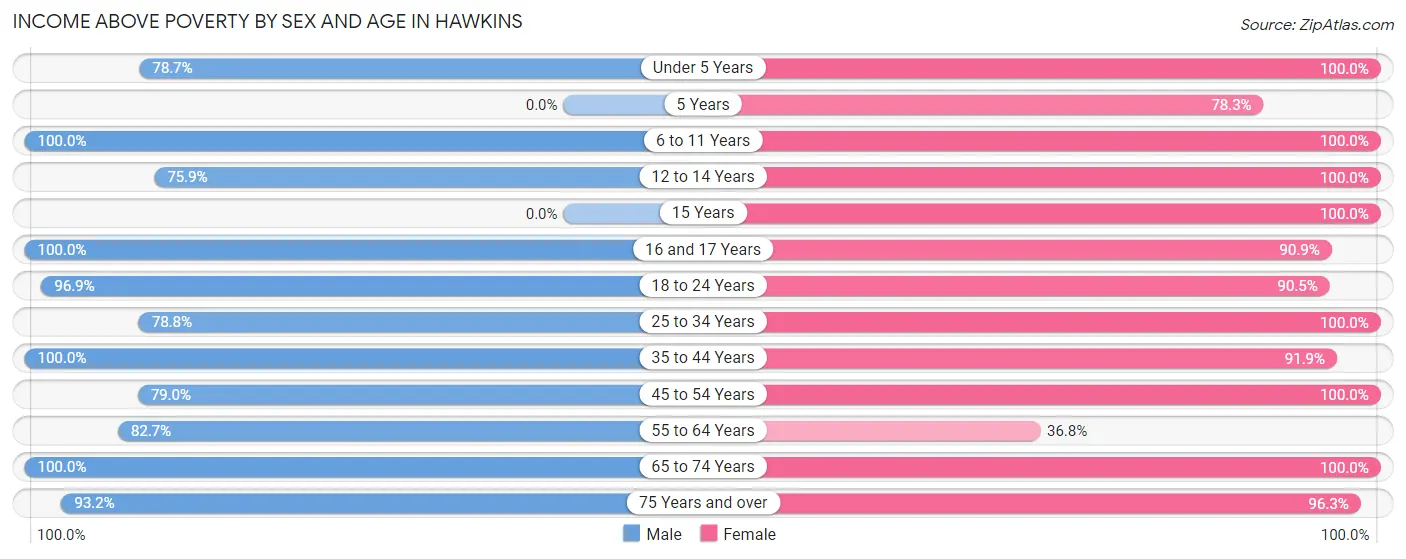
| Age Bracket | Male | Female |
| Under 5 Years | 48 (78.7%) | 40 (100.0%) |
| 5 Years | 0 (0.0%) | 18 (78.3%) |
| 6 to 11 Years | 29 (100.0%) | 72 (100.0%) |
| 12 to 14 Years | 41 (75.9%) | 21 (100.0%) |
| 15 Years | 0 (0.0%) | 10 (100.0%) |
| 16 and 17 Years | 1 (100.0%) | 30 (90.9%) |
| 18 to 24 Years | 124 (96.9%) | 67 (90.5%) |
| 25 to 34 Years | 130 (78.8%) | 87 (100.0%) |
| 35 to 44 Years | 87 (100.0%) | 170 (91.9%) |
| 45 to 54 Years | 79 (79.0%) | 61 (100.0%) |
| 55 to 64 Years | 105 (82.7%) | 46 (36.8%) |
| 65 to 74 Years | 57 (100.0%) | 57 (100.0%) |
| 75 Years and over | 41 (93.2%) | 78 (96.3%) |
| Total | 742 (85.8%) | 757 (87.1%) |
Income Below Poverty Among Married-Couple Families in Hawkins
The poverty statistics for married-couple families in Hawkins show that 2.2% or 6 of the total 271 families live below the poverty line. Families with 1 or 2 children have the highest poverty rate of 6.2%, comprising of 6 families. On the other hand, families with no children have the lowest poverty rate of 0.0%, which includes 0 families.
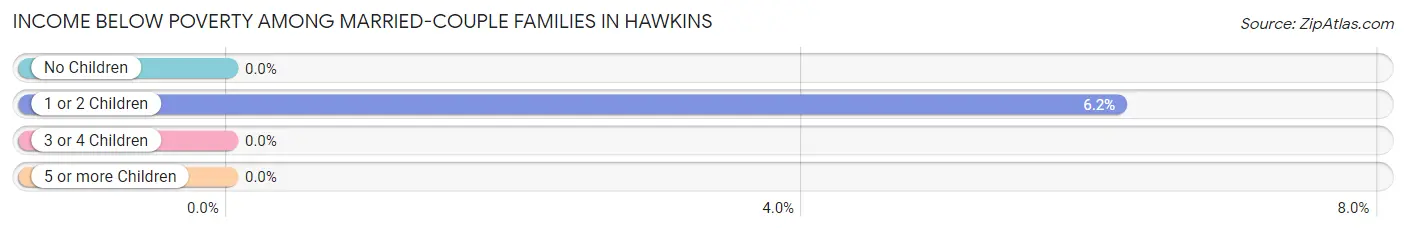
| Children | Above Poverty | Below Poverty |
| No Children | 143 (100.0%) | 0 (0.0%) |
| 1 or 2 Children | 91 (93.8%) | 6 (6.2%) |
| 3 or 4 Children | 31 (100.0%) | 0 (0.0%) |
| 5 or more Children | 0 (0.0%) | 0 (0.0%) |
| Total | 265 (97.8%) | 6 (2.2%) |
Income Below Poverty Among Single-Parent Households in Hawkins
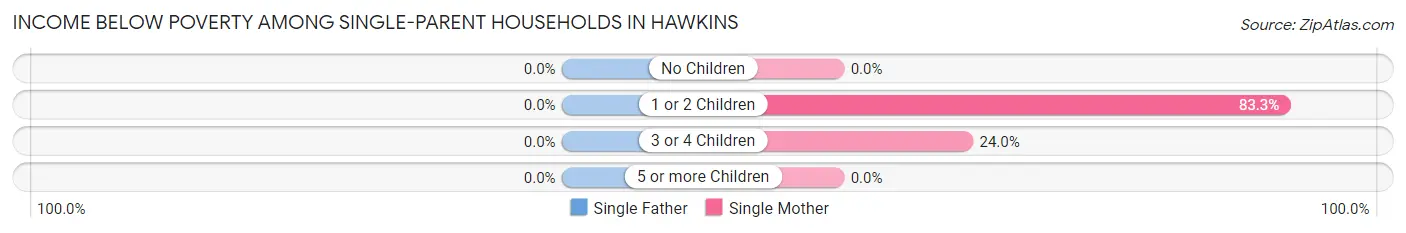
| Children | Single Father | Single Mother |
| No Children | 0 (0.0%) | 0 (0.0%) |
| 1 or 2 Children | 0 (0.0%) | 5 (83.3%) |
| 3 or 4 Children | 0 (0.0%) | 6 (24.0%) |
| 5 or more Children | 0 (0.0%) | 0 (0.0%) |
| Total | 0 (0.0%) | 11 (15.3%) |
Income Below Poverty Among Married-Couple vs Single-Parent Households in Hawkins
The poverty data for Hawkins shows that 6 of the married-couple family households (2.2%) and 11 of the single-parent households (12.0%) are living below the poverty level. Within the married-couple family households, those with 1 or 2 children have the highest poverty rate, with 6 households (6.2%) falling below the poverty line. Among the single-parent households, those with 1 or 2 children have the highest poverty rate, with 5 household (25.0%) living below poverty.
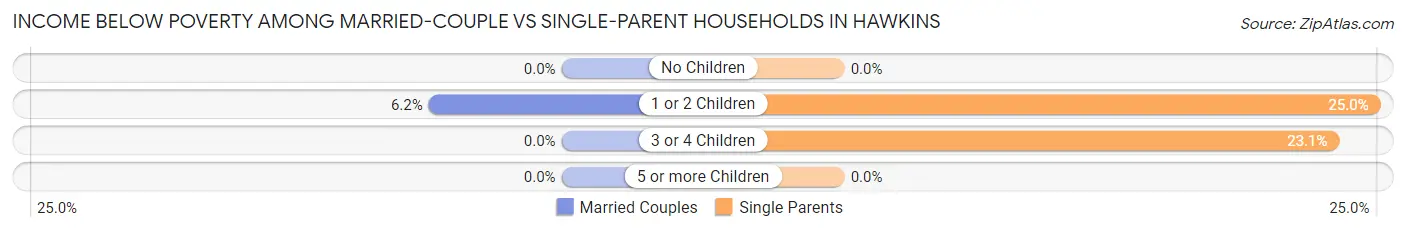
| Children | Married-Couple Families | Single-Parent Households |
| No Children | 0 (0.0%) | 0 (0.0%) |
| 1 or 2 Children | 6 (6.2%) | 5 (25.0%) |
| 3 or 4 Children | 0 (0.0%) | 6 (23.1%) |
| 5 or more Children | 0 (0.0%) | 0 (0.0%) |
| Total | 6 (2.2%) | 11 (12.0%) |
Race in Hawkins
The most populous races in Hawkins are White / Caucasian (1,151 | 66.0%), Black / African American (547 | 31.4%), and Hispanic or Latino (62 | 3.6%).
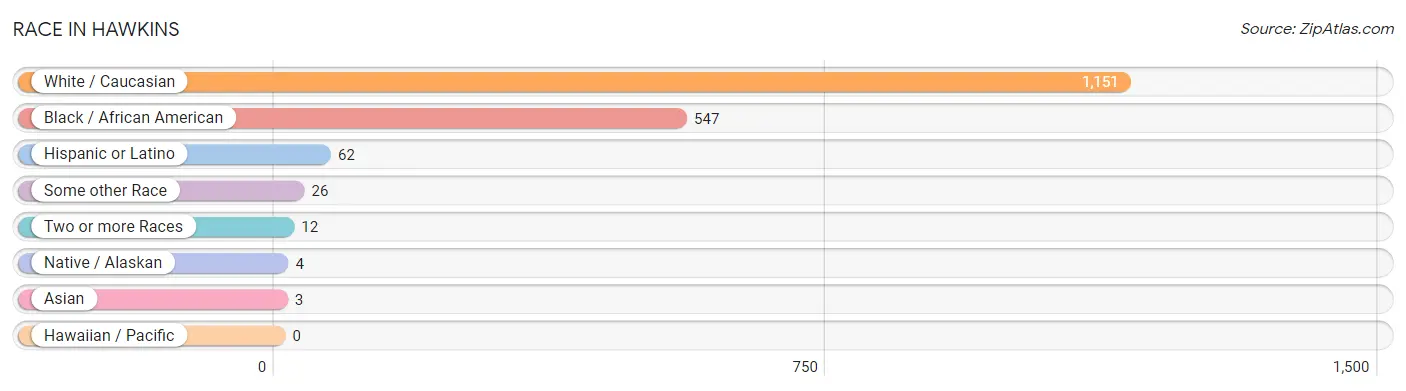
| Race | # Population | % Population |
| Asian | 3 | 0.2% |
| Black / African American | 547 | 31.4% |
| Hawaiian / Pacific | 0 | 0.0% |
| Hispanic or Latino | 62 | 3.6% |
| Native / Alaskan | 4 | 0.2% |
| White / Caucasian | 1,151 | 66.0% |
| Two or more Races | 12 | 0.7% |
| Some other Race | 26 | 1.5% |
| Total | 1,743 | 100.0% |
Ancestry in Hawkins
The most populous ancestries reported in Hawkins are English (170 | 9.8%), American (115 | 6.6%), German (74 | 4.3%), European (55 | 3.2%), and Mexican (38 | 2.2%), together accounting for 25.9% of all Hawkins residents.
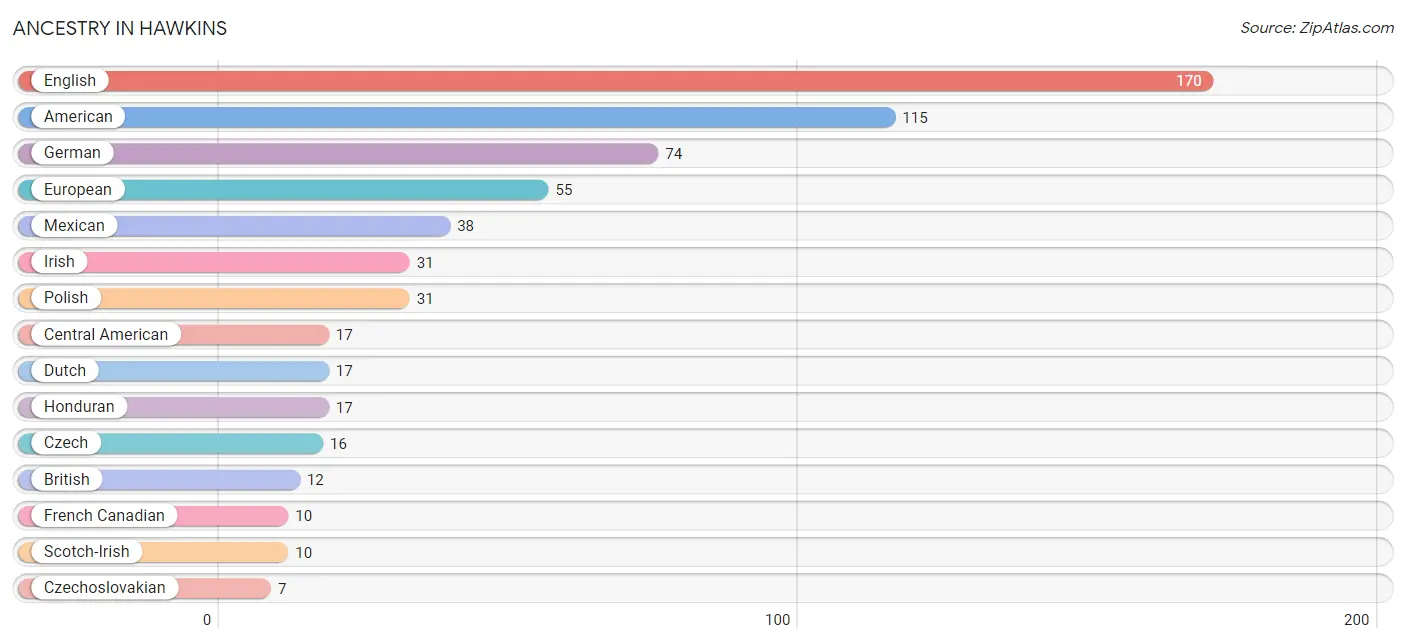
| Ancestry | # Population | % Population |
| American | 115 | 6.6% |
| British | 12 | 0.7% |
| Central American | 17 | 1.0% |
| Czech | 16 | 0.9% |
| Czechoslovakian | 7 | 0.4% |
| Dutch | 17 | 1.0% |
| English | 170 | 9.8% |
| European | 55 | 3.2% |
| French Canadian | 10 | 0.6% |
| German | 74 | 4.3% |
| Honduran | 17 | 1.0% |
| Irish | 31 | 1.8% |
| Italian | 5 | 0.3% |
| Korean | 3 | 0.2% |
| Lumbee | 2 | 0.1% |
| Mexican | 38 | 2.2% |
| Polish | 31 | 1.8% |
| Scotch-Irish | 10 | 0.6% |
| Spaniard | 7 | 0.4% | View All 19 Rows |
Immigrants in Hawkins
The most numerous immigrant groups reported in Hawkins came from Central America (9 | 0.5%), Latin America (9 | 0.5%), Mexico (9 | 0.5%), Asia (3 | 0.2%), and Philippines (3 | 0.2%), together accounting for 1.9% of all Hawkins residents.
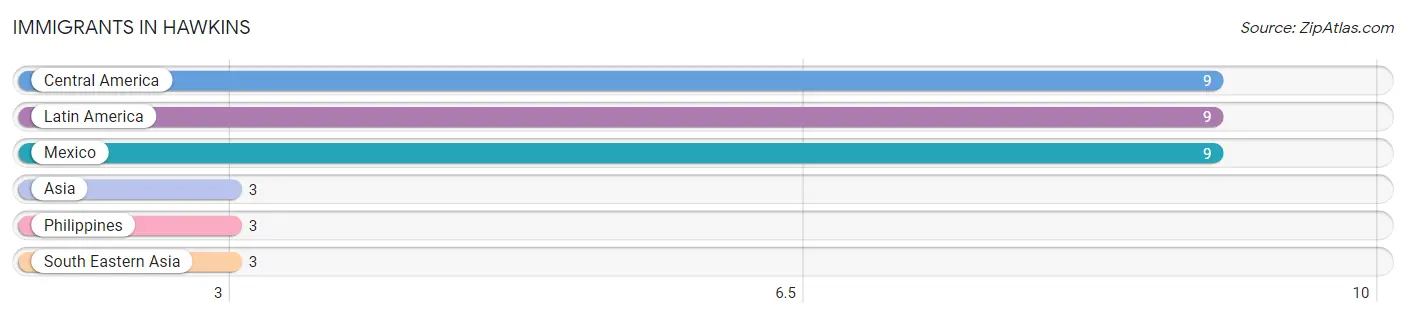
| Immigration Origin | # Population | % Population |
| Asia | 3 | 0.2% |
| Central America | 9 | 0.5% |
| Latin America | 9 | 0.5% |
| Mexico | 9 | 0.5% |
| Philippines | 3 | 0.2% |
| South Eastern Asia | 3 | 0.2% | View All 6 Rows |
Sex and Age in Hawkins
Sex and Age in Hawkins
The most populous age groups in Hawkins are 20 to 24 Years (114 | 13.2%) for men and 55 to 59 Years (111 | 12.6%) for women.
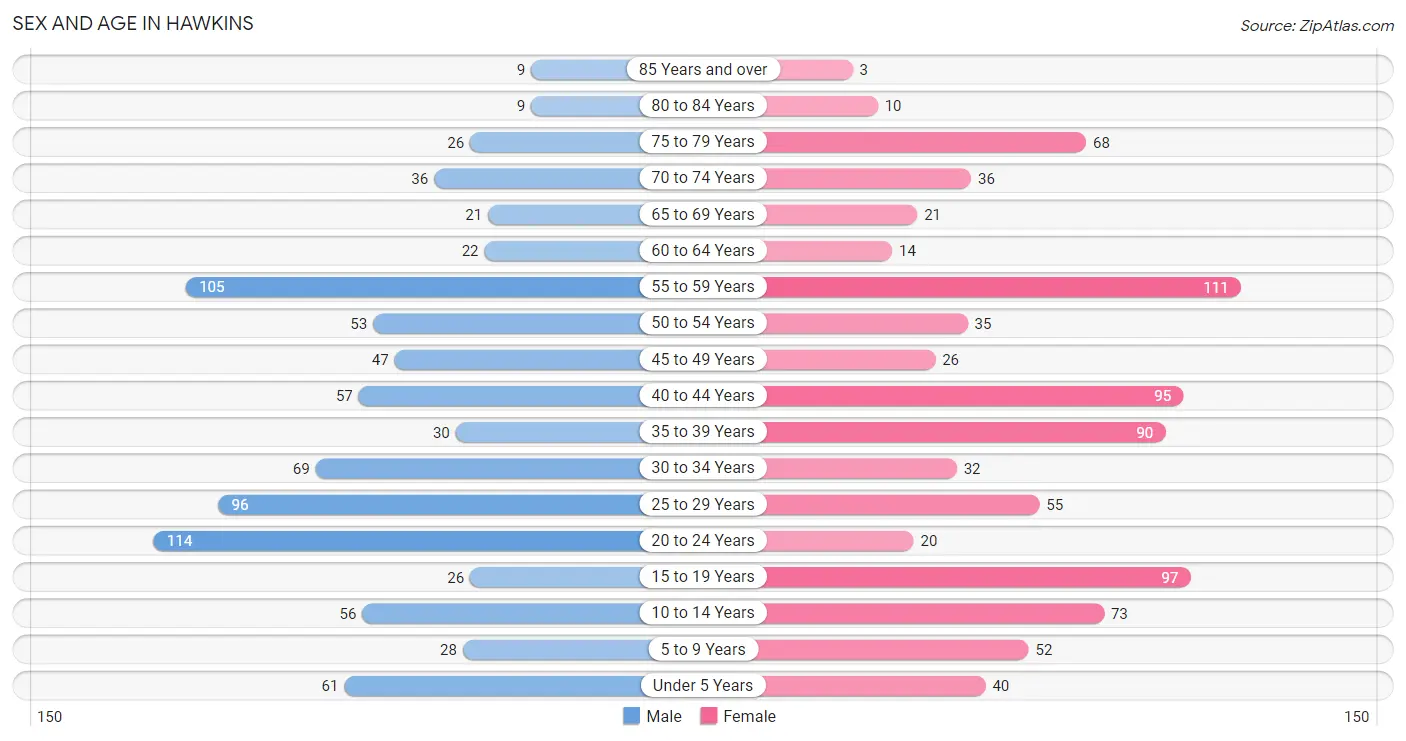
| Age Bracket | Male | Female |
| Under 5 Years | 61 (7.0%) | 40 (4.6%) |
| 5 to 9 Years | 28 (3.2%) | 52 (5.9%) |
| 10 to 14 Years | 56 (6.5%) | 73 (8.3%) |
| 15 to 19 Years | 26 (3.0%) | 97 (11.1%) |
| 20 to 24 Years | 114 (13.2%) | 20 (2.3%) |
| 25 to 29 Years | 96 (11.1%) | 55 (6.3%) |
| 30 to 34 Years | 69 (8.0%) | 32 (3.6%) |
| 35 to 39 Years | 30 (3.5%) | 90 (10.2%) |
| 40 to 44 Years | 57 (6.6%) | 95 (10.8%) |
| 45 to 49 Years | 47 (5.4%) | 26 (3.0%) |
| 50 to 54 Years | 53 (6.1%) | 35 (4.0%) |
| 55 to 59 Years | 105 (12.1%) | 111 (12.6%) |
| 60 to 64 Years | 22 (2.5%) | 14 (1.6%) |
| 65 to 69 Years | 21 (2.4%) | 21 (2.4%) |
| 70 to 74 Years | 36 (4.2%) | 36 (4.1%) |
| 75 to 79 Years | 26 (3.0%) | 68 (7.7%) |
| 80 to 84 Years | 9 (1.0%) | 10 (1.1%) |
| 85 Years and over | 9 (1.0%) | 3 (0.3%) |
| Total | 865 (100.0%) | 878 (100.0%) |
Families and Households in Hawkins
Median Family Size in Hawkins
The median family size in Hawkins is 3.59 persons per family, with single female/mother families (72 | 19.8%) accounting for the largest median family size of 4.39 persons per family. On the other hand, single male/father families (20 | 5.5%) represent the smallest median family size with 2.65 persons per family.
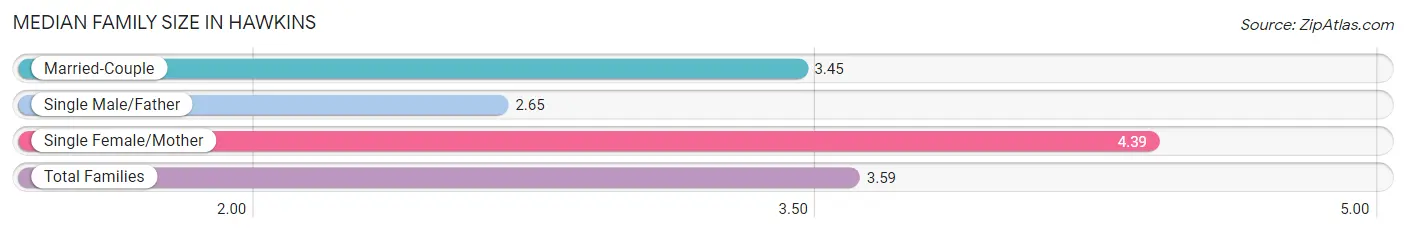
| Family Type | # Families | Family Size |
| Married-Couple | 271 (74.7%) | 3.45 |
| Single Male/Father | 20 (5.5%) | 2.65 |
| Single Female/Mother | 72 (19.8%) | 4.39 |
| Total Families | 363 (100.0%) | 3.59 |
Median Household Size in Hawkins
The median household size in Hawkins is 2.74 persons per household, with single female/mother households (72 | 11.5%) accounting for the largest median household size of 4.9 persons per household. non-family households (265 | 42.2%) represent the smallest median household size with 1.36 persons per household.
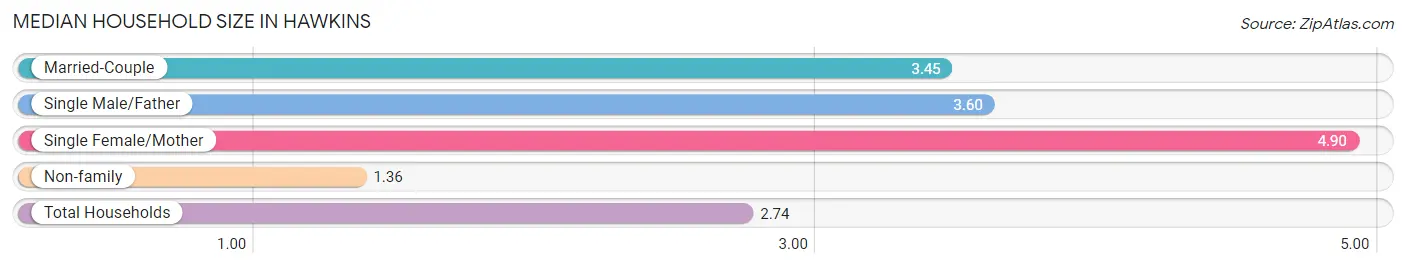
| Household Type | # Households | Household Size |
| Married-Couple | 271 (43.1%) | 3.45 |
| Single Male/Father | 20 (3.2%) | 3.60 |
| Single Female/Mother | 72 (11.5%) | 4.90 |
| Non-family | 265 (42.2%) | 1.36 |
| Total Households | 628 (100.0%) | 2.74 |
Household Size by Marriage Status in Hawkins
Out of a total of 628 households in Hawkins, 363 (57.8%) are family households, while 265 (42.2%) are nonfamily households. The most numerous type of family households are 2-person households, comprising 134, and the most common type of nonfamily households are 1-person households, comprising 200.
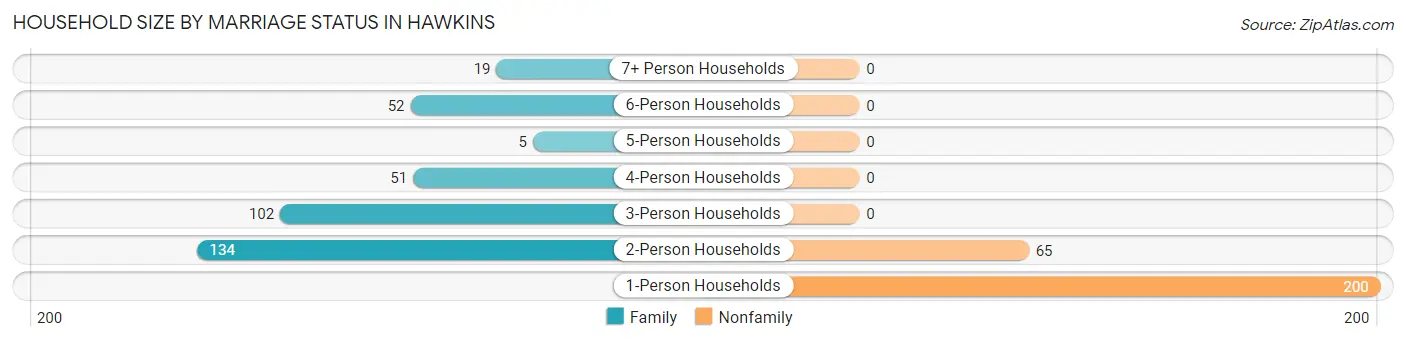
| Household Size | Family Households | Nonfamily Households |
| 1-Person Households | - | 200 (31.9%) |
| 2-Person Households | 134 (21.3%) | 65 (10.3%) |
| 3-Person Households | 102 (16.2%) | 0 (0.0%) |
| 4-Person Households | 51 (8.1%) | 0 (0.0%) |
| 5-Person Households | 5 (0.8%) | 0 (0.0%) |
| 6-Person Households | 52 (8.3%) | 0 (0.0%) |
| 7+ Person Households | 19 (3.0%) | 0 (0.0%) |
| Total | 363 (57.8%) | 265 (42.2%) |
Female Fertility in Hawkins
Fertility by Age in Hawkins
Average fertility rate in Hawkins is 34.0 births per 1,000 women. Women in the age bracket of 15 to 19 years have the highest fertility rate with 82.0 births per 1,000 women. Women in the age bracket of 15 to 19 years acount for 57.1% of all women with births.
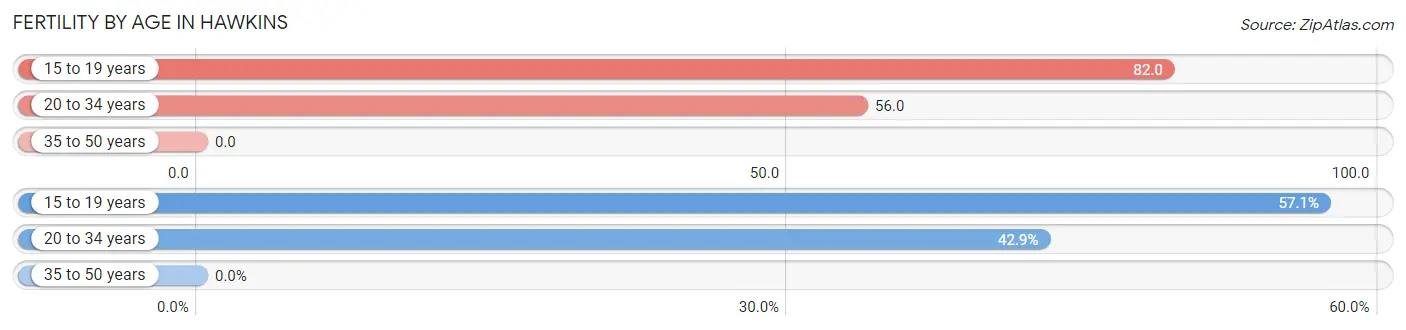
| Age Bracket | Women with Births | Births / 1,000 Women |
| 15 to 19 years | 8 (57.1%) | 82.0 |
| 20 to 34 years | 6 (42.9%) | 56.0 |
| 35 to 50 years | 0 (0.0%) | 0.0 |
| Total | 14 (100.0%) | 34.0 |
Fertility by Age by Marriage Status in Hawkins
14.3% of women with births (14) in Hawkins are married. The highest percentage of unmarried women with births falls into 15 to 19 years age bracket with 100.0% of them unmarried at the time of birth, while the lowest percentage of unmarried women with births belong to 20 to 34 years age bracket with 66.7% of them unmarried.
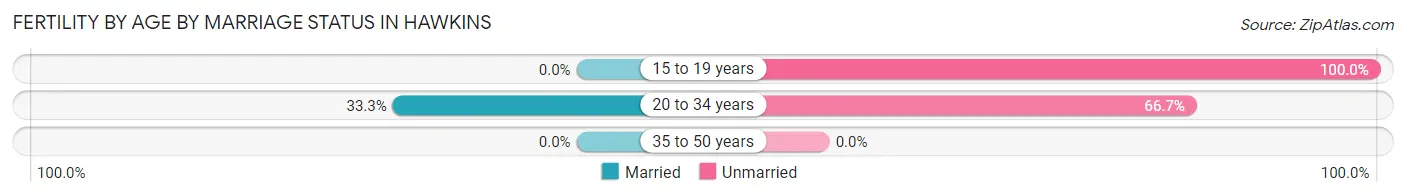
| Age Bracket | Married | Unmarried |
| 15 to 19 years | 0 (0.0%) | 8 (100.0%) |
| 20 to 34 years | 2 (33.3%) | 4 (66.7%) |
| 35 to 50 years | 0 (0.0%) | 0 (0.0%) |
| Total | 2 (14.3%) | 12 (85.7%) |
Fertility by Education in Hawkins
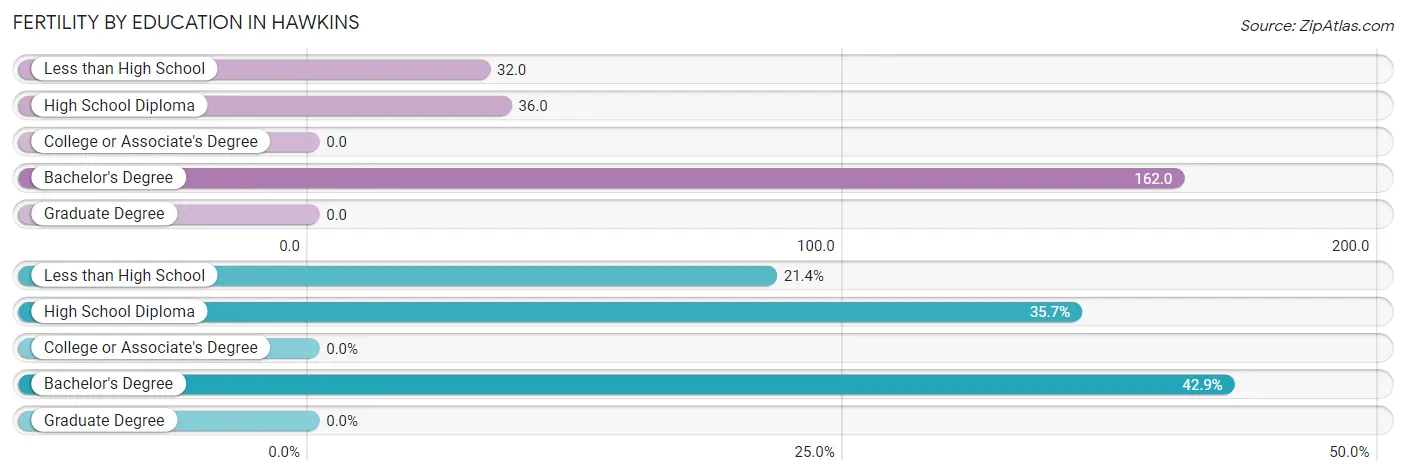
| Educational Attainment | Women with Births | Births / 1,000 Women |
| Less than High School | 3 (21.4%) | 32.0 |
| High School Diploma | 5 (35.7%) | 36.0 |
| College or Associate's Degree | 0 (0.0%) | 0.0 |
| Bachelor's Degree | 6 (42.9%) | 162.0 |
| Graduate Degree | 0 (0.0%) | 0.0 |
| Total | 14 (100.0%) | 34.0 |
Fertility by Education by Marriage Status in Hawkins
85.7% of women with births in Hawkins are unmarried. Women with the educational attainment of bachelor's degree are most likely to be married with 33.3% of them married at childbirth, while women with the educational attainment of less than high school are least likely to be married with 100.0% of them unmarried at childbirth.
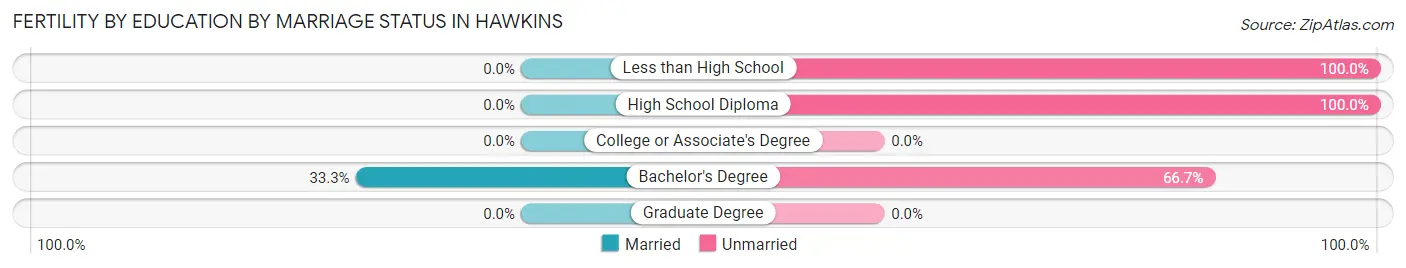
| Educational Attainment | Married | Unmarried |
| Less than High School | 0 (0.0%) | 3 (100.0%) |
| High School Diploma | 0 (0.0%) | 5 (100.0%) |
| College or Associate's Degree | 0 (0.0%) | 0 (0.0%) |
| Bachelor's Degree | 2 (33.3%) | 4 (66.7%) |
| Graduate Degree | 0 (0.0%) | 0 (0.0%) |
| Total | 2 (14.3%) | 12 (85.7%) |
Employment Characteristics in Hawkins
Employment by Class of Employer in Hawkins
Among the 886 employed individuals in Hawkins, private company employees (544 | 61.4%), local government employees (149 | 16.8%), and not-for-profit organizations (106 | 12.0%) make up the most common classes of employment.
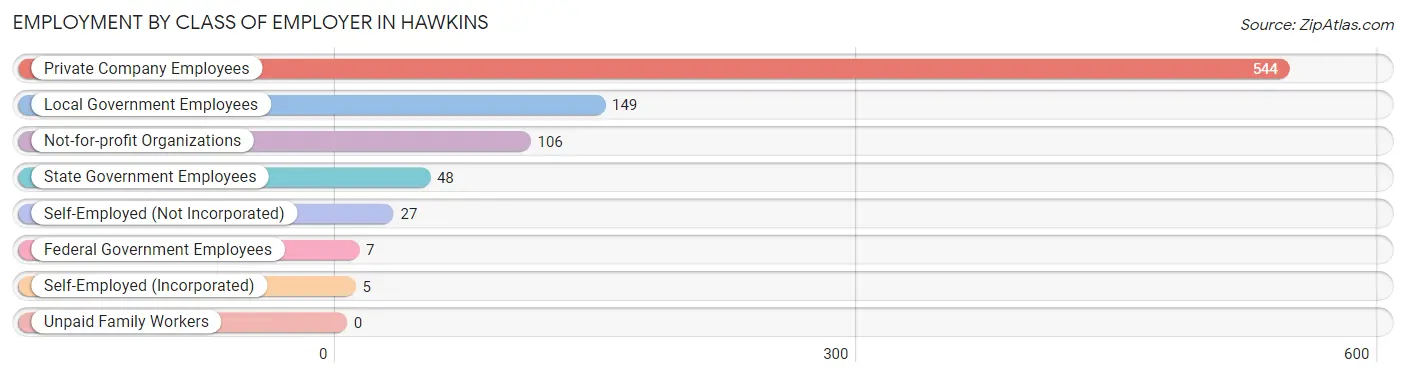
| Employer Class | # Employees | % Employees |
| Private Company Employees | 544 | 61.4% |
| Self-Employed (Incorporated) | 5 | 0.6% |
| Self-Employed (Not Incorporated) | 27 | 3.0% |
| Not-for-profit Organizations | 106 | 12.0% |
| Local Government Employees | 149 | 16.8% |
| State Government Employees | 48 | 5.4% |
| Federal Government Employees | 7 | 0.8% |
| Unpaid Family Workers | 0 | 0.0% |
| Total | 886 | 100.0% |
Employment Status by Age in Hawkins
According to the labor force statistics for Hawkins, out of the total population over 16 years of age (1,412), 68.5% or 967 individuals are in the labor force, with 8.4% or 81 of them unemployed. The age group with the highest labor force participation rate is 30 to 34 years, with 97.0% or 98 individuals in the labor force. Within the labor force, the 16 to 19 years age range has the highest percentage of unemployed individuals, with 63.8% or 30 of them being unemployed.
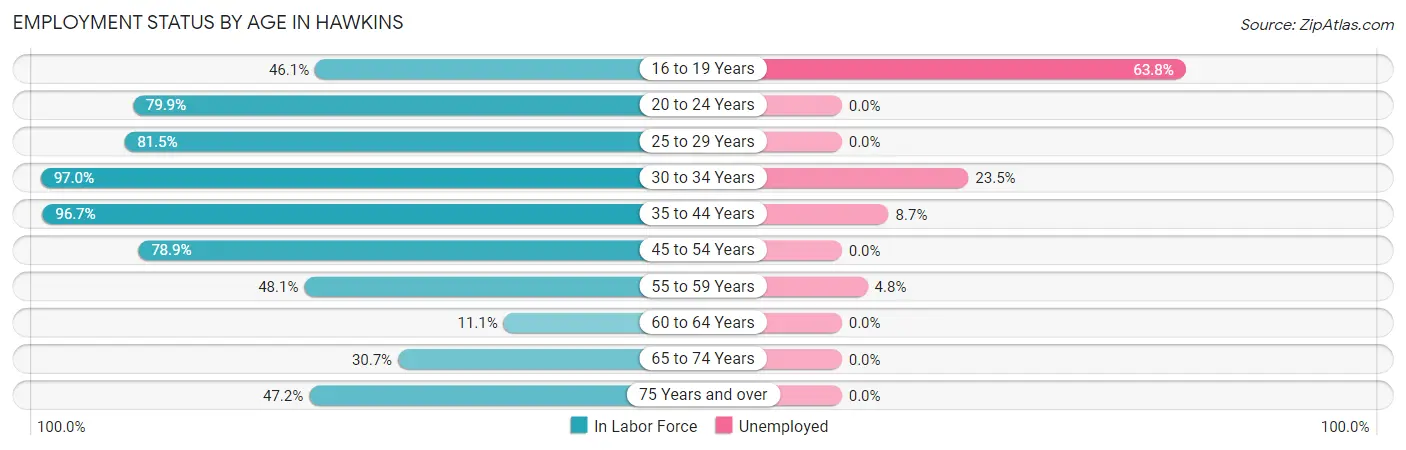
| Age Bracket | In Labor Force | Unemployed |
| 16 to 19 Years | 47 (46.1%) | 30 (63.8%) |
| 20 to 24 Years | 107 (79.9%) | 0 (0.0%) |
| 25 to 29 Years | 123 (81.5%) | 0 (0.0%) |
| 30 to 34 Years | 98 (97.0%) | 23 (23.5%) |
| 35 to 44 Years | 263 (96.7%) | 23 (8.7%) |
| 45 to 54 Years | 127 (78.9%) | 0 (0.0%) |
| 55 to 59 Years | 104 (48.1%) | 5 (4.8%) |
| 60 to 64 Years | 4 (11.1%) | 0 (0.0%) |
| 65 to 74 Years | 35 (30.7%) | 0 (0.0%) |
| 75 Years and over | 59 (47.2%) | 0 (0.0%) |
| Total | 967 (68.5%) | 81 (8.4%) |
Employment Status by Educational Attainment in Hawkins
According to labor force statistics for Hawkins, 76.7% of individuals (719) out of the total population between 25 and 64 years of age (937) are in the labor force, with 7.1% or 51 of them being unemployed. The group with the highest labor force participation rate are those with the educational attainment of bachelor's degree or higher, with 90.4% or 150 individuals in the labor force. Within the labor force, individuals with high school diploma education have the highest percentage of unemployment, with 12.8% or 38 of them being unemployed.
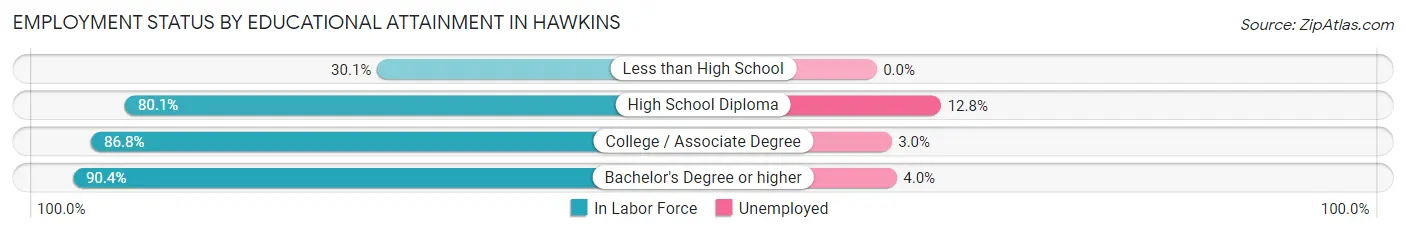
| Educational Attainment | In Labor Force | Unemployed |
| Less than High School | 40 (30.1%) | 0 (0.0%) |
| High School Diploma | 298 (80.1%) | 48 (12.8%) |
| College / Associate Degree | 231 (86.8%) | 8 (3.0%) |
| Bachelor's Degree or higher | 150 (90.4%) | 7 (4.0%) |
| Total | 719 (76.7%) | 67 (7.1%) |
Employment Occupations by Sex in Hawkins
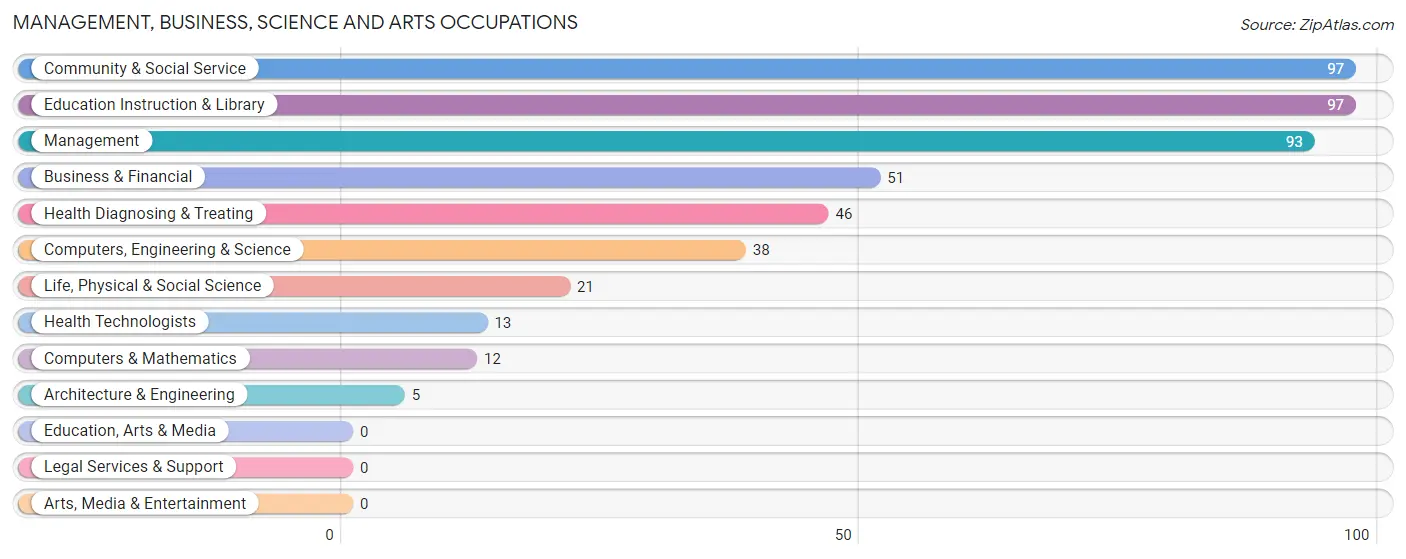
Management, Business, Science and Arts Occupations
The most common Management, Business, Science and Arts occupations in Hawkins are Community & Social Service (97 | 11.0%), Education Instruction & Library (97 | 11.0%), Management (93 | 10.5%), Business & Financial (51 | 5.8%), and Health Diagnosing & Treating (46 | 5.2%).
Management, Business, Science and Arts Occupations by Sex
Within the Management, Business, Science and Arts occupations in Hawkins, the most male-oriented occupations are Architecture & Engineering (100.0%), Life, Physical & Social Science (100.0%), and Computers, Engineering & Science (89.5%), while the most female-oriented occupations are Health Technologists (100.0%), Community & Social Service (76.3%), and Education Instruction & Library (76.3%).
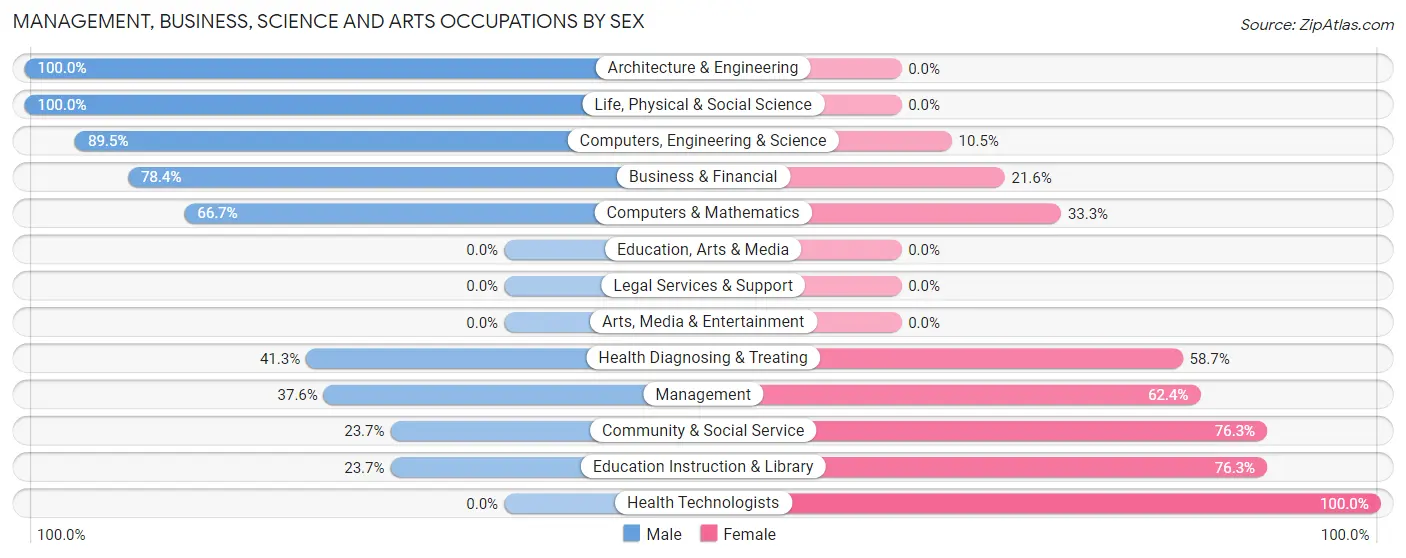
| Occupation | Male | Female |
| Management | 35 (37.6%) | 58 (62.4%) |
| Business & Financial | 40 (78.4%) | 11 (21.6%) |
| Computers, Engineering & Science | 34 (89.5%) | 4 (10.5%) |
| Computers & Mathematics | 8 (66.7%) | 4 (33.3%) |
| Architecture & Engineering | 5 (100.0%) | 0 (0.0%) |
| Life, Physical & Social Science | 21 (100.0%) | 0 (0.0%) |
| Community & Social Service | 23 (23.7%) | 74 (76.3%) |
| Education, Arts & Media | 0 (0.0%) | 0 (0.0%) |
| Legal Services & Support | 0 (0.0%) | 0 (0.0%) |
| Education Instruction & Library | 23 (23.7%) | 74 (76.3%) |
| Arts, Media & Entertainment | 0 (0.0%) | 0 (0.0%) |
| Health Diagnosing & Treating | 19 (41.3%) | 27 (58.7%) |
| Health Technologists | 0 (0.0%) | 13 (100.0%) |
| Total (Category) | 151 (46.5%) | 174 (53.5%) |
| Total (Overall) | 481 (54.3%) | 405 (45.7%) |
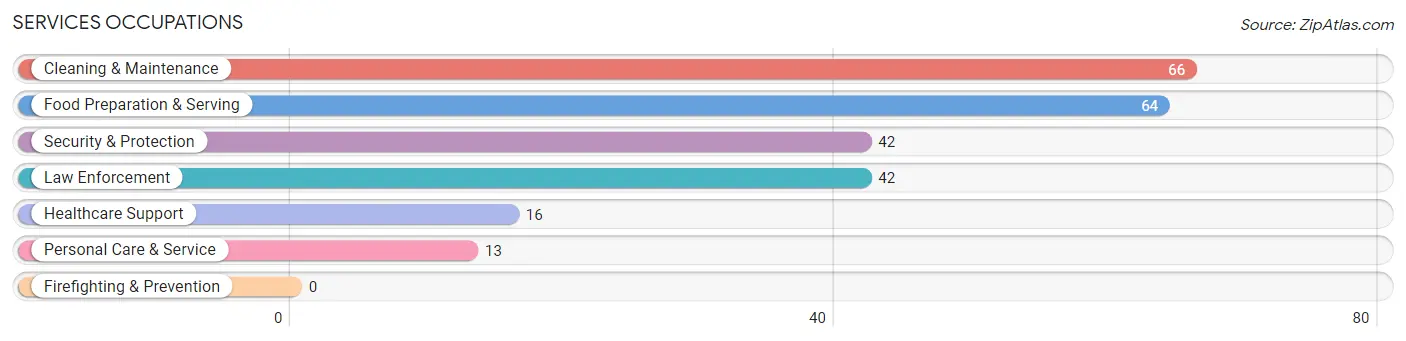
Services Occupations
The most common Services occupations in Hawkins are Cleaning & Maintenance (66 | 7.4%), Food Preparation & Serving (64 | 7.2%), Security & Protection (42 | 4.7%), Law Enforcement (42 | 4.7%), and Healthcare Support (16 | 1.8%).
Services Occupations by Sex
Within the Services occupations in Hawkins, the most male-oriented occupations are Cleaning & Maintenance (69.7%), Food Preparation & Serving (51.6%), and Security & Protection (33.3%), while the most female-oriented occupations are Healthcare Support (100.0%), Personal Care & Service (100.0%), and Security & Protection (66.7%).
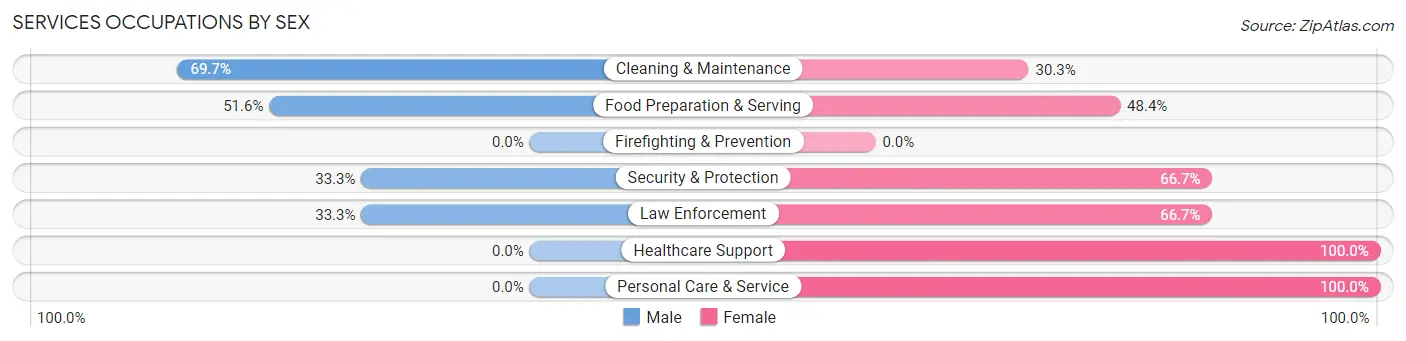
| Occupation | Male | Female |
| Healthcare Support | 0 (0.0%) | 16 (100.0%) |
| Security & Protection | 14 (33.3%) | 28 (66.7%) |
| Firefighting & Prevention | 0 (0.0%) | 0 (0.0%) |
| Law Enforcement | 14 (33.3%) | 28 (66.7%) |
| Food Preparation & Serving | 33 (51.6%) | 31 (48.4%) |
| Cleaning & Maintenance | 46 (69.7%) | 20 (30.3%) |
| Personal Care & Service | 0 (0.0%) | 13 (100.0%) |
| Total (Category) | 93 (46.3%) | 108 (53.7%) |
| Total (Overall) | 481 (54.3%) | 405 (45.7%) |
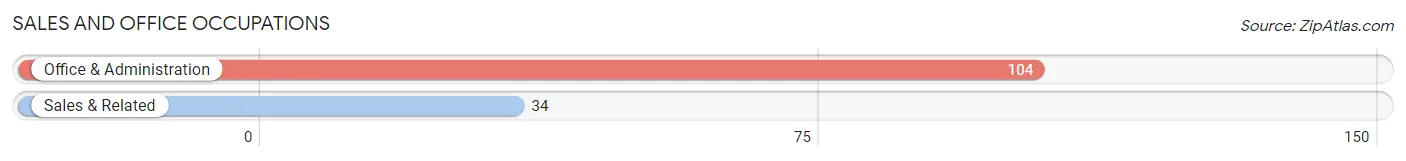
Sales and Office Occupations
The most common Sales and Office occupations in Hawkins are Office & Administration (104 | 11.7%), and Sales & Related (34 | 3.8%).
Sales and Office Occupations by Sex
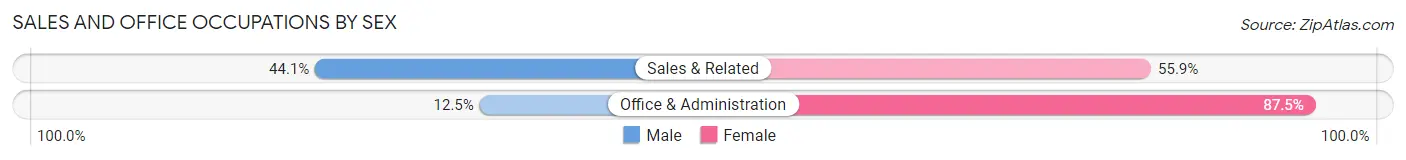
| Occupation | Male | Female |
| Sales & Related | 15 (44.1%) | 19 (55.9%) |
| Office & Administration | 13 (12.5%) | 91 (87.5%) |
| Total (Category) | 28 (20.3%) | 110 (79.7%) |
| Total (Overall) | 481 (54.3%) | 405 (45.7%) |
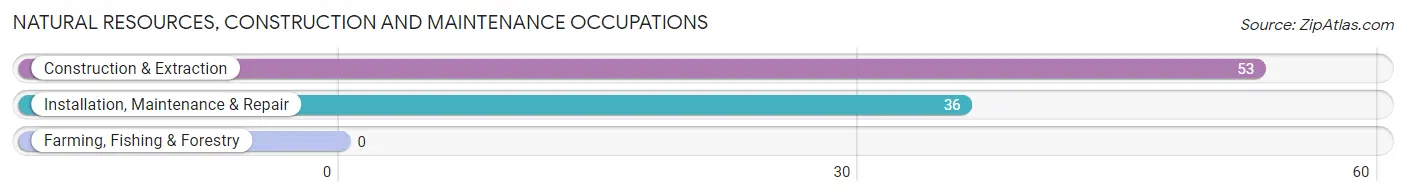
Natural Resources, Construction and Maintenance Occupations
The most common Natural Resources, Construction and Maintenance occupations in Hawkins are Construction & Extraction (53 | 6.0%), and Installation, Maintenance & Repair (36 | 4.1%).
Natural Resources, Construction and Maintenance Occupations by Sex
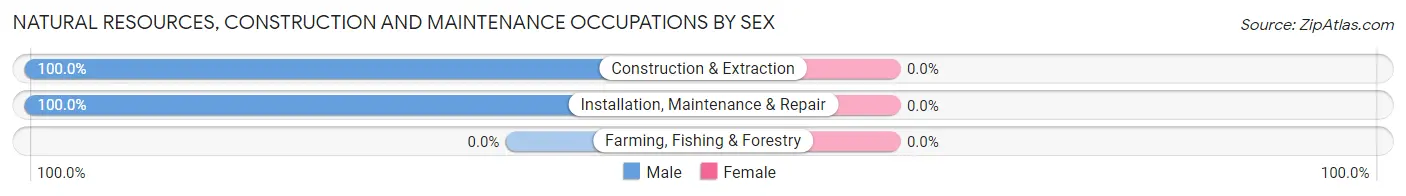
| Occupation | Male | Female |
| Farming, Fishing & Forestry | 0 (0.0%) | 0 (0.0%) |
| Construction & Extraction | 53 (100.0%) | 0 (0.0%) |
| Installation, Maintenance & Repair | 36 (100.0%) | 0 (0.0%) |
| Total (Category) | 89 (100.0%) | 0 (0.0%) |
| Total (Overall) | 481 (54.3%) | 405 (45.7%) |
Production, Transportation and Moving Occupations
The most common Production, Transportation and Moving occupations in Hawkins are Material Moving (65 | 7.3%), Production (44 | 5.0%), and Transportation (24 | 2.7%).
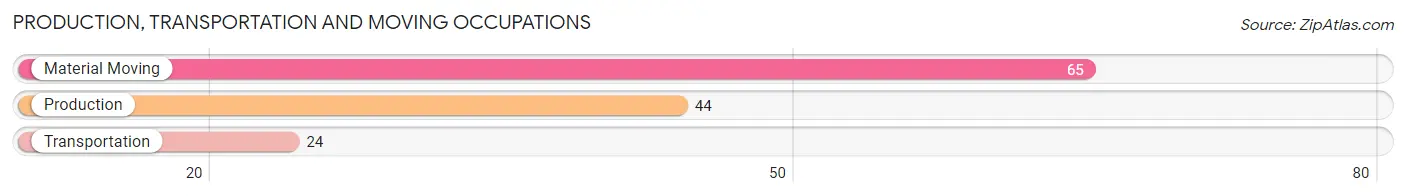
Production, Transportation and Moving Occupations by Sex
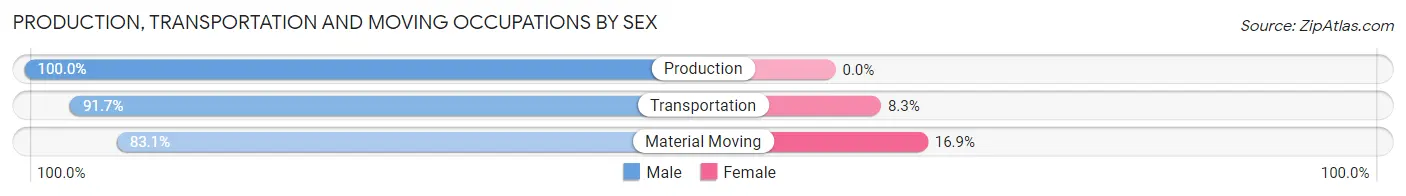
| Occupation | Male | Female |
| Production | 44 (100.0%) | 0 (0.0%) |
| Transportation | 22 (91.7%) | 2 (8.3%) |
| Material Moving | 54 (83.1%) | 11 (16.9%) |
| Total (Category) | 120 (90.2%) | 13 (9.8%) |
| Total (Overall) | 481 (54.3%) | 405 (45.7%) |
Employment Industries by Sex in Hawkins
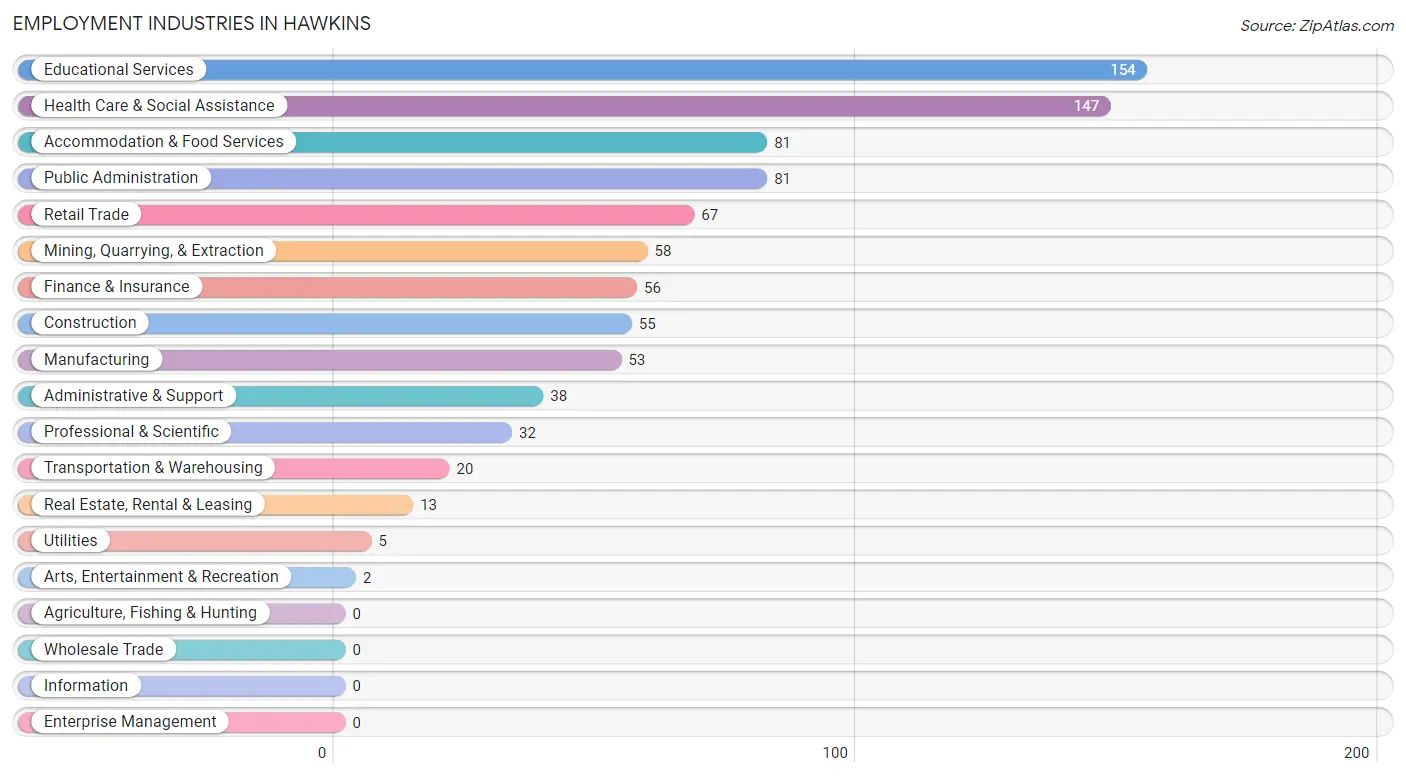
Employment Industries in Hawkins
The major employment industries in Hawkins include Educational Services (154 | 17.4%), Health Care & Social Assistance (147 | 16.6%), Accommodation & Food Services (81 | 9.1%), Public Administration (81 | 9.1%), and Retail Trade (67 | 7.6%).
Employment Industries by Sex in Hawkins
The Hawkins industries that see more men than women are Mining, Quarrying, & Extraction (100.0%), Construction (100.0%), and Manufacturing (100.0%), whereas the industries that tend to have a higher number of women are Real Estate, Rental & Leasing (100.0%), Educational Services (85.1%), and Professional & Scientific (84.4%).
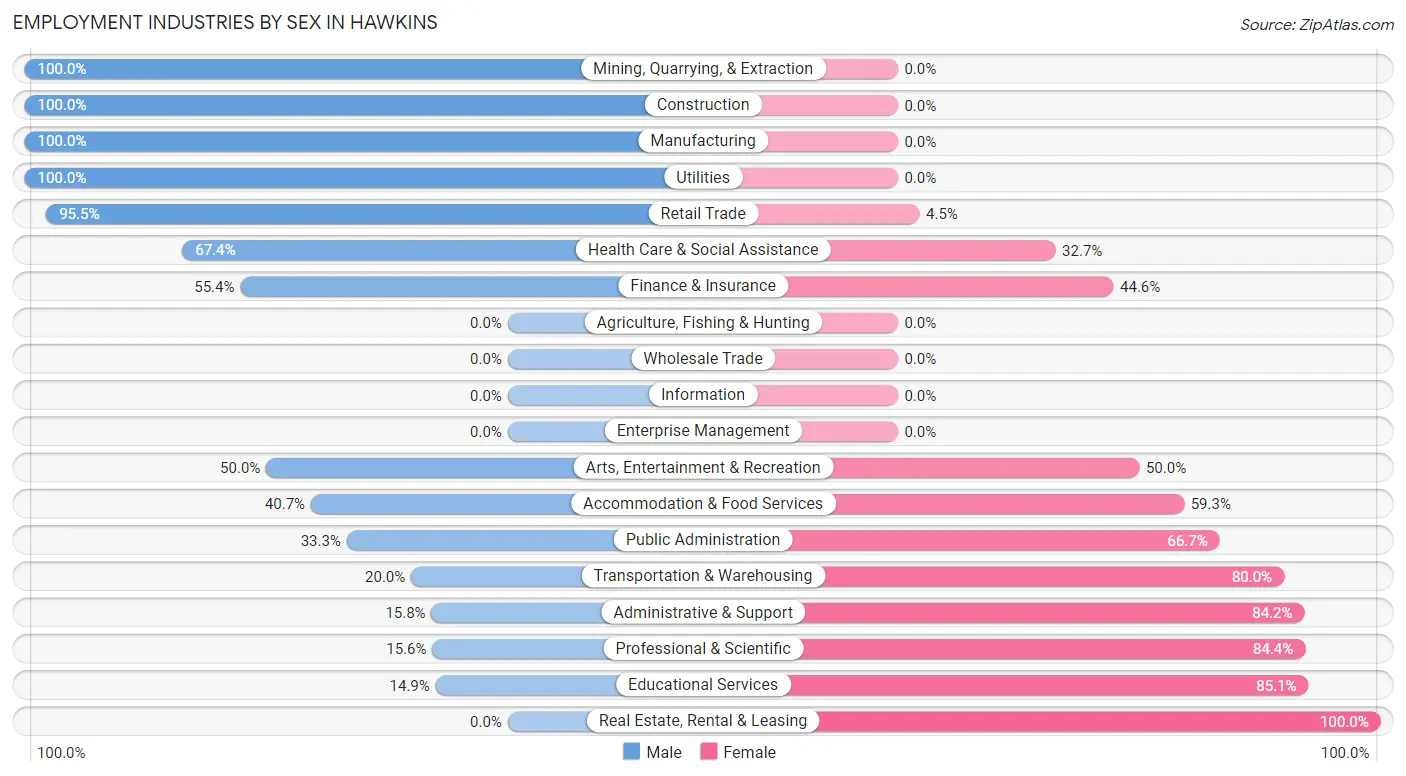
| Industry | Male | Female |
| Agriculture, Fishing & Hunting | 0 (0.0%) | 0 (0.0%) |
| Mining, Quarrying, & Extraction | 58 (100.0%) | 0 (0.0%) |
| Construction | 55 (100.0%) | 0 (0.0%) |
| Manufacturing | 53 (100.0%) | 0 (0.0%) |
| Wholesale Trade | 0 (0.0%) | 0 (0.0%) |
| Retail Trade | 64 (95.5%) | 3 (4.5%) |
| Transportation & Warehousing | 4 (20.0%) | 16 (80.0%) |
| Utilities | 5 (100.0%) | 0 (0.0%) |
| Information | 0 (0.0%) | 0 (0.0%) |
| Finance & Insurance | 31 (55.4%) | 25 (44.6%) |
| Real Estate, Rental & Leasing | 0 (0.0%) | 13 (100.0%) |
| Professional & Scientific | 5 (15.6%) | 27 (84.4%) |
| Enterprise Management | 0 (0.0%) | 0 (0.0%) |
| Administrative & Support | 6 (15.8%) | 32 (84.2%) |
| Educational Services | 23 (14.9%) | 131 (85.1%) |
| Health Care & Social Assistance | 99 (67.3%) | 48 (32.7%) |
| Arts, Entertainment & Recreation | 1 (50.0%) | 1 (50.0%) |
| Accommodation & Food Services | 33 (40.7%) | 48 (59.3%) |
| Public Administration | 27 (33.3%) | 54 (66.7%) |
| Total | 481 (54.3%) | 405 (45.7%) |
Education in Hawkins
School Enrollment in Hawkins
The most common levels of schooling among the 358 students in Hawkins are middle school (130 | 36.3%), high school (77 | 21.5%), and elementary school (52 | 14.5%).
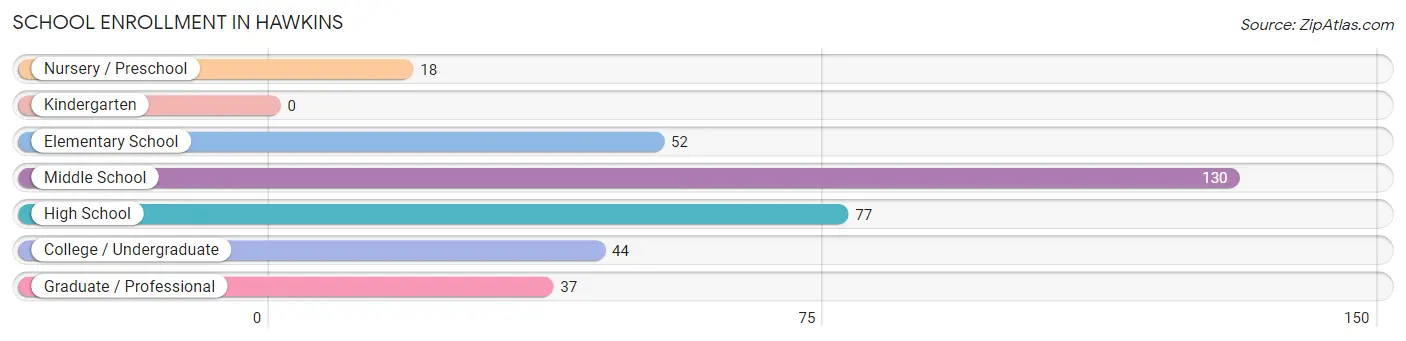
| School Level | # Students | % Students |
| Nursery / Preschool | 18 | 5.0% |
| Kindergarten | 0 | 0.0% |
| Elementary School | 52 | 14.5% |
| Middle School | 130 | 36.3% |
| High School | 77 | 21.5% |
| College / Undergraduate | 44 | 12.3% |
| Graduate / Professional | 37 | 10.3% |
| Total | 358 | 100.0% |
School Enrollment by Age by Funding Source in Hawkins
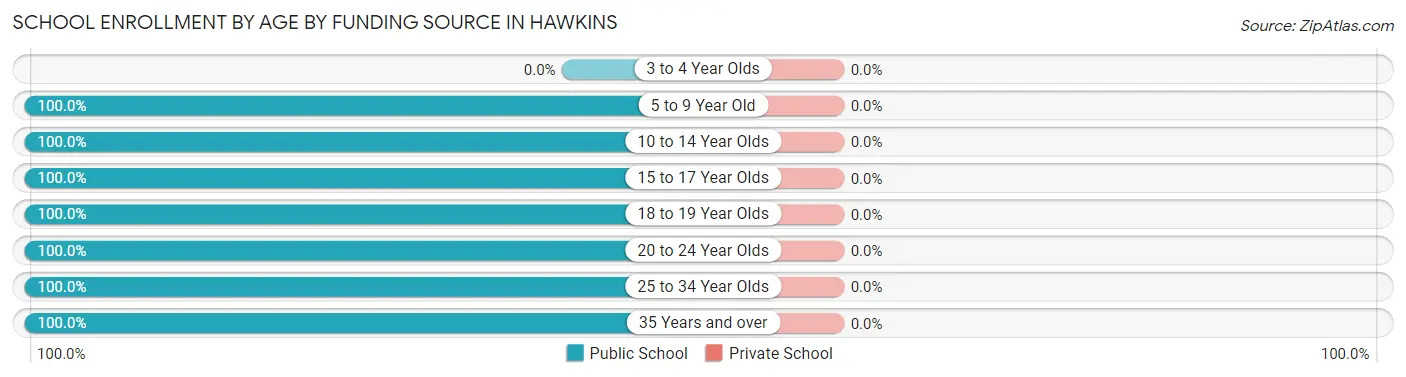
| Age Bracket | Public School | Private School |
| 3 to 4 Year Olds | 0 (0.0%) | 0 (0.0%) |
| 5 to 9 Year Old | 67 (100.0%) | 0 (0.0%) |
| 10 to 14 Year Olds | 129 (100.0%) | 0 (0.0%) |
| 15 to 17 Year Olds | 55 (100.0%) | 0 (0.0%) |
| 18 to 19 Year Olds | 33 (100.0%) | 0 (0.0%) |
| 20 to 24 Year Olds | 16 (100.0%) | 0 (0.0%) |
| 25 to 34 Year Olds | 22 (100.0%) | 0 (0.0%) |
| 35 Years and over | 36 (100.0%) | 0 (0.0%) |
| Total | 358 (100.0%) | 0 (0.0%) |
Educational Attainment by Field of Study in Hawkins
Literature & languages (51 | 20.3%), engineering (38 | 15.1%), business (37 | 14.7%), education (34 | 13.6%), and arts & humanities (30 | 11.9%) are the most common fields of study among 251 individuals in Hawkins who have obtained a bachelor's degree or higher.
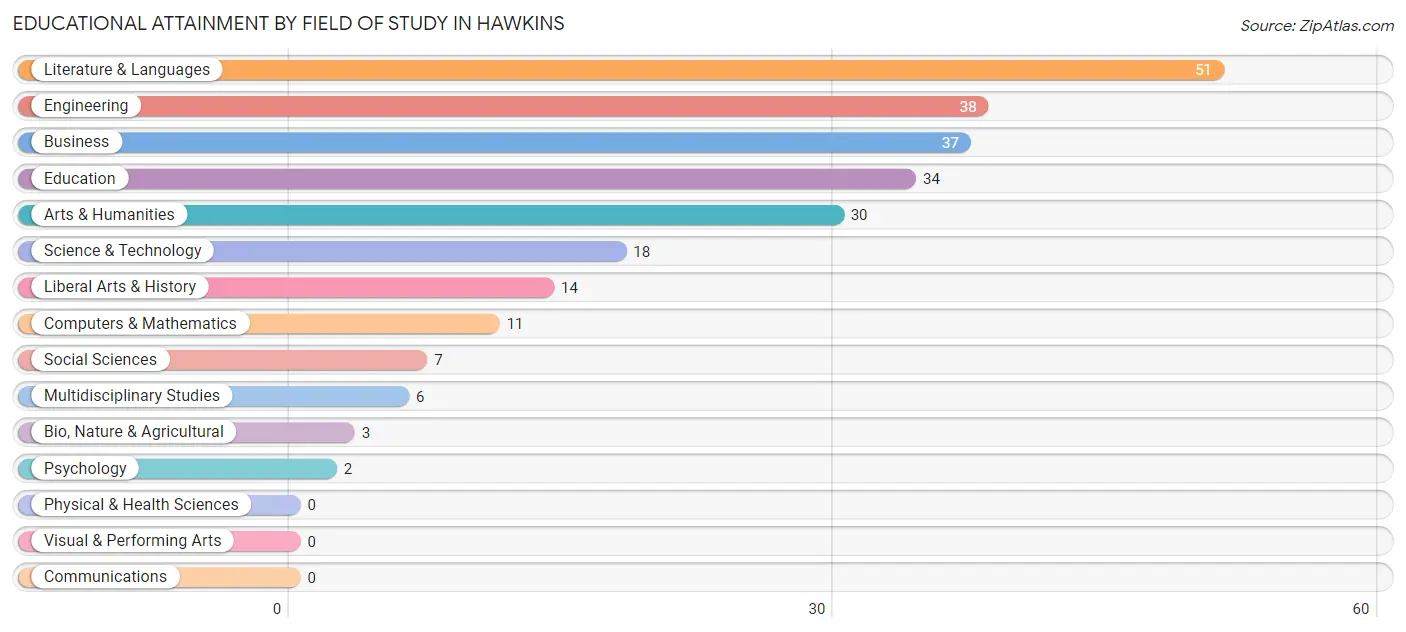
| Field of Study | # Graduates | % Graduates |
| Computers & Mathematics | 11 | 4.4% |
| Bio, Nature & Agricultural | 3 | 1.2% |
| Physical & Health Sciences | 0 | 0.0% |
| Psychology | 2 | 0.8% |
| Social Sciences | 7 | 2.8% |
| Engineering | 38 | 15.1% |
| Multidisciplinary Studies | 6 | 2.4% |
| Science & Technology | 18 | 7.2% |
| Business | 37 | 14.7% |
| Education | 34 | 13.6% |
| Literature & Languages | 51 | 20.3% |
| Liberal Arts & History | 14 | 5.6% |
| Visual & Performing Arts | 0 | 0.0% |
| Communications | 0 | 0.0% |
| Arts & Humanities | 30 | 11.9% |
| Total | 251 | 100.0% |
Transportation & Commute in Hawkins
Vehicle Availability by Sex in Hawkins
The most prevalent vehicle ownership categories in Hawkins are males with 3 vehicles (198, accounting for 41.2%) and females with 3 vehicles (150, making up 48.9%).
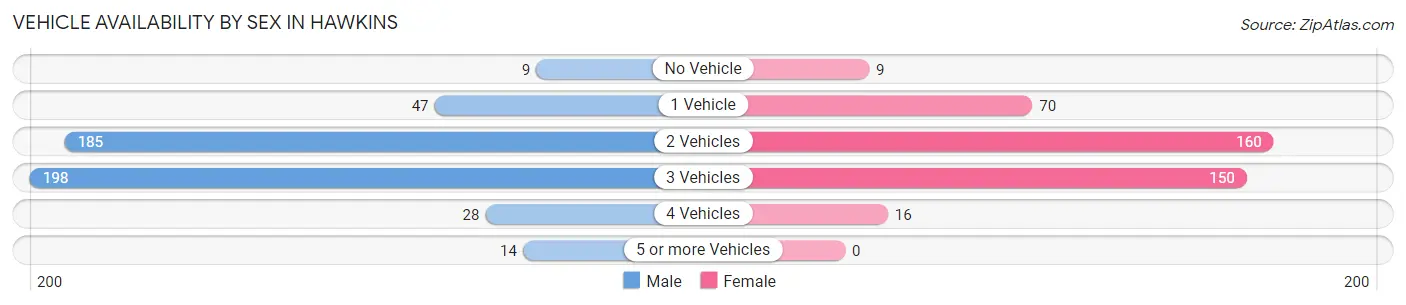
| Vehicles Available | Male | Female |
| No Vehicle | 9 (1.9%) | 9 (2.2%) |
| 1 Vehicle | 47 (9.8%) | 70 (17.3%) |
| 2 Vehicles | 185 (38.5%) | 160 (39.5%) |
| 3 Vehicles | 198 (41.2%) | 150 (37.0%) |
| 4 Vehicles | 28 (5.8%) | 16 (4.0%) |
| 5 or more Vehicles | 14 (2.9%) | 0 (0.0%) |
| Total | 481 (100.0%) | 405 (100.0%) |
Commute Time in Hawkins
The most frequently occuring commute durations in Hawkins are 5 to 9 minutes (205 commuters, 23.8%), 30 to 34 minutes (185 commuters, 21.5%), and less than 5 minutes (121 commuters, 14.1%).
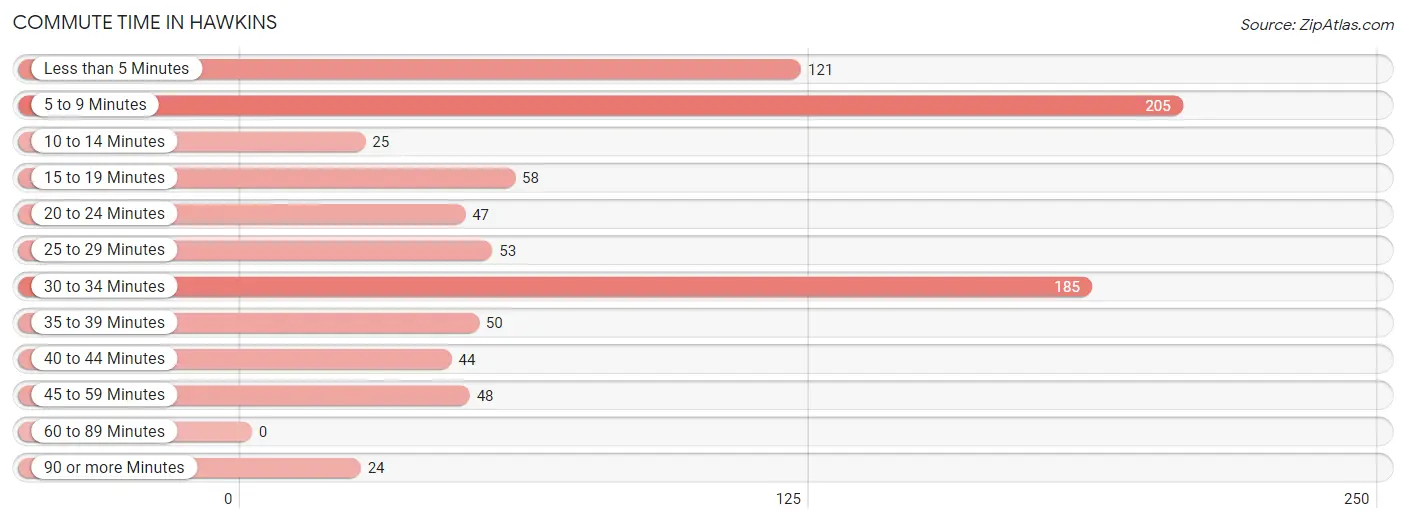
| Commute Time | # Commuters | % Commuters |
| Less than 5 Minutes | 121 | 14.1% |
| 5 to 9 Minutes | 205 | 23.8% |
| 10 to 14 Minutes | 25 | 2.9% |
| 15 to 19 Minutes | 58 | 6.7% |
| 20 to 24 Minutes | 47 | 5.5% |
| 25 to 29 Minutes | 53 | 6.2% |
| 30 to 34 Minutes | 185 | 21.5% |
| 35 to 39 Minutes | 50 | 5.8% |
| 40 to 44 Minutes | 44 | 5.1% |
| 45 to 59 Minutes | 48 | 5.6% |
| 60 to 89 Minutes | 0 | 0.0% |
| 90 or more Minutes | 24 | 2.8% |
Commute Time by Sex in Hawkins
The most common commute times in Hawkins are 5 to 9 minutes (105 commuters, 22.7%) for males and 5 to 9 minutes (100 commuters, 25.2%) for females.
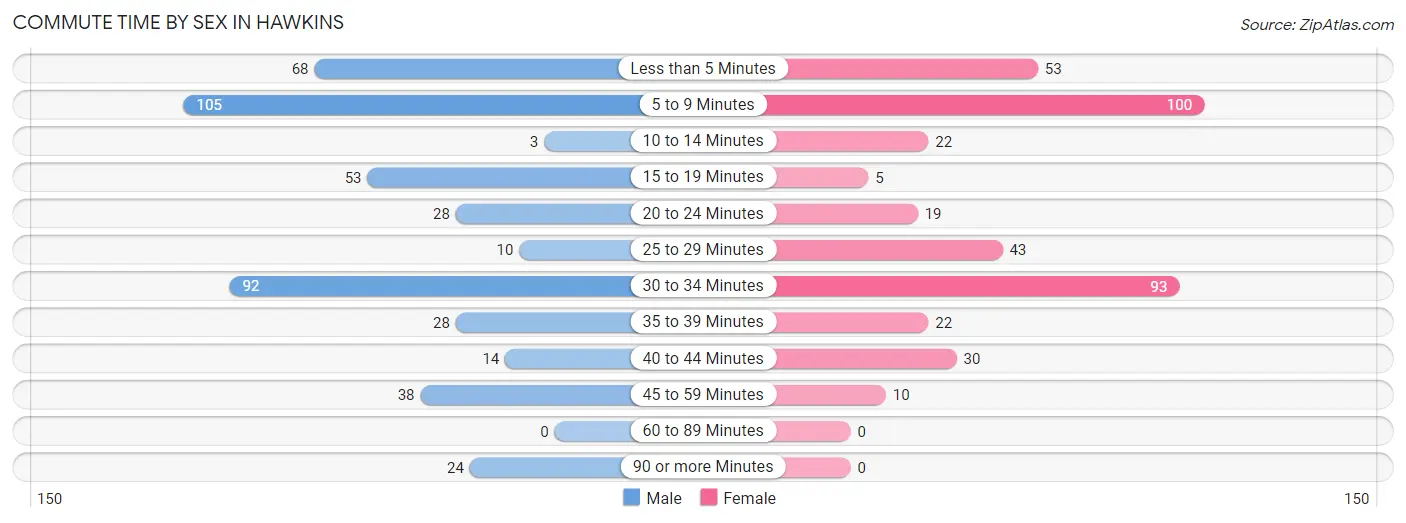
| Commute Time | Male | Female |
| Less than 5 Minutes | 68 (14.7%) | 53 (13.4%) |
| 5 to 9 Minutes | 105 (22.7%) | 100 (25.2%) |
| 10 to 14 Minutes | 3 (0.6%) | 22 (5.5%) |
| 15 to 19 Minutes | 53 (11.5%) | 5 (1.3%) |
| 20 to 24 Minutes | 28 (6.0%) | 19 (4.8%) |
| 25 to 29 Minutes | 10 (2.2%) | 43 (10.8%) |
| 30 to 34 Minutes | 92 (19.9%) | 93 (23.4%) |
| 35 to 39 Minutes | 28 (6.0%) | 22 (5.5%) |
| 40 to 44 Minutes | 14 (3.0%) | 30 (7.6%) |
| 45 to 59 Minutes | 38 (8.2%) | 10 (2.5%) |
| 60 to 89 Minutes | 0 (0.0%) | 0 (0.0%) |
| 90 or more Minutes | 24 (5.2%) | 0 (0.0%) |
Time of Departure to Work by Sex in Hawkins
The most frequent times of departure to work in Hawkins are 8:00 AM to 8:29 AM (83, 17.9%) for males and 6:30 AM to 6:59 AM (74, 18.6%) for females.
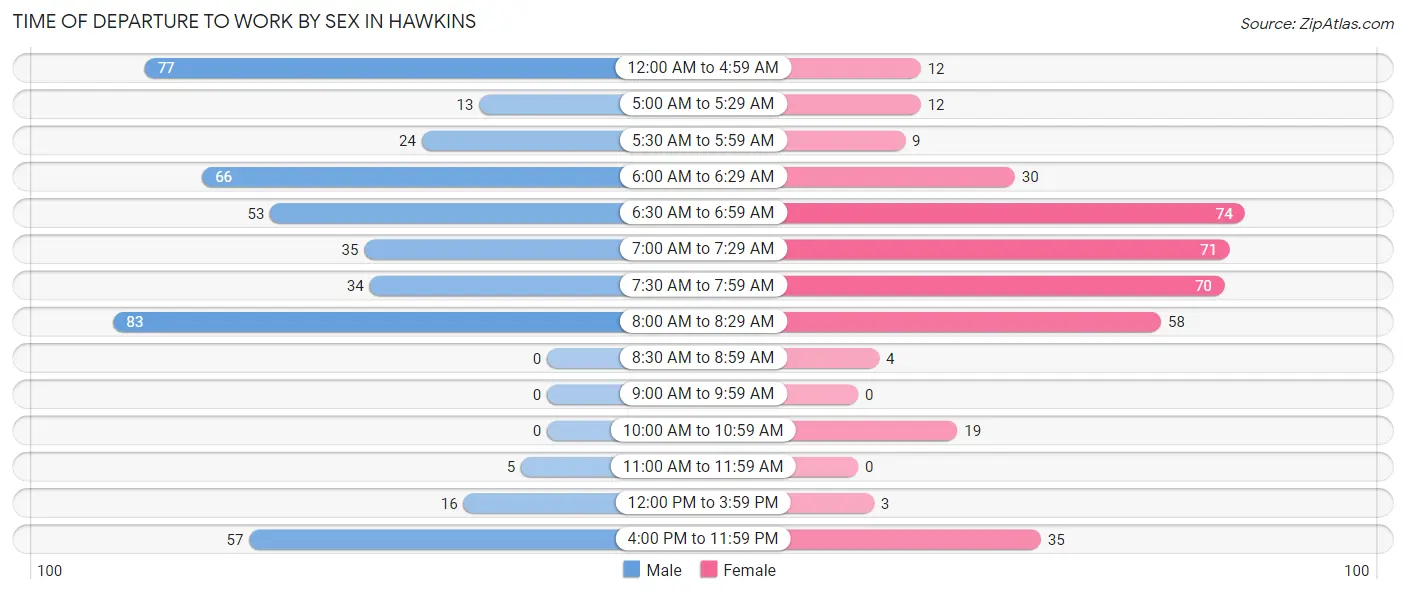
| Time of Departure | Male | Female |
| 12:00 AM to 4:59 AM | 77 (16.6%) | 12 (3.0%) |
| 5:00 AM to 5:29 AM | 13 (2.8%) | 12 (3.0%) |
| 5:30 AM to 5:59 AM | 24 (5.2%) | 9 (2.3%) |
| 6:00 AM to 6:29 AM | 66 (14.2%) | 30 (7.6%) |
| 6:30 AM to 6:59 AM | 53 (11.5%) | 74 (18.6%) |
| 7:00 AM to 7:29 AM | 35 (7.6%) | 71 (17.9%) |
| 7:30 AM to 7:59 AM | 34 (7.3%) | 70 (17.6%) |
| 8:00 AM to 8:29 AM | 83 (17.9%) | 58 (14.6%) |
| 8:30 AM to 8:59 AM | 0 (0.0%) | 4 (1.0%) |
| 9:00 AM to 9:59 AM | 0 (0.0%) | 0 (0.0%) |
| 10:00 AM to 10:59 AM | 0 (0.0%) | 19 (4.8%) |
| 11:00 AM to 11:59 AM | 5 (1.1%) | 0 (0.0%) |
| 12:00 PM to 3:59 PM | 16 (3.5%) | 3 (0.8%) |
| 4:00 PM to 11:59 PM | 57 (12.3%) | 35 (8.8%) |
| Total | 463 (100.0%) | 397 (100.0%) |
Housing Occupancy in Hawkins
Occupancy by Ownership in Hawkins
Of the total 628 dwellings in Hawkins, owner-occupied units account for 455 (72.5%), while renter-occupied units make up 173 (27.6%).
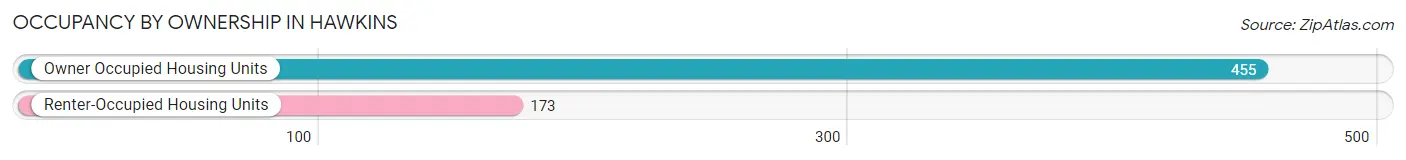
| Occupancy | # Housing Units | % Housing Units |
| Owner Occupied Housing Units | 455 | 72.5% |
| Renter-Occupied Housing Units | 173 | 27.6% |
| Total Occupied Housing Units | 628 | 100.0% |
Occupancy by Household Size in Hawkins
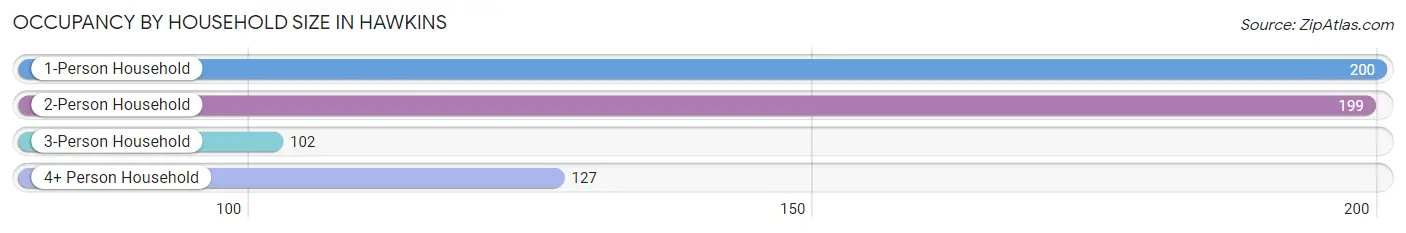
| Household Size | # Housing Units | % Housing Units |
| 1-Person Household | 200 | 31.9% |
| 2-Person Household | 199 | 31.7% |
| 3-Person Household | 102 | 16.2% |
| 4+ Person Household | 127 | 20.2% |
| Total Housing Units | 628 | 100.0% |
Occupancy by Ownership by Household Size in Hawkins
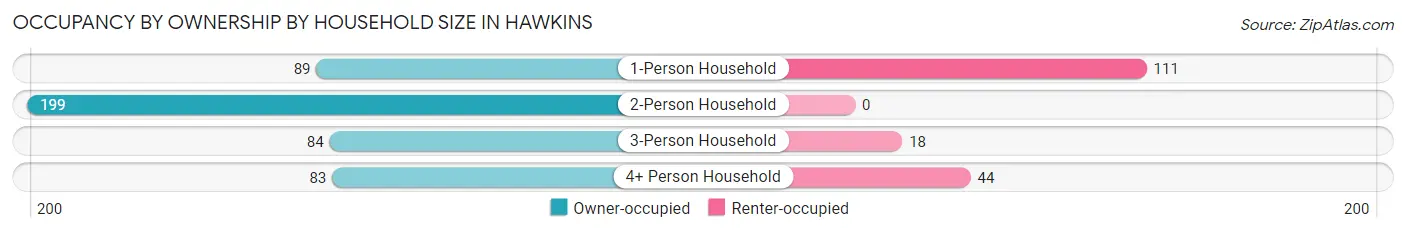
| Household Size | Owner-occupied | Renter-occupied |
| 1-Person Household | 89 (44.5%) | 111 (55.5%) |
| 2-Person Household | 199 (100.0%) | 0 (0.0%) |
| 3-Person Household | 84 (82.4%) | 18 (17.6%) |
| 4+ Person Household | 83 (65.3%) | 44 (34.6%) |
| Total Housing Units | 455 (72.5%) | 173 (27.6%) |
Occupancy by Educational Attainment in Hawkins
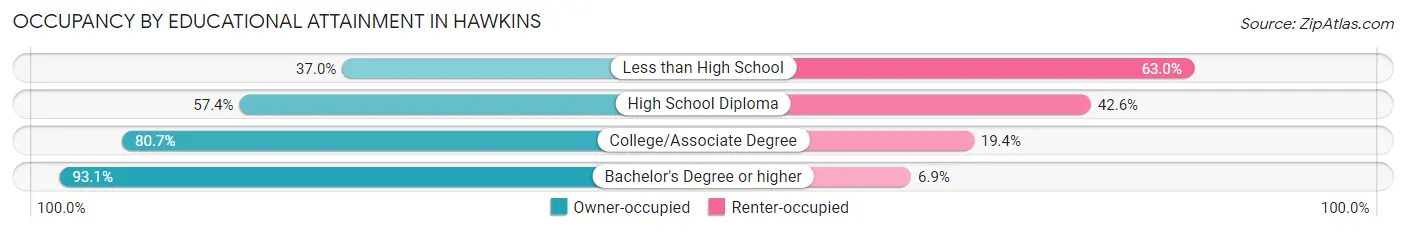
| Household Size | Owner-occupied | Renter-occupied |
| Less than High School | 10 (37.0%) | 17 (63.0%) |
| High School Diploma | 147 (57.4%) | 109 (42.6%) |
| College/Associate Degree | 150 (80.6%) | 36 (19.4%) |
| Bachelor's Degree or higher | 148 (93.1%) | 11 (6.9%) |
Occupancy by Age of Householder in Hawkins
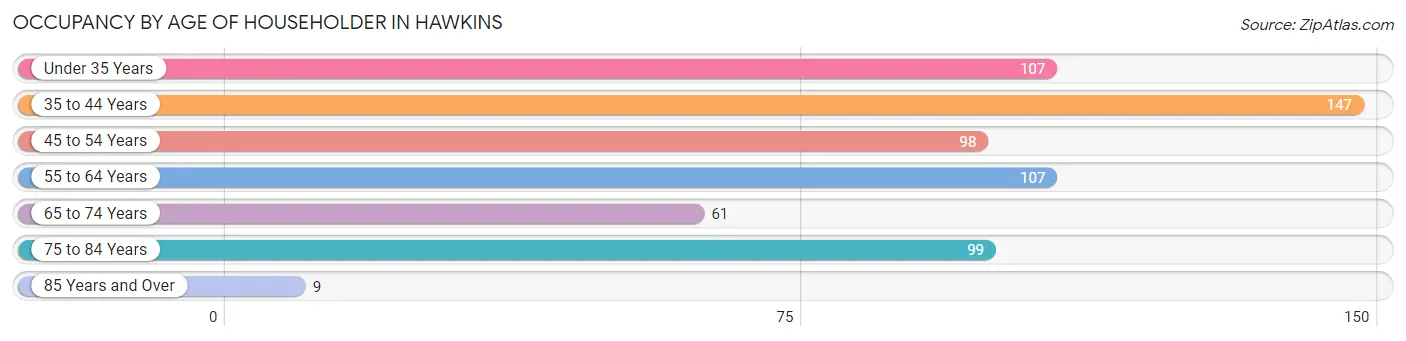
| Age Bracket | # Households | % Households |
| Under 35 Years | 107 | 17.0% |
| 35 to 44 Years | 147 | 23.4% |
| 45 to 54 Years | 98 | 15.6% |
| 55 to 64 Years | 107 | 17.0% |
| 65 to 74 Years | 61 | 9.7% |
| 75 to 84 Years | 99 | 15.8% |
| 85 Years and Over | 9 | 1.4% |
| Total | 628 | 100.0% |
Housing Finances in Hawkins
Median Income by Occupancy in Hawkins
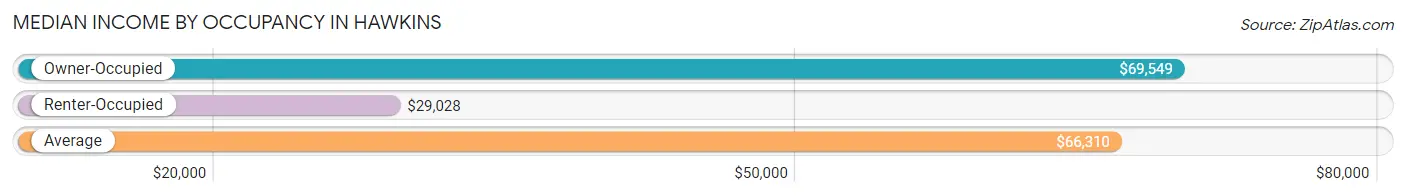
| Occupancy Type | # Households | Median Income |
| Owner-Occupied | 455 (72.5%) | $69,549 |
| Renter-Occupied | 173 (27.6%) | $29,028 |
| Average | 628 (100.0%) | $66,310 |
Occupancy by Householder Income Bracket in Hawkins
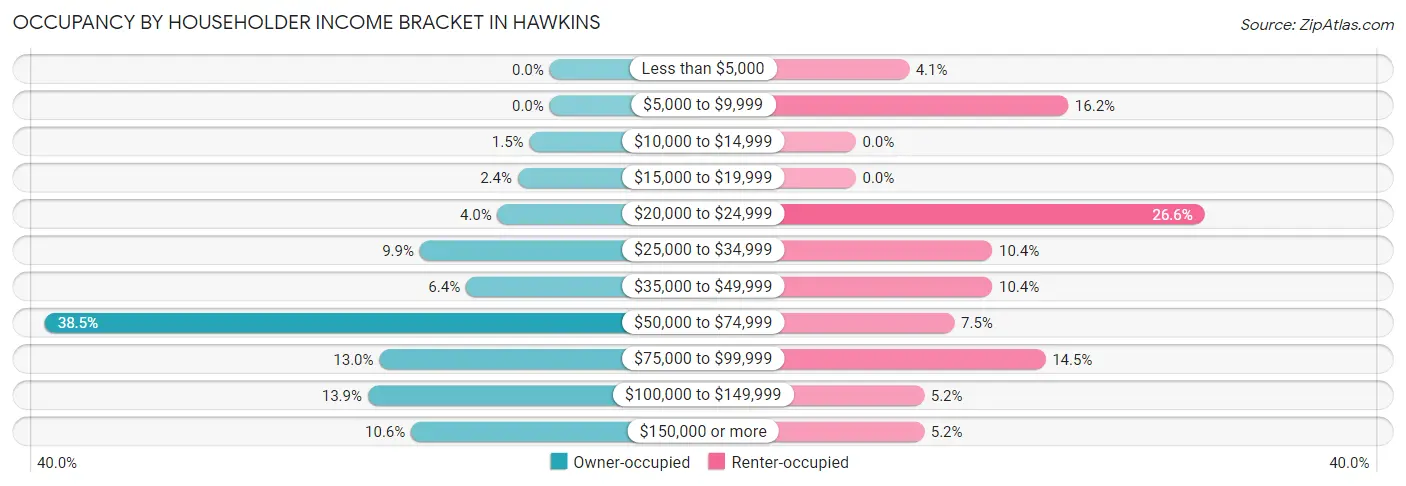
| Income Bracket | Owner-occupied | Renter-occupied |
| Less than $5,000 | 0 (0.0%) | 7 (4.1%) |
| $5,000 to $9,999 | 0 (0.0%) | 28 (16.2%) |
| $10,000 to $14,999 | 7 (1.5%) | 0 (0.0%) |
| $15,000 to $19,999 | 11 (2.4%) | 0 (0.0%) |
| $20,000 to $24,999 | 18 (4.0%) | 46 (26.6%) |
| $25,000 to $34,999 | 45 (9.9%) | 18 (10.4%) |
| $35,000 to $49,999 | 29 (6.4%) | 18 (10.4%) |
| $50,000 to $74,999 | 175 (38.5%) | 13 (7.5%) |
| $75,000 to $99,999 | 59 (13.0%) | 25 (14.4%) |
| $100,000 to $149,999 | 63 (13.9%) | 9 (5.2%) |
| $150,000 or more | 48 (10.5%) | 9 (5.2%) |
| Total | 455 (100.0%) | 173 (100.0%) |
Monthly Housing Cost Tiers in Hawkins
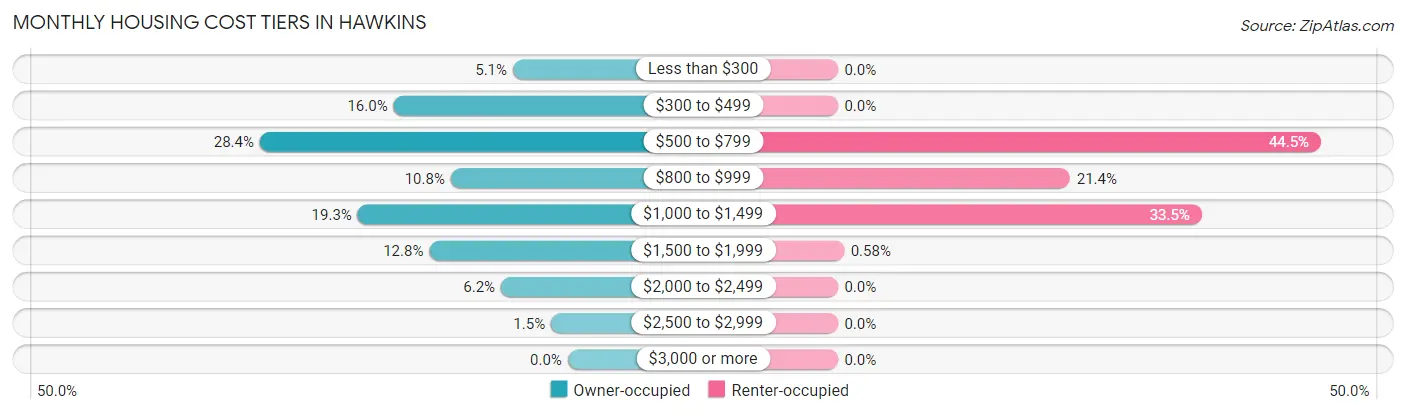
| Monthly Cost | Owner-occupied | Renter-occupied |
| Less than $300 | 23 (5.1%) | 0 (0.0%) |
| $300 to $499 | 73 (16.0%) | 0 (0.0%) |
| $500 to $799 | 129 (28.3%) | 77 (44.5%) |
| $800 to $999 | 49 (10.8%) | 37 (21.4%) |
| $1,000 to $1,499 | 88 (19.3%) | 58 (33.5%) |
| $1,500 to $1,999 | 58 (12.8%) | 1 (0.6%) |
| $2,000 to $2,499 | 28 (6.1%) | 0 (0.0%) |
| $2,500 to $2,999 | 7 (1.5%) | 0 (0.0%) |
| $3,000 or more | 0 (0.0%) | 0 (0.0%) |
| Total | 455 (100.0%) | 173 (100.0%) |
Physical Housing Characteristics in Hawkins
Housing Structures in Hawkins
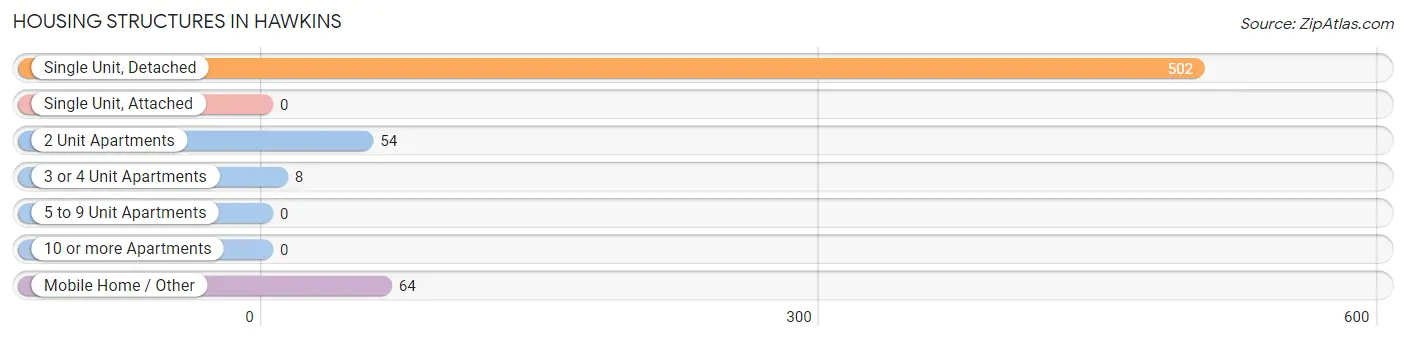
| Structure Type | # Housing Units | % Housing Units |
| Single Unit, Detached | 502 | 79.9% |
| Single Unit, Attached | 0 | 0.0% |
| 2 Unit Apartments | 54 | 8.6% |
| 3 or 4 Unit Apartments | 8 | 1.3% |
| 5 to 9 Unit Apartments | 0 | 0.0% |
| 10 or more Apartments | 0 | 0.0% |
| Mobile Home / Other | 64 | 10.2% |
| Total | 628 | 100.0% |
Housing Structures by Occupancy in Hawkins
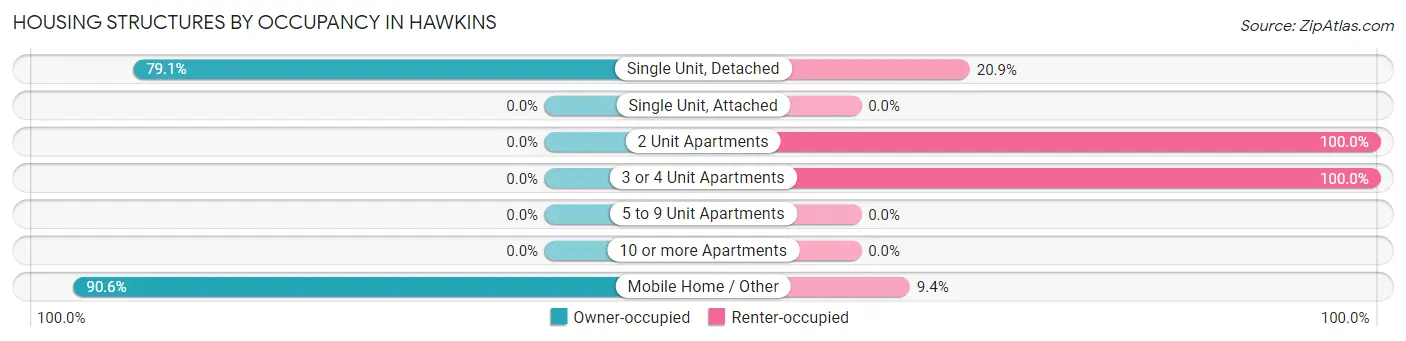
| Structure Type | Owner-occupied | Renter-occupied |
| Single Unit, Detached | 397 (79.1%) | 105 (20.9%) |
| Single Unit, Attached | 0 (0.0%) | 0 (0.0%) |
| 2 Unit Apartments | 0 (0.0%) | 54 (100.0%) |
| 3 or 4 Unit Apartments | 0 (0.0%) | 8 (100.0%) |
| 5 to 9 Unit Apartments | 0 (0.0%) | 0 (0.0%) |
| 10 or more Apartments | 0 (0.0%) | 0 (0.0%) |
| Mobile Home / Other | 58 (90.6%) | 6 (9.4%) |
| Total | 455 (72.5%) | 173 (27.6%) |
Housing Structures by Number of Rooms in Hawkins
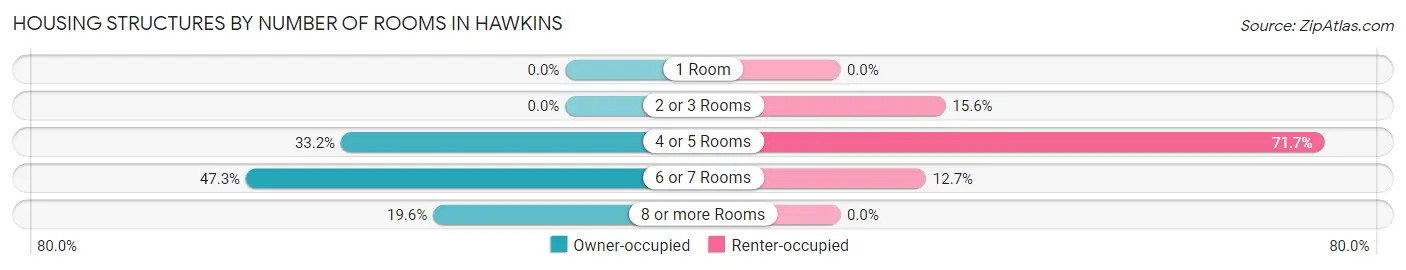
| Number of Rooms | Owner-occupied | Renter-occupied |
| 1 Room | 0 (0.0%) | 0 (0.0%) |
| 2 or 3 Rooms | 0 (0.0%) | 27 (15.6%) |
| 4 or 5 Rooms | 151 (33.2%) | 124 (71.7%) |
| 6 or 7 Rooms | 215 (47.2%) | 22 (12.7%) |
| 8 or more Rooms | 89 (19.6%) | 0 (0.0%) |
| Total | 455 (100.0%) | 173 (100.0%) |
Housing Structure by Heating Type in Hawkins
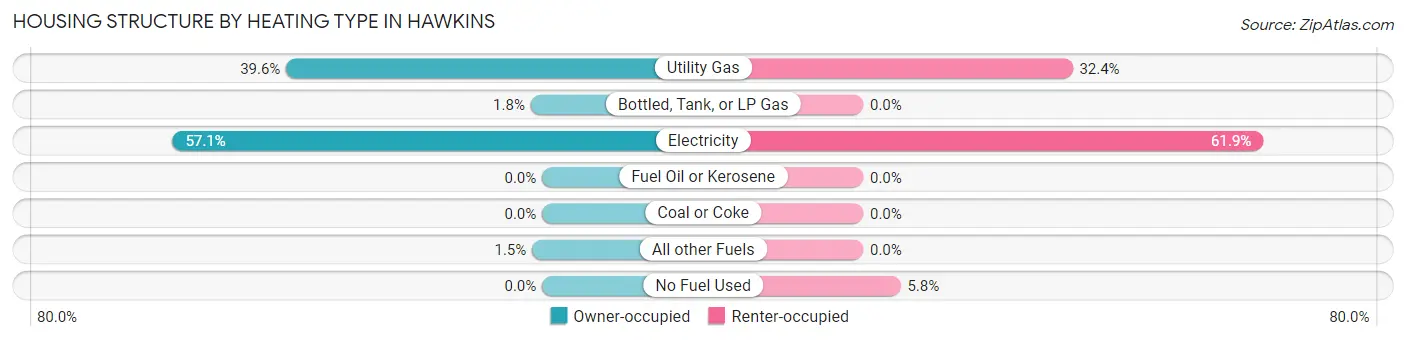
| Heating Type | Owner-occupied | Renter-occupied |
| Utility Gas | 180 (39.6%) | 56 (32.4%) |
| Bottled, Tank, or LP Gas | 8 (1.8%) | 0 (0.0%) |
| Electricity | 260 (57.1%) | 107 (61.9%) |
| Fuel Oil or Kerosene | 0 (0.0%) | 0 (0.0%) |
| Coal or Coke | 0 (0.0%) | 0 (0.0%) |
| All other Fuels | 7 (1.5%) | 0 (0.0%) |
| No Fuel Used | 0 (0.0%) | 10 (5.8%) |
| Total | 455 (100.0%) | 173 (100.0%) |
Household Vehicle Usage in Hawkins
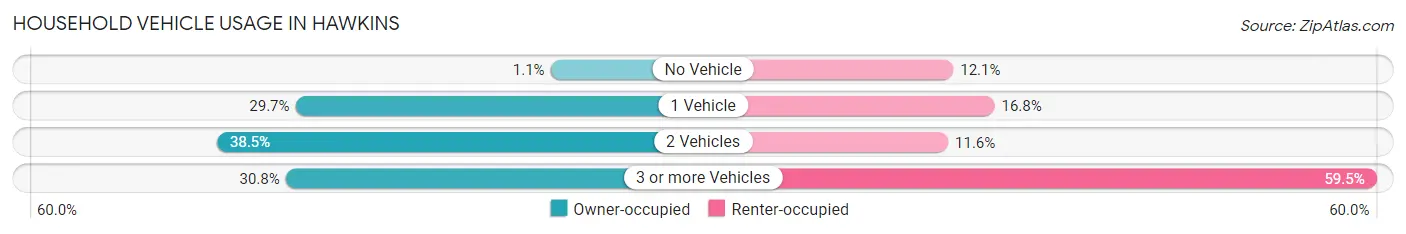
| Vehicles per Household | Owner-occupied | Renter-occupied |
| No Vehicle | 5 (1.1%) | 21 (12.1%) |
| 1 Vehicle | 135 (29.7%) | 29 (16.8%) |
| 2 Vehicles | 175 (38.5%) | 20 (11.6%) |
| 3 or more Vehicles | 140 (30.8%) | 103 (59.5%) |
| Total | 455 (100.0%) | 173 (100.0%) |
Real Estate & Mortgages in Hawkins
Real Estate and Mortgage Overview in Hawkins
| Characteristic | Without Mortgage | With Mortgage |
| Housing Units | 163 | 292 |
| Median Property Value | $82,600 | $118,800 |
| Median Household Income | $50,066 | $45 |
| Monthly Housing Costs | $476 | $0 |
| Real Estate Taxes | $1,017 | $33 |
Property Value by Mortgage Status in Hawkins
| Property Value | Without Mortgage | With Mortgage |
| Less than $50,000 | 54 (33.1%) | 51 (17.5%) |
| $50,000 to $99,999 | 55 (33.7%) | 89 (30.5%) |
| $100,000 to $299,999 | 54 (33.1%) | 131 (44.9%) |
| $300,000 to $499,999 | 0 (0.0%) | 21 (7.2%) |
| $500,000 to $749,999 | 0 (0.0%) | 0 (0.0%) |
| $750,000 to $999,999 | 0 (0.0%) | 0 (0.0%) |
| $1,000,000 or more | 0 (0.0%) | 0 (0.0%) |
| Total | 163 (100.0%) | 292 (100.0%) |
Household Income by Mortgage Status in Hawkins
| Household Income | Without Mortgage | With Mortgage |
| Less than $10,000 | 0 (0.0%) | 0 (0.0%) |
| $10,000 to $24,999 | 34 (20.9%) | 0 (0.0%) |
| $25,000 to $34,999 | 35 (21.5%) | 2 (0.7%) |
| $35,000 to $49,999 | 12 (7.4%) | 10 (3.4%) |
| $50,000 to $74,999 | 58 (35.6%) | 17 (5.8%) |
| $75,000 to $99,999 | 14 (8.6%) | 117 (40.1%) |
| $100,000 to $149,999 | 7 (4.3%) | 45 (15.4%) |
| $150,000 or more | 3 (1.8%) | 56 (19.2%) |
| Total | 163 (100.0%) | 292 (100.0%) |
Property Value to Household Income Ratio in Hawkins
| Value-to-Income Ratio | Without Mortgage | With Mortgage |
| Less than 2.0x | 71 (43.6%) | 77,500 (26,541.1%) |
| 2.0x to 2.9x | 40 (24.5%) | 205 (70.2%) |
| 3.0x to 3.9x | 19 (11.7%) | 41 (14.0%) |
| 4.0x or more | 33 (20.3%) | 34 (11.6%) |
| Total | 163 (100.0%) | 292 (100.0%) |
Real Estate Taxes by Mortgage Status in Hawkins
| Property Taxes | Without Mortgage | With Mortgage |
| Less than $800 | 68 (41.7%) | 0 (0.0%) |
| $800 to $1,499 | 39 (23.9%) | 63 (21.6%) |
| $800 to $1,499 | 49 (30.1%) | 24 (8.2%) |
| Total | 163 (100.0%) | 292 (100.0%) |
Health & Disability in Hawkins
Health Insurance Coverage by Age in Hawkins
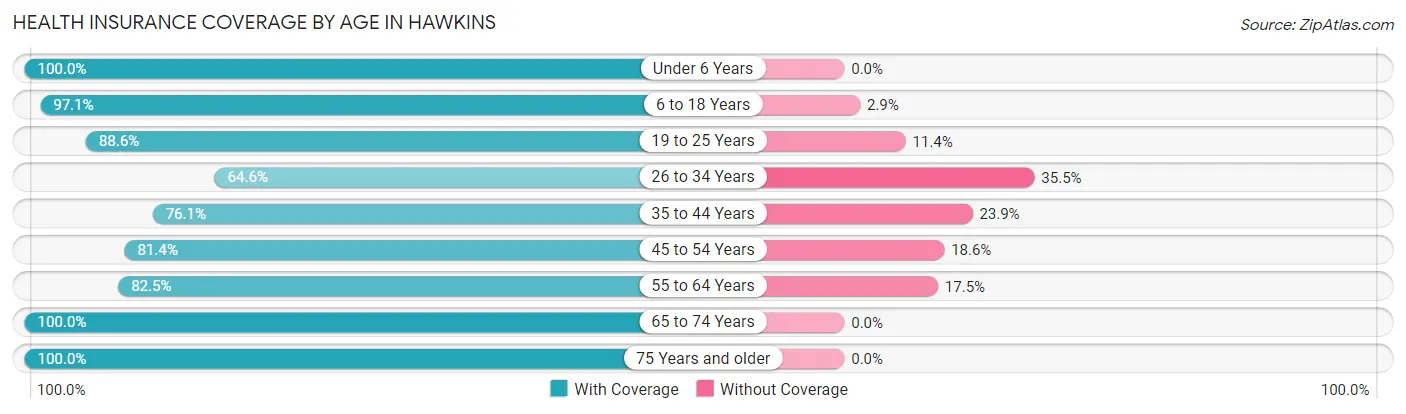
| Age Bracket | With Coverage | Without Coverage |
| Under 6 Years | 125 (100.0%) | 0 (0.0%) |
| 6 to 18 Years | 265 (97.1%) | 8 (2.9%) |
| 19 to 25 Years | 178 (88.6%) | 23 (11.4%) |
| 26 to 34 Years | 142 (64.5%) | 78 (35.4%) |
| 35 to 44 Years | 207 (76.1%) | 65 (23.9%) |
| 45 to 54 Years | 131 (81.4%) | 30 (18.6%) |
| 55 to 64 Years | 208 (82.5%) | 44 (17.5%) |
| 65 to 74 Years | 114 (100.0%) | 0 (0.0%) |
| 75 Years and older | 125 (100.0%) | 0 (0.0%) |
| Total | 1,495 (85.8%) | 248 (14.2%) |
Health Insurance Coverage by Citizenship Status in Hawkins
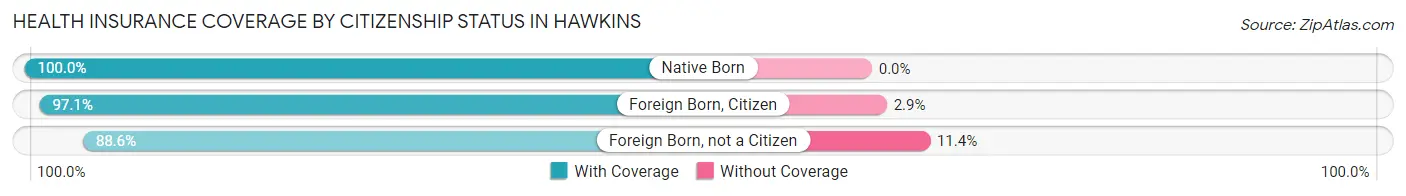
| Citizenship Status | With Coverage | Without Coverage |
| Native Born | 125 (100.0%) | 0 (0.0%) |
| Foreign Born, Citizen | 265 (97.1%) | 8 (2.9%) |
| Foreign Born, not a Citizen | 178 (88.6%) | 23 (11.4%) |
Health Insurance Coverage by Household Income in Hawkins
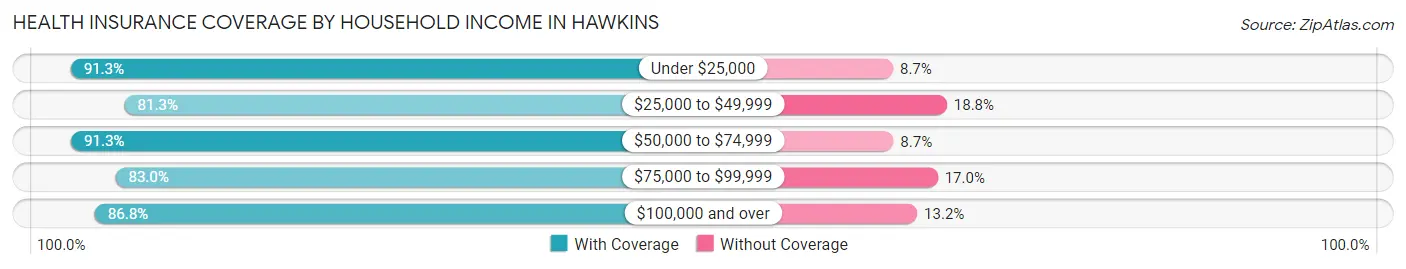
| Household Income | With Coverage | Without Coverage |
| Under $25,000 | 116 (91.3%) | 11 (8.7%) |
| $25,000 to $49,999 | 182 (81.2%) | 42 (18.8%) |
| $50,000 to $74,999 | 439 (91.3%) | 42 (8.7%) |
| $75,000 to $99,999 | 297 (83.0%) | 61 (17.0%) |
| $100,000 and over | 461 (86.8%) | 70 (13.2%) |
Public vs Private Health Insurance Coverage by Age in Hawkins
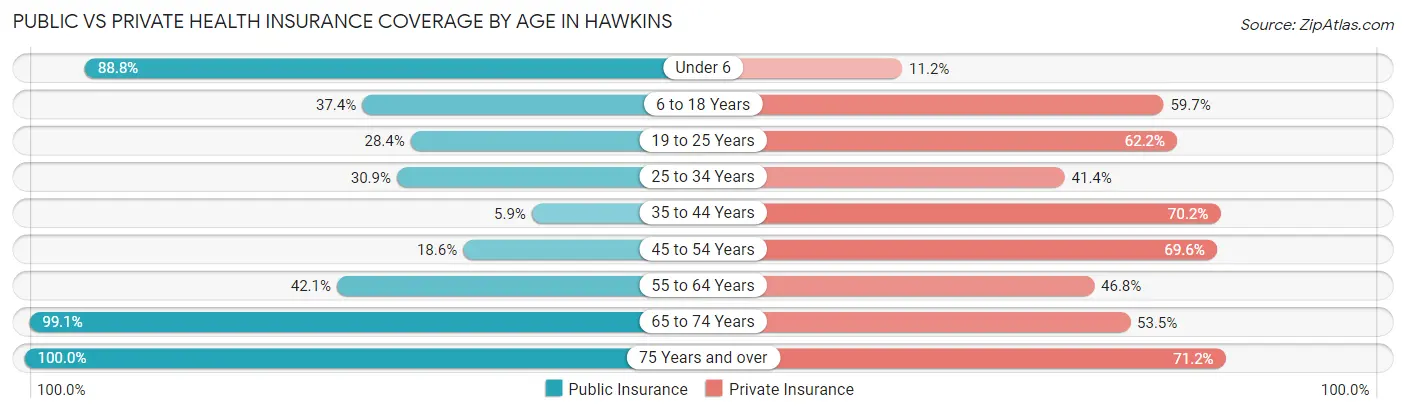
| Age Bracket | Public Insurance | Private Insurance |
| Under 6 | 111 (88.8%) | 14 (11.2%) |
| 6 to 18 Years | 102 (37.4%) | 163 (59.7%) |
| 19 to 25 Years | 57 (28.4%) | 125 (62.2%) |
| 25 to 34 Years | 68 (30.9%) | 91 (41.4%) |
| 35 to 44 Years | 16 (5.9%) | 191 (70.2%) |
| 45 to 54 Years | 30 (18.6%) | 112 (69.6%) |
| 55 to 64 Years | 106 (42.1%) | 118 (46.8%) |
| 65 to 74 Years | 113 (99.1%) | 61 (53.5%) |
| 75 Years and over | 125 (100.0%) | 89 (71.2%) |
| Total | 728 (41.8%) | 964 (55.3%) |
Disability Status by Sex by Age in Hawkins
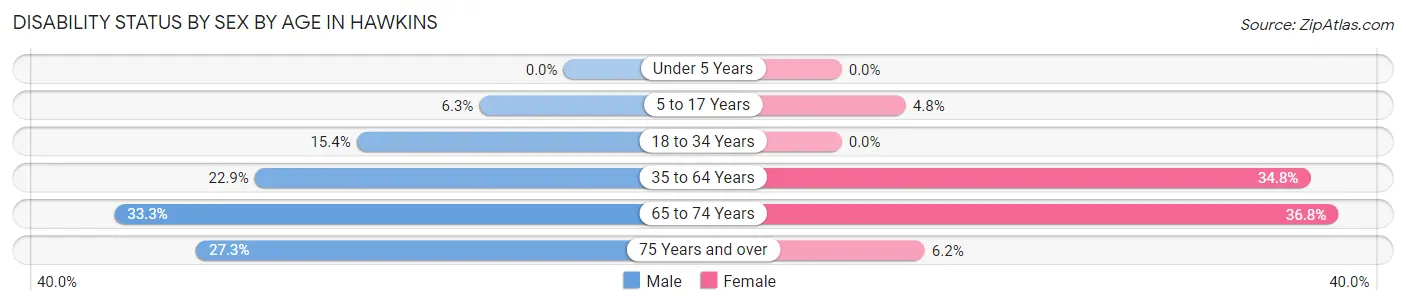
| Age Bracket | Male | Female |
| Under 5 Years | 0 (0.0%) | 0 (0.0%) |
| 5 to 17 Years | 6 (6.2%) | 8 (4.8%) |
| 18 to 34 Years | 45 (15.4%) | 0 (0.0%) |
| 35 to 64 Years | 72 (22.9%) | 129 (34.8%) |
| 65 to 74 Years | 19 (33.3%) | 21 (36.8%) |
| 75 Years and over | 12 (27.3%) | 5 (6.2%) |
Disability Class by Sex by Age in Hawkins
Disability Class: Hearing Difficulty
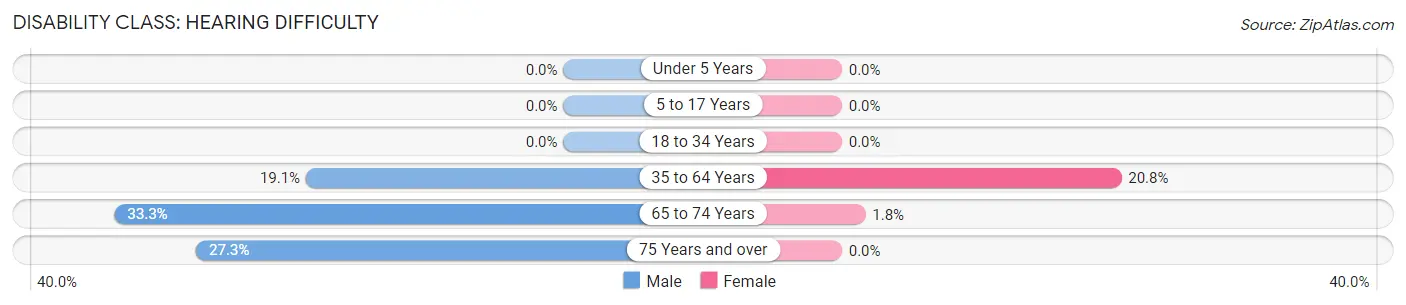
| Age Bracket | Male | Female |
| Under 5 Years | 0 (0.0%) | 0 (0.0%) |
| 5 to 17 Years | 0 (0.0%) | 0 (0.0%) |
| 18 to 34 Years | 0 (0.0%) | 0 (0.0%) |
| 35 to 64 Years | 60 (19.1%) | 77 (20.7%) |
| 65 to 74 Years | 19 (33.3%) | 1 (1.8%) |
| 75 Years and over | 12 (27.3%) | 0 (0.0%) |
Disability Class: Vision Difficulty
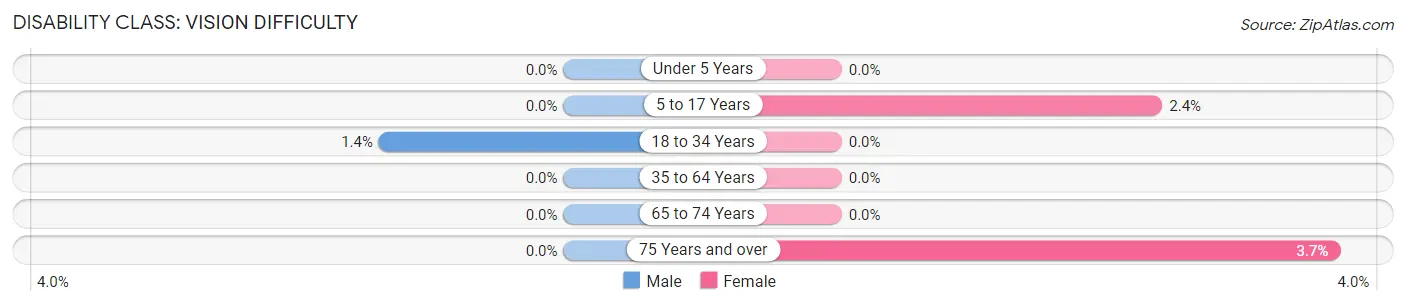
| Age Bracket | Male | Female |
| Under 5 Years | 0 (0.0%) | 0 (0.0%) |
| 5 to 17 Years | 0 (0.0%) | 4 (2.4%) |
| 18 to 34 Years | 4 (1.4%) | 0 (0.0%) |
| 35 to 64 Years | 0 (0.0%) | 0 (0.0%) |
| 65 to 74 Years | 0 (0.0%) | 0 (0.0%) |
| 75 Years and over | 0 (0.0%) | 3 (3.7%) |
Disability Class: Cognitive Difficulty
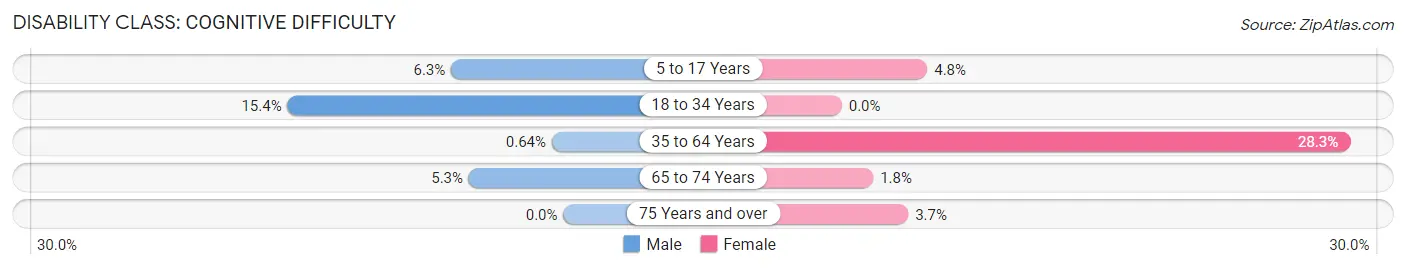
| Age Bracket | Male | Female |
| 5 to 17 Years | 6 (6.2%) | 8 (4.8%) |
| 18 to 34 Years | 45 (15.4%) | 0 (0.0%) |
| 35 to 64 Years | 2 (0.6%) | 105 (28.3%) |
| 65 to 74 Years | 3 (5.3%) | 1 (1.8%) |
| 75 Years and over | 0 (0.0%) | 3 (3.7%) |
Disability Class: Ambulatory Difficulty
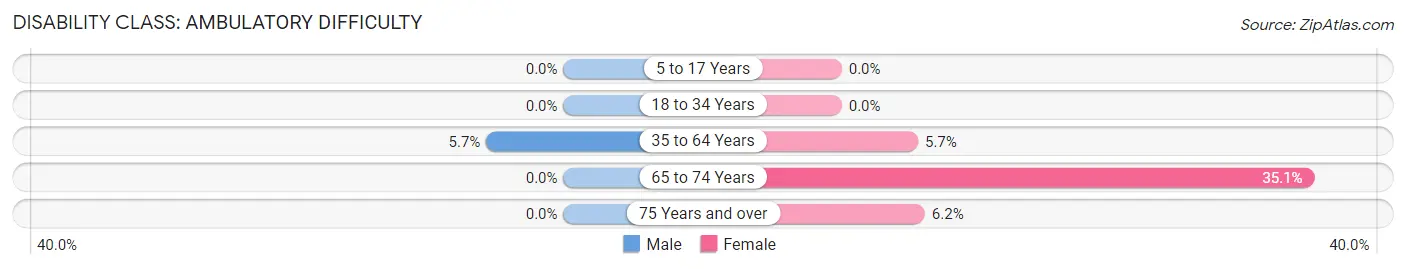
| Age Bracket | Male | Female |
| 5 to 17 Years | 0 (0.0%) | 0 (0.0%) |
| 18 to 34 Years | 0 (0.0%) | 0 (0.0%) |
| 35 to 64 Years | 18 (5.7%) | 21 (5.7%) |
| 65 to 74 Years | 0 (0.0%) | 20 (35.1%) |
| 75 Years and over | 0 (0.0%) | 5 (6.2%) |
Disability Class: Self-Care Difficulty
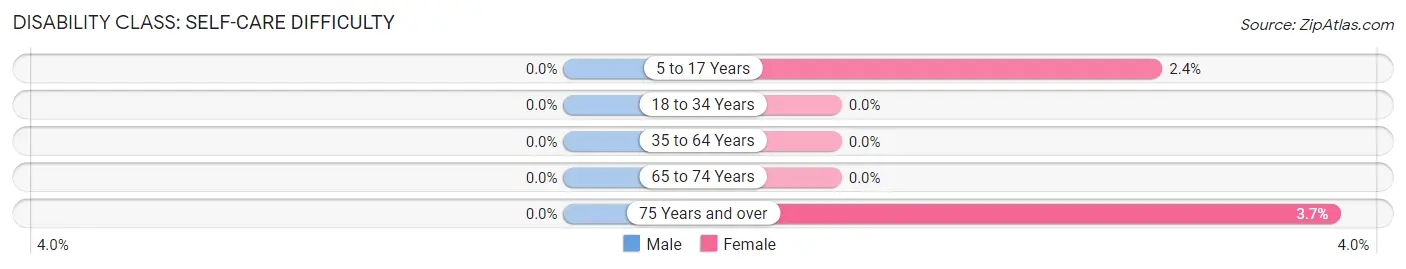
| Age Bracket | Male | Female |
| 5 to 17 Years | 0 (0.0%) | 4 (2.4%) |
| 18 to 34 Years | 0 (0.0%) | 0 (0.0%) |
| 35 to 64 Years | 0 (0.0%) | 0 (0.0%) |
| 65 to 74 Years | 0 (0.0%) | 0 (0.0%) |
| 75 Years and over | 0 (0.0%) | 3 (3.7%) |
Technology Access in Hawkins
Computing Device Access in Hawkins
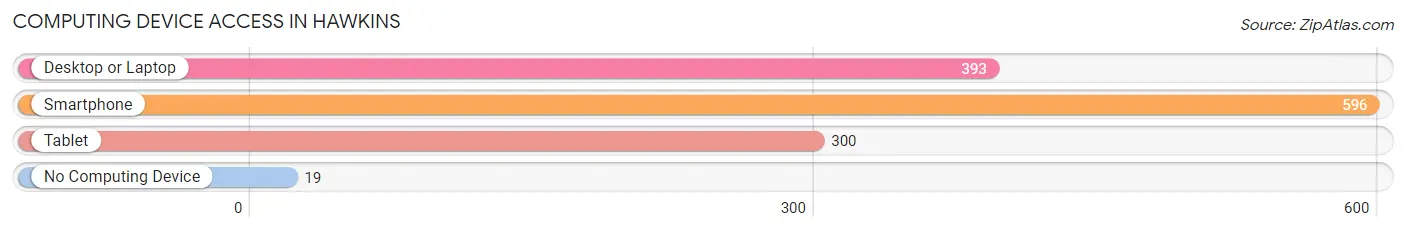
| Device Type | # Households | % Households |
| Desktop or Laptop | 393 | 62.6% |
| Smartphone | 596 | 94.9% |
| Tablet | 300 | 47.8% |
| No Computing Device | 19 | 3.0% |
| Total | 628 | 100.0% |
Internet Access in Hawkins
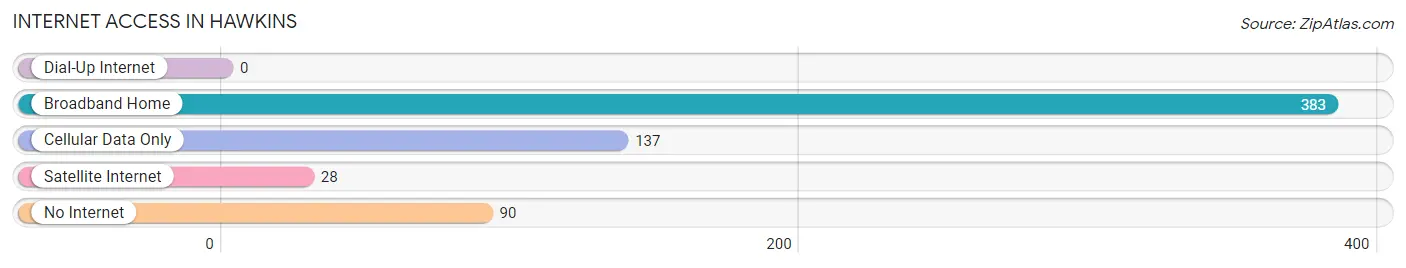
| Internet Type | # Households | % Households |
| Dial-Up Internet | 0 | 0.0% |
| Broadband Home | 383 | 61.0% |
| Cellular Data Only | 137 | 21.8% |
| Satellite Internet | 28 | 4.5% |
| No Internet | 90 | 14.3% |
| Total | 628 | 100.0% |
Hawkins Summary
Hawkins, Texas is a small town located in Wood County, Texas, United States. It is situated about 10 miles east of Quitman, the county seat. The population of Hawkins was 1,845 at the 2010 census.
History
The area that is now Hawkins was first settled in the late 1840s by a group of settlers from Tennessee. The town was originally known as "Hickory Hill" and was later renamed "Hawkins" in honor of the first postmaster, William Hawkins. The town was officially incorporated in 1891.
In the early 1900s, Hawkins was a thriving agricultural community. Cotton was the main crop, and the town had several cotton gins and a cottonseed oil mill. The town also had a sawmill, a gristmill, and a blacksmith shop.
In the 1920s, Hawkins began to experience a decline in population as many of its residents moved away to larger cities in search of better economic opportunities. The Great Depression of the 1930s further exacerbated the town's economic woes.
In the 1940s, Hawkins began to experience a resurgence in population as the town became a center for oil and gas production. The town also became a center for the timber industry, and several sawmills were built in the area.
Geography
Hawkins is located in Wood County, Texas, at the intersection of State Highway 154 and Farm to Market Road 779. The town is situated about 10 miles east of Quitman, the county seat.
The town is located in the East Texas Piney Woods region, and the terrain is mostly flat with some rolling hills. The climate is humid subtropical, with hot summers and mild winters.
Economy
The economy of Hawkins is largely based on agriculture and oil and gas production. The town is home to several cotton gins, a cottonseed oil mill, and several sawmills.
The town is also home to several small businesses, including a grocery store, a hardware store, and a restaurant.
Demographics
As of the 2010 census, the population of Hawkins was 1,845. The racial makeup of the town was 79.3% White, 17.2% African American, 0.7% Native American, 0.3% Asian, 0.1% Pacific Islander, and 2.4% from other races. Hispanic or Latino of any race were 4.2% of the population.
The median household income in Hawkins was $31,250, and the median family income was $37,500. The per capita income was $15,945. About 17.2% of families and 20.3% of the population were below the poverty line, including 28.3% of those under age 18 and 11.2% of those age 65 or over.
Common Questions
What is Per Capita Income in Hawkins?
Per Capita income in Hawkins is $28,288.
What is the Median Family Income in Hawkins?
Median Family Income in Hawkins is $69,779.
What is the Median Household income in Hawkins?
Median Household Income in Hawkins is $66,310.
What is Income or Wage Gap in Hawkins?
Income or Wage Gap in Hawkins is 8.8%.
Women in Hawkins earn 91.2 cents for every dollar earned by a man.
What is Inequality or Gini Index in Hawkins?
Inequality or Gini Index in Hawkins is 0.37.
What is the Total Population of Hawkins?
Total Population of Hawkins is 1,743.
What is the Total Male Population of Hawkins?
Total Male Population of Hawkins is 865.
What is the Total Female Population of Hawkins?
Total Female Population of Hawkins is 878.
What is the Ratio of Males per 100 Females in Hawkins?
There are 98.52 Males per 100 Females in Hawkins.
What is the Ratio of Females per 100 Males in Hawkins?
There are 101.50 Females per 100 Males in Hawkins.
What is the Median Population Age in Hawkins?
Median Population Age in Hawkins is 36.5 Years.
What is the Average Family Size in Hawkins
Average Family Size in Hawkins is 3.6 People.
What is the Average Household Size in Hawkins
Average Household Size in Hawkins is 2.7 People.
How Large is the Labor Force in Hawkins?
There are 967 People in the Labor Forcein in Hawkins.
What is the Percentage of People in the Labor Force in Hawkins?
68.5% of People are in the Labor Force in Hawkins.
What is the Unemployment Rate in Hawkins?
Unemployment Rate in Hawkins is 8.4%.