Hale Center, TX Map & Demographics
Hale Center Map
Hale Center Overview
$26,429
PER CAPITA INCOME
$60,000
AVG FAMILY INCOME
$47,130
AVG HOUSEHOLD INCOME
6.9%
WAGE / INCOME GAP [ % ]
93.1¢/ $1
WAGE / INCOME GAP [ $ ]
0.41
INEQUALITY / GINI INDEX
1,866
TOTAL POPULATION
983
MALE POPULATION
883
FEMALE POPULATION
111.33
MALES / 100 FEMALES
89.83
FEMALES / 100 MALES
50.5
MEDIAN AGE
3.0
AVG FAMILY SIZE
2.5
AVG HOUSEHOLD SIZE
813
LABOR FORCE [ PEOPLE ]
50.9%
PERCENT IN LABOR FORCE
2.1%
UNEMPLOYMENT RATE
Hale Center Zip Codes
Hale Center Area Codes
Income in Hale Center
Income Overview in Hale Center
Per Capita Income in Hale Center is $26,429, while median incomes of families and households are $60,000 and $47,130 respectively.
| Characteristic | Number | Measure |
| Per Capita Income | 1,866 | $26,429 |
| Median Family Income | 528 | $60,000 |
| Mean Family Income | 528 | $76,365 |
| Median Household Income | 742 | $47,130 |
| Mean Household Income | 742 | $61,646 |
| Income Deficit | 528 | $0 |
| Wage / Income Gap (%) | 1,866 | 6.88% |
| Wage / Income Gap ($) | 1,866 | 93.12¢ per $1 |
| Gini / Inequality Index | 1,866 | 0.41 |
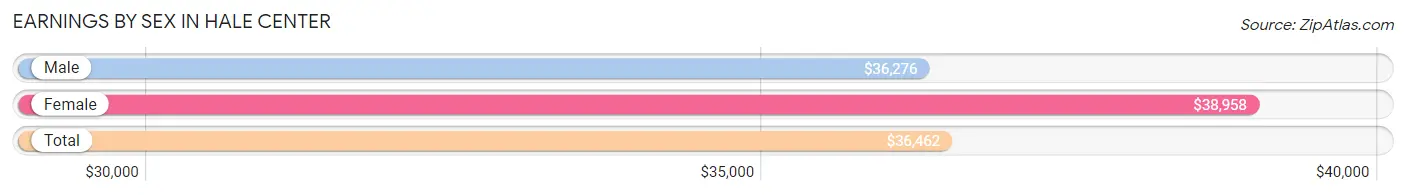
Earnings by Sex in Hale Center
Average Earnings in Hale Center are $36,462, $36,276 for men and $38,958 for women, a difference of 6.9%.
| Sex | Number | Average Earnings |
| Male | 457 (51.6%) | $36,276 |
| Female | 429 (48.4%) | $38,958 |
| Total | 886 (100.0%) | $36,462 |
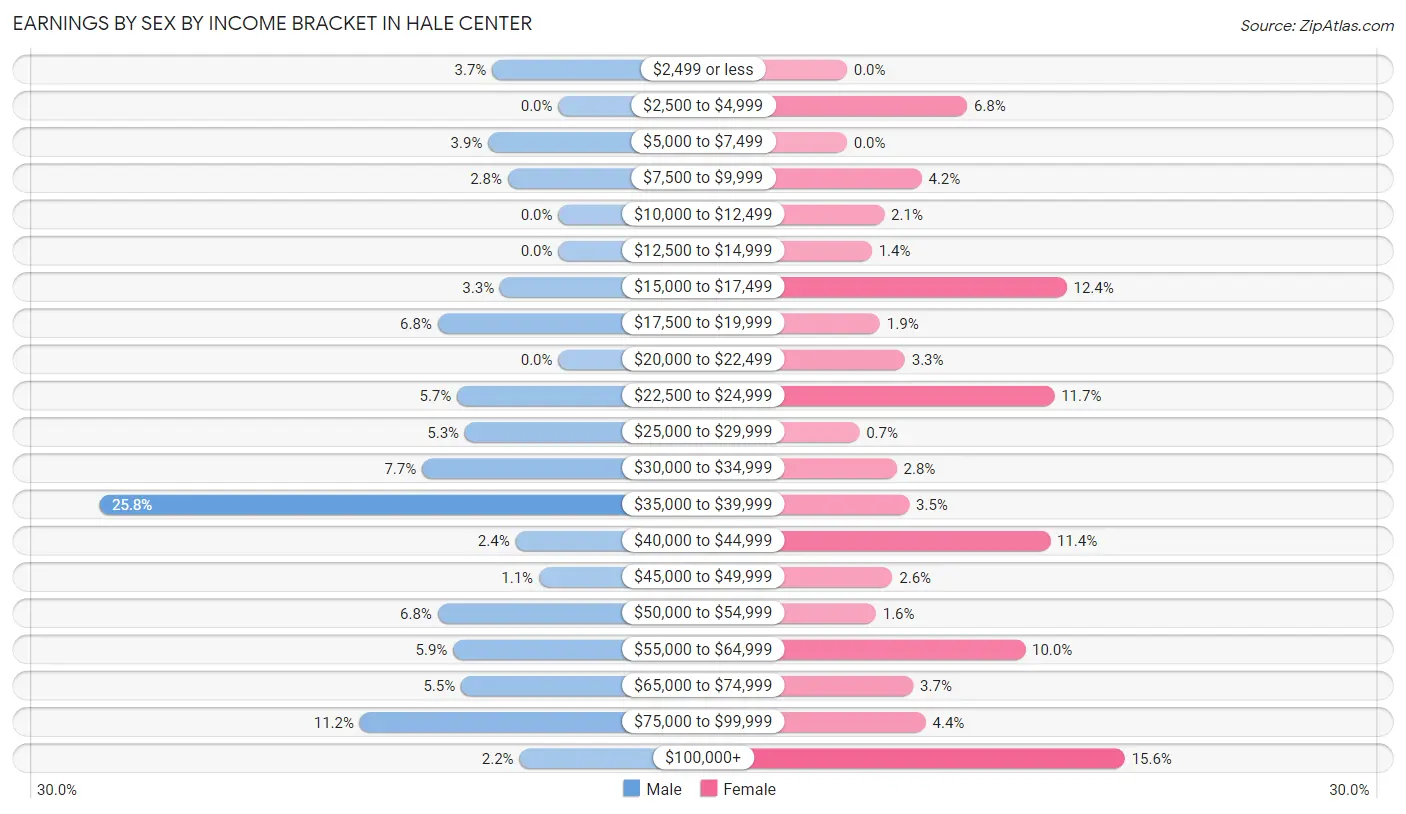
Earnings by Sex by Income Bracket in Hale Center
The most common earnings brackets in Hale Center are $35,000 to $39,999 for men (118 | 25.8%) and $100,000+ for women (67 | 15.6%).
| Income | Male | Female |
| $2,499 or less | 17 (3.7%) | 0 (0.0%) |
| $2,500 to $4,999 | 0 (0.0%) | 29 (6.8%) |
| $5,000 to $7,499 | 18 (3.9%) | 0 (0.0%) |
| $7,500 to $9,999 | 13 (2.8%) | 18 (4.2%) |
| $10,000 to $12,499 | 0 (0.0%) | 9 (2.1%) |
| $12,500 to $14,999 | 0 (0.0%) | 6 (1.4%) |
| $15,000 to $17,499 | 15 (3.3%) | 53 (12.3%) |
| $17,500 to $19,999 | 31 (6.8%) | 8 (1.9%) |
| $20,000 to $22,499 | 0 (0.0%) | 14 (3.3%) |
| $22,500 to $24,999 | 26 (5.7%) | 50 (11.7%) |
| $25,000 to $29,999 | 24 (5.2%) | 3 (0.7%) |
| $30,000 to $34,999 | 35 (7.7%) | 12 (2.8%) |
| $35,000 to $39,999 | 118 (25.8%) | 15 (3.5%) |
| $40,000 to $44,999 | 11 (2.4%) | 49 (11.4%) |
| $45,000 to $49,999 | 5 (1.1%) | 11 (2.6%) |
| $50,000 to $54,999 | 31 (6.8%) | 7 (1.6%) |
| $55,000 to $64,999 | 27 (5.9%) | 43 (10.0%) |
| $65,000 to $74,999 | 25 (5.5%) | 16 (3.7%) |
| $75,000 to $99,999 | 51 (11.2%) | 19 (4.4%) |
| $100,000+ | 10 (2.2%) | 67 (15.6%) |
| Total | 457 (100.0%) | 429 (100.0%) |
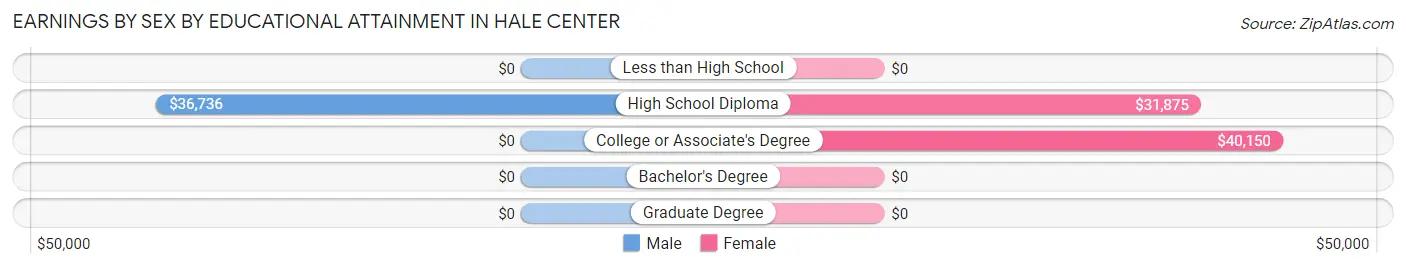
Earnings by Sex by Educational Attainment in Hale Center
Average earnings in Hale Center are $36,701 for men and $40,699 for women, a difference of 9.8%. Men with an educational attainment of high school diploma enjoy the highest average annual earnings of $36,736, while those with high school diploma education earn the least with $36,736. Women with an educational attainment of college or associate's degree earn the most with the average annual earnings of $40,150, while those with high school diploma education have the smallest earnings of $31,875.
| Educational Attainment | Male Income | Female Income |
| Less than High School | - | - |
| High School Diploma | $36,736 | $31,875 |
| College or Associate's Degree | - | - |
| Bachelor's Degree | - | - |
| Graduate Degree | - | - |
| Total | $36,701 | $40,699 |
Family Income in Hale Center
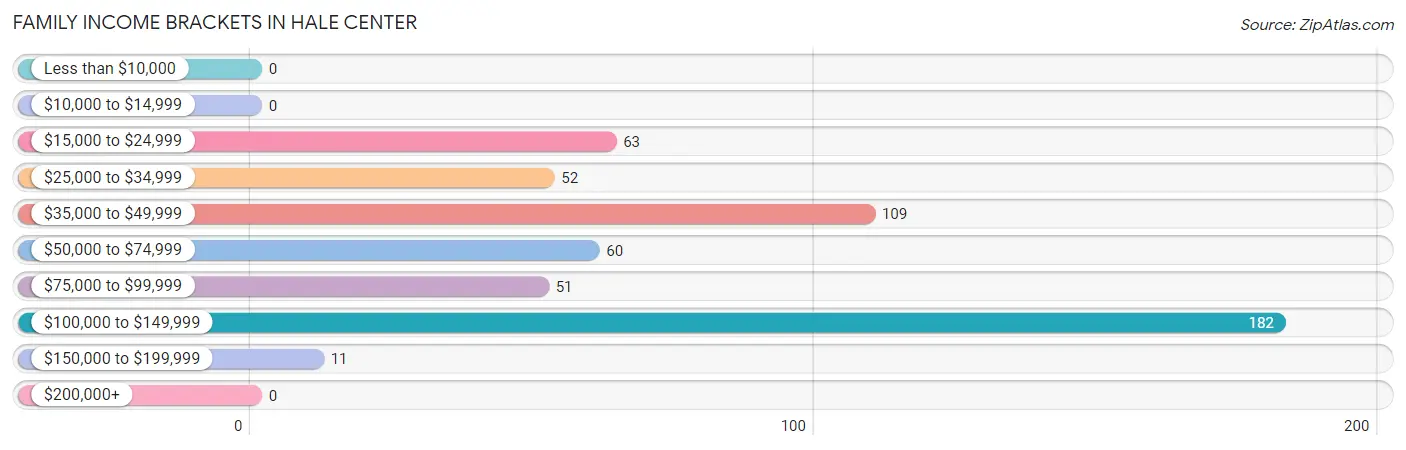
Family Income Brackets in Hale Center
According to the Hale Center family income data, there are 182 families falling into the $100,000 to $149,999 income range, which is the most common income bracket and makes up 34.5% of all families.
| Income Bracket | # Families | % Families |
| Less than $10,000 | 0 | 0.0% |
| $10,000 to $14,999 | 0 | 0.0% |
| $15,000 to $24,999 | 63 | 11.9% |
| $25,000 to $34,999 | 52 | 9.8% |
| $35,000 to $49,999 | 109 | 20.6% |
| $50,000 to $74,999 | 60 | 11.4% |
| $75,000 to $99,999 | 51 | 9.7% |
| $100,000 to $149,999 | 182 | 34.5% |
| $150,000 to $199,999 | 11 | 2.1% |
| $200,000+ | 0 | 0.0% |
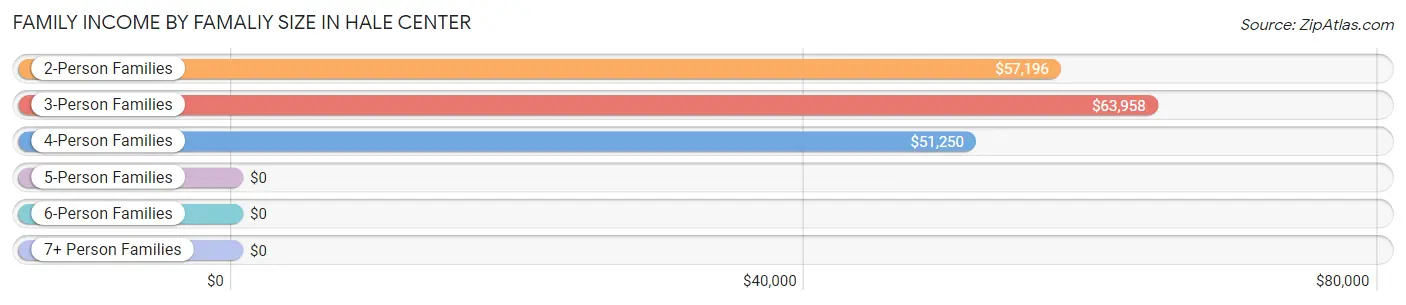
Family Income by Famaliy Size in Hale Center
3-person families (83 | 15.7%) account for the highest median family income in Hale Center with $63,958 per family, while 2-person families (287 | 54.4%) have the highest median income of $28,598 per family member.
| Income Bracket | # Families | Median Income |
| 2-Person Families | 287 (54.4%) | $57,196 |
| 3-Person Families | 83 (15.7%) | $63,958 |
| 4-Person Families | 144 (27.3%) | $51,250 |
| 5-Person Families | 11 (2.1%) | $0 |
| 6-Person Families | 3 (0.6%) | $0 |
| 7+ Person Families | 0 (0.0%) | $0 |
| Total | 528 (100.0%) | $60,000 |
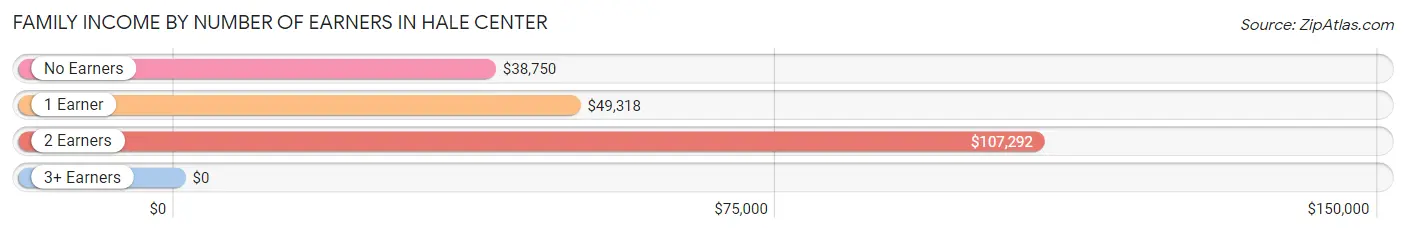
Family Income by Number of Earners in Hale Center
| Number of Earners | # Families | Median Income |
| No Earners | 60 (11.4%) | $38,750 |
| 1 Earner | 216 (40.9%) | $49,318 |
| 2 Earners | 231 (43.8%) | $107,292 |
| 3+ Earners | 21 (4.0%) | $0 |
| Total | 528 (100.0%) | $60,000 |
Household Income in Hale Center
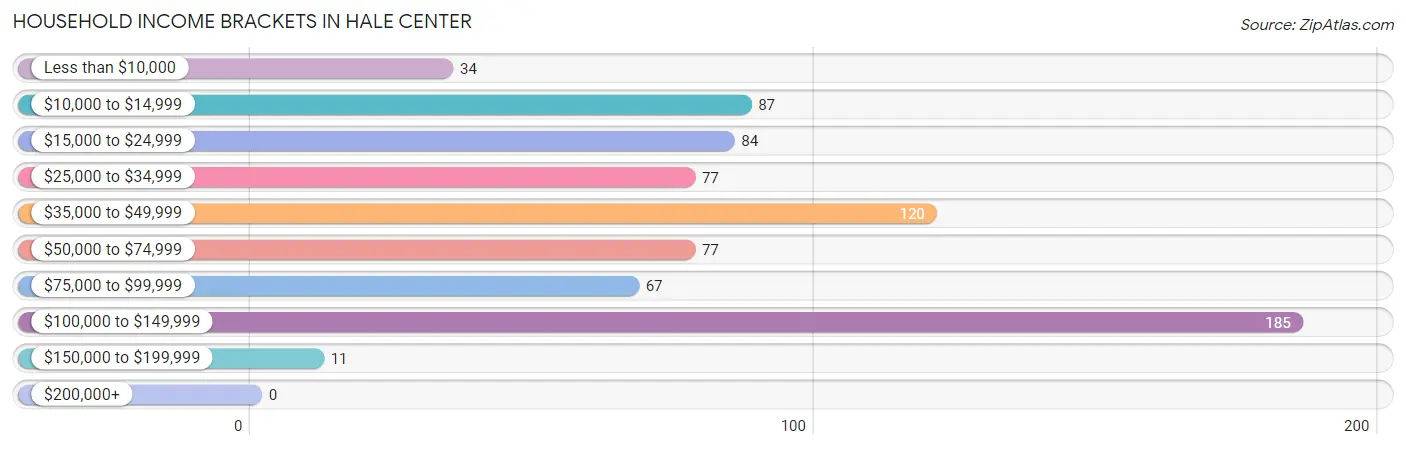
Household Income Brackets in Hale Center
With 185 households falling in the category, the $100,000 to $149,999 income range is the most frequent in Hale Center, accounting for 24.9% of all households.
| Income Bracket | # Households | % Households |
| Less than $10,000 | 34 | 4.6% |
| $10,000 to $14,999 | 87 | 11.7% |
| $15,000 to $24,999 | 84 | 11.3% |
| $25,000 to $34,999 | 77 | 10.4% |
| $35,000 to $49,999 | 120 | 16.2% |
| $50,000 to $74,999 | 77 | 10.4% |
| $75,000 to $99,999 | 67 | 9.0% |
| $100,000 to $149,999 | 185 | 24.9% |
| $150,000 to $199,999 | 11 | 1.5% |
| $200,000+ | 0 | 0.0% |
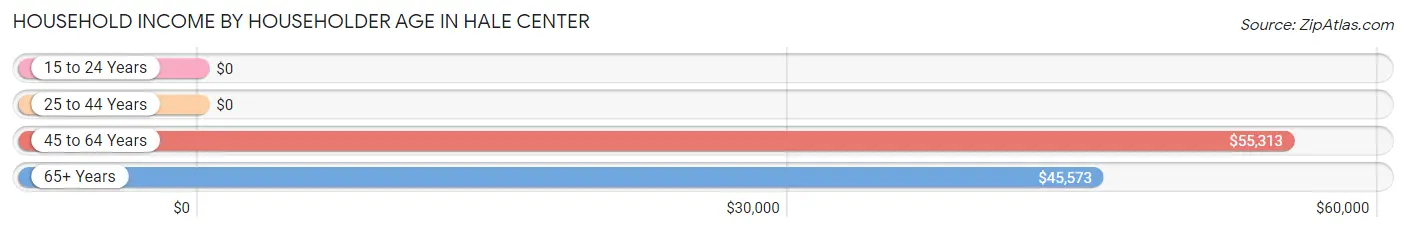
Household Income by Householder Age in Hale Center
The median household income in Hale Center is $47,130, with the highest median household income of $55,313 found in the 45 to 64 years age bracket for the primary householder. A total of 337 households (45.4%) fall into this category. Meanwhile, the 15 to 24 years age bracket for the primary householder has the lowest median household income of $0, with 14 households (1.9%) in this group.
| Income Bracket | # Households | Median Income |
| 15 to 24 Years | 14 (1.9%) | $0 |
| 25 to 44 Years | 182 (24.5%) | $0 |
| 45 to 64 Years | 337 (45.4%) | $55,313 |
| 65+ Years | 209 (28.2%) | $45,573 |
| Total | 742 (100.0%) | $47,130 |
Poverty in Hale Center
Income Below Poverty by Sex and Age in Hale Center
With 12.8% poverty level for males and 20.9% for females among the residents of Hale Center, 16 and 17 year old males and 6 to 11 year old females are the most vulnerable to poverty, with 11 males (27.5%) and 47 females (83.9%) in their respective age groups living below the poverty level.
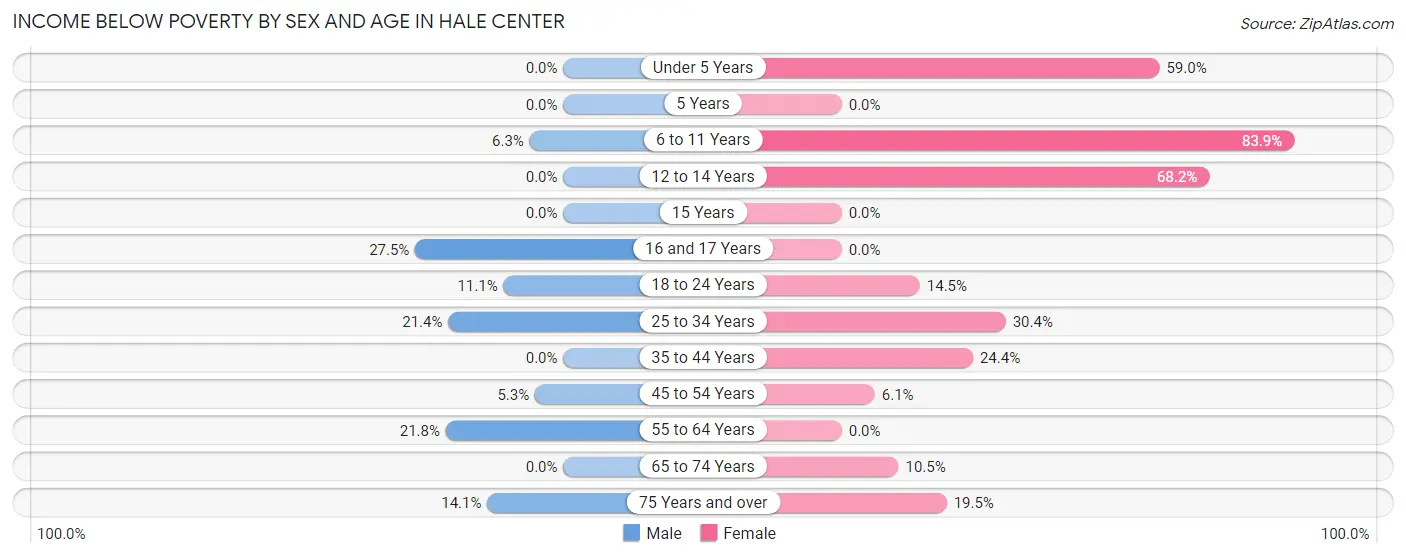
| Age Bracket | Male | Female |
| Under 5 Years | 0 (0.0%) | 23 (59.0%) |
| 5 Years | 0 (0.0%) | 0 (0.0%) |
| 6 to 11 Years | 6 (6.2%) | 47 (83.9%) |
| 12 to 14 Years | 0 (0.0%) | 30 (68.2%) |
| 15 Years | 0 (0.0%) | 0 (0.0%) |
| 16 and 17 Years | 11 (27.5%) | 0 (0.0%) |
| 18 to 24 Years | 8 (11.1%) | 10 (14.5%) |
| 25 to 34 Years | 19 (21.3%) | 14 (30.4%) |
| 35 to 44 Years | 0 (0.0%) | 28 (24.3%) |
| 45 to 54 Years | 4 (5.3%) | 7 (6.1%) |
| 55 to 64 Years | 60 (21.8%) | 0 (0.0%) |
| 65 to 74 Years | 0 (0.0%) | 4 (10.5%) |
| 75 Years and over | 12 (14.1%) | 22 (19.5%) |
| Total | 120 (12.8%) | 185 (20.9%) |
Income Above Poverty by Sex and Age in Hale Center
According to the poverty statistics in Hale Center, males aged under 5 years and females aged 16 and 17 years are the age groups that are most secure financially, with 100.0% of males and 100.0% of females in these age groups living above the poverty line.
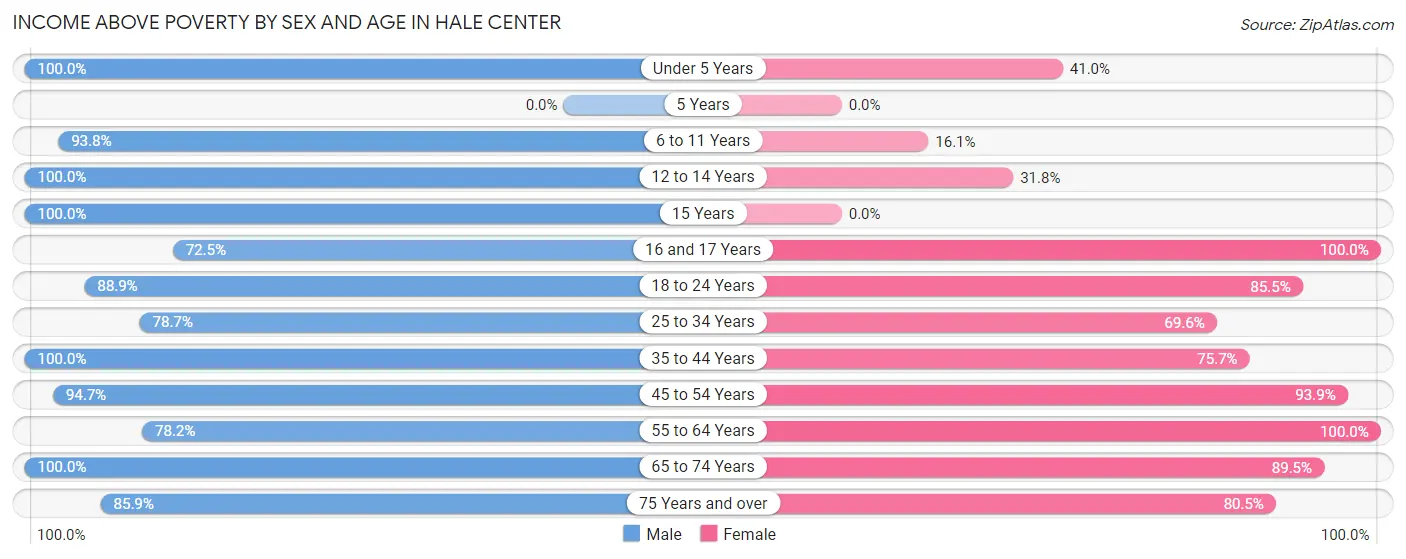
| Age Bracket | Male | Female |
| Under 5 Years | 21 (100.0%) | 16 (41.0%) |
| 5 Years | 0 (0.0%) | 0 (0.0%) |
| 6 to 11 Years | 90 (93.8%) | 9 (16.1%) |
| 12 to 14 Years | 6 (100.0%) | 14 (31.8%) |
| 15 Years | 6 (100.0%) | 0 (0.0%) |
| 16 and 17 Years | 29 (72.5%) | 43 (100.0%) |
| 18 to 24 Years | 64 (88.9%) | 59 (85.5%) |
| 25 to 34 Years | 70 (78.6%) | 32 (69.6%) |
| 35 to 44 Years | 95 (100.0%) | 87 (75.6%) |
| 45 to 54 Years | 72 (94.7%) | 107 (93.9%) |
| 55 to 64 Years | 215 (78.2%) | 206 (100.0%) |
| 65 to 74 Years | 75 (100.0%) | 34 (89.5%) |
| 75 Years and over | 73 (85.9%) | 91 (80.5%) |
| Total | 816 (87.2%) | 698 (79.0%) |
Income Below Poverty Among Married-Couple Families in Hale Center
The poverty statistics for married-couple families in Hale Center show that 2.0% or 7 of the total 354 families live below the poverty line. Families with no children have the highest poverty rate of 2.7%, comprising of 7 families. On the other hand, families with 1 or 2 children have the lowest poverty rate of 0.0%, which includes 0 families.
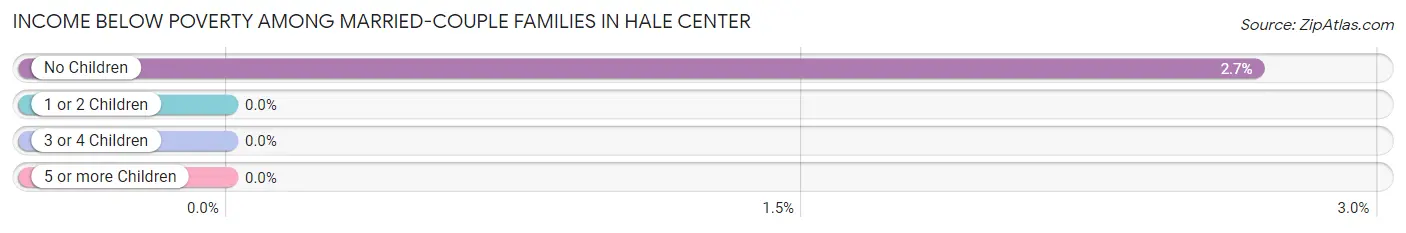
| Children | Above Poverty | Below Poverty |
| No Children | 254 (97.3%) | 7 (2.7%) |
| 1 or 2 Children | 82 (100.0%) | 0 (0.0%) |
| 3 or 4 Children | 11 (100.0%) | 0 (0.0%) |
| 5 or more Children | 0 (0.0%) | 0 (0.0%) |
| Total | 347 (98.0%) | 7 (2.0%) |
Income Below Poverty Among Single-Parent Households in Hale Center
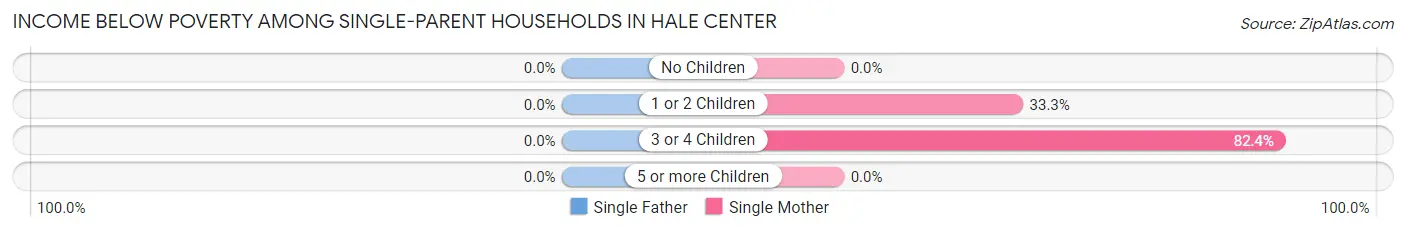
| Children | Single Father | Single Mother |
| No Children | 0 (0.0%) | 0 (0.0%) |
| 1 or 2 Children | 0 (0.0%) | 28 (33.3%) |
| 3 or 4 Children | 0 (0.0%) | 14 (82.4%) |
| 5 or more Children | 0 (0.0%) | 0 (0.0%) |
| Total | 0 (0.0%) | 42 (29.0%) |
Income Below Poverty Among Married-Couple vs Single-Parent Households in Hale Center
The poverty data for Hale Center shows that 7 of the married-couple family households (2.0%) and 42 of the single-parent households (24.1%) are living below the poverty level. Within the married-couple family households, those with no children have the highest poverty rate, with 7 households (2.7%) falling below the poverty line. Among the single-parent households, those with 3 or 4 children have the highest poverty rate, with 14 household (82.4%) living below poverty.
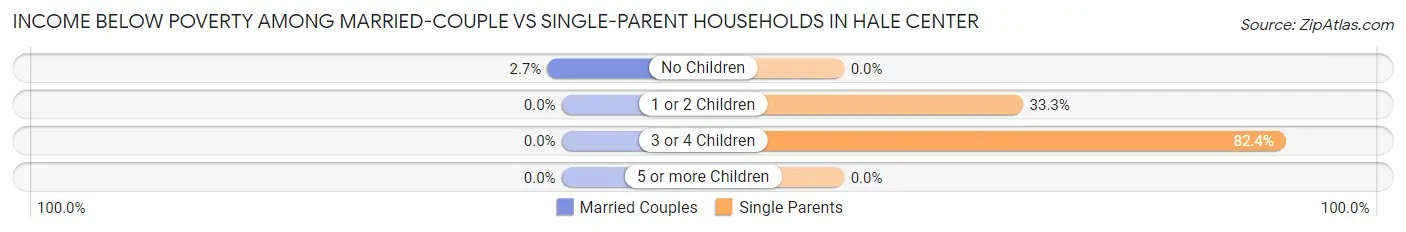
| Children | Married-Couple Families | Single-Parent Households |
| No Children | 7 (2.7%) | 0 (0.0%) |
| 1 or 2 Children | 0 (0.0%) | 28 (33.3%) |
| 3 or 4 Children | 0 (0.0%) | 14 (82.4%) |
| 5 or more Children | 0 (0.0%) | 0 (0.0%) |
| Total | 7 (2.0%) | 42 (24.1%) |
Race in Hale Center
The most populous races in Hale Center are Hispanic or Latino (1,230 | 65.9%), White / Caucasian (1,109 | 59.4%), and Two or more Races (414 | 22.2%).
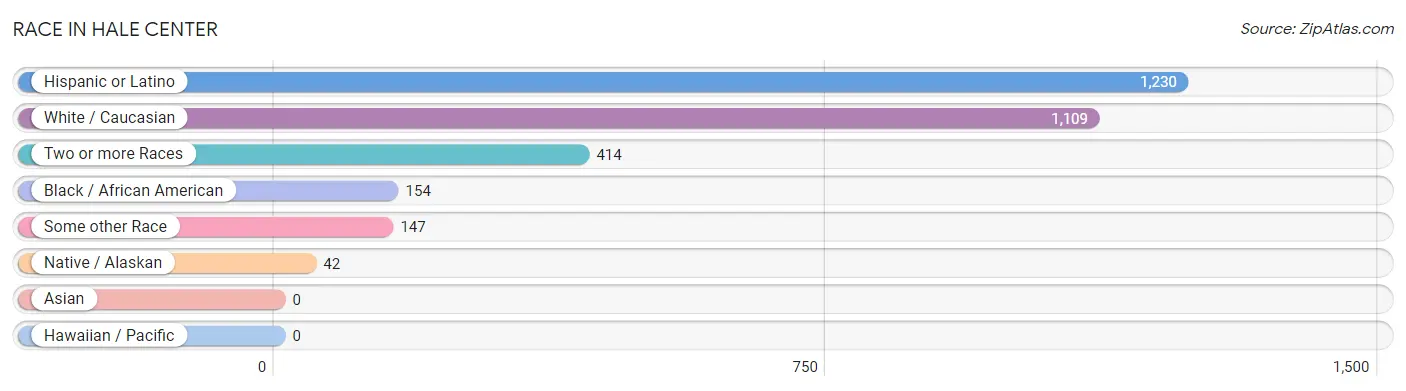
| Race | # Population | % Population |
| Asian | 0 | 0.0% |
| Black / African American | 154 | 8.3% |
| Hawaiian / Pacific | 0 | 0.0% |
| Hispanic or Latino | 1,230 | 65.9% |
| Native / Alaskan | 42 | 2.2% |
| White / Caucasian | 1,109 | 59.4% |
| Two or more Races | 414 | 22.2% |
| Some other Race | 147 | 7.9% |
| Total | 1,866 | 100.0% |
Ancestry in Hale Center
The most populous ancestries reported in Hale Center are Mexican (1,104 | 59.2%), German (131 | 7.0%), Irish (100 | 5.4%), African (81 | 4.3%), and Subsaharan African (81 | 4.3%), together accounting for 80.2% of all Hale Center residents.
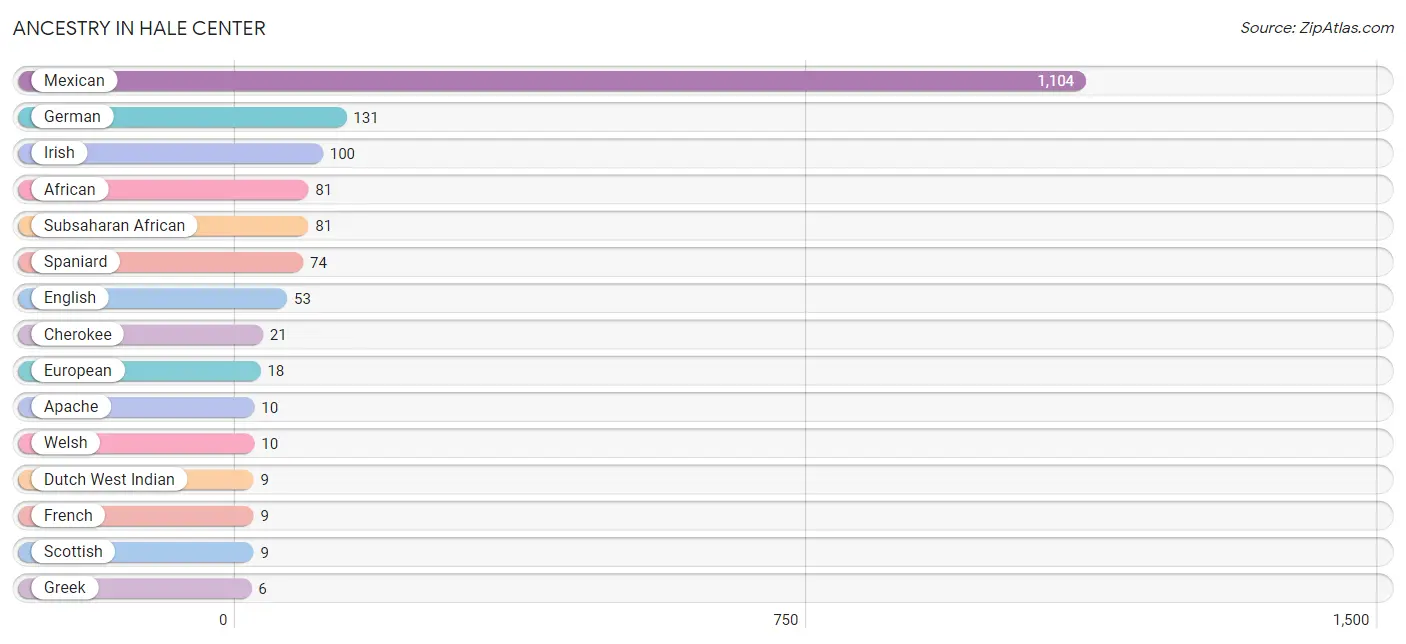
| Ancestry | # Population | % Population |
| African | 81 | 4.3% |
| Apache | 10 | 0.5% |
| Cherokee | 21 | 1.1% |
| Comanche | 3 | 0.2% |
| Dutch West Indian | 9 | 0.5% |
| English | 53 | 2.8% |
| European | 18 | 1.0% |
| French | 9 | 0.5% |
| German | 131 | 7.0% |
| Greek | 6 | 0.3% |
| Irish | 100 | 5.4% |
| Italian | 6 | 0.3% |
| Mexican | 1,104 | 59.2% |
| Scotch-Irish | 3 | 0.2% |
| Scottish | 9 | 0.5% |
| Spaniard | 74 | 4.0% |
| Spanish | 3 | 0.2% |
| Subsaharan African | 81 | 4.3% |
| Welsh | 10 | 0.5% | View All 19 Rows |
Immigrants in Hale Center
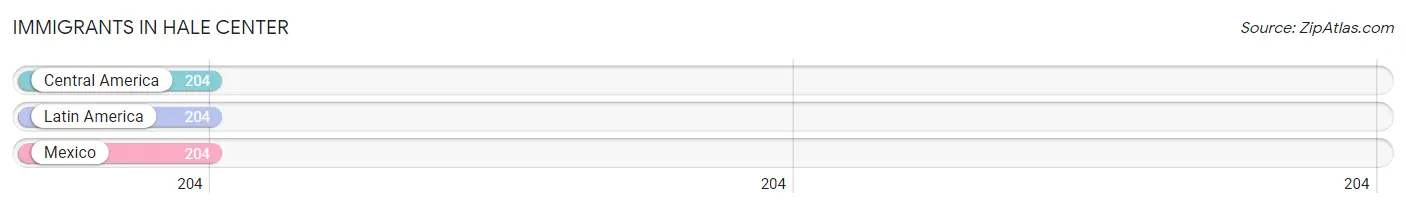
The most numerous immigrant groups reported in Hale Center came from Central America (204 | 10.9%), Latin America (204 | 10.9%), and Mexico (204 | 10.9%), together accounting for 32.8% of all Hale Center residents.
| Immigration Origin | # Population | % Population |
| Central America | 204 | 10.9% |
| Latin America | 204 | 10.9% |
| Mexico | 204 | 10.9% | View All 3 Rows |
Sex and Age in Hale Center
Sex and Age in Hale Center
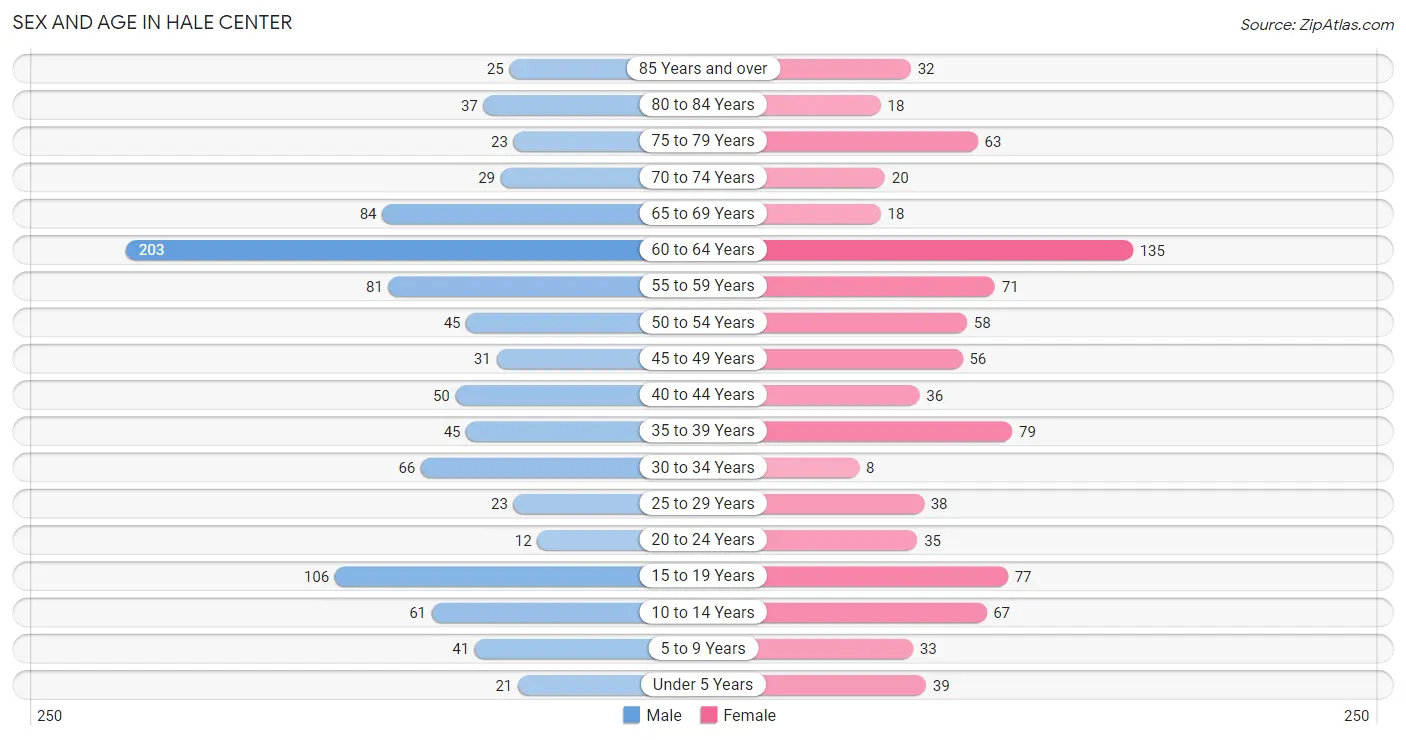
The most populous age groups in Hale Center are 60 to 64 Years (203 | 20.6%) for men and 60 to 64 Years (135 | 15.3%) for women.
| Age Bracket | Male | Female |
| Under 5 Years | 21 (2.1%) | 39 (4.4%) |
| 5 to 9 Years | 41 (4.2%) | 33 (3.7%) |
| 10 to 14 Years | 61 (6.2%) | 67 (7.6%) |
| 15 to 19 Years | 106 (10.8%) | 77 (8.7%) |
| 20 to 24 Years | 12 (1.2%) | 35 (4.0%) |
| 25 to 29 Years | 23 (2.3%) | 38 (4.3%) |
| 30 to 34 Years | 66 (6.7%) | 8 (0.9%) |
| 35 to 39 Years | 45 (4.6%) | 79 (8.9%) |
| 40 to 44 Years | 50 (5.1%) | 36 (4.1%) |
| 45 to 49 Years | 31 (3.2%) | 56 (6.3%) |
| 50 to 54 Years | 45 (4.6%) | 58 (6.6%) |
| 55 to 59 Years | 81 (8.2%) | 71 (8.0%) |
| 60 to 64 Years | 203 (20.6%) | 135 (15.3%) |
| 65 to 69 Years | 84 (8.6%) | 18 (2.0%) |
| 70 to 74 Years | 29 (2.9%) | 20 (2.3%) |
| 75 to 79 Years | 23 (2.3%) | 63 (7.1%) |
| 80 to 84 Years | 37 (3.8%) | 18 (2.0%) |
| 85 Years and over | 25 (2.5%) | 32 (3.6%) |
| Total | 983 (100.0%) | 883 (100.0%) |
Families and Households in Hale Center
Median Family Size in Hale Center
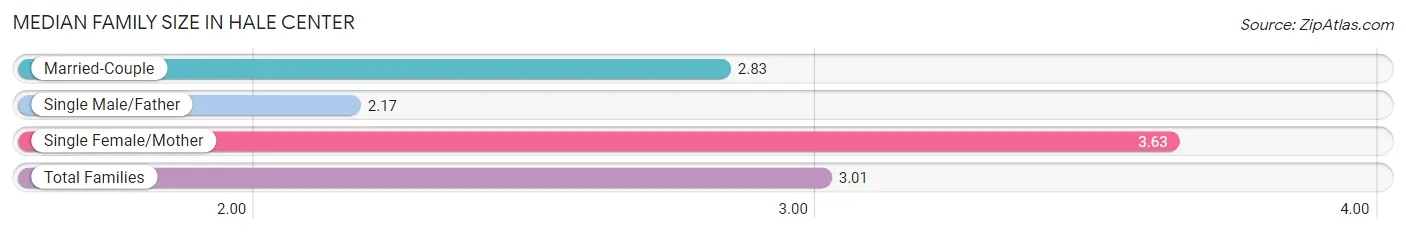
The median family size in Hale Center is 3.01 persons per family, with single female/mother families (145 | 27.5%) accounting for the largest median family size of 3.63 persons per family. On the other hand, single male/father families (29 | 5.5%) represent the smallest median family size with 2.17 persons per family.
| Family Type | # Families | Family Size |
| Married-Couple | 354 (67.0%) | 2.83 |
| Single Male/Father | 29 (5.5%) | 2.17 |
| Single Female/Mother | 145 (27.5%) | 3.63 |
| Total Families | 528 (100.0%) | 3.01 |
Median Household Size in Hale Center
| Household Type | # Households | Household Size |
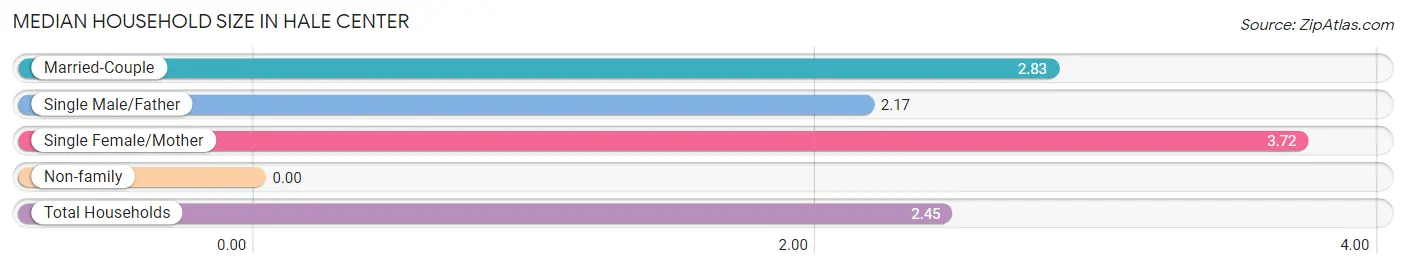
| Married-Couple | 354 (47.7%) | 2.83 |
| Single Male/Father | 29 (3.9%) | 2.17 |
| Single Female/Mother | 145 (19.5%) | 3.72 |
| Non-family | 214 (28.8%) | - |
| Total Households | 742 (100.0%) | 2.45 |
Household Size by Marriage Status in Hale Center
Out of a total of 742 households in Hale Center, 528 (71.2%) are family households, while 214 (28.8%) are nonfamily households. The most numerous type of family households are 2-person households, comprising 287, and the most common type of nonfamily households are 1-person households, comprising 214.
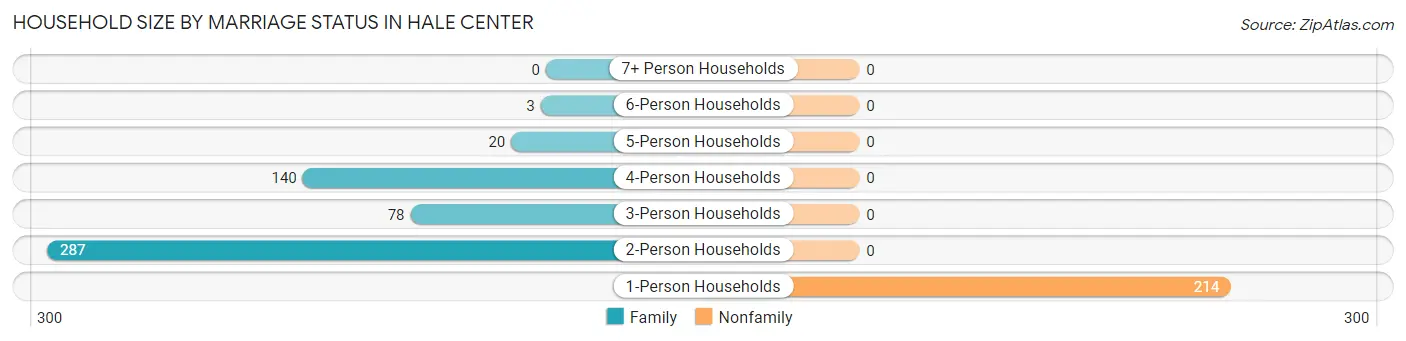
| Household Size | Family Households | Nonfamily Households |
| 1-Person Households | - | 214 (28.8%) |
| 2-Person Households | 287 (38.7%) | 0 (0.0%) |
| 3-Person Households | 78 (10.5%) | 0 (0.0%) |
| 4-Person Households | 140 (18.9%) | 0 (0.0%) |
| 5-Person Households | 20 (2.7%) | 0 (0.0%) |
| 6-Person Households | 3 (0.4%) | 0 (0.0%) |
| 7+ Person Households | 0 (0.0%) | 0 (0.0%) |
| Total | 528 (71.2%) | 214 (28.8%) |
Female Fertility in Hale Center
Fertility by Age in Hale Center
Average fertility rate in Hale Center is 51.0 births per 1,000 women. Women in the age bracket of 20 to 34 years have the highest fertility rate with 210.0 births per 1,000 women. Women in the age bracket of 20 to 34 years acount for 100.0% of all women with births.
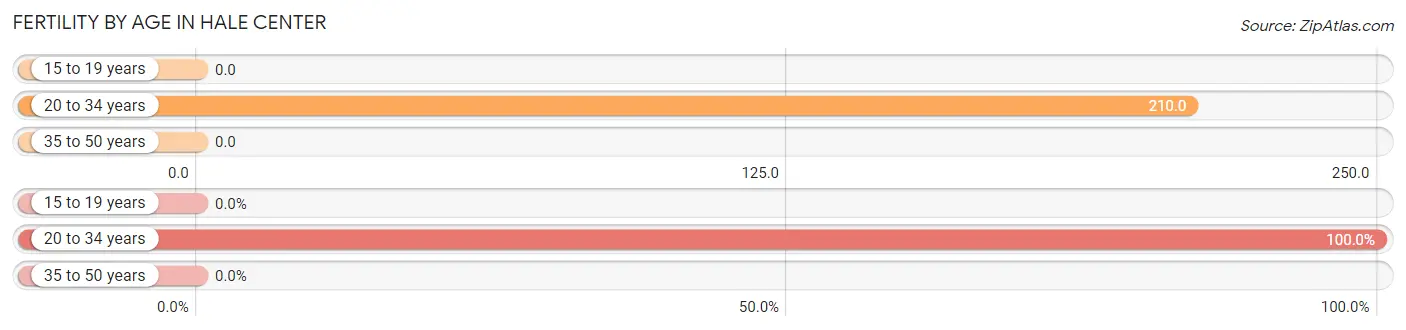
| Age Bracket | Women with Births | Births / 1,000 Women |
| 15 to 19 years | 0 (0.0%) | 0.0 |
| 20 to 34 years | 17 (100.0%) | 210.0 |
| 35 to 50 years | 0 (0.0%) | 0.0 |
| Total | 17 (100.0%) | 51.0 |
Fertility by Age by Marriage Status in Hale Center
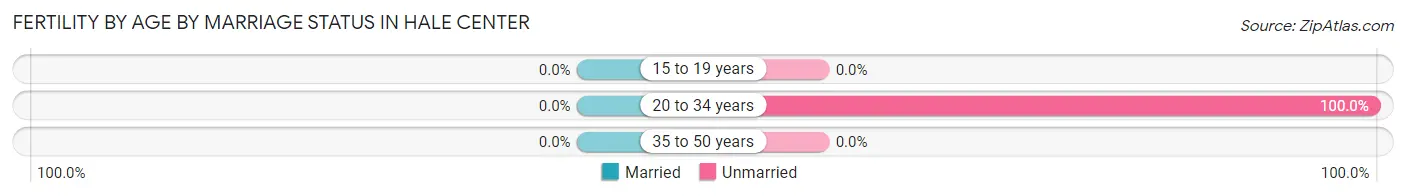
| Age Bracket | Married | Unmarried |
| 15 to 19 years | 0 (0.0%) | 0 (0.0%) |
| 20 to 34 years | 0 (0.0%) | 17 (100.0%) |
| 35 to 50 years | 0 (0.0%) | 0 (0.0%) |
| Total | 0 (0.0%) | 17 (100.0%) |
Fertility by Education in Hale Center
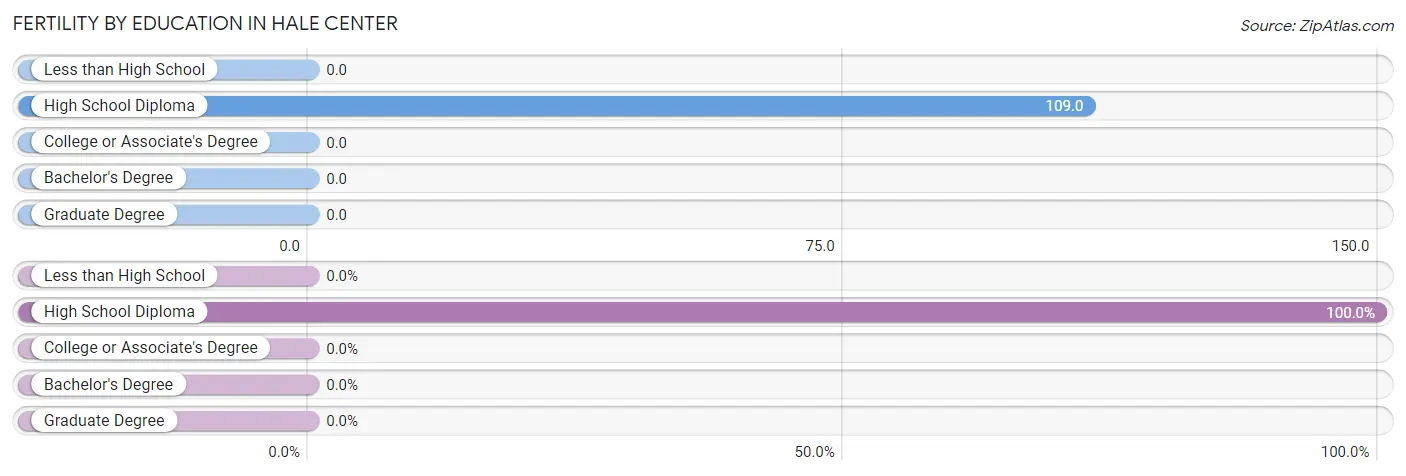
| Educational Attainment | Women with Births | Births / 1,000 Women |
| Less than High School | 0 (0.0%) | 0.0 |
| High School Diploma | 17 (100.0%) | 109.0 |
| College or Associate's Degree | 0 (0.0%) | 0.0 |
| Bachelor's Degree | 0 (0.0%) | 0.0 |
| Graduate Degree | 0 (0.0%) | 0.0 |
| Total | 17 (100.0%) | 51.0 |
Fertility by Education by Marriage Status in Hale Center
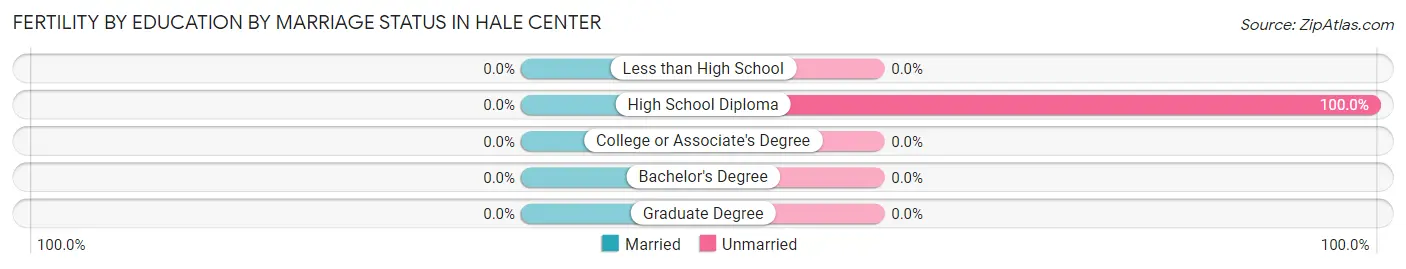
| Educational Attainment | Married | Unmarried |
| Less than High School | 0 (0.0%) | 0 (0.0%) |
| High School Diploma | 0 (0.0%) | 17 (100.0%) |
| College or Associate's Degree | 0 (0.0%) | 0 (0.0%) |
| Bachelor's Degree | 0 (0.0%) | 0 (0.0%) |
| Graduate Degree | 0 (0.0%) | 0 (0.0%) |
| Total | 0 (0.0%) | 17 (100.0%) |
Employment Characteristics in Hale Center
Employment by Class of Employer in Hale Center
Among the 706 employed individuals in Hale Center, private company employees (432 | 61.2%), self-employed (not incorporated) (133 | 18.8%), and local government employees (75 | 10.6%) make up the most common classes of employment.
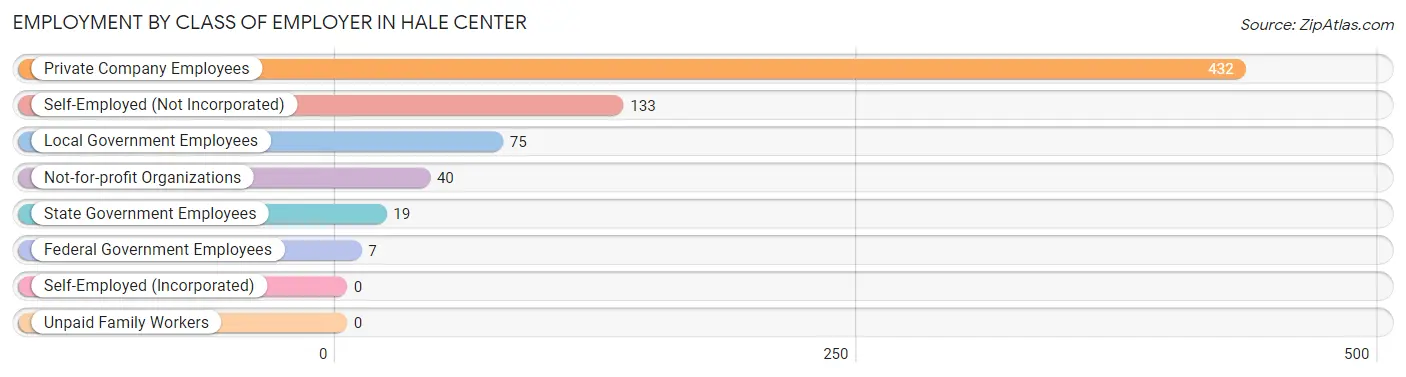
| Employer Class | # Employees | % Employees |
| Private Company Employees | 432 | 61.2% |
| Self-Employed (Incorporated) | 0 | 0.0% |
| Self-Employed (Not Incorporated) | 133 | 18.8% |
| Not-for-profit Organizations | 40 | 5.7% |
| Local Government Employees | 75 | 10.6% |
| State Government Employees | 19 | 2.7% |
| Federal Government Employees | 7 | 1.0% |
| Unpaid Family Workers | 0 | 0.0% |
| Total | 706 | 100.0% |
Employment Status by Age in Hale Center
According to the labor force statistics for Hale Center, out of the total population over 16 years of age (1,598), 50.9% or 813 individuals are in the labor force, with 2.1% or 17 of them unemployed. The age group with the highest labor force participation rate is 45 to 54 years, with 82.1% or 156 individuals in the labor force. Within the labor force, the 55 to 59 years age range has the highest percentage of unemployed individuals, with 11.0% or 13 of them being unemployed.
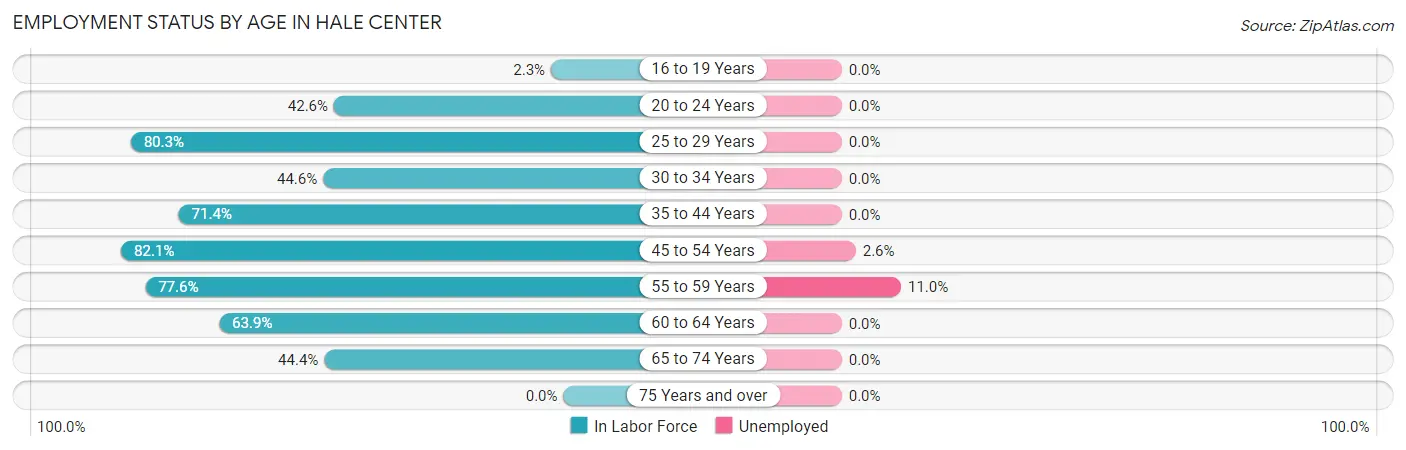
| Age Bracket | In Labor Force | Unemployed |
| 16 to 19 Years | 4 (2.3%) | 0 (0.0%) |
| 20 to 24 Years | 20 (42.6%) | 0 (0.0%) |
| 25 to 29 Years | 49 (80.3%) | 0 (0.0%) |
| 30 to 34 Years | 33 (44.6%) | 0 (0.0%) |
| 35 to 44 Years | 150 (71.4%) | 0 (0.0%) |
| 45 to 54 Years | 156 (82.1%) | 4 (2.6%) |
| 55 to 59 Years | 118 (77.6%) | 13 (11.0%) |
| 60 to 64 Years | 216 (63.9%) | 0 (0.0%) |
| 65 to 74 Years | 67 (44.4%) | 0 (0.0%) |
| 75 Years and over | 0 (0.0%) | 0 (0.0%) |
| Total | 813 (50.9%) | 17 (2.1%) |
Employment Status by Educational Attainment in Hale Center
According to labor force statistics for Hale Center, 70.4% of individuals (722) out of the total population between 25 and 64 years of age (1,025) are in the labor force, with 2.4% or 17 of them being unemployed. The group with the highest labor force participation rate are those with the educational attainment of bachelor's degree or higher, with 88.8% or 71 individuals in the labor force. Within the labor force, individuals with less than high school education have the highest percentage of unemployment, with 4.7% or 9 of them being unemployed.
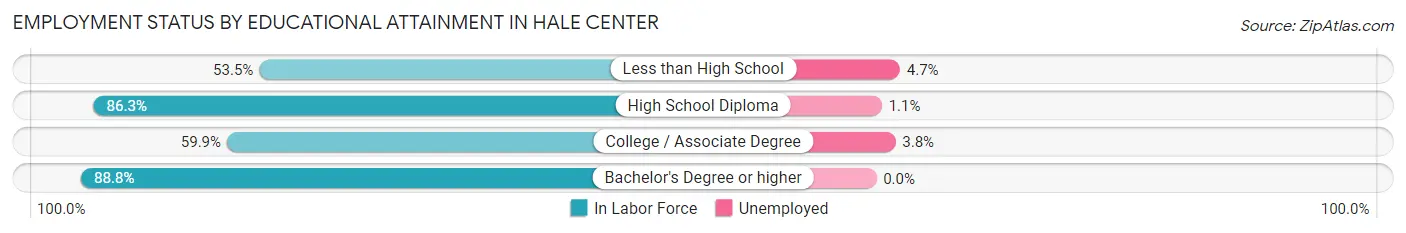
| Educational Attainment | In Labor Force | Unemployed |
| Less than High School | 192 (53.5%) | 17 (4.7%) |
| High School Diploma | 353 (86.3%) | 4 (1.1%) |
| College / Associate Degree | 106 (59.9%) | 7 (3.8%) |
| Bachelor's Degree or higher | 71 (88.8%) | 0 (0.0%) |
| Total | 722 (70.4%) | 25 (2.4%) |
Employment Occupations by Sex in Hale Center
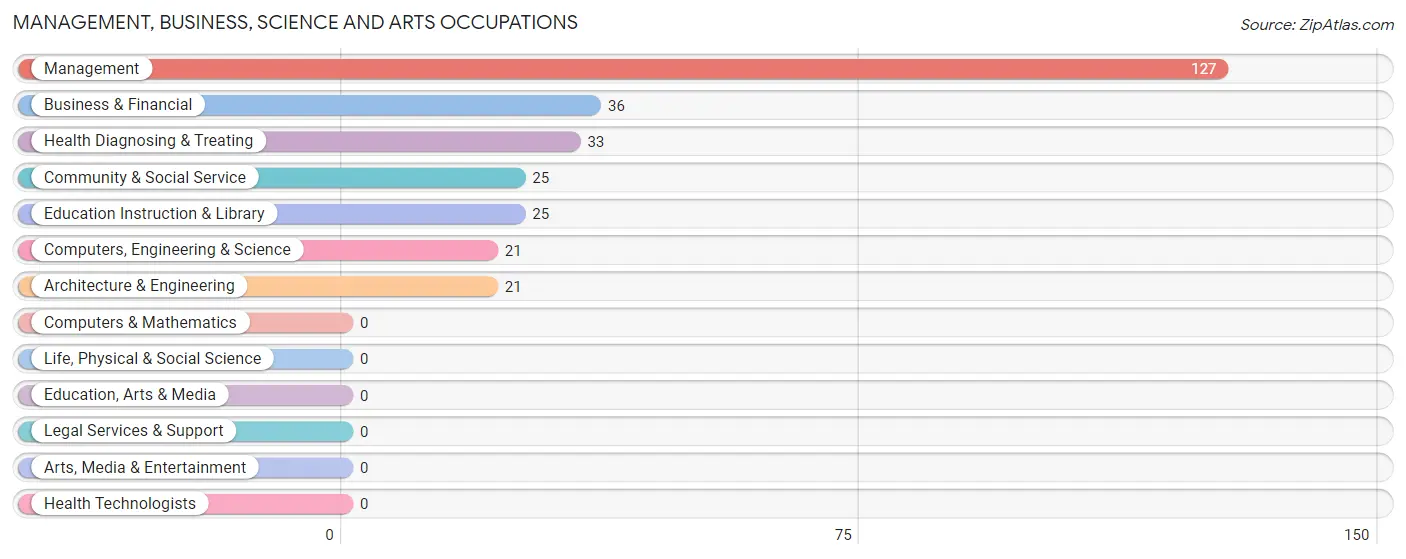
Management, Business, Science and Arts Occupations
The most common Management, Business, Science and Arts occupations in Hale Center are Management (127 | 16.0%), Business & Financial (36 | 4.5%), Health Diagnosing & Treating (33 | 4.2%), Community & Social Service (25 | 3.1%), and Education Instruction & Library (25 | 3.1%).
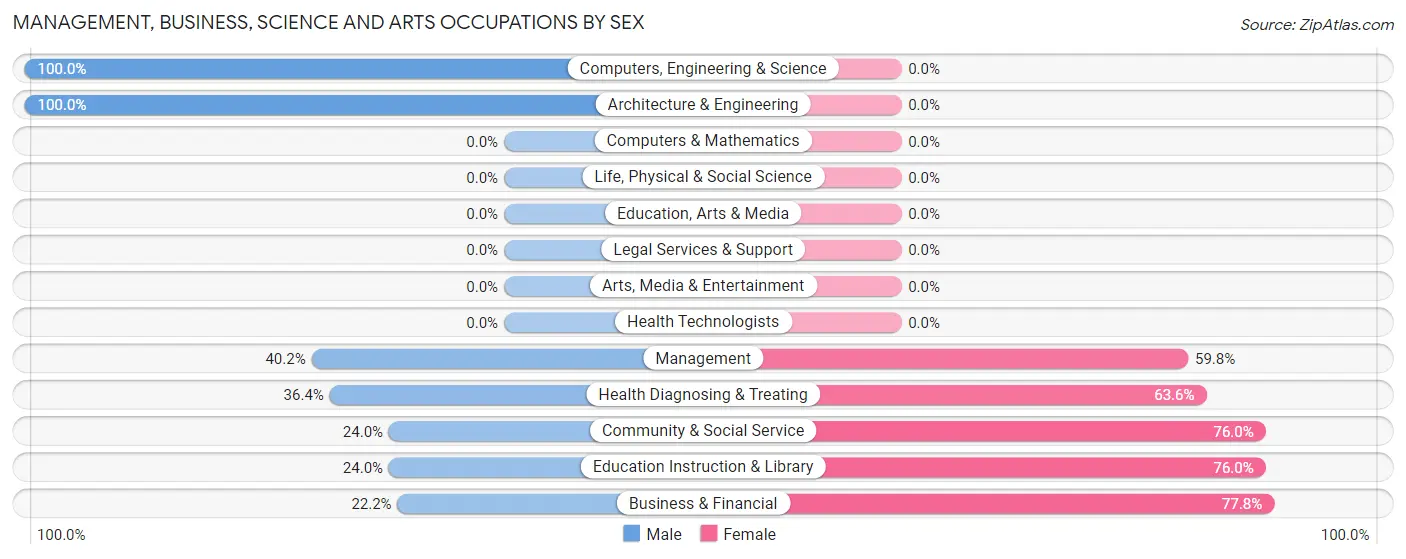
Management, Business, Science and Arts Occupations by Sex
Within the Management, Business, Science and Arts occupations in Hale Center, the most male-oriented occupations are Computers, Engineering & Science (100.0%), Architecture & Engineering (100.0%), and Management (40.2%), while the most female-oriented occupations are Business & Financial (77.8%), Community & Social Service (76.0%), and Education Instruction & Library (76.0%).
| Occupation | Male | Female |
| Management | 51 (40.2%) | 76 (59.8%) |
| Business & Financial | 8 (22.2%) | 28 (77.8%) |
| Computers, Engineering & Science | 21 (100.0%) | 0 (0.0%) |
| Computers & Mathematics | 0 (0.0%) | 0 (0.0%) |
| Architecture & Engineering | 21 (100.0%) | 0 (0.0%) |
| Life, Physical & Social Science | 0 (0.0%) | 0 (0.0%) |
| Community & Social Service | 6 (24.0%) | 19 (76.0%) |
| Education, Arts & Media | 0 (0.0%) | 0 (0.0%) |
| Legal Services & Support | 0 (0.0%) | 0 (0.0%) |
| Education Instruction & Library | 6 (24.0%) | 19 (76.0%) |
| Arts, Media & Entertainment | 0 (0.0%) | 0 (0.0%) |
| Health Diagnosing & Treating | 12 (36.4%) | 21 (63.6%) |
| Health Technologists | 0 (0.0%) | 0 (0.0%) |
| Total (Category) | 98 (40.5%) | 144 (59.5%) |
| Total (Overall) | 433 (54.4%) | 363 (45.6%) |
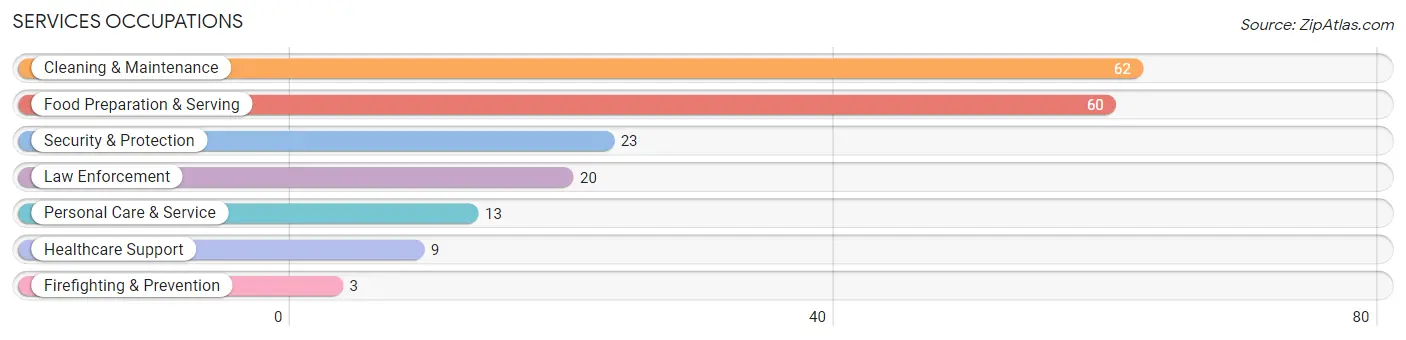
Services Occupations
The most common Services occupations in Hale Center are Cleaning & Maintenance (62 | 7.8%), Food Preparation & Serving (60 | 7.5%), Security & Protection (23 | 2.9%), Law Enforcement (20 | 2.5%), and Personal Care & Service (13 | 1.6%).
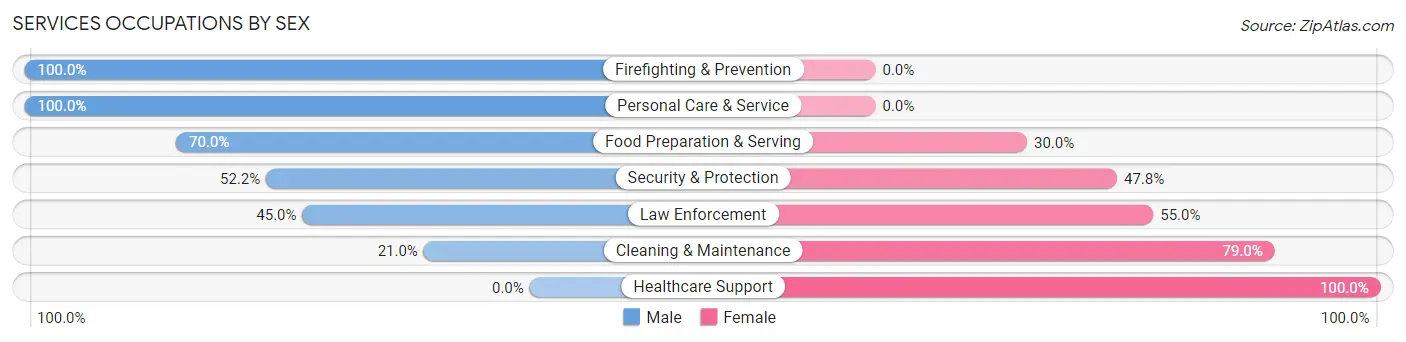
Services Occupations by Sex
Within the Services occupations in Hale Center, the most male-oriented occupations are Firefighting & Prevention (100.0%), Personal Care & Service (100.0%), and Food Preparation & Serving (70.0%), while the most female-oriented occupations are Healthcare Support (100.0%), Cleaning & Maintenance (79.0%), and Law Enforcement (55.0%).
| Occupation | Male | Female |
| Healthcare Support | 0 (0.0%) | 9 (100.0%) |
| Security & Protection | 12 (52.2%) | 11 (47.8%) |
| Firefighting & Prevention | 3 (100.0%) | 0 (0.0%) |
| Law Enforcement | 9 (45.0%) | 11 (55.0%) |
| Food Preparation & Serving | 42 (70.0%) | 18 (30.0%) |
| Cleaning & Maintenance | 13 (21.0%) | 49 (79.0%) |
| Personal Care & Service | 13 (100.0%) | 0 (0.0%) |
| Total (Category) | 80 (47.9%) | 87 (52.1%) |
| Total (Overall) | 433 (54.4%) | 363 (45.6%) |
Sales and Office Occupations
The most common Sales and Office occupations in Hale Center are Sales & Related (57 | 7.2%), and Office & Administration (51 | 6.4%).
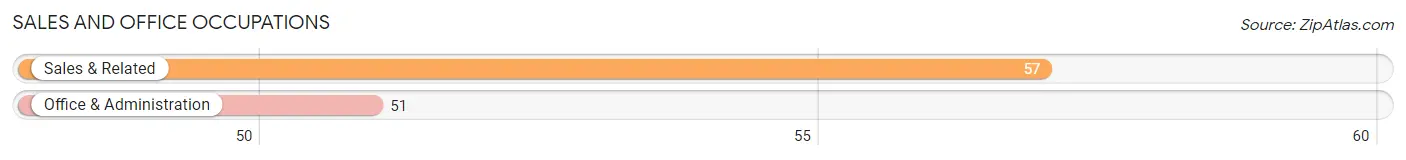
Sales and Office Occupations by Sex
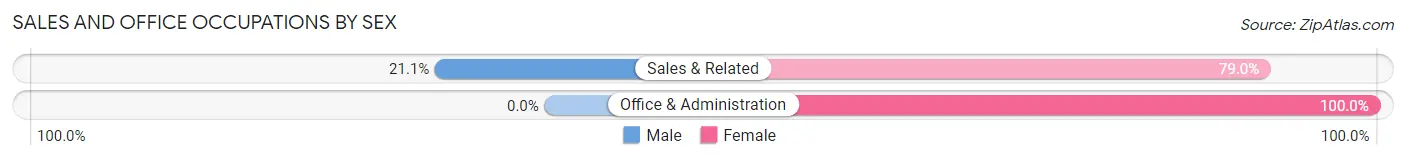
| Occupation | Male | Female |
| Sales & Related | 12 (21.0%) | 45 (78.9%) |
| Office & Administration | 0 (0.0%) | 51 (100.0%) |
| Total (Category) | 12 (11.1%) | 96 (88.9%) |
| Total (Overall) | 433 (54.4%) | 363 (45.6%) |
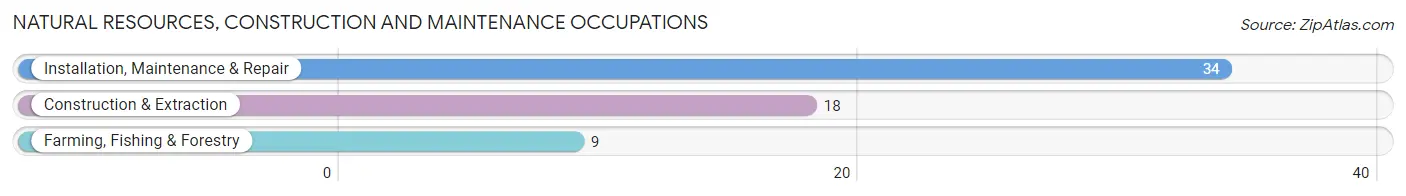
Natural Resources, Construction and Maintenance Occupations
The most common Natural Resources, Construction and Maintenance occupations in Hale Center are Installation, Maintenance & Repair (34 | 4.3%), Construction & Extraction (18 | 2.3%), and Farming, Fishing & Forestry (9 | 1.1%).
Natural Resources, Construction and Maintenance Occupations by Sex
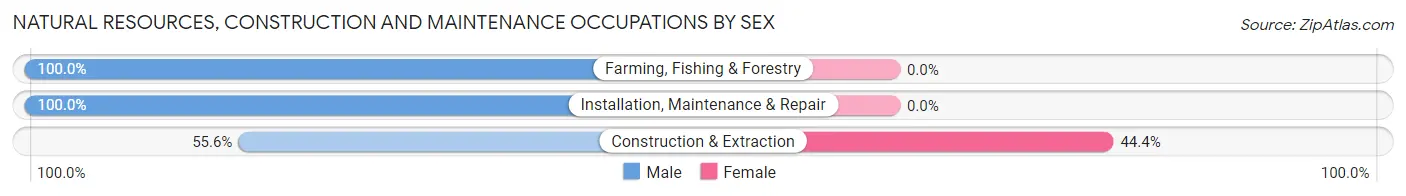
| Occupation | Male | Female |
| Farming, Fishing & Forestry | 9 (100.0%) | 0 (0.0%) |
| Construction & Extraction | 10 (55.6%) | 8 (44.4%) |
| Installation, Maintenance & Repair | 34 (100.0%) | 0 (0.0%) |
| Total (Category) | 53 (86.9%) | 8 (13.1%) |
| Total (Overall) | 433 (54.4%) | 363 (45.6%) |
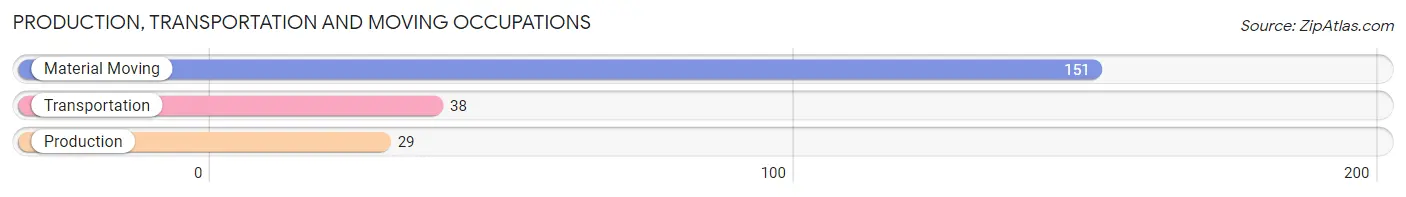
Production, Transportation and Moving Occupations
The most common Production, Transportation and Moving occupations in Hale Center are Material Moving (151 | 19.0%), Transportation (38 | 4.8%), and Production (29 | 3.6%).
Production, Transportation and Moving Occupations by Sex
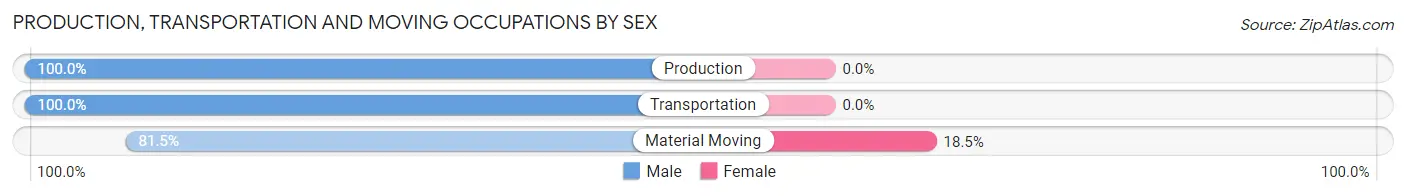
| Occupation | Male | Female |
| Production | 29 (100.0%) | 0 (0.0%) |
| Transportation | 38 (100.0%) | 0 (0.0%) |
| Material Moving | 123 (81.5%) | 28 (18.5%) |
| Total (Category) | 190 (87.2%) | 28 (12.8%) |
| Total (Overall) | 433 (54.4%) | 363 (45.6%) |
Employment Industries by Sex in Hale Center
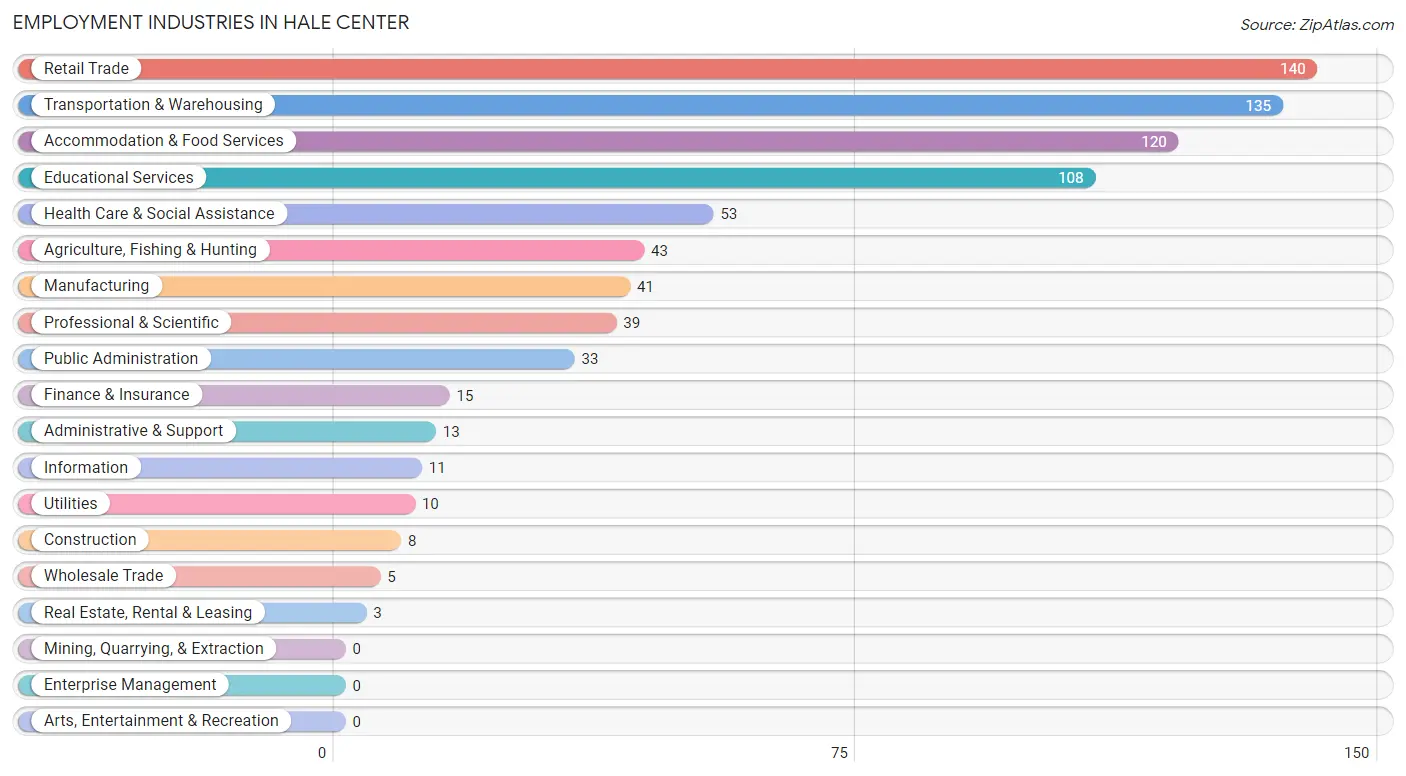
Employment Industries in Hale Center
The major employment industries in Hale Center include Retail Trade (140 | 17.6%), Transportation & Warehousing (135 | 17.0%), Accommodation & Food Services (120 | 15.1%), Educational Services (108 | 13.6%), and Health Care & Social Assistance (53 | 6.7%).
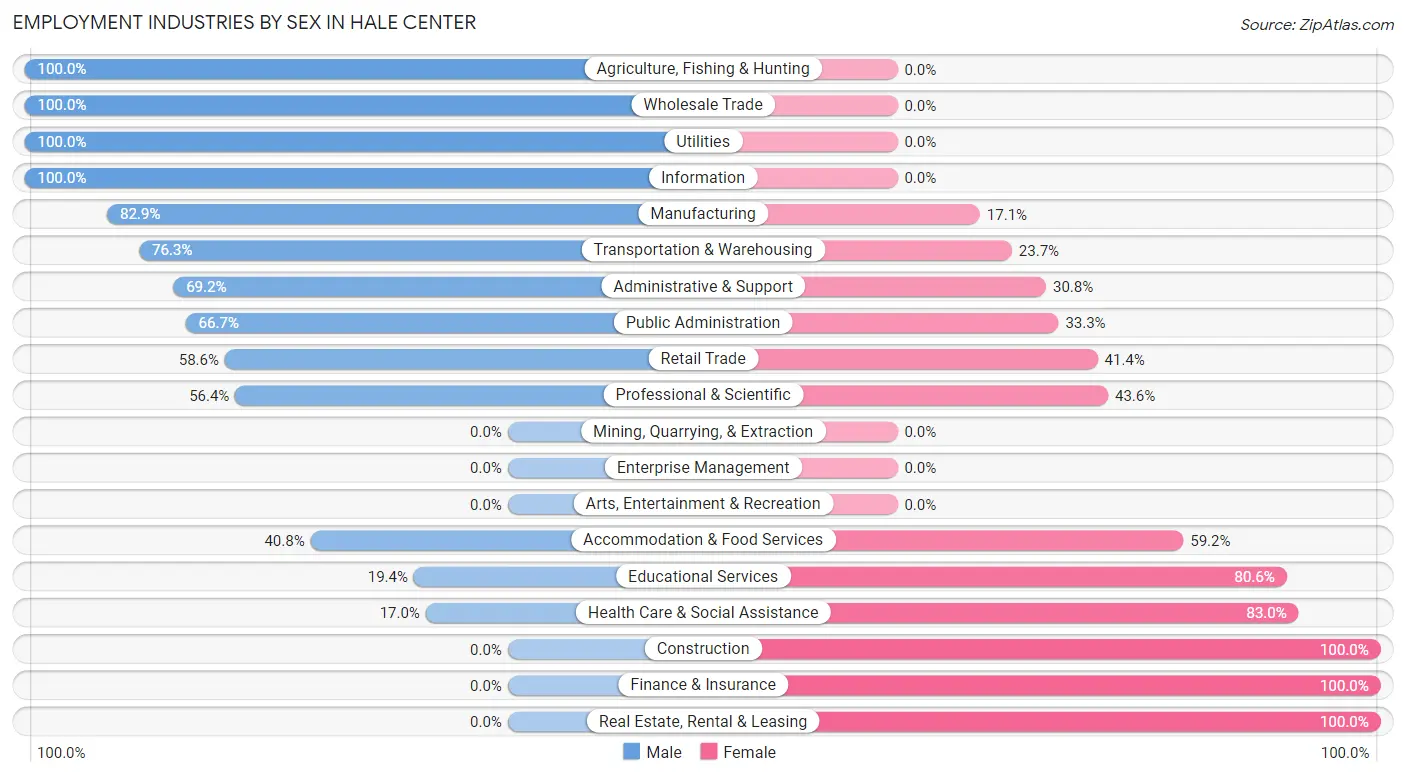
Employment Industries by Sex in Hale Center
The Hale Center industries that see more men than women are Agriculture, Fishing & Hunting (100.0%), Wholesale Trade (100.0%), and Utilities (100.0%), whereas the industries that tend to have a higher number of women are Construction (100.0%), Finance & Insurance (100.0%), and Real Estate, Rental & Leasing (100.0%).
| Industry | Male | Female |
| Agriculture, Fishing & Hunting | 43 (100.0%) | 0 (0.0%) |
| Mining, Quarrying, & Extraction | 0 (0.0%) | 0 (0.0%) |
| Construction | 0 (0.0%) | 8 (100.0%) |
| Manufacturing | 34 (82.9%) | 7 (17.1%) |
| Wholesale Trade | 5 (100.0%) | 0 (0.0%) |
| Retail Trade | 82 (58.6%) | 58 (41.4%) |
| Transportation & Warehousing | 103 (76.3%) | 32 (23.7%) |
| Utilities | 10 (100.0%) | 0 (0.0%) |
| Information | 11 (100.0%) | 0 (0.0%) |
| Finance & Insurance | 0 (0.0%) | 15 (100.0%) |
| Real Estate, Rental & Leasing | 0 (0.0%) | 3 (100.0%) |
| Professional & Scientific | 22 (56.4%) | 17 (43.6%) |
| Enterprise Management | 0 (0.0%) | 0 (0.0%) |
| Administrative & Support | 9 (69.2%) | 4 (30.8%) |
| Educational Services | 21 (19.4%) | 87 (80.6%) |
| Health Care & Social Assistance | 9 (17.0%) | 44 (83.0%) |
| Arts, Entertainment & Recreation | 0 (0.0%) | 0 (0.0%) |
| Accommodation & Food Services | 49 (40.8%) | 71 (59.2%) |
| Public Administration | 22 (66.7%) | 11 (33.3%) |
| Total | 433 (54.4%) | 363 (45.6%) |
Education in Hale Center
School Enrollment in Hale Center
The most common levels of schooling among the 401 students in Hale Center are high school (154 | 38.4%), middle school (110 | 27.4%), and elementary school (86 | 21.4%).
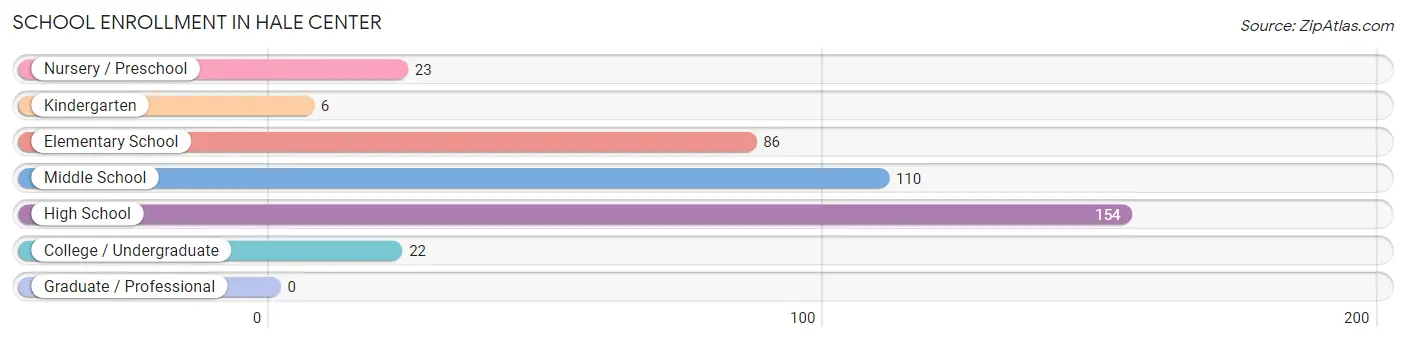
| School Level | # Students | % Students |
| Nursery / Preschool | 23 | 5.7% |
| Kindergarten | 6 | 1.5% |
| Elementary School | 86 | 21.4% |
| Middle School | 110 | 27.4% |
| High School | 154 | 38.4% |
| College / Undergraduate | 22 | 5.5% |
| Graduate / Professional | 0 | 0.0% |
| Total | 401 | 100.0% |
School Enrollment by Age by Funding Source in Hale Center
Out of a total of 401 students who are enrolled in schools in Hale Center, 14 (3.5%) attend a private institution, while the remaining 387 (96.5%) are enrolled in public schools. The age group of 35 years and over has the highest likelihood of being enrolled in private schools, with 14 (100.0% in the age bracket) enrolled. Conversely, the age group of 3 to 4 year olds has the lowest likelihood of being enrolled in a private school, with 23 (100.0% in the age bracket) attending a public institution.
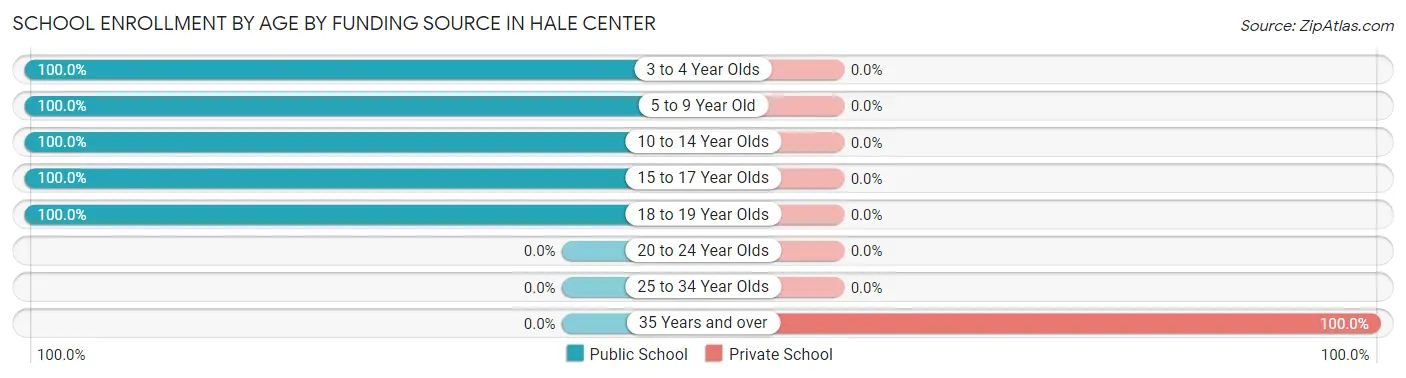
| Age Bracket | Public School | Private School |
| 3 to 4 Year Olds | 23 (100.0%) | 0 (0.0%) |
| 5 to 9 Year Old | 74 (100.0%) | 0 (0.0%) |
| 10 to 14 Year Olds | 128 (100.0%) | 0 (0.0%) |
| 15 to 17 Year Olds | 89 (100.0%) | 0 (0.0%) |
| 18 to 19 Year Olds | 73 (100.0%) | 0 (0.0%) |
| 20 to 24 Year Olds | 0 (0.0%) | 0 (0.0%) |
| 25 to 34 Year Olds | 0 (0.0%) | 0 (0.0%) |
| 35 Years and over | 0 (0.0%) | 14 (100.0%) |
| Total | 387 (96.5%) | 14 (3.5%) |
Educational Attainment by Field of Study in Hale Center
Business (38 | 33.0%), bio, nature & agricultural (29 | 25.2%), arts & humanities (14 | 12.2%), education (13 | 11.3%), and physical & health sciences (8 | 7.0%) are the most common fields of study among 115 individuals in Hale Center who have obtained a bachelor's degree or higher.
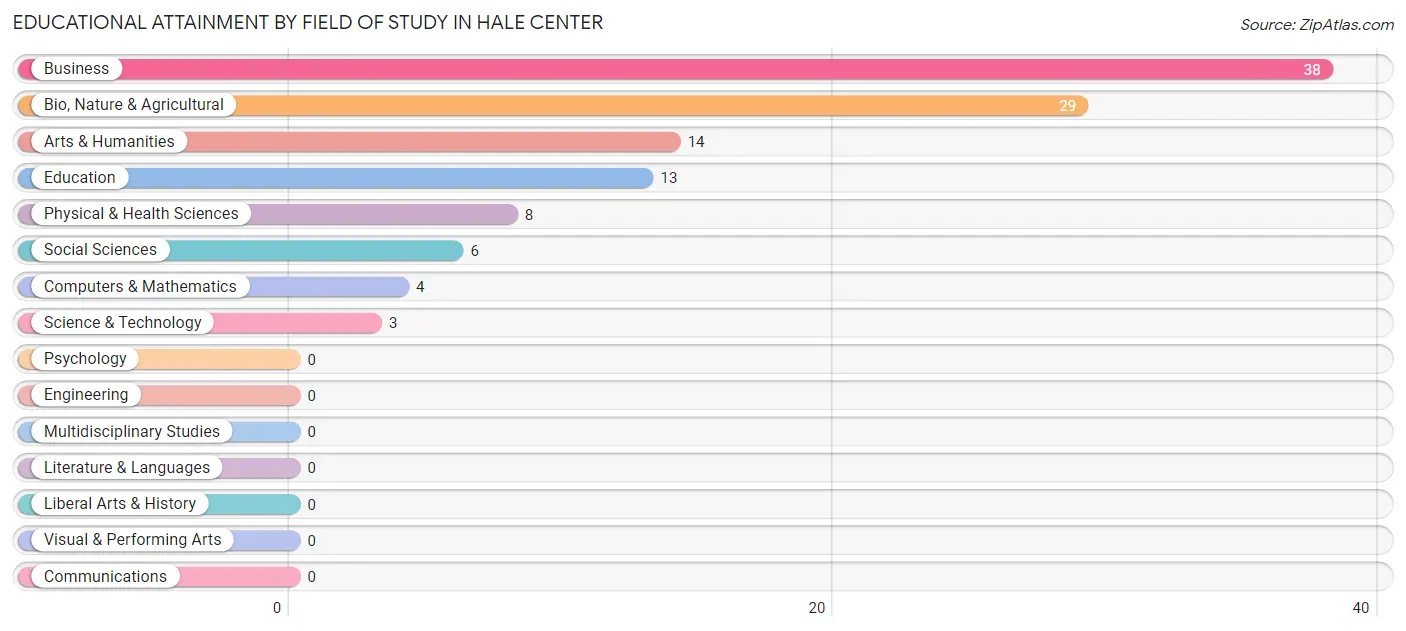
| Field of Study | # Graduates | % Graduates |
| Computers & Mathematics | 4 | 3.5% |
| Bio, Nature & Agricultural | 29 | 25.2% |
| Physical & Health Sciences | 8 | 7.0% |
| Psychology | 0 | 0.0% |
| Social Sciences | 6 | 5.2% |
| Engineering | 0 | 0.0% |
| Multidisciplinary Studies | 0 | 0.0% |
| Science & Technology | 3 | 2.6% |
| Business | 38 | 33.0% |
| Education | 13 | 11.3% |
| Literature & Languages | 0 | 0.0% |
| Liberal Arts & History | 0 | 0.0% |
| Visual & Performing Arts | 0 | 0.0% |
| Communications | 0 | 0.0% |
| Arts & Humanities | 14 | 12.2% |
| Total | 115 | 100.0% |
Transportation & Commute in Hale Center
Vehicle Availability by Sex in Hale Center
The most prevalent vehicle ownership categories in Hale Center are males with 2 vehicles (168, accounting for 49.0%) and females with 2 vehicles (262, making up 46.3%).
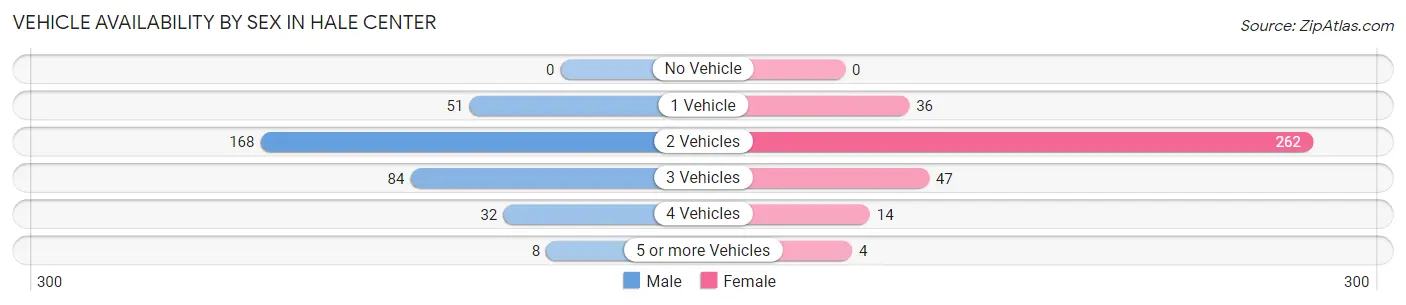
| Vehicles Available | Male | Female |
| No Vehicle | 0 (0.0%) | 0 (0.0%) |
| 1 Vehicle | 51 (14.9%) | 36 (9.9%) |
| 2 Vehicles | 168 (49.0%) | 262 (72.2%) |
| 3 Vehicles | 84 (24.5%) | 47 (13.0%) |
| 4 Vehicles | 32 (9.3%) | 14 (3.9%) |
| 5 or more Vehicles | 8 (2.3%) | 4 (1.1%) |
| Total | 343 (100.0%) | 363 (100.0%) |
Commute Time in Hale Center
The most frequently occuring commute durations in Hale Center are 15 to 19 minutes (206 commuters, 29.5%), less than 5 minutes (170 commuters, 24.3%), and 5 to 9 minutes (105 commuters, 15.0%).
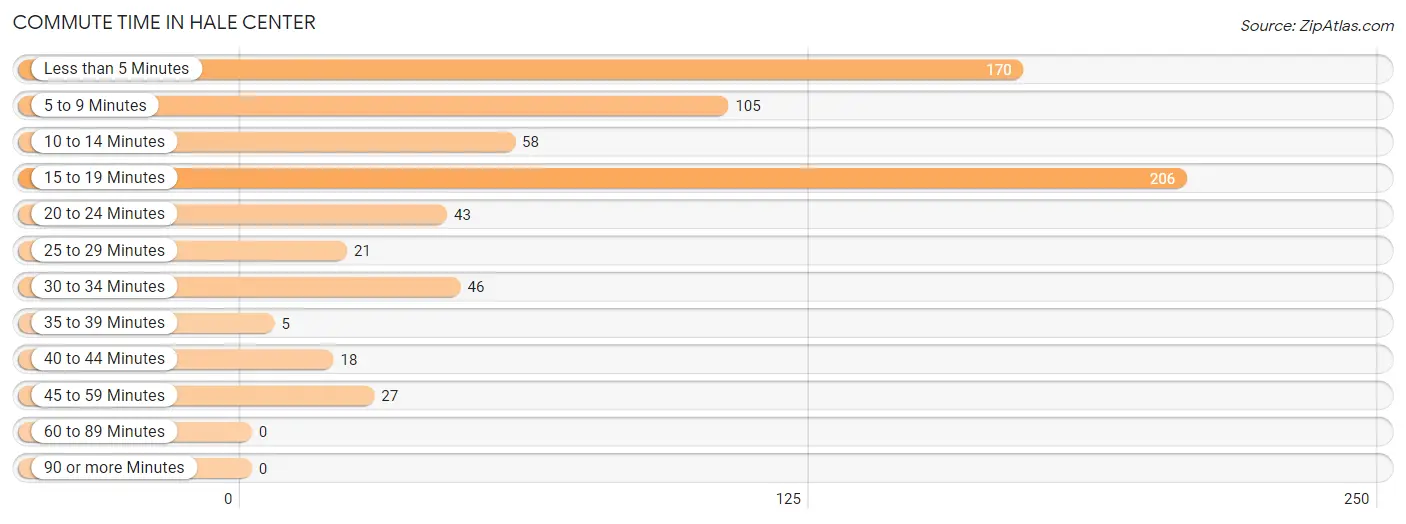
| Commute Time | # Commuters | % Commuters |
| Less than 5 Minutes | 170 | 24.3% |
| 5 to 9 Minutes | 105 | 15.0% |
| 10 to 14 Minutes | 58 | 8.3% |
| 15 to 19 Minutes | 206 | 29.5% |
| 20 to 24 Minutes | 43 | 6.1% |
| 25 to 29 Minutes | 21 | 3.0% |
| 30 to 34 Minutes | 46 | 6.6% |
| 35 to 39 Minutes | 5 | 0.7% |
| 40 to 44 Minutes | 18 | 2.6% |
| 45 to 59 Minutes | 27 | 3.9% |
| 60 to 89 Minutes | 0 | 0.0% |
| 90 or more Minutes | 0 | 0.0% |
Commute Time by Sex in Hale Center
The most common commute times in Hale Center are 15 to 19 minutes (98 commuters, 28.6%) for males and less than 5 minutes (116 commuters, 32.6%) for females.
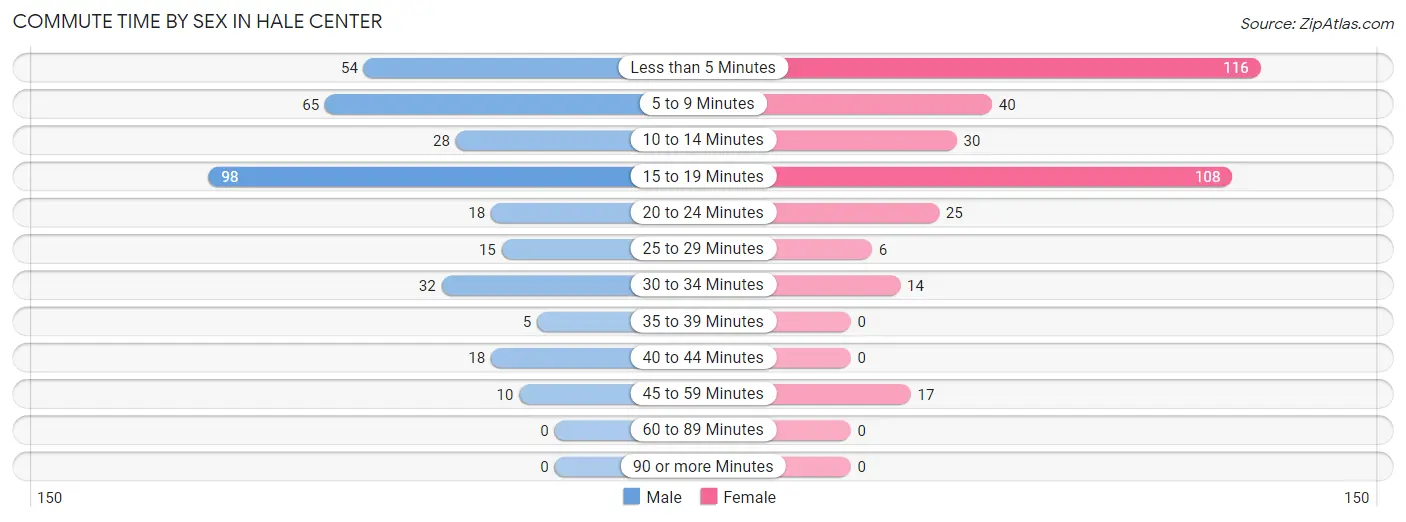
| Commute Time | Male | Female |
| Less than 5 Minutes | 54 (15.7%) | 116 (32.6%) |
| 5 to 9 Minutes | 65 (19.0%) | 40 (11.2%) |
| 10 to 14 Minutes | 28 (8.2%) | 30 (8.4%) |
| 15 to 19 Minutes | 98 (28.6%) | 108 (30.3%) |
| 20 to 24 Minutes | 18 (5.2%) | 25 (7.0%) |
| 25 to 29 Minutes | 15 (4.4%) | 6 (1.7%) |
| 30 to 34 Minutes | 32 (9.3%) | 14 (3.9%) |
| 35 to 39 Minutes | 5 (1.5%) | 0 (0.0%) |
| 40 to 44 Minutes | 18 (5.2%) | 0 (0.0%) |
| 45 to 59 Minutes | 10 (2.9%) | 17 (4.8%) |
| 60 to 89 Minutes | 0 (0.0%) | 0 (0.0%) |
| 90 or more Minutes | 0 (0.0%) | 0 (0.0%) |
Time of Departure to Work by Sex in Hale Center
The most frequent times of departure to work in Hale Center are 7:00 AM to 7:29 AM (99, 28.9%) for males and 6:00 AM to 6:29 AM (124, 34.8%) for females.
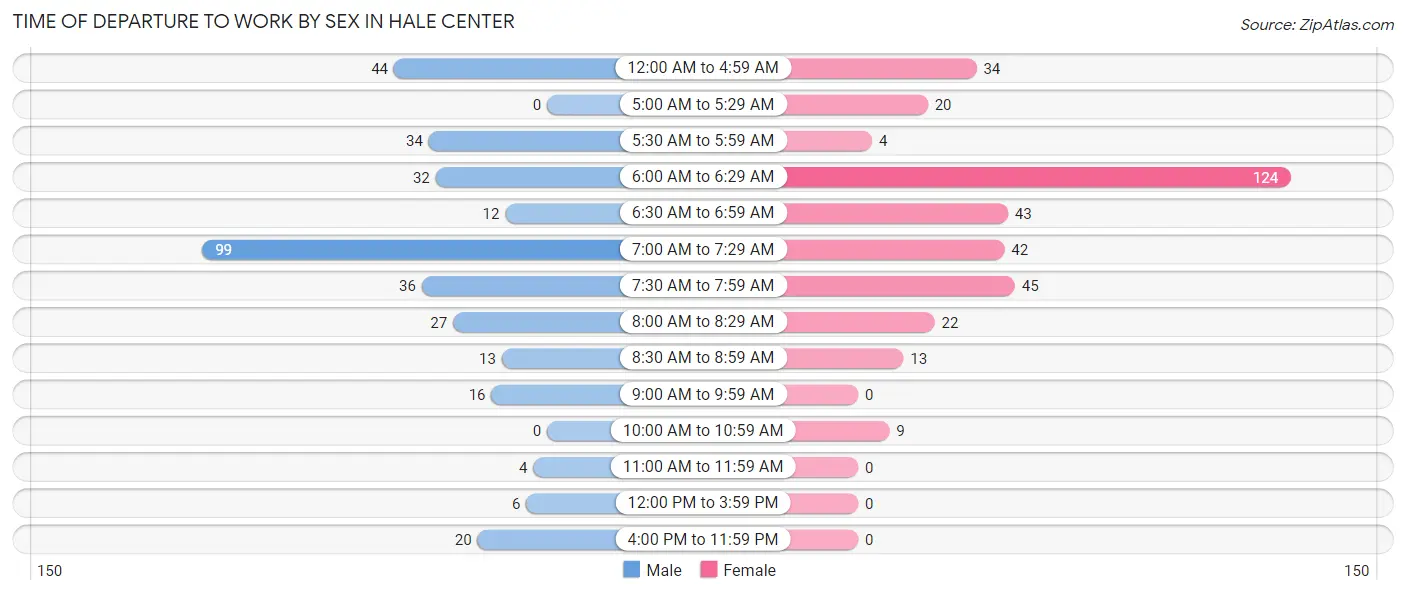
| Time of Departure | Male | Female |
| 12:00 AM to 4:59 AM | 44 (12.8%) | 34 (9.6%) |
| 5:00 AM to 5:29 AM | 0 (0.0%) | 20 (5.6%) |
| 5:30 AM to 5:59 AM | 34 (9.9%) | 4 (1.1%) |
| 6:00 AM to 6:29 AM | 32 (9.3%) | 124 (34.8%) |
| 6:30 AM to 6:59 AM | 12 (3.5%) | 43 (12.1%) |
| 7:00 AM to 7:29 AM | 99 (28.9%) | 42 (11.8%) |
| 7:30 AM to 7:59 AM | 36 (10.5%) | 45 (12.6%) |
| 8:00 AM to 8:29 AM | 27 (7.9%) | 22 (6.2%) |
| 8:30 AM to 8:59 AM | 13 (3.8%) | 13 (3.6%) |
| 9:00 AM to 9:59 AM | 16 (4.7%) | 0 (0.0%) |
| 10:00 AM to 10:59 AM | 0 (0.0%) | 9 (2.5%) |
| 11:00 AM to 11:59 AM | 4 (1.2%) | 0 (0.0%) |
| 12:00 PM to 3:59 PM | 6 (1.8%) | 0 (0.0%) |
| 4:00 PM to 11:59 PM | 20 (5.8%) | 0 (0.0%) |
| Total | 343 (100.0%) | 356 (100.0%) |
Housing Occupancy in Hale Center
Occupancy by Ownership in Hale Center
Of the total 742 dwellings in Hale Center, owner-occupied units account for 623 (84.0%), while renter-occupied units make up 119 (16.0%).
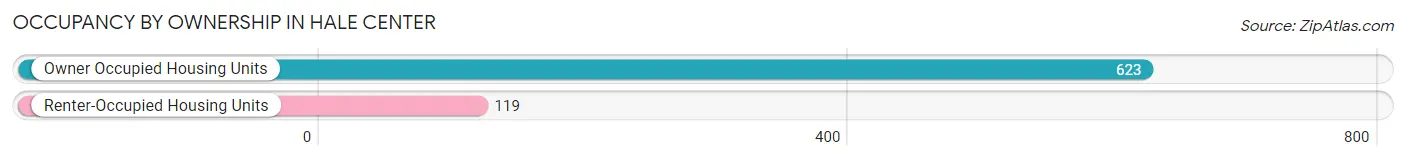
| Occupancy | # Housing Units | % Housing Units |
| Owner Occupied Housing Units | 623 | 84.0% |
| Renter-Occupied Housing Units | 119 | 16.0% |
| Total Occupied Housing Units | 742 | 100.0% |
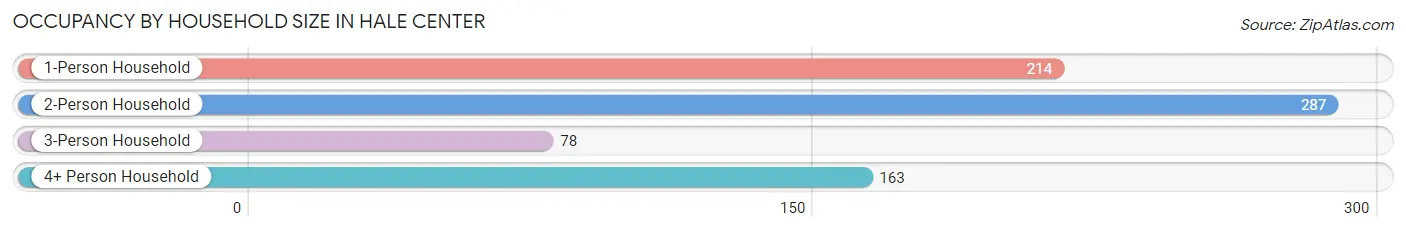
Occupancy by Household Size in Hale Center
| Household Size | # Housing Units | % Housing Units |
| 1-Person Household | 214 | 28.8% |
| 2-Person Household | 287 | 38.7% |
| 3-Person Household | 78 | 10.5% |
| 4+ Person Household | 163 | 22.0% |
| Total Housing Units | 742 | 100.0% |
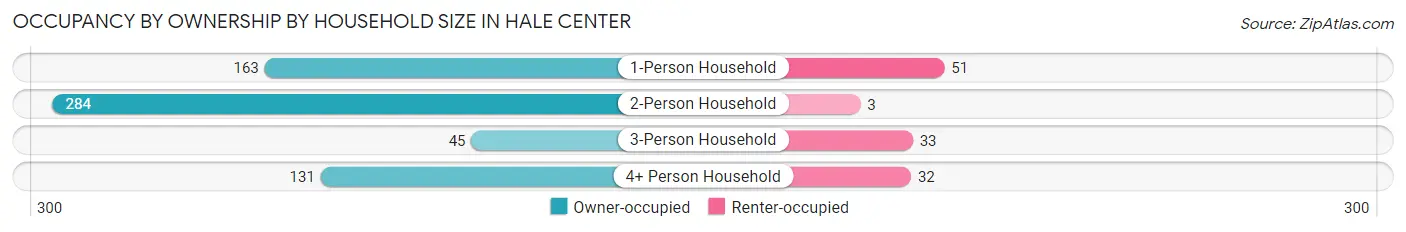
Occupancy by Ownership by Household Size in Hale Center
| Household Size | Owner-occupied | Renter-occupied |
| 1-Person Household | 163 (76.2%) | 51 (23.8%) |
| 2-Person Household | 284 (99.0%) | 3 (1.1%) |
| 3-Person Household | 45 (57.7%) | 33 (42.3%) |
| 4+ Person Household | 131 (80.4%) | 32 (19.6%) |
| Total Housing Units | 623 (84.0%) | 119 (16.0%) |
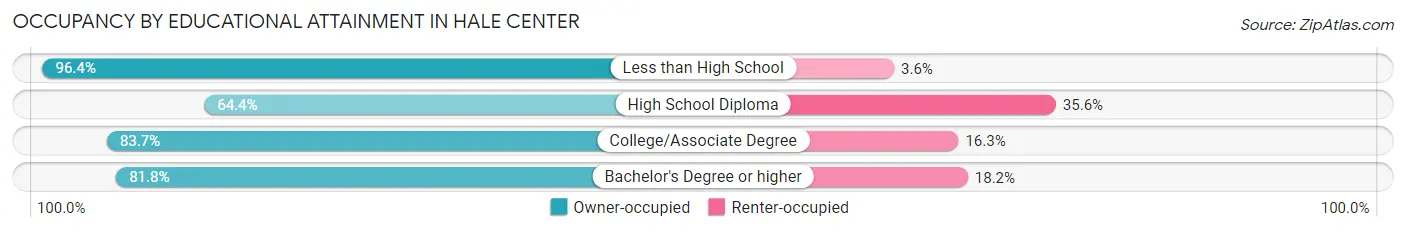
Occupancy by Educational Attainment in Hale Center
| Household Size | Owner-occupied | Renter-occupied |
| Less than High School | 298 (96.4%) | 11 (3.6%) |
| High School Diploma | 121 (64.4%) | 67 (35.6%) |
| College/Associate Degree | 159 (83.7%) | 31 (16.3%) |
| Bachelor's Degree or higher | 45 (81.8%) | 10 (18.2%) |
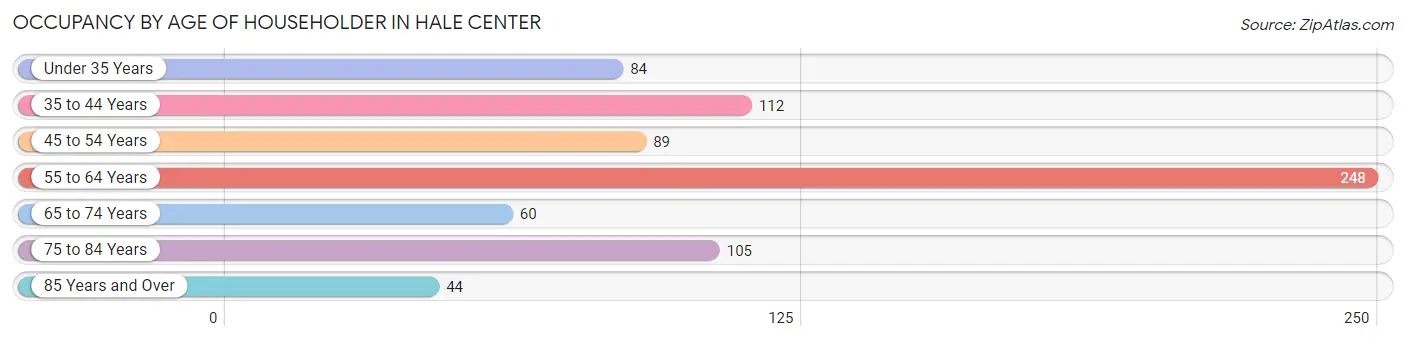
Occupancy by Age of Householder in Hale Center
| Age Bracket | # Households | % Households |
| Under 35 Years | 84 | 11.3% |
| 35 to 44 Years | 112 | 15.1% |
| 45 to 54 Years | 89 | 12.0% |
| 55 to 64 Years | 248 | 33.4% |
| 65 to 74 Years | 60 | 8.1% |
| 75 to 84 Years | 105 | 14.1% |
| 85 Years and Over | 44 | 5.9% |
| Total | 742 | 100.0% |
Housing Finances in Hale Center
Median Income by Occupancy in Hale Center
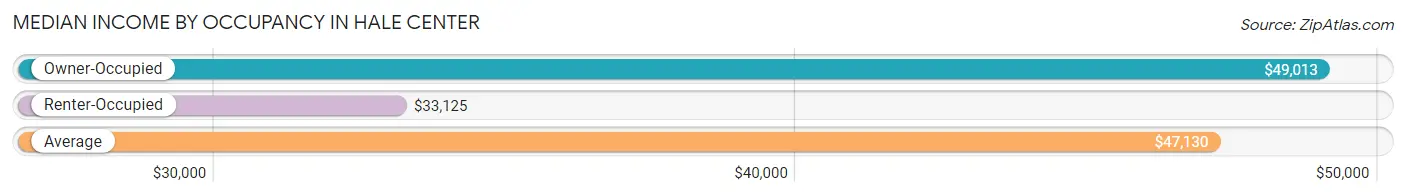
| Occupancy Type | # Households | Median Income |
| Owner-Occupied | 623 (84.0%) | $49,013 |
| Renter-Occupied | 119 (16.0%) | $33,125 |
| Average | 742 (100.0%) | $47,130 |
Occupancy by Householder Income Bracket in Hale Center
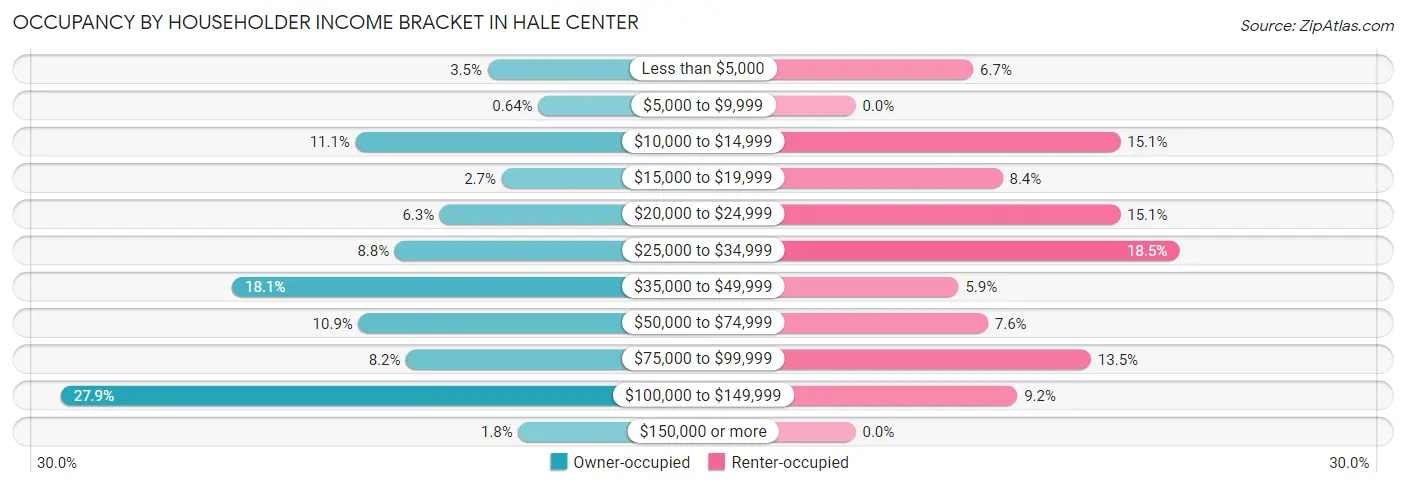
| Income Bracket | Owner-occupied | Renter-occupied |
| Less than $5,000 | 22 (3.5%) | 8 (6.7%) |
| $5,000 to $9,999 | 4 (0.6%) | 0 (0.0%) |
| $10,000 to $14,999 | 69 (11.1%) | 18 (15.1%) |
| $15,000 to $19,999 | 17 (2.7%) | 10 (8.4%) |
| $20,000 to $24,999 | 39 (6.3%) | 18 (15.1%) |
| $25,000 to $34,999 | 55 (8.8%) | 22 (18.5%) |
| $35,000 to $49,999 | 113 (18.1%) | 7 (5.9%) |
| $50,000 to $74,999 | 68 (10.9%) | 9 (7.6%) |
| $75,000 to $99,999 | 51 (8.2%) | 16 (13.5%) |
| $100,000 to $149,999 | 174 (27.9%) | 11 (9.2%) |
| $150,000 or more | 11 (1.8%) | 0 (0.0%) |
| Total | 623 (100.0%) | 119 (100.0%) |
Monthly Housing Cost Tiers in Hale Center
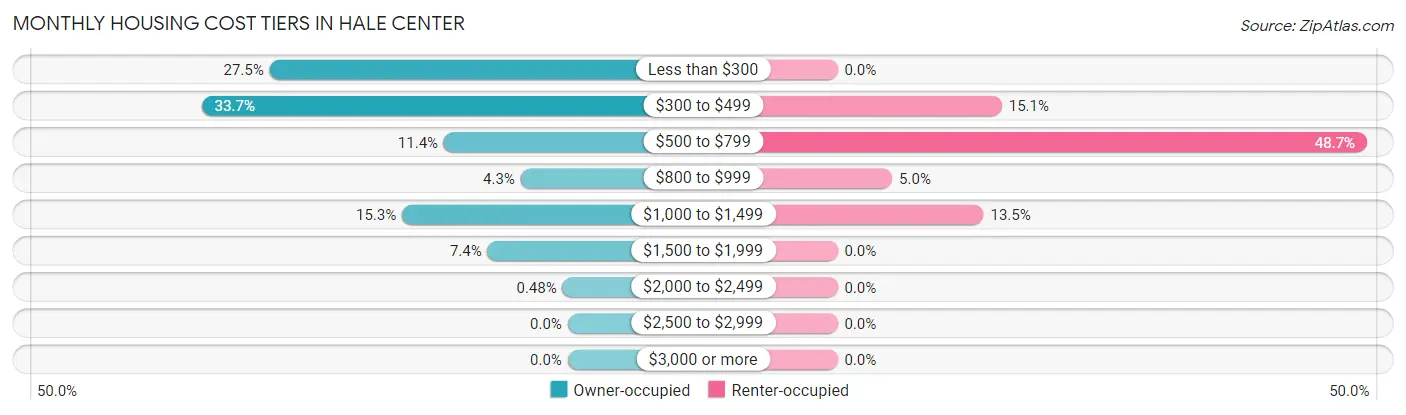
| Monthly Cost | Owner-occupied | Renter-occupied |
| Less than $300 | 171 (27.5%) | 0 (0.0%) |
| $300 to $499 | 210 (33.7%) | 18 (15.1%) |
| $500 to $799 | 71 (11.4%) | 58 (48.7%) |
| $800 to $999 | 27 (4.3%) | 6 (5.0%) |
| $1,000 to $1,499 | 95 (15.2%) | 16 (13.5%) |
| $1,500 to $1,999 | 46 (7.4%) | 0 (0.0%) |
| $2,000 to $2,499 | 3 (0.5%) | 0 (0.0%) |
| $2,500 to $2,999 | 0 (0.0%) | 0 (0.0%) |
| $3,000 or more | 0 (0.0%) | 0 (0.0%) |
| Total | 623 (100.0%) | 119 (100.0%) |
Physical Housing Characteristics in Hale Center
Housing Structures in Hale Center
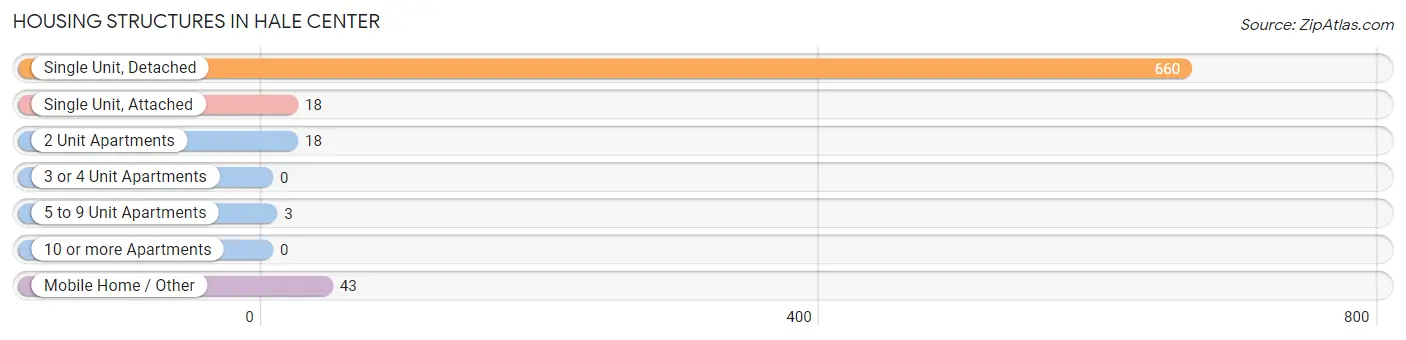
| Structure Type | # Housing Units | % Housing Units |
| Single Unit, Detached | 660 | 88.9% |
| Single Unit, Attached | 18 | 2.4% |
| 2 Unit Apartments | 18 | 2.4% |
| 3 or 4 Unit Apartments | 0 | 0.0% |
| 5 to 9 Unit Apartments | 3 | 0.4% |
| 10 or more Apartments | 0 | 0.0% |
| Mobile Home / Other | 43 | 5.8% |
| Total | 742 | 100.0% |
Housing Structures by Occupancy in Hale Center
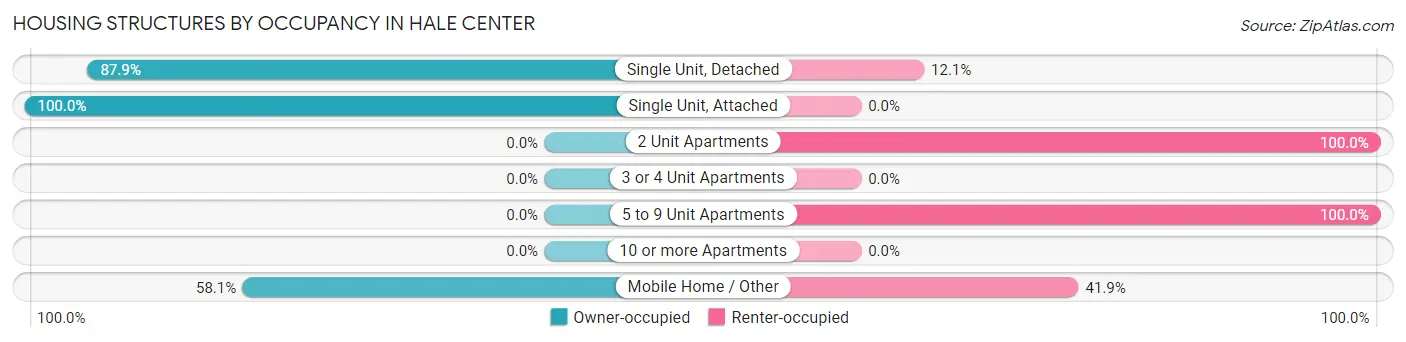
| Structure Type | Owner-occupied | Renter-occupied |
| Single Unit, Detached | 580 (87.9%) | 80 (12.1%) |
| Single Unit, Attached | 18 (100.0%) | 0 (0.0%) |
| 2 Unit Apartments | 0 (0.0%) | 18 (100.0%) |
| 3 or 4 Unit Apartments | 0 (0.0%) | 0 (0.0%) |
| 5 to 9 Unit Apartments | 0 (0.0%) | 3 (100.0%) |
| 10 or more Apartments | 0 (0.0%) | 0 (0.0%) |
| Mobile Home / Other | 25 (58.1%) | 18 (41.9%) |
| Total | 623 (84.0%) | 119 (16.0%) |
Housing Structures by Number of Rooms in Hale Center
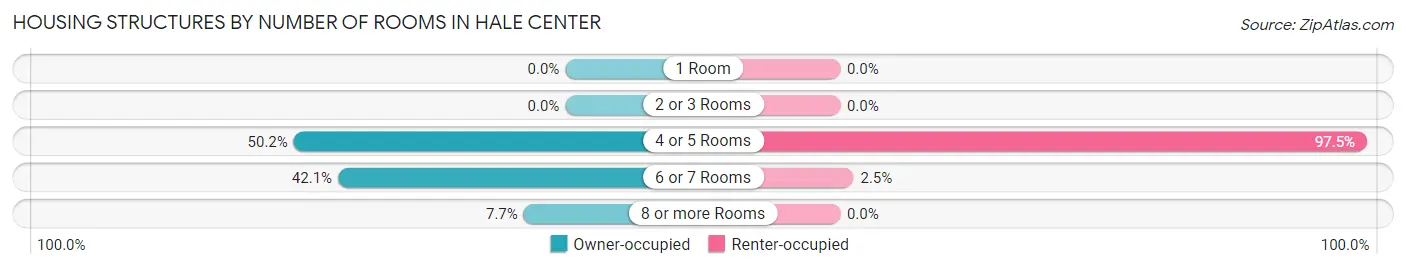
| Number of Rooms | Owner-occupied | Renter-occupied |
| 1 Room | 0 (0.0%) | 0 (0.0%) |
| 2 or 3 Rooms | 0 (0.0%) | 0 (0.0%) |
| 4 or 5 Rooms | 313 (50.2%) | 116 (97.5%) |
| 6 or 7 Rooms | 262 (42.0%) | 3 (2.5%) |
| 8 or more Rooms | 48 (7.7%) | 0 (0.0%) |
| Total | 623 (100.0%) | 119 (100.0%) |
Housing Structure by Heating Type in Hale Center
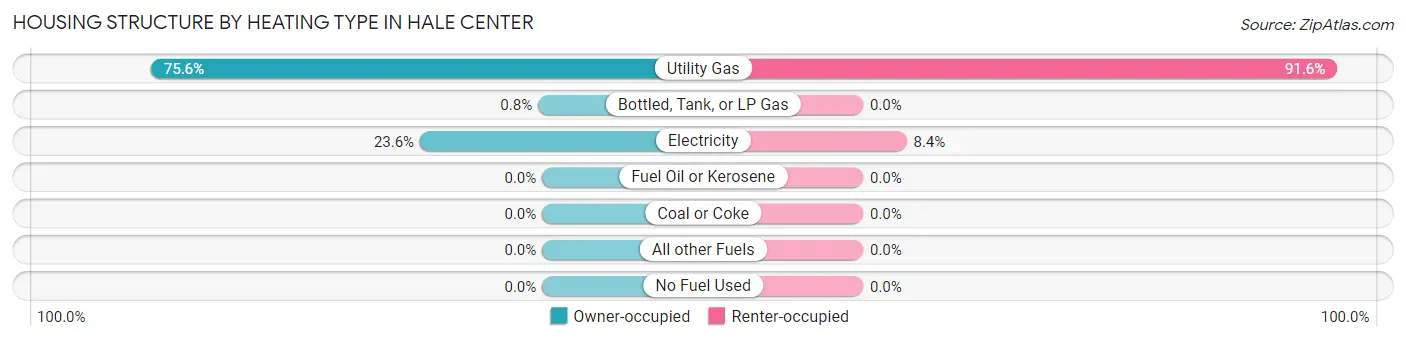
| Heating Type | Owner-occupied | Renter-occupied |
| Utility Gas | 471 (75.6%) | 109 (91.6%) |
| Bottled, Tank, or LP Gas | 5 (0.8%) | 0 (0.0%) |
| Electricity | 147 (23.6%) | 10 (8.4%) |
| Fuel Oil or Kerosene | 0 (0.0%) | 0 (0.0%) |
| Coal or Coke | 0 (0.0%) | 0 (0.0%) |
| All other Fuels | 0 (0.0%) | 0 (0.0%) |
| No Fuel Used | 0 (0.0%) | 0 (0.0%) |
| Total | 623 (100.0%) | 119 (100.0%) |
Household Vehicle Usage in Hale Center
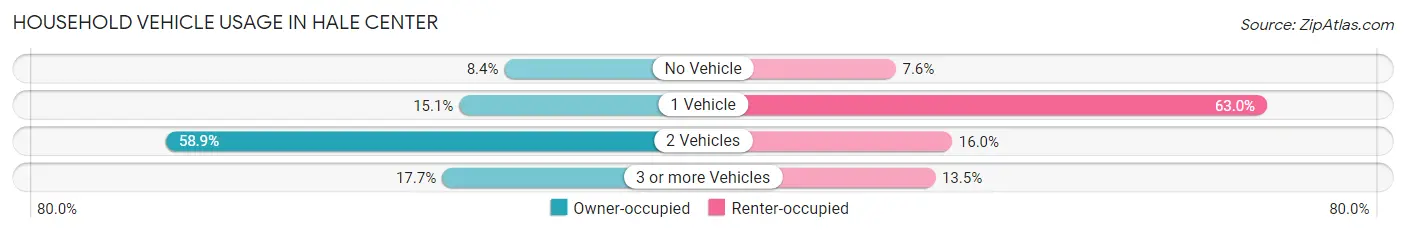
| Vehicles per Household | Owner-occupied | Renter-occupied |
| No Vehicle | 52 (8.4%) | 9 (7.6%) |
| 1 Vehicle | 94 (15.1%) | 75 (63.0%) |
| 2 Vehicles | 367 (58.9%) | 19 (16.0%) |
| 3 or more Vehicles | 110 (17.7%) | 16 (13.5%) |
| Total | 623 (100.0%) | 119 (100.0%) |
Real Estate & Mortgages in Hale Center
Real Estate and Mortgage Overview in Hale Center
| Characteristic | Without Mortgage | With Mortgage |
| Housing Units | 458 | 165 |
| Median Property Value | $59,400 | $110,400 |
| Median Household Income | $45,948 | $0 |
| Monthly Housing Costs | $331 | $0 |
| Real Estate Taxes | $815 | $0 |
Property Value by Mortgage Status in Hale Center
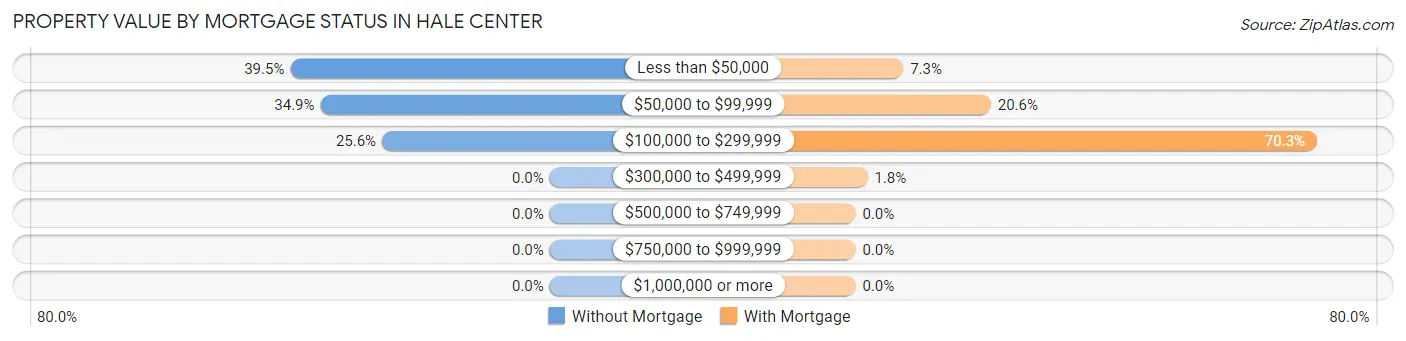
| Property Value | Without Mortgage | With Mortgage |
| Less than $50,000 | 181 (39.5%) | 12 (7.3%) |
| $50,000 to $99,999 | 160 (34.9%) | 34 (20.6%) |
| $100,000 to $299,999 | 117 (25.6%) | 116 (70.3%) |
| $300,000 to $499,999 | 0 (0.0%) | 3 (1.8%) |
| $500,000 to $749,999 | 0 (0.0%) | 0 (0.0%) |
| $750,000 to $999,999 | 0 (0.0%) | 0 (0.0%) |
| $1,000,000 or more | 0 (0.0%) | 0 (0.0%) |
| Total | 458 (100.0%) | 165 (100.0%) |
Household Income by Mortgage Status in Hale Center
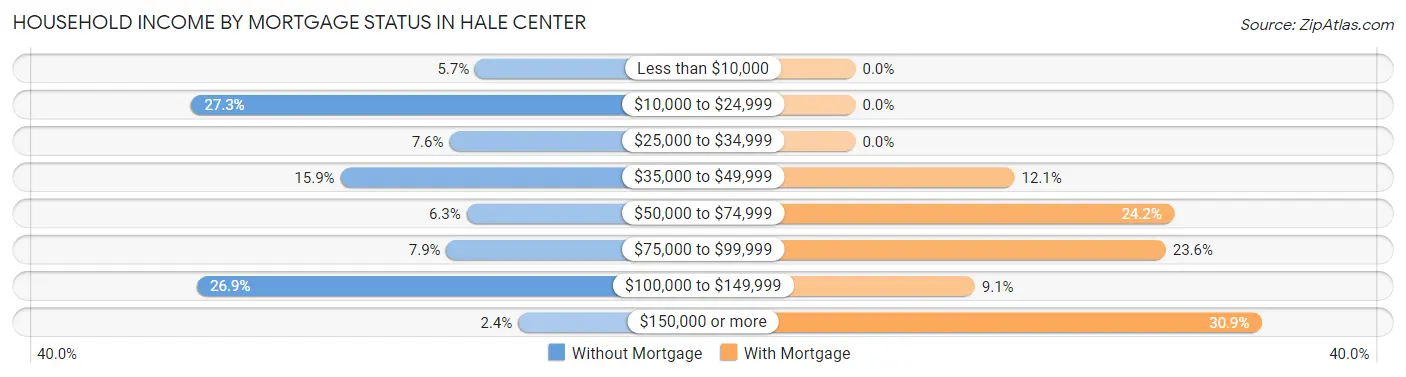
| Household Income | Without Mortgage | With Mortgage |
| Less than $10,000 | 26 (5.7%) | 0 (0.0%) |
| $10,000 to $24,999 | 125 (27.3%) | 0 (0.0%) |
| $25,000 to $34,999 | 35 (7.6%) | 0 (0.0%) |
| $35,000 to $49,999 | 73 (15.9%) | 20 (12.1%) |
| $50,000 to $74,999 | 29 (6.3%) | 40 (24.2%) |
| $75,000 to $99,999 | 36 (7.9%) | 39 (23.6%) |
| $100,000 to $149,999 | 123 (26.9%) | 15 (9.1%) |
| $150,000 or more | 11 (2.4%) | 51 (30.9%) |
| Total | 458 (100.0%) | 165 (100.0%) |
Property Value to Household Income Ratio in Hale Center
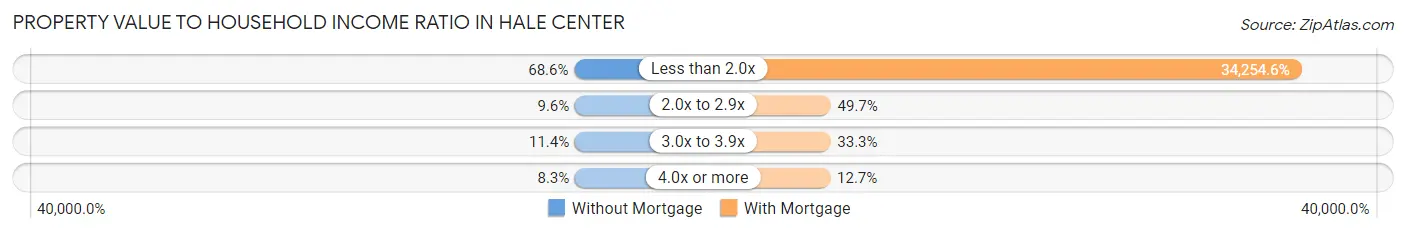
| Value-to-Income Ratio | Without Mortgage | With Mortgage |
| Less than 2.0x | 314 (68.6%) | 56,520 (34,254.6%) |
| 2.0x to 2.9x | 44 (9.6%) | 82 (49.7%) |
| 3.0x to 3.9x | 52 (11.4%) | 55 (33.3%) |
| 4.0x or more | 38 (8.3%) | 21 (12.7%) |
| Total | 458 (100.0%) | 165 (100.0%) |
Real Estate Taxes by Mortgage Status in Hale Center
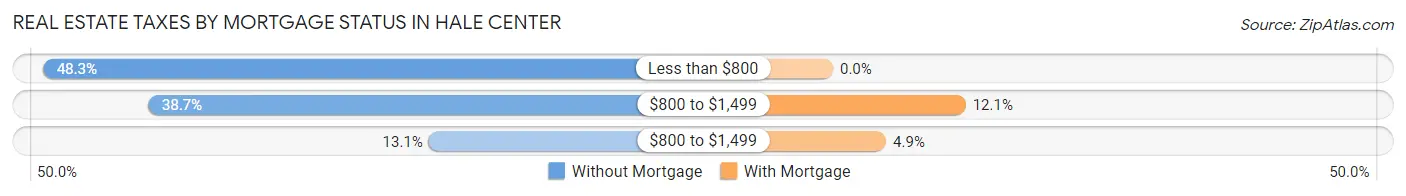
| Property Taxes | Without Mortgage | With Mortgage |
| Less than $800 | 221 (48.2%) | 0 (0.0%) |
| $800 to $1,499 | 177 (38.7%) | 20 (12.1%) |
| $800 to $1,499 | 60 (13.1%) | 8 (4.9%) |
| Total | 458 (100.0%) | 165 (100.0%) |
Health & Disability in Hale Center
Health Insurance Coverage by Age in Hale Center
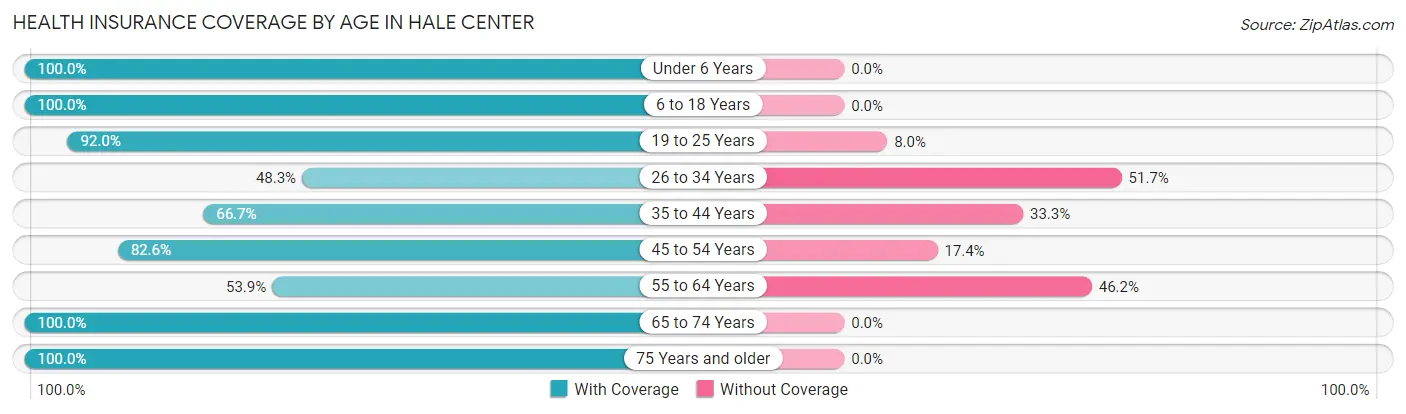
| Age Bracket | With Coverage | Without Coverage |
| Under 6 Years | 60 (100.0%) | 0 (0.0%) |
| 6 to 18 Years | 351 (100.0%) | 0 (0.0%) |
| 19 to 25 Years | 92 (92.0%) | 8 (8.0%) |
| 26 to 34 Years | 56 (48.3%) | 60 (51.7%) |
| 35 to 44 Years | 140 (66.7%) | 70 (33.3%) |
| 45 to 54 Years | 157 (82.6%) | 33 (17.4%) |
| 55 to 64 Years | 259 (53.8%) | 222 (46.2%) |
| 65 to 74 Years | 113 (100.0%) | 0 (0.0%) |
| 75 Years and older | 198 (100.0%) | 0 (0.0%) |
| Total | 1,426 (78.4%) | 393 (21.6%) |
Health Insurance Coverage by Citizenship Status in Hale Center
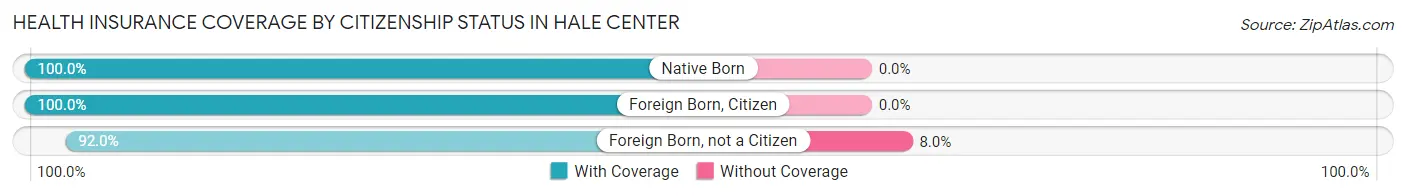
| Citizenship Status | With Coverage | Without Coverage |
| Native Born | 60 (100.0%) | 0 (0.0%) |
| Foreign Born, Citizen | 351 (100.0%) | 0 (0.0%) |
| Foreign Born, not a Citizen | 92 (92.0%) | 8 (8.0%) |
Health Insurance Coverage by Household Income in Hale Center
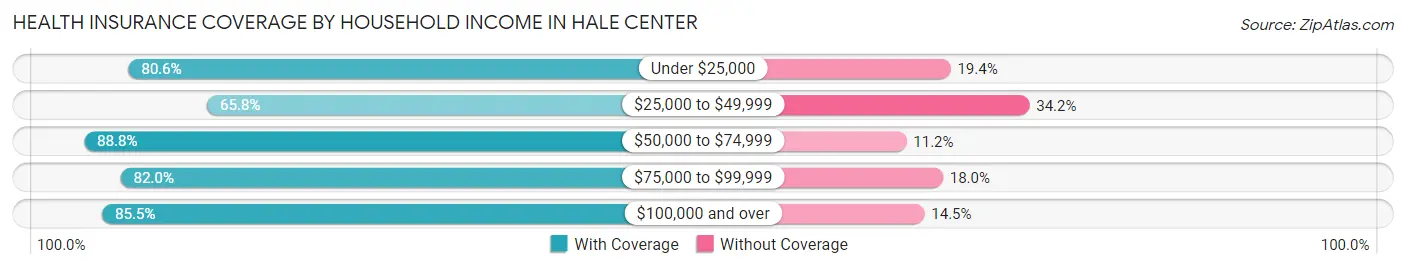
| Household Income | With Coverage | Without Coverage |
| Under $25,000 | 253 (80.6%) | 61 (19.4%) |
| $25,000 to $49,999 | 383 (65.8%) | 199 (34.2%) |
| $50,000 to $74,999 | 191 (88.8%) | 24 (11.2%) |
| $75,000 to $99,999 | 146 (82.0%) | 32 (18.0%) |
| $100,000 and over | 453 (85.5%) | 77 (14.5%) |
Public vs Private Health Insurance Coverage by Age in Hale Center
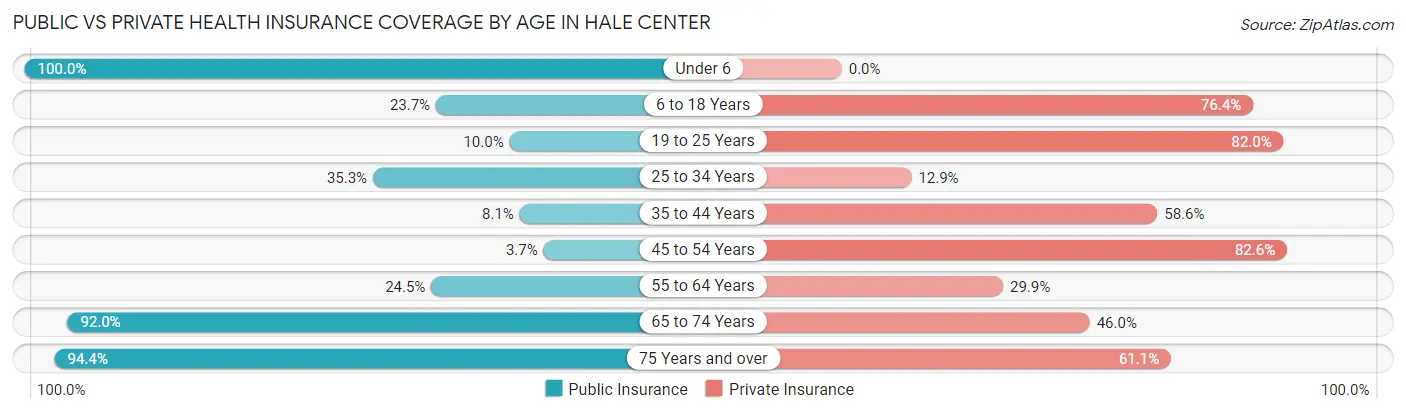
| Age Bracket | Public Insurance | Private Insurance |
| Under 6 | 60 (100.0%) | 0 (0.0%) |
| 6 to 18 Years | 83 (23.6%) | 268 (76.3%) |
| 19 to 25 Years | 10 (10.0%) | 82 (82.0%) |
| 25 to 34 Years | 41 (35.3%) | 15 (12.9%) |
| 35 to 44 Years | 17 (8.1%) | 123 (58.6%) |
| 45 to 54 Years | 7 (3.7%) | 157 (82.6%) |
| 55 to 64 Years | 118 (24.5%) | 144 (29.9%) |
| 65 to 74 Years | 104 (92.0%) | 52 (46.0%) |
| 75 Years and over | 187 (94.4%) | 121 (61.1%) |
| Total | 627 (34.5%) | 962 (52.9%) |
Disability Status by Sex by Age in Hale Center
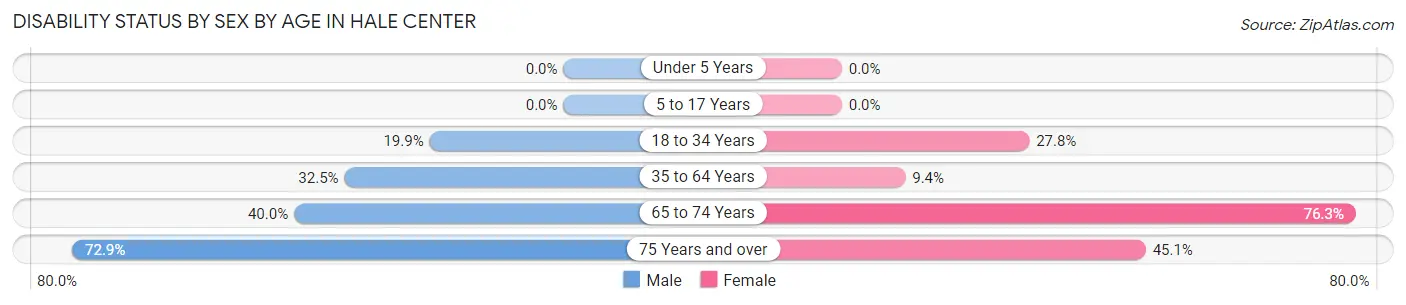
| Age Bracket | Male | Female |
| Under 5 Years | 0 (0.0%) | 0 (0.0%) |
| 5 to 17 Years | 0 (0.0%) | 0 (0.0%) |
| 18 to 34 Years | 32 (19.9%) | 32 (27.8%) |
| 35 to 64 Years | 145 (32.5%) | 41 (9.4%) |
| 65 to 74 Years | 30 (40.0%) | 29 (76.3%) |
| 75 Years and over | 62 (72.9%) | 51 (45.1%) |
Disability Class by Sex by Age in Hale Center
Disability Class: Hearing Difficulty
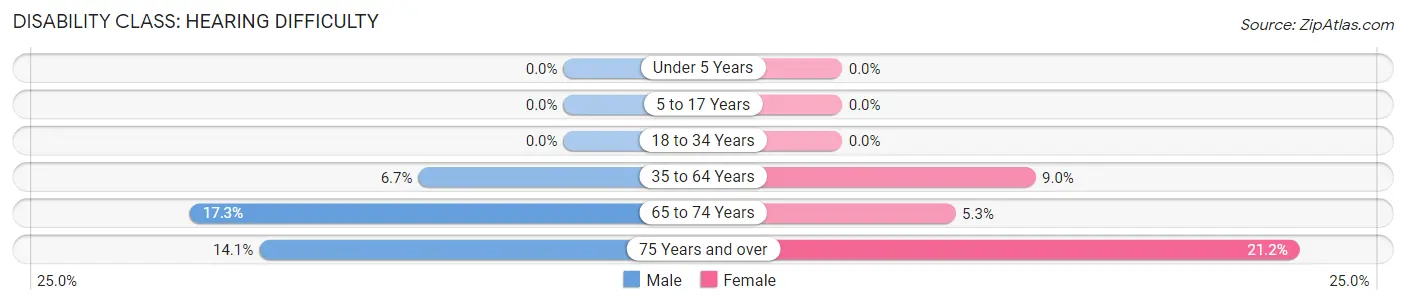
| Age Bracket | Male | Female |
| Under 5 Years | 0 (0.0%) | 0 (0.0%) |
| 5 to 17 Years | 0 (0.0%) | 0 (0.0%) |
| 18 to 34 Years | 0 (0.0%) | 0 (0.0%) |
| 35 to 64 Years | 30 (6.7%) | 39 (9.0%) |
| 65 to 74 Years | 13 (17.3%) | 2 (5.3%) |
| 75 Years and over | 12 (14.1%) | 24 (21.2%) |
Disability Class: Vision Difficulty
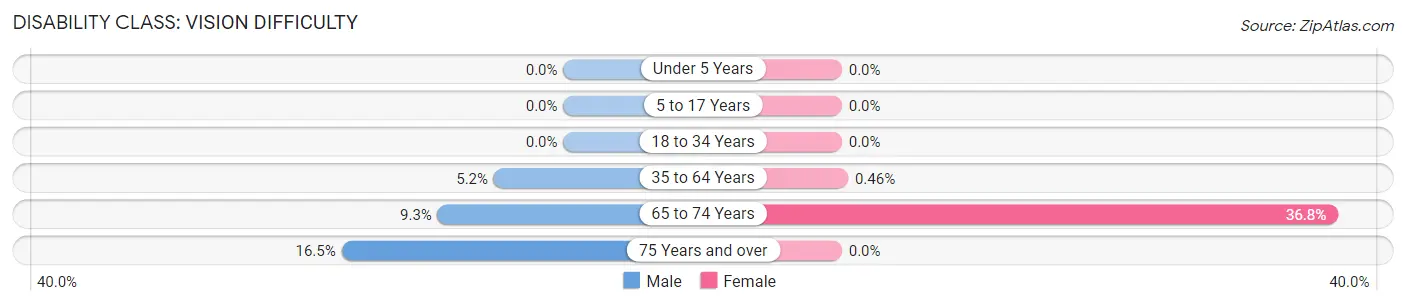
| Age Bracket | Male | Female |
| Under 5 Years | 0 (0.0%) | 0 (0.0%) |
| 5 to 17 Years | 0 (0.0%) | 0 (0.0%) |
| 18 to 34 Years | 0 (0.0%) | 0 (0.0%) |
| 35 to 64 Years | 23 (5.2%) | 2 (0.5%) |
| 65 to 74 Years | 7 (9.3%) | 14 (36.8%) |
| 75 Years and over | 14 (16.5%) | 0 (0.0%) |
Disability Class: Cognitive Difficulty
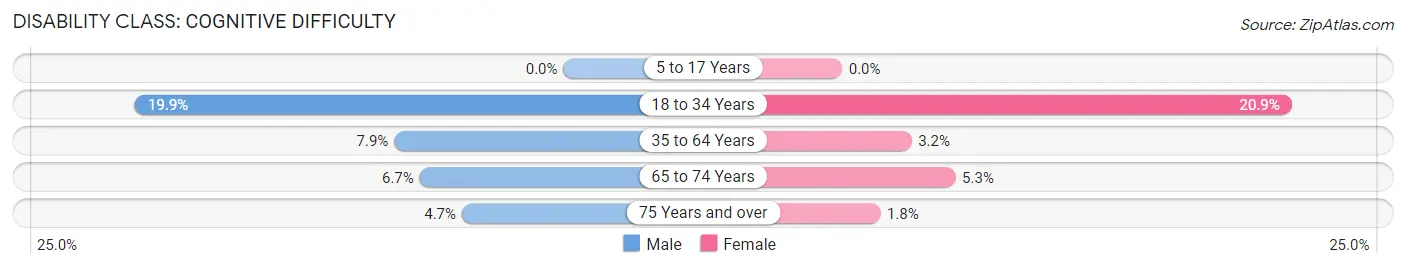
| Age Bracket | Male | Female |
| 5 to 17 Years | 0 (0.0%) | 0 (0.0%) |
| 18 to 34 Years | 32 (19.9%) | 24 (20.9%) |
| 35 to 64 Years | 35 (7.9%) | 14 (3.2%) |
| 65 to 74 Years | 5 (6.7%) | 2 (5.3%) |
| 75 Years and over | 4 (4.7%) | 2 (1.8%) |
Disability Class: Ambulatory Difficulty
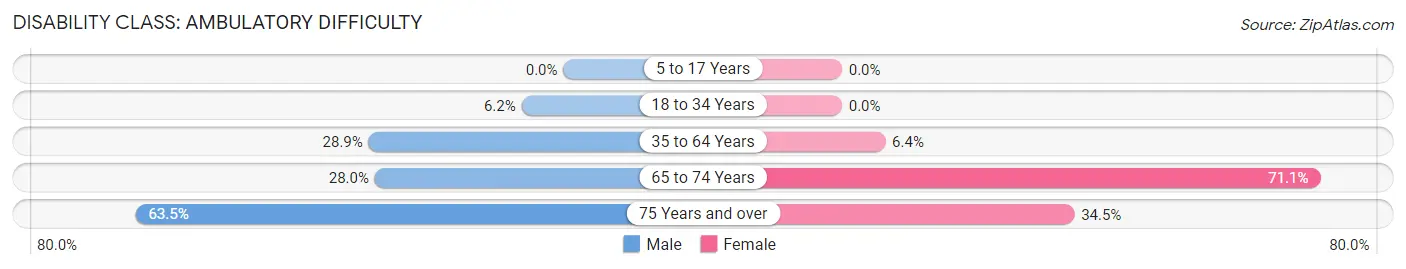
| Age Bracket | Male | Female |
| 5 to 17 Years | 0 (0.0%) | 0 (0.0%) |
| 18 to 34 Years | 10 (6.2%) | 0 (0.0%) |
| 35 to 64 Years | 129 (28.9%) | 28 (6.4%) |
| 65 to 74 Years | 21 (28.0%) | 27 (71.1%) |
| 75 Years and over | 54 (63.5%) | 39 (34.5%) |
Disability Class: Self-Care Difficulty
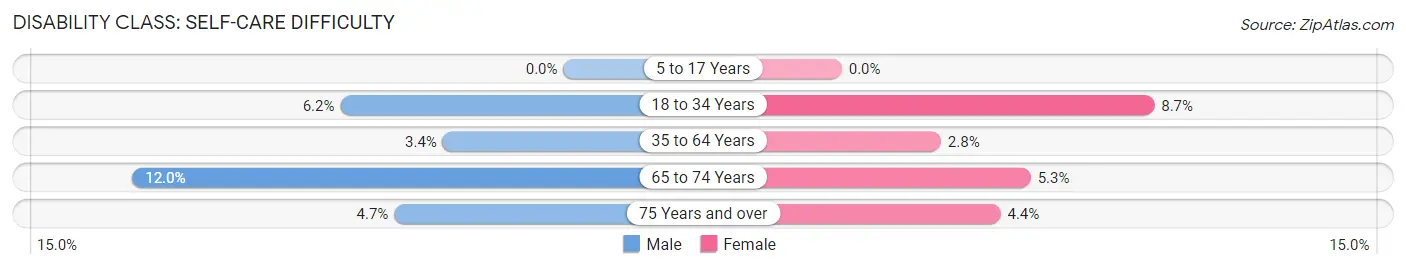
| Age Bracket | Male | Female |
| 5 to 17 Years | 0 (0.0%) | 0 (0.0%) |
| 18 to 34 Years | 10 (6.2%) | 10 (8.7%) |
| 35 to 64 Years | 15 (3.4%) | 12 (2.8%) |
| 65 to 74 Years | 9 (12.0%) | 2 (5.3%) |
| 75 Years and over | 4 (4.7%) | 5 (4.4%) |
Technology Access in Hale Center
Computing Device Access in Hale Center
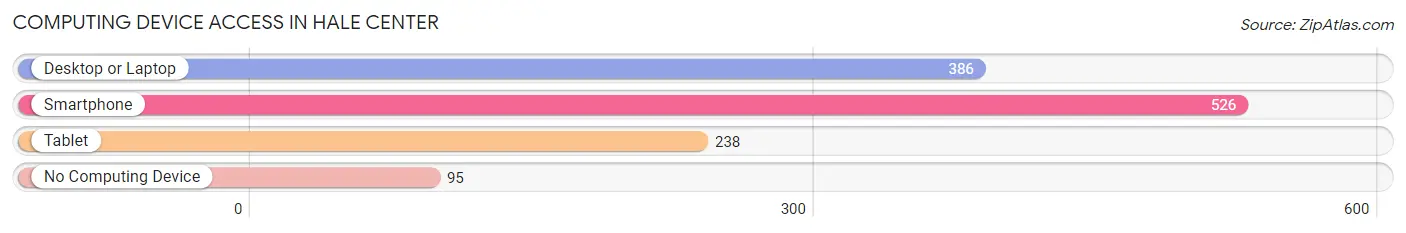
| Device Type | # Households | % Households |
| Desktop or Laptop | 386 | 52.0% |
| Smartphone | 526 | 70.9% |
| Tablet | 238 | 32.1% |
| No Computing Device | 95 | 12.8% |
| Total | 742 | 100.0% |
Internet Access in Hale Center
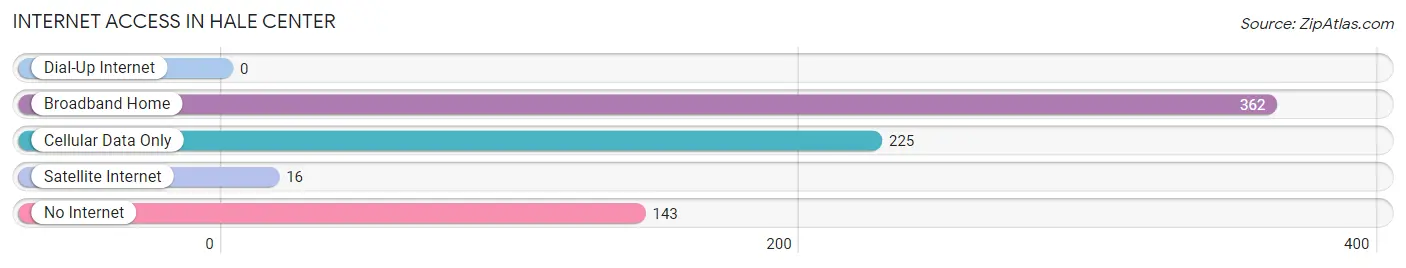
| Internet Type | # Households | % Households |
| Dial-Up Internet | 0 | 0.0% |
| Broadband Home | 362 | 48.8% |
| Cellular Data Only | 225 | 30.3% |
| Satellite Internet | 16 | 2.2% |
| No Internet | 143 | 19.3% |
| Total | 742 | 100.0% |
Hale Center Summary
Hale Center is a city located in Hale County, Texas, United States. It is situated in the South Plains region of the state, approximately 25 miles northeast of Lubbock. As of the 2010 census, the city had a population of 2,252.
History
Hale Center was founded in 1906 by the Hale brothers, who were ranchers from the nearby town of Plainview. The brothers purchased a section of land and began to develop it into a farming community. The town was named after the brothers, and the post office was established in 1907.
In the early years, the town was primarily an agricultural community, with cotton and corn being the main crops. The town also had a number of businesses, including a bank, a hotel, a general store, and a blacksmith shop.
In the 1920s, the town began to grow rapidly, and by the 1930s it had become a major center for cotton production. The town also had a number of other businesses, including a movie theater, a bowling alley, and a number of restaurants.
In the 1950s, the town began to decline as the cotton industry began to decline. The town was also affected by the Dust Bowl, which caused many of the farmers to leave the area.
In the 1970s, the town began to experience a resurgence as the oil and gas industry began to boom in the area. The town also began to attract new businesses, including a number of manufacturing plants.
Geography
Hale Center is located in the South Plains region of Texas, approximately 25 miles northeast of Lubbock. The city is situated on the Llano Estacado, a large plateau that covers much of the western part of the state. The city is located at an elevation of 3,000 feet above sea level.
The climate in Hale Center is semi-arid, with hot summers and mild winters. The average annual temperature is around 65 degrees Fahrenheit, and the average annual precipitation is around 17 inches.
Economy
The economy of Hale Center is largely based on agriculture and oil and gas production. The town is home to a number of cotton gins, as well as a number of oil and gas production facilities.
The town also has a number of other businesses, including a number of manufacturing plants, a number of retail stores, and a number of restaurants.
Demographics
As of the 2010 census, the population of Hale Center was 2,252. The racial makeup of the city was 79.3% White, 0.7% African American, 0.3% Native American, 0.2% Asian, 0.1% Pacific Islander, 17.7% from other races, and 1.9% from two or more races. Hispanic or Latino of any race were 37.2% of the population.
The median household income in Hale Center was $31,250, and the median family income was $37,500. The per capita income was $15,945. About 17.2% of families and 20.3% of the population were below the poverty line, including 28.3% of those under age 18 and 11.2% of those age 65 or over.
Common Questions
What is Per Capita Income in Hale Center?
Per Capita income in Hale Center is $26,429.
What is the Median Family Income in Hale Center?
Median Family Income in Hale Center is $60,000.
What is the Median Household income in Hale Center?
Median Household Income in Hale Center is $47,130.
What is Income or Wage Gap in Hale Center?
Income or Wage Gap in Hale Center is 6.9%.
Women in Hale Center earn 93.1 cents for every dollar earned by a man.
What is Inequality or Gini Index in Hale Center?
Inequality or Gini Index in Hale Center is 0.41.
What is the Total Population of Hale Center?
Total Population of Hale Center is 1,866.
What is the Total Male Population of Hale Center?
Total Male Population of Hale Center is 983.
What is the Total Female Population of Hale Center?
Total Female Population of Hale Center is 883.
What is the Ratio of Males per 100 Females in Hale Center?
There are 111.33 Males per 100 Females in Hale Center.
What is the Ratio of Females per 100 Males in Hale Center?
There are 89.83 Females per 100 Males in Hale Center.
What is the Median Population Age in Hale Center?
Median Population Age in Hale Center is 50.5 Years.
What is the Average Family Size in Hale Center
Average Family Size in Hale Center is 3.0 People.
What is the Average Household Size in Hale Center
Average Household Size in Hale Center is 2.5 People.
How Large is the Labor Force in Hale Center?
There are 813 People in the Labor Forcein in Hale Center.
What is the Percentage of People in the Labor Force in Hale Center?
50.9% of People are in the Labor Force in Hale Center.
What is the Unemployment Rate in Hale Center?
Unemployment Rate in Hale Center is 2.1%.