Groves, TX Map & Demographics
Groves Map
Groves Overview
$32,330
PER CAPITA INCOME
$79,167
AVG FAMILY INCOME
$64,737
AVG HOUSEHOLD INCOME
32.2%
WAGE / INCOME GAP [ % ]
67.8¢/ $1
WAGE / INCOME GAP [ $ ]
0.40
INEQUALITY / GINI INDEX
17,110
TOTAL POPULATION
8,645
MALE POPULATION
8,465
FEMALE POPULATION
102.13
MALES / 100 FEMALES
97.92
FEMALES / 100 MALES
38.9
MEDIAN AGE
3.3
AVG FAMILY SIZE
2.8
AVG HOUSEHOLD SIZE
8,172
LABOR FORCE [ PEOPLE ]
60.9%
PERCENT IN LABOR FORCE
4.1%
UNEMPLOYMENT RATE
Groves Zip Codes
Groves Area Codes
Income in Groves
Income Overview in Groves
Per Capita Income in Groves is $32,330, while median incomes of families and households are $79,167 and $64,737 respectively.
| Characteristic | Number | Measure |
| Per Capita Income | 17,110 | $32,330 |
| Median Family Income | 4,180 | $79,167 |
| Mean Family Income | 4,180 | $92,765 |
| Median Household Income | 6,034 | $64,737 |
| Mean Household Income | 6,034 | $87,450 |
| Income Deficit | 4,180 | $0 |
| Wage / Income Gap (%) | 17,110 | 32.21% |
| Wage / Income Gap ($) | 17,110 | 67.79¢ per $1 |
| Gini / Inequality Index | 17,110 | 0.40 |
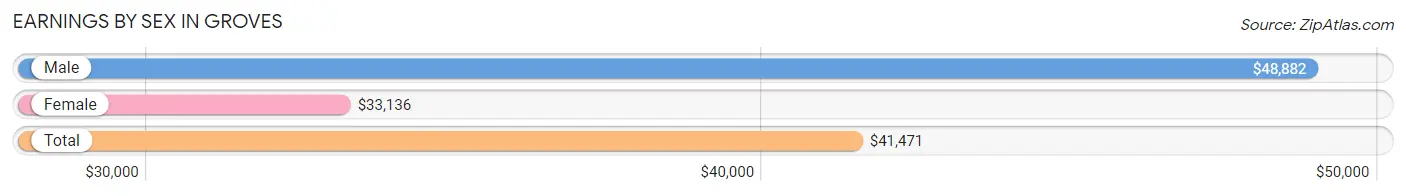
Earnings by Sex in Groves
Average Earnings in Groves are $41,471, $48,882 for men and $33,136 for women, a difference of 32.2%.
| Sex | Number | Average Earnings |
| Male | 4,762 (55.4%) | $48,882 |
| Female | 3,834 (44.6%) | $33,136 |
| Total | 8,596 (100.0%) | $41,471 |
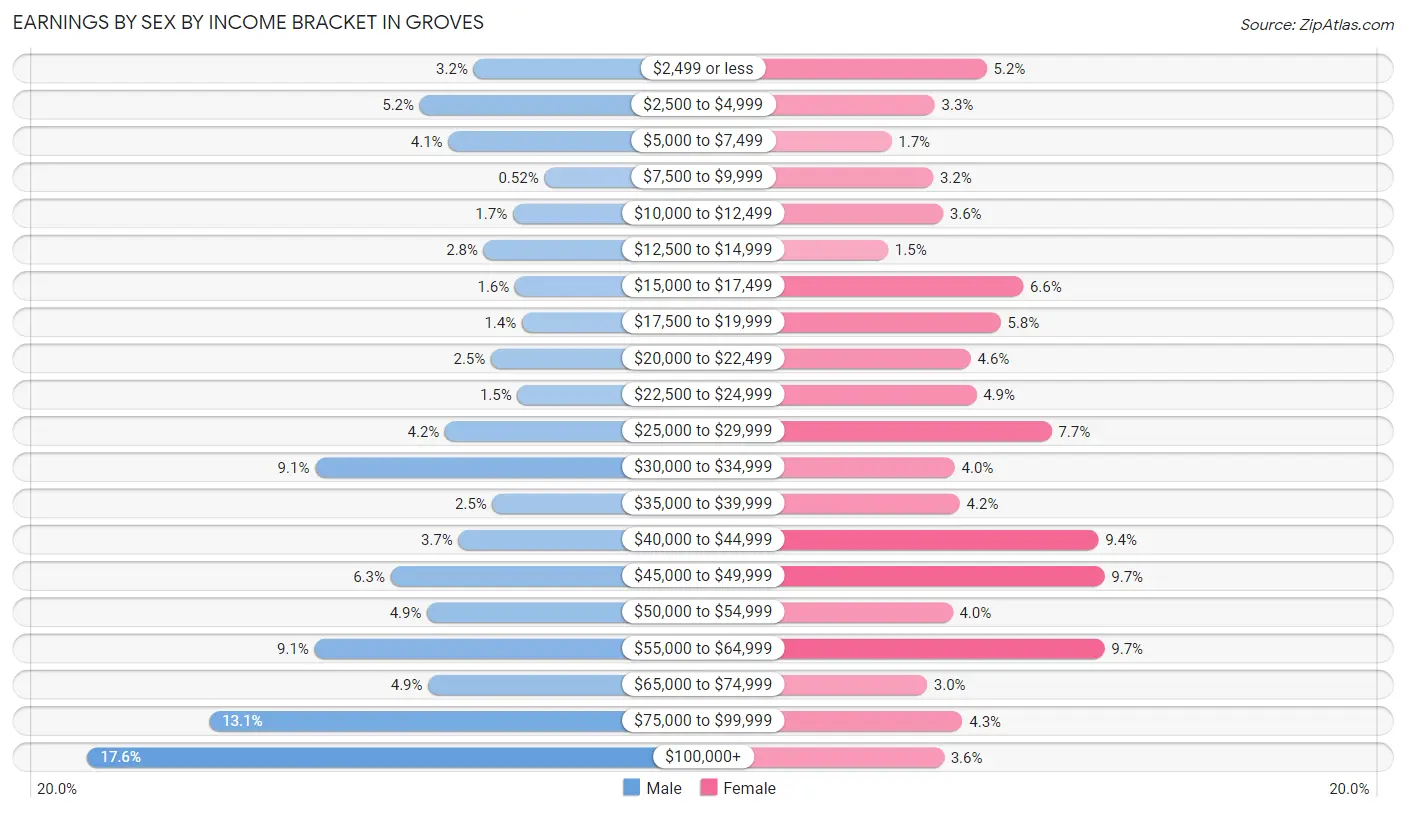
Earnings by Sex by Income Bracket in Groves
The most common earnings brackets in Groves are $100,000+ for men (840 | 17.6%) and $45,000 to $49,999 for women (370 | 9.7%).
| Income | Male | Female |
| $2,499 or less | 151 (3.2%) | 201 (5.2%) |
| $2,500 to $4,999 | 247 (5.2%) | 126 (3.3%) |
| $5,000 to $7,499 | 196 (4.1%) | 64 (1.7%) |
| $7,500 to $9,999 | 25 (0.5%) | 124 (3.2%) |
| $10,000 to $12,499 | 81 (1.7%) | 138 (3.6%) |
| $12,500 to $14,999 | 133 (2.8%) | 59 (1.5%) |
| $15,000 to $17,499 | 77 (1.6%) | 253 (6.6%) |
| $17,500 to $19,999 | 65 (1.4%) | 221 (5.8%) |
| $20,000 to $22,499 | 120 (2.5%) | 178 (4.6%) |
| $22,500 to $24,999 | 73 (1.5%) | 186 (4.9%) |
| $25,000 to $29,999 | 202 (4.2%) | 294 (7.7%) |
| $30,000 to $34,999 | 434 (9.1%) | 155 (4.0%) |
| $35,000 to $39,999 | 117 (2.5%) | 162 (4.2%) |
| $40,000 to $44,999 | 178 (3.7%) | 361 (9.4%) |
| $45,000 to $49,999 | 299 (6.3%) | 370 (9.7%) |
| $50,000 to $54,999 | 234 (4.9%) | 152 (4.0%) |
| $55,000 to $64,999 | 435 (9.1%) | 370 (9.7%) |
| $65,000 to $74,999 | 232 (4.9%) | 115 (3.0%) |
| $75,000 to $99,999 | 623 (13.1%) | 166 (4.3%) |
| $100,000+ | 840 (17.6%) | 139 (3.6%) |
| Total | 4,762 (100.0%) | 3,834 (100.0%) |
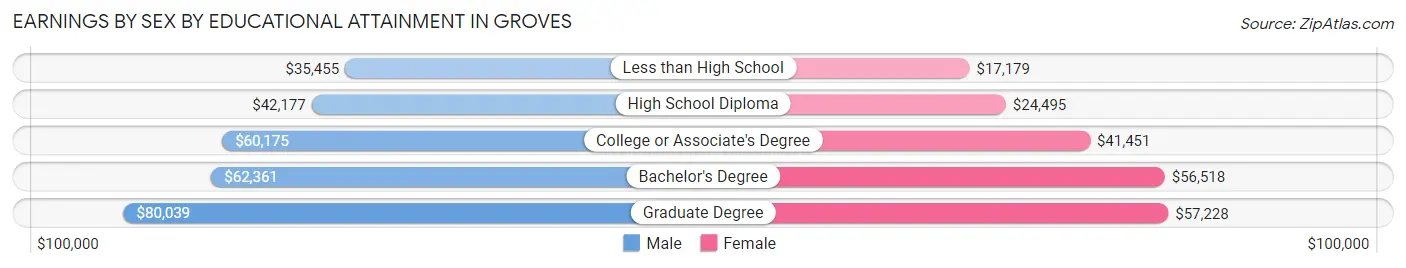
Earnings by Sex by Educational Attainment in Groves
Average earnings in Groves are $52,544 for men and $39,682 for women, a difference of 24.5%. Men with an educational attainment of graduate degree enjoy the highest average annual earnings of $80,039, while those with less than high school education earn the least with $35,455. Women with an educational attainment of graduate degree earn the most with the average annual earnings of $57,228, while those with less than high school education have the smallest earnings of $17,179.
| Educational Attainment | Male Income | Female Income |
| Less than High School | $35,455 | $17,179 |
| High School Diploma | $42,177 | $24,495 |
| College or Associate's Degree | $60,175 | $41,451 |
| Bachelor's Degree | $62,361 | $56,518 |
| Graduate Degree | $80,039 | $57,228 |
| Total | $52,544 | $39,682 |
Family Income in Groves
Family Income Brackets in Groves
According to the Groves family income data, there are 936 families falling into the $100,000 to $149,999 income range, which is the most common income bracket and makes up 22.4% of all families. Conversely, the $10,000 to $14,999 income bracket is the least frequent group with only 84 families (2.0%) belonging to this category.
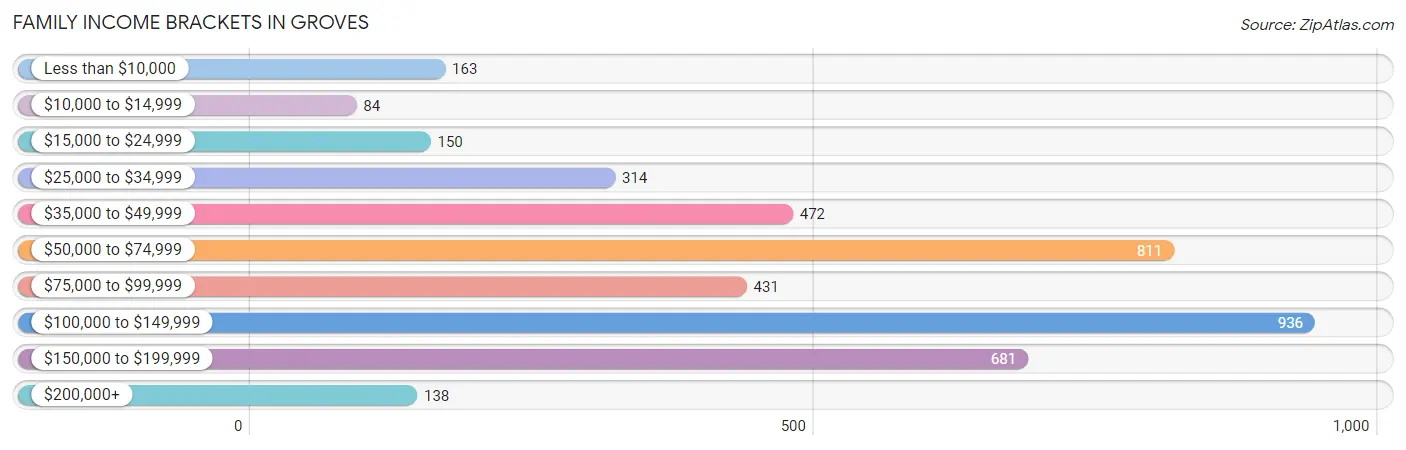
| Income Bracket | # Families | % Families |
| Less than $10,000 | 163 | 3.9% |
| $10,000 to $14,999 | 84 | 2.0% |
| $15,000 to $24,999 | 150 | 3.6% |
| $25,000 to $34,999 | 314 | 7.5% |
| $35,000 to $49,999 | 472 | 11.3% |
| $50,000 to $74,999 | 811 | 19.4% |
| $75,000 to $99,999 | 431 | 10.3% |
| $100,000 to $149,999 | 936 | 22.4% |
| $150,000 to $199,999 | 681 | 16.3% |
| $200,000+ | 138 | 3.3% |
Family Income by Famaliy Size in Groves
7+ person families (75 | 1.8%) account for the highest median family income in Groves with $165,096 per family, while 2-person families (1,856 | 44.4%) have the highest median income of $32,649 per family member.
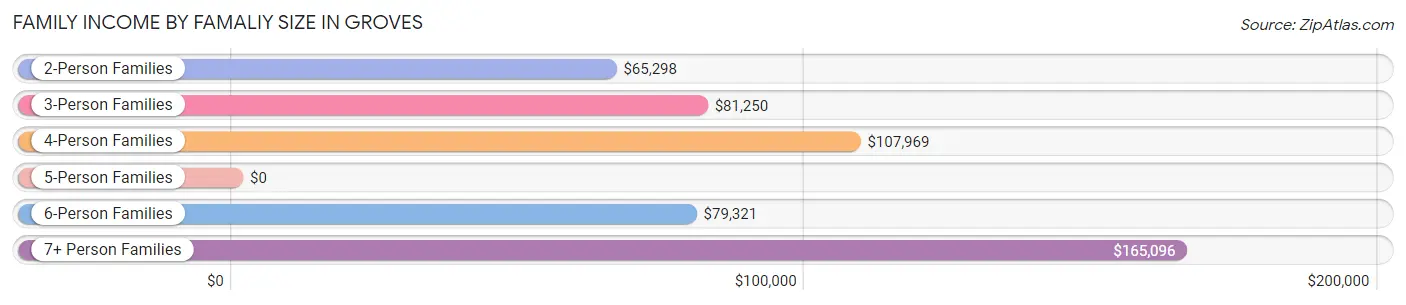
| Income Bracket | # Families | Median Income |
| 2-Person Families | 1,856 (44.4%) | $65,298 |
| 3-Person Families | 1,004 (24.0%) | $81,250 |
| 4-Person Families | 758 (18.1%) | $107,969 |
| 5-Person Families | 290 (6.9%) | $0 |
| 6-Person Families | 197 (4.7%) | $79,321 |
| 7+ Person Families | 75 (1.8%) | $165,096 |
| Total | 4,180 (100.0%) | $79,167 |
Family Income by Number of Earners in Groves
The median family income in Groves is $79,167, with families comprising 3+ earners (430) having the highest median family income of $151,944, while families with no earners (672) have the lowest median family income of $50,682, accounting for 10.3% and 16.1% of families, respectively.
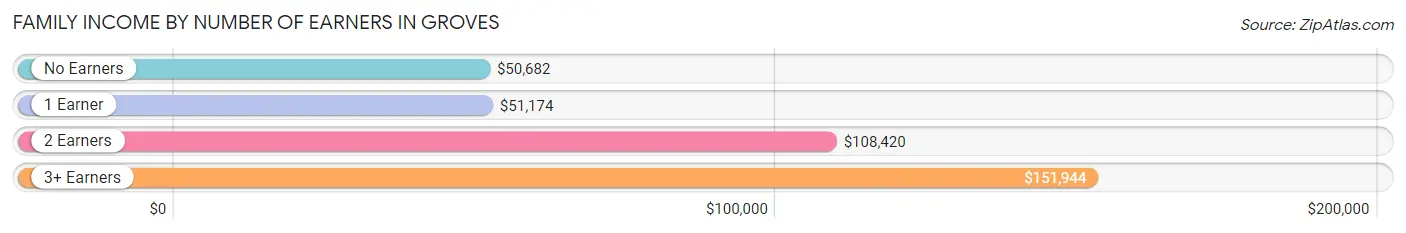
| Number of Earners | # Families | Median Income |
| No Earners | 672 (16.1%) | $50,682 |
| 1 Earner | 1,347 (32.2%) | $51,174 |
| 2 Earners | 1,731 (41.4%) | $108,420 |
| 3+ Earners | 430 (10.3%) | $151,944 |
| Total | 4,180 (100.0%) | $79,167 |
Household Income in Groves
Household Income Brackets in Groves
With 1,225 households falling in the category, the $50,000 to $74,999 income range is the most frequent in Groves, accounting for 20.3% of all households. In contrast, only 133 households (2.2%) fall into the $10,000 to $14,999 income bracket, making it the least populous group.
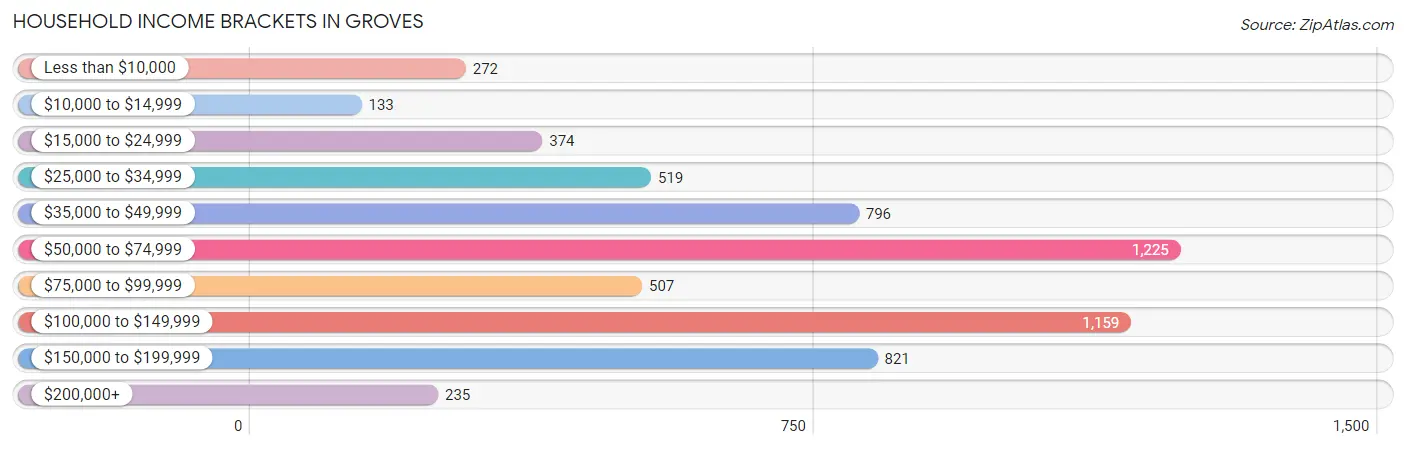
| Income Bracket | # Households | % Households |
| Less than $10,000 | 272 | 4.5% |
| $10,000 to $14,999 | 133 | 2.2% |
| $15,000 to $24,999 | 374 | 6.2% |
| $25,000 to $34,999 | 519 | 8.6% |
| $35,000 to $49,999 | 796 | 13.2% |
| $50,000 to $74,999 | 1,225 | 20.3% |
| $75,000 to $99,999 | 507 | 8.4% |
| $100,000 to $149,999 | 1,159 | 19.2% |
| $150,000 to $199,999 | 821 | 13.6% |
| $200,000+ | 235 | 3.9% |
Household Income by Householder Age in Groves
The median household income in Groves is $64,737, with the highest median household income of $87,182 found in the 45 to 64 years age bracket for the primary householder. A total of 2,198 households (36.4%) fall into this category. Meanwhile, the 65+ years age bracket for the primary householder has the lowest median household income of $60,577, with 1,536 households (25.5%) in this group.
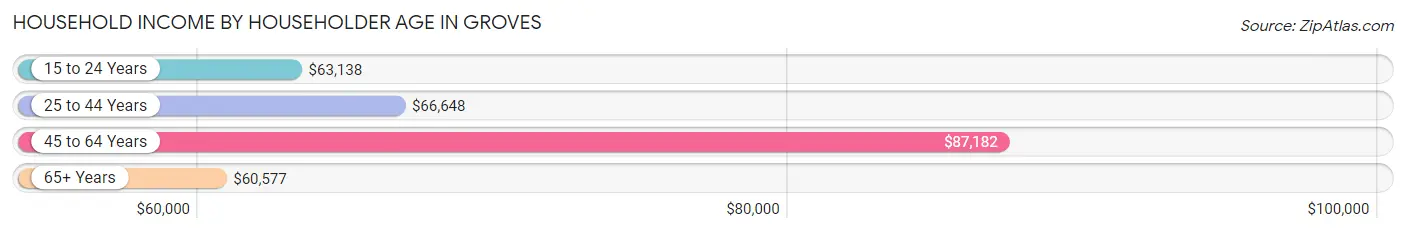
| Income Bracket | # Households | Median Income |
| 15 to 24 Years | 225 (3.7%) | $63,138 |
| 25 to 44 Years | 2,075 (34.4%) | $66,648 |
| 45 to 64 Years | 2,198 (36.4%) | $87,182 |
| 65+ Years | 1,536 (25.5%) | $60,577 |
| Total | 6,034 (100.0%) | $64,737 |
Poverty in Groves
Income Below Poverty by Sex and Age in Groves
With 9.7% poverty level for males and 11.8% for females among the residents of Groves, 5 year old males and 6 to 11 year old females are the most vulnerable to poverty, with 47 males (36.4%) and 152 females (22.9%) in their respective age groups living below the poverty level.
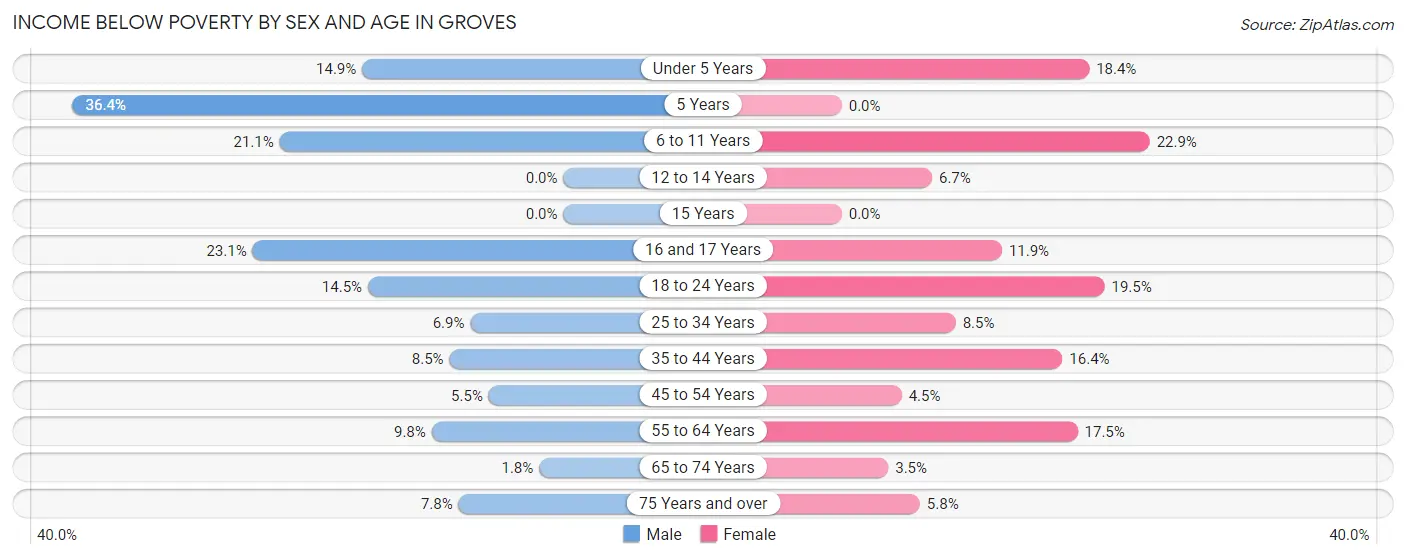
| Age Bracket | Male | Female |
| Under 5 Years | 98 (14.9%) | 97 (18.4%) |
| 5 Years | 47 (36.4%) | 0 (0.0%) |
| 6 to 11 Years | 170 (21.1%) | 152 (22.9%) |
| 12 to 14 Years | 0 (0.0%) | 14 (6.7%) |
| 15 Years | 0 (0.0%) | 0 (0.0%) |
| 16 and 17 Years | 27 (23.1%) | 27 (11.9%) |
| 18 to 24 Years | 75 (14.5%) | 111 (19.5%) |
| 25 to 34 Years | 99 (6.9%) | 108 (8.5%) |
| 35 to 44 Years | 83 (8.5%) | 161 (16.4%) |
| 45 to 54 Years | 60 (5.5%) | 38 (4.4%) |
| 55 to 64 Years | 122 (9.8%) | 198 (17.5%) |
| 65 to 74 Years | 14 (1.8%) | 33 (3.5%) |
| 75 Years and over | 27 (7.8%) | 42 (5.8%) |
| Total | 822 (9.7%) | 981 (11.8%) |
Income Above Poverty by Sex and Age in Groves
According to the poverty statistics in Groves, males aged 12 to 14 years and females aged 5 years are the age groups that are most secure financially, with 100.0% of males and 100.0% of females in these age groups living above the poverty line.
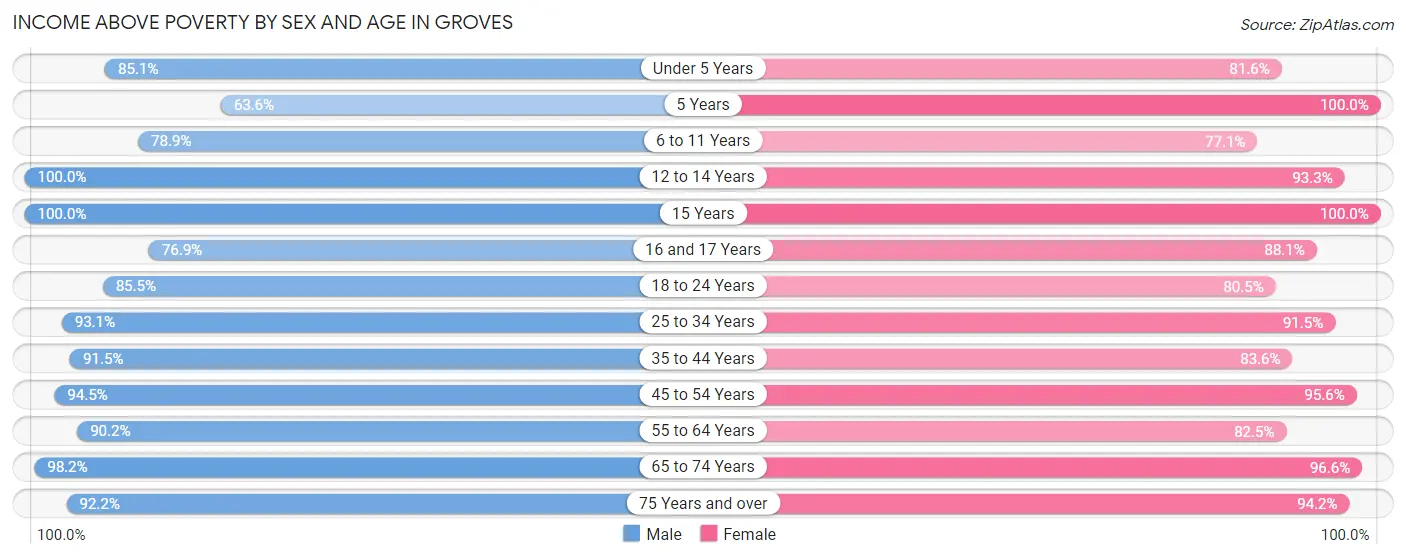
| Age Bracket | Male | Female |
| Under 5 Years | 558 (85.1%) | 431 (81.6%) |
| 5 Years | 82 (63.6%) | 187 (100.0%) |
| 6 to 11 Years | 637 (78.9%) | 513 (77.1%) |
| 12 to 14 Years | 265 (100.0%) | 195 (93.3%) |
| 15 Years | 148 (100.0%) | 28 (100.0%) |
| 16 and 17 Years | 90 (76.9%) | 200 (88.1%) |
| 18 to 24 Years | 442 (85.5%) | 458 (80.5%) |
| 25 to 34 Years | 1,334 (93.1%) | 1,169 (91.5%) |
| 35 to 44 Years | 898 (91.5%) | 822 (83.6%) |
| 45 to 54 Years | 1,024 (94.5%) | 815 (95.6%) |
| 55 to 64 Years | 1,125 (90.2%) | 933 (82.5%) |
| 65 to 74 Years | 762 (98.2%) | 924 (96.6%) |
| 75 Years and over | 320 (92.2%) | 682 (94.2%) |
| Total | 7,685 (90.3%) | 7,357 (88.2%) |
Income Below Poverty Among Married-Couple Families in Groves
The poverty statistics for married-couple families in Groves show that 4.2% or 133 of the total 3,139 families live below the poverty line. Families with 1 or 2 children have the highest poverty rate of 10.2%, comprising of 118 families. On the other hand, families with 3 or 4 children have the lowest poverty rate of 0.0%, which includes 0 families.
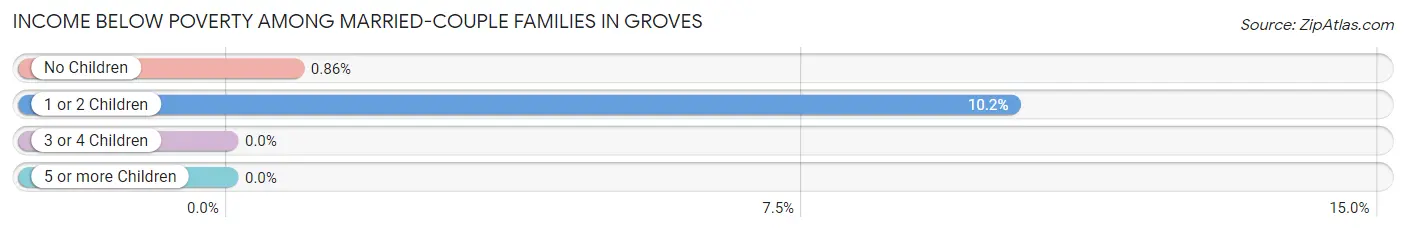
| Children | Above Poverty | Below Poverty |
| No Children | 1,720 (99.1%) | 15 (0.9%) |
| 1 or 2 Children | 1,038 (89.8%) | 118 (10.2%) |
| 3 or 4 Children | 209 (100.0%) | 0 (0.0%) |
| 5 or more Children | 39 (100.0%) | 0 (0.0%) |
| Total | 3,006 (95.8%) | 133 (4.2%) |
Income Below Poverty Among Single-Parent Households in Groves
According to the poverty data in Groves, 3.2% or 11 single-father households and 30.8% or 216 single-mother households are living below the poverty line. Among single-father households, those with no children have the highest poverty rate, with 11 households (4.5%) experiencing poverty. Likewise, among single-mother households, those with 5 or more children have the highest poverty rate, with 25 households (100.0%) falling below the poverty line.
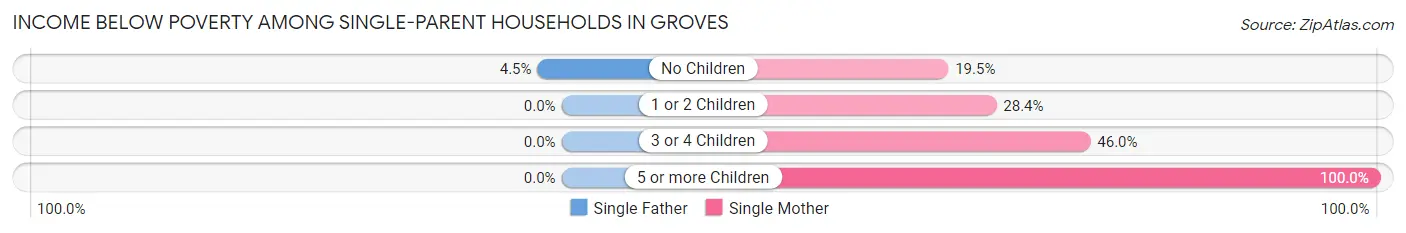
| Children | Single Father | Single Mother |
| No Children | 11 (4.5%) | 45 (19.5%) |
| 1 or 2 Children | 0 (0.0%) | 95 (28.4%) |
| 3 or 4 Children | 0 (0.0%) | 51 (46.0%) |
| 5 or more Children | 0 (0.0%) | 25 (100.0%) |
| Total | 11 (3.2%) | 216 (30.8%) |
Income Below Poverty Among Married-Couple vs Single-Parent Households in Groves
The poverty data for Groves shows that 133 of the married-couple family households (4.2%) and 227 of the single-parent households (21.8%) are living below the poverty level. Within the married-couple family households, those with 1 or 2 children have the highest poverty rate, with 118 households (10.2%) falling below the poverty line. Among the single-parent households, those with 5 or more children have the highest poverty rate, with 25 household (100.0%) living below poverty.
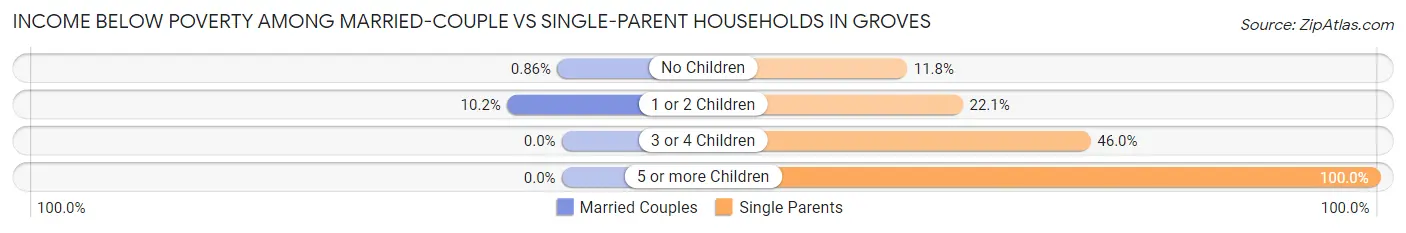
| Children | Married-Couple Families | Single-Parent Households |
| No Children | 15 (0.9%) | 56 (11.8%) |
| 1 or 2 Children | 118 (10.2%) | 95 (22.1%) |
| 3 or 4 Children | 0 (0.0%) | 51 (46.0%) |
| 5 or more Children | 0 (0.0%) | 25 (100.0%) |
| Total | 133 (4.2%) | 227 (21.8%) |
Race in Groves
The most populous races in Groves are White / Caucasian (11,351 | 66.3%), Hispanic or Latino (4,388 | 25.7%), and Two or more Races (2,303 | 13.5%).
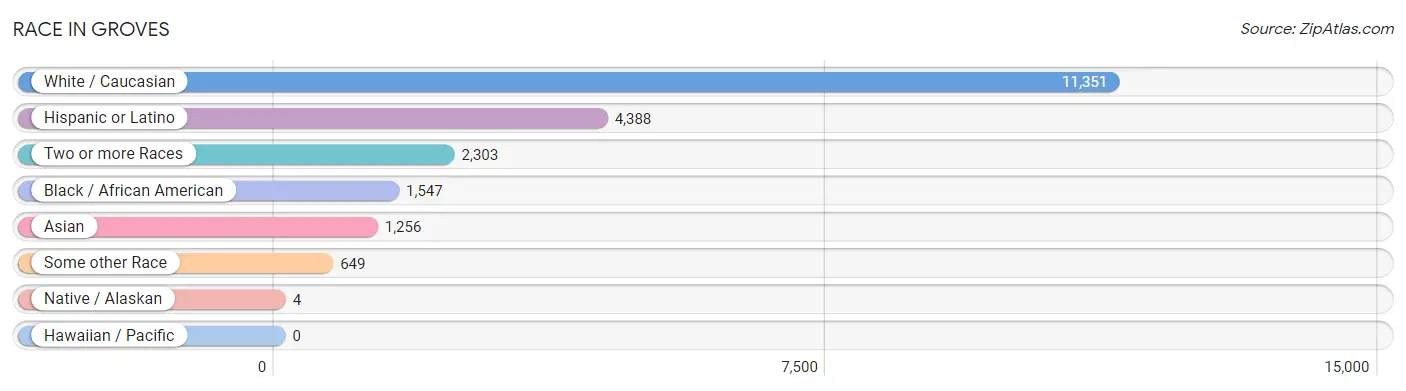
| Race | # Population | % Population |
| Asian | 1,256 | 7.3% |
| Black / African American | 1,547 | 9.0% |
| Hawaiian / Pacific | 0 | 0.0% |
| Hispanic or Latino | 4,388 | 25.7% |
| Native / Alaskan | 4 | 0.0% |
| White / Caucasian | 11,351 | 66.3% |
| Two or more Races | 2,303 | 13.5% |
| Some other Race | 649 | 3.8% |
| Total | 17,110 | 100.0% |
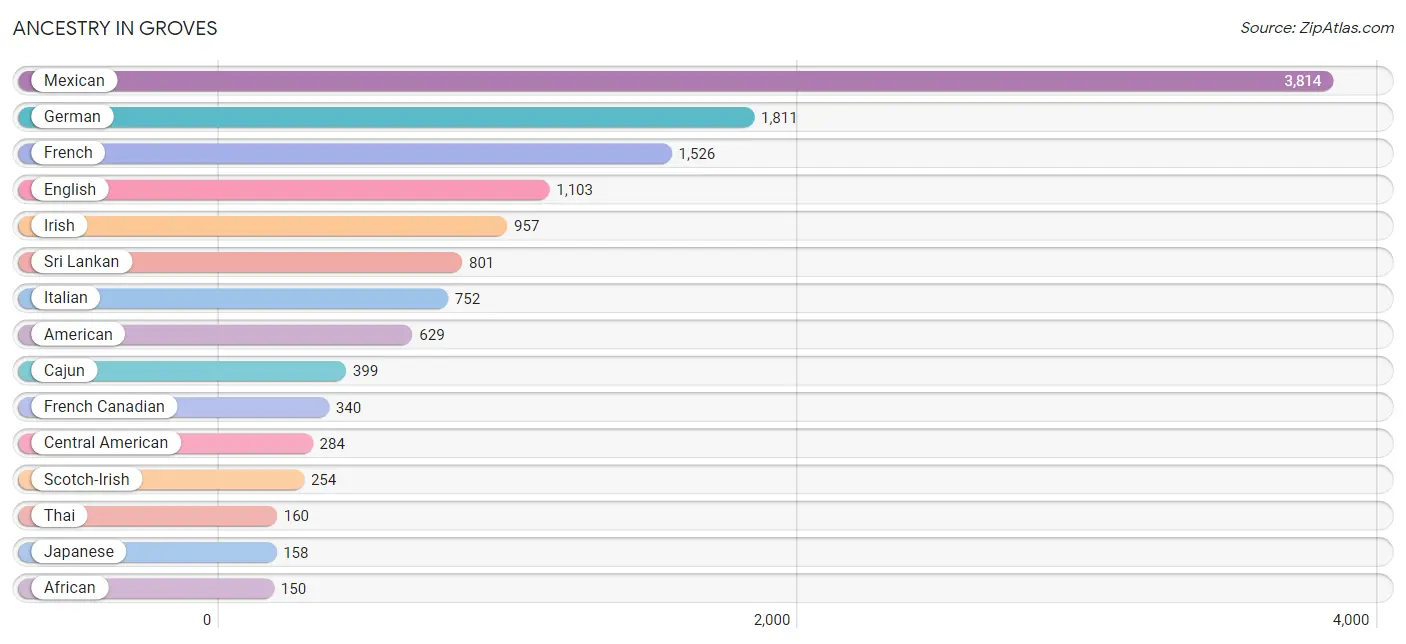
Ancestry in Groves
The most populous ancestries reported in Groves are Mexican (3,814 | 22.3%), German (1,811 | 10.6%), French (1,526 | 8.9%), English (1,103 | 6.5%), and Irish (957 | 5.6%), together accounting for 53.8% of all Groves residents.
| Ancestry | # Population | % Population |
| African | 150 | 0.9% |
| American | 629 | 3.7% |
| Arab | 49 | 0.3% |
| British | 22 | 0.1% |
| Cajun | 399 | 2.3% |
| Canadian | 25 | 0.2% |
| Celtic | 15 | 0.1% |
| Central American | 284 | 1.7% |
| Cherokee | 6 | 0.0% |
| Choctaw | 24 | 0.1% |
| Colombian | 66 | 0.4% |
| Cuban | 36 | 0.2% |
| Czech | 37 | 0.2% |
| Danish | 22 | 0.1% |
| Dominican | 130 | 0.8% |
| Dutch | 36 | 0.2% |
| English | 1,103 | 6.5% |
| European | 89 | 0.5% |
| French | 1,526 | 8.9% |
| French Canadian | 340 | 2.0% |
| German | 1,811 | 10.6% |
| Greek | 66 | 0.4% |
| Guatemalan | 12 | 0.1% |
| Honduran | 112 | 0.6% |
| Hungarian | 8 | 0.1% |
| Indian (Asian) | 72 | 0.4% |
| Irish | 957 | 5.6% |
| Italian | 752 | 4.4% |
| Japanese | 158 | 0.9% |
| Korean | 45 | 0.3% |
| Lebanese | 7 | 0.0% |
| Mexican | 3,814 | 22.3% |
| Nicaraguan | 107 | 0.6% |
| Northern European | 4 | 0.0% |
| Norwegian | 35 | 0.2% |
| Polish | 100 | 0.6% |
| Potawatomi | 1 | 0.0% |
| Puerto Rican | 21 | 0.1% |
| Russian | 61 | 0.4% |
| Salvadoran | 53 | 0.3% |
| Scotch-Irish | 254 | 1.5% |
| Scottish | 123 | 0.7% |
| South American | 66 | 0.4% |
| Spaniard | 10 | 0.1% |
| Spanish | 23 | 0.1% |
| Sri Lankan | 801 | 4.7% |
| Subsaharan African | 150 | 0.9% |
| Swedish | 30 | 0.2% |
| Swiss | 10 | 0.1% |
| Syrian | 42 | 0.3% |
| Thai | 160 | 0.9% | View All 51 Rows |
Immigrants in Groves
The most numerous immigrant groups reported in Groves came from Latin America (1,596 | 9.3%), Central America (1,421 | 8.3%), Mexico (1,201 | 7.0%), Asia (789 | 4.6%), and South Eastern Asia (659 | 3.8%), together accounting for 33.1% of all Groves residents.
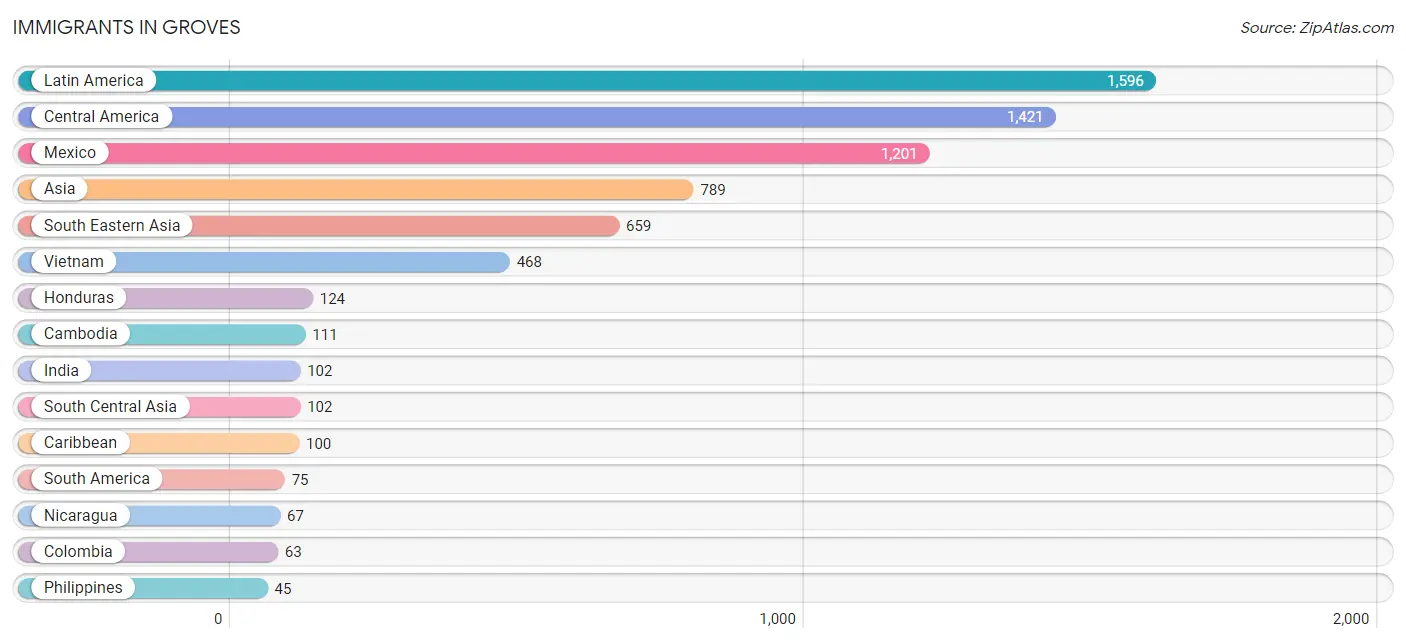
| Immigration Origin | # Population | % Population |
| Asia | 789 | 4.6% |
| Cambodia | 111 | 0.6% |
| Caribbean | 100 | 0.6% |
| Central America | 1,421 | 8.3% |
| Colombia | 63 | 0.4% |
| Cuba | 36 | 0.2% |
| Dominican Republic | 29 | 0.2% |
| El Salvador | 26 | 0.2% |
| Guatemala | 3 | 0.0% |
| Honduras | 124 | 0.7% |
| India | 102 | 0.6% |
| Jamaica | 29 | 0.2% |
| Latin America | 1,596 | 9.3% |
| Malaysia | 35 | 0.2% |
| Mexico | 1,201 | 7.0% |
| Nicaragua | 67 | 0.4% |
| Peru | 12 | 0.1% |
| Philippines | 45 | 0.3% |
| South America | 75 | 0.4% |
| South Central Asia | 102 | 0.6% |
| South Eastern Asia | 659 | 3.8% |
| Syria | 28 | 0.2% |
| Vietnam | 468 | 2.7% |
| Western Asia | 28 | 0.2% | View All 24 Rows |
Sex and Age in Groves
Sex and Age in Groves
The most populous age groups in Groves are 5 to 9 Years (764 | 8.8%) for men and 25 to 29 Years (735 | 8.7%) for women.
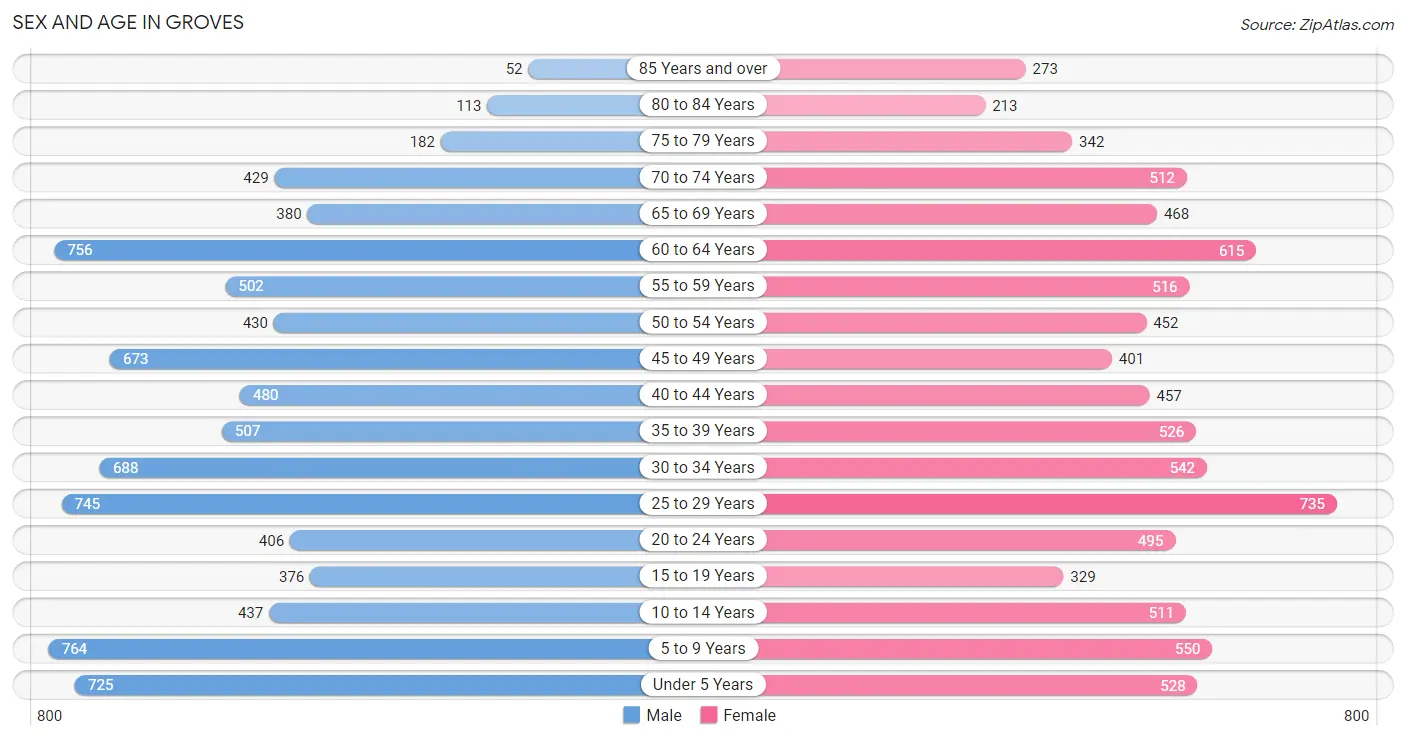
| Age Bracket | Male | Female |
| Under 5 Years | 725 (8.4%) | 528 (6.2%) |
| 5 to 9 Years | 764 (8.8%) | 550 (6.5%) |
| 10 to 14 Years | 437 (5.1%) | 511 (6.0%) |
| 15 to 19 Years | 376 (4.3%) | 329 (3.9%) |
| 20 to 24 Years | 406 (4.7%) | 495 (5.9%) |
| 25 to 29 Years | 745 (8.6%) | 735 (8.7%) |
| 30 to 34 Years | 688 (8.0%) | 542 (6.4%) |
| 35 to 39 Years | 507 (5.9%) | 526 (6.2%) |
| 40 to 44 Years | 480 (5.6%) | 457 (5.4%) |
| 45 to 49 Years | 673 (7.8%) | 401 (4.7%) |
| 50 to 54 Years | 430 (5.0%) | 452 (5.3%) |
| 55 to 59 Years | 502 (5.8%) | 516 (6.1%) |
| 60 to 64 Years | 756 (8.7%) | 615 (7.3%) |
| 65 to 69 Years | 380 (4.4%) | 468 (5.5%) |
| 70 to 74 Years | 429 (5.0%) | 512 (6.0%) |
| 75 to 79 Years | 182 (2.1%) | 342 (4.0%) |
| 80 to 84 Years | 113 (1.3%) | 213 (2.5%) |
| 85 Years and over | 52 (0.6%) | 273 (3.2%) |
| Total | 8,645 (100.0%) | 8,465 (100.0%) |
Families and Households in Groves
Median Family Size in Groves
The median family size in Groves is 3.33 persons per family, with single female/mother families (701 | 16.8%) accounting for the largest median family size of 3.54 persons per family. On the other hand, single male/father families (340 | 8.1%) represent the smallest median family size with 2.62 persons per family.
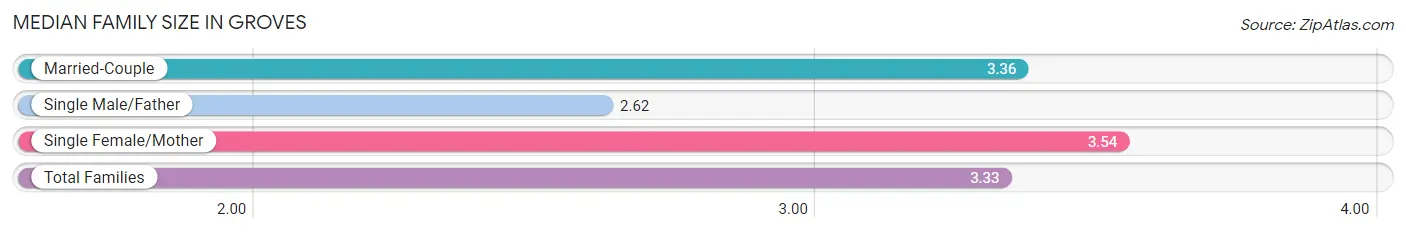
| Family Type | # Families | Family Size |
| Married-Couple | 3,139 (75.1%) | 3.36 |
| Single Male/Father | 340 (8.1%) | 2.62 |
| Single Female/Mother | 701 (16.8%) | 3.54 |
| Total Families | 4,180 (100.0%) | 3.33 |
Median Household Size in Groves
The median household size in Groves is 2.80 persons per household, with single female/mother households (701 | 11.6%) accounting for the largest median household size of 3.78 persons per household. non-family households (1,854 | 30.7%) represent the smallest median household size with 1.44 persons per household.
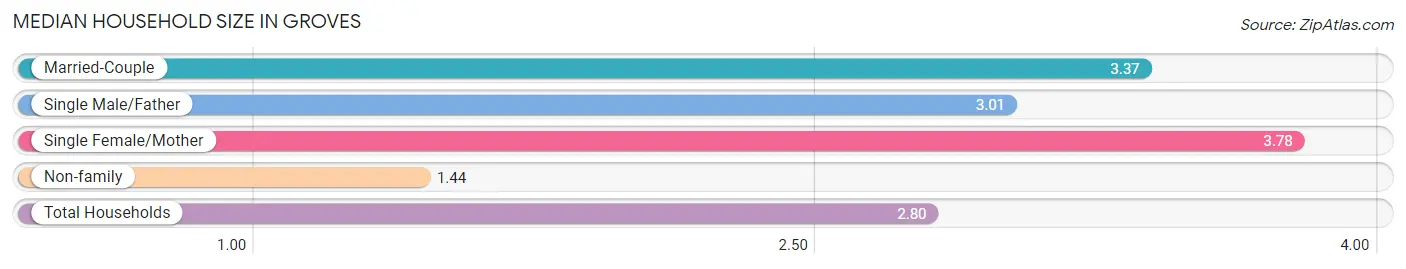
| Household Type | # Households | Household Size |
| Married-Couple | 3,139 (52.0%) | 3.37 |
| Single Male/Father | 340 (5.6%) | 3.01 |
| Single Female/Mother | 701 (11.6%) | 3.78 |
| Non-family | 1,854 (30.7%) | 1.44 |
| Total Households | 6,034 (100.0%) | 2.80 |
Household Size by Marriage Status in Groves
Out of a total of 6,034 households in Groves, 4,180 (69.3%) are family households, while 1,854 (30.7%) are nonfamily households. The most numerous type of family households are 2-person households, comprising 1,729, and the most common type of nonfamily households are 1-person households, comprising 1,363.
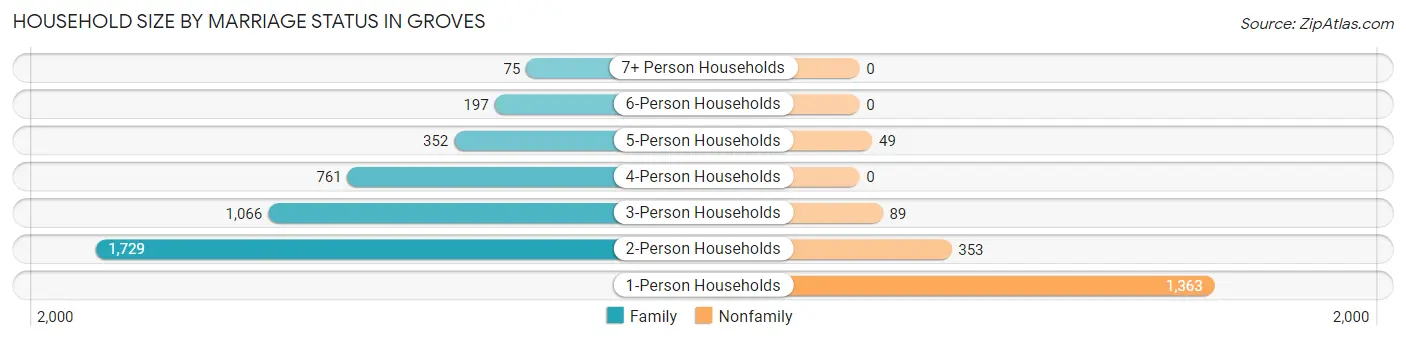
| Household Size | Family Households | Nonfamily Households |
| 1-Person Households | - | 1,363 (22.6%) |
| 2-Person Households | 1,729 (28.6%) | 353 (5.9%) |
| 3-Person Households | 1,066 (17.7%) | 89 (1.5%) |
| 4-Person Households | 761 (12.6%) | 0 (0.0%) |
| 5-Person Households | 352 (5.8%) | 49 (0.8%) |
| 6-Person Households | 197 (3.3%) | 0 (0.0%) |
| 7+ Person Households | 75 (1.2%) | 0 (0.0%) |
| Total | 4,180 (69.3%) | 1,854 (30.7%) |
Female Fertility in Groves
Fertility by Age in Groves
Average fertility rate in Groves is 39.0 births per 1,000 women. Women in the age bracket of 20 to 34 years have the highest fertility rate with 76.0 births per 1,000 women. Women in the age bracket of 20 to 34 years acount for 100.0% of all women with births.
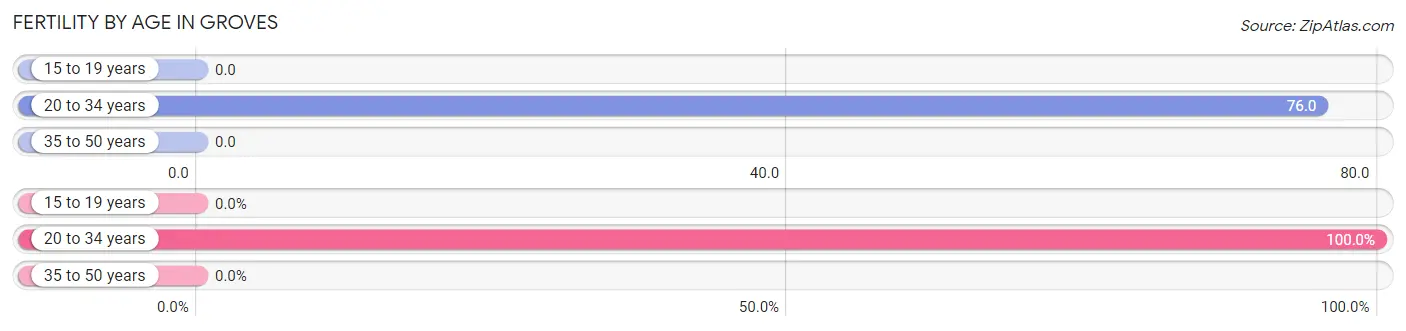
| Age Bracket | Women with Births | Births / 1,000 Women |
| 15 to 19 years | 0 (0.0%) | 0.0 |
| 20 to 34 years | 135 (100.0%) | 76.0 |
| 35 to 50 years | 0 (0.0%) | 0.0 |
| Total | 135 (100.0%) | 39.0 |
Fertility by Age by Marriage Status in Groves
80.7% of women with births (135) in Groves are married. The highest percentage of unmarried women with births falls into 20 to 34 years age bracket with 19.3% of them unmarried at the time of birth, while the lowest percentage of unmarried women with births belong to 20 to 34 years age bracket with 19.3% of them unmarried.
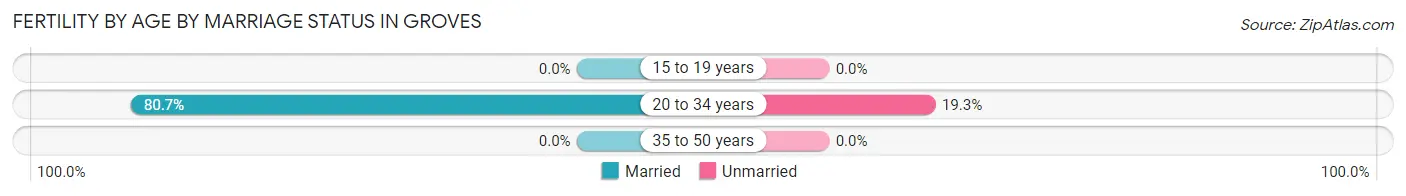
| Age Bracket | Married | Unmarried |
| 15 to 19 years | 0 (0.0%) | 0 (0.0%) |
| 20 to 34 years | 109 (80.7%) | 26 (19.3%) |
| 35 to 50 years | 0 (0.0%) | 0 (0.0%) |
| Total | 109 (80.7%) | 26 (19.3%) |
Fertility by Education in Groves
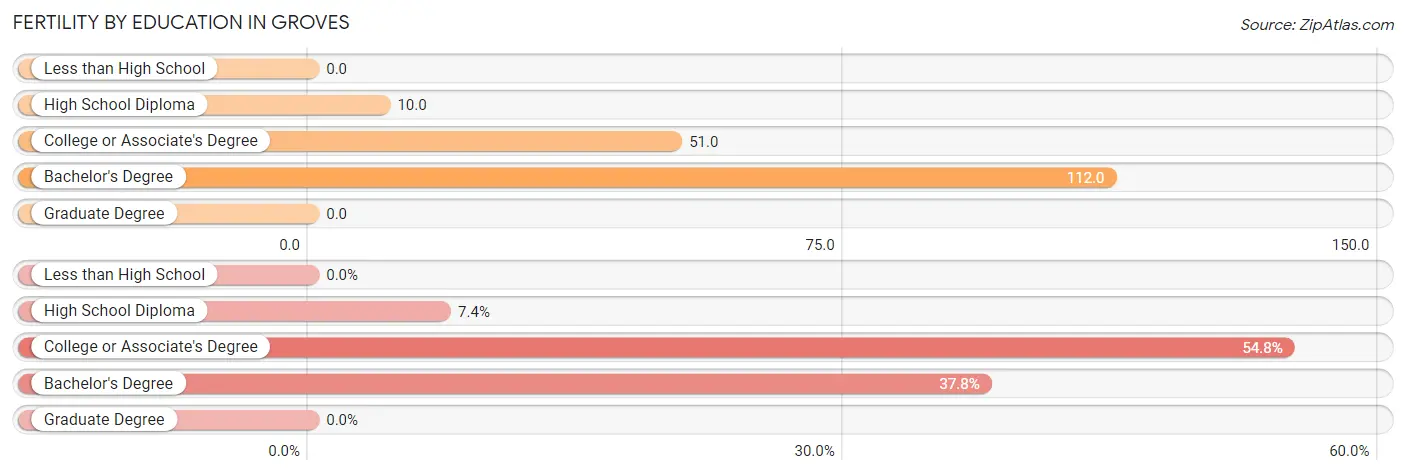
| Educational Attainment | Women with Births | Births / 1,000 Women |
| Less than High School | 0 (0.0%) | 0.0 |
| High School Diploma | 10 (7.4%) | 10.0 |
| College or Associate's Degree | 74 (54.8%) | 51.0 |
| Bachelor's Degree | 51 (37.8%) | 112.0 |
| Graduate Degree | 0 (0.0%) | 0.0 |
| Total | 135 (100.0%) | 39.0 |
Fertility by Education by Marriage Status in Groves
19.3% of women with births in Groves are unmarried. Women with the educational attainment of high school diploma are most likely to be married with 100.0% of them married at childbirth, while women with the educational attainment of college or associate's degree are least likely to be married with 35.1% of them unmarried at childbirth.
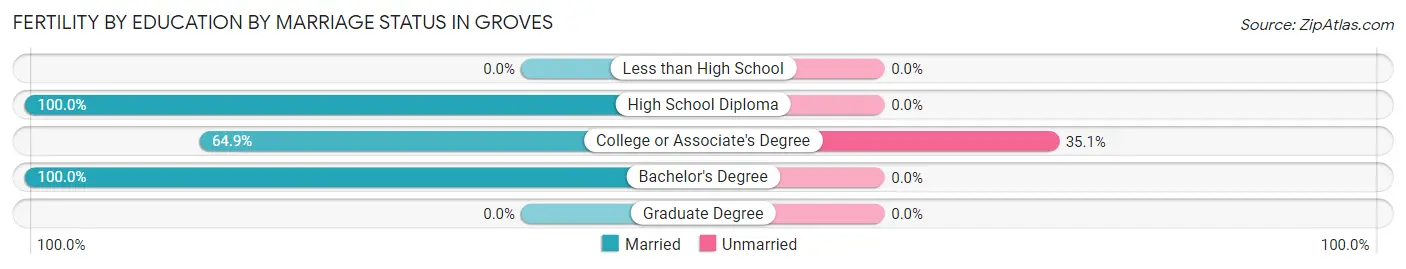
| Educational Attainment | Married | Unmarried |
| Less than High School | 0 (0.0%) | 0 (0.0%) |
| High School Diploma | 10 (100.0%) | 0 (0.0%) |
| College or Associate's Degree | 48 (64.9%) | 26 (35.1%) |
| Bachelor's Degree | 51 (100.0%) | 0 (0.0%) |
| Graduate Degree | 0 (0.0%) | 0 (0.0%) |
| Total | 109 (80.7%) | 26 (19.3%) |
Employment Characteristics in Groves
Employment by Class of Employer in Groves
Among the 7,778 employed individuals in Groves, private company employees (5,505 | 70.8%), self-employed (not incorporated) (738 | 9.5%), and local government employees (574 | 7.4%) make up the most common classes of employment.
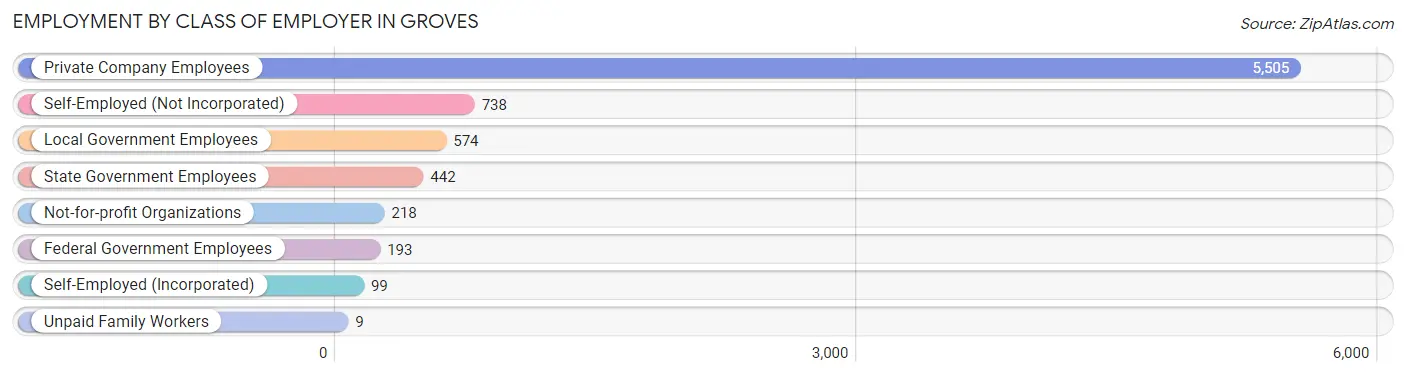
| Employer Class | # Employees | % Employees |
| Private Company Employees | 5,505 | 70.8% |
| Self-Employed (Incorporated) | 99 | 1.3% |
| Self-Employed (Not Incorporated) | 738 | 9.5% |
| Not-for-profit Organizations | 218 | 2.8% |
| Local Government Employees | 574 | 7.4% |
| State Government Employees | 442 | 5.7% |
| Federal Government Employees | 193 | 2.5% |
| Unpaid Family Workers | 9 | 0.1% |
| Total | 7,778 | 100.0% |
Employment Status by Age in Groves
According to the labor force statistics for Groves, out of the total population over 16 years of age (13,419), 60.9% or 8,172 individuals are in the labor force, with 4.1% or 335 of them unemployed. The age group with the highest labor force participation rate is 30 to 34 years, with 85.1% or 1,047 individuals in the labor force. Within the labor force, the 25 to 29 years age range has the highest percentage of unemployed individuals, with 10.8% or 132 of them being unemployed.
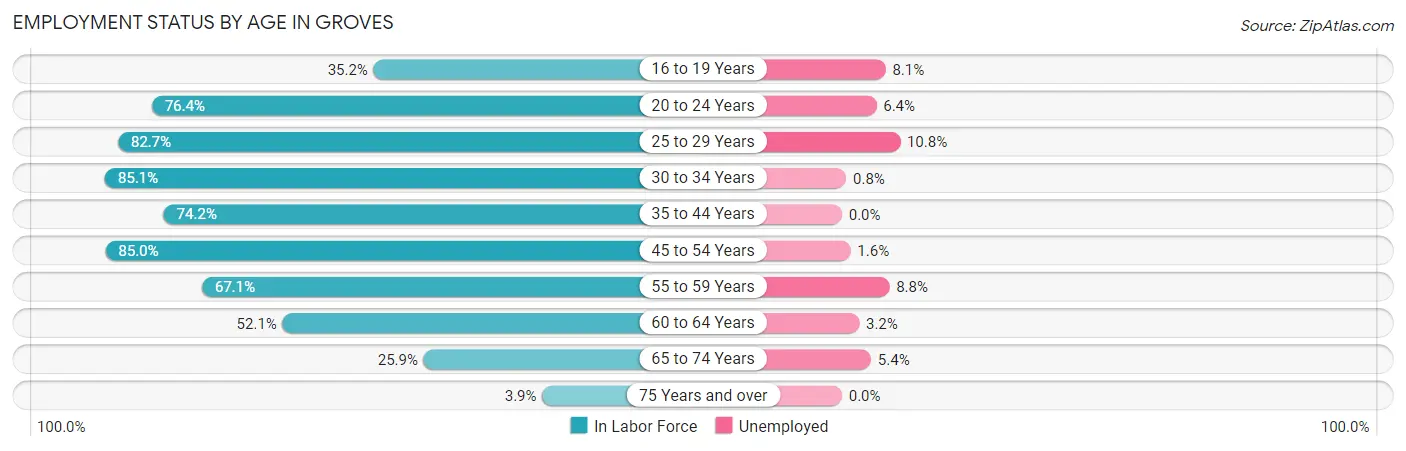
| Age Bracket | In Labor Force | Unemployed |
| 16 to 19 Years | 186 (35.2%) | 15 (8.1%) |
| 20 to 24 Years | 688 (76.4%) | 44 (6.4%) |
| 25 to 29 Years | 1,224 (82.7%) | 132 (10.8%) |
| 30 to 34 Years | 1,047 (85.1%) | 8 (0.8%) |
| 35 to 44 Years | 1,462 (74.2%) | 0 (0.0%) |
| 45 to 54 Years | 1,663 (85.0%) | 27 (1.6%) |
| 55 to 59 Years | 683 (67.1%) | 60 (8.8%) |
| 60 to 64 Years | 714 (52.1%) | 23 (3.2%) |
| 65 to 74 Years | 463 (25.9%) | 25 (5.4%) |
| 75 Years and over | 46 (3.9%) | 0 (0.0%) |
| Total | 8,172 (60.9%) | 335 (4.1%) |
Employment Status by Educational Attainment in Groves
According to labor force statistics for Groves, 75.3% of individuals (6,796) out of the total population between 25 and 64 years of age (9,025) are in the labor force, with 3.6% or 245 of them being unemployed. The group with the highest labor force participation rate are those with the educational attainment of bachelor's degree or higher, with 80.1% or 1,008 individuals in the labor force. Within the labor force, individuals with high school diploma education have the highest percentage of unemployment, with 8.9% or 186 of them being unemployed.
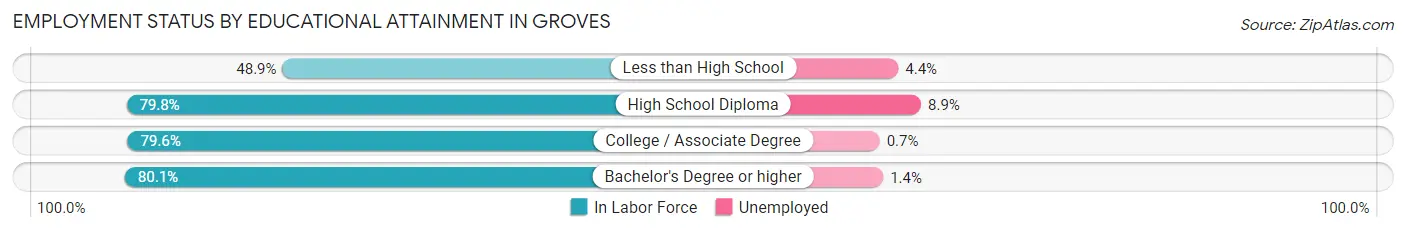
| Educational Attainment | In Labor Force | Unemployed |
| Less than High School | 643 (48.9%) | 58 (4.4%) |
| High School Diploma | 2,088 (79.8%) | 233 (8.9%) |
| College / Associate Degree | 3,053 (79.6%) | 27 (0.7%) |
| Bachelor's Degree or higher | 1,008 (80.1%) | 18 (1.4%) |
| Total | 6,796 (75.3%) | 325 (3.6%) |
Employment Occupations by Sex in Groves
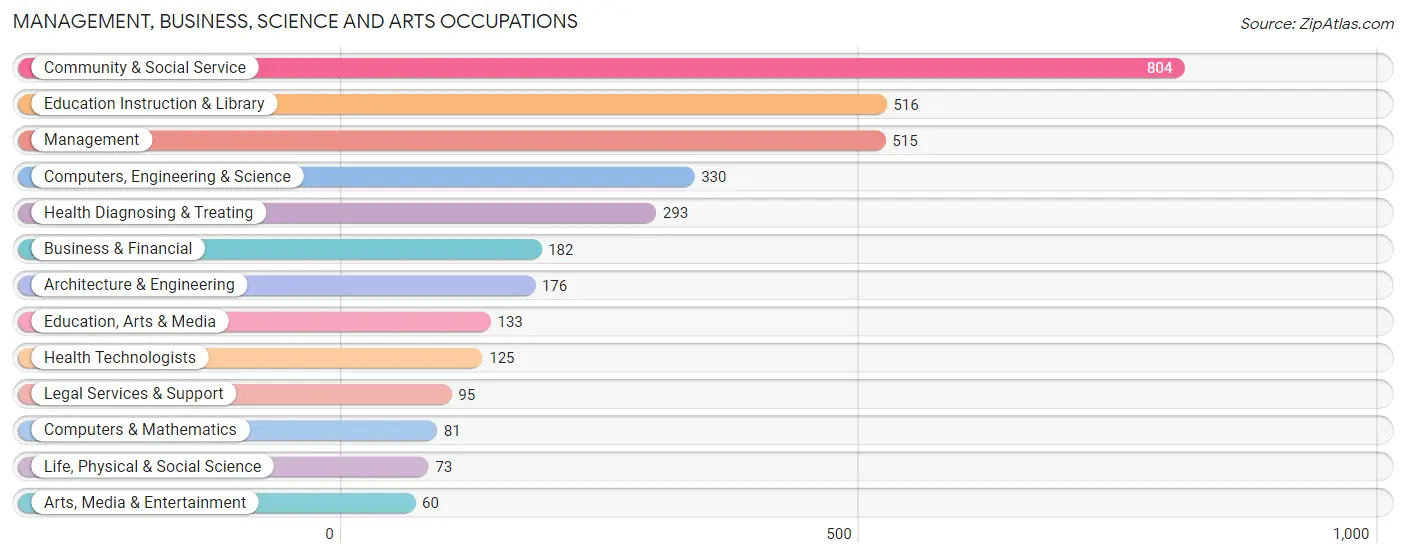
Management, Business, Science and Arts Occupations
The most common Management, Business, Science and Arts occupations in Groves are Community & Social Service (804 | 10.3%), Education Instruction & Library (516 | 6.6%), Management (515 | 6.6%), Computers, Engineering & Science (330 | 4.2%), and Health Diagnosing & Treating (293 | 3.7%).
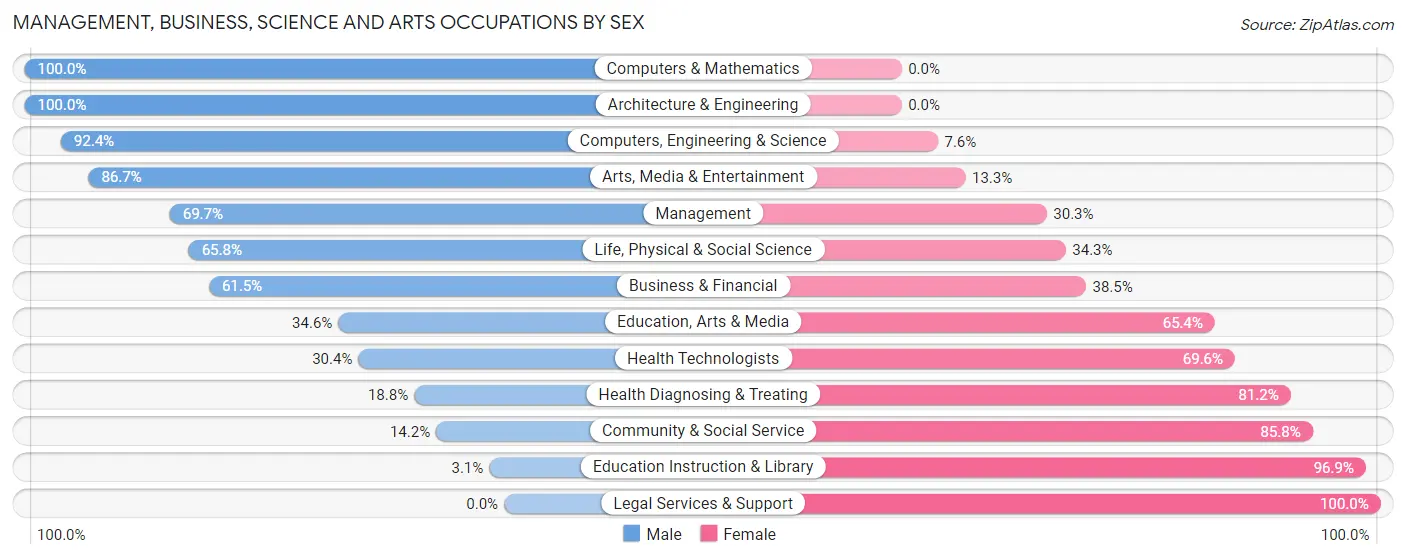
Management, Business, Science and Arts Occupations by Sex
Within the Management, Business, Science and Arts occupations in Groves, the most male-oriented occupations are Computers & Mathematics (100.0%), Architecture & Engineering (100.0%), and Computers, Engineering & Science (92.4%), while the most female-oriented occupations are Legal Services & Support (100.0%), Education Instruction & Library (96.9%), and Community & Social Service (85.8%).
| Occupation | Male | Female |
| Management | 359 (69.7%) | 156 (30.3%) |
| Business & Financial | 112 (61.5%) | 70 (38.5%) |
| Computers, Engineering & Science | 305 (92.4%) | 25 (7.6%) |
| Computers & Mathematics | 81 (100.0%) | 0 (0.0%) |
| Architecture & Engineering | 176 (100.0%) | 0 (0.0%) |
| Life, Physical & Social Science | 48 (65.7%) | 25 (34.3%) |
| Community & Social Service | 114 (14.2%) | 690 (85.8%) |
| Education, Arts & Media | 46 (34.6%) | 87 (65.4%) |
| Legal Services & Support | 0 (0.0%) | 95 (100.0%) |
| Education Instruction & Library | 16 (3.1%) | 500 (96.9%) |
| Arts, Media & Entertainment | 52 (86.7%) | 8 (13.3%) |
| Health Diagnosing & Treating | 55 (18.8%) | 238 (81.2%) |
| Health Technologists | 38 (30.4%) | 87 (69.6%) |
| Total (Category) | 945 (44.5%) | 1,179 (55.5%) |
| Total (Overall) | 4,291 (54.9%) | 3,530 (45.1%) |
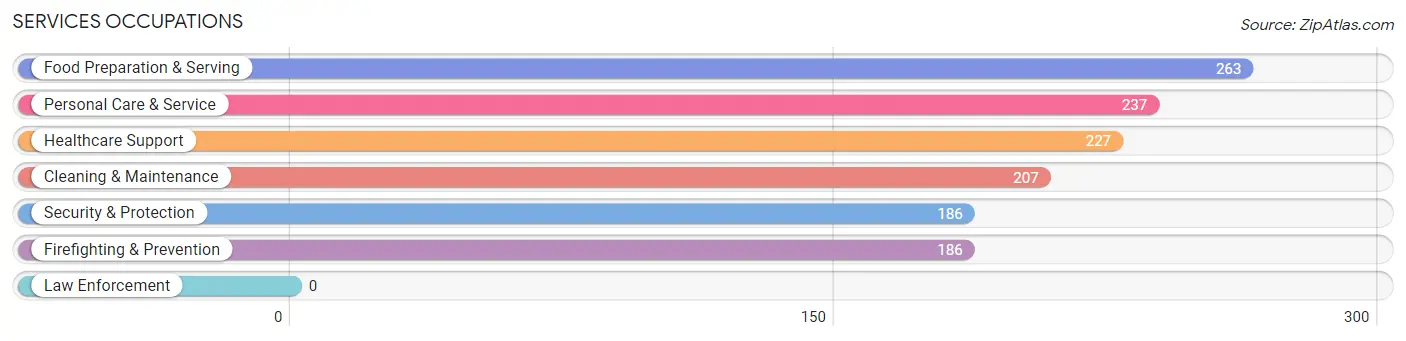
Services Occupations
The most common Services occupations in Groves are Food Preparation & Serving (263 | 3.4%), Personal Care & Service (237 | 3.0%), Healthcare Support (227 | 2.9%), Cleaning & Maintenance (207 | 2.6%), and Security & Protection (186 | 2.4%).
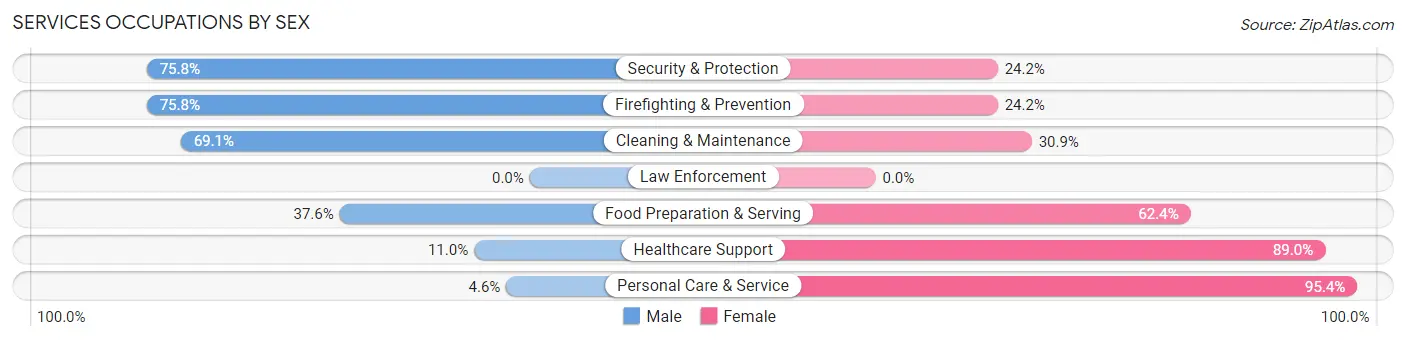
Services Occupations by Sex
Within the Services occupations in Groves, the most male-oriented occupations are Security & Protection (75.8%), Firefighting & Prevention (75.8%), and Cleaning & Maintenance (69.1%), while the most female-oriented occupations are Personal Care & Service (95.4%), Healthcare Support (89.0%), and Food Preparation & Serving (62.4%).
| Occupation | Male | Female |
| Healthcare Support | 25 (11.0%) | 202 (89.0%) |
| Security & Protection | 141 (75.8%) | 45 (24.2%) |
| Firefighting & Prevention | 141 (75.8%) | 45 (24.2%) |
| Law Enforcement | 0 (0.0%) | 0 (0.0%) |
| Food Preparation & Serving | 99 (37.6%) | 164 (62.4%) |
| Cleaning & Maintenance | 143 (69.1%) | 64 (30.9%) |
| Personal Care & Service | 11 (4.6%) | 226 (95.4%) |
| Total (Category) | 419 (37.4%) | 701 (62.6%) |
| Total (Overall) | 4,291 (54.9%) | 3,530 (45.1%) |
Sales and Office Occupations
The most common Sales and Office occupations in Groves are Sales & Related (1,121 | 14.3%), and Office & Administration (940 | 12.0%).
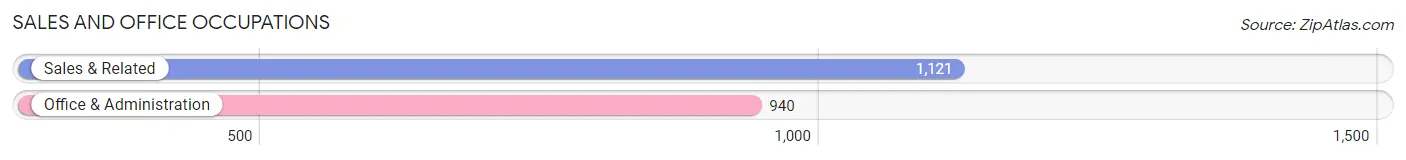
Sales and Office Occupations by Sex
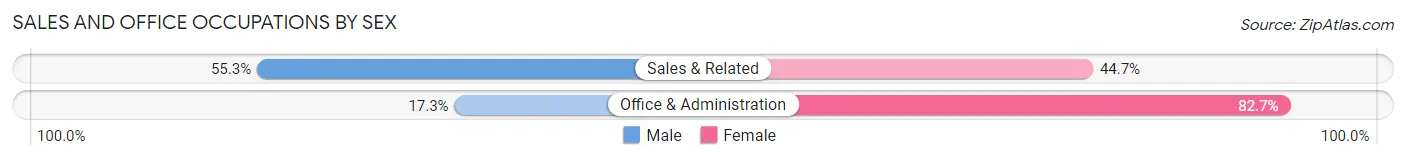
| Occupation | Male | Female |
| Sales & Related | 620 (55.3%) | 501 (44.7%) |
| Office & Administration | 163 (17.3%) | 777 (82.7%) |
| Total (Category) | 783 (38.0%) | 1,278 (62.0%) |
| Total (Overall) | 4,291 (54.9%) | 3,530 (45.1%) |
Natural Resources, Construction and Maintenance Occupations
The most common Natural Resources, Construction and Maintenance occupations in Groves are Construction & Extraction (999 | 12.8%), Installation, Maintenance & Repair (332 | 4.2%), and Farming, Fishing & Forestry (29 | 0.4%).
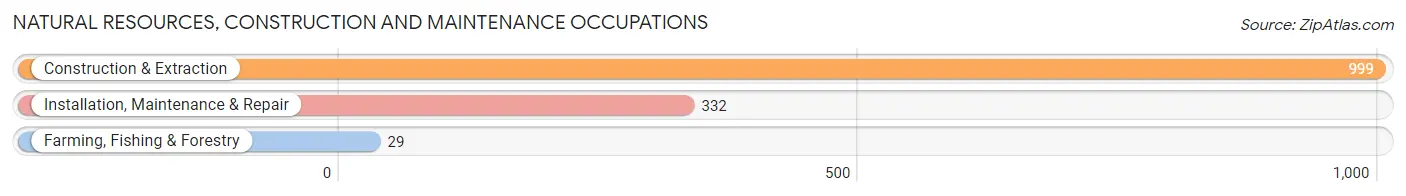
Natural Resources, Construction and Maintenance Occupations by Sex
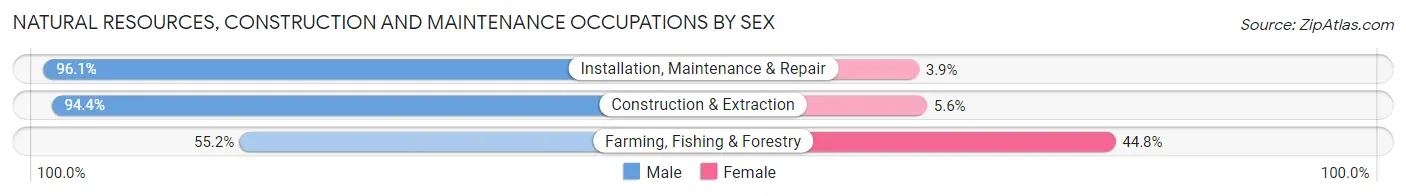
| Occupation | Male | Female |
| Farming, Fishing & Forestry | 16 (55.2%) | 13 (44.8%) |
| Construction & Extraction | 943 (94.4%) | 56 (5.6%) |
| Installation, Maintenance & Repair | 319 (96.1%) | 13 (3.9%) |
| Total (Category) | 1,278 (94.0%) | 82 (6.0%) |
| Total (Overall) | 4,291 (54.9%) | 3,530 (45.1%) |
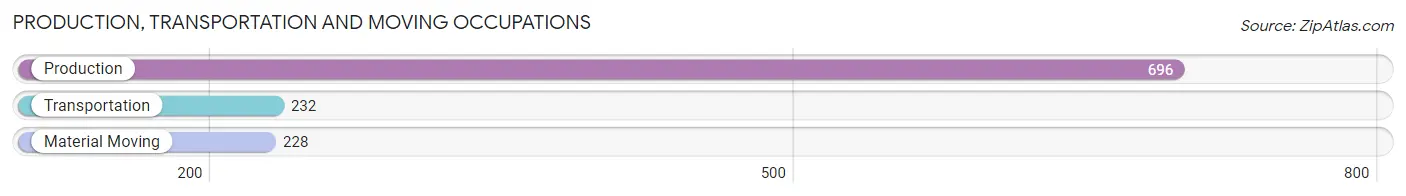
Production, Transportation and Moving Occupations
The most common Production, Transportation and Moving occupations in Groves are Production (696 | 8.9%), Transportation (232 | 3.0%), and Material Moving (228 | 2.9%).
Production, Transportation and Moving Occupations by Sex
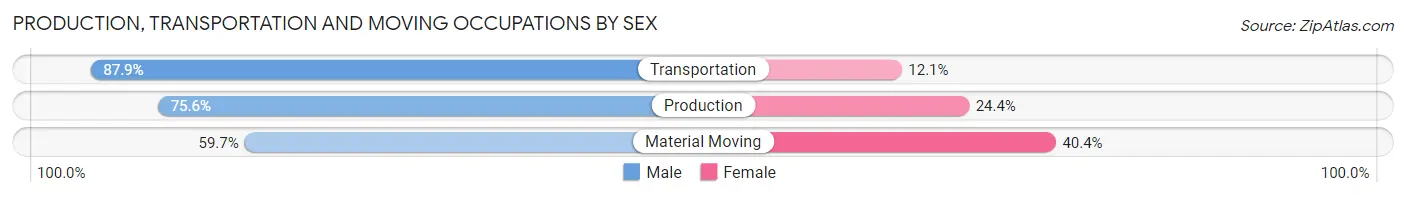
| Occupation | Male | Female |
| Production | 526 (75.6%) | 170 (24.4%) |
| Transportation | 204 (87.9%) | 28 (12.1%) |
| Material Moving | 136 (59.7%) | 92 (40.4%) |
| Total (Category) | 866 (74.9%) | 290 (25.1%) |
| Total (Overall) | 4,291 (54.9%) | 3,530 (45.1%) |
Employment Industries by Sex in Groves
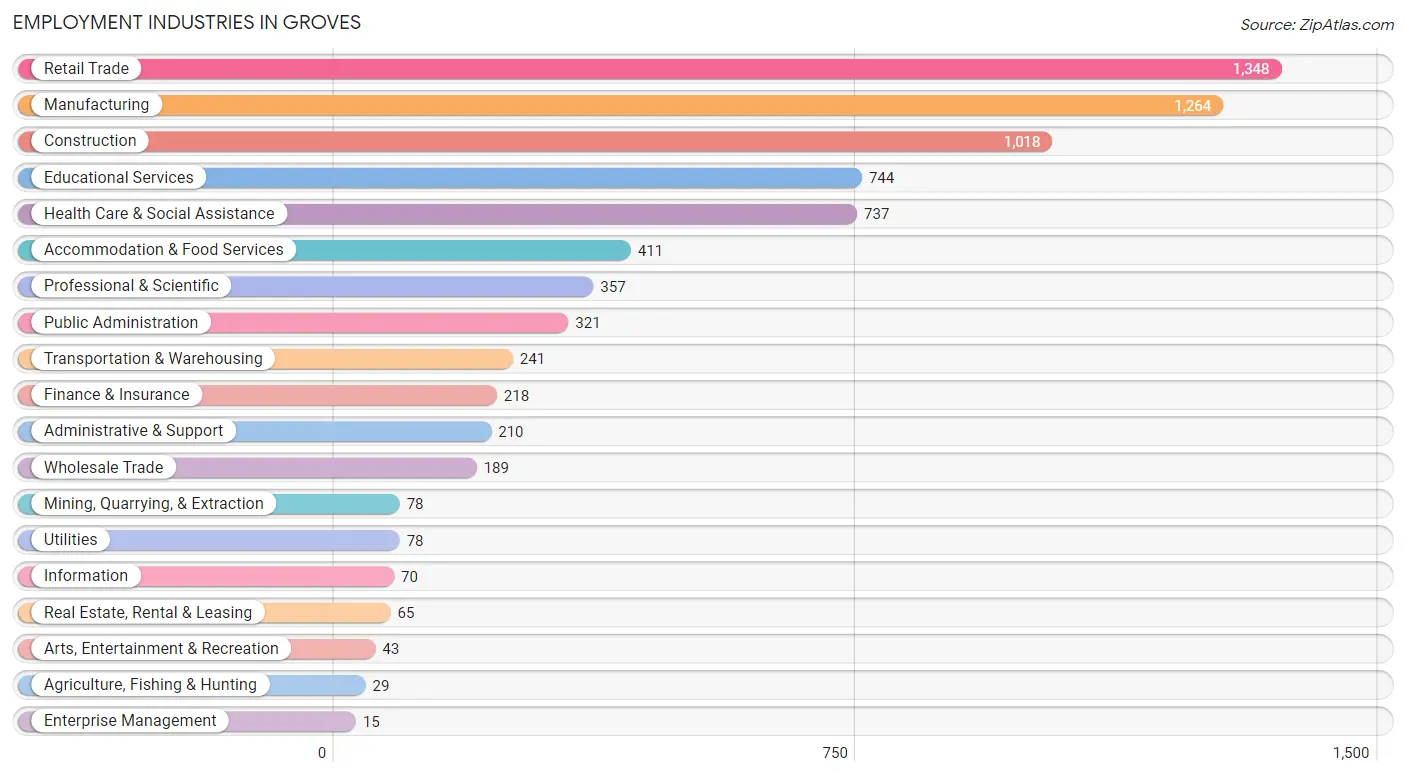
Employment Industries in Groves
The major employment industries in Groves include Retail Trade (1,348 | 17.2%), Manufacturing (1,264 | 16.2%), Construction (1,018 | 13.0%), Educational Services (744 | 9.5%), and Health Care & Social Assistance (737 | 9.4%).
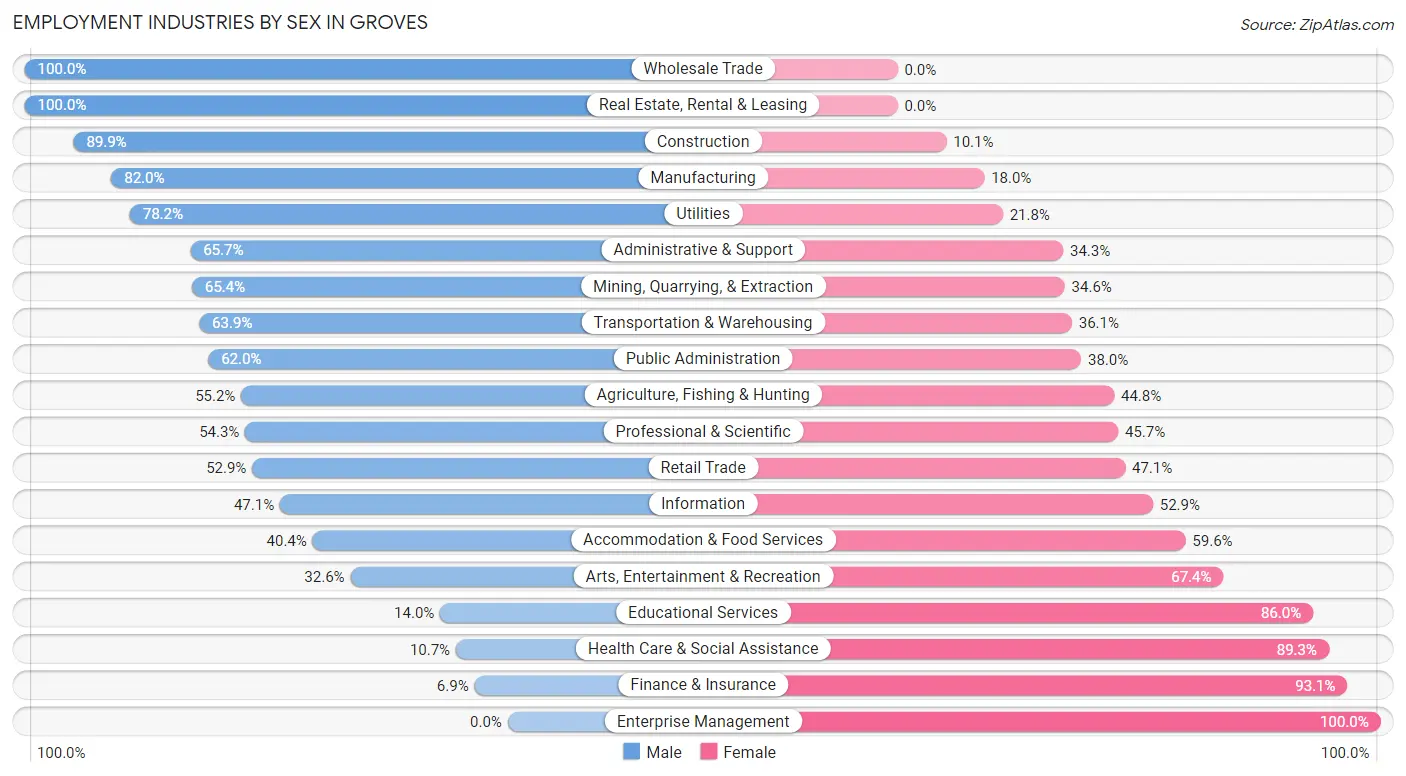
Employment Industries by Sex in Groves
The Groves industries that see more men than women are Wholesale Trade (100.0%), Real Estate, Rental & Leasing (100.0%), and Construction (89.9%), whereas the industries that tend to have a higher number of women are Enterprise Management (100.0%), Finance & Insurance (93.1%), and Health Care & Social Assistance (89.3%).
| Industry | Male | Female |
| Agriculture, Fishing & Hunting | 16 (55.2%) | 13 (44.8%) |
| Mining, Quarrying, & Extraction | 51 (65.4%) | 27 (34.6%) |
| Construction | 915 (89.9%) | 103 (10.1%) |
| Manufacturing | 1,037 (82.0%) | 227 (18.0%) |
| Wholesale Trade | 189 (100.0%) | 0 (0.0%) |
| Retail Trade | 713 (52.9%) | 635 (47.1%) |
| Transportation & Warehousing | 154 (63.9%) | 87 (36.1%) |
| Utilities | 61 (78.2%) | 17 (21.8%) |
| Information | 33 (47.1%) | 37 (52.9%) |
| Finance & Insurance | 15 (6.9%) | 203 (93.1%) |
| Real Estate, Rental & Leasing | 65 (100.0%) | 0 (0.0%) |
| Professional & Scientific | 194 (54.3%) | 163 (45.7%) |
| Enterprise Management | 0 (0.0%) | 15 (100.0%) |
| Administrative & Support | 138 (65.7%) | 72 (34.3%) |
| Educational Services | 104 (14.0%) | 640 (86.0%) |
| Health Care & Social Assistance | 79 (10.7%) | 658 (89.3%) |
| Arts, Entertainment & Recreation | 14 (32.6%) | 29 (67.4%) |
| Accommodation & Food Services | 166 (40.4%) | 245 (59.6%) |
| Public Administration | 199 (62.0%) | 122 (38.0%) |
| Total | 4,291 (54.9%) | 3,530 (45.1%) |
Education in Groves
School Enrollment in Groves
The most common levels of schooling among the 3,304 students in Groves are elementary school (960 | 29.1%), high school (747 | 22.6%), and college / undergraduate (512 | 15.5%).
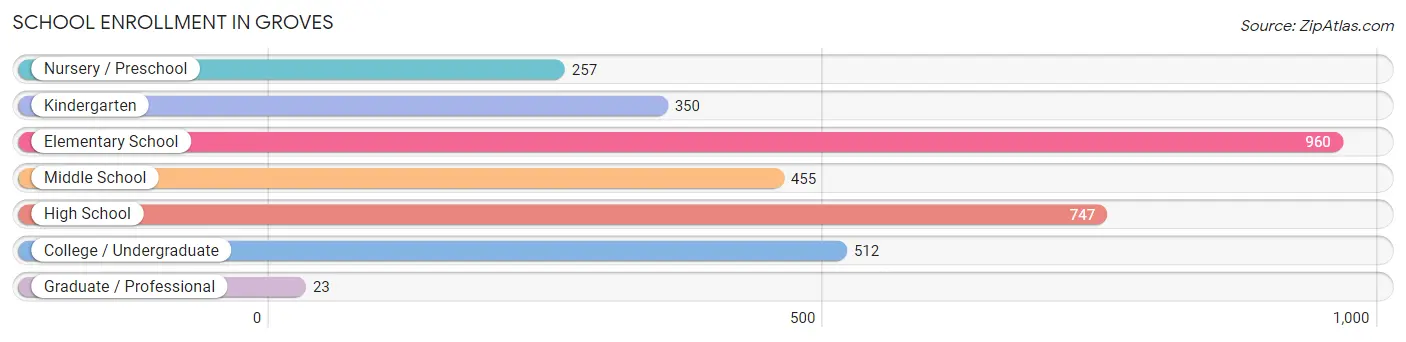
| School Level | # Students | % Students |
| Nursery / Preschool | 257 | 7.8% |
| Kindergarten | 350 | 10.6% |
| Elementary School | 960 | 29.1% |
| Middle School | 455 | 13.8% |
| High School | 747 | 22.6% |
| College / Undergraduate | 512 | 15.5% |
| Graduate / Professional | 23 | 0.7% |
| Total | 3,304 | 100.0% |
School Enrollment by Age by Funding Source in Groves
Out of a total of 3,304 students who are enrolled in schools in Groves, 155 (4.7%) attend a private institution, while the remaining 3,149 (95.3%) are enrolled in public schools. The age group of 3 to 4 year olds has the highest likelihood of being enrolled in private schools, with 42 (21.6% in the age bracket) enrolled. Conversely, the age group of 5 to 9 year old has the lowest likelihood of being enrolled in a private school, with 1,078 (100.0% in the age bracket) attending a public institution.
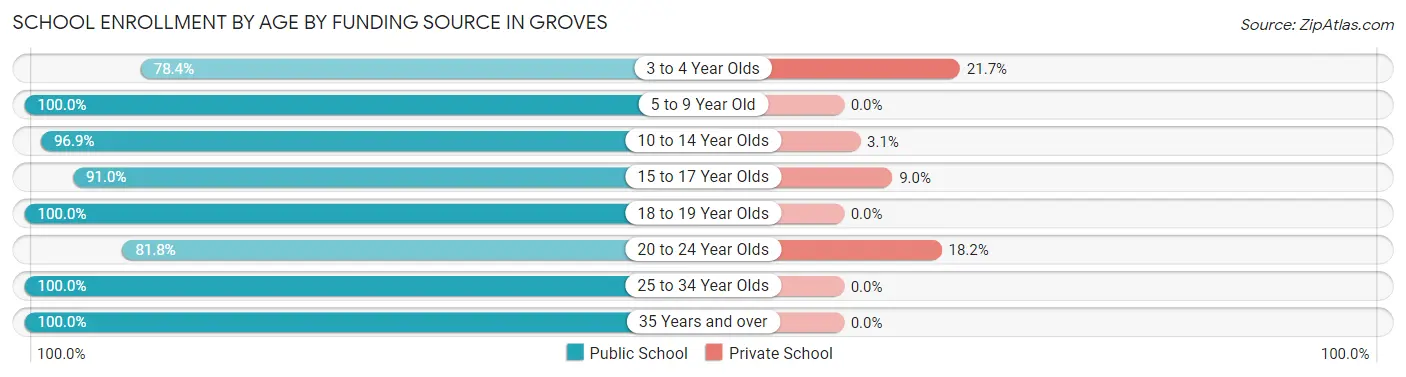
| Age Bracket | Public School | Private School |
| 3 to 4 Year Olds | 152 (78.3%) | 42 (21.6%) |
| 5 to 9 Year Old | 1,078 (100.0%) | 0 (0.0%) |
| 10 to 14 Year Olds | 919 (96.9%) | 29 (3.1%) |
| 15 to 17 Year Olds | 473 (91.0%) | 47 (9.0%) |
| 18 to 19 Year Olds | 184 (100.0%) | 0 (0.0%) |
| 20 to 24 Year Olds | 166 (81.8%) | 37 (18.2%) |
| 25 to 34 Year Olds | 69 (100.0%) | 0 (0.0%) |
| 35 Years and over | 108 (100.0%) | 0 (0.0%) |
| Total | 3,149 (95.3%) | 155 (4.7%) |
Educational Attainment by Field of Study in Groves
Business (401 | 23.8%), education (347 | 20.6%), science & technology (244 | 14.4%), liberal arts & history (134 | 7.9%), and engineering (116 | 6.9%) are the most common fields of study among 1,688 individuals in Groves who have obtained a bachelor's degree or higher.
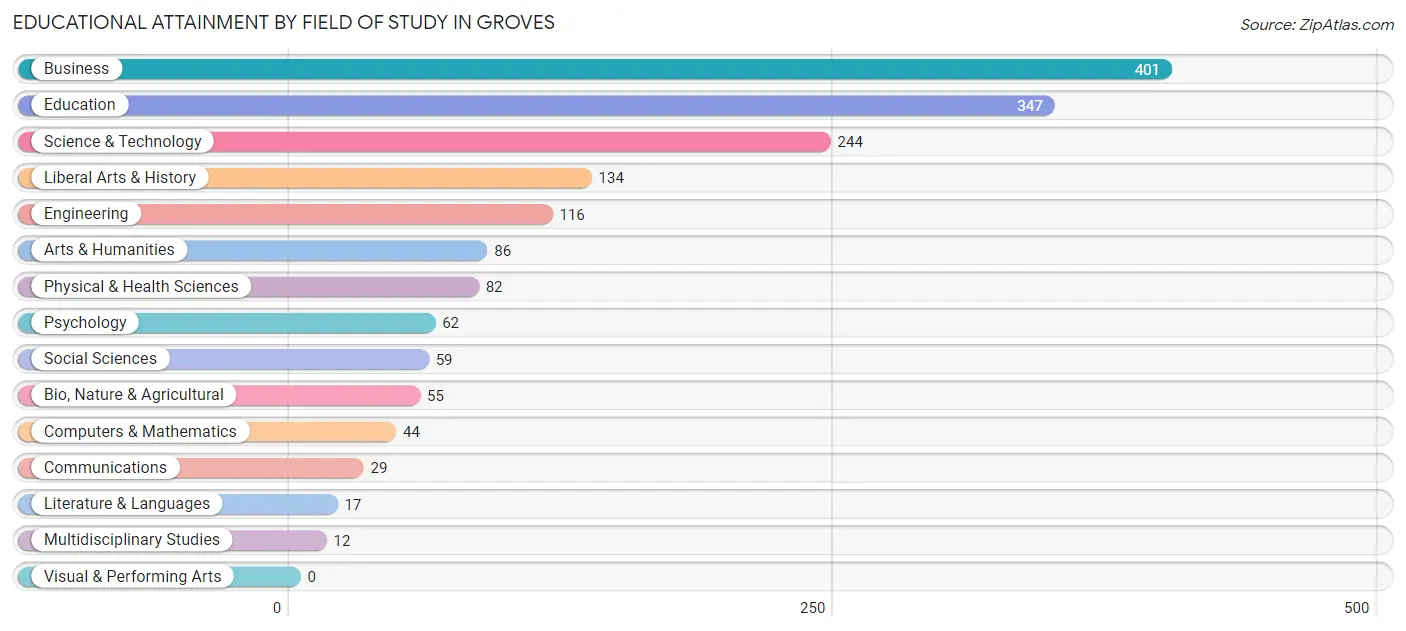
| Field of Study | # Graduates | % Graduates |
| Computers & Mathematics | 44 | 2.6% |
| Bio, Nature & Agricultural | 55 | 3.3% |
| Physical & Health Sciences | 82 | 4.9% |
| Psychology | 62 | 3.7% |
| Social Sciences | 59 | 3.5% |
| Engineering | 116 | 6.9% |
| Multidisciplinary Studies | 12 | 0.7% |
| Science & Technology | 244 | 14.4% |
| Business | 401 | 23.8% |
| Education | 347 | 20.6% |
| Literature & Languages | 17 | 1.0% |
| Liberal Arts & History | 134 | 7.9% |
| Visual & Performing Arts | 0 | 0.0% |
| Communications | 29 | 1.7% |
| Arts & Humanities | 86 | 5.1% |
| Total | 1,688 | 100.0% |
Transportation & Commute in Groves
Vehicle Availability by Sex in Groves
The most prevalent vehicle ownership categories in Groves are males with 2 vehicles (2,299, accounting for 53.7%) and females with 2 vehicles (1,830, making up 65.7%).
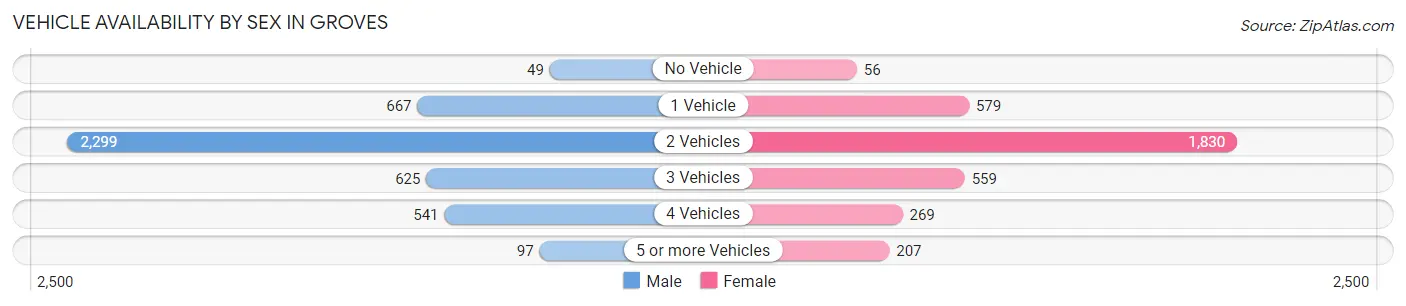
| Vehicles Available | Male | Female |
| No Vehicle | 49 (1.1%) | 56 (1.6%) |
| 1 Vehicle | 667 (15.6%) | 579 (16.5%) |
| 2 Vehicles | 2,299 (53.7%) | 1,830 (52.3%) |
| 3 Vehicles | 625 (14.6%) | 559 (16.0%) |
| 4 Vehicles | 541 (12.7%) | 269 (7.7%) |
| 5 or more Vehicles | 97 (2.3%) | 207 (5.9%) |
| Total | 4,278 (100.0%) | 3,500 (100.0%) |
Commute Time in Groves
The most frequently occuring commute durations in Groves are 10 to 14 minutes (1,582 commuters, 20.7%), 15 to 19 minutes (1,188 commuters, 15.6%), and 5 to 9 minutes (1,068 commuters, 14.0%).
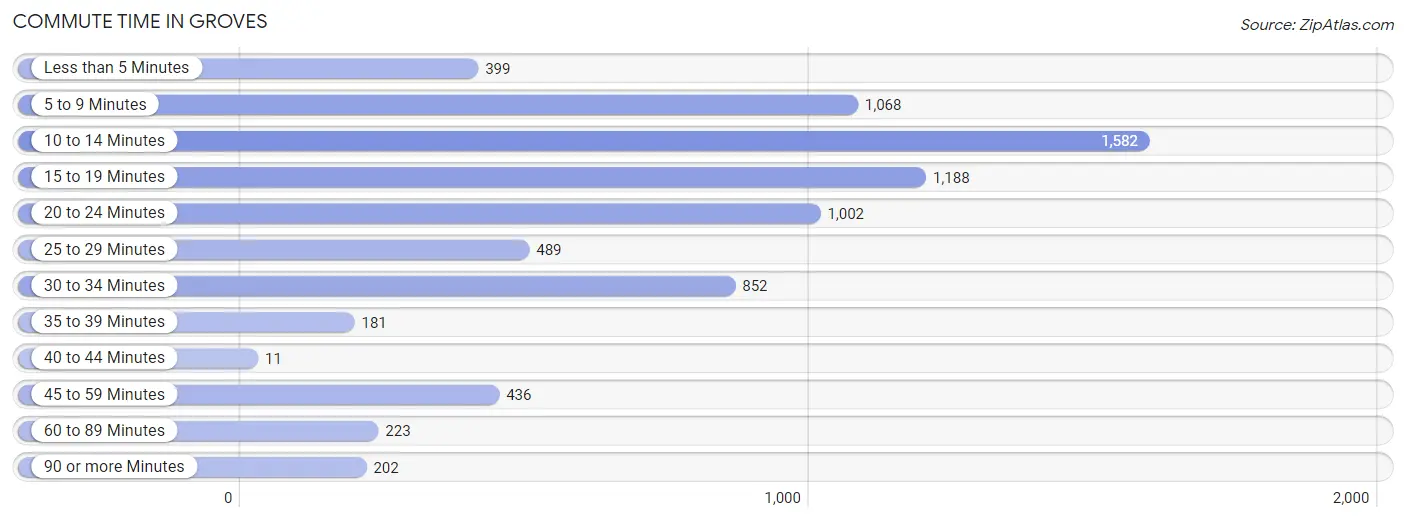
| Commute Time | # Commuters | % Commuters |
| Less than 5 Minutes | 399 | 5.2% |
| 5 to 9 Minutes | 1,068 | 14.0% |
| 10 to 14 Minutes | 1,582 | 20.7% |
| 15 to 19 Minutes | 1,188 | 15.6% |
| 20 to 24 Minutes | 1,002 | 13.1% |
| 25 to 29 Minutes | 489 | 6.4% |
| 30 to 34 Minutes | 852 | 11.2% |
| 35 to 39 Minutes | 181 | 2.4% |
| 40 to 44 Minutes | 11 | 0.1% |
| 45 to 59 Minutes | 436 | 5.7% |
| 60 to 89 Minutes | 223 | 2.9% |
| 90 or more Minutes | 202 | 2.6% |
Commute Time by Sex in Groves
The most common commute times in Groves are 10 to 14 minutes (762 commuters, 18.1%) for males and 10 to 14 minutes (820 commuters, 23.9%) for females.
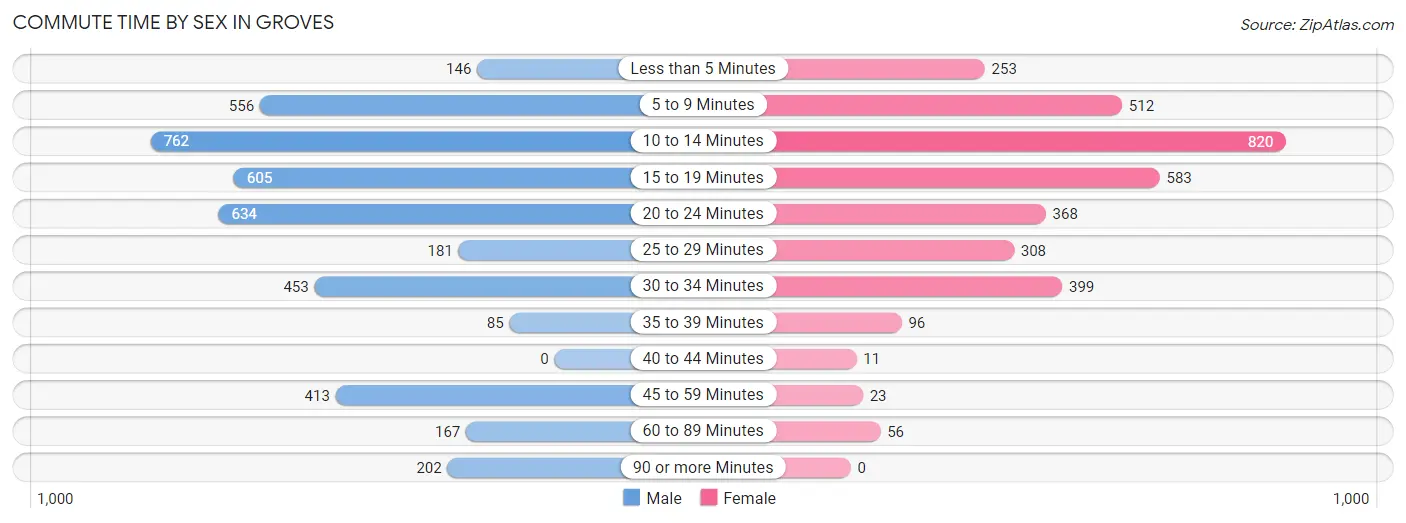
| Commute Time | Male | Female |
| Less than 5 Minutes | 146 (3.5%) | 253 (7.4%) |
| 5 to 9 Minutes | 556 (13.2%) | 512 (14.9%) |
| 10 to 14 Minutes | 762 (18.1%) | 820 (23.9%) |
| 15 to 19 Minutes | 605 (14.4%) | 583 (17.0%) |
| 20 to 24 Minutes | 634 (15.1%) | 368 (10.7%) |
| 25 to 29 Minutes | 181 (4.3%) | 308 (9.0%) |
| 30 to 34 Minutes | 453 (10.8%) | 399 (11.6%) |
| 35 to 39 Minutes | 85 (2.0%) | 96 (2.8%) |
| 40 to 44 Minutes | 0 (0.0%) | 11 (0.3%) |
| 45 to 59 Minutes | 413 (9.8%) | 23 (0.7%) |
| 60 to 89 Minutes | 167 (4.0%) | 56 (1.6%) |
| 90 or more Minutes | 202 (4.8%) | 0 (0.0%) |
Time of Departure to Work by Sex in Groves
The most frequent times of departure to work in Groves are 12:00 AM to 4:59 AM (764, 18.2%) for males and 7:30 AM to 7:59 AM (876, 25.6%) for females.
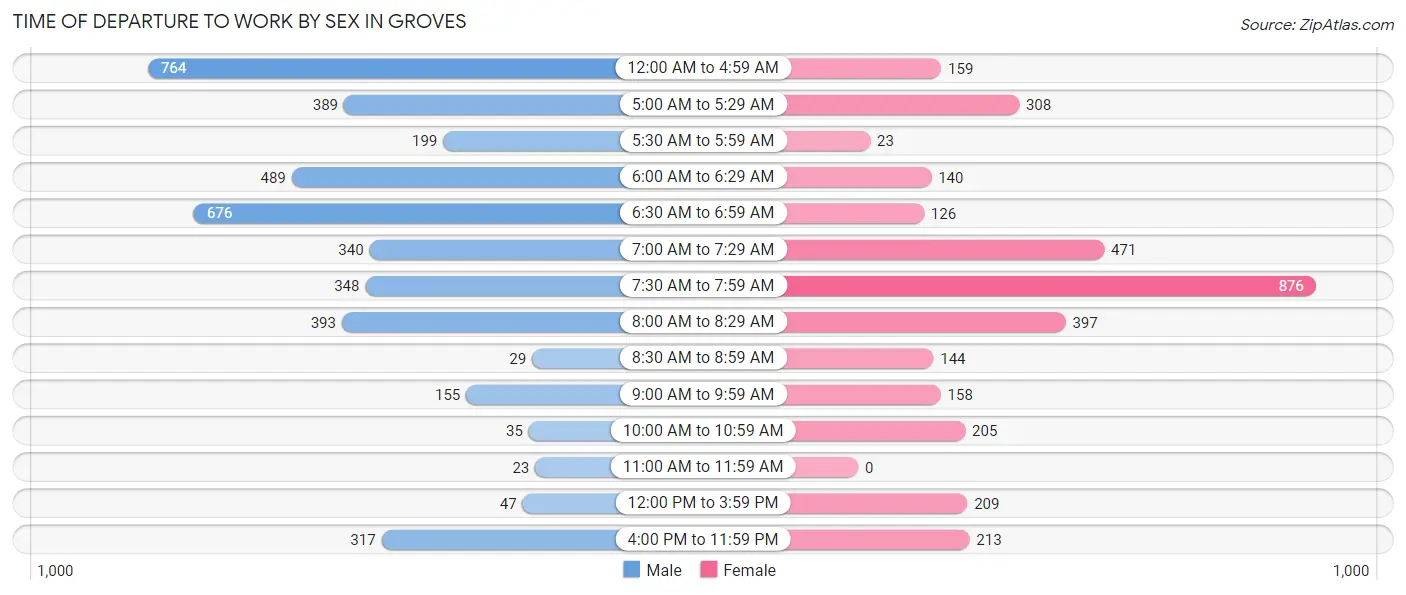
| Time of Departure | Male | Female |
| 12:00 AM to 4:59 AM | 764 (18.2%) | 159 (4.6%) |
| 5:00 AM to 5:29 AM | 389 (9.2%) | 308 (9.0%) |
| 5:30 AM to 5:59 AM | 199 (4.7%) | 23 (0.7%) |
| 6:00 AM to 6:29 AM | 489 (11.6%) | 140 (4.1%) |
| 6:30 AM to 6:59 AM | 676 (16.1%) | 126 (3.7%) |
| 7:00 AM to 7:29 AM | 340 (8.1%) | 471 (13.7%) |
| 7:30 AM to 7:59 AM | 348 (8.3%) | 876 (25.6%) |
| 8:00 AM to 8:29 AM | 393 (9.3%) | 397 (11.6%) |
| 8:30 AM to 8:59 AM | 29 (0.7%) | 144 (4.2%) |
| 9:00 AM to 9:59 AM | 155 (3.7%) | 158 (4.6%) |
| 10:00 AM to 10:59 AM | 35 (0.8%) | 205 (6.0%) |
| 11:00 AM to 11:59 AM | 23 (0.5%) | 0 (0.0%) |
| 12:00 PM to 3:59 PM | 47 (1.1%) | 209 (6.1%) |
| 4:00 PM to 11:59 PM | 317 (7.5%) | 213 (6.2%) |
| Total | 4,204 (100.0%) | 3,429 (100.0%) |
Housing Occupancy in Groves
Occupancy by Ownership in Groves
Of the total 6,034 dwellings in Groves, owner-occupied units account for 4,453 (73.8%), while renter-occupied units make up 1,581 (26.2%).
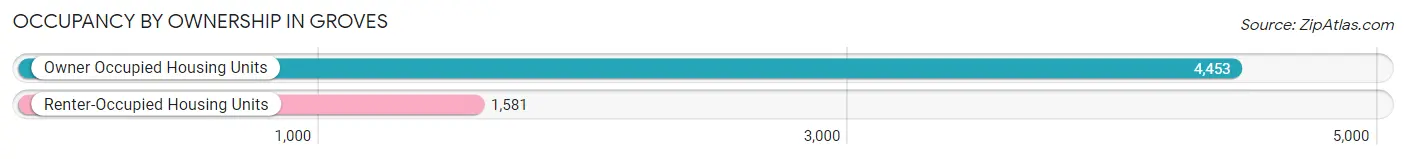
| Occupancy | # Housing Units | % Housing Units |
| Owner Occupied Housing Units | 4,453 | 73.8% |
| Renter-Occupied Housing Units | 1,581 | 26.2% |
| Total Occupied Housing Units | 6,034 | 100.0% |
Occupancy by Household Size in Groves
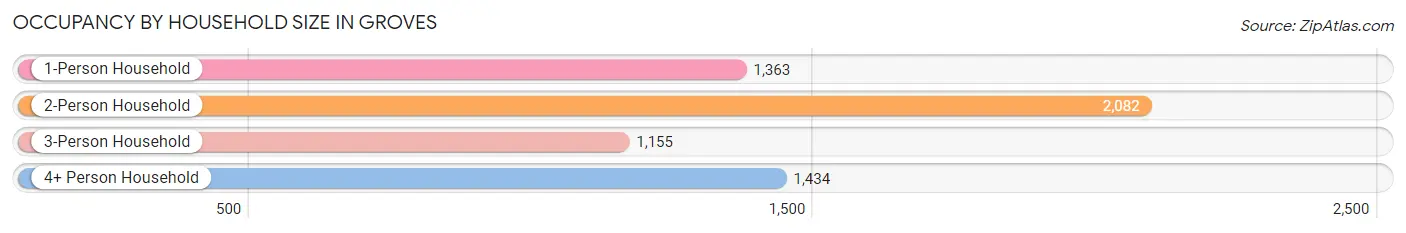
| Household Size | # Housing Units | % Housing Units |
| 1-Person Household | 1,363 | 22.6% |
| 2-Person Household | 2,082 | 34.5% |
| 3-Person Household | 1,155 | 19.1% |
| 4+ Person Household | 1,434 | 23.8% |
| Total Housing Units | 6,034 | 100.0% |
Occupancy by Ownership by Household Size in Groves
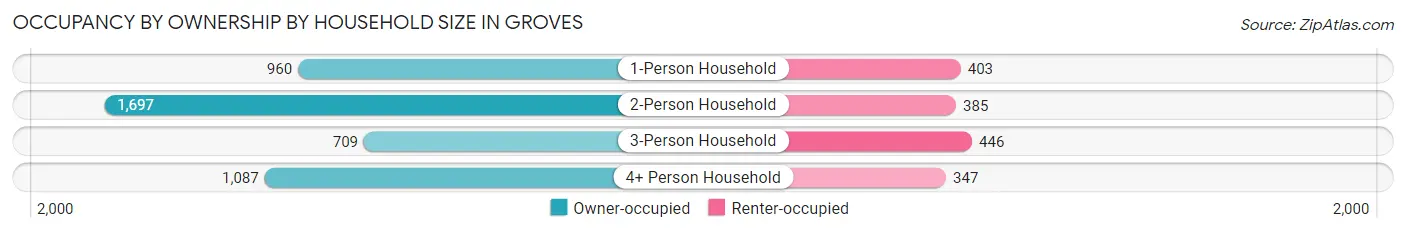
| Household Size | Owner-occupied | Renter-occupied |
| 1-Person Household | 960 (70.4%) | 403 (29.6%) |
| 2-Person Household | 1,697 (81.5%) | 385 (18.5%) |
| 3-Person Household | 709 (61.4%) | 446 (38.6%) |
| 4+ Person Household | 1,087 (75.8%) | 347 (24.2%) |
| Total Housing Units | 4,453 (73.8%) | 1,581 (26.2%) |
Occupancy by Educational Attainment in Groves
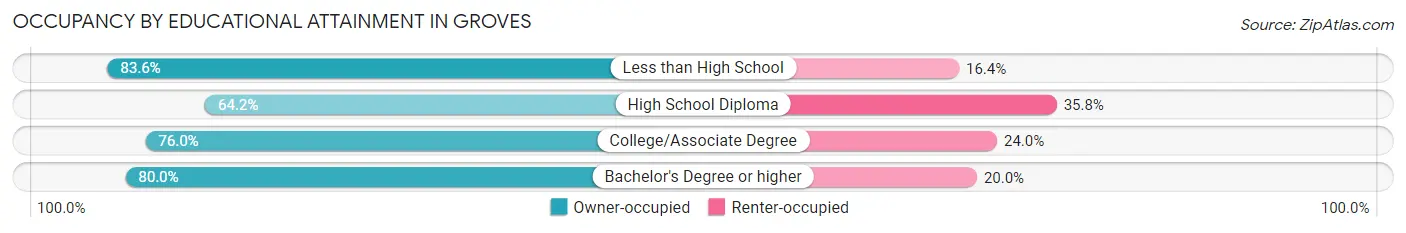
| Household Size | Owner-occupied | Renter-occupied |
| Less than High School | 468 (83.6%) | 92 (16.4%) |
| High School Diploma | 1,177 (64.2%) | 656 (35.8%) |
| College/Associate Degree | 2,015 (76.0%) | 635 (24.0%) |
| Bachelor's Degree or higher | 793 (80.0%) | 198 (20.0%) |
Occupancy by Age of Householder in Groves
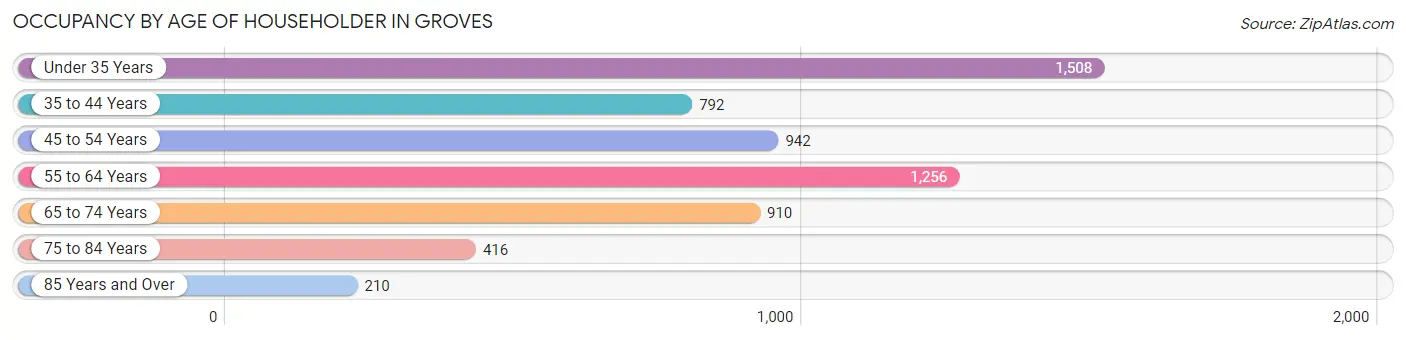
| Age Bracket | # Households | % Households |
| Under 35 Years | 1,508 | 25.0% |
| 35 to 44 Years | 792 | 13.1% |
| 45 to 54 Years | 942 | 15.6% |
| 55 to 64 Years | 1,256 | 20.8% |
| 65 to 74 Years | 910 | 15.1% |
| 75 to 84 Years | 416 | 6.9% |
| 85 Years and Over | 210 | 3.5% |
| Total | 6,034 | 100.0% |
Housing Finances in Groves
Median Income by Occupancy in Groves
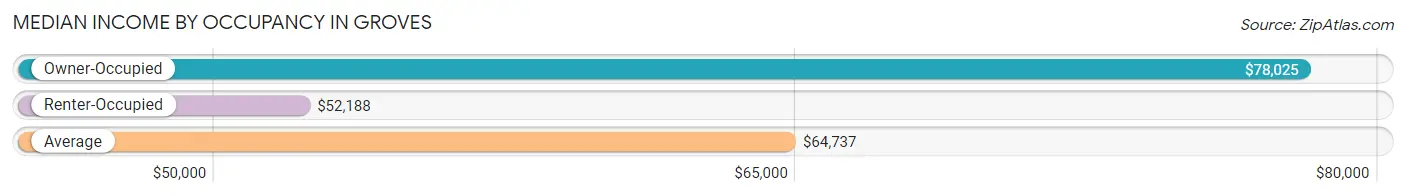
| Occupancy Type | # Households | Median Income |
| Owner-Occupied | 4,453 (73.8%) | $78,025 |
| Renter-Occupied | 1,581 (26.2%) | $52,188 |
| Average | 6,034 (100.0%) | $64,737 |
Occupancy by Householder Income Bracket in Groves
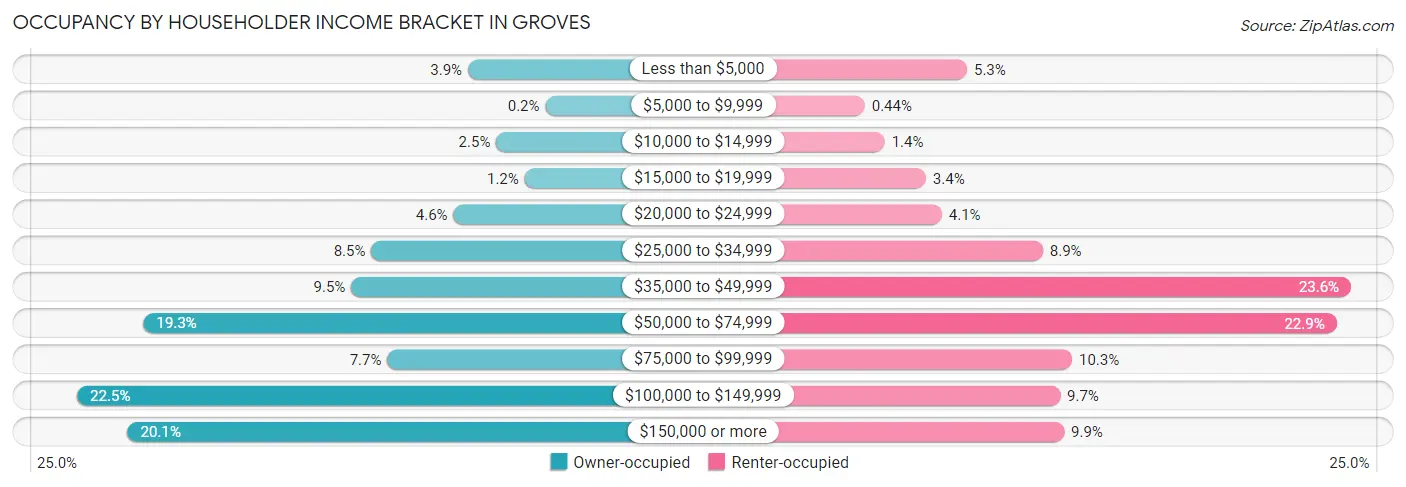
| Income Bracket | Owner-occupied | Renter-occupied |
| Less than $5,000 | 173 (3.9%) | 84 (5.3%) |
| $5,000 to $9,999 | 9 (0.2%) | 7 (0.4%) |
| $10,000 to $14,999 | 113 (2.5%) | 22 (1.4%) |
| $15,000 to $19,999 | 53 (1.2%) | 53 (3.4%) |
| $20,000 to $24,999 | 204 (4.6%) | 65 (4.1%) |
| $25,000 to $34,999 | 378 (8.5%) | 141 (8.9%) |
| $35,000 to $49,999 | 421 (9.5%) | 373 (23.6%) |
| $50,000 to $74,999 | 861 (19.3%) | 362 (22.9%) |
| $75,000 to $99,999 | 344 (7.7%) | 163 (10.3%) |
| $100,000 to $149,999 | 1,002 (22.5%) | 154 (9.7%) |
| $150,000 or more | 895 (20.1%) | 157 (9.9%) |
| Total | 4,453 (100.0%) | 1,581 (100.0%) |
Monthly Housing Cost Tiers in Groves
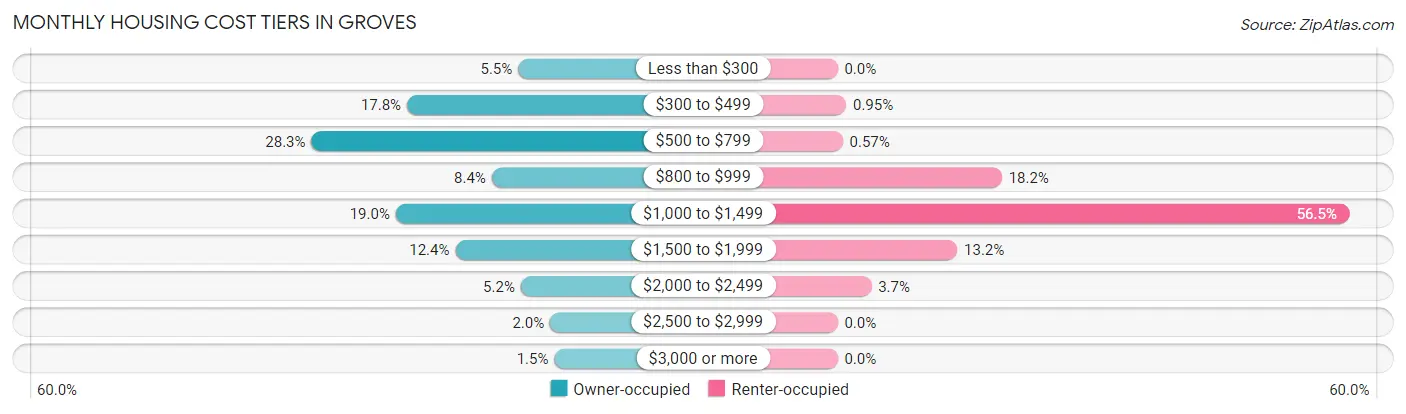
| Monthly Cost | Owner-occupied | Renter-occupied |
| Less than $300 | 244 (5.5%) | 0 (0.0%) |
| $300 to $499 | 791 (17.8%) | 15 (0.9%) |
| $500 to $799 | 1,261 (28.3%) | 9 (0.6%) |
| $800 to $999 | 374 (8.4%) | 287 (18.1%) |
| $1,000 to $1,499 | 846 (19.0%) | 893 (56.5%) |
| $1,500 to $1,999 | 553 (12.4%) | 209 (13.2%) |
| $2,000 to $2,499 | 231 (5.2%) | 59 (3.7%) |
| $2,500 to $2,999 | 87 (1.9%) | 0 (0.0%) |
| $3,000 or more | 66 (1.5%) | 0 (0.0%) |
| Total | 4,453 (100.0%) | 1,581 (100.0%) |
Physical Housing Characteristics in Groves
Housing Structures in Groves
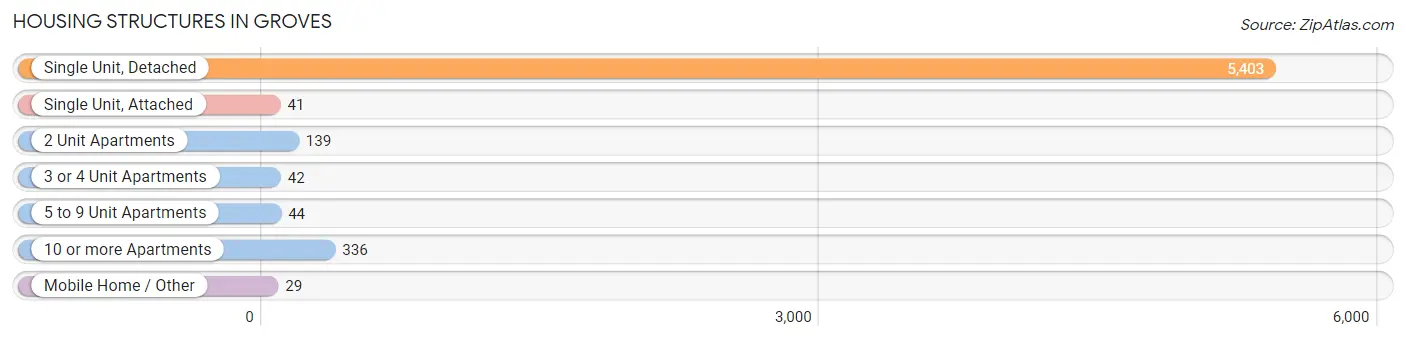
| Structure Type | # Housing Units | % Housing Units |
| Single Unit, Detached | 5,403 | 89.5% |
| Single Unit, Attached | 41 | 0.7% |
| 2 Unit Apartments | 139 | 2.3% |
| 3 or 4 Unit Apartments | 42 | 0.7% |
| 5 to 9 Unit Apartments | 44 | 0.7% |
| 10 or more Apartments | 336 | 5.6% |
| Mobile Home / Other | 29 | 0.5% |
| Total | 6,034 | 100.0% |
Housing Structures by Occupancy in Groves
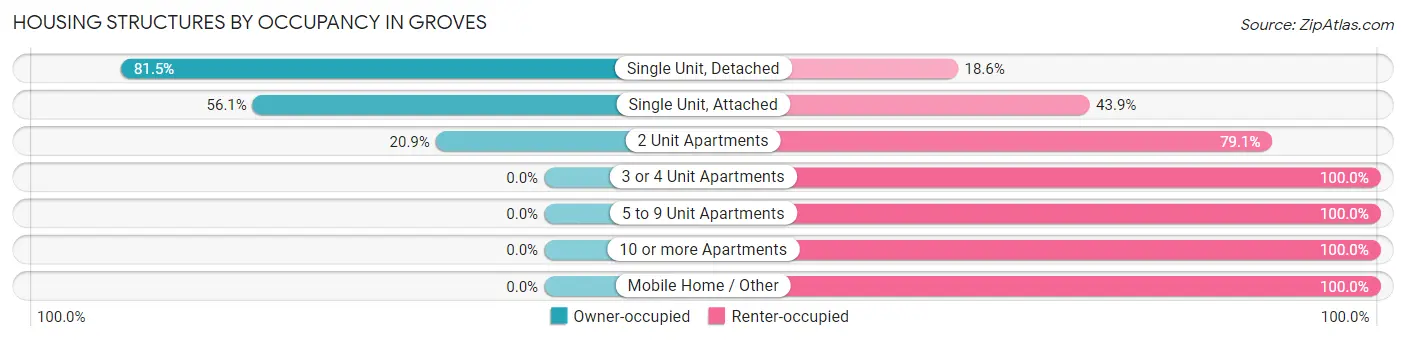
| Structure Type | Owner-occupied | Renter-occupied |
| Single Unit, Detached | 4,401 (81.5%) | 1,002 (18.5%) |
| Single Unit, Attached | 23 (56.1%) | 18 (43.9%) |
| 2 Unit Apartments | 29 (20.9%) | 110 (79.1%) |
| 3 or 4 Unit Apartments | 0 (0.0%) | 42 (100.0%) |
| 5 to 9 Unit Apartments | 0 (0.0%) | 44 (100.0%) |
| 10 or more Apartments | 0 (0.0%) | 336 (100.0%) |
| Mobile Home / Other | 0 (0.0%) | 29 (100.0%) |
| Total | 4,453 (73.8%) | 1,581 (26.2%) |
Housing Structures by Number of Rooms in Groves
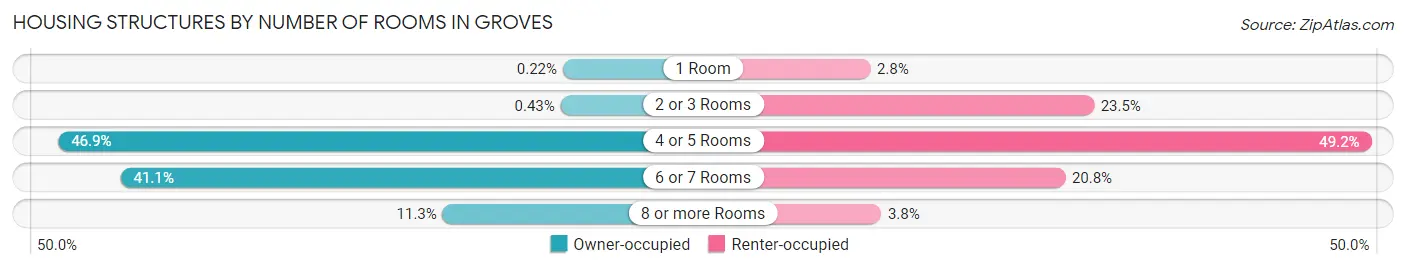
| Number of Rooms | Owner-occupied | Renter-occupied |
| 1 Room | 10 (0.2%) | 44 (2.8%) |
| 2 or 3 Rooms | 19 (0.4%) | 371 (23.5%) |
| 4 or 5 Rooms | 2,088 (46.9%) | 777 (49.1%) |
| 6 or 7 Rooms | 1,831 (41.1%) | 329 (20.8%) |
| 8 or more Rooms | 505 (11.3%) | 60 (3.8%) |
| Total | 4,453 (100.0%) | 1,581 (100.0%) |
Housing Structure by Heating Type in Groves
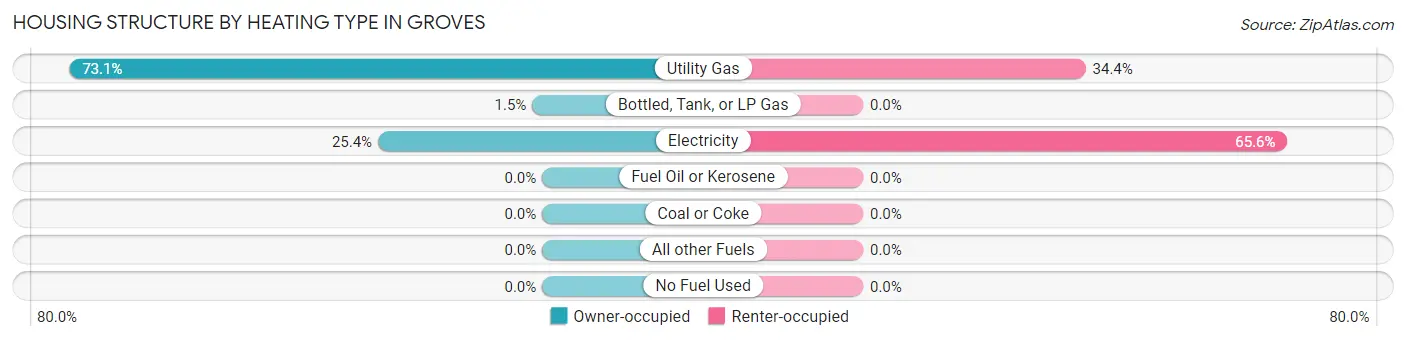
| Heating Type | Owner-occupied | Renter-occupied |
| Utility Gas | 3,255 (73.1%) | 544 (34.4%) |
| Bottled, Tank, or LP Gas | 68 (1.5%) | 0 (0.0%) |
| Electricity | 1,130 (25.4%) | 1,037 (65.6%) |
| Fuel Oil or Kerosene | 0 (0.0%) | 0 (0.0%) |
| Coal or Coke | 0 (0.0%) | 0 (0.0%) |
| All other Fuels | 0 (0.0%) | 0 (0.0%) |
| No Fuel Used | 0 (0.0%) | 0 (0.0%) |
| Total | 4,453 (100.0%) | 1,581 (100.0%) |
Household Vehicle Usage in Groves
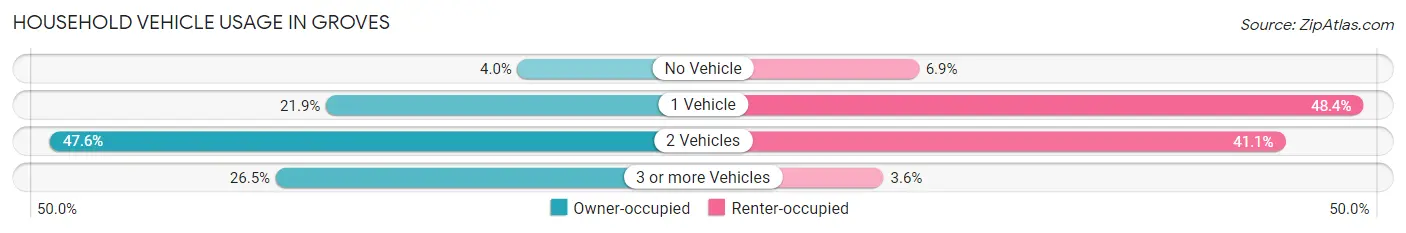
| Vehicles per Household | Owner-occupied | Renter-occupied |
| No Vehicle | 177 (4.0%) | 109 (6.9%) |
| 1 Vehicle | 973 (21.8%) | 765 (48.4%) |
| 2 Vehicles | 2,121 (47.6%) | 650 (41.1%) |
| 3 or more Vehicles | 1,182 (26.5%) | 57 (3.6%) |
| Total | 4,453 (100.0%) | 1,581 (100.0%) |
Real Estate & Mortgages in Groves
Real Estate and Mortgage Overview in Groves
| Characteristic | Without Mortgage | With Mortgage |
| Housing Units | 2,568 | 1,885 |
| Median Property Value | $130,800 | $170,100 |
| Median Household Income | $62,561 | $532 |
| Monthly Housing Costs | $547 | $53 |
| Real Estate Taxes | $2,086 | $42 |
Property Value by Mortgage Status in Groves
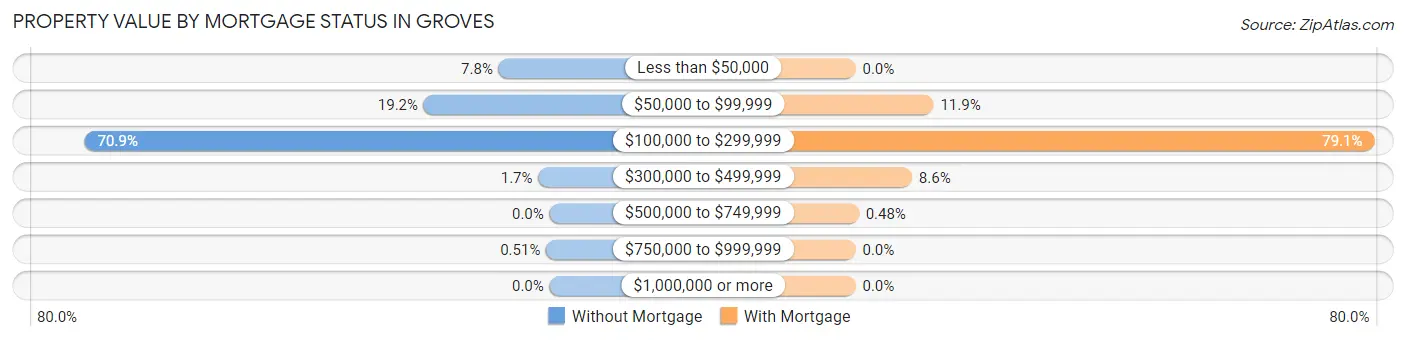
| Property Value | Without Mortgage | With Mortgage |
| Less than $50,000 | 199 (7.7%) | 0 (0.0%) |
| $50,000 to $99,999 | 492 (19.2%) | 224 (11.9%) |
| $100,000 to $299,999 | 1,820 (70.9%) | 1,490 (79.0%) |
| $300,000 to $499,999 | 44 (1.7%) | 162 (8.6%) |
| $500,000 to $749,999 | 0 (0.0%) | 9 (0.5%) |
| $750,000 to $999,999 | 13 (0.5%) | 0 (0.0%) |
| $1,000,000 or more | 0 (0.0%) | 0 (0.0%) |
| Total | 2,568 (100.0%) | 1,885 (100.0%) |
Household Income by Mortgage Status in Groves
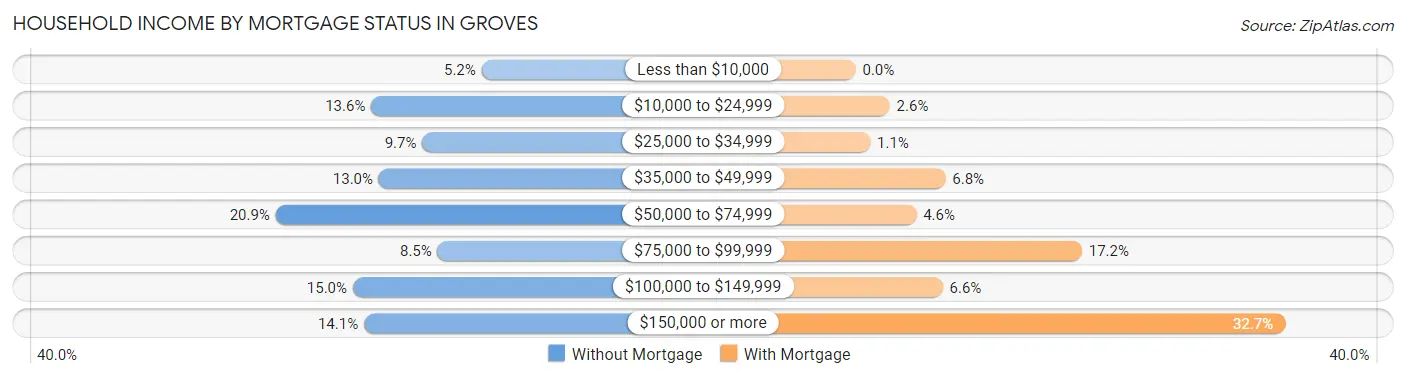
| Household Income | Without Mortgage | With Mortgage |
| Less than $10,000 | 133 (5.2%) | 0 (0.0%) |
| $10,000 to $24,999 | 349 (13.6%) | 49 (2.6%) |
| $25,000 to $34,999 | 249 (9.7%) | 21 (1.1%) |
| $35,000 to $49,999 | 334 (13.0%) | 129 (6.8%) |
| $50,000 to $74,999 | 536 (20.9%) | 87 (4.6%) |
| $75,000 to $99,999 | 219 (8.5%) | 325 (17.2%) |
| $100,000 to $149,999 | 385 (15.0%) | 125 (6.6%) |
| $150,000 or more | 363 (14.1%) | 617 (32.7%) |
| Total | 2,568 (100.0%) | 1,885 (100.0%) |
Property Value to Household Income Ratio in Groves
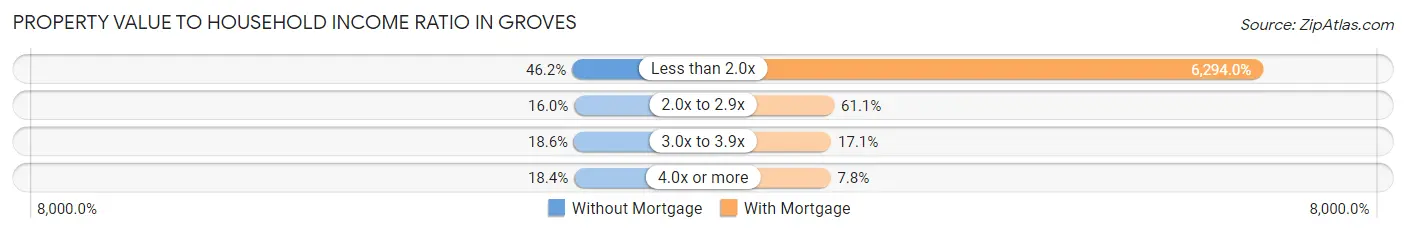
| Value-to-Income Ratio | Without Mortgage | With Mortgage |
| Less than 2.0x | 1,187 (46.2%) | 118,641 (6,294.0%) |
| 2.0x to 2.9x | 411 (16.0%) | 1,152 (61.1%) |
| 3.0x to 3.9x | 477 (18.6%) | 322 (17.1%) |
| 4.0x or more | 472 (18.4%) | 146 (7.7%) |
| Total | 2,568 (100.0%) | 1,885 (100.0%) |
Real Estate Taxes by Mortgage Status in Groves
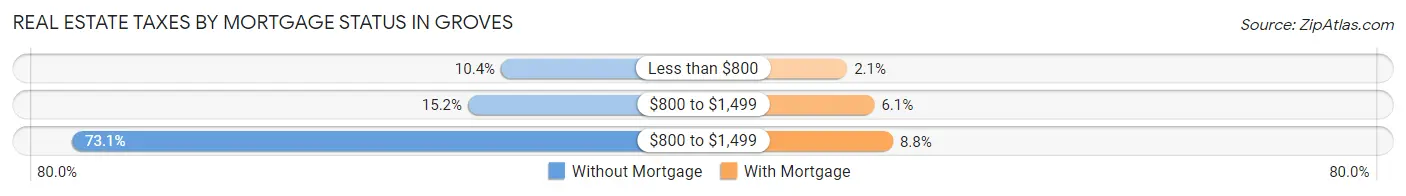
| Property Taxes | Without Mortgage | With Mortgage |
| Less than $800 | 267 (10.4%) | 39 (2.1%) |
| $800 to $1,499 | 391 (15.2%) | 114 (6.0%) |
| $800 to $1,499 | 1,876 (73.1%) | 165 (8.7%) |
| Total | 2,568 (100.0%) | 1,885 (100.0%) |
Health & Disability in Groves
Health Insurance Coverage by Age in Groves
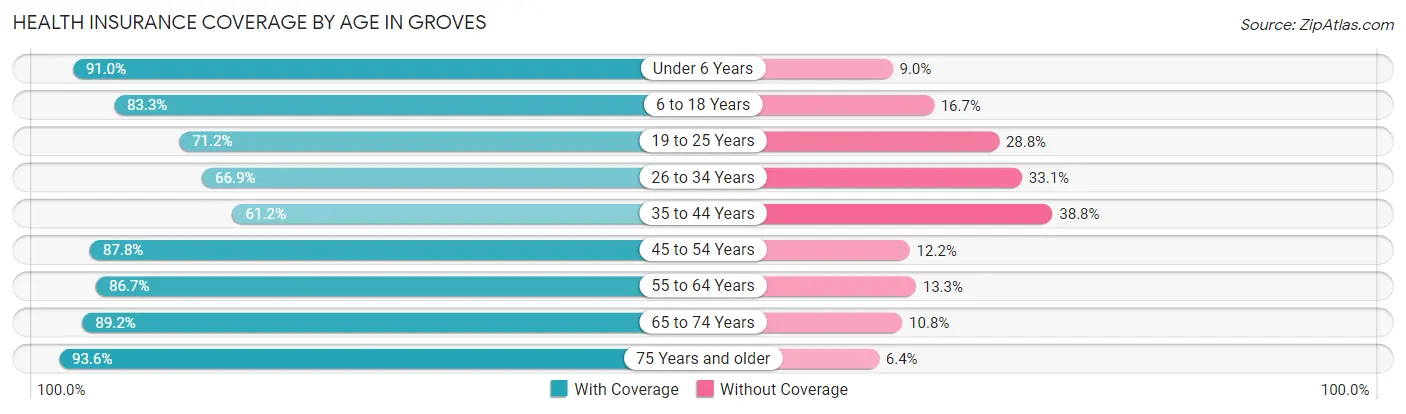
| Age Bracket | With Coverage | Without Coverage |
| Under 6 Years | 1,428 (91.0%) | 141 (9.0%) |
| 6 to 18 Years | 2,144 (83.3%) | 429 (16.7%) |
| 19 to 25 Years | 945 (71.2%) | 383 (28.8%) |
| 26 to 34 Years | 1,569 (66.9%) | 777 (33.1%) |
| 35 to 44 Years | 1,202 (61.2%) | 762 (38.8%) |
| 45 to 54 Years | 1,693 (87.8%) | 235 (12.2%) |
| 55 to 64 Years | 2,061 (86.7%) | 317 (13.3%) |
| 65 to 74 Years | 1,546 (89.2%) | 187 (10.8%) |
| 75 Years and older | 1,002 (93.6%) | 69 (6.4%) |
| Total | 13,590 (80.5%) | 3,300 (19.5%) |
Health Insurance Coverage by Citizenship Status in Groves
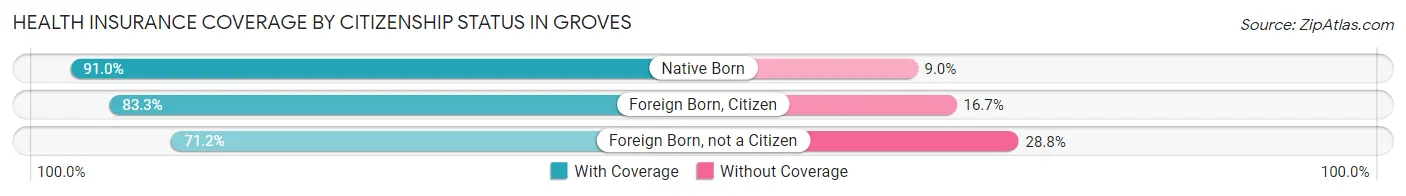
| Citizenship Status | With Coverage | Without Coverage |
| Native Born | 1,428 (91.0%) | 141 (9.0%) |
| Foreign Born, Citizen | 2,144 (83.3%) | 429 (16.7%) |
| Foreign Born, not a Citizen | 945 (71.2%) | 383 (28.8%) |
Health Insurance Coverage by Household Income in Groves
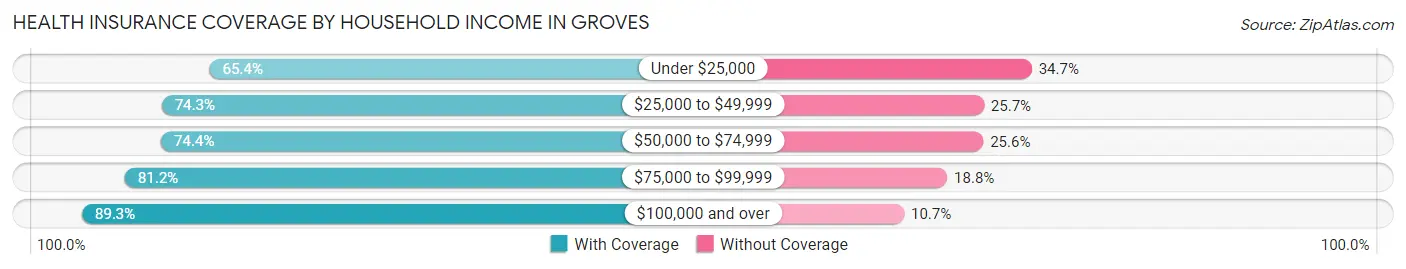
| Household Income | With Coverage | Without Coverage |
| Under $25,000 | 1,045 (65.3%) | 554 (34.6%) |
| $25,000 to $49,999 | 2,354 (74.3%) | 814 (25.7%) |
| $50,000 to $74,999 | 2,566 (74.4%) | 881 (25.6%) |
| $75,000 to $99,999 | 1,209 (81.2%) | 280 (18.8%) |
| $100,000 and over | 6,415 (89.3%) | 771 (10.7%) |
Public vs Private Health Insurance Coverage by Age in Groves
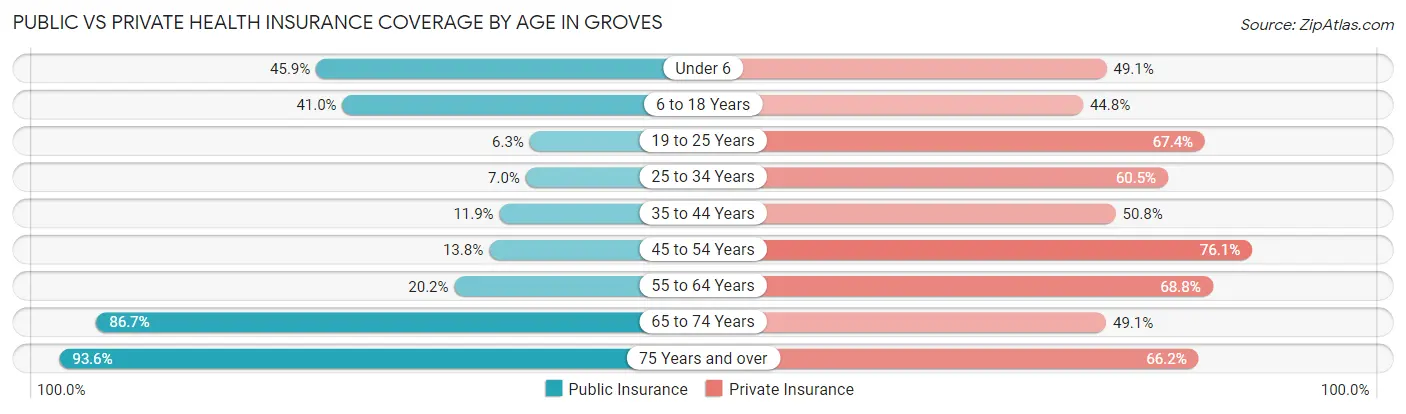
| Age Bracket | Public Insurance | Private Insurance |
| Under 6 | 720 (45.9%) | 771 (49.1%) |
| 6 to 18 Years | 1,055 (41.0%) | 1,152 (44.8%) |
| 19 to 25 Years | 83 (6.2%) | 895 (67.4%) |
| 25 to 34 Years | 164 (7.0%) | 1,420 (60.5%) |
| 35 to 44 Years | 233 (11.9%) | 998 (50.8%) |
| 45 to 54 Years | 266 (13.8%) | 1,468 (76.1%) |
| 55 to 64 Years | 481 (20.2%) | 1,636 (68.8%) |
| 65 to 74 Years | 1,502 (86.7%) | 850 (49.0%) |
| 75 Years and over | 1,002 (93.6%) | 709 (66.2%) |
| Total | 5,506 (32.6%) | 9,899 (58.6%) |
Disability Status by Sex by Age in Groves
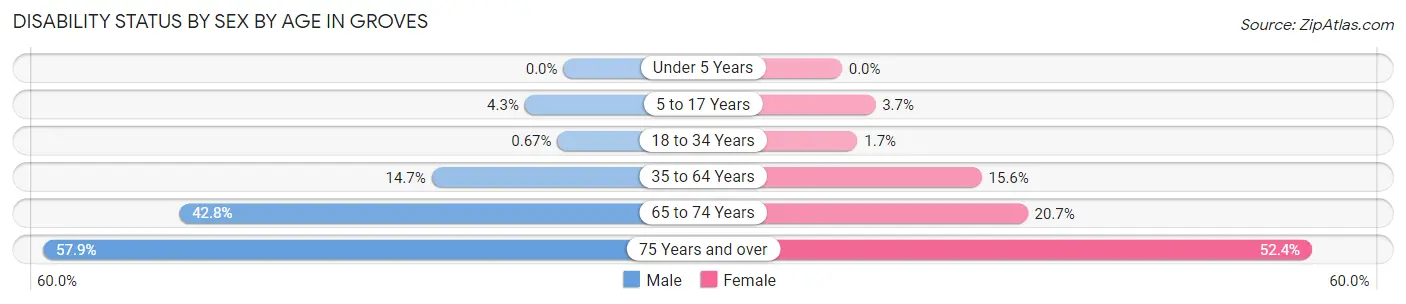
| Age Bracket | Male | Female |
| Under 5 Years | 0 (0.0%) | 0 (0.0%) |
| 5 to 17 Years | 63 (4.3%) | 49 (3.7%) |
| 18 to 34 Years | 13 (0.7%) | 32 (1.7%) |
| 35 to 64 Years | 485 (14.7%) | 462 (15.6%) |
| 65 to 74 Years | 332 (42.8%) | 198 (20.7%) |
| 75 Years and over | 201 (57.9%) | 379 (52.3%) |
Disability Class by Sex by Age in Groves
Disability Class: Hearing Difficulty
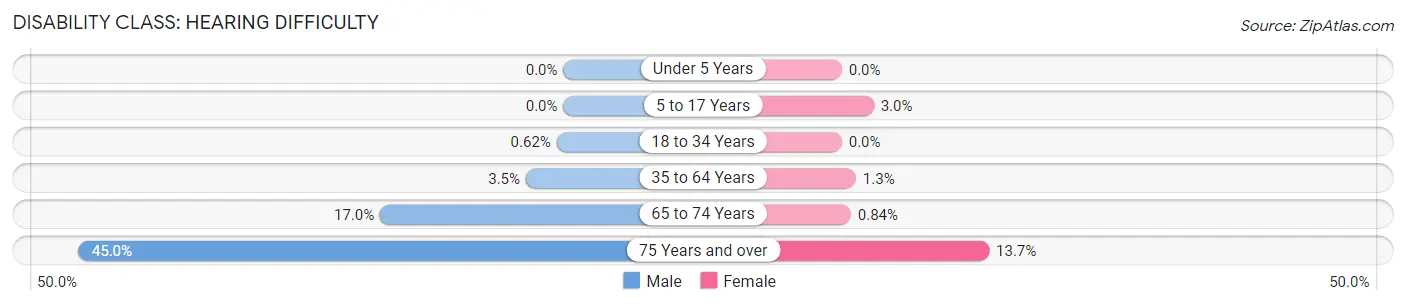
| Age Bracket | Male | Female |
| Under 5 Years | 0 (0.0%) | 0 (0.0%) |
| 5 to 17 Years | 0 (0.0%) | 39 (3.0%) |
| 18 to 34 Years | 12 (0.6%) | 0 (0.0%) |
| 35 to 64 Years | 115 (3.5%) | 39 (1.3%) |
| 65 to 74 Years | 132 (17.0%) | 8 (0.8%) |
| 75 Years and over | 156 (45.0%) | 99 (13.7%) |
Disability Class: Vision Difficulty
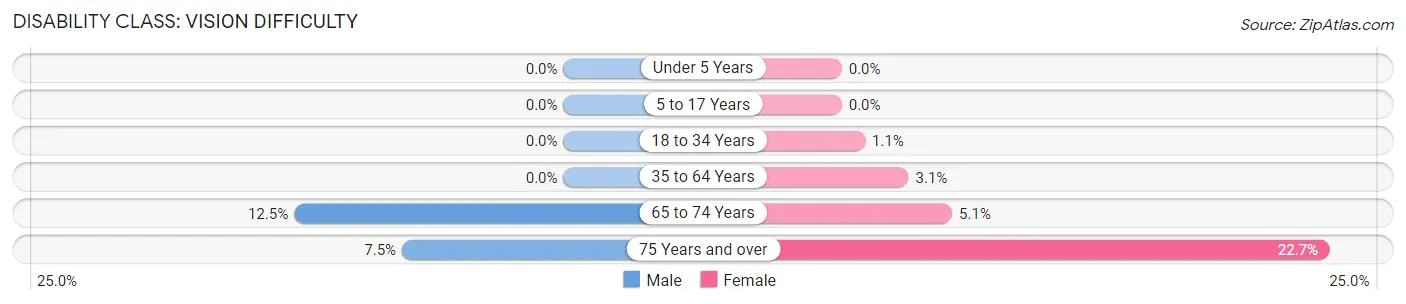
| Age Bracket | Male | Female |
| Under 5 Years | 0 (0.0%) | 0 (0.0%) |
| 5 to 17 Years | 0 (0.0%) | 0 (0.0%) |
| 18 to 34 Years | 0 (0.0%) | 20 (1.1%) |
| 35 to 64 Years | 0 (0.0%) | 92 (3.1%) |
| 65 to 74 Years | 97 (12.5%) | 49 (5.1%) |
| 75 Years and over | 26 (7.5%) | 164 (22.7%) |
Disability Class: Cognitive Difficulty
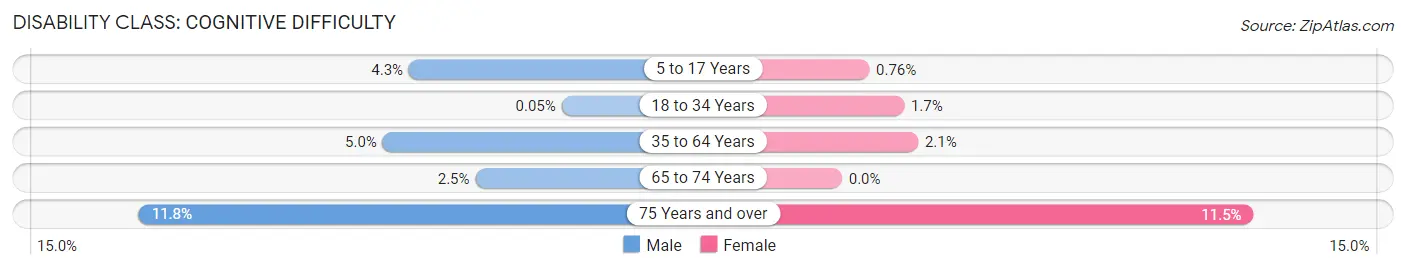
| Age Bracket | Male | Female |
| 5 to 17 Years | 63 (4.3%) | 10 (0.8%) |
| 18 to 34 Years | 1 (0.1%) | 32 (1.7%) |
| 35 to 64 Years | 166 (5.0%) | 63 (2.1%) |
| 65 to 74 Years | 19 (2.5%) | 0 (0.0%) |
| 75 Years and over | 41 (11.8%) | 83 (11.5%) |
Disability Class: Ambulatory Difficulty
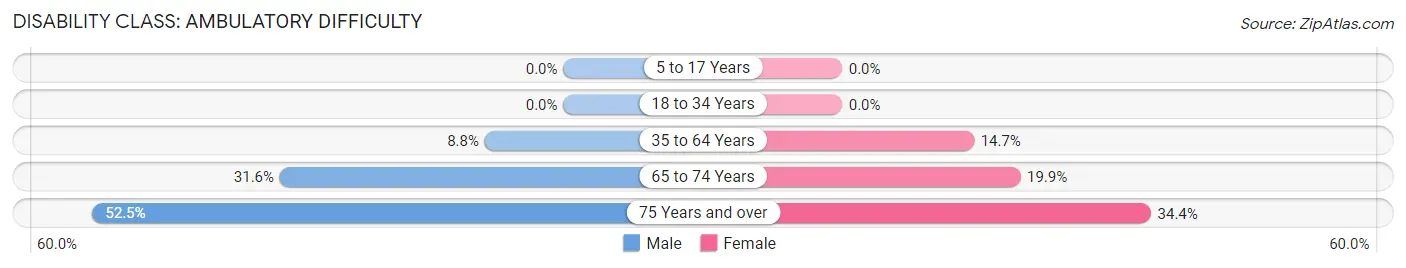
| Age Bracket | Male | Female |
| 5 to 17 Years | 0 (0.0%) | 0 (0.0%) |
| 18 to 34 Years | 0 (0.0%) | 0 (0.0%) |
| 35 to 64 Years | 289 (8.7%) | 436 (14.7%) |
| 65 to 74 Years | 245 (31.6%) | 190 (19.9%) |
| 75 Years and over | 182 (52.4%) | 249 (34.4%) |
Disability Class: Self-Care Difficulty
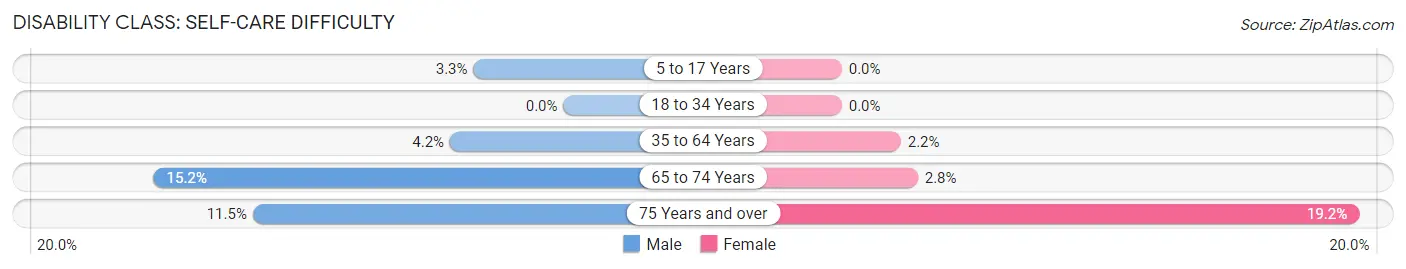
| Age Bracket | Male | Female |
| 5 to 17 Years | 49 (3.3%) | 0 (0.0%) |
| 18 to 34 Years | 0 (0.0%) | 0 (0.0%) |
| 35 to 64 Years | 139 (4.2%) | 65 (2.2%) |
| 65 to 74 Years | 118 (15.2%) | 27 (2.8%) |
| 75 Years and over | 40 (11.5%) | 139 (19.2%) |
Technology Access in Groves
Computing Device Access in Groves
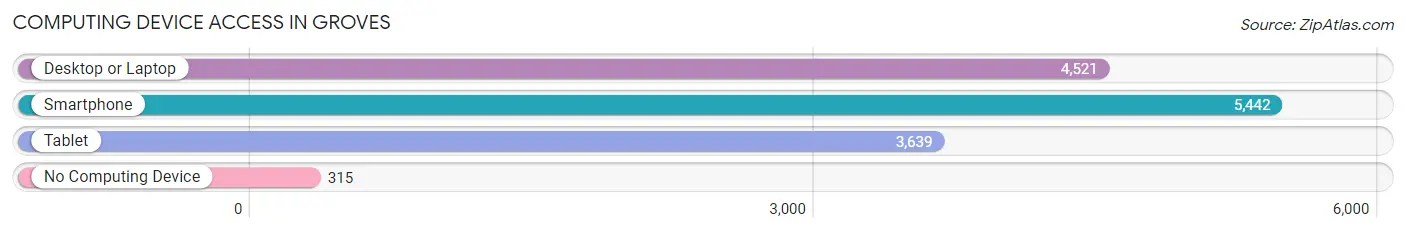
| Device Type | # Households | % Households |
| Desktop or Laptop | 4,521 | 74.9% |
| Smartphone | 5,442 | 90.2% |
| Tablet | 3,639 | 60.3% |
| No Computing Device | 315 | 5.2% |
| Total | 6,034 | 100.0% |
Internet Access in Groves
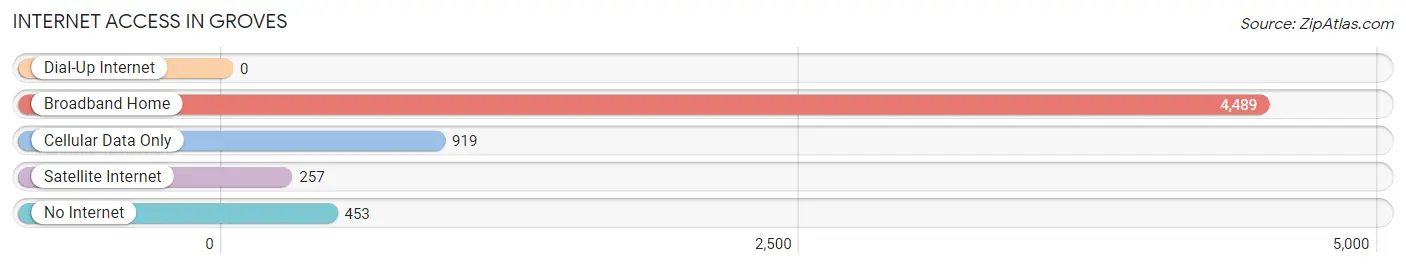
| Internet Type | # Households | % Households |
| Dial-Up Internet | 0 | 0.0% |
| Broadband Home | 4,489 | 74.4% |
| Cellular Data Only | 919 | 15.2% |
| Satellite Internet | 257 | 4.3% |
| No Internet | 453 | 7.5% |
| Total | 6,034 | 100.0% |
Groves Summary
Groves, Texas is a city located in Jefferson County, Texas, United States. It is part of the Beaumont–Port Arthur Metropolitan Statistical Area. The population was 11,482 at the 2010 census.
History
The area that is now Groves was first settled in the late 1800s by a group of French settlers. The settlement was originally known as “French Groves” and was located near the Neches River. The settlement was later renamed “Groves” after the first postmaster, William Groves.
In the early 1900s, the area began to grow as the lumber industry began to expand. The city was officially incorporated in 1927 and the population began to grow rapidly. By the 1940s, the population had grown to over 1,000 people.
In the 1950s, the city began to experience a period of rapid growth as the petrochemical industry began to expand in the area. This growth continued into the 1960s and 1970s, and by the 1980s, the population had grown to over 10,000 people.
Geography
Groves is located at 29°58'25" North, 93°59'17" West (29.973611, -93.988333). According to the United States Census Bureau, the city has a total area of 5.3 square miles (13.7 km2), all of it land.
Economy
The economy of Groves is largely based on the petrochemical industry. The city is home to several major petrochemical plants, including the Valero Refinery, the Motiva Refinery, and the Total Petrochemicals plant. The city is also home to several other industries, including manufacturing, retail, and healthcare.
Demographics
As of the 2010 census, there were 11,482 people, 4,093 households, and 2,945 families residing in the city. The population density was 2,164.2 people per square mile (835.2/km2). There were 4,521 housing units at an average density of 860.2 per square mile (332.2/km2). The racial makeup of the city was 73.2% White, 11.3% African American, 0.7% Native American, 0.7% Asian, 0.1% Pacific Islander, 11.3% from other races, and 3.1% from two or more races. Hispanic or Latino of any race were 24.2% of the population.
There were 4,093 households, out of which 36.2% had children under the age of 18 living with them, 47.2% were married couples living together, 17.2% had a female householder with no husband present, and 29.2% were non-families. 24.2% of all households were made up of individuals, and 10.2% had someone living alone who was 65 years of age or older. The average household size was 2.78 and the average family size was 3.30.
In the city, the population was spread out, with 28.7% under the age of 18, 10.2% from 18 to 24, 27.2% from 25 to 44, 21.2% from 45 to 64, and 12.7% who were 65 years of age or older. The median age was 33 years. For every 100 females, there were 95.2 males. For every 100 females age 18 and over, there were 91.2 males.
The median income for a household in the city was $33,917, and the median income for a family was $38,917. Males had a median income of $31,917 versus $21,917 for females. The per capita income for the city was $15,917. About 14.2% of families and 17.2% of the population were below the poverty line, including 22.2% of those under age 18 and 11.2% of those age 65 or over.
Common Questions
What is Per Capita Income in Groves?
Per Capita income in Groves is $32,330.
What is the Median Family Income in Groves?
Median Family Income in Groves is $79,167.
What is the Median Household income in Groves?
Median Household Income in Groves is $64,737.
What is Income or Wage Gap in Groves?
Income or Wage Gap in Groves is 32.2%.
Women in Groves earn 67.8 cents for every dollar earned by a man.
What is Inequality or Gini Index in Groves?
Inequality or Gini Index in Groves is 0.40.
What is the Total Population of Groves?
Total Population of Groves is 17,110.
What is the Total Male Population of Groves?
Total Male Population of Groves is 8,645.
What is the Total Female Population of Groves?
Total Female Population of Groves is 8,465.
What is the Ratio of Males per 100 Females in Groves?
There are 102.13 Males per 100 Females in Groves.
What is the Ratio of Females per 100 Males in Groves?
There are 97.92 Females per 100 Males in Groves.
What is the Median Population Age in Groves?
Median Population Age in Groves is 38.9 Years.
What is the Average Family Size in Groves
Average Family Size in Groves is 3.3 People.
What is the Average Household Size in Groves
Average Household Size in Groves is 2.8 People.
How Large is the Labor Force in Groves?
There are 8,172 People in the Labor Forcein in Groves.
What is the Percentage of People in the Labor Force in Groves?
60.9% of People are in the Labor Force in Groves.
What is the Unemployment Rate in Groves?
Unemployment Rate in Groves is 4.1%.