Granger, TX Map & Demographics
Granger Map
Granger Overview
$28,170
PER CAPITA INCOME
$67,656
AVG FAMILY INCOME
$58,917
AVG HOUSEHOLD INCOME
38.3%
WAGE / INCOME GAP [ % ]
61.7¢/ $1
WAGE / INCOME GAP [ $ ]
0.42
INEQUALITY / GINI INDEX
1,100
TOTAL POPULATION
645
MALE POPULATION
455
FEMALE POPULATION
141.76
MALES / 100 FEMALES
70.54
FEMALES / 100 MALES
48.5
MEDIAN AGE
2.8
AVG FAMILY SIZE
2.2
AVG HOUSEHOLD SIZE
536
LABOR FORCE [ PEOPLE ]
52.0%
PERCENT IN LABOR FORCE
8.2%
UNEMPLOYMENT RATE
Granger Zip Codes
Granger Area Codes
Income in Granger
Income Overview in Granger
Per Capita Income in Granger is $28,170, while median incomes of families and households are $67,656 and $58,917 respectively.
| Characteristic | Number | Measure |
| Per Capita Income | 1,100 | $28,170 |
| Median Family Income | 228 | $67,656 |
| Mean Family Income | 228 | $78,067 |
| Median Household Income | 445 | $58,917 |
| Mean Household Income | 445 | $67,152 |
| Income Deficit | 228 | $0 |
| Wage / Income Gap (%) | 1,100 | 38.27% |
| Wage / Income Gap ($) | 1,100 | 61.73¢ per $1 |
| Gini / Inequality Index | 1,100 | 0.42 |
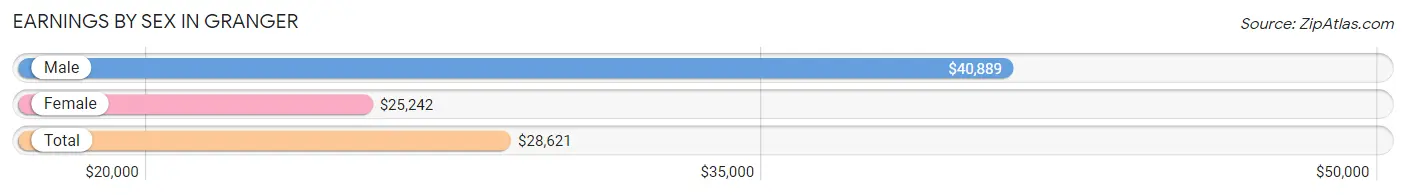
Earnings by Sex in Granger
Average Earnings in Granger are $28,621, $40,889 for men and $25,242 for women, a difference of 38.3%.
| Sex | Number | Average Earnings |
| Male | 332 (61.7%) | $40,889 |
| Female | 206 (38.3%) | $25,242 |
| Total | 538 (100.0%) | $28,621 |
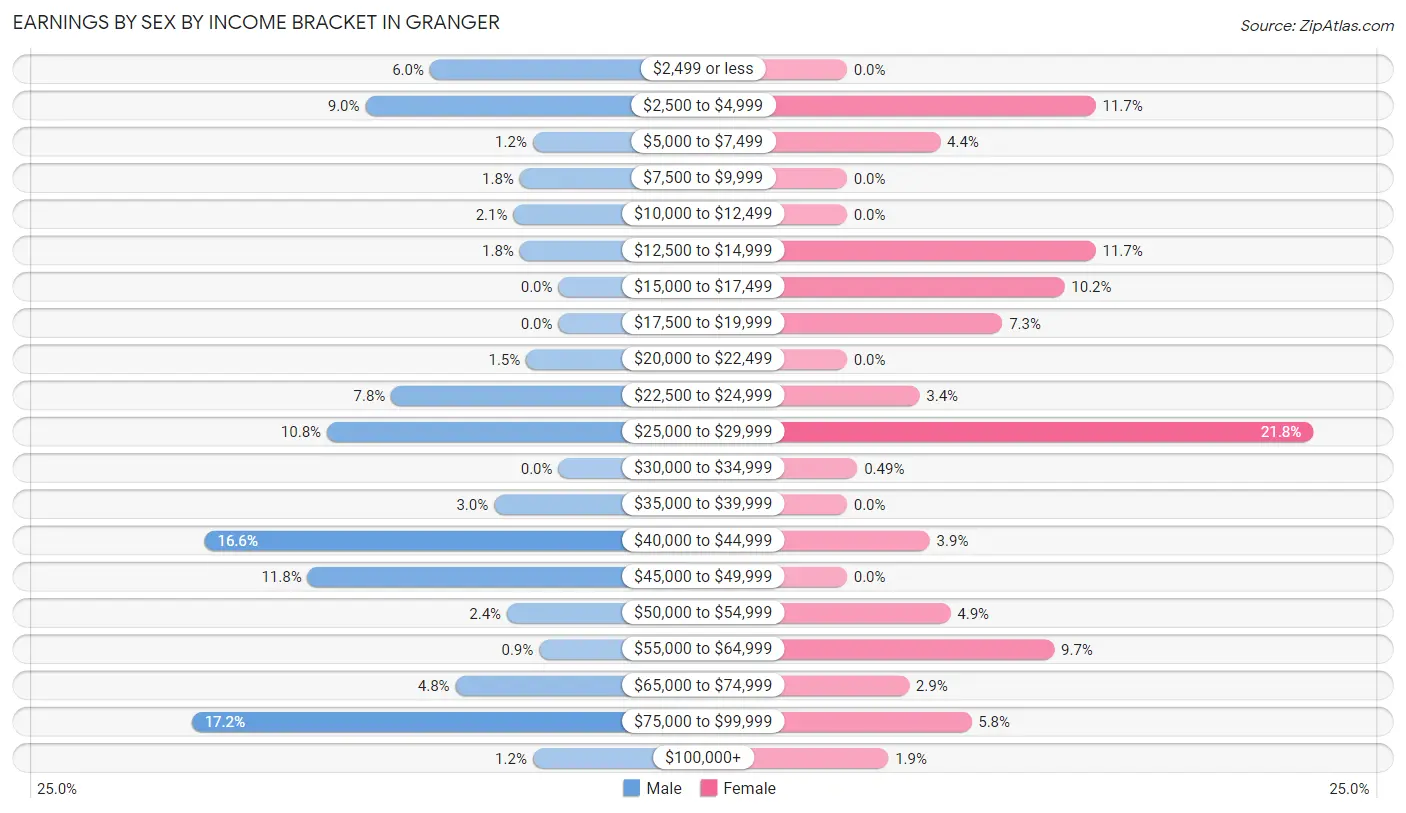
Earnings by Sex by Income Bracket in Granger
The most common earnings brackets in Granger are $75,000 to $99,999 for men (57 | 17.2%) and $25,000 to $29,999 for women (45 | 21.8%).
| Income | Male | Female |
| $2,499 or less | 20 (6.0%) | 0 (0.0%) |
| $2,500 to $4,999 | 30 (9.0%) | 24 (11.7%) |
| $5,000 to $7,499 | 4 (1.2%) | 9 (4.4%) |
| $7,500 to $9,999 | 6 (1.8%) | 0 (0.0%) |
| $10,000 to $12,499 | 7 (2.1%) | 0 (0.0%) |
| $12,500 to $14,999 | 6 (1.8%) | 24 (11.7%) |
| $15,000 to $17,499 | 0 (0.0%) | 21 (10.2%) |
| $17,500 to $19,999 | 0 (0.0%) | 15 (7.3%) |
| $20,000 to $22,499 | 5 (1.5%) | 0 (0.0%) |
| $22,500 to $24,999 | 26 (7.8%) | 7 (3.4%) |
| $25,000 to $29,999 | 36 (10.8%) | 45 (21.8%) |
| $30,000 to $34,999 | 0 (0.0%) | 1 (0.5%) |
| $35,000 to $39,999 | 10 (3.0%) | 0 (0.0%) |
| $40,000 to $44,999 | 55 (16.6%) | 8 (3.9%) |
| $45,000 to $49,999 | 39 (11.7%) | 0 (0.0%) |
| $50,000 to $54,999 | 8 (2.4%) | 10 (4.9%) |
| $55,000 to $64,999 | 3 (0.9%) | 20 (9.7%) |
| $65,000 to $74,999 | 16 (4.8%) | 6 (2.9%) |
| $75,000 to $99,999 | 57 (17.2%) | 12 (5.8%) |
| $100,000+ | 4 (1.2%) | 4 (1.9%) |
| Total | 332 (100.0%) | 206 (100.0%) |
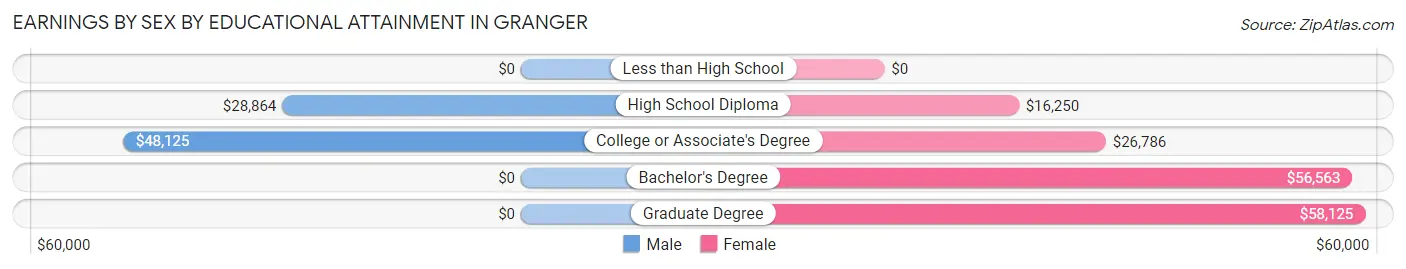
Earnings by Sex by Educational Attainment in Granger
Average earnings in Granger are $42,000 for men and $24,286 for women, a difference of 42.2%. Men with an educational attainment of college or associate's degree enjoy the highest average annual earnings of $48,125, while those with high school diploma education earn the least with $28,864. Women with an educational attainment of graduate degree earn the most with the average annual earnings of $58,125, while those with high school diploma education have the smallest earnings of $16,250.
| Educational Attainment | Male Income | Female Income |
| Less than High School | - | - |
| High School Diploma | $28,864 | $16,250 |
| College or Associate's Degree | $48,125 | $26,786 |
| Bachelor's Degree | - | - |
| Graduate Degree | - | - |
| Total | $42,000 | $24,286 |
Family Income in Granger
Family Income Brackets in Granger
According to the Granger family income data, there are 47 families falling into the $50,000 to $74,999 income range, which is the most common income bracket and makes up 20.6% of all families.
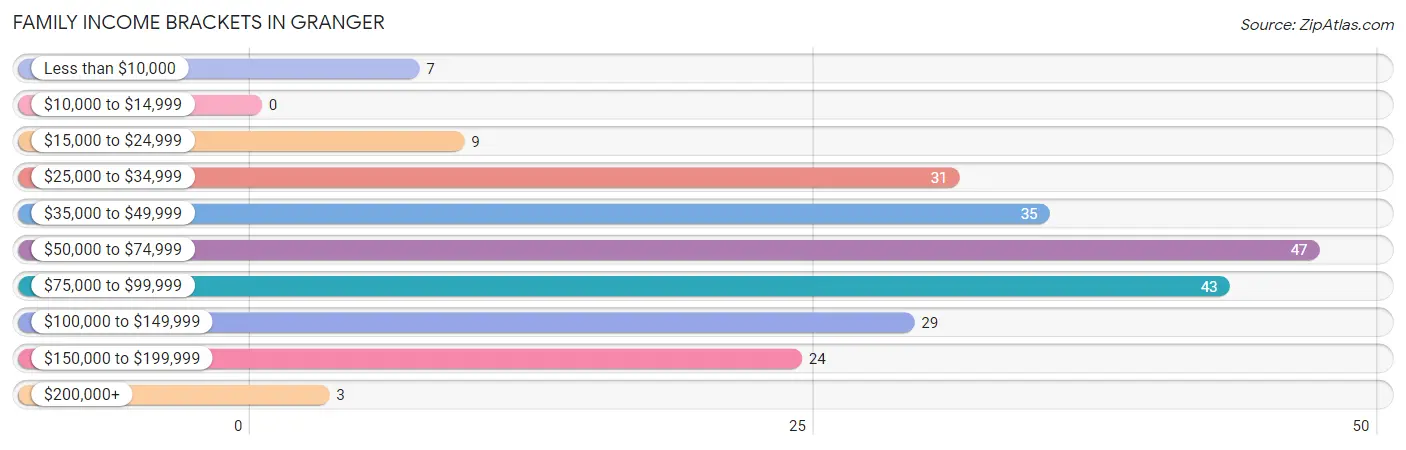
| Income Bracket | # Families | % Families |
| Less than $10,000 | 7 | 3.1% |
| $10,000 to $14,999 | 0 | 0.0% |
| $15,000 to $24,999 | 9 | 3.9% |
| $25,000 to $34,999 | 31 | 13.6% |
| $35,000 to $49,999 | 35 | 15.4% |
| $50,000 to $74,999 | 47 | 20.6% |
| $75,000 to $99,999 | 43 | 18.9% |
| $100,000 to $149,999 | 29 | 12.7% |
| $150,000 to $199,999 | 24 | 10.5% |
| $200,000+ | 3 | 1.3% |
Family Income by Famaliy Size in Granger
4-person families (16 | 7.0%) account for the highest median family income in Granger with $123,750 per family, while 4-person families (16 | 7.0%) have the highest median income of $30,938 per family member.
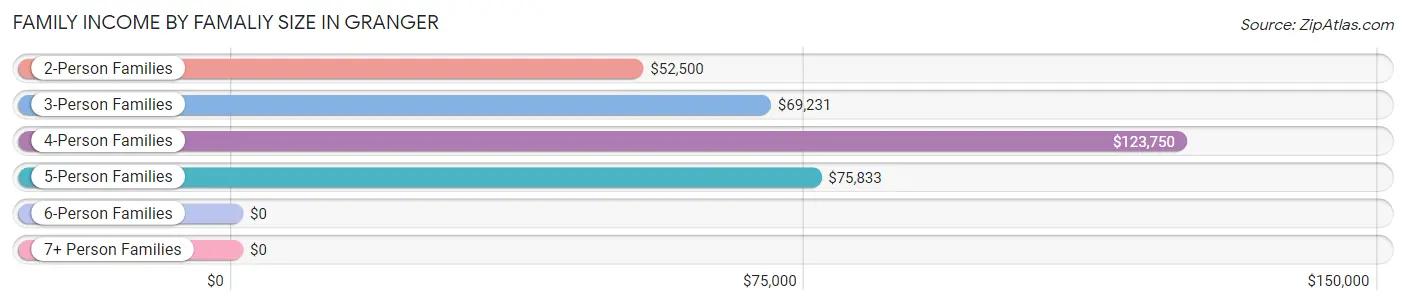
| Income Bracket | # Families | Median Income |
| 2-Person Families | 128 (56.1%) | $52,500 |
| 3-Person Families | 66 (28.9%) | $69,231 |
| 4-Person Families | 16 (7.0%) | $123,750 |
| 5-Person Families | 14 (6.1%) | $75,833 |
| 6-Person Families | 4 (1.8%) | $0 |
| 7+ Person Families | 0 (0.0%) | $0 |
| Total | 228 (100.0%) | $67,656 |
Family Income by Number of Earners in Granger
The median family income in Granger is $67,656, with families comprising 3+ earners (43) having the highest median family income of $123,375, while families with no earners (43) have the lowest median family income of $31,528, accounting for 18.9% and 18.9% of families, respectively.
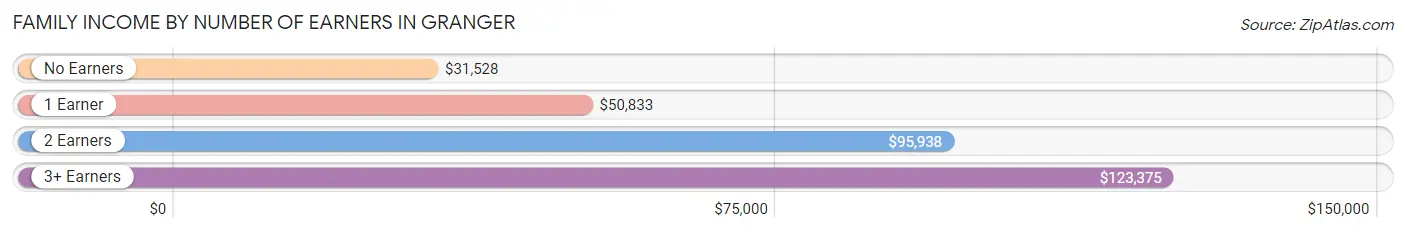
| Number of Earners | # Families | Median Income |
| No Earners | 43 (18.9%) | $31,528 |
| 1 Earner | 84 (36.8%) | $50,833 |
| 2 Earners | 58 (25.4%) | $95,938 |
| 3+ Earners | 43 (18.9%) | $123,375 |
| Total | 228 (100.0%) | $67,656 |
Household Income in Granger
Household Income Brackets in Granger
With 87 households falling in the category, the $50,000 to $74,999 income range is the most frequent in Granger, accounting for 19.6% of all households. In contrast, only 12 households (2.7%) fall into the $200,000+ income bracket, making it the least populous group.
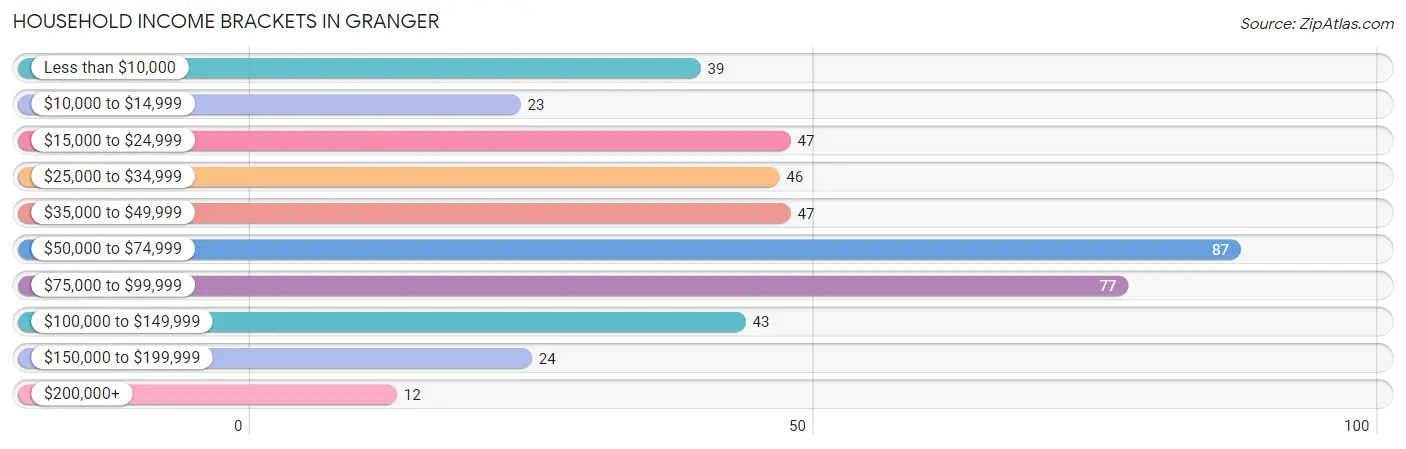
| Income Bracket | # Households | % Households |
| Less than $10,000 | 39 | 8.8% |
| $10,000 to $14,999 | 23 | 5.2% |
| $15,000 to $24,999 | 47 | 10.6% |
| $25,000 to $34,999 | 46 | 10.3% |
| $35,000 to $49,999 | 47 | 10.6% |
| $50,000 to $74,999 | 87 | 19.6% |
| $75,000 to $99,999 | 77 | 17.3% |
| $100,000 to $149,999 | 43 | 9.7% |
| $150,000 to $199,999 | 24 | 5.4% |
| $200,000+ | 12 | 2.7% |
Household Income by Householder Age in Granger
The median household income in Granger is $58,917, with the highest median household income of $82,250 found in the 25 to 44 years age bracket for the primary householder. A total of 68 households (15.3%) fall into this category. Meanwhile, the 65+ years age bracket for the primary householder has the lowest median household income of $30,417, with 171 households (38.4%) in this group.
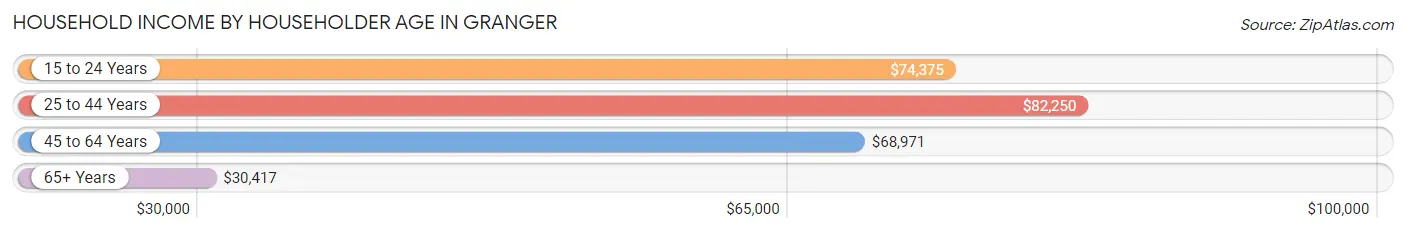
| Income Bracket | # Households | Median Income |
| 15 to 24 Years | 26 (5.8%) | $74,375 |
| 25 to 44 Years | 68 (15.3%) | $82,250 |
| 45 to 64 Years | 180 (40.5%) | $68,971 |
| 65+ Years | 171 (38.4%) | $30,417 |
| Total | 445 (100.0%) | $58,917 |
Poverty in Granger
Income Below Poverty by Sex and Age in Granger
With 11.6% poverty level for males and 16.1% for females among the residents of Granger, 65 to 74 year old males and 5 year old females are the most vulnerable to poverty, with 28 males (32.9%) and 4 females (100.0%) in their respective age groups living below the poverty level.
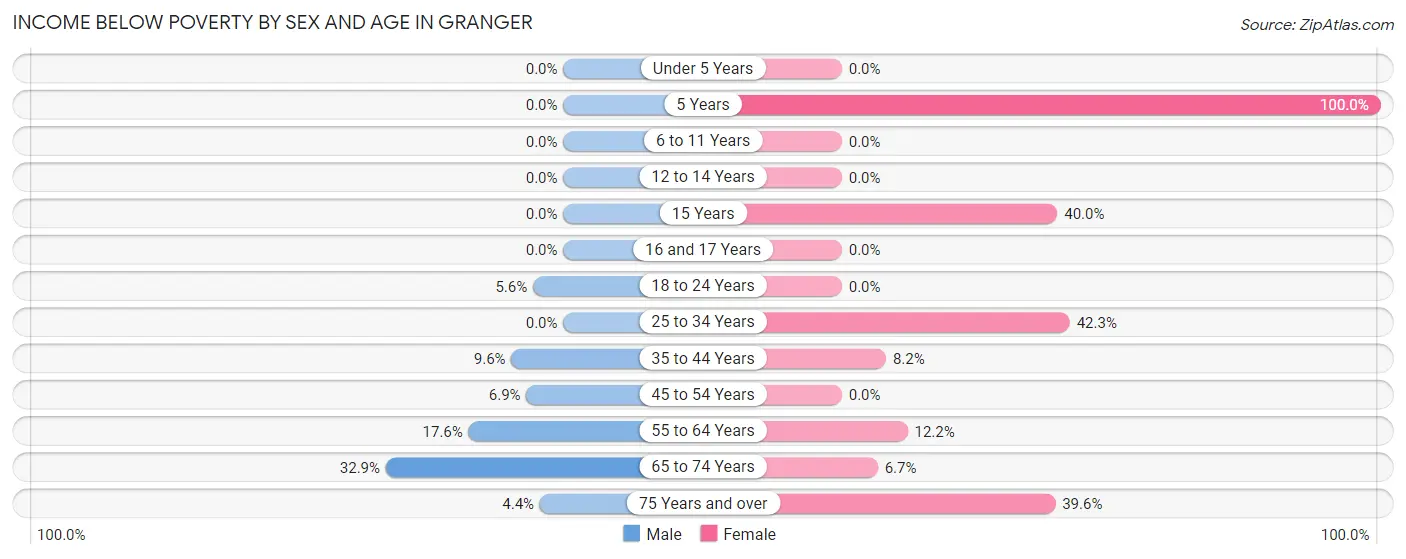
| Age Bracket | Male | Female |
| Under 5 Years | 0 (0.0%) | 0 (0.0%) |
| 5 Years | 0 (0.0%) | 4 (100.0%) |
| 6 to 11 Years | 0 (0.0%) | 0 (0.0%) |
| 12 to 14 Years | 0 (0.0%) | 0 (0.0%) |
| 15 Years | 0 (0.0%) | 4 (40.0%) |
| 16 and 17 Years | 0 (0.0%) | 0 (0.0%) |
| 18 to 24 Years | 4 (5.6%) | 0 (0.0%) |
| 25 to 34 Years | 0 (0.0%) | 22 (42.3%) |
| 35 to 44 Years | 8 (9.6%) | 5 (8.2%) |
| 45 to 54 Years | 5 (6.9%) | 0 (0.0%) |
| 55 to 64 Years | 16 (17.6%) | 10 (12.2%) |
| 65 to 74 Years | 28 (32.9%) | 4 (6.7%) |
| 75 Years and over | 2 (4.3%) | 21 (39.6%) |
| Total | 63 (11.6%) | 70 (16.1%) |
Income Above Poverty by Sex and Age in Granger
According to the poverty statistics in Granger, males aged under 5 years and females aged under 5 years are the age groups that are most secure financially, with 100.0% of males and 100.0% of females in these age groups living above the poverty line.
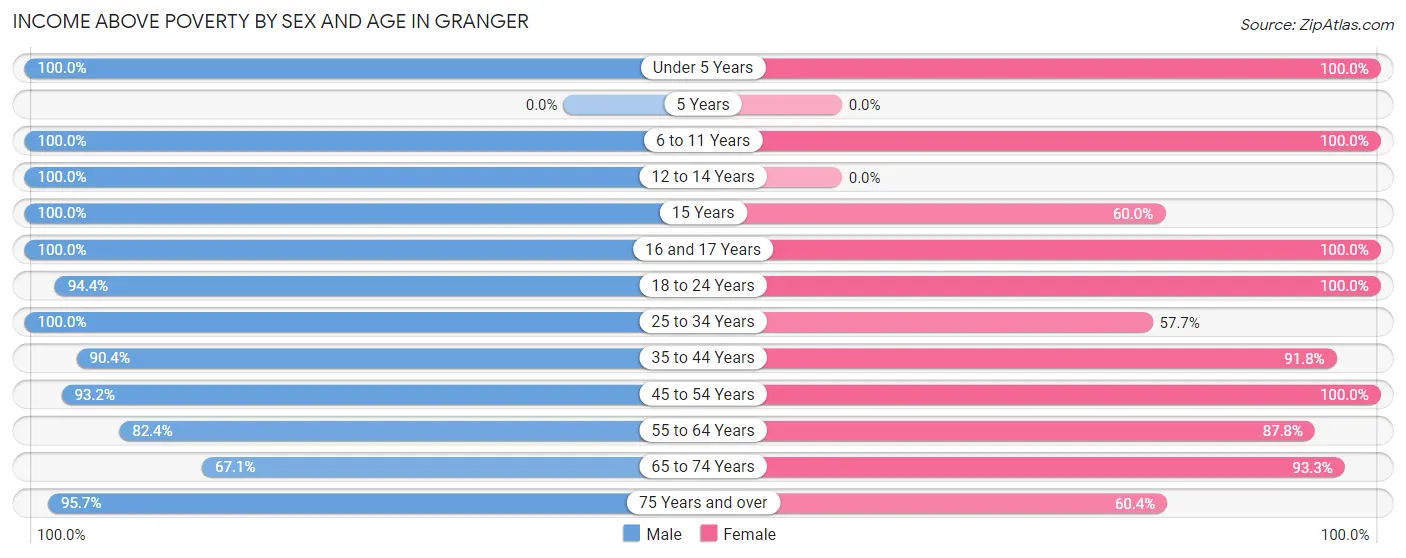
| Age Bracket | Male | Female |
| Under 5 Years | 12 (100.0%) | 8 (100.0%) |
| 5 Years | 0 (0.0%) | 0 (0.0%) |
| 6 to 11 Years | 12 (100.0%) | 8 (100.0%) |
| 12 to 14 Years | 12 (100.0%) | 0 (0.0%) |
| 15 Years | 4 (100.0%) | 6 (60.0%) |
| 16 and 17 Years | 4 (100.0%) | 12 (100.0%) |
| 18 to 24 Years | 67 (94.4%) | 26 (100.0%) |
| 25 to 34 Years | 49 (100.0%) | 30 (57.7%) |
| 35 to 44 Years | 75 (90.4%) | 56 (91.8%) |
| 45 to 54 Years | 68 (93.1%) | 59 (100.0%) |
| 55 to 64 Years | 75 (82.4%) | 72 (87.8%) |
| 65 to 74 Years | 57 (67.1%) | 56 (93.3%) |
| 75 Years and over | 44 (95.7%) | 32 (60.4%) |
| Total | 479 (88.4%) | 365 (83.9%) |
Income Below Poverty Among Married-Couple Families in Granger
The poverty statistics for married-couple families in Granger show that 5.9% or 10 of the total 168 families live below the poverty line. Families with 1 or 2 children have the highest poverty rate of 9.3%, comprising of 4 families. On the other hand, families with no children have the lowest poverty rate of 4.8%, which includes 6 families.
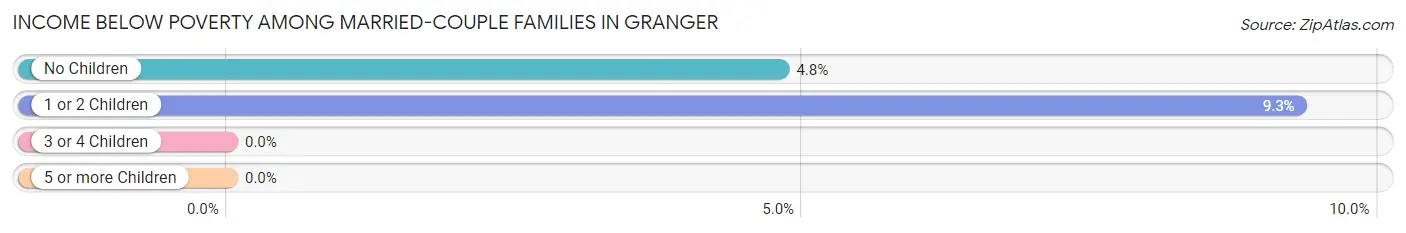
| Children | Above Poverty | Below Poverty |
| No Children | 119 (95.2%) | 6 (4.8%) |
| 1 or 2 Children | 39 (90.7%) | 4 (9.3%) |
| 3 or 4 Children | 0 (0.0%) | 0 (0.0%) |
| 5 or more Children | 0 (0.0%) | 0 (0.0%) |
| Total | 158 (94.1%) | 10 (5.9%) |
Income Below Poverty Among Single-Parent Households in Granger
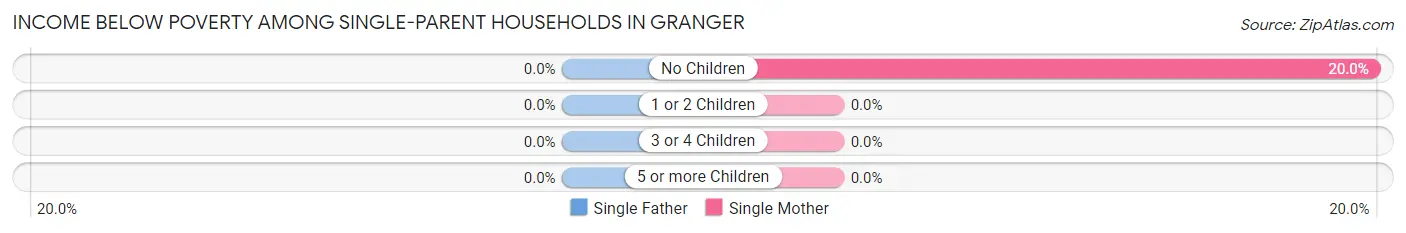
| Children | Single Father | Single Mother |
| No Children | 0 (0.0%) | 3 (20.0%) |
| 1 or 2 Children | 0 (0.0%) | 0 (0.0%) |
| 3 or 4 Children | 0 (0.0%) | 0 (0.0%) |
| 5 or more Children | 0 (0.0%) | 0 (0.0%) |
| Total | 0 (0.0%) | 3 (9.7%) |
Income Below Poverty Among Married-Couple vs Single-Parent Households in Granger
The poverty data for Granger shows that 10 of the married-couple family households (5.9%) and 3 of the single-parent households (5.0%) are living below the poverty level. Within the married-couple family households, those with 1 or 2 children have the highest poverty rate, with 4 households (9.3%) falling below the poverty line. Among the single-parent households, those with no children have the highest poverty rate, with 3 household (10.3%) living below poverty.
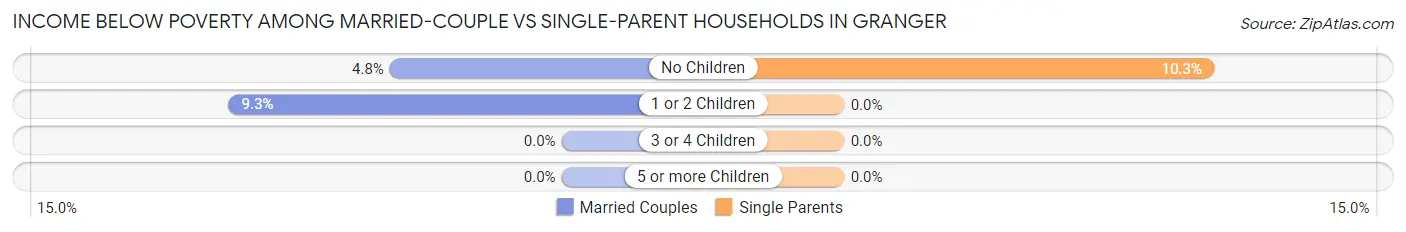
| Children | Married-Couple Families | Single-Parent Households |
| No Children | 6 (4.8%) | 3 (10.3%) |
| 1 or 2 Children | 4 (9.3%) | 0 (0.0%) |
| 3 or 4 Children | 0 (0.0%) | 0 (0.0%) |
| 5 or more Children | 0 (0.0%) | 0 (0.0%) |
| Total | 10 (5.9%) | 3 (5.0%) |
Race in Granger
The most populous races in Granger are White / Caucasian (713 | 64.8%), Hispanic or Latino (411 | 37.4%), and Some other Race (166 | 15.1%).
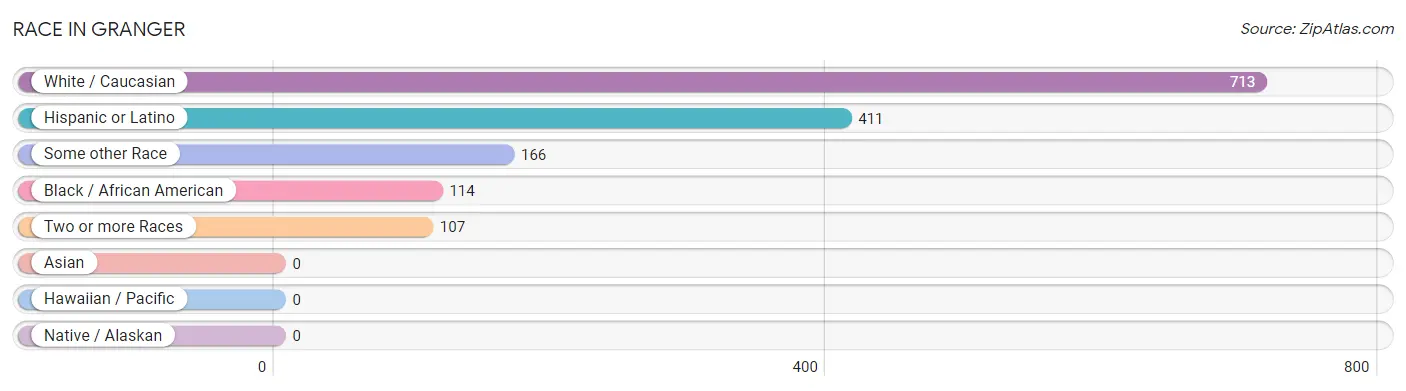
| Race | # Population | % Population |
| Asian | 0 | 0.0% |
| Black / African American | 114 | 10.4% |
| Hawaiian / Pacific | 0 | 0.0% |
| Hispanic or Latino | 411 | 37.4% |
| Native / Alaskan | 0 | 0.0% |
| White / Caucasian | 713 | 64.8% |
| Two or more Races | 107 | 9.7% |
| Some other Race | 166 | 15.1% |
| Total | 1,100 | 100.0% |
Ancestry in Granger
The most populous ancestries reported in Granger are Mexican (338 | 30.7%), German (166 | 15.1%), Czech (109 | 9.9%), Irish (109 | 9.9%), and American (35 | 3.2%), together accounting for 68.8% of all Granger residents.
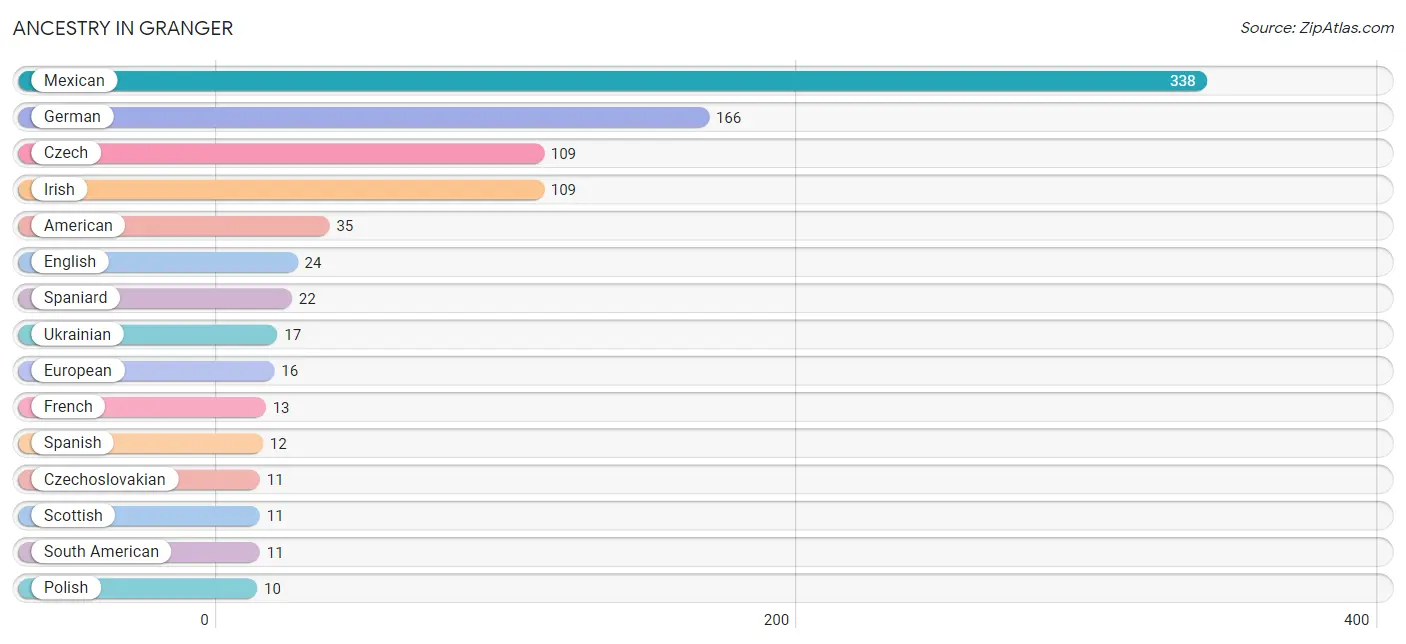
| Ancestry | # Population | % Population |
| American | 35 | 3.2% |
| Central American | 5 | 0.4% |
| Colombian | 5 | 0.4% |
| Czech | 109 | 9.9% |
| Czechoslovakian | 11 | 1.0% |
| Dutch | 6 | 0.5% |
| Eastern European | 8 | 0.7% |
| English | 24 | 2.2% |
| European | 16 | 1.5% |
| French | 13 | 1.2% |
| German | 166 | 15.1% |
| Irish | 109 | 9.9% |
| Italian | 7 | 0.6% |
| Mexican | 338 | 30.7% |
| Nicaraguan | 5 | 0.4% |
| Norwegian | 3 | 0.3% |
| Polish | 10 | 0.9% |
| Russian | 7 | 0.6% |
| Scottish | 11 | 1.0% |
| South American | 11 | 1.0% |
| Spaniard | 22 | 2.0% |
| Spanish | 12 | 1.1% |
| Ukrainian | 17 | 1.5% |
| Venezuelan | 6 | 0.5% | View All 24 Rows |
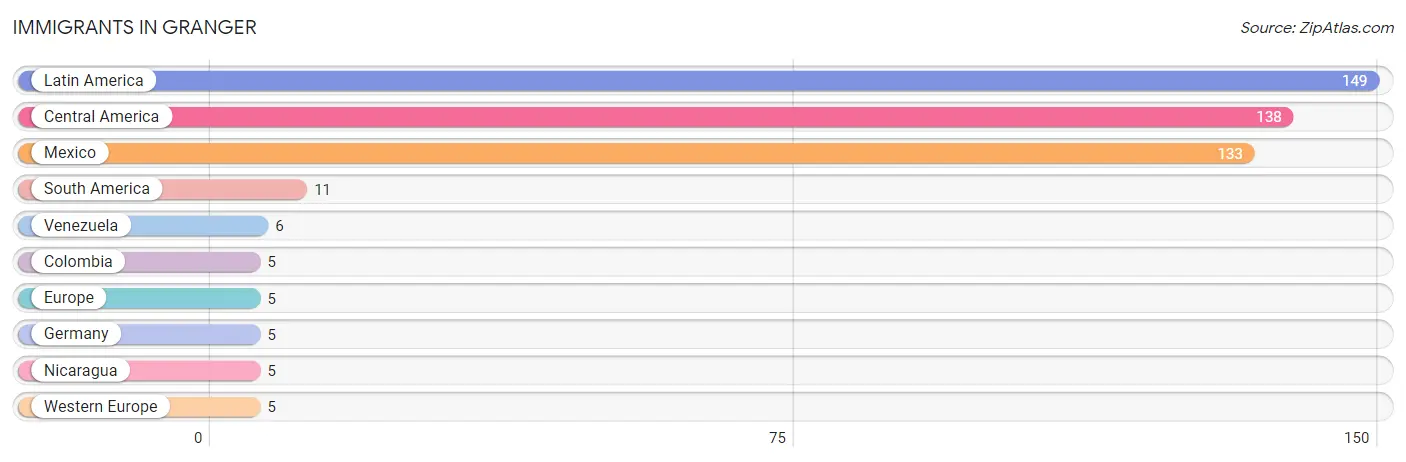
Immigrants in Granger
The most numerous immigrant groups reported in Granger came from Latin America (149 | 13.6%), Central America (138 | 12.6%), Mexico (133 | 12.1%), South America (11 | 1.0%), and Venezuela (6 | 0.5%), together accounting for 39.7% of all Granger residents.
| Immigration Origin | # Population | % Population |
| Central America | 138 | 12.6% |
| Colombia | 5 | 0.4% |
| Europe | 5 | 0.4% |
| Germany | 5 | 0.4% |
| Latin America | 149 | 13.6% |
| Mexico | 133 | 12.1% |
| Nicaragua | 5 | 0.4% |
| South America | 11 | 1.0% |
| Venezuela | 6 | 0.5% |
| Western Europe | 5 | 0.4% | View All 10 Rows |
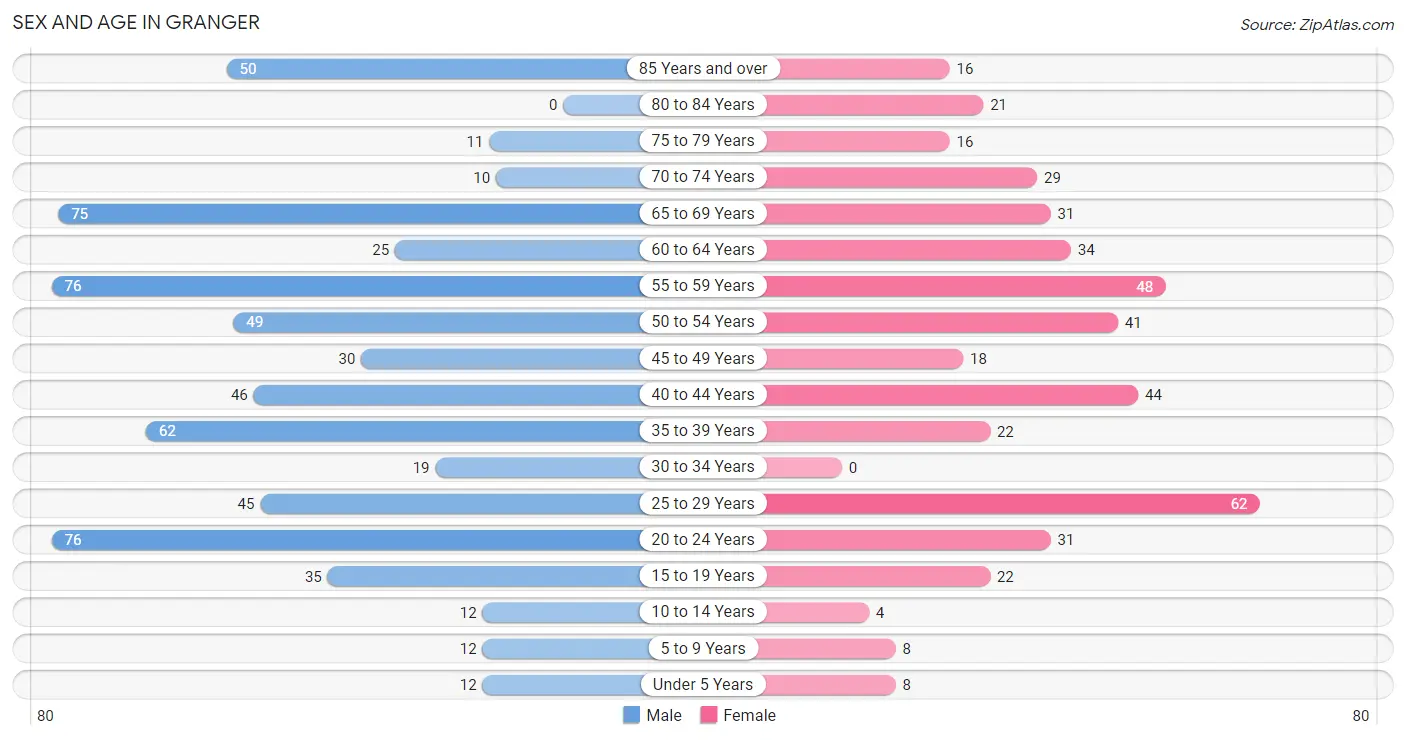
Sex and Age in Granger
Sex and Age in Granger
The most populous age groups in Granger are 20 to 24 Years (76 | 11.8%) for men and 25 to 29 Years (62 | 13.6%) for women.
| Age Bracket | Male | Female |
| Under 5 Years | 12 (1.9%) | 8 (1.8%) |
| 5 to 9 Years | 12 (1.9%) | 8 (1.8%) |
| 10 to 14 Years | 12 (1.9%) | 4 (0.9%) |
| 15 to 19 Years | 35 (5.4%) | 22 (4.8%) |
| 20 to 24 Years | 76 (11.8%) | 31 (6.8%) |
| 25 to 29 Years | 45 (7.0%) | 62 (13.6%) |
| 30 to 34 Years | 19 (2.9%) | 0 (0.0%) |
| 35 to 39 Years | 62 (9.6%) | 22 (4.8%) |
| 40 to 44 Years | 46 (7.1%) | 44 (9.7%) |
| 45 to 49 Years | 30 (4.6%) | 18 (4.0%) |
| 50 to 54 Years | 49 (7.6%) | 41 (9.0%) |
| 55 to 59 Years | 76 (11.8%) | 48 (10.5%) |
| 60 to 64 Years | 25 (3.9%) | 34 (7.5%) |
| 65 to 69 Years | 75 (11.6%) | 31 (6.8%) |
| 70 to 74 Years | 10 (1.5%) | 29 (6.4%) |
| 75 to 79 Years | 11 (1.7%) | 16 (3.5%) |
| 80 to 84 Years | 0 (0.0%) | 21 (4.6%) |
| 85 Years and over | 50 (7.7%) | 16 (3.5%) |
| Total | 645 (100.0%) | 455 (100.0%) |
Families and Households in Granger
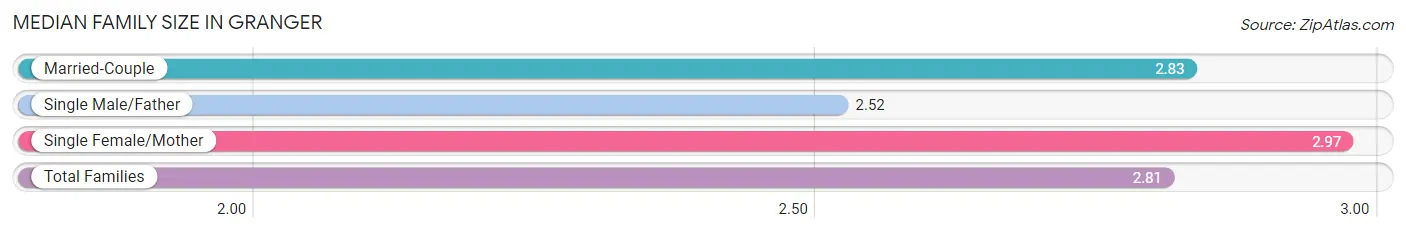
Median Family Size in Granger
The median family size in Granger is 2.81 persons per family, with single female/mother families (31 | 13.6%) accounting for the largest median family size of 2.97 persons per family. On the other hand, single male/father families (29 | 12.7%) represent the smallest median family size with 2.52 persons per family.
| Family Type | # Families | Family Size |
| Married-Couple | 168 (73.7%) | 2.83 |
| Single Male/Father | 29 (12.7%) | 2.52 |
| Single Female/Mother | 31 (13.6%) | 2.97 |
| Total Families | 228 (100.0%) | 2.81 |
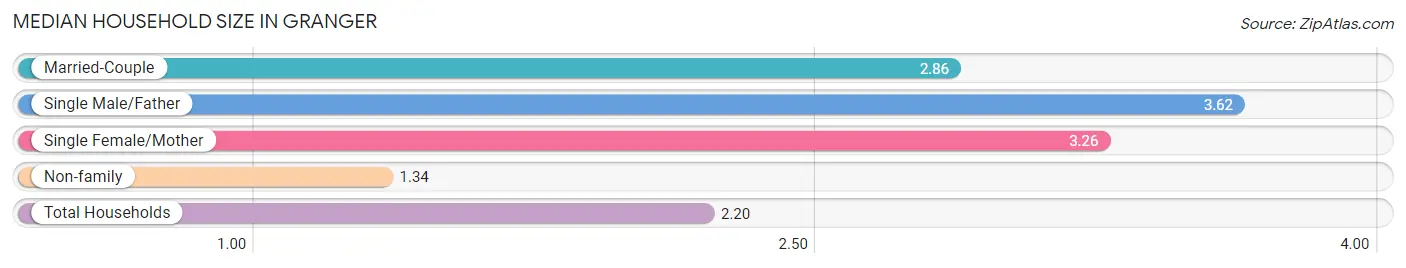
Median Household Size in Granger
The median household size in Granger is 2.20 persons per household, with single male/father households (29 | 6.5%) accounting for the largest median household size of 3.62 persons per household. non-family households (217 | 48.8%) represent the smallest median household size with 1.34 persons per household.
| Household Type | # Households | Household Size |
| Married-Couple | 168 (37.8%) | 2.86 |
| Single Male/Father | 29 (6.5%) | 3.62 |
| Single Female/Mother | 31 (7.0%) | 3.26 |
| Non-family | 217 (48.8%) | 1.34 |
| Total Households | 445 (100.0%) | 2.20 |
Household Size by Marriage Status in Granger
Out of a total of 445 households in Granger, 228 (51.2%) are family households, while 217 (48.8%) are nonfamily households. The most numerous type of family households are 2-person households, comprising 110, and the most common type of nonfamily households are 1-person households, comprising 176.
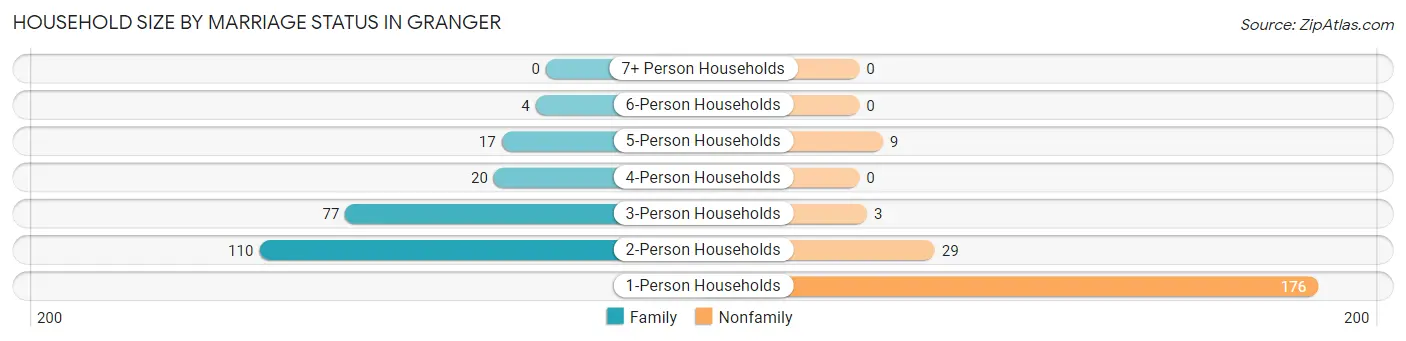
| Household Size | Family Households | Nonfamily Households |
| 1-Person Households | - | 176 (39.6%) |
| 2-Person Households | 110 (24.7%) | 29 (6.5%) |
| 3-Person Households | 77 (17.3%) | 3 (0.7%) |
| 4-Person Households | 20 (4.5%) | 0 (0.0%) |
| 5-Person Households | 17 (3.8%) | 9 (2.0%) |
| 6-Person Households | 4 (0.9%) | 0 (0.0%) |
| 7+ Person Households | 0 (0.0%) | 0 (0.0%) |
| Total | 228 (51.2%) | 217 (48.8%) |
Female Fertility in Granger
Fertility by Age in Granger
| Age Bracket | Women with Births | Births / 1,000 Women |
| 15 to 19 years | 0 (0.0%) | 0.0 |
| 20 to 34 years | 0 (0.0%) | 0.0 |
| 35 to 50 years | 0 (0.0%) | 0.0 |
| Total | 0 (0.0%) | 0.0 |
Fertility by Age by Marriage Status in Granger
| Age Bracket | Married | Unmarried |
| 15 to 19 years | 0 (0.0%) | 0 (0.0%) |
| 20 to 34 years | 0 (0.0%) | 0 (0.0%) |
| 35 to 50 years | 0 (0.0%) | 0 (0.0%) |
| Total | 0 (0.0%) | 0 (0.0%) |
Fertility by Education in Granger
| Educational Attainment | Women with Births | Births / 1,000 Women |
| Less than High School | 0 (0.0%) | 0.0 |
| High School Diploma | 0 (0.0%) | 0.0 |
| College or Associate's Degree | 0 (0.0%) | 0.0 |
| Bachelor's Degree | 0 (0.0%) | 0.0 |
| Graduate Degree | 0 (0.0%) | 0.0 |
| Total | 0 (0.0%) | 0.0 |
Fertility by Education by Marriage Status in Granger
| Educational Attainment | Married | Unmarried |
| Less than High School | 0 (0.0%) | 0 (0.0%) |
| High School Diploma | 0 (0.0%) | 0 (0.0%) |
| College or Associate's Degree | 0 (0.0%) | 0 (0.0%) |
| Bachelor's Degree | 0 (0.0%) | 0 (0.0%) |
| Graduate Degree | 0 (0.0%) | 0 (0.0%) |
| Total | 0 (0.0%) | 0 (0.0%) |
Employment Characteristics in Granger
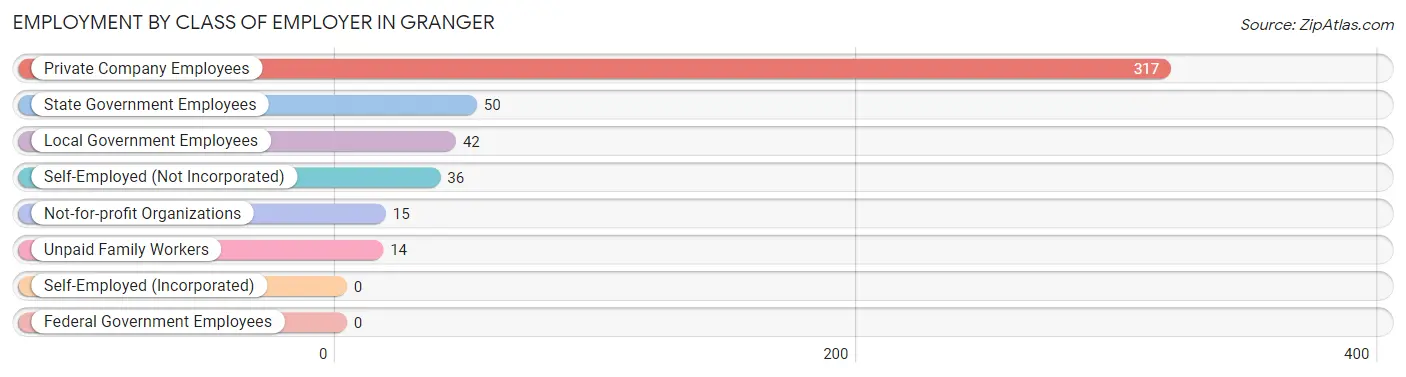
Employment by Class of Employer in Granger
Among the 474 employed individuals in Granger, private company employees (317 | 66.9%), state government employees (50 | 10.5%), and local government employees (42 | 8.9%) make up the most common classes of employment.
| Employer Class | # Employees | % Employees |
| Private Company Employees | 317 | 66.9% |
| Self-Employed (Incorporated) | 0 | 0.0% |
| Self-Employed (Not Incorporated) | 36 | 7.6% |
| Not-for-profit Organizations | 15 | 3.2% |
| Local Government Employees | 42 | 8.9% |
| State Government Employees | 50 | 10.5% |
| Federal Government Employees | 0 | 0.0% |
| Unpaid Family Workers | 14 | 2.9% |
| Total | 474 | 100.0% |
Employment Status by Age in Granger
According to the labor force statistics for Granger, out of the total population over 16 years of age (1,030), 52.0% or 536 individuals are in the labor force, with 8.2% or 44 of them unemployed. The age group with the highest labor force participation rate is 45 to 54 years, with 79.0% or 109 individuals in the labor force. Within the labor force, the 65 to 74 years age range has the highest percentage of unemployed individuals, with 40.0% or 8 of them being unemployed.
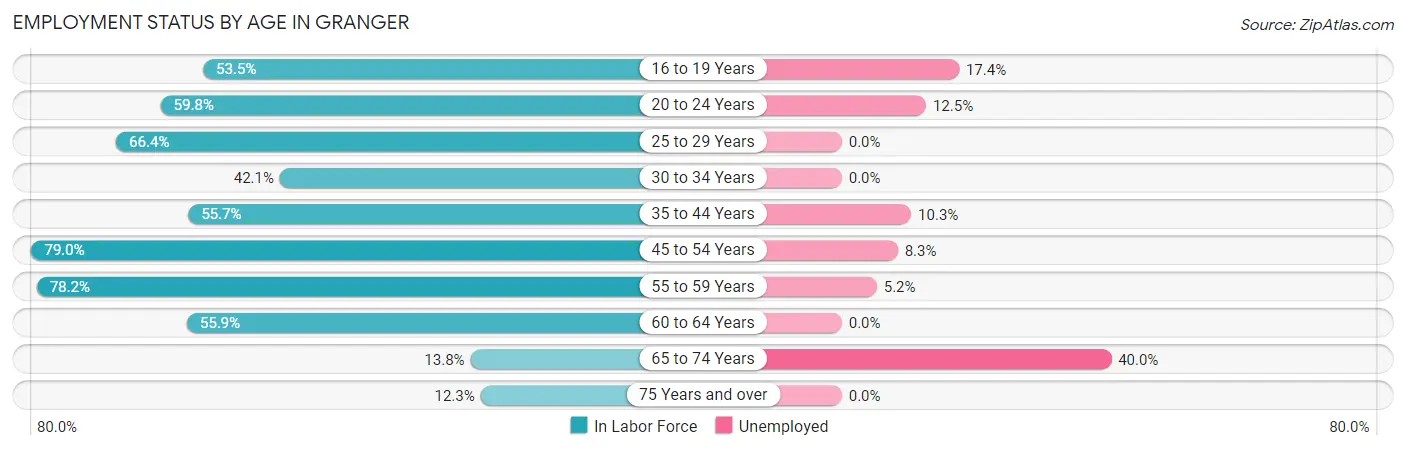
| Age Bracket | In Labor Force | Unemployed |
| 16 to 19 Years | 23 (53.5%) | 4 (17.4%) |
| 20 to 24 Years | 64 (59.8%) | 8 (12.5%) |
| 25 to 29 Years | 71 (66.4%) | 0 (0.0%) |
| 30 to 34 Years | 8 (42.1%) | 0 (0.0%) |
| 35 to 44 Years | 97 (55.7%) | 10 (10.3%) |
| 45 to 54 Years | 109 (79.0%) | 9 (8.3%) |
| 55 to 59 Years | 97 (78.2%) | 5 (5.2%) |
| 60 to 64 Years | 33 (55.9%) | 0 (0.0%) |
| 65 to 74 Years | 20 (13.8%) | 8 (40.0%) |
| 75 Years and over | 14 (12.3%) | 0 (0.0%) |
| Total | 536 (52.0%) | 44 (8.2%) |
Employment Status by Educational Attainment in Granger
According to labor force statistics for Granger, 66.8% of individuals (415) out of the total population between 25 and 64 years of age (621) are in the labor force, with 5.8% or 24 of them being unemployed. The group with the highest labor force participation rate are those with the educational attainment of high school diploma, with 78.2% or 205 individuals in the labor force. Within the labor force, individuals with high school diploma education have the highest percentage of unemployment, with 7.3% or 15 of them being unemployed.
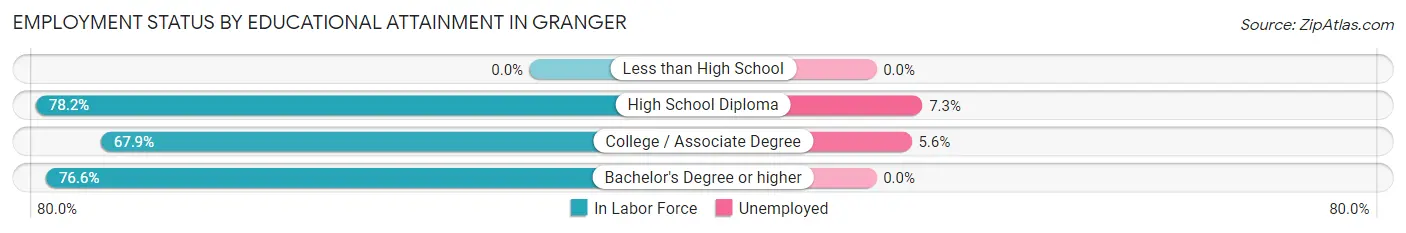
| Educational Attainment | In Labor Force | Unemployed |
| Less than High School | 0 (0.0%) | 0 (0.0%) |
| High School Diploma | 205 (78.2%) | 19 (7.3%) |
| College / Associate Degree | 161 (67.9%) | 13 (5.6%) |
| Bachelor's Degree or higher | 49 (76.6%) | 0 (0.0%) |
| Total | 415 (66.8%) | 36 (5.8%) |
Employment Occupations by Sex in Granger
Management, Business, Science and Arts Occupations
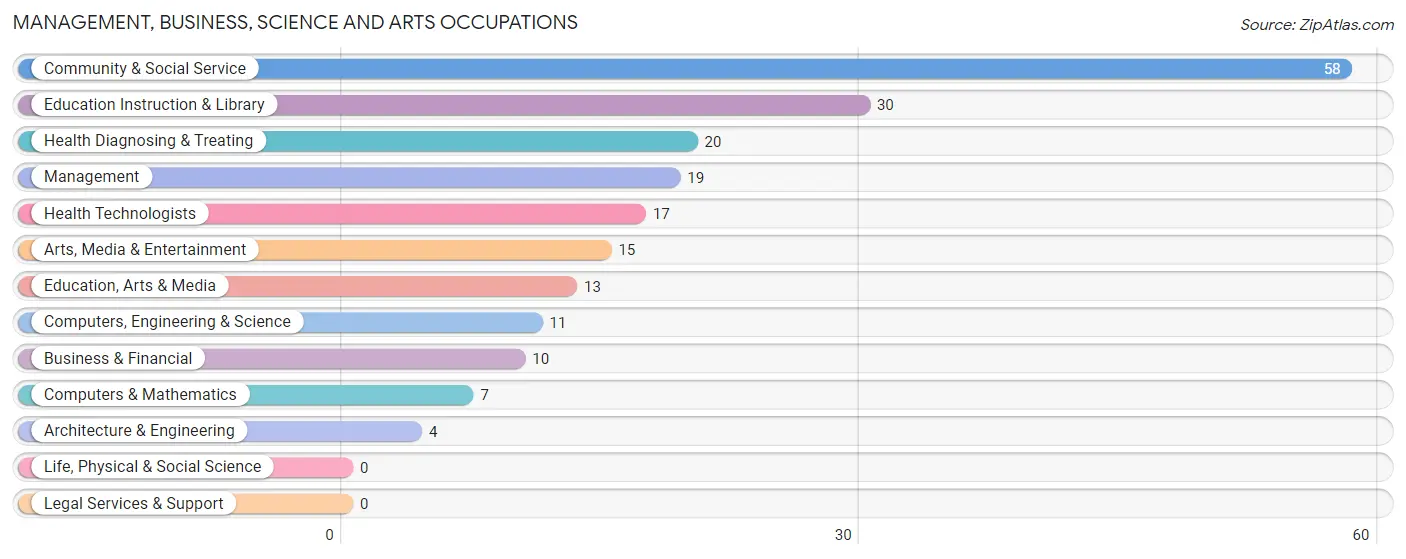
The most common Management, Business, Science and Arts occupations in Granger are Community & Social Service (58 | 11.8%), Education Instruction & Library (30 | 6.1%), Health Diagnosing & Treating (20 | 4.1%), Management (19 | 3.9%), and Health Technologists (17 | 3.5%).
Management, Business, Science and Arts Occupations by Sex
Within the Management, Business, Science and Arts occupations in Granger, the most male-oriented occupations are Architecture & Engineering (100.0%), Health Technologists (82.4%), and Health Diagnosing & Treating (70.0%), while the most female-oriented occupations are Computers & Mathematics (100.0%), Education Instruction & Library (86.7%), and Computers, Engineering & Science (63.6%).
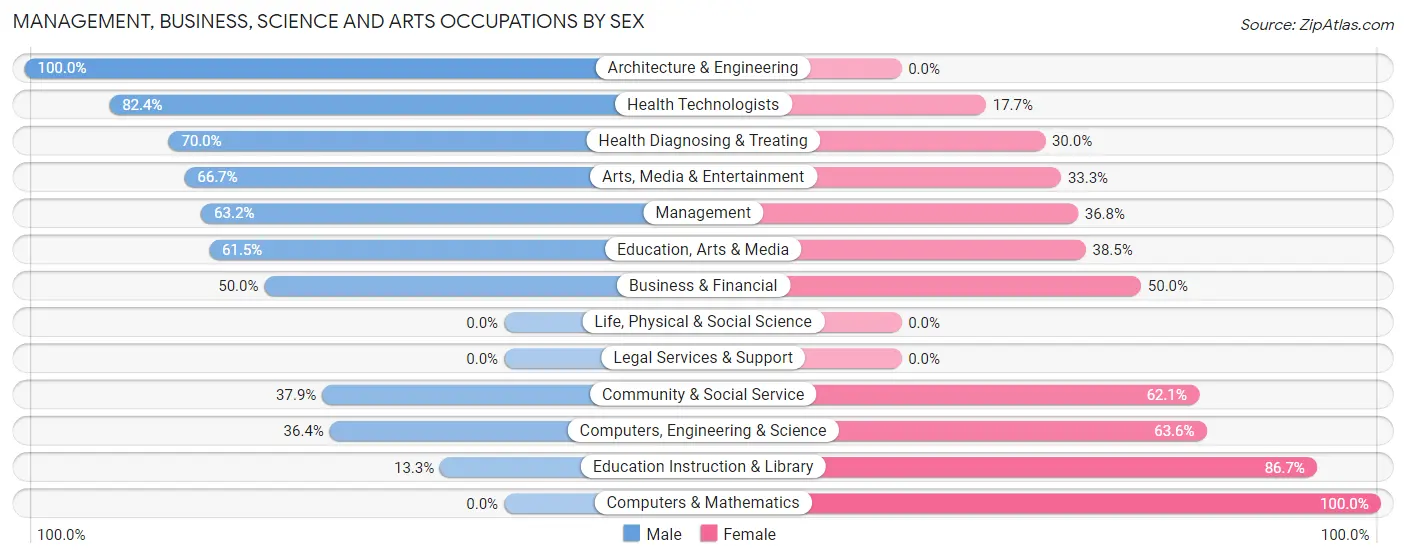
| Occupation | Male | Female |
| Management | 12 (63.2%) | 7 (36.8%) |
| Business & Financial | 5 (50.0%) | 5 (50.0%) |
| Computers, Engineering & Science | 4 (36.4%) | 7 (63.6%) |
| Computers & Mathematics | 0 (0.0%) | 7 (100.0%) |
| Architecture & Engineering | 4 (100.0%) | 0 (0.0%) |
| Life, Physical & Social Science | 0 (0.0%) | 0 (0.0%) |
| Community & Social Service | 22 (37.9%) | 36 (62.1%) |
| Education, Arts & Media | 8 (61.5%) | 5 (38.5%) |
| Legal Services & Support | 0 (0.0%) | 0 (0.0%) |
| Education Instruction & Library | 4 (13.3%) | 26 (86.7%) |
| Arts, Media & Entertainment | 10 (66.7%) | 5 (33.3%) |
| Health Diagnosing & Treating | 14 (70.0%) | 6 (30.0%) |
| Health Technologists | 14 (82.4%) | 3 (17.6%) |
| Total (Category) | 57 (48.3%) | 61 (51.7%) |
| Total (Overall) | 294 (59.8%) | 198 (40.2%) |
Services Occupations
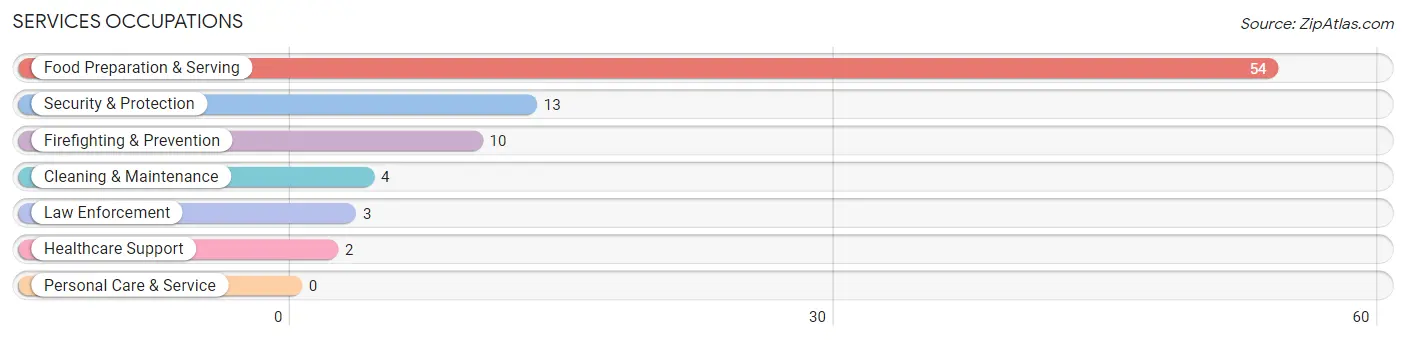
The most common Services occupations in Granger are Food Preparation & Serving (54 | 11.0%), Security & Protection (13 | 2.6%), Firefighting & Prevention (10 | 2.0%), Cleaning & Maintenance (4 | 0.8%), and Law Enforcement (3 | 0.6%).
Services Occupations by Sex
Within the Services occupations in Granger, the most male-oriented occupations are Firefighting & Prevention (100.0%), Security & Protection (76.9%), and Food Preparation & Serving (27.8%), while the most female-oriented occupations are Healthcare Support (100.0%), Law Enforcement (100.0%), and Cleaning & Maintenance (100.0%).
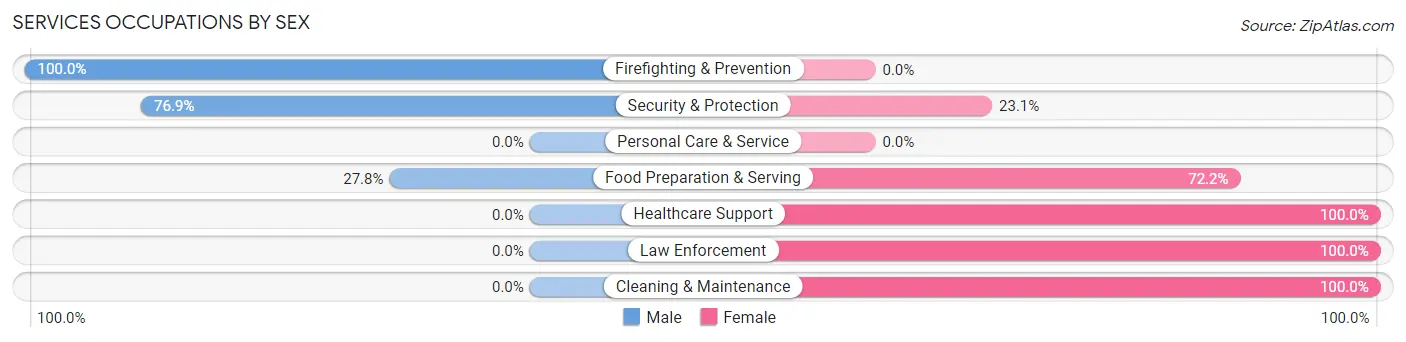
| Occupation | Male | Female |
| Healthcare Support | 0 (0.0%) | 2 (100.0%) |
| Security & Protection | 10 (76.9%) | 3 (23.1%) |
| Firefighting & Prevention | 10 (100.0%) | 0 (0.0%) |
| Law Enforcement | 0 (0.0%) | 3 (100.0%) |
| Food Preparation & Serving | 15 (27.8%) | 39 (72.2%) |
| Cleaning & Maintenance | 0 (0.0%) | 4 (100.0%) |
| Personal Care & Service | 0 (0.0%) | 0 (0.0%) |
| Total (Category) | 25 (34.3%) | 48 (65.7%) |
| Total (Overall) | 294 (59.8%) | 198 (40.2%) |
Sales and Office Occupations
The most common Sales and Office occupations in Granger are Office & Administration (74 | 15.0%), and Sales & Related (30 | 6.1%).
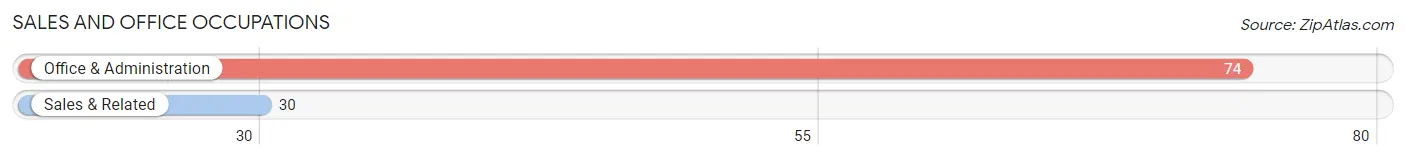
Sales and Office Occupations by Sex
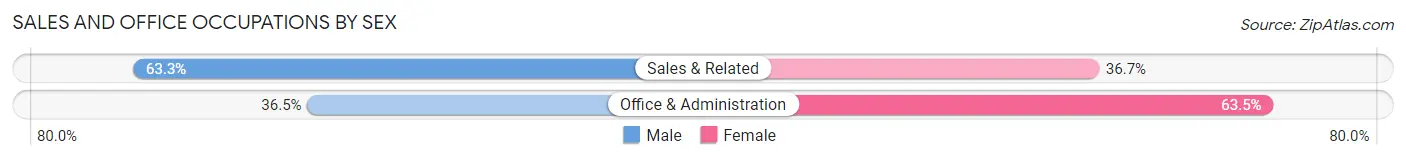
| Occupation | Male | Female |
| Sales & Related | 19 (63.3%) | 11 (36.7%) |
| Office & Administration | 27 (36.5%) | 47 (63.5%) |
| Total (Category) | 46 (44.2%) | 58 (55.8%) |
| Total (Overall) | 294 (59.8%) | 198 (40.2%) |
Natural Resources, Construction and Maintenance Occupations
The most common Natural Resources, Construction and Maintenance occupations in Granger are Construction & Extraction (76 | 15.4%), and Installation, Maintenance & Repair (42 | 8.5%).
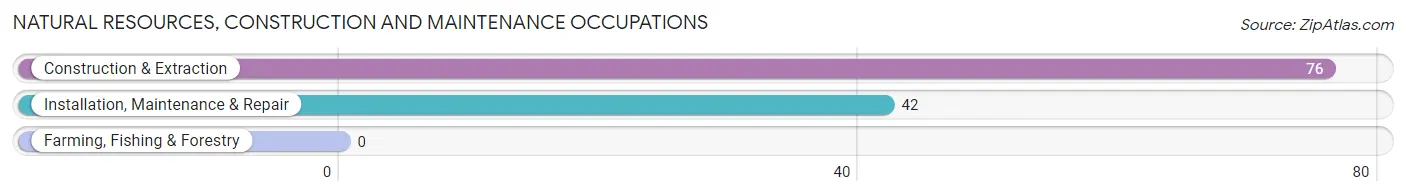
Natural Resources, Construction and Maintenance Occupations by Sex
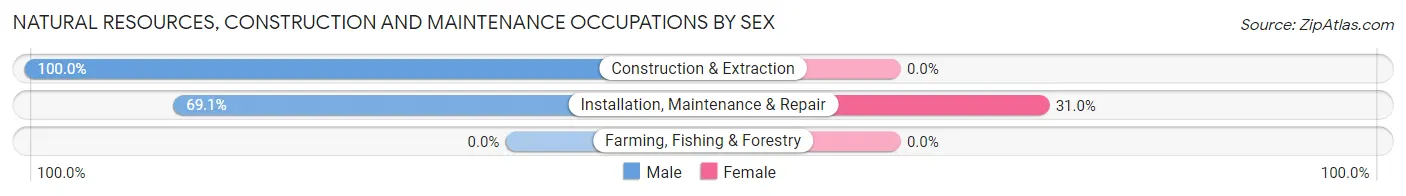
| Occupation | Male | Female |
| Farming, Fishing & Forestry | 0 (0.0%) | 0 (0.0%) |
| Construction & Extraction | 76 (100.0%) | 0 (0.0%) |
| Installation, Maintenance & Repair | 29 (69.1%) | 13 (30.9%) |
| Total (Category) | 105 (89.0%) | 13 (11.0%) |
| Total (Overall) | 294 (59.8%) | 198 (40.2%) |
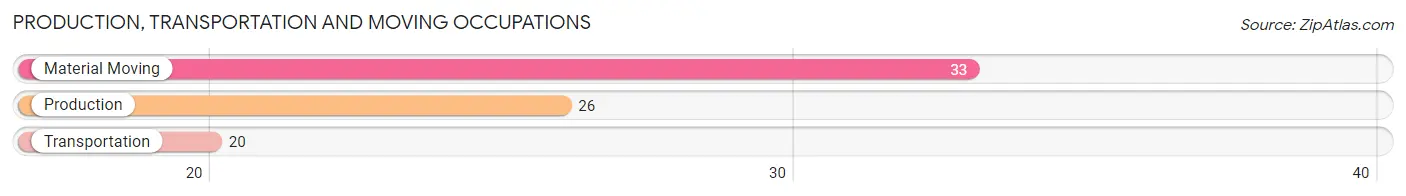
Production, Transportation and Moving Occupations
The most common Production, Transportation and Moving occupations in Granger are Material Moving (33 | 6.7%), Production (26 | 5.3%), and Transportation (20 | 4.1%).
Production, Transportation and Moving Occupations by Sex
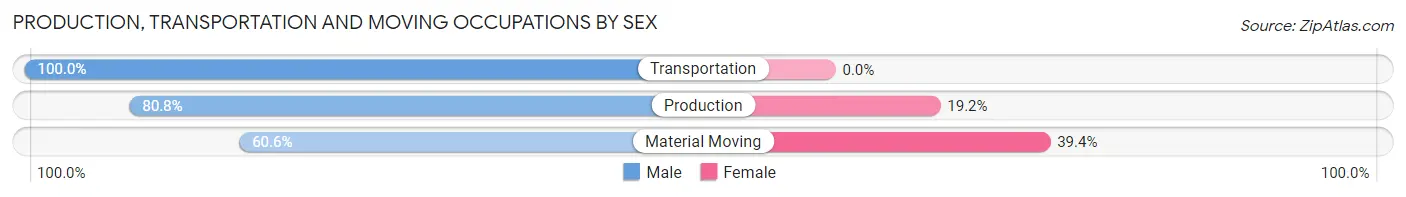
| Occupation | Male | Female |
| Production | 21 (80.8%) | 5 (19.2%) |
| Transportation | 20 (100.0%) | 0 (0.0%) |
| Material Moving | 20 (60.6%) | 13 (39.4%) |
| Total (Category) | 61 (77.2%) | 18 (22.8%) |
| Total (Overall) | 294 (59.8%) | 198 (40.2%) |
Employment Industries by Sex in Granger
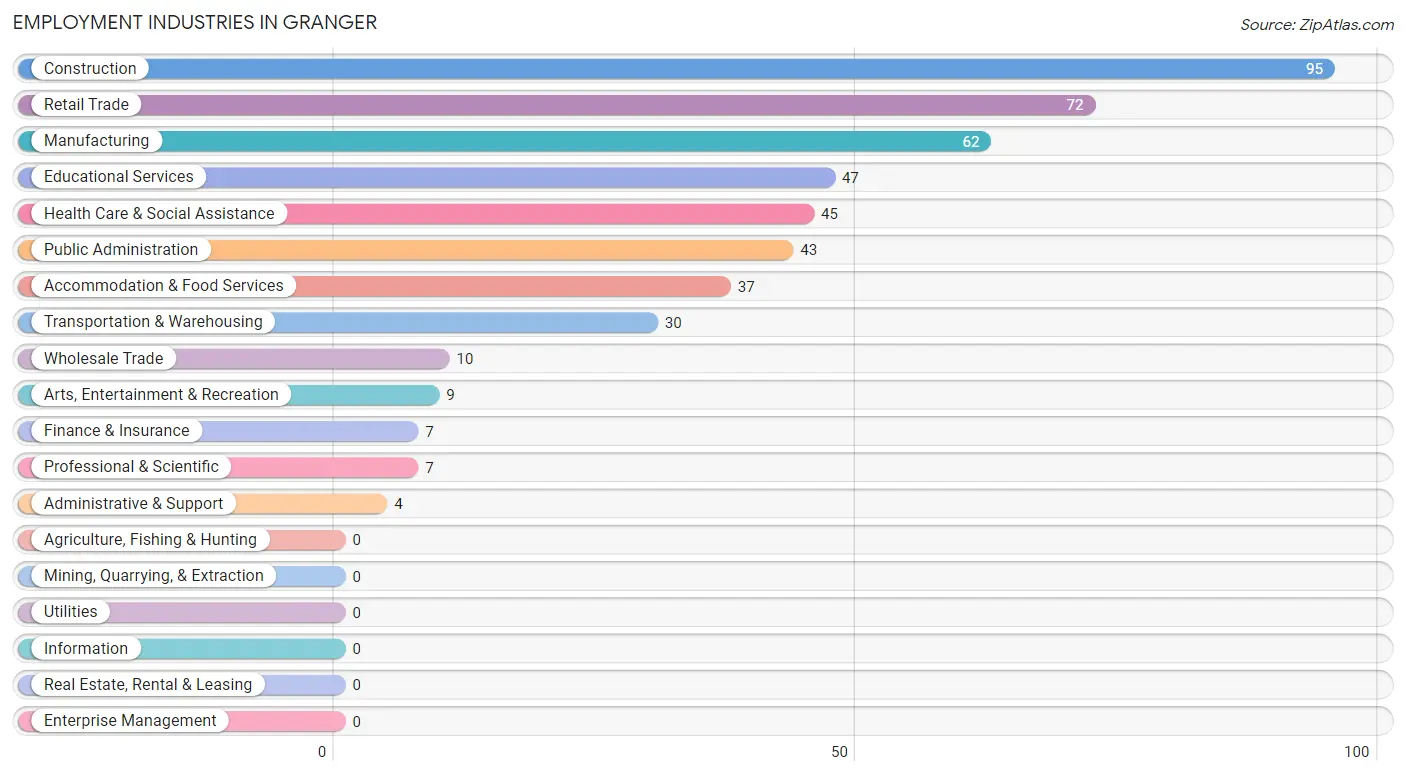
Employment Industries in Granger
The major employment industries in Granger include Construction (95 | 19.3%), Retail Trade (72 | 14.6%), Manufacturing (62 | 12.6%), Educational Services (47 | 9.6%), and Health Care & Social Assistance (45 | 9.1%).
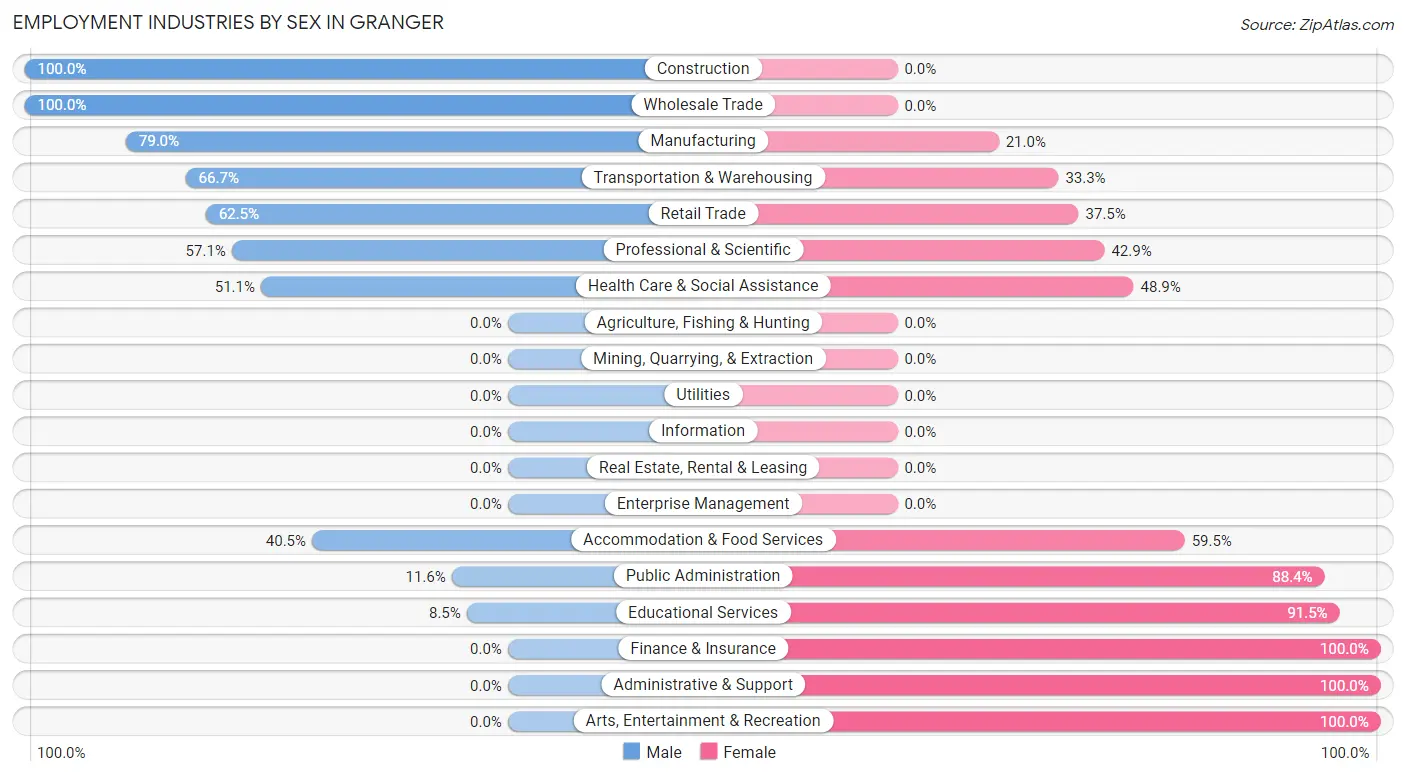
Employment Industries by Sex in Granger
The Granger industries that see more men than women are Construction (100.0%), Wholesale Trade (100.0%), and Manufacturing (79.0%), whereas the industries that tend to have a higher number of women are Finance & Insurance (100.0%), Administrative & Support (100.0%), and Arts, Entertainment & Recreation (100.0%).
| Industry | Male | Female |
| Agriculture, Fishing & Hunting | 0 (0.0%) | 0 (0.0%) |
| Mining, Quarrying, & Extraction | 0 (0.0%) | 0 (0.0%) |
| Construction | 95 (100.0%) | 0 (0.0%) |
| Manufacturing | 49 (79.0%) | 13 (21.0%) |
| Wholesale Trade | 10 (100.0%) | 0 (0.0%) |
| Retail Trade | 45 (62.5%) | 27 (37.5%) |
| Transportation & Warehousing | 20 (66.7%) | 10 (33.3%) |
| Utilities | 0 (0.0%) | 0 (0.0%) |
| Information | 0 (0.0%) | 0 (0.0%) |
| Finance & Insurance | 0 (0.0%) | 7 (100.0%) |
| Real Estate, Rental & Leasing | 0 (0.0%) | 0 (0.0%) |
| Professional & Scientific | 4 (57.1%) | 3 (42.9%) |
| Enterprise Management | 0 (0.0%) | 0 (0.0%) |
| Administrative & Support | 0 (0.0%) | 4 (100.0%) |
| Educational Services | 4 (8.5%) | 43 (91.5%) |
| Health Care & Social Assistance | 23 (51.1%) | 22 (48.9%) |
| Arts, Entertainment & Recreation | 0 (0.0%) | 9 (100.0%) |
| Accommodation & Food Services | 15 (40.5%) | 22 (59.5%) |
| Public Administration | 5 (11.6%) | 38 (88.4%) |
| Total | 294 (59.8%) | 198 (40.2%) |
Education in Granger
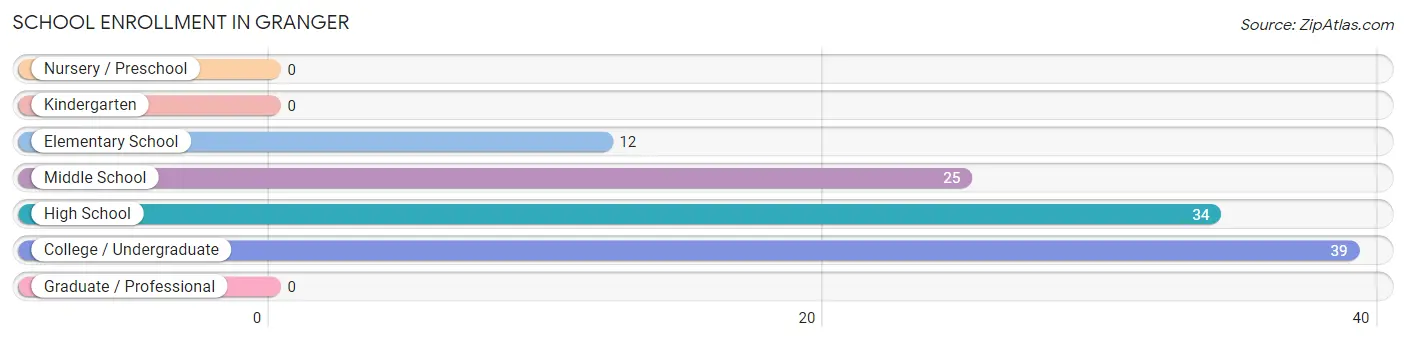
School Enrollment in Granger
The most common levels of schooling among the 110 students in Granger are college / undergraduate (39 | 35.4%), high school (34 | 30.9%), and middle school (25 | 22.7%).
| School Level | # Students | % Students |
| Nursery / Preschool | 0 | 0.0% |
| Kindergarten | 0 | 0.0% |
| Elementary School | 12 | 10.9% |
| Middle School | 25 | 22.7% |
| High School | 34 | 30.9% |
| College / Undergraduate | 39 | 35.4% |
| Graduate / Professional | 0 | 0.0% |
| Total | 110 | 100.0% |
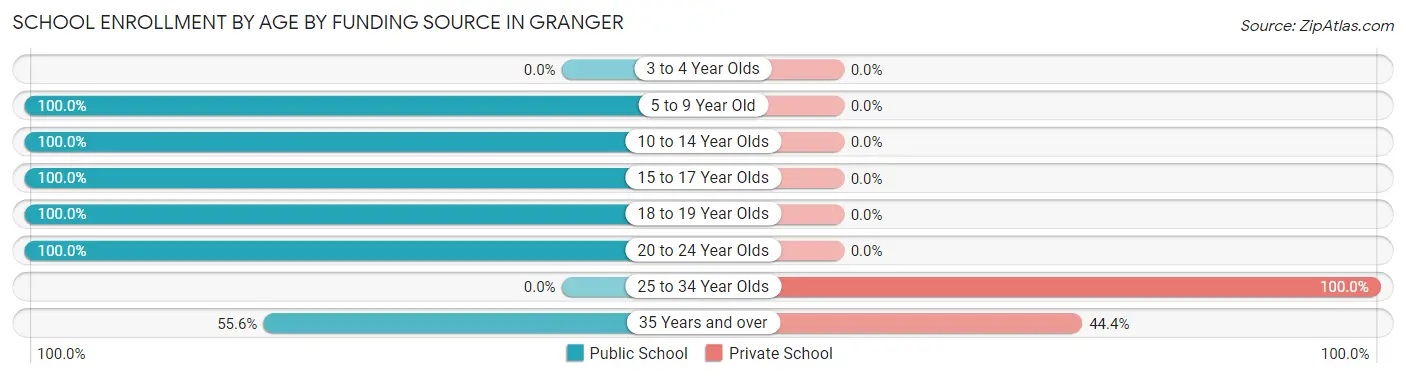
School Enrollment by Age by Funding Source in Granger
Out of a total of 110 students who are enrolled in schools in Granger, 26 (23.6%) attend a private institution, while the remaining 84 (76.4%) are enrolled in public schools. The age group of 25 to 34 year olds has the highest likelihood of being enrolled in private schools, with 22 (100.0% in the age bracket) enrolled. Conversely, the age group of 5 to 9 year old has the lowest likelihood of being enrolled in a private school, with 16 (100.0% in the age bracket) attending a public institution.
| Age Bracket | Public School | Private School |
| 3 to 4 Year Olds | 0 (0.0%) | 0 (0.0%) |
| 5 to 9 Year Old | 16 (100.0%) | 0 (0.0%) |
| 10 to 14 Year Olds | 16 (100.0%) | 0 (0.0%) |
| 15 to 17 Year Olds | 30 (100.0%) | 0 (0.0%) |
| 18 to 19 Year Olds | 11 (100.0%) | 0 (0.0%) |
| 20 to 24 Year Olds | 6 (100.0%) | 0 (0.0%) |
| 25 to 34 Year Olds | 0 (0.0%) | 22 (100.0%) |
| 35 Years and over | 5 (55.6%) | 4 (44.4%) |
| Total | 84 (76.4%) | 26 (23.6%) |
Educational Attainment by Field of Study in Granger
Education (46 | 43.0%), business (19 | 17.8%), engineering (9 | 8.4%), arts & humanities (8 | 7.5%), and bio, nature & agricultural (7 | 6.5%) are the most common fields of study among 107 individuals in Granger who have obtained a bachelor's degree or higher.
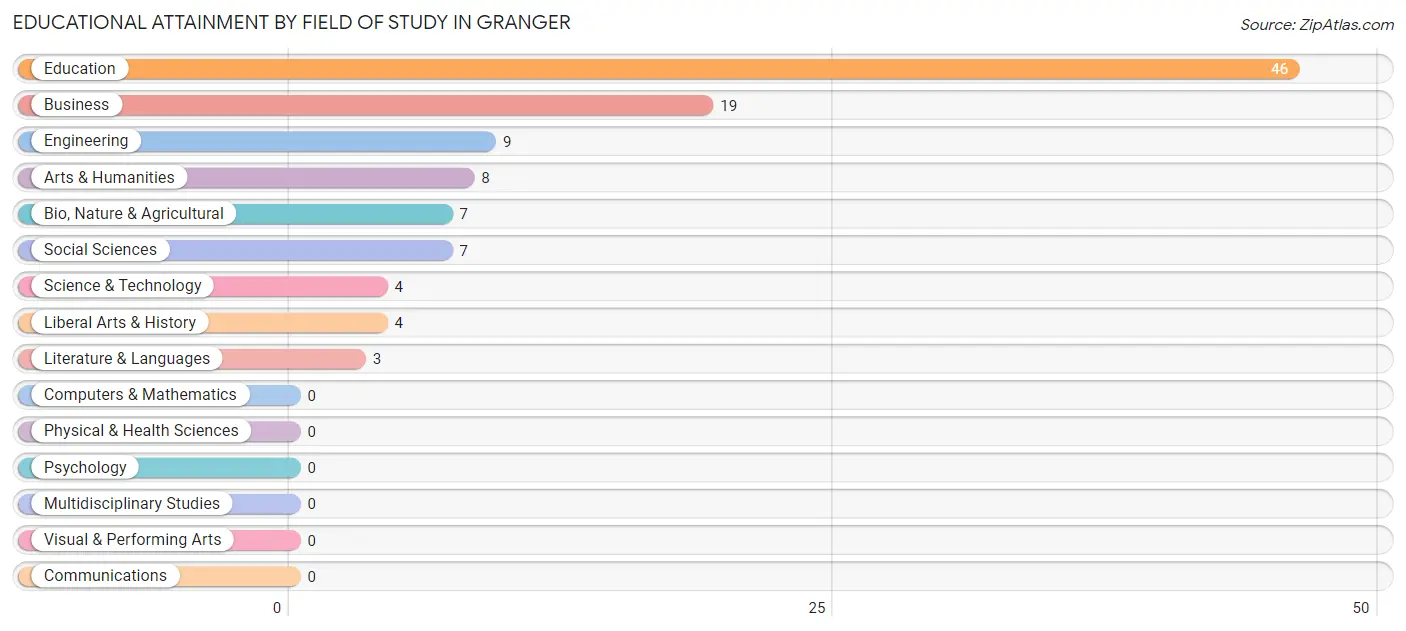
| Field of Study | # Graduates | % Graduates |
| Computers & Mathematics | 0 | 0.0% |
| Bio, Nature & Agricultural | 7 | 6.5% |
| Physical & Health Sciences | 0 | 0.0% |
| Psychology | 0 | 0.0% |
| Social Sciences | 7 | 6.5% |
| Engineering | 9 | 8.4% |
| Multidisciplinary Studies | 0 | 0.0% |
| Science & Technology | 4 | 3.7% |
| Business | 19 | 17.8% |
| Education | 46 | 43.0% |
| Literature & Languages | 3 | 2.8% |
| Liberal Arts & History | 4 | 3.7% |
| Visual & Performing Arts | 0 | 0.0% |
| Communications | 0 | 0.0% |
| Arts & Humanities | 8 | 7.5% |
| Total | 107 | 100.0% |
Transportation & Commute in Granger
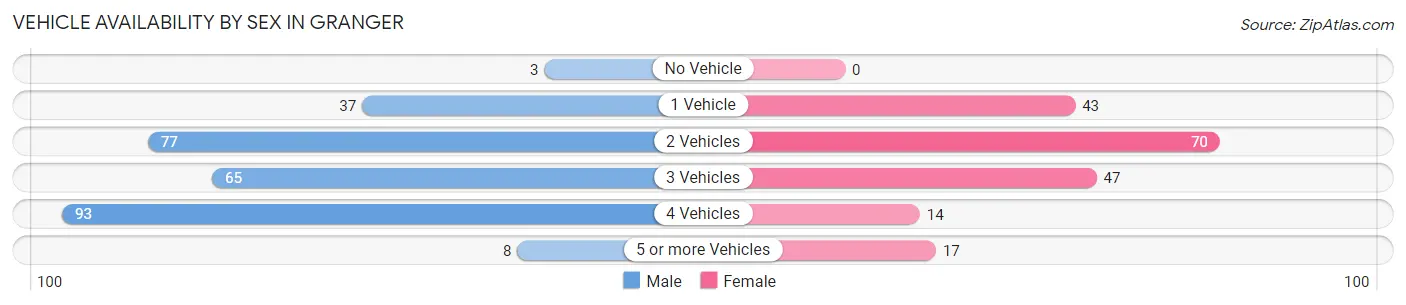
Vehicle Availability by Sex in Granger
The most prevalent vehicle ownership categories in Granger are males with 4 vehicles (93, accounting for 32.9%) and females with 4 vehicles (14, making up 48.7%).
| Vehicles Available | Male | Female |
| No Vehicle | 3 (1.1%) | 0 (0.0%) |
| 1 Vehicle | 37 (13.1%) | 43 (22.5%) |
| 2 Vehicles | 77 (27.2%) | 70 (36.6%) |
| 3 Vehicles | 65 (23.0%) | 47 (24.6%) |
| 4 Vehicles | 93 (32.9%) | 14 (7.3%) |
| 5 or more Vehicles | 8 (2.8%) | 17 (8.9%) |
| Total | 283 (100.0%) | 191 (100.0%) |
Commute Time in Granger
The most frequently occuring commute durations in Granger are 30 to 34 minutes (89 commuters, 19.1%), 15 to 19 minutes (59 commuters, 12.7%), and 45 to 59 minutes (53 commuters, 11.4%).
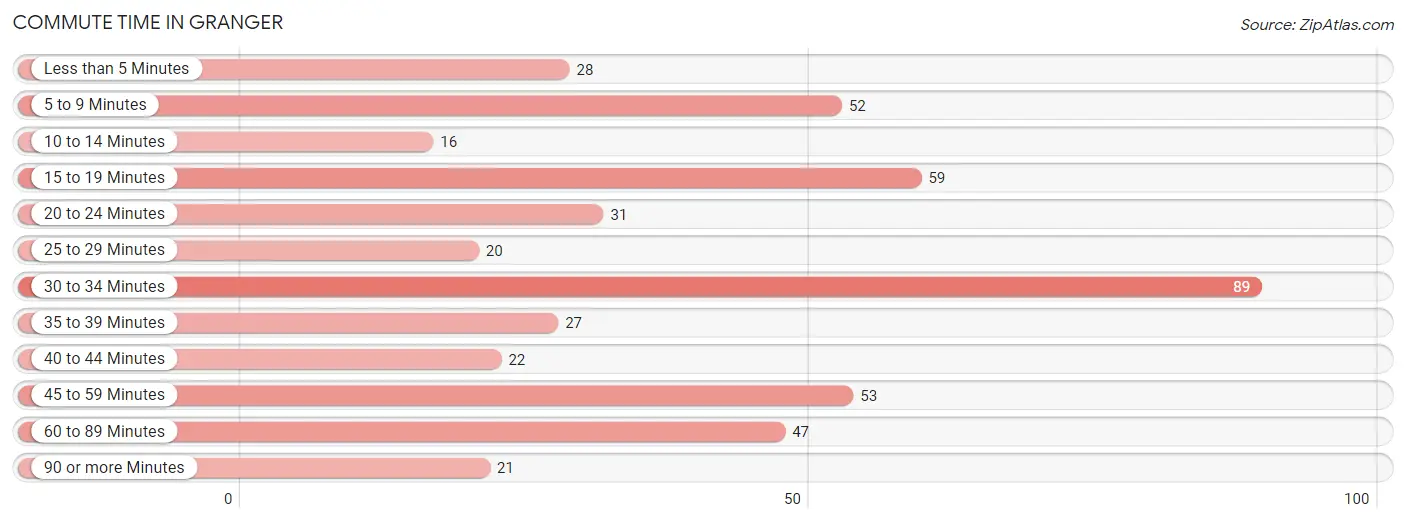
| Commute Time | # Commuters | % Commuters |
| Less than 5 Minutes | 28 | 6.0% |
| 5 to 9 Minutes | 52 | 11.2% |
| 10 to 14 Minutes | 16 | 3.4% |
| 15 to 19 Minutes | 59 | 12.7% |
| 20 to 24 Minutes | 31 | 6.7% |
| 25 to 29 Minutes | 20 | 4.3% |
| 30 to 34 Minutes | 89 | 19.1% |
| 35 to 39 Minutes | 27 | 5.8% |
| 40 to 44 Minutes | 22 | 4.7% |
| 45 to 59 Minutes | 53 | 11.4% |
| 60 to 89 Minutes | 47 | 10.1% |
| 90 or more Minutes | 21 | 4.5% |
Commute Time by Sex in Granger
The most common commute times in Granger are 30 to 34 minutes (55 commuters, 19.6%) for males and 5 to 9 minutes (44 commuters, 23.8%) for females.
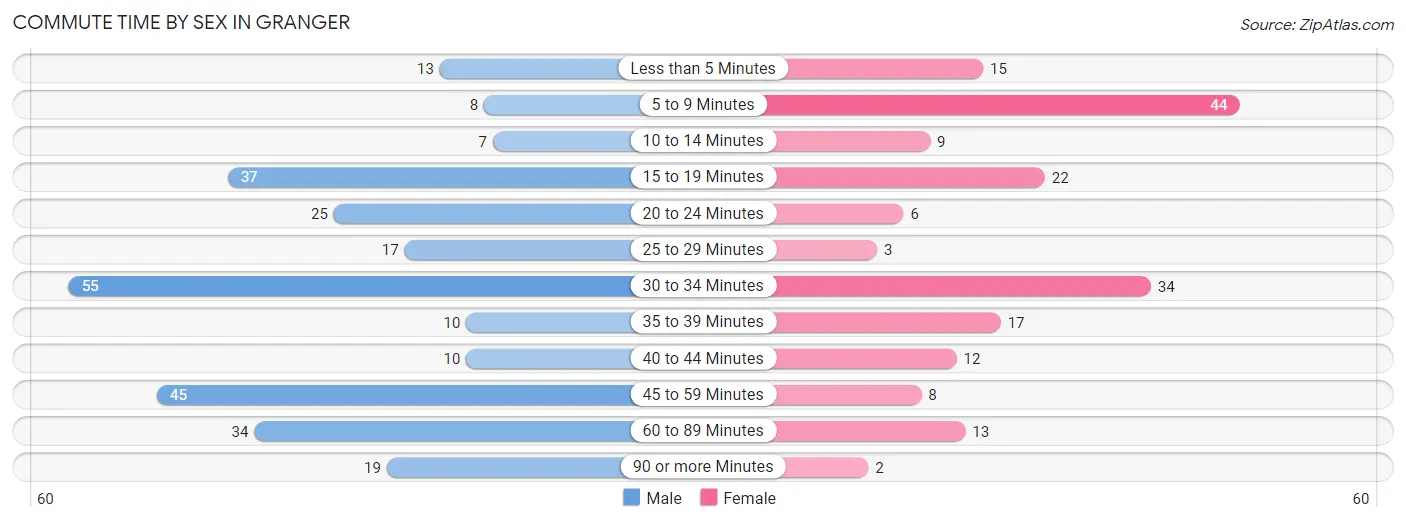
| Commute Time | Male | Female |
| Less than 5 Minutes | 13 (4.6%) | 15 (8.1%) |
| 5 to 9 Minutes | 8 (2.9%) | 44 (23.8%) |
| 10 to 14 Minutes | 7 (2.5%) | 9 (4.9%) |
| 15 to 19 Minutes | 37 (13.2%) | 22 (11.9%) |
| 20 to 24 Minutes | 25 (8.9%) | 6 (3.2%) |
| 25 to 29 Minutes | 17 (6.1%) | 3 (1.6%) |
| 30 to 34 Minutes | 55 (19.6%) | 34 (18.4%) |
| 35 to 39 Minutes | 10 (3.6%) | 17 (9.2%) |
| 40 to 44 Minutes | 10 (3.6%) | 12 (6.5%) |
| 45 to 59 Minutes | 45 (16.1%) | 8 (4.3%) |
| 60 to 89 Minutes | 34 (12.1%) | 13 (7.0%) |
| 90 or more Minutes | 19 (6.8%) | 2 (1.1%) |
Time of Departure to Work by Sex in Granger
The most frequent times of departure to work in Granger are 7:00 AM to 7:29 AM (68, 24.3%) for males and 7:00 AM to 7:29 AM (52, 28.1%) for females.
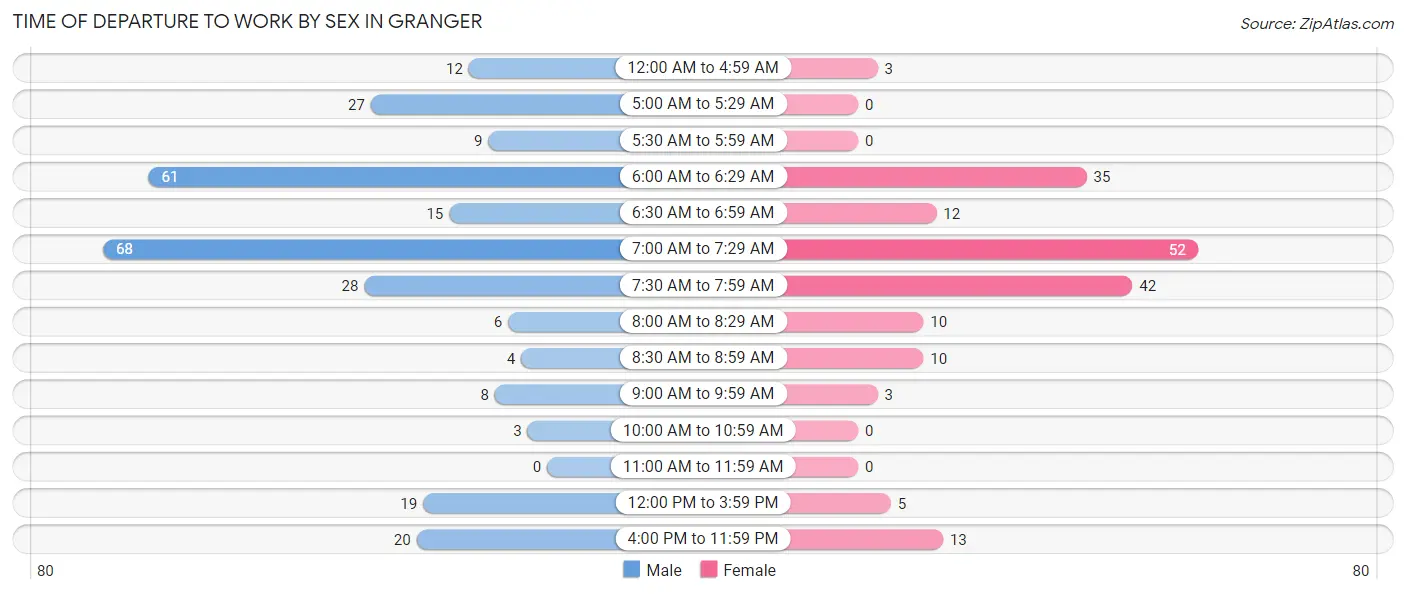
| Time of Departure | Male | Female |
| 12:00 AM to 4:59 AM | 12 (4.3%) | 3 (1.6%) |
| 5:00 AM to 5:29 AM | 27 (9.6%) | 0 (0.0%) |
| 5:30 AM to 5:59 AM | 9 (3.2%) | 0 (0.0%) |
| 6:00 AM to 6:29 AM | 61 (21.8%) | 35 (18.9%) |
| 6:30 AM to 6:59 AM | 15 (5.4%) | 12 (6.5%) |
| 7:00 AM to 7:29 AM | 68 (24.3%) | 52 (28.1%) |
| 7:30 AM to 7:59 AM | 28 (10.0%) | 42 (22.7%) |
| 8:00 AM to 8:29 AM | 6 (2.1%) | 10 (5.4%) |
| 8:30 AM to 8:59 AM | 4 (1.4%) | 10 (5.4%) |
| 9:00 AM to 9:59 AM | 8 (2.9%) | 3 (1.6%) |
| 10:00 AM to 10:59 AM | 3 (1.1%) | 0 (0.0%) |
| 11:00 AM to 11:59 AM | 0 (0.0%) | 0 (0.0%) |
| 12:00 PM to 3:59 PM | 19 (6.8%) | 5 (2.7%) |
| 4:00 PM to 11:59 PM | 20 (7.1%) | 13 (7.0%) |
| Total | 280 (100.0%) | 185 (100.0%) |
Housing Occupancy in Granger
Occupancy by Ownership in Granger
Of the total 445 dwellings in Granger, owner-occupied units account for 331 (74.4%), while renter-occupied units make up 114 (25.6%).
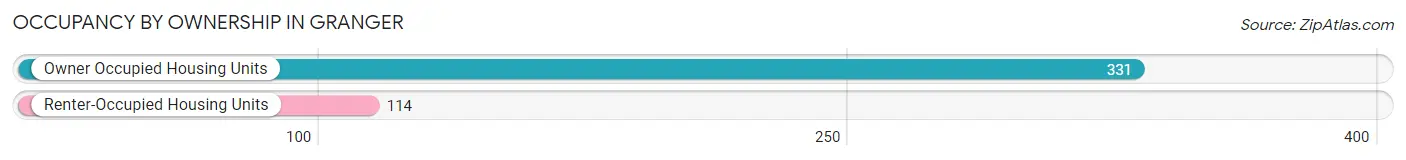
| Occupancy | # Housing Units | % Housing Units |
| Owner Occupied Housing Units | 331 | 74.4% |
| Renter-Occupied Housing Units | 114 | 25.6% |
| Total Occupied Housing Units | 445 | 100.0% |
Occupancy by Household Size in Granger
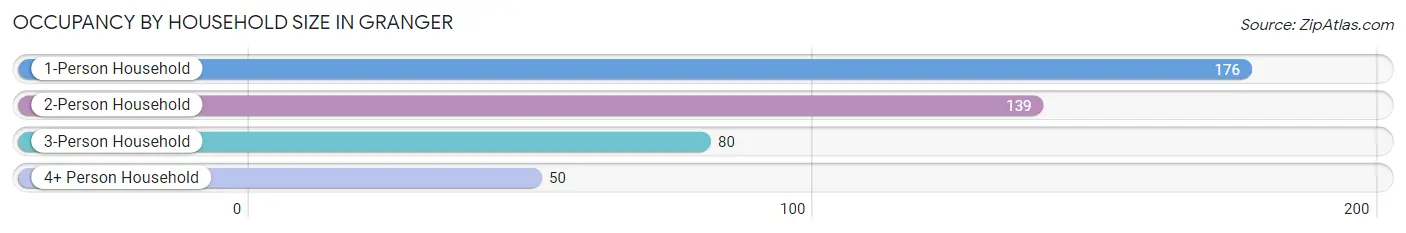
| Household Size | # Housing Units | % Housing Units |
| 1-Person Household | 176 | 39.6% |
| 2-Person Household | 139 | 31.2% |
| 3-Person Household | 80 | 18.0% |
| 4+ Person Household | 50 | 11.2% |
| Total Housing Units | 445 | 100.0% |
Occupancy by Ownership by Household Size in Granger
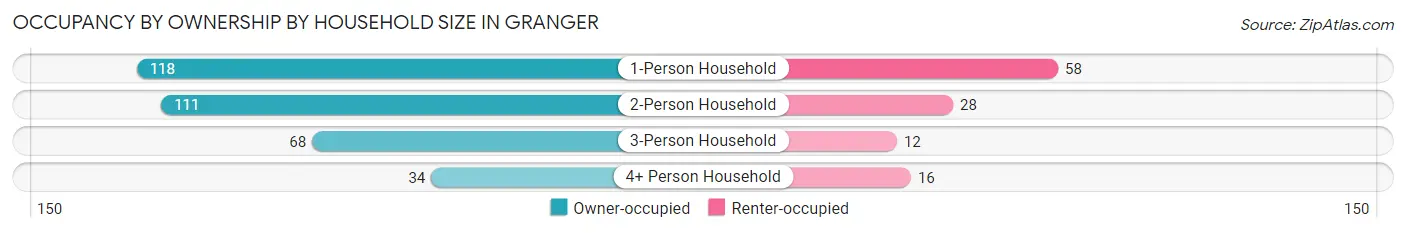
| Household Size | Owner-occupied | Renter-occupied |
| 1-Person Household | 118 (67.0%) | 58 (33.0%) |
| 2-Person Household | 111 (79.9%) | 28 (20.1%) |
| 3-Person Household | 68 (85.0%) | 12 (15.0%) |
| 4+ Person Household | 34 (68.0%) | 16 (32.0%) |
| Total Housing Units | 331 (74.4%) | 114 (25.6%) |
Occupancy by Educational Attainment in Granger
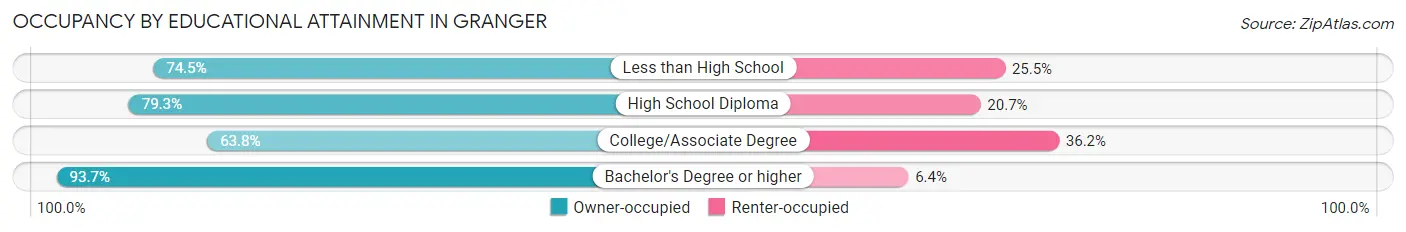
| Household Size | Owner-occupied | Renter-occupied |
| Less than High School | 35 (74.5%) | 12 (25.5%) |
| High School Diploma | 119 (79.3%) | 31 (20.7%) |
| College/Associate Degree | 118 (63.8%) | 67 (36.2%) |
| Bachelor's Degree or higher | 59 (93.6%) | 4 (6.4%) |
Occupancy by Age of Householder in Granger
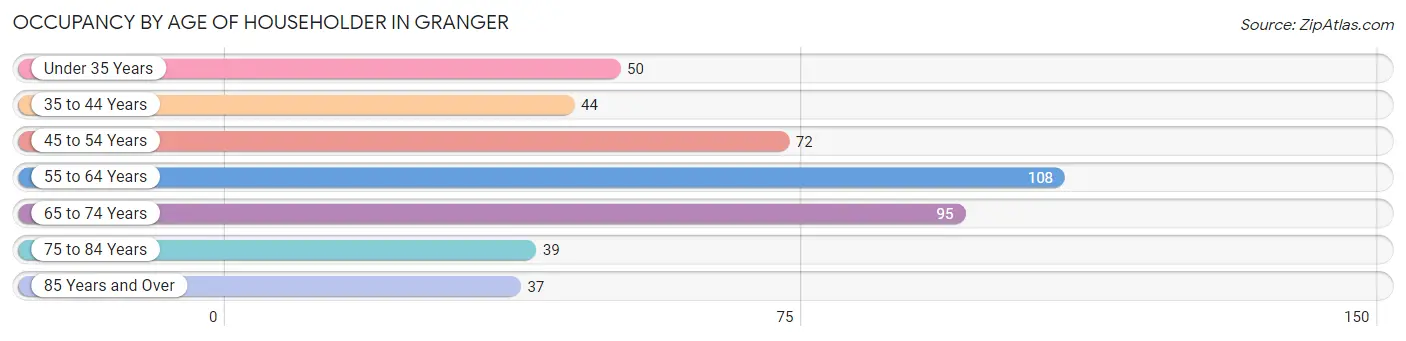
| Age Bracket | # Households | % Households |
| Under 35 Years | 50 | 11.2% |
| 35 to 44 Years | 44 | 9.9% |
| 45 to 54 Years | 72 | 16.2% |
| 55 to 64 Years | 108 | 24.3% |
| 65 to 74 Years | 95 | 21.3% |
| 75 to 84 Years | 39 | 8.8% |
| 85 Years and Over | 37 | 8.3% |
| Total | 445 | 100.0% |
Housing Finances in Granger
Median Income by Occupancy in Granger
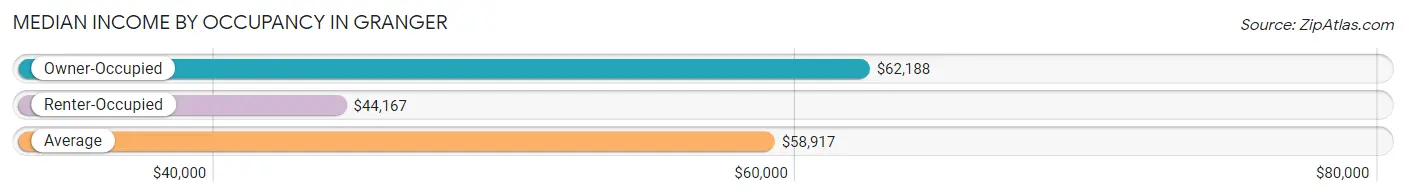
| Occupancy Type | # Households | Median Income |
| Owner-Occupied | 331 (74.4%) | $62,188 |
| Renter-Occupied | 114 (25.6%) | $44,167 |
| Average | 445 (100.0%) | $58,917 |
Occupancy by Householder Income Bracket in Granger
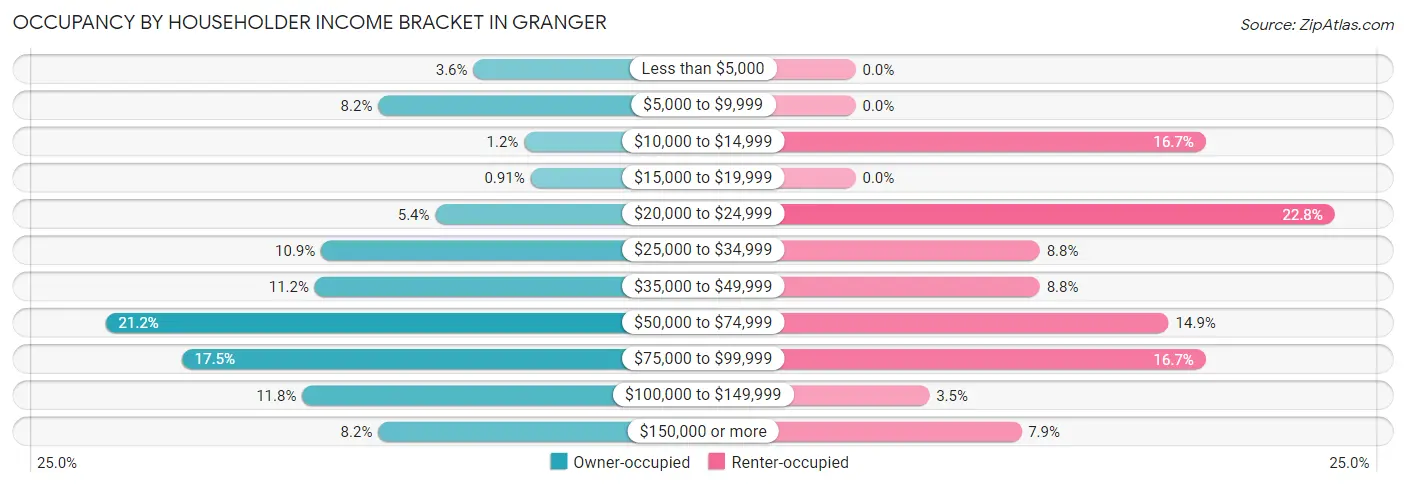
| Income Bracket | Owner-occupied | Renter-occupied |
| Less than $5,000 | 12 (3.6%) | 0 (0.0%) |
| $5,000 to $9,999 | 27 (8.2%) | 0 (0.0%) |
| $10,000 to $14,999 | 4 (1.2%) | 19 (16.7%) |
| $15,000 to $19,999 | 3 (0.9%) | 0 (0.0%) |
| $20,000 to $24,999 | 18 (5.4%) | 26 (22.8%) |
| $25,000 to $34,999 | 36 (10.9%) | 10 (8.8%) |
| $35,000 to $49,999 | 37 (11.2%) | 10 (8.8%) |
| $50,000 to $74,999 | 70 (21.1%) | 17 (14.9%) |
| $75,000 to $99,999 | 58 (17.5%) | 19 (16.7%) |
| $100,000 to $149,999 | 39 (11.8%) | 4 (3.5%) |
| $150,000 or more | 27 (8.2%) | 9 (7.9%) |
| Total | 331 (100.0%) | 114 (100.0%) |
Monthly Housing Cost Tiers in Granger
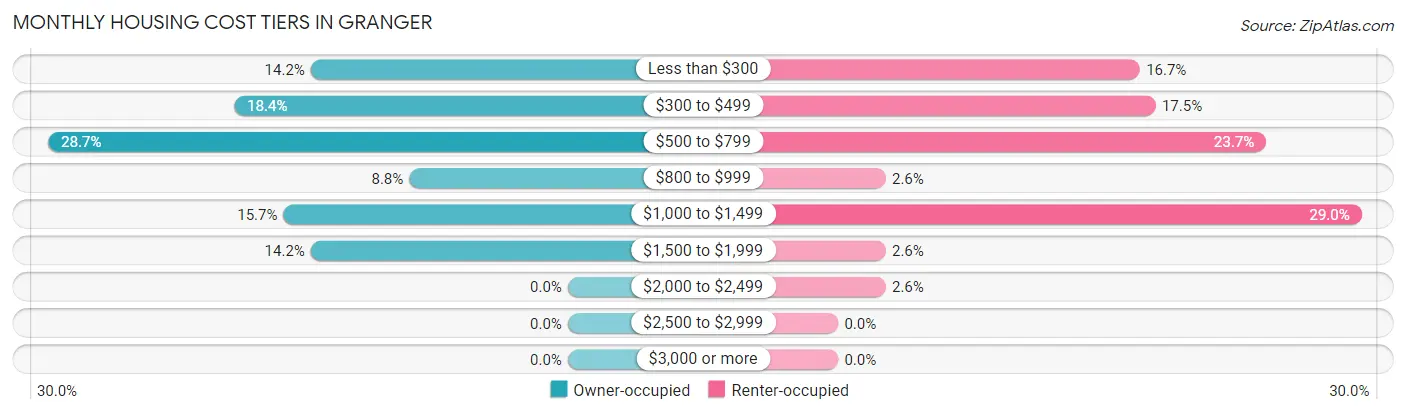
| Monthly Cost | Owner-occupied | Renter-occupied |
| Less than $300 | 47 (14.2%) | 19 (16.7%) |
| $300 to $499 | 61 (18.4%) | 20 (17.5%) |
| $500 to $799 | 95 (28.7%) | 27 (23.7%) |
| $800 to $999 | 29 (8.8%) | 3 (2.6%) |
| $1,000 to $1,499 | 52 (15.7%) | 33 (28.9%) |
| $1,500 to $1,999 | 47 (14.2%) | 3 (2.6%) |
| $2,000 to $2,499 | 0 (0.0%) | 3 (2.6%) |
| $2,500 to $2,999 | 0 (0.0%) | 0 (0.0%) |
| $3,000 or more | 0 (0.0%) | 0 (0.0%) |
| Total | 331 (100.0%) | 114 (100.0%) |
Physical Housing Characteristics in Granger
Housing Structures in Granger
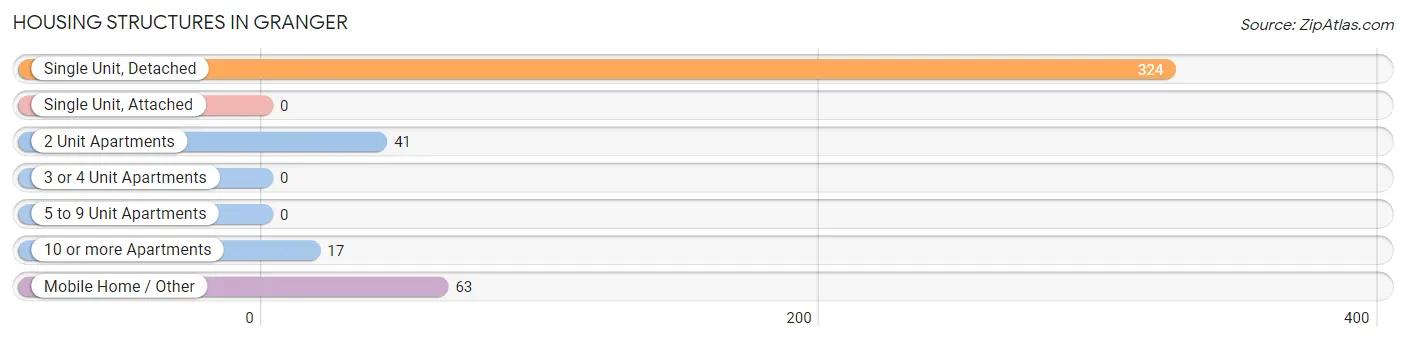
| Structure Type | # Housing Units | % Housing Units |
| Single Unit, Detached | 324 | 72.8% |
| Single Unit, Attached | 0 | 0.0% |
| 2 Unit Apartments | 41 | 9.2% |
| 3 or 4 Unit Apartments | 0 | 0.0% |
| 5 to 9 Unit Apartments | 0 | 0.0% |
| 10 or more Apartments | 17 | 3.8% |
| Mobile Home / Other | 63 | 14.2% |
| Total | 445 | 100.0% |
Housing Structures by Occupancy in Granger
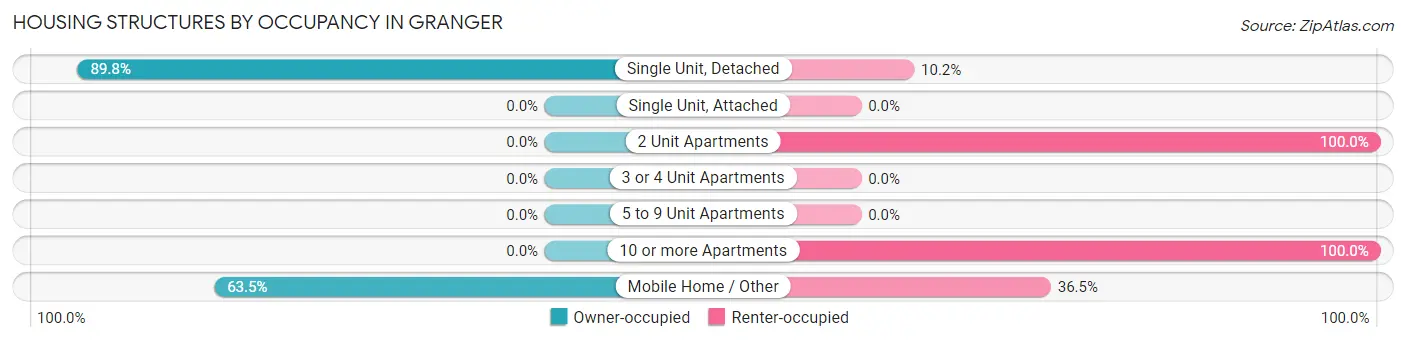
| Structure Type | Owner-occupied | Renter-occupied |
| Single Unit, Detached | 291 (89.8%) | 33 (10.2%) |
| Single Unit, Attached | 0 (0.0%) | 0 (0.0%) |
| 2 Unit Apartments | 0 (0.0%) | 41 (100.0%) |
| 3 or 4 Unit Apartments | 0 (0.0%) | 0 (0.0%) |
| 5 to 9 Unit Apartments | 0 (0.0%) | 0 (0.0%) |
| 10 or more Apartments | 0 (0.0%) | 17 (100.0%) |
| Mobile Home / Other | 40 (63.5%) | 23 (36.5%) |
| Total | 331 (74.4%) | 114 (25.6%) |
Housing Structures by Number of Rooms in Granger
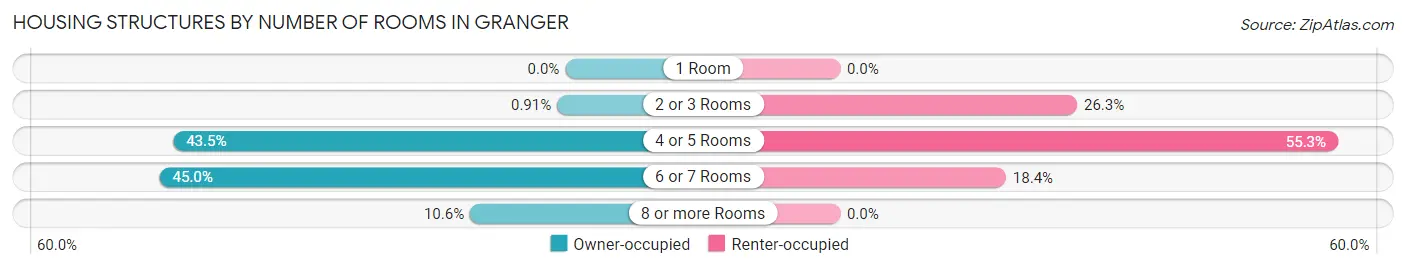
| Number of Rooms | Owner-occupied | Renter-occupied |
| 1 Room | 0 (0.0%) | 0 (0.0%) |
| 2 or 3 Rooms | 3 (0.9%) | 30 (26.3%) |
| 4 or 5 Rooms | 144 (43.5%) | 63 (55.3%) |
| 6 or 7 Rooms | 149 (45.0%) | 21 (18.4%) |
| 8 or more Rooms | 35 (10.6%) | 0 (0.0%) |
| Total | 331 (100.0%) | 114 (100.0%) |
Housing Structure by Heating Type in Granger
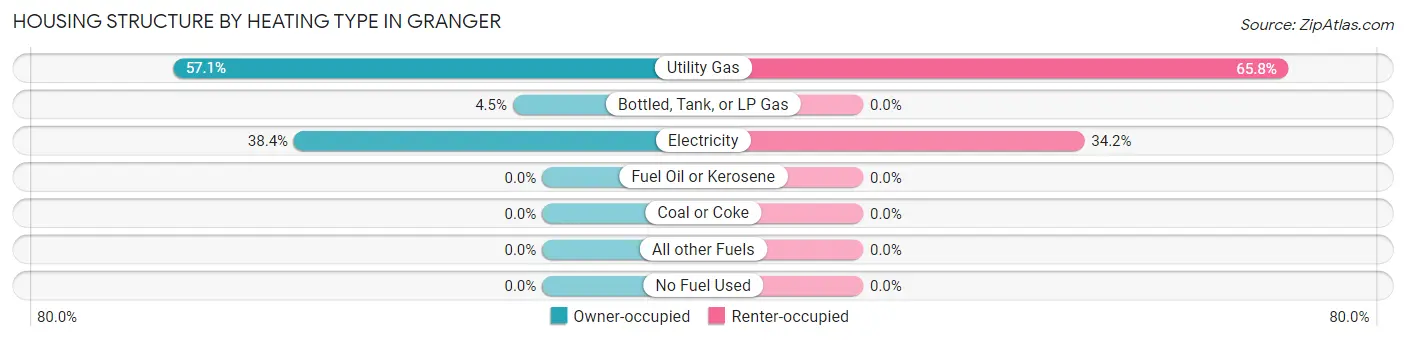
| Heating Type | Owner-occupied | Renter-occupied |
| Utility Gas | 189 (57.1%) | 75 (65.8%) |
| Bottled, Tank, or LP Gas | 15 (4.5%) | 0 (0.0%) |
| Electricity | 127 (38.4%) | 39 (34.2%) |
| Fuel Oil or Kerosene | 0 (0.0%) | 0 (0.0%) |
| Coal or Coke | 0 (0.0%) | 0 (0.0%) |
| All other Fuels | 0 (0.0%) | 0 (0.0%) |
| No Fuel Used | 0 (0.0%) | 0 (0.0%) |
| Total | 331 (100.0%) | 114 (100.0%) |
Household Vehicle Usage in Granger
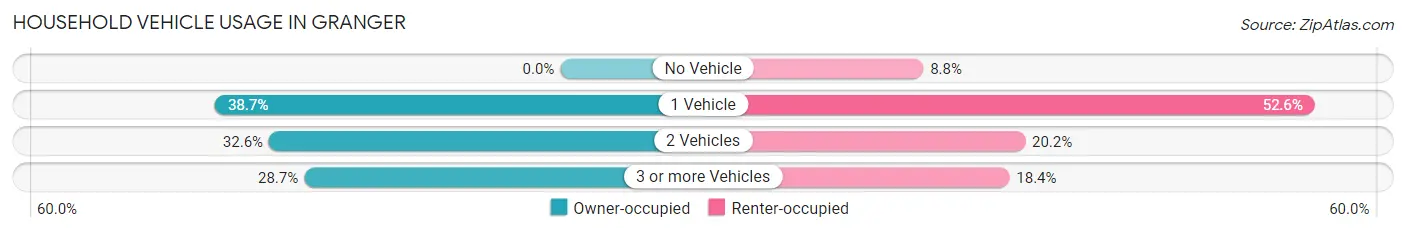
| Vehicles per Household | Owner-occupied | Renter-occupied |
| No Vehicle | 0 (0.0%) | 10 (8.8%) |
| 1 Vehicle | 128 (38.7%) | 60 (52.6%) |
| 2 Vehicles | 108 (32.6%) | 23 (20.2%) |
| 3 or more Vehicles | 95 (28.7%) | 21 (18.4%) |
| Total | 331 (100.0%) | 114 (100.0%) |
Real Estate & Mortgages in Granger
Real Estate and Mortgage Overview in Granger
| Characteristic | Without Mortgage | With Mortgage |
| Housing Units | 188 | 143 |
| Median Property Value | $122,800 | $133,000 |
| Median Household Income | $35,313 | $11 |
| Monthly Housing Costs | $467 | $0 |
| Real Estate Taxes | $1,652 | $4 |
Property Value by Mortgage Status in Granger
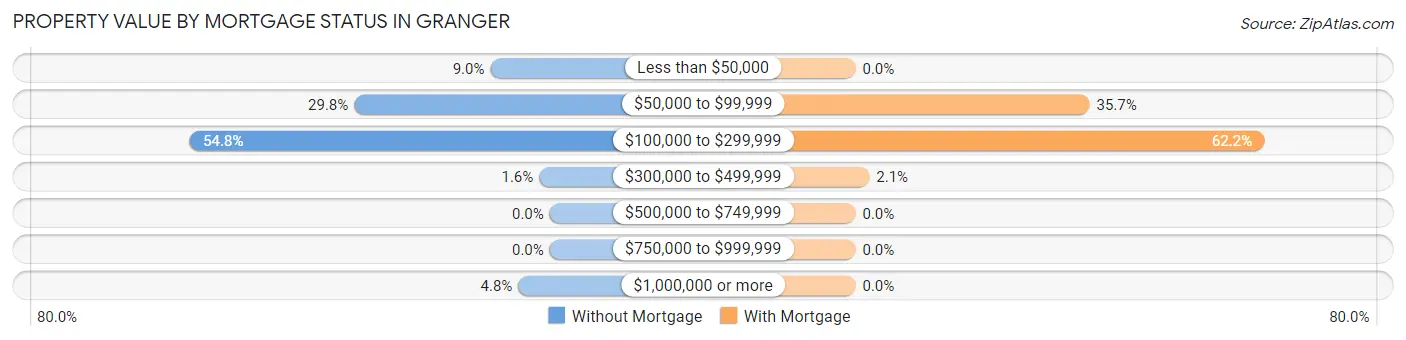
| Property Value | Without Mortgage | With Mortgage |
| Less than $50,000 | 17 (9.0%) | 0 (0.0%) |
| $50,000 to $99,999 | 56 (29.8%) | 51 (35.7%) |
| $100,000 to $299,999 | 103 (54.8%) | 89 (62.2%) |
| $300,000 to $499,999 | 3 (1.6%) | 3 (2.1%) |
| $500,000 to $749,999 | 0 (0.0%) | 0 (0.0%) |
| $750,000 to $999,999 | 0 (0.0%) | 0 (0.0%) |
| $1,000,000 or more | 9 (4.8%) | 0 (0.0%) |
| Total | 188 (100.0%) | 143 (100.0%) |
Household Income by Mortgage Status in Granger
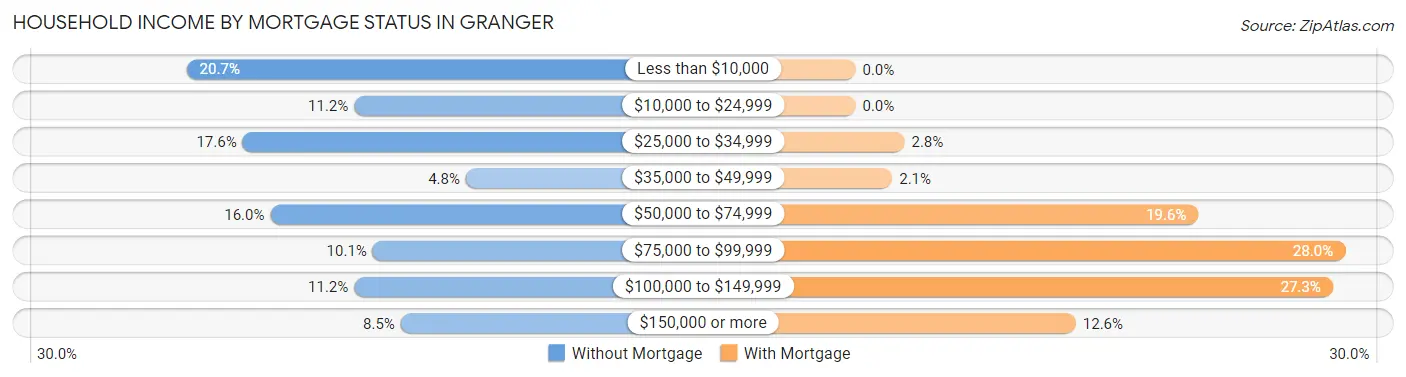
| Household Income | Without Mortgage | With Mortgage |
| Less than $10,000 | 39 (20.7%) | 0 (0.0%) |
| $10,000 to $24,999 | 21 (11.2%) | 0 (0.0%) |
| $25,000 to $34,999 | 33 (17.5%) | 4 (2.8%) |
| $35,000 to $49,999 | 9 (4.8%) | 3 (2.1%) |
| $50,000 to $74,999 | 30 (16.0%) | 28 (19.6%) |
| $75,000 to $99,999 | 19 (10.1%) | 40 (28.0%) |
| $100,000 to $149,999 | 21 (11.2%) | 39 (27.3%) |
| $150,000 or more | 16 (8.5%) | 18 (12.6%) |
| Total | 188 (100.0%) | 143 (100.0%) |
Property Value to Household Income Ratio in Granger
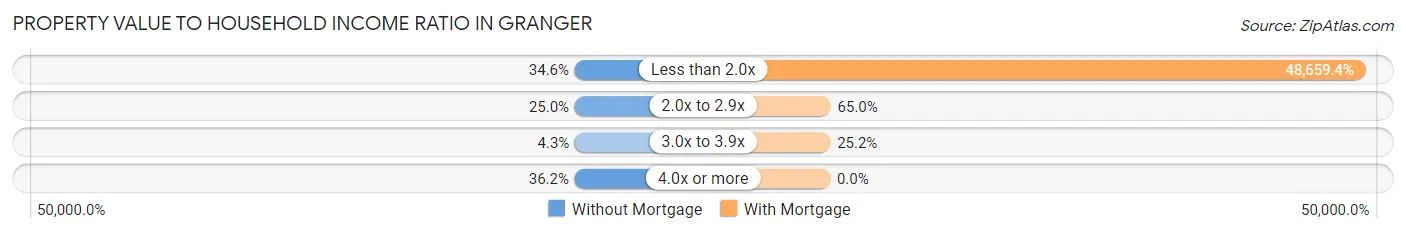
| Value-to-Income Ratio | Without Mortgage | With Mortgage |
| Less than 2.0x | 65 (34.6%) | 69,583 (48,659.4%) |
| 2.0x to 2.9x | 47 (25.0%) | 93 (65.0%) |
| 3.0x to 3.9x | 8 (4.3%) | 36 (25.2%) |
| 4.0x or more | 68 (36.2%) | 0 (0.0%) |
| Total | 188 (100.0%) | 143 (100.0%) |
Real Estate Taxes by Mortgage Status in Granger
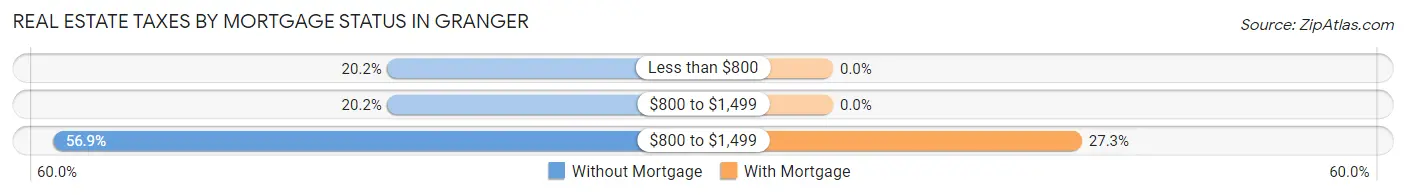
| Property Taxes | Without Mortgage | With Mortgage |
| Less than $800 | 38 (20.2%) | 0 (0.0%) |
| $800 to $1,499 | 38 (20.2%) | 0 (0.0%) |
| $800 to $1,499 | 107 (56.9%) | 39 (27.3%) |
| Total | 188 (100.0%) | 143 (100.0%) |
Health & Disability in Granger
Health Insurance Coverage by Age in Granger
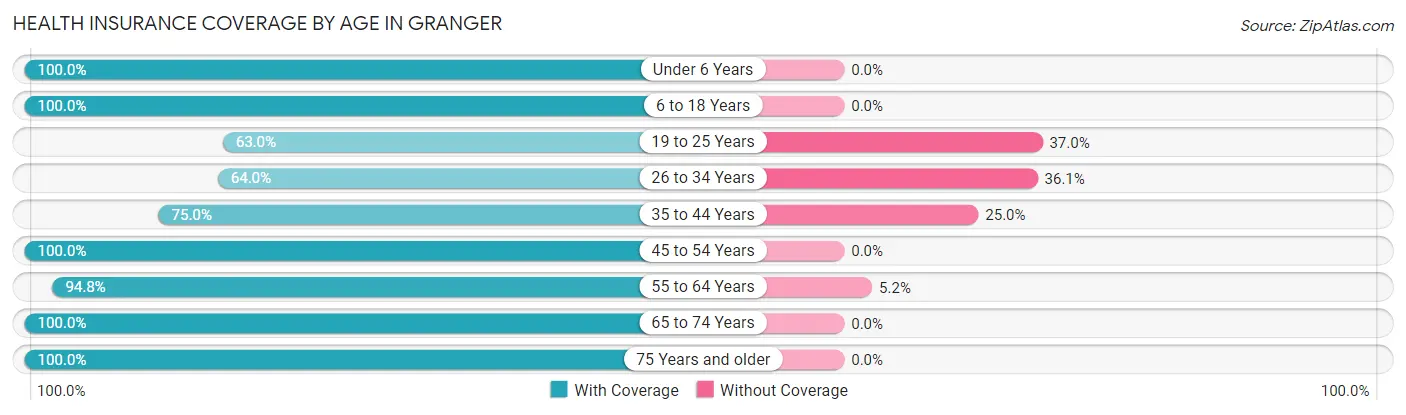
| Age Bracket | With Coverage | Without Coverage |
| Under 6 Years | 24 (100.0%) | 0 (0.0%) |
| 6 to 18 Years | 82 (100.0%) | 0 (0.0%) |
| 19 to 25 Years | 58 (63.0%) | 34 (37.0%) |
| 26 to 34 Years | 55 (63.9%) | 31 (36.0%) |
| 35 to 44 Years | 108 (75.0%) | 36 (25.0%) |
| 45 to 54 Years | 132 (100.0%) | 0 (0.0%) |
| 55 to 64 Years | 164 (94.8%) | 9 (5.2%) |
| 65 to 74 Years | 145 (100.0%) | 0 (0.0%) |
| 75 Years and older | 99 (100.0%) | 0 (0.0%) |
| Total | 867 (88.7%) | 110 (11.3%) |
Health Insurance Coverage by Citizenship Status in Granger
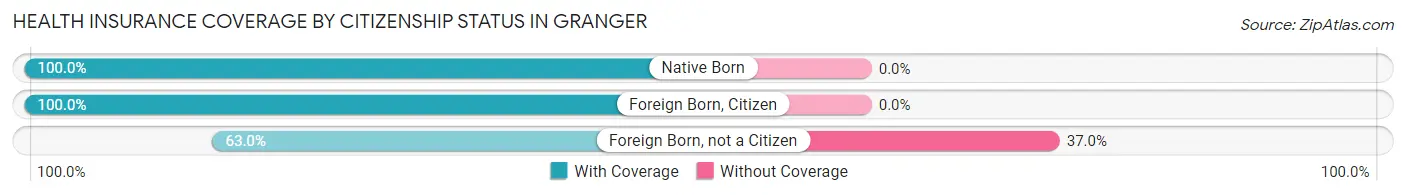
| Citizenship Status | With Coverage | Without Coverage |
| Native Born | 24 (100.0%) | 0 (0.0%) |
| Foreign Born, Citizen | 82 (100.0%) | 0 (0.0%) |
| Foreign Born, not a Citizen | 58 (63.0%) | 34 (37.0%) |
Health Insurance Coverage by Household Income in Granger
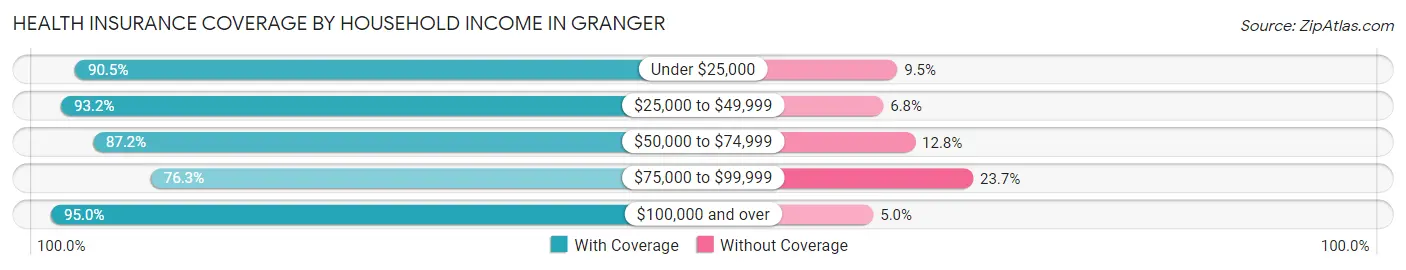
| Household Income | With Coverage | Without Coverage |
| Under $25,000 | 134 (90.5%) | 14 (9.5%) |
| $25,000 to $49,999 | 177 (93.2%) | 13 (6.8%) |
| $50,000 to $74,999 | 184 (87.2%) | 27 (12.8%) |
| $75,000 to $99,999 | 142 (76.3%) | 44 (23.7%) |
| $100,000 and over | 230 (95.0%) | 12 (5.0%) |
Public vs Private Health Insurance Coverage by Age in Granger
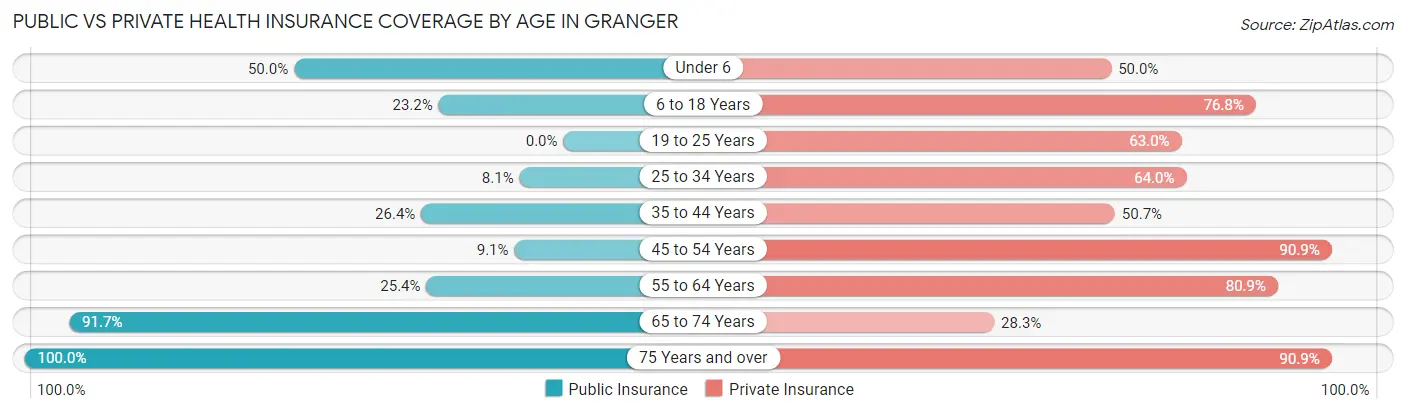
| Age Bracket | Public Insurance | Private Insurance |
| Under 6 | 12 (50.0%) | 12 (50.0%) |
| 6 to 18 Years | 19 (23.2%) | 63 (76.8%) |
| 19 to 25 Years | 0 (0.0%) | 58 (63.0%) |
| 25 to 34 Years | 7 (8.1%) | 55 (63.9%) |
| 35 to 44 Years | 38 (26.4%) | 73 (50.7%) |
| 45 to 54 Years | 12 (9.1%) | 120 (90.9%) |
| 55 to 64 Years | 44 (25.4%) | 140 (80.9%) |
| 65 to 74 Years | 133 (91.7%) | 41 (28.3%) |
| 75 Years and over | 99 (100.0%) | 90 (90.9%) |
| Total | 364 (37.3%) | 652 (66.7%) |
Disability Status by Sex by Age in Granger
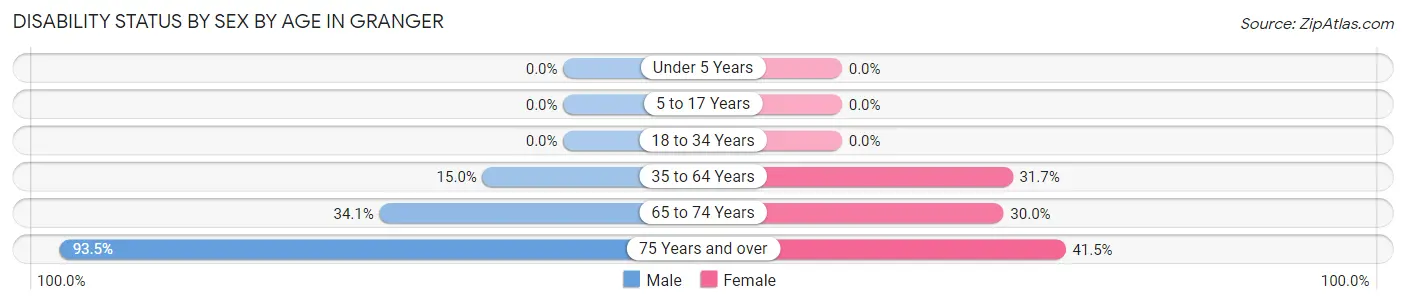
| Age Bracket | Male | Female |
| Under 5 Years | 0 (0.0%) | 0 (0.0%) |
| 5 to 17 Years | 0 (0.0%) | 0 (0.0%) |
| 18 to 34 Years | 0 (0.0%) | 0 (0.0%) |
| 35 to 64 Years | 37 (15.0%) | 64 (31.7%) |
| 65 to 74 Years | 29 (34.1%) | 18 (30.0%) |
| 75 Years and over | 43 (93.5%) | 22 (41.5%) |
Disability Class by Sex by Age in Granger
Disability Class: Hearing Difficulty
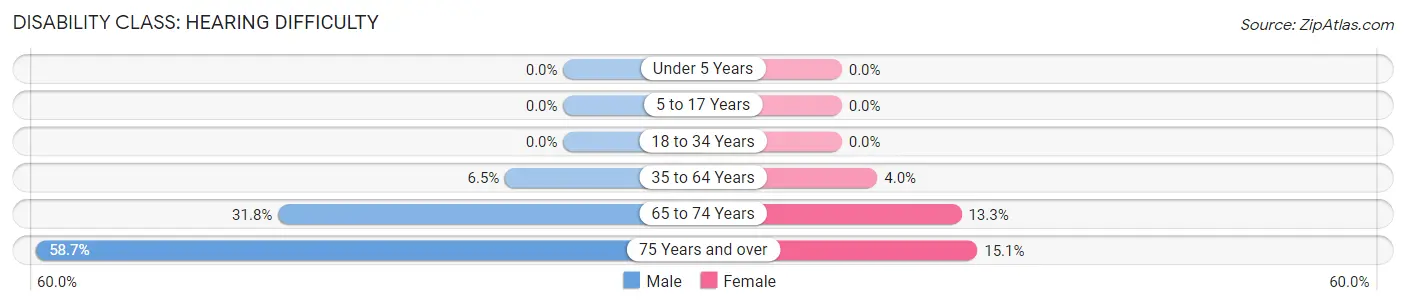
| Age Bracket | Male | Female |
| Under 5 Years | 0 (0.0%) | 0 (0.0%) |
| 5 to 17 Years | 0 (0.0%) | 0 (0.0%) |
| 18 to 34 Years | 0 (0.0%) | 0 (0.0%) |
| 35 to 64 Years | 16 (6.5%) | 8 (4.0%) |
| 65 to 74 Years | 27 (31.8%) | 8 (13.3%) |
| 75 Years and over | 27 (58.7%) | 8 (15.1%) |
Disability Class: Vision Difficulty
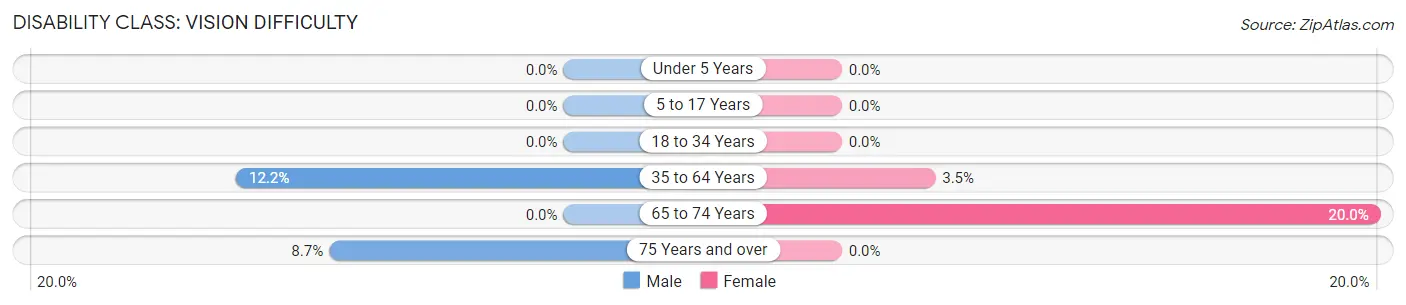
| Age Bracket | Male | Female |
| Under 5 Years | 0 (0.0%) | 0 (0.0%) |
| 5 to 17 Years | 0 (0.0%) | 0 (0.0%) |
| 18 to 34 Years | 0 (0.0%) | 0 (0.0%) |
| 35 to 64 Years | 30 (12.1%) | 7 (3.5%) |
| 65 to 74 Years | 0 (0.0%) | 12 (20.0%) |
| 75 Years and over | 4 (8.7%) | 0 (0.0%) |
Disability Class: Cognitive Difficulty
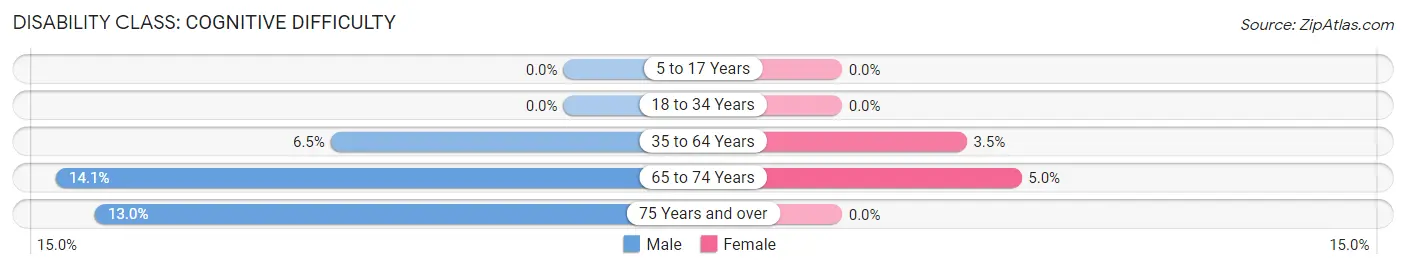
| Age Bracket | Male | Female |
| 5 to 17 Years | 0 (0.0%) | 0 (0.0%) |
| 18 to 34 Years | 0 (0.0%) | 0 (0.0%) |
| 35 to 64 Years | 16 (6.5%) | 7 (3.5%) |
| 65 to 74 Years | 12 (14.1%) | 3 (5.0%) |
| 75 Years and over | 6 (13.0%) | 0 (0.0%) |
Disability Class: Ambulatory Difficulty
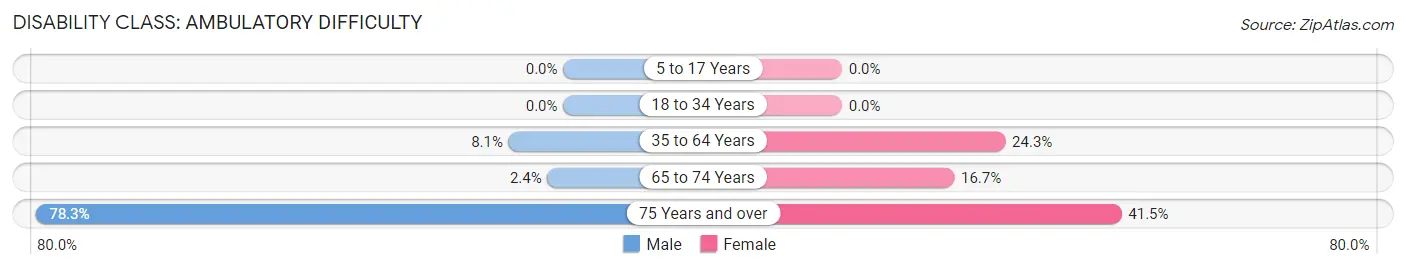
| Age Bracket | Male | Female |
| 5 to 17 Years | 0 (0.0%) | 0 (0.0%) |
| 18 to 34 Years | 0 (0.0%) | 0 (0.0%) |
| 35 to 64 Years | 20 (8.1%) | 49 (24.3%) |
| 65 to 74 Years | 2 (2.4%) | 10 (16.7%) |
| 75 Years and over | 36 (78.3%) | 22 (41.5%) |
Disability Class: Self-Care Difficulty
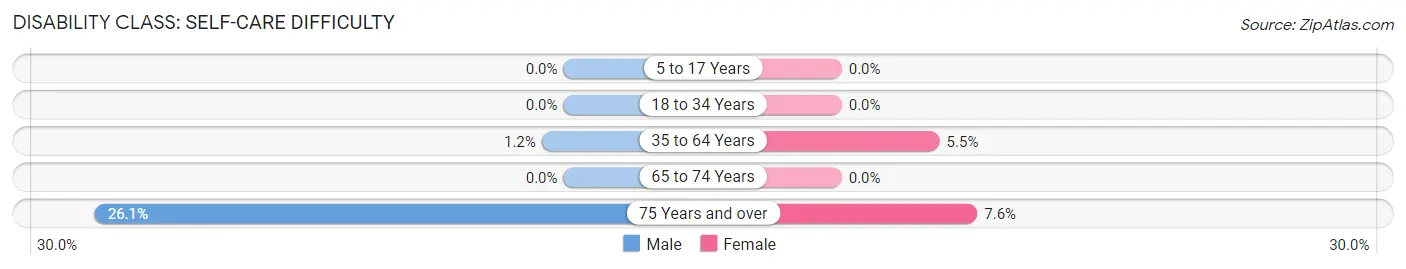
| Age Bracket | Male | Female |
| 5 to 17 Years | 0 (0.0%) | 0 (0.0%) |
| 18 to 34 Years | 0 (0.0%) | 0 (0.0%) |
| 35 to 64 Years | 3 (1.2%) | 11 (5.4%) |
| 65 to 74 Years | 0 (0.0%) | 0 (0.0%) |
| 75 Years and over | 12 (26.1%) | 4 (7.5%) |
Technology Access in Granger
Computing Device Access in Granger
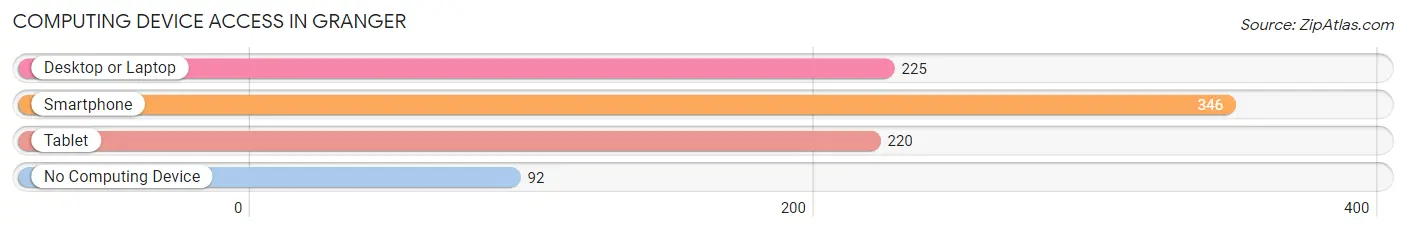
| Device Type | # Households | % Households |
| Desktop or Laptop | 225 | 50.6% |
| Smartphone | 346 | 77.7% |
| Tablet | 220 | 49.4% |
| No Computing Device | 92 | 20.7% |
| Total | 445 | 100.0% |
Internet Access in Granger
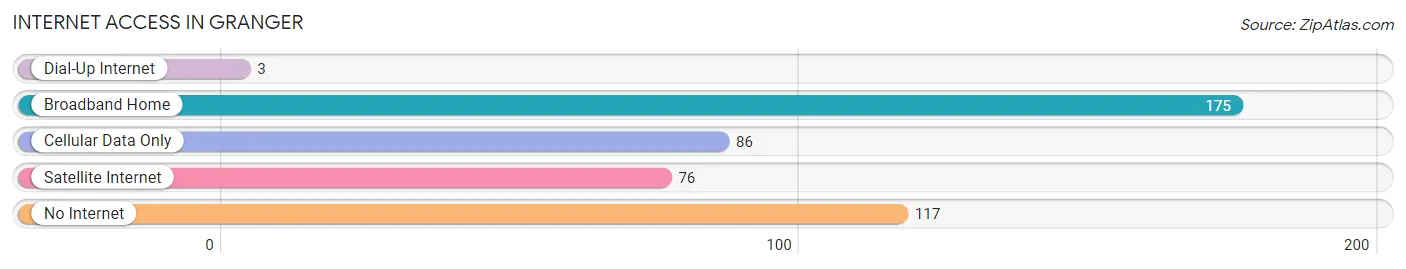
| Internet Type | # Households | % Households |
| Dial-Up Internet | 3 | 0.7% |
| Broadband Home | 175 | 39.3% |
| Cellular Data Only | 86 | 19.3% |
| Satellite Internet | 76 | 17.1% |
| No Internet | 117 | 26.3% |
| Total | 445 | 100.0% |
Granger Summary
Granger, Texas is a small town located in Williamson County, Texas. It is situated about 30 miles north of Austin and is part of the Austin-Round Rock metropolitan area. The population of Granger was 1,845 in the 2010 census.
History
Granger was founded in 1872 by a group of settlers from Granger, Indiana. The town was named after the Indiana town, and the settlers brought with them the same name. The town was originally a farming community, and the first post office was established in 1873.
In 1876, the Granger Academy was established, and it was the first school in the area. The school was later renamed Granger High School and is still in operation today.
In 1881, the Granger Railroad was built, connecting the town to Austin and other nearby towns. This allowed for the growth of the town and the development of the local economy.
In the early 1900s, the town began to grow and develop. The first bank was established in 1906, and the first telephone service was established in 1907.
Geography
Granger is located in Williamson County, Texas, about 30 miles north of Austin. The town is situated on the banks of the San Gabriel River, and the terrain is mostly flat. The climate is hot and humid in the summer and mild in the winter.
Economy
The economy of Granger is largely based on agriculture and tourism. The town is home to several farms, and the local economy is supported by the sale of agricultural products. The town is also home to several small businesses, including restaurants, retail stores, and other services.
Tourism is also an important part of the local economy. The town is home to several historic sites, including the Granger Academy, the Granger Railroad, and the San Gabriel River. The town also hosts several festivals and events throughout the year, including the Granger Days Festival and the Granger Music Festival.
Demographics
As of the 2010 census, the population of Granger was 1,845. The racial makeup of the town was 79.3% White, 15.2% Hispanic or Latino, 1.7% African American, 0.7% Native American, 0.3% Asian, and 2.9% from other races.
The median household income in Granger was $45,938, and the median family income was $50,938. The per capita income was $20,938. About 11.3% of the population was below the poverty line.
Conclusion
Granger, Texas is a small town located in Williamson County, Texas. It is situated about 30 miles north of Austin and is part of the Austin-Round Rock metropolitan area. The town was founded in 1872 by a group of settlers from Granger, Indiana, and the local economy is largely based on agriculture and tourism. The population of Granger was 1,845 in the 2010 census, and the median household income was $45,938. Granger is home to several historic sites, and the town hosts several festivals and events throughout the year.
Common Questions
What is Per Capita Income in Granger?
Per Capita income in Granger is $28,170.
What is the Median Family Income in Granger?
Median Family Income in Granger is $67,656.
What is the Median Household income in Granger?
Median Household Income in Granger is $58,917.
What is Income or Wage Gap in Granger?
Income or Wage Gap in Granger is 38.3%.
Women in Granger earn 61.7 cents for every dollar earned by a man.
What is Inequality or Gini Index in Granger?
Inequality or Gini Index in Granger is 0.42.
What is the Total Population of Granger?
Total Population of Granger is 1,100.
What is the Total Male Population of Granger?
Total Male Population of Granger is 645.
What is the Total Female Population of Granger?
Total Female Population of Granger is 455.
What is the Ratio of Males per 100 Females in Granger?
There are 141.76 Males per 100 Females in Granger.
What is the Ratio of Females per 100 Males in Granger?
There are 70.54 Females per 100 Males in Granger.
What is the Median Population Age in Granger?
Median Population Age in Granger is 48.5 Years.
What is the Average Family Size in Granger
Average Family Size in Granger is 2.8 People.
What is the Average Household Size in Granger
Average Household Size in Granger is 2.2 People.
How Large is the Labor Force in Granger?
There are 536 People in the Labor Forcein in Granger.
What is the Percentage of People in the Labor Force in Granger?
52.0% of People are in the Labor Force in Granger.
What is the Unemployment Rate in Granger?
Unemployment Rate in Granger is 8.2%.