Graham, TX Map & Demographics
Graham Map
Graham Overview
$32,949
PER CAPITA INCOME
$85,214
AVG FAMILY INCOME
$63,361
AVG HOUSEHOLD INCOME
38.7%
WAGE / INCOME GAP [ % ]
61.3¢/ $1
WAGE / INCOME GAP [ $ ]
0.40
INEQUALITY / GINI INDEX
8,726
TOTAL POPULATION
4,062
MALE POPULATION
4,664
FEMALE POPULATION
87.09
MALES / 100 FEMALES
114.82
FEMALES / 100 MALES
36.7
MEDIAN AGE
2.9
AVG FAMILY SIZE
2.5
AVG HOUSEHOLD SIZE
4,330
LABOR FORCE [ PEOPLE ]
64.5%
PERCENT IN LABOR FORCE
1.5%
UNEMPLOYMENT RATE
Graham Zip Codes
Graham Area Codes
Income in Graham
Income Overview in Graham
Per Capita Income in Graham is $32,949, while median incomes of families and households are $85,214 and $63,361 respectively.
| Characteristic | Number | Measure |
| Per Capita Income | 8,726 | $32,949 |
| Median Family Income | 2,334 | $85,214 |
| Mean Family Income | 2,334 | $93,707 |
| Median Household Income | 3,495 | $63,361 |
| Mean Household Income | 3,495 | $79,916 |
| Income Deficit | 2,334 | $0 |
| Wage / Income Gap (%) | 8,726 | 38.70% |
| Wage / Income Gap ($) | 8,726 | 61.30¢ per $1 |
| Gini / Inequality Index | 8,726 | 0.40 |
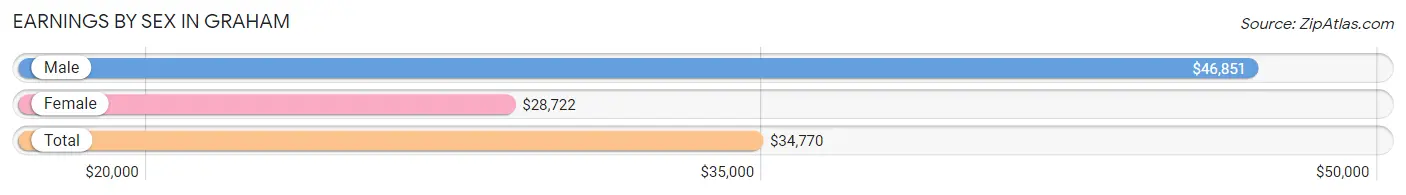
Earnings by Sex in Graham
Average Earnings in Graham are $34,770, $46,851 for men and $28,722 for women, a difference of 38.7%.
| Sex | Number | Average Earnings |
| Male | 2,324 (51.1%) | $46,851 |
| Female | 2,222 (48.9%) | $28,722 |
| Total | 4,546 (100.0%) | $34,770 |
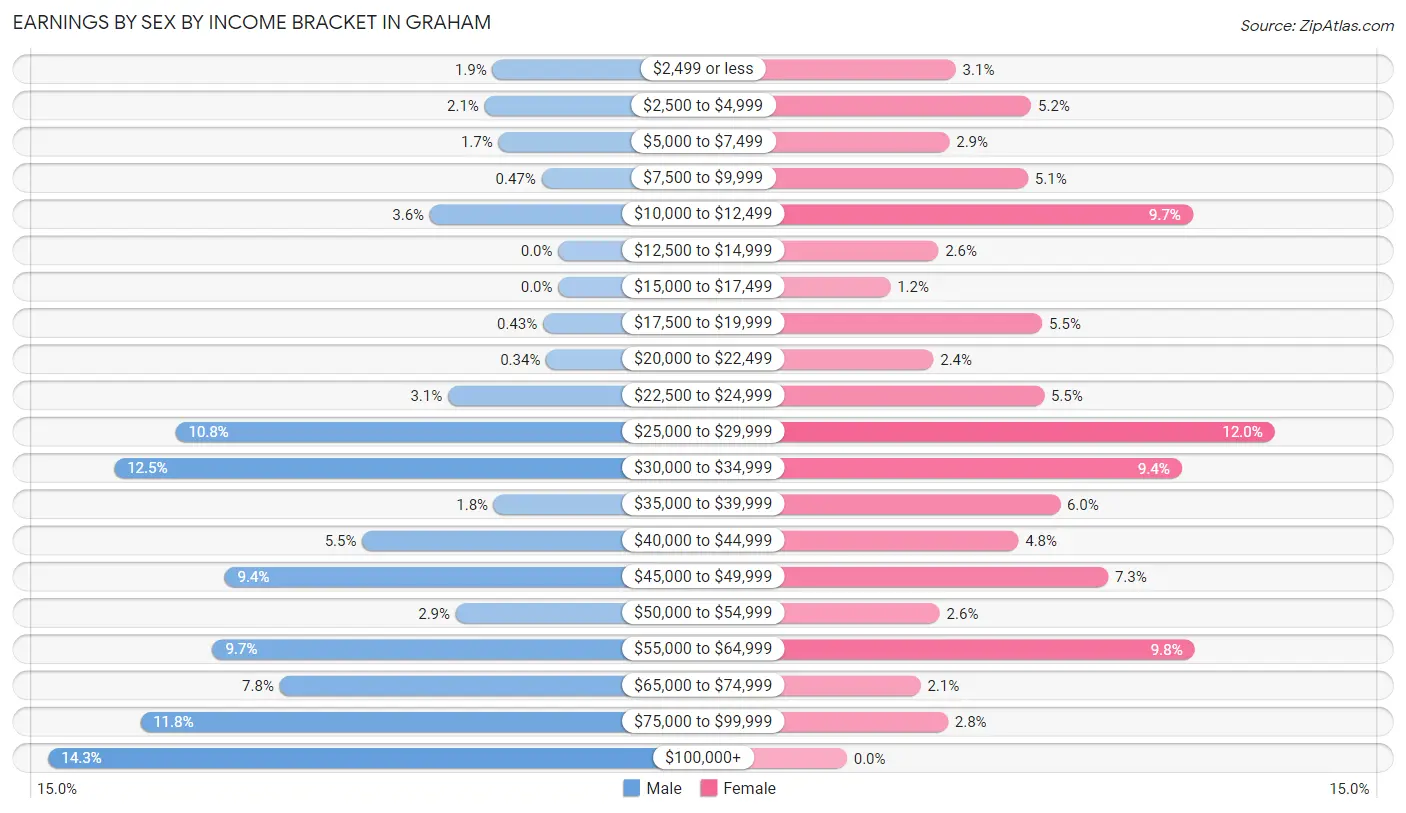
Earnings by Sex by Income Bracket in Graham
The most common earnings brackets in Graham are $100,000+ for men (333 | 14.3%) and $25,000 to $29,999 for women (267 | 12.0%).
| Income | Male | Female |
| $2,499 or less | 43 (1.8%) | 68 (3.1%) |
| $2,500 to $4,999 | 48 (2.1%) | 115 (5.2%) |
| $5,000 to $7,499 | 39 (1.7%) | 64 (2.9%) |
| $7,500 to $9,999 | 11 (0.5%) | 113 (5.1%) |
| $10,000 to $12,499 | 84 (3.6%) | 216 (9.7%) |
| $12,500 to $14,999 | 0 (0.0%) | 57 (2.6%) |
| $15,000 to $17,499 | 0 (0.0%) | 27 (1.2%) |
| $17,500 to $19,999 | 10 (0.4%) | 122 (5.5%) |
| $20,000 to $22,499 | 8 (0.3%) | 54 (2.4%) |
| $22,500 to $24,999 | 72 (3.1%) | 123 (5.5%) |
| $25,000 to $29,999 | 250 (10.8%) | 267 (12.0%) |
| $30,000 to $34,999 | 290 (12.5%) | 209 (9.4%) |
| $35,000 to $39,999 | 42 (1.8%) | 133 (6.0%) |
| $40,000 to $44,999 | 128 (5.5%) | 107 (4.8%) |
| $45,000 to $49,999 | 218 (9.4%) | 163 (7.3%) |
| $50,000 to $54,999 | 67 (2.9%) | 58 (2.6%) |
| $55,000 to $64,999 | 226 (9.7%) | 217 (9.8%) |
| $65,000 to $74,999 | 182 (7.8%) | 46 (2.1%) |
| $75,000 to $99,999 | 273 (11.7%) | 63 (2.8%) |
| $100,000+ | 333 (14.3%) | 0 (0.0%) |
| Total | 2,324 (100.0%) | 2,222 (100.0%) |
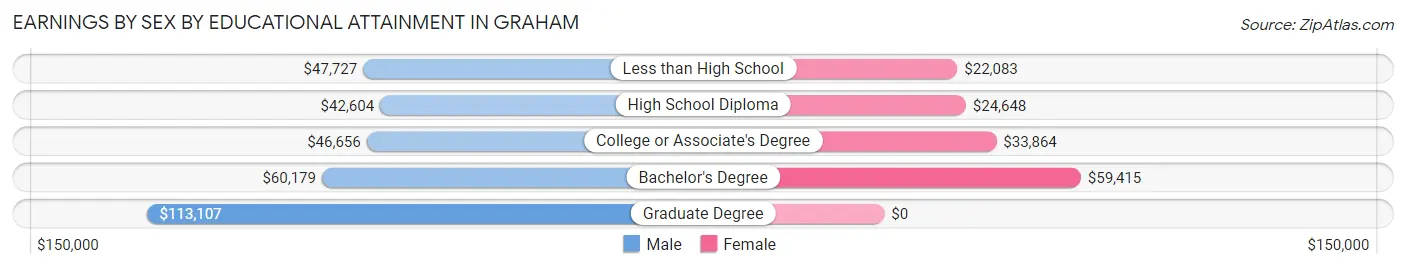
Earnings by Sex by Educational Attainment in Graham
Average earnings in Graham are $52,763 for men and $31,692 for women, a difference of 39.9%. Men with an educational attainment of graduate degree enjoy the highest average annual earnings of $113,107, while those with high school diploma education earn the least with $42,604. Women with an educational attainment of bachelor's degree earn the most with the average annual earnings of $59,415, while those with less than high school education have the smallest earnings of $22,083.
| Educational Attainment | Male Income | Female Income |
| Less than High School | $47,727 | $22,083 |
| High School Diploma | $42,604 | $24,648 |
| College or Associate's Degree | $46,656 | $33,864 |
| Bachelor's Degree | $60,179 | $59,415 |
| Graduate Degree | $113,107 | $0 |
| Total | $52,763 | $31,692 |
Family Income in Graham
Family Income Brackets in Graham
According to the Graham family income data, there are 534 families falling into the $100,000 to $149,999 income range, which is the most common income bracket and makes up 22.9% of all families. Conversely, the $10,000 to $14,999 income bracket is the least frequent group with only 9 families (0.4%) belonging to this category.
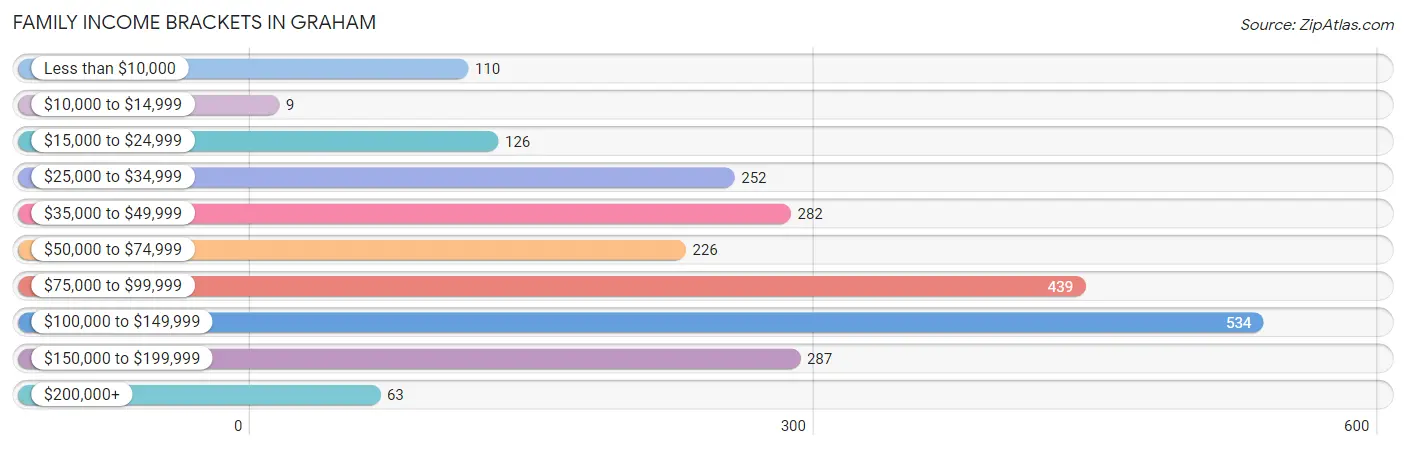
| Income Bracket | # Families | % Families |
| Less than $10,000 | 110 | 4.7% |
| $10,000 to $14,999 | 9 | 0.4% |
| $15,000 to $24,999 | 126 | 5.4% |
| $25,000 to $34,999 | 252 | 10.8% |
| $35,000 to $49,999 | 282 | 12.1% |
| $50,000 to $74,999 | 226 | 9.7% |
| $75,000 to $99,999 | 439 | 18.8% |
| $100,000 to $149,999 | 534 | 22.9% |
| $150,000 to $199,999 | 287 | 12.3% |
| $200,000+ | 63 | 2.7% |
Family Income by Famaliy Size in Graham
4-person families (551 | 23.6%) account for the highest median family income in Graham with $130,960 per family, while 3-person families (373 | 16.0%) have the highest median income of $39,464 per family member.
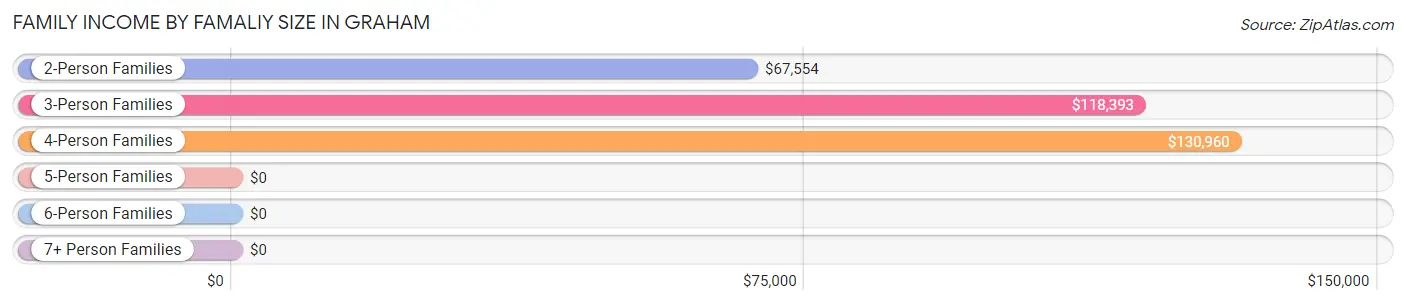
| Income Bracket | # Families | Median Income |
| 2-Person Families | 1,190 (51.0%) | $67,554 |
| 3-Person Families | 373 (16.0%) | $118,393 |
| 4-Person Families | 551 (23.6%) | $130,960 |
| 5-Person Families | 170 (7.3%) | $0 |
| 6-Person Families | 50 (2.1%) | $0 |
| 7+ Person Families | 0 (0.0%) | $0 |
| Total | 2,334 (100.0%) | $85,214 |
Family Income by Number of Earners in Graham
The median family income in Graham is $85,214, with families comprising 3+ earners (116) having the highest median family income of $150,147, while families with 1 earner (786) have the lowest median family income of $43,859, accounting for 5.0% and 33.7% of families, respectively.
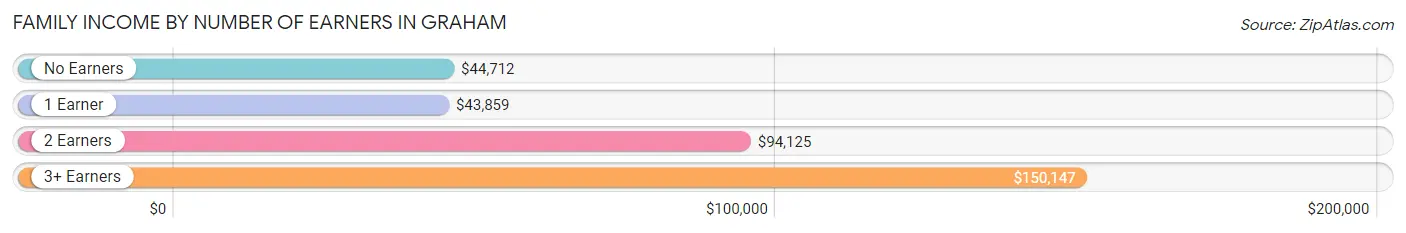
| Number of Earners | # Families | Median Income |
| No Earners | 287 (12.3%) | $44,712 |
| 1 Earner | 786 (33.7%) | $43,859 |
| 2 Earners | 1,145 (49.1%) | $94,125 |
| 3+ Earners | 116 (5.0%) | $150,147 |
| Total | 2,334 (100.0%) | $85,214 |
Household Income in Graham
Household Income Brackets in Graham
With 654 households falling in the category, the $100,000 to $149,999 income range is the most frequent in Graham, accounting for 18.7% of all households. In contrast, only 59 households (1.7%) fall into the $10,000 to $14,999 income bracket, making it the least populous group.
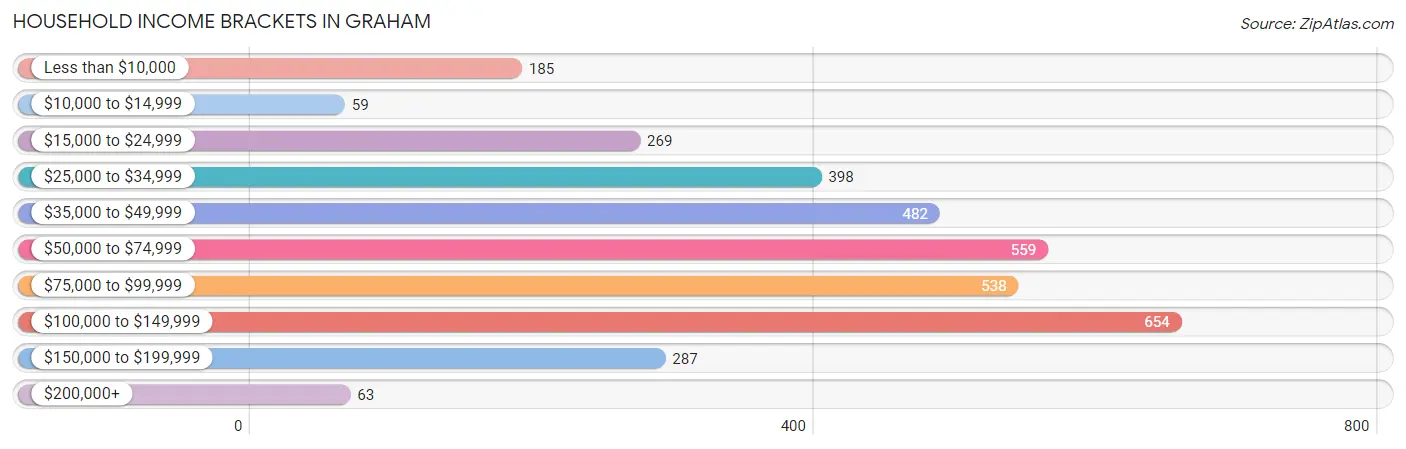
| Income Bracket | # Households | % Households |
| Less than $10,000 | 185 | 5.3% |
| $10,000 to $14,999 | 59 | 1.7% |
| $15,000 to $24,999 | 269 | 7.7% |
| $25,000 to $34,999 | 398 | 11.4% |
| $35,000 to $49,999 | 482 | 13.8% |
| $50,000 to $74,999 | 559 | 16.0% |
| $75,000 to $99,999 | 538 | 15.4% |
| $100,000 to $149,999 | 654 | 18.7% |
| $150,000 to $199,999 | 287 | 8.2% |
| $200,000+ | 63 | 1.8% |
Household Income by Householder Age in Graham
The median household income in Graham is $63,361, with the highest median household income of $89,495 found in the 45 to 64 years age bracket for the primary householder. A total of 999 households (28.6%) fall into this category. Meanwhile, the 15 to 24 years age bracket for the primary householder has the lowest median household income of $44,609, with 360 households (10.3%) in this group.
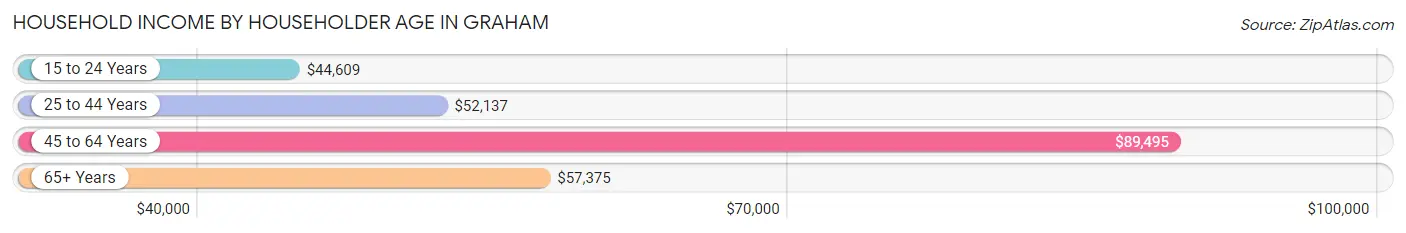
| Income Bracket | # Households | Median Income |
| 15 to 24 Years | 360 (10.3%) | $44,609 |
| 25 to 44 Years | 1,159 (33.2%) | $52,137 |
| 45 to 64 Years | 999 (28.6%) | $89,495 |
| 65+ Years | 977 (28.0%) | $57,375 |
| Total | 3,495 (100.0%) | $63,361 |
Poverty in Graham
Income Below Poverty by Sex and Age in Graham
With 14.9% poverty level for males and 19.9% for females among the residents of Graham, 6 to 11 year old males and 5 year old females are the most vulnerable to poverty, with 249 males (64.2%) and 40 females (100.0%) in their respective age groups living below the poverty level.
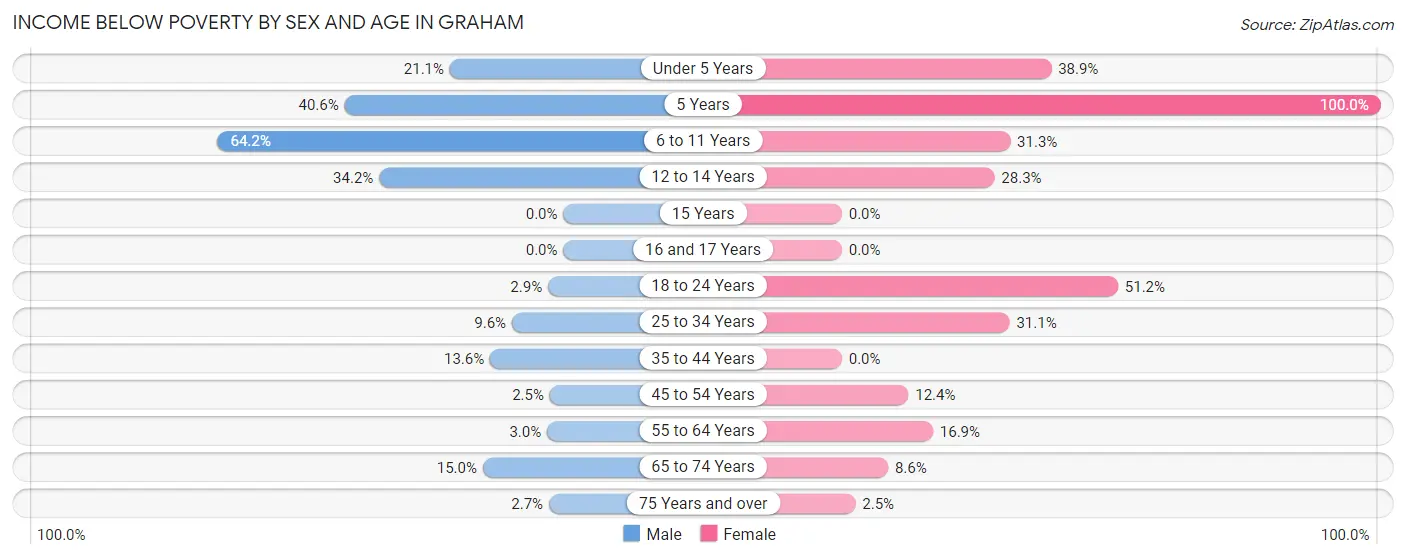
| Age Bracket | Male | Female |
| Under 5 Years | 91 (21.1%) | 103 (38.9%) |
| 5 Years | 13 (40.6%) | 40 (100.0%) |
| 6 to 11 Years | 249 (64.2%) | 120 (31.2%) |
| 12 to 14 Years | 40 (34.2%) | 68 (28.3%) |
| 15 Years | 0 (0.0%) | 0 (0.0%) |
| 16 and 17 Years | 0 (0.0%) | 0 (0.0%) |
| 18 to 24 Years | 10 (2.9%) | 206 (51.2%) |
| 25 to 34 Years | 66 (9.6%) | 188 (31.1%) |
| 35 to 44 Years | 51 (13.6%) | 0 (0.0%) |
| 45 to 54 Years | 12 (2.5%) | 52 (12.3%) |
| 55 to 64 Years | 12 (3.0%) | 71 (16.9%) |
| 65 to 74 Years | 48 (14.9%) | 43 (8.6%) |
| 75 Years and over | 10 (2.7%) | 10 (2.5%) |
| Total | 602 (14.9%) | 901 (19.9%) |
Income Above Poverty by Sex and Age in Graham
According to the poverty statistics in Graham, males aged 15 years and females aged 15 years are the age groups that are most secure financially, with 100.0% of males and 100.0% of females in these age groups living above the poverty line.
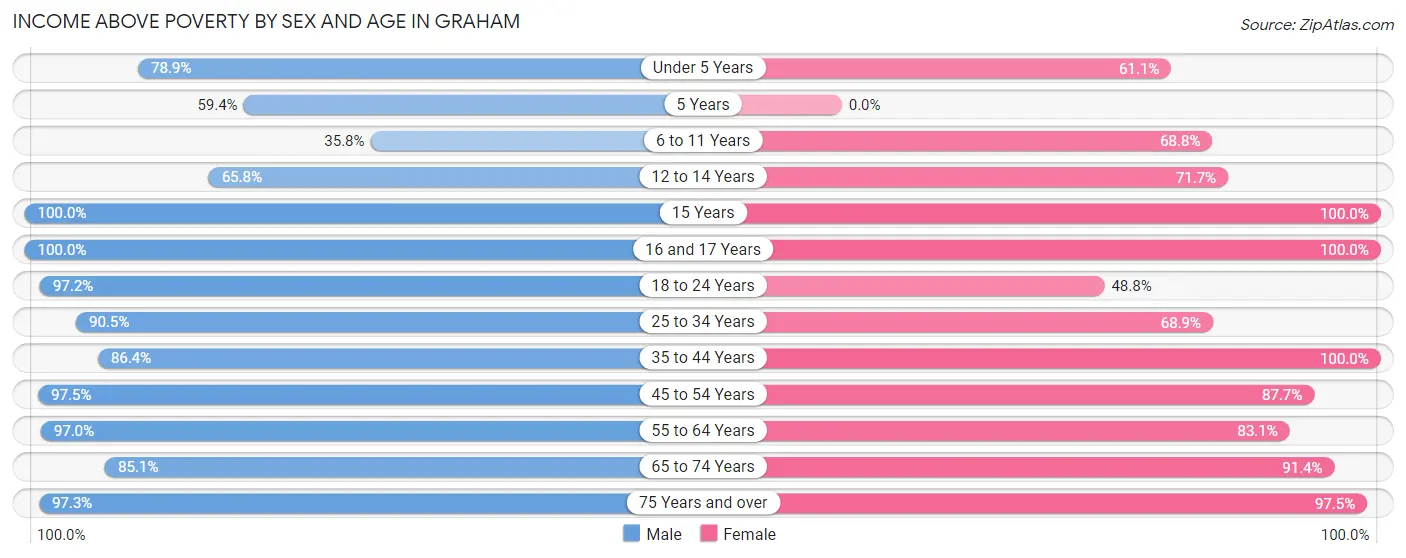
| Age Bracket | Male | Female |
| Under 5 Years | 341 (78.9%) | 162 (61.1%) |
| 5 Years | 19 (59.4%) | 0 (0.0%) |
| 6 to 11 Years | 139 (35.8%) | 264 (68.8%) |
| 12 to 14 Years | 77 (65.8%) | 172 (71.7%) |
| 15 Years | 32 (100.0%) | 63 (100.0%) |
| 16 and 17 Years | 40 (100.0%) | 173 (100.0%) |
| 18 to 24 Years | 341 (97.2%) | 196 (48.8%) |
| 25 to 34 Years | 625 (90.4%) | 416 (68.9%) |
| 35 to 44 Years | 324 (86.4%) | 617 (100.0%) |
| 45 to 54 Years | 466 (97.5%) | 369 (87.6%) |
| 55 to 64 Years | 384 (97.0%) | 349 (83.1%) |
| 65 to 74 Years | 273 (85.1%) | 459 (91.4%) |
| 75 Years and over | 364 (97.3%) | 389 (97.5%) |
| Total | 3,425 (85.1%) | 3,629 (80.1%) |
Income Below Poverty Among Married-Couple Families in Graham
The poverty statistics for married-couple families in Graham show that 6.9% or 115 of the total 1,673 families live below the poverty line. Families with 3 or 4 children have the highest poverty rate of 67.3%, comprising of 66 families. On the other hand, families with no children have the lowest poverty rate of 2.8%, which includes 24 families.
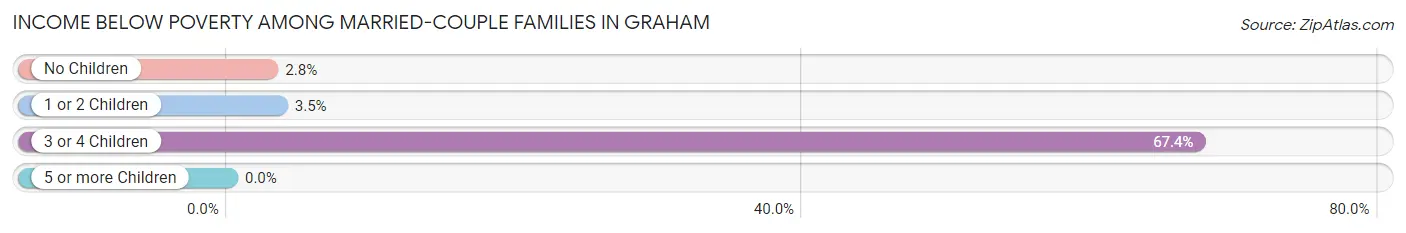
| Children | Above Poverty | Below Poverty |
| No Children | 831 (97.2%) | 24 (2.8%) |
| 1 or 2 Children | 695 (96.5%) | 25 (3.5%) |
| 3 or 4 Children | 32 (32.7%) | 66 (67.3%) |
| 5 or more Children | 0 (0.0%) | 0 (0.0%) |
| Total | 1,558 (93.1%) | 115 (6.9%) |
Income Below Poverty Among Single-Parent Households in Graham
According to the poverty data in Graham, 5.6% or 12 single-father households and 37.0% or 166 single-mother households are living below the poverty line. Among single-father households, those with 3 or 4 children have the highest poverty rate, with 12 households (100.0%) experiencing poverty. Likewise, among single-mother households, those with 3 or 4 children have the highest poverty rate, with 73 households (100.0%) falling below the poverty line.
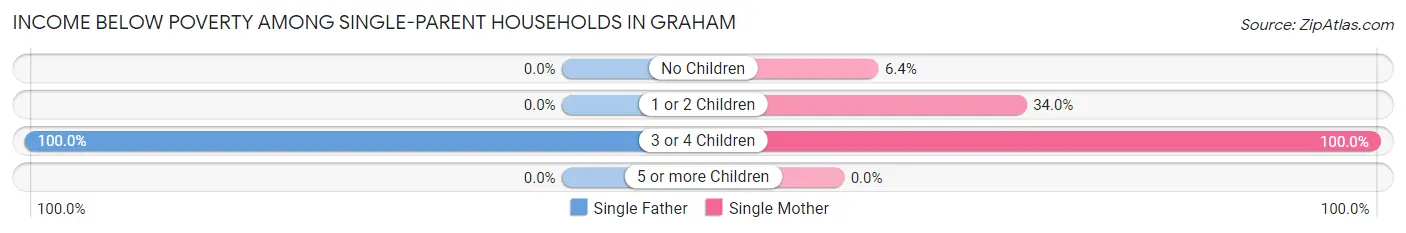
| Children | Single Father | Single Mother |
| No Children | 0 (0.0%) | 8 (6.4%) |
| 1 or 2 Children | 0 (0.0%) | 85 (34.0%) |
| 3 or 4 Children | 12 (100.0%) | 73 (100.0%) |
| 5 or more Children | 0 (0.0%) | 0 (0.0%) |
| Total | 12 (5.6%) | 166 (37.0%) |
Income Below Poverty Among Married-Couple vs Single-Parent Households in Graham
The poverty data for Graham shows that 115 of the married-couple family households (6.9%) and 178 of the single-parent households (26.9%) are living below the poverty level. Within the married-couple family households, those with 3 or 4 children have the highest poverty rate, with 66 households (67.3%) falling below the poverty line. Among the single-parent households, those with 3 or 4 children have the highest poverty rate, with 85 household (100.0%) living below poverty.
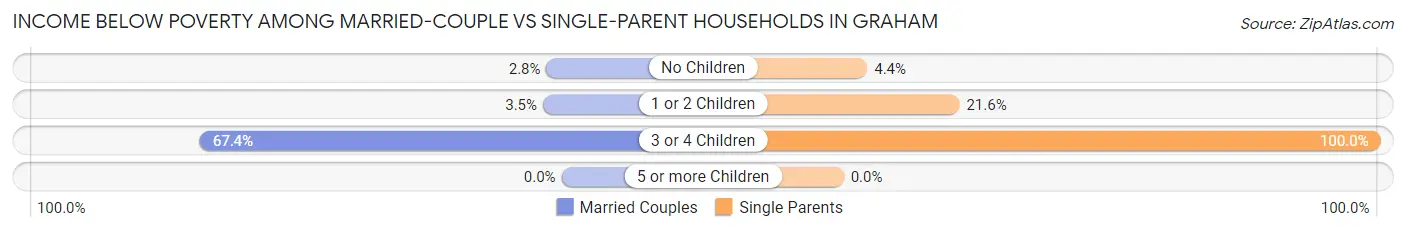
| Children | Married-Couple Families | Single-Parent Households |
| No Children | 24 (2.8%) | 8 (4.4%) |
| 1 or 2 Children | 25 (3.5%) | 85 (21.6%) |
| 3 or 4 Children | 66 (67.3%) | 85 (100.0%) |
| 5 or more Children | 0 (0.0%) | 0 (0.0%) |
| Total | 115 (6.9%) | 178 (26.9%) |
Race in Graham
The most populous races in Graham are White / Caucasian (7,376 | 84.5%), Hispanic or Latino (2,191 | 25.1%), and Two or more Races (895 | 10.3%).
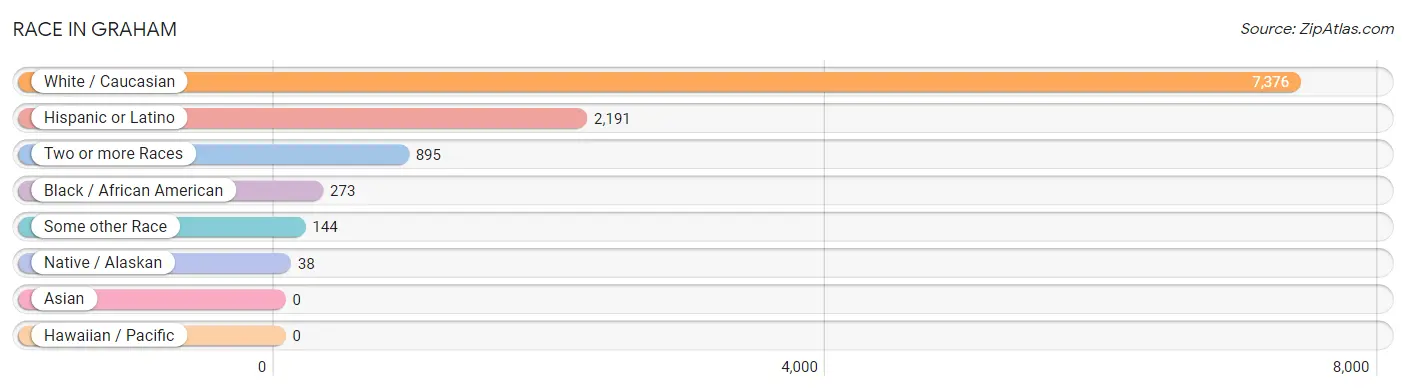
| Race | # Population | % Population |
| Asian | 0 | 0.0% |
| Black / African American | 273 | 3.1% |
| Hawaiian / Pacific | 0 | 0.0% |
| Hispanic or Latino | 2,191 | 25.1% |
| Native / Alaskan | 38 | 0.4% |
| White / Caucasian | 7,376 | 84.5% |
| Two or more Races | 895 | 10.3% |
| Some other Race | 144 | 1.7% |
| Total | 8,726 | 100.0% |
Ancestry in Graham
The most populous ancestries reported in Graham are Mexican (1,935 | 22.2%), English (823 | 9.4%), American (634 | 7.3%), German (482 | 5.5%), and Irish (410 | 4.7%), together accounting for 49.1% of all Graham residents.
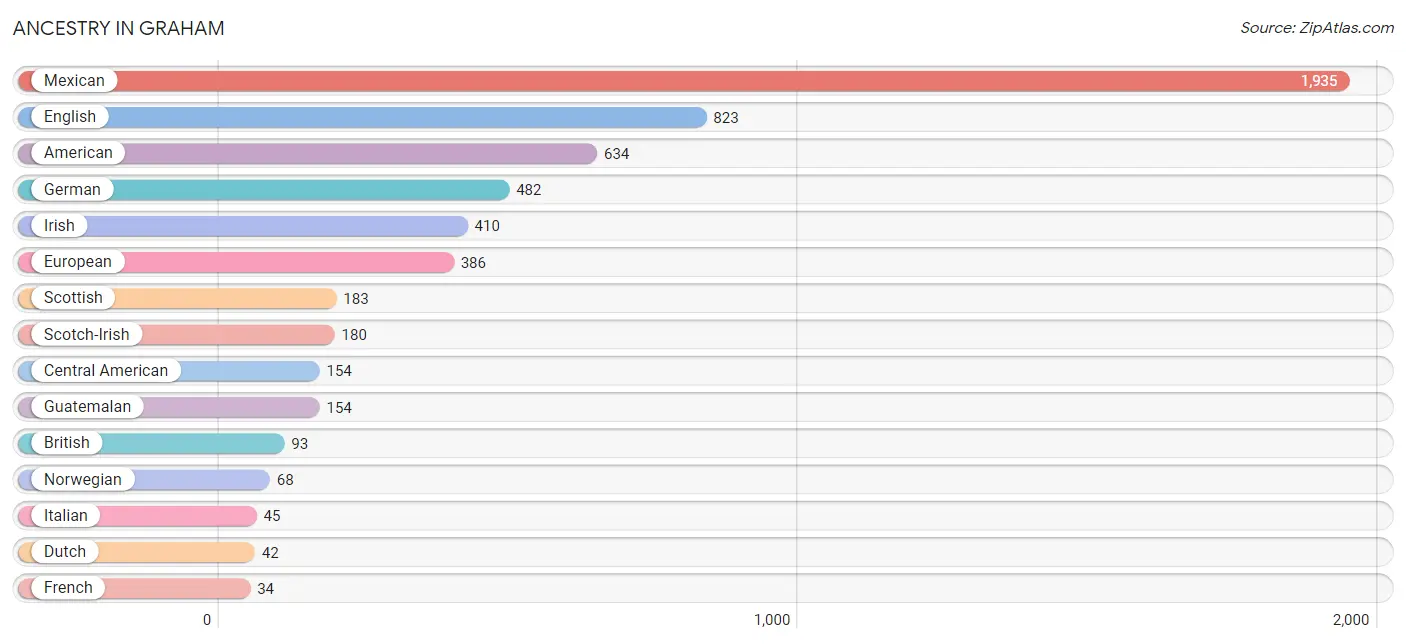
| Ancestry | # Population | % Population |
| American | 634 | 7.3% |
| Blackfeet | 33 | 0.4% |
| British | 93 | 1.1% |
| Celtic | 22 | 0.3% |
| Central American | 154 | 1.8% |
| Cherokee | 8 | 0.1% |
| Choctaw | 30 | 0.3% |
| Comanche | 33 | 0.4% |
| Czech | 26 | 0.3% |
| Dutch | 42 | 0.5% |
| English | 823 | 9.4% |
| European | 386 | 4.4% |
| French | 34 | 0.4% |
| German | 482 | 5.5% |
| Guatemalan | 154 | 1.8% |
| Irish | 410 | 4.7% |
| Italian | 45 | 0.5% |
| Mexican | 1,935 | 22.2% |
| Norwegian | 68 | 0.8% |
| Scotch-Irish | 180 | 2.1% |
| Scottish | 183 | 2.1% |
| Spaniard | 24 | 0.3% | View All 22 Rows |
Immigrants in Graham
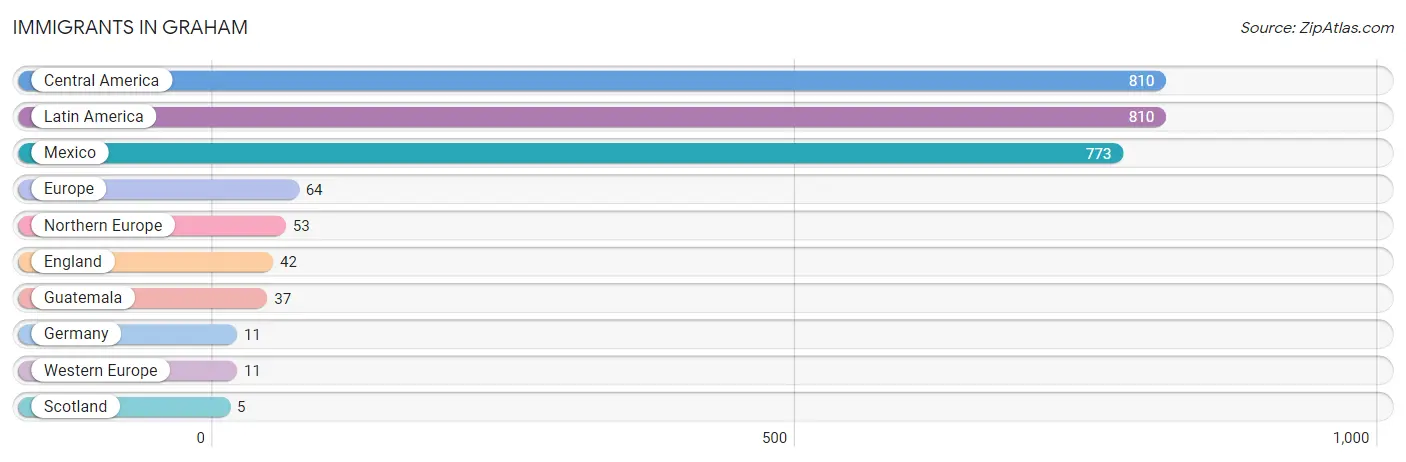
The most numerous immigrant groups reported in Graham came from Central America (810 | 9.3%), Latin America (810 | 9.3%), Mexico (773 | 8.9%), Europe (64 | 0.7%), and Northern Europe (53 | 0.6%), together accounting for 28.8% of all Graham residents.
| Immigration Origin | # Population | % Population |
| Central America | 810 | 9.3% |
| England | 42 | 0.5% |
| Europe | 64 | 0.7% |
| Germany | 11 | 0.1% |
| Guatemala | 37 | 0.4% |
| Latin America | 810 | 9.3% |
| Mexico | 773 | 8.9% |
| Northern Europe | 53 | 0.6% |
| Scotland | 5 | 0.1% |
| Western Europe | 11 | 0.1% | View All 10 Rows |
Sex and Age in Graham
Sex and Age in Graham
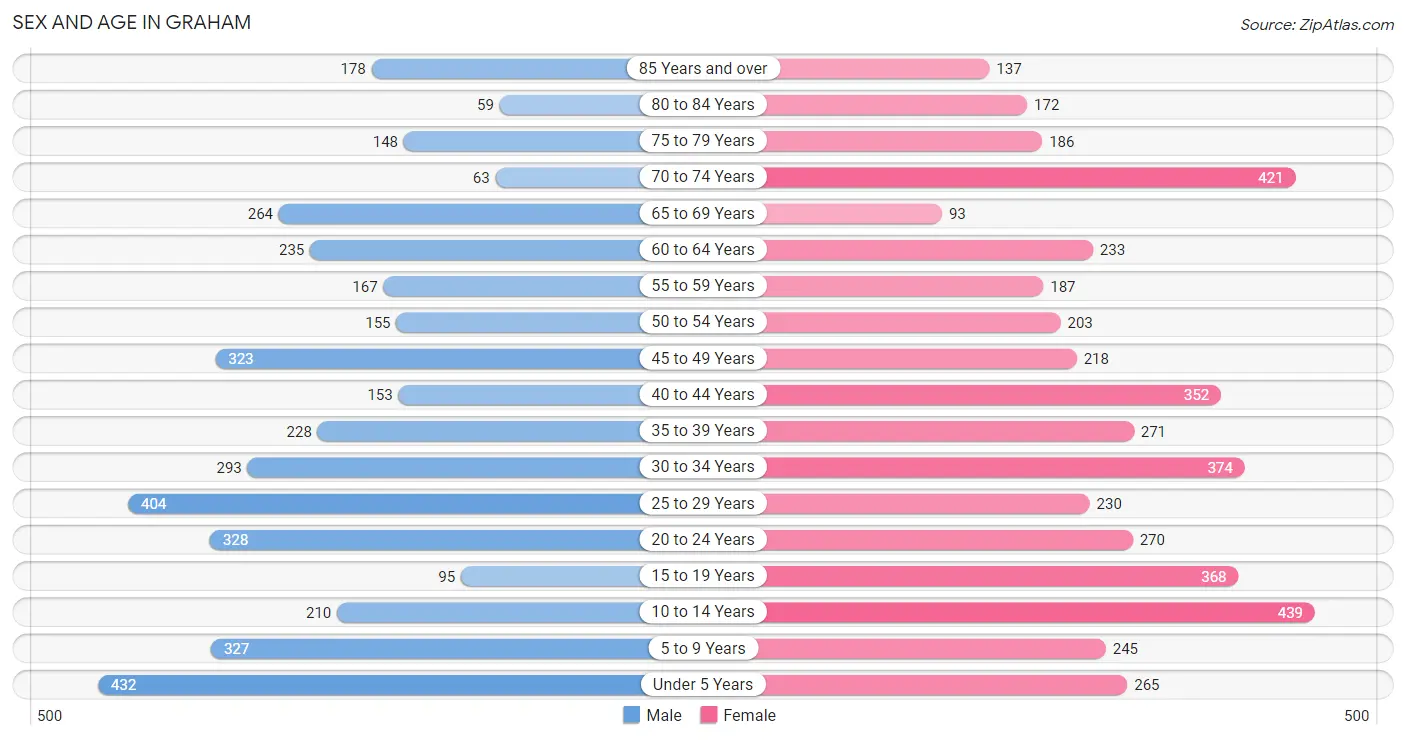
The most populous age groups in Graham are Under 5 Years (432 | 10.6%) for men and 10 to 14 Years (439 | 9.4%) for women.
| Age Bracket | Male | Female |
| Under 5 Years | 432 (10.6%) | 265 (5.7%) |
| 5 to 9 Years | 327 (8.1%) | 245 (5.2%) |
| 10 to 14 Years | 210 (5.2%) | 439 (9.4%) |
| 15 to 19 Years | 95 (2.3%) | 368 (7.9%) |
| 20 to 24 Years | 328 (8.1%) | 270 (5.8%) |
| 25 to 29 Years | 404 (10.0%) | 230 (4.9%) |
| 30 to 34 Years | 293 (7.2%) | 374 (8.0%) |
| 35 to 39 Years | 228 (5.6%) | 271 (5.8%) |
| 40 to 44 Years | 153 (3.8%) | 352 (7.5%) |
| 45 to 49 Years | 323 (8.0%) | 218 (4.7%) |
| 50 to 54 Years | 155 (3.8%) | 203 (4.3%) |
| 55 to 59 Years | 167 (4.1%) | 187 (4.0%) |
| 60 to 64 Years | 235 (5.8%) | 233 (5.0%) |
| 65 to 69 Years | 264 (6.5%) | 93 (2.0%) |
| 70 to 74 Years | 63 (1.5%) | 421 (9.0%) |
| 75 to 79 Years | 148 (3.6%) | 186 (4.0%) |
| 80 to 84 Years | 59 (1.5%) | 172 (3.7%) |
| 85 Years and over | 178 (4.4%) | 137 (2.9%) |
| Total | 4,062 (100.0%) | 4,664 (100.0%) |
Families and Households in Graham
Median Family Size in Graham
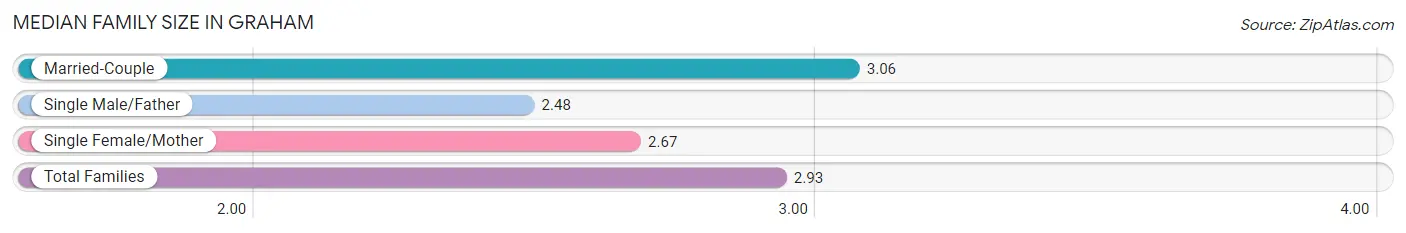
The median family size in Graham is 2.93 persons per family, with married-couple families (1,673 | 71.7%) accounting for the largest median family size of 3.06 persons per family. On the other hand, single male/father families (213 | 9.1%) represent the smallest median family size with 2.48 persons per family.
| Family Type | # Families | Family Size |
| Married-Couple | 1,673 (71.7%) | 3.06 |
| Single Male/Father | 213 (9.1%) | 2.48 |
| Single Female/Mother | 448 (19.2%) | 2.67 |
| Total Families | 2,334 (100.0%) | 2.93 |
Median Household Size in Graham
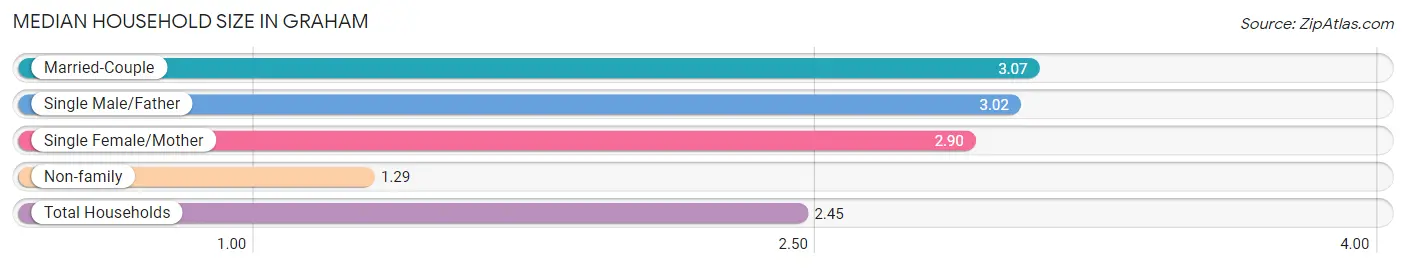
The median household size in Graham is 2.45 persons per household, with married-couple households (1,673 | 47.9%) accounting for the largest median household size of 3.07 persons per household. non-family households (1,161 | 33.2%) represent the smallest median household size with 1.29 persons per household.
| Household Type | # Households | Household Size |
| Married-Couple | 1,673 (47.9%) | 3.07 |
| Single Male/Father | 213 (6.1%) | 3.02 |
| Single Female/Mother | 448 (12.8%) | 2.90 |
| Non-family | 1,161 (33.2%) | 1.29 |
| Total Households | 3,495 (100.0%) | 2.45 |
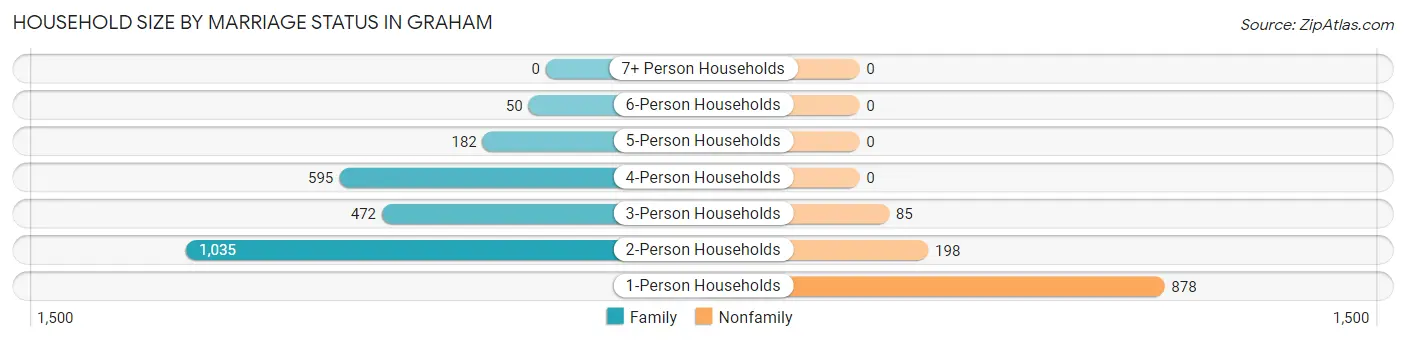
Household Size by Marriage Status in Graham
Out of a total of 3,495 households in Graham, 2,334 (66.8%) are family households, while 1,161 (33.2%) are nonfamily households. The most numerous type of family households are 2-person households, comprising 1,035, and the most common type of nonfamily households are 1-person households, comprising 878.
| Household Size | Family Households | Nonfamily Households |
| 1-Person Households | - | 878 (25.1%) |
| 2-Person Households | 1,035 (29.6%) | 198 (5.7%) |
| 3-Person Households | 472 (13.5%) | 85 (2.4%) |
| 4-Person Households | 595 (17.0%) | 0 (0.0%) |
| 5-Person Households | 182 (5.2%) | 0 (0.0%) |
| 6-Person Households | 50 (1.4%) | 0 (0.0%) |
| 7+ Person Households | 0 (0.0%) | 0 (0.0%) |
| Total | 2,334 (66.8%) | 1,161 (33.2%) |
Female Fertility in Graham
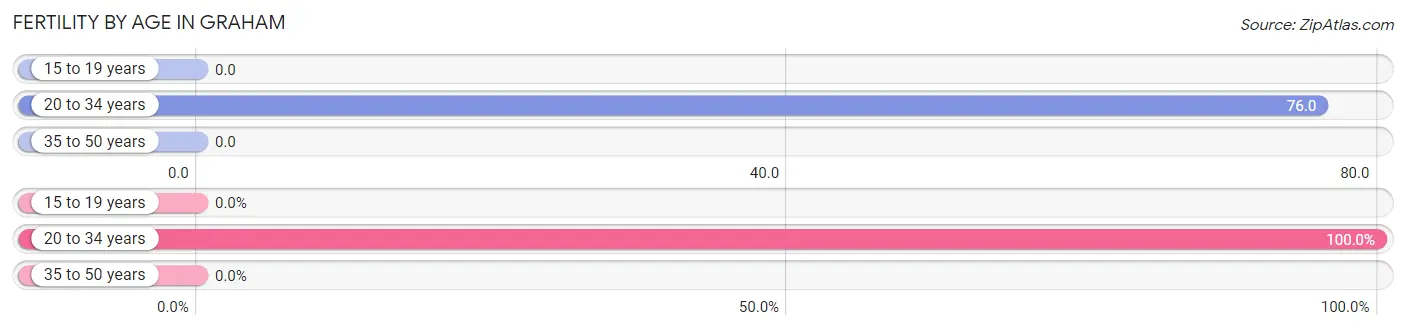
Fertility by Age in Graham
Average fertility rate in Graham is 32.0 births per 1,000 women. Women in the age bracket of 20 to 34 years have the highest fertility rate with 76.0 births per 1,000 women. Women in the age bracket of 20 to 34 years acount for 100.0% of all women with births.
| Age Bracket | Women with Births | Births / 1,000 Women |
| 15 to 19 years | 0 (0.0%) | 0.0 |
| 20 to 34 years | 66 (100.0%) | 76.0 |
| 35 to 50 years | 0 (0.0%) | 0.0 |
| Total | 66 (100.0%) | 32.0 |
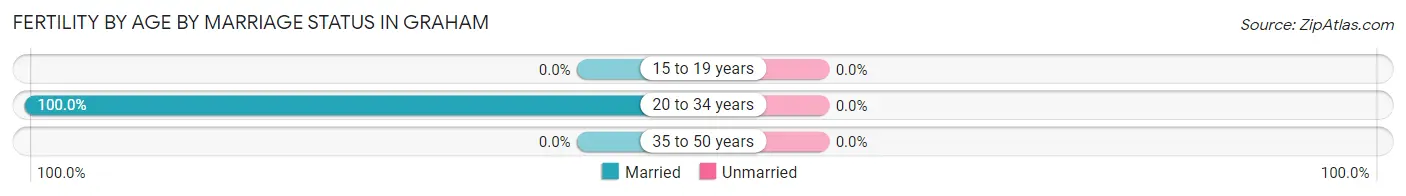
Fertility by Age by Marriage Status in Graham
| Age Bracket | Married | Unmarried |
| 15 to 19 years | 0 (0.0%) | 0 (0.0%) |
| 20 to 34 years | 66 (100.0%) | 0 (0.0%) |
| 35 to 50 years | 0 (0.0%) | 0 (0.0%) |
| Total | 66 (100.0%) | 0 (0.0%) |
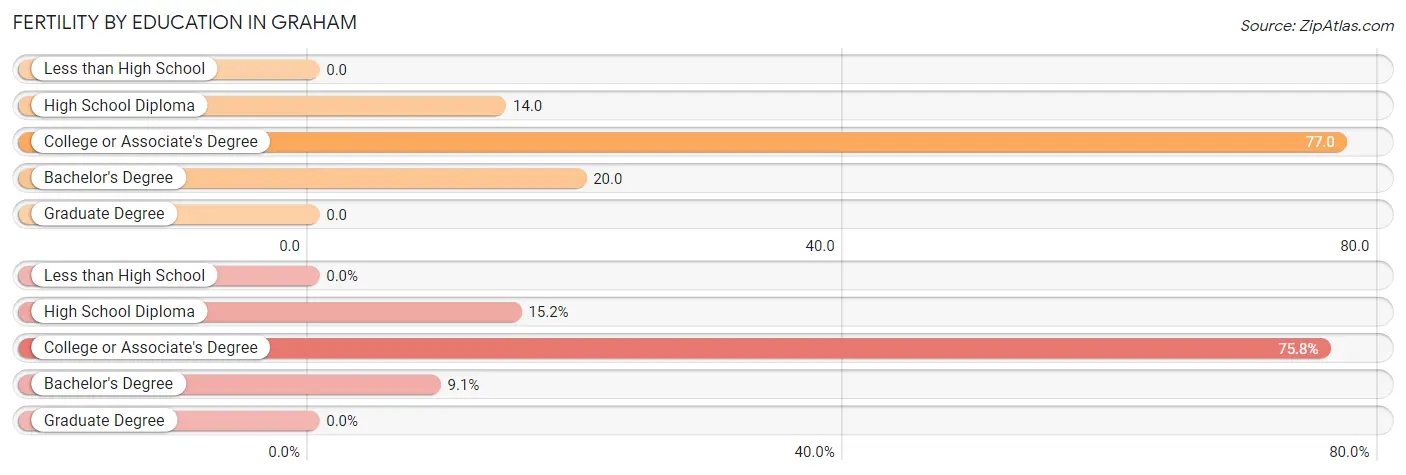
Fertility by Education in Graham
| Educational Attainment | Women with Births | Births / 1,000 Women |
| Less than High School | 0 (0.0%) | 0.0 |
| High School Diploma | 10 (15.1%) | 14.0 |
| College or Associate's Degree | 50 (75.8%) | 77.0 |
| Bachelor's Degree | 6 (9.1%) | 20.0 |
| Graduate Degree | 0 (0.0%) | 0.0 |
| Total | 66 (100.0%) | 32.0 |
Fertility by Education by Marriage Status in Graham
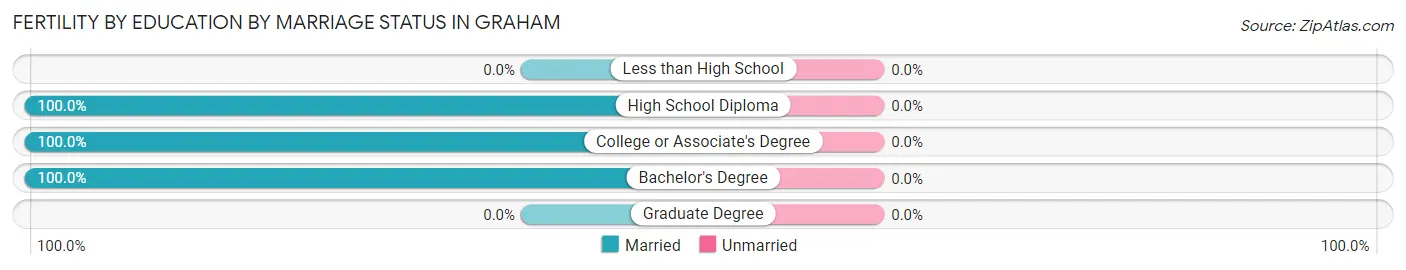
| Educational Attainment | Married | Unmarried |
| Less than High School | 0 (0.0%) | 0 (0.0%) |
| High School Diploma | 10 (100.0%) | 0 (0.0%) |
| College or Associate's Degree | 50 (100.0%) | 0 (0.0%) |
| Bachelor's Degree | 6 (100.0%) | 0 (0.0%) |
| Graduate Degree | 0 (0.0%) | 0 (0.0%) |
| Total | 66 (100.0%) | 0 (0.0%) |
Employment Characteristics in Graham
Employment by Class of Employer in Graham
Among the 4,231 employed individuals in Graham, private company employees (2,694 | 63.7%), local government employees (491 | 11.6%), and self-employed (not incorporated) (436 | 10.3%) make up the most common classes of employment.
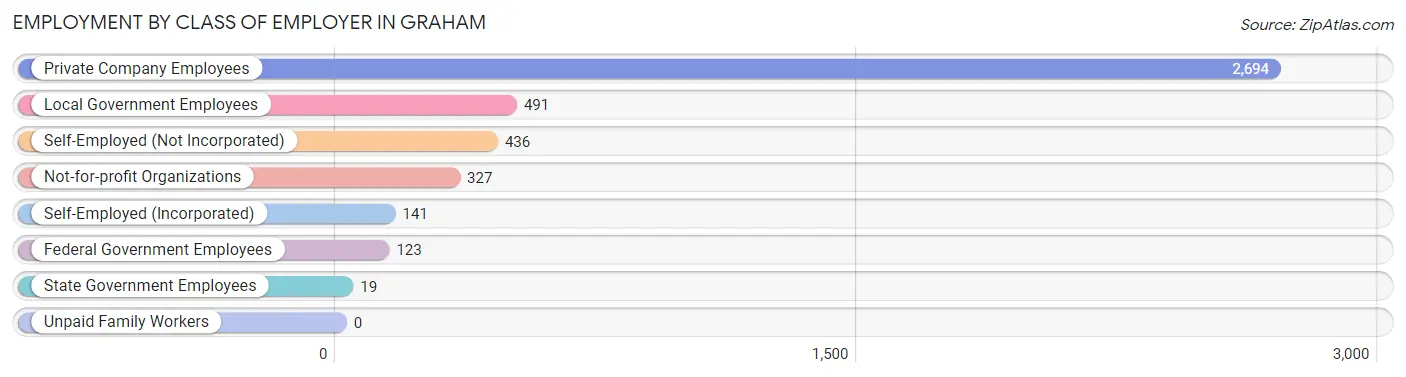
| Employer Class | # Employees | % Employees |
| Private Company Employees | 2,694 | 63.7% |
| Self-Employed (Incorporated) | 141 | 3.3% |
| Self-Employed (Not Incorporated) | 436 | 10.3% |
| Not-for-profit Organizations | 327 | 7.7% |
| Local Government Employees | 491 | 11.6% |
| State Government Employees | 19 | 0.4% |
| Federal Government Employees | 123 | 2.9% |
| Unpaid Family Workers | 0 | 0.0% |
| Total | 4,231 | 100.0% |
Employment Status by Age in Graham
According to the labor force statistics for Graham, out of the total population over 16 years of age (6,713), 64.5% or 4,330 individuals are in the labor force, with 1.5% or 65 of them unemployed. The age group with the highest labor force participation rate is 45 to 54 years, with 91.4% or 822 individuals in the labor force. Within the labor force, the 35 to 44 years age range has the highest percentage of unemployed individuals, with 5.3% or 45 of them being unemployed.
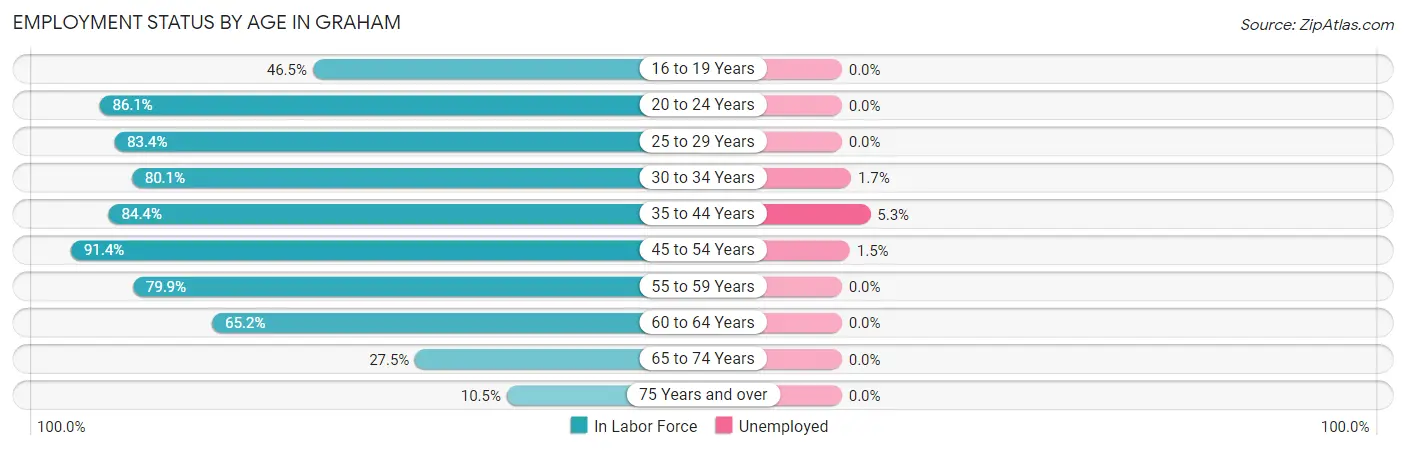
| Age Bracket | In Labor Force | Unemployed |
| 16 to 19 Years | 171 (46.5%) | 0 (0.0%) |
| 20 to 24 Years | 515 (86.1%) | 0 (0.0%) |
| 25 to 29 Years | 529 (83.4%) | 0 (0.0%) |
| 30 to 34 Years | 534 (80.1%) | 9 (1.7%) |
| 35 to 44 Years | 847 (84.4%) | 45 (5.3%) |
| 45 to 54 Years | 822 (91.4%) | 12 (1.5%) |
| 55 to 59 Years | 283 (79.9%) | 0 (0.0%) |
| 60 to 64 Years | 305 (65.2%) | 0 (0.0%) |
| 65 to 74 Years | 231 (27.5%) | 0 (0.0%) |
| 75 Years and over | 92 (10.5%) | 0 (0.0%) |
| Total | 4,330 (64.5%) | 65 (1.5%) |
Employment Status by Educational Attainment in Graham
According to labor force statistics for Graham, 82.5% of individuals (3,321) out of the total population between 25 and 64 years of age (4,026) are in the labor force, with 2.0% or 66 of them being unemployed. The group with the highest labor force participation rate are those with the educational attainment of high school diploma, with 86.4% or 1,146 individuals in the labor force. Within the labor force, individuals with high school diploma education have the highest percentage of unemployment, with 5.0% or 57 of them being unemployed.
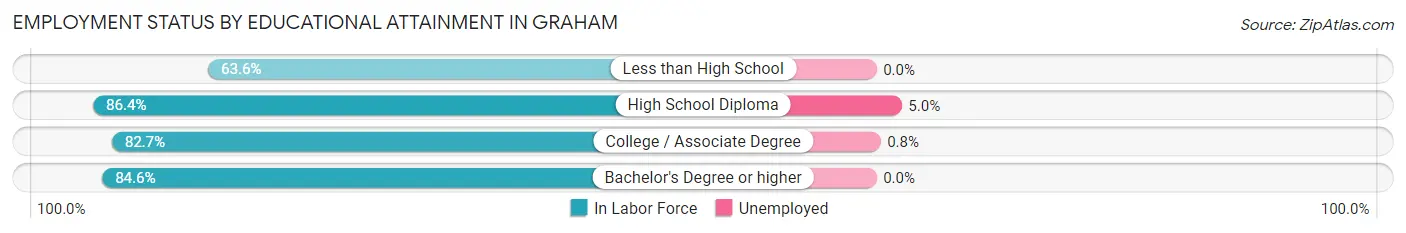
| Educational Attainment | In Labor Force | Unemployed |
| Less than High School | 250 (63.6%) | 0 (0.0%) |
| High School Diploma | 1,146 (86.4%) | 66 (5.0%) |
| College / Associate Degree | 1,198 (82.7%) | 12 (0.8%) |
| Bachelor's Degree or higher | 726 (84.6%) | 0 (0.0%) |
| Total | 3,321 (82.5%) | 81 (2.0%) |
Employment Occupations by Sex in Graham
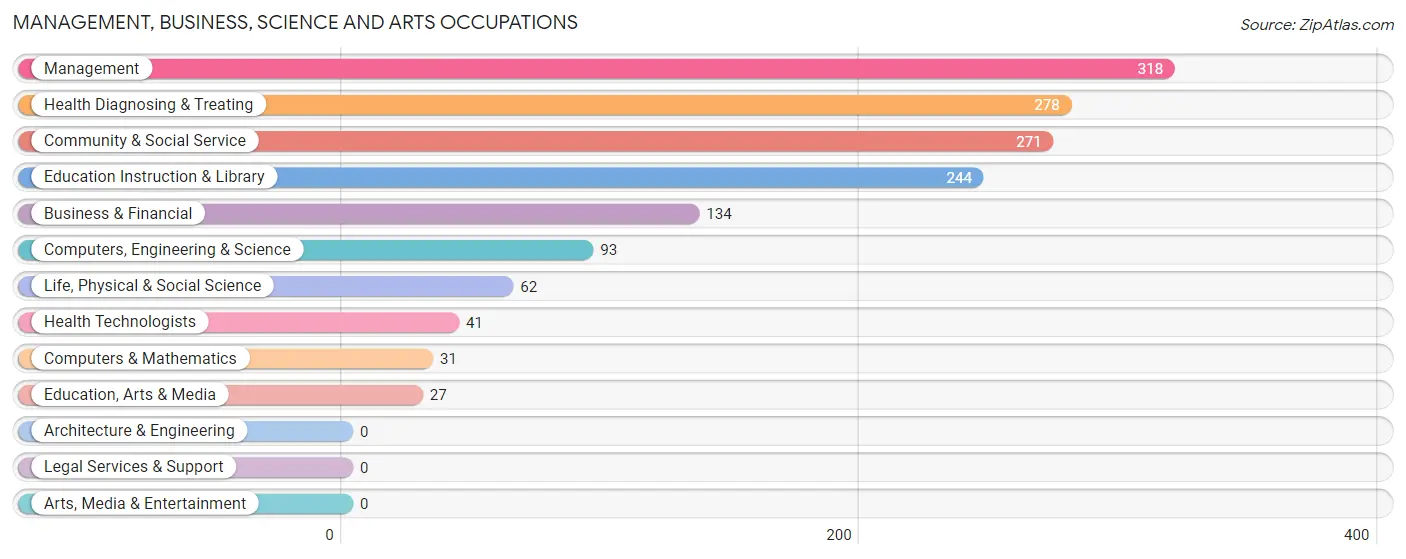
Management, Business, Science and Arts Occupations
The most common Management, Business, Science and Arts occupations in Graham are Management (318 | 7.5%), Health Diagnosing & Treating (278 | 6.5%), Community & Social Service (271 | 6.4%), Education Instruction & Library (244 | 5.7%), and Business & Financial (134 | 3.1%).
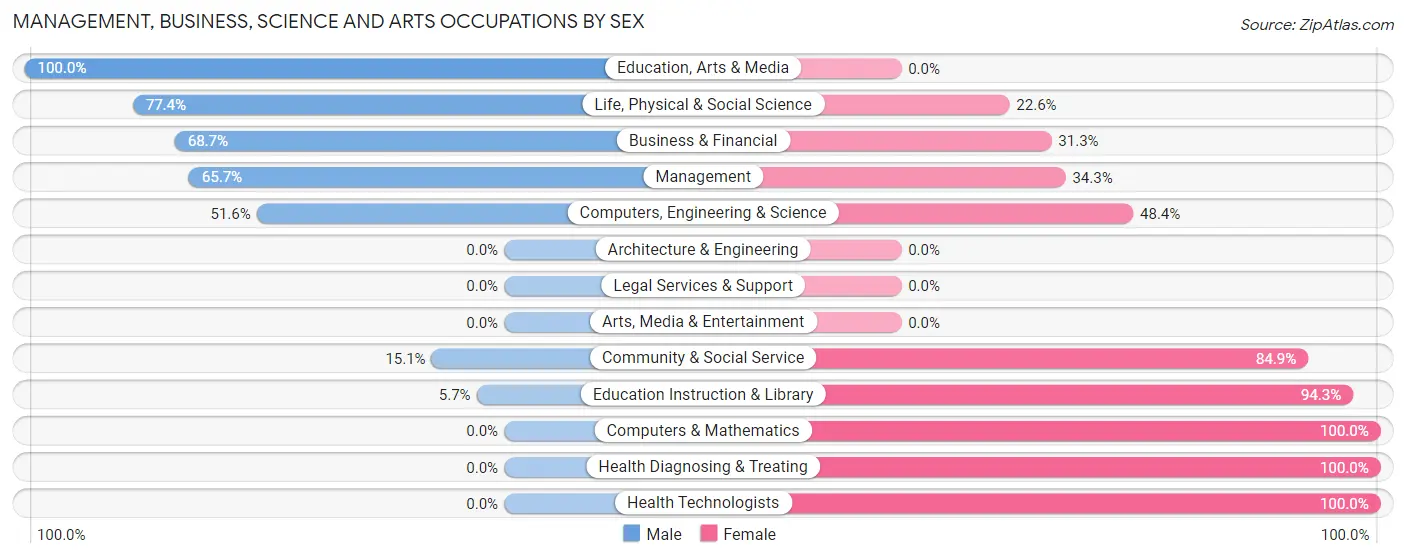
Management, Business, Science and Arts Occupations by Sex
Within the Management, Business, Science and Arts occupations in Graham, the most male-oriented occupations are Education, Arts & Media (100.0%), Life, Physical & Social Science (77.4%), and Business & Financial (68.7%), while the most female-oriented occupations are Computers & Mathematics (100.0%), Health Diagnosing & Treating (100.0%), and Health Technologists (100.0%).
| Occupation | Male | Female |
| Management | 209 (65.7%) | 109 (34.3%) |
| Business & Financial | 92 (68.7%) | 42 (31.3%) |
| Computers, Engineering & Science | 48 (51.6%) | 45 (48.4%) |
| Computers & Mathematics | 0 (0.0%) | 31 (100.0%) |
| Architecture & Engineering | 0 (0.0%) | 0 (0.0%) |
| Life, Physical & Social Science | 48 (77.4%) | 14 (22.6%) |
| Community & Social Service | 41 (15.1%) | 230 (84.9%) |
| Education, Arts & Media | 27 (100.0%) | 0 (0.0%) |
| Legal Services & Support | 0 (0.0%) | 0 (0.0%) |
| Education Instruction & Library | 14 (5.7%) | 230 (94.3%) |
| Arts, Media & Entertainment | 0 (0.0%) | 0 (0.0%) |
| Health Diagnosing & Treating | 0 (0.0%) | 278 (100.0%) |
| Health Technologists | 0 (0.0%) | 41 (100.0%) |
| Total (Category) | 390 (35.6%) | 704 (64.3%) |
| Total (Overall) | 2,278 (53.4%) | 1,985 (46.6%) |
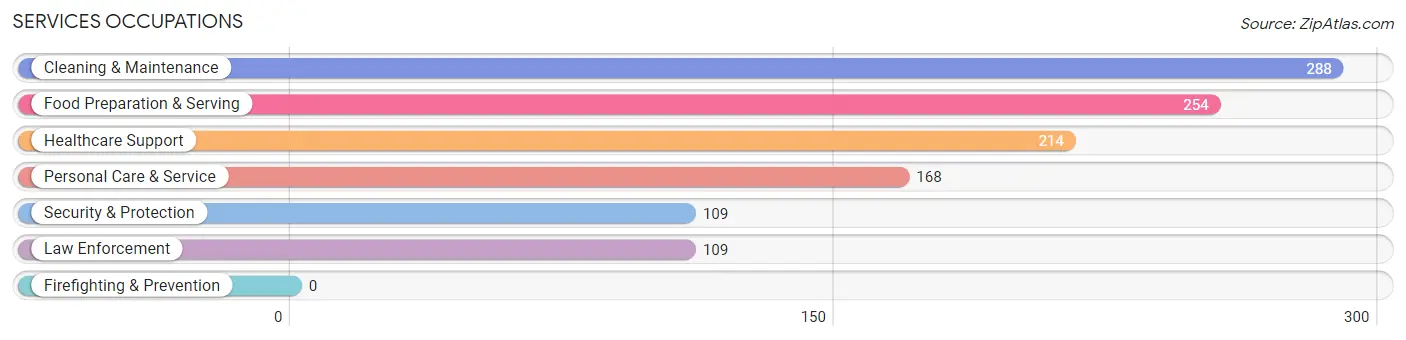
Services Occupations
The most common Services occupations in Graham are Cleaning & Maintenance (288 | 6.8%), Food Preparation & Serving (254 | 6.0%), Healthcare Support (214 | 5.0%), Personal Care & Service (168 | 3.9%), and Security & Protection (109 | 2.6%).
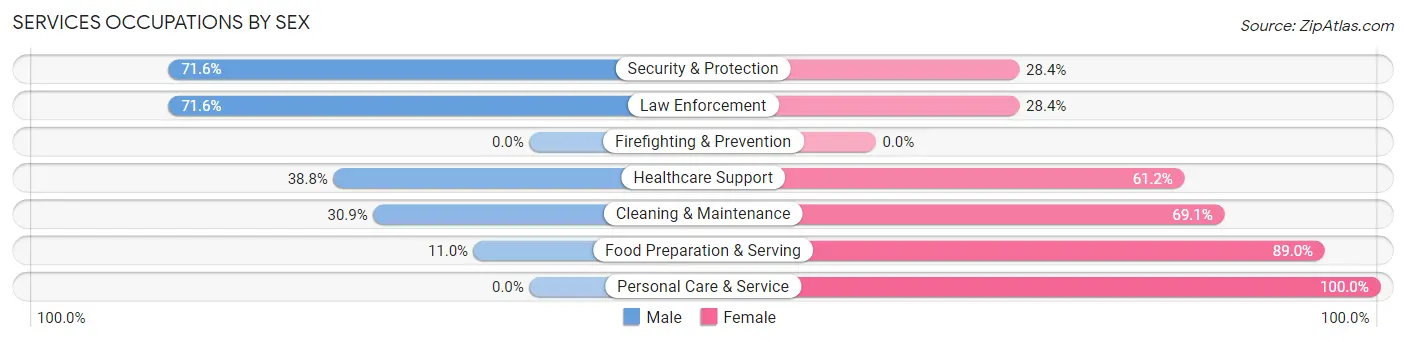
Services Occupations by Sex
Within the Services occupations in Graham, the most male-oriented occupations are Security & Protection (71.6%), Law Enforcement (71.6%), and Healthcare Support (38.8%), while the most female-oriented occupations are Personal Care & Service (100.0%), Food Preparation & Serving (89.0%), and Cleaning & Maintenance (69.1%).
| Occupation | Male | Female |
| Healthcare Support | 83 (38.8%) | 131 (61.2%) |
| Security & Protection | 78 (71.6%) | 31 (28.4%) |
| Firefighting & Prevention | 0 (0.0%) | 0 (0.0%) |
| Law Enforcement | 78 (71.6%) | 31 (28.4%) |
| Food Preparation & Serving | 28 (11.0%) | 226 (89.0%) |
| Cleaning & Maintenance | 89 (30.9%) | 199 (69.1%) |
| Personal Care & Service | 0 (0.0%) | 168 (100.0%) |
| Total (Category) | 278 (26.9%) | 755 (73.1%) |
| Total (Overall) | 2,278 (53.4%) | 1,985 (46.6%) |
Sales and Office Occupations
The most common Sales and Office occupations in Graham are Office & Administration (492 | 11.5%), and Sales & Related (241 | 5.7%).
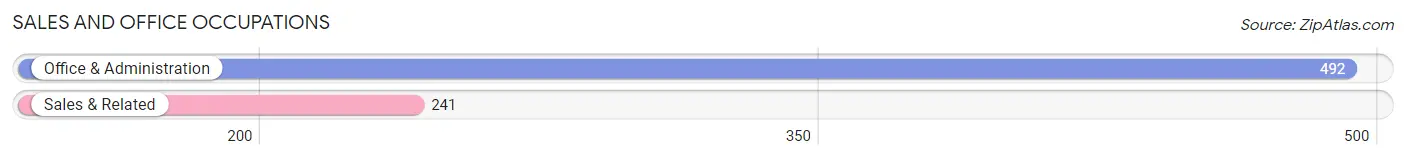
Sales and Office Occupations by Sex
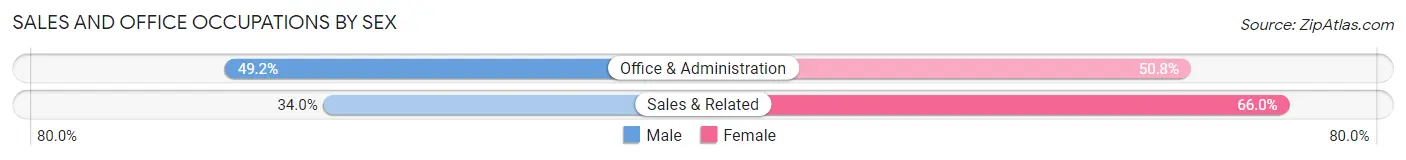
| Occupation | Male | Female |
| Sales & Related | 82 (34.0%) | 159 (66.0%) |
| Office & Administration | 242 (49.2%) | 250 (50.8%) |
| Total (Category) | 324 (44.2%) | 409 (55.8%) |
| Total (Overall) | 2,278 (53.4%) | 1,985 (46.6%) |
Natural Resources, Construction and Maintenance Occupations
The most common Natural Resources, Construction and Maintenance occupations in Graham are Construction & Extraction (512 | 12.0%), Installation, Maintenance & Repair (161 | 3.8%), and Farming, Fishing & Forestry (32 | 0.7%).
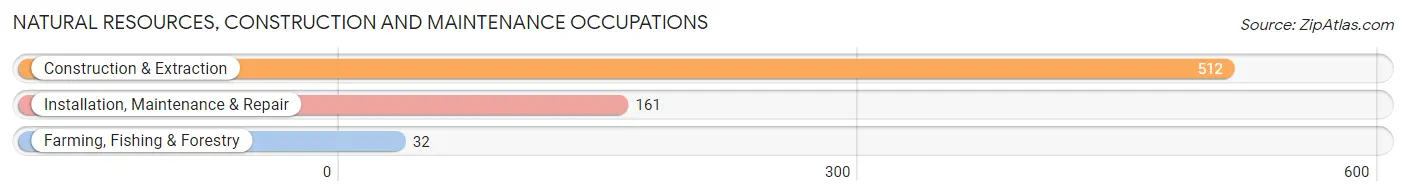
Natural Resources, Construction and Maintenance Occupations by Sex
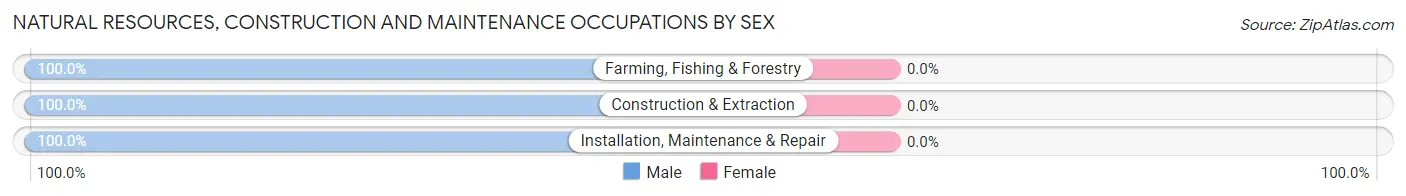
| Occupation | Male | Female |
| Farming, Fishing & Forestry | 32 (100.0%) | 0 (0.0%) |
| Construction & Extraction | 512 (100.0%) | 0 (0.0%) |
| Installation, Maintenance & Repair | 161 (100.0%) | 0 (0.0%) |
| Total (Category) | 705 (100.0%) | 0 (0.0%) |
| Total (Overall) | 2,278 (53.4%) | 1,985 (46.6%) |
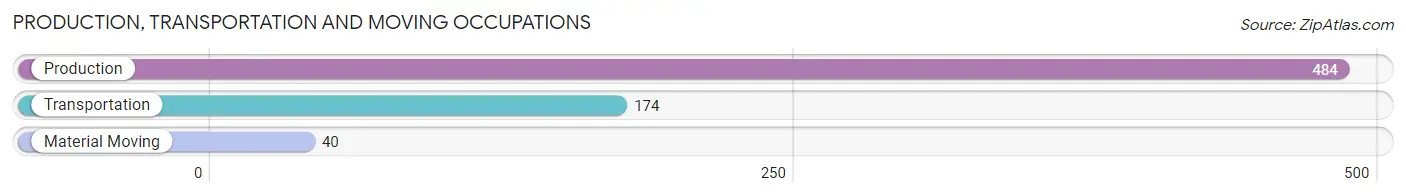
Production, Transportation and Moving Occupations
The most common Production, Transportation and Moving occupations in Graham are Production (484 | 11.4%), Transportation (174 | 4.1%), and Material Moving (40 | 0.9%).
Production, Transportation and Moving Occupations by Sex
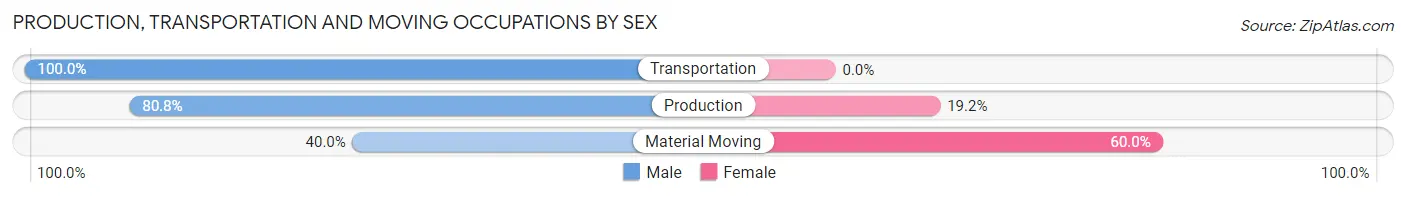
| Occupation | Male | Female |
| Production | 391 (80.8%) | 93 (19.2%) |
| Transportation | 174 (100.0%) | 0 (0.0%) |
| Material Moving | 16 (40.0%) | 24 (60.0%) |
| Total (Category) | 581 (83.2%) | 117 (16.8%) |
| Total (Overall) | 2,278 (53.4%) | 1,985 (46.6%) |
Employment Industries by Sex in Graham
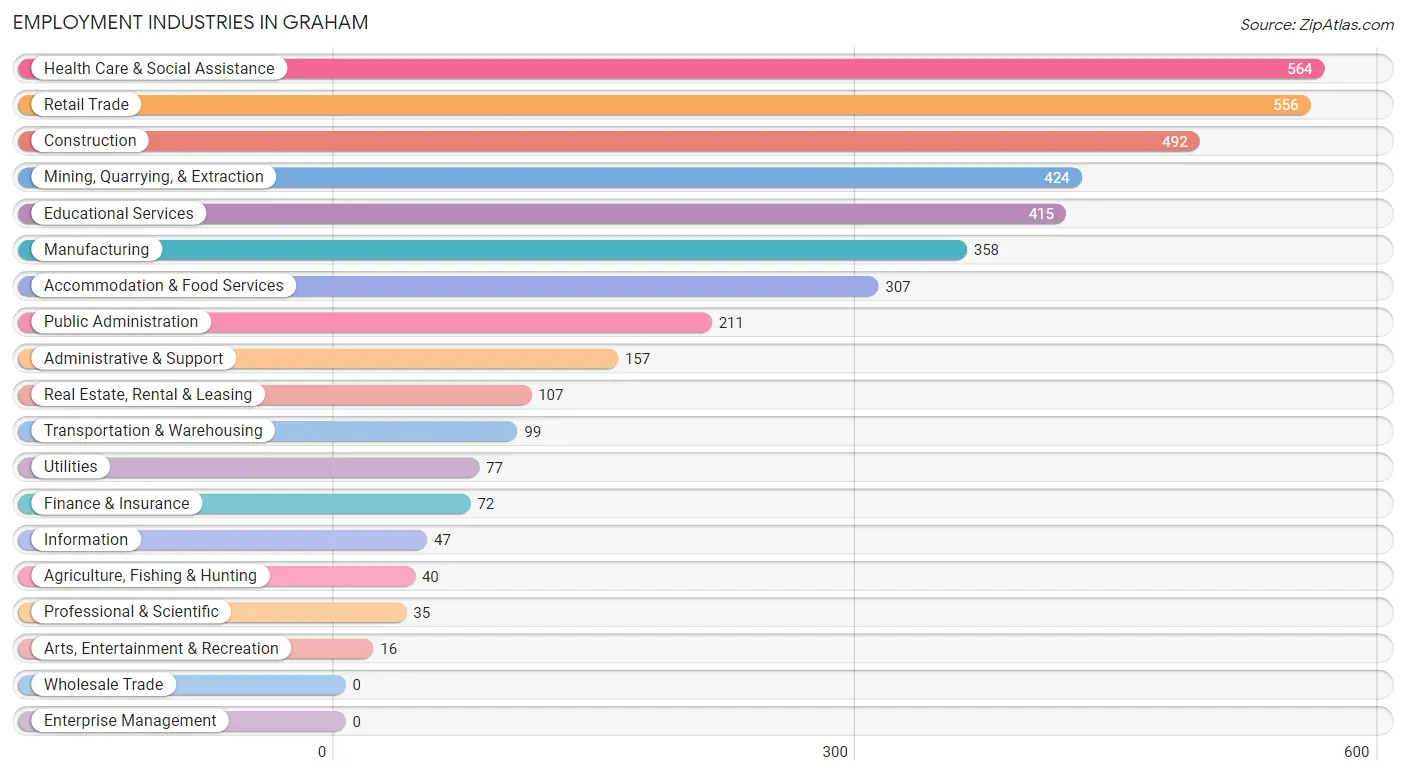
Employment Industries in Graham
The major employment industries in Graham include Health Care & Social Assistance (564 | 13.2%), Retail Trade (556 | 13.0%), Construction (492 | 11.5%), Mining, Quarrying, & Extraction (424 | 10.0%), and Educational Services (415 | 9.7%).
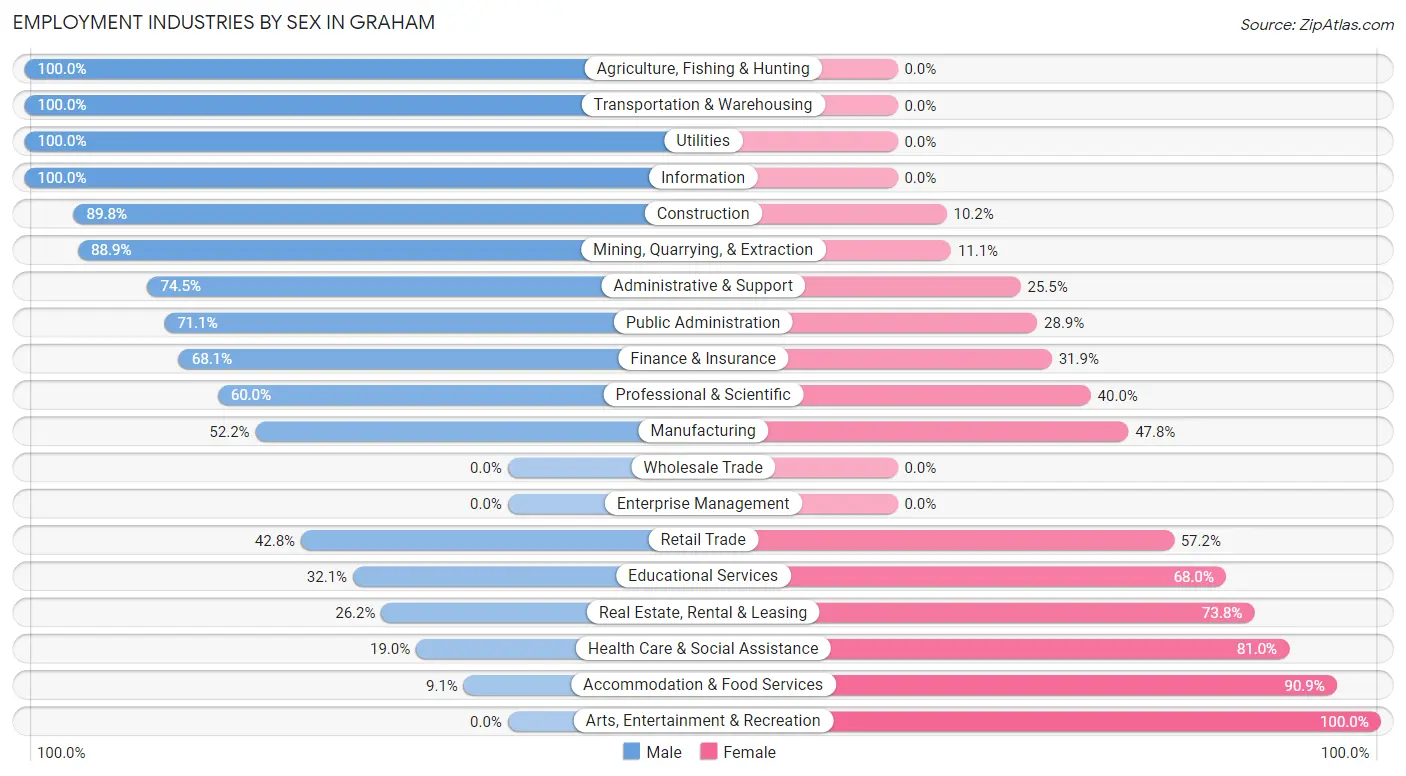
Employment Industries by Sex in Graham
The Graham industries that see more men than women are Agriculture, Fishing & Hunting (100.0%), Transportation & Warehousing (100.0%), and Utilities (100.0%), whereas the industries that tend to have a higher number of women are Arts, Entertainment & Recreation (100.0%), Accommodation & Food Services (90.9%), and Health Care & Social Assistance (81.0%).
| Industry | Male | Female |
| Agriculture, Fishing & Hunting | 40 (100.0%) | 0 (0.0%) |
| Mining, Quarrying, & Extraction | 377 (88.9%) | 47 (11.1%) |
| Construction | 442 (89.8%) | 50 (10.2%) |
| Manufacturing | 187 (52.2%) | 171 (47.8%) |
| Wholesale Trade | 0 (0.0%) | 0 (0.0%) |
| Retail Trade | 238 (42.8%) | 318 (57.2%) |
| Transportation & Warehousing | 99 (100.0%) | 0 (0.0%) |
| Utilities | 77 (100.0%) | 0 (0.0%) |
| Information | 47 (100.0%) | 0 (0.0%) |
| Finance & Insurance | 49 (68.1%) | 23 (31.9%) |
| Real Estate, Rental & Leasing | 28 (26.2%) | 79 (73.8%) |
| Professional & Scientific | 21 (60.0%) | 14 (40.0%) |
| Enterprise Management | 0 (0.0%) | 0 (0.0%) |
| Administrative & Support | 117 (74.5%) | 40 (25.5%) |
| Educational Services | 133 (32.1%) | 282 (67.9%) |
| Health Care & Social Assistance | 107 (19.0%) | 457 (81.0%) |
| Arts, Entertainment & Recreation | 0 (0.0%) | 16 (100.0%) |
| Accommodation & Food Services | 28 (9.1%) | 279 (90.9%) |
| Public Administration | 150 (71.1%) | 61 (28.9%) |
| Total | 2,278 (53.4%) | 1,985 (46.6%) |
Education in Graham
School Enrollment in Graham
The most common levels of schooling among the 1,917 students in Graham are elementary school (568 | 29.6%), middle school (499 | 26.0%), and high school (386 | 20.1%).
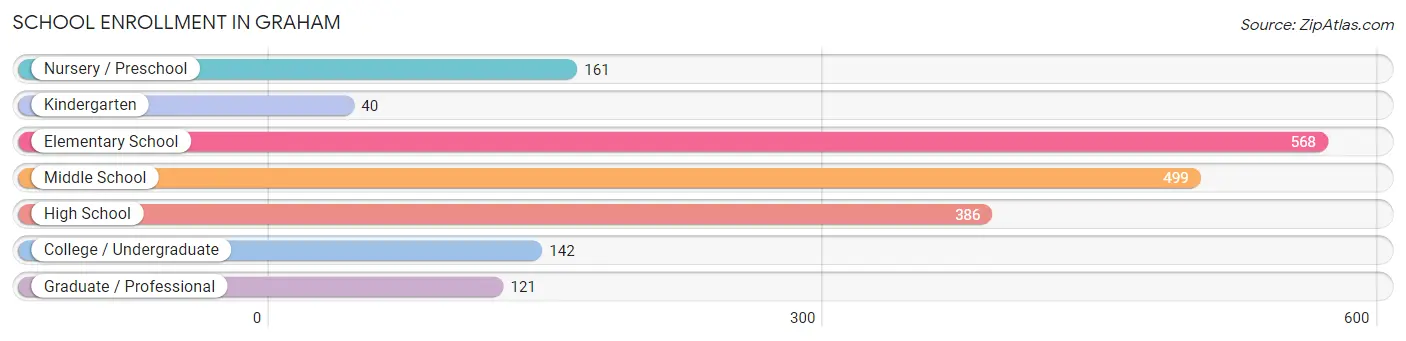
| School Level | # Students | % Students |
| Nursery / Preschool | 161 | 8.4% |
| Kindergarten | 40 | 2.1% |
| Elementary School | 568 | 29.6% |
| Middle School | 499 | 26.0% |
| High School | 386 | 20.1% |
| College / Undergraduate | 142 | 7.4% |
| Graduate / Professional | 121 | 6.3% |
| Total | 1,917 | 100.0% |
School Enrollment by Age by Funding Source in Graham
Out of a total of 1,917 students who are enrolled in schools in Graham, 192 (10.0%) attend a private institution, while the remaining 1,725 (90.0%) are enrolled in public schools. The age group of 3 to 4 year olds has the highest likelihood of being enrolled in private schools, with 71 (50.0% in the age bracket) enrolled. Conversely, the age group of 15 to 17 year olds has the lowest likelihood of being enrolled in a private school, with 308 (100.0% in the age bracket) attending a public institution.
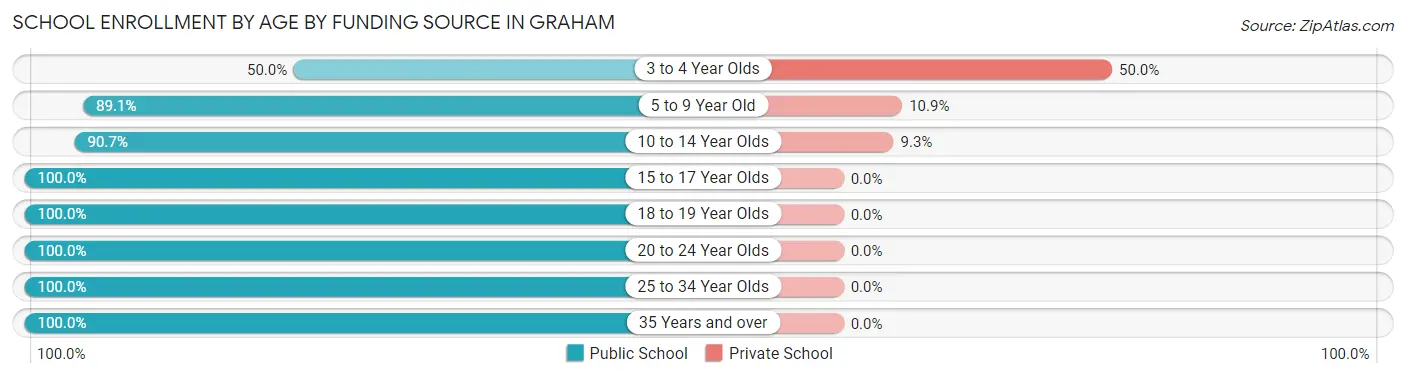
| Age Bracket | Public School | Private School |
| 3 to 4 Year Olds | 71 (50.0%) | 71 (50.0%) |
| 5 to 9 Year Old | 498 (89.1%) | 61 (10.9%) |
| 10 to 14 Year Olds | 585 (90.7%) | 60 (9.3%) |
| 15 to 17 Year Olds | 308 (100.0%) | 0 (0.0%) |
| 18 to 19 Year Olds | 19 (100.0%) | 0 (0.0%) |
| 20 to 24 Year Olds | 27 (100.0%) | 0 (0.0%) |
| 25 to 34 Year Olds | 102 (100.0%) | 0 (0.0%) |
| 35 Years and over | 115 (100.0%) | 0 (0.0%) |
| Total | 1,725 (90.0%) | 192 (10.0%) |
Educational Attainment by Field of Study in Graham
Education (277 | 23.2%), arts & humanities (227 | 19.0%), business (191 | 16.0%), social sciences (147 | 12.3%), and bio, nature & agricultural (54 | 4.5%) are the most common fields of study among 1,194 individuals in Graham who have obtained a bachelor's degree or higher.
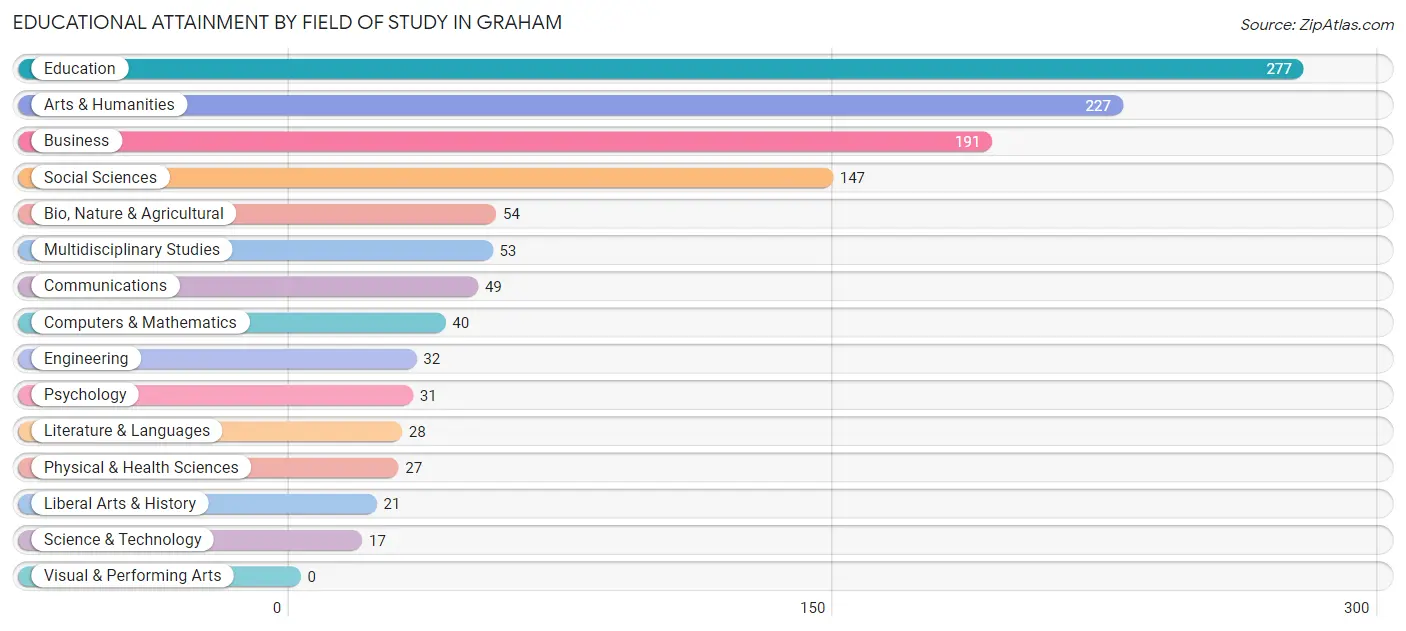
| Field of Study | # Graduates | % Graduates |
| Computers & Mathematics | 40 | 3.4% |
| Bio, Nature & Agricultural | 54 | 4.5% |
| Physical & Health Sciences | 27 | 2.3% |
| Psychology | 31 | 2.6% |
| Social Sciences | 147 | 12.3% |
| Engineering | 32 | 2.7% |
| Multidisciplinary Studies | 53 | 4.4% |
| Science & Technology | 17 | 1.4% |
| Business | 191 | 16.0% |
| Education | 277 | 23.2% |
| Literature & Languages | 28 | 2.4% |
| Liberal Arts & History | 21 | 1.8% |
| Visual & Performing Arts | 0 | 0.0% |
| Communications | 49 | 4.1% |
| Arts & Humanities | 227 | 19.0% |
| Total | 1,194 | 100.0% |
Transportation & Commute in Graham
Vehicle Availability by Sex in Graham
The most prevalent vehicle ownership categories in Graham are males with 2 vehicles (1,093, accounting for 48.3%) and females with 2 vehicles (859, making up 55.5%).
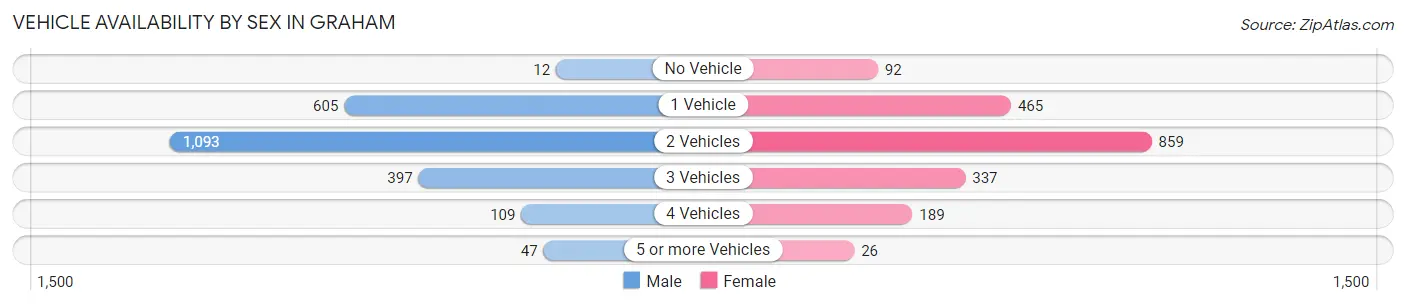
| Vehicles Available | Male | Female |
| No Vehicle | 12 (0.5%) | 92 (4.7%) |
| 1 Vehicle | 605 (26.7%) | 465 (23.6%) |
| 2 Vehicles | 1,093 (48.3%) | 859 (43.6%) |
| 3 Vehicles | 397 (17.5%) | 337 (17.1%) |
| 4 Vehicles | 109 (4.8%) | 189 (9.6%) |
| 5 or more Vehicles | 47 (2.1%) | 26 (1.3%) |
| Total | 2,263 (100.0%) | 1,968 (100.0%) |
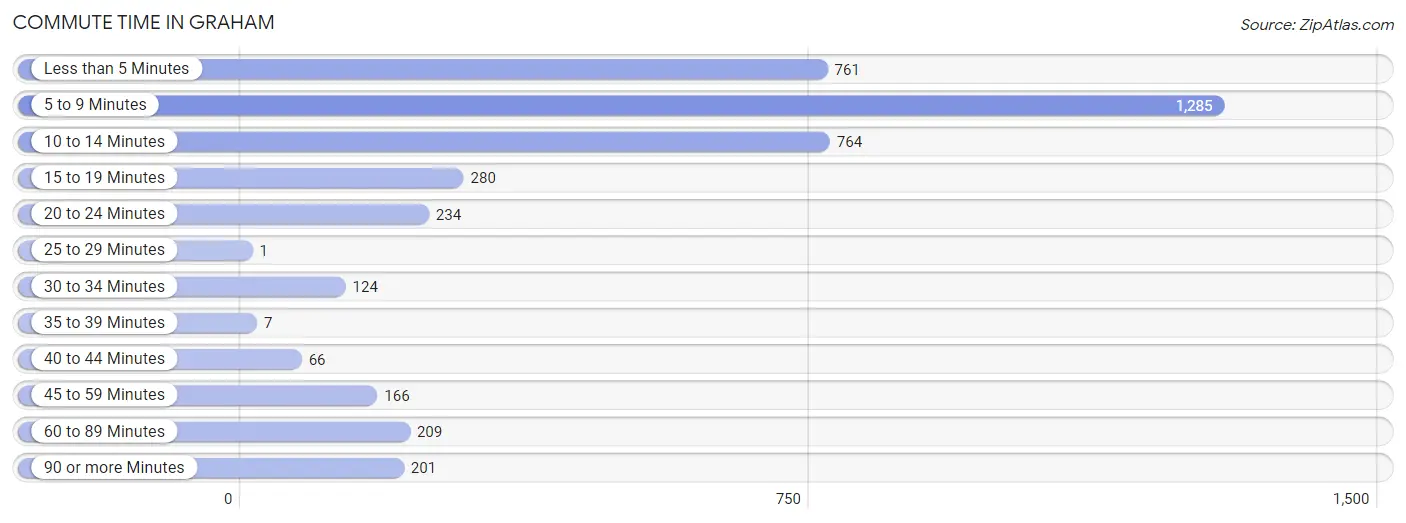
Commute Time in Graham
The most frequently occuring commute durations in Graham are 5 to 9 minutes (1,285 commuters, 31.4%), 10 to 14 minutes (764 commuters, 18.6%), and less than 5 minutes (761 commuters, 18.6%).
| Commute Time | # Commuters | % Commuters |
| Less than 5 Minutes | 761 | 18.6% |
| 5 to 9 Minutes | 1,285 | 31.4% |
| 10 to 14 Minutes | 764 | 18.6% |
| 15 to 19 Minutes | 280 | 6.8% |
| 20 to 24 Minutes | 234 | 5.7% |
| 25 to 29 Minutes | 1 | 0.0% |
| 30 to 34 Minutes | 124 | 3.0% |
| 35 to 39 Minutes | 7 | 0.2% |
| 40 to 44 Minutes | 66 | 1.6% |
| 45 to 59 Minutes | 166 | 4.1% |
| 60 to 89 Minutes | 209 | 5.1% |
| 90 or more Minutes | 201 | 4.9% |
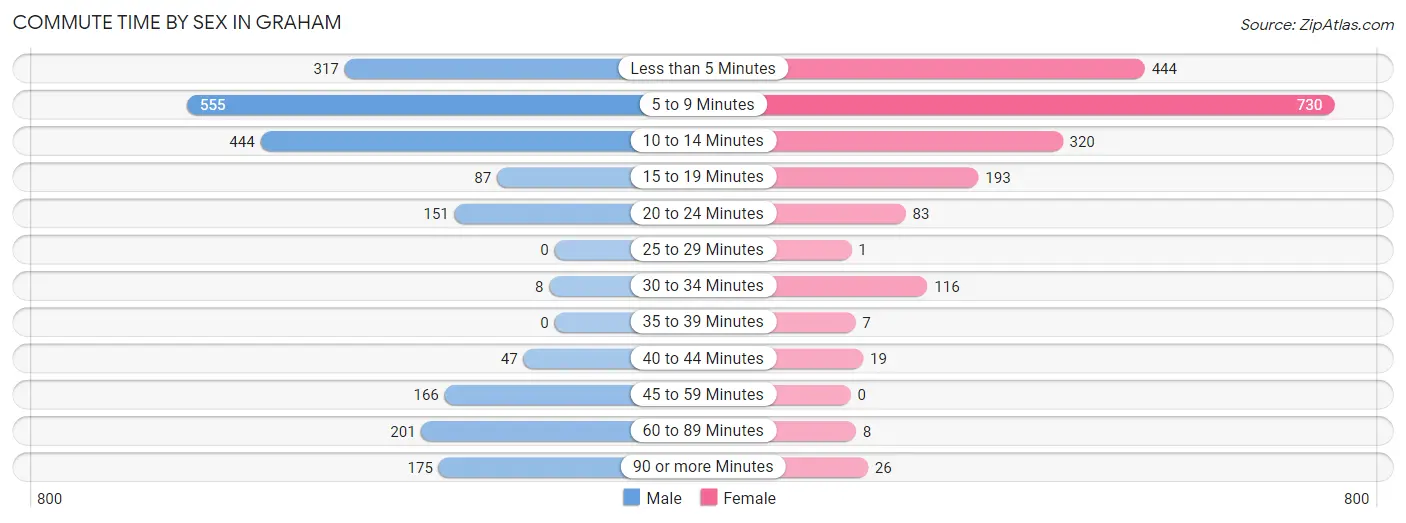
Commute Time by Sex in Graham
The most common commute times in Graham are 5 to 9 minutes (555 commuters, 25.8%) for males and 5 to 9 minutes (730 commuters, 37.5%) for females.
| Commute Time | Male | Female |
| Less than 5 Minutes | 317 (14.7%) | 444 (22.8%) |
| 5 to 9 Minutes | 555 (25.8%) | 730 (37.5%) |
| 10 to 14 Minutes | 444 (20.6%) | 320 (16.4%) |
| 15 to 19 Minutes | 87 (4.0%) | 193 (9.9%) |
| 20 to 24 Minutes | 151 (7.0%) | 83 (4.3%) |
| 25 to 29 Minutes | 0 (0.0%) | 1 (0.1%) |
| 30 to 34 Minutes | 8 (0.4%) | 116 (6.0%) |
| 35 to 39 Minutes | 0 (0.0%) | 7 (0.4%) |
| 40 to 44 Minutes | 47 (2.2%) | 19 (1.0%) |
| 45 to 59 Minutes | 166 (7.7%) | 0 (0.0%) |
| 60 to 89 Minutes | 201 (9.3%) | 8 (0.4%) |
| 90 or more Minutes | 175 (8.1%) | 26 (1.3%) |
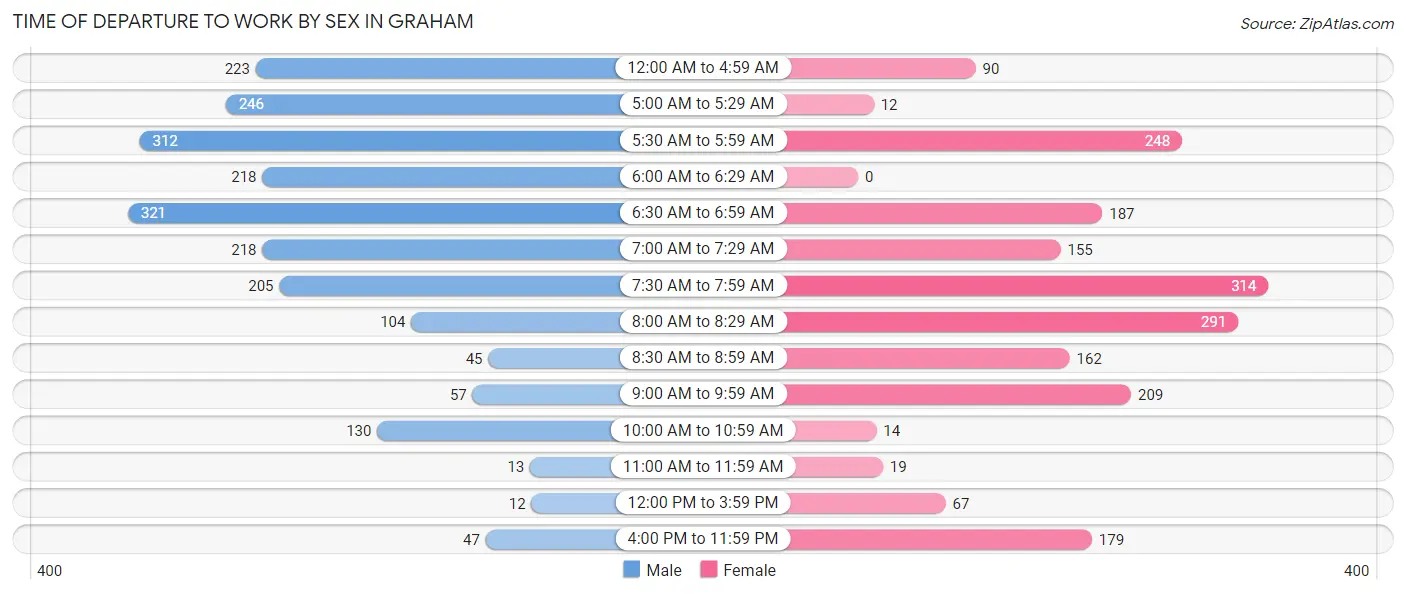
Time of Departure to Work by Sex in Graham
The most frequent times of departure to work in Graham are 6:30 AM to 6:59 AM (321, 14.9%) for males and 7:30 AM to 7:59 AM (314, 16.1%) for females.
| Time of Departure | Male | Female |
| 12:00 AM to 4:59 AM | 223 (10.4%) | 90 (4.6%) |
| 5:00 AM to 5:29 AM | 246 (11.4%) | 12 (0.6%) |
| 5:30 AM to 5:59 AM | 312 (14.5%) | 248 (12.7%) |
| 6:00 AM to 6:29 AM | 218 (10.1%) | 0 (0.0%) |
| 6:30 AM to 6:59 AM | 321 (14.9%) | 187 (9.6%) |
| 7:00 AM to 7:29 AM | 218 (10.1%) | 155 (8.0%) |
| 7:30 AM to 7:59 AM | 205 (9.5%) | 314 (16.1%) |
| 8:00 AM to 8:29 AM | 104 (4.8%) | 291 (14.9%) |
| 8:30 AM to 8:59 AM | 45 (2.1%) | 162 (8.3%) |
| 9:00 AM to 9:59 AM | 57 (2.6%) | 209 (10.7%) |
| 10:00 AM to 10:59 AM | 130 (6.0%) | 14 (0.7%) |
| 11:00 AM to 11:59 AM | 13 (0.6%) | 19 (1.0%) |
| 12:00 PM to 3:59 PM | 12 (0.6%) | 67 (3.4%) |
| 4:00 PM to 11:59 PM | 47 (2.2%) | 179 (9.2%) |
| Total | 2,151 (100.0%) | 1,947 (100.0%) |
Housing Occupancy in Graham
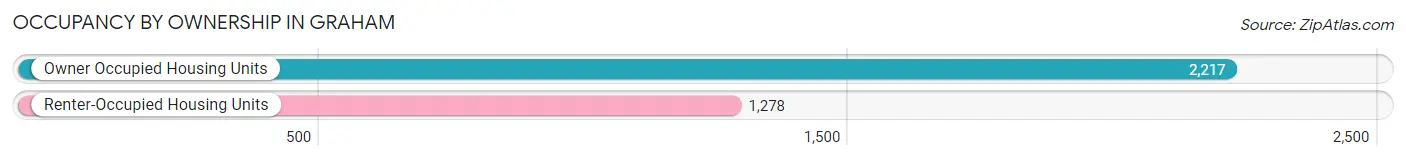
Occupancy by Ownership in Graham
Of the total 3,495 dwellings in Graham, owner-occupied units account for 2,217 (63.4%), while renter-occupied units make up 1,278 (36.6%).
| Occupancy | # Housing Units | % Housing Units |
| Owner Occupied Housing Units | 2,217 | 63.4% |
| Renter-Occupied Housing Units | 1,278 | 36.6% |
| Total Occupied Housing Units | 3,495 | 100.0% |
Occupancy by Household Size in Graham
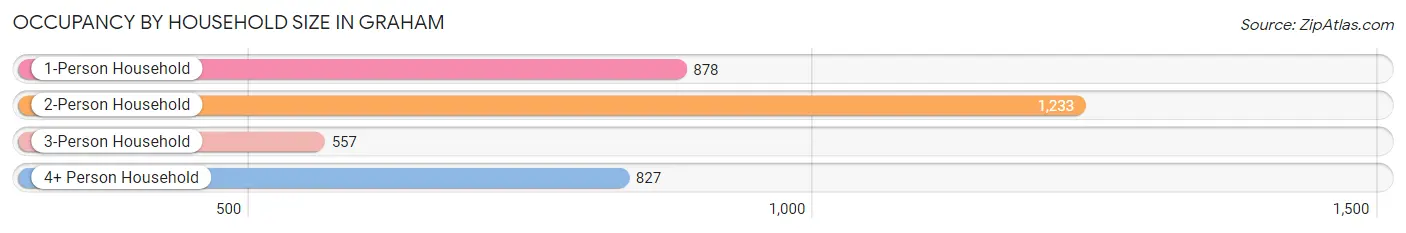
| Household Size | # Housing Units | % Housing Units |
| 1-Person Household | 878 | 25.1% |
| 2-Person Household | 1,233 | 35.3% |
| 3-Person Household | 557 | 15.9% |
| 4+ Person Household | 827 | 23.7% |
| Total Housing Units | 3,495 | 100.0% |
Occupancy by Ownership by Household Size in Graham
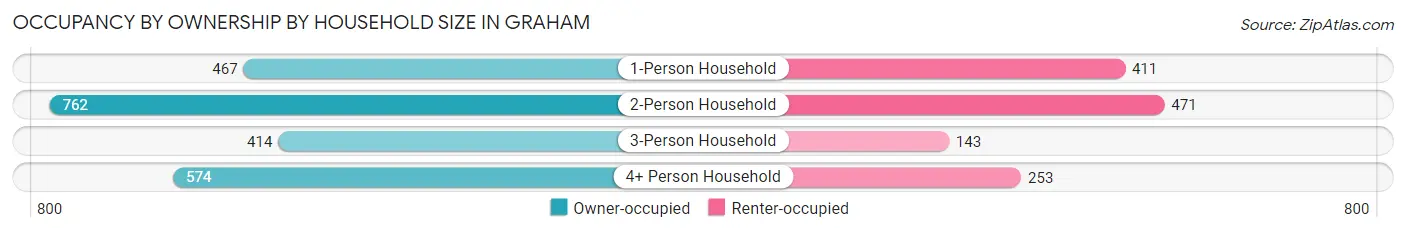
| Household Size | Owner-occupied | Renter-occupied |
| 1-Person Household | 467 (53.2%) | 411 (46.8%) |
| 2-Person Household | 762 (61.8%) | 471 (38.2%) |
| 3-Person Household | 414 (74.3%) | 143 (25.7%) |
| 4+ Person Household | 574 (69.4%) | 253 (30.6%) |
| Total Housing Units | 2,217 (63.4%) | 1,278 (36.6%) |
Occupancy by Educational Attainment in Graham
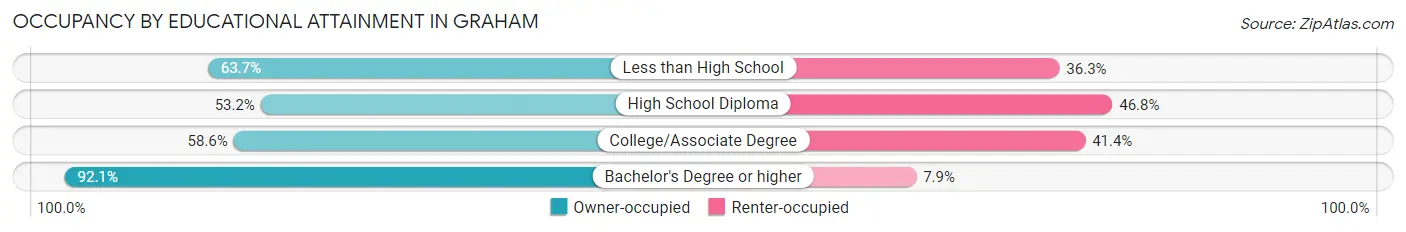
| Household Size | Owner-occupied | Renter-occupied |
| Less than High School | 184 (63.7%) | 105 (36.3%) |
| High School Diploma | 759 (53.2%) | 668 (46.8%) |
| College/Associate Degree | 636 (58.6%) | 450 (41.4%) |
| Bachelor's Degree or higher | 638 (92.1%) | 55 (7.9%) |
Occupancy by Age of Householder in Graham
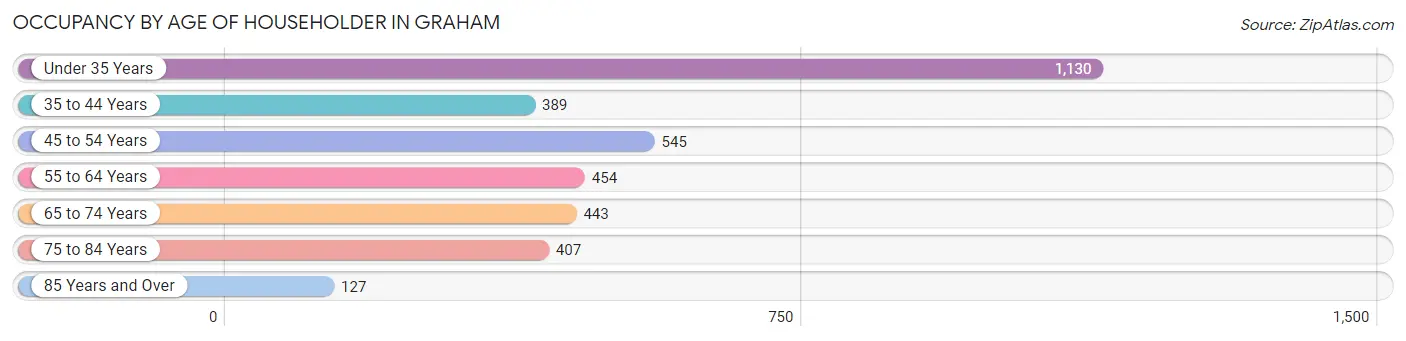
| Age Bracket | # Households | % Households |
| Under 35 Years | 1,130 | 32.3% |
| 35 to 44 Years | 389 | 11.1% |
| 45 to 54 Years | 545 | 15.6% |
| 55 to 64 Years | 454 | 13.0% |
| 65 to 74 Years | 443 | 12.7% |
| 75 to 84 Years | 407 | 11.7% |
| 85 Years and Over | 127 | 3.6% |
| Total | 3,495 | 100.0% |
Housing Finances in Graham
Median Income by Occupancy in Graham
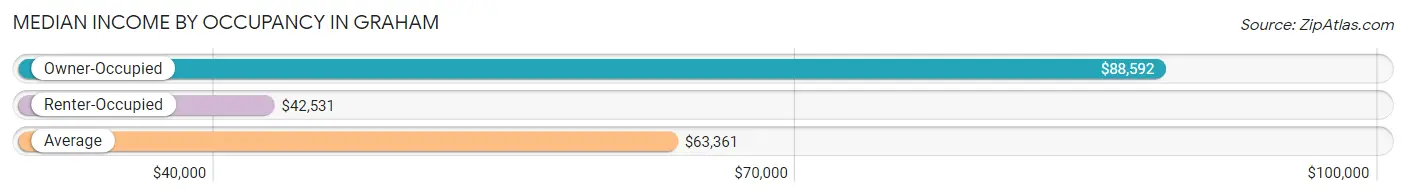
| Occupancy Type | # Households | Median Income |
| Owner-Occupied | 2,217 (63.4%) | $88,592 |
| Renter-Occupied | 1,278 (36.6%) | $42,531 |
| Average | 3,495 (100.0%) | $63,361 |
Occupancy by Householder Income Bracket in Graham
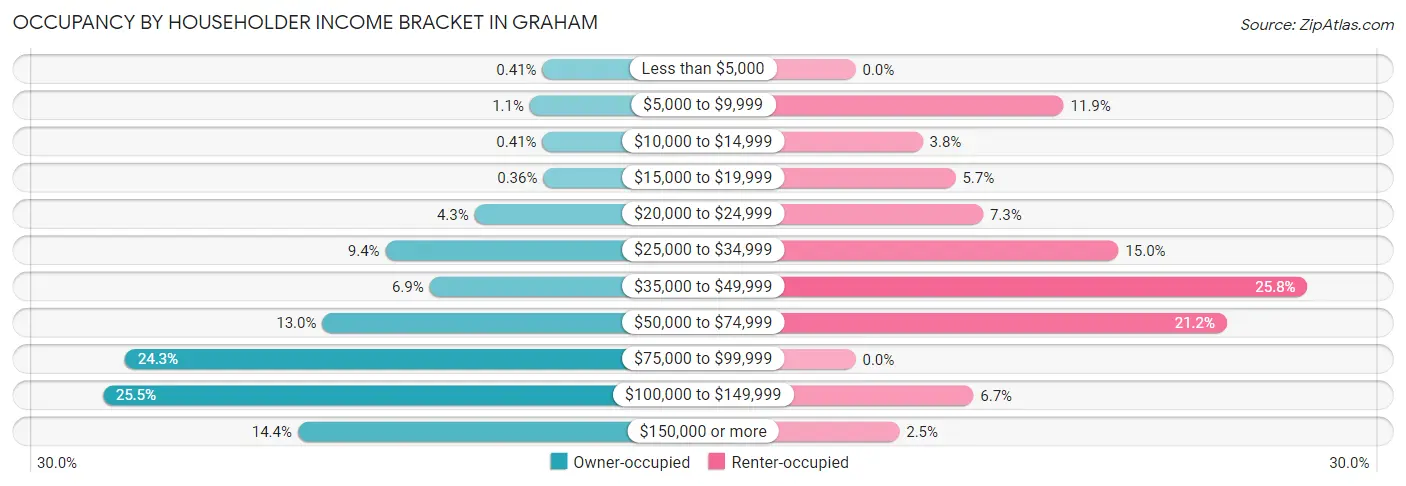
| Income Bracket | Owner-occupied | Renter-occupied |
| Less than $5,000 | 9 (0.4%) | 0 (0.0%) |
| $5,000 to $9,999 | 25 (1.1%) | 152 (11.9%) |
| $10,000 to $14,999 | 9 (0.4%) | 49 (3.8%) |
| $15,000 to $19,999 | 8 (0.4%) | 73 (5.7%) |
| $20,000 to $24,999 | 95 (4.3%) | 93 (7.3%) |
| $25,000 to $34,999 | 208 (9.4%) | 192 (15.0%) |
| $35,000 to $49,999 | 152 (6.9%) | 330 (25.8%) |
| $50,000 to $74,999 | 288 (13.0%) | 271 (21.2%) |
| $75,000 to $99,999 | 538 (24.3%) | 0 (0.0%) |
| $100,000 to $149,999 | 566 (25.5%) | 86 (6.7%) |
| $150,000 or more | 319 (14.4%) | 32 (2.5%) |
| Total | 2,217 (100.0%) | 1,278 (100.0%) |
Monthly Housing Cost Tiers in Graham
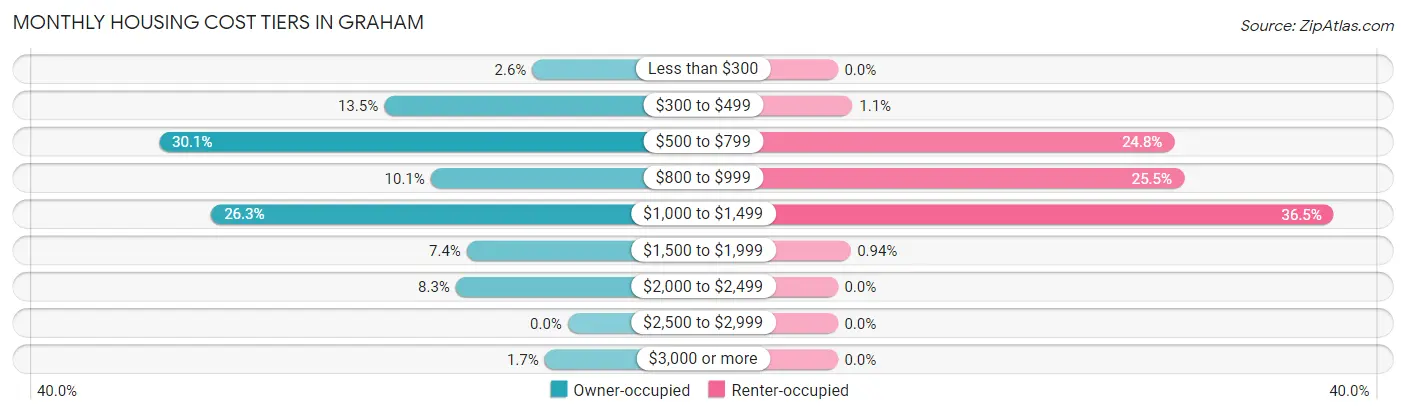
| Monthly Cost | Owner-occupied | Renter-occupied |
| Less than $300 | 58 (2.6%) | 0 (0.0%) |
| $300 to $499 | 300 (13.5%) | 14 (1.1%) |
| $500 to $799 | 667 (30.1%) | 317 (24.8%) |
| $800 to $999 | 224 (10.1%) | 326 (25.5%) |
| $1,000 to $1,499 | 582 (26.3%) | 467 (36.5%) |
| $1,500 to $1,999 | 165 (7.4%) | 12 (0.9%) |
| $2,000 to $2,499 | 183 (8.3%) | 0 (0.0%) |
| $2,500 to $2,999 | 0 (0.0%) | 0 (0.0%) |
| $3,000 or more | 38 (1.7%) | 0 (0.0%) |
| Total | 2,217 (100.0%) | 1,278 (100.0%) |
Physical Housing Characteristics in Graham
Housing Structures in Graham
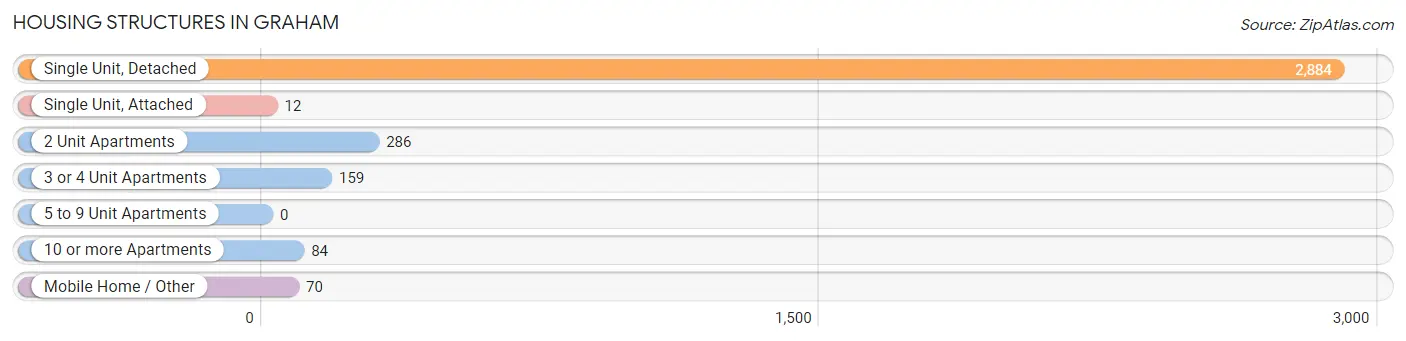
| Structure Type | # Housing Units | % Housing Units |
| Single Unit, Detached | 2,884 | 82.5% |
| Single Unit, Attached | 12 | 0.3% |
| 2 Unit Apartments | 286 | 8.2% |
| 3 or 4 Unit Apartments | 159 | 4.5% |
| 5 to 9 Unit Apartments | 0 | 0.0% |
| 10 or more Apartments | 84 | 2.4% |
| Mobile Home / Other | 70 | 2.0% |
| Total | 3,495 | 100.0% |
Housing Structures by Occupancy in Graham
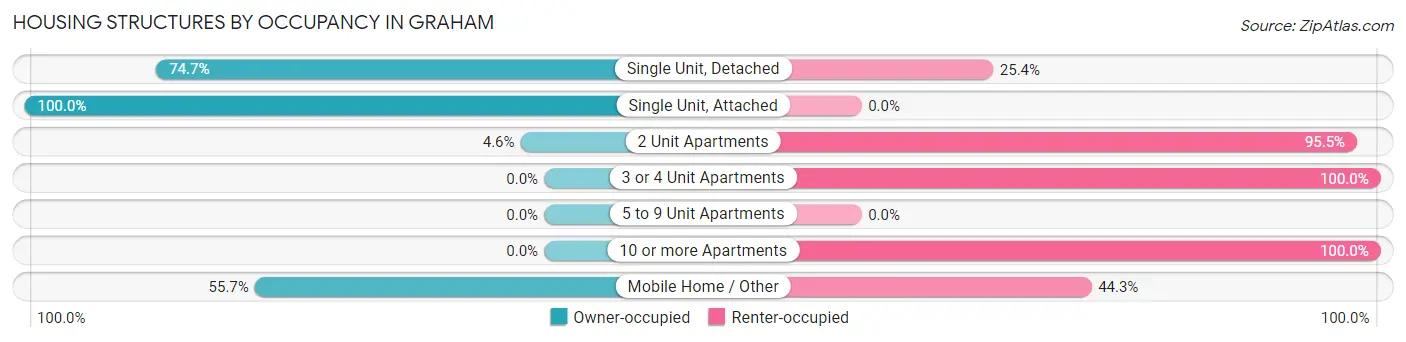
| Structure Type | Owner-occupied | Renter-occupied |
| Single Unit, Detached | 2,153 (74.7%) | 731 (25.4%) |
| Single Unit, Attached | 12 (100.0%) | 0 (0.0%) |
| 2 Unit Apartments | 13 (4.5%) | 273 (95.5%) |
| 3 or 4 Unit Apartments | 0 (0.0%) | 159 (100.0%) |
| 5 to 9 Unit Apartments | 0 (0.0%) | 0 (0.0%) |
| 10 or more Apartments | 0 (0.0%) | 84 (100.0%) |
| Mobile Home / Other | 39 (55.7%) | 31 (44.3%) |
| Total | 2,217 (63.4%) | 1,278 (36.6%) |
Housing Structures by Number of Rooms in Graham
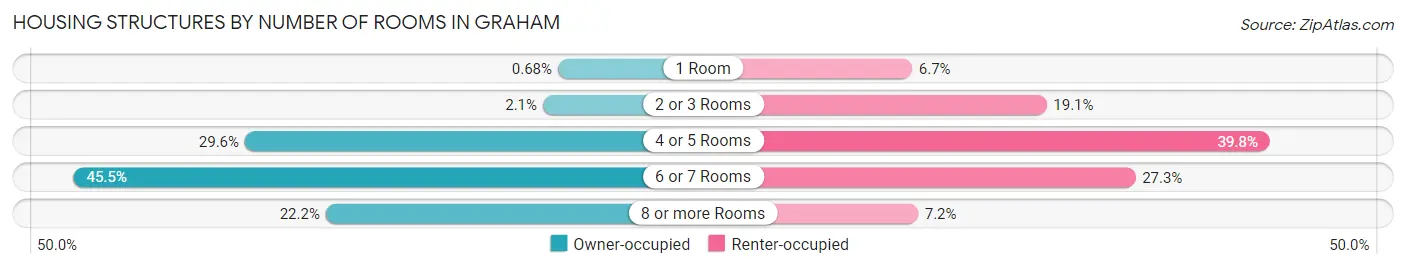
| Number of Rooms | Owner-occupied | Renter-occupied |
| 1 Room | 15 (0.7%) | 85 (6.7%) |
| 2 or 3 Rooms | 46 (2.1%) | 244 (19.1%) |
| 4 or 5 Rooms | 657 (29.6%) | 508 (39.8%) |
| 6 or 7 Rooms | 1,008 (45.5%) | 349 (27.3%) |
| 8 or more Rooms | 491 (22.2%) | 92 (7.2%) |
| Total | 2,217 (100.0%) | 1,278 (100.0%) |
Housing Structure by Heating Type in Graham
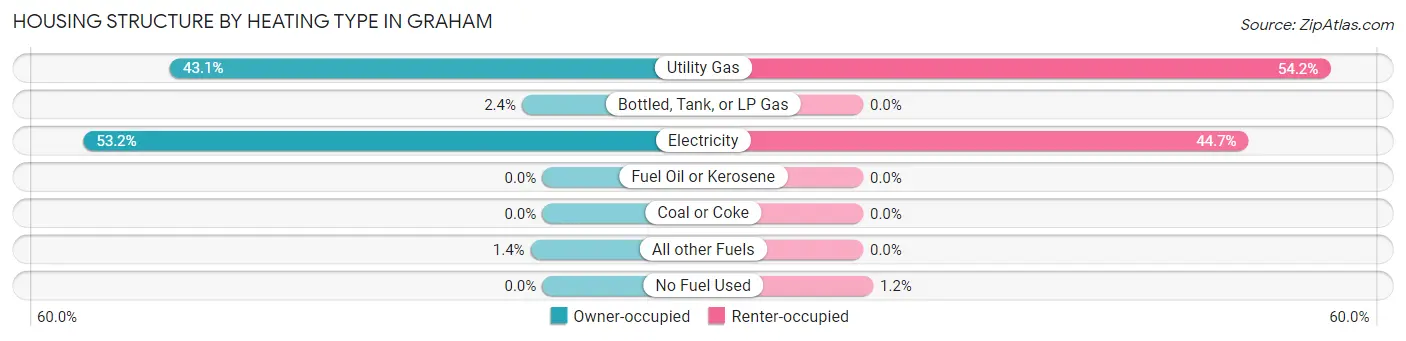
| Heating Type | Owner-occupied | Renter-occupied |
| Utility Gas | 956 (43.1%) | 692 (54.1%) |
| Bottled, Tank, or LP Gas | 52 (2.4%) | 0 (0.0%) |
| Electricity | 1,179 (53.2%) | 571 (44.7%) |
| Fuel Oil or Kerosene | 0 (0.0%) | 0 (0.0%) |
| Coal or Coke | 0 (0.0%) | 0 (0.0%) |
| All other Fuels | 30 (1.3%) | 0 (0.0%) |
| No Fuel Used | 0 (0.0%) | 15 (1.2%) |
| Total | 2,217 (100.0%) | 1,278 (100.0%) |
Household Vehicle Usage in Graham
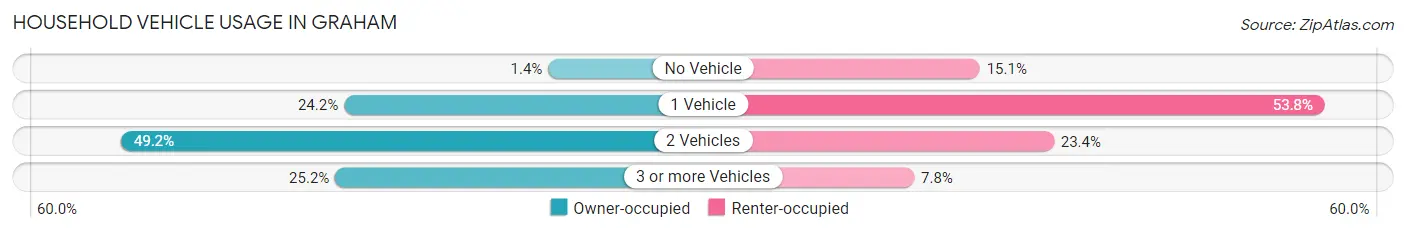
| Vehicles per Household | Owner-occupied | Renter-occupied |
| No Vehicle | 30 (1.3%) | 193 (15.1%) |
| 1 Vehicle | 537 (24.2%) | 687 (53.8%) |
| 2 Vehicles | 1,091 (49.2%) | 299 (23.4%) |
| 3 or more Vehicles | 559 (25.2%) | 99 (7.7%) |
| Total | 2,217 (100.0%) | 1,278 (100.0%) |
Real Estate & Mortgages in Graham
Real Estate and Mortgage Overview in Graham
| Characteristic | Without Mortgage | With Mortgage |
| Housing Units | 1,105 | 1,112 |
| Median Property Value | $137,500 | $165,100 |
| Median Household Income | $87,996 | $239 |
| Monthly Housing Costs | $586 | $38 |
| Real Estate Taxes | $2,257 | $11 |
Property Value by Mortgage Status in Graham
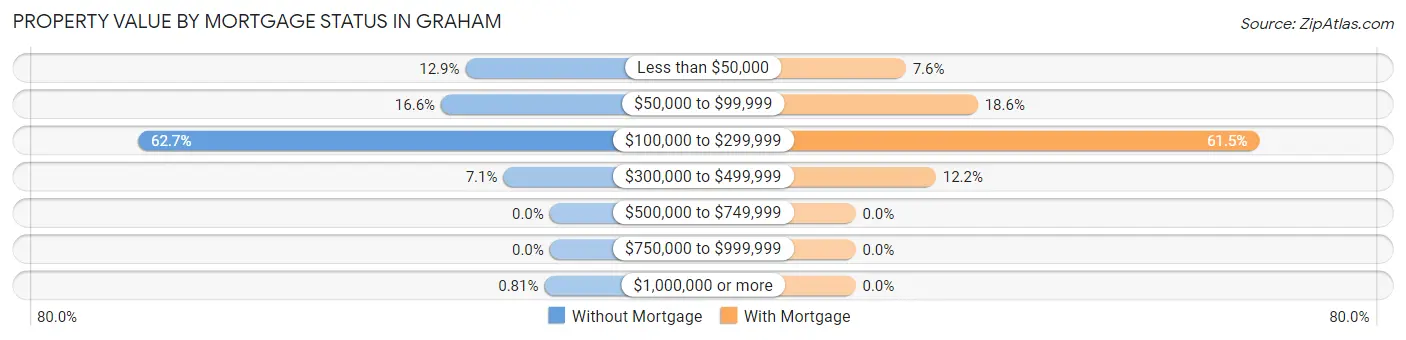
| Property Value | Without Mortgage | With Mortgage |
| Less than $50,000 | 142 (12.9%) | 85 (7.6%) |
| $50,000 to $99,999 | 183 (16.6%) | 207 (18.6%) |
| $100,000 to $299,999 | 693 (62.7%) | 684 (61.5%) |
| $300,000 to $499,999 | 78 (7.1%) | 136 (12.2%) |
| $500,000 to $749,999 | 0 (0.0%) | 0 (0.0%) |
| $750,000 to $999,999 | 0 (0.0%) | 0 (0.0%) |
| $1,000,000 or more | 9 (0.8%) | 0 (0.0%) |
| Total | 1,105 (100.0%) | 1,112 (100.0%) |
Household Income by Mortgage Status in Graham
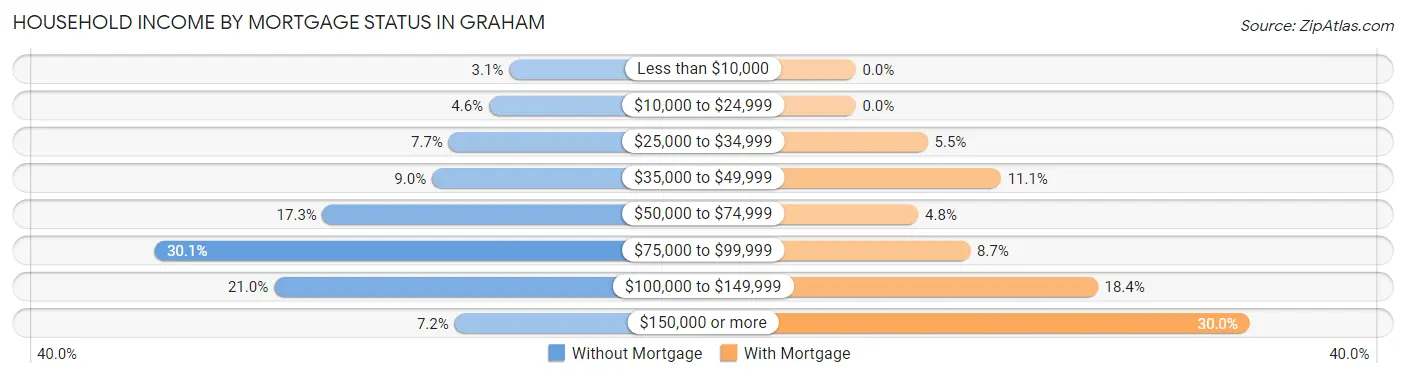
| Household Income | Without Mortgage | With Mortgage |
| Less than $10,000 | 34 (3.1%) | 0 (0.0%) |
| $10,000 to $24,999 | 51 (4.6%) | 0 (0.0%) |
| $25,000 to $34,999 | 85 (7.7%) | 61 (5.5%) |
| $35,000 to $49,999 | 99 (9.0%) | 123 (11.1%) |
| $50,000 to $74,999 | 191 (17.3%) | 53 (4.8%) |
| $75,000 to $99,999 | 333 (30.1%) | 97 (8.7%) |
| $100,000 to $149,999 | 232 (21.0%) | 205 (18.4%) |
| $150,000 or more | 80 (7.2%) | 334 (30.0%) |
| Total | 1,105 (100.0%) | 1,112 (100.0%) |
Property Value to Household Income Ratio in Graham
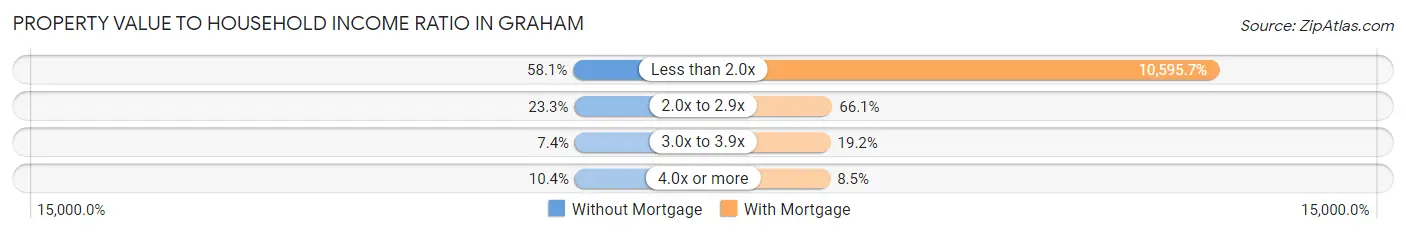
| Value-to-Income Ratio | Without Mortgage | With Mortgage |
| Less than 2.0x | 642 (58.1%) | 117,824 (10,595.7%) |
| 2.0x to 2.9x | 257 (23.3%) | 735 (66.1%) |
| 3.0x to 3.9x | 82 (7.4%) | 214 (19.2%) |
| 4.0x or more | 115 (10.4%) | 95 (8.5%) |
| Total | 1,105 (100.0%) | 1,112 (100.0%) |
Real Estate Taxes by Mortgage Status in Graham
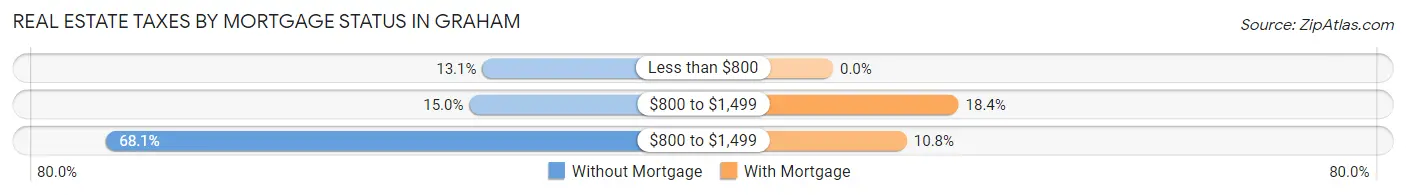
| Property Taxes | Without Mortgage | With Mortgage |
| Less than $800 | 145 (13.1%) | 0 (0.0%) |
| $800 to $1,499 | 166 (15.0%) | 204 (18.3%) |
| $800 to $1,499 | 752 (68.0%) | 120 (10.8%) |
| Total | 1,105 (100.0%) | 1,112 (100.0%) |
Health & Disability in Graham
Health Insurance Coverage by Age in Graham
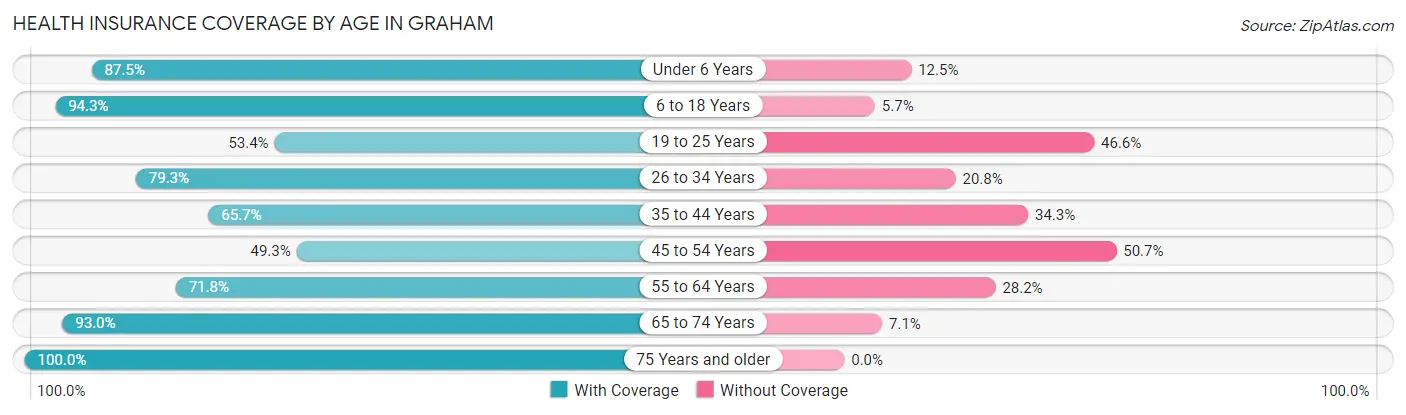
| Age Bracket | With Coverage | Without Coverage |
| Under 6 Years | 673 (87.5%) | 96 (12.5%) |
| 6 to 18 Years | 1,404 (94.3%) | 85 (5.7%) |
| 19 to 25 Years | 454 (53.4%) | 396 (46.6%) |
| 26 to 34 Years | 924 (79.2%) | 242 (20.7%) |
| 35 to 44 Years | 652 (65.7%) | 340 (34.3%) |
| 45 to 54 Years | 443 (49.3%) | 456 (50.7%) |
| 55 to 64 Years | 586 (71.8%) | 230 (28.2%) |
| 65 to 74 Years | 765 (92.9%) | 58 (7.0%) |
| 75 Years and older | 773 (100.0%) | 0 (0.0%) |
| Total | 6,674 (77.8%) | 1,903 (22.2%) |
Health Insurance Coverage by Citizenship Status in Graham
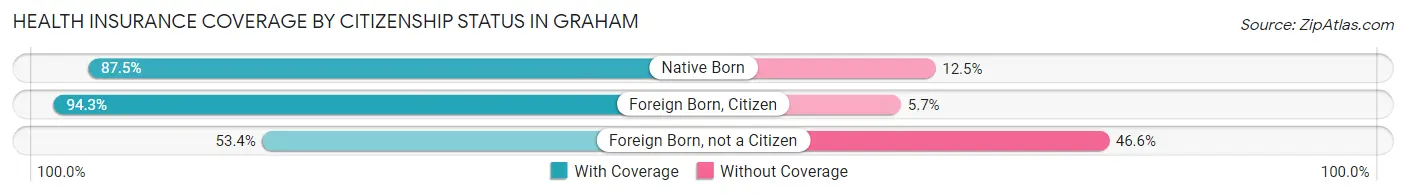
| Citizenship Status | With Coverage | Without Coverage |
| Native Born | 673 (87.5%) | 96 (12.5%) |
| Foreign Born, Citizen | 1,404 (94.3%) | 85 (5.7%) |
| Foreign Born, not a Citizen | 454 (53.4%) | 396 (46.6%) |
Health Insurance Coverage by Household Income in Graham
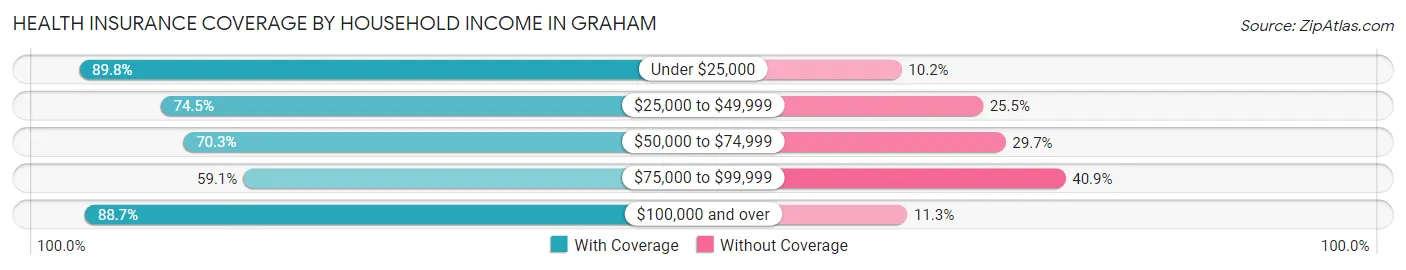
| Household Income | With Coverage | Without Coverage |
| Under $25,000 | 834 (89.8%) | 95 (10.2%) |
| $25,000 to $49,999 | 1,595 (74.5%) | 545 (25.5%) |
| $50,000 to $74,999 | 998 (70.3%) | 422 (29.7%) |
| $75,000 to $99,999 | 756 (59.1%) | 524 (40.9%) |
| $100,000 and over | 2,491 (88.7%) | 317 (11.3%) |
Public vs Private Health Insurance Coverage by Age in Graham
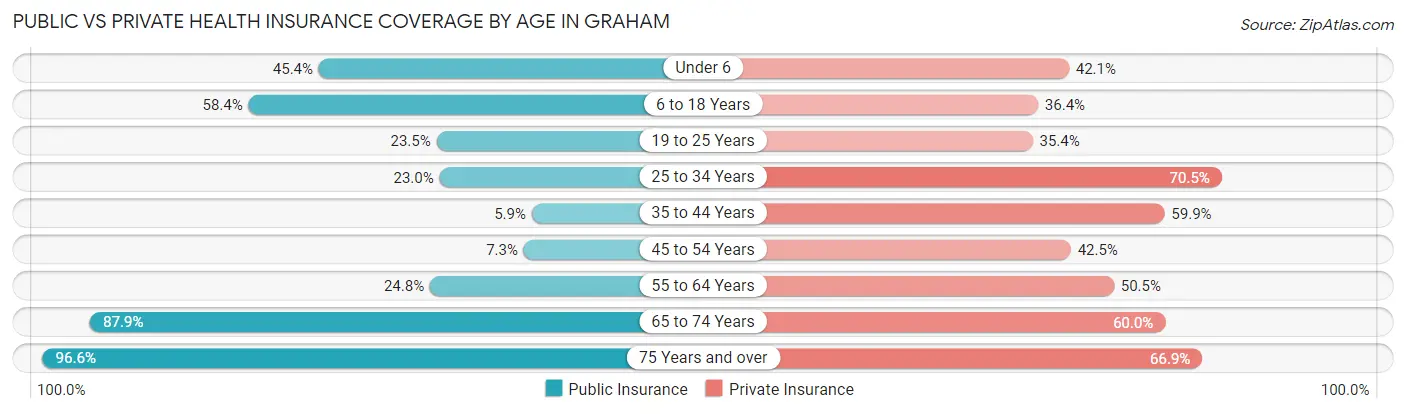
| Age Bracket | Public Insurance | Private Insurance |
| Under 6 | 349 (45.4%) | 324 (42.1%) |
| 6 to 18 Years | 870 (58.4%) | 542 (36.4%) |
| 19 to 25 Years | 200 (23.5%) | 301 (35.4%) |
| 25 to 34 Years | 268 (23.0%) | 822 (70.5%) |
| 35 to 44 Years | 58 (5.9%) | 594 (59.9%) |
| 45 to 54 Years | 66 (7.3%) | 382 (42.5%) |
| 55 to 64 Years | 202 (24.7%) | 412 (50.5%) |
| 65 to 74 Years | 723 (87.8%) | 494 (60.0%) |
| 75 Years and over | 747 (96.6%) | 517 (66.9%) |
| Total | 3,483 (40.6%) | 4,388 (51.2%) |
Disability Status by Sex by Age in Graham
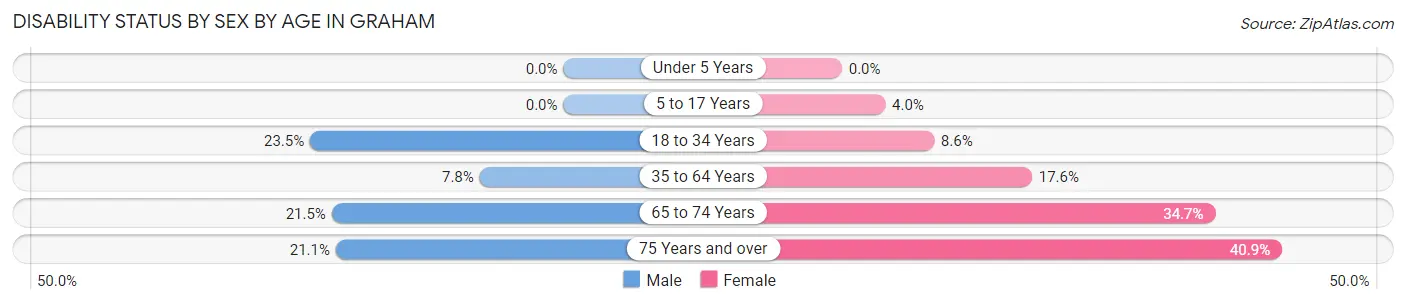
| Age Bracket | Male | Female |
| Under 5 Years | 0 (0.0%) | 0 (0.0%) |
| 5 to 17 Years | 0 (0.0%) | 37 (4.0%) |
| 18 to 34 Years | 245 (23.5%) | 86 (8.6%) |
| 35 to 64 Years | 97 (7.8%) | 257 (17.6%) |
| 65 to 74 Years | 69 (21.5%) | 174 (34.7%) |
| 75 Years and over | 79 (21.1%) | 163 (40.8%) |
Disability Class by Sex by Age in Graham
Disability Class: Hearing Difficulty
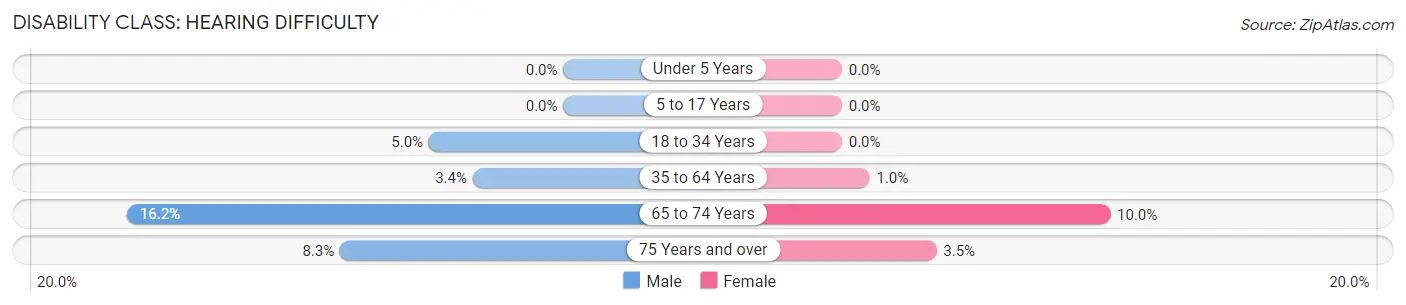
| Age Bracket | Male | Female |
| Under 5 Years | 0 (0.0%) | 0 (0.0%) |
| 5 to 17 Years | 0 (0.0%) | 0 (0.0%) |
| 18 to 34 Years | 52 (5.0%) | 0 (0.0%) |
| 35 to 64 Years | 42 (3.4%) | 15 (1.0%) |
| 65 to 74 Years | 52 (16.2%) | 50 (10.0%) |
| 75 Years and over | 31 (8.3%) | 14 (3.5%) |
Disability Class: Vision Difficulty
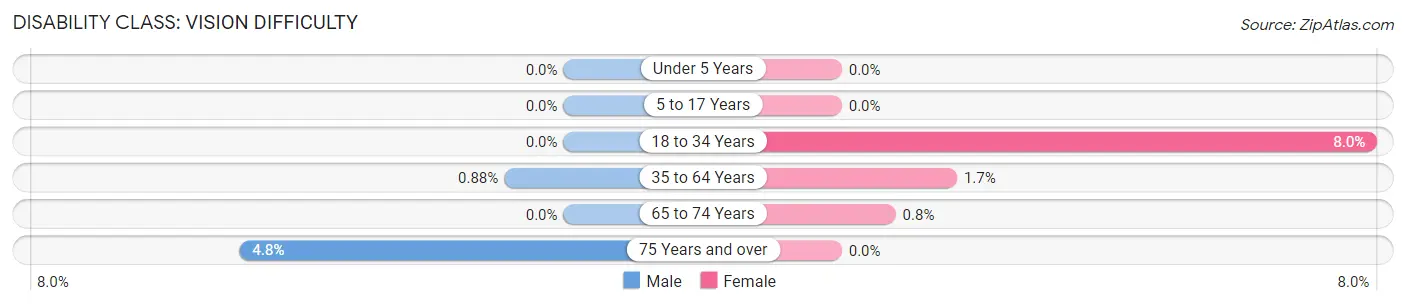
| Age Bracket | Male | Female |
| Under 5 Years | 0 (0.0%) | 0 (0.0%) |
| 5 to 17 Years | 0 (0.0%) | 0 (0.0%) |
| 18 to 34 Years | 0 (0.0%) | 80 (8.0%) |
| 35 to 64 Years | 11 (0.9%) | 25 (1.7%) |
| 65 to 74 Years | 0 (0.0%) | 4 (0.8%) |
| 75 Years and over | 18 (4.8%) | 0 (0.0%) |
Disability Class: Cognitive Difficulty
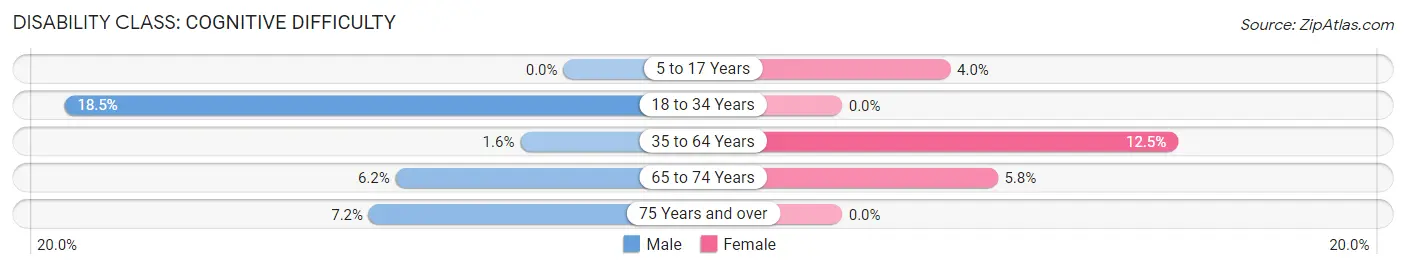
| Age Bracket | Male | Female |
| 5 to 17 Years | 0 (0.0%) | 37 (4.0%) |
| 18 to 34 Years | 193 (18.5%) | 0 (0.0%) |
| 35 to 64 Years | 20 (1.6%) | 182 (12.5%) |
| 65 to 74 Years | 20 (6.2%) | 29 (5.8%) |
| 75 Years and over | 27 (7.2%) | 0 (0.0%) |
Disability Class: Ambulatory Difficulty
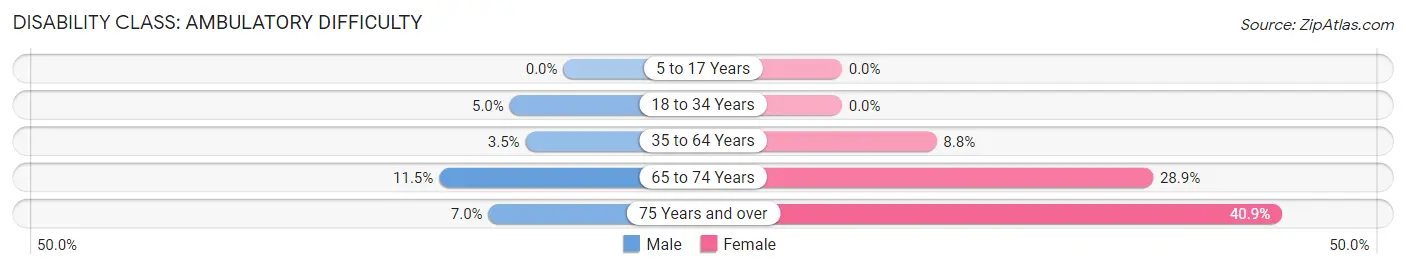
| Age Bracket | Male | Female |
| 5 to 17 Years | 0 (0.0%) | 0 (0.0%) |
| 18 to 34 Years | 52 (5.0%) | 0 (0.0%) |
| 35 to 64 Years | 44 (3.5%) | 128 (8.8%) |
| 65 to 74 Years | 37 (11.5%) | 145 (28.9%) |
| 75 Years and over | 26 (7.0%) | 163 (40.8%) |
Disability Class: Self-Care Difficulty
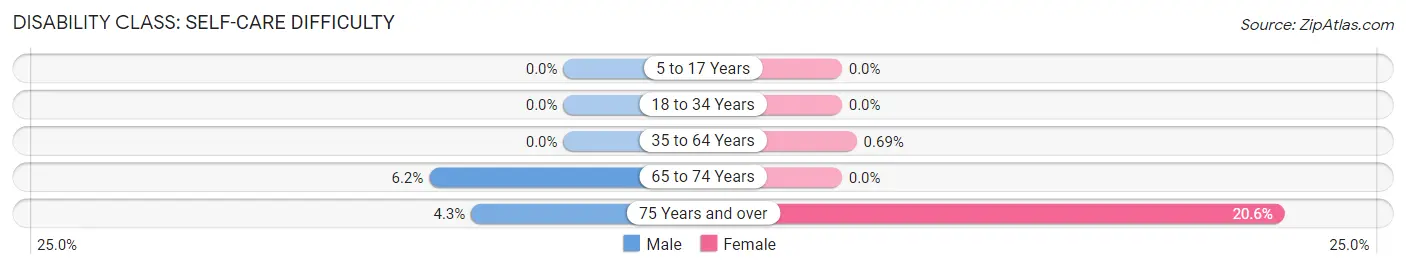
| Age Bracket | Male | Female |
| 5 to 17 Years | 0 (0.0%) | 0 (0.0%) |
| 18 to 34 Years | 0 (0.0%) | 0 (0.0%) |
| 35 to 64 Years | 0 (0.0%) | 10 (0.7%) |
| 65 to 74 Years | 20 (6.2%) | 0 (0.0%) |
| 75 Years and over | 16 (4.3%) | 82 (20.5%) |
Technology Access in Graham
Computing Device Access in Graham
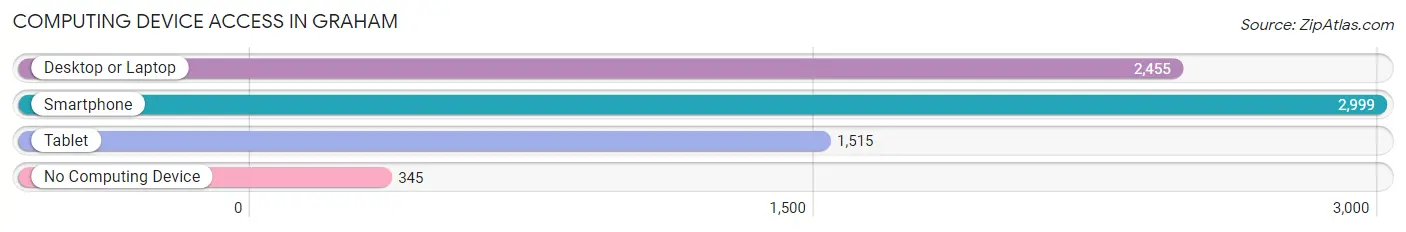
| Device Type | # Households | % Households |
| Desktop or Laptop | 2,455 | 70.2% |
| Smartphone | 2,999 | 85.8% |
| Tablet | 1,515 | 43.3% |
| No Computing Device | 345 | 9.9% |
| Total | 3,495 | 100.0% |
Internet Access in Graham
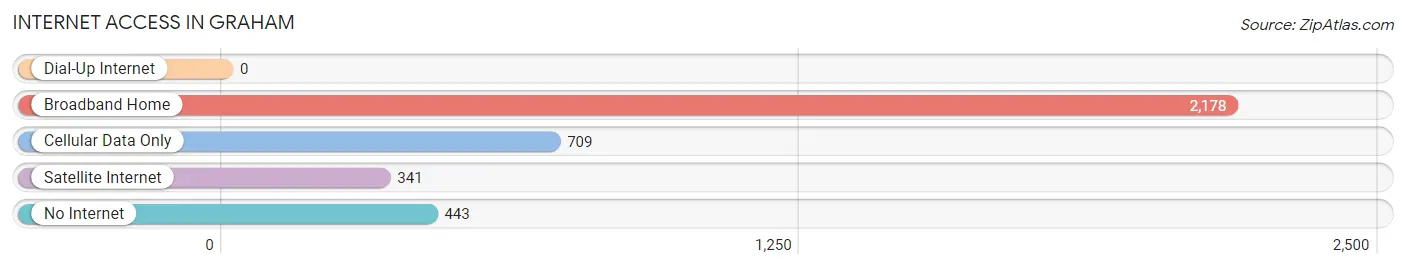
| Internet Type | # Households | % Households |
| Dial-Up Internet | 0 | 0.0% |
| Broadband Home | 2,178 | 62.3% |
| Cellular Data Only | 709 | 20.3% |
| Satellite Internet | 341 | 9.8% |
| No Internet | 443 | 12.7% |
| Total | 3,495 | 100.0% |
Graham Summary
Graham, Texas is a city located in Young County, Texas, United States. It is the county seat of Young County and is located in the western part of the state. The population of Graham was 8,717 at the 2010 census.
History
The area that is now Graham was first settled in 1873 by a group of settlers from Missouri. The town was named after a local rancher, William A. Graham. The town was officially incorporated in 1876.
In the late 19th century, Graham was a major stop on the Texas and Pacific Railway. The railroad brought many new settlers to the area, and the town grew rapidly. By the early 20th century, Graham had become a major center for the cattle industry.
Geography
Graham is located in the western part of Young County, Texas, at the intersection of U.S. Route 380 and State Highway 16. It is about 90 miles west of Fort Worth and about 100 miles northwest of Dallas.
The city has a total area of 8.3 square miles, all of which is land. The elevation of Graham is 1,068 feet above sea level.
Economy
The economy of Graham is largely based on agriculture and ranching. The city is home to several large ranches, including the Graham Land and Cattle Company, which is one of the largest ranches in the state.
The city is also home to several manufacturing companies, including Graham Manufacturing, which produces agricultural equipment, and Graham Plastics, which produces plastic products.
Demographics
As of the 2010 census, there were 8,717 people, 3,093 households, and 2,092 families residing in the city. The population density was 1,051.2 people per square mile. The racial makeup of the city was 81.2% White, 11.3% African American, 0.7% Native American, 0.4% Asian, 0.1% Pacific Islander, 4.7% from other races, and 1.6% from two or more races. Hispanic or Latino of any race were 11.7% of the population.
The median income for a household in the city was $35,938, and the median income for a family was $41,944. The per capita income for the city was $17,845. About 16.2% of families and 19.2% of the population were below the poverty line, including 25.2% of those under age 18 and 13.2% of those age 65 or over.
Common Questions
What is Per Capita Income in Graham?
Per Capita income in Graham is $32,949.
What is the Median Family Income in Graham?
Median Family Income in Graham is $85,214.
What is the Median Household income in Graham?
Median Household Income in Graham is $63,361.
What is Income or Wage Gap in Graham?
Income or Wage Gap in Graham is 38.7%.
Women in Graham earn 61.3 cents for every dollar earned by a man.
What is Inequality or Gini Index in Graham?
Inequality or Gini Index in Graham is 0.40.
What is the Total Population of Graham?
Total Population of Graham is 8,726.
What is the Total Male Population of Graham?
Total Male Population of Graham is 4,062.
What is the Total Female Population of Graham?
Total Female Population of Graham is 4,664.
What is the Ratio of Males per 100 Females in Graham?
There are 87.09 Males per 100 Females in Graham.
What is the Ratio of Females per 100 Males in Graham?
There are 114.82 Females per 100 Males in Graham.
What is the Median Population Age in Graham?
Median Population Age in Graham is 36.7 Years.
What is the Average Family Size in Graham
Average Family Size in Graham is 2.9 People.
What is the Average Household Size in Graham
Average Household Size in Graham is 2.5 People.
How Large is the Labor Force in Graham?
There are 4,330 People in the Labor Forcein in Graham.
What is the Percentage of People in the Labor Force in Graham?
64.5% of People are in the Labor Force in Graham.
What is the Unemployment Rate in Graham?
Unemployment Rate in Graham is 1.5%.