Ganado, TX Map & Demographics
Ganado Map
Ganado Overview
$26,852
PER CAPITA INCOME
$62,333
AVG FAMILY INCOME
$55,938
AVG HOUSEHOLD INCOME
0.8%
WAGE / INCOME GAP [ % ]
99.2¢/ $1
WAGE / INCOME GAP [ $ ]
0.39
INEQUALITY / GINI INDEX
2,318
TOTAL POPULATION
1,170
MALE POPULATION
1,148
FEMALE POPULATION
101.92
MALES / 100 FEMALES
98.12
FEMALES / 100 MALES
30.3
MEDIAN AGE
3.5
AVG FAMILY SIZE
2.8
AVG HOUSEHOLD SIZE
1,072
LABOR FORCE [ PEOPLE ]
62.3%
PERCENT IN LABOR FORCE
Ganado Zip Codes
Ganado Area Codes
Income in Ganado
Income Overview in Ganado
Per Capita Income in Ganado is $26,852, while median incomes of families and households are $62,333 and $55,938 respectively.
| Characteristic | Number | Measure |
| Per Capita Income | 2,318 | $26,852 |
| Median Family Income | 566 | $62,333 |
| Mean Family Income | 566 | $80,653 |
| Median Household Income | 809 | $55,938 |
| Mean Household Income | 809 | $74,856 |
| Income Deficit | 566 | $0 |
| Wage / Income Gap (%) | 2,318 | 0.80% |
| Wage / Income Gap ($) | 2,318 | 99.20¢ per $1 |
| Gini / Inequality Index | 2,318 | 0.39 |
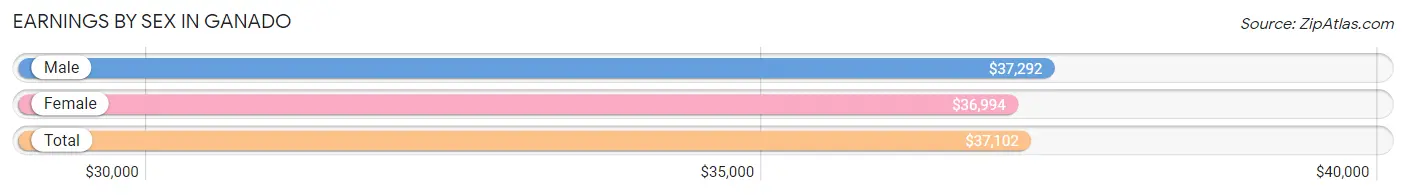
Earnings by Sex in Ganado
Average Earnings in Ganado are $37,102, $37,292 for men and $36,994 for women, a difference of 0.8%.
| Sex | Number | Average Earnings |
| Male | 814 (72.9%) | $37,292 |
| Female | 303 (27.1%) | $36,994 |
| Total | 1,117 (100.0%) | $37,102 |
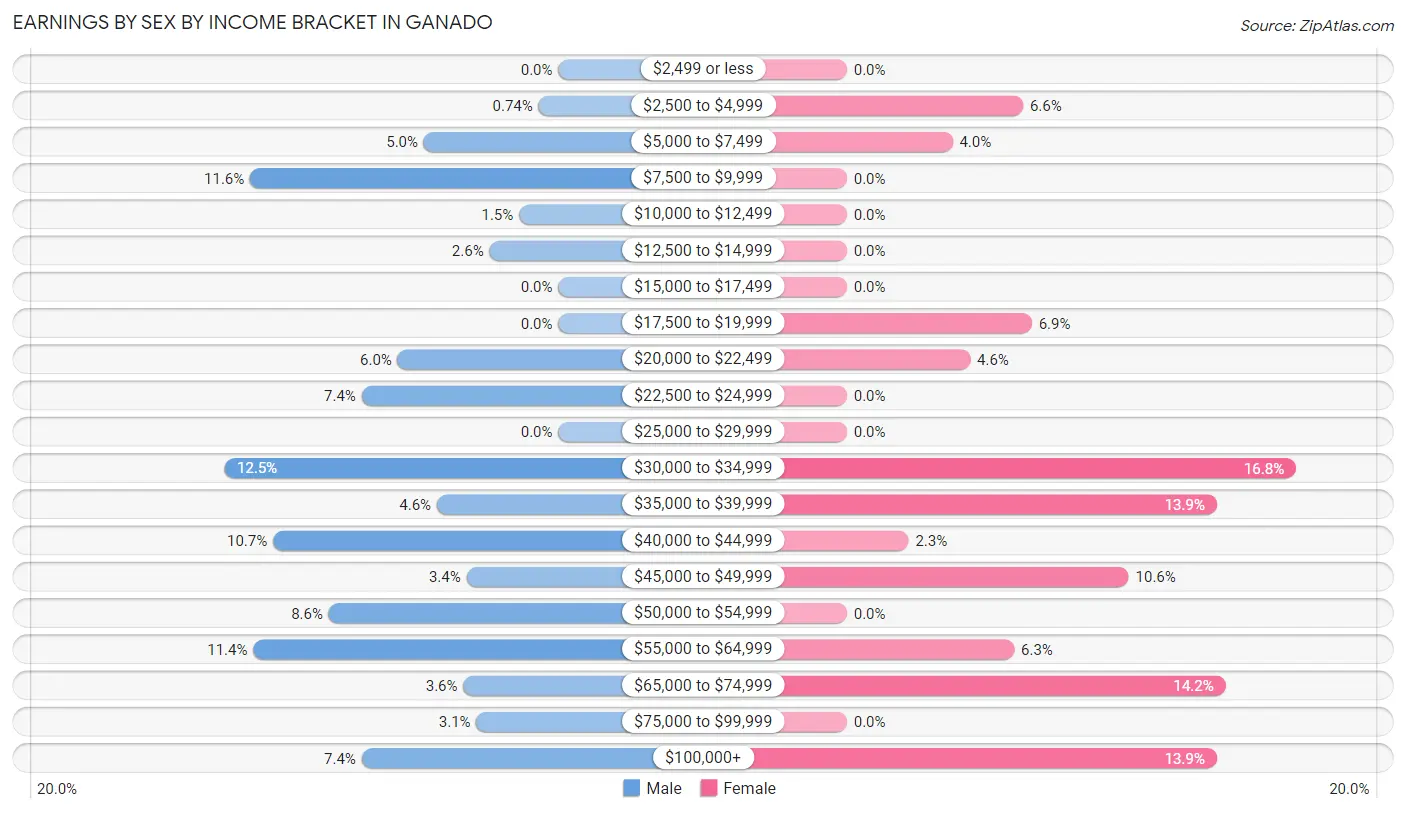
Earnings by Sex by Income Bracket in Ganado
The most common earnings brackets in Ganado are $30,000 to $34,999 for men (102 | 12.5%) and $30,000 to $34,999 for women (51 | 16.8%).
| Income | Male | Female |
| $2,499 or less | 0 (0.0%) | 0 (0.0%) |
| $2,500 to $4,999 | 6 (0.7%) | 20 (6.6%) |
| $5,000 to $7,499 | 41 (5.0%) | 12 (4.0%) |
| $7,500 to $9,999 | 94 (11.6%) | 0 (0.0%) |
| $10,000 to $12,499 | 12 (1.5%) | 0 (0.0%) |
| $12,500 to $14,999 | 21 (2.6%) | 0 (0.0%) |
| $15,000 to $17,499 | 0 (0.0%) | 0 (0.0%) |
| $17,500 to $19,999 | 0 (0.0%) | 21 (6.9%) |
| $20,000 to $22,499 | 49 (6.0%) | 14 (4.6%) |
| $22,500 to $24,999 | 60 (7.4%) | 0 (0.0%) |
| $25,000 to $29,999 | 0 (0.0%) | 0 (0.0%) |
| $30,000 to $34,999 | 102 (12.5%) | 51 (16.8%) |
| $35,000 to $39,999 | 37 (4.5%) | 42 (13.9%) |
| $40,000 to $44,999 | 87 (10.7%) | 7 (2.3%) |
| $45,000 to $49,999 | 28 (3.4%) | 32 (10.6%) |
| $50,000 to $54,999 | 70 (8.6%) | 0 (0.0%) |
| $55,000 to $64,999 | 93 (11.4%) | 19 (6.3%) |
| $65,000 to $74,999 | 29 (3.6%) | 43 (14.2%) |
| $75,000 to $99,999 | 25 (3.1%) | 0 (0.0%) |
| $100,000+ | 60 (7.4%) | 42 (13.9%) |
| Total | 814 (100.0%) | 303 (100.0%) |
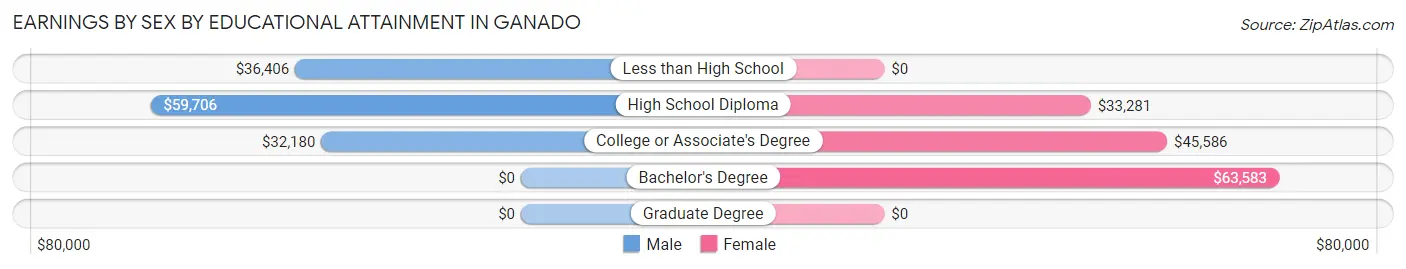
Earnings by Sex by Educational Attainment in Ganado
Average earnings in Ganado are $42,763 for men and $40,536 for women, a difference of 5.2%. Men with an educational attainment of high school diploma enjoy the highest average annual earnings of $59,706, while those with college or associate's degree education earn the least with $32,180. Women with an educational attainment of bachelor's degree earn the most with the average annual earnings of $63,583, while those with high school diploma education have the smallest earnings of $33,281.
| Educational Attainment | Male Income | Female Income |
| Less than High School | $36,406 | $0 |
| High School Diploma | $59,706 | $33,281 |
| College or Associate's Degree | $32,180 | $45,586 |
| Bachelor's Degree | - | - |
| Graduate Degree | - | - |
| Total | $42,763 | $40,536 |
Family Income in Ganado
Family Income Brackets in Ganado
According to the Ganado family income data, there are 130 families falling into the $75,000 to $99,999 income range, which is the most common income bracket and makes up 23.0% of all families. Conversely, the less than $10,000 income bracket is the least frequent group with only 2 families (0.4%) belonging to this category.
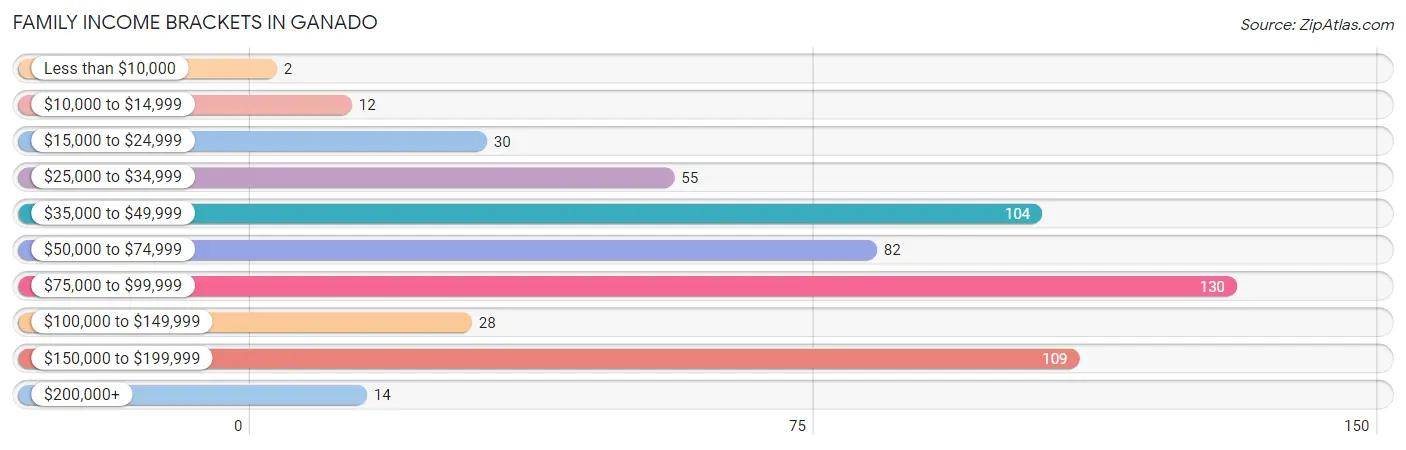
| Income Bracket | # Families | % Families |
| Less than $10,000 | 2 | 0.4% |
| $10,000 to $14,999 | 12 | 2.1% |
| $15,000 to $24,999 | 30 | 5.3% |
| $25,000 to $34,999 | 55 | 9.7% |
| $35,000 to $49,999 | 104 | 18.4% |
| $50,000 to $74,999 | 82 | 14.5% |
| $75,000 to $99,999 | 130 | 23.0% |
| $100,000 to $149,999 | 28 | 4.9% |
| $150,000 to $199,999 | 109 | 19.3% |
| $200,000+ | 14 | 2.5% |
Family Income by Famaliy Size in Ganado
2-person families (222 | 39.2%) account for the highest median family income in Ganado with $79,833 per family, while 2-person families (222 | 39.2%) have the highest median income of $39,916 per family member.
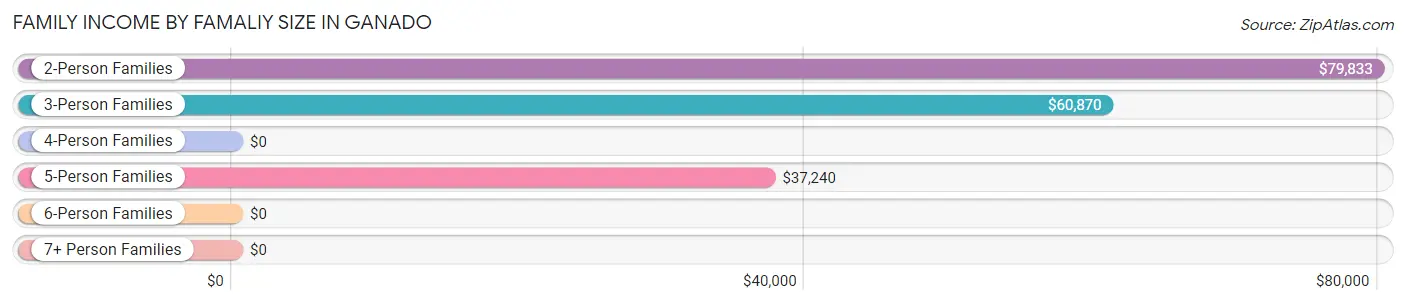
| Income Bracket | # Families | Median Income |
| 2-Person Families | 222 (39.2%) | $79,833 |
| 3-Person Families | 96 (17.0%) | $60,870 |
| 4-Person Families | 118 (20.8%) | $0 |
| 5-Person Families | 65 (11.5%) | $37,240 |
| 6-Person Families | 43 (7.6%) | $0 |
| 7+ Person Families | 22 (3.9%) | $0 |
| Total | 566 (100.0%) | $62,333 |
Family Income by Number of Earners in Ganado
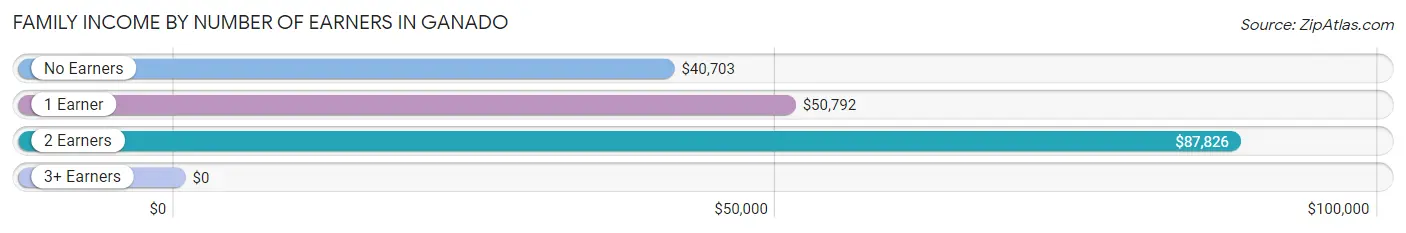
| Number of Earners | # Families | Median Income |
| No Earners | 89 (15.7%) | $40,703 |
| 1 Earner | 223 (39.4%) | $50,792 |
| 2 Earners | 178 (31.5%) | $87,826 |
| 3+ Earners | 76 (13.4%) | $0 |
| Total | 566 (100.0%) | $62,333 |
Household Income in Ganado
Household Income Brackets in Ganado
With 160 households falling in the category, the $50,000 to $74,999 income range is the most frequent in Ganado, accounting for 19.8% of all households. In contrast, only 2 households (0.3%) fall into the less than $10,000 income bracket, making it the least populous group.
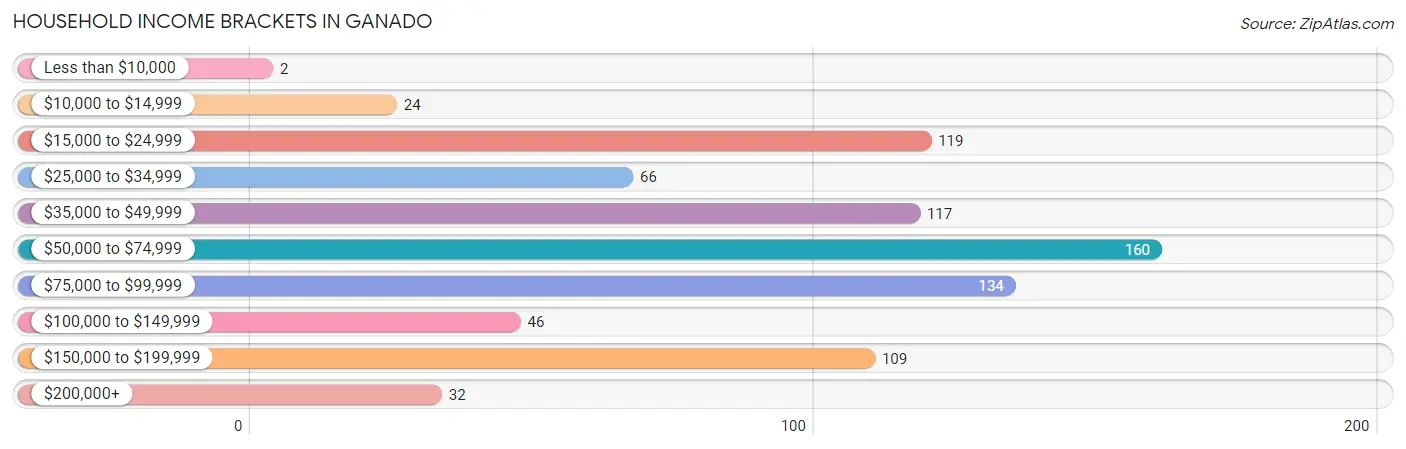
| Income Bracket | # Households | % Households |
| Less than $10,000 | 2 | 0.2% |
| $10,000 to $14,999 | 24 | 3.0% |
| $15,000 to $24,999 | 119 | 14.7% |
| $25,000 to $34,999 | 66 | 8.2% |
| $35,000 to $49,999 | 117 | 14.5% |
| $50,000 to $74,999 | 160 | 19.8% |
| $75,000 to $99,999 | 134 | 16.6% |
| $100,000 to $149,999 | 46 | 5.7% |
| $150,000 to $199,999 | 109 | 13.5% |
| $200,000+ | 32 | 4.0% |
Household Income by Householder Age in Ganado
The median household income in Ganado is $55,938, with the highest median household income of $58,309 found in the 25 to 44 years age bracket for the primary householder. A total of 407 households (50.3%) fall into this category. Meanwhile, the 15 to 24 years age bracket for the primary householder has the lowest median household income of $0, with 68 households (8.4%) in this group.
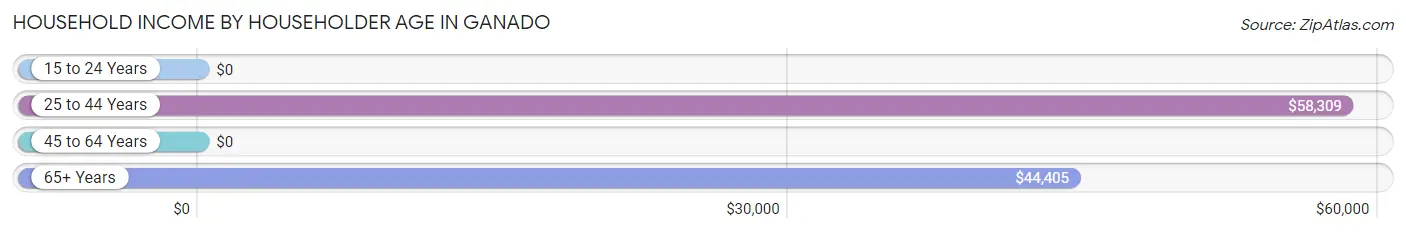
| Income Bracket | # Households | Median Income |
| 15 to 24 Years | 68 (8.4%) | $0 |
| 25 to 44 Years | 407 (50.3%) | $58,309 |
| 45 to 64 Years | 198 (24.5%) | $0 |
| 65+ Years | 136 (16.8%) | $44,405 |
| Total | 809 (100.0%) | $55,938 |
Poverty in Ganado
Income Below Poverty by Sex and Age in Ganado
With 7.4% poverty level for males and 15.6% for females among the residents of Ganado, 12 to 14 year old males and 16 and 17 year old females are the most vulnerable to poverty, with 14 males (77.8%) and 23 females (41.1%) in their respective age groups living below the poverty level.
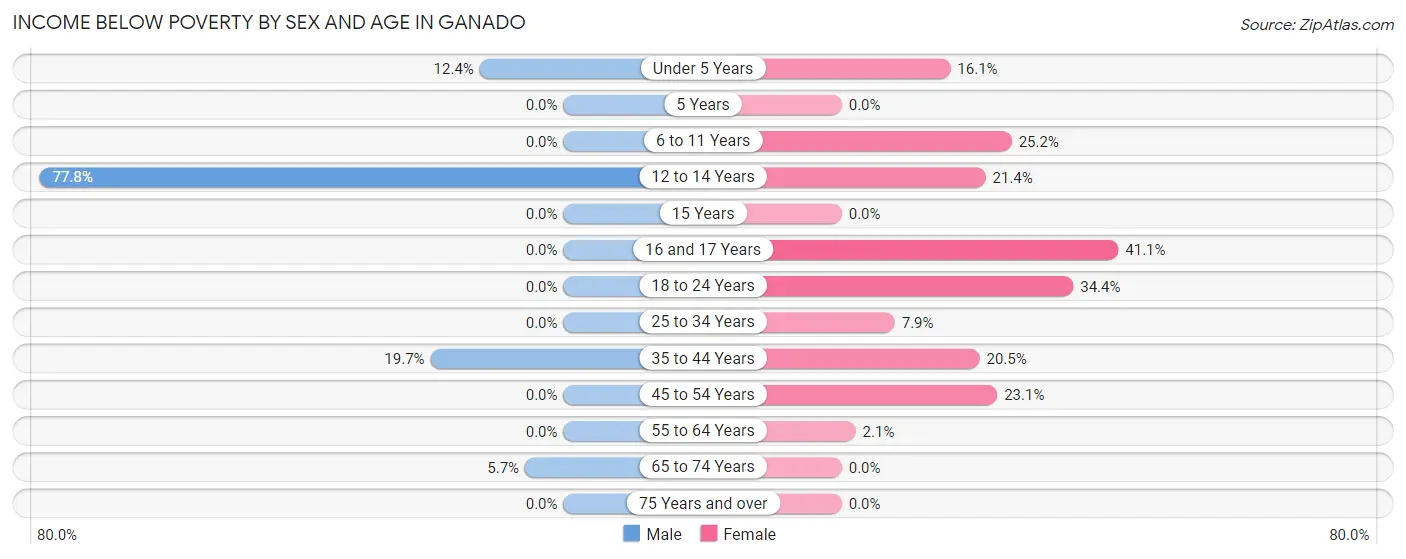
| Age Bracket | Male | Female |
| Under 5 Years | 22 (12.4%) | 15 (16.1%) |
| 5 Years | 0 (0.0%) | 0 (0.0%) |
| 6 to 11 Years | 0 (0.0%) | 27 (25.2%) |
| 12 to 14 Years | 14 (77.8%) | 22 (21.4%) |
| 15 Years | 0 (0.0%) | 0 (0.0%) |
| 16 and 17 Years | 0 (0.0%) | 23 (41.1%) |
| 18 to 24 Years | 0 (0.0%) | 33 (34.4%) |
| 25 to 34 Years | 0 (0.0%) | 14 (7.9%) |
| 35 to 44 Years | 46 (19.7%) | 27 (20.4%) |
| 45 to 54 Years | 0 (0.0%) | 12 (23.1%) |
| 55 to 64 Years | 0 (0.0%) | 2 (2.1%) |
| 65 to 74 Years | 2 (5.7%) | 0 (0.0%) |
| 75 Years and over | 0 (0.0%) | 0 (0.0%) |
| Total | 84 (7.4%) | 175 (15.6%) |
Income Above Poverty by Sex and Age in Ganado
According to the poverty statistics in Ganado, males aged 6 to 11 years and females aged 5 years are the age groups that are most secure financially, with 100.0% of males and 100.0% of females in these age groups living above the poverty line.
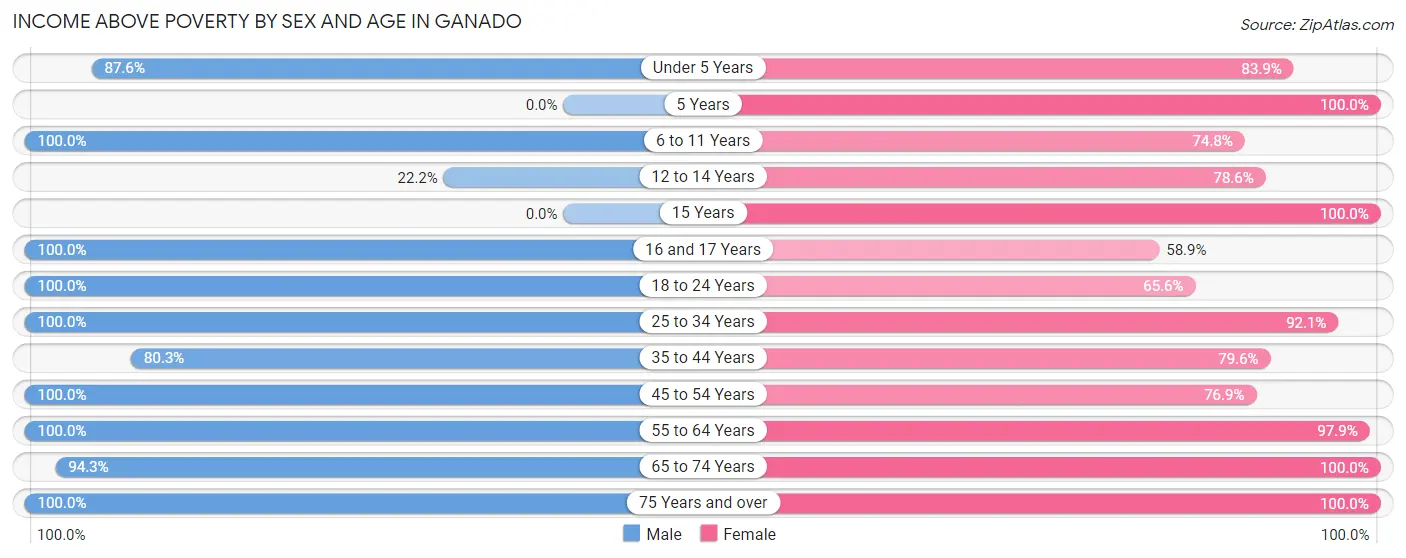
| Age Bracket | Male | Female |
| Under 5 Years | 155 (87.6%) | 78 (83.9%) |
| 5 Years | 0 (0.0%) | 25 (100.0%) |
| 6 to 11 Years | 28 (100.0%) | 80 (74.8%) |
| 12 to 14 Years | 4 (22.2%) | 81 (78.6%) |
| 15 Years | 0 (0.0%) | 47 (100.0%) |
| 16 and 17 Years | 6 (100.0%) | 33 (58.9%) |
| 18 to 24 Years | 168 (100.0%) | 63 (65.6%) |
| 25 to 34 Years | 236 (100.0%) | 164 (92.1%) |
| 35 to 44 Years | 187 (80.3%) | 105 (79.5%) |
| 45 to 54 Years | 112 (100.0%) | 40 (76.9%) |
| 55 to 64 Years | 107 (100.0%) | 95 (97.9%) |
| 65 to 74 Years | 33 (94.3%) | 40 (100.0%) |
| 75 Years and over | 19 (100.0%) | 99 (100.0%) |
| Total | 1,055 (92.6%) | 950 (84.4%) |
Income Below Poverty Among Married-Couple Families in Ganado
The poverty statistics for married-couple families in Ganado show that 6.8% or 25 of the total 369 families live below the poverty line. Families with 1 or 2 children have the highest poverty rate of 19.5%, comprising of 23 families. On the other hand, families with 3 or 4 children have the lowest poverty rate of 0.0%, which includes 0 families.
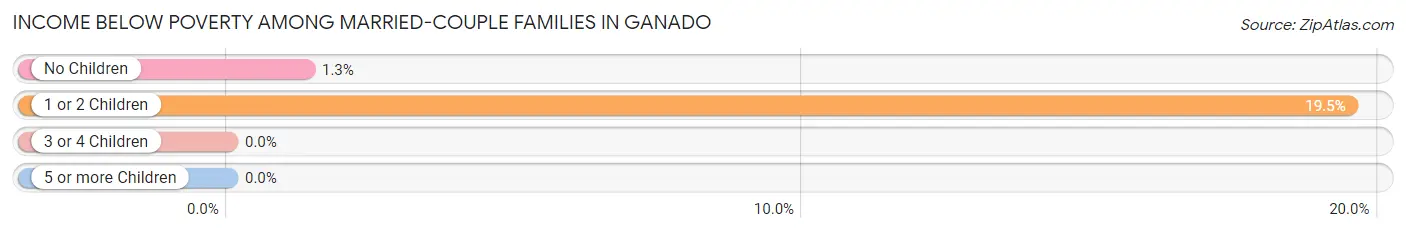
| Children | Above Poverty | Below Poverty |
| No Children | 147 (98.7%) | 2 (1.3%) |
| 1 or 2 Children | 95 (80.5%) | 23 (19.5%) |
| 3 or 4 Children | 102 (100.0%) | 0 (0.0%) |
| 5 or more Children | 0 (0.0%) | 0 (0.0%) |
| Total | 344 (93.2%) | 25 (6.8%) |
Income Below Poverty Among Single-Parent Households in Ganado
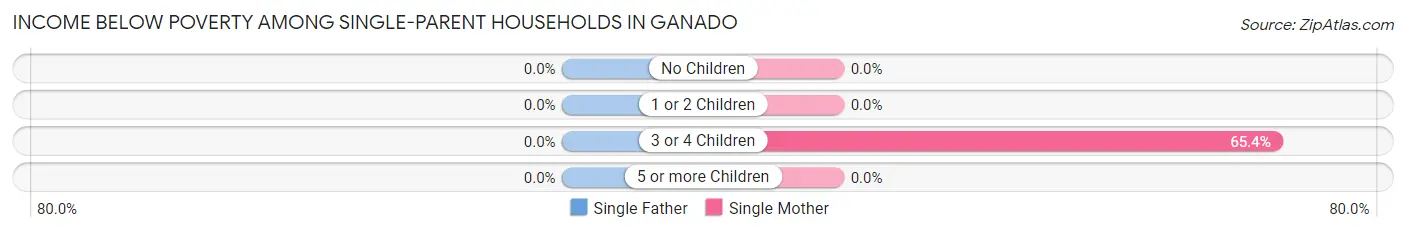
| Children | Single Father | Single Mother |
| No Children | 0 (0.0%) | 0 (0.0%) |
| 1 or 2 Children | 0 (0.0%) | 0 (0.0%) |
| 3 or 4 Children | 0 (0.0%) | 17 (65.4%) |
| 5 or more Children | 0 (0.0%) | 0 (0.0%) |
| Total | 0 (0.0%) | 17 (12.6%) |
Income Below Poverty Among Married-Couple vs Single-Parent Households in Ganado
The poverty data for Ganado shows that 25 of the married-couple family households (6.8%) and 17 of the single-parent households (8.6%) are living below the poverty level. Within the married-couple family households, those with 1 or 2 children have the highest poverty rate, with 23 households (19.5%) falling below the poverty line. Among the single-parent households, those with 3 or 4 children have the highest poverty rate, with 17 household (65.4%) living below poverty.
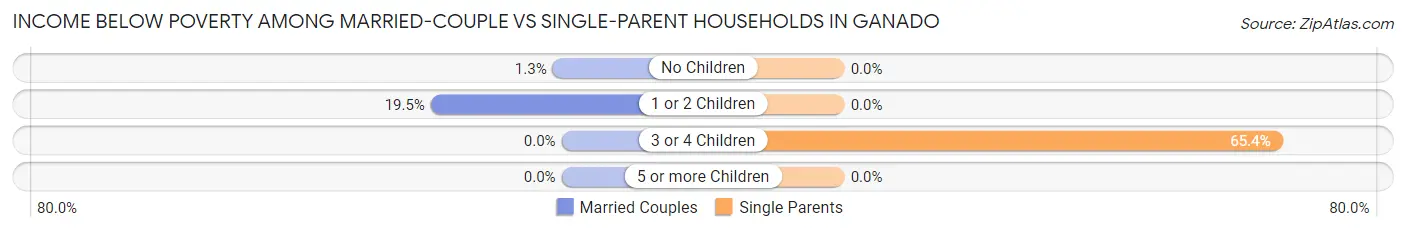
| Children | Married-Couple Families | Single-Parent Households |
| No Children | 2 (1.3%) | 0 (0.0%) |
| 1 or 2 Children | 23 (19.5%) | 0 (0.0%) |
| 3 or 4 Children | 0 (0.0%) | 17 (65.4%) |
| 5 or more Children | 0 (0.0%) | 0 (0.0%) |
| Total | 25 (6.8%) | 17 (8.6%) |
Race in Ganado
The most populous races in Ganado are Hispanic or Latino (1,462 | 63.1%), White / Caucasian (1,454 | 62.7%), and Two or more Races (415 | 17.9%).
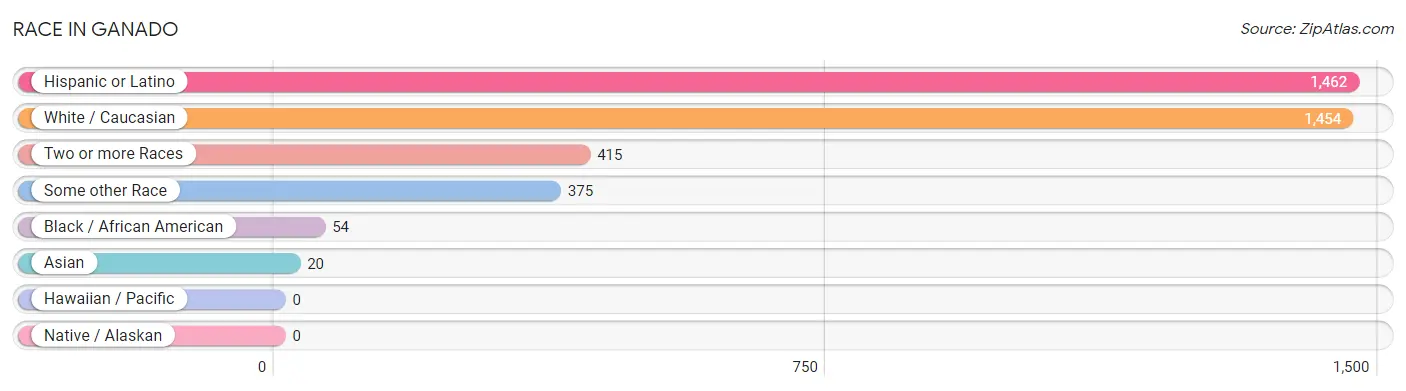
| Race | # Population | % Population |
| Asian | 20 | 0.9% |
| Black / African American | 54 | 2.3% |
| Hawaiian / Pacific | 0 | 0.0% |
| Hispanic or Latino | 1,462 | 63.1% |
| Native / Alaskan | 0 | 0.0% |
| White / Caucasian | 1,454 | 62.7% |
| Two or more Races | 415 | 17.9% |
| Some other Race | 375 | 16.2% |
| Total | 2,318 | 100.0% |
Ancestry in Ganado
The most populous ancestries reported in Ganado are Mexican (1,423 | 61.4%), Czech (269 | 11.6%), German (139 | 6.0%), Irish (95 | 4.1%), and English (64 | 2.8%), together accounting for 85.9% of all Ganado residents.
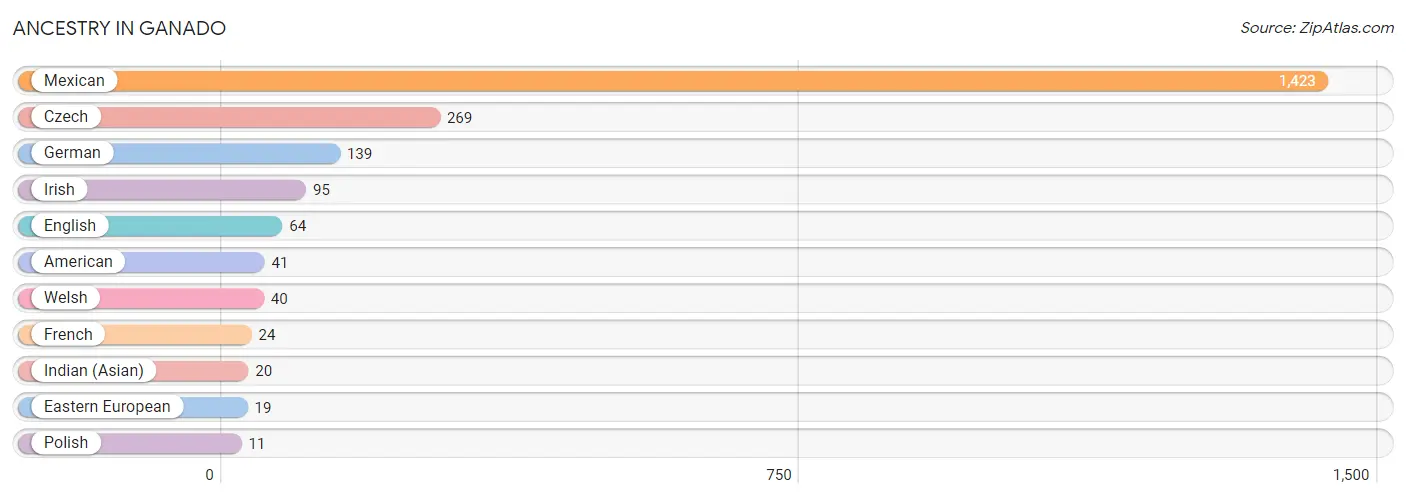
| Ancestry | # Population | % Population |
| American | 41 | 1.8% |
| Czech | 269 | 11.6% |
| Eastern European | 19 | 0.8% |
| English | 64 | 2.8% |
| French | 24 | 1.0% |
| German | 139 | 6.0% |
| Indian (Asian) | 20 | 0.9% |
| Irish | 95 | 4.1% |
| Mexican | 1,423 | 61.4% |
| Polish | 11 | 0.5% |
| Welsh | 40 | 1.7% | View All 11 Rows |
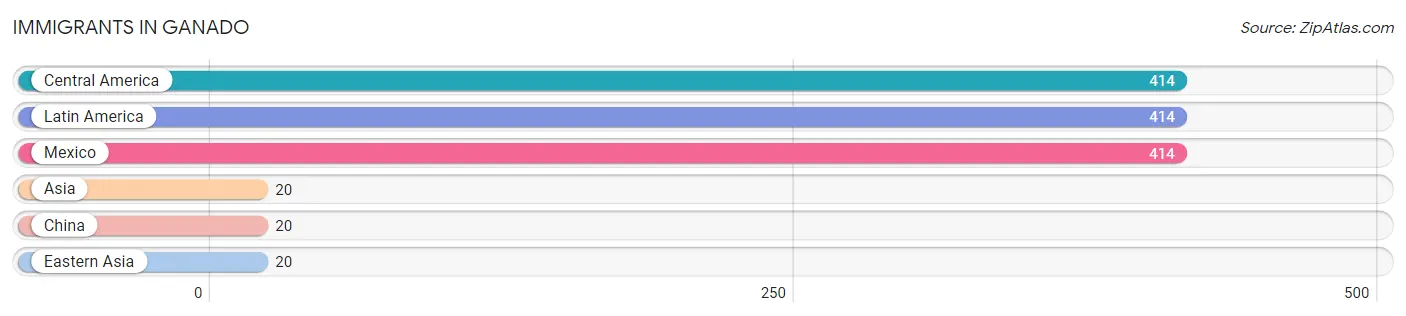
Immigrants in Ganado
The most numerous immigrant groups reported in Ganado came from Central America (414 | 17.9%), Latin America (414 | 17.9%), Mexico (414 | 17.9%), Asia (20 | 0.9%), and China (20 | 0.9%), together accounting for 55.3% of all Ganado residents.
| Immigration Origin | # Population | % Population |
| Asia | 20 | 0.9% |
| Central America | 414 | 17.9% |
| China | 20 | 0.9% |
| Eastern Asia | 20 | 0.9% |
| Latin America | 414 | 17.9% |
| Mexico | 414 | 17.9% | View All 6 Rows |
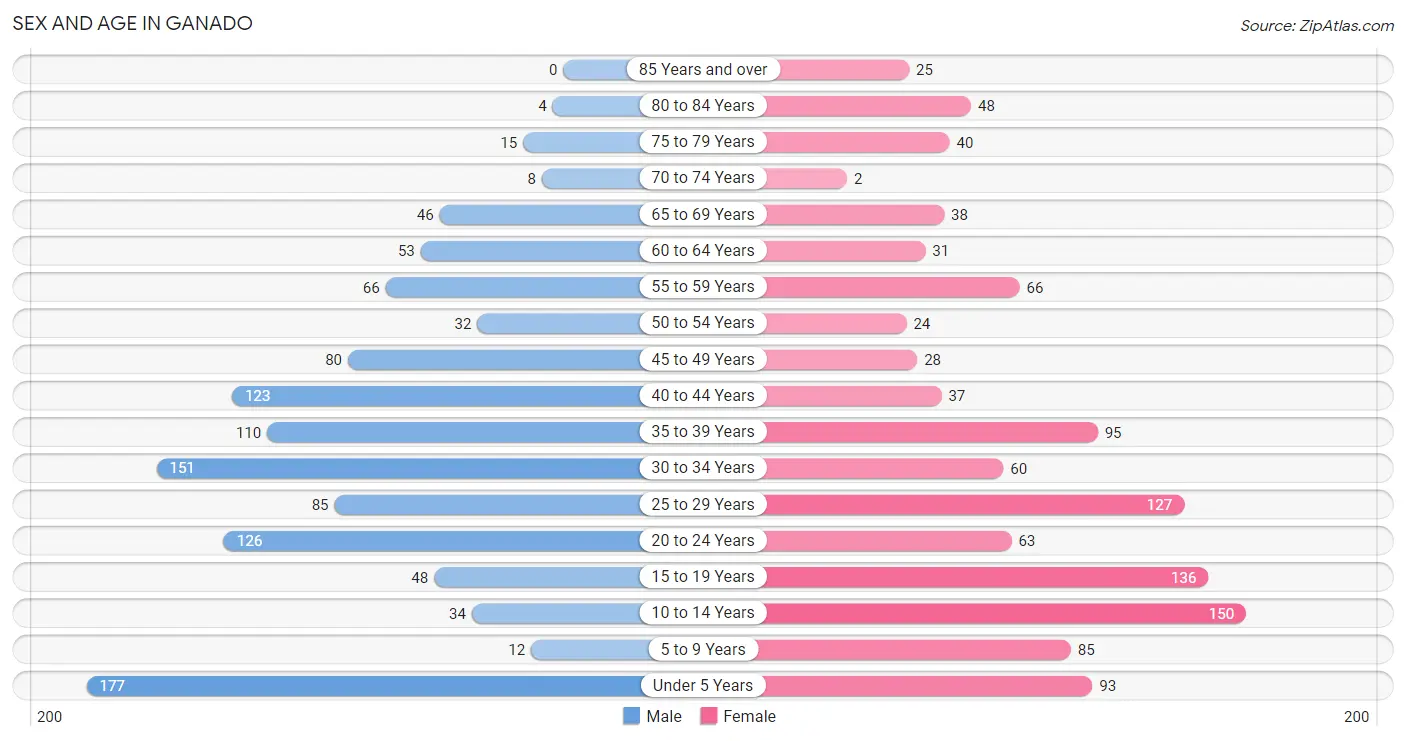
Sex and Age in Ganado
Sex and Age in Ganado
The most populous age groups in Ganado are Under 5 Years (177 | 15.1%) for men and 10 to 14 Years (150 | 13.1%) for women.
| Age Bracket | Male | Female |
| Under 5 Years | 177 (15.1%) | 93 (8.1%) |
| 5 to 9 Years | 12 (1.0%) | 85 (7.4%) |
| 10 to 14 Years | 34 (2.9%) | 150 (13.1%) |
| 15 to 19 Years | 48 (4.1%) | 136 (11.8%) |
| 20 to 24 Years | 126 (10.8%) | 63 (5.5%) |
| 25 to 29 Years | 85 (7.3%) | 127 (11.1%) |
| 30 to 34 Years | 151 (12.9%) | 60 (5.2%) |
| 35 to 39 Years | 110 (9.4%) | 95 (8.3%) |
| 40 to 44 Years | 123 (10.5%) | 37 (3.2%) |
| 45 to 49 Years | 80 (6.8%) | 28 (2.4%) |
| 50 to 54 Years | 32 (2.7%) | 24 (2.1%) |
| 55 to 59 Years | 66 (5.6%) | 66 (5.8%) |
| 60 to 64 Years | 53 (4.5%) | 31 (2.7%) |
| 65 to 69 Years | 46 (3.9%) | 38 (3.3%) |
| 70 to 74 Years | 8 (0.7%) | 2 (0.2%) |
| 75 to 79 Years | 15 (1.3%) | 40 (3.5%) |
| 80 to 84 Years | 4 (0.3%) | 48 (4.2%) |
| 85 Years and over | 0 (0.0%) | 25 (2.2%) |
| Total | 1,170 (100.0%) | 1,148 (100.0%) |
Families and Households in Ganado
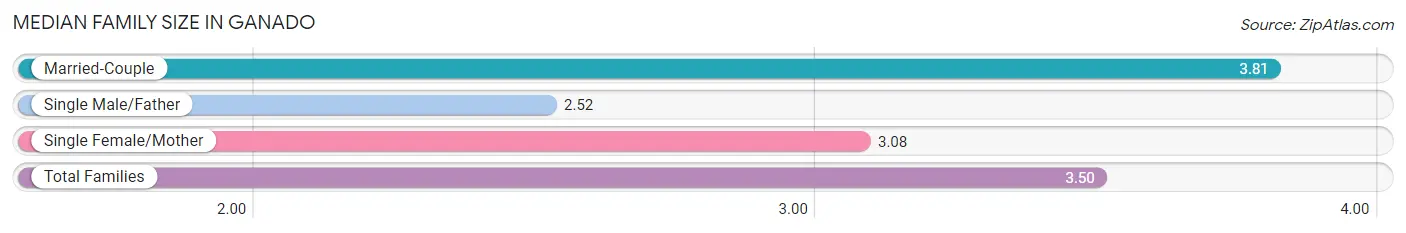
Median Family Size in Ganado
The median family size in Ganado is 3.50 persons per family, with married-couple families (369 | 65.2%) accounting for the largest median family size of 3.81 persons per family. On the other hand, single male/father families (62 | 11.0%) represent the smallest median family size with 2.52 persons per family.
| Family Type | # Families | Family Size |
| Married-Couple | 369 (65.2%) | 3.81 |
| Single Male/Father | 62 (11.0%) | 2.52 |
| Single Female/Mother | 135 (23.8%) | 3.08 |
| Total Families | 566 (100.0%) | 3.50 |
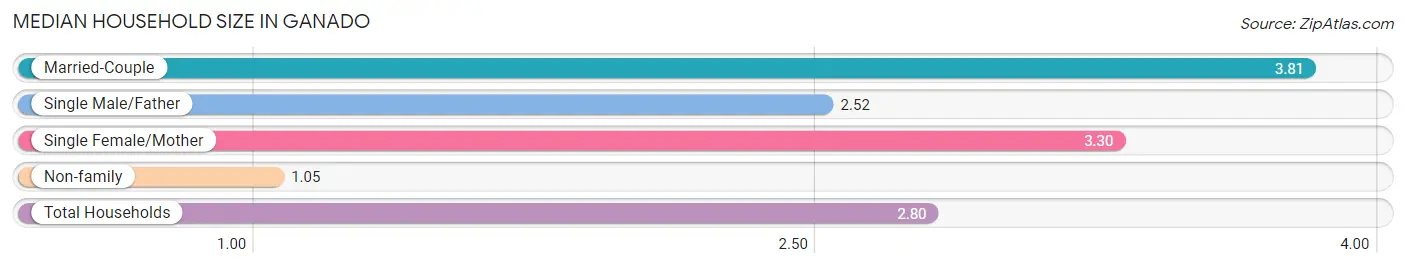
Median Household Size in Ganado
The median household size in Ganado is 2.80 persons per household, with married-couple households (369 | 45.6%) accounting for the largest median household size of 3.81 persons per household. non-family households (243 | 30.0%) represent the smallest median household size with 1.05 persons per household.
| Household Type | # Households | Household Size |
| Married-Couple | 369 (45.6%) | 3.81 |
| Single Male/Father | 62 (7.7%) | 2.52 |
| Single Female/Mother | 135 (16.7%) | 3.30 |
| Non-family | 243 (30.0%) | 1.05 |
| Total Households | 809 (100.0%) | 2.80 |
Household Size by Marriage Status in Ganado
Out of a total of 809 households in Ganado, 566 (70.0%) are family households, while 243 (30.0%) are nonfamily households. The most numerous type of family households are 2-person households, comprising 203, and the most common type of nonfamily households are 1-person households, comprising 225.
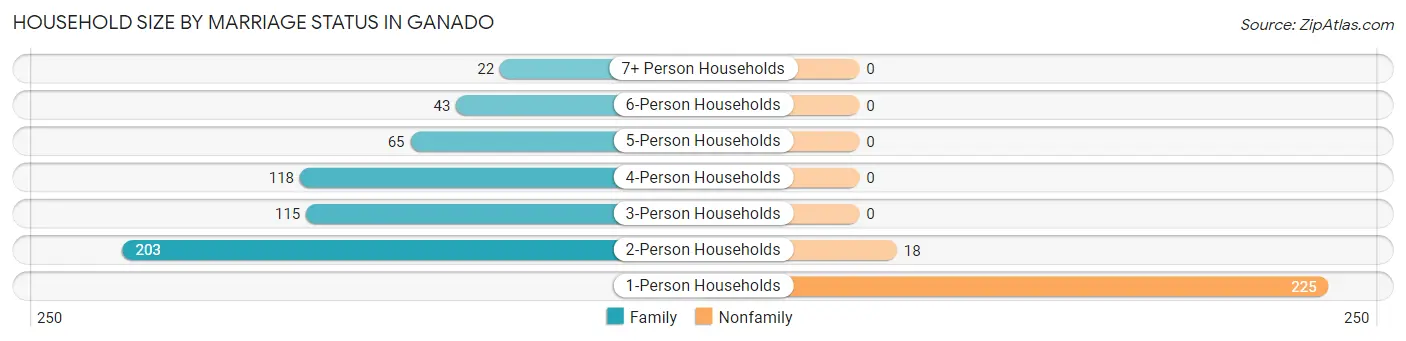
| Household Size | Family Households | Nonfamily Households |
| 1-Person Households | - | 225 (27.8%) |
| 2-Person Households | 203 (25.1%) | 18 (2.2%) |
| 3-Person Households | 115 (14.2%) | 0 (0.0%) |
| 4-Person Households | 118 (14.6%) | 0 (0.0%) |
| 5-Person Households | 65 (8.0%) | 0 (0.0%) |
| 6-Person Households | 43 (5.3%) | 0 (0.0%) |
| 7+ Person Households | 22 (2.7%) | 0 (0.0%) |
| Total | 566 (70.0%) | 243 (30.0%) |
Female Fertility in Ganado
Fertility by Age in Ganado
Average fertility rate in Ganado is 64.0 births per 1,000 women. Women in the age bracket of 20 to 34 years have the highest fertility rate with 140.0 births per 1,000 women. Women in the age bracket of 20 to 34 years acount for 100.0% of all women with births.
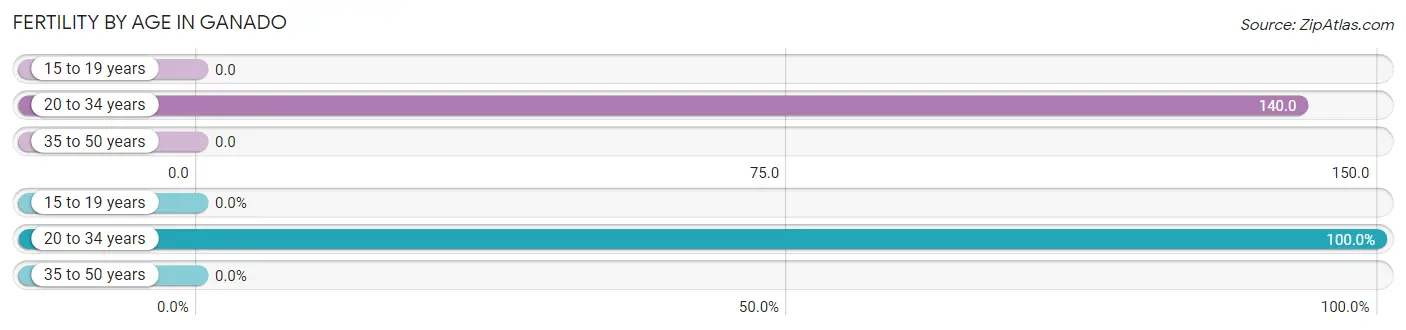
| Age Bracket | Women with Births | Births / 1,000 Women |
| 15 to 19 years | 0 (0.0%) | 0.0 |
| 20 to 34 years | 35 (100.0%) | 140.0 |
| 35 to 50 years | 0 (0.0%) | 0.0 |
| Total | 35 (100.0%) | 64.0 |
Fertility by Age by Marriage Status in Ganado
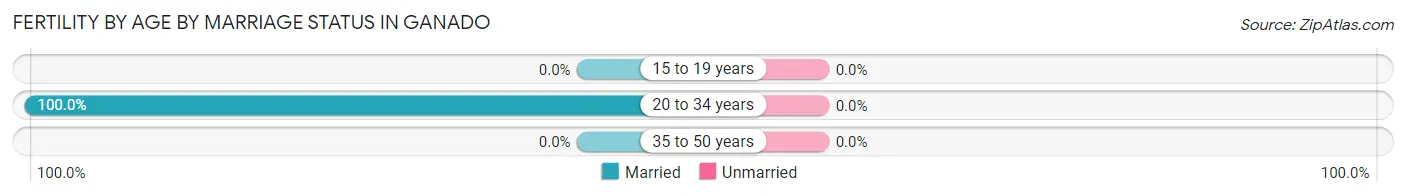
| Age Bracket | Married | Unmarried |
| 15 to 19 years | 0 (0.0%) | 0 (0.0%) |
| 20 to 34 years | 35 (100.0%) | 0 (0.0%) |
| 35 to 50 years | 0 (0.0%) | 0 (0.0%) |
| Total | 35 (100.0%) | 0 (0.0%) |
Fertility by Education in Ganado
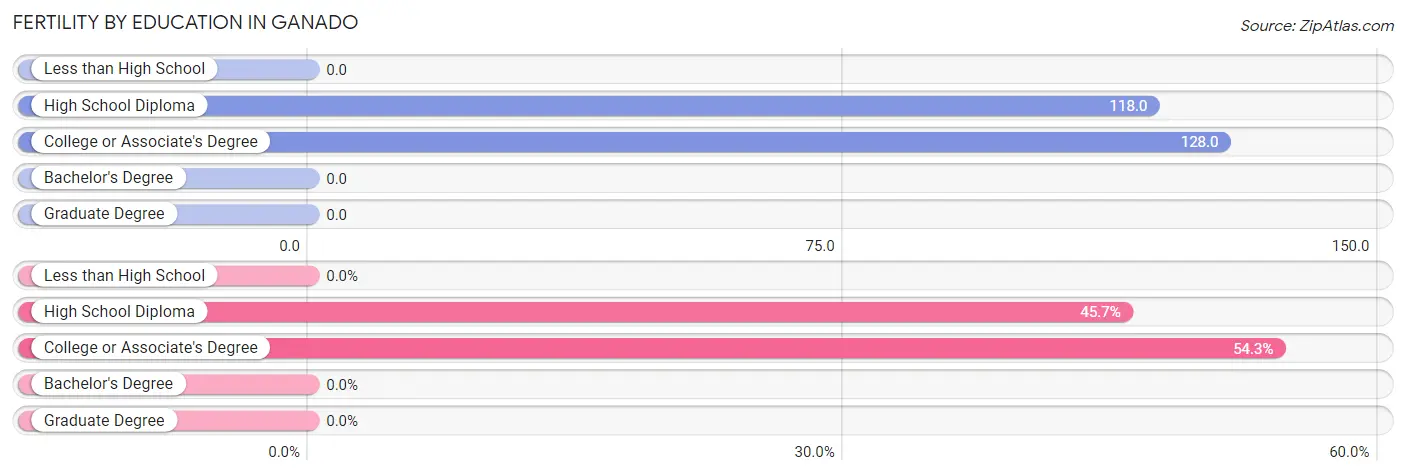
| Educational Attainment | Women with Births | Births / 1,000 Women |
| Less than High School | 0 (0.0%) | 0.0 |
| High School Diploma | 16 (45.7%) | 118.0 |
| College or Associate's Degree | 19 (54.3%) | 128.0 |
| Bachelor's Degree | 0 (0.0%) | 0.0 |
| Graduate Degree | 0 (0.0%) | 0.0 |
| Total | 35 (100.0%) | 64.0 |
Fertility by Education by Marriage Status in Ganado
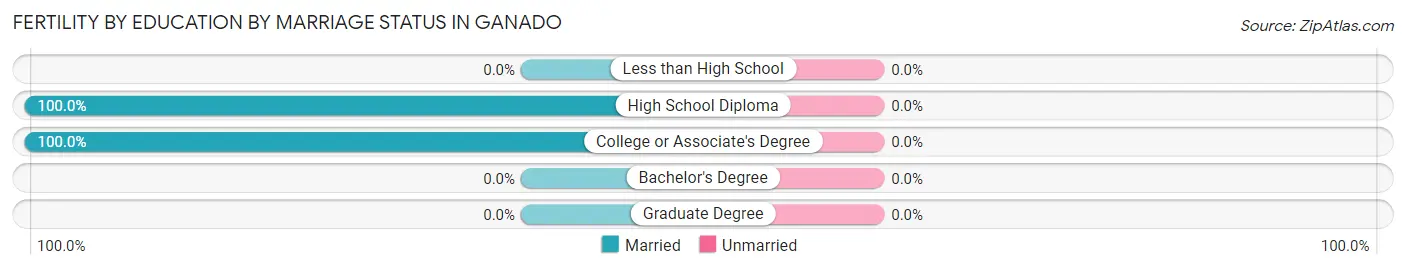
| Educational Attainment | Married | Unmarried |
| Less than High School | 0 (0.0%) | 0 (0.0%) |
| High School Diploma | 16 (100.0%) | 0 (0.0%) |
| College or Associate's Degree | 19 (100.0%) | 0 (0.0%) |
| Bachelor's Degree | 0 (0.0%) | 0 (0.0%) |
| Graduate Degree | 0 (0.0%) | 0 (0.0%) |
| Total | 35 (100.0%) | 0 (0.0%) |
Employment Characteristics in Ganado
Employment by Class of Employer in Ganado
Among the 1,063 employed individuals in Ganado, private company employees (804 | 75.6%), state government employees (87 | 8.2%), and local government employees (78 | 7.3%) make up the most common classes of employment.
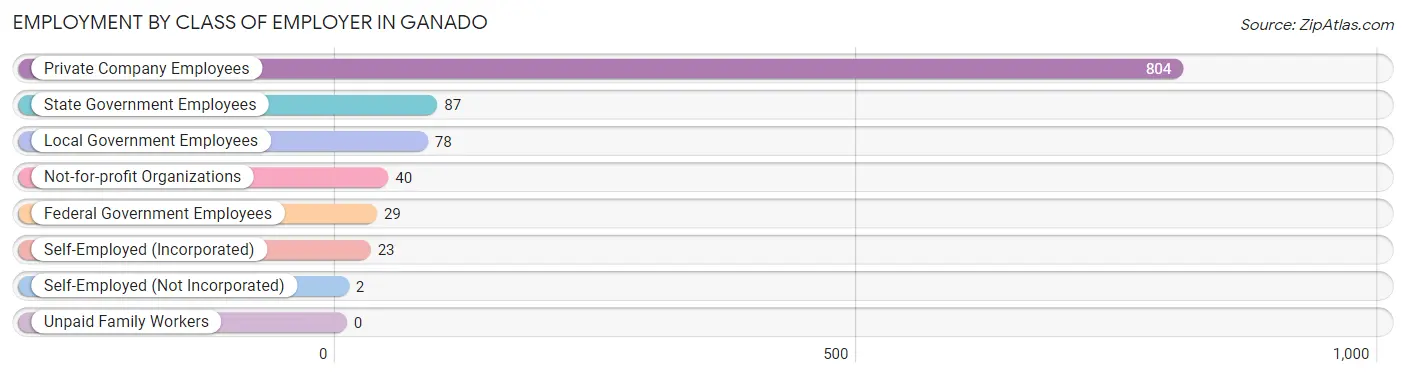
| Employer Class | # Employees | % Employees |
| Private Company Employees | 804 | 75.6% |
| Self-Employed (Incorporated) | 23 | 2.2% |
| Self-Employed (Not Incorporated) | 2 | 0.2% |
| Not-for-profit Organizations | 40 | 3.8% |
| Local Government Employees | 78 | 7.3% |
| State Government Employees | 87 | 8.2% |
| Federal Government Employees | 29 | 2.7% |
| Unpaid Family Workers | 0 | 0.0% |
| Total | 1,063 | 100.0% |
Employment Status by Age in Ganado
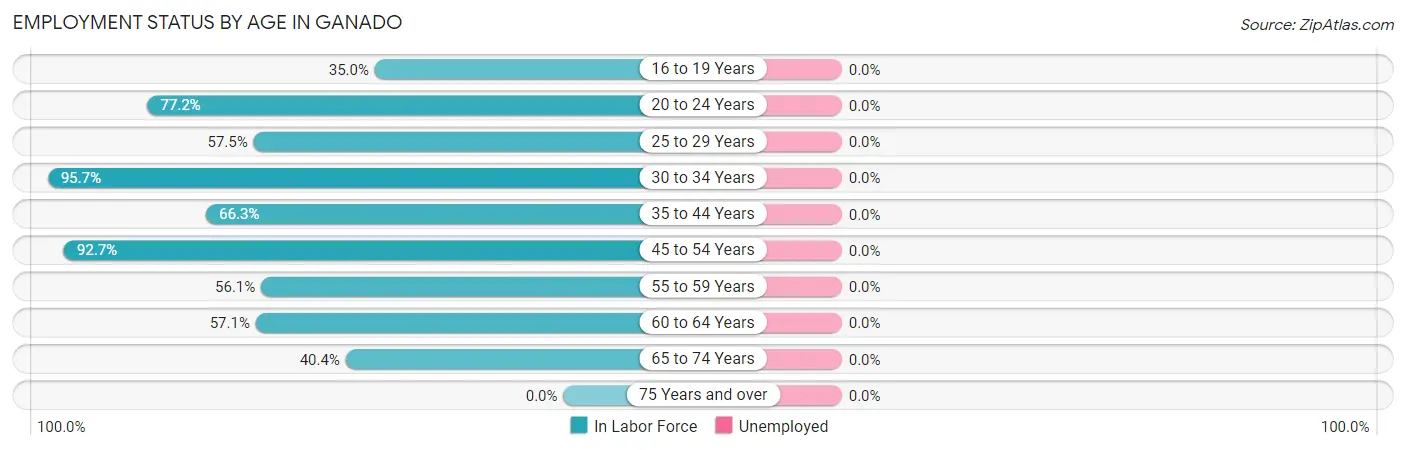
| Age Bracket | In Labor Force | Unemployed |
| 16 to 19 Years | 48 (35.0%) | 0 (0.0%) |
| 20 to 24 Years | 146 (77.2%) | 0 (0.0%) |
| 25 to 29 Years | 122 (57.5%) | 0 (0.0%) |
| 30 to 34 Years | 202 (95.7%) | 0 (0.0%) |
| 35 to 44 Years | 242 (66.3%) | 0 (0.0%) |
| 45 to 54 Years | 152 (92.7%) | 0 (0.0%) |
| 55 to 59 Years | 74 (56.1%) | 0 (0.0%) |
| 60 to 64 Years | 48 (57.1%) | 0 (0.0%) |
| 65 to 74 Years | 38 (40.4%) | 0 (0.0%) |
| 75 Years and over | 0 (0.0%) | 0 (0.0%) |
| Total | 1,072 (62.3%) | 0 (0.0%) |
Employment Status by Educational Attainment in Ganado
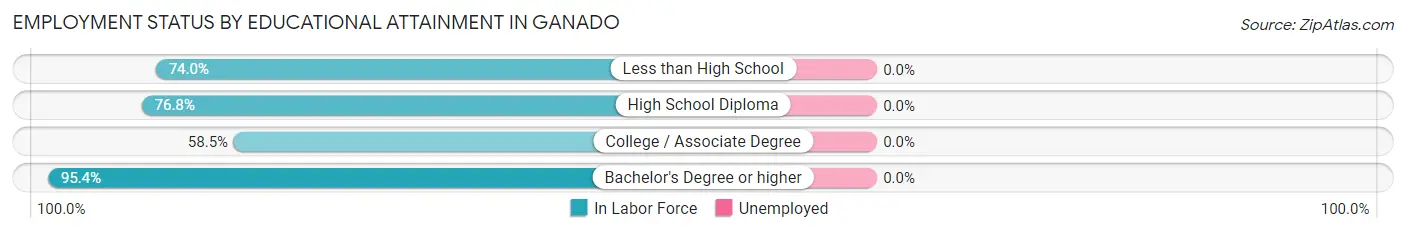
| Educational Attainment | In Labor Force | Unemployed |
| Less than High School | 299 (74.0%) | 0 (0.0%) |
| High School Diploma | 261 (76.8%) | 0 (0.0%) |
| College / Associate Degree | 197 (58.5%) | 0 (0.0%) |
| Bachelor's Degree or higher | 83 (95.4%) | 0 (0.0%) |
| Total | 840 (71.9%) | 0 (0.0%) |
Employment Occupations by Sex in Ganado
Management, Business, Science and Arts Occupations
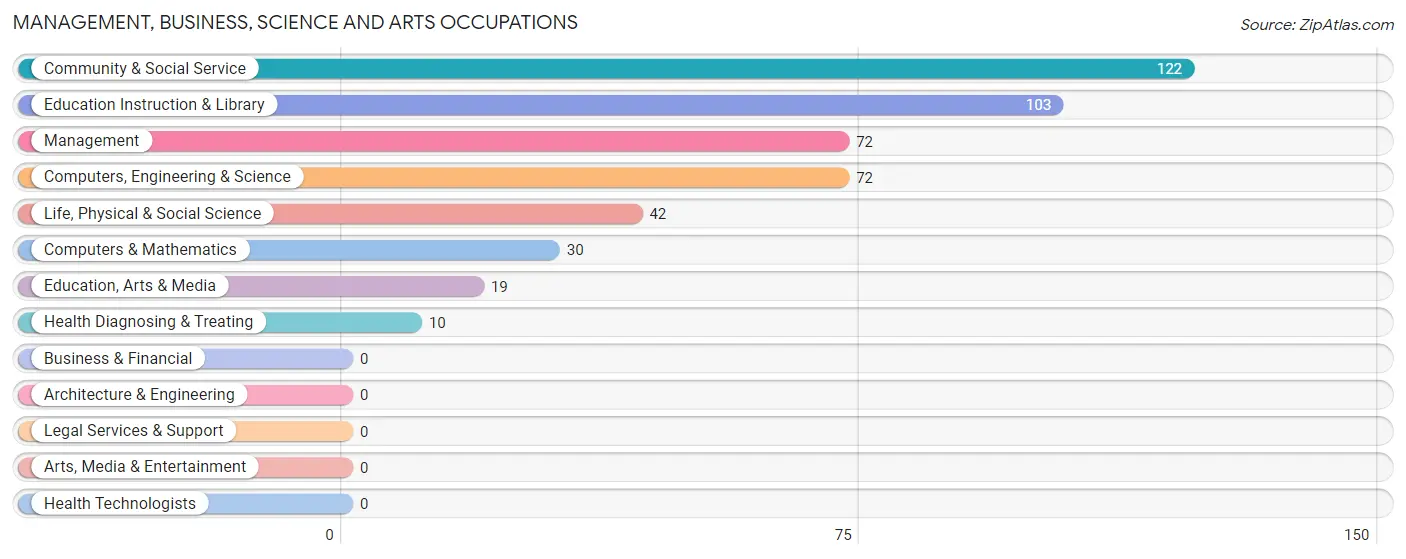
The most common Management, Business, Science and Arts occupations in Ganado are Community & Social Service (122 | 11.4%), Education Instruction & Library (103 | 9.6%), Management (72 | 6.7%), Computers, Engineering & Science (72 | 6.7%), and Life, Physical & Social Science (42 | 3.9%).
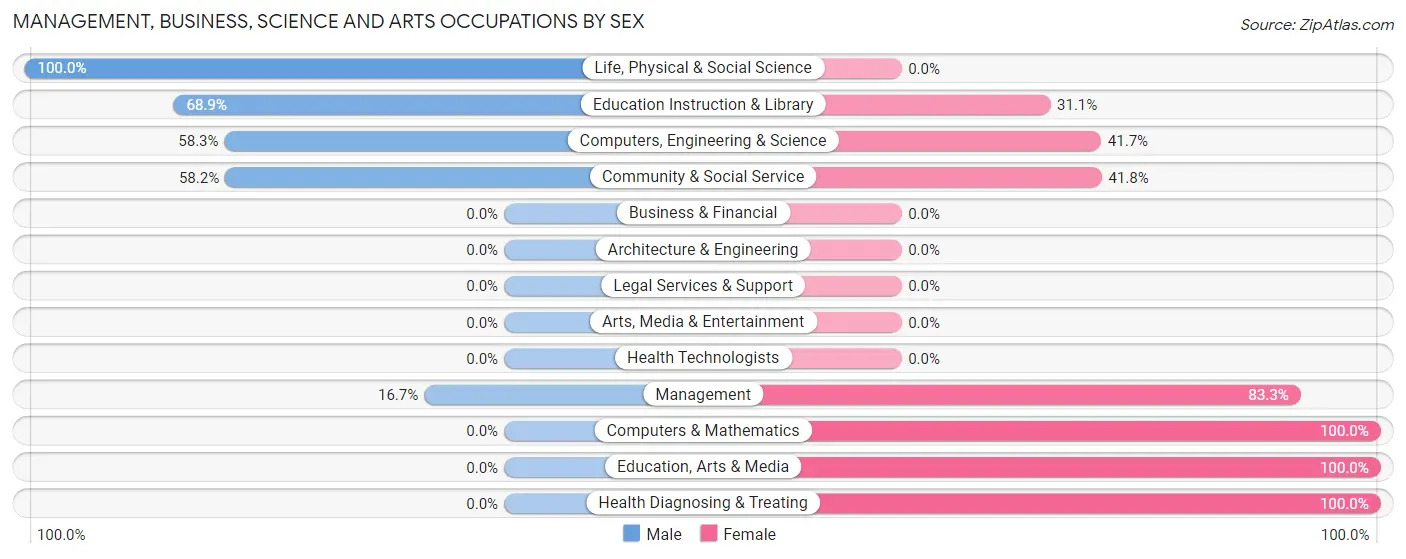
Management, Business, Science and Arts Occupations by Sex
Within the Management, Business, Science and Arts occupations in Ganado, the most male-oriented occupations are Life, Physical & Social Science (100.0%), Education Instruction & Library (68.9%), and Computers, Engineering & Science (58.3%), while the most female-oriented occupations are Computers & Mathematics (100.0%), Education, Arts & Media (100.0%), and Health Diagnosing & Treating (100.0%).
| Occupation | Male | Female |
| Management | 12 (16.7%) | 60 (83.3%) |
| Business & Financial | 0 (0.0%) | 0 (0.0%) |
| Computers, Engineering & Science | 42 (58.3%) | 30 (41.7%) |
| Computers & Mathematics | 0 (0.0%) | 30 (100.0%) |
| Architecture & Engineering | 0 (0.0%) | 0 (0.0%) |
| Life, Physical & Social Science | 42 (100.0%) | 0 (0.0%) |
| Community & Social Service | 71 (58.2%) | 51 (41.8%) |
| Education, Arts & Media | 0 (0.0%) | 19 (100.0%) |
| Legal Services & Support | 0 (0.0%) | 0 (0.0%) |
| Education Instruction & Library | 71 (68.9%) | 32 (31.1%) |
| Arts, Media & Entertainment | 0 (0.0%) | 0 (0.0%) |
| Health Diagnosing & Treating | 0 (0.0%) | 10 (100.0%) |
| Health Technologists | 0 (0.0%) | 0 (0.0%) |
| Total (Category) | 125 (45.3%) | 151 (54.7%) |
| Total (Overall) | 814 (75.9%) | 258 (24.1%) |
Services Occupations
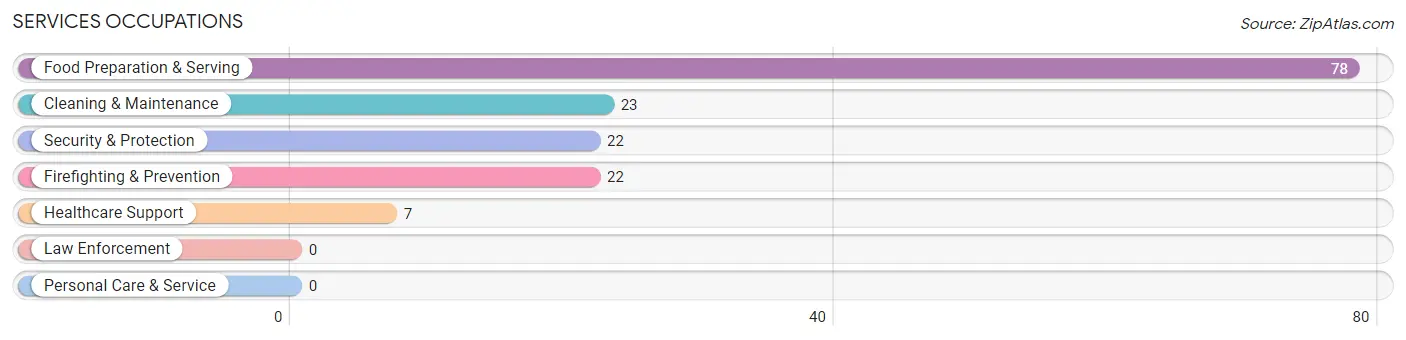
The most common Services occupations in Ganado are Food Preparation & Serving (78 | 7.3%), Cleaning & Maintenance (23 | 2.1%), Security & Protection (22 | 2.1%), Firefighting & Prevention (22 | 2.1%), and Healthcare Support (7 | 0.6%).
Services Occupations by Sex
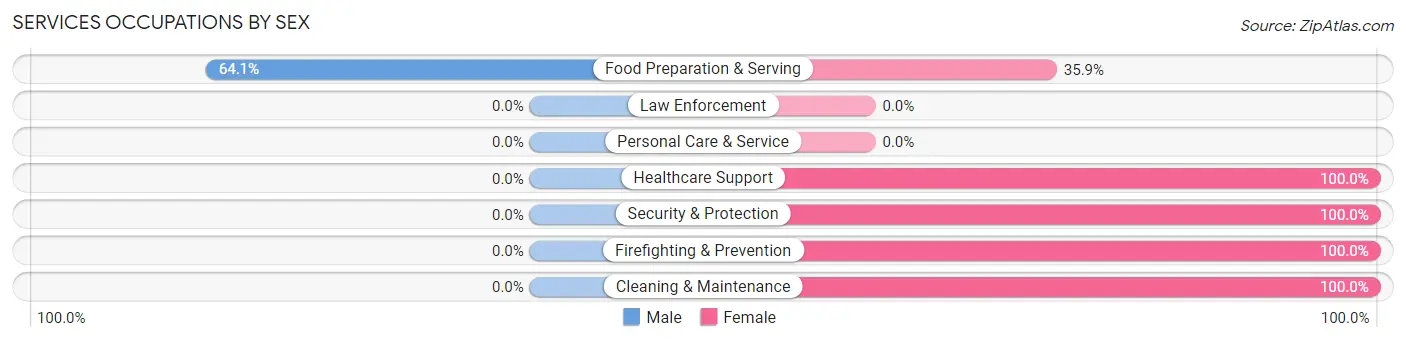
| Occupation | Male | Female |
| Healthcare Support | 0 (0.0%) | 7 (100.0%) |
| Security & Protection | 0 (0.0%) | 22 (100.0%) |
| Firefighting & Prevention | 0 (0.0%) | 22 (100.0%) |
| Law Enforcement | 0 (0.0%) | 0 (0.0%) |
| Food Preparation & Serving | 50 (64.1%) | 28 (35.9%) |
| Cleaning & Maintenance | 0 (0.0%) | 23 (100.0%) |
| Personal Care & Service | 0 (0.0%) | 0 (0.0%) |
| Total (Category) | 50 (38.5%) | 80 (61.5%) |
| Total (Overall) | 814 (75.9%) | 258 (24.1%) |
Sales and Office Occupations
The most common Sales and Office occupations in Ganado are Office & Administration (18 | 1.7%), and Sales & Related (2 | 0.2%).
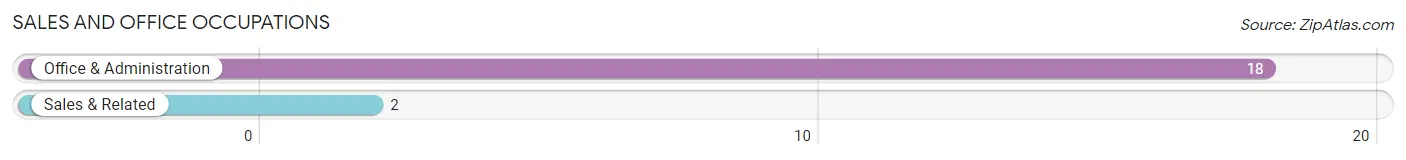
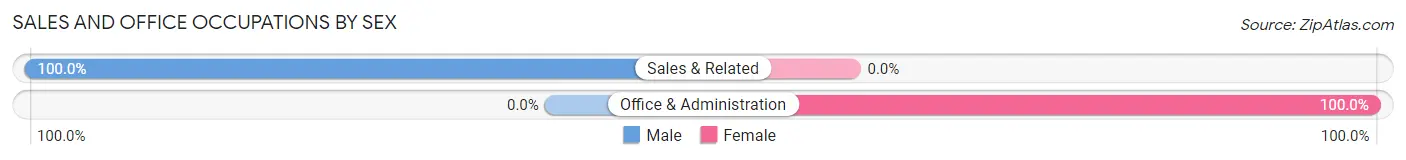
Sales and Office Occupations by Sex
| Occupation | Male | Female |
| Sales & Related | 2 (100.0%) | 0 (0.0%) |
| Office & Administration | 0 (0.0%) | 18 (100.0%) |
| Total (Category) | 2 (10.0%) | 18 (90.0%) |
| Total (Overall) | 814 (75.9%) | 258 (24.1%) |
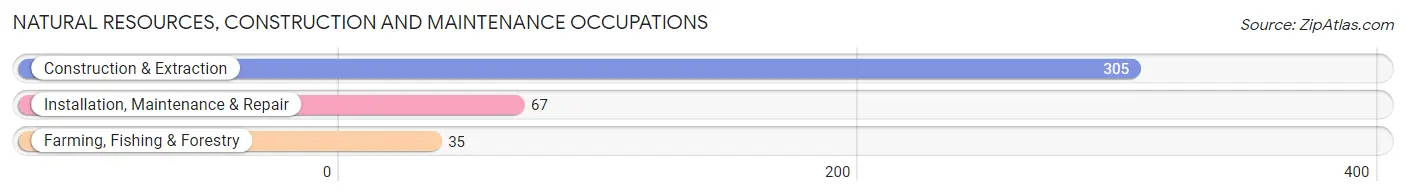
Natural Resources, Construction and Maintenance Occupations
The most common Natural Resources, Construction and Maintenance occupations in Ganado are Construction & Extraction (305 | 28.4%), Installation, Maintenance & Repair (67 | 6.2%), and Farming, Fishing & Forestry (35 | 3.3%).
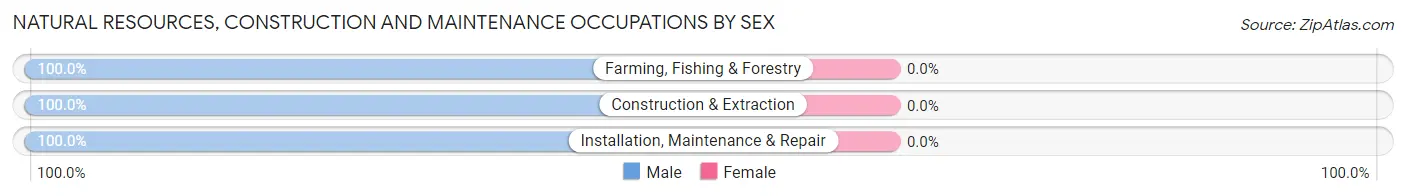
Natural Resources, Construction and Maintenance Occupations by Sex
| Occupation | Male | Female |
| Farming, Fishing & Forestry | 35 (100.0%) | 0 (0.0%) |
| Construction & Extraction | 305 (100.0%) | 0 (0.0%) |
| Installation, Maintenance & Repair | 67 (100.0%) | 0 (0.0%) |
| Total (Category) | 407 (100.0%) | 0 (0.0%) |
| Total (Overall) | 814 (75.9%) | 258 (24.1%) |
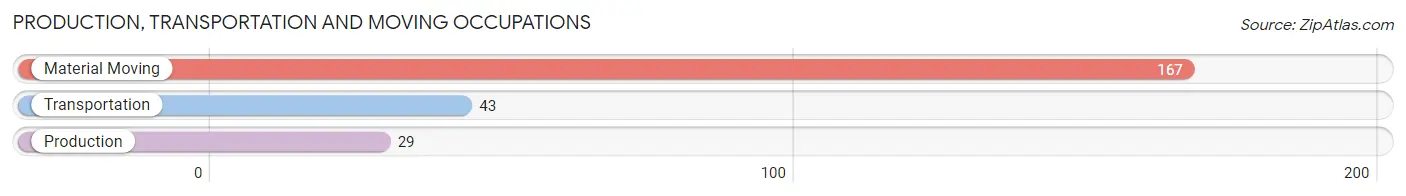
Production, Transportation and Moving Occupations
The most common Production, Transportation and Moving occupations in Ganado are Material Moving (167 | 15.6%), Transportation (43 | 4.0%), and Production (29 | 2.7%).
Production, Transportation and Moving Occupations by Sex
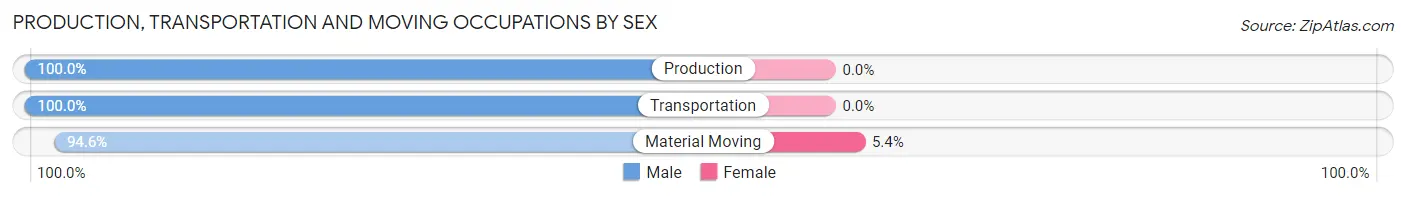
| Occupation | Male | Female |
| Production | 29 (100.0%) | 0 (0.0%) |
| Transportation | 43 (100.0%) | 0 (0.0%) |
| Material Moving | 158 (94.6%) | 9 (5.4%) |
| Total (Category) | 230 (96.2%) | 9 (3.8%) |
| Total (Overall) | 814 (75.9%) | 258 (24.1%) |
Employment Industries by Sex in Ganado
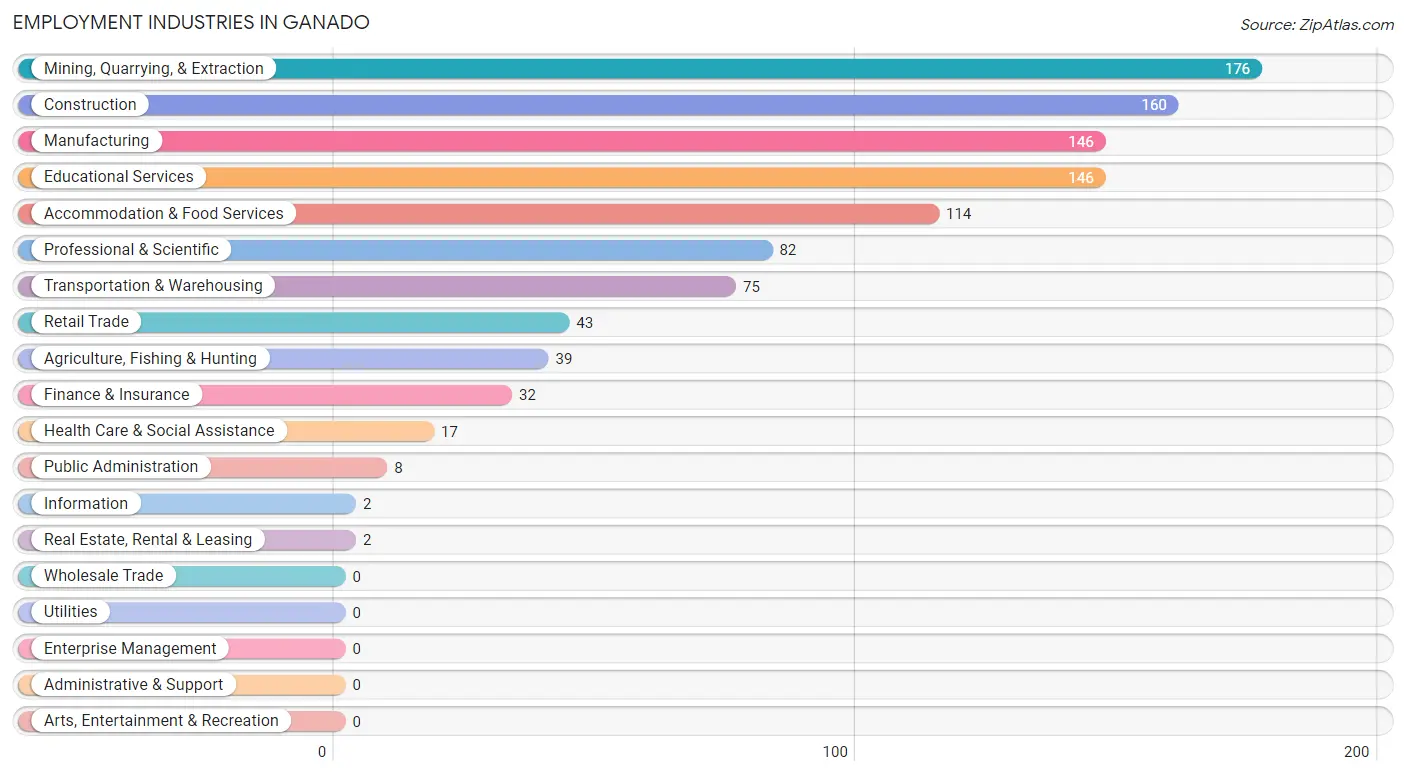
Employment Industries in Ganado
The major employment industries in Ganado include Mining, Quarrying, & Extraction (176 | 16.4%), Construction (160 | 14.9%), Manufacturing (146 | 13.6%), Educational Services (146 | 13.6%), and Accommodation & Food Services (114 | 10.6%).
Employment Industries by Sex in Ganado
The Ganado industries that see more men than women are Agriculture, Fishing & Hunting (100.0%), Retail Trade (100.0%), and Transportation & Warehousing (100.0%), whereas the industries that tend to have a higher number of women are Information (100.0%), Finance & Insurance (100.0%), and Health Care & Social Assistance (100.0%).
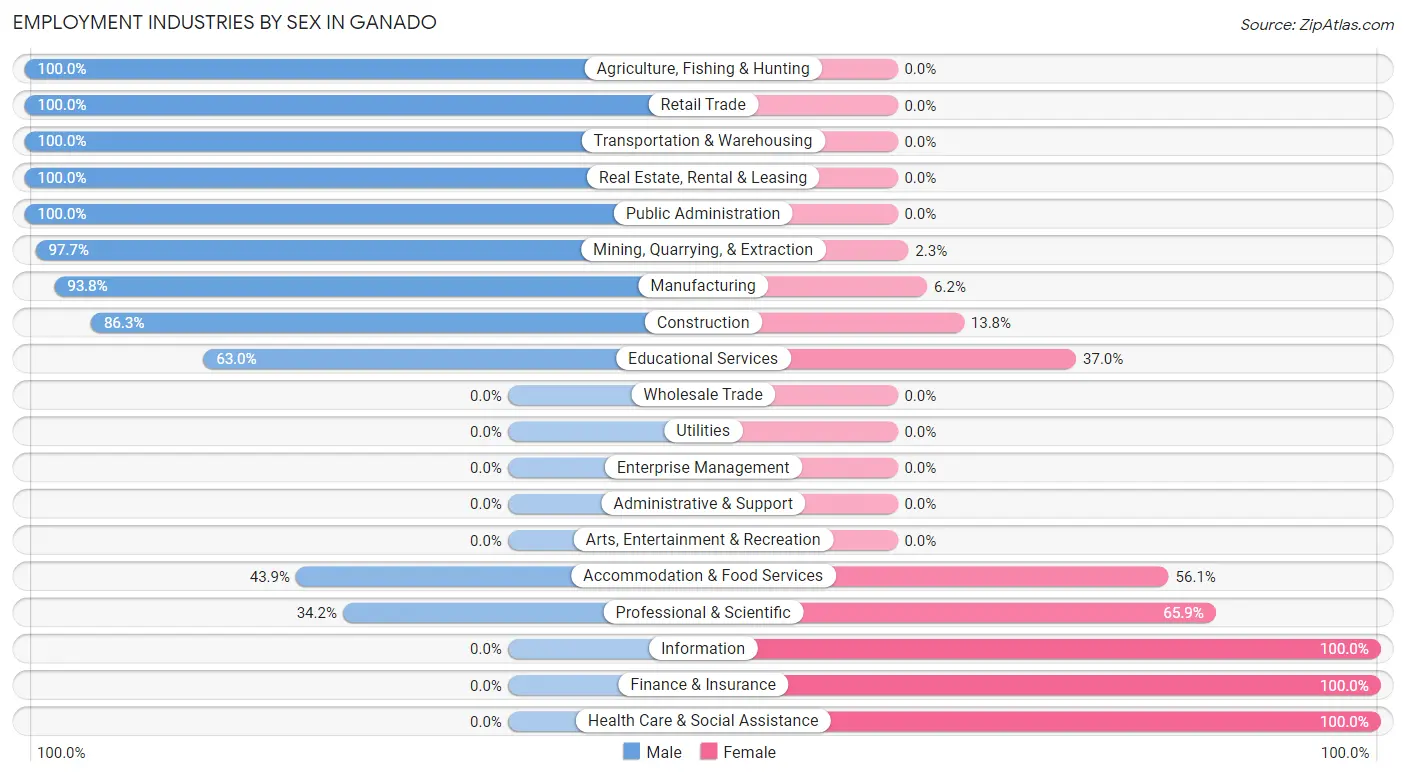
| Industry | Male | Female |
| Agriculture, Fishing & Hunting | 39 (100.0%) | 0 (0.0%) |
| Mining, Quarrying, & Extraction | 172 (97.7%) | 4 (2.3%) |
| Construction | 138 (86.3%) | 22 (13.8%) |
| Manufacturing | 137 (93.8%) | 9 (6.2%) |
| Wholesale Trade | 0 (0.0%) | 0 (0.0%) |
| Retail Trade | 43 (100.0%) | 0 (0.0%) |
| Transportation & Warehousing | 75 (100.0%) | 0 (0.0%) |
| Utilities | 0 (0.0%) | 0 (0.0%) |
| Information | 0 (0.0%) | 2 (100.0%) |
| Finance & Insurance | 0 (0.0%) | 32 (100.0%) |
| Real Estate, Rental & Leasing | 2 (100.0%) | 0 (0.0%) |
| Professional & Scientific | 28 (34.2%) | 54 (65.8%) |
| Enterprise Management | 0 (0.0%) | 0 (0.0%) |
| Administrative & Support | 0 (0.0%) | 0 (0.0%) |
| Educational Services | 92 (63.0%) | 54 (37.0%) |
| Health Care & Social Assistance | 0 (0.0%) | 17 (100.0%) |
| Arts, Entertainment & Recreation | 0 (0.0%) | 0 (0.0%) |
| Accommodation & Food Services | 50 (43.9%) | 64 (56.1%) |
| Public Administration | 8 (100.0%) | 0 (0.0%) |
| Total | 814 (75.9%) | 258 (24.1%) |
Education in Ganado
School Enrollment in Ganado
The most common levels of schooling among the 540 students in Ganado are high school (151 | 28.0%), elementary school (129 | 23.9%), and middle school (123 | 22.8%).
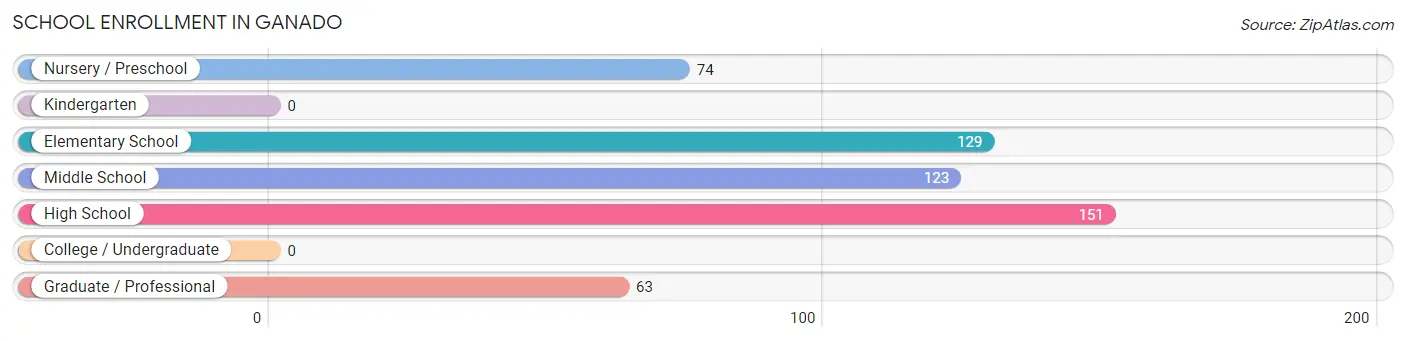
| School Level | # Students | % Students |
| Nursery / Preschool | 74 | 13.7% |
| Kindergarten | 0 | 0.0% |
| Elementary School | 129 | 23.9% |
| Middle School | 123 | 22.8% |
| High School | 151 | 28.0% |
| College / Undergraduate | 0 | 0.0% |
| Graduate / Professional | 63 | 11.7% |
| Total | 540 | 100.0% |
School Enrollment by Age by Funding Source in Ganado
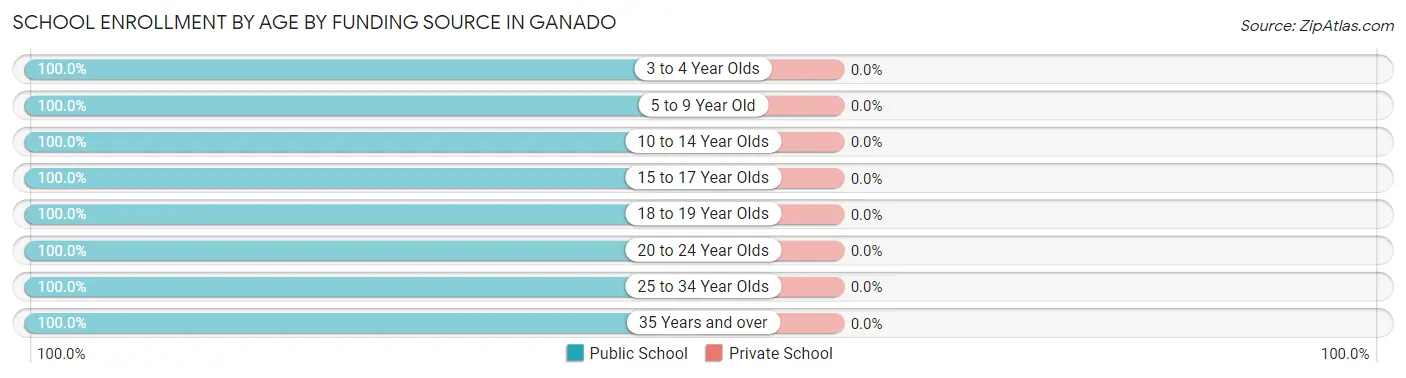
| Age Bracket | Public School | Private School |
| 3 to 4 Year Olds | 49 (100.0%) | 0 (0.0%) |
| 5 to 9 Year Old | 97 (100.0%) | 0 (0.0%) |
| 10 to 14 Year Olds | 184 (100.0%) | 0 (0.0%) |
| 15 to 17 Year Olds | 109 (100.0%) | 0 (0.0%) |
| 18 to 19 Year Olds | 38 (100.0%) | 0 (0.0%) |
| 20 to 24 Year Olds | 24 (100.0%) | 0 (0.0%) |
| 25 to 34 Year Olds | 19 (100.0%) | 0 (0.0%) |
| 35 Years and over | 20 (100.0%) | 0 (0.0%) |
| Total | 540 (100.0%) | 0 (0.0%) |
Educational Attainment by Field of Study in Ganado
Education (78 | 65.5%), business (21 | 17.6%), and bio, nature & agricultural (20 | 16.8%) are the most common fields of study among 119 individuals in Ganado who have obtained a bachelor's degree or higher.
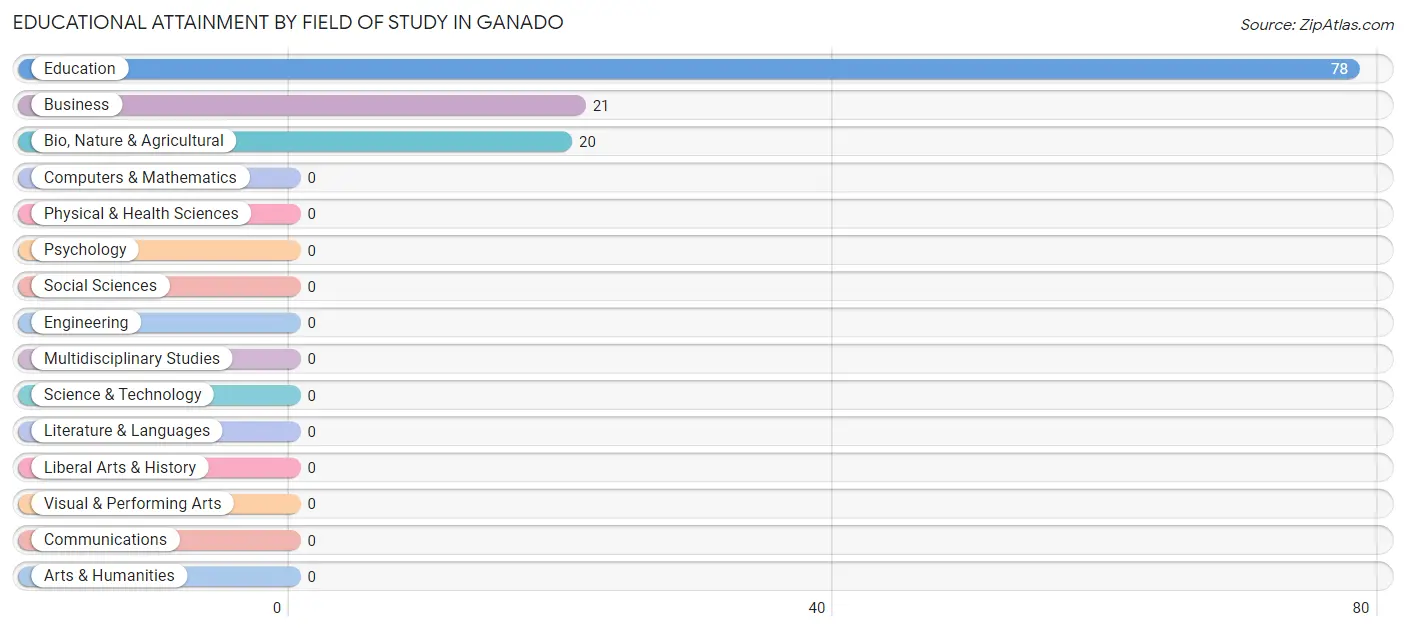
| Field of Study | # Graduates | % Graduates |
| Computers & Mathematics | 0 | 0.0% |
| Bio, Nature & Agricultural | 20 | 16.8% |
| Physical & Health Sciences | 0 | 0.0% |
| Psychology | 0 | 0.0% |
| Social Sciences | 0 | 0.0% |
| Engineering | 0 | 0.0% |
| Multidisciplinary Studies | 0 | 0.0% |
| Science & Technology | 0 | 0.0% |
| Business | 21 | 17.6% |
| Education | 78 | 65.5% |
| Literature & Languages | 0 | 0.0% |
| Liberal Arts & History | 0 | 0.0% |
| Visual & Performing Arts | 0 | 0.0% |
| Communications | 0 | 0.0% |
| Arts & Humanities | 0 | 0.0% |
| Total | 119 | 100.0% |
Transportation & Commute in Ganado
Vehicle Availability by Sex in Ganado
The most prevalent vehicle ownership categories in Ganado are males with 1 vehicle (227, accounting for 28.2%) and females with 1 vehicle (75, making up 88.0%).
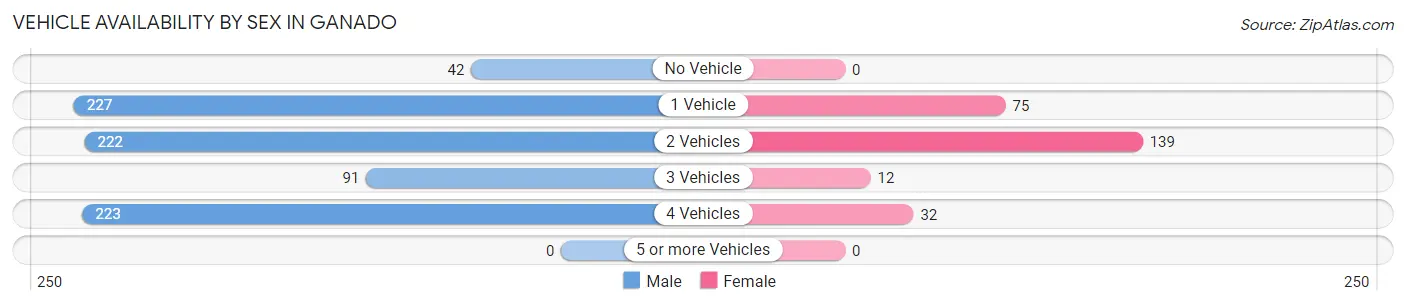
| Vehicles Available | Male | Female |
| No Vehicle | 42 (5.2%) | 0 (0.0%) |
| 1 Vehicle | 227 (28.2%) | 75 (29.1%) |
| 2 Vehicles | 222 (27.6%) | 139 (53.9%) |
| 3 Vehicles | 91 (11.3%) | 12 (4.6%) |
| 4 Vehicles | 223 (27.7%) | 32 (12.4%) |
| 5 or more Vehicles | 0 (0.0%) | 0 (0.0%) |
| Total | 805 (100.0%) | 258 (100.0%) |
Commute Time in Ganado
The most frequently occuring commute durations in Ganado are 5 to 9 minutes (217 commuters, 21.9%), 45 to 59 minutes (177 commuters, 17.9%), and less than 5 minutes (168 commuters, 17.0%).
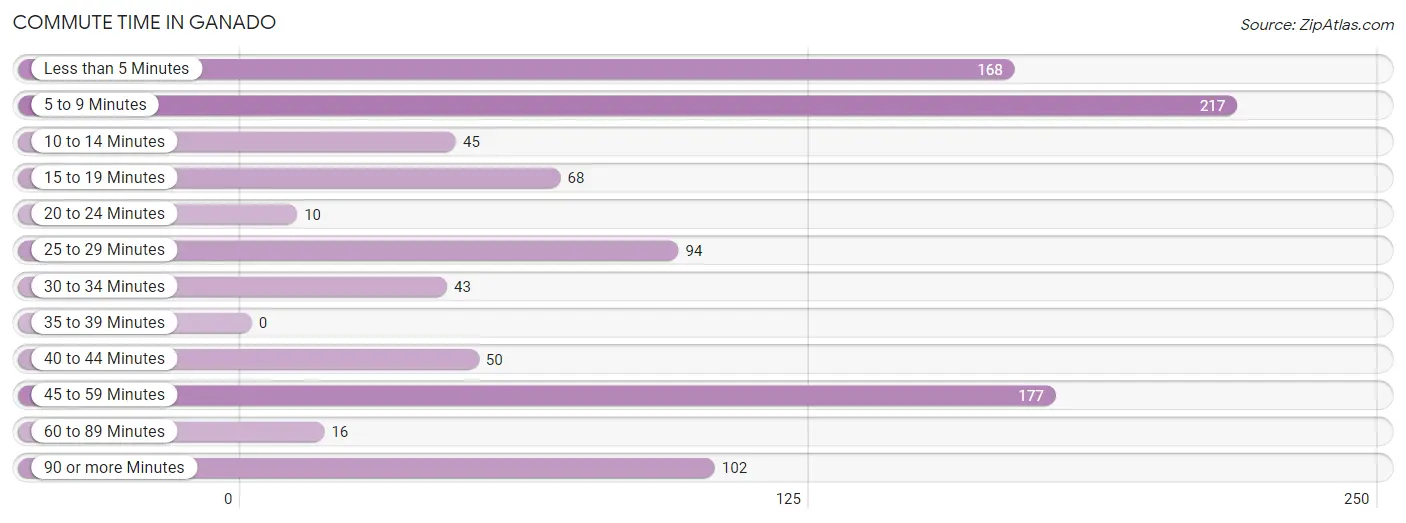
| Commute Time | # Commuters | % Commuters |
| Less than 5 Minutes | 168 | 17.0% |
| 5 to 9 Minutes | 217 | 21.9% |
| 10 to 14 Minutes | 45 | 4.5% |
| 15 to 19 Minutes | 68 | 6.9% |
| 20 to 24 Minutes | 10 | 1.0% |
| 25 to 29 Minutes | 94 | 9.5% |
| 30 to 34 Minutes | 43 | 4.3% |
| 35 to 39 Minutes | 0 | 0.0% |
| 40 to 44 Minutes | 50 | 5.1% |
| 45 to 59 Minutes | 177 | 17.9% |
| 60 to 89 Minutes | 16 | 1.6% |
| 90 or more Minutes | 102 | 10.3% |
Commute Time by Sex in Ganado
The most common commute times in Ganado are 5 to 9 minutes (196 commuters, 25.7%) for males and less than 5 minutes (75 commuters, 32.9%) for females.
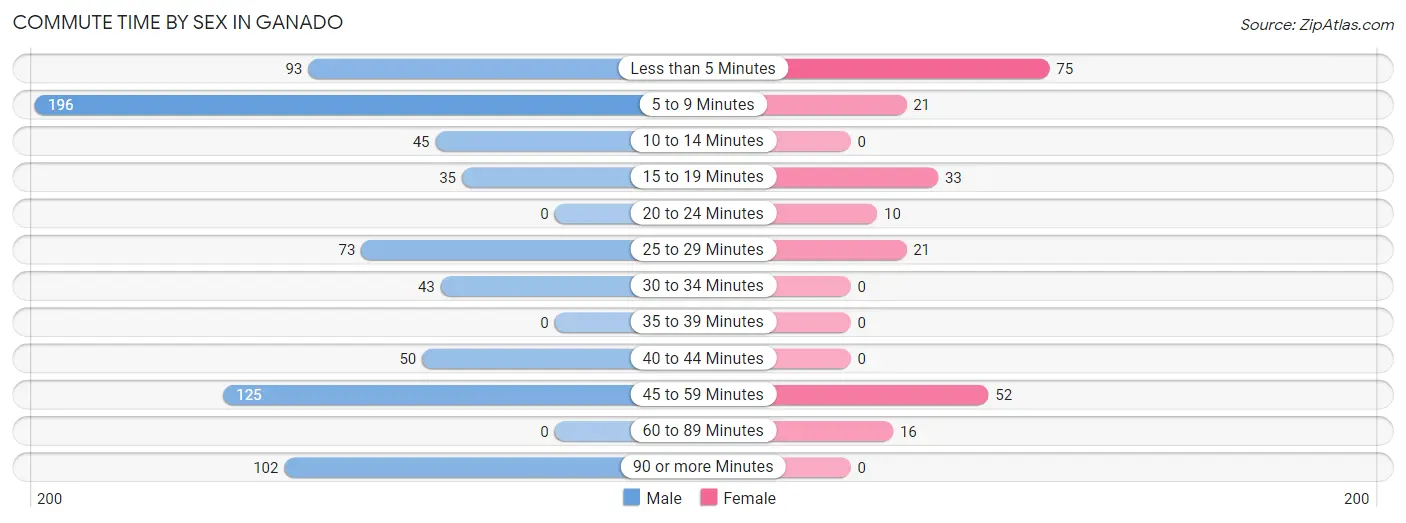
| Commute Time | Male | Female |
| Less than 5 Minutes | 93 (12.2%) | 75 (32.9%) |
| 5 to 9 Minutes | 196 (25.7%) | 21 (9.2%) |
| 10 to 14 Minutes | 45 (5.9%) | 0 (0.0%) |
| 15 to 19 Minutes | 35 (4.6%) | 33 (14.5%) |
| 20 to 24 Minutes | 0 (0.0%) | 10 (4.4%) |
| 25 to 29 Minutes | 73 (9.6%) | 21 (9.2%) |
| 30 to 34 Minutes | 43 (5.6%) | 0 (0.0%) |
| 35 to 39 Minutes | 0 (0.0%) | 0 (0.0%) |
| 40 to 44 Minutes | 50 (6.6%) | 0 (0.0%) |
| 45 to 59 Minutes | 125 (16.4%) | 52 (22.8%) |
| 60 to 89 Minutes | 0 (0.0%) | 16 (7.0%) |
| 90 or more Minutes | 102 (13.4%) | 0 (0.0%) |
Time of Departure to Work by Sex in Ganado
The most frequent times of departure to work in Ganado are 5:30 AM to 5:59 AM (177, 23.2%) for males and 5:30 AM to 5:59 AM (73, 32.0%) for females.
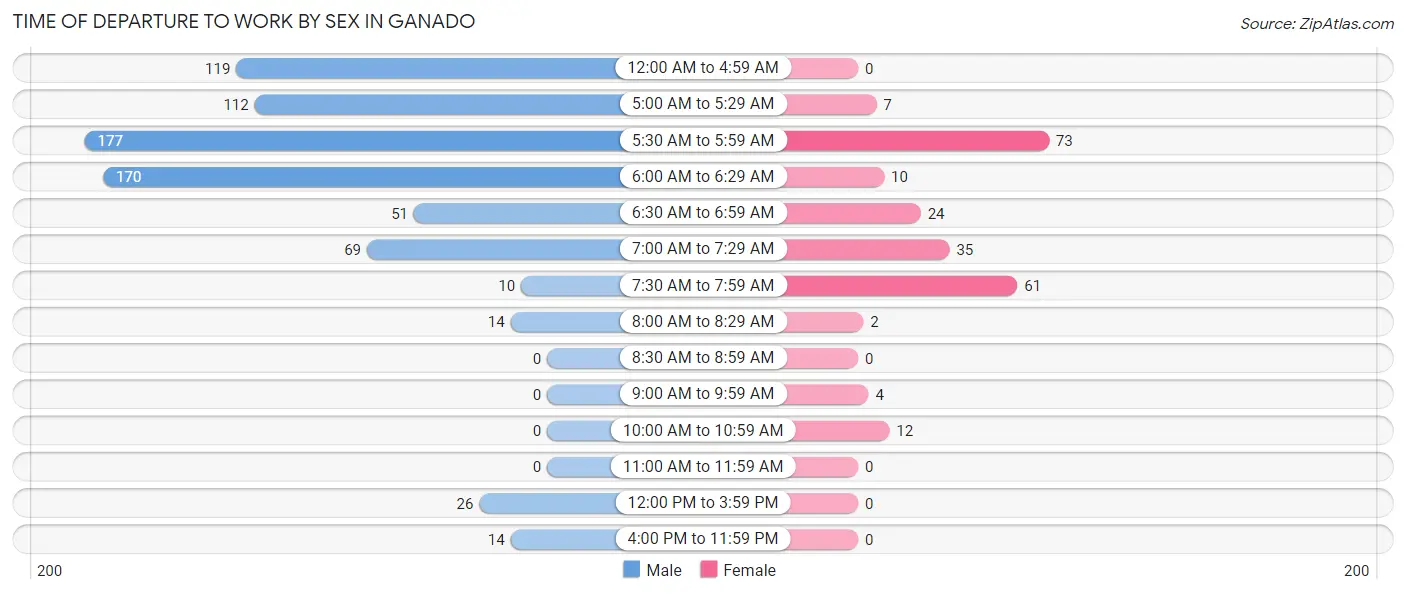
| Time of Departure | Male | Female |
| 12:00 AM to 4:59 AM | 119 (15.6%) | 0 (0.0%) |
| 5:00 AM to 5:29 AM | 112 (14.7%) | 7 (3.1%) |
| 5:30 AM to 5:59 AM | 177 (23.2%) | 73 (32.0%) |
| 6:00 AM to 6:29 AM | 170 (22.3%) | 10 (4.4%) |
| 6:30 AM to 6:59 AM | 51 (6.7%) | 24 (10.5%) |
| 7:00 AM to 7:29 AM | 69 (9.1%) | 35 (15.3%) |
| 7:30 AM to 7:59 AM | 10 (1.3%) | 61 (26.8%) |
| 8:00 AM to 8:29 AM | 14 (1.8%) | 2 (0.9%) |
| 8:30 AM to 8:59 AM | 0 (0.0%) | 0 (0.0%) |
| 9:00 AM to 9:59 AM | 0 (0.0%) | 4 (1.8%) |
| 10:00 AM to 10:59 AM | 0 (0.0%) | 12 (5.3%) |
| 11:00 AM to 11:59 AM | 0 (0.0%) | 0 (0.0%) |
| 12:00 PM to 3:59 PM | 26 (3.4%) | 0 (0.0%) |
| 4:00 PM to 11:59 PM | 14 (1.8%) | 0 (0.0%) |
| Total | 762 (100.0%) | 228 (100.0%) |
Housing Occupancy in Ganado
Occupancy by Ownership in Ganado
Of the total 809 dwellings in Ganado, owner-occupied units account for 406 (50.2%), while renter-occupied units make up 403 (49.8%).
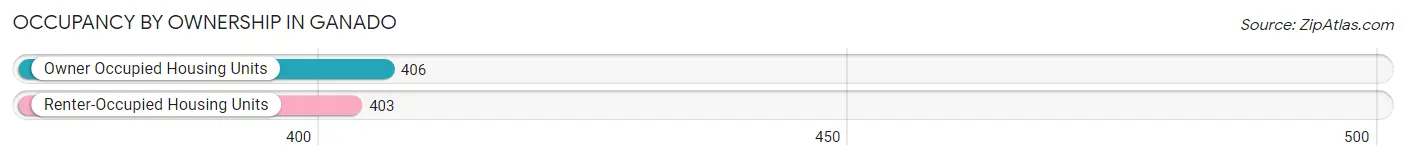
| Occupancy | # Housing Units | % Housing Units |
| Owner Occupied Housing Units | 406 | 50.2% |
| Renter-Occupied Housing Units | 403 | 49.8% |
| Total Occupied Housing Units | 809 | 100.0% |
Occupancy by Household Size in Ganado
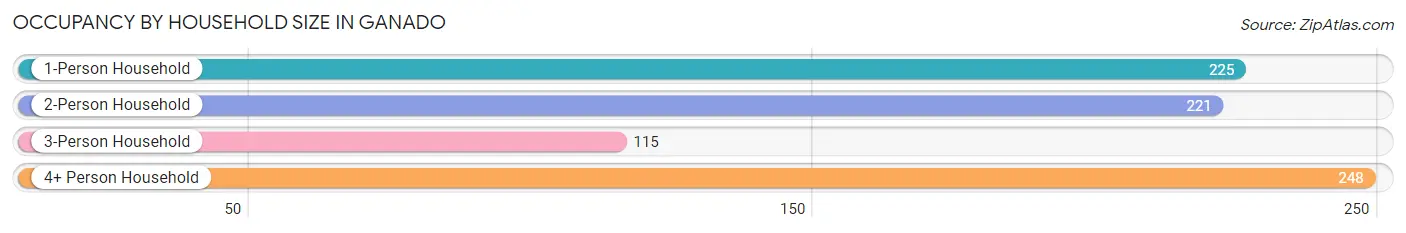
| Household Size | # Housing Units | % Housing Units |
| 1-Person Household | 225 | 27.8% |
| 2-Person Household | 221 | 27.3% |
| 3-Person Household | 115 | 14.2% |
| 4+ Person Household | 248 | 30.7% |
| Total Housing Units | 809 | 100.0% |
Occupancy by Ownership by Household Size in Ganado
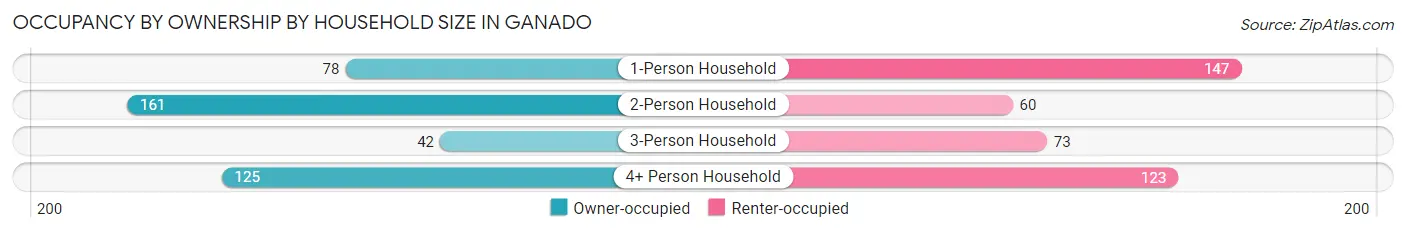
| Household Size | Owner-occupied | Renter-occupied |
| 1-Person Household | 78 (34.7%) | 147 (65.3%) |
| 2-Person Household | 161 (72.9%) | 60 (27.2%) |
| 3-Person Household | 42 (36.5%) | 73 (63.5%) |
| 4+ Person Household | 125 (50.4%) | 123 (49.6%) |
| Total Housing Units | 406 (50.2%) | 403 (49.8%) |
Occupancy by Educational Attainment in Ganado
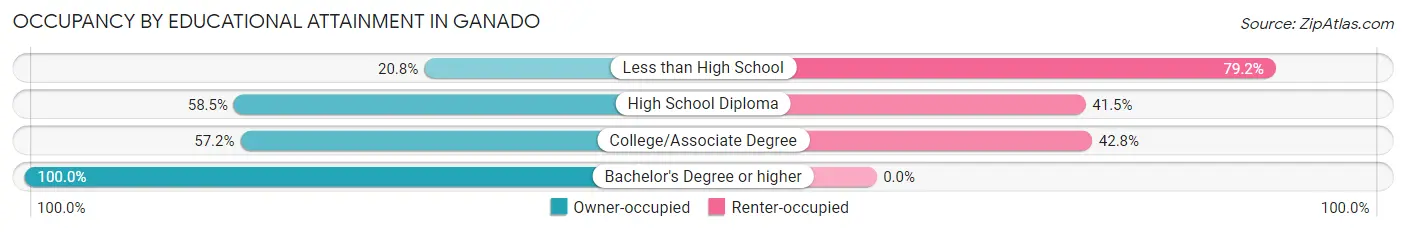
| Household Size | Owner-occupied | Renter-occupied |
| Less than High School | 46 (20.8%) | 175 (79.2%) |
| High School Diploma | 151 (58.5%) | 107 (41.5%) |
| College/Associate Degree | 162 (57.2%) | 121 (42.8%) |
| Bachelor's Degree or higher | 47 (100.0%) | 0 (0.0%) |
Occupancy by Age of Householder in Ganado
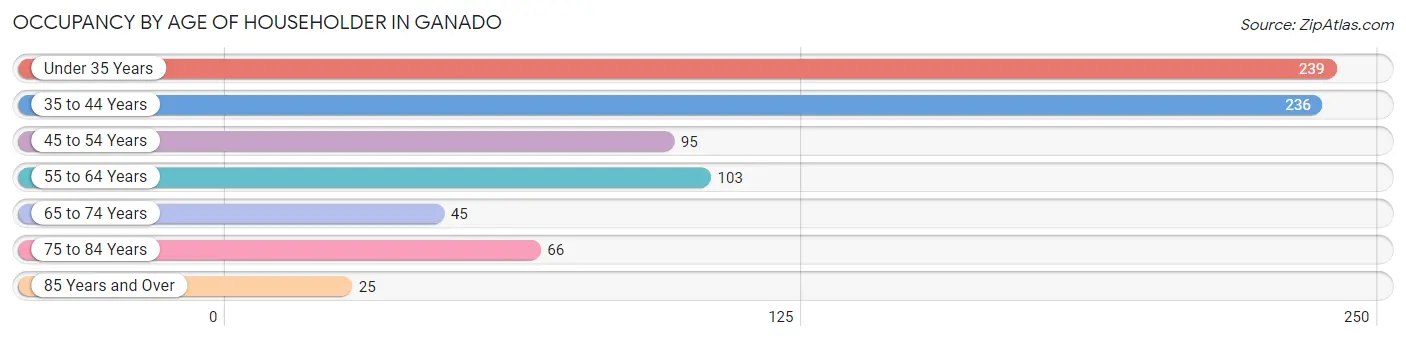
| Age Bracket | # Households | % Households |
| Under 35 Years | 239 | 29.5% |
| 35 to 44 Years | 236 | 29.2% |
| 45 to 54 Years | 95 | 11.7% |
| 55 to 64 Years | 103 | 12.7% |
| 65 to 74 Years | 45 | 5.6% |
| 75 to 84 Years | 66 | 8.2% |
| 85 Years and Over | 25 | 3.1% |
| Total | 809 | 100.0% |
Housing Finances in Ganado
Median Income by Occupancy in Ganado
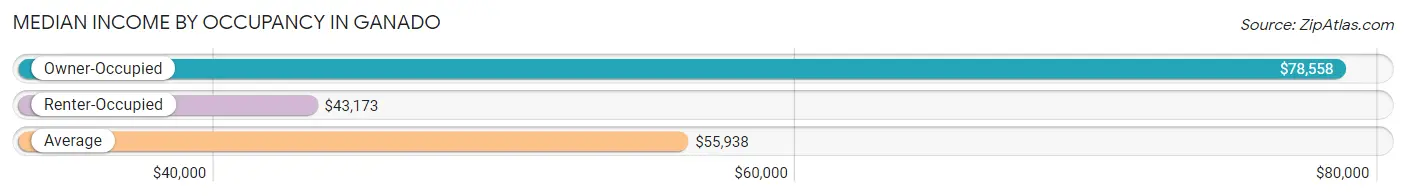
| Occupancy Type | # Households | Median Income |
| Owner-Occupied | 406 (50.2%) | $78,558 |
| Renter-Occupied | 403 (49.8%) | $43,173 |
| Average | 809 (100.0%) | $55,938 |
Occupancy by Householder Income Bracket in Ganado
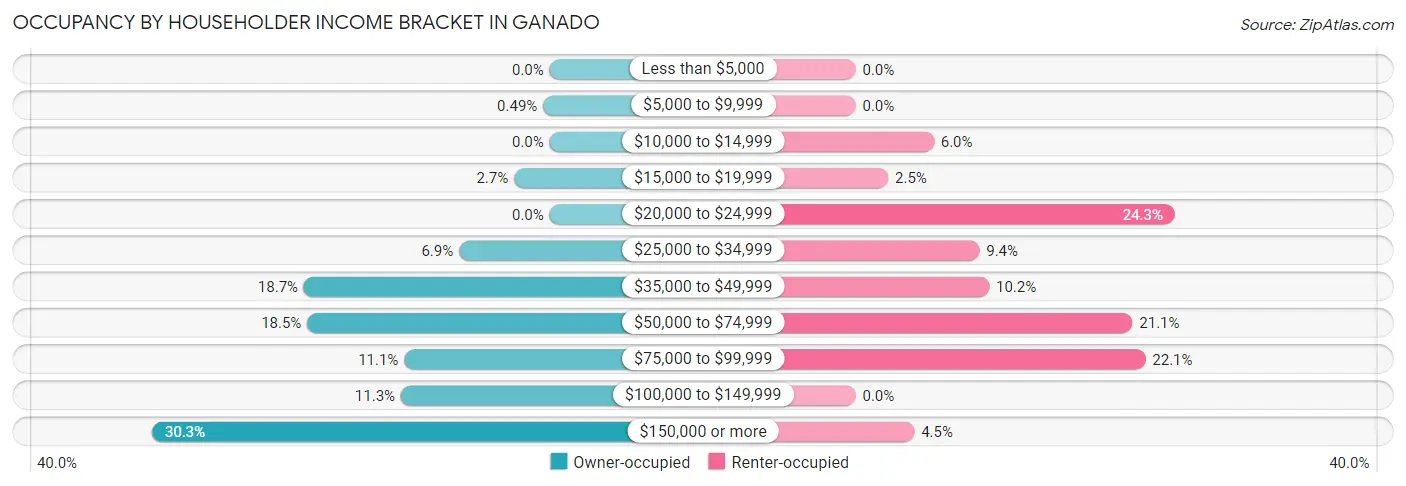
| Income Bracket | Owner-occupied | Renter-occupied |
| Less than $5,000 | 0 (0.0%) | 0 (0.0%) |
| $5,000 to $9,999 | 2 (0.5%) | 0 (0.0%) |
| $10,000 to $14,999 | 0 (0.0%) | 24 (6.0%) |
| $15,000 to $19,999 | 11 (2.7%) | 10 (2.5%) |
| $20,000 to $24,999 | 0 (0.0%) | 98 (24.3%) |
| $25,000 to $34,999 | 28 (6.9%) | 38 (9.4%) |
| $35,000 to $49,999 | 76 (18.7%) | 41 (10.2%) |
| $50,000 to $74,999 | 75 (18.5%) | 85 (21.1%) |
| $75,000 to $99,999 | 45 (11.1%) | 89 (22.1%) |
| $100,000 to $149,999 | 46 (11.3%) | 0 (0.0%) |
| $150,000 or more | 123 (30.3%) | 18 (4.5%) |
| Total | 406 (100.0%) | 403 (100.0%) |
Monthly Housing Cost Tiers in Ganado
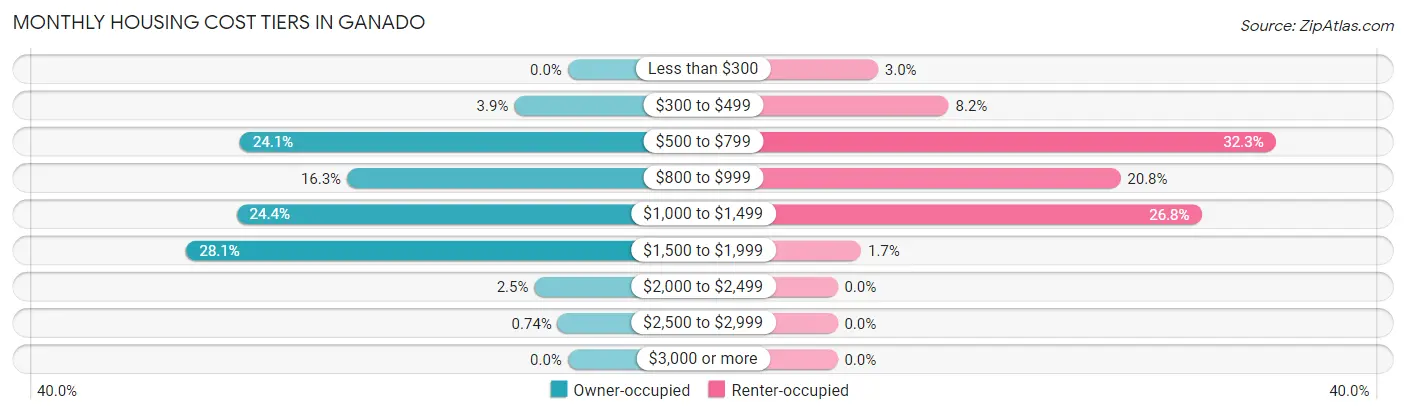
| Monthly Cost | Owner-occupied | Renter-occupied |
| Less than $300 | 0 (0.0%) | 12 (3.0%) |
| $300 to $499 | 16 (3.9%) | 33 (8.2%) |
| $500 to $799 | 98 (24.1%) | 130 (32.3%) |
| $800 to $999 | 66 (16.3%) | 84 (20.8%) |
| $1,000 to $1,499 | 99 (24.4%) | 108 (26.8%) |
| $1,500 to $1,999 | 114 (28.1%) | 7 (1.7%) |
| $2,000 to $2,499 | 10 (2.5%) | 0 (0.0%) |
| $2,500 to $2,999 | 3 (0.7%) | 0 (0.0%) |
| $3,000 or more | 0 (0.0%) | 0 (0.0%) |
| Total | 406 (100.0%) | 403 (100.0%) |
Physical Housing Characteristics in Ganado
Housing Structures in Ganado
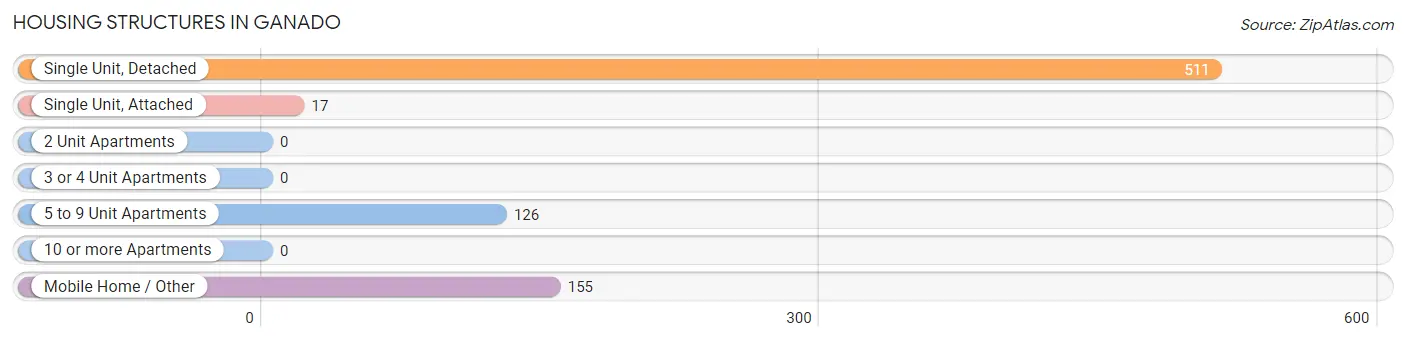
| Structure Type | # Housing Units | % Housing Units |
| Single Unit, Detached | 511 | 63.2% |
| Single Unit, Attached | 17 | 2.1% |
| 2 Unit Apartments | 0 | 0.0% |
| 3 or 4 Unit Apartments | 0 | 0.0% |
| 5 to 9 Unit Apartments | 126 | 15.6% |
| 10 or more Apartments | 0 | 0.0% |
| Mobile Home / Other | 155 | 19.2% |
| Total | 809 | 100.0% |
Housing Structures by Occupancy in Ganado
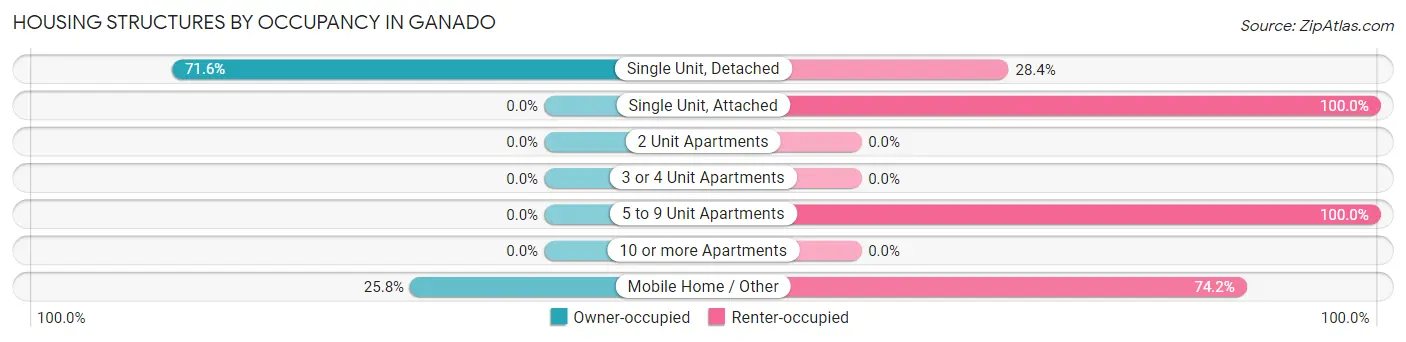
| Structure Type | Owner-occupied | Renter-occupied |
| Single Unit, Detached | 366 (71.6%) | 145 (28.4%) |
| Single Unit, Attached | 0 (0.0%) | 17 (100.0%) |
| 2 Unit Apartments | 0 (0.0%) | 0 (0.0%) |
| 3 or 4 Unit Apartments | 0 (0.0%) | 0 (0.0%) |
| 5 to 9 Unit Apartments | 0 (0.0%) | 126 (100.0%) |
| 10 or more Apartments | 0 (0.0%) | 0 (0.0%) |
| Mobile Home / Other | 40 (25.8%) | 115 (74.2%) |
| Total | 406 (50.2%) | 403 (49.8%) |
Housing Structures by Number of Rooms in Ganado
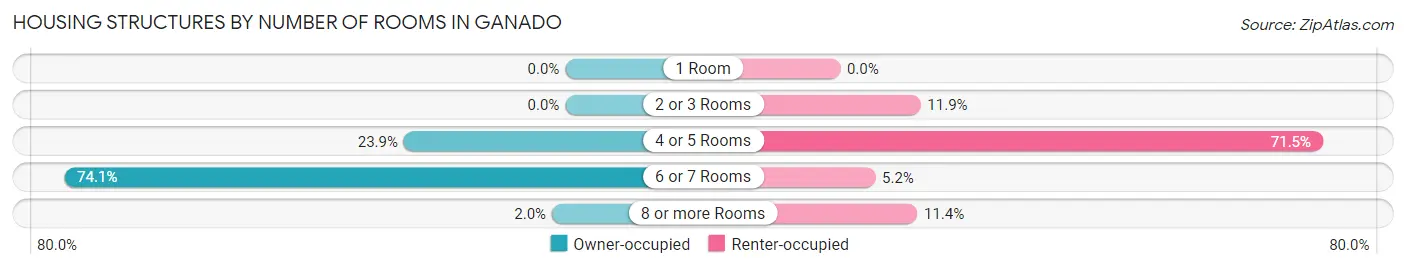
| Number of Rooms | Owner-occupied | Renter-occupied |
| 1 Room | 0 (0.0%) | 0 (0.0%) |
| 2 or 3 Rooms | 0 (0.0%) | 48 (11.9%) |
| 4 or 5 Rooms | 97 (23.9%) | 288 (71.5%) |
| 6 or 7 Rooms | 301 (74.1%) | 21 (5.2%) |
| 8 or more Rooms | 8 (2.0%) | 46 (11.4%) |
| Total | 406 (100.0%) | 403 (100.0%) |
Housing Structure by Heating Type in Ganado
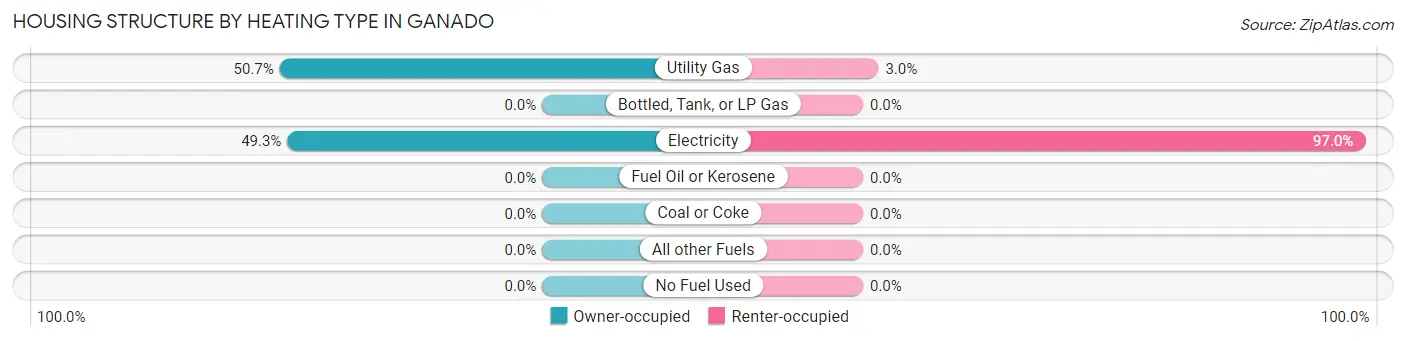
| Heating Type | Owner-occupied | Renter-occupied |
| Utility Gas | 206 (50.7%) | 12 (3.0%) |
| Bottled, Tank, or LP Gas | 0 (0.0%) | 0 (0.0%) |
| Electricity | 200 (49.3%) | 391 (97.0%) |
| Fuel Oil or Kerosene | 0 (0.0%) | 0 (0.0%) |
| Coal or Coke | 0 (0.0%) | 0 (0.0%) |
| All other Fuels | 0 (0.0%) | 0 (0.0%) |
| No Fuel Used | 0 (0.0%) | 0 (0.0%) |
| Total | 406 (100.0%) | 403 (100.0%) |
Household Vehicle Usage in Ganado
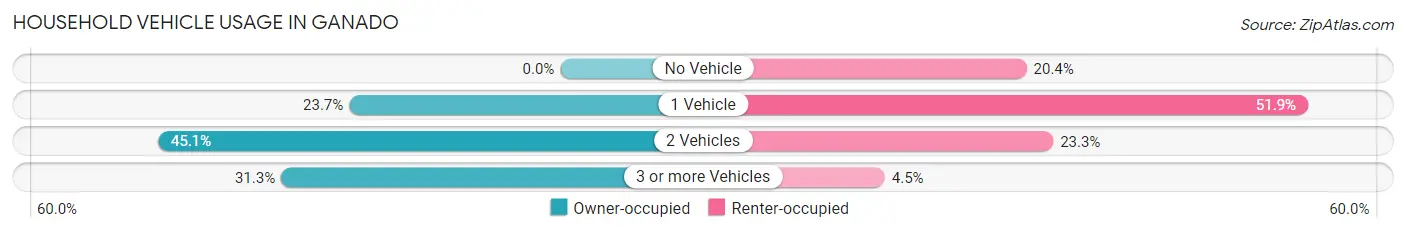
| Vehicles per Household | Owner-occupied | Renter-occupied |
| No Vehicle | 0 (0.0%) | 82 (20.3%) |
| 1 Vehicle | 96 (23.6%) | 209 (51.9%) |
| 2 Vehicles | 183 (45.1%) | 94 (23.3%) |
| 3 or more Vehicles | 127 (31.3%) | 18 (4.5%) |
| Total | 406 (100.0%) | 403 (100.0%) |
Real Estate & Mortgages in Ganado
Real Estate and Mortgage Overview in Ganado
| Characteristic | Without Mortgage | With Mortgage |
| Housing Units | 174 | 232 |
| Median Property Value | $205,300 | $198,400 |
| Median Household Income | $61,167 | $106 |
| Monthly Housing Costs | $597 | $0 |
| Real Estate Taxes | $1,939 | $0 |
Property Value by Mortgage Status in Ganado
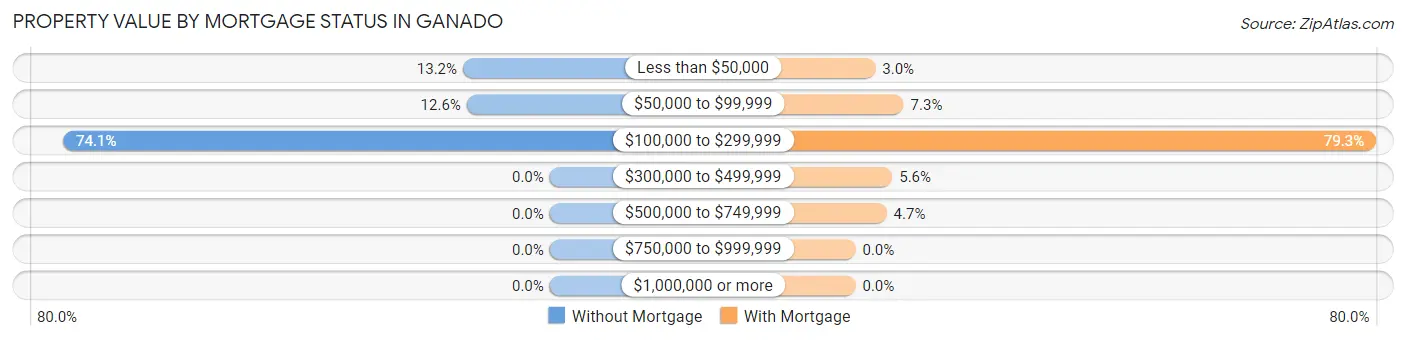
| Property Value | Without Mortgage | With Mortgage |
| Less than $50,000 | 23 (13.2%) | 7 (3.0%) |
| $50,000 to $99,999 | 22 (12.6%) | 17 (7.3%) |
| $100,000 to $299,999 | 129 (74.1%) | 184 (79.3%) |
| $300,000 to $499,999 | 0 (0.0%) | 13 (5.6%) |
| $500,000 to $749,999 | 0 (0.0%) | 11 (4.7%) |
| $750,000 to $999,999 | 0 (0.0%) | 0 (0.0%) |
| $1,000,000 or more | 0 (0.0%) | 0 (0.0%) |
| Total | 174 (100.0%) | 232 (100.0%) |
Household Income by Mortgage Status in Ganado
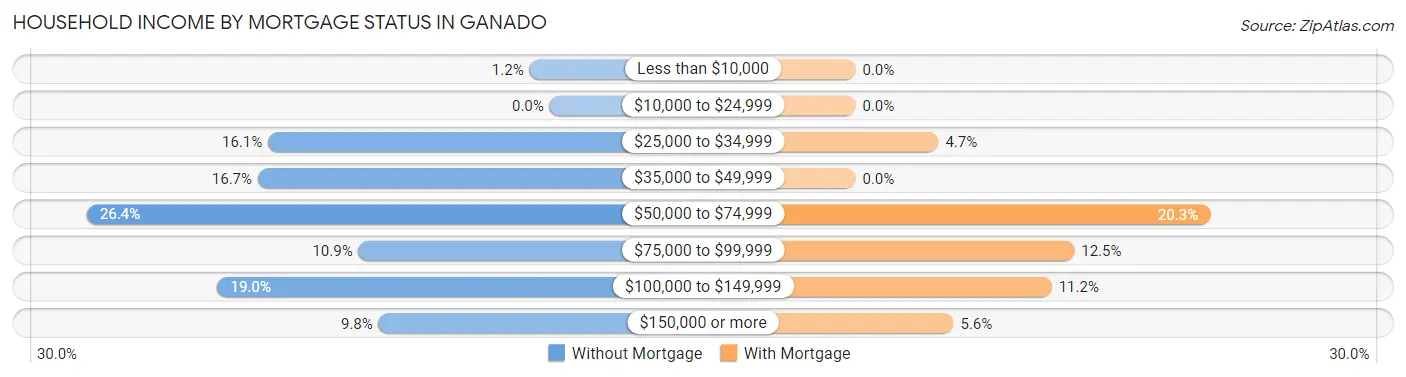
| Household Income | Without Mortgage | With Mortgage |
| Less than $10,000 | 2 (1.1%) | 0 (0.0%) |
| $10,000 to $24,999 | 0 (0.0%) | 0 (0.0%) |
| $25,000 to $34,999 | 28 (16.1%) | 11 (4.7%) |
| $35,000 to $49,999 | 29 (16.7%) | 0 (0.0%) |
| $50,000 to $74,999 | 46 (26.4%) | 47 (20.3%) |
| $75,000 to $99,999 | 19 (10.9%) | 29 (12.5%) |
| $100,000 to $149,999 | 33 (19.0%) | 26 (11.2%) |
| $150,000 or more | 17 (9.8%) | 13 (5.6%) |
| Total | 174 (100.0%) | 232 (100.0%) |
Property Value to Household Income Ratio in Ganado
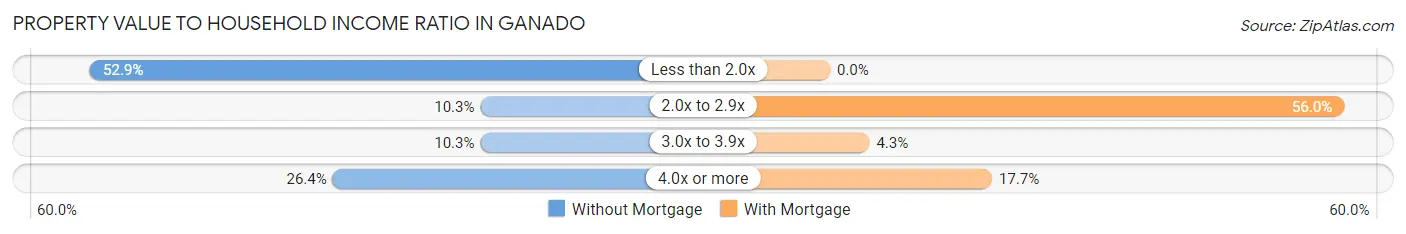
| Value-to-Income Ratio | Without Mortgage | With Mortgage |
| Less than 2.0x | 92 (52.9%) | 0 (0.0%) |
| 2.0x to 2.9x | 18 (10.3%) | 130 (56.0%) |
| 3.0x to 3.9x | 18 (10.3%) | 10 (4.3%) |
| 4.0x or more | 46 (26.4%) | 41 (17.7%) |
| Total | 174 (100.0%) | 232 (100.0%) |
Real Estate Taxes by Mortgage Status in Ganado
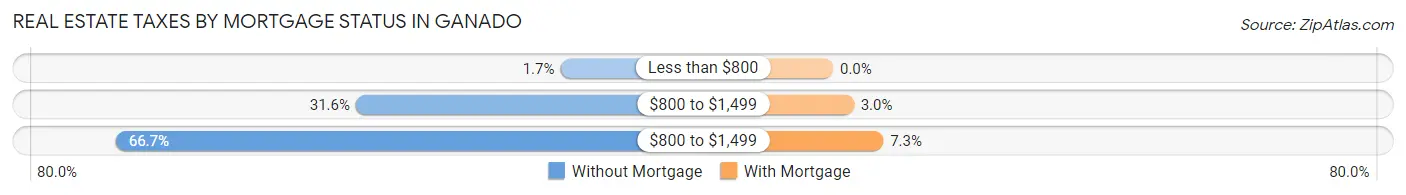
| Property Taxes | Without Mortgage | With Mortgage |
| Less than $800 | 3 (1.7%) | 0 (0.0%) |
| $800 to $1,499 | 55 (31.6%) | 7 (3.0%) |
| $800 to $1,499 | 116 (66.7%) | 17 (7.3%) |
| Total | 174 (100.0%) | 232 (100.0%) |
Health & Disability in Ganado
Health Insurance Coverage by Age in Ganado

| Age Bracket | With Coverage | Without Coverage |
| Under 6 Years | 238 (80.7%) | 57 (19.3%) |
| 6 to 18 Years | 329 (81.6%) | 74 (18.4%) |
| 19 to 25 Years | 186 (82.3%) | 40 (17.7%) |
| 26 to 34 Years | 224 (54.1%) | 190 (45.9%) |
| 35 to 44 Years | 277 (75.9%) | 88 (24.1%) |
| 45 to 54 Years | 109 (66.5%) | 55 (33.5%) |
| 55 to 64 Years | 191 (93.6%) | 13 (6.4%) |
| 65 to 74 Years | 62 (82.7%) | 13 (17.3%) |
| 75 Years and older | 118 (100.0%) | 0 (0.0%) |
| Total | 1,734 (76.6%) | 530 (23.4%) |
Health Insurance Coverage by Citizenship Status in Ganado
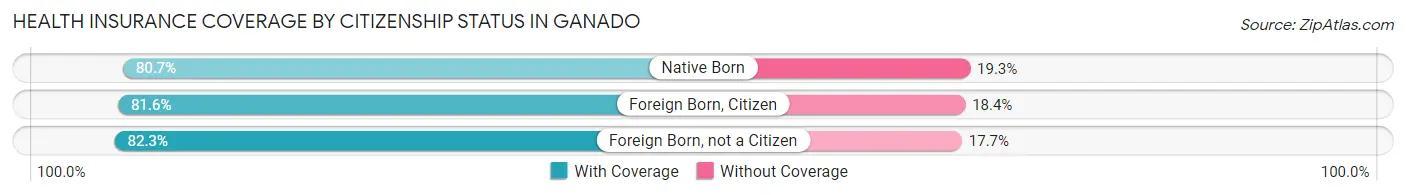
| Citizenship Status | With Coverage | Without Coverage |
| Native Born | 238 (80.7%) | 57 (19.3%) |
| Foreign Born, Citizen | 329 (81.6%) | 74 (18.4%) |
| Foreign Born, not a Citizen | 186 (82.3%) | 40 (17.7%) |
Health Insurance Coverage by Household Income in Ganado
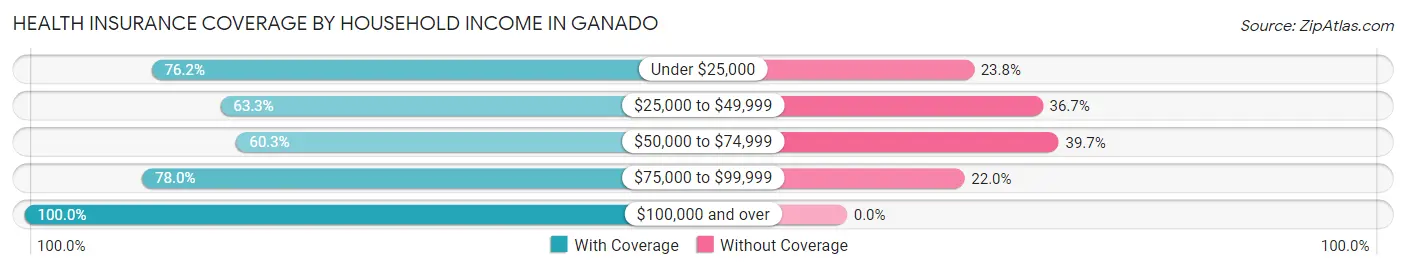
| Household Income | With Coverage | Without Coverage |
| Under $25,000 | 218 (76.2%) | 68 (23.8%) |
| $25,000 to $49,999 | 347 (63.3%) | 201 (36.7%) |
| $50,000 to $74,999 | 222 (60.3%) | 146 (39.7%) |
| $75,000 to $99,999 | 407 (78.0%) | 115 (22.0%) |
| $100,000 and over | 540 (100.0%) | 0 (0.0%) |
Public vs Private Health Insurance Coverage by Age in Ganado
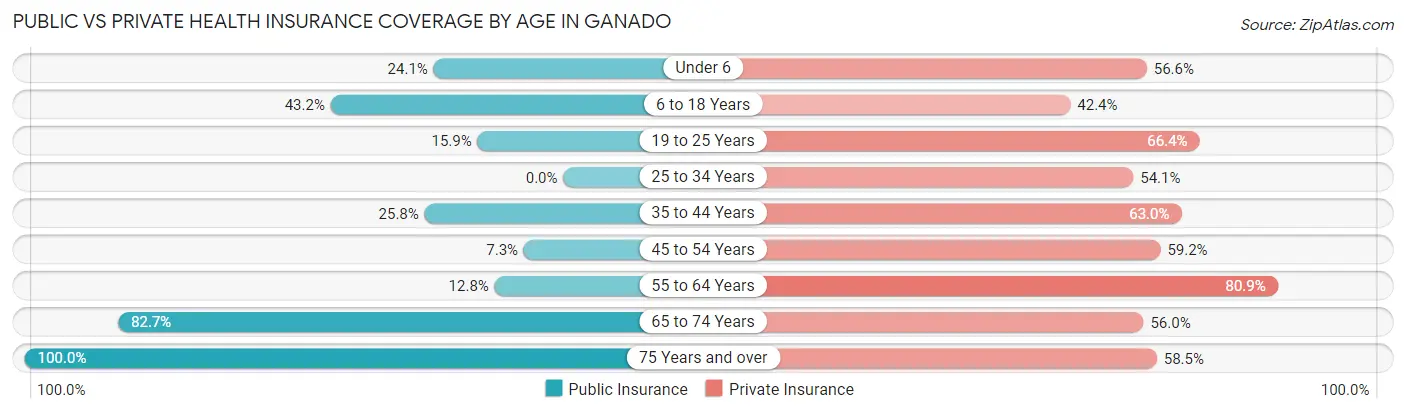
| Age Bracket | Public Insurance | Private Insurance |
| Under 6 | 71 (24.1%) | 167 (56.6%) |
| 6 to 18 Years | 174 (43.2%) | 171 (42.4%) |
| 19 to 25 Years | 36 (15.9%) | 150 (66.4%) |
| 25 to 34 Years | 0 (0.0%) | 224 (54.1%) |
| 35 to 44 Years | 94 (25.8%) | 230 (63.0%) |
| 45 to 54 Years | 12 (7.3%) | 97 (59.2%) |
| 55 to 64 Years | 26 (12.8%) | 165 (80.9%) |
| 65 to 74 Years | 62 (82.7%) | 42 (56.0%) |
| 75 Years and over | 118 (100.0%) | 69 (58.5%) |
| Total | 593 (26.2%) | 1,315 (58.1%) |
Disability Status by Sex by Age in Ganado
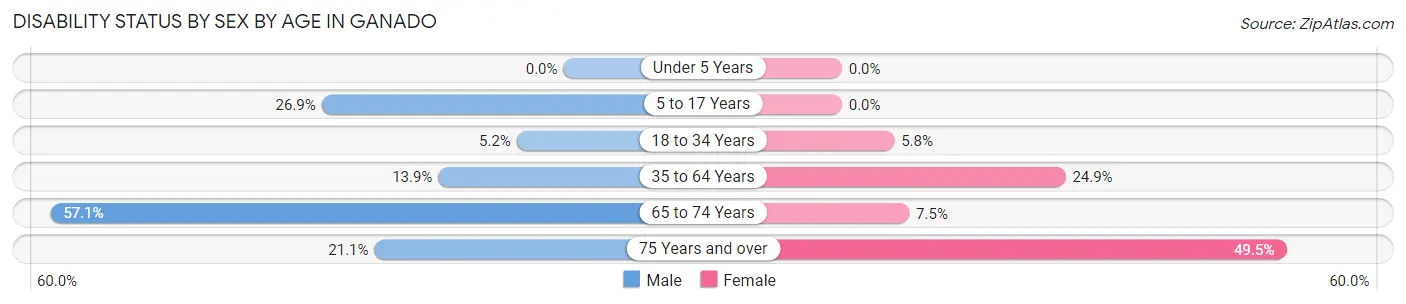
| Age Bracket | Male | Female |
| Under 5 Years | 0 (0.0%) | 0 (0.0%) |
| 5 to 17 Years | 14 (26.9%) | 0 (0.0%) |
| 18 to 34 Years | 21 (5.2%) | 16 (5.8%) |
| 35 to 64 Years | 63 (13.9%) | 70 (24.9%) |
| 65 to 74 Years | 20 (57.1%) | 3 (7.5%) |
| 75 Years and over | 4 (21.0%) | 49 (49.5%) |
Disability Class by Sex by Age in Ganado
Disability Class: Hearing Difficulty
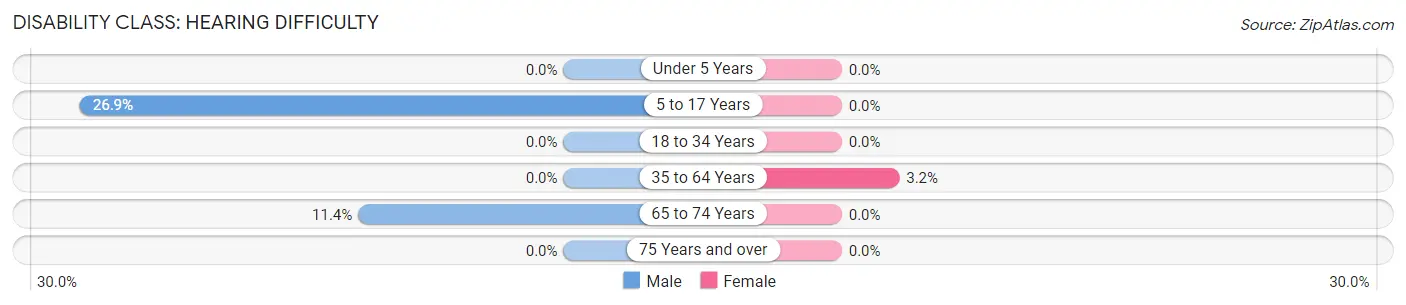
| Age Bracket | Male | Female |
| Under 5 Years | 0 (0.0%) | 0 (0.0%) |
| 5 to 17 Years | 14 (26.9%) | 0 (0.0%) |
| 18 to 34 Years | 0 (0.0%) | 0 (0.0%) |
| 35 to 64 Years | 0 (0.0%) | 9 (3.2%) |
| 65 to 74 Years | 4 (11.4%) | 0 (0.0%) |
| 75 Years and over | 0 (0.0%) | 0 (0.0%) |
Disability Class: Vision Difficulty
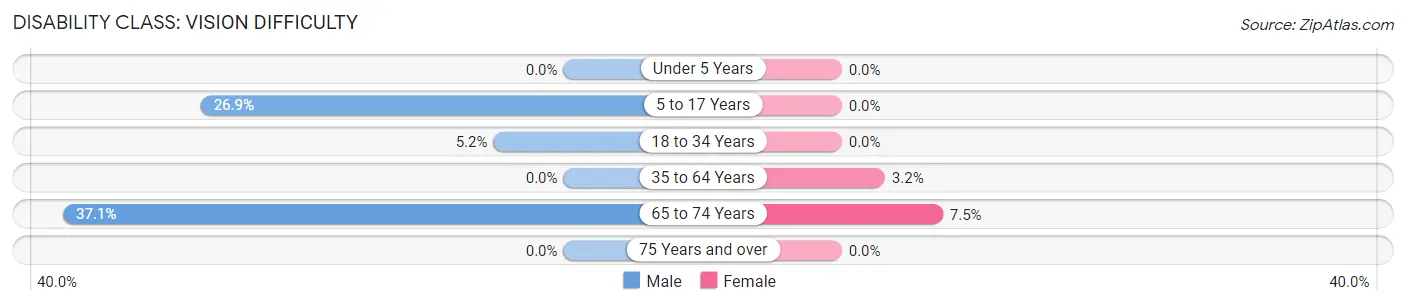
| Age Bracket | Male | Female |
| Under 5 Years | 0 (0.0%) | 0 (0.0%) |
| 5 to 17 Years | 14 (26.9%) | 0 (0.0%) |
| 18 to 34 Years | 21 (5.2%) | 0 (0.0%) |
| 35 to 64 Years | 0 (0.0%) | 9 (3.2%) |
| 65 to 74 Years | 13 (37.1%) | 3 (7.5%) |
| 75 Years and over | 0 (0.0%) | 0 (0.0%) |
Disability Class: Cognitive Difficulty
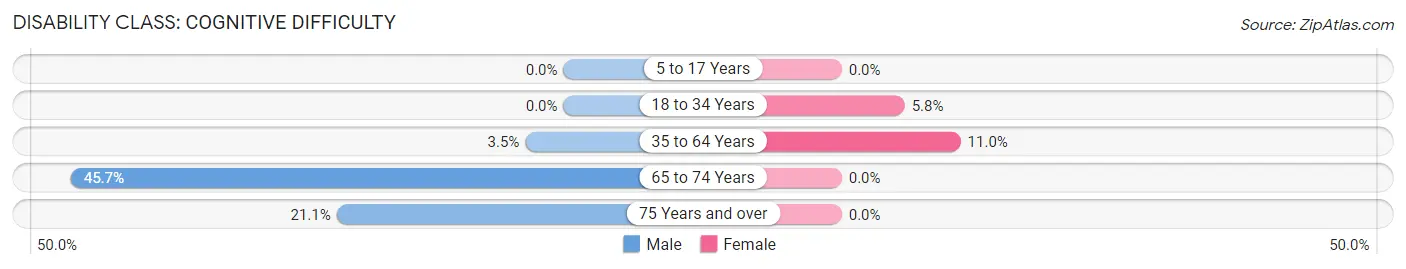
| Age Bracket | Male | Female |
| 5 to 17 Years | 0 (0.0%) | 0 (0.0%) |
| 18 to 34 Years | 0 (0.0%) | 16 (5.8%) |
| 35 to 64 Years | 16 (3.5%) | 31 (11.0%) |
| 65 to 74 Years | 16 (45.7%) | 0 (0.0%) |
| 75 Years and over | 4 (21.0%) | 0 (0.0%) |
Disability Class: Ambulatory Difficulty
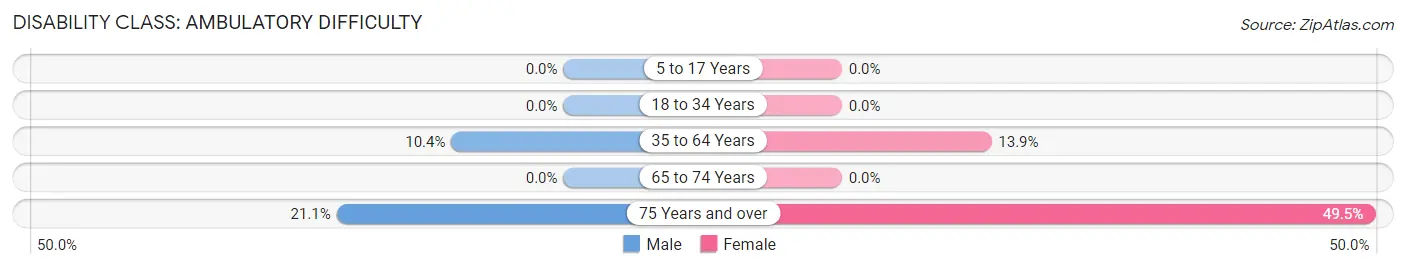
| Age Bracket | Male | Female |
| 5 to 17 Years | 0 (0.0%) | 0 (0.0%) |
| 18 to 34 Years | 0 (0.0%) | 0 (0.0%) |
| 35 to 64 Years | 47 (10.4%) | 39 (13.9%) |
| 65 to 74 Years | 0 (0.0%) | 0 (0.0%) |
| 75 Years and over | 4 (21.0%) | 49 (49.5%) |
Disability Class: Self-Care Difficulty
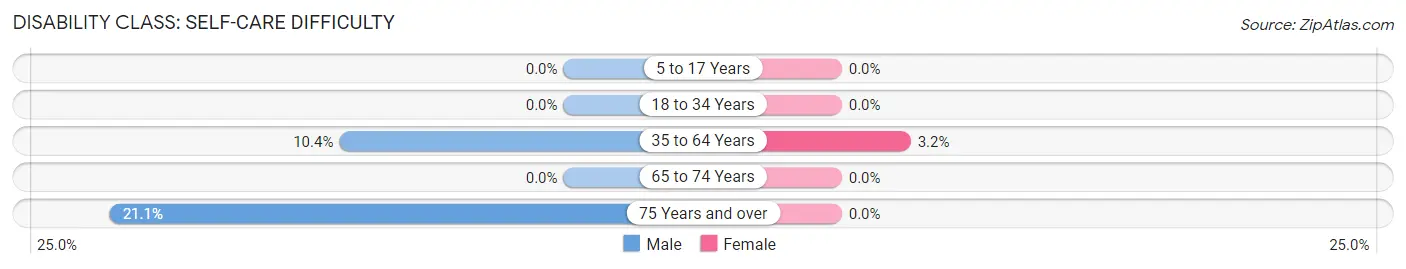
| Age Bracket | Male | Female |
| 5 to 17 Years | 0 (0.0%) | 0 (0.0%) |
| 18 to 34 Years | 0 (0.0%) | 0 (0.0%) |
| 35 to 64 Years | 47 (10.4%) | 9 (3.2%) |
| 65 to 74 Years | 0 (0.0%) | 0 (0.0%) |
| 75 Years and over | 4 (21.0%) | 0 (0.0%) |
Technology Access in Ganado
Computing Device Access in Ganado
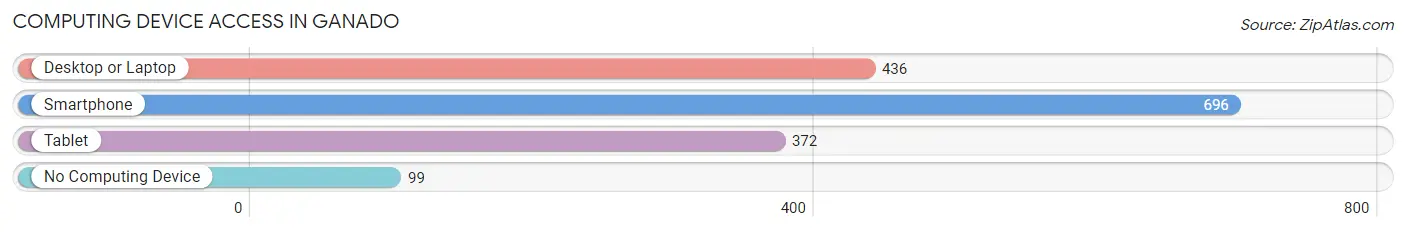
| Device Type | # Households | % Households |
| Desktop or Laptop | 436 | 53.9% |
| Smartphone | 696 | 86.0% |
| Tablet | 372 | 46.0% |
| No Computing Device | 99 | 12.2% |
| Total | 809 | 100.0% |
Internet Access in Ganado
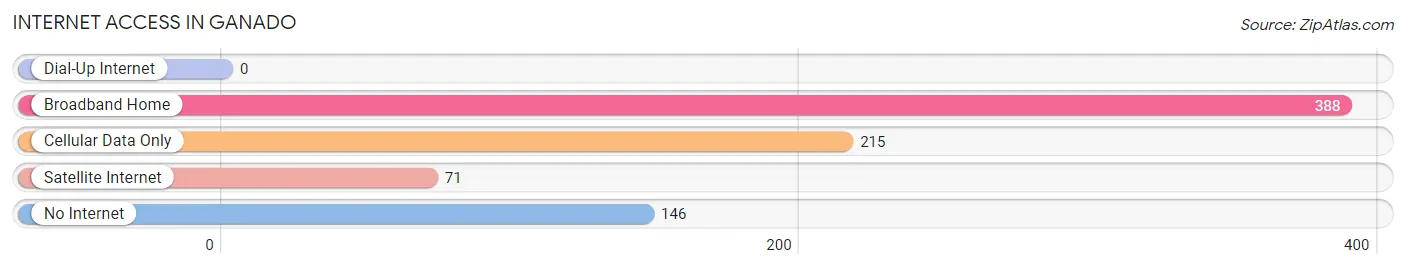
| Internet Type | # Households | % Households |
| Dial-Up Internet | 0 | 0.0% |
| Broadband Home | 388 | 48.0% |
| Cellular Data Only | 215 | 26.6% |
| Satellite Internet | 71 | 8.8% |
| No Internet | 146 | 18.0% |
| Total | 809 | 100.0% |
Ganado Summary
Ganado is a small town located in Jackson County, Texas, United States. It is situated on the banks of the Lavaca River, about 25 miles east of Victoria. The population was 1,205 at the 2010 census.
History
Ganado was founded in 1873 by a group of settlers from the Czech Republic. The town was named after the nearby Ganado Creek, which was named after the Spanish word for “herd”. The settlers were attracted to the area by the abundance of wild game and the fertile soil.
The town quickly grew and by 1876, it had a population of over 500. The town was incorporated in 1883 and the first mayor was elected in 1884.
In the late 19th century, Ganado was a thriving agricultural center. The town was home to several cotton gins, a grist mill, and a sawmill. The town also had a hotel, a bank, and several stores.
In the early 20th century, the town began to decline as the population shifted to larger cities. The Great Depression hit the town hard and many of the businesses closed.
Geography
Ganado is located at 28°45'25" North, 96°51'45" West (28.756944, -96.862500). The town is situated on the banks of the Lavaca River, about 25 miles east of Victoria.
The town has a total area of 1 2 square miles all of it land
Economy
The economy of Ganado is largely based on agriculture. The town is home to several farms and ranches, which produce cotton, corn, hay, and other crops.
The town also has several small businesses, including a grocery store, a hardware store, and a few restaurants.
Demographics
As of the 2010 census, there were 1,205 people, 441 households, and 315 families residing in the town. The population density was 1,000.7 people per square mile. The racial makeup of the town was 79.2% White, 0.3% African American, 0.2% Native American, 0.2% Asian, 0.1% Pacific Islander, 18.3% from other races, and 1.9% from two or more races. Hispanic or Latino of any race were 33.2% of the population.
There were 441 households, out of which 33.2% had children under the age of 18 living with them, 51.6% were married couples living together, 12.7% had a female householder with no husband present, and 30.2% were non-families. 25.7% of all households were made up of individuals, and 12.7% had someone living alone who was 65 years of age or older. The average household size was 2.72 and the average family size was 3.27.
In the town, the population was spread out, with 28.2% under the age of 18, 8.2% from 18 to 24, 25.2% from 25 to 44, 22.7% from 45 to 64, and 15.7% who were 65 years of age or older. The median age was 36 years. For every 100 females, there were 94.2 males. For every 100 females age 18 and over, there were 91.2 males.
The median income for a household in the town was $30,000, and the median income for a family was $35,000. Males had a median income of $27,500 versus $20,000 for females. The per capita income for the town was $14,845. About 15.2% of families and 17.7% of the population were below the poverty line, including 22.2% of those under age 18 and 15.2% of those age 65 or over.
Common Questions
What is Per Capita Income in Ganado?
Per Capita income in Ganado is $26,852.
What is the Median Family Income in Ganado?
Median Family Income in Ganado is $62,333.
What is the Median Household income in Ganado?
Median Household Income in Ganado is $55,938.
What is Income or Wage Gap in Ganado?
Income or Wage Gap in Ganado is 0.8%.
Women in Ganado earn 99.2 cents for every dollar earned by a man.
What is Inequality or Gini Index in Ganado?
Inequality or Gini Index in Ganado is 0.39.
What is the Total Population of Ganado?
Total Population of Ganado is 2,318.
What is the Total Male Population of Ganado?
Total Male Population of Ganado is 1,170.
What is the Total Female Population of Ganado?
Total Female Population of Ganado is 1,148.
What is the Ratio of Males per 100 Females in Ganado?
There are 101.92 Males per 100 Females in Ganado.
What is the Ratio of Females per 100 Males in Ganado?
There are 98.12 Females per 100 Males in Ganado.
What is the Median Population Age in Ganado?
Median Population Age in Ganado is 30.3 Years.
What is the Average Family Size in Ganado
Average Family Size in Ganado is 3.5 People.
What is the Average Household Size in Ganado
Average Household Size in Ganado is 2.8 People.
How Large is the Labor Force in Ganado?
There are 1,072 People in the Labor Forcein in Ganado.
What is the Percentage of People in the Labor Force in Ganado?
62.3% of People are in the Labor Force in Ganado.