Gainesville, TX Map & Demographics
Gainesville Map
Gainesville Overview
$25,016
PER CAPITA INCOME
$58,467
AVG FAMILY INCOME
$49,170
AVG HOUSEHOLD INCOME
32.3%
WAGE / INCOME GAP [ % ]
67.7¢/ $1
WAGE / INCOME GAP [ $ ]
$8,743
FAMILY INCOME DEFICIT
0.42
INEQUALITY / GINI INDEX
17,459
TOTAL POPULATION
8,561
MALE POPULATION
8,898
FEMALE POPULATION
96.21
MALES / 100 FEMALES
103.94
FEMALES / 100 MALES
34.8
MEDIAN AGE
3.1
AVG FAMILY SIZE
2.5
AVG HOUSEHOLD SIZE
8,623
LABOR FORCE [ PEOPLE ]
64.2%
PERCENT IN LABOR FORCE
6.1%
UNEMPLOYMENT RATE
Gainesville Area Codes
Income in Gainesville
Income Overview in Gainesville
Per Capita Income in Gainesville is $25,016, while median incomes of families and households are $58,467 and $49,170 respectively.
| Characteristic | Number | Measure |
| Per Capita Income | 17,459 | $25,016 |
| Median Family Income | 4,328 | $58,467 |
| Mean Family Income | 4,328 | $74,358 |
| Median Household Income | 6,792 | $49,170 |
| Mean Household Income | 6,792 | $63,633 |
| Income Deficit | 4,328 | $8,743 |
| Wage / Income Gap (%) | 17,459 | 32.28% |
| Wage / Income Gap ($) | 17,459 | 67.72¢ per $1 |
| Gini / Inequality Index | 17,459 | 0.42 |
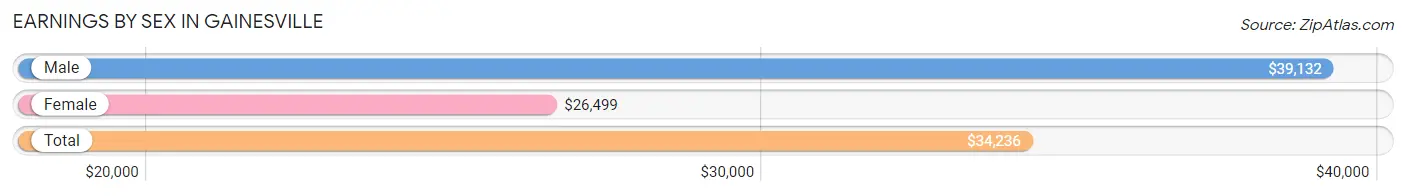
Earnings by Sex in Gainesville
Average Earnings in Gainesville are $34,236, $39,132 for men and $26,499 for women, a difference of 32.3%.
| Sex | Number | Average Earnings |
| Male | 4,847 (54.7%) | $39,132 |
| Female | 4,015 (45.3%) | $26,499 |
| Total | 8,862 (100.0%) | $34,236 |
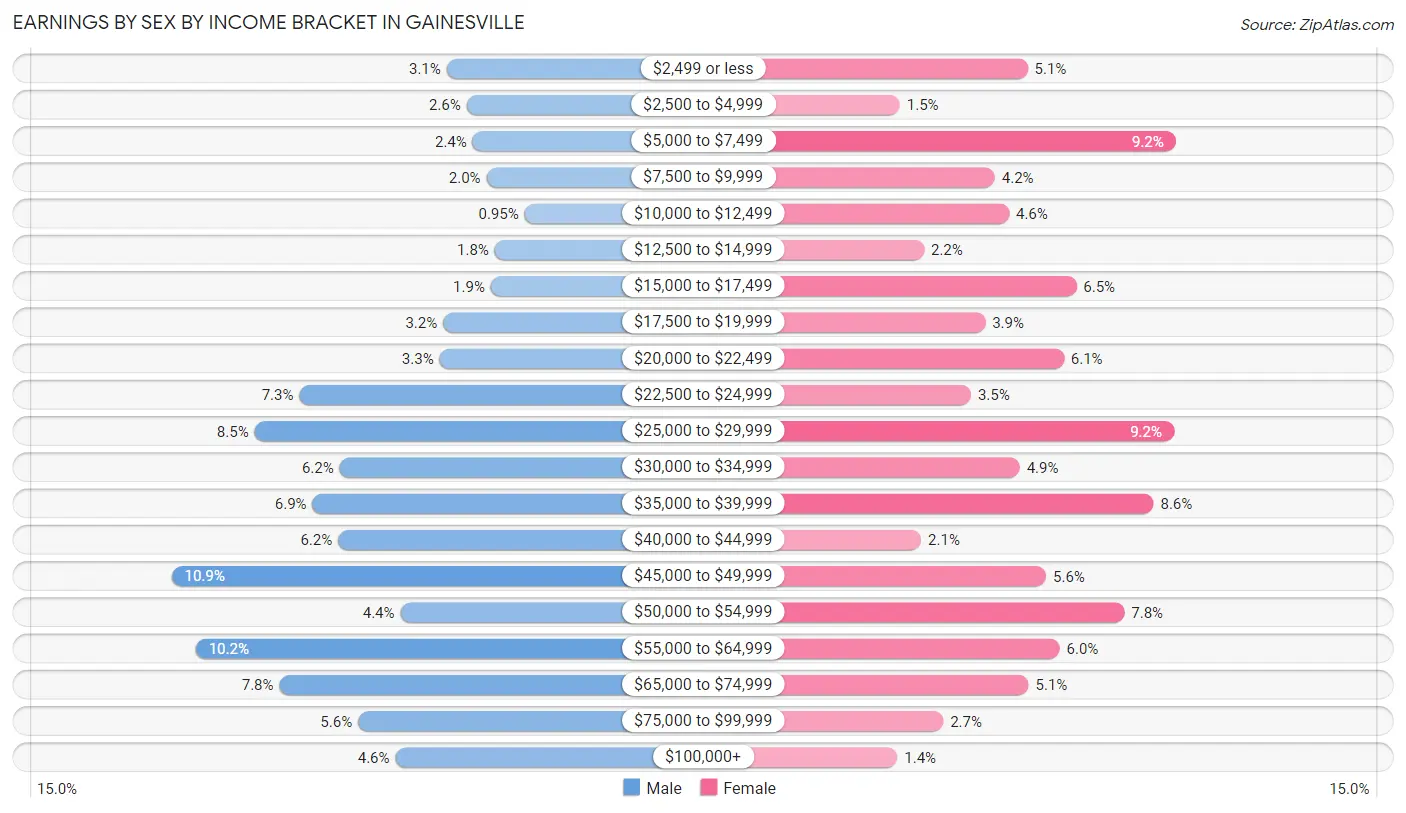
Earnings by Sex by Income Bracket in Gainesville
The most common earnings brackets in Gainesville are $45,000 to $49,999 for men (527 | 10.9%) and $5,000 to $7,499 for women (371 | 9.2%).
| Income | Male | Female |
| $2,499 or less | 152 (3.1%) | 204 (5.1%) |
| $2,500 to $4,999 | 125 (2.6%) | 60 (1.5%) |
| $5,000 to $7,499 | 117 (2.4%) | 371 (9.2%) |
| $7,500 to $9,999 | 98 (2.0%) | 167 (4.2%) |
| $10,000 to $12,499 | 46 (0.9%) | 183 (4.6%) |
| $12,500 to $14,999 | 87 (1.8%) | 87 (2.2%) |
| $15,000 to $17,499 | 92 (1.9%) | 259 (6.5%) |
| $17,500 to $19,999 | 157 (3.2%) | 156 (3.9%) |
| $20,000 to $22,499 | 162 (3.3%) | 245 (6.1%) |
| $22,500 to $24,999 | 353 (7.3%) | 140 (3.5%) |
| $25,000 to $29,999 | 414 (8.5%) | 369 (9.2%) |
| $30,000 to $34,999 | 298 (6.1%) | 195 (4.9%) |
| $35,000 to $39,999 | 335 (6.9%) | 346 (8.6%) |
| $40,000 to $44,999 | 300 (6.2%) | 84 (2.1%) |
| $45,000 to $49,999 | 527 (10.9%) | 225 (5.6%) |
| $50,000 to $54,999 | 215 (4.4%) | 313 (7.8%) |
| $55,000 to $64,999 | 494 (10.2%) | 240 (6.0%) |
| $65,000 to $74,999 | 380 (7.8%) | 205 (5.1%) |
| $75,000 to $99,999 | 273 (5.6%) | 109 (2.7%) |
| $100,000+ | 222 (4.6%) | 57 (1.4%) |
| Total | 4,847 (100.0%) | 4,015 (100.0%) |
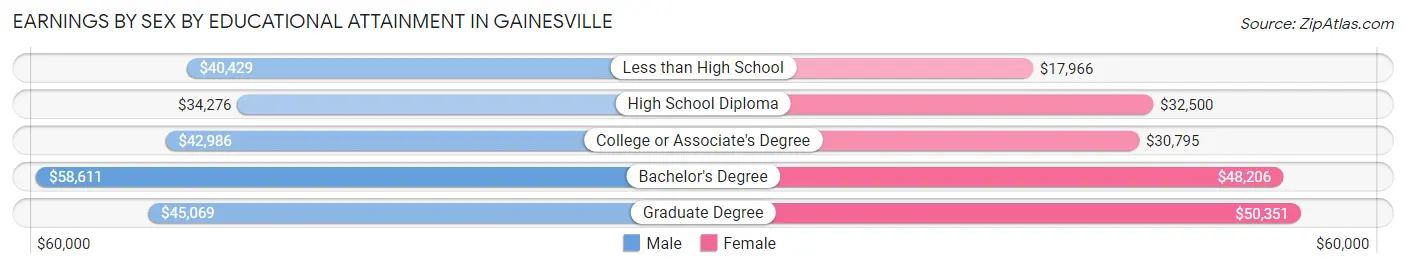
Earnings by Sex by Educational Attainment in Gainesville
Average earnings in Gainesville are $41,071 for men and $33,930 for women, a difference of 17.4%. Men with an educational attainment of bachelor's degree enjoy the highest average annual earnings of $58,611, while those with high school diploma education earn the least with $34,276. Women with an educational attainment of graduate degree earn the most with the average annual earnings of $50,351, while those with less than high school education have the smallest earnings of $17,966.
| Educational Attainment | Male Income | Female Income |
| Less than High School | $40,429 | $17,966 |
| High School Diploma | $34,276 | $32,500 |
| College or Associate's Degree | $42,986 | $30,795 |
| Bachelor's Degree | $58,611 | $48,206 |
| Graduate Degree | $45,069 | $50,351 |
| Total | $41,071 | $33,930 |
Family Income in Gainesville
Family Income Brackets in Gainesville
According to the Gainesville family income data, there are 909 families falling into the $50,000 to $74,999 income range, which is the most common income bracket and makes up 21.0% of all families. Conversely, the $10,000 to $14,999 income bracket is the least frequent group with only 117 families (2.7%) belonging to this category.
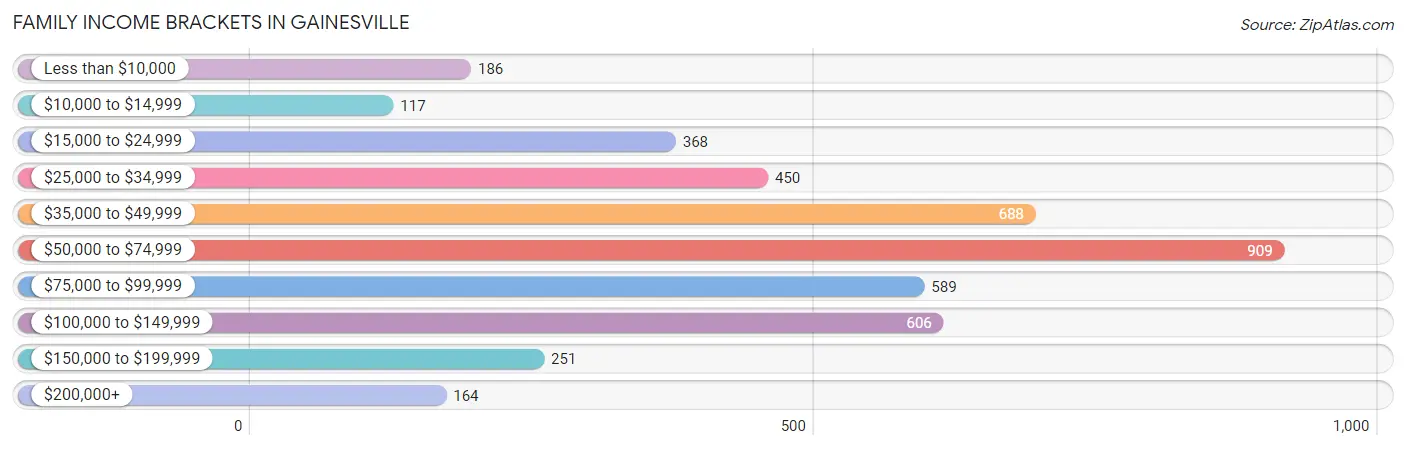
| Income Bracket | # Families | % Families |
| Less than $10,000 | 186 | 4.3% |
| $10,000 to $14,999 | 117 | 2.7% |
| $15,000 to $24,999 | 368 | 8.5% |
| $25,000 to $34,999 | 450 | 10.4% |
| $35,000 to $49,999 | 688 | 15.9% |
| $50,000 to $74,999 | 909 | 21.0% |
| $75,000 to $99,999 | 589 | 13.6% |
| $100,000 to $149,999 | 606 | 14.0% |
| $150,000 to $199,999 | 251 | 5.8% |
| $200,000+ | 164 | 3.8% |
Family Income by Famaliy Size in Gainesville
6-person families (124 | 2.9%) account for the highest median family income in Gainesville with $79,318 per family, while 2-person families (1,971 | 45.5%) have the highest median income of $29,220 per family member.
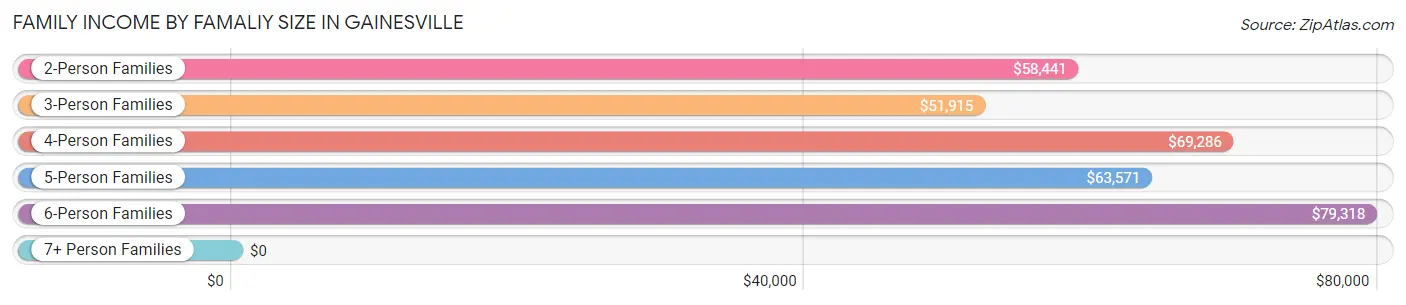
| Income Bracket | # Families | Median Income |
| 2-Person Families | 1,971 (45.5%) | $58,441 |
| 3-Person Families | 1,039 (24.0%) | $51,915 |
| 4-Person Families | 450 (10.4%) | $69,286 |
| 5-Person Families | 514 (11.9%) | $63,571 |
| 6-Person Families | 124 (2.9%) | $79,318 |
| 7+ Person Families | 230 (5.3%) | $0 |
| Total | 4,328 (100.0%) | $58,467 |
Family Income by Number of Earners in Gainesville
The median family income in Gainesville is $58,467, with families comprising 3+ earners (512) having the highest median family income of $135,581, while families with 1 earner (1,972) have the lowest median family income of $42,606, accounting for 11.8% and 45.6% of families, respectively.
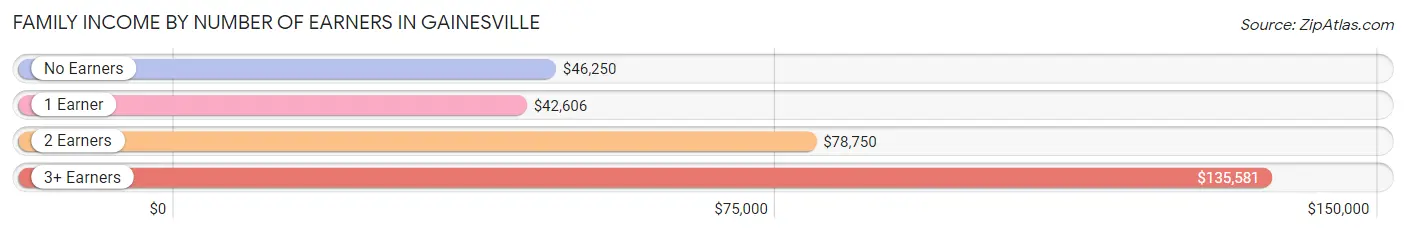
| Number of Earners | # Families | Median Income |
| No Earners | 561 (13.0%) | $46,250 |
| 1 Earner | 1,972 (45.6%) | $42,606 |
| 2 Earners | 1,283 (29.6%) | $78,750 |
| 3+ Earners | 512 (11.8%) | $135,581 |
| Total | 4,328 (100.0%) | $58,467 |
Household Income in Gainesville
Household Income Brackets in Gainesville
With 1,406 households falling in the category, the $50,000 to $74,999 income range is the most frequent in Gainesville, accounting for 20.7% of all households. In contrast, only 177 households (2.6%) fall into the $200,000+ income bracket, making it the least populous group.
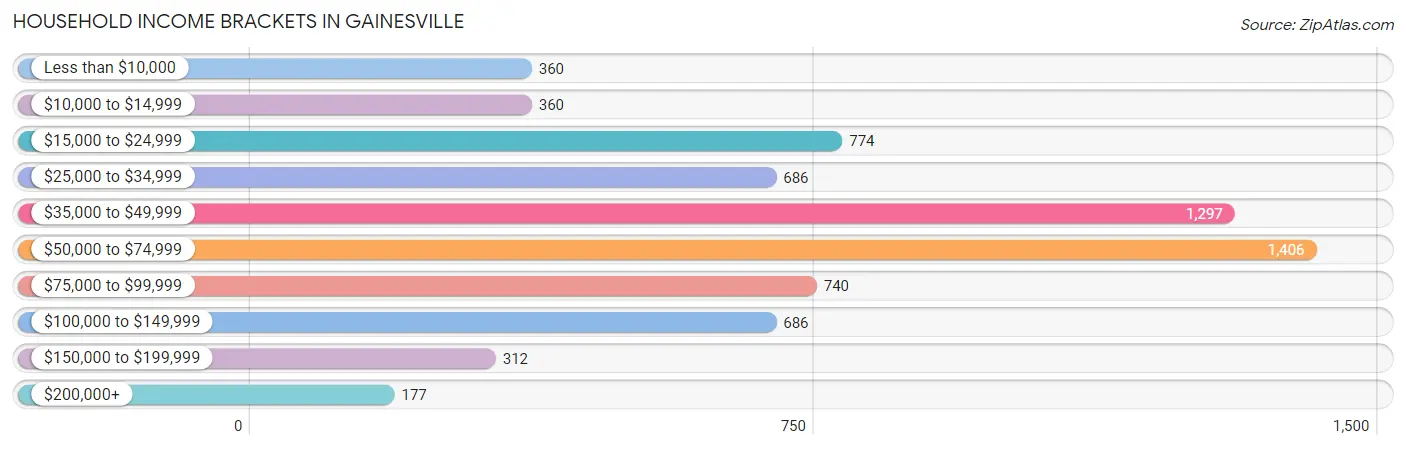
| Income Bracket | # Households | % Households |
| Less than $10,000 | 360 | 5.3% |
| $10,000 to $14,999 | 360 | 5.3% |
| $15,000 to $24,999 | 774 | 11.4% |
| $25,000 to $34,999 | 686 | 10.1% |
| $35,000 to $49,999 | 1,297 | 19.1% |
| $50,000 to $74,999 | 1,406 | 20.7% |
| $75,000 to $99,999 | 740 | 10.9% |
| $100,000 to $149,999 | 686 | 10.1% |
| $150,000 to $199,999 | 312 | 4.6% |
| $200,000+ | 177 | 2.6% |
Household Income by Householder Age in Gainesville
The median household income in Gainesville is $49,170, with the highest median household income of $58,623 found in the 45 to 64 years age bracket for the primary householder. A total of 2,179 households (32.1%) fall into this category. Meanwhile, the 25 to 44 years age bracket for the primary householder has the lowest median household income of $42,431, with 2,695 households (39.7%) in this group.
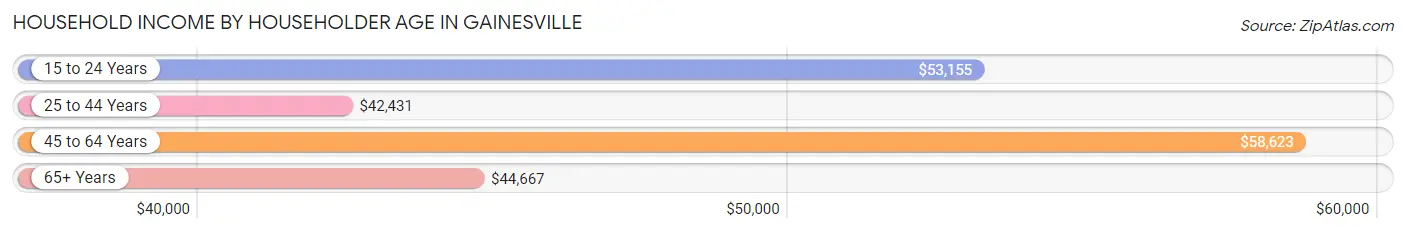
| Income Bracket | # Households | Median Income |
| 15 to 24 Years | 410 (6.0%) | $53,155 |
| 25 to 44 Years | 2,695 (39.7%) | $42,431 |
| 45 to 64 Years | 2,179 (32.1%) | $58,623 |
| 65+ Years | 1,508 (22.2%) | $44,667 |
| Total | 6,792 (100.0%) | $49,170 |
Poverty in Gainesville
Income Below Poverty by Sex and Age in Gainesville
With 20.4% poverty level for males and 23.1% for females among the residents of Gainesville, 16 and 17 year old males and 16 and 17 year old females are the most vulnerable to poverty, with 128 males (52.2%) and 143 females (67.1%) in their respective age groups living below the poverty level.
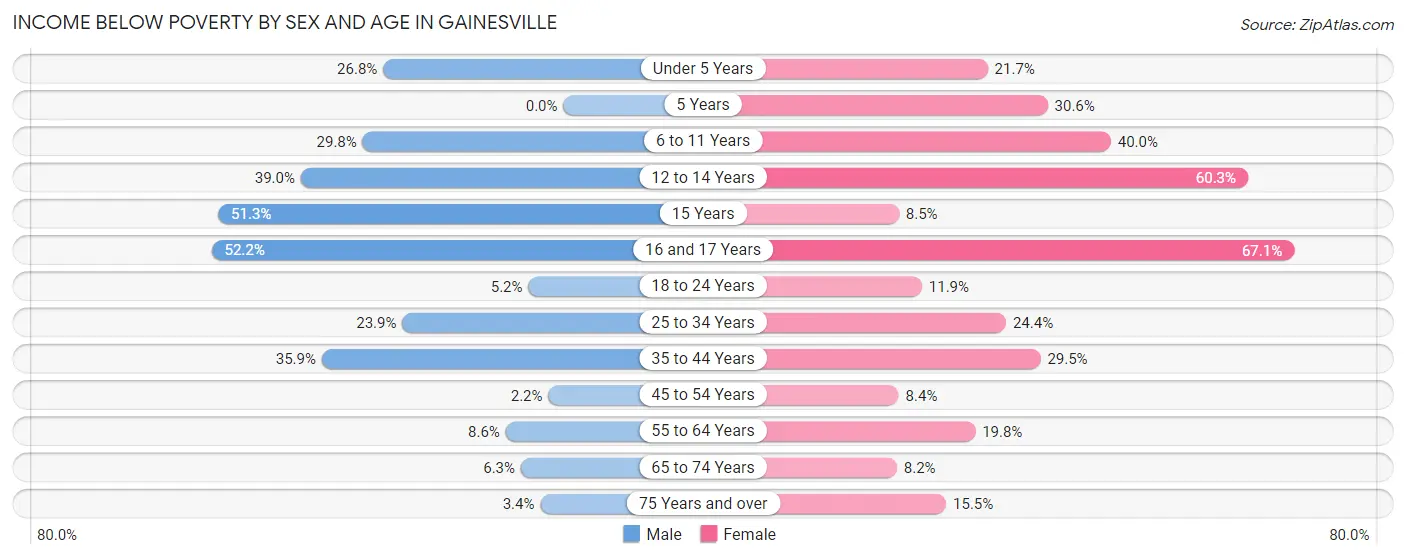
| Age Bracket | Male | Female |
| Under 5 Years | 186 (26.8%) | 128 (21.7%) |
| 5 Years | 0 (0.0%) | 33 (30.6%) |
| 6 to 11 Years | 231 (29.8%) | 310 (40.0%) |
| 12 to 14 Years | 177 (39.0%) | 164 (60.3%) |
| 15 Years | 81 (51.3%) | 5 (8.5%) |
| 16 and 17 Years | 128 (52.2%) | 143 (67.1%) |
| 18 to 24 Years | 45 (5.2%) | 109 (11.9%) |
| 25 to 34 Years | 235 (23.9%) | 352 (24.4%) |
| 35 to 44 Years | 467 (35.9%) | 321 (29.5%) |
| 45 to 54 Years | 19 (2.2%) | 68 (8.4%) |
| 55 to 64 Years | 76 (8.6%) | 186 (19.8%) |
| 65 to 74 Years | 46 (6.3%) | 56 (8.2%) |
| 75 Years and over | 13 (3.4%) | 105 (15.5%) |
| Total | 1,704 (20.4%) | 1,980 (23.1%) |
Income Above Poverty by Sex and Age in Gainesville
According to the poverty statistics in Gainesville, males aged 5 years and females aged 65 to 74 years are the age groups that are most secure financially, with 100.0% of males and 91.8% of females in these age groups living above the poverty line.
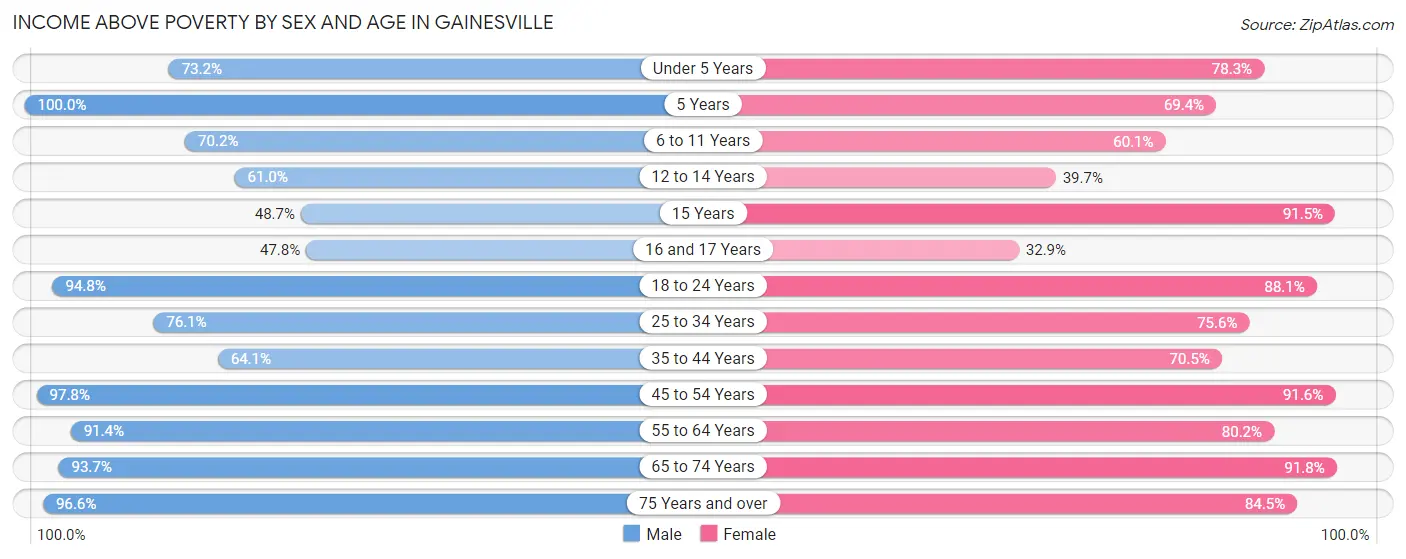
| Age Bracket | Male | Female |
| Under 5 Years | 509 (73.2%) | 463 (78.3%) |
| 5 Years | 30 (100.0%) | 75 (69.4%) |
| 6 to 11 Years | 544 (70.2%) | 466 (60.1%) |
| 12 to 14 Years | 277 (61.0%) | 108 (39.7%) |
| 15 Years | 77 (48.7%) | 54 (91.5%) |
| 16 and 17 Years | 117 (47.8%) | 70 (32.9%) |
| 18 to 24 Years | 820 (94.8%) | 808 (88.1%) |
| 25 to 34 Years | 748 (76.1%) | 1,092 (75.6%) |
| 35 to 44 Years | 835 (64.1%) | 767 (70.5%) |
| 45 to 54 Years | 833 (97.8%) | 738 (91.6%) |
| 55 to 64 Years | 811 (91.4%) | 753 (80.2%) |
| 65 to 74 Years | 683 (93.7%) | 629 (91.8%) |
| 75 Years and over | 367 (96.6%) | 573 (84.5%) |
| Total | 6,651 (79.6%) | 6,596 (76.9%) |
Income Below Poverty Among Married-Couple Families in Gainesville
The poverty statistics for married-couple families in Gainesville show that 10.8% or 324 of the total 2,987 families live below the poverty line. Families with 5 or more children have the highest poverty rate of 54.0%, comprising of 54 families. On the other hand, families with no children have the lowest poverty rate of 3.1%, which includes 46 families.
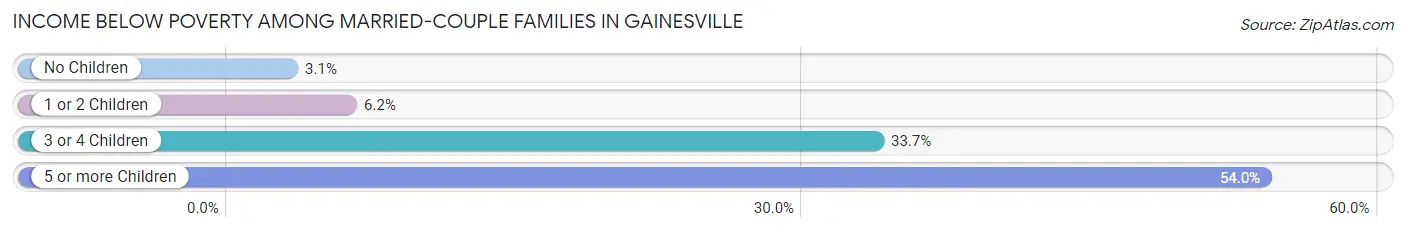
| Children | Above Poverty | Below Poverty |
| No Children | 1,417 (96.9%) | 46 (3.1%) |
| 1 or 2 Children | 874 (93.8%) | 58 (6.2%) |
| 3 or 4 Children | 326 (66.3%) | 166 (33.7%) |
| 5 or more Children | 46 (46.0%) | 54 (54.0%) |
| Total | 2,663 (89.1%) | 324 (10.8%) |
Income Below Poverty Among Single-Parent Households in Gainesville
According to the poverty data in Gainesville, 58.3% or 193 single-father households and 28.9% or 292 single-mother households are living below the poverty line. Among single-father households, those with 5 or more children have the highest poverty rate, with 13 households (100.0%) experiencing poverty. Likewise, among single-mother households, those with 3 or 4 children have the highest poverty rate, with 112 households (74.2%) falling below the poverty line.
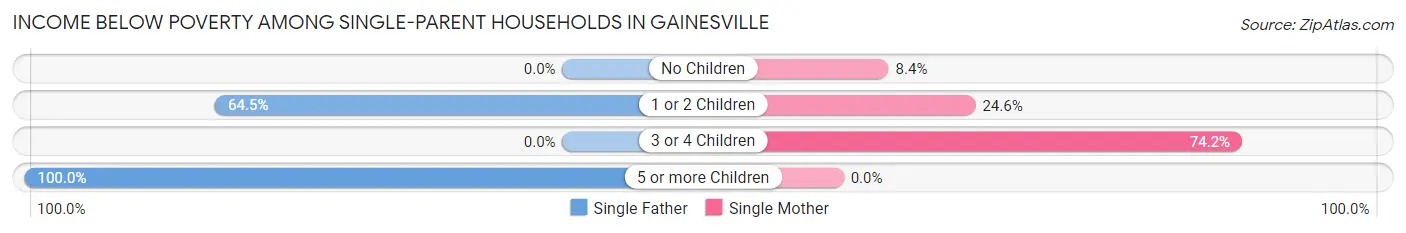
| Children | Single Father | Single Mother |
| No Children | 0 (0.0%) | 16 (8.4%) |
| 1 or 2 Children | 180 (64.5%) | 164 (24.5%) |
| 3 or 4 Children | 0 (0.0%) | 112 (74.2%) |
| 5 or more Children | 13 (100.0%) | 0 (0.0%) |
| Total | 193 (58.3%) | 292 (28.9%) |
Income Below Poverty Among Married-Couple vs Single-Parent Households in Gainesville
The poverty data for Gainesville shows that 324 of the married-couple family households (10.8%) and 485 of the single-parent households (36.2%) are living below the poverty level. Within the married-couple family households, those with 5 or more children have the highest poverty rate, with 54 households (54.0%) falling below the poverty line. Among the single-parent households, those with 5 or more children have the highest poverty rate, with 13 household (100.0%) living below poverty.
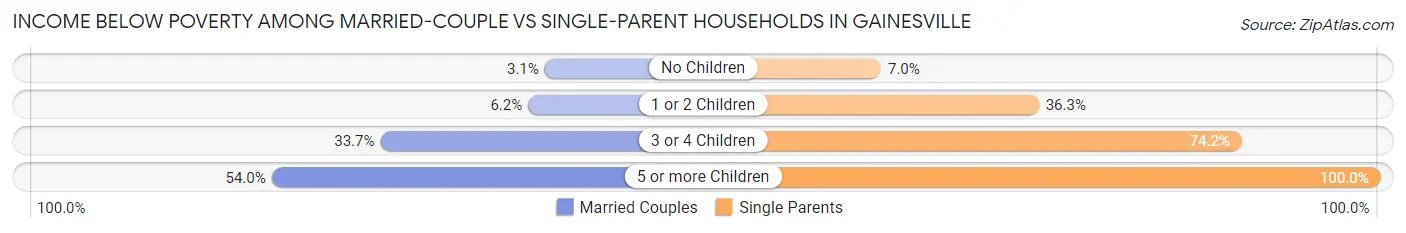
| Children | Married-Couple Families | Single-Parent Households |
| No Children | 46 (3.1%) | 16 (7.0%) |
| 1 or 2 Children | 58 (6.2%) | 344 (36.3%) |
| 3 or 4 Children | 166 (33.7%) | 112 (74.2%) |
| 5 or more Children | 54 (54.0%) | 13 (100.0%) |
| Total | 324 (10.8%) | 485 (36.2%) |
Race in Gainesville
The most populous races in Gainesville are White / Caucasian (12,962 | 74.2%), Hispanic or Latino (5,511 | 31.6%), and Two or more Races (2,180 | 12.5%).
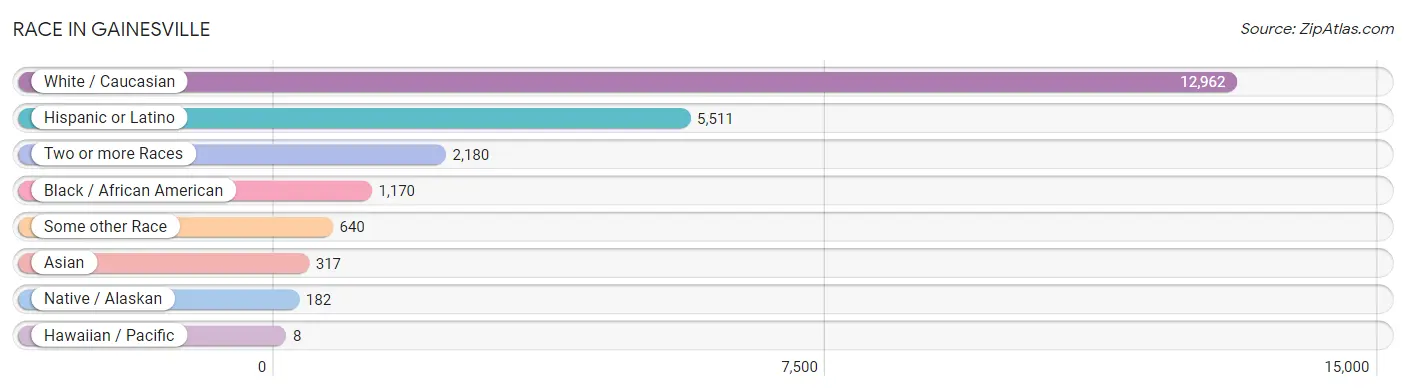
| Race | # Population | % Population |
| Asian | 317 | 1.8% |
| Black / African American | 1,170 | 6.7% |
| Hawaiian / Pacific | 8 | 0.1% |
| Hispanic or Latino | 5,511 | 31.6% |
| Native / Alaskan | 182 | 1.0% |
| White / Caucasian | 12,962 | 74.2% |
| Two or more Races | 2,180 | 12.5% |
| Some other Race | 640 | 3.7% |
| Total | 17,459 | 100.0% |
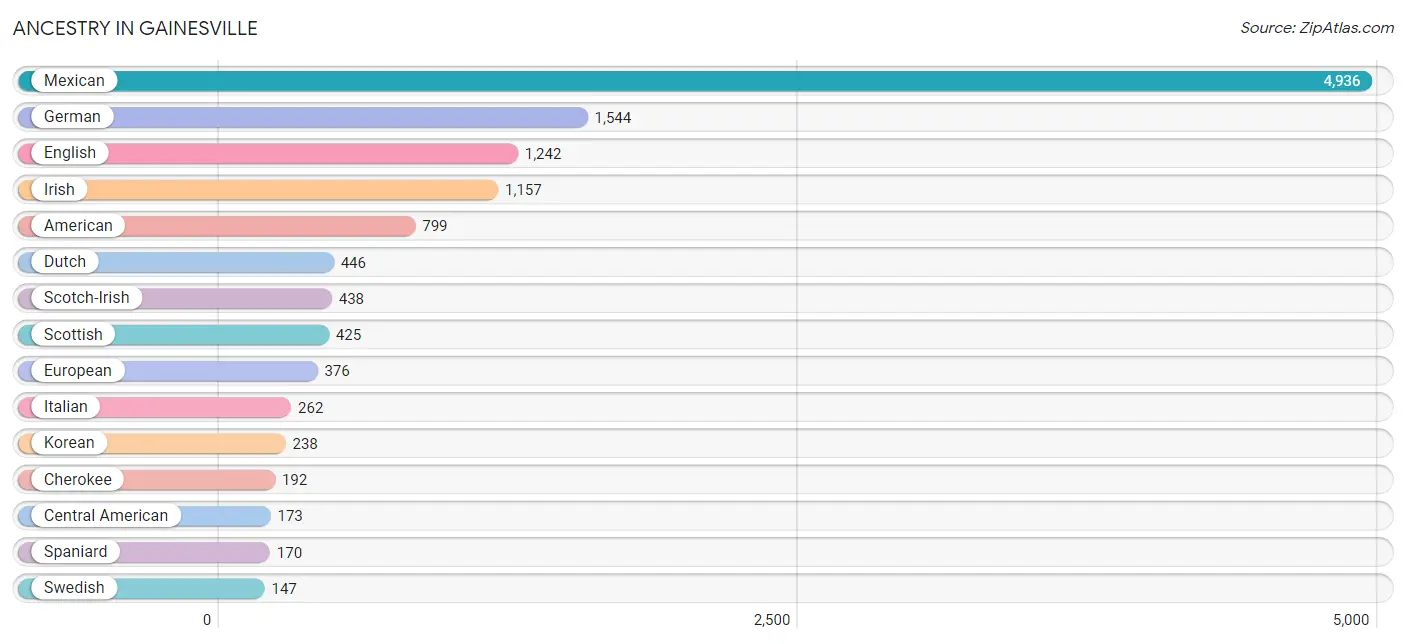
Ancestry in Gainesville
The most populous ancestries reported in Gainesville are Mexican (4,936 | 28.3%), German (1,544 | 8.8%), English (1,242 | 7.1%), Irish (1,157 | 6.6%), and American (799 | 4.6%), together accounting for 55.4% of all Gainesville residents.
| Ancestry | # Population | % Population |
| American | 799 | 4.6% |
| Apache | 31 | 0.2% |
| Austrian | 9 | 0.1% |
| Bhutanese | 11 | 0.1% |
| Blackfeet | 7 | 0.0% |
| British | 61 | 0.4% |
| Central American | 173 | 1.0% |
| Central American Indian | 61 | 0.4% |
| Cherokee | 192 | 1.1% |
| Chickasaw | 43 | 0.3% |
| Choctaw | 10 | 0.1% |
| Colombian | 17 | 0.1% |
| Comanche | 18 | 0.1% |
| Danish | 28 | 0.2% |
| Dutch | 446 | 2.5% |
| Eastern European | 33 | 0.2% |
| English | 1,242 | 7.1% |
| European | 376 | 2.1% |
| French | 112 | 0.6% |
| French American Indian | 15 | 0.1% |
| French Canadian | 19 | 0.1% |
| German | 1,544 | 8.8% |
| Greek | 36 | 0.2% |
| Guatemalan | 40 | 0.2% |
| Indian (Asian) | 12 | 0.1% |
| Irish | 1,157 | 6.6% |
| Italian | 262 | 1.5% |
| Japanese | 5 | 0.0% |
| Korean | 238 | 1.4% |
| Macedonian | 5 | 0.0% |
| Mexican | 4,936 | 28.3% |
| Mexican American Indian | 61 | 0.4% |
| Norwegian | 55 | 0.3% |
| Pennsylvania German | 19 | 0.1% |
| Polish | 131 | 0.7% |
| Puerto Rican | 102 | 0.6% |
| Romanian | 11 | 0.1% |
| Russian | 68 | 0.4% |
| Salvadoran | 133 | 0.8% |
| Scandinavian | 29 | 0.2% |
| Scotch-Irish | 438 | 2.5% |
| Scottish | 425 | 2.4% |
| South American | 34 | 0.2% |
| Spaniard | 170 | 1.0% |
| Spanish | 22 | 0.1% |
| Sri Lankan | 22 | 0.1% |
| Swedish | 147 | 0.8% |
| Swiss | 28 | 0.2% |
| Thai | 139 | 0.8% |
| Ukrainian | 99 | 0.6% |
| Venezuelan | 17 | 0.1% |
| Welsh | 46 | 0.3% | View All 52 Rows |
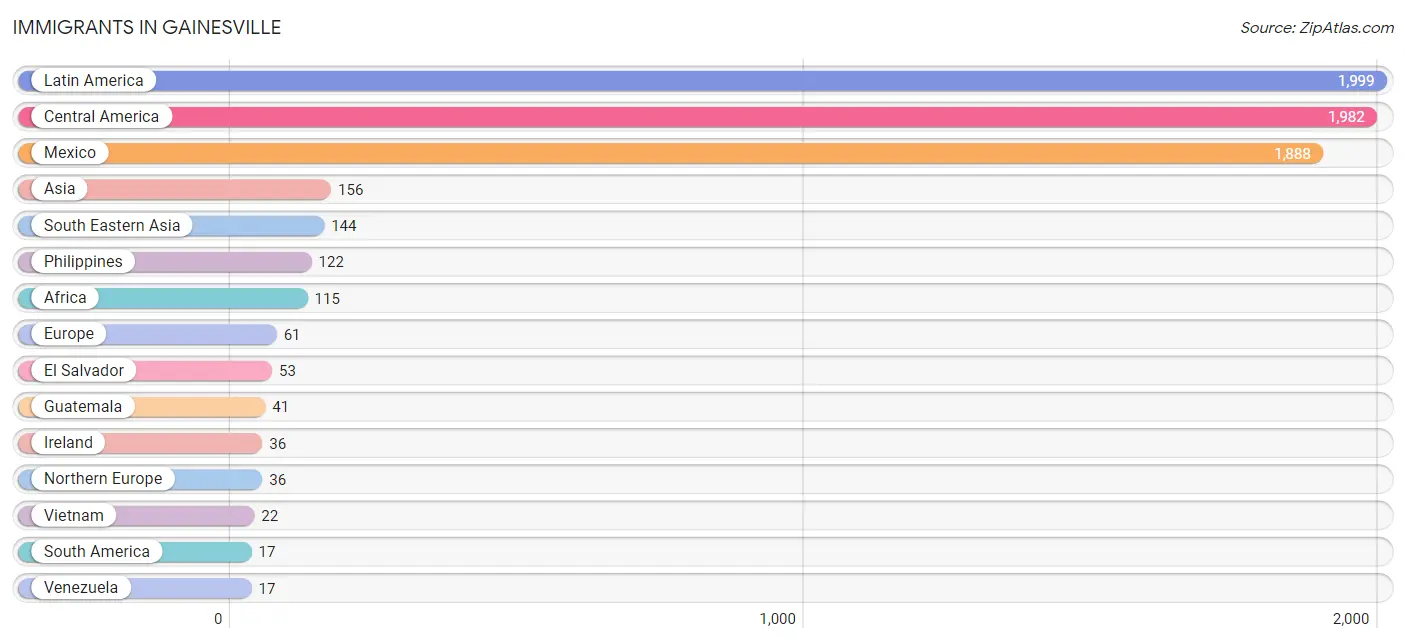
Immigrants in Gainesville
The most numerous immigrant groups reported in Gainesville came from Latin America (1,999 | 11.5%), Central America (1,982 | 11.4%), Mexico (1,888 | 10.8%), Asia (156 | 0.9%), and South Eastern Asia (144 | 0.8%), together accounting for 35.3% of all Gainesville residents.
| Immigration Origin | # Population | % Population |
| Africa | 115 | 0.7% |
| Asia | 156 | 0.9% |
| Central America | 1,982 | 11.4% |
| China | 12 | 0.1% |
| Eastern Asia | 12 | 0.1% |
| Eastern Europe | 11 | 0.1% |
| El Salvador | 53 | 0.3% |
| Europe | 61 | 0.4% |
| Germany | 14 | 0.1% |
| Guatemala | 41 | 0.2% |
| Hong Kong | 12 | 0.1% |
| Ireland | 36 | 0.2% |
| Latin America | 1,999 | 11.5% |
| Mexico | 1,888 | 10.8% |
| Northern Europe | 36 | 0.2% |
| Philippines | 122 | 0.7% |
| Romania | 11 | 0.1% |
| South Africa | 8 | 0.1% |
| South America | 17 | 0.1% |
| South Eastern Asia | 144 | 0.8% |
| Venezuela | 17 | 0.1% |
| Vietnam | 22 | 0.1% |
| Western Europe | 14 | 0.1% | View All 23 Rows |
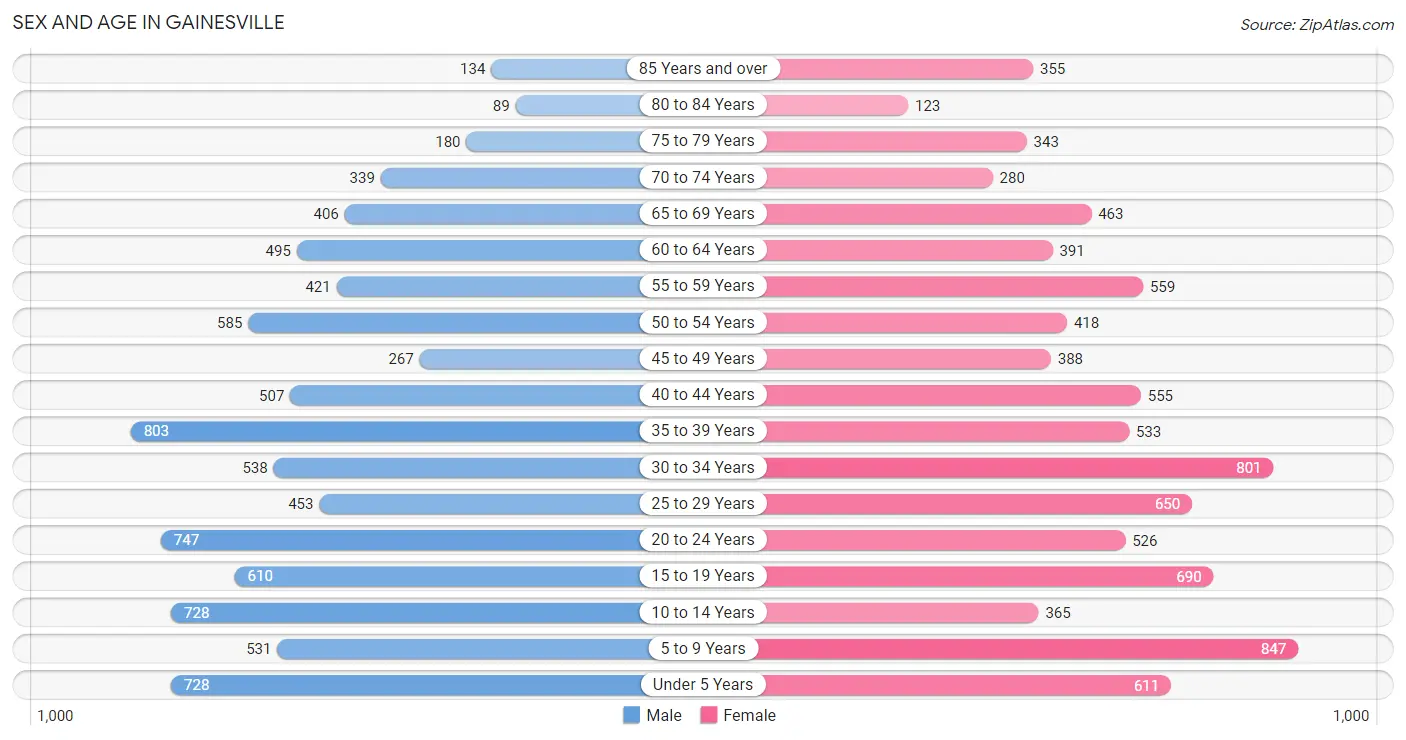
Sex and Age in Gainesville
Sex and Age in Gainesville
The most populous age groups in Gainesville are 35 to 39 Years (803 | 9.4%) for men and 5 to 9 Years (847 | 9.5%) for women.
| Age Bracket | Male | Female |
| Under 5 Years | 728 (8.5%) | 611 (6.9%) |
| 5 to 9 Years | 531 (6.2%) | 847 (9.5%) |
| 10 to 14 Years | 728 (8.5%) | 365 (4.1%) |
| 15 to 19 Years | 610 (7.1%) | 690 (7.7%) |
| 20 to 24 Years | 747 (8.7%) | 526 (5.9%) |
| 25 to 29 Years | 453 (5.3%) | 650 (7.3%) |
| 30 to 34 Years | 538 (6.3%) | 801 (9.0%) |
| 35 to 39 Years | 803 (9.4%) | 533 (6.0%) |
| 40 to 44 Years | 507 (5.9%) | 555 (6.2%) |
| 45 to 49 Years | 267 (3.1%) | 388 (4.4%) |
| 50 to 54 Years | 585 (6.8%) | 418 (4.7%) |
| 55 to 59 Years | 421 (4.9%) | 559 (6.3%) |
| 60 to 64 Years | 495 (5.8%) | 391 (4.4%) |
| 65 to 69 Years | 406 (4.7%) | 463 (5.2%) |
| 70 to 74 Years | 339 (4.0%) | 280 (3.2%) |
| 75 to 79 Years | 180 (2.1%) | 343 (3.8%) |
| 80 to 84 Years | 89 (1.0%) | 123 (1.4%) |
| 85 Years and over | 134 (1.6%) | 355 (4.0%) |
| Total | 8,561 (100.0%) | 8,898 (100.0%) |
Families and Households in Gainesville
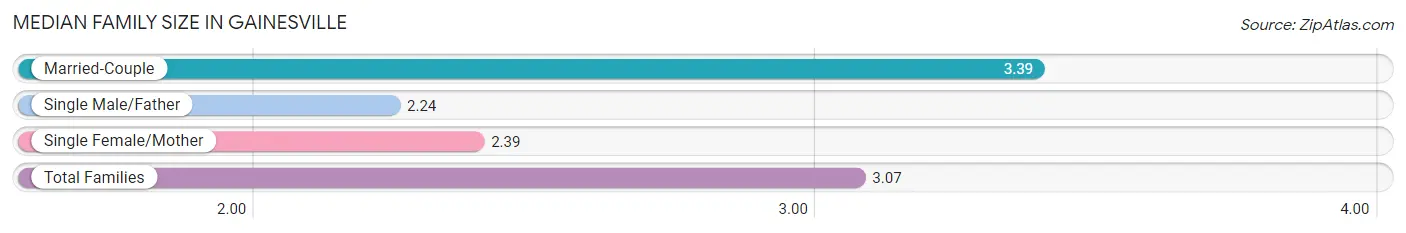
Median Family Size in Gainesville
The median family size in Gainesville is 3.07 persons per family, with married-couple families (2,987 | 69.0%) accounting for the largest median family size of 3.39 persons per family. On the other hand, single male/father families (331 | 7.6%) represent the smallest median family size with 2.24 persons per family.
| Family Type | # Families | Family Size |
| Married-Couple | 2,987 (69.0%) | 3.39 |
| Single Male/Father | 331 (7.6%) | 2.24 |
| Single Female/Mother | 1,010 (23.3%) | 2.39 |
| Total Families | 4,328 (100.0%) | 3.07 |
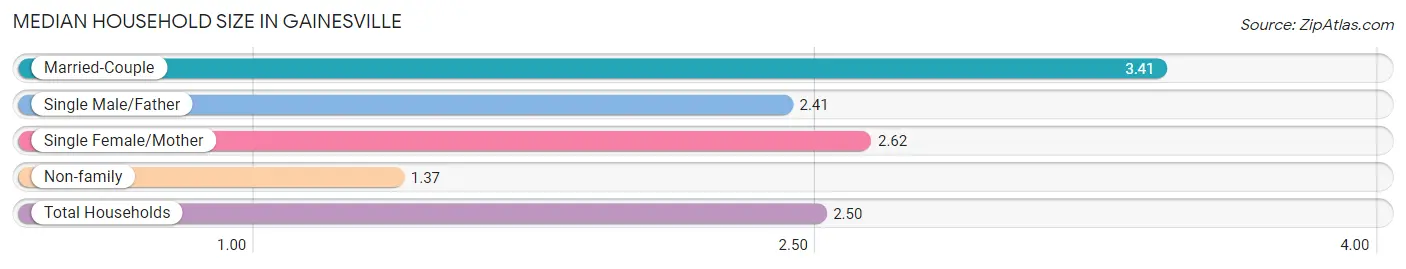
Median Household Size in Gainesville
The median household size in Gainesville is 2.50 persons per household, with married-couple households (2,987 | 44.0%) accounting for the largest median household size of 3.41 persons per household. non-family households (2,464 | 36.3%) represent the smallest median household size with 1.37 persons per household.
| Household Type | # Households | Household Size |
| Married-Couple | 2,987 (44.0%) | 3.41 |
| Single Male/Father | 331 (4.9%) | 2.41 |
| Single Female/Mother | 1,010 (14.9%) | 2.62 |
| Non-family | 2,464 (36.3%) | 1.37 |
| Total Households | 6,792 (100.0%) | 2.50 |
Household Size by Marriage Status in Gainesville
Out of a total of 6,792 households in Gainesville, 4,328 (63.7%) are family households, while 2,464 (36.3%) are nonfamily households. The most numerous type of family households are 2-person households, comprising 1,669, and the most common type of nonfamily households are 1-person households, comprising 1,928.
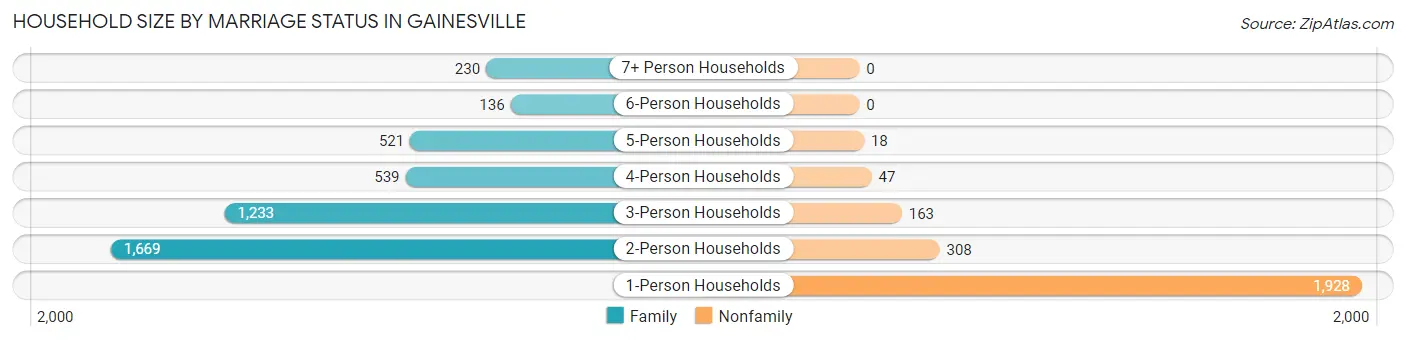
| Household Size | Family Households | Nonfamily Households |
| 1-Person Households | - | 1,928 (28.4%) |
| 2-Person Households | 1,669 (24.6%) | 308 (4.5%) |
| 3-Person Households | 1,233 (18.1%) | 163 (2.4%) |
| 4-Person Households | 539 (7.9%) | 47 (0.7%) |
| 5-Person Households | 521 (7.7%) | 18 (0.3%) |
| 6-Person Households | 136 (2.0%) | 0 (0.0%) |
| 7+ Person Households | 230 (3.4%) | 0 (0.0%) |
| Total | 4,328 (63.7%) | 2,464 (36.3%) |
Female Fertility in Gainesville
Fertility by Age in Gainesville
Average fertility rate in Gainesville is 86.0 births per 1,000 women. Women in the age bracket of 20 to 34 years have the highest fertility rate with 153.0 births per 1,000 women. Women in the age bracket of 20 to 34 years acount for 84.4% of all women with births.
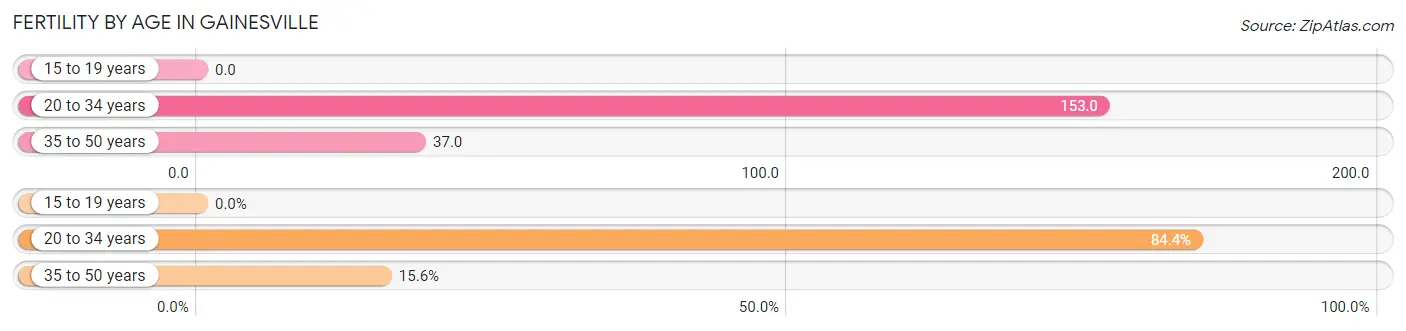
| Age Bracket | Women with Births | Births / 1,000 Women |
| 15 to 19 years | 0 (0.0%) | 0.0 |
| 20 to 34 years | 303 (84.4%) | 153.0 |
| 35 to 50 years | 56 (15.6%) | 37.0 |
| Total | 359 (100.0%) | 86.0 |
Fertility by Age by Marriage Status in Gainesville
51.3% of women with births (359) in Gainesville are married. The highest percentage of unmarried women with births falls into 20 to 34 years age bracket with 57.8% of them unmarried at the time of birth, while the lowest percentage of unmarried women with births belong to 35 to 50 years age bracket with 0.0% of them unmarried.
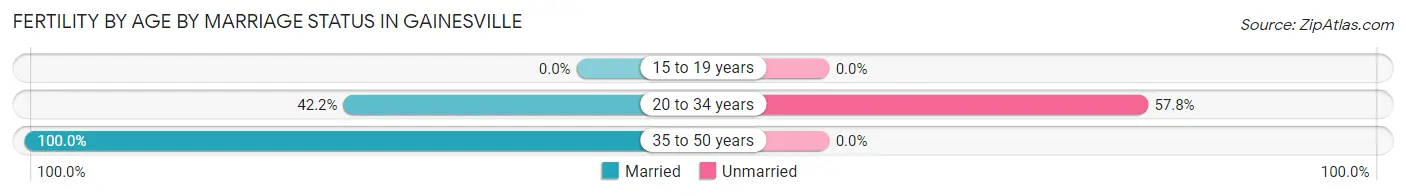
| Age Bracket | Married | Unmarried |
| 15 to 19 years | 0 (0.0%) | 0 (0.0%) |
| 20 to 34 years | 128 (42.2%) | 175 (57.8%) |
| 35 to 50 years | 56 (100.0%) | 0 (0.0%) |
| Total | 184 (51.2%) | 175 (48.7%) |
Fertility by Education in Gainesville
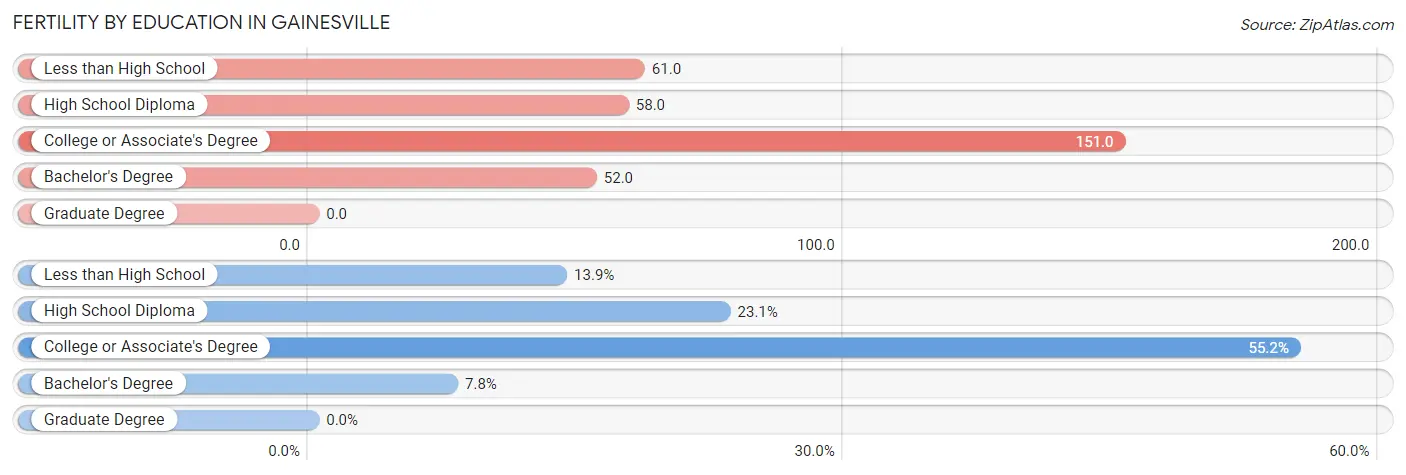
| Educational Attainment | Women with Births | Births / 1,000 Women |
| Less than High School | 50 (13.9%) | 61.0 |
| High School Diploma | 83 (23.1%) | 58.0 |
| College or Associate's Degree | 198 (55.1%) | 151.0 |
| Bachelor's Degree | 28 (7.8%) | 52.0 |
| Graduate Degree | 0 (0.0%) | 0.0 |
| Total | 359 (100.0%) | 86.0 |
Fertility by Education by Marriage Status in Gainesville
48.7% of women with births in Gainesville are unmarried. Women with the educational attainment of less than high school are most likely to be married with 100.0% of them married at childbirth, while women with the educational attainment of college or associate's degree are least likely to be married with 77.8% of them unmarried at childbirth.
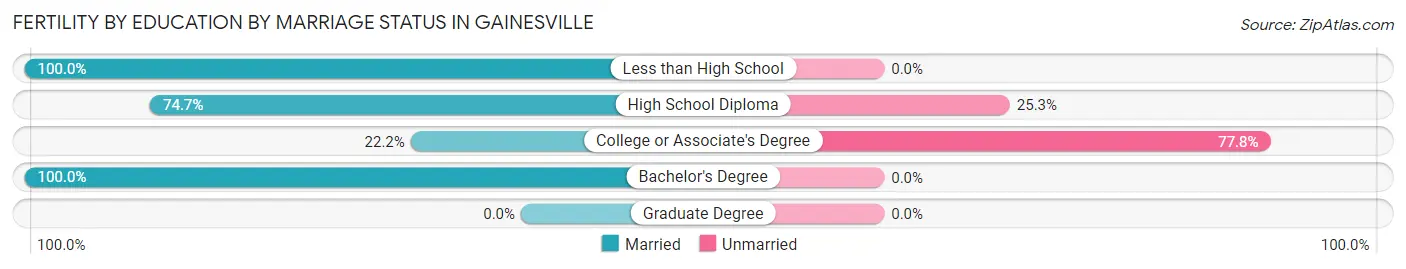
| Educational Attainment | Married | Unmarried |
| Less than High School | 50 (100.0%) | 0 (0.0%) |
| High School Diploma | 62 (74.7%) | 21 (25.3%) |
| College or Associate's Degree | 44 (22.2%) | 154 (77.8%) |
| Bachelor's Degree | 28 (100.0%) | 0 (0.0%) |
| Graduate Degree | 0 (0.0%) | 0 (0.0%) |
| Total | 184 (51.2%) | 175 (48.7%) |
Employment Characteristics in Gainesville
Employment by Class of Employer in Gainesville
Among the 8,022 employed individuals in Gainesville, private company employees (6,149 | 76.6%), local government employees (623 | 7.8%), and state government employees (401 | 5.0%) make up the most common classes of employment.
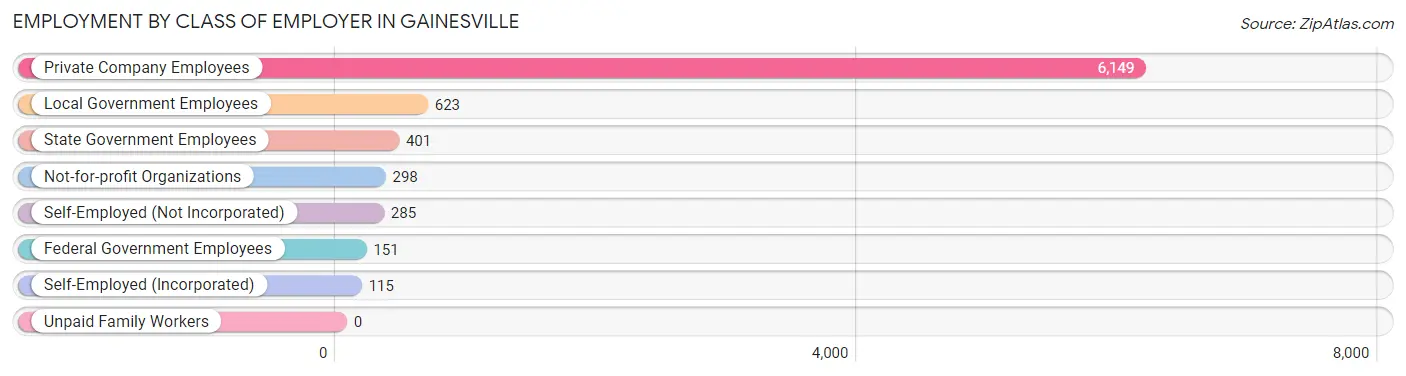
| Employer Class | # Employees | % Employees |
| Private Company Employees | 6,149 | 76.6% |
| Self-Employed (Incorporated) | 115 | 1.4% |
| Self-Employed (Not Incorporated) | 285 | 3.5% |
| Not-for-profit Organizations | 298 | 3.7% |
| Local Government Employees | 623 | 7.8% |
| State Government Employees | 401 | 5.0% |
| Federal Government Employees | 151 | 1.9% |
| Unpaid Family Workers | 0 | 0.0% |
| Total | 8,022 | 100.0% |
Employment Status by Age in Gainesville
According to the labor force statistics for Gainesville, out of the total population over 16 years of age (13,432), 64.2% or 8,623 individuals are in the labor force, with 6.1% or 526 of them unemployed. The age group with the highest labor force participation rate is 30 to 34 years, with 92.3% or 1,236 individuals in the labor force. Within the labor force, the 30 to 34 years age range has the highest percentage of unemployed individuals, with 9.8% or 121 of them being unemployed.
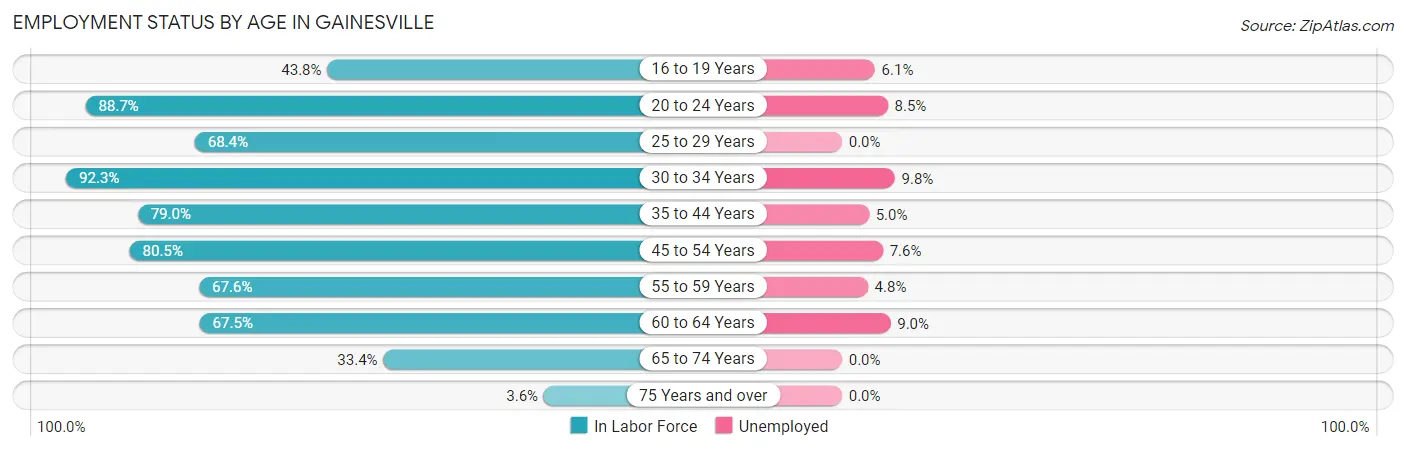
| Age Bracket | In Labor Force | Unemployed |
| 16 to 19 Years | 474 (43.8%) | 29 (6.1%) |
| 20 to 24 Years | 1,129 (88.7%) | 96 (8.5%) |
| 25 to 29 Years | 754 (68.4%) | 0 (0.0%) |
| 30 to 34 Years | 1,236 (92.3%) | 121 (9.8%) |
| 35 to 44 Years | 1,894 (79.0%) | 95 (5.0%) |
| 45 to 54 Years | 1,335 (80.5%) | 101 (7.6%) |
| 55 to 59 Years | 662 (67.6%) | 32 (4.8%) |
| 60 to 64 Years | 598 (67.5%) | 54 (9.0%) |
| 65 to 74 Years | 497 (33.4%) | 0 (0.0%) |
| 75 Years and over | 44 (3.6%) | 0 (0.0%) |
| Total | 8,623 (64.2%) | 526 (6.1%) |
Employment Status by Educational Attainment in Gainesville
According to labor force statistics for Gainesville, 77.5% of individuals (6,482) out of the total population between 25 and 64 years of age (8,364) are in the labor force, with 6.2% or 402 of them being unemployed. The group with the highest labor force participation rate are those with the educational attainment of bachelor's degree or higher, with 85.4% or 1,203 individuals in the labor force. Within the labor force, individuals with college / associate degree education have the highest percentage of unemployment, with 9.7% or 224 of them being unemployed.
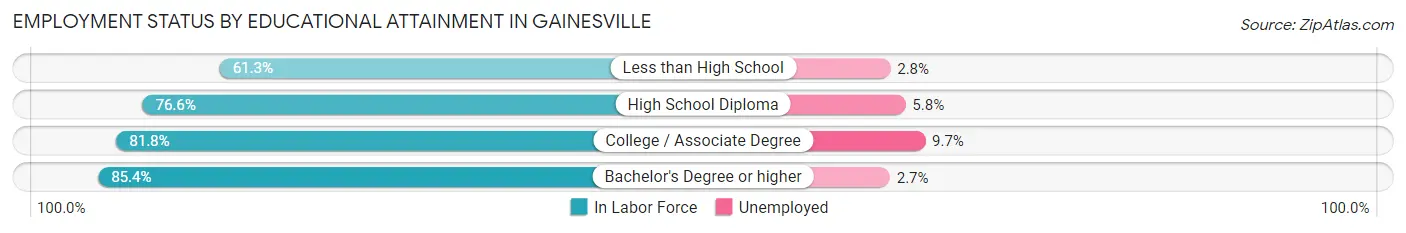
| Educational Attainment | In Labor Force | Unemployed |
| Less than High School | 793 (61.3%) | 36 (2.8%) |
| High School Diploma | 2,178 (76.6%) | 165 (5.8%) |
| College / Associate Degree | 2,306 (81.8%) | 273 (9.7%) |
| Bachelor's Degree or higher | 1,203 (85.4%) | 38 (2.7%) |
| Total | 6,482 (77.5%) | 519 (6.2%) |
Employment Occupations by Sex in Gainesville
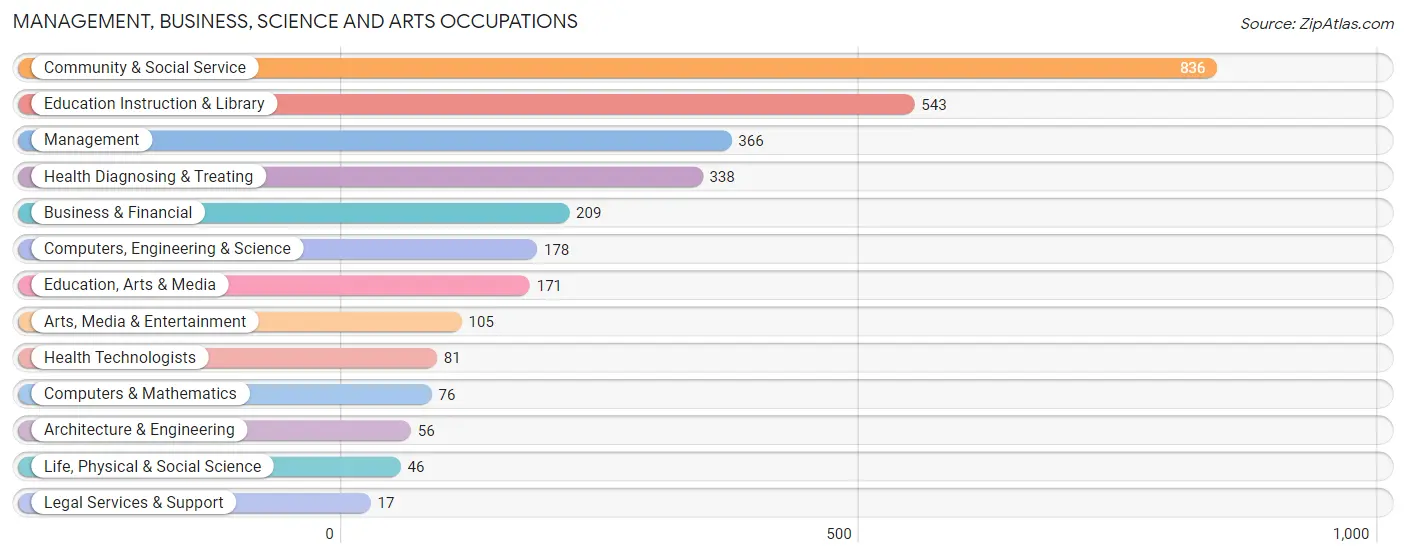
Management, Business, Science and Arts Occupations
The most common Management, Business, Science and Arts occupations in Gainesville are Community & Social Service (836 | 10.3%), Education Instruction & Library (543 | 6.7%), Management (366 | 4.5%), Health Diagnosing & Treating (338 | 4.2%), and Business & Financial (209 | 2.6%).
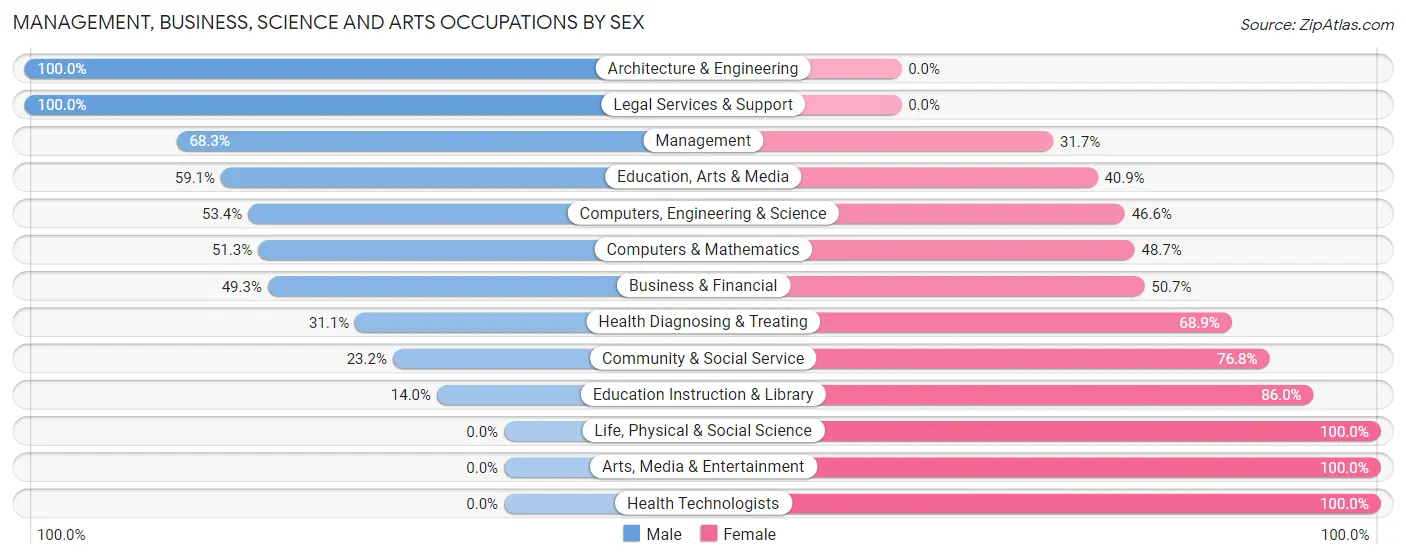
Management, Business, Science and Arts Occupations by Sex
Within the Management, Business, Science and Arts occupations in Gainesville, the most male-oriented occupations are Architecture & Engineering (100.0%), Legal Services & Support (100.0%), and Management (68.3%), while the most female-oriented occupations are Life, Physical & Social Science (100.0%), Arts, Media & Entertainment (100.0%), and Health Technologists (100.0%).
| Occupation | Male | Female |
| Management | 250 (68.3%) | 116 (31.7%) |
| Business & Financial | 103 (49.3%) | 106 (50.7%) |
| Computers, Engineering & Science | 95 (53.4%) | 83 (46.6%) |
| Computers & Mathematics | 39 (51.3%) | 37 (48.7%) |
| Architecture & Engineering | 56 (100.0%) | 0 (0.0%) |
| Life, Physical & Social Science | 0 (0.0%) | 46 (100.0%) |
| Community & Social Service | 194 (23.2%) | 642 (76.8%) |
| Education, Arts & Media | 101 (59.1%) | 70 (40.9%) |
| Legal Services & Support | 17 (100.0%) | 0 (0.0%) |
| Education Instruction & Library | 76 (14.0%) | 467 (86.0%) |
| Arts, Media & Entertainment | 0 (0.0%) | 105 (100.0%) |
| Health Diagnosing & Treating | 105 (31.1%) | 233 (68.9%) |
| Health Technologists | 0 (0.0%) | 81 (100.0%) |
| Total (Category) | 747 (38.8%) | 1,180 (61.2%) |
| Total (Overall) | 4,394 (54.3%) | 3,701 (45.7%) |
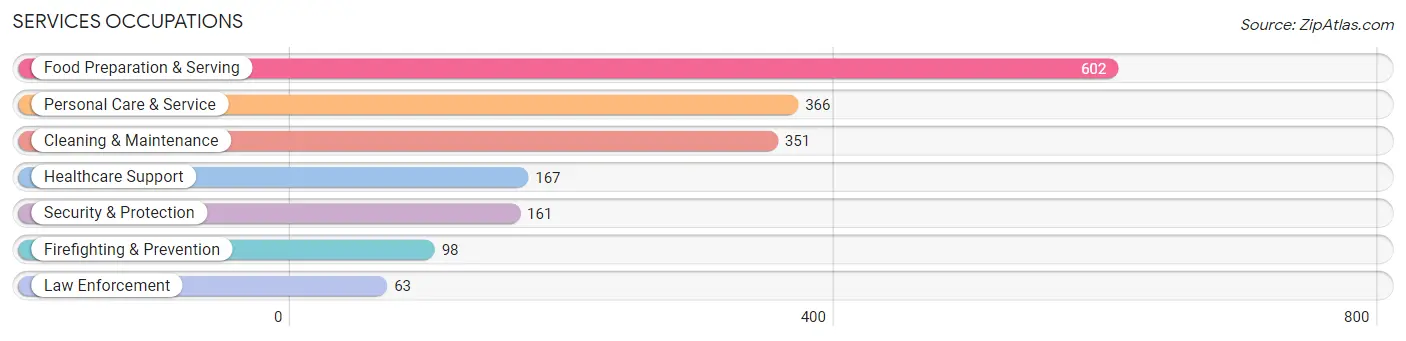
Services Occupations
The most common Services occupations in Gainesville are Food Preparation & Serving (602 | 7.4%), Personal Care & Service (366 | 4.5%), Cleaning & Maintenance (351 | 4.3%), Healthcare Support (167 | 2.1%), and Security & Protection (161 | 2.0%).
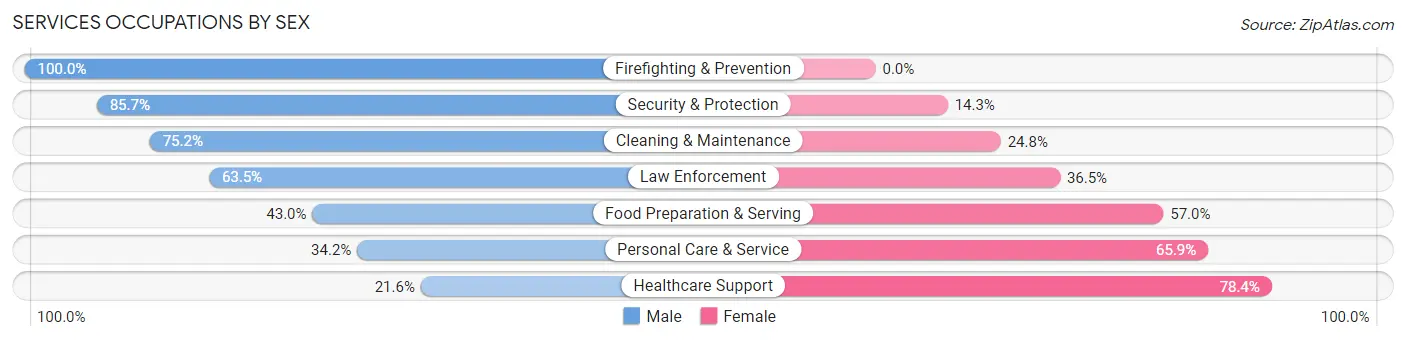
Services Occupations by Sex
Within the Services occupations in Gainesville, the most male-oriented occupations are Firefighting & Prevention (100.0%), Security & Protection (85.7%), and Cleaning & Maintenance (75.2%), while the most female-oriented occupations are Healthcare Support (78.4%), Personal Care & Service (65.8%), and Food Preparation & Serving (57.0%).
| Occupation | Male | Female |
| Healthcare Support | 36 (21.6%) | 131 (78.4%) |
| Security & Protection | 138 (85.7%) | 23 (14.3%) |
| Firefighting & Prevention | 98 (100.0%) | 0 (0.0%) |
| Law Enforcement | 40 (63.5%) | 23 (36.5%) |
| Food Preparation & Serving | 259 (43.0%) | 343 (57.0%) |
| Cleaning & Maintenance | 264 (75.2%) | 87 (24.8%) |
| Personal Care & Service | 125 (34.2%) | 241 (65.8%) |
| Total (Category) | 822 (49.9%) | 825 (50.1%) |
| Total (Overall) | 4,394 (54.3%) | 3,701 (45.7%) |
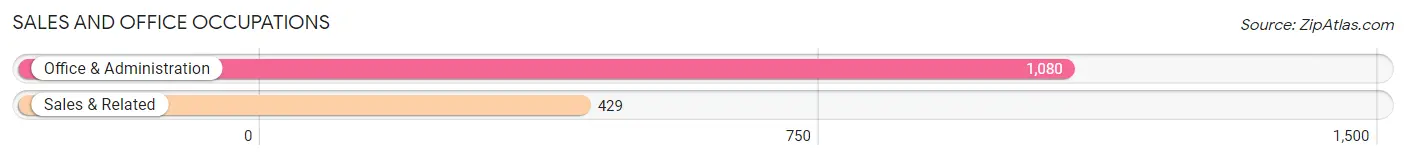
Sales and Office Occupations
The most common Sales and Office occupations in Gainesville are Office & Administration (1,080 | 13.3%), and Sales & Related (429 | 5.3%).
Sales and Office Occupations by Sex
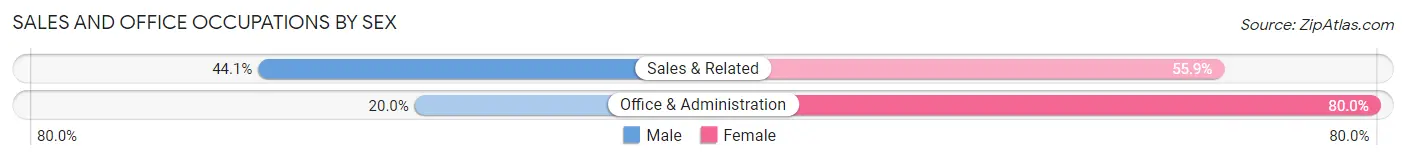
| Occupation | Male | Female |
| Sales & Related | 189 (44.1%) | 240 (55.9%) |
| Office & Administration | 216 (20.0%) | 864 (80.0%) |
| Total (Category) | 405 (26.8%) | 1,104 (73.2%) |
| Total (Overall) | 4,394 (54.3%) | 3,701 (45.7%) |
Natural Resources, Construction and Maintenance Occupations
The most common Natural Resources, Construction and Maintenance occupations in Gainesville are Construction & Extraction (661 | 8.2%), Installation, Maintenance & Repair (484 | 6.0%), and Farming, Fishing & Forestry (49 | 0.6%).

Natural Resources, Construction and Maintenance Occupations by Sex
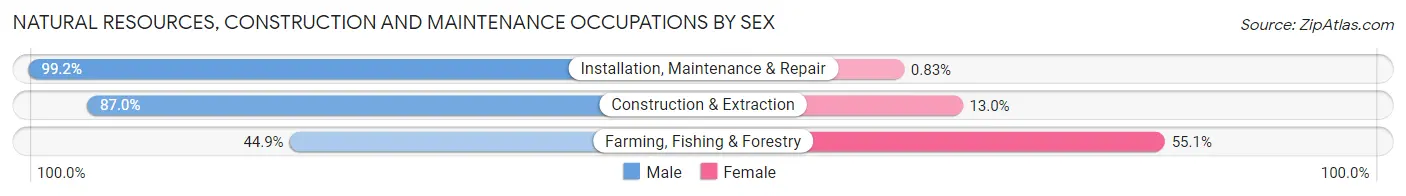
| Occupation | Male | Female |
| Farming, Fishing & Forestry | 22 (44.9%) | 27 (55.1%) |
| Construction & Extraction | 575 (87.0%) | 86 (13.0%) |
| Installation, Maintenance & Repair | 480 (99.2%) | 4 (0.8%) |
| Total (Category) | 1,077 (90.2%) | 117 (9.8%) |
| Total (Overall) | 4,394 (54.3%) | 3,701 (45.7%) |
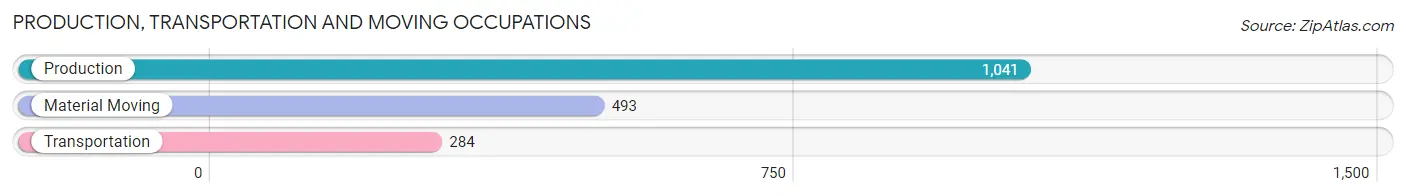
Production, Transportation and Moving Occupations
The most common Production, Transportation and Moving occupations in Gainesville are Production (1,041 | 12.9%), Material Moving (493 | 6.1%), and Transportation (284 | 3.5%).
Production, Transportation and Moving Occupations by Sex
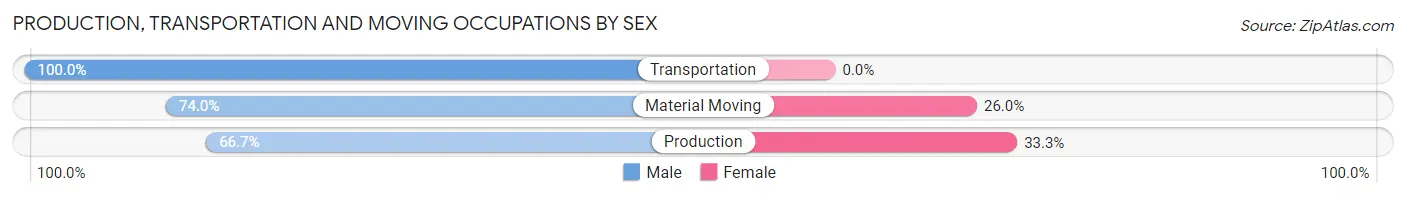
| Occupation | Male | Female |
| Production | 694 (66.7%) | 347 (33.3%) |
| Transportation | 284 (100.0%) | 0 (0.0%) |
| Material Moving | 365 (74.0%) | 128 (26.0%) |
| Total (Category) | 1,343 (73.9%) | 475 (26.1%) |
| Total (Overall) | 4,394 (54.3%) | 3,701 (45.7%) |
Employment Industries by Sex in Gainesville
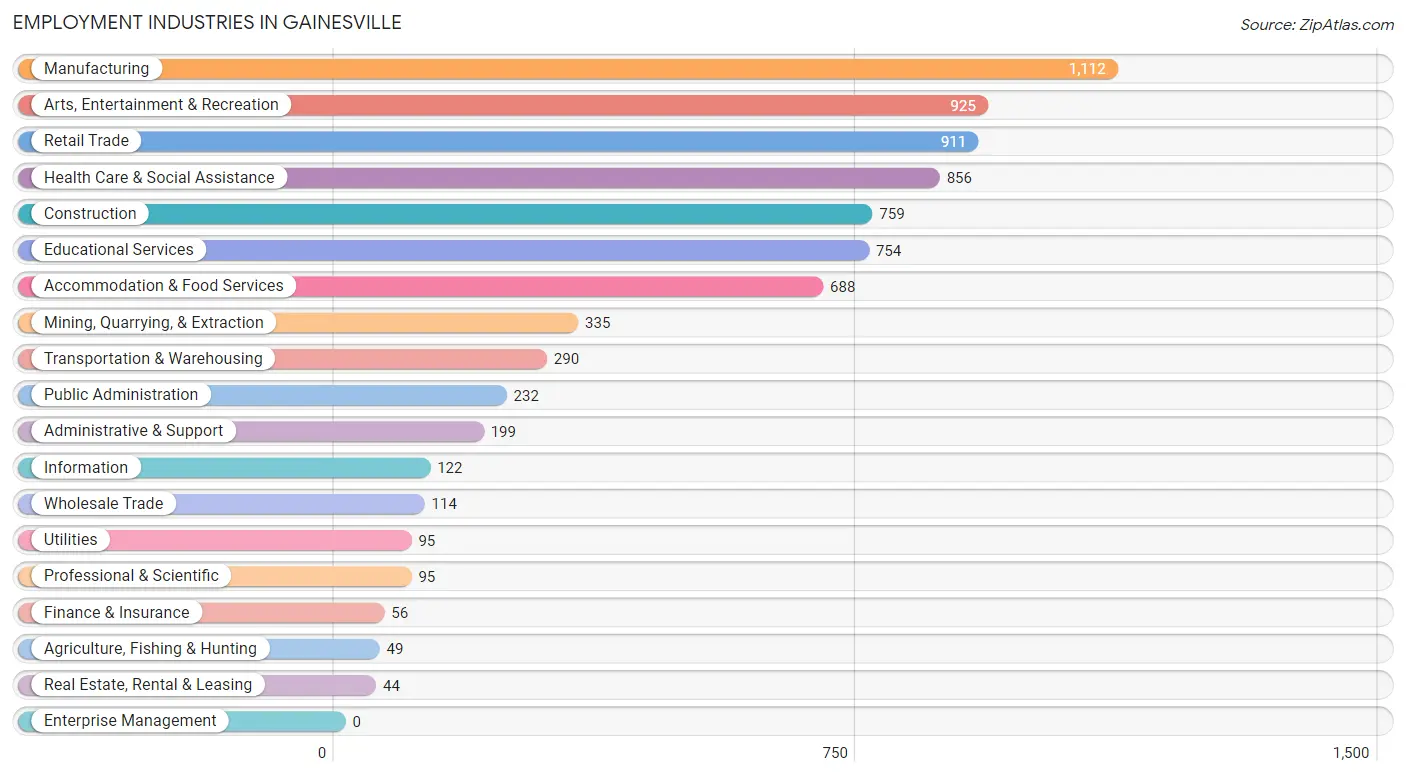
Employment Industries in Gainesville
The major employment industries in Gainesville include Manufacturing (1,112 | 13.7%), Arts, Entertainment & Recreation (925 | 11.4%), Retail Trade (911 | 11.3%), Health Care & Social Assistance (856 | 10.6%), and Construction (759 | 9.4%).
Employment Industries by Sex in Gainesville
The Gainesville industries that see more men than women are Wholesale Trade (100.0%), Utilities (100.0%), and Information (100.0%), whereas the industries that tend to have a higher number of women are Finance & Insurance (100.0%), Health Care & Social Assistance (79.7%), and Educational Services (76.3%).
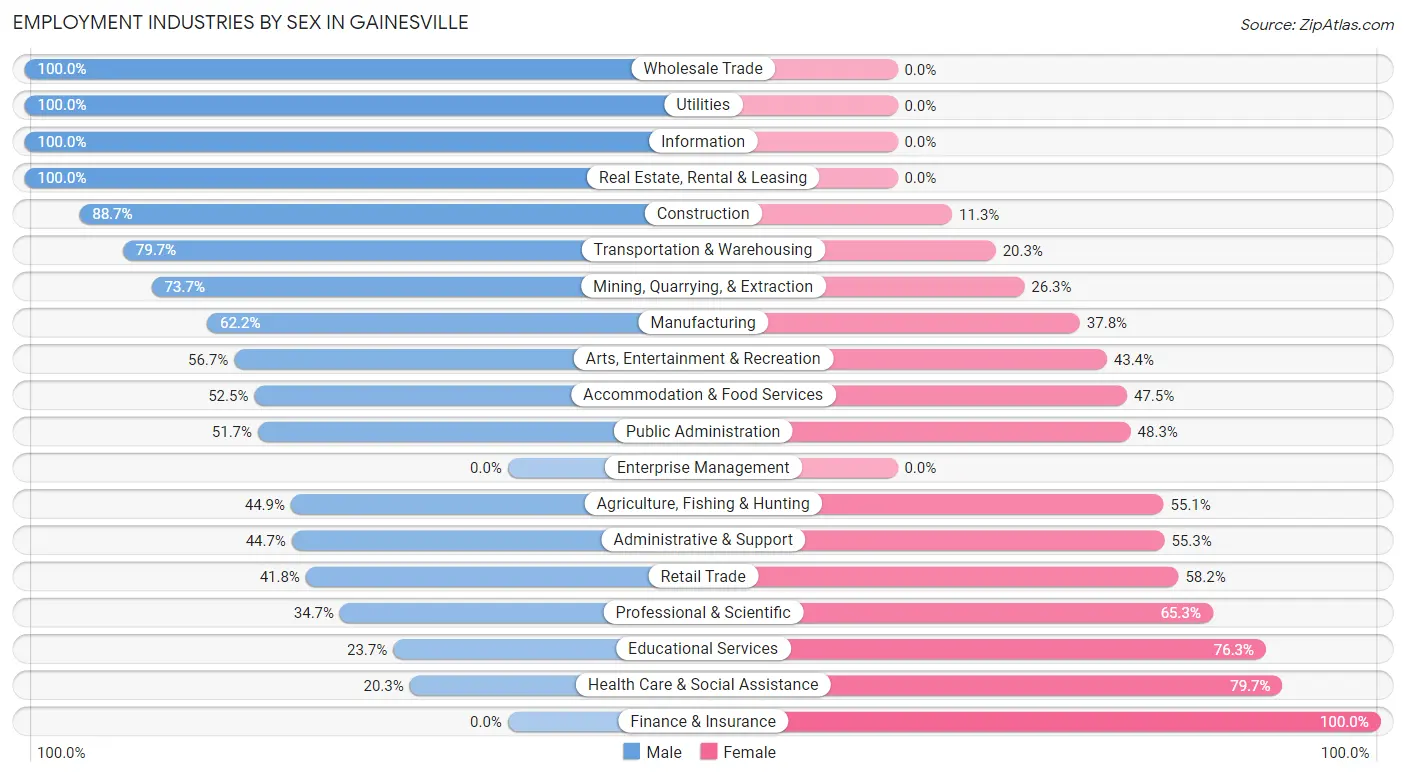
| Industry | Male | Female |
| Agriculture, Fishing & Hunting | 22 (44.9%) | 27 (55.1%) |
| Mining, Quarrying, & Extraction | 247 (73.7%) | 88 (26.3%) |
| Construction | 673 (88.7%) | 86 (11.3%) |
| Manufacturing | 692 (62.2%) | 420 (37.8%) |
| Wholesale Trade | 114 (100.0%) | 0 (0.0%) |
| Retail Trade | 381 (41.8%) | 530 (58.2%) |
| Transportation & Warehousing | 231 (79.7%) | 59 (20.3%) |
| Utilities | 95 (100.0%) | 0 (0.0%) |
| Information | 122 (100.0%) | 0 (0.0%) |
| Finance & Insurance | 0 (0.0%) | 56 (100.0%) |
| Real Estate, Rental & Leasing | 44 (100.0%) | 0 (0.0%) |
| Professional & Scientific | 33 (34.7%) | 62 (65.3%) |
| Enterprise Management | 0 (0.0%) | 0 (0.0%) |
| Administrative & Support | 89 (44.7%) | 110 (55.3%) |
| Educational Services | 179 (23.7%) | 575 (76.3%) |
| Health Care & Social Assistance | 174 (20.3%) | 682 (79.7%) |
| Arts, Entertainment & Recreation | 524 (56.7%) | 401 (43.3%) |
| Accommodation & Food Services | 361 (52.5%) | 327 (47.5%) |
| Public Administration | 120 (51.7%) | 112 (48.3%) |
| Total | 4,394 (54.3%) | 3,701 (45.7%) |
Education in Gainesville
School Enrollment in Gainesville
The most common levels of schooling among the 3,925 students in Gainesville are elementary school (1,164 | 29.7%), high school (1,075 | 27.4%), and middle school (846 | 21.5%).
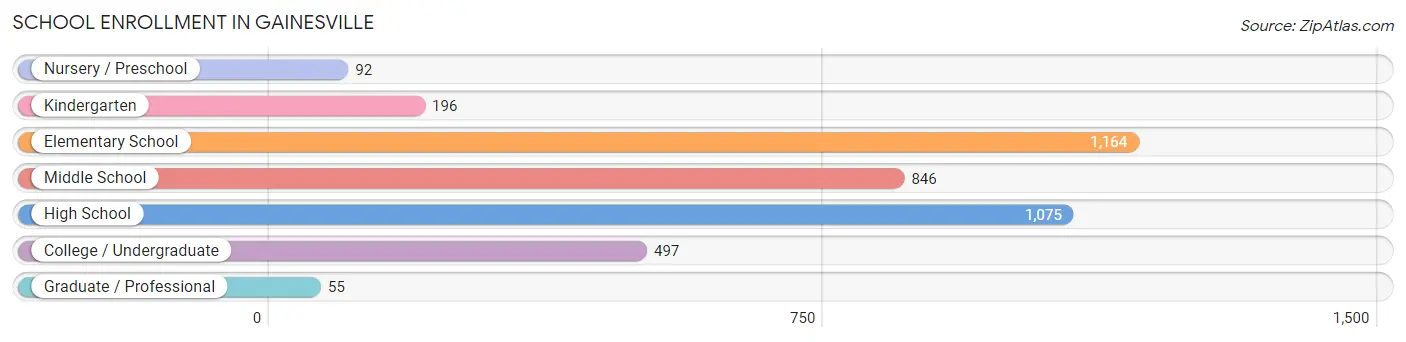
| School Level | # Students | % Students |
| Nursery / Preschool | 92 | 2.3% |
| Kindergarten | 196 | 5.0% |
| Elementary School | 1,164 | 29.7% |
| Middle School | 846 | 21.5% |
| High School | 1,075 | 27.4% |
| College / Undergraduate | 497 | 12.7% |
| Graduate / Professional | 55 | 1.4% |
| Total | 3,925 | 100.0% |
School Enrollment by Age by Funding Source in Gainesville
Out of a total of 3,925 students who are enrolled in schools in Gainesville, 408 (10.4%) attend a private institution, while the remaining 3,517 (89.6%) are enrolled in public schools. The age group of 3 to 4 year olds has the highest likelihood of being enrolled in private schools, with 25 (40.3% in the age bracket) enrolled. Conversely, the age group of 25 to 34 year olds has the lowest likelihood of being enrolled in a private school, with 139 (100.0% in the age bracket) attending a public institution.
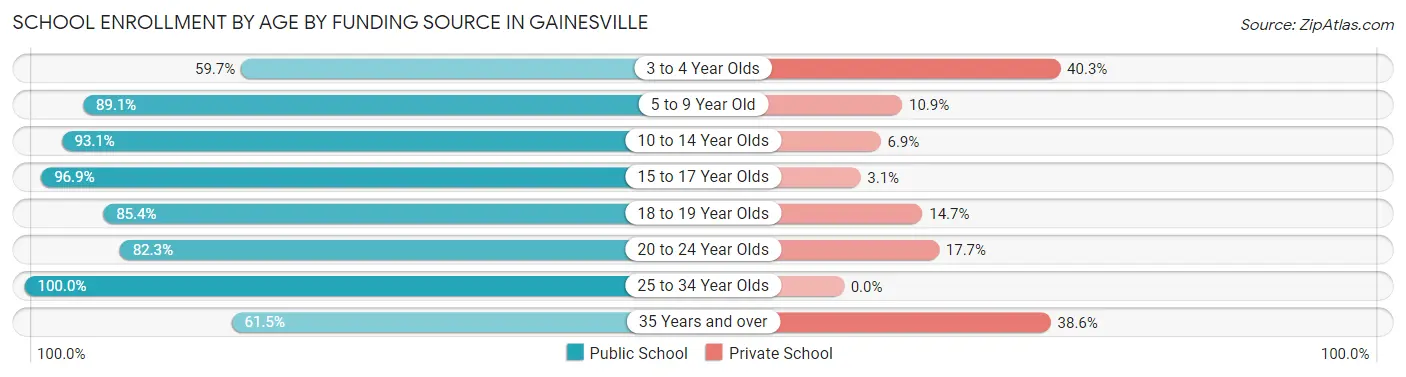
| Age Bracket | Public School | Private School |
| 3 to 4 Year Olds | 37 (59.7%) | 25 (40.3%) |
| 5 to 9 Year Old | 1,189 (89.1%) | 145 (10.9%) |
| 10 to 14 Year Olds | 1,003 (93.1%) | 74 (6.9%) |
| 15 to 17 Year Olds | 591 (96.9%) | 19 (3.1%) |
| 18 to 19 Year Olds | 338 (85.4%) | 58 (14.6%) |
| 20 to 24 Year Olds | 116 (82.3%) | 25 (17.7%) |
| 25 to 34 Year Olds | 139 (100.0%) | 0 (0.0%) |
| 35 Years and over | 102 (61.5%) | 64 (38.6%) |
| Total | 3,517 (89.6%) | 408 (10.4%) |
Educational Attainment by Field of Study in Gainesville
Education (402 | 18.7%), business (351 | 16.4%), arts & humanities (194 | 9.0%), liberal arts & history (176 | 8.2%), and science & technology (157 | 7.3%) are the most common fields of study among 2,145 individuals in Gainesville who have obtained a bachelor's degree or higher.
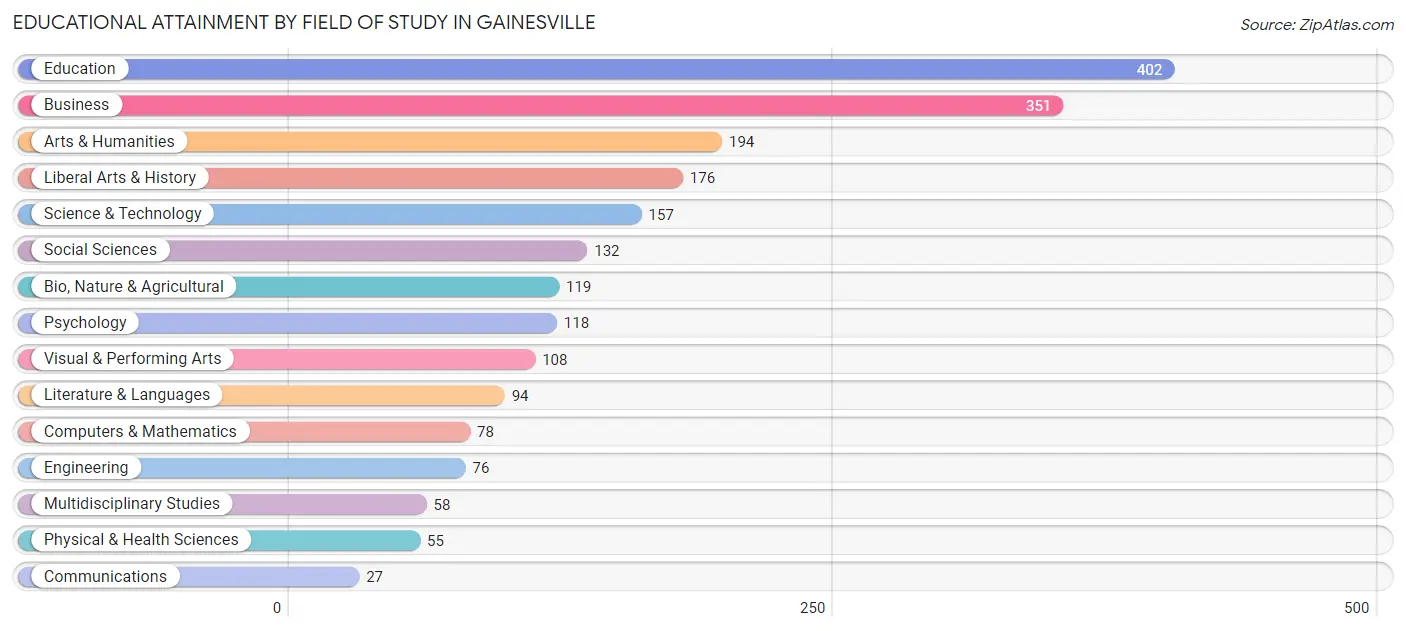
| Field of Study | # Graduates | % Graduates |
| Computers & Mathematics | 78 | 3.6% |
| Bio, Nature & Agricultural | 119 | 5.6% |
| Physical & Health Sciences | 55 | 2.6% |
| Psychology | 118 | 5.5% |
| Social Sciences | 132 | 6.1% |
| Engineering | 76 | 3.5% |
| Multidisciplinary Studies | 58 | 2.7% |
| Science & Technology | 157 | 7.3% |
| Business | 351 | 16.4% |
| Education | 402 | 18.7% |
| Literature & Languages | 94 | 4.4% |
| Liberal Arts & History | 176 | 8.2% |
| Visual & Performing Arts | 108 | 5.0% |
| Communications | 27 | 1.3% |
| Arts & Humanities | 194 | 9.0% |
| Total | 2,145 | 100.0% |
Transportation & Commute in Gainesville
Vehicle Availability by Sex in Gainesville
The most prevalent vehicle ownership categories in Gainesville are males with 2 vehicles (1,800, accounting for 41.6%) and females with 2 vehicles (1,406, making up 49.2%).
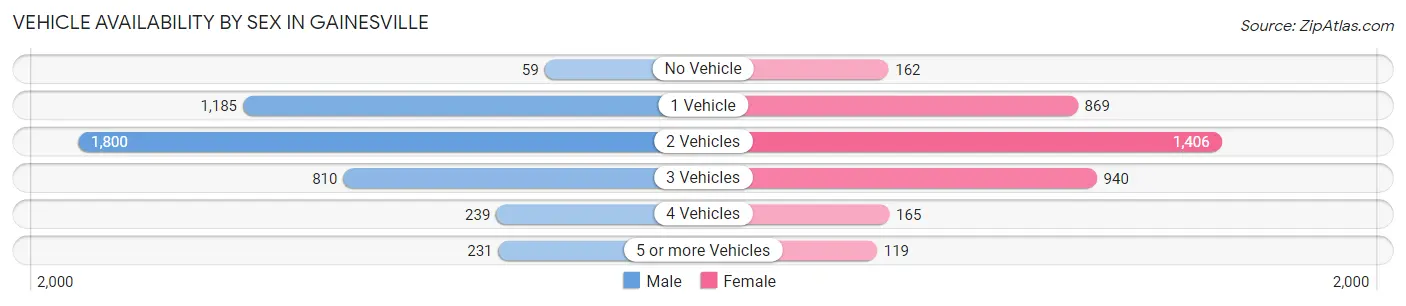
| Vehicles Available | Male | Female |
| No Vehicle | 59 (1.4%) | 162 (4.4%) |
| 1 Vehicle | 1,185 (27.4%) | 869 (23.7%) |
| 2 Vehicles | 1,800 (41.6%) | 1,406 (38.4%) |
| 3 Vehicles | 810 (18.7%) | 940 (25.7%) |
| 4 Vehicles | 239 (5.5%) | 165 (4.5%) |
| 5 or more Vehicles | 231 (5.3%) | 119 (3.3%) |
| Total | 4,324 (100.0%) | 3,661 (100.0%) |
Commute Time in Gainesville
The most frequently occuring commute durations in Gainesville are 10 to 14 minutes (1,902 commuters, 25.3%), 5 to 9 minutes (1,835 commuters, 24.4%), and 20 to 24 minutes (766 commuters, 10.2%).
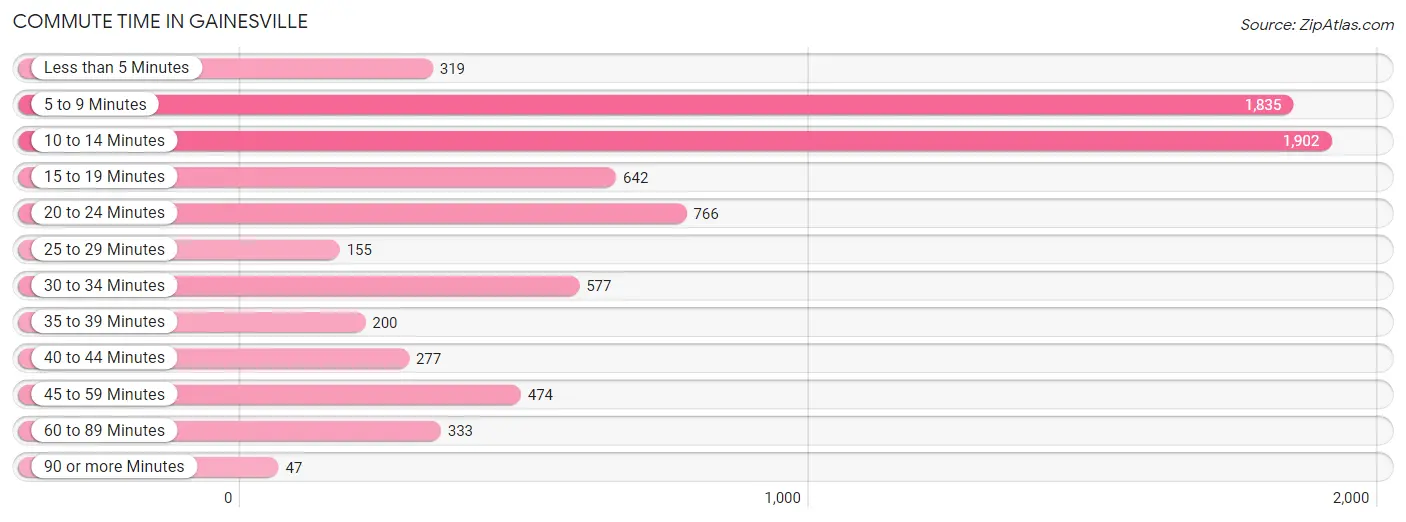
| Commute Time | # Commuters | % Commuters |
| Less than 5 Minutes | 319 | 4.2% |
| 5 to 9 Minutes | 1,835 | 24.4% |
| 10 to 14 Minutes | 1,902 | 25.3% |
| 15 to 19 Minutes | 642 | 8.5% |
| 20 to 24 Minutes | 766 | 10.2% |
| 25 to 29 Minutes | 155 | 2.1% |
| 30 to 34 Minutes | 577 | 7.7% |
| 35 to 39 Minutes | 200 | 2.7% |
| 40 to 44 Minutes | 277 | 3.7% |
| 45 to 59 Minutes | 474 | 6.3% |
| 60 to 89 Minutes | 333 | 4.4% |
| 90 or more Minutes | 47 | 0.6% |
Commute Time by Sex in Gainesville
The most common commute times in Gainesville are 5 to 9 minutes (982 commuters, 23.7%) for males and 10 to 14 minutes (936 commuters, 27.6%) for females.
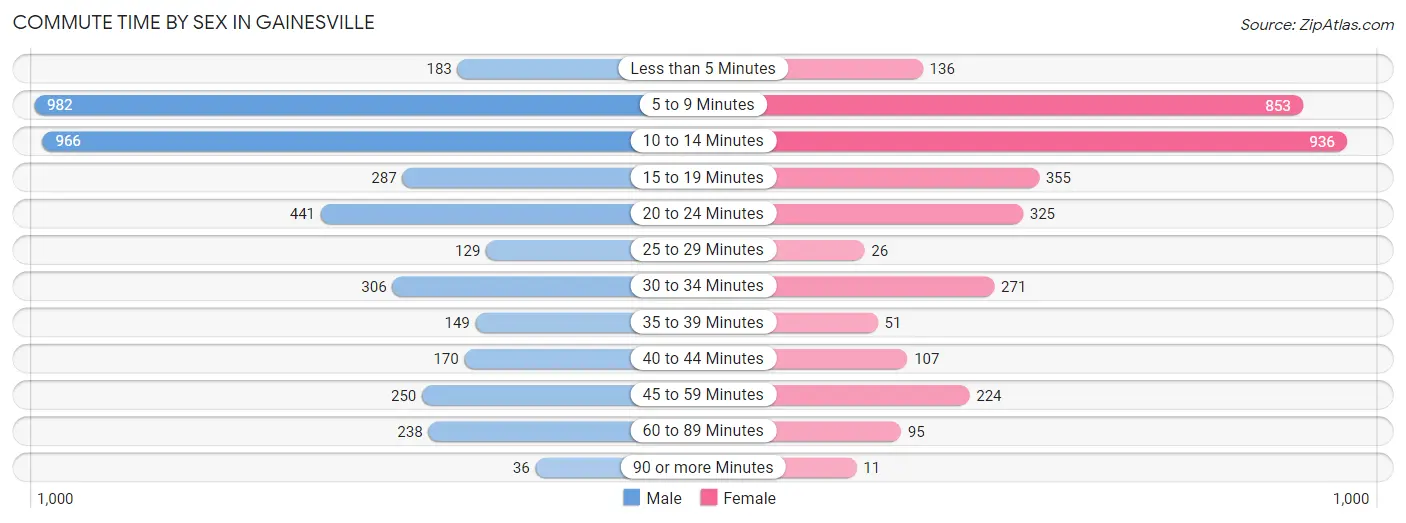
| Commute Time | Male | Female |
| Less than 5 Minutes | 183 (4.4%) | 136 (4.0%) |
| 5 to 9 Minutes | 982 (23.7%) | 853 (25.2%) |
| 10 to 14 Minutes | 966 (23.4%) | 936 (27.6%) |
| 15 to 19 Minutes | 287 (6.9%) | 355 (10.5%) |
| 20 to 24 Minutes | 441 (10.7%) | 325 (9.6%) |
| 25 to 29 Minutes | 129 (3.1%) | 26 (0.8%) |
| 30 to 34 Minutes | 306 (7.4%) | 271 (8.0%) |
| 35 to 39 Minutes | 149 (3.6%) | 51 (1.5%) |
| 40 to 44 Minutes | 170 (4.1%) | 107 (3.2%) |
| 45 to 59 Minutes | 250 (6.0%) | 224 (6.6%) |
| 60 to 89 Minutes | 238 (5.8%) | 95 (2.8%) |
| 90 or more Minutes | 36 (0.9%) | 11 (0.3%) |
Time of Departure to Work by Sex in Gainesville
The most frequent times of departure to work in Gainesville are 4:00 PM to 11:59 PM (632, 15.3%) for males and 6:30 AM to 6:59 AM (526, 15.5%) for females.
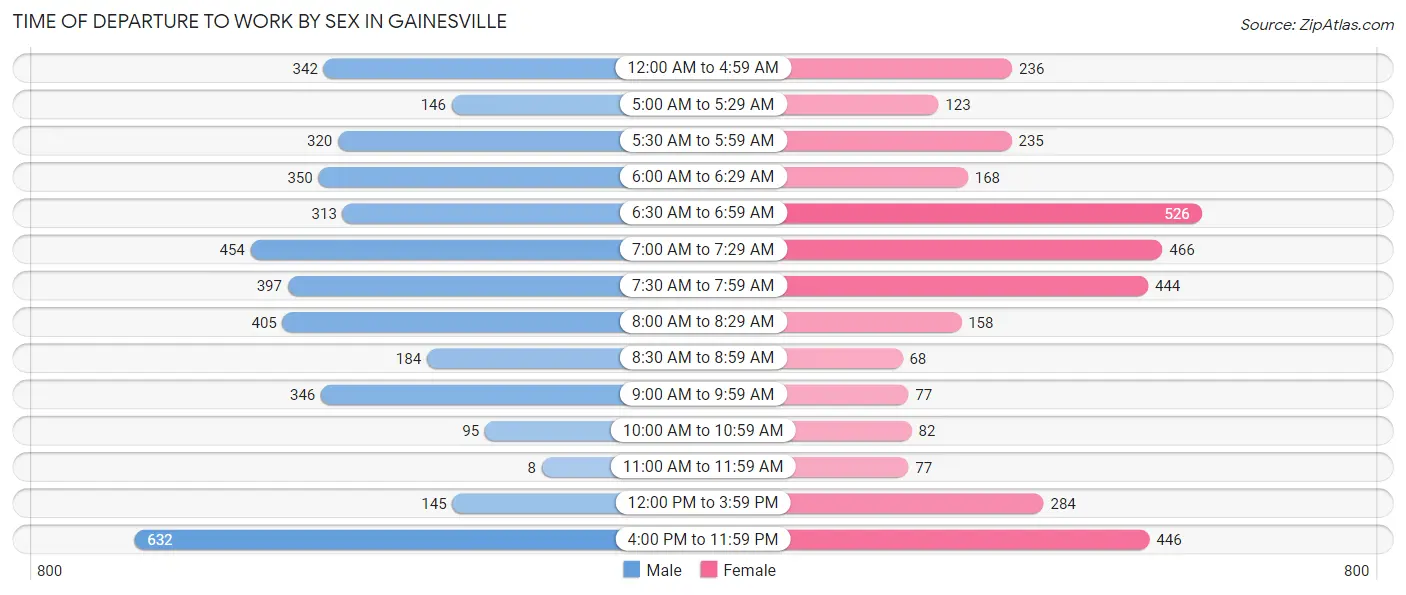
| Time of Departure | Male | Female |
| 12:00 AM to 4:59 AM | 342 (8.3%) | 236 (7.0%) |
| 5:00 AM to 5:29 AM | 146 (3.5%) | 123 (3.6%) |
| 5:30 AM to 5:59 AM | 320 (7.7%) | 235 (6.9%) |
| 6:00 AM to 6:29 AM | 350 (8.5%) | 168 (5.0%) |
| 6:30 AM to 6:59 AM | 313 (7.6%) | 526 (15.5%) |
| 7:00 AM to 7:29 AM | 454 (11.0%) | 466 (13.8%) |
| 7:30 AM to 7:59 AM | 397 (9.6%) | 444 (13.1%) |
| 8:00 AM to 8:29 AM | 405 (9.8%) | 158 (4.7%) |
| 8:30 AM to 8:59 AM | 184 (4.4%) | 68 (2.0%) |
| 9:00 AM to 9:59 AM | 346 (8.4%) | 77 (2.3%) |
| 10:00 AM to 10:59 AM | 95 (2.3%) | 82 (2.4%) |
| 11:00 AM to 11:59 AM | 8 (0.2%) | 77 (2.3%) |
| 12:00 PM to 3:59 PM | 145 (3.5%) | 284 (8.4%) |
| 4:00 PM to 11:59 PM | 632 (15.3%) | 446 (13.2%) |
| Total | 4,137 (100.0%) | 3,390 (100.0%) |
Housing Occupancy in Gainesville
Occupancy by Ownership in Gainesville
Of the total 6,792 dwellings in Gainesville, owner-occupied units account for 3,369 (49.6%), while renter-occupied units make up 3,423 (50.4%).
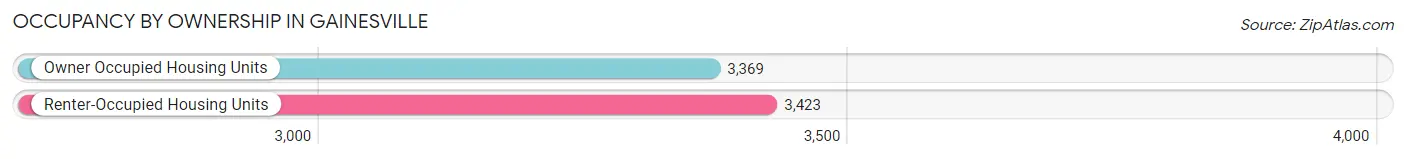
| Occupancy | # Housing Units | % Housing Units |
| Owner Occupied Housing Units | 3,369 | 49.6% |
| Renter-Occupied Housing Units | 3,423 | 50.4% |
| Total Occupied Housing Units | 6,792 | 100.0% |
Occupancy by Household Size in Gainesville
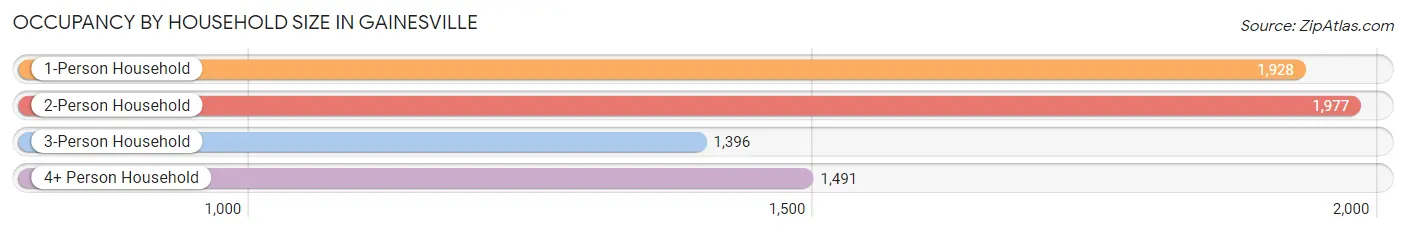
| Household Size | # Housing Units | % Housing Units |
| 1-Person Household | 1,928 | 28.4% |
| 2-Person Household | 1,977 | 29.1% |
| 3-Person Household | 1,396 | 20.5% |
| 4+ Person Household | 1,491 | 22.0% |
| Total Housing Units | 6,792 | 100.0% |
Occupancy by Ownership by Household Size in Gainesville
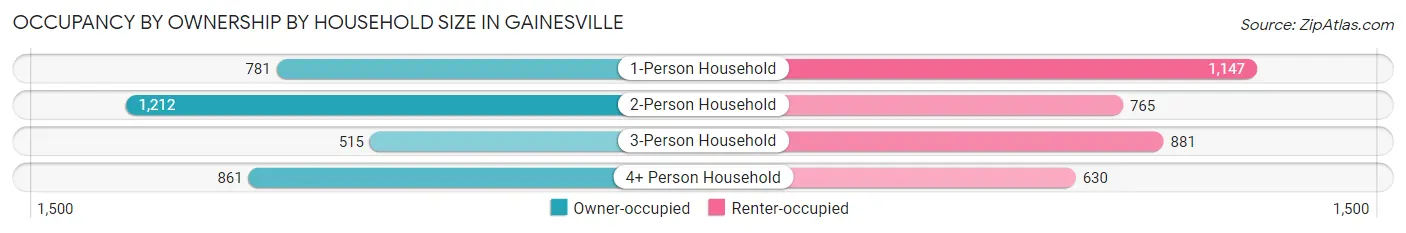
| Household Size | Owner-occupied | Renter-occupied |
| 1-Person Household | 781 (40.5%) | 1,147 (59.5%) |
| 2-Person Household | 1,212 (61.3%) | 765 (38.7%) |
| 3-Person Household | 515 (36.9%) | 881 (63.1%) |
| 4+ Person Household | 861 (57.8%) | 630 (42.2%) |
| Total Housing Units | 3,369 (49.6%) | 3,423 (50.4%) |
Occupancy by Educational Attainment in Gainesville
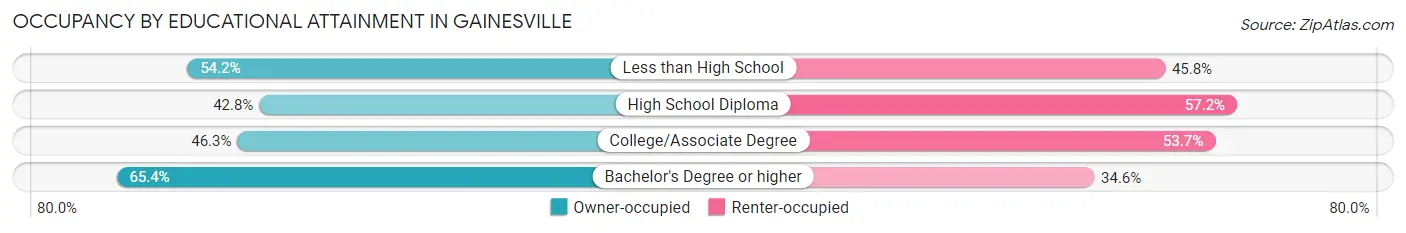
| Household Size | Owner-occupied | Renter-occupied |
| Less than High School | 607 (54.2%) | 513 (45.8%) |
| High School Diploma | 964 (42.8%) | 1,289 (57.2%) |
| College/Associate Degree | 1,060 (46.3%) | 1,231 (53.7%) |
| Bachelor's Degree or higher | 738 (65.4%) | 390 (34.6%) |
Occupancy by Age of Householder in Gainesville
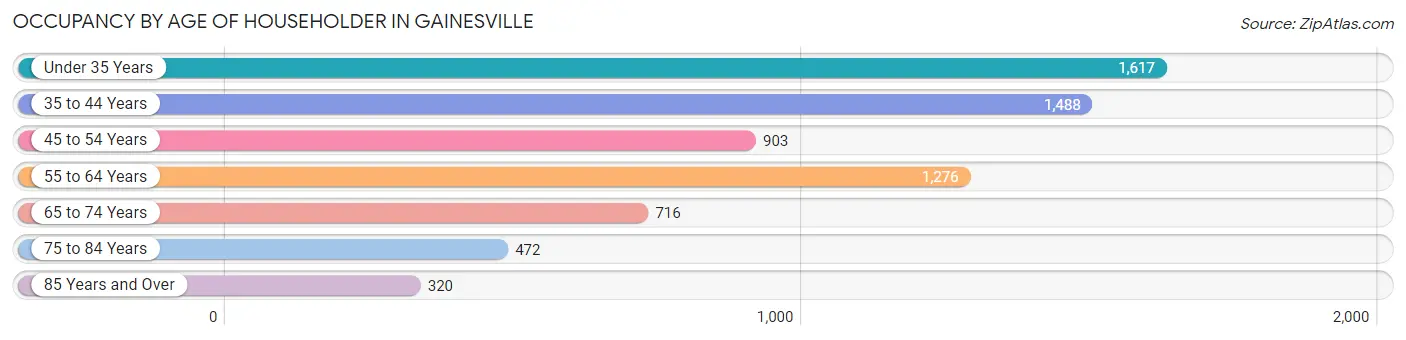
| Age Bracket | # Households | % Households |
| Under 35 Years | 1,617 | 23.8% |
| 35 to 44 Years | 1,488 | 21.9% |
| 45 to 54 Years | 903 | 13.3% |
| 55 to 64 Years | 1,276 | 18.8% |
| 65 to 74 Years | 716 | 10.5% |
| 75 to 84 Years | 472 | 7.0% |
| 85 Years and Over | 320 | 4.7% |
| Total | 6,792 | 100.0% |
Housing Finances in Gainesville
Median Income by Occupancy in Gainesville
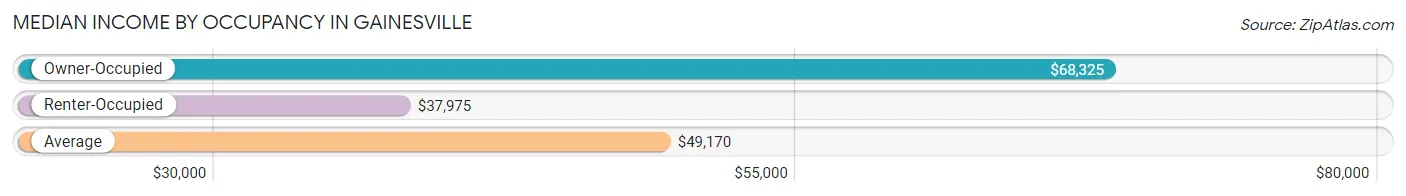
| Occupancy Type | # Households | Median Income |
| Owner-Occupied | 3,369 (49.6%) | $68,325 |
| Renter-Occupied | 3,423 (50.4%) | $37,975 |
| Average | 6,792 (100.0%) | $49,170 |
Occupancy by Householder Income Bracket in Gainesville
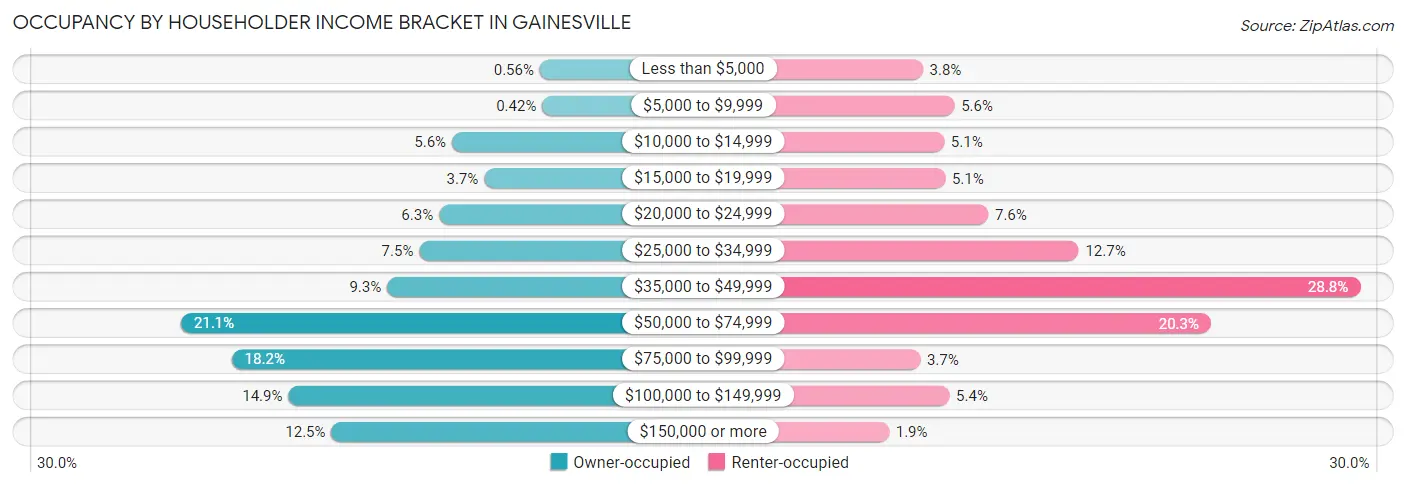
| Income Bracket | Owner-occupied | Renter-occupied |
| Less than $5,000 | 19 (0.6%) | 131 (3.8%) |
| $5,000 to $9,999 | 14 (0.4%) | 193 (5.6%) |
| $10,000 to $14,999 | 188 (5.6%) | 173 (5.1%) |
| $15,000 to $19,999 | 126 (3.7%) | 175 (5.1%) |
| $20,000 to $24,999 | 213 (6.3%) | 259 (7.6%) |
| $25,000 to $34,999 | 251 (7.4%) | 436 (12.7%) |
| $35,000 to $49,999 | 313 (9.3%) | 987 (28.8%) |
| $50,000 to $74,999 | 710 (21.1%) | 695 (20.3%) |
| $75,000 to $99,999 | 612 (18.2%) | 126 (3.7%) |
| $100,000 to $149,999 | 503 (14.9%) | 183 (5.3%) |
| $150,000 or more | 420 (12.5%) | 65 (1.9%) |
| Total | 3,369 (100.0%) | 3,423 (100.0%) |
Monthly Housing Cost Tiers in Gainesville
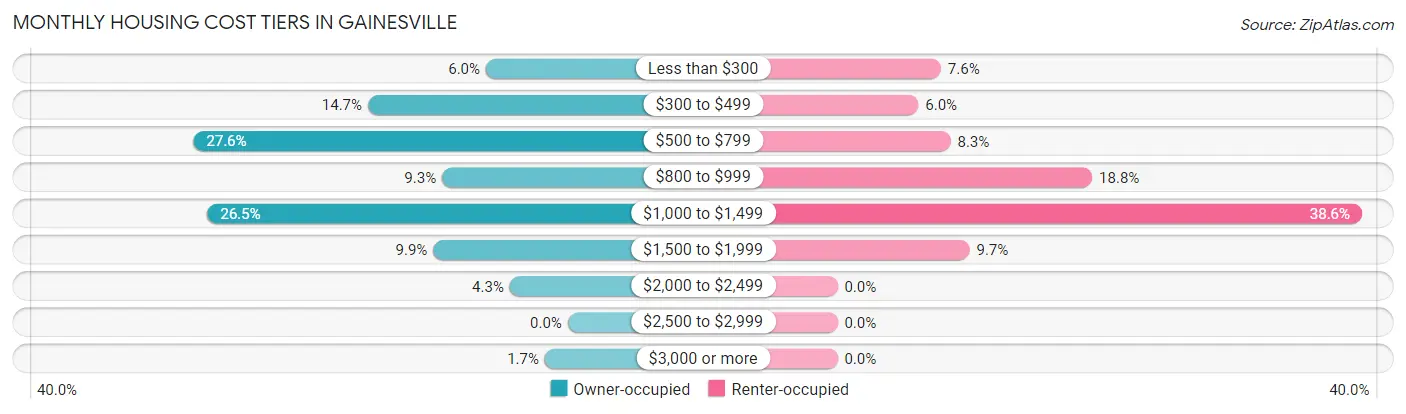
| Monthly Cost | Owner-occupied | Renter-occupied |
| Less than $300 | 203 (6.0%) | 261 (7.6%) |
| $300 to $499 | 496 (14.7%) | 204 (6.0%) |
| $500 to $799 | 929 (27.6%) | 285 (8.3%) |
| $800 to $999 | 312 (9.3%) | 642 (18.8%) |
| $1,000 to $1,499 | 894 (26.5%) | 1,322 (38.6%) |
| $1,500 to $1,999 | 334 (9.9%) | 333 (9.7%) |
| $2,000 to $2,499 | 144 (4.3%) | 0 (0.0%) |
| $2,500 to $2,999 | 0 (0.0%) | 0 (0.0%) |
| $3,000 or more | 57 (1.7%) | 0 (0.0%) |
| Total | 3,369 (100.0%) | 3,423 (100.0%) |
Physical Housing Characteristics in Gainesville
Housing Structures in Gainesville
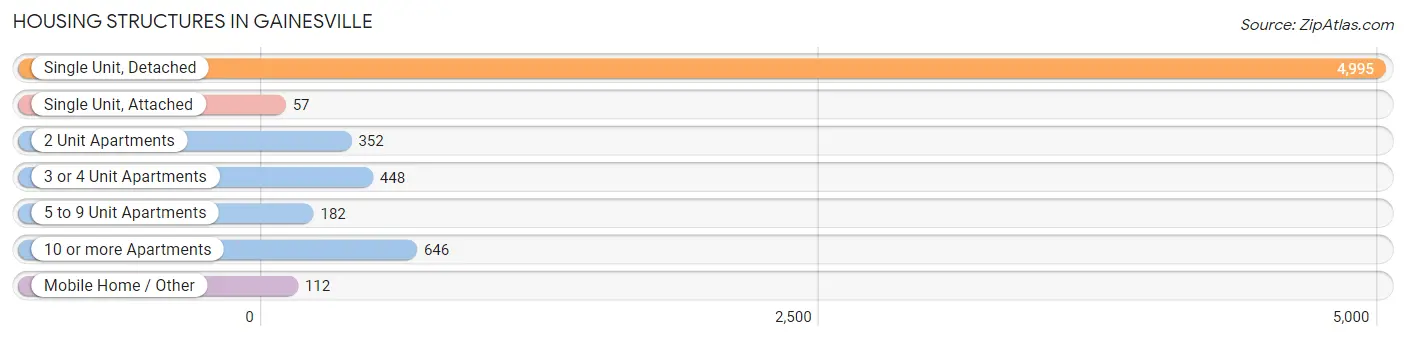
| Structure Type | # Housing Units | % Housing Units |
| Single Unit, Detached | 4,995 | 73.5% |
| Single Unit, Attached | 57 | 0.8% |
| 2 Unit Apartments | 352 | 5.2% |
| 3 or 4 Unit Apartments | 448 | 6.6% |
| 5 to 9 Unit Apartments | 182 | 2.7% |
| 10 or more Apartments | 646 | 9.5% |
| Mobile Home / Other | 112 | 1.7% |
| Total | 6,792 | 100.0% |
Housing Structures by Occupancy in Gainesville
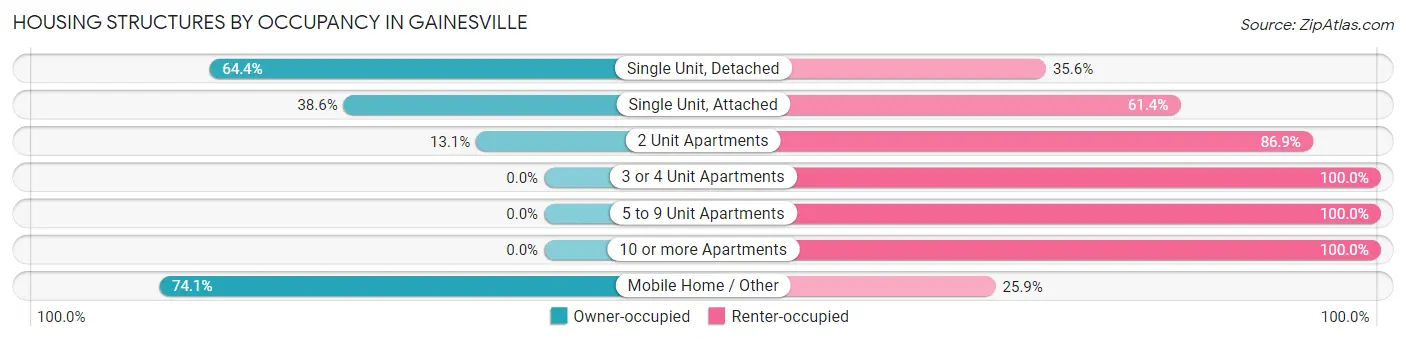
| Structure Type | Owner-occupied | Renter-occupied |
| Single Unit, Detached | 3,218 (64.4%) | 1,777 (35.6%) |
| Single Unit, Attached | 22 (38.6%) | 35 (61.4%) |
| 2 Unit Apartments | 46 (13.1%) | 306 (86.9%) |
| 3 or 4 Unit Apartments | 0 (0.0%) | 448 (100.0%) |
| 5 to 9 Unit Apartments | 0 (0.0%) | 182 (100.0%) |
| 10 or more Apartments | 0 (0.0%) | 646 (100.0%) |
| Mobile Home / Other | 83 (74.1%) | 29 (25.9%) |
| Total | 3,369 (49.6%) | 3,423 (50.4%) |
Housing Structures by Number of Rooms in Gainesville
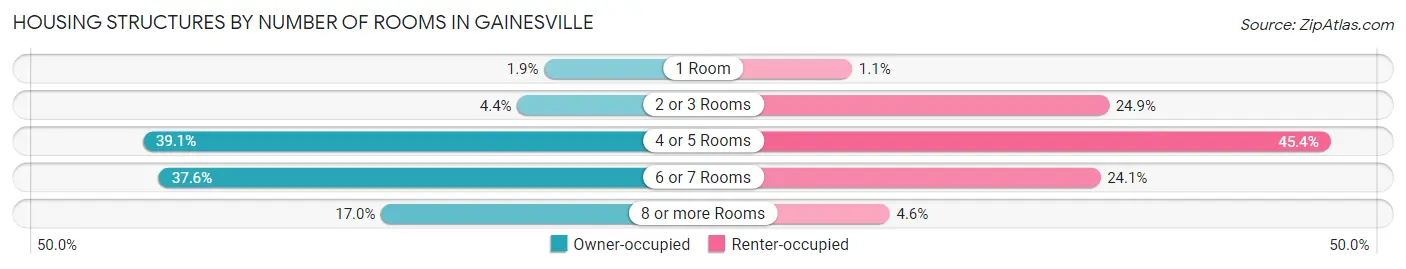
| Number of Rooms | Owner-occupied | Renter-occupied |
| 1 Room | 65 (1.9%) | 38 (1.1%) |
| 2 or 3 Rooms | 149 (4.4%) | 851 (24.9%) |
| 4 or 5 Rooms | 1,316 (39.1%) | 1,553 (45.4%) |
| 6 or 7 Rooms | 1,266 (37.6%) | 824 (24.1%) |
| 8 or more Rooms | 573 (17.0%) | 157 (4.6%) |
| Total | 3,369 (100.0%) | 3,423 (100.0%) |
Housing Structure by Heating Type in Gainesville
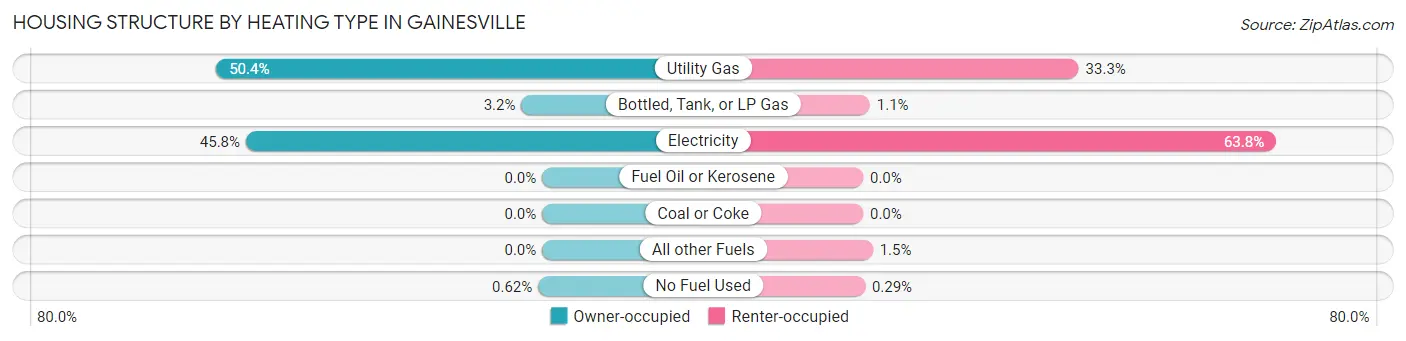
| Heating Type | Owner-occupied | Renter-occupied |
| Utility Gas | 1,697 (50.4%) | 1,141 (33.3%) |
| Bottled, Tank, or LP Gas | 108 (3.2%) | 36 (1.1%) |
| Electricity | 1,543 (45.8%) | 2,185 (63.8%) |
| Fuel Oil or Kerosene | 0 (0.0%) | 0 (0.0%) |
| Coal or Coke | 0 (0.0%) | 0 (0.0%) |
| All other Fuels | 0 (0.0%) | 51 (1.5%) |
| No Fuel Used | 21 (0.6%) | 10 (0.3%) |
| Total | 3,369 (100.0%) | 3,423 (100.0%) |
Household Vehicle Usage in Gainesville
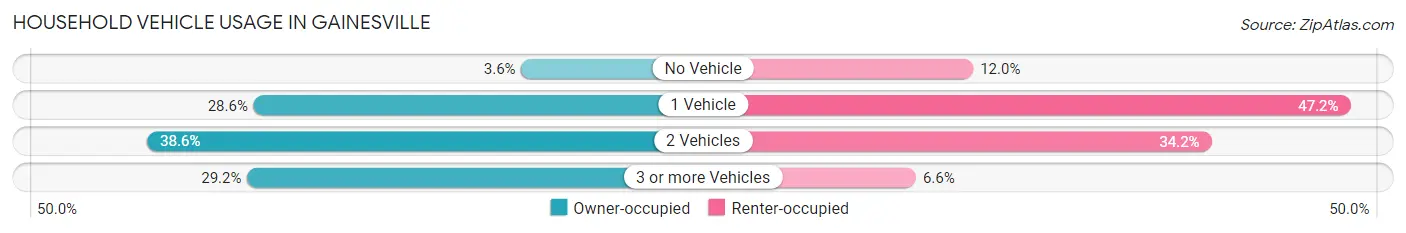
| Vehicles per Household | Owner-occupied | Renter-occupied |
| No Vehicle | 122 (3.6%) | 410 (12.0%) |
| 1 Vehicle | 964 (28.6%) | 1,615 (47.2%) |
| 2 Vehicles | 1,299 (38.6%) | 1,171 (34.2%) |
| 3 or more Vehicles | 984 (29.2%) | 227 (6.6%) |
| Total | 3,369 (100.0%) | 3,423 (100.0%) |
Real Estate & Mortgages in Gainesville
Real Estate and Mortgage Overview in Gainesville
| Characteristic | Without Mortgage | With Mortgage |
| Housing Units | 1,781 | 1,588 |
| Median Property Value | $101,500 | $152,000 |
| Median Household Income | $53,564 | $266 |
| Monthly Housing Costs | $559 | $57 |
| Real Estate Taxes | $1,477 | $67 |
Property Value by Mortgage Status in Gainesville
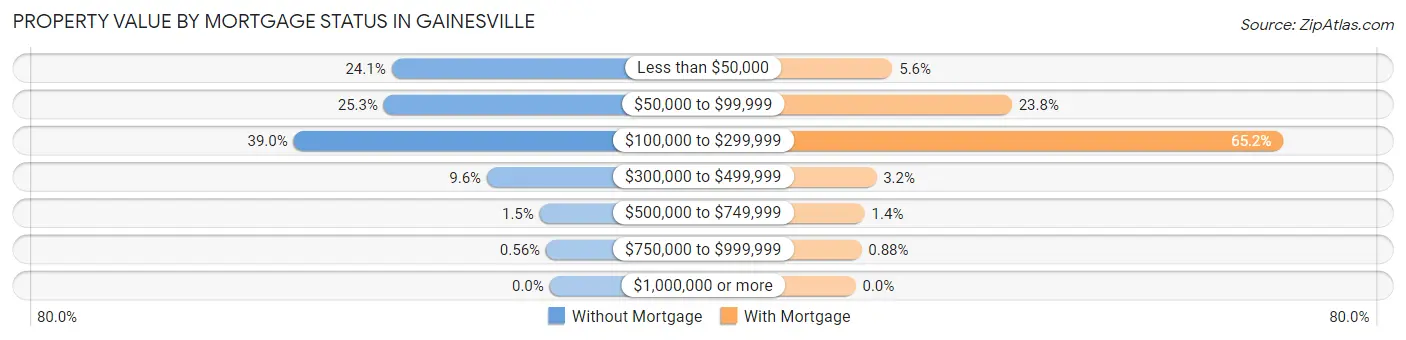
| Property Value | Without Mortgage | With Mortgage |
| Less than $50,000 | 429 (24.1%) | 89 (5.6%) |
| $50,000 to $99,999 | 450 (25.3%) | 378 (23.8%) |
| $100,000 to $299,999 | 695 (39.0%) | 1,035 (65.2%) |
| $300,000 to $499,999 | 170 (9.6%) | 50 (3.2%) |
| $500,000 to $749,999 | 27 (1.5%) | 22 (1.4%) |
| $750,000 to $999,999 | 10 (0.6%) | 14 (0.9%) |
| $1,000,000 or more | 0 (0.0%) | 0 (0.0%) |
| Total | 1,781 (100.0%) | 1,588 (100.0%) |
Household Income by Mortgage Status in Gainesville
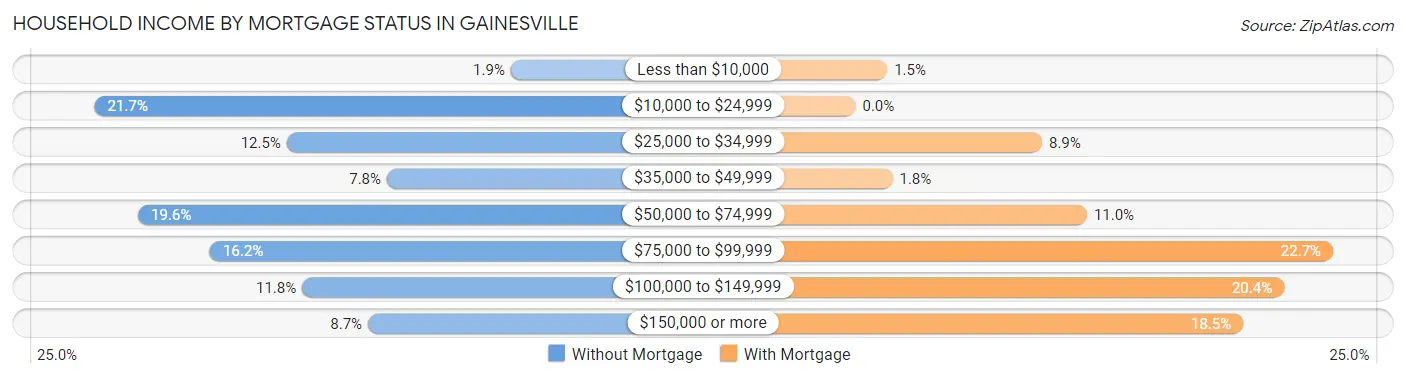
| Household Income | Without Mortgage | With Mortgage |
| Less than $10,000 | 33 (1.8%) | 24 (1.5%) |
| $10,000 to $24,999 | 386 (21.7%) | 0 (0.0%) |
| $25,000 to $34,999 | 223 (12.5%) | 141 (8.9%) |
| $35,000 to $49,999 | 138 (7.7%) | 28 (1.8%) |
| $50,000 to $74,999 | 349 (19.6%) | 175 (11.0%) |
| $75,000 to $99,999 | 288 (16.2%) | 361 (22.7%) |
| $100,000 to $149,999 | 210 (11.8%) | 324 (20.4%) |
| $150,000 or more | 154 (8.6%) | 293 (18.4%) |
| Total | 1,781 (100.0%) | 1,588 (100.0%) |
Property Value to Household Income Ratio in Gainesville
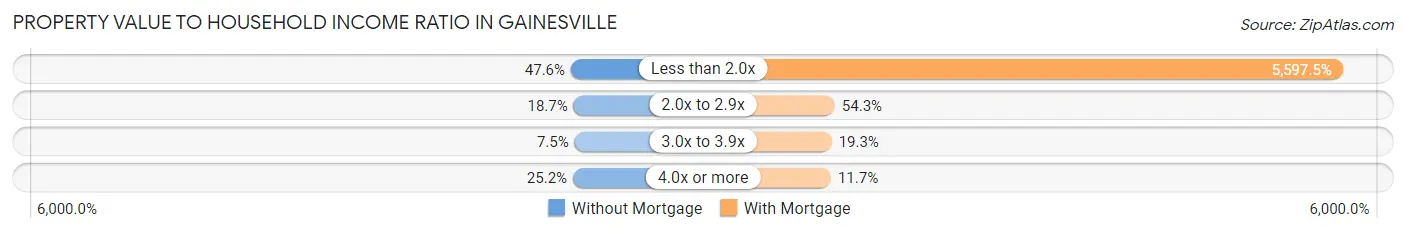
| Value-to-Income Ratio | Without Mortgage | With Mortgage |
| Less than 2.0x | 847 (47.6%) | 88,889 (5,597.5%) |
| 2.0x to 2.9x | 333 (18.7%) | 862 (54.3%) |
| 3.0x to 3.9x | 134 (7.5%) | 307 (19.3%) |
| 4.0x or more | 448 (25.2%) | 186 (11.7%) |
| Total | 1,781 (100.0%) | 1,588 (100.0%) |
Real Estate Taxes by Mortgage Status in Gainesville
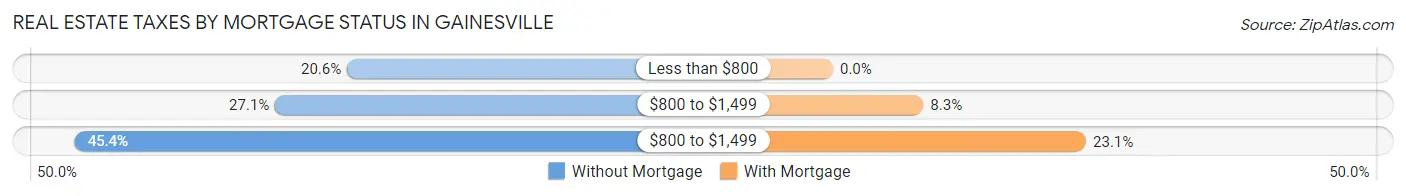
| Property Taxes | Without Mortgage | With Mortgage |
| Less than $800 | 366 (20.5%) | 0 (0.0%) |
| $800 to $1,499 | 483 (27.1%) | 131 (8.3%) |
| $800 to $1,499 | 809 (45.4%) | 367 (23.1%) |
| Total | 1,781 (100.0%) | 1,588 (100.0%) |
Health & Disability in Gainesville
Health Insurance Coverage by Age in Gainesville
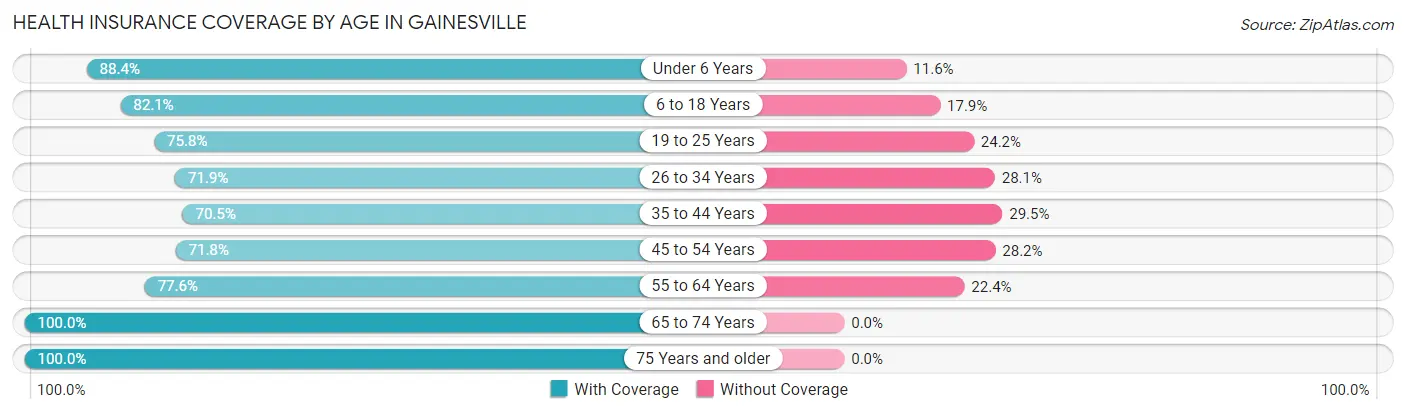
| Age Bracket | With Coverage | Without Coverage |
| Under 6 Years | 1,306 (88.4%) | 171 (11.6%) |
| 6 to 18 Years | 2,832 (82.1%) | 616 (17.9%) |
| 19 to 25 Years | 1,293 (75.8%) | 412 (24.2%) |
| 26 to 34 Years | 1,563 (71.9%) | 610 (28.1%) |
| 35 to 44 Years | 1,686 (70.5%) | 704 (29.5%) |
| 45 to 54 Years | 1,191 (71.8%) | 467 (28.2%) |
| 55 to 64 Years | 1,417 (77.6%) | 409 (22.4%) |
| 65 to 74 Years | 1,414 (100.0%) | 0 (0.0%) |
| 75 Years and older | 1,058 (100.0%) | 0 (0.0%) |
| Total | 13,760 (80.2%) | 3,389 (19.8%) |
Health Insurance Coverage by Citizenship Status in Gainesville
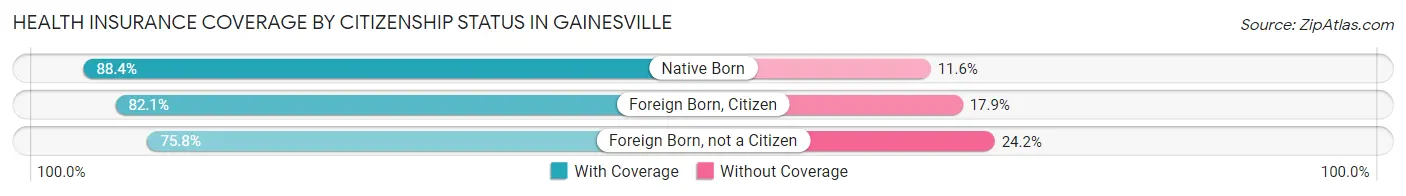
| Citizenship Status | With Coverage | Without Coverage |
| Native Born | 1,306 (88.4%) | 171 (11.6%) |
| Foreign Born, Citizen | 2,832 (82.1%) | 616 (17.9%) |
| Foreign Born, not a Citizen | 1,293 (75.8%) | 412 (24.2%) |
Health Insurance Coverage by Household Income in Gainesville
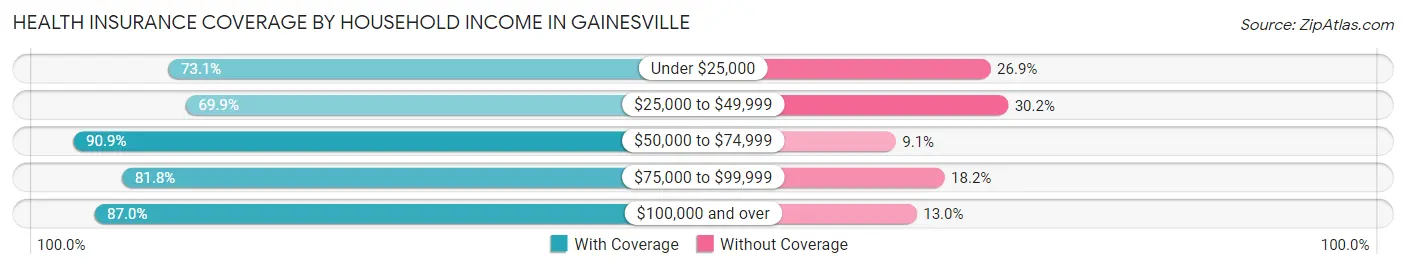
| Household Income | With Coverage | Without Coverage |
| Under $25,000 | 2,061 (73.1%) | 757 (26.9%) |
| $25,000 to $49,999 | 3,229 (69.9%) | 1,394 (30.1%) |
| $50,000 to $74,999 | 3,132 (90.9%) | 313 (9.1%) |
| $75,000 to $99,999 | 1,820 (81.8%) | 406 (18.2%) |
| $100,000 and over | 3,387 (87.0%) | 507 (13.0%) |
Public vs Private Health Insurance Coverage by Age in Gainesville
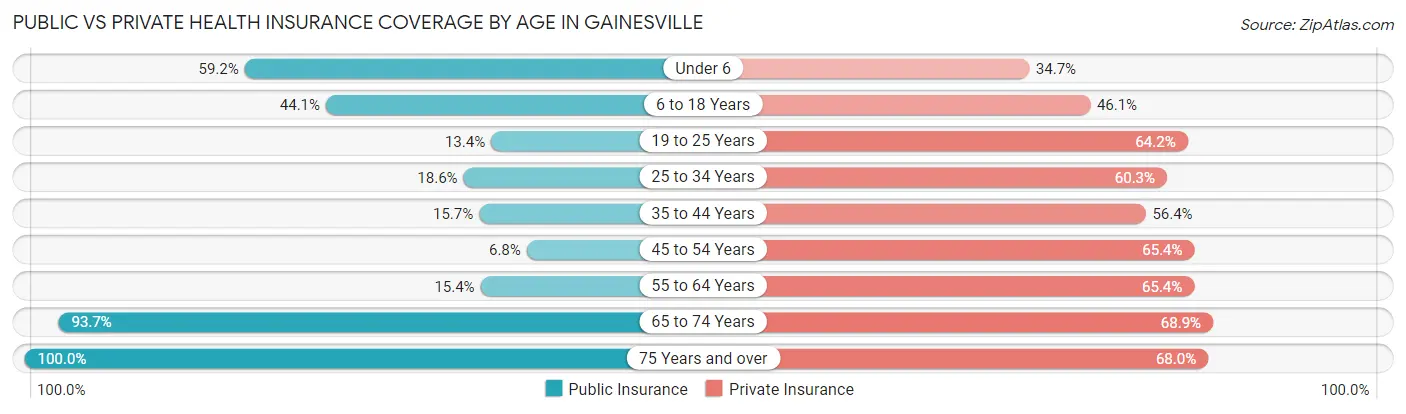
| Age Bracket | Public Insurance | Private Insurance |
| Under 6 | 874 (59.2%) | 513 (34.7%) |
| 6 to 18 Years | 1,520 (44.1%) | 1,588 (46.1%) |
| 19 to 25 Years | 229 (13.4%) | 1,094 (64.2%) |
| 25 to 34 Years | 403 (18.5%) | 1,311 (60.3%) |
| 35 to 44 Years | 374 (15.7%) | 1,347 (56.4%) |
| 45 to 54 Years | 113 (6.8%) | 1,085 (65.4%) |
| 55 to 64 Years | 281 (15.4%) | 1,194 (65.4%) |
| 65 to 74 Years | 1,325 (93.7%) | 974 (68.9%) |
| 75 Years and over | 1,058 (100.0%) | 719 (68.0%) |
| Total | 6,177 (36.0%) | 9,825 (57.3%) |
Disability Status by Sex by Age in Gainesville
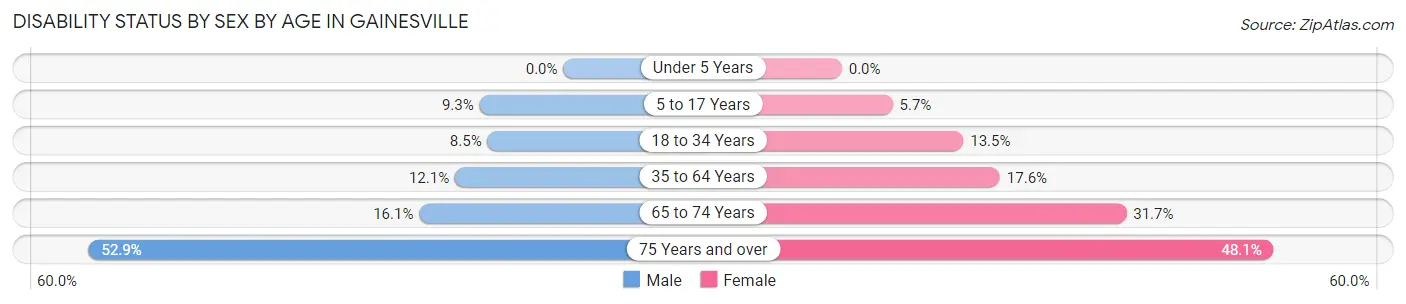
| Age Bracket | Male | Female |
| Under 5 Years | 0 (0.0%) | 0 (0.0%) |
| 5 to 17 Years | 155 (9.3%) | 84 (5.7%) |
| 18 to 34 Years | 163 (8.5%) | 323 (13.5%) |
| 35 to 64 Years | 367 (12.1%) | 499 (17.6%) |
| 65 to 74 Years | 117 (16.1%) | 217 (31.7%) |
| 75 Years and over | 201 (52.9%) | 326 (48.1%) |
Disability Class by Sex by Age in Gainesville
Disability Class: Hearing Difficulty
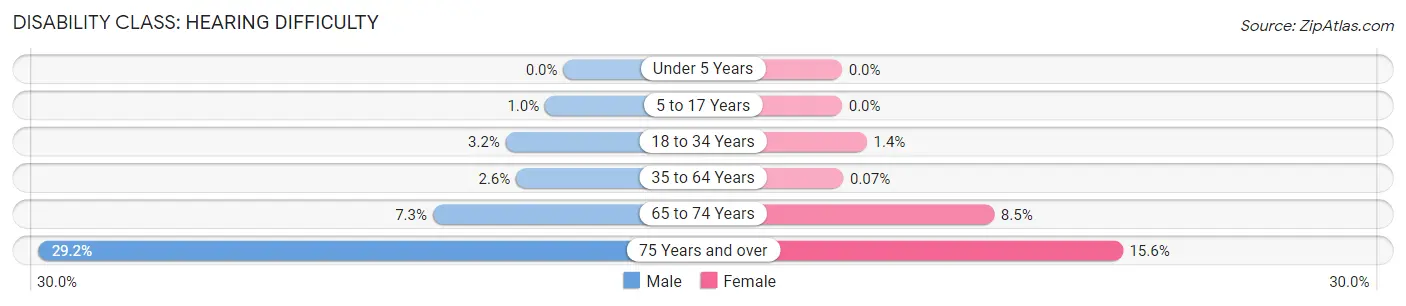
| Age Bracket | Male | Female |
| Under 5 Years | 0 (0.0%) | 0 (0.0%) |
| 5 to 17 Years | 17 (1.0%) | 0 (0.0%) |
| 18 to 34 Years | 62 (3.2%) | 33 (1.4%) |
| 35 to 64 Years | 80 (2.6%) | 2 (0.1%) |
| 65 to 74 Years | 53 (7.3%) | 58 (8.5%) |
| 75 Years and over | 111 (29.2%) | 106 (15.6%) |
Disability Class: Vision Difficulty
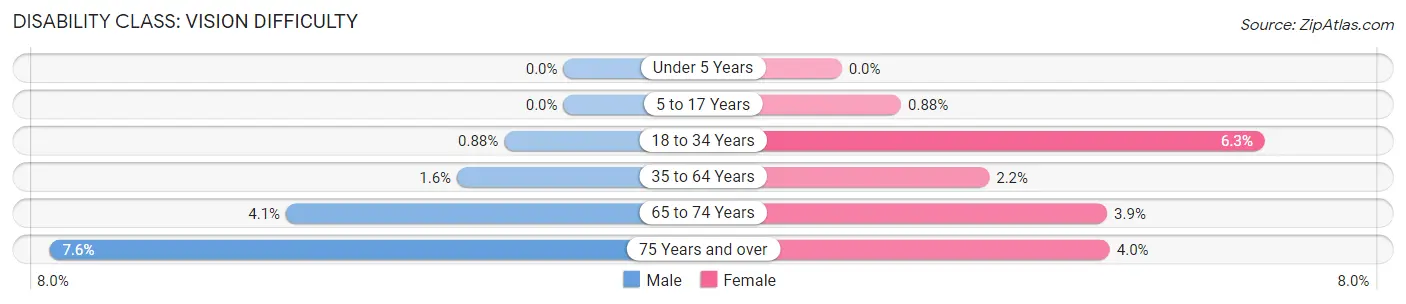
| Age Bracket | Male | Female |
| Under 5 Years | 0 (0.0%) | 0 (0.0%) |
| 5 to 17 Years | 0 (0.0%) | 13 (0.9%) |
| 18 to 34 Years | 17 (0.9%) | 150 (6.3%) |
| 35 to 64 Years | 48 (1.6%) | 62 (2.2%) |
| 65 to 74 Years | 30 (4.1%) | 27 (3.9%) |
| 75 Years and over | 29 (7.6%) | 27 (4.0%) |
Disability Class: Cognitive Difficulty
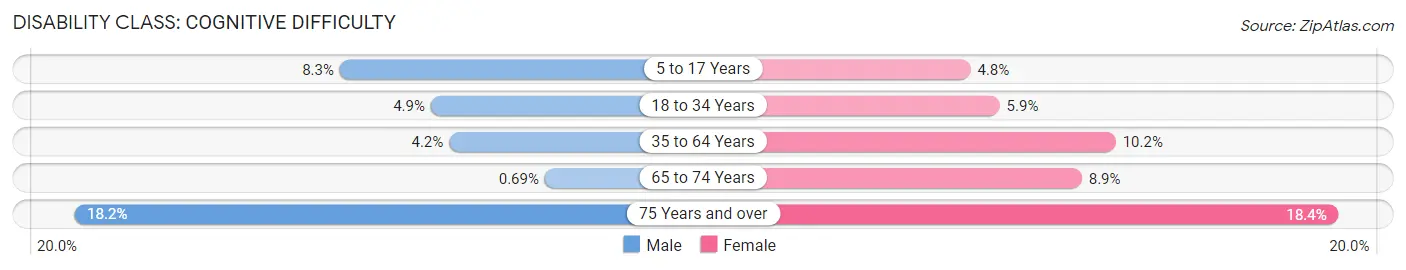
| Age Bracket | Male | Female |
| 5 to 17 Years | 138 (8.3%) | 71 (4.8%) |
| 18 to 34 Years | 95 (4.9%) | 140 (5.9%) |
| 35 to 64 Years | 129 (4.2%) | 288 (10.2%) |
| 65 to 74 Years | 5 (0.7%) | 61 (8.9%) |
| 75 Years and over | 69 (18.2%) | 125 (18.4%) |
Disability Class: Ambulatory Difficulty
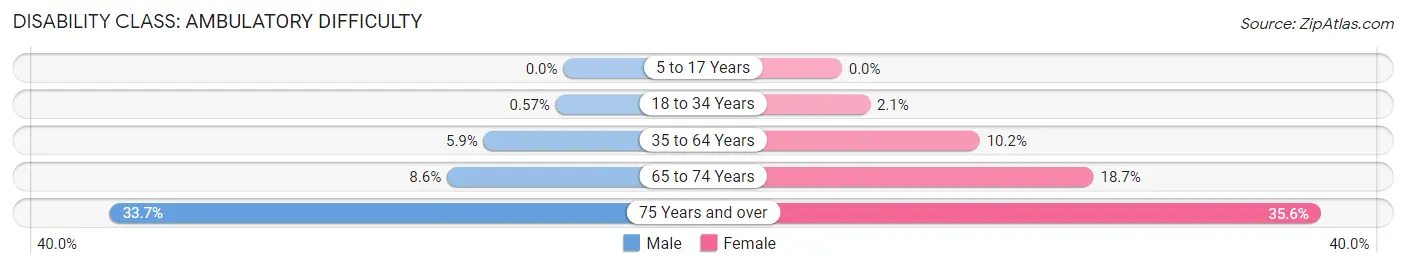
| Age Bracket | Male | Female |
| 5 to 17 Years | 0 (0.0%) | 0 (0.0%) |
| 18 to 34 Years | 11 (0.6%) | 50 (2.1%) |
| 35 to 64 Years | 180 (5.9%) | 290 (10.2%) |
| 65 to 74 Years | 63 (8.6%) | 128 (18.7%) |
| 75 Years and over | 128 (33.7%) | 241 (35.5%) |
Disability Class: Self-Care Difficulty
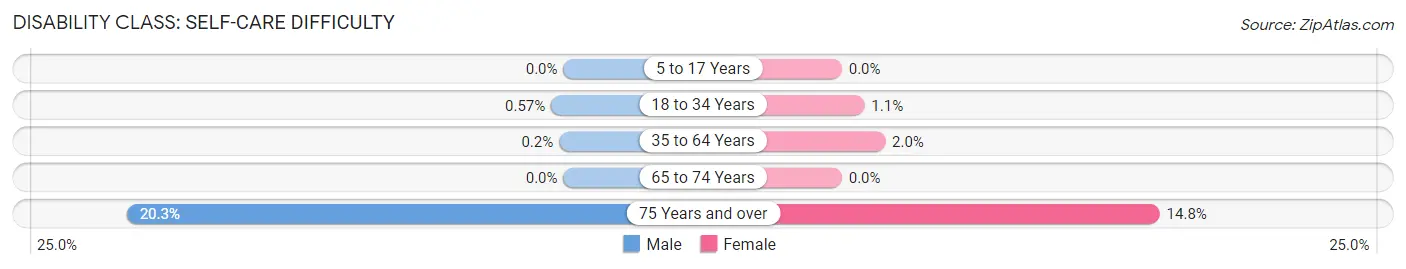
| Age Bracket | Male | Female |
| 5 to 17 Years | 0 (0.0%) | 0 (0.0%) |
| 18 to 34 Years | 11 (0.6%) | 25 (1.1%) |
| 35 to 64 Years | 6 (0.2%) | 57 (2.0%) |
| 65 to 74 Years | 0 (0.0%) | 0 (0.0%) |
| 75 Years and over | 77 (20.3%) | 100 (14.7%) |
Technology Access in Gainesville
Computing Device Access in Gainesville
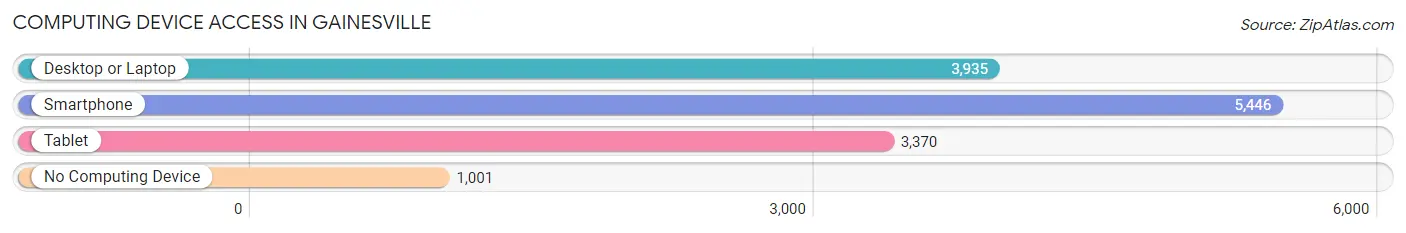
| Device Type | # Households | % Households |
| Desktop or Laptop | 3,935 | 57.9% |
| Smartphone | 5,446 | 80.2% |
| Tablet | 3,370 | 49.6% |
| No Computing Device | 1,001 | 14.7% |
| Total | 6,792 | 100.0% |
Internet Access in Gainesville
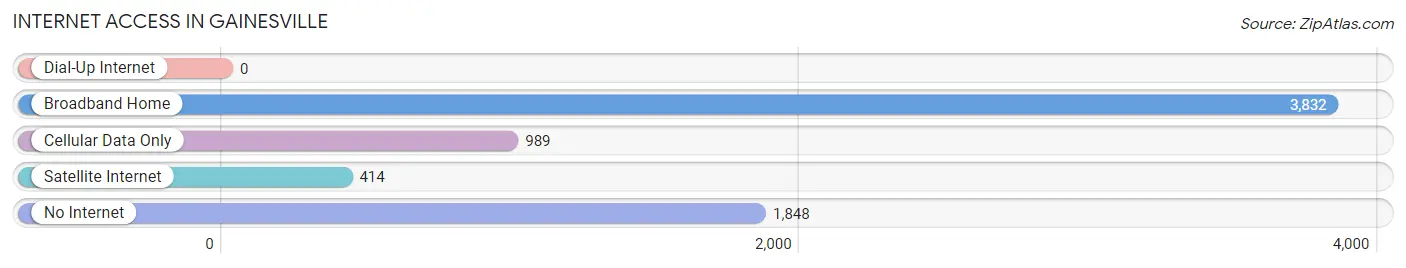
| Internet Type | # Households | % Households |
| Dial-Up Internet | 0 | 0.0% |
| Broadband Home | 3,832 | 56.4% |
| Cellular Data Only | 989 | 14.6% |
| Satellite Internet | 414 | 6.1% |
| No Internet | 1,848 | 27.2% |
| Total | 6,792 | 100.0% |
Gainesville Summary
Gainesville is a city located in Cooke County, Texas, United States. It is the county seat of Cooke County and is part of the Dallas-Fort Worth-Arlington metropolitan area. As of the 2010 census, the city had a population of 16,002.
Geography
Gainesville is located at 33°37'N 97°07'W (33.619, -97.118). According to the United States Census Bureau, the city has a total area of 11.2 square miles (29.0 km2), of which 11.2 square miles (29.0 km2) is land and 0.04 square miles (0.1 km2) (0.18%) is water.
History
Gainesville was founded in 1850 as a trading post along the Shawnee Trail. The city was named after General Edmund Pendleton Gaines, a hero of the War of 1812. The city was incorporated in 1873 and became the county seat of Cooke County in 1876.
Gainesville was a major stop on the Chisholm Trail, and the city's economy was largely based on the cattle industry. In the late 19th century, Gainesville was a major center for cotton production. The city was also home to several large cotton gins and a cottonseed oil mill.
In the early 20th century, Gainesville was a major center for oil production. The city was home to several large oil refineries and a number of oil-related businesses.
Economy
Gainesville's economy is largely based on agriculture and manufacturing. The city is home to several large food processing plants, including a Tyson Foods plant and a Pilgrim's Pride plant. The city is also home to several large manufacturing plants, including a Caterpillar plant and a General Electric plant.
Gainesville is also home to several large retail stores, including Walmart, Lowe's, and Home Depot. The city is also home to several large medical facilities, including a hospital and a nursing home.
Demographics
As of the 2010 census, there were 16,002 people, 6,093 households, and 3,945 families residing in the city. The population density was 1,421.3 people per square mile (548.7/km2). There were 6,717 housing units at an average density of 597.3 per square mile (230.7/km2). The racial makeup of the city was 75.2% White, 11.3% African American, 0.7% Native American, 0.7% Asian, 0.1% Pacific Islander, 9.7% from other races, and 2.2% from two or more races. Hispanic or Latino of any race were 24.2% of the population.
There were 6,093 households, out of which 32.2% had children under the age of 18 living with them, 44.2% were married couples living together, 15.7% had a female householder with no husband present, and 34.7% were non-families. 29.3% of all households were made up of individuals, and 13.2% had someone living alone who was 65 years of age or older. The average household size was 2.54 and the average family size was 3.14.
In the city, the population was spread out, with 26.2% under the age of 18, 9.7% from 18 to 24, 27.2% from 25 to 44, 21.3% from 45 to 64, and 15.6% who were 65 years of age or older. The median age was 35 years. For every 100 females, there were 93.2 males. For every 100 females age 18 and over, there were 89.2 males.
The median income for a household in the city was $30,945, and the median income for a family was $37,945. Males had a median income of $30,945 versus $21,945 for females. The per capita income for the city was $17,945. About 14.2% of families and 17.2% of the population were below the poverty line, including 22.2% of those under age 18 and 11.2% of those age 65 or over.
Common Questions
What is Per Capita Income in Gainesville?
Per Capita income in Gainesville is $25,016.
What is the Median Family Income in Gainesville?
Median Family Income in Gainesville is $58,467.
What is the Median Household income in Gainesville?
Median Household Income in Gainesville is $49,170.
What is Income or Wage Gap in Gainesville?
Income or Wage Gap in Gainesville is 32.3%.
Women in Gainesville earn 67.7 cents for every dollar earned by a man.
What is Family Income Deficit in Gainesville?
Family Income Deficit in Gainesville is $8,743.
Families that are below poverty line in Gainesville earn $8,743 less on average than the poverty threshold level.
What is Inequality or Gini Index in Gainesville?
Inequality or Gini Index in Gainesville is 0.42.
What is the Total Population of Gainesville?
Total Population of Gainesville is 17,459.
What is the Total Male Population of Gainesville?
Total Male Population of Gainesville is 8,561.
What is the Total Female Population of Gainesville?
Total Female Population of Gainesville is 8,898.
What is the Ratio of Males per 100 Females in Gainesville?
There are 96.21 Males per 100 Females in Gainesville.
What is the Ratio of Females per 100 Males in Gainesville?
There are 103.94 Females per 100 Males in Gainesville.
What is the Median Population Age in Gainesville?
Median Population Age in Gainesville is 34.8 Years.
What is the Average Family Size in Gainesville
Average Family Size in Gainesville is 3.1 People.
What is the Average Household Size in Gainesville
Average Household Size in Gainesville is 2.5 People.
How Large is the Labor Force in Gainesville?
There are 8,623 People in the Labor Forcein in Gainesville.
What is the Percentage of People in the Labor Force in Gainesville?
64.2% of People are in the Labor Force in Gainesville.
What is the Unemployment Rate in Gainesville?
Unemployment Rate in Gainesville is 6.1%.