Fulton, TX Map & Demographics
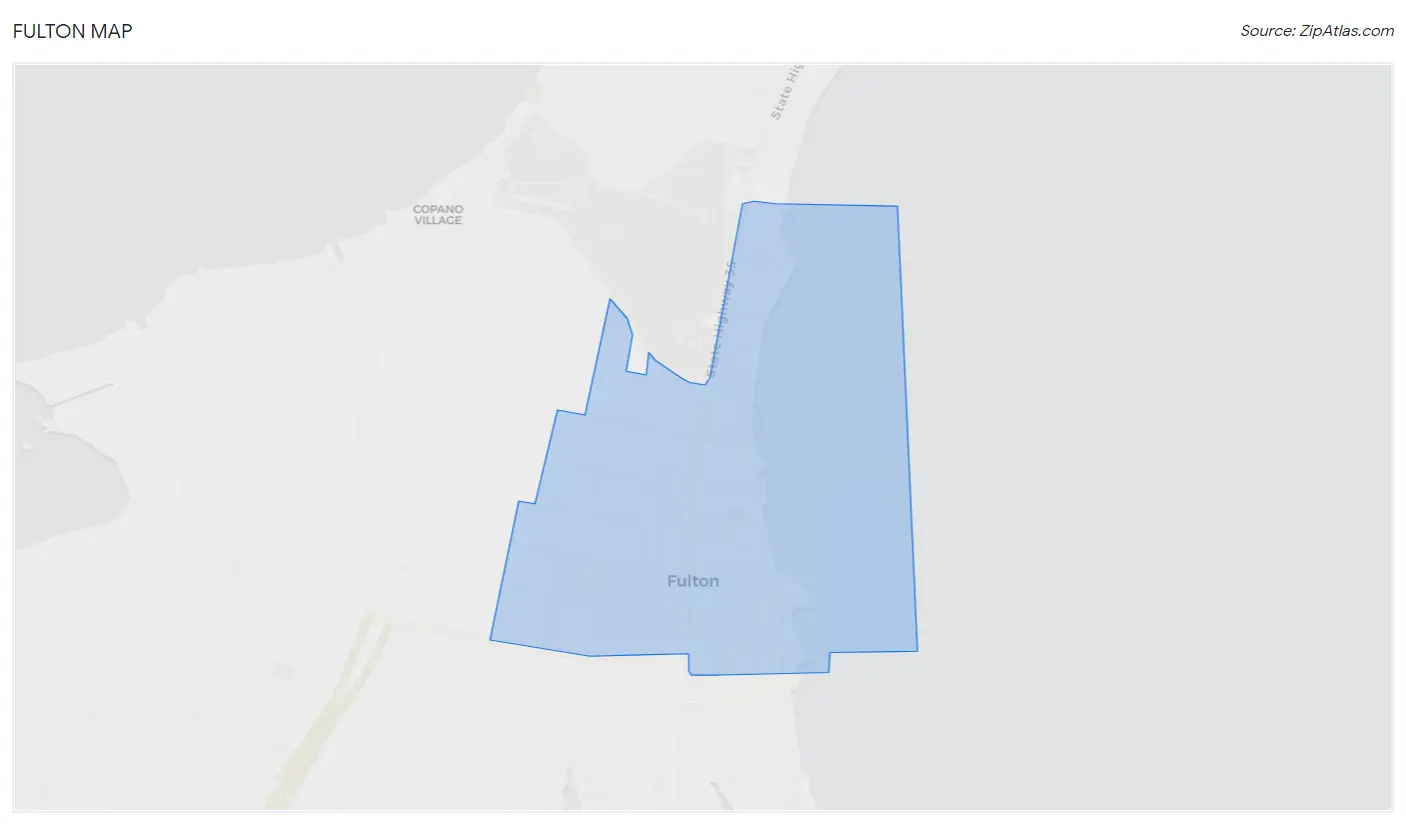
Fulton Map
Fulton Overview
$50,199
PER CAPITA INCOME
$50,204
AVG FAMILY INCOME
$41,900
AVG HOUSEHOLD INCOME
0.59
INEQUALITY / GINI INDEX
1,241
TOTAL POPULATION
439
MALE POPULATION
802
FEMALE POPULATION
54.74
MALES / 100 FEMALES
182.69
FEMALES / 100 MALES
62.0
MEDIAN AGE
1.9
AVG FAMILY SIZE
1.7
AVG HOUSEHOLD SIZE
371
LABOR FORCE [ PEOPLE ]
30.0%
PERCENT IN LABOR FORCE
3.0%
UNEMPLOYMENT RATE
Fulton Zip Codes
Fulton Area Codes
Income in Fulton
Income Overview in Fulton
Per Capita Income in Fulton is $50,199, while median incomes of families and households are $50,204 and $41,900 respectively.
| Characteristic | Number | Measure |
| Per Capita Income | 1,241 | $50,199 |
| Median Family Income | 522 | $50,204 |
| Mean Family Income | 522 | $101,305 |
| Median Household Income | 738 | $41,900 |
| Mean Household Income | 738 | $83,222 |
| Income Deficit | 522 | $0 |
| Wage / Income Gap (%) | 1,241 | 0.00% |
| Wage / Income Gap ($) | 1,241 | 100.00¢ per $1 |
| Gini / Inequality Index | 1,241 | 0.59 |
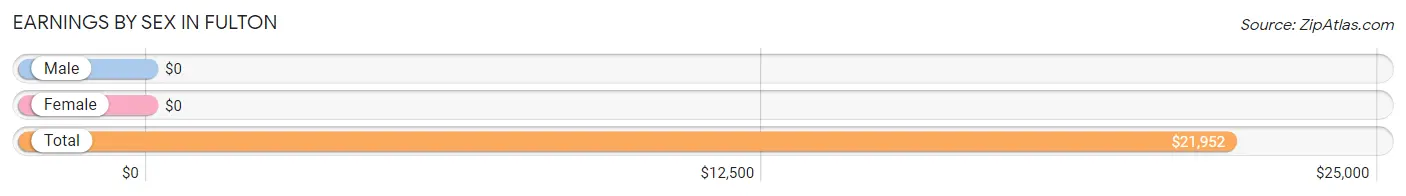
Earnings by Sex in Fulton
| Sex | Number | Average Earnings |
| Male | 275 (39.8%) | $0 |
| Female | 416 (60.2%) | $0 |
| Total | 691 (100.0%) | $21,952 |
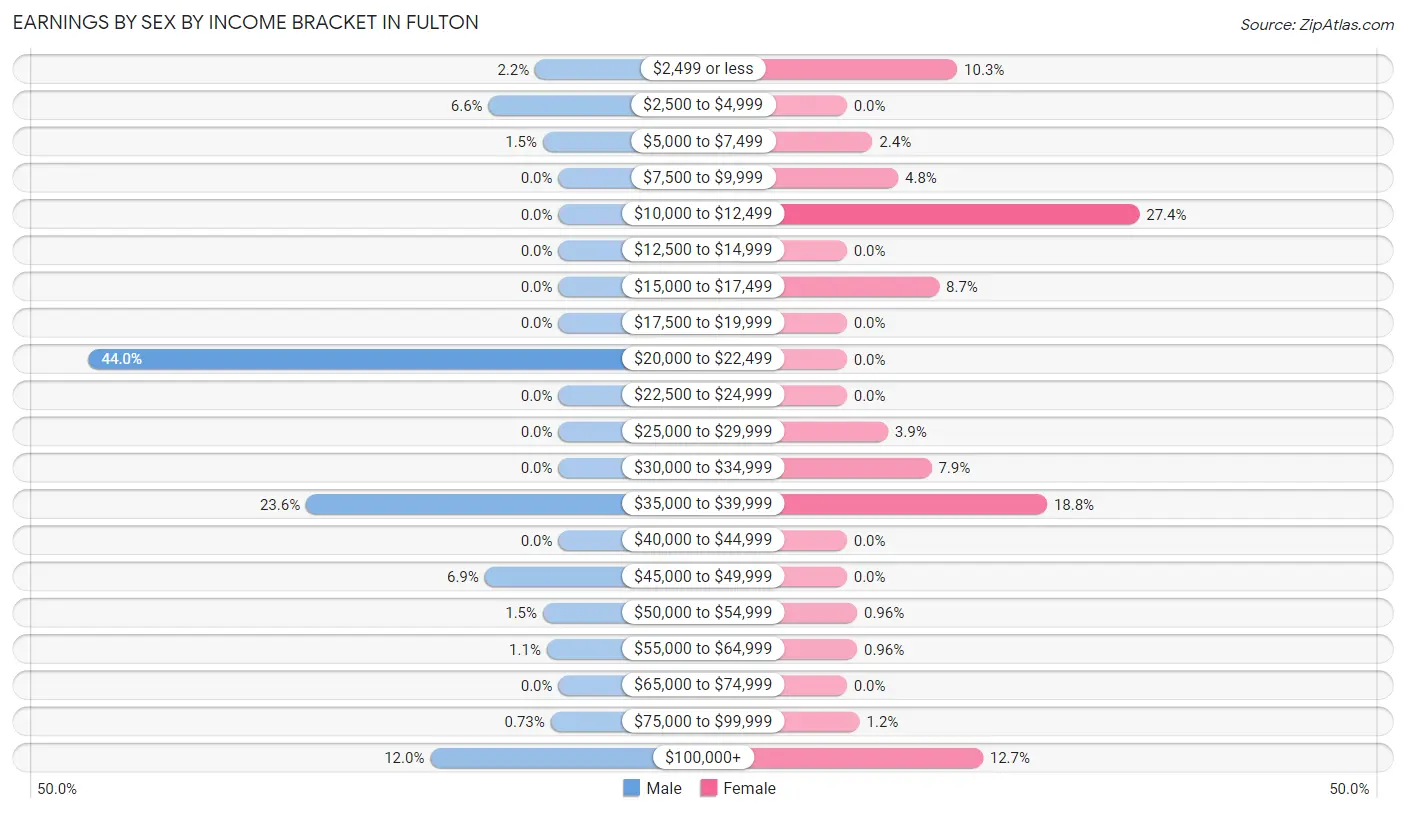
Earnings by Sex by Income Bracket in Fulton
The most common earnings brackets in Fulton are $20,000 to $22,499 for men (121 | 44.0%) and $10,000 to $12,499 for women (114 | 27.4%).
| Income | Male | Female |
| $2,499 or less | 6 (2.2%) | 43 (10.3%) |
| $2,500 to $4,999 | 18 (6.6%) | 0 (0.0%) |
| $5,000 to $7,499 | 4 (1.5%) | 10 (2.4%) |
| $7,500 to $9,999 | 0 (0.0%) | 20 (4.8%) |
| $10,000 to $12,499 | 0 (0.0%) | 114 (27.4%) |
| $12,500 to $14,999 | 0 (0.0%) | 0 (0.0%) |
| $15,000 to $17,499 | 0 (0.0%) | 36 (8.6%) |
| $17,500 to $19,999 | 0 (0.0%) | 0 (0.0%) |
| $20,000 to $22,499 | 121 (44.0%) | 0 (0.0%) |
| $22,500 to $24,999 | 0 (0.0%) | 0 (0.0%) |
| $25,000 to $29,999 | 0 (0.0%) | 16 (3.8%) |
| $30,000 to $34,999 | 0 (0.0%) | 33 (7.9%) |
| $35,000 to $39,999 | 65 (23.6%) | 78 (18.8%) |
| $40,000 to $44,999 | 0 (0.0%) | 0 (0.0%) |
| $45,000 to $49,999 | 19 (6.9%) | 0 (0.0%) |
| $50,000 to $54,999 | 4 (1.5%) | 4 (1.0%) |
| $55,000 to $64,999 | 3 (1.1%) | 4 (1.0%) |
| $65,000 to $74,999 | 0 (0.0%) | 0 (0.0%) |
| $75,000 to $99,999 | 2 (0.7%) | 5 (1.2%) |
| $100,000+ | 33 (12.0%) | 53 (12.7%) |
| Total | 275 (100.0%) | 416 (100.0%) |
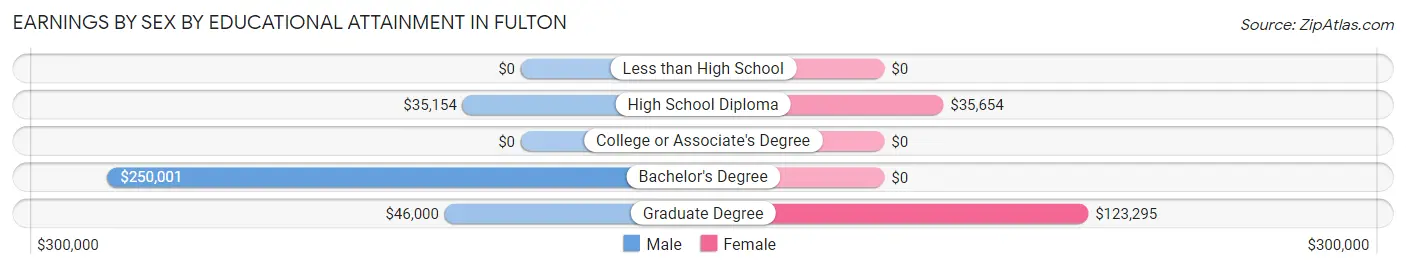
Earnings by Sex by Educational Attainment in Fulton
| Educational Attainment | Male Income | Female Income |
| Less than High School | - | - |
| High School Diploma | $35,154 | $35,654 |
| College or Associate's Degree | - | - |
| Bachelor's Degree | $250,001 | $0 |
| Graduate Degree | $46,000 | $123,295 |
| Total | - | - |
Family Income in Fulton
Family Income Brackets in Fulton
According to the Fulton family income data, there are 188 families falling into the $25,000 to $34,999 income range, which is the most common income bracket and makes up 36.0% of all families.
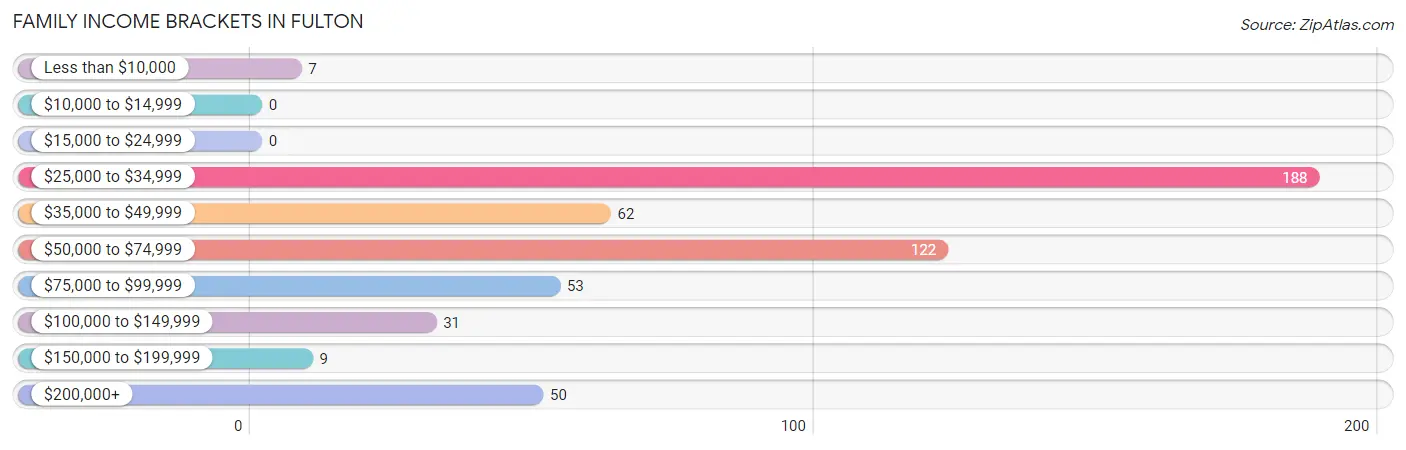
| Income Bracket | # Families | % Families |
| Less than $10,000 | 7 | 1.3% |
| $10,000 to $14,999 | 0 | 0.0% |
| $15,000 to $24,999 | 0 | 0.0% |
| $25,000 to $34,999 | 188 | 36.0% |
| $35,000 to $49,999 | 62 | 11.9% |
| $50,000 to $74,999 | 122 | 23.4% |
| $75,000 to $99,999 | 53 | 10.2% |
| $100,000 to $149,999 | 31 | 5.9% |
| $150,000 to $199,999 | 9 | 1.7% |
| $200,000+ | 50 | 9.6% |
Family Income by Famaliy Size in Fulton
2-person families (407 | 78.0%) account for the highest median family income in Fulton with $72,635 per family, while 2-person families (407 | 78.0%) have the highest median income of $36,318 per family member.
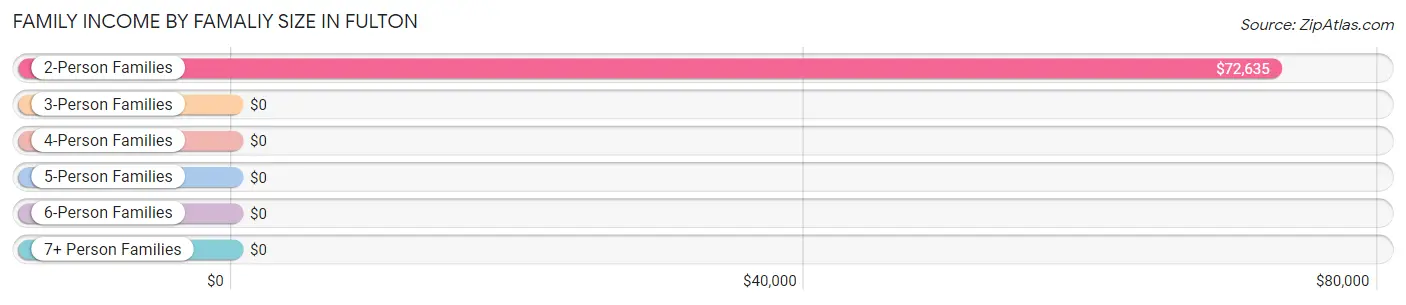
| Income Bracket | # Families | Median Income |
| 2-Person Families | 407 (78.0%) | $72,635 |
| 3-Person Families | 115 (22.0%) | $0 |
| 4-Person Families | 0 (0.0%) | $0 |
| 5-Person Families | 0 (0.0%) | $0 |
| 6-Person Families | 0 (0.0%) | $0 |
| 7+ Person Families | 0 (0.0%) | $0 |
| Total | 522 (100.0%) | $50,204 |
Family Income by Number of Earners in Fulton
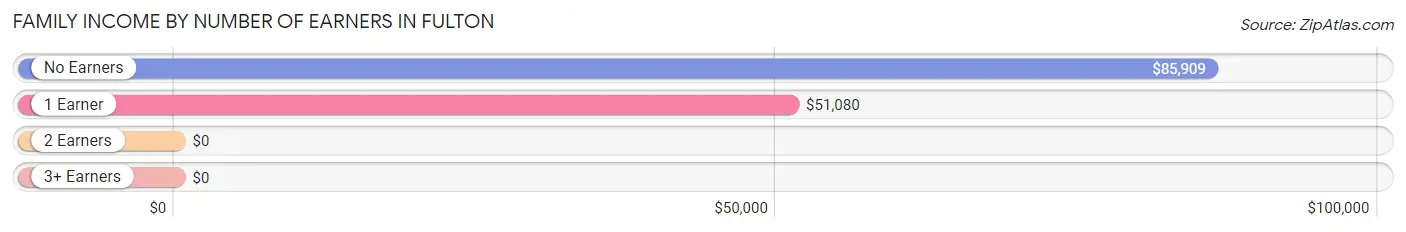
| Number of Earners | # Families | Median Income |
| No Earners | 114 (21.8%) | $85,909 |
| 1 Earner | 130 (24.9%) | $51,080 |
| 2 Earners | 164 (31.4%) | $0 |
| 3+ Earners | 114 (21.8%) | $0 |
| Total | 522 (100.0%) | $50,204 |
Household Income in Fulton
Household Income Brackets in Fulton
With 195 households falling in the category, the $25,000 to $34,999 income range is the most frequent in Fulton, accounting for 26.4% of all households. In contrast, only 14 households (1.9%) fall into the $10,000 to $14,999 income bracket, making it the least populous group.
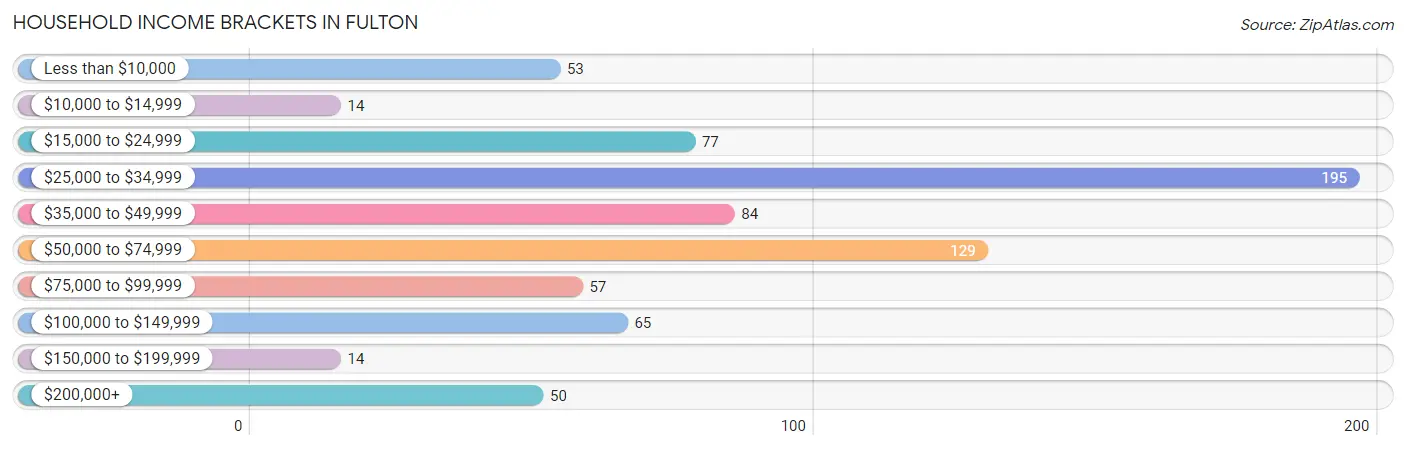
| Income Bracket | # Households | % Households |
| Less than $10,000 | 53 | 7.2% |
| $10,000 to $14,999 | 14 | 1.9% |
| $15,000 to $24,999 | 77 | 10.4% |
| $25,000 to $34,999 | 195 | 26.4% |
| $35,000 to $49,999 | 84 | 11.4% |
| $50,000 to $74,999 | 129 | 17.5% |
| $75,000 to $99,999 | 57 | 7.7% |
| $100,000 to $149,999 | 65 | 8.8% |
| $150,000 to $199,999 | 14 | 1.9% |
| $200,000+ | 50 | 6.8% |
Household Income by Householder Age in Fulton
The median household income in Fulton is $41,900, with the highest median household income of $52,000 found in the 65+ years age bracket for the primary householder. A total of 318 households (43.1%) fall into this category.
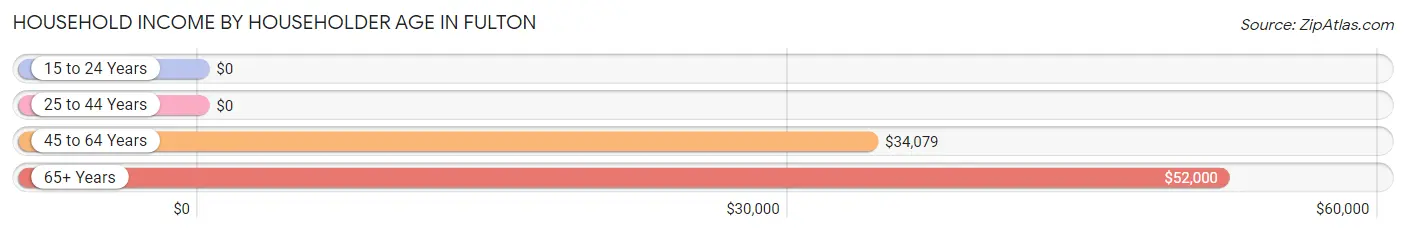
| Income Bracket | # Households | Median Income |
| 15 to 24 Years | 0 (0.0%) | $0 |
| 25 to 44 Years | 0 (0.0%) | $0 |
| 45 to 64 Years | 420 (56.9%) | $34,079 |
| 65+ Years | 318 (43.1%) | $52,000 |
| Total | 738 (100.0%) | $41,900 |
Poverty in Fulton
Income Below Poverty by Sex and Age in Fulton
With 5.2% poverty level for males and 14.0% for females among the residents of Fulton, 65 to 74 year old males and 16 and 17 year old females are the most vulnerable to poverty, with 18 males (30.0%) and 11 females (24.4%) in their respective age groups living below the poverty level.
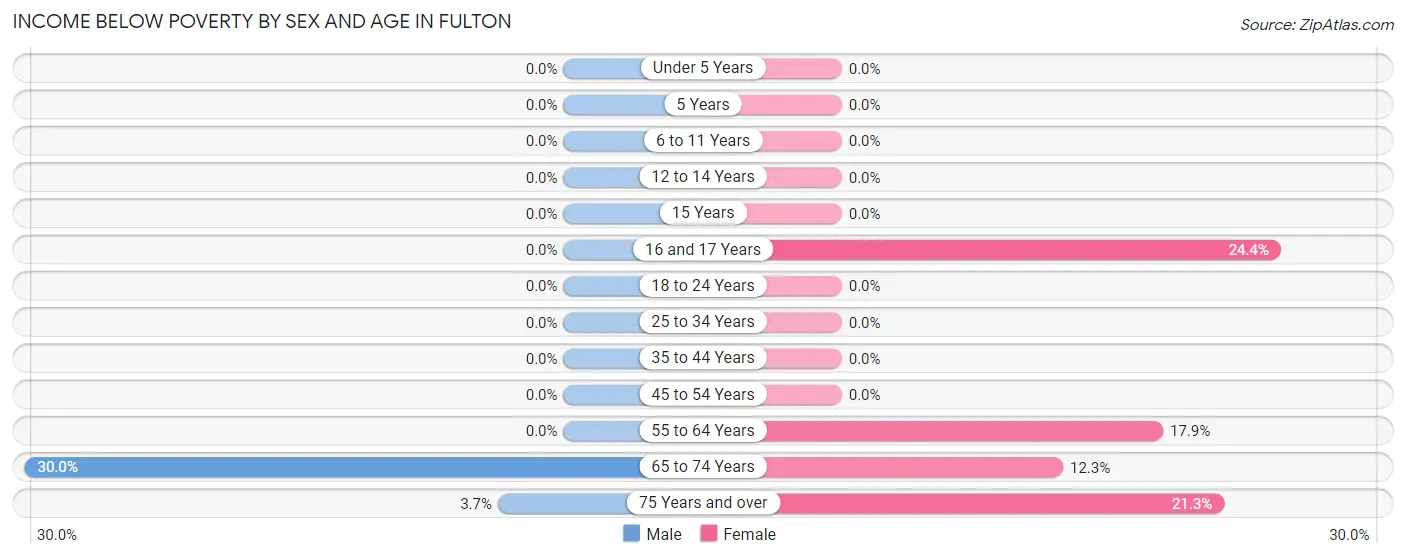
| Age Bracket | Male | Female |
| Under 5 Years | 0 (0.0%) | 0 (0.0%) |
| 5 Years | 0 (0.0%) | 0 (0.0%) |
| 6 to 11 Years | 0 (0.0%) | 0 (0.0%) |
| 12 to 14 Years | 0 (0.0%) | 0 (0.0%) |
| 15 Years | 0 (0.0%) | 0 (0.0%) |
| 16 and 17 Years | 0 (0.0%) | 11 (24.4%) |
| 18 to 24 Years | 0 (0.0%) | 0 (0.0%) |
| 25 to 34 Years | 0 (0.0%) | 0 (0.0%) |
| 35 to 44 Years | 0 (0.0%) | 0 (0.0%) |
| 45 to 54 Years | 0 (0.0%) | 0 (0.0%) |
| 55 to 64 Years | 0 (0.0%) | 51 (17.9%) |
| 65 to 74 Years | 18 (30.0%) | 17 (12.3%) |
| 75 Years and over | 5 (3.6%) | 33 (21.3%) |
| Total | 23 (5.2%) | 112 (14.0%) |
Income Above Poverty by Sex and Age in Fulton
According to the poverty statistics in Fulton, males aged 6 to 11 years and females aged 18 to 24 years are the age groups that are most secure financially, with 100.0% of males and 100.0% of females in these age groups living above the poverty line.
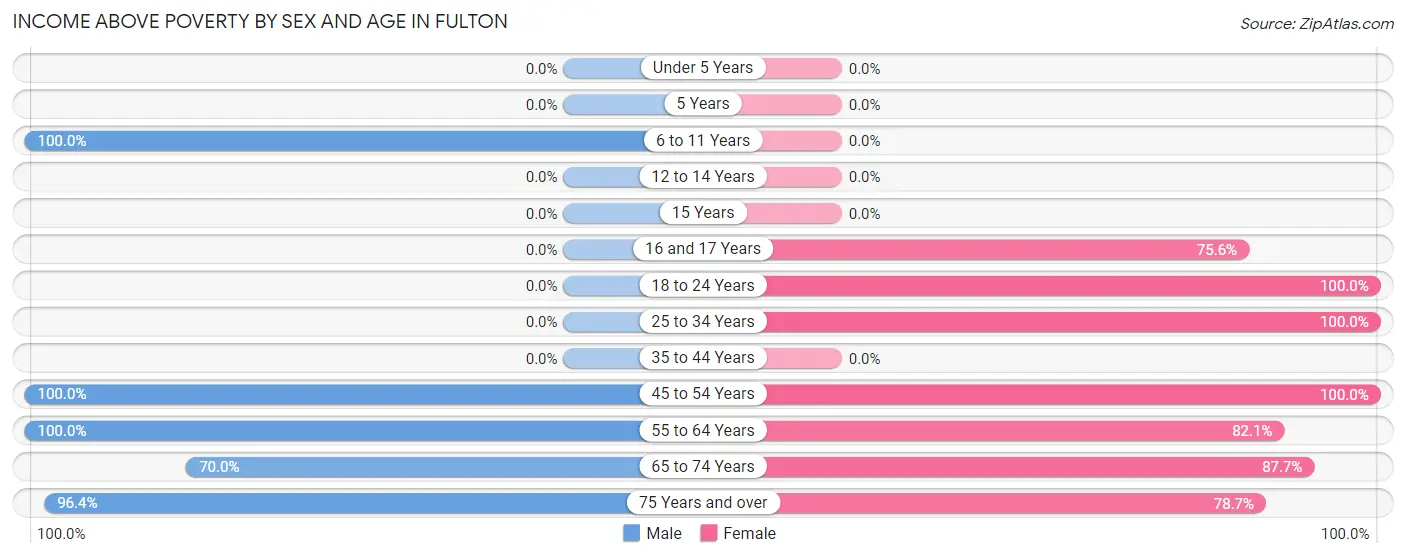
| Age Bracket | Male | Female |
| Under 5 Years | 0 (0.0%) | 0 (0.0%) |
| 5 Years | 0 (0.0%) | 0 (0.0%) |
| 6 to 11 Years | 5 (100.0%) | 0 (0.0%) |
| 12 to 14 Years | 0 (0.0%) | 0 (0.0%) |
| 15 Years | 0 (0.0%) | 0 (0.0%) |
| 16 and 17 Years | 0 (0.0%) | 34 (75.6%) |
| 18 to 24 Years | 0 (0.0%) | 33 (100.0%) |
| 25 to 34 Years | 0 (0.0%) | 1 (100.0%) |
| 35 to 44 Years | 0 (0.0%) | 0 (0.0%) |
| 45 to 54 Years | 85 (100.0%) | 145 (100.0%) |
| 55 to 64 Years | 152 (100.0%) | 234 (82.1%) |
| 65 to 74 Years | 42 (70.0%) | 121 (87.7%) |
| 75 Years and over | 132 (96.4%) | 122 (78.7%) |
| Total | 416 (94.8%) | 690 (86.0%) |
Income Below Poverty Among Married-Couple Families in Fulton
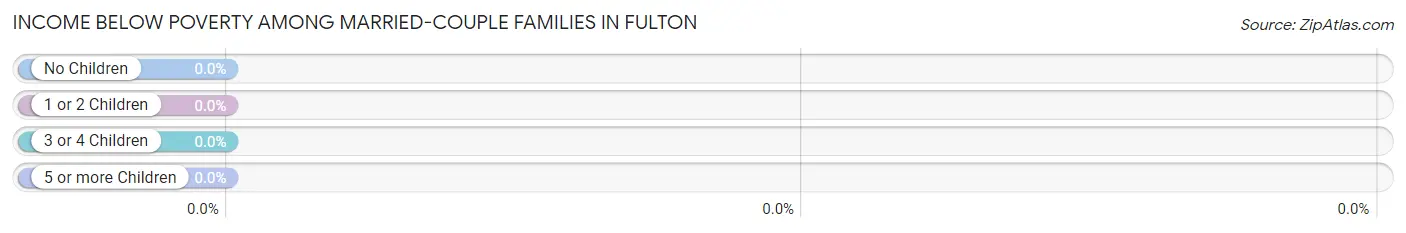
| Children | Above Poverty | Below Poverty |
| No Children | 339 (100.0%) | 0 (0.0%) |
| 1 or 2 Children | 114 (100.0%) | 0 (0.0%) |
| 3 or 4 Children | 0 (0.0%) | 0 (0.0%) |
| 5 or more Children | 0 (0.0%) | 0 (0.0%) |
| Total | 453 (100.0%) | 0 (0.0%) |
Income Below Poverty Among Single-Parent Households in Fulton
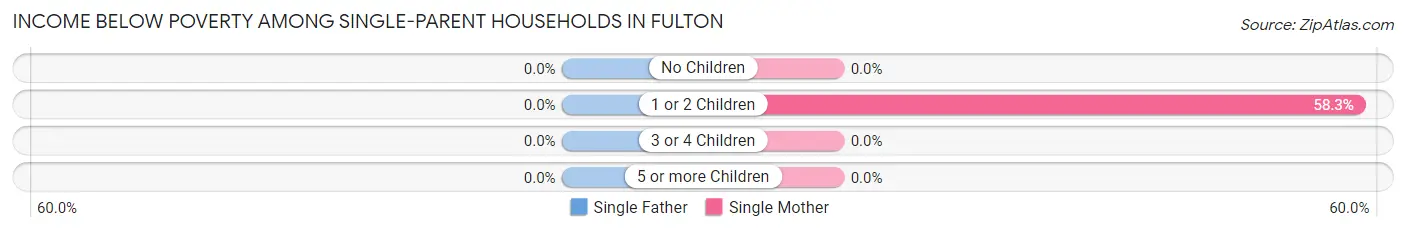
| Children | Single Father | Single Mother |
| No Children | 0 (0.0%) | 0 (0.0%) |
| 1 or 2 Children | 0 (0.0%) | 7 (58.3%) |
| 3 or 4 Children | 0 (0.0%) | 0 (0.0%) |
| 5 or more Children | 0 (0.0%) | 0 (0.0%) |
| Total | 0 (0.0%) | 7 (10.1%) |
Income Below Poverty Among Married-Couple vs Single-Parent Households in Fulton
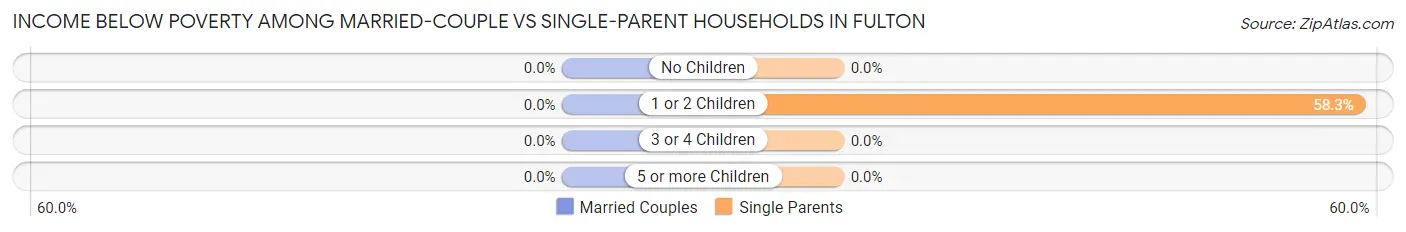
| Children | Married-Couple Families | Single-Parent Households |
| No Children | 0 (0.0%) | 0 (0.0%) |
| 1 or 2 Children | 0 (0.0%) | 7 (58.3%) |
| 3 or 4 Children | 0 (0.0%) | 0 (0.0%) |
| 5 or more Children | 0 (0.0%) | 0 (0.0%) |
| Total | 0 (0.0%) | 7 (10.1%) |
Race in Fulton
The most populous races in Fulton are White / Caucasian (691 | 55.7%), Two or more Races (231 | 18.6%), and Asian (198 | 16.0%).
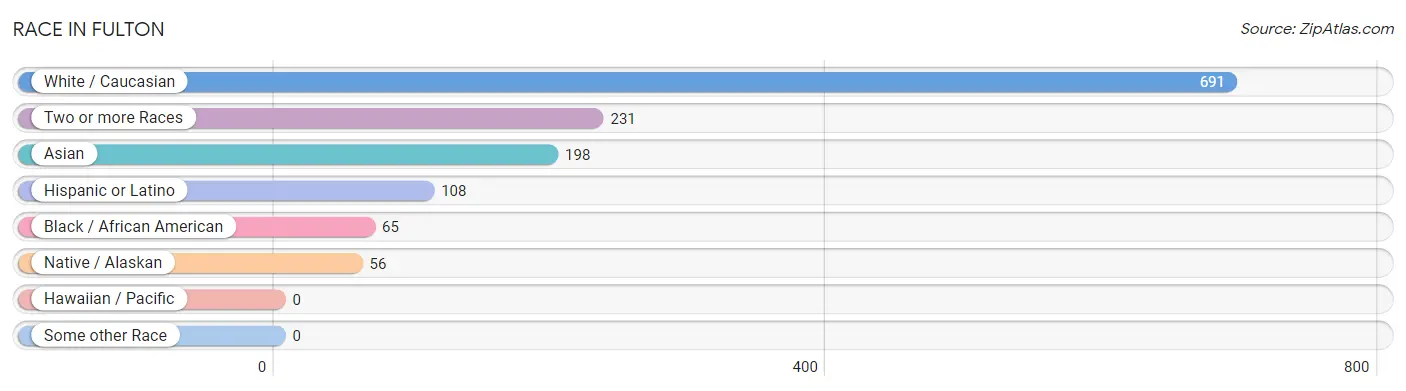
| Race | # Population | % Population |
| Asian | 198 | 16.0% |
| Black / African American | 65 | 5.2% |
| Hawaiian / Pacific | 0 | 0.0% |
| Hispanic or Latino | 108 | 8.7% |
| Native / Alaskan | 56 | 4.5% |
| White / Caucasian | 691 | 55.7% |
| Two or more Races | 231 | 18.6% |
| Some other Race | 0 | 0.0% |
| Total | 1,241 | 100.0% |
Ancestry in Fulton
The most populous ancestries reported in Fulton are German (224 | 18.0%), Sri Lankan (198 | 16.0%), English (191 | 15.4%), Irish (170 | 13.7%), and Cherokee (89 | 7.2%), together accounting for 70.3% of all Fulton residents.
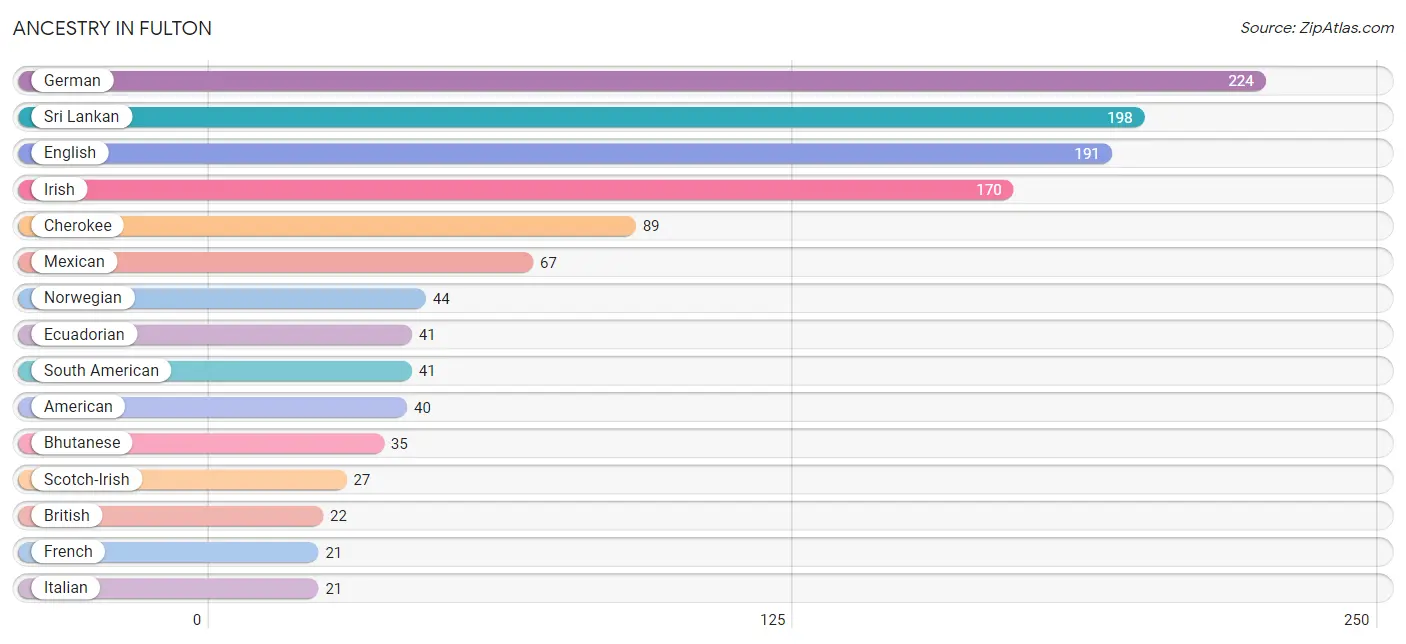
| Ancestry | # Population | % Population |
| American | 40 | 3.2% |
| Arab | 4 | 0.3% |
| Bhutanese | 35 | 2.8% |
| British | 22 | 1.8% |
| Canadian | 3 | 0.2% |
| Cherokee | 89 | 7.2% |
| Choctaw | 16 | 1.3% |
| Dutch | 16 | 1.3% |
| Ecuadorian | 41 | 3.3% |
| English | 191 | 15.4% |
| French | 21 | 1.7% |
| French Canadian | 5 | 0.4% |
| German | 224 | 18.0% |
| Greek | 5 | 0.4% |
| Irish | 170 | 13.7% |
| Italian | 21 | 1.7% |
| Lebanese | 4 | 0.3% |
| Mexican | 67 | 5.4% |
| Norwegian | 44 | 3.5% |
| Osage | 2 | 0.2% |
| Polish | 12 | 1.0% |
| Portuguese | 2 | 0.2% |
| Scotch-Irish | 27 | 2.2% |
| Scottish | 17 | 1.4% |
| Slovak | 5 | 0.4% |
| South American | 41 | 3.3% |
| Sri Lankan | 198 | 16.0% |
| Swedish | 11 | 0.9% |
| Welsh | 8 | 0.6% | View All 29 Rows |
Immigrants in Fulton
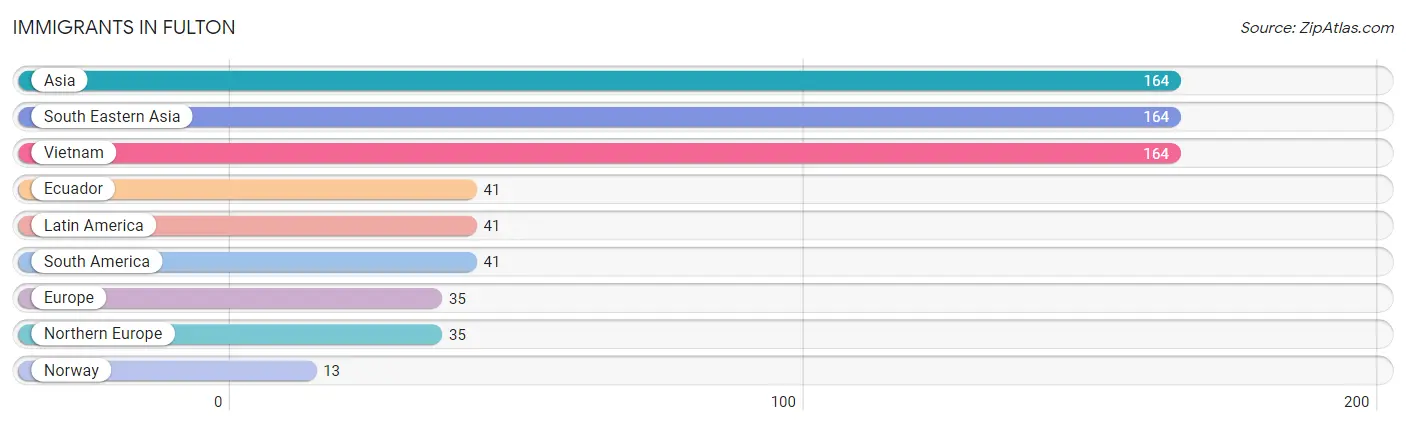
The most numerous immigrant groups reported in Fulton came from Asia (164 | 13.2%), South Eastern Asia (164 | 13.2%), Vietnam (164 | 13.2%), Ecuador (41 | 3.3%), and Latin America (41 | 3.3%), together accounting for 46.3% of all Fulton residents.
| Immigration Origin | # Population | % Population |
| Asia | 164 | 13.2% |
| Ecuador | 41 | 3.3% |
| Europe | 35 | 2.8% |
| Latin America | 41 | 3.3% |
| Northern Europe | 35 | 2.8% |
| Norway | 13 | 1.1% |
| South America | 41 | 3.3% |
| South Eastern Asia | 164 | 13.2% |
| Vietnam | 164 | 13.2% | View All 9 Rows |
Sex and Age in Fulton
Sex and Age in Fulton
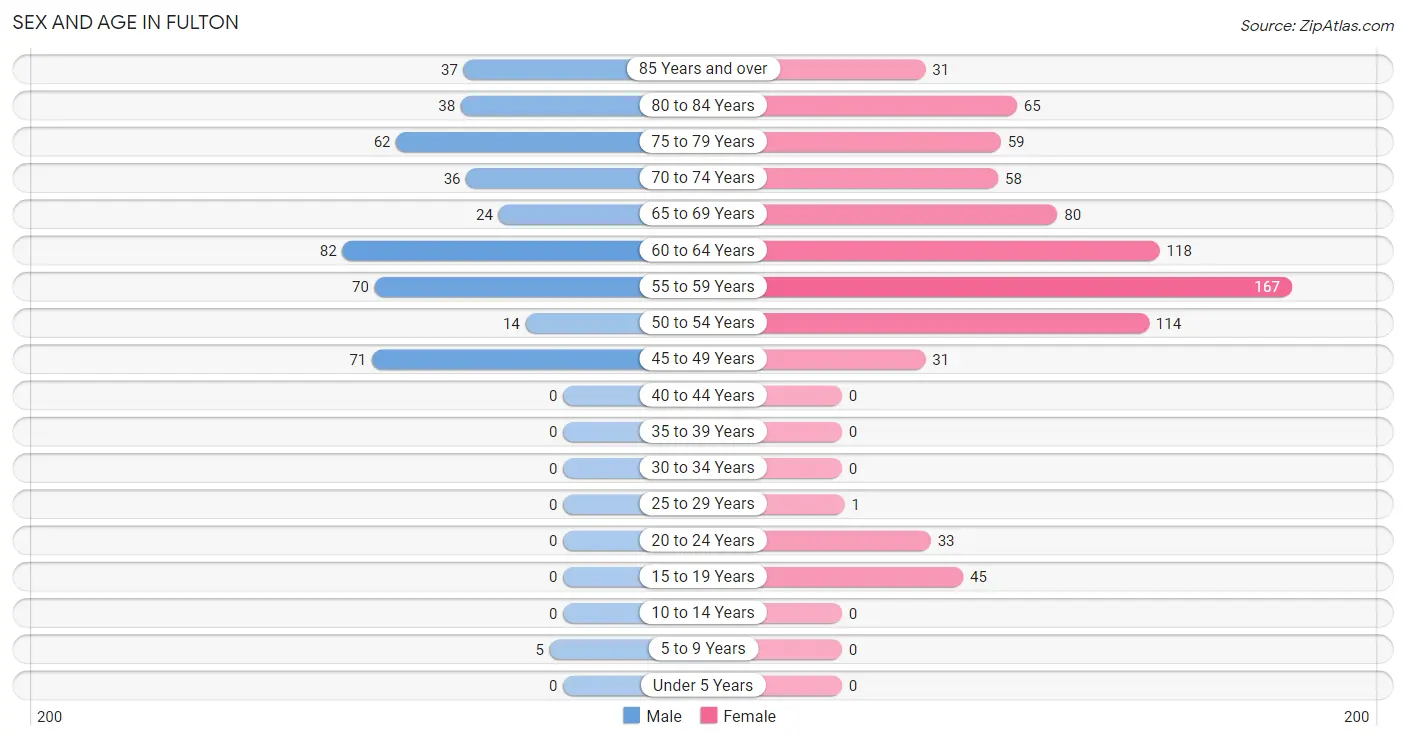
The most populous age groups in Fulton are 60 to 64 Years (82 | 18.7%) for men and 55 to 59 Years (167 | 20.8%) for women.
| Age Bracket | Male | Female |
| Under 5 Years | 0 (0.0%) | 0 (0.0%) |
| 5 to 9 Years | 5 (1.1%) | 0 (0.0%) |
| 10 to 14 Years | 0 (0.0%) | 0 (0.0%) |
| 15 to 19 Years | 0 (0.0%) | 45 (5.6%) |
| 20 to 24 Years | 0 (0.0%) | 33 (4.1%) |
| 25 to 29 Years | 0 (0.0%) | 1 (0.1%) |
| 30 to 34 Years | 0 (0.0%) | 0 (0.0%) |
| 35 to 39 Years | 0 (0.0%) | 0 (0.0%) |
| 40 to 44 Years | 0 (0.0%) | 0 (0.0%) |
| 45 to 49 Years | 71 (16.2%) | 31 (3.9%) |
| 50 to 54 Years | 14 (3.2%) | 114 (14.2%) |
| 55 to 59 Years | 70 (16.0%) | 167 (20.8%) |
| 60 to 64 Years | 82 (18.7%) | 118 (14.7%) |
| 65 to 69 Years | 24 (5.5%) | 80 (10.0%) |
| 70 to 74 Years | 36 (8.2%) | 58 (7.2%) |
| 75 to 79 Years | 62 (14.1%) | 59 (7.4%) |
| 80 to 84 Years | 38 (8.7%) | 65 (8.1%) |
| 85 Years and over | 37 (8.4%) | 31 (3.9%) |
| Total | 439 (100.0%) | 802 (100.0%) |
Families and Households in Fulton
Median Family Size in Fulton

| Family Type | # Families | Family Size |
| Married-Couple | 453 (86.8%) | 1.93 |
| Single Male/Father | 0 (0.0%) | - |
| Single Female/Mother | 69 (13.2%) | 1.80 |
| Total Families | 522 (100.0%) | 1.91 |
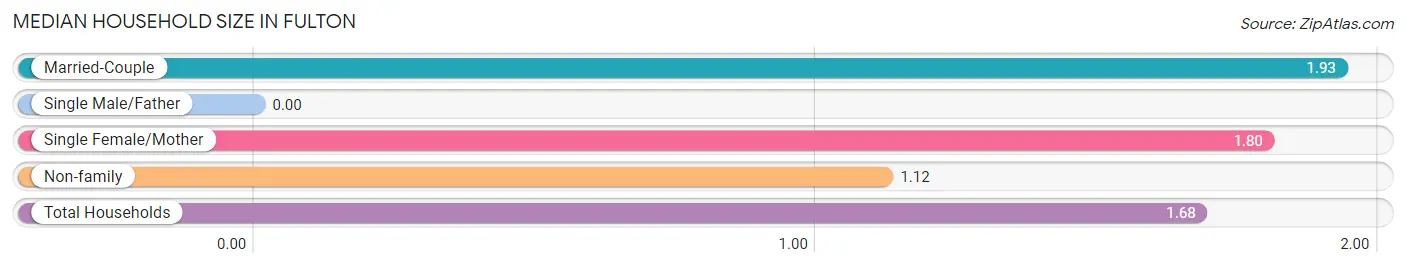
Median Household Size in Fulton
| Household Type | # Households | Household Size |
| Married-Couple | 453 (61.4%) | 1.93 |
| Single Male/Father | 0 (0.0%) | - |
| Single Female/Mother | 69 (9.3%) | 1.80 |
| Non-family | 216 (29.3%) | 1.12 |
| Total Households | 738 (100.0%) | 1.68 |
Household Size by Marriage Status in Fulton
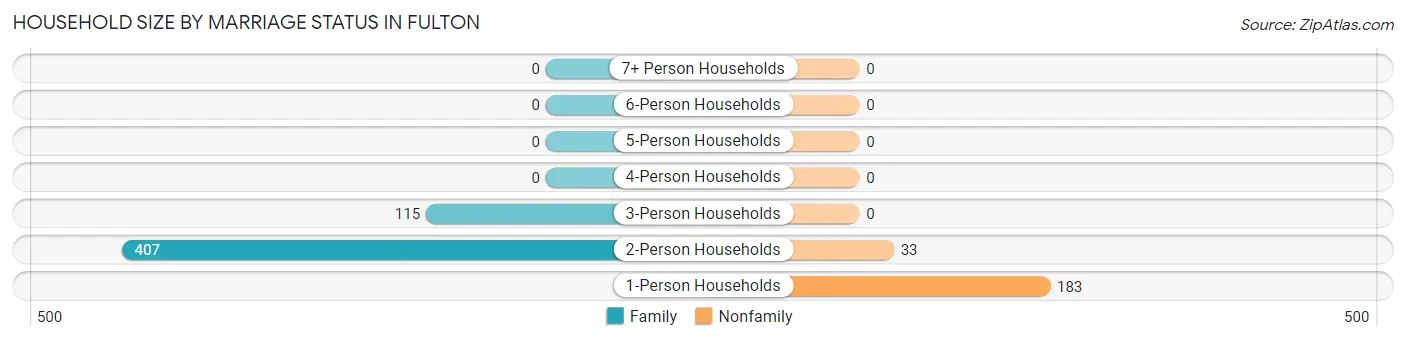
Out of a total of 738 households in Fulton, 522 (70.7%) are family households, while 216 (29.3%) are nonfamily households. The most numerous type of family households are 2-person households, comprising 407, and the most common type of nonfamily households are 1-person households, comprising 183.
| Household Size | Family Households | Nonfamily Households |
| 1-Person Households | - | 183 (24.8%) |
| 2-Person Households | 407 (55.1%) | 33 (4.5%) |
| 3-Person Households | 115 (15.6%) | 0 (0.0%) |
| 4-Person Households | 0 (0.0%) | 0 (0.0%) |
| 5-Person Households | 0 (0.0%) | 0 (0.0%) |
| 6-Person Households | 0 (0.0%) | 0 (0.0%) |
| 7+ Person Households | 0 (0.0%) | 0 (0.0%) |
| Total | 522 (70.7%) | 216 (29.3%) |
Female Fertility in Fulton
Fertility by Age in Fulton
| Age Bracket | Women with Births | Births / 1,000 Women |
| 15 to 19 years | 0 (0.0%) | 0.0 |
| 20 to 34 years | 0 (0.0%) | 0.0 |
| 35 to 50 years | 0 (0.0%) | 0.0 |
| Total | 0 (0.0%) | 0.0 |
Fertility by Age by Marriage Status in Fulton
| Age Bracket | Married | Unmarried |
| 15 to 19 years | 0 (0.0%) | 0 (0.0%) |
| 20 to 34 years | 0 (0.0%) | 0 (0.0%) |
| 35 to 50 years | 0 (0.0%) | 0 (0.0%) |
| Total | 0 (0.0%) | 0 (0.0%) |
Fertility by Education in Fulton
| Educational Attainment | Women with Births | Births / 1,000 Women |
| Less than High School | 0 (0.0%) | 0.0 |
| High School Diploma | 0 (0.0%) | 0.0 |
| College or Associate's Degree | 0 (0.0%) | 0.0 |
| Bachelor's Degree | 0 (0.0%) | 0.0 |
| Graduate Degree | 0 (0.0%) | 0.0 |
| Total | 0 (0.0%) | 0.0 |
Fertility by Education by Marriage Status in Fulton
| Educational Attainment | Married | Unmarried |
| Less than High School | 0 (0.0%) | 0 (0.0%) |
| High School Diploma | 0 (0.0%) | 0 (0.0%) |
| College or Associate's Degree | 0 (0.0%) | 0 (0.0%) |
| Bachelor's Degree | 0 (0.0%) | 0 (0.0%) |
| Graduate Degree | 0 (0.0%) | 0 (0.0%) |
| Total | 0 (0.0%) | 0 (0.0%) |
Employment Characteristics in Fulton
Employment by Class of Employer in Fulton
Among the 359 employed individuals in Fulton, private company employees (147 | 40.9%), self-employed (not incorporated) (70 | 19.5%), and not-for-profit organizations (65 | 18.1%) make up the most common classes of employment.
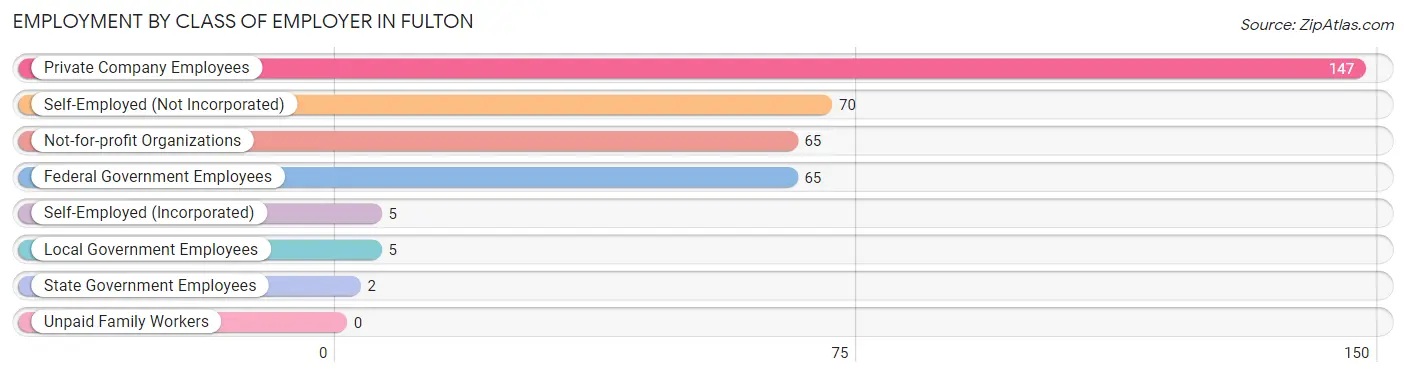
| Employer Class | # Employees | % Employees |
| Private Company Employees | 147 | 40.9% |
| Self-Employed (Incorporated) | 5 | 1.4% |
| Self-Employed (Not Incorporated) | 70 | 19.5% |
| Not-for-profit Organizations | 65 | 18.1% |
| Local Government Employees | 5 | 1.4% |
| State Government Employees | 2 | 0.6% |
| Federal Government Employees | 65 | 18.1% |
| Unpaid Family Workers | 0 | 0.0% |
| Total | 359 | 100.0% |
Employment Status by Age in Fulton
According to the labor force statistics for Fulton, out of the total population over 16 years of age (1,236), 30.0% or 371 individuals are in the labor force, with 3.0% or 11 of them unemployed. The age group with the highest labor force participation rate is 20 to 24 years, with 100.0% or 33 individuals in the labor force. Within the labor force, the 75 years and over age range has the highest percentage of unemployed individuals, with 68.8% or 11 of them being unemployed.
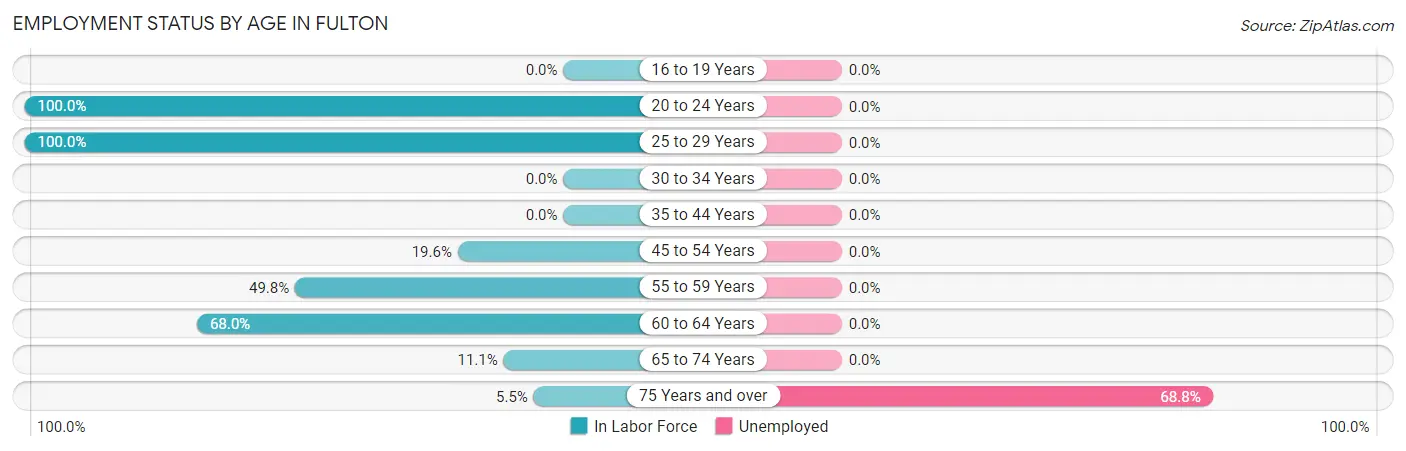
| Age Bracket | In Labor Force | Unemployed |
| 16 to 19 Years | 0 (0.0%) | 0 (0.0%) |
| 20 to 24 Years | 33 (100.0%) | 0 (0.0%) |
| 25 to 29 Years | 1 (100.0%) | 0 (0.0%) |
| 30 to 34 Years | 0 (0.0%) | 0 (0.0%) |
| 35 to 44 Years | 0 (0.0%) | 0 (0.0%) |
| 45 to 54 Years | 45 (19.6%) | 0 (0.0%) |
| 55 to 59 Years | 118 (49.8%) | 0 (0.0%) |
| 60 to 64 Years | 136 (68.0%) | 0 (0.0%) |
| 65 to 74 Years | 22 (11.1%) | 0 (0.0%) |
| 75 Years and over | 16 (5.5%) | 11 (68.8%) |
| Total | 371 (30.0%) | 11 (3.0%) |
Employment Status by Educational Attainment in Fulton
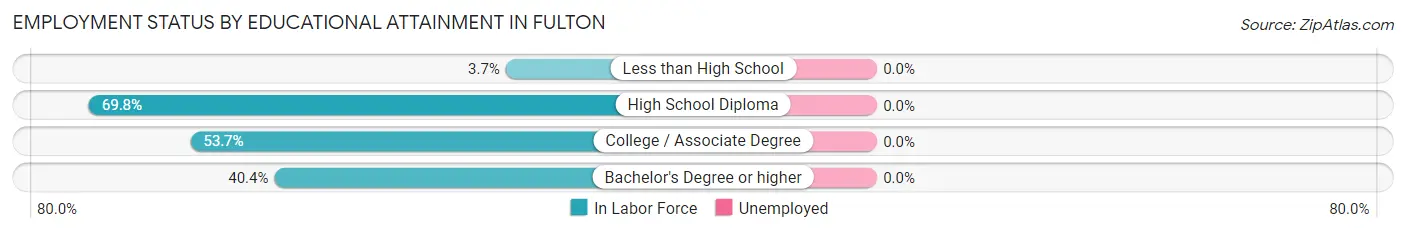
| Educational Attainment | In Labor Force | Unemployed |
| Less than High School | 7 (3.7%) | 0 (0.0%) |
| High School Diploma | 183 (69.8%) | 0 (0.0%) |
| College / Associate Degree | 87 (53.7%) | 0 (0.0%) |
| Bachelor's Degree or higher | 23 (40.4%) | 0 (0.0%) |
| Total | 300 (44.9%) | 0 (0.0%) |
Employment Occupations by Sex in Fulton
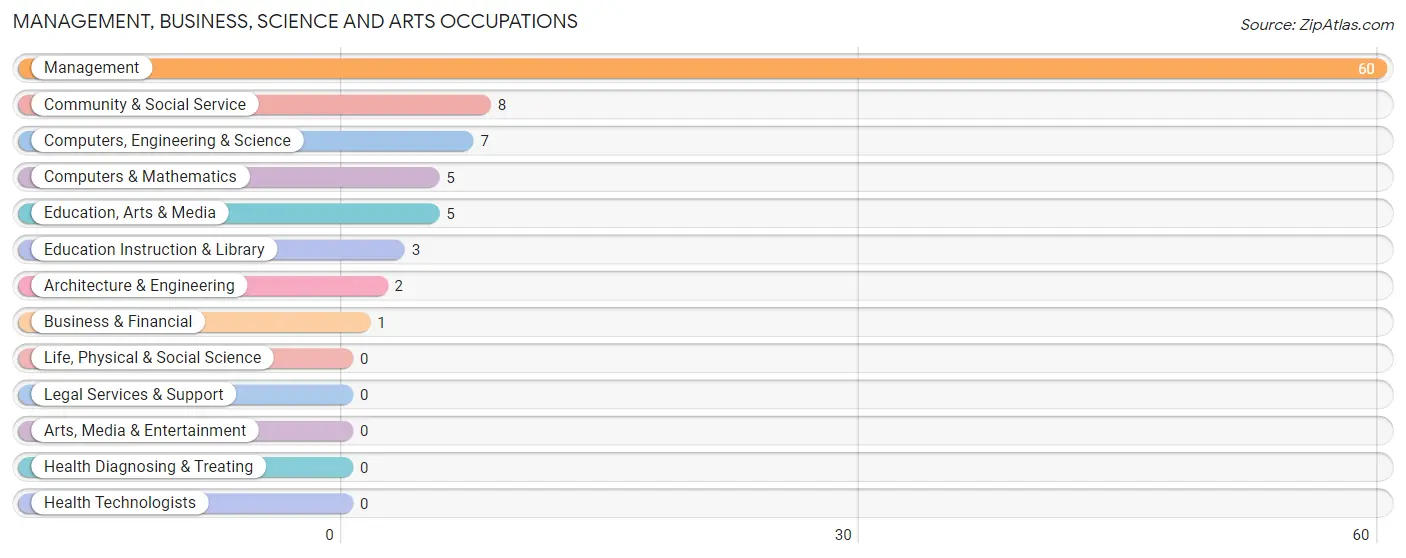
Management, Business, Science and Arts Occupations
The most common Management, Business, Science and Arts occupations in Fulton are Management (60 | 16.7%), Community & Social Service (8 | 2.2%), Computers, Engineering & Science (7 | 1.9%), Computers & Mathematics (5 | 1.4%), and Education, Arts & Media (5 | 1.4%).
Management, Business, Science and Arts Occupations by Sex
Within the Management, Business, Science and Arts occupations in Fulton, the most male-oriented occupations are Computers, Engineering & Science (100.0%), Computers & Mathematics (100.0%), and Architecture & Engineering (100.0%), while the most female-oriented occupations are Business & Financial (100.0%), Education, Arts & Media (100.0%), and Management (86.7%).
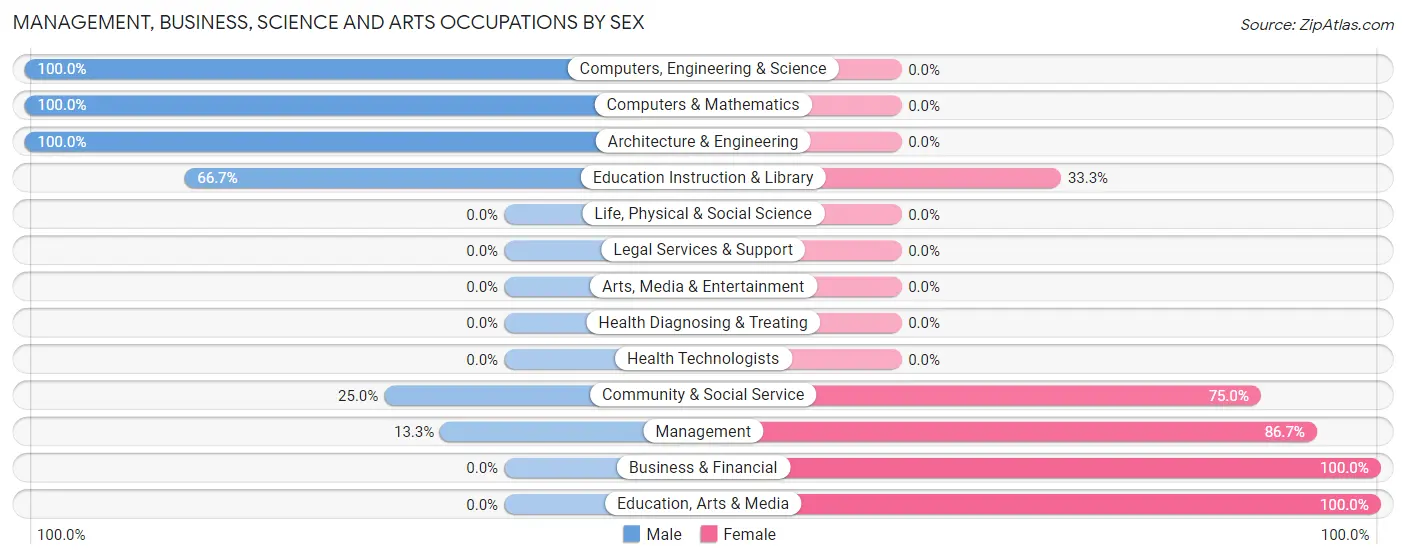
| Occupation | Male | Female |
| Management | 8 (13.3%) | 52 (86.7%) |
| Business & Financial | 0 (0.0%) | 1 (100.0%) |
| Computers, Engineering & Science | 7 (100.0%) | 0 (0.0%) |
| Computers & Mathematics | 5 (100.0%) | 0 (0.0%) |
| Architecture & Engineering | 2 (100.0%) | 0 (0.0%) |
| Life, Physical & Social Science | 0 (0.0%) | 0 (0.0%) |
| Community & Social Service | 2 (25.0%) | 6 (75.0%) |
| Education, Arts & Media | 0 (0.0%) | 5 (100.0%) |
| Legal Services & Support | 0 (0.0%) | 0 (0.0%) |
| Education Instruction & Library | 2 (66.7%) | 1 (33.3%) |
| Arts, Media & Entertainment | 0 (0.0%) | 0 (0.0%) |
| Health Diagnosing & Treating | 0 (0.0%) | 0 (0.0%) |
| Health Technologists | 0 (0.0%) | 0 (0.0%) |
| Total (Category) | 17 (22.4%) | 59 (77.6%) |
| Total (Overall) | 115 (31.9%) | 245 (68.1%) |
Services Occupations
The most common Services occupations in Fulton are Healthcare Support (133 | 36.9%), and Food Preparation & Serving (20 | 5.6%).
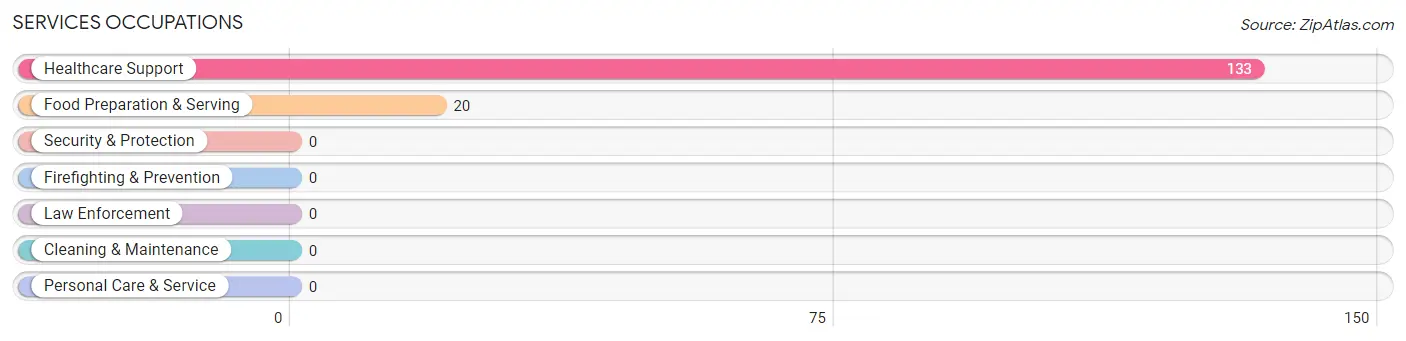
Services Occupations by Sex
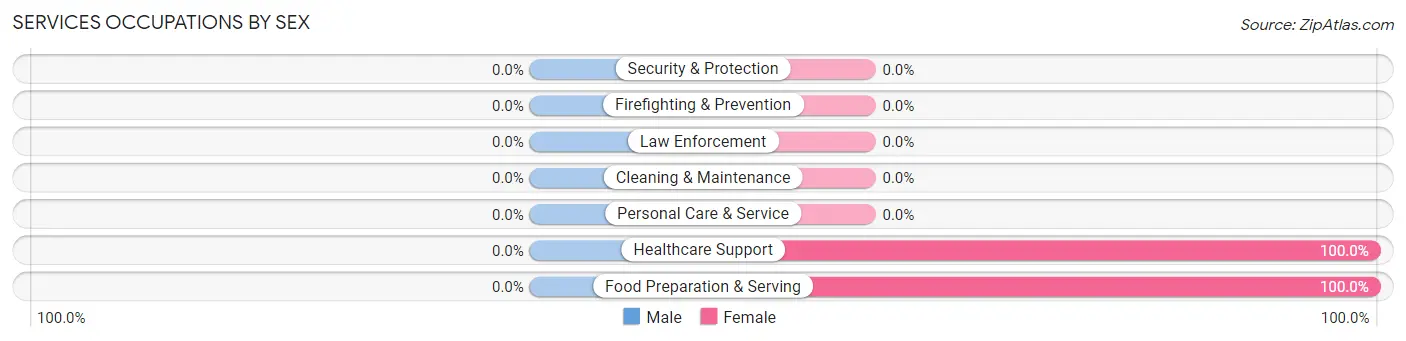
| Occupation | Male | Female |
| Healthcare Support | 0 (0.0%) | 133 (100.0%) |
| Security & Protection | 0 (0.0%) | 0 (0.0%) |
| Firefighting & Prevention | 0 (0.0%) | 0 (0.0%) |
| Law Enforcement | 0 (0.0%) | 0 (0.0%) |
| Food Preparation & Serving | 0 (0.0%) | 20 (100.0%) |
| Cleaning & Maintenance | 0 (0.0%) | 0 (0.0%) |
| Personal Care & Service | 0 (0.0%) | 0 (0.0%) |
| Total (Category) | 0 (0.0%) | 153 (100.0%) |
| Total (Overall) | 115 (31.9%) | 245 (68.1%) |
Sales and Office Occupations
The most common Sales and Office occupations in Fulton are Sales & Related (21 | 5.8%), and Office & Administration (17 | 4.7%).
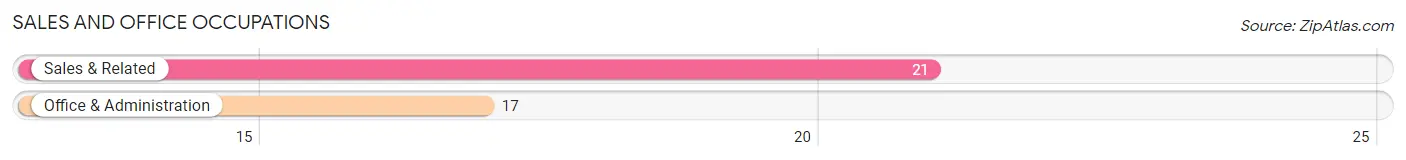
Sales and Office Occupations by Sex

| Occupation | Male | Female |
| Sales & Related | 12 (57.1%) | 9 (42.9%) |
| Office & Administration | 0 (0.0%) | 17 (100.0%) |
| Total (Category) | 12 (31.6%) | 26 (68.4%) |
| Total (Overall) | 115 (31.9%) | 245 (68.1%) |
Natural Resources, Construction and Maintenance Occupations
The most common Natural Resources, Construction and Maintenance occupations in Fulton are Construction & Extraction (14 | 3.9%), and Installation, Maintenance & Repair (4 | 1.1%).
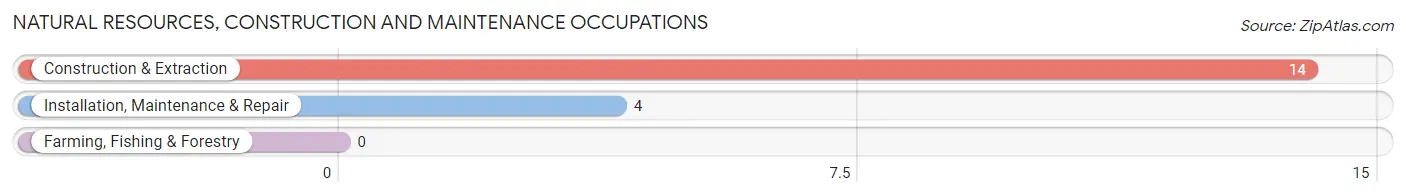
Natural Resources, Construction and Maintenance Occupations by Sex
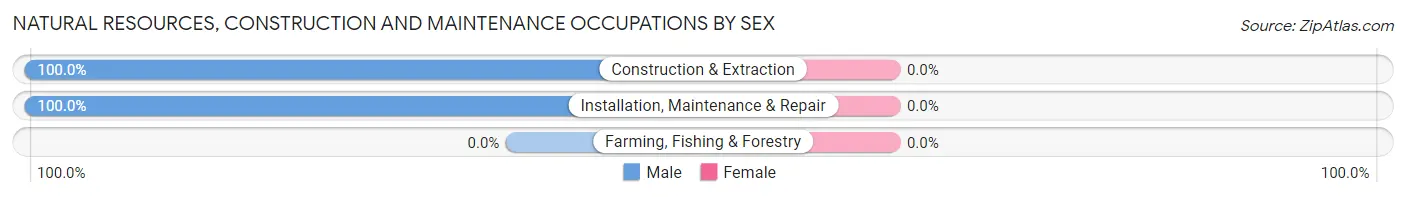
| Occupation | Male | Female |
| Farming, Fishing & Forestry | 0 (0.0%) | 0 (0.0%) |
| Construction & Extraction | 14 (100.0%) | 0 (0.0%) |
| Installation, Maintenance & Repair | 4 (100.0%) | 0 (0.0%) |
| Total (Category) | 18 (100.0%) | 0 (0.0%) |
| Total (Overall) | 115 (31.9%) | 245 (68.1%) |
Production, Transportation and Moving Occupations
The most common Production, Transportation and Moving occupations in Fulton are , and Transportation (75 | 20.8%).
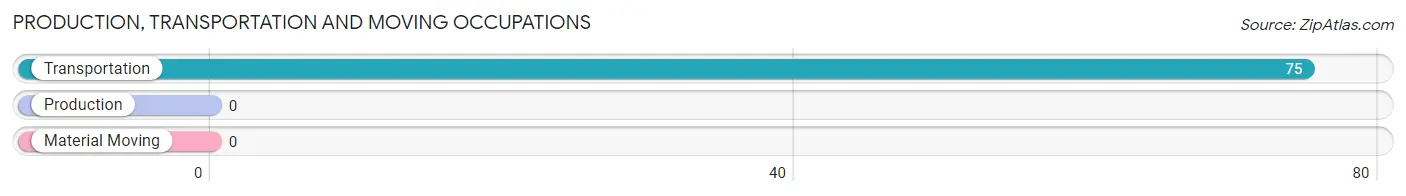
Production, Transportation and Moving Occupations by Sex
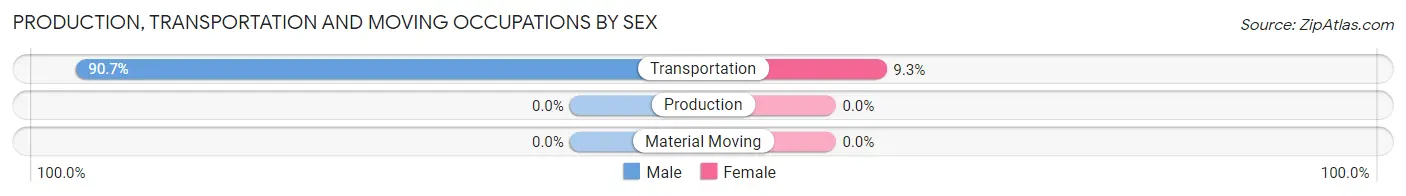
| Occupation | Male | Female |
| Production | 0 (0.0%) | 0 (0.0%) |
| Transportation | 68 (90.7%) | 7 (9.3%) |
| Material Moving | 0 (0.0%) | 0 (0.0%) |
| Total (Category) | 68 (90.7%) | 7 (9.3%) |
| Total (Overall) | 115 (31.9%) | 245 (68.1%) |
Employment Industries by Sex in Fulton
Employment Industries in Fulton
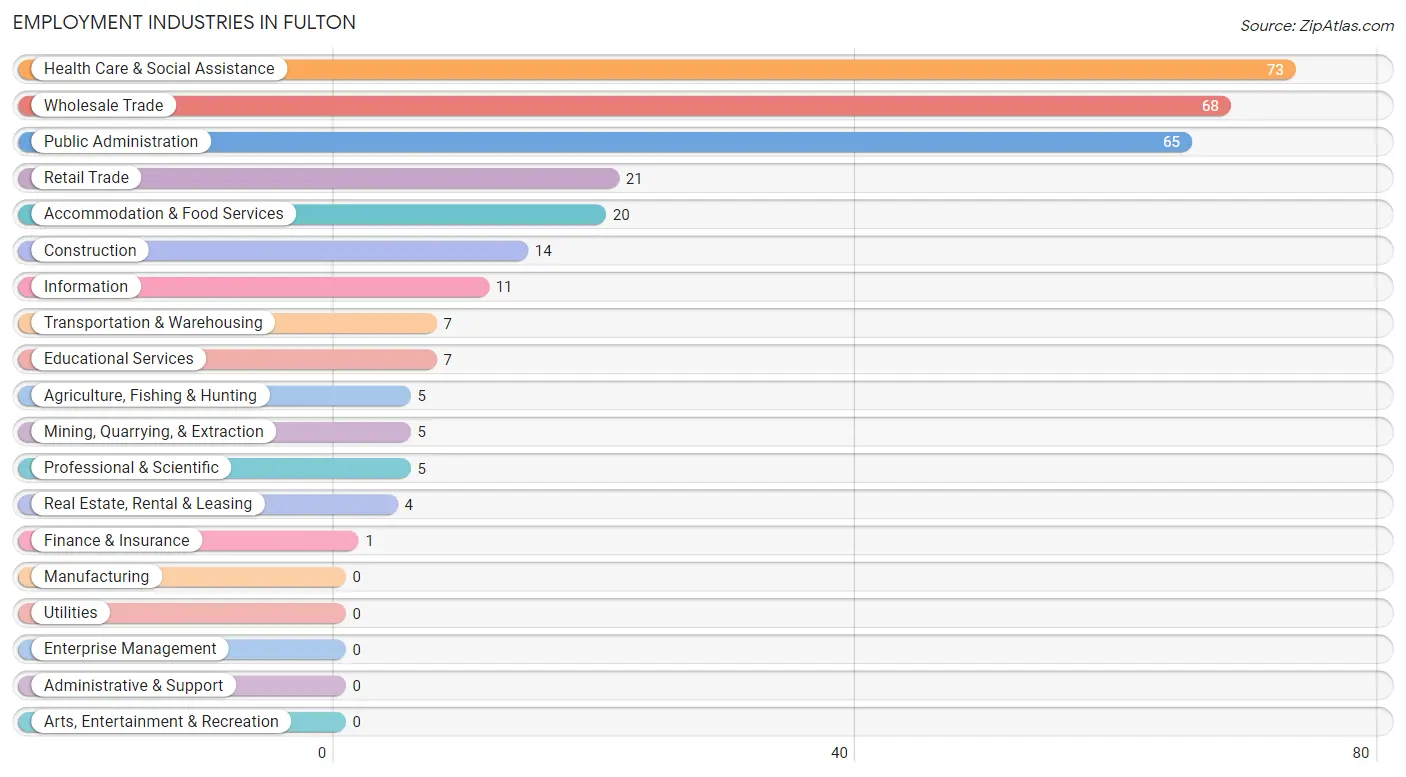
The major employment industries in Fulton include Health Care & Social Assistance (73 | 20.3%), Wholesale Trade (68 | 18.9%), Public Administration (65 | 18.1%), Retail Trade (21 | 5.8%), and Accommodation & Food Services (20 | 5.6%).
Employment Industries by Sex in Fulton
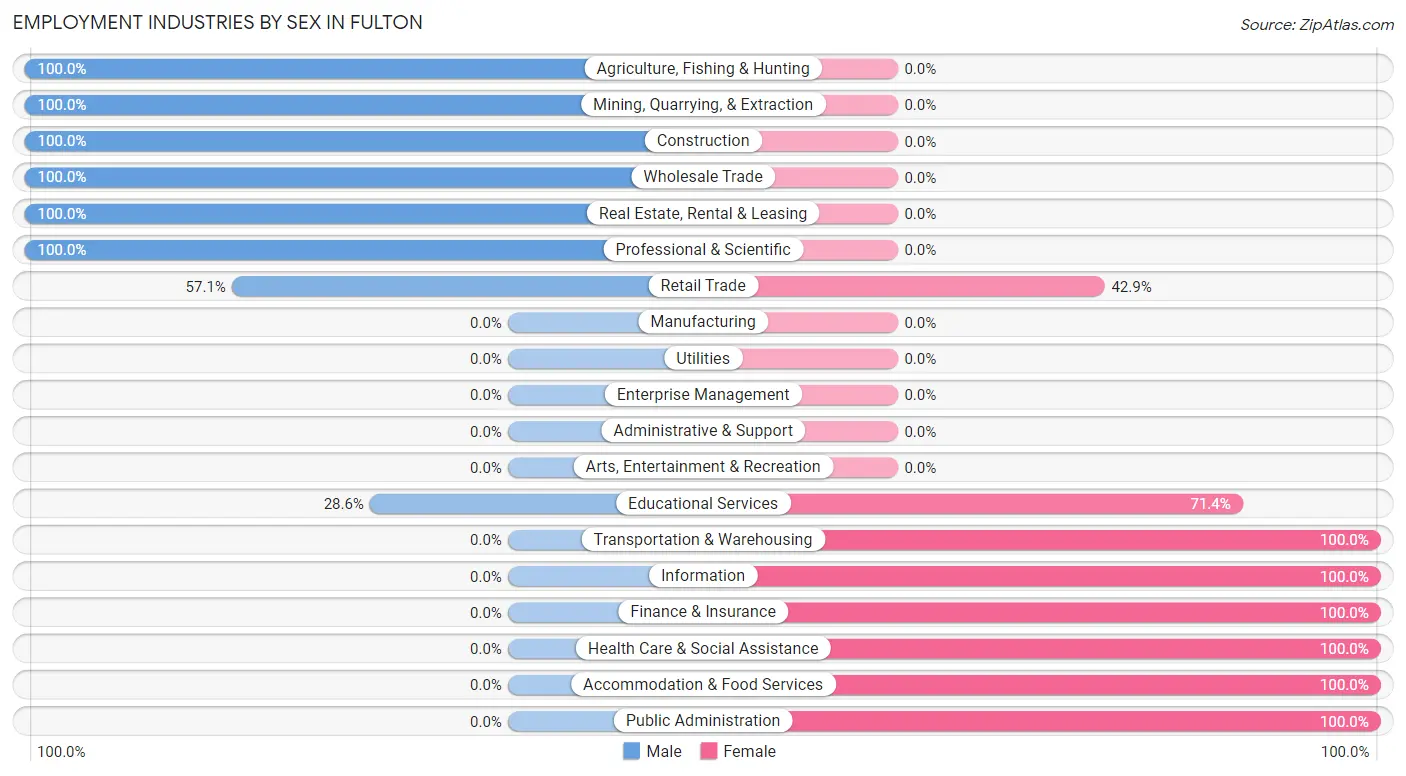
The Fulton industries that see more men than women are Agriculture, Fishing & Hunting (100.0%), Mining, Quarrying, & Extraction (100.0%), and Construction (100.0%), whereas the industries that tend to have a higher number of women are Transportation & Warehousing (100.0%), Information (100.0%), and Finance & Insurance (100.0%).
| Industry | Male | Female |
| Agriculture, Fishing & Hunting | 5 (100.0%) | 0 (0.0%) |
| Mining, Quarrying, & Extraction | 5 (100.0%) | 0 (0.0%) |
| Construction | 14 (100.0%) | 0 (0.0%) |
| Manufacturing | 0 (0.0%) | 0 (0.0%) |
| Wholesale Trade | 68 (100.0%) | 0 (0.0%) |
| Retail Trade | 12 (57.1%) | 9 (42.9%) |
| Transportation & Warehousing | 0 (0.0%) | 7 (100.0%) |
| Utilities | 0 (0.0%) | 0 (0.0%) |
| Information | 0 (0.0%) | 11 (100.0%) |
| Finance & Insurance | 0 (0.0%) | 1 (100.0%) |
| Real Estate, Rental & Leasing | 4 (100.0%) | 0 (0.0%) |
| Professional & Scientific | 5 (100.0%) | 0 (0.0%) |
| Enterprise Management | 0 (0.0%) | 0 (0.0%) |
| Administrative & Support | 0 (0.0%) | 0 (0.0%) |
| Educational Services | 2 (28.6%) | 5 (71.4%) |
| Health Care & Social Assistance | 0 (0.0%) | 73 (100.0%) |
| Arts, Entertainment & Recreation | 0 (0.0%) | 0 (0.0%) |
| Accommodation & Food Services | 0 (0.0%) | 20 (100.0%) |
| Public Administration | 0 (0.0%) | 65 (100.0%) |
| Total | 115 (31.9%) | 245 (68.1%) |
Education in Fulton
School Enrollment in Fulton
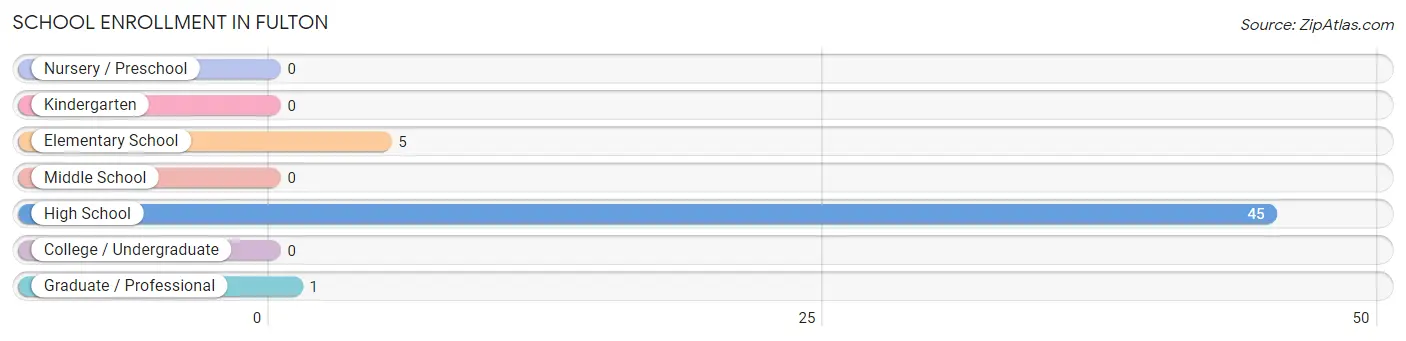
The most common levels of schooling among the 51 students in Fulton are high school (45 | 88.2%), elementary school (5 | 9.8%), and graduate / professional (1 | 2.0%).
| School Level | # Students | % Students |
| Nursery / Preschool | 0 | 0.0% |
| Kindergarten | 0 | 0.0% |
| Elementary School | 5 | 9.8% |
| Middle School | 0 | 0.0% |
| High School | 45 | 88.2% |
| College / Undergraduate | 0 | 0.0% |
| Graduate / Professional | 1 | 2.0% |
| Total | 51 | 100.0% |
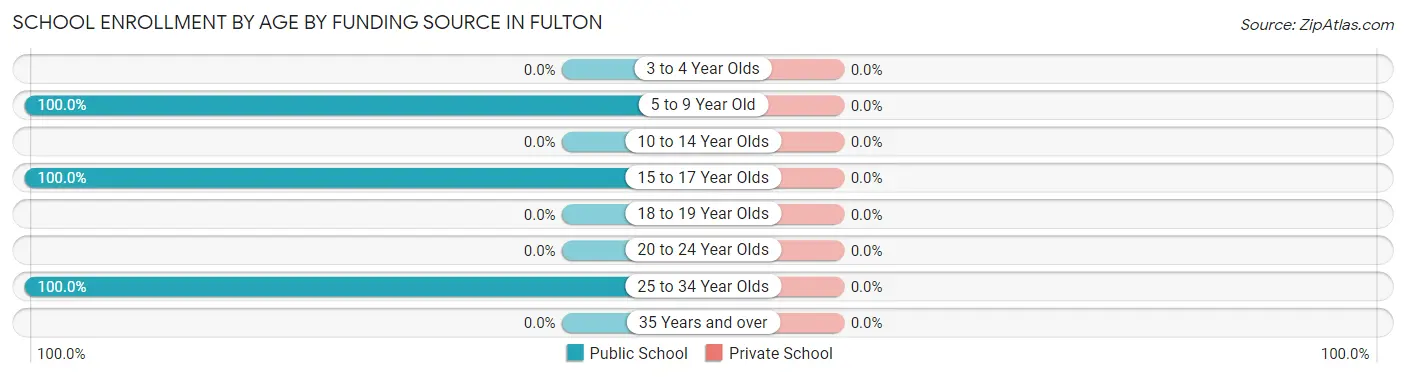
School Enrollment by Age by Funding Source in Fulton
| Age Bracket | Public School | Private School |
| 3 to 4 Year Olds | 0 (0.0%) | 0 (0.0%) |
| 5 to 9 Year Old | 5 (100.0%) | 0 (0.0%) |
| 10 to 14 Year Olds | 0 (0.0%) | 0 (0.0%) |
| 15 to 17 Year Olds | 45 (100.0%) | 0 (0.0%) |
| 18 to 19 Year Olds | 0 (0.0%) | 0 (0.0%) |
| 20 to 24 Year Olds | 0 (0.0%) | 0 (0.0%) |
| 25 to 34 Year Olds | 1 (100.0%) | 0 (0.0%) |
| 35 Years and over | 0 (0.0%) | 0 (0.0%) |
| Total | 51 (100.0%) | 0 (0.0%) |
Educational Attainment by Field of Study in Fulton
Business (52 | 19.3%), literature & languages (45 | 16.7%), education (39 | 14.4%), psychology (29 | 10.7%), and science & technology (25 | 9.3%) are the most common fields of study among 270 individuals in Fulton who have obtained a bachelor's degree or higher.
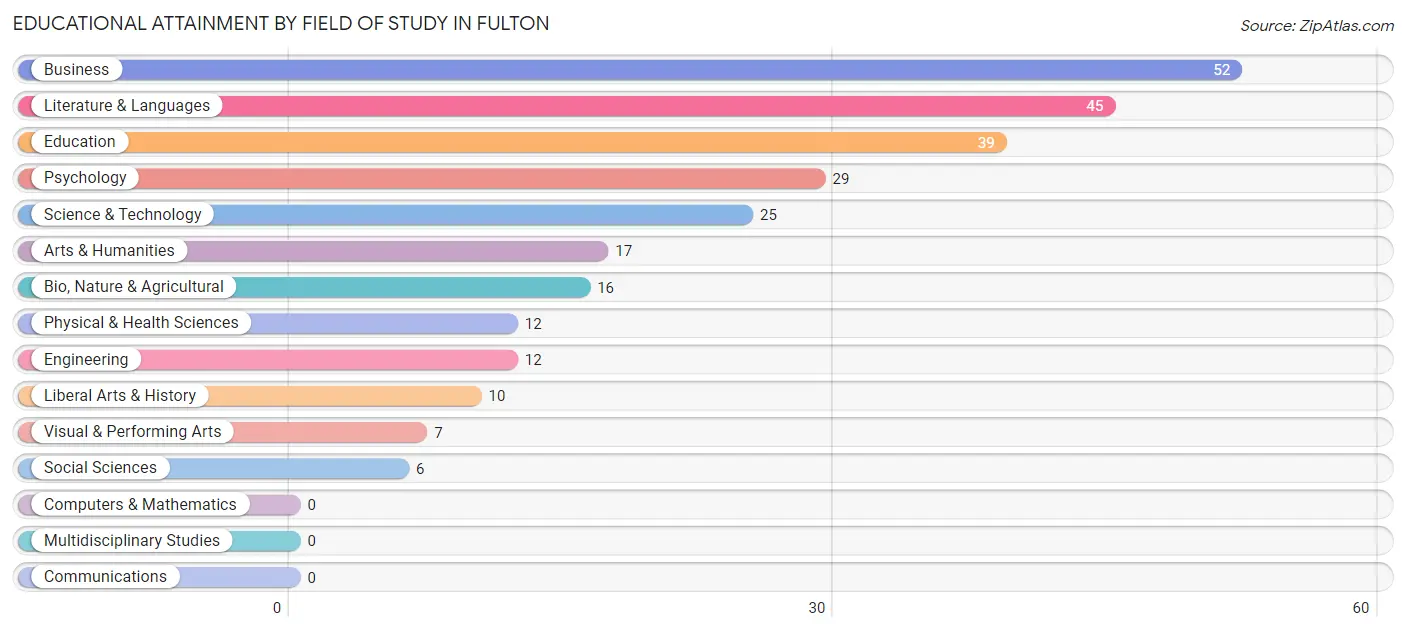
| Field of Study | # Graduates | % Graduates |
| Computers & Mathematics | 0 | 0.0% |
| Bio, Nature & Agricultural | 16 | 5.9% |
| Physical & Health Sciences | 12 | 4.4% |
| Psychology | 29 | 10.7% |
| Social Sciences | 6 | 2.2% |
| Engineering | 12 | 4.4% |
| Multidisciplinary Studies | 0 | 0.0% |
| Science & Technology | 25 | 9.3% |
| Business | 52 | 19.3% |
| Education | 39 | 14.4% |
| Literature & Languages | 45 | 16.7% |
| Liberal Arts & History | 10 | 3.7% |
| Visual & Performing Arts | 7 | 2.6% |
| Communications | 0 | 0.0% |
| Arts & Humanities | 17 | 6.3% |
| Total | 270 | 100.0% |
Transportation & Commute in Fulton
Vehicle Availability by Sex in Fulton
The most prevalent vehicle ownership categories in Fulton are males with 2 vehicles (110, accounting for 95.7%) and females with 2 vehicles (87, making up 45.1%).
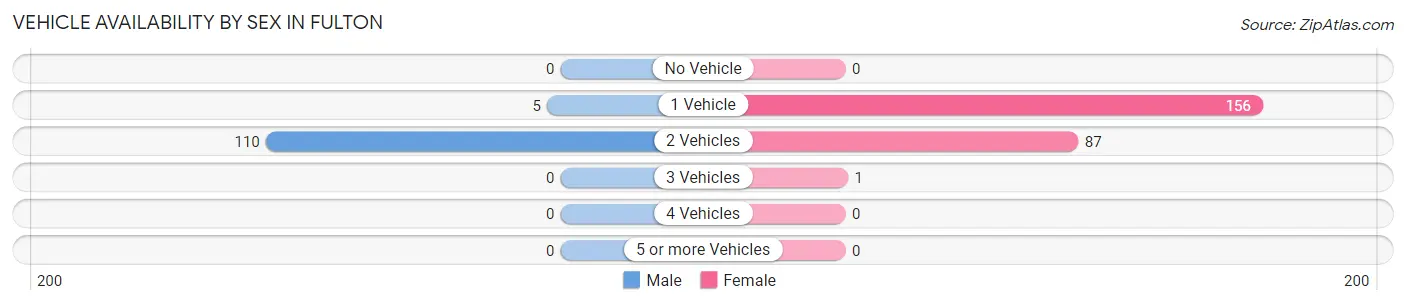
| Vehicles Available | Male | Female |
| No Vehicle | 0 (0.0%) | 0 (0.0%) |
| 1 Vehicle | 5 (4.3%) | 156 (63.9%) |
| 2 Vehicles | 110 (95.7%) | 87 (35.7%) |
| 3 Vehicles | 0 (0.0%) | 1 (0.4%) |
| 4 Vehicles | 0 (0.0%) | 0 (0.0%) |
| 5 or more Vehicles | 0 (0.0%) | 0 (0.0%) |
| Total | 115 (100.0%) | 244 (100.0%) |
Commute Time in Fulton
The most frequently occuring commute durations in Fulton are 30 to 34 minutes (131 commuters, 45.2%), 20 to 24 minutes (35 commuters, 12.1%), and 60 to 89 minutes (35 commuters, 12.1%).
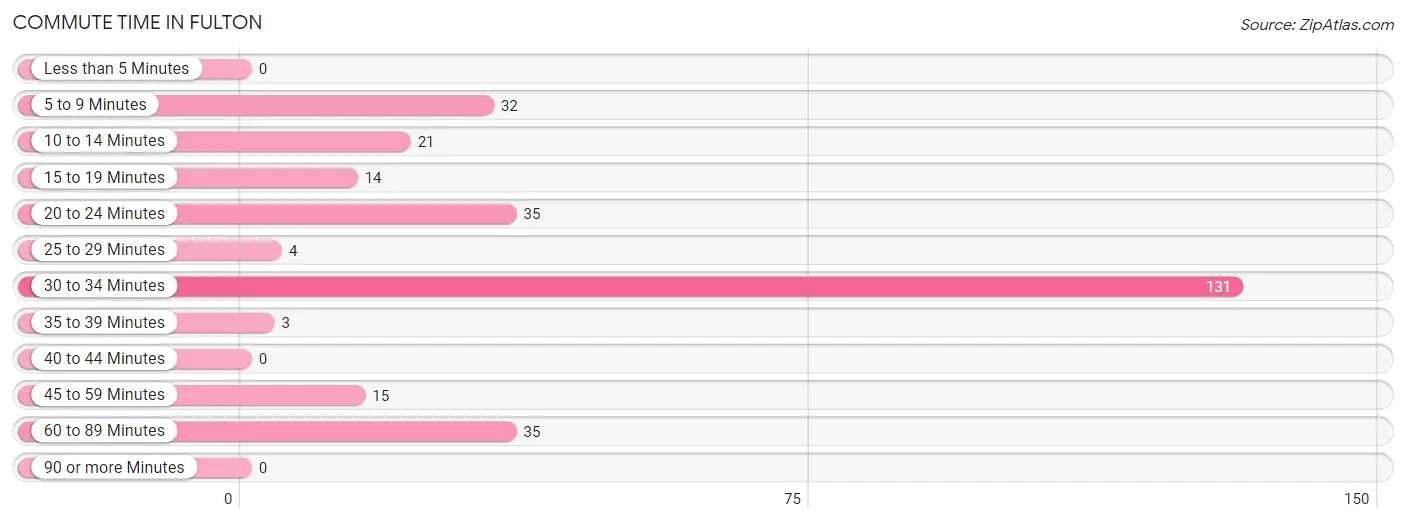
| Commute Time | # Commuters | % Commuters |
| Less than 5 Minutes | 0 | 0.0% |
| 5 to 9 Minutes | 32 | 11.0% |
| 10 to 14 Minutes | 21 | 7.2% |
| 15 to 19 Minutes | 14 | 4.8% |
| 20 to 24 Minutes | 35 | 12.1% |
| 25 to 29 Minutes | 4 | 1.4% |
| 30 to 34 Minutes | 131 | 45.2% |
| 35 to 39 Minutes | 3 | 1.0% |
| 40 to 44 Minutes | 0 | 0.0% |
| 45 to 59 Minutes | 15 | 5.2% |
| 60 to 89 Minutes | 35 | 12.1% |
| 90 or more Minutes | 0 | 0.0% |
Commute Time by Sex in Fulton
The most common commute times in Fulton are 30 to 34 minutes (65 commuters, 63.7%) for males and 30 to 34 minutes (66 commuters, 35.1%) for females.
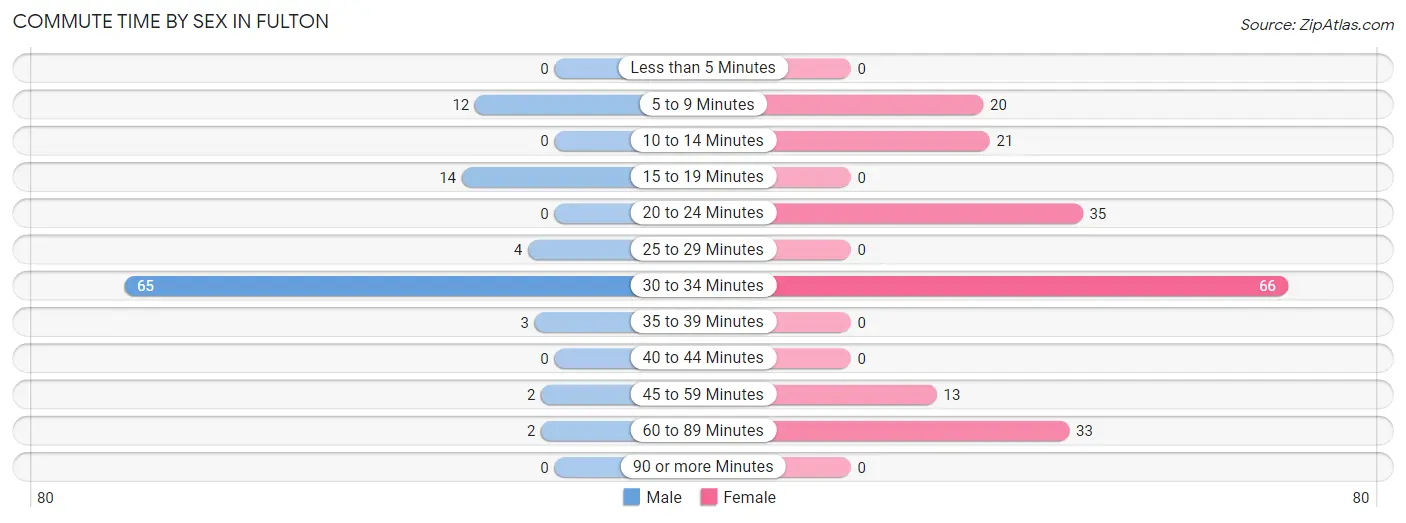
| Commute Time | Male | Female |
| Less than 5 Minutes | 0 (0.0%) | 0 (0.0%) |
| 5 to 9 Minutes | 12 (11.8%) | 20 (10.6%) |
| 10 to 14 Minutes | 0 (0.0%) | 21 (11.2%) |
| 15 to 19 Minutes | 14 (13.7%) | 0 (0.0%) |
| 20 to 24 Minutes | 0 (0.0%) | 35 (18.6%) |
| 25 to 29 Minutes | 4 (3.9%) | 0 (0.0%) |
| 30 to 34 Minutes | 65 (63.7%) | 66 (35.1%) |
| 35 to 39 Minutes | 3 (2.9%) | 0 (0.0%) |
| 40 to 44 Minutes | 0 (0.0%) | 0 (0.0%) |
| 45 to 59 Minutes | 2 (2.0%) | 13 (6.9%) |
| 60 to 89 Minutes | 2 (2.0%) | 33 (17.5%) |
| 90 or more Minutes | 0 (0.0%) | 0 (0.0%) |
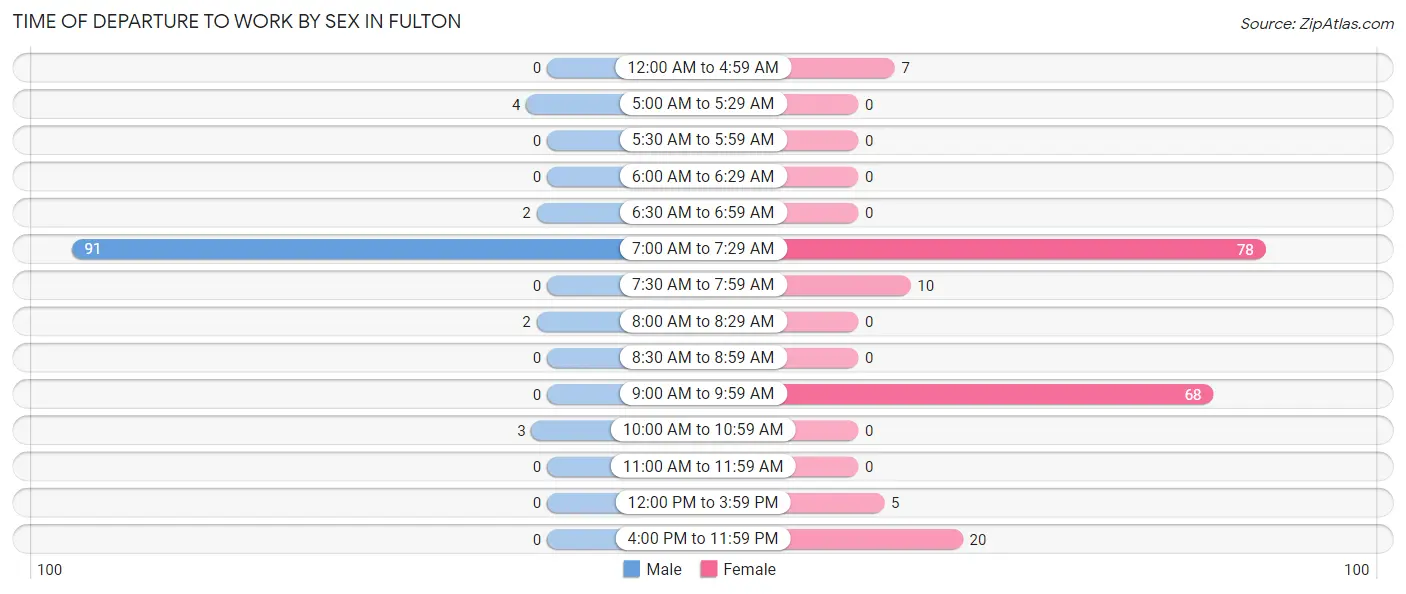
Time of Departure to Work by Sex in Fulton
The most frequent times of departure to work in Fulton are 7:00 AM to 7:29 AM (91, 89.2%) for males and 7:00 AM to 7:29 AM (78, 41.5%) for females.
| Time of Departure | Male | Female |
| 12:00 AM to 4:59 AM | 0 (0.0%) | 7 (3.7%) |
| 5:00 AM to 5:29 AM | 4 (3.9%) | 0 (0.0%) |
| 5:30 AM to 5:59 AM | 0 (0.0%) | 0 (0.0%) |
| 6:00 AM to 6:29 AM | 0 (0.0%) | 0 (0.0%) |
| 6:30 AM to 6:59 AM | 2 (2.0%) | 0 (0.0%) |
| 7:00 AM to 7:29 AM | 91 (89.2%) | 78 (41.5%) |
| 7:30 AM to 7:59 AM | 0 (0.0%) | 10 (5.3%) |
| 8:00 AM to 8:29 AM | 2 (2.0%) | 0 (0.0%) |
| 8:30 AM to 8:59 AM | 0 (0.0%) | 0 (0.0%) |
| 9:00 AM to 9:59 AM | 0 (0.0%) | 68 (36.2%) |
| 10:00 AM to 10:59 AM | 3 (2.9%) | 0 (0.0%) |
| 11:00 AM to 11:59 AM | 0 (0.0%) | 0 (0.0%) |
| 12:00 PM to 3:59 PM | 0 (0.0%) | 5 (2.7%) |
| 4:00 PM to 11:59 PM | 0 (0.0%) | 20 (10.6%) |
| Total | 102 (100.0%) | 188 (100.0%) |
Housing Occupancy in Fulton
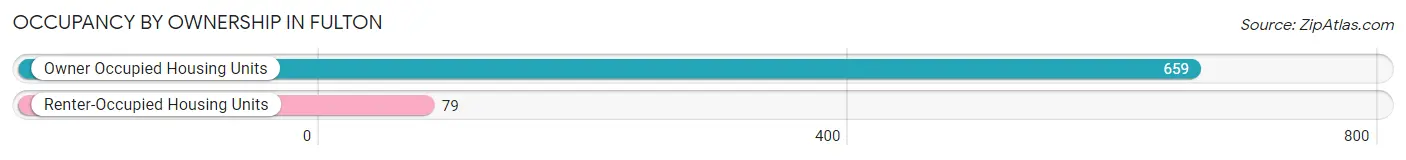
Occupancy by Ownership in Fulton
Of the total 738 dwellings in Fulton, owner-occupied units account for 659 (89.3%), while renter-occupied units make up 79 (10.7%).
| Occupancy | # Housing Units | % Housing Units |
| Owner Occupied Housing Units | 659 | 89.3% |
| Renter-Occupied Housing Units | 79 | 10.7% |
| Total Occupied Housing Units | 738 | 100.0% |
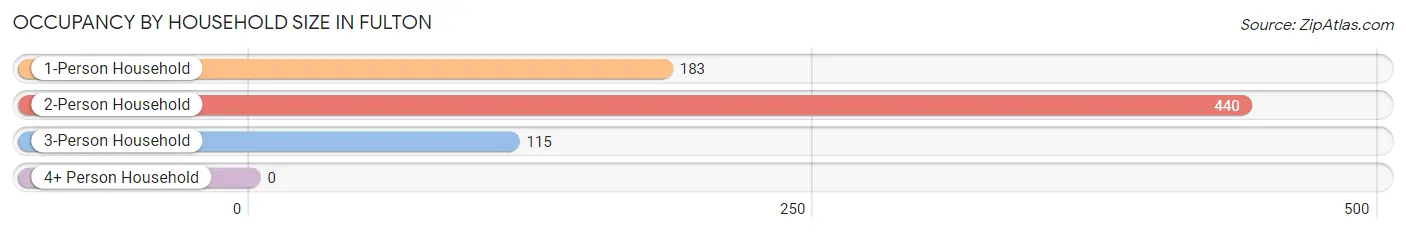
Occupancy by Household Size in Fulton
| Household Size | # Housing Units | % Housing Units |
| 1-Person Household | 183 | 24.8% |
| 2-Person Household | 440 | 59.6% |
| 3-Person Household | 115 | 15.6% |
| 4+ Person Household | 0 | 0.0% |
| Total Housing Units | 738 | 100.0% |
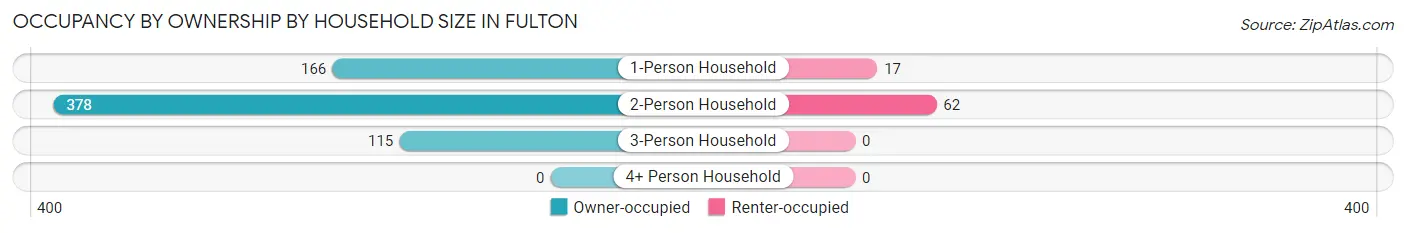
Occupancy by Ownership by Household Size in Fulton
| Household Size | Owner-occupied | Renter-occupied |
| 1-Person Household | 166 (90.7%) | 17 (9.3%) |
| 2-Person Household | 378 (85.9%) | 62 (14.1%) |
| 3-Person Household | 115 (100.0%) | 0 (0.0%) |
| 4+ Person Household | 0 (0.0%) | 0 (0.0%) |
| Total Housing Units | 659 (89.3%) | 79 (10.7%) |
Occupancy by Educational Attainment in Fulton
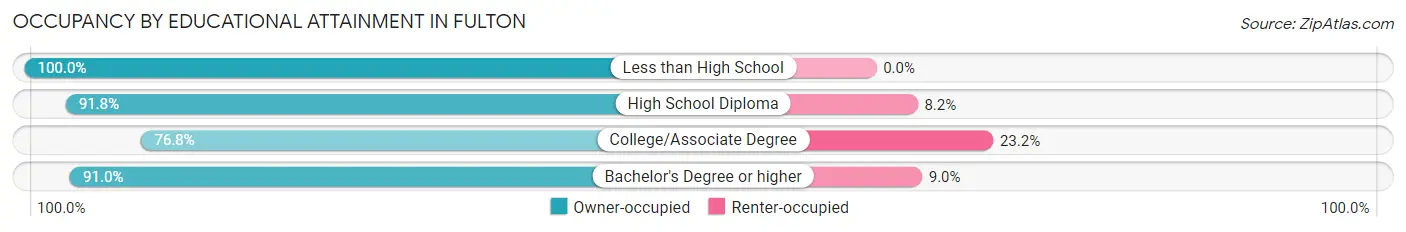
| Household Size | Owner-occupied | Renter-occupied |
| Less than High School | 140 (100.0%) | 0 (0.0%) |
| High School Diploma | 202 (91.8%) | 18 (8.2%) |
| College/Associate Degree | 146 (76.8%) | 44 (23.2%) |
| Bachelor's Degree or higher | 171 (91.0%) | 17 (9.0%) |
Occupancy by Age of Householder in Fulton
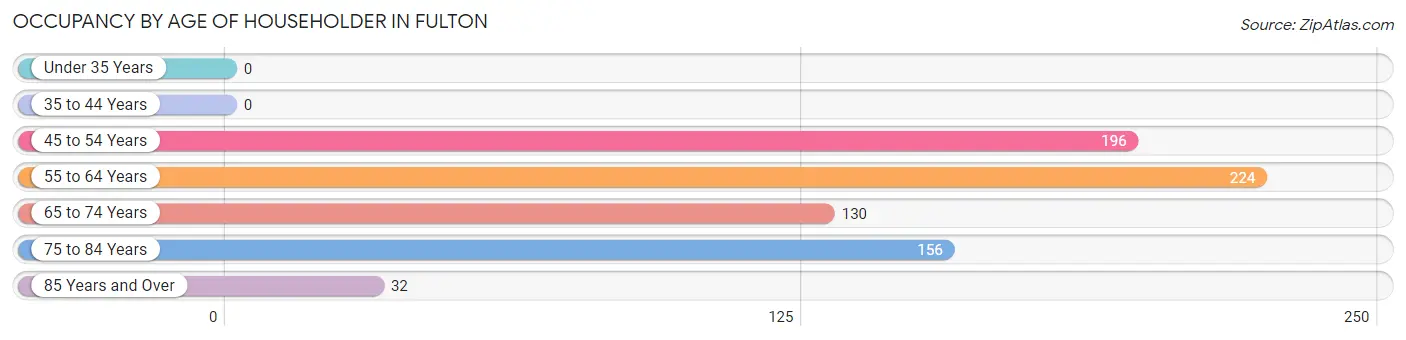
| Age Bracket | # Households | % Households |
| Under 35 Years | 0 | 0.0% |
| 35 to 44 Years | 0 | 0.0% |
| 45 to 54 Years | 196 | 26.6% |
| 55 to 64 Years | 224 | 30.3% |
| 65 to 74 Years | 130 | 17.6% |
| 75 to 84 Years | 156 | 21.1% |
| 85 Years and Over | 32 | 4.3% |
| Total | 738 | 100.0% |
Housing Finances in Fulton
Median Income by Occupancy in Fulton
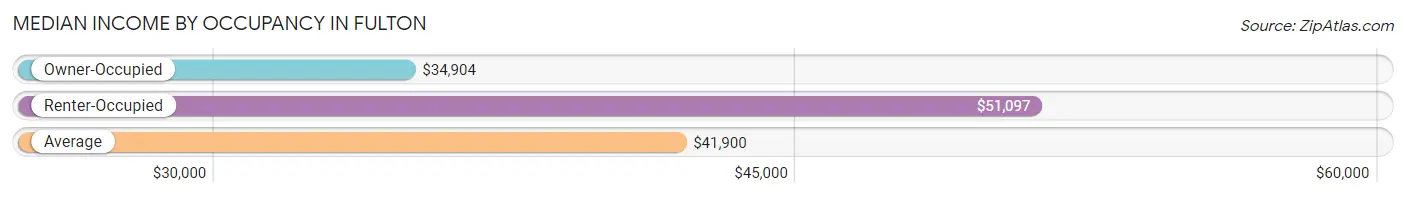
| Occupancy Type | # Households | Median Income |
| Owner-Occupied | 659 (89.3%) | $34,904 |
| Renter-Occupied | 79 (10.7%) | $51,097 |
| Average | 738 (100.0%) | $41,900 |
Occupancy by Householder Income Bracket in Fulton
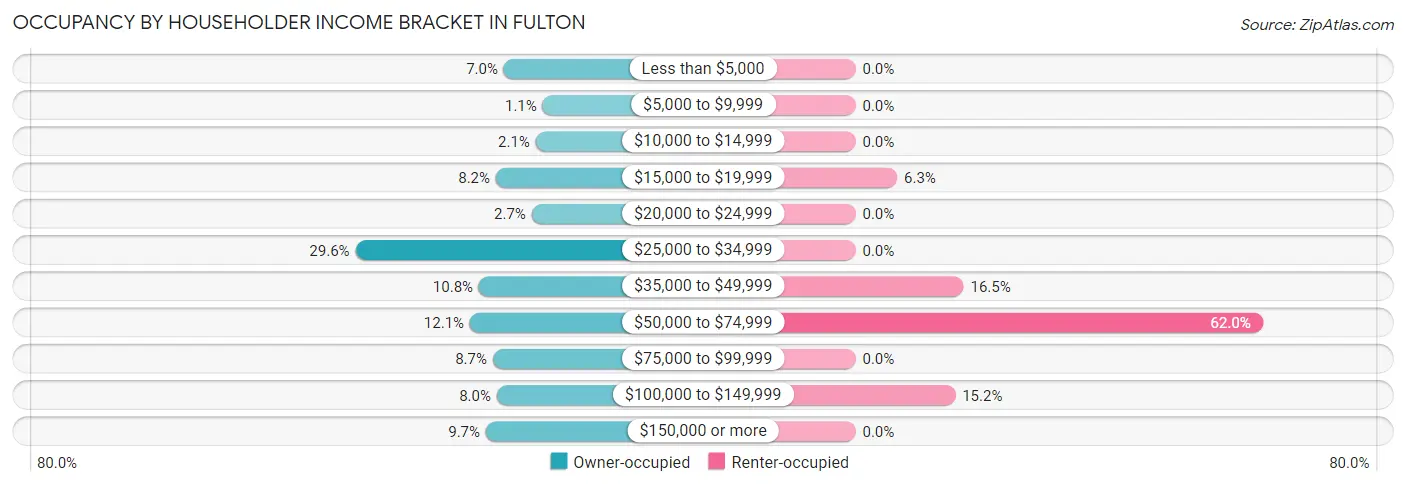
| Income Bracket | Owner-occupied | Renter-occupied |
| Less than $5,000 | 46 (7.0%) | 0 (0.0%) |
| $5,000 to $9,999 | 7 (1.1%) | 0 (0.0%) |
| $10,000 to $14,999 | 14 (2.1%) | 0 (0.0%) |
| $15,000 to $19,999 | 54 (8.2%) | 5 (6.3%) |
| $20,000 to $24,999 | 18 (2.7%) | 0 (0.0%) |
| $25,000 to $34,999 | 195 (29.6%) | 0 (0.0%) |
| $35,000 to $49,999 | 71 (10.8%) | 13 (16.5%) |
| $50,000 to $74,999 | 80 (12.1%) | 49 (62.0%) |
| $75,000 to $99,999 | 57 (8.6%) | 0 (0.0%) |
| $100,000 to $149,999 | 53 (8.0%) | 12 (15.2%) |
| $150,000 or more | 64 (9.7%) | 0 (0.0%) |
| Total | 659 (100.0%) | 79 (100.0%) |
Monthly Housing Cost Tiers in Fulton
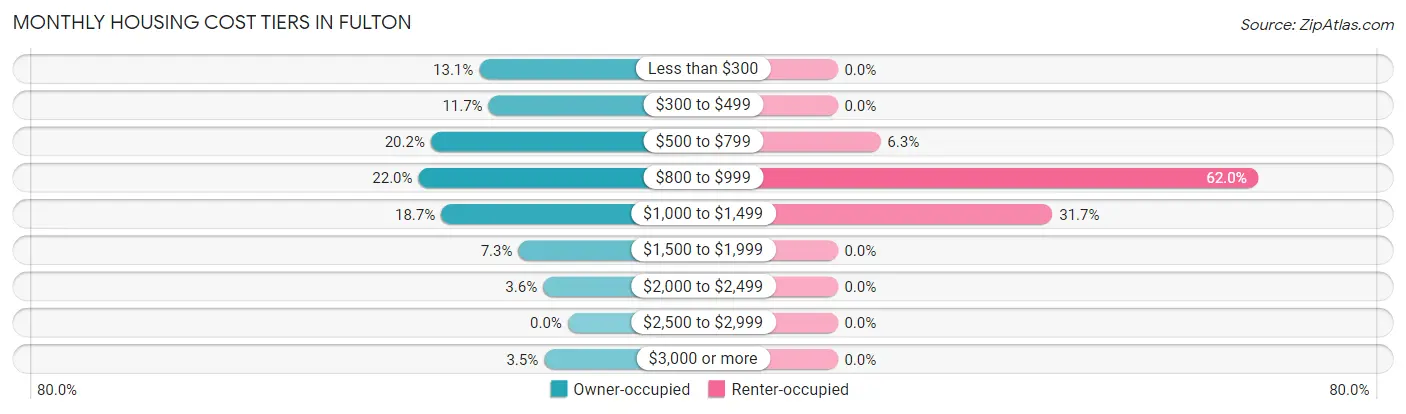
| Monthly Cost | Owner-occupied | Renter-occupied |
| Less than $300 | 86 (13.1%) | 0 (0.0%) |
| $300 to $499 | 77 (11.7%) | 0 (0.0%) |
| $500 to $799 | 133 (20.2%) | 5 (6.3%) |
| $800 to $999 | 145 (22.0%) | 49 (62.0%) |
| $1,000 to $1,499 | 123 (18.7%) | 25 (31.7%) |
| $1,500 to $1,999 | 48 (7.3%) | 0 (0.0%) |
| $2,000 to $2,499 | 24 (3.6%) | 0 (0.0%) |
| $2,500 to $2,999 | 0 (0.0%) | 0 (0.0%) |
| $3,000 or more | 23 (3.5%) | 0 (0.0%) |
| Total | 659 (100.0%) | 79 (100.0%) |
Physical Housing Characteristics in Fulton
Housing Structures in Fulton
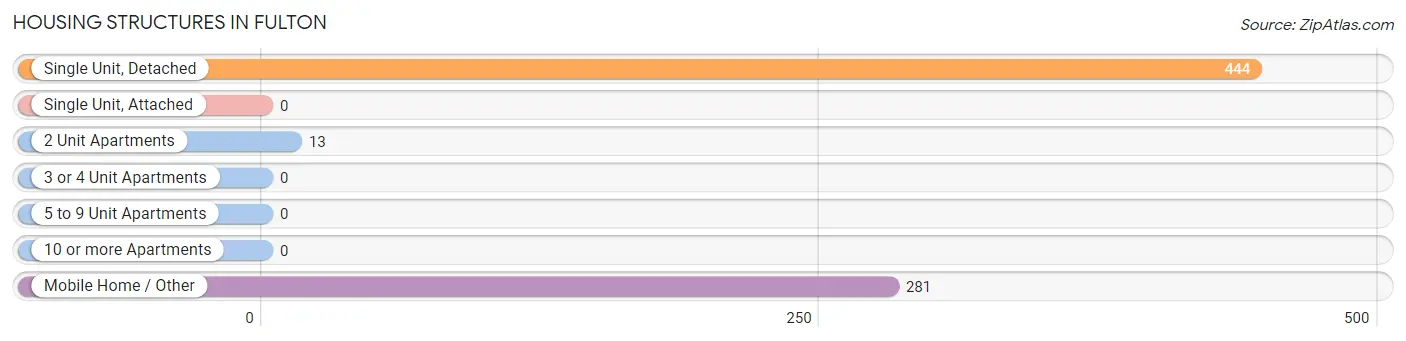
| Structure Type | # Housing Units | % Housing Units |
| Single Unit, Detached | 444 | 60.2% |
| Single Unit, Attached | 0 | 0.0% |
| 2 Unit Apartments | 13 | 1.8% |
| 3 or 4 Unit Apartments | 0 | 0.0% |
| 5 to 9 Unit Apartments | 0 | 0.0% |
| 10 or more Apartments | 0 | 0.0% |
| Mobile Home / Other | 281 | 38.1% |
| Total | 738 | 100.0% |
Housing Structures by Occupancy in Fulton
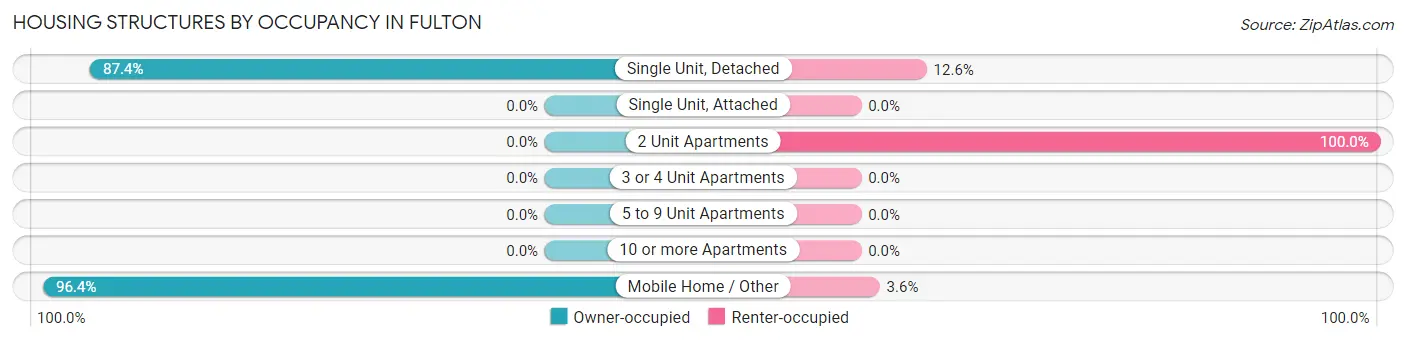
| Structure Type | Owner-occupied | Renter-occupied |
| Single Unit, Detached | 388 (87.4%) | 56 (12.6%) |
| Single Unit, Attached | 0 (0.0%) | 0 (0.0%) |
| 2 Unit Apartments | 0 (0.0%) | 13 (100.0%) |
| 3 or 4 Unit Apartments | 0 (0.0%) | 0 (0.0%) |
| 5 to 9 Unit Apartments | 0 (0.0%) | 0 (0.0%) |
| 10 or more Apartments | 0 (0.0%) | 0 (0.0%) |
| Mobile Home / Other | 271 (96.4%) | 10 (3.6%) |
| Total | 659 (89.3%) | 79 (10.7%) |
Housing Structures by Number of Rooms in Fulton
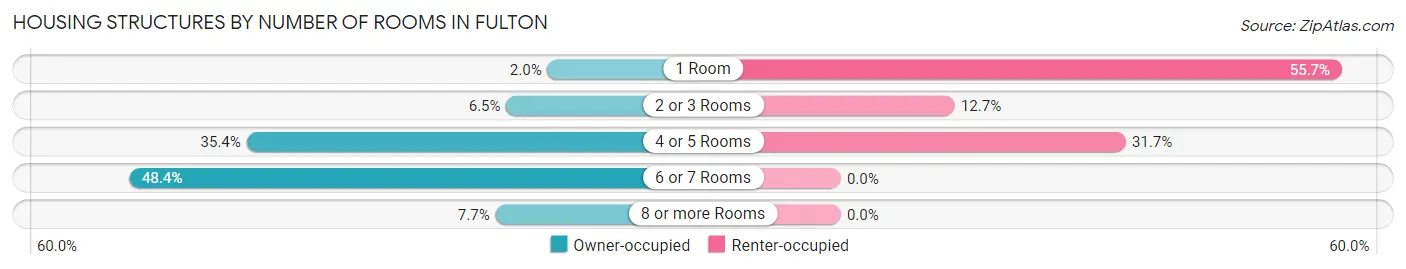
| Number of Rooms | Owner-occupied | Renter-occupied |
| 1 Room | 13 (2.0%) | 44 (55.7%) |
| 2 or 3 Rooms | 43 (6.5%) | 10 (12.7%) |
| 4 or 5 Rooms | 233 (35.4%) | 25 (31.7%) |
| 6 or 7 Rooms | 319 (48.4%) | 0 (0.0%) |
| 8 or more Rooms | 51 (7.7%) | 0 (0.0%) |
| Total | 659 (100.0%) | 79 (100.0%) |
Housing Structure by Heating Type in Fulton
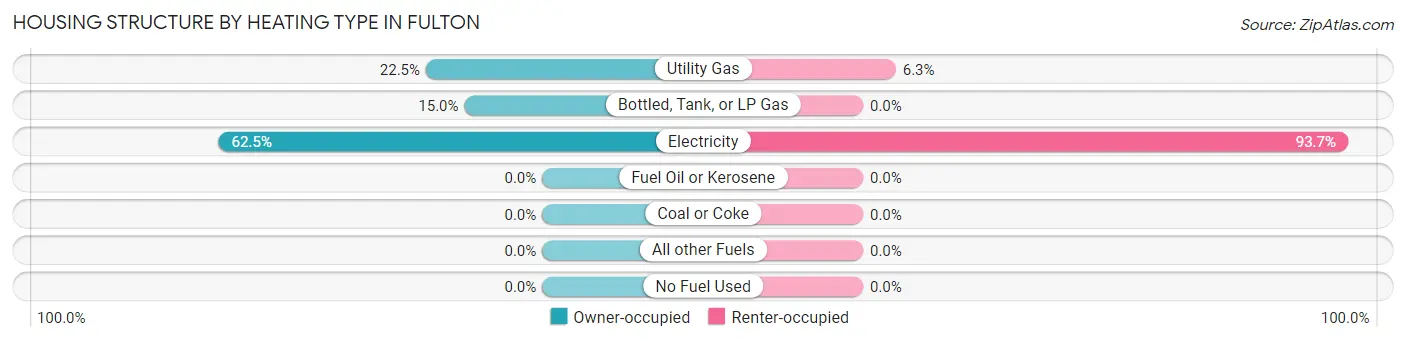
| Heating Type | Owner-occupied | Renter-occupied |
| Utility Gas | 148 (22.5%) | 5 (6.3%) |
| Bottled, Tank, or LP Gas | 99 (15.0%) | 0 (0.0%) |
| Electricity | 412 (62.5%) | 74 (93.7%) |
| Fuel Oil or Kerosene | 0 (0.0%) | 0 (0.0%) |
| Coal or Coke | 0 (0.0%) | 0 (0.0%) |
| All other Fuels | 0 (0.0%) | 0 (0.0%) |
| No Fuel Used | 0 (0.0%) | 0 (0.0%) |
| Total | 659 (100.0%) | 79 (100.0%) |
Household Vehicle Usage in Fulton
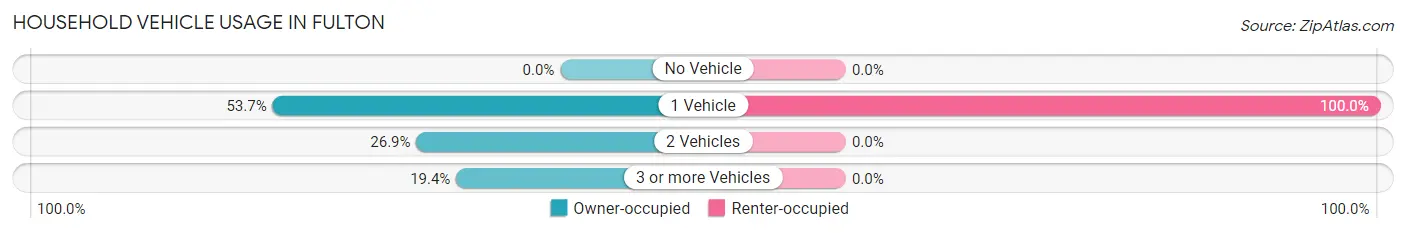
| Vehicles per Household | Owner-occupied | Renter-occupied |
| No Vehicle | 0 (0.0%) | 0 (0.0%) |
| 1 Vehicle | 354 (53.7%) | 79 (100.0%) |
| 2 Vehicles | 177 (26.9%) | 0 (0.0%) |
| 3 or more Vehicles | 128 (19.4%) | 0 (0.0%) |
| Total | 659 (100.0%) | 79 (100.0%) |
Real Estate & Mortgages in Fulton
Real Estate and Mortgage Overview in Fulton
| Characteristic | Without Mortgage | With Mortgage |
| Housing Units | 492 | 167 |
| Median Property Value | - | - |
| Median Household Income | $33,974 | $30 |
| Monthly Housing Costs | $749 | $6 |
| Real Estate Taxes | $3,184 | $5 |
Property Value by Mortgage Status in Fulton
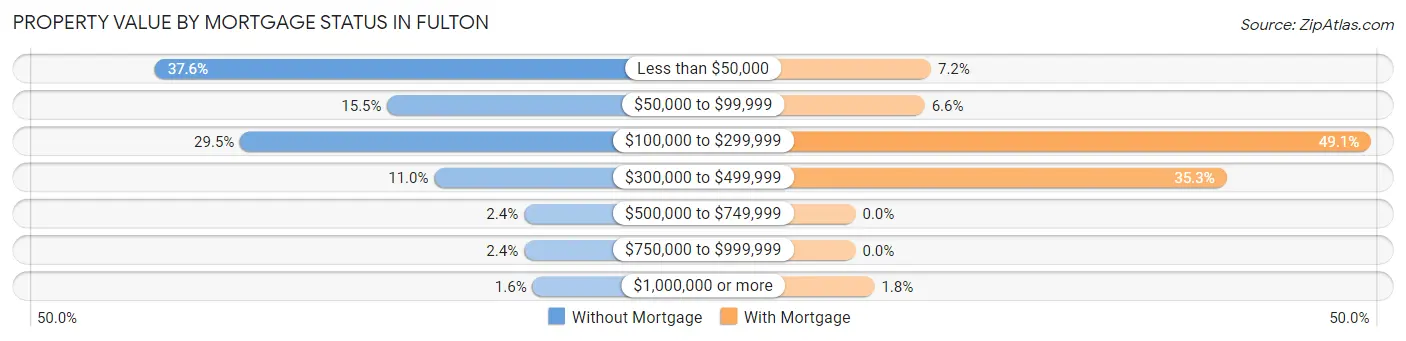
| Property Value | Without Mortgage | With Mortgage |
| Less than $50,000 | 185 (37.6%) | 12 (7.2%) |
| $50,000 to $99,999 | 76 (15.4%) | 11 (6.6%) |
| $100,000 to $299,999 | 145 (29.5%) | 82 (49.1%) |
| $300,000 to $499,999 | 54 (11.0%) | 59 (35.3%) |
| $500,000 to $749,999 | 12 (2.4%) | 0 (0.0%) |
| $750,000 to $999,999 | 12 (2.4%) | 0 (0.0%) |
| $1,000,000 or more | 8 (1.6%) | 3 (1.8%) |
| Total | 492 (100.0%) | 167 (100.0%) |
Household Income by Mortgage Status in Fulton
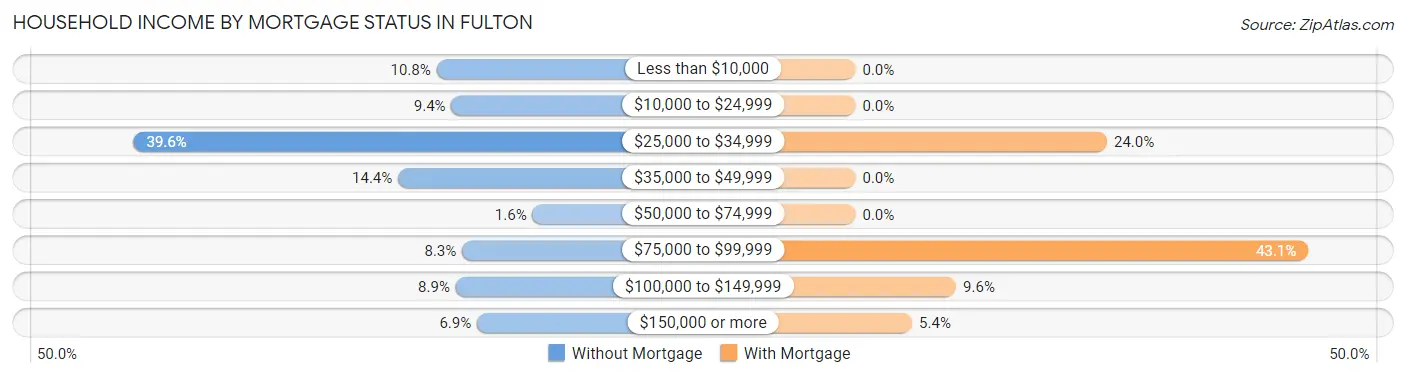
| Household Income | Without Mortgage | With Mortgage |
| Less than $10,000 | 53 (10.8%) | 0 (0.0%) |
| $10,000 to $24,999 | 46 (9.3%) | 0 (0.0%) |
| $25,000 to $34,999 | 195 (39.6%) | 40 (23.9%) |
| $35,000 to $49,999 | 71 (14.4%) | 0 (0.0%) |
| $50,000 to $74,999 | 8 (1.6%) | 0 (0.0%) |
| $75,000 to $99,999 | 41 (8.3%) | 72 (43.1%) |
| $100,000 to $149,999 | 44 (8.9%) | 16 (9.6%) |
| $150,000 or more | 34 (6.9%) | 9 (5.4%) |
| Total | 492 (100.0%) | 167 (100.0%) |
Property Value to Household Income Ratio in Fulton
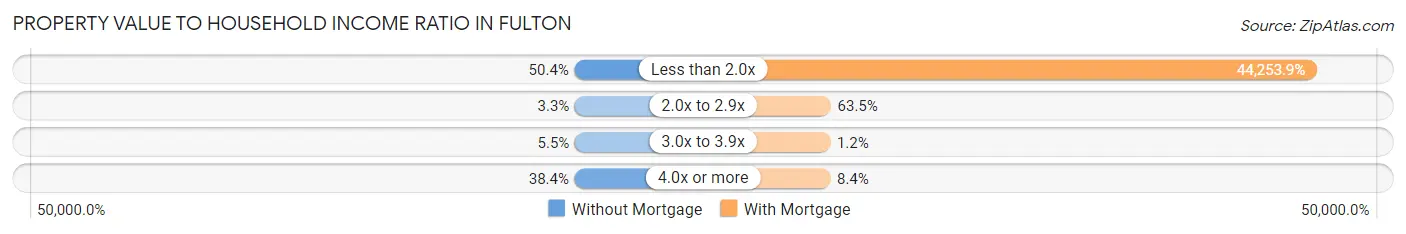
| Value-to-Income Ratio | Without Mortgage | With Mortgage |
| Less than 2.0x | 248 (50.4%) | 73,904 (44,253.9%) |
| 2.0x to 2.9x | 16 (3.3%) | 106 (63.5%) |
| 3.0x to 3.9x | 27 (5.5%) | 2 (1.2%) |
| 4.0x or more | 189 (38.4%) | 14 (8.4%) |
| Total | 492 (100.0%) | 167 (100.0%) |
Real Estate Taxes by Mortgage Status in Fulton
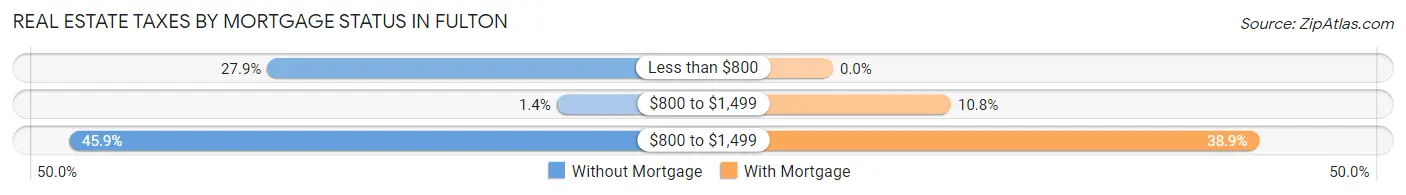
| Property Taxes | Without Mortgage | With Mortgage |
| Less than $800 | 137 (27.9%) | 0 (0.0%) |
| $800 to $1,499 | 7 (1.4%) | 18 (10.8%) |
| $800 to $1,499 | 226 (45.9%) | 65 (38.9%) |
| Total | 492 (100.0%) | 167 (100.0%) |
Health & Disability in Fulton
Health Insurance Coverage by Age in Fulton
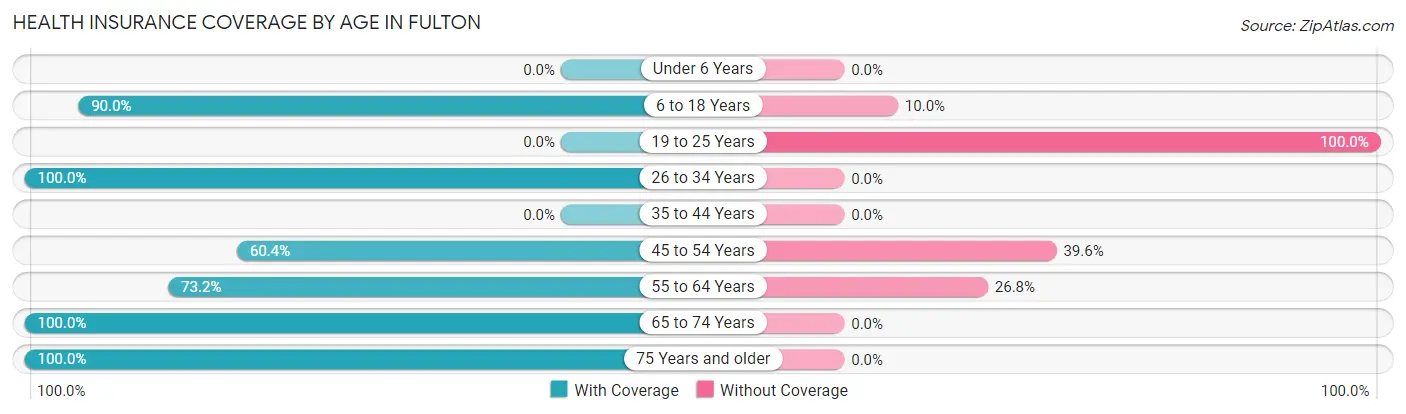
| Age Bracket | With Coverage | Without Coverage |
| Under 6 Years | 0 (0.0%) | 0 (0.0%) |
| 6 to 18 Years | 45 (90.0%) | 5 (10.0%) |
| 19 to 25 Years | 0 (0.0%) | 33 (100.0%) |
| 26 to 34 Years | 1 (100.0%) | 0 (0.0%) |
| 35 to 44 Years | 0 (0.0%) | 0 (0.0%) |
| 45 to 54 Years | 139 (60.4%) | 91 (39.6%) |
| 55 to 64 Years | 320 (73.2%) | 117 (26.8%) |
| 65 to 74 Years | 198 (100.0%) | 0 (0.0%) |
| 75 Years and older | 292 (100.0%) | 0 (0.0%) |
| Total | 995 (80.2%) | 246 (19.8%) |
Health Insurance Coverage by Citizenship Status in Fulton
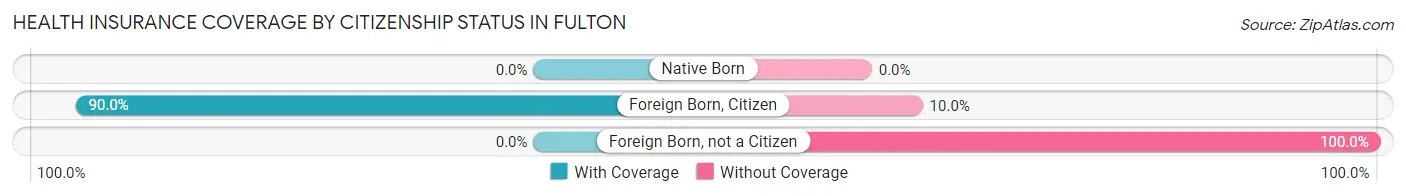
| Citizenship Status | With Coverage | Without Coverage |
| Native Born | 0 (0.0%) | 0 (0.0%) |
| Foreign Born, Citizen | 45 (90.0%) | 5 (10.0%) |
| Foreign Born, not a Citizen | 0 (0.0%) | 33 (100.0%) |
Health Insurance Coverage by Household Income in Fulton
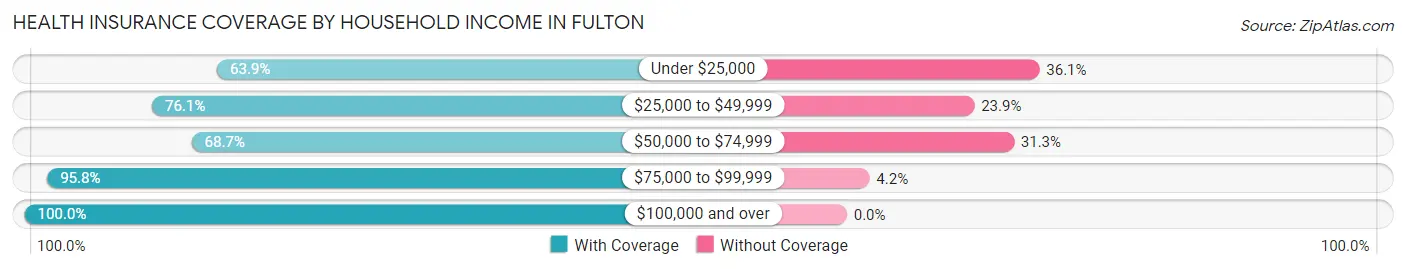
| Household Income | With Coverage | Without Coverage |
| Under $25,000 | 101 (63.9%) | 57 (36.1%) |
| $25,000 to $49,999 | 341 (76.1%) | 107 (23.9%) |
| $50,000 to $74,999 | 169 (68.7%) | 77 (31.3%) |
| $75,000 to $99,999 | 113 (95.8%) | 5 (4.2%) |
| $100,000 and over | 271 (100.0%) | 0 (0.0%) |
Public vs Private Health Insurance Coverage by Age in Fulton
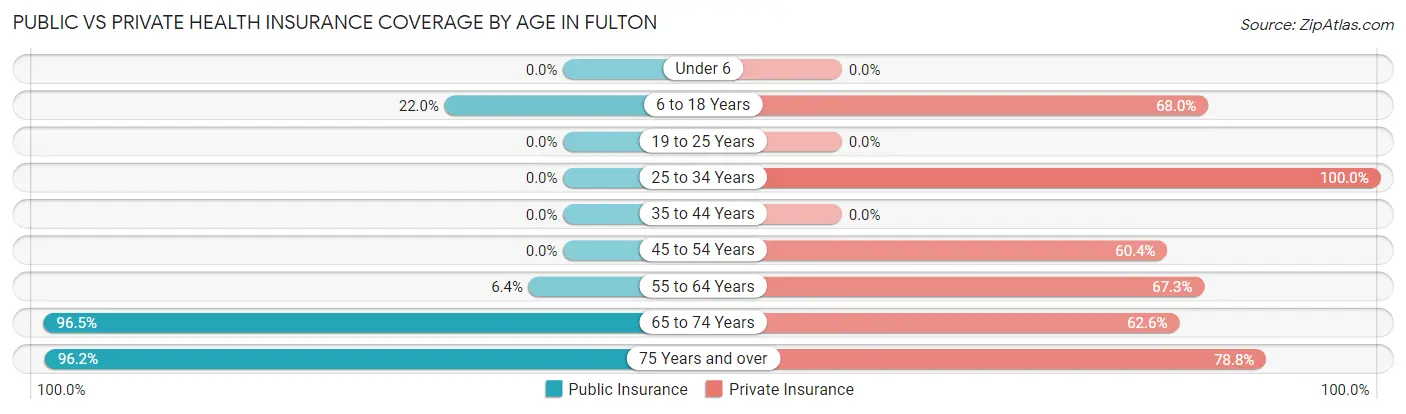
| Age Bracket | Public Insurance | Private Insurance |
| Under 6 | 0 (0.0%) | 0 (0.0%) |
| 6 to 18 Years | 11 (22.0%) | 34 (68.0%) |
| 19 to 25 Years | 0 (0.0%) | 0 (0.0%) |
| 25 to 34 Years | 0 (0.0%) | 1 (100.0%) |
| 35 to 44 Years | 0 (0.0%) | 0 (0.0%) |
| 45 to 54 Years | 0 (0.0%) | 139 (60.4%) |
| 55 to 64 Years | 28 (6.4%) | 294 (67.3%) |
| 65 to 74 Years | 191 (96.5%) | 124 (62.6%) |
| 75 Years and over | 281 (96.2%) | 230 (78.8%) |
| Total | 511 (41.2%) | 822 (66.2%) |
Disability Status by Sex by Age in Fulton
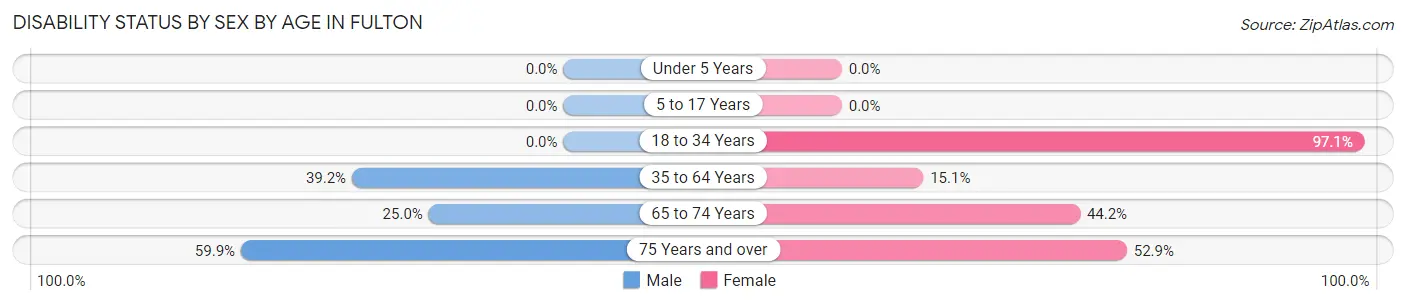
| Age Bracket | Male | Female |
| Under 5 Years | 0 (0.0%) | 0 (0.0%) |
| 5 to 17 Years | 0 (0.0%) | 0 (0.0%) |
| 18 to 34 Years | 0 (0.0%) | 33 (97.1%) |
| 35 to 64 Years | 93 (39.2%) | 65 (15.1%) |
| 65 to 74 Years | 15 (25.0%) | 61 (44.2%) |
| 75 Years and over | 82 (59.9%) | 82 (52.9%) |
Disability Class by Sex by Age in Fulton
Disability Class: Hearing Difficulty
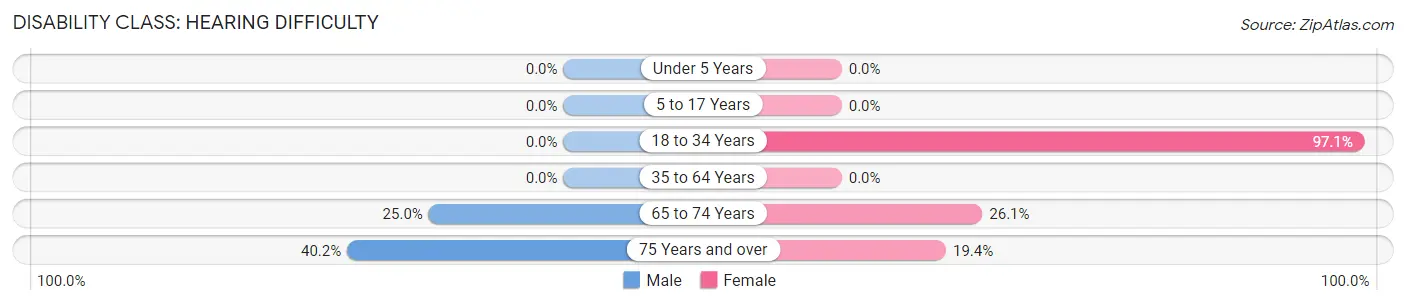
| Age Bracket | Male | Female |
| Under 5 Years | 0 (0.0%) | 0 (0.0%) |
| 5 to 17 Years | 0 (0.0%) | 0 (0.0%) |
| 18 to 34 Years | 0 (0.0%) | 33 (97.1%) |
| 35 to 64 Years | 0 (0.0%) | 0 (0.0%) |
| 65 to 74 Years | 15 (25.0%) | 36 (26.1%) |
| 75 Years and over | 55 (40.2%) | 30 (19.4%) |
Disability Class: Vision Difficulty
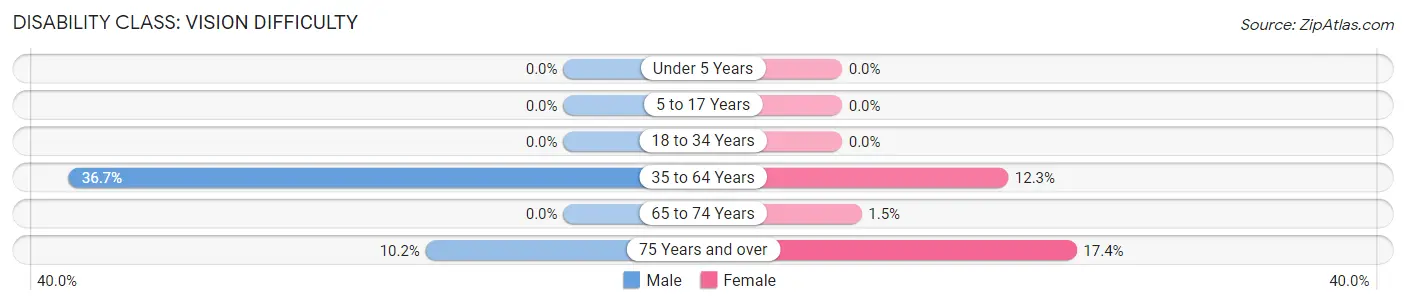
| Age Bracket | Male | Female |
| Under 5 Years | 0 (0.0%) | 0 (0.0%) |
| 5 to 17 Years | 0 (0.0%) | 0 (0.0%) |
| 18 to 34 Years | 0 (0.0%) | 0 (0.0%) |
| 35 to 64 Years | 87 (36.7%) | 53 (12.3%) |
| 65 to 74 Years | 0 (0.0%) | 2 (1.5%) |
| 75 Years and over | 14 (10.2%) | 27 (17.4%) |
Disability Class: Cognitive Difficulty
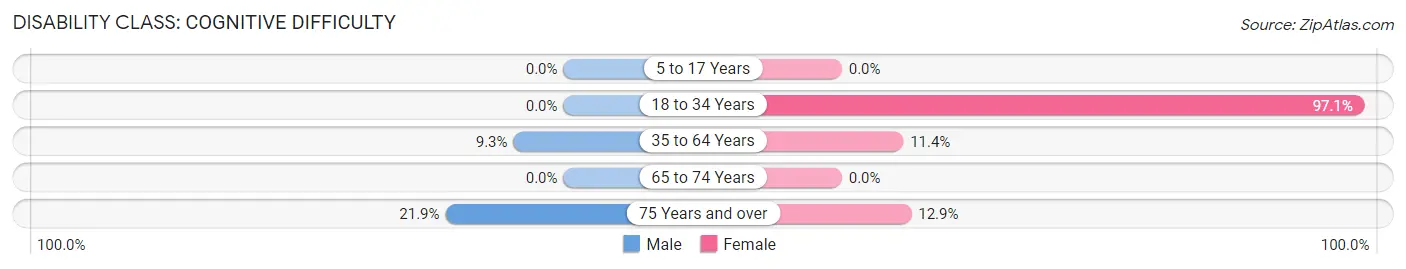
| Age Bracket | Male | Female |
| 5 to 17 Years | 0 (0.0%) | 0 (0.0%) |
| 18 to 34 Years | 0 (0.0%) | 33 (97.1%) |
| 35 to 64 Years | 22 (9.3%) | 49 (11.4%) |
| 65 to 74 Years | 0 (0.0%) | 0 (0.0%) |
| 75 Years and over | 30 (21.9%) | 20 (12.9%) |
Disability Class: Ambulatory Difficulty
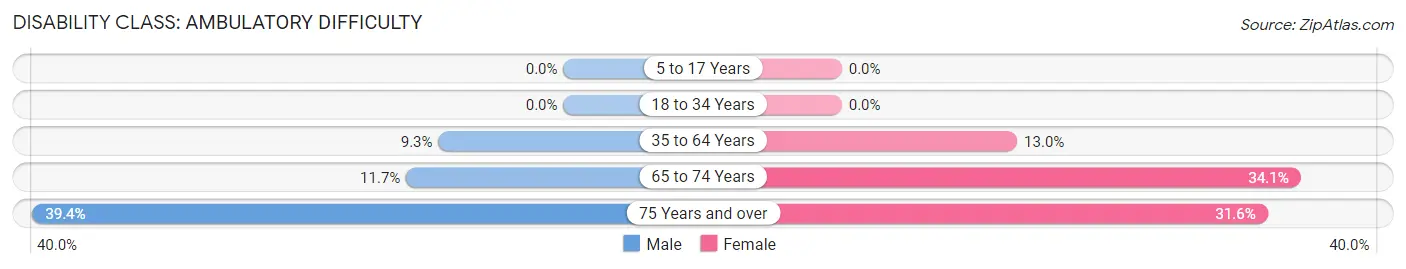
| Age Bracket | Male | Female |
| 5 to 17 Years | 0 (0.0%) | 0 (0.0%) |
| 18 to 34 Years | 0 (0.0%) | 0 (0.0%) |
| 35 to 64 Years | 22 (9.3%) | 56 (13.0%) |
| 65 to 74 Years | 7 (11.7%) | 47 (34.1%) |
| 75 Years and over | 54 (39.4%) | 49 (31.6%) |
Disability Class: Self-Care Difficulty
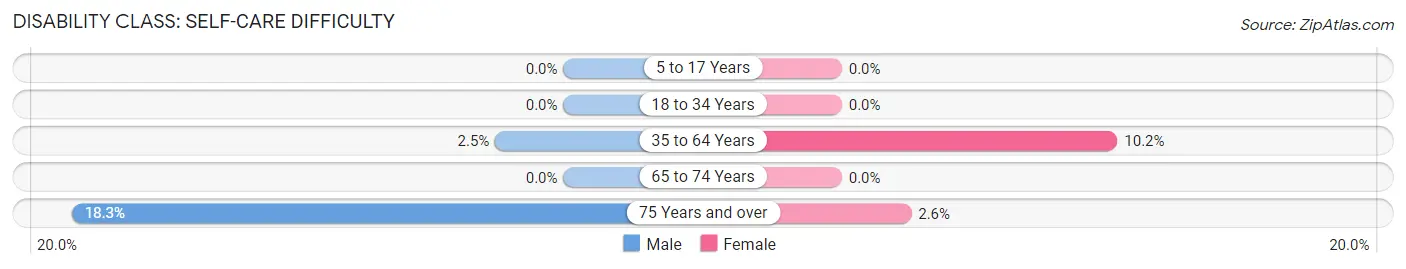
| Age Bracket | Male | Female |
| 5 to 17 Years | 0 (0.0%) | 0 (0.0%) |
| 18 to 34 Years | 0 (0.0%) | 0 (0.0%) |
| 35 to 64 Years | 6 (2.5%) | 44 (10.2%) |
| 65 to 74 Years | 0 (0.0%) | 0 (0.0%) |
| 75 Years and over | 25 (18.2%) | 4 (2.6%) |
Technology Access in Fulton
Computing Device Access in Fulton
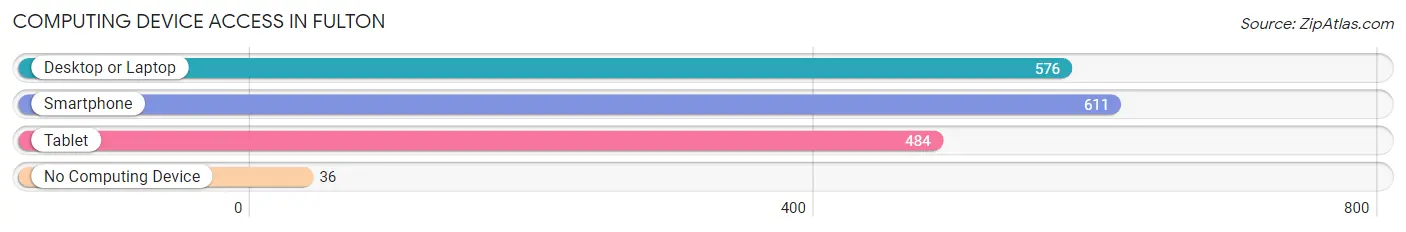
| Device Type | # Households | % Households |
| Desktop or Laptop | 576 | 78.0% |
| Smartphone | 611 | 82.8% |
| Tablet | 484 | 65.6% |
| No Computing Device | 36 | 4.9% |
| Total | 738 | 100.0% |
Internet Access in Fulton
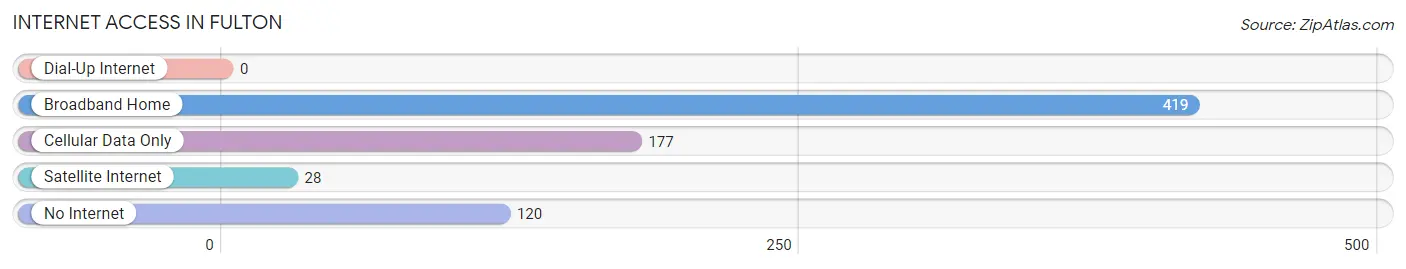
| Internet Type | # Households | % Households |
| Dial-Up Internet | 0 | 0.0% |
| Broadband Home | 419 | 56.8% |
| Cellular Data Only | 177 | 24.0% |
| Satellite Internet | 28 | 3.8% |
| No Internet | 120 | 16.3% |
| Total | 738 | 100.0% |
Fulton Summary
Fulton, Texas is a small town located in Aransas County, Texas. It is situated on the Gulf of Mexico, approximately 30 miles south of Corpus Christi. The town was founded in 1876 and is named after Robert Fulton, the inventor of the steamboat. The population of Fulton was 1,845 as of the 2010 census.
Geography
Fulton is located at 28°20'25"N 97°14'45"W (28.340278, -97.245833). It is situated on the Gulf of Mexico, approximately 30 miles south of Corpus Christi. The town is located on the western shore of Aransas Bay, and is bordered by the cities of Rockport and Aransas Pass. The town is located in a flat coastal plain, with an average elevation of 10 feet above sea level.
Climate
Fulton has a humid subtropical climate, with hot, humid summers and mild winters. The average annual temperature is 73°F, with an average high of 87°F in July and an average low of 59°F in January. The average annual precipitation is 44 inches, with most of the rain falling in the summer months.
Demographics
As of the 2010 census, there were 1,845 people, 745 households, and 486 families residing in Fulton. The population density was 1,092.3 people per square mile. The racial makeup of the town was 81.3% White, 0.7% African American, 0.4% Native American, 0.2% Asian, 0.1% Pacific Islander, 15.2% from other races, and 2.2% from two or more races. Hispanic or Latino of any race were 33.2% of the population.
Economy
Fulton's economy is largely based on tourism and fishing. The town is home to several marinas, which provide access to the Gulf of Mexico for recreational fishing and boating. The town is also home to several restaurants, hotels, and other tourist attractions. The town is also home to several seafood processing plants, which provide employment for many of the town's residents.
History
Fulton was founded in 1876 by Robert Fulton, the inventor of the steamboat. The town was originally named "Fulton City", but the name was later changed to "Fulton". The town was incorporated in 1891, and the first post office was established in 1892.
Fulton was a popular tourist destination in the early 20th century, and was home to several resorts and hotels. The town was also home to several seafood processing plants, which provided employment for many of the town's residents.
In the 1950s, the town began to decline as the seafood industry moved away from the area. The town's population decreased, and many of the businesses closed. In the late 1970s, the town began to experience a resurgence as the tourism industry began to grow. The town is now home to several marinas, restaurants, and other tourist attractions.
Common Questions
What is Per Capita Income in Fulton?
Per Capita income in Fulton is $50,199.
What is the Median Family Income in Fulton?
Median Family Income in Fulton is $50,204.
What is the Median Household income in Fulton?
Median Household Income in Fulton is $41,900.
What is Inequality or Gini Index in Fulton?
Inequality or Gini Index in Fulton is 0.59.
What is the Total Population of Fulton?
Total Population of Fulton is 1,241.
What is the Total Male Population of Fulton?
Total Male Population of Fulton is 439.
What is the Total Female Population of Fulton?
Total Female Population of Fulton is 802.
What is the Ratio of Males per 100 Females in Fulton?
There are 54.74 Males per 100 Females in Fulton.
What is the Ratio of Females per 100 Males in Fulton?
There are 182.69 Females per 100 Males in Fulton.
What is the Median Population Age in Fulton?
Median Population Age in Fulton is 62.0 Years.
What is the Average Family Size in Fulton
Average Family Size in Fulton is 1.9 People.
What is the Average Household Size in Fulton
Average Household Size in Fulton is 1.7 People.
How Large is the Labor Force in Fulton?
There are 371 People in the Labor Forcein in Fulton.
What is the Percentage of People in the Labor Force in Fulton?
30.0% of People are in the Labor Force in Fulton.
What is the Unemployment Rate in Fulton?
Unemployment Rate in Fulton is 3.0%.