Follett, TX Map & Demographics
Follett Map
Follett Overview
$30,290
PER CAPITA INCOME
$90,833
AVG FAMILY INCOME
$80,500
AVG HOUSEHOLD INCOME
45.2%
WAGE / INCOME GAP [ % ]
54.8¢/ $1
WAGE / INCOME GAP [ $ ]
0.32
INEQUALITY / GINI INDEX
396
TOTAL POPULATION
184
MALE POPULATION
212
FEMALE POPULATION
86.79
MALES / 100 FEMALES
115.22
FEMALES / 100 MALES
35.3
MEDIAN AGE
2.9
AVG FAMILY SIZE
2.8
AVG HOUSEHOLD SIZE
175
LABOR FORCE [ PEOPLE ]
59.7%
PERCENT IN LABOR FORCE
1.1%
UNEMPLOYMENT RATE
Follett Zip Codes
Follett Area Codes
Income in Follett
Income Overview in Follett
Per Capita Income in Follett is $30,290, while median incomes of families and households are $90,833 and $80,500 respectively.
| Characteristic | Number | Measure |
| Per Capita Income | 396 | $30,290 |
| Median Family Income | 122 | $90,833 |
| Mean Family Income | 122 | $91,234 |
| Median Household Income | 140 | $80,500 |
| Mean Household Income | 140 | $85,694 |
| Income Deficit | 122 | $0 |
| Wage / Income Gap (%) | 396 | 45.25% |
| Wage / Income Gap ($) | 396 | 54.75¢ per $1 |
| Gini / Inequality Index | 396 | 0.32 |
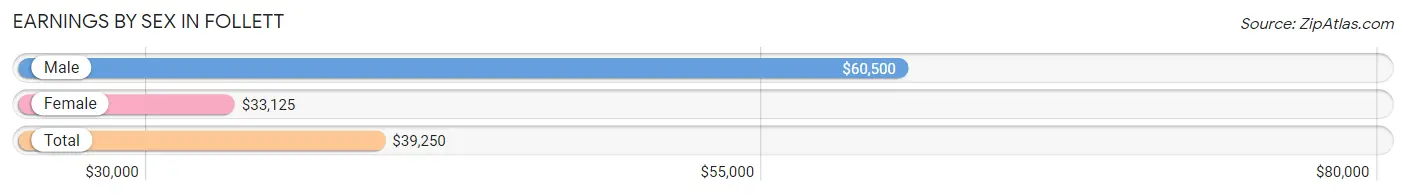
Earnings by Sex in Follett
Average Earnings in Follett are $39,250, $60,500 for men and $33,125 for women, a difference of 45.3%.
| Sex | Number | Average Earnings |
| Male | 88 (46.3%) | $60,500 |
| Female | 102 (53.7%) | $33,125 |
| Total | 190 (100.0%) | $39,250 |
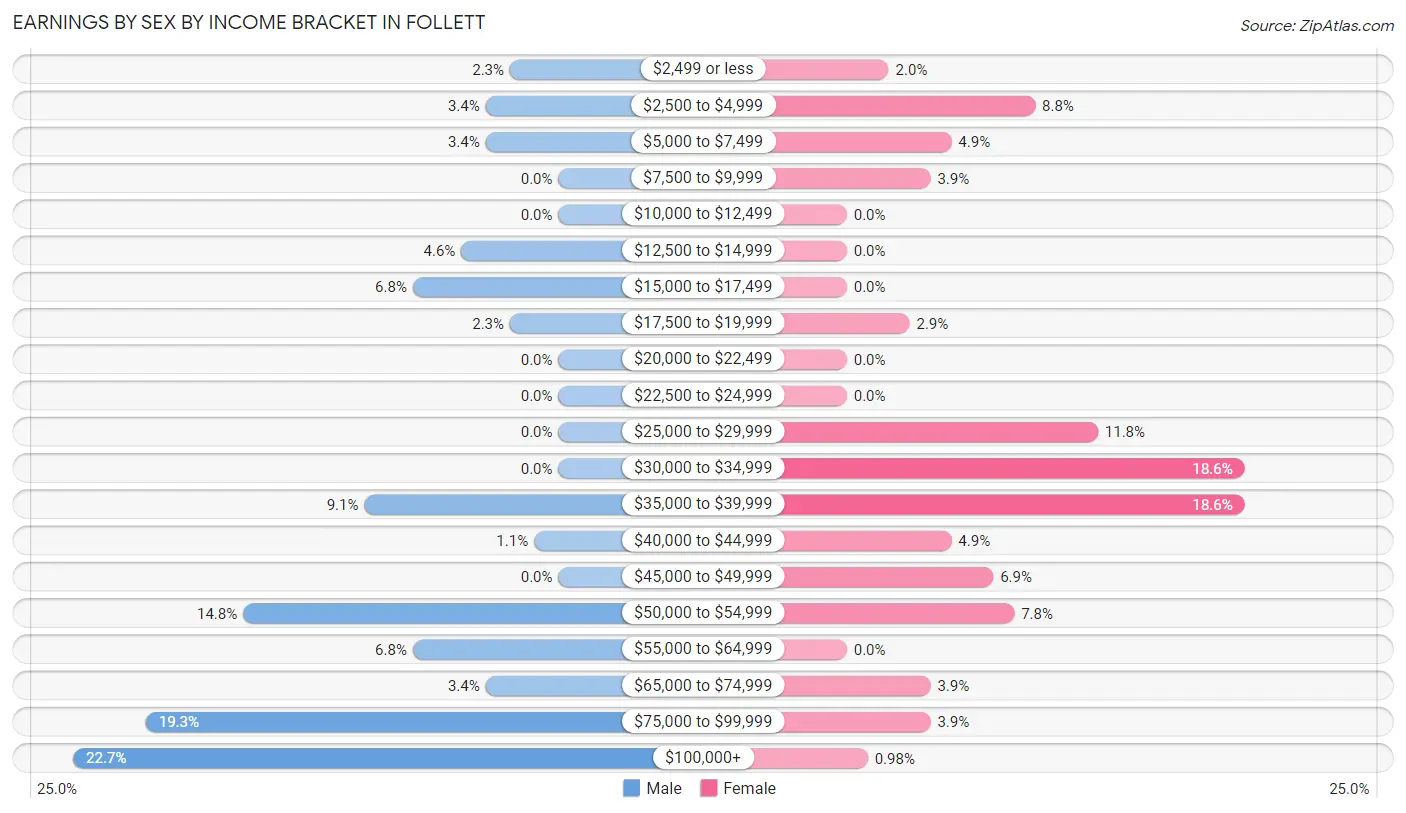
Earnings by Sex by Income Bracket in Follett
The most common earnings brackets in Follett are $100,000+ for men (20 | 22.7%) and $30,000 to $34,999 for women (19 | 18.6%).
| Income | Male | Female |
| $2,499 or less | 2 (2.3%) | 2 (2.0%) |
| $2,500 to $4,999 | 3 (3.4%) | 9 (8.8%) |
| $5,000 to $7,499 | 3 (3.4%) | 5 (4.9%) |
| $7,500 to $9,999 | 0 (0.0%) | 4 (3.9%) |
| $10,000 to $12,499 | 0 (0.0%) | 0 (0.0%) |
| $12,500 to $14,999 | 4 (4.5%) | 0 (0.0%) |
| $15,000 to $17,499 | 6 (6.8%) | 0 (0.0%) |
| $17,500 to $19,999 | 2 (2.3%) | 3 (2.9%) |
| $20,000 to $22,499 | 0 (0.0%) | 0 (0.0%) |
| $22,500 to $24,999 | 0 (0.0%) | 0 (0.0%) |
| $25,000 to $29,999 | 0 (0.0%) | 12 (11.8%) |
| $30,000 to $34,999 | 0 (0.0%) | 19 (18.6%) |
| $35,000 to $39,999 | 8 (9.1%) | 19 (18.6%) |
| $40,000 to $44,999 | 1 (1.1%) | 5 (4.9%) |
| $45,000 to $49,999 | 0 (0.0%) | 7 (6.9%) |
| $50,000 to $54,999 | 13 (14.8%) | 8 (7.8%) |
| $55,000 to $64,999 | 6 (6.8%) | 0 (0.0%) |
| $65,000 to $74,999 | 3 (3.4%) | 4 (3.9%) |
| $75,000 to $99,999 | 17 (19.3%) | 4 (3.9%) |
| $100,000+ | 20 (22.7%) | 1 (1.0%) |
| Total | 88 (100.0%) | 102 (100.0%) |
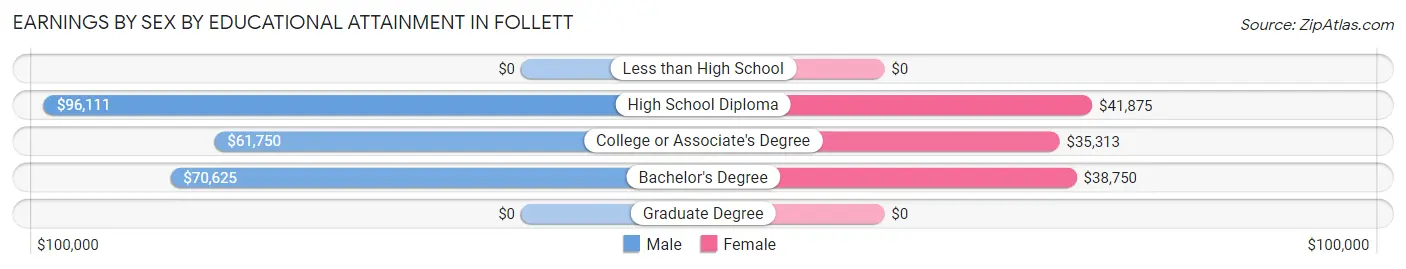
Earnings by Sex by Educational Attainment in Follett
Average earnings in Follett are $65,000 for men and $37,583 for women, a difference of 42.2%. Men with an educational attainment of high school diploma enjoy the highest average annual earnings of $96,111, while those with college or associate's degree education earn the least with $61,750. Women with an educational attainment of high school diploma earn the most with the average annual earnings of $41,875, while those with college or associate's degree education have the smallest earnings of $35,313.
| Educational Attainment | Male Income | Female Income |
| Less than High School | - | - |
| High School Diploma | $96,111 | $41,875 |
| College or Associate's Degree | $61,750 | $35,313 |
| Bachelor's Degree | $70,625 | $38,750 |
| Graduate Degree | - | - |
| Total | $65,000 | $37,583 |
Family Income in Follett
Family Income Brackets in Follett
According to the Follett family income data, there are 33 families falling into the $100,000 to $149,999 income range, which is the most common income bracket and makes up 27.1% of all families. Conversely, the less than $10,000 income bracket is the least frequent group with only 1 families (0.8%) belonging to this category.
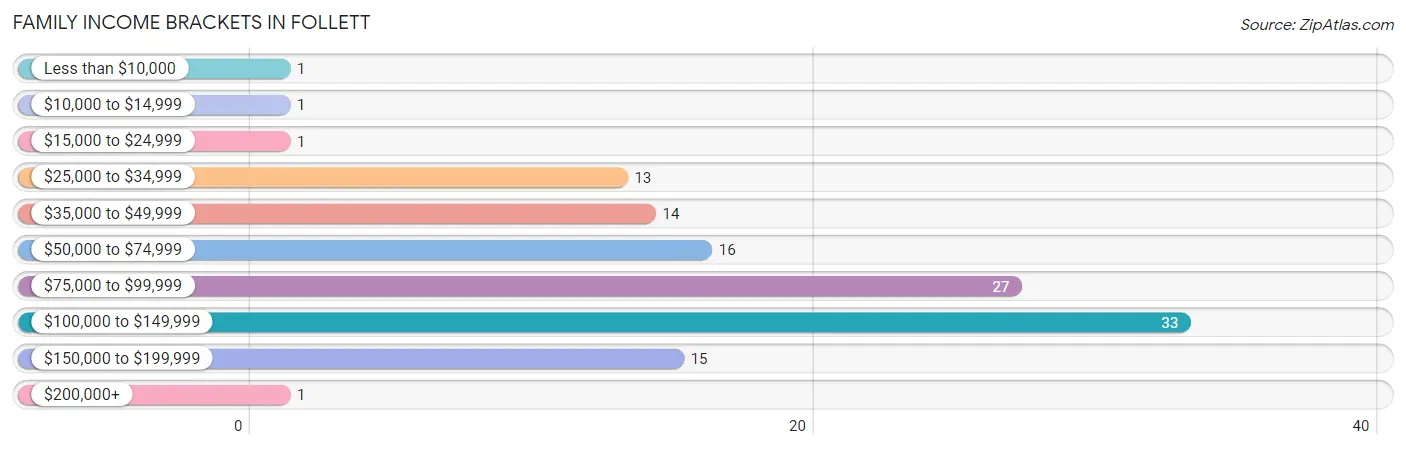
| Income Bracket | # Families | % Families |
| Less than $10,000 | 1 | 0.8% |
| $10,000 to $14,999 | 1 | 0.8% |
| $15,000 to $24,999 | 1 | 0.8% |
| $25,000 to $34,999 | 13 | 10.7% |
| $35,000 to $49,999 | 14 | 11.5% |
| $50,000 to $74,999 | 16 | 13.1% |
| $75,000 to $99,999 | 27 | 22.1% |
| $100,000 to $149,999 | 33 | 27.0% |
| $150,000 to $199,999 | 15 | 12.3% |
| $200,000+ | 1 | 0.8% |
Family Income by Famaliy Size in Follett
5-person families (14 | 11.5%) account for the highest median family income in Follett with $113,571 per family, while 2-person families (66 | 54.1%) have the highest median income of $38,500 per family member.
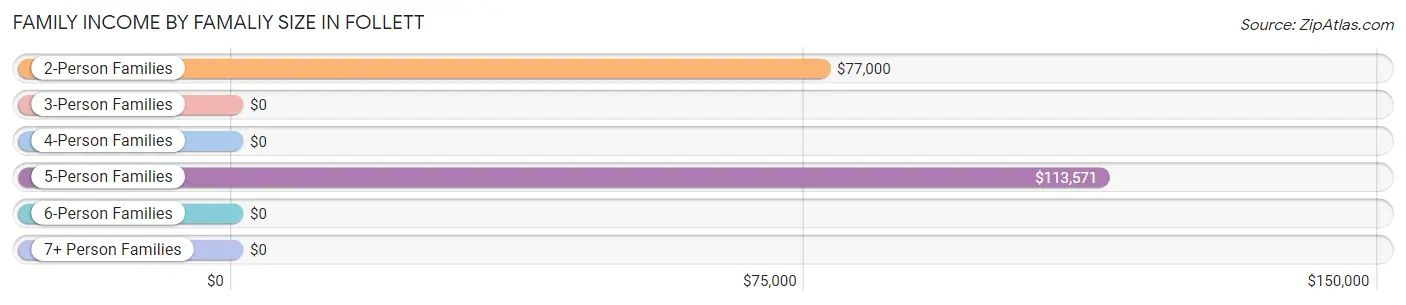
| Income Bracket | # Families | Median Income |
| 2-Person Families | 66 (54.1%) | $77,000 |
| 3-Person Families | 23 (18.9%) | $0 |
| 4-Person Families | 19 (15.6%) | $0 |
| 5-Person Families | 14 (11.5%) | $113,571 |
| 6-Person Families | 0 (0.0%) | $0 |
| 7+ Person Families | 0 (0.0%) | $0 |
| Total | 122 (100.0%) | $90,833 |
Family Income by Number of Earners in Follett
The median family income in Follett is $90,833, with families comprising 2 earners (43) having the highest median family income of $125,139, while families with no earners (16) have the lowest median family income of $61,667, accounting for 35.2% and 13.1% of families, respectively.
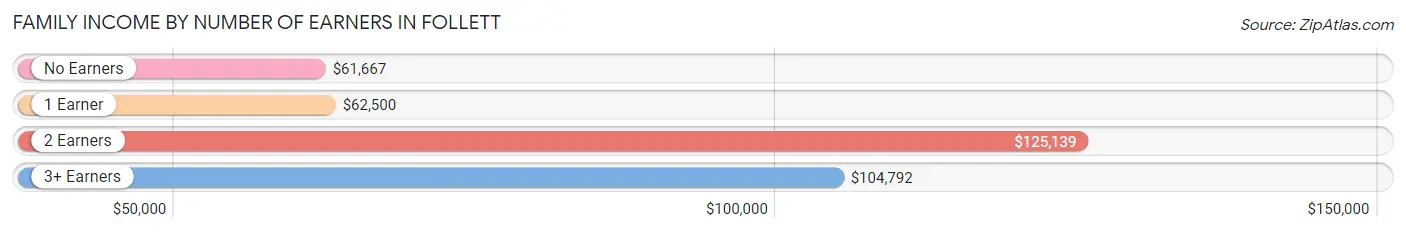
| Number of Earners | # Families | Median Income |
| No Earners | 16 (13.1%) | $61,667 |
| 1 Earner | 52 (42.6%) | $62,500 |
| 2 Earners | 43 (35.2%) | $125,139 |
| 3+ Earners | 11 (9.0%) | $104,792 |
| Total | 122 (100.0%) | $90,833 |
Household Income in Follett
Household Income Brackets in Follett
With 34 households falling in the category, the $100,000 to $149,999 income range is the most frequent in Follett, accounting for 24.3% of all households. In contrast, only 1 households (0.7%) fall into the $200,000+ income bracket, making it the least populous group.
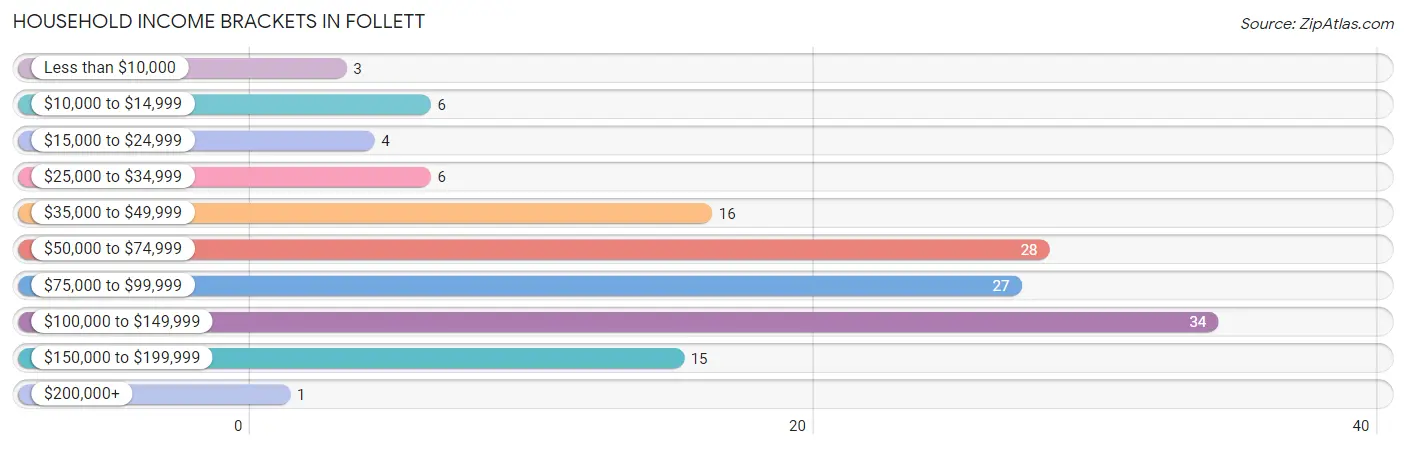
| Income Bracket | # Households | % Households |
| Less than $10,000 | 3 | 2.1% |
| $10,000 to $14,999 | 6 | 4.3% |
| $15,000 to $24,999 | 4 | 2.9% |
| $25,000 to $34,999 | 6 | 4.3% |
| $35,000 to $49,999 | 16 | 11.4% |
| $50,000 to $74,999 | 28 | 20.0% |
| $75,000 to $99,999 | 27 | 19.3% |
| $100,000 to $149,999 | 34 | 24.3% |
| $150,000 to $199,999 | 15 | 10.7% |
| $200,000+ | 1 | 0.7% |
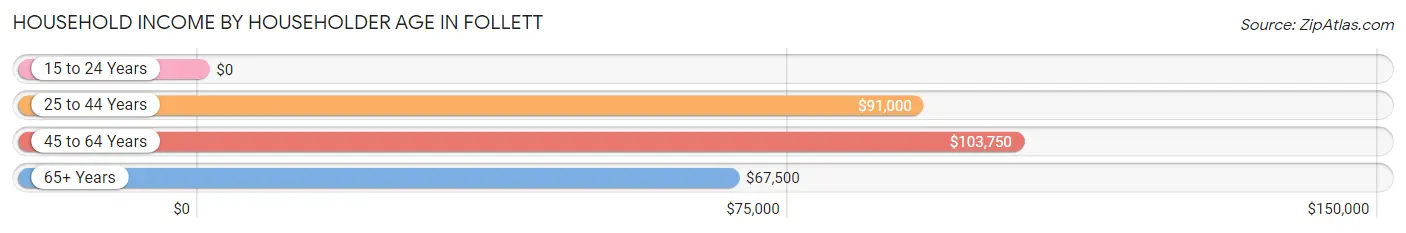
Household Income by Householder Age in Follett
The median household income in Follett is $80,500, with the highest median household income of $103,750 found in the 45 to 64 years age bracket for the primary householder. A total of 48 households (34.3%) fall into this category.
| Income Bracket | # Households | Median Income |
| 15 to 24 Years | 0 (0.0%) | $0 |
| 25 to 44 Years | 54 (38.6%) | $91,000 |
| 45 to 64 Years | 48 (34.3%) | $103,750 |
| 65+ Years | 38 (27.1%) | $67,500 |
| Total | 140 (100.0%) | $80,500 |
Poverty in Follett
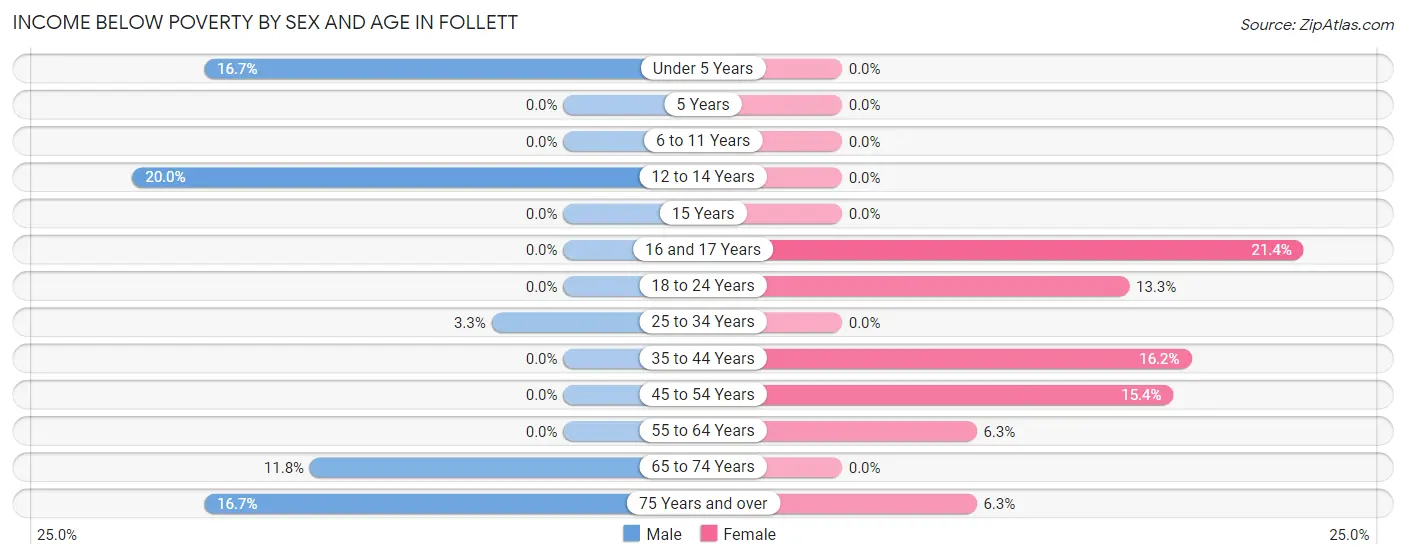
Income Below Poverty by Sex and Age in Follett
With 5.4% poverty level for males and 7.7% for females among the residents of Follett, 12 to 14 year old males and 16 and 17 year old females are the most vulnerable to poverty, with 2 males (20.0%) and 3 females (21.4%) in their respective age groups living below the poverty level.
| Age Bracket | Male | Female |
| Under 5 Years | 2 (16.7%) | 0 (0.0%) |
| 5 Years | 0 (0.0%) | 0 (0.0%) |
| 6 to 11 Years | 0 (0.0%) | 0 (0.0%) |
| 12 to 14 Years | 2 (20.0%) | 0 (0.0%) |
| 15 Years | 0 (0.0%) | 0 (0.0%) |
| 16 and 17 Years | 0 (0.0%) | 3 (21.4%) |
| 18 to 24 Years | 0 (0.0%) | 2 (13.3%) |
| 25 to 34 Years | 1 (3.3%) | 0 (0.0%) |
| 35 to 44 Years | 0 (0.0%) | 6 (16.2%) |
| 45 to 54 Years | 0 (0.0%) | 2 (15.4%) |
| 55 to 64 Years | 0 (0.0%) | 2 (6.2%) |
| 65 to 74 Years | 2 (11.8%) | 0 (0.0%) |
| 75 Years and over | 3 (16.7%) | 1 (6.2%) |
| Total | 10 (5.4%) | 16 (7.7%) |
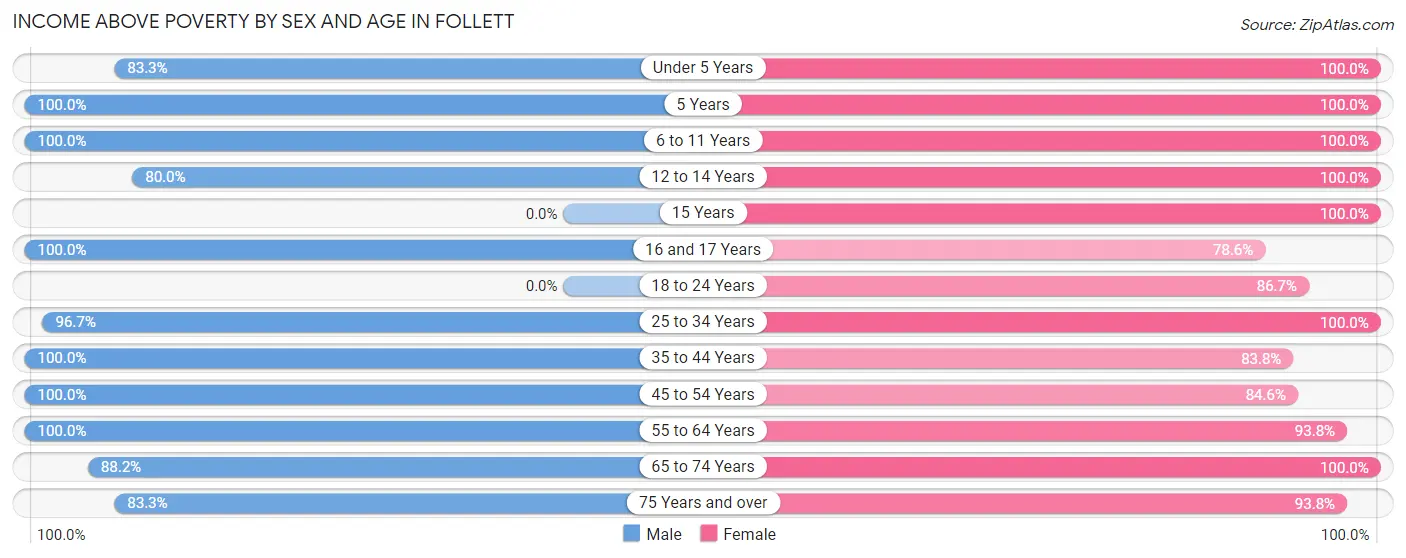
Income Above Poverty by Sex and Age in Follett
According to the poverty statistics in Follett, males aged 5 years and females aged under 5 years are the age groups that are most secure financially, with 100.0% of males and 100.0% of females in these age groups living above the poverty line.
| Age Bracket | Male | Female |
| Under 5 Years | 10 (83.3%) | 4 (100.0%) |
| 5 Years | 16 (100.0%) | 19 (100.0%) |
| 6 to 11 Years | 18 (100.0%) | 8 (100.0%) |
| 12 to 14 Years | 8 (80.0%) | 3 (100.0%) |
| 15 Years | 0 (0.0%) | 9 (100.0%) |
| 16 and 17 Years | 10 (100.0%) | 11 (78.6%) |
| 18 to 24 Years | 0 (0.0%) | 13 (86.7%) |
| 25 to 34 Years | 29 (96.7%) | 22 (100.0%) |
| 35 to 44 Years | 12 (100.0%) | 31 (83.8%) |
| 45 to 54 Years | 7 (100.0%) | 11 (84.6%) |
| 55 to 64 Years | 34 (100.0%) | 30 (93.8%) |
| 65 to 74 Years | 15 (88.2%) | 16 (100.0%) |
| 75 Years and over | 15 (83.3%) | 15 (93.8%) |
| Total | 174 (94.6%) | 192 (92.3%) |
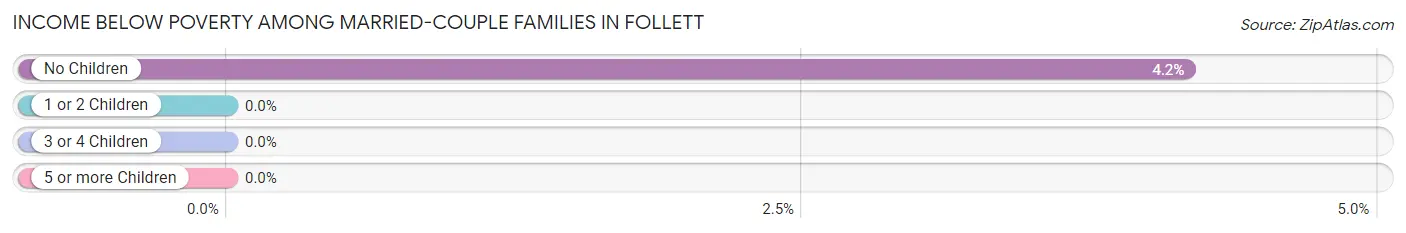
Income Below Poverty Among Married-Couple Families in Follett
The poverty statistics for married-couple families in Follett show that 2.6% or 2 of the total 78 families live below the poverty line. Families with no children have the highest poverty rate of 4.2%, comprising of 2 families. On the other hand, families with 1 or 2 children have the lowest poverty rate of 0.0%, which includes 0 families.
| Children | Above Poverty | Below Poverty |
| No Children | 46 (95.8%) | 2 (4.2%) |
| 1 or 2 Children | 30 (100.0%) | 0 (0.0%) |
| 3 or 4 Children | 0 (0.0%) | 0 (0.0%) |
| 5 or more Children | 0 (0.0%) | 0 (0.0%) |
| Total | 76 (97.4%) | 2 (2.6%) |
Income Below Poverty Among Single-Parent Households in Follett
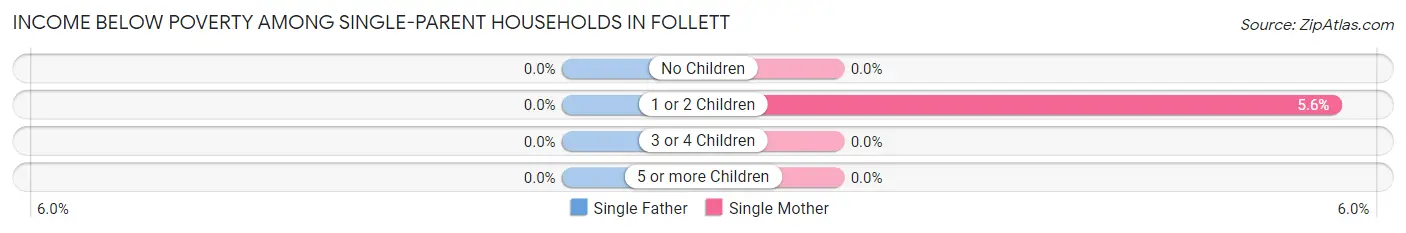
| Children | Single Father | Single Mother |
| No Children | 0 (0.0%) | 0 (0.0%) |
| 1 or 2 Children | 0 (0.0%) | 1 (5.6%) |
| 3 or 4 Children | 0 (0.0%) | 0 (0.0%) |
| 5 or more Children | 0 (0.0%) | 0 (0.0%) |
| Total | 0 (0.0%) | 1 (3.8%) |
Income Below Poverty Among Married-Couple vs Single-Parent Households in Follett
The poverty data for Follett shows that 2 of the married-couple family households (2.6%) and 1 of the single-parent households (2.3%) are living below the poverty level. Within the married-couple family households, those with no children have the highest poverty rate, with 2 households (4.2%) falling below the poverty line. Among the single-parent households, those with 1 or 2 children have the highest poverty rate, with 1 household (4.3%) living below poverty.
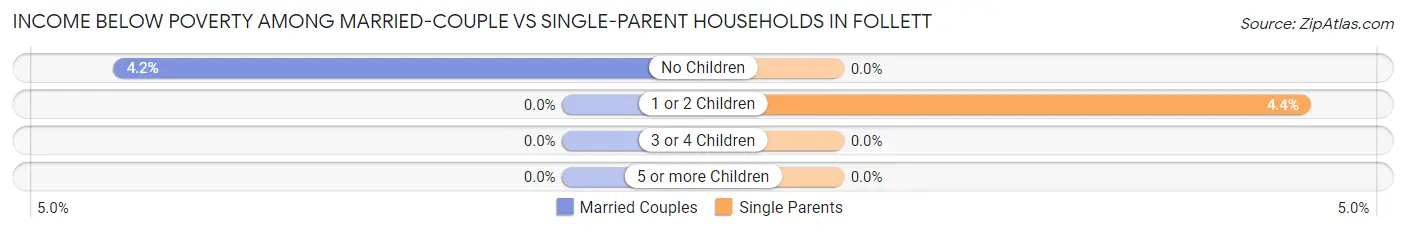
| Children | Married-Couple Families | Single-Parent Households |
| No Children | 2 (4.2%) | 0 (0.0%) |
| 1 or 2 Children | 0 (0.0%) | 1 (4.3%) |
| 3 or 4 Children | 0 (0.0%) | 0 (0.0%) |
| 5 or more Children | 0 (0.0%) | 0 (0.0%) |
| Total | 2 (2.6%) | 1 (2.3%) |
Race in Follett
The most populous races in Follett are White / Caucasian (377 | 95.2%), Hispanic or Latino (31 | 7.8%), and Two or more Races (15 | 3.8%).
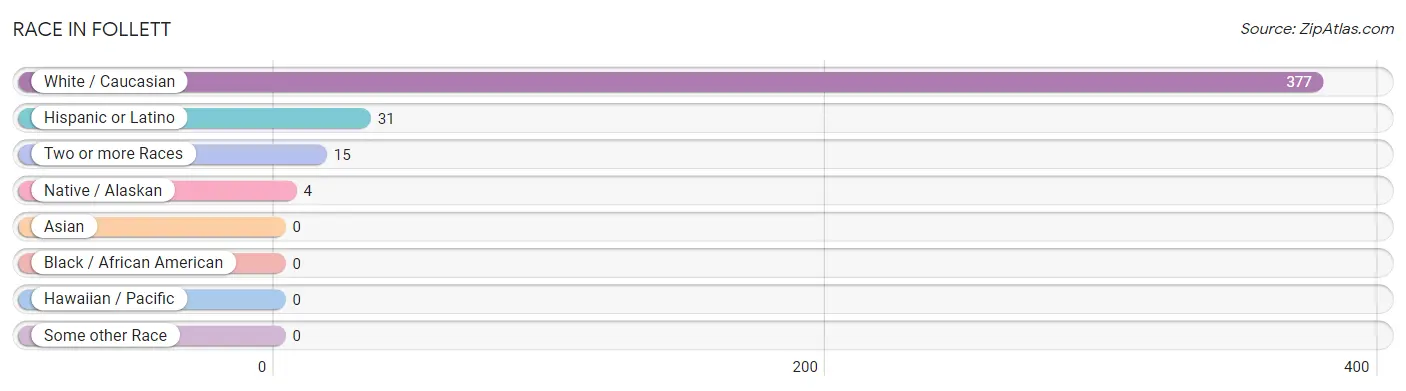
| Race | # Population | % Population |
| Asian | 0 | 0.0% |
| Black / African American | 0 | 0.0% |
| Hawaiian / Pacific | 0 | 0.0% |
| Hispanic or Latino | 31 | 7.8% |
| Native / Alaskan | 4 | 1.0% |
| White / Caucasian | 377 | 95.2% |
| Two or more Races | 15 | 3.8% |
| Some other Race | 0 | 0.0% |
| Total | 396 | 100.0% |
Ancestry in Follett
The most populous ancestries reported in Follett are German (97 | 24.5%), English (41 | 10.3%), Irish (38 | 9.6%), Mexican (20 | 5.1%), and French (19 | 4.8%), together accounting for 54.3% of all Follett residents.
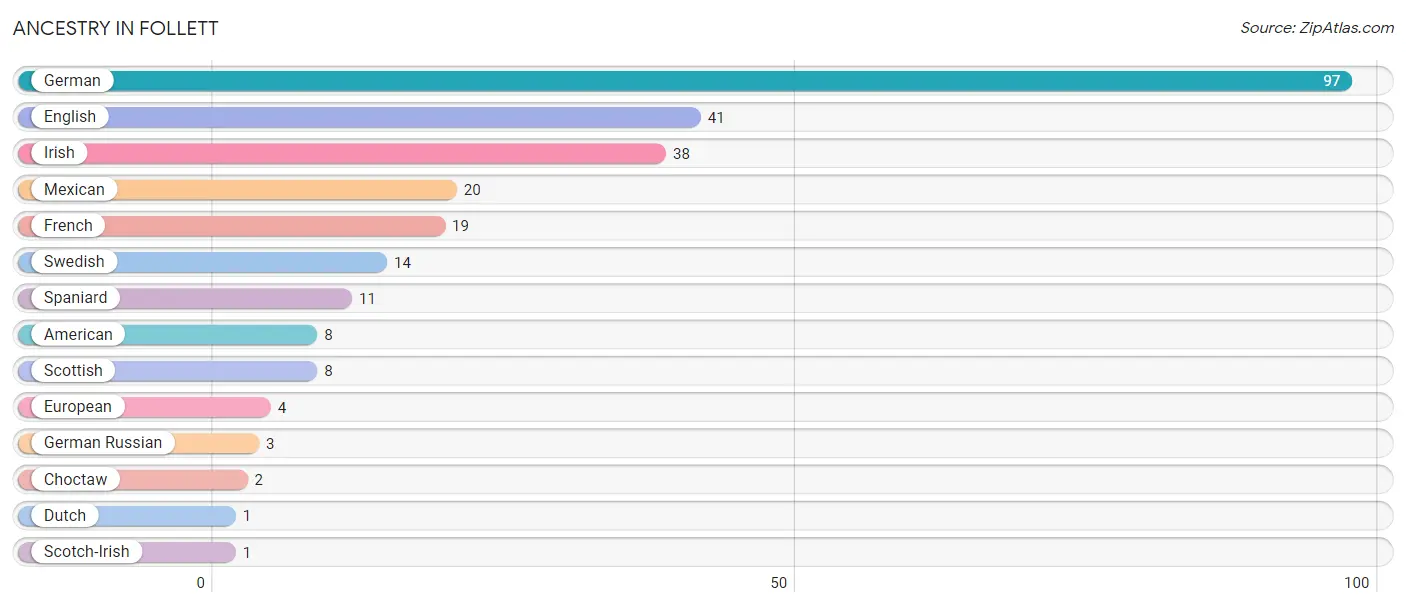
| Ancestry | # Population | % Population |
| American | 8 | 2.0% |
| Choctaw | 2 | 0.5% |
| Dutch | 1 | 0.3% |
| English | 41 | 10.3% |
| European | 4 | 1.0% |
| French | 19 | 4.8% |
| German | 97 | 24.5% |
| German Russian | 3 | 0.8% |
| Irish | 38 | 9.6% |
| Mexican | 20 | 5.1% |
| Scotch-Irish | 1 | 0.3% |
| Scottish | 8 | 2.0% |
| Spaniard | 11 | 2.8% |
| Swedish | 14 | 3.5% | View All 14 Rows |
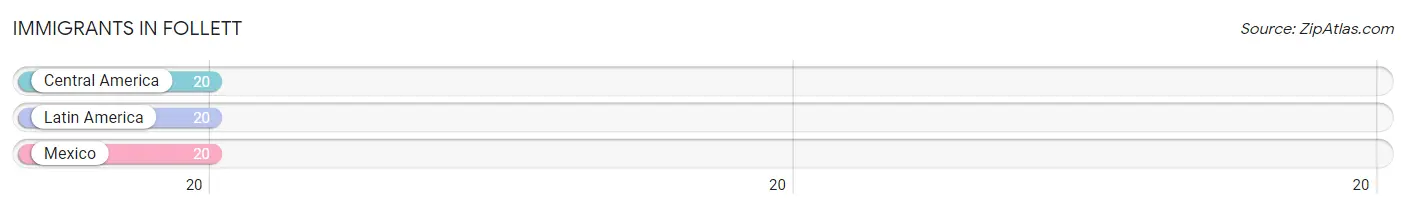
Immigrants in Follett
The most numerous immigrant groups reported in Follett came from Central America (20 | 5.1%), Latin America (20 | 5.1%), and Mexico (20 | 5.1%), together accounting for 15.2% of all Follett residents.
| Immigration Origin | # Population | % Population |
| Central America | 20 | 5.1% |
| Latin America | 20 | 5.1% |
| Mexico | 20 | 5.1% | View All 3 Rows |
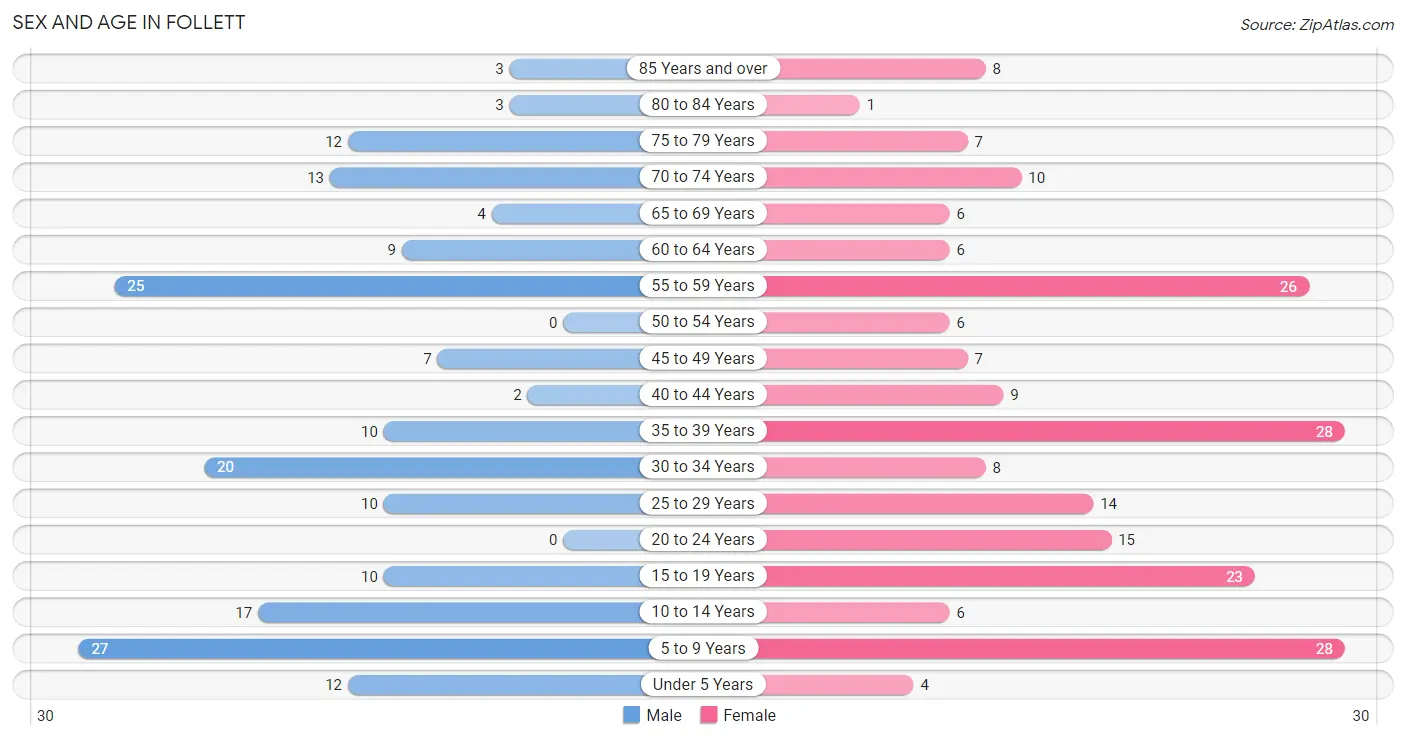
Sex and Age in Follett
Sex and Age in Follett
The most populous age groups in Follett are 5 to 9 Years (27 | 14.7%) for men and 5 to 9 Years (28 | 13.2%) for women.
| Age Bracket | Male | Female |
| Under 5 Years | 12 (6.5%) | 4 (1.9%) |
| 5 to 9 Years | 27 (14.7%) | 28 (13.2%) |
| 10 to 14 Years | 17 (9.2%) | 6 (2.8%) |
| 15 to 19 Years | 10 (5.4%) | 23 (10.8%) |
| 20 to 24 Years | 0 (0.0%) | 15 (7.1%) |
| 25 to 29 Years | 10 (5.4%) | 14 (6.6%) |
| 30 to 34 Years | 20 (10.9%) | 8 (3.8%) |
| 35 to 39 Years | 10 (5.4%) | 28 (13.2%) |
| 40 to 44 Years | 2 (1.1%) | 9 (4.3%) |
| 45 to 49 Years | 7 (3.8%) | 7 (3.3%) |
| 50 to 54 Years | 0 (0.0%) | 6 (2.8%) |
| 55 to 59 Years | 25 (13.6%) | 26 (12.3%) |
| 60 to 64 Years | 9 (4.9%) | 6 (2.8%) |
| 65 to 69 Years | 4 (2.2%) | 6 (2.8%) |
| 70 to 74 Years | 13 (7.1%) | 10 (4.7%) |
| 75 to 79 Years | 12 (6.5%) | 7 (3.3%) |
| 80 to 84 Years | 3 (1.6%) | 1 (0.5%) |
| 85 Years and over | 3 (1.6%) | 8 (3.8%) |
| Total | 184 (100.0%) | 212 (100.0%) |
Families and Households in Follett
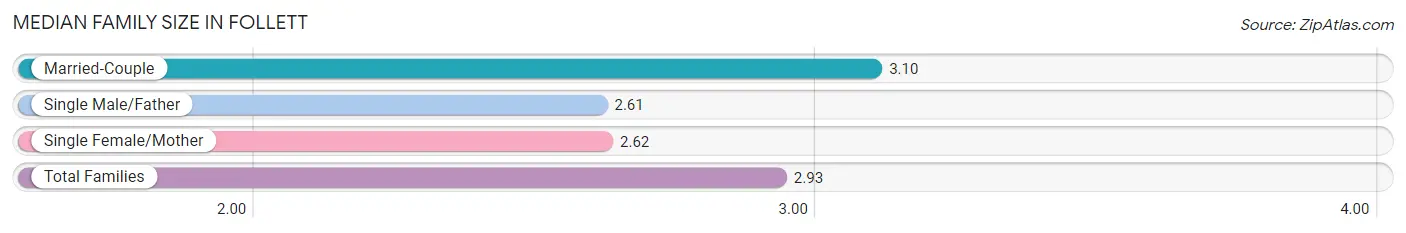
Median Family Size in Follett
The median family size in Follett is 2.93 persons per family, with married-couple families (78 | 63.9%) accounting for the largest median family size of 3.1 persons per family. On the other hand, single male/father families (18 | 14.7%) represent the smallest median family size with 2.61 persons per family.
| Family Type | # Families | Family Size |
| Married-Couple | 78 (63.9%) | 3.10 |
| Single Male/Father | 18 (14.7%) | 2.61 |
| Single Female/Mother | 26 (21.3%) | 2.62 |
| Total Families | 122 (100.0%) | 2.93 |
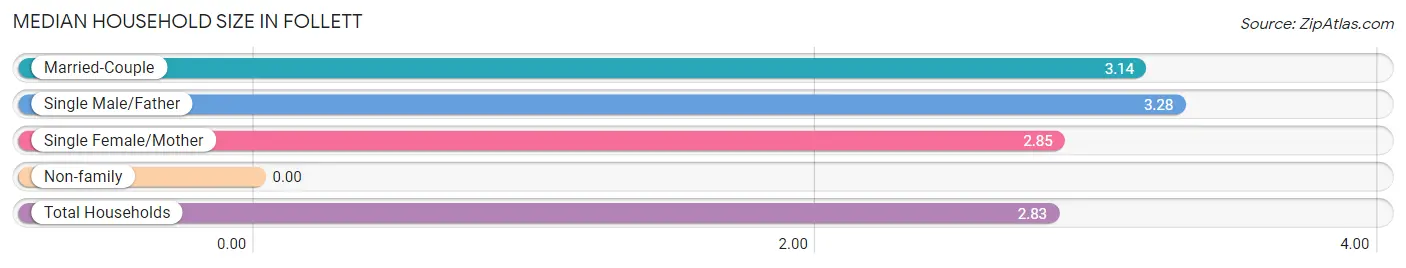
Median Household Size in Follett
| Household Type | # Households | Household Size |
| Married-Couple | 78 (55.7%) | 3.14 |
| Single Male/Father | 18 (12.9%) | 3.28 |
| Single Female/Mother | 26 (18.6%) | 2.85 |
| Non-family | 18 (12.9%) | - |
| Total Households | 140 (100.0%) | 2.83 |
Household Size by Marriage Status in Follett
Out of a total of 140 households in Follett, 122 (87.1%) are family households, while 18 (12.9%) are nonfamily households. The most numerous type of family households are 2-person households, comprising 65, and the most common type of nonfamily households are 1-person households, comprising 18.
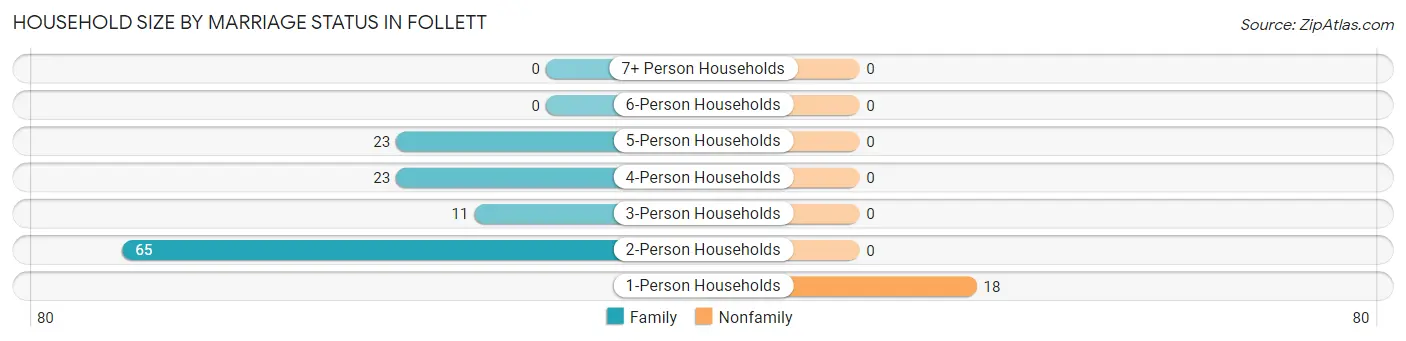
| Household Size | Family Households | Nonfamily Households |
| 1-Person Households | - | 18 (12.9%) |
| 2-Person Households | 65 (46.4%) | 0 (0.0%) |
| 3-Person Households | 11 (7.9%) | 0 (0.0%) |
| 4-Person Households | 23 (16.4%) | 0 (0.0%) |
| 5-Person Households | 23 (16.4%) | 0 (0.0%) |
| 6-Person Households | 0 (0.0%) | 0 (0.0%) |
| 7+ Person Households | 0 (0.0%) | 0 (0.0%) |
| Total | 122 (87.1%) | 18 (12.9%) |
Female Fertility in Follett
Fertility by Age in Follett
Average fertility rate in Follett is 10.0 births per 1,000 women. Women in the age bracket of 35 to 50 years have the highest fertility rate with 23.0 births per 1,000 women. Women in the age bracket of 35 to 50 years acount for 100.0% of all women with births.
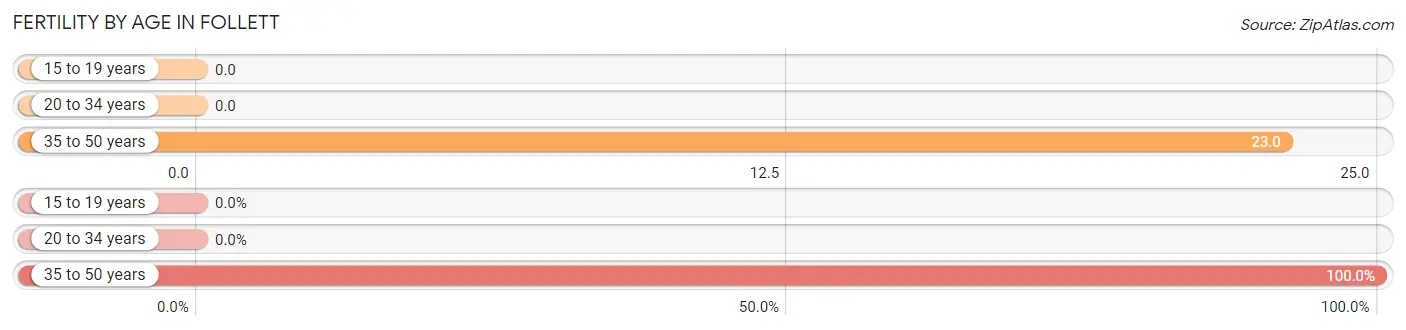
| Age Bracket | Women with Births | Births / 1,000 Women |
| 15 to 19 years | 0 (0.0%) | 0.0 |
| 20 to 34 years | 0 (0.0%) | 0.0 |
| 35 to 50 years | 1 (100.0%) | 23.0 |
| Total | 1 (100.0%) | 10.0 |
Fertility by Age by Marriage Status in Follett
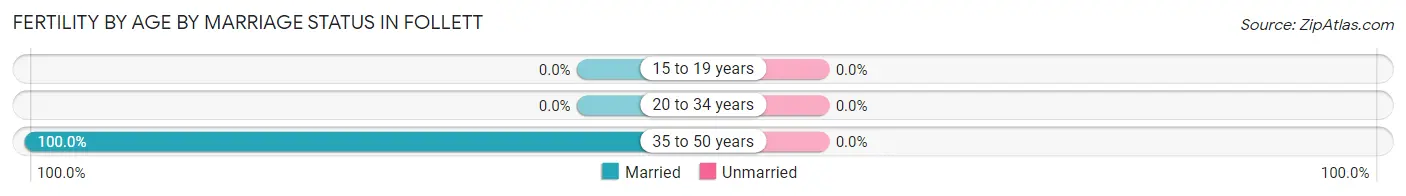
| Age Bracket | Married | Unmarried |
| 15 to 19 years | 0 (0.0%) | 0 (0.0%) |
| 20 to 34 years | 0 (0.0%) | 0 (0.0%) |
| 35 to 50 years | 1 (100.0%) | 0 (0.0%) |
| Total | 1 (100.0%) | 0 (0.0%) |
Fertility by Education in Follett
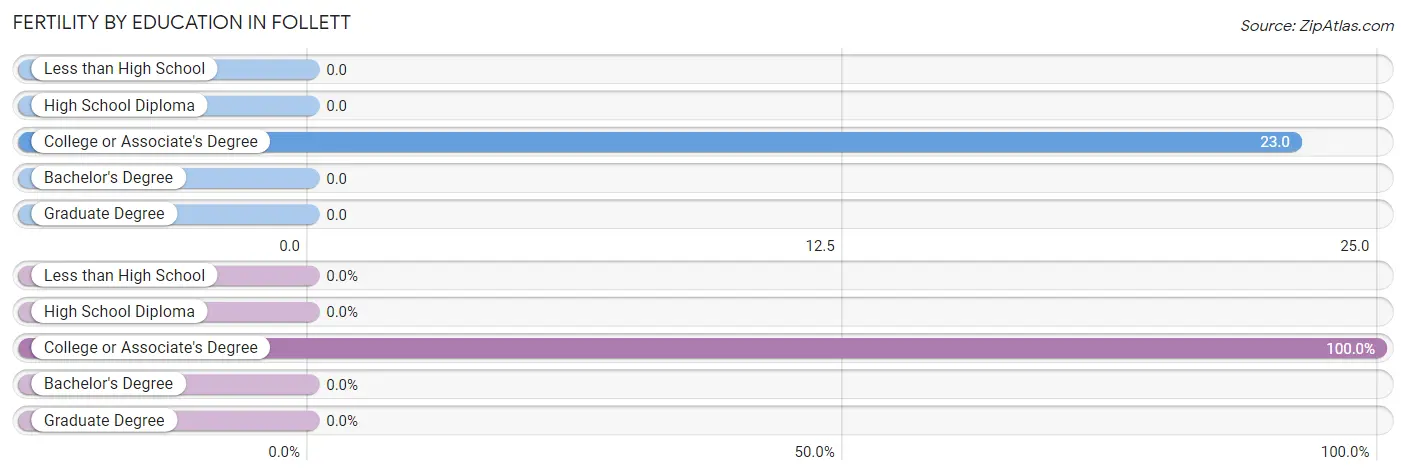
| Educational Attainment | Women with Births | Births / 1,000 Women |
| Less than High School | 0 (0.0%) | 0.0 |
| High School Diploma | 0 (0.0%) | 0.0 |
| College or Associate's Degree | 1 (100.0%) | 23.0 |
| Bachelor's Degree | 0 (0.0%) | 0.0 |
| Graduate Degree | 0 (0.0%) | 0.0 |
| Total | 1 (100.0%) | 10.0 |
Fertility by Education by Marriage Status in Follett
| Educational Attainment | Married | Unmarried |
| Less than High School | 0 (0.0%) | 0 (0.0%) |
| High School Diploma | 0 (0.0%) | 0 (0.0%) |
| College or Associate's Degree | 1 (100.0%) | 0 (0.0%) |
| Bachelor's Degree | 0 (0.0%) | 0 (0.0%) |
| Graduate Degree | 0 (0.0%) | 0 (0.0%) |
| Total | 1 (100.0%) | 0 (0.0%) |
Employment Characteristics in Follett
Employment by Class of Employer in Follett
Among the 162 employed individuals in Follett, private company employees (94 | 58.0%), local government employees (55 | 34.0%), and self-employed (not incorporated) (9 | 5.6%) make up the most common classes of employment.
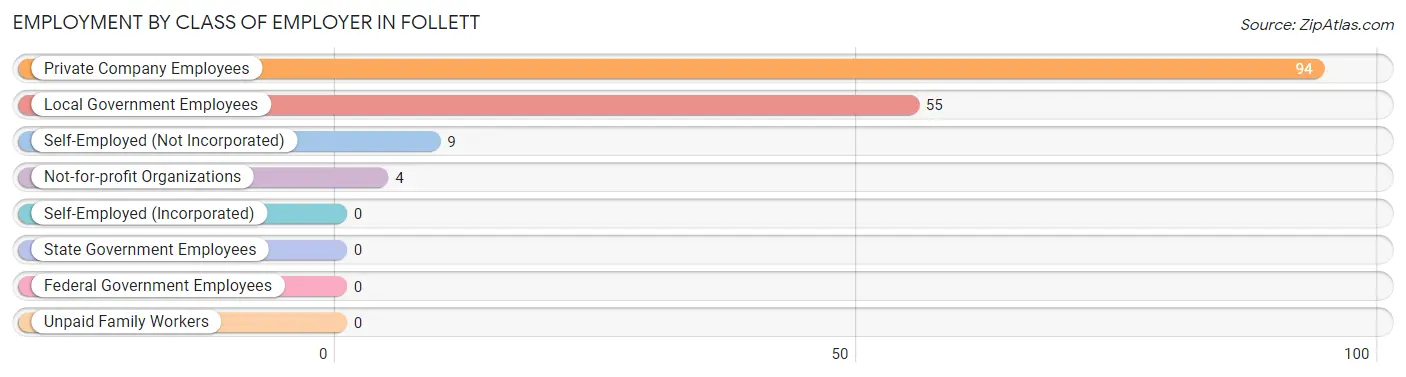
| Employer Class | # Employees | % Employees |
| Private Company Employees | 94 | 58.0% |
| Self-Employed (Incorporated) | 0 | 0.0% |
| Self-Employed (Not Incorporated) | 9 | 5.6% |
| Not-for-profit Organizations | 4 | 2.5% |
| Local Government Employees | 55 | 34.0% |
| State Government Employees | 0 | 0.0% |
| Federal Government Employees | 0 | 0.0% |
| Unpaid Family Workers | 0 | 0.0% |
| Total | 162 | 100.0% |
Employment Status by Age in Follett
According to the labor force statistics for Follett, out of the total population over 16 years of age (293), 59.7% or 175 individuals are in the labor force, with 1.1% or 2 of them unemployed. The age group with the highest labor force participation rate is 30 to 34 years, with 100.0% or 28 individuals in the labor force. Within the labor force, the 16 to 19 years age range has the highest percentage of unemployed individuals, with 28.6% or 2 of them being unemployed.
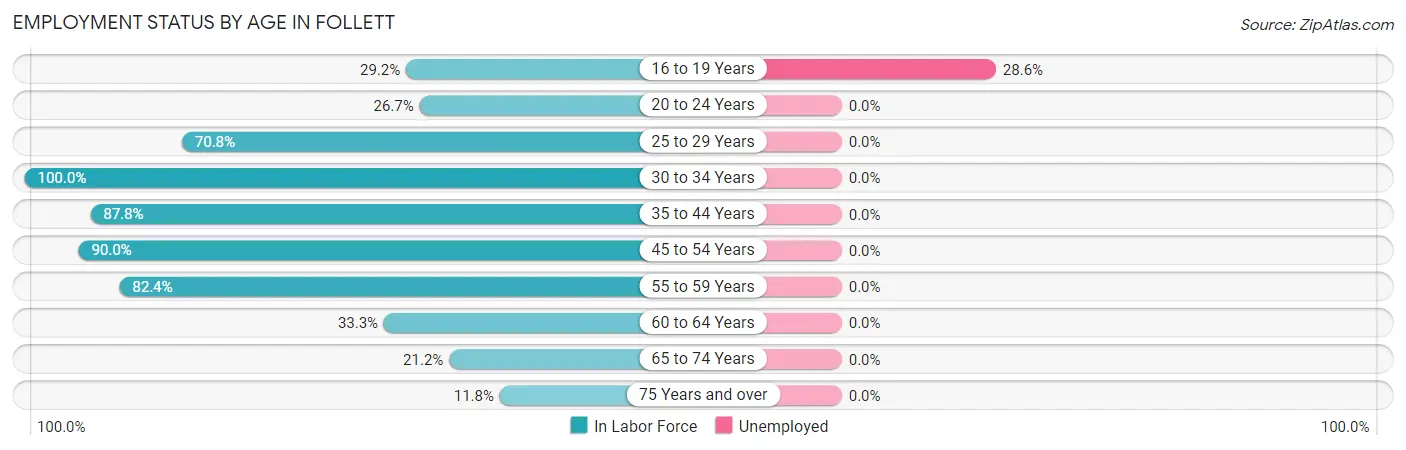
| Age Bracket | In Labor Force | Unemployed |
| 16 to 19 Years | 7 (29.2%) | 2 (28.6%) |
| 20 to 24 Years | 4 (26.7%) | 0 (0.0%) |
| 25 to 29 Years | 17 (70.8%) | 0 (0.0%) |
| 30 to 34 Years | 28 (100.0%) | 0 (0.0%) |
| 35 to 44 Years | 43 (87.8%) | 0 (0.0%) |
| 45 to 54 Years | 18 (90.0%) | 0 (0.0%) |
| 55 to 59 Years | 42 (82.4%) | 0 (0.0%) |
| 60 to 64 Years | 5 (33.3%) | 0 (0.0%) |
| 65 to 74 Years | 7 (21.2%) | 0 (0.0%) |
| 75 Years and over | 4 (11.8%) | 0 (0.0%) |
| Total | 175 (59.7%) | 2 (1.1%) |
Employment Status by Educational Attainment in Follett
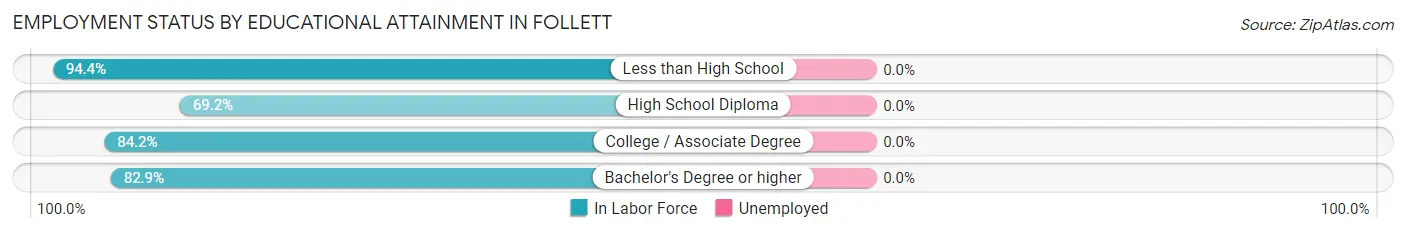
| Educational Attainment | In Labor Force | Unemployed |
| Less than High School | 17 (94.4%) | 0 (0.0%) |
| High School Diploma | 27 (69.2%) | 0 (0.0%) |
| College / Associate Degree | 80 (84.2%) | 0 (0.0%) |
| Bachelor's Degree or higher | 29 (82.9%) | 0 (0.0%) |
| Total | 153 (81.8%) | 0 (0.0%) |
Employment Occupations by Sex in Follett
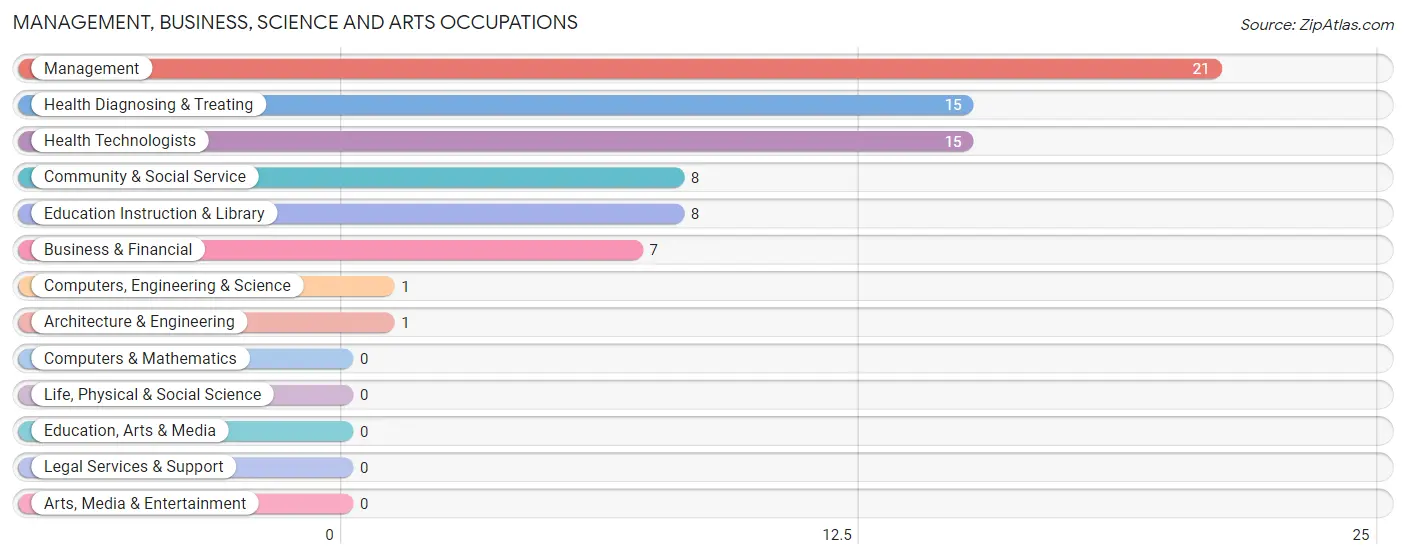
Management, Business, Science and Arts Occupations
The most common Management, Business, Science and Arts occupations in Follett are Management (21 | 12.1%), Health Diagnosing & Treating (15 | 8.7%), Health Technologists (15 | 8.7%), Community & Social Service (8 | 4.6%), and Education Instruction & Library (8 | 4.6%).
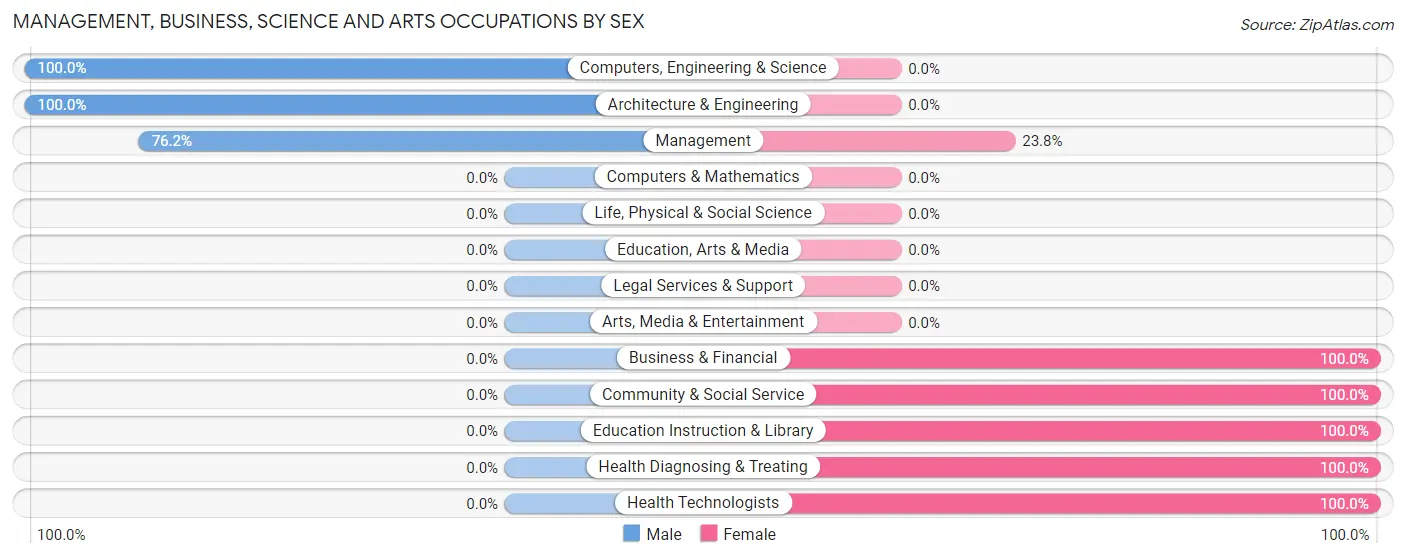
Management, Business, Science and Arts Occupations by Sex
Within the Management, Business, Science and Arts occupations in Follett, the most male-oriented occupations are Computers, Engineering & Science (100.0%), Architecture & Engineering (100.0%), and Management (76.2%), while the most female-oriented occupations are Business & Financial (100.0%), Community & Social Service (100.0%), and Education Instruction & Library (100.0%).
| Occupation | Male | Female |
| Management | 16 (76.2%) | 5 (23.8%) |
| Business & Financial | 0 (0.0%) | 7 (100.0%) |
| Computers, Engineering & Science | 1 (100.0%) | 0 (0.0%) |
| Computers & Mathematics | 0 (0.0%) | 0 (0.0%) |
| Architecture & Engineering | 1 (100.0%) | 0 (0.0%) |
| Life, Physical & Social Science | 0 (0.0%) | 0 (0.0%) |
| Community & Social Service | 0 (0.0%) | 8 (100.0%) |
| Education, Arts & Media | 0 (0.0%) | 0 (0.0%) |
| Legal Services & Support | 0 (0.0%) | 0 (0.0%) |
| Education Instruction & Library | 0 (0.0%) | 8 (100.0%) |
| Arts, Media & Entertainment | 0 (0.0%) | 0 (0.0%) |
| Health Diagnosing & Treating | 0 (0.0%) | 15 (100.0%) |
| Health Technologists | 0 (0.0%) | 15 (100.0%) |
| Total (Category) | 17 (32.7%) | 35 (67.3%) |
| Total (Overall) | 80 (46.2%) | 93 (53.8%) |
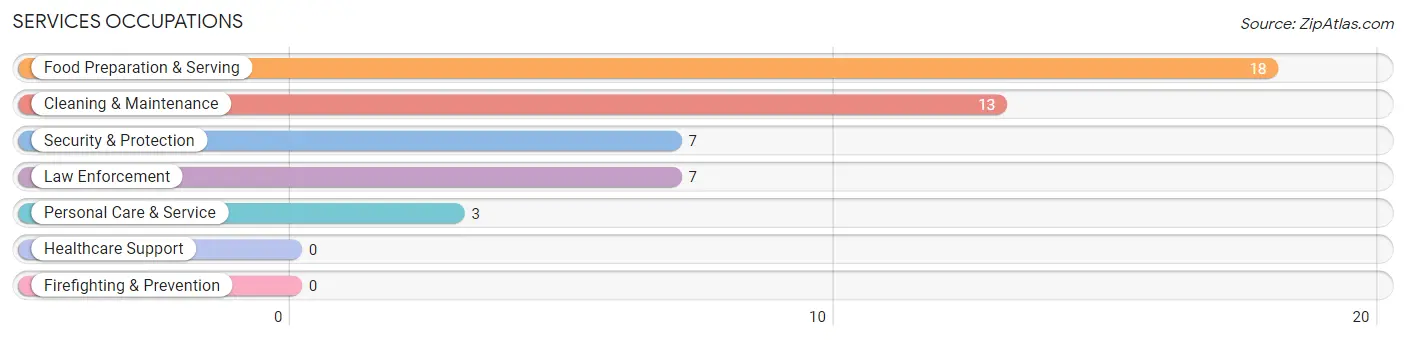
Services Occupations
The most common Services occupations in Follett are Food Preparation & Serving (18 | 10.4%), Cleaning & Maintenance (13 | 7.5%), Security & Protection (7 | 4.1%), Law Enforcement (7 | 4.1%), and Personal Care & Service (3 | 1.7%).
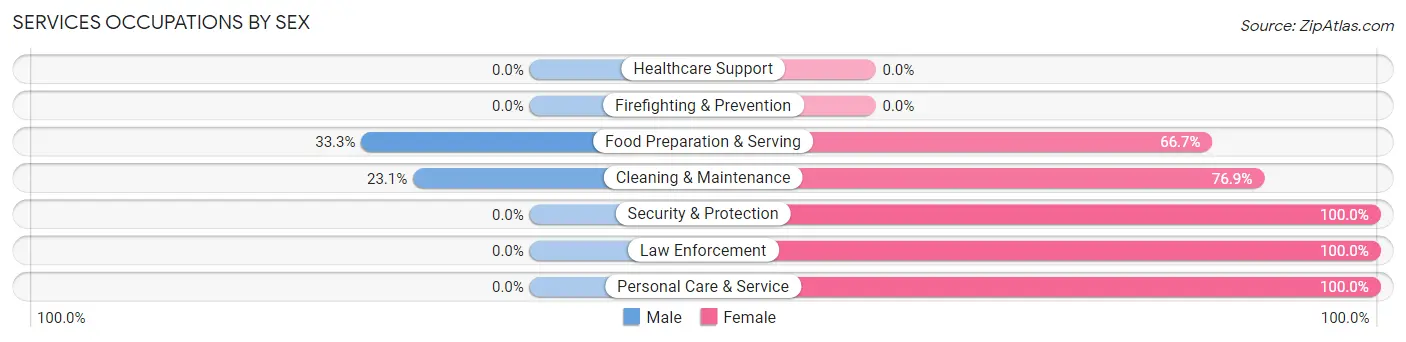
Services Occupations by Sex
Within the Services occupations in Follett, the most male-oriented occupations are Food Preparation & Serving (33.3%), and Cleaning & Maintenance (23.1%), while the most female-oriented occupations are Security & Protection (100.0%), Law Enforcement (100.0%), and Personal Care & Service (100.0%).
| Occupation | Male | Female |
| Healthcare Support | 0 (0.0%) | 0 (0.0%) |
| Security & Protection | 0 (0.0%) | 7 (100.0%) |
| Firefighting & Prevention | 0 (0.0%) | 0 (0.0%) |
| Law Enforcement | 0 (0.0%) | 7 (100.0%) |
| Food Preparation & Serving | 6 (33.3%) | 12 (66.7%) |
| Cleaning & Maintenance | 3 (23.1%) | 10 (76.9%) |
| Personal Care & Service | 0 (0.0%) | 3 (100.0%) |
| Total (Category) | 9 (22.0%) | 32 (78.0%) |
| Total (Overall) | 80 (46.2%) | 93 (53.8%) |
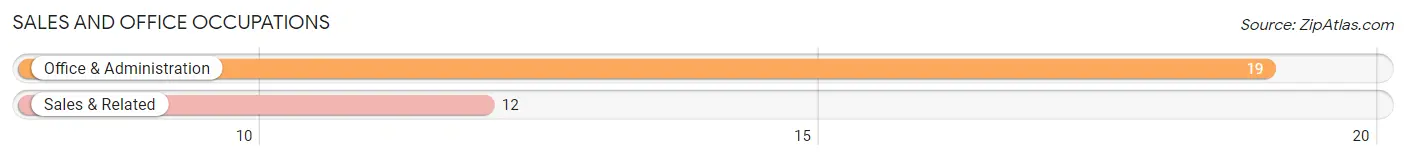
Sales and Office Occupations
The most common Sales and Office occupations in Follett are Office & Administration (19 | 11.0%), and Sales & Related (12 | 6.9%).
Sales and Office Occupations by Sex
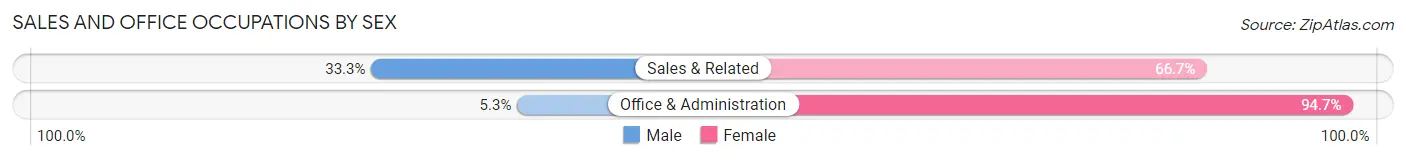
| Occupation | Male | Female |
| Sales & Related | 4 (33.3%) | 8 (66.7%) |
| Office & Administration | 1 (5.3%) | 18 (94.7%) |
| Total (Category) | 5 (16.1%) | 26 (83.9%) |
| Total (Overall) | 80 (46.2%) | 93 (53.8%) |
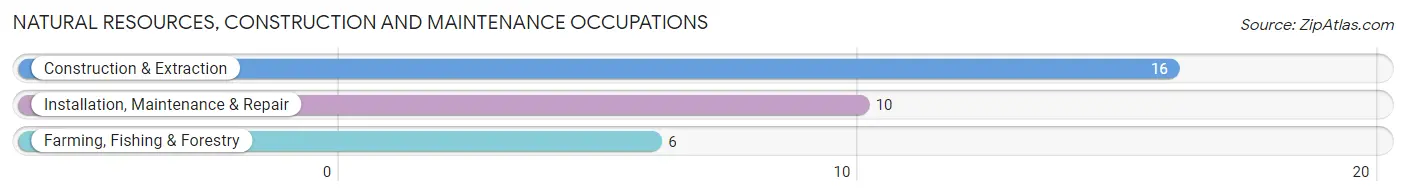
Natural Resources, Construction and Maintenance Occupations
The most common Natural Resources, Construction and Maintenance occupations in Follett are Construction & Extraction (16 | 9.2%), Installation, Maintenance & Repair (10 | 5.8%), and Farming, Fishing & Forestry (6 | 3.5%).
Natural Resources, Construction and Maintenance Occupations by Sex
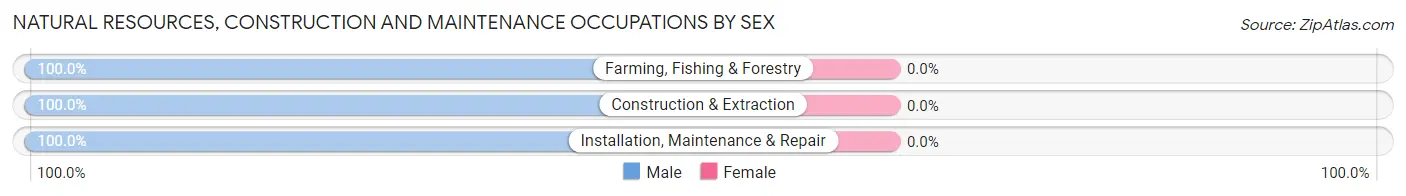
| Occupation | Male | Female |
| Farming, Fishing & Forestry | 6 (100.0%) | 0 (0.0%) |
| Construction & Extraction | 16 (100.0%) | 0 (0.0%) |
| Installation, Maintenance & Repair | 10 (100.0%) | 0 (0.0%) |
| Total (Category) | 32 (100.0%) | 0 (0.0%) |
| Total (Overall) | 80 (46.2%) | 93 (53.8%) |
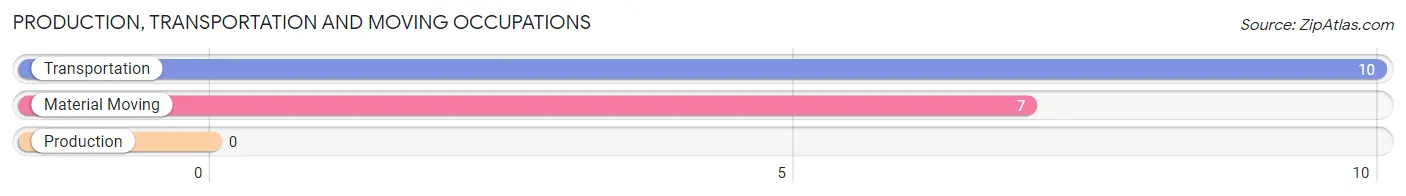
Production, Transportation and Moving Occupations
The most common Production, Transportation and Moving occupations in Follett are Transportation (10 | 5.8%), and Material Moving (7 | 4.1%).
Production, Transportation and Moving Occupations by Sex
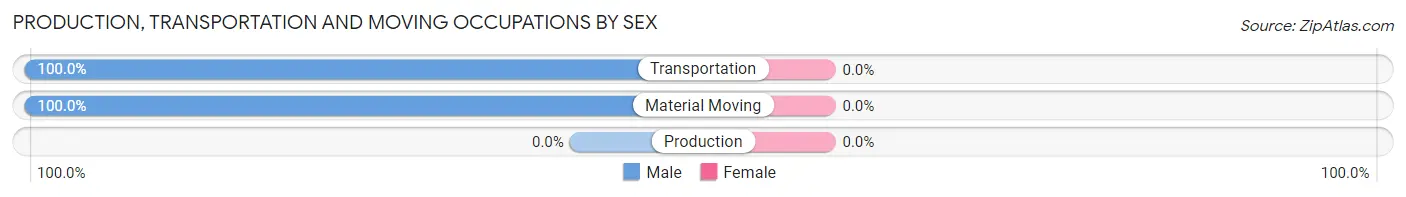
| Occupation | Male | Female |
| Production | 0 (0.0%) | 0 (0.0%) |
| Transportation | 10 (100.0%) | 0 (0.0%) |
| Material Moving | 7 (100.0%) | 0 (0.0%) |
| Total (Category) | 17 (100.0%) | 0 (0.0%) |
| Total (Overall) | 80 (46.2%) | 93 (53.8%) |
Employment Industries by Sex in Follett
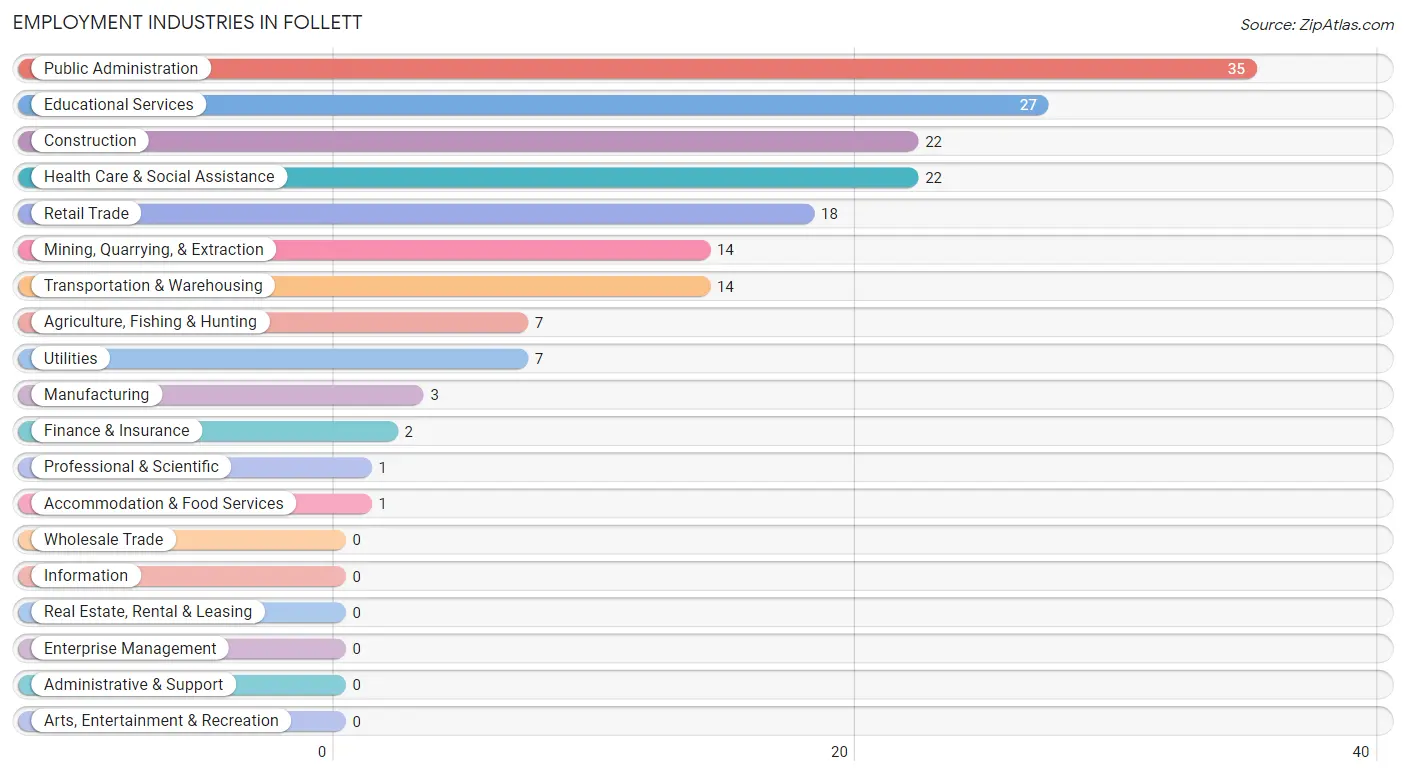
Employment Industries in Follett
The major employment industries in Follett include Public Administration (35 | 20.2%), Educational Services (27 | 15.6%), Construction (22 | 12.7%), Health Care & Social Assistance (22 | 12.7%), and Retail Trade (18 | 10.4%).
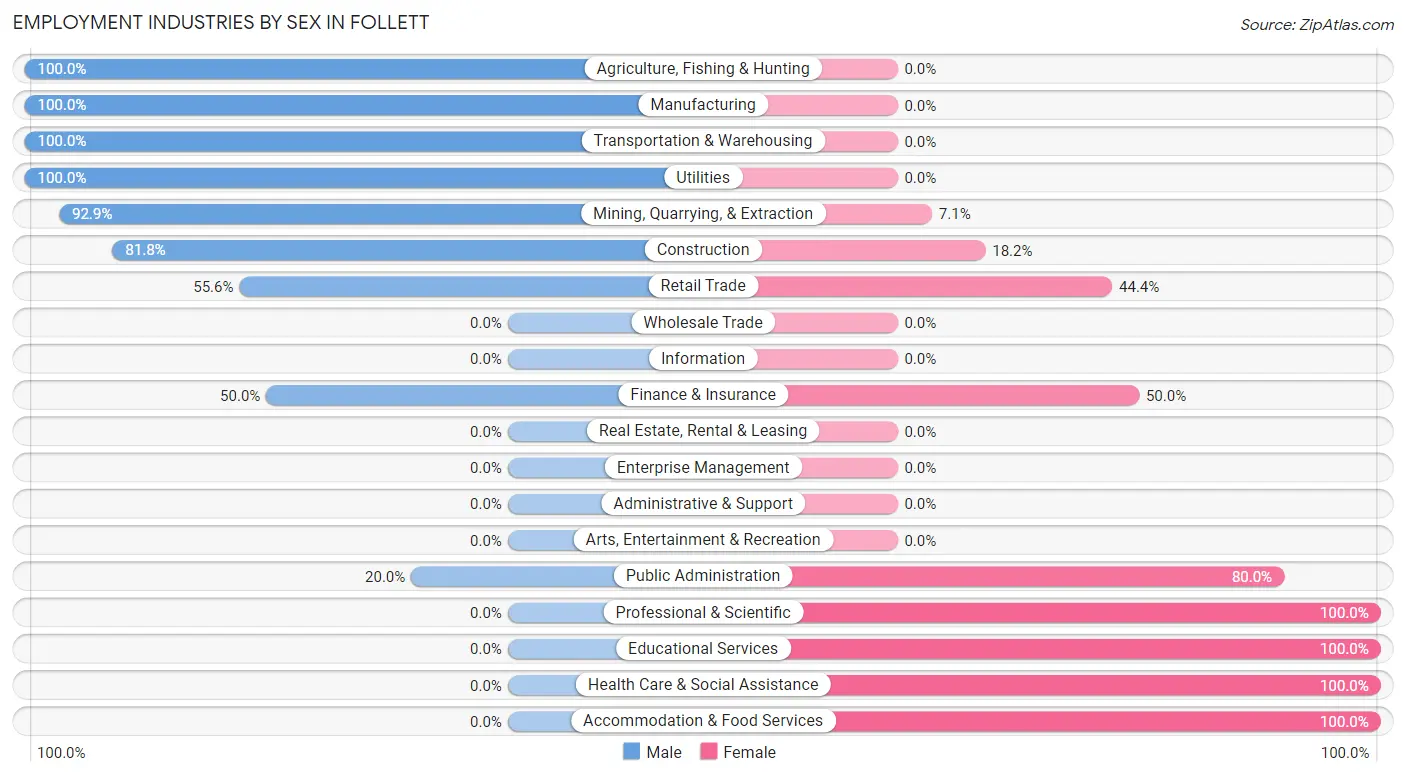
Employment Industries by Sex in Follett
The Follett industries that see more men than women are Agriculture, Fishing & Hunting (100.0%), Manufacturing (100.0%), and Transportation & Warehousing (100.0%), whereas the industries that tend to have a higher number of women are Professional & Scientific (100.0%), Educational Services (100.0%), and Health Care & Social Assistance (100.0%).
| Industry | Male | Female |
| Agriculture, Fishing & Hunting | 7 (100.0%) | 0 (0.0%) |
| Mining, Quarrying, & Extraction | 13 (92.9%) | 1 (7.1%) |
| Construction | 18 (81.8%) | 4 (18.2%) |
| Manufacturing | 3 (100.0%) | 0 (0.0%) |
| Wholesale Trade | 0 (0.0%) | 0 (0.0%) |
| Retail Trade | 10 (55.6%) | 8 (44.4%) |
| Transportation & Warehousing | 14 (100.0%) | 0 (0.0%) |
| Utilities | 7 (100.0%) | 0 (0.0%) |
| Information | 0 (0.0%) | 0 (0.0%) |
| Finance & Insurance | 1 (50.0%) | 1 (50.0%) |
| Real Estate, Rental & Leasing | 0 (0.0%) | 0 (0.0%) |
| Professional & Scientific | 0 (0.0%) | 1 (100.0%) |
| Enterprise Management | 0 (0.0%) | 0 (0.0%) |
| Administrative & Support | 0 (0.0%) | 0 (0.0%) |
| Educational Services | 0 (0.0%) | 27 (100.0%) |
| Health Care & Social Assistance | 0 (0.0%) | 22 (100.0%) |
| Arts, Entertainment & Recreation | 0 (0.0%) | 0 (0.0%) |
| Accommodation & Food Services | 0 (0.0%) | 1 (100.0%) |
| Public Administration | 7 (20.0%) | 28 (80.0%) |
| Total | 80 (46.2%) | 93 (53.8%) |
Education in Follett
School Enrollment in Follett
The most common levels of schooling among the 111 students in Follett are high school (42 | 37.8%), elementary school (19 | 17.1%), and middle school (18 | 16.2%).
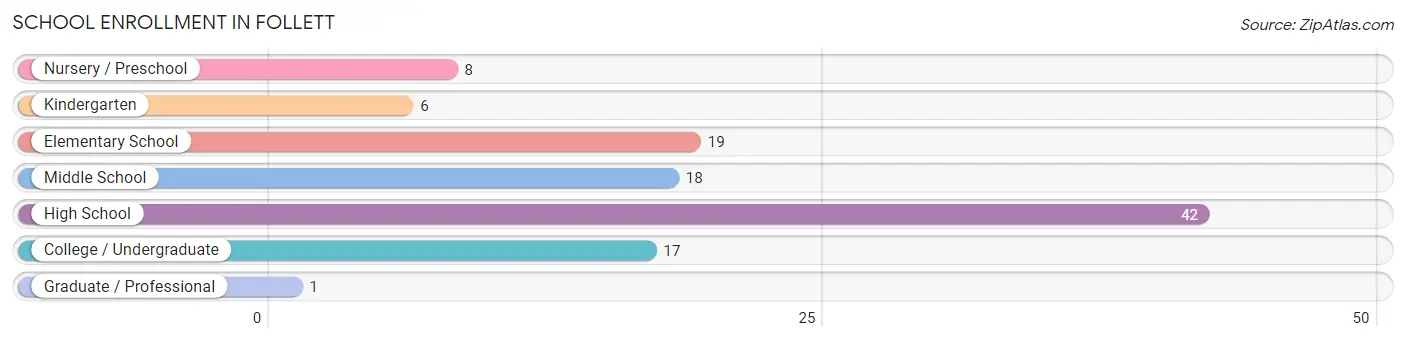
| School Level | # Students | % Students |
| Nursery / Preschool | 8 | 7.2% |
| Kindergarten | 6 | 5.4% |
| Elementary School | 19 | 17.1% |
| Middle School | 18 | 16.2% |
| High School | 42 | 37.8% |
| College / Undergraduate | 17 | 15.3% |
| Graduate / Professional | 1 | 0.9% |
| Total | 111 | 100.0% |
School Enrollment by Age by Funding Source in Follett
Out of a total of 111 students who are enrolled in schools in Follett, 4 (3.6%) attend a private institution, while the remaining 107 (96.4%) are enrolled in public schools. The age group of 20 to 24 year olds has the highest likelihood of being enrolled in private schools, with 4 (30.8% in the age bracket) enrolled. Conversely, the age group of 3 to 4 year olds has the lowest likelihood of being enrolled in a private school, with 4 (100.0% in the age bracket) attending a public institution.
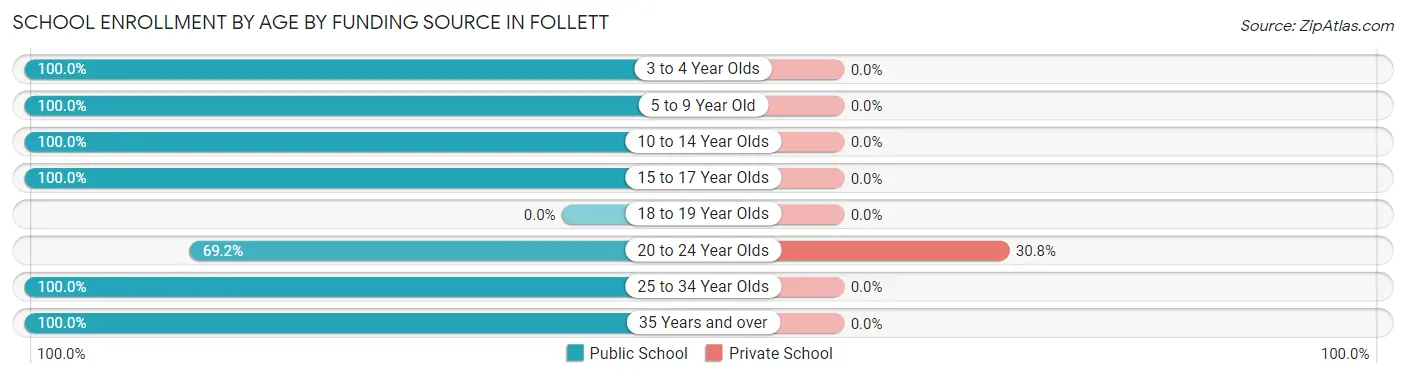
| Age Bracket | Public School | Private School |
| 3 to 4 Year Olds | 4 (100.0%) | 0 (0.0%) |
| 5 to 9 Year Old | 24 (100.0%) | 0 (0.0%) |
| 10 to 14 Year Olds | 23 (100.0%) | 0 (0.0%) |
| 15 to 17 Year Olds | 33 (100.0%) | 0 (0.0%) |
| 18 to 19 Year Olds | 0 (0.0%) | 0 (0.0%) |
| 20 to 24 Year Olds | 9 (69.2%) | 4 (30.8%) |
| 25 to 34 Year Olds | 12 (100.0%) | 0 (0.0%) |
| 35 Years and over | 2 (100.0%) | 0 (0.0%) |
| Total | 107 (96.4%) | 4 (3.6%) |
Educational Attainment by Field of Study in Follett
Education (17 | 30.9%), science & technology (16 | 29.1%), business (14 | 25.5%), bio, nature & agricultural (5 | 9.1%), and physical & health sciences (2 | 3.6%) are the most common fields of study among 55 individuals in Follett who have obtained a bachelor's degree or higher.
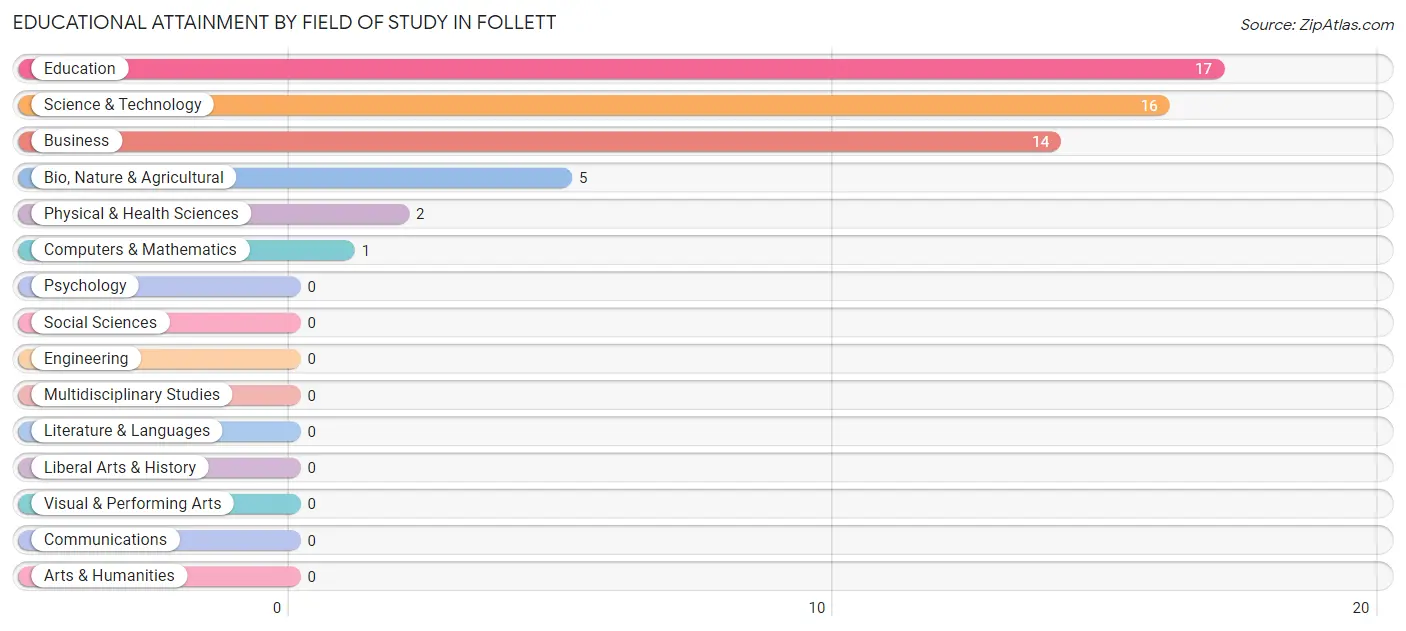
| Field of Study | # Graduates | % Graduates |
| Computers & Mathematics | 1 | 1.8% |
| Bio, Nature & Agricultural | 5 | 9.1% |
| Physical & Health Sciences | 2 | 3.6% |
| Psychology | 0 | 0.0% |
| Social Sciences | 0 | 0.0% |
| Engineering | 0 | 0.0% |
| Multidisciplinary Studies | 0 | 0.0% |
| Science & Technology | 16 | 29.1% |
| Business | 14 | 25.5% |
| Education | 17 | 30.9% |
| Literature & Languages | 0 | 0.0% |
| Liberal Arts & History | 0 | 0.0% |
| Visual & Performing Arts | 0 | 0.0% |
| Communications | 0 | 0.0% |
| Arts & Humanities | 0 | 0.0% |
| Total | 55 | 100.0% |
Transportation & Commute in Follett
Vehicle Availability by Sex in Follett
The most prevalent vehicle ownership categories in Follett are males with 3 vehicles (31, accounting for 38.8%) and females with 3 vehicles (25, making up 37.8%).
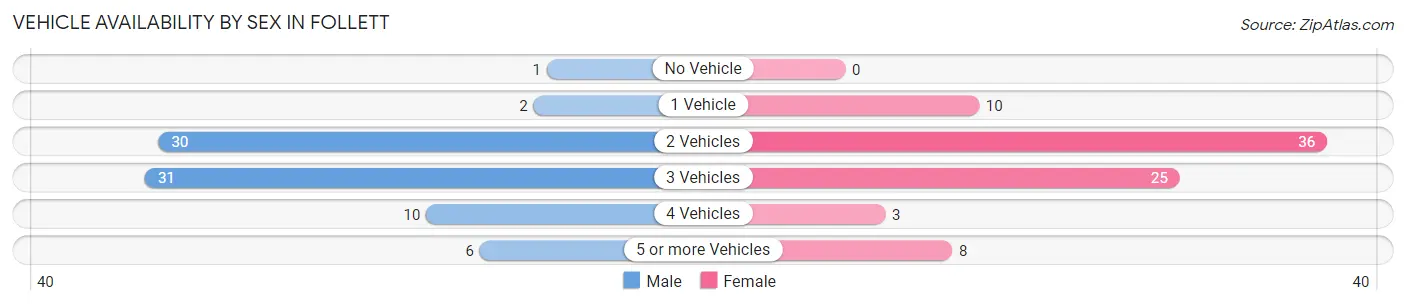
| Vehicles Available | Male | Female |
| No Vehicle | 1 (1.3%) | 0 (0.0%) |
| 1 Vehicle | 2 (2.5%) | 10 (12.2%) |
| 2 Vehicles | 30 (37.5%) | 36 (43.9%) |
| 3 Vehicles | 31 (38.8%) | 25 (30.5%) |
| 4 Vehicles | 10 (12.5%) | 3 (3.7%) |
| 5 or more Vehicles | 6 (7.5%) | 8 (9.8%) |
| Total | 80 (100.0%) | 82 (100.0%) |
Commute Time in Follett
The most frequently occuring commute durations in Follett are less than 5 minutes (50 commuters, 31.7%), 60 to 89 minutes (22 commuters, 13.9%), and 15 to 19 minutes (20 commuters, 12.7%).
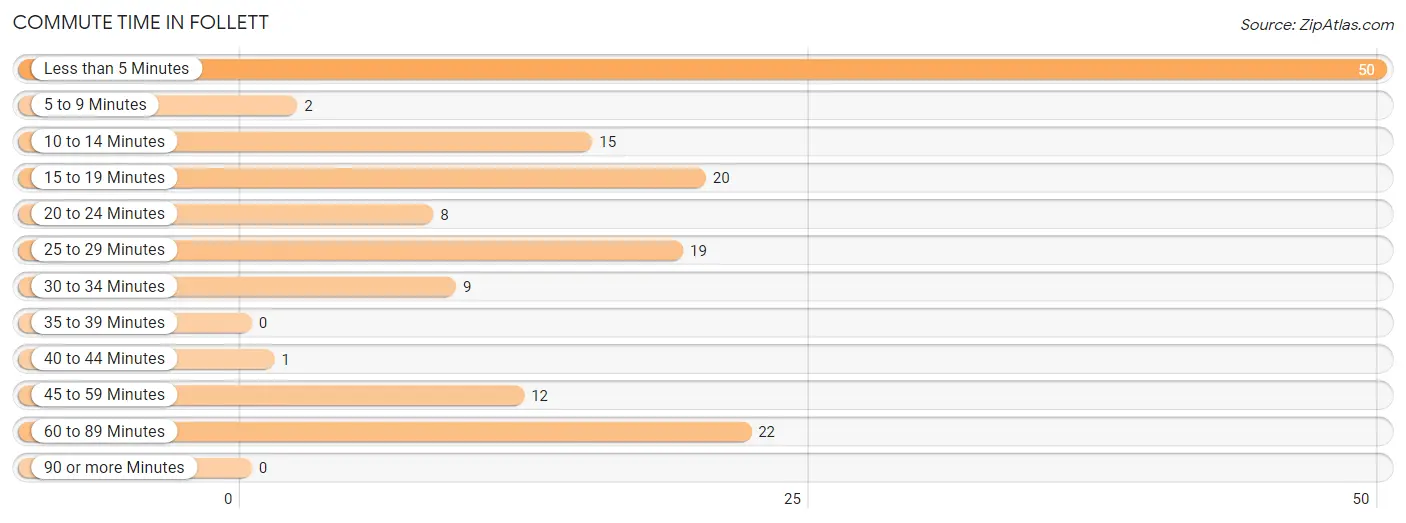
| Commute Time | # Commuters | % Commuters |
| Less than 5 Minutes | 50 | 31.7% |
| 5 to 9 Minutes | 2 | 1.3% |
| 10 to 14 Minutes | 15 | 9.5% |
| 15 to 19 Minutes | 20 | 12.7% |
| 20 to 24 Minutes | 8 | 5.1% |
| 25 to 29 Minutes | 19 | 12.0% |
| 30 to 34 Minutes | 9 | 5.7% |
| 35 to 39 Minutes | 0 | 0.0% |
| 40 to 44 Minutes | 1 | 0.6% |
| 45 to 59 Minutes | 12 | 7.6% |
| 60 to 89 Minutes | 22 | 13.9% |
| 90 or more Minutes | 0 | 0.0% |
Commute Time by Sex in Follett
The most common commute times in Follett are less than 5 minutes (26 commuters, 32.9%) for males and less than 5 minutes (24 commuters, 30.4%) for females.
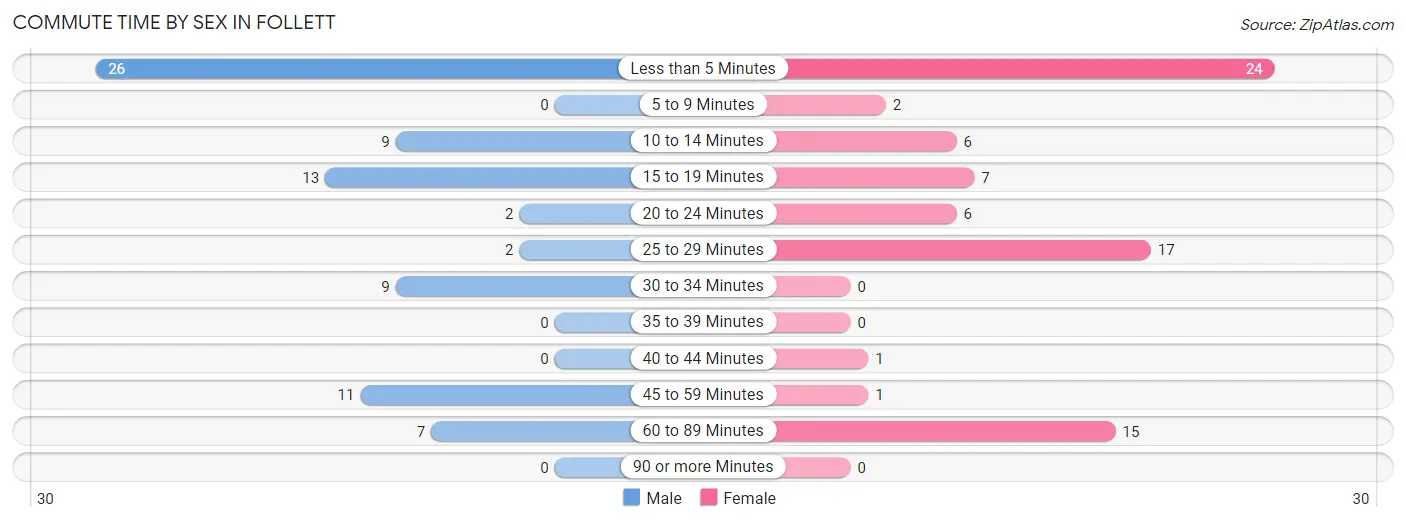
| Commute Time | Male | Female |
| Less than 5 Minutes | 26 (32.9%) | 24 (30.4%) |
| 5 to 9 Minutes | 0 (0.0%) | 2 (2.5%) |
| 10 to 14 Minutes | 9 (11.4%) | 6 (7.6%) |
| 15 to 19 Minutes | 13 (16.5%) | 7 (8.9%) |
| 20 to 24 Minutes | 2 (2.5%) | 6 (7.6%) |
| 25 to 29 Minutes | 2 (2.5%) | 17 (21.5%) |
| 30 to 34 Minutes | 9 (11.4%) | 0 (0.0%) |
| 35 to 39 Minutes | 0 (0.0%) | 0 (0.0%) |
| 40 to 44 Minutes | 0 (0.0%) | 1 (1.3%) |
| 45 to 59 Minutes | 11 (13.9%) | 1 (1.3%) |
| 60 to 89 Minutes | 7 (8.9%) | 15 (19.0%) |
| 90 or more Minutes | 0 (0.0%) | 0 (0.0%) |
Time of Departure to Work by Sex in Follett
The most frequent times of departure to work in Follett are 6:30 AM to 6:59 AM (25, 31.7%) for males and 7:30 AM to 7:59 AM (25, 31.7%) for females.
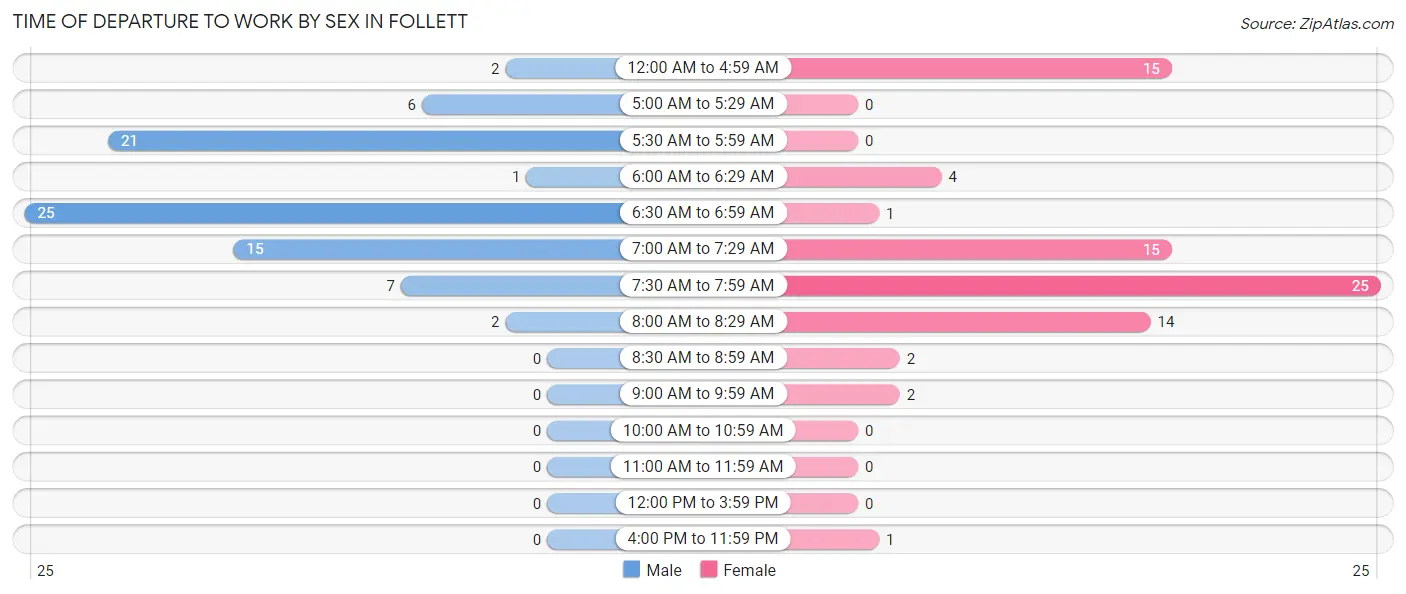
| Time of Departure | Male | Female |
| 12:00 AM to 4:59 AM | 2 (2.5%) | 15 (19.0%) |
| 5:00 AM to 5:29 AM | 6 (7.6%) | 0 (0.0%) |
| 5:30 AM to 5:59 AM | 21 (26.6%) | 0 (0.0%) |
| 6:00 AM to 6:29 AM | 1 (1.3%) | 4 (5.1%) |
| 6:30 AM to 6:59 AM | 25 (31.7%) | 1 (1.3%) |
| 7:00 AM to 7:29 AM | 15 (19.0%) | 15 (19.0%) |
| 7:30 AM to 7:59 AM | 7 (8.9%) | 25 (31.7%) |
| 8:00 AM to 8:29 AM | 2 (2.5%) | 14 (17.7%) |
| 8:30 AM to 8:59 AM | 0 (0.0%) | 2 (2.5%) |
| 9:00 AM to 9:59 AM | 0 (0.0%) | 2 (2.5%) |
| 10:00 AM to 10:59 AM | 0 (0.0%) | 0 (0.0%) |
| 11:00 AM to 11:59 AM | 0 (0.0%) | 0 (0.0%) |
| 12:00 PM to 3:59 PM | 0 (0.0%) | 0 (0.0%) |
| 4:00 PM to 11:59 PM | 0 (0.0%) | 1 (1.3%) |
| Total | 79 (100.0%) | 79 (100.0%) |
Housing Occupancy in Follett
Occupancy by Ownership in Follett
Of the total 140 dwellings in Follett, owner-occupied units account for 113 (80.7%), while renter-occupied units make up 27 (19.3%).
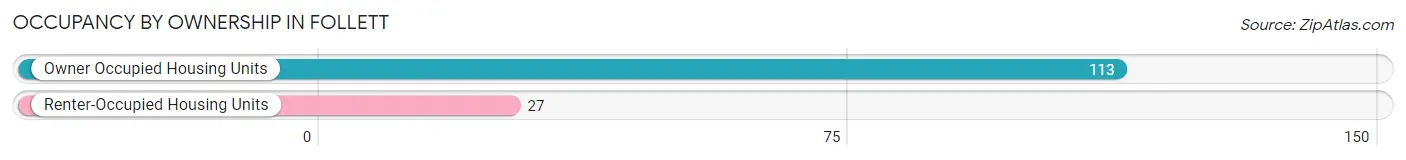
| Occupancy | # Housing Units | % Housing Units |
| Owner Occupied Housing Units | 113 | 80.7% |
| Renter-Occupied Housing Units | 27 | 19.3% |
| Total Occupied Housing Units | 140 | 100.0% |
Occupancy by Household Size in Follett
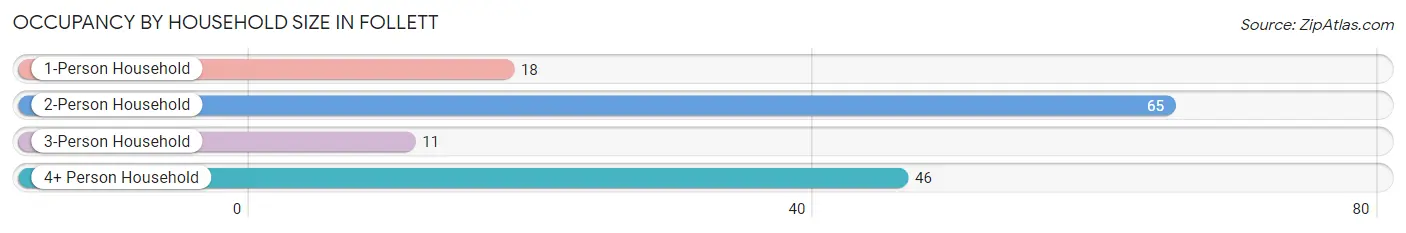
| Household Size | # Housing Units | % Housing Units |
| 1-Person Household | 18 | 12.9% |
| 2-Person Household | 65 | 46.4% |
| 3-Person Household | 11 | 7.9% |
| 4+ Person Household | 46 | 32.9% |
| Total Housing Units | 140 | 100.0% |
Occupancy by Ownership by Household Size in Follett
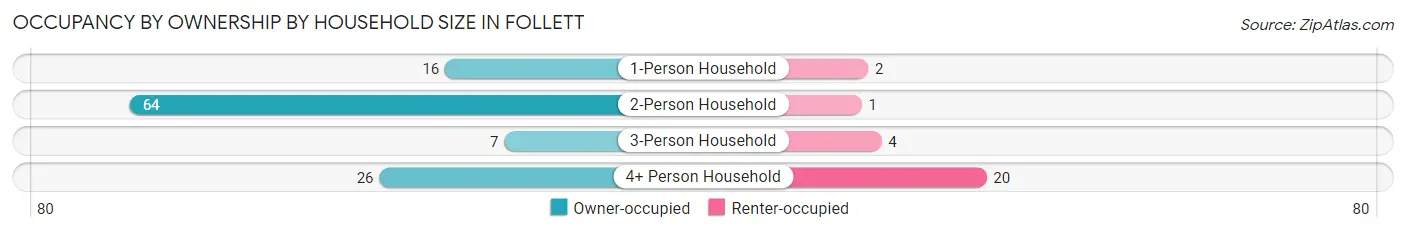
| Household Size | Owner-occupied | Renter-occupied |
| 1-Person Household | 16 (88.9%) | 2 (11.1%) |
| 2-Person Household | 64 (98.5%) | 1 (1.5%) |
| 3-Person Household | 7 (63.6%) | 4 (36.4%) |
| 4+ Person Household | 26 (56.5%) | 20 (43.5%) |
| Total Housing Units | 113 (80.7%) | 27 (19.3%) |
Occupancy by Educational Attainment in Follett
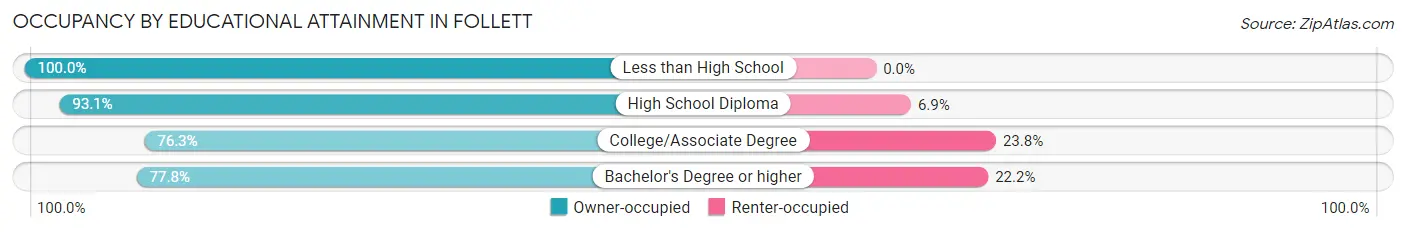
| Household Size | Owner-occupied | Renter-occupied |
| Less than High School | 4 (100.0%) | 0 (0.0%) |
| High School Diploma | 27 (93.1%) | 2 (6.9%) |
| College/Associate Degree | 61 (76.2%) | 19 (23.7%) |
| Bachelor's Degree or higher | 21 (77.8%) | 6 (22.2%) |
Occupancy by Age of Householder in Follett
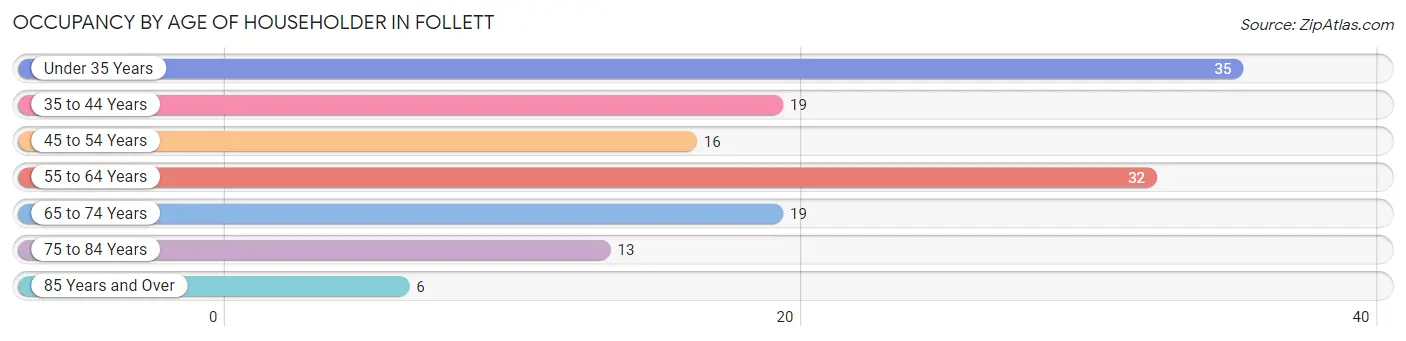
| Age Bracket | # Households | % Households |
| Under 35 Years | 35 | 25.0% |
| 35 to 44 Years | 19 | 13.6% |
| 45 to 54 Years | 16 | 11.4% |
| 55 to 64 Years | 32 | 22.9% |
| 65 to 74 Years | 19 | 13.6% |
| 75 to 84 Years | 13 | 9.3% |
| 85 Years and Over | 6 | 4.3% |
| Total | 140 | 100.0% |
Housing Finances in Follett
Median Income by Occupancy in Follett
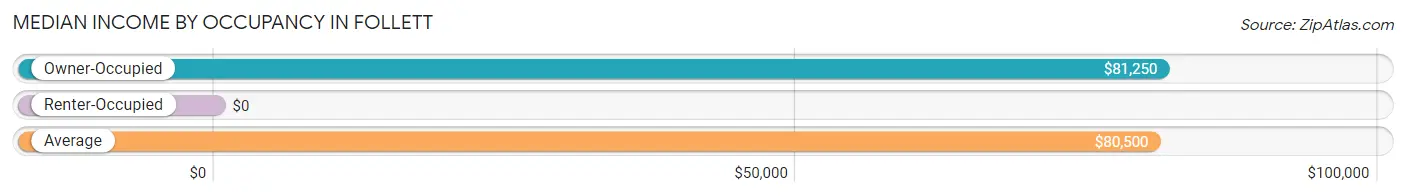
| Occupancy Type | # Households | Median Income |
| Owner-Occupied | 113 (80.7%) | $81,250 |
| Renter-Occupied | 27 (19.3%) | $0 |
| Average | 140 (100.0%) | $80,500 |
Occupancy by Householder Income Bracket in Follett
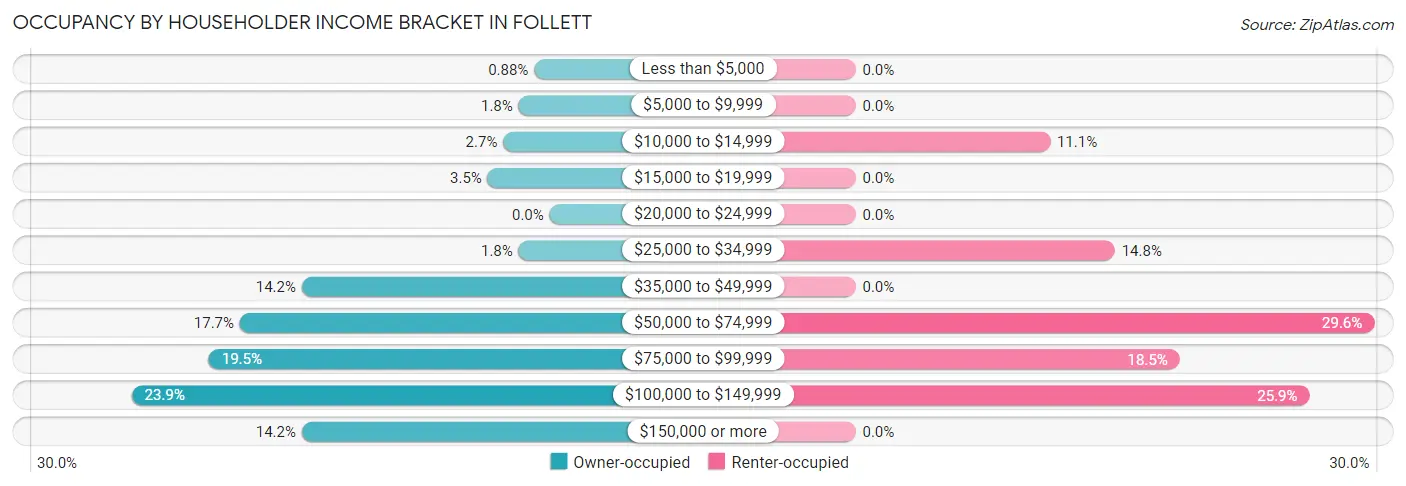
| Income Bracket | Owner-occupied | Renter-occupied |
| Less than $5,000 | 1 (0.9%) | 0 (0.0%) |
| $5,000 to $9,999 | 2 (1.8%) | 0 (0.0%) |
| $10,000 to $14,999 | 3 (2.6%) | 3 (11.1%) |
| $15,000 to $19,999 | 4 (3.5%) | 0 (0.0%) |
| $20,000 to $24,999 | 0 (0.0%) | 0 (0.0%) |
| $25,000 to $34,999 | 2 (1.8%) | 4 (14.8%) |
| $35,000 to $49,999 | 16 (14.2%) | 0 (0.0%) |
| $50,000 to $74,999 | 20 (17.7%) | 8 (29.6%) |
| $75,000 to $99,999 | 22 (19.5%) | 5 (18.5%) |
| $100,000 to $149,999 | 27 (23.9%) | 7 (25.9%) |
| $150,000 or more | 16 (14.2%) | 0 (0.0%) |
| Total | 113 (100.0%) | 27 (100.0%) |
Monthly Housing Cost Tiers in Follett
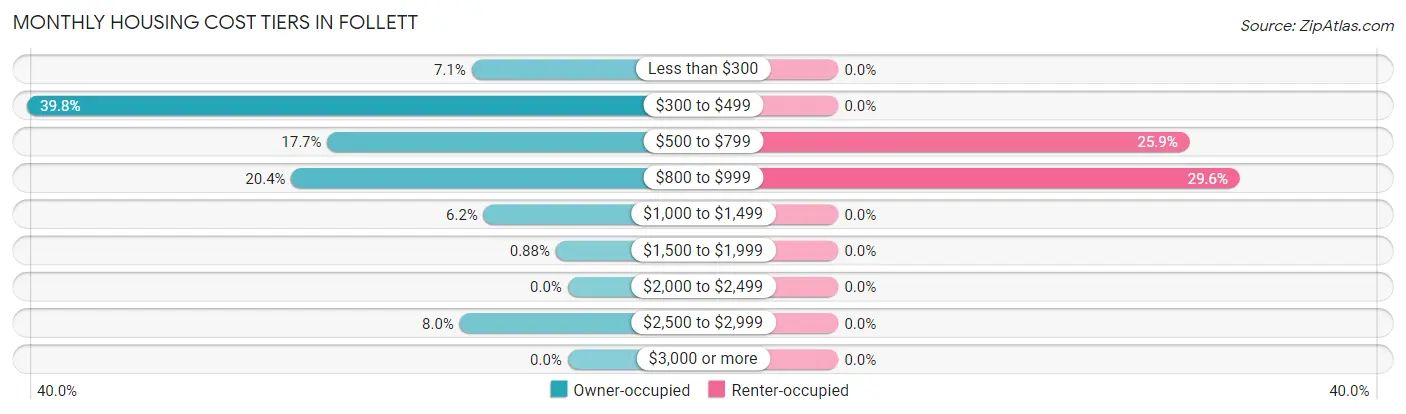
| Monthly Cost | Owner-occupied | Renter-occupied |
| Less than $300 | 8 (7.1%) | 0 (0.0%) |
| $300 to $499 | 45 (39.8%) | 0 (0.0%) |
| $500 to $799 | 20 (17.7%) | 7 (25.9%) |
| $800 to $999 | 23 (20.3%) | 8 (29.6%) |
| $1,000 to $1,499 | 7 (6.2%) | 0 (0.0%) |
| $1,500 to $1,999 | 1 (0.9%) | 0 (0.0%) |
| $2,000 to $2,499 | 0 (0.0%) | 0 (0.0%) |
| $2,500 to $2,999 | 9 (8.0%) | 0 (0.0%) |
| $3,000 or more | 0 (0.0%) | 0 (0.0%) |
| Total | 113 (100.0%) | 27 (100.0%) |
Physical Housing Characteristics in Follett
Housing Structures in Follett
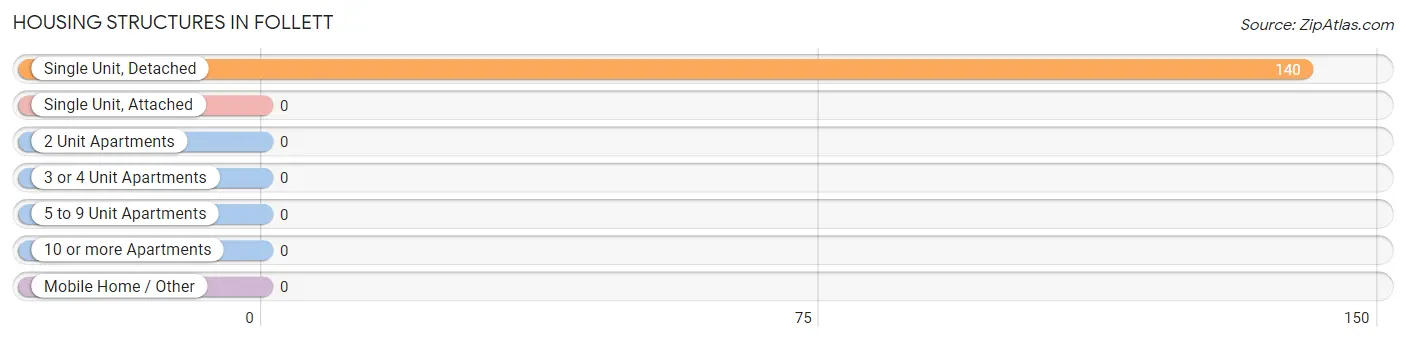
| Structure Type | # Housing Units | % Housing Units |
| Single Unit, Detached | 140 | 100.0% |
| Single Unit, Attached | 0 | 0.0% |
| 2 Unit Apartments | 0 | 0.0% |
| 3 or 4 Unit Apartments | 0 | 0.0% |
| 5 to 9 Unit Apartments | 0 | 0.0% |
| 10 or more Apartments | 0 | 0.0% |
| Mobile Home / Other | 0 | 0.0% |
| Total | 140 | 100.0% |
Housing Structures by Occupancy in Follett
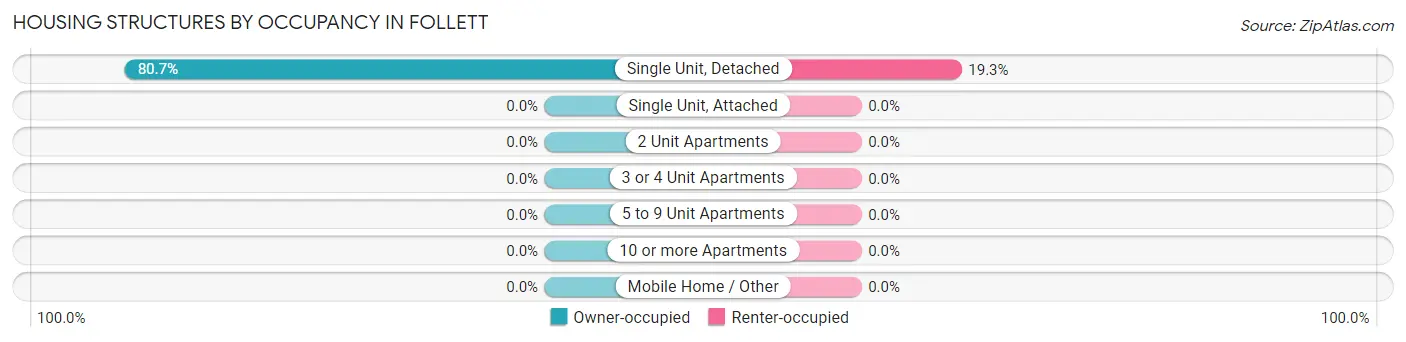
| Structure Type | Owner-occupied | Renter-occupied |
| Single Unit, Detached | 113 (80.7%) | 27 (19.3%) |
| Single Unit, Attached | 0 (0.0%) | 0 (0.0%) |
| 2 Unit Apartments | 0 (0.0%) | 0 (0.0%) |
| 3 or 4 Unit Apartments | 0 (0.0%) | 0 (0.0%) |
| 5 to 9 Unit Apartments | 0 (0.0%) | 0 (0.0%) |
| 10 or more Apartments | 0 (0.0%) | 0 (0.0%) |
| Mobile Home / Other | 0 (0.0%) | 0 (0.0%) |
| Total | 113 (80.7%) | 27 (19.3%) |
Housing Structures by Number of Rooms in Follett
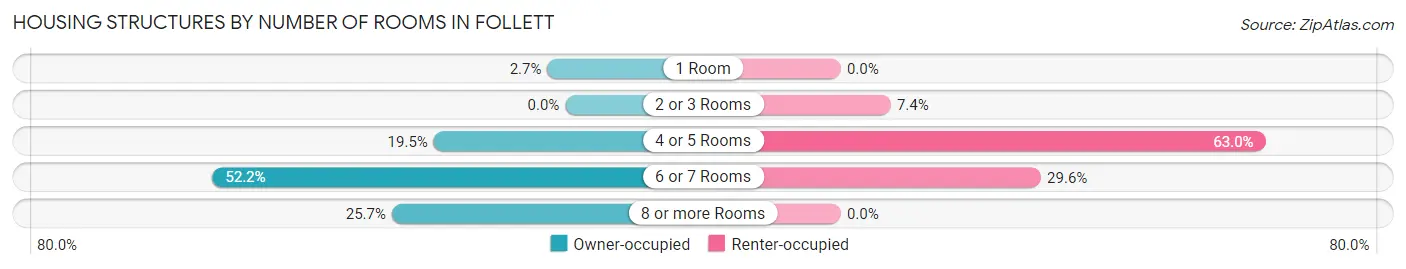
| Number of Rooms | Owner-occupied | Renter-occupied |
| 1 Room | 3 (2.6%) | 0 (0.0%) |
| 2 or 3 Rooms | 0 (0.0%) | 2 (7.4%) |
| 4 or 5 Rooms | 22 (19.5%) | 17 (63.0%) |
| 6 or 7 Rooms | 59 (52.2%) | 8 (29.6%) |
| 8 or more Rooms | 29 (25.7%) | 0 (0.0%) |
| Total | 113 (100.0%) | 27 (100.0%) |
Housing Structure by Heating Type in Follett
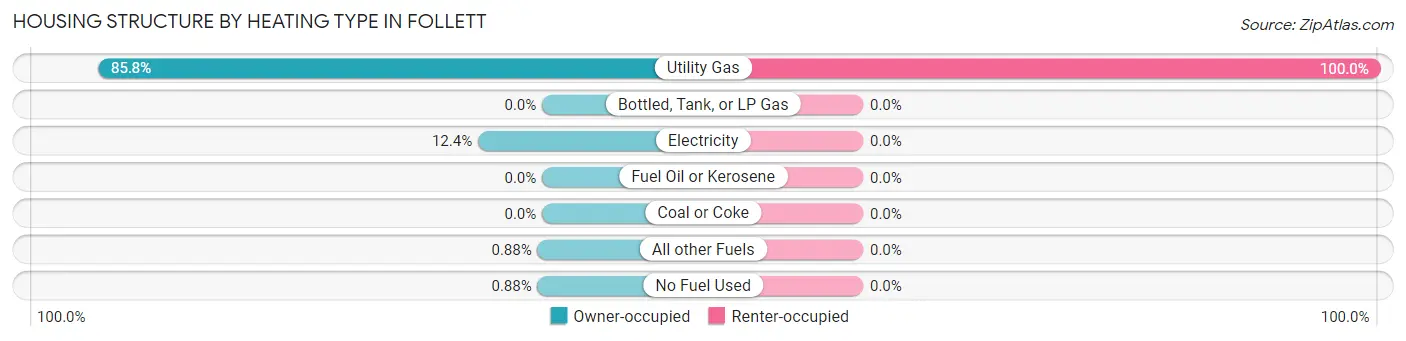
| Heating Type | Owner-occupied | Renter-occupied |
| Utility Gas | 97 (85.8%) | 27 (100.0%) |
| Bottled, Tank, or LP Gas | 0 (0.0%) | 0 (0.0%) |
| Electricity | 14 (12.4%) | 0 (0.0%) |
| Fuel Oil or Kerosene | 0 (0.0%) | 0 (0.0%) |
| Coal or Coke | 0 (0.0%) | 0 (0.0%) |
| All other Fuels | 1 (0.9%) | 0 (0.0%) |
| No Fuel Used | 1 (0.9%) | 0 (0.0%) |
| Total | 113 (100.0%) | 27 (100.0%) |
Household Vehicle Usage in Follett
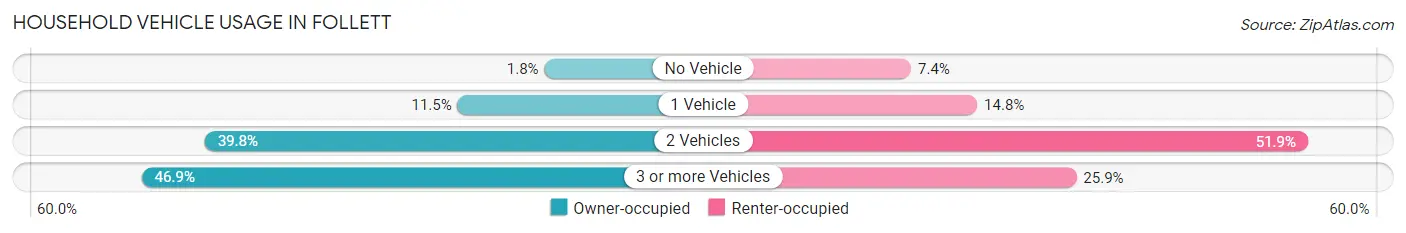
| Vehicles per Household | Owner-occupied | Renter-occupied |
| No Vehicle | 2 (1.8%) | 2 (7.4%) |
| 1 Vehicle | 13 (11.5%) | 4 (14.8%) |
| 2 Vehicles | 45 (39.8%) | 14 (51.8%) |
| 3 or more Vehicles | 53 (46.9%) | 7 (25.9%) |
| Total | 113 (100.0%) | 27 (100.0%) |
Real Estate & Mortgages in Follett
Real Estate and Mortgage Overview in Follett
| Characteristic | Without Mortgage | With Mortgage |
| Housing Units | 90 | 23 |
| Median Property Value | $104,500 | $0 |
| Median Household Income | $80,000 | $10 |
| Monthly Housing Costs | $470 | $0 |
| Real Estate Taxes | $1,475 | $0 |
Property Value by Mortgage Status in Follett
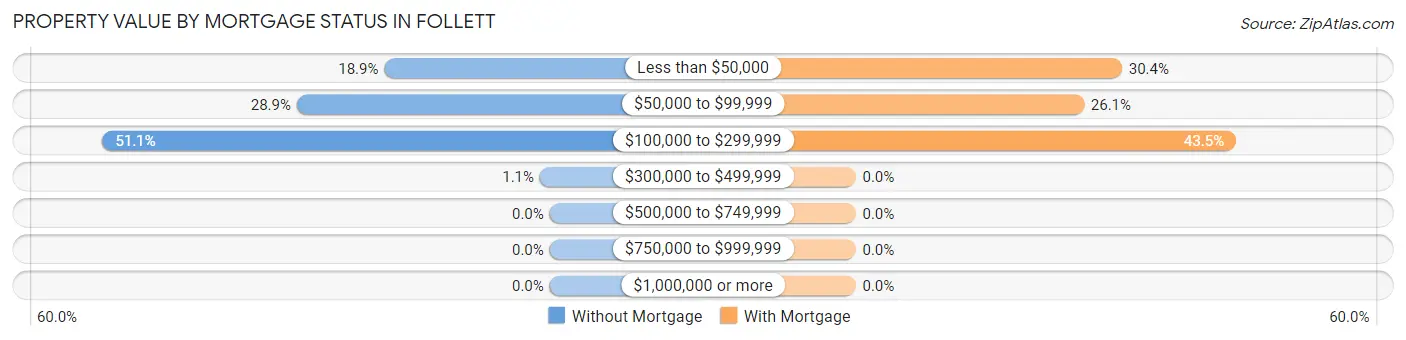
| Property Value | Without Mortgage | With Mortgage |
| Less than $50,000 | 17 (18.9%) | 7 (30.4%) |
| $50,000 to $99,999 | 26 (28.9%) | 6 (26.1%) |
| $100,000 to $299,999 | 46 (51.1%) | 10 (43.5%) |
| $300,000 to $499,999 | 1 (1.1%) | 0 (0.0%) |
| $500,000 to $749,999 | 0 (0.0%) | 0 (0.0%) |
| $750,000 to $999,999 | 0 (0.0%) | 0 (0.0%) |
| $1,000,000 or more | 0 (0.0%) | 0 (0.0%) |
| Total | 90 (100.0%) | 23 (100.0%) |
Household Income by Mortgage Status in Follett
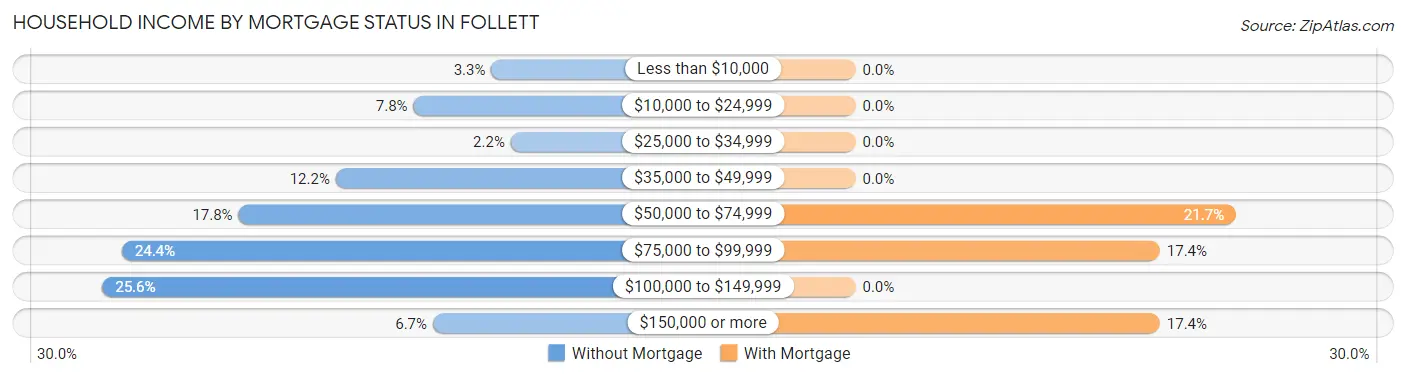
| Household Income | Without Mortgage | With Mortgage |
| Less than $10,000 | 3 (3.3%) | 0 (0.0%) |
| $10,000 to $24,999 | 7 (7.8%) | 0 (0.0%) |
| $25,000 to $34,999 | 2 (2.2%) | 0 (0.0%) |
| $35,000 to $49,999 | 11 (12.2%) | 0 (0.0%) |
| $50,000 to $74,999 | 16 (17.8%) | 5 (21.7%) |
| $75,000 to $99,999 | 22 (24.4%) | 4 (17.4%) |
| $100,000 to $149,999 | 23 (25.6%) | 0 (0.0%) |
| $150,000 or more | 6 (6.7%) | 4 (17.4%) |
| Total | 90 (100.0%) | 23 (100.0%) |
Property Value to Household Income Ratio in Follett
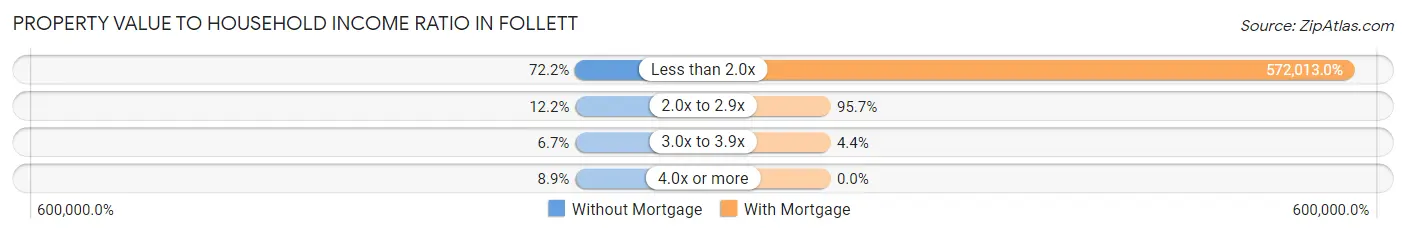
| Value-to-Income Ratio | Without Mortgage | With Mortgage |
| Less than 2.0x | 65 (72.2%) | 131,563 (572,013.0%) |
| 2.0x to 2.9x | 11 (12.2%) | 22 (95.7%) |
| 3.0x to 3.9x | 6 (6.7%) | 1 (4.3%) |
| 4.0x or more | 8 (8.9%) | 0 (0.0%) |
| Total | 90 (100.0%) | 23 (100.0%) |
Real Estate Taxes by Mortgage Status in Follett
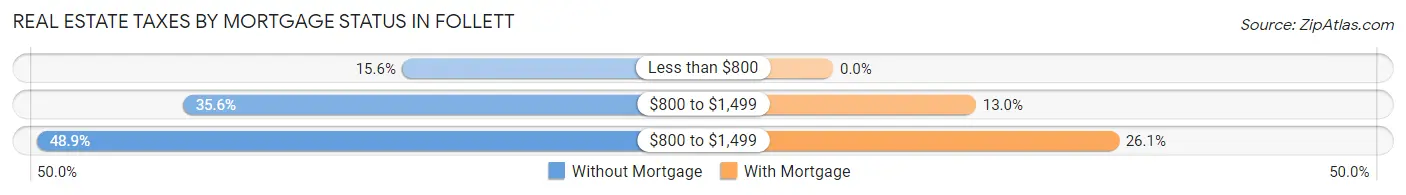
| Property Taxes | Without Mortgage | With Mortgage |
| Less than $800 | 14 (15.6%) | 0 (0.0%) |
| $800 to $1,499 | 32 (35.6%) | 3 (13.0%) |
| $800 to $1,499 | 44 (48.9%) | 6 (26.1%) |
| Total | 90 (100.0%) | 23 (100.0%) |
Health & Disability in Follett
Health Insurance Coverage by Age in Follett
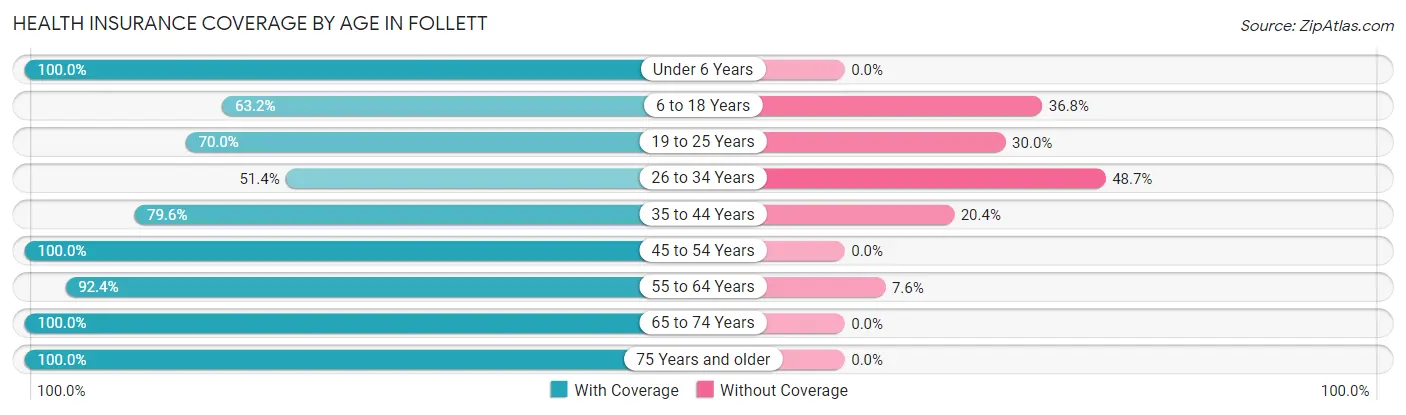
| Age Bracket | With Coverage | Without Coverage |
| Under 6 Years | 51 (100.0%) | 0 (0.0%) |
| 6 to 18 Years | 48 (63.2%) | 28 (36.8%) |
| 19 to 25 Years | 21 (70.0%) | 9 (30.0%) |
| 26 to 34 Years | 19 (51.3%) | 18 (48.6%) |
| 35 to 44 Years | 39 (79.6%) | 10 (20.4%) |
| 45 to 54 Years | 20 (100.0%) | 0 (0.0%) |
| 55 to 64 Years | 61 (92.4%) | 5 (7.6%) |
| 65 to 74 Years | 33 (100.0%) | 0 (0.0%) |
| 75 Years and older | 34 (100.0%) | 0 (0.0%) |
| Total | 326 (82.3%) | 70 (17.7%) |
Health Insurance Coverage by Citizenship Status in Follett
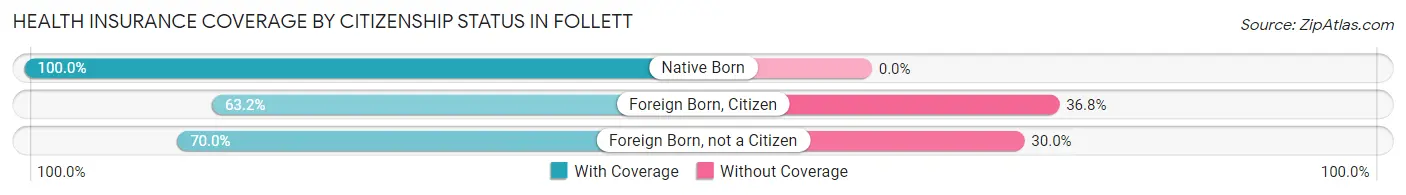
| Citizenship Status | With Coverage | Without Coverage |
| Native Born | 51 (100.0%) | 0 (0.0%) |
| Foreign Born, Citizen | 48 (63.2%) | 28 (36.8%) |
| Foreign Born, not a Citizen | 21 (70.0%) | 9 (30.0%) |
Health Insurance Coverage by Household Income in Follett
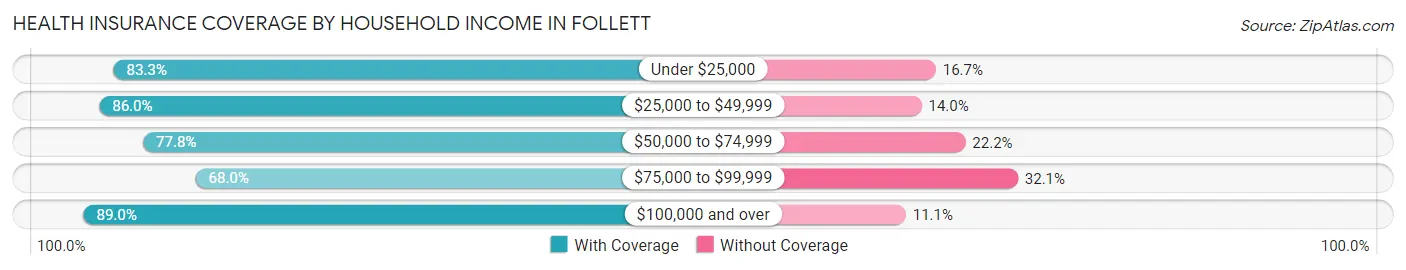
| Household Income | With Coverage | Without Coverage |
| Under $25,000 | 20 (83.3%) | 4 (16.7%) |
| $25,000 to $49,999 | 43 (86.0%) | 7 (14.0%) |
| $50,000 to $74,999 | 49 (77.8%) | 14 (22.2%) |
| $75,000 to $99,999 | 53 (67.9%) | 25 (32.1%) |
| $100,000 and over | 161 (88.9%) | 20 (11.1%) |
Public vs Private Health Insurance Coverage by Age in Follett
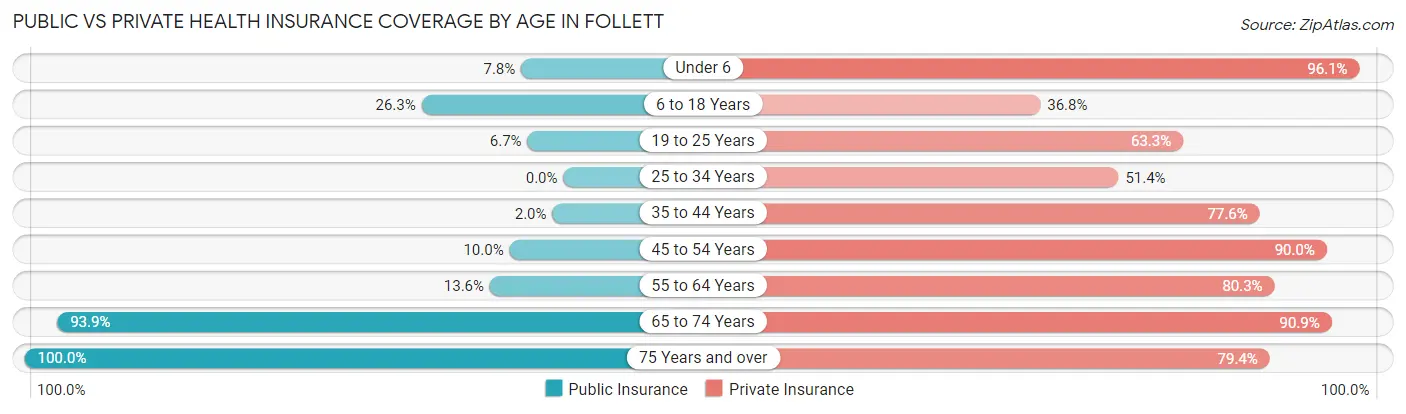
| Age Bracket | Public Insurance | Private Insurance |
| Under 6 | 4 (7.8%) | 49 (96.1%) |
| 6 to 18 Years | 20 (26.3%) | 28 (36.8%) |
| 19 to 25 Years | 2 (6.7%) | 19 (63.3%) |
| 25 to 34 Years | 0 (0.0%) | 19 (51.3%) |
| 35 to 44 Years | 1 (2.0%) | 38 (77.5%) |
| 45 to 54 Years | 2 (10.0%) | 18 (90.0%) |
| 55 to 64 Years | 9 (13.6%) | 53 (80.3%) |
| 65 to 74 Years | 31 (93.9%) | 30 (90.9%) |
| 75 Years and over | 34 (100.0%) | 27 (79.4%) |
| Total | 103 (26.0%) | 281 (71.0%) |
Disability Status by Sex by Age in Follett
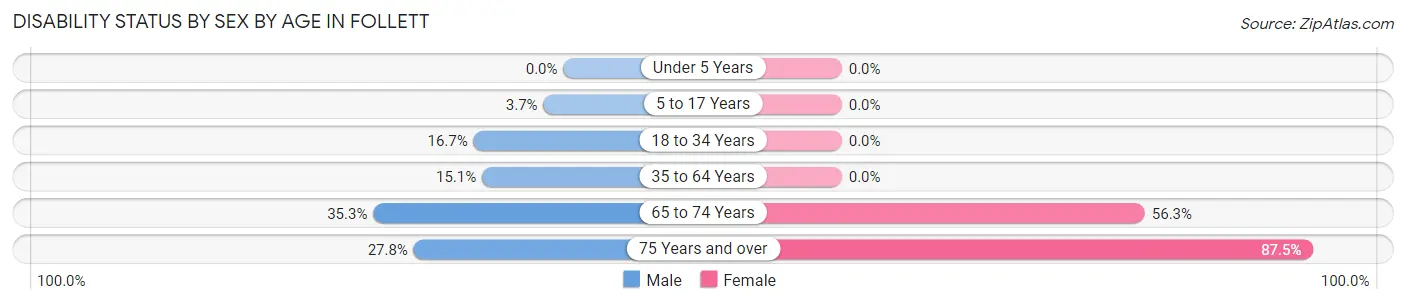
| Age Bracket | Male | Female |
| Under 5 Years | 0 (0.0%) | 0 (0.0%) |
| 5 to 17 Years | 2 (3.7%) | 0 (0.0%) |
| 18 to 34 Years | 5 (16.7%) | 0 (0.0%) |
| 35 to 64 Years | 8 (15.1%) | 0 (0.0%) |
| 65 to 74 Years | 6 (35.3%) | 9 (56.2%) |
| 75 Years and over | 5 (27.8%) | 14 (87.5%) |
Disability Class by Sex by Age in Follett
Disability Class: Hearing Difficulty
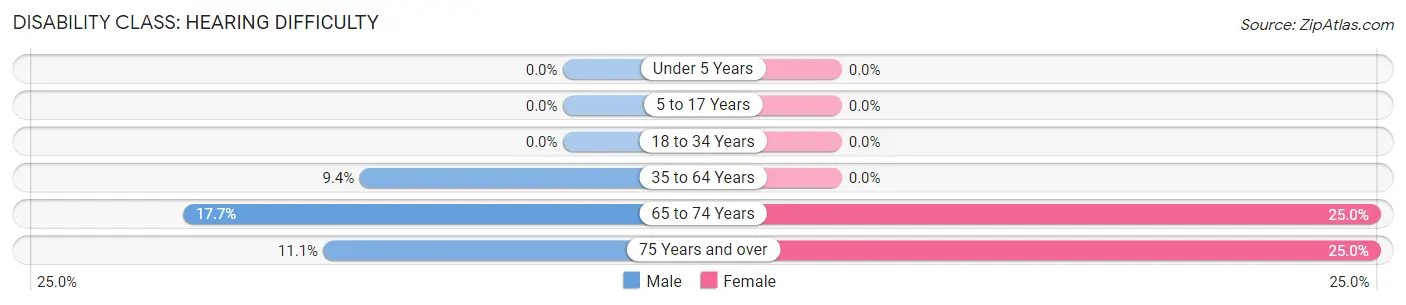
| Age Bracket | Male | Female |
| Under 5 Years | 0 (0.0%) | 0 (0.0%) |
| 5 to 17 Years | 0 (0.0%) | 0 (0.0%) |
| 18 to 34 Years | 0 (0.0%) | 0 (0.0%) |
| 35 to 64 Years | 5 (9.4%) | 0 (0.0%) |
| 65 to 74 Years | 3 (17.6%) | 4 (25.0%) |
| 75 Years and over | 2 (11.1%) | 4 (25.0%) |
Disability Class: Vision Difficulty
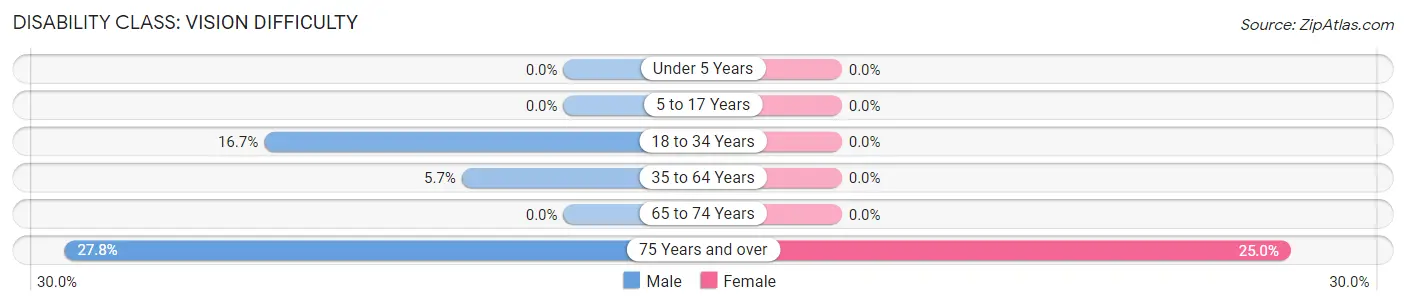
| Age Bracket | Male | Female |
| Under 5 Years | 0 (0.0%) | 0 (0.0%) |
| 5 to 17 Years | 0 (0.0%) | 0 (0.0%) |
| 18 to 34 Years | 5 (16.7%) | 0 (0.0%) |
| 35 to 64 Years | 3 (5.7%) | 0 (0.0%) |
| 65 to 74 Years | 0 (0.0%) | 0 (0.0%) |
| 75 Years and over | 5 (27.8%) | 4 (25.0%) |
Disability Class: Cognitive Difficulty

| Age Bracket | Male | Female |
| 5 to 17 Years | 2 (3.7%) | 0 (0.0%) |
| 18 to 34 Years | 0 (0.0%) | 0 (0.0%) |
| 35 to 64 Years | 5 (9.4%) | 0 (0.0%) |
| 65 to 74 Years | 0 (0.0%) | 1 (6.2%) |
| 75 Years and over | 0 (0.0%) | 0 (0.0%) |
Disability Class: Ambulatory Difficulty
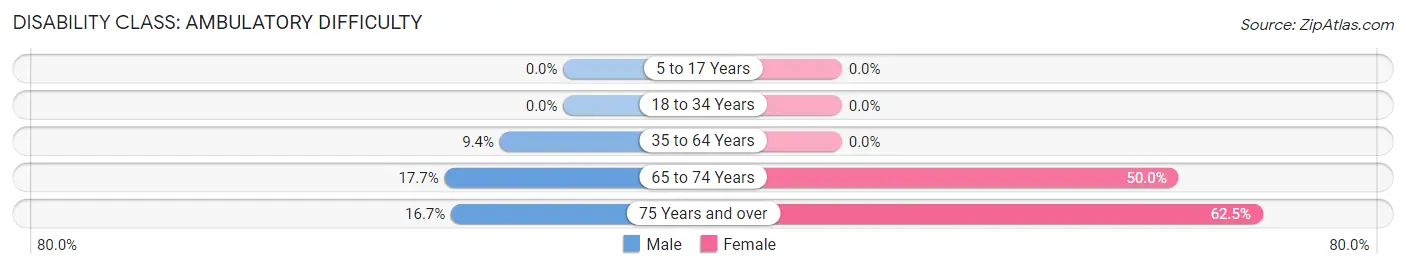
| Age Bracket | Male | Female |
| 5 to 17 Years | 0 (0.0%) | 0 (0.0%) |
| 18 to 34 Years | 0 (0.0%) | 0 (0.0%) |
| 35 to 64 Years | 5 (9.4%) | 0 (0.0%) |
| 65 to 74 Years | 3 (17.6%) | 8 (50.0%) |
| 75 Years and over | 3 (16.7%) | 10 (62.5%) |
Disability Class: Self-Care Difficulty
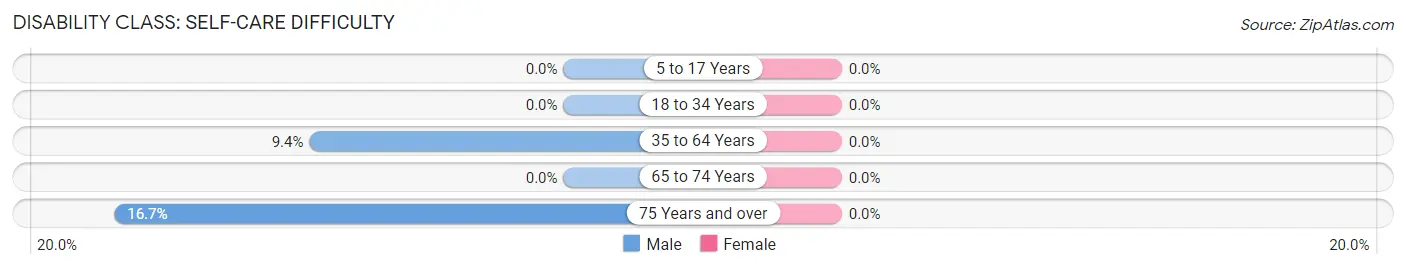
| Age Bracket | Male | Female |
| 5 to 17 Years | 0 (0.0%) | 0 (0.0%) |
| 18 to 34 Years | 0 (0.0%) | 0 (0.0%) |
| 35 to 64 Years | 5 (9.4%) | 0 (0.0%) |
| 65 to 74 Years | 0 (0.0%) | 0 (0.0%) |
| 75 Years and over | 3 (16.7%) | 0 (0.0%) |
Technology Access in Follett
Computing Device Access in Follett
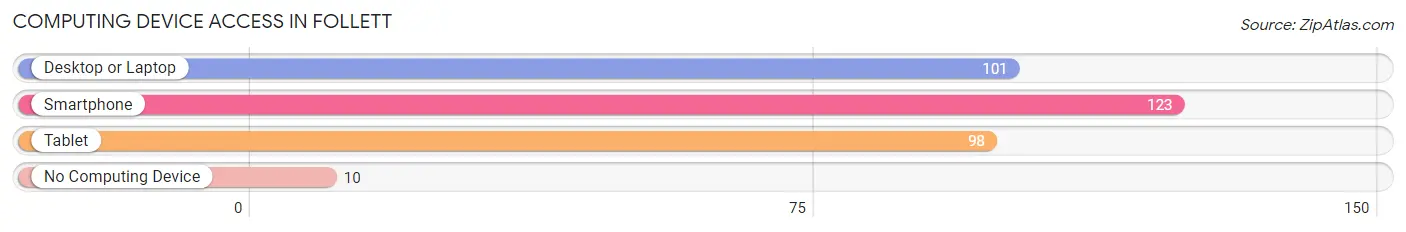
| Device Type | # Households | % Households |
| Desktop or Laptop | 101 | 72.1% |
| Smartphone | 123 | 87.9% |
| Tablet | 98 | 70.0% |
| No Computing Device | 10 | 7.1% |
| Total | 140 | 100.0% |
Internet Access in Follett
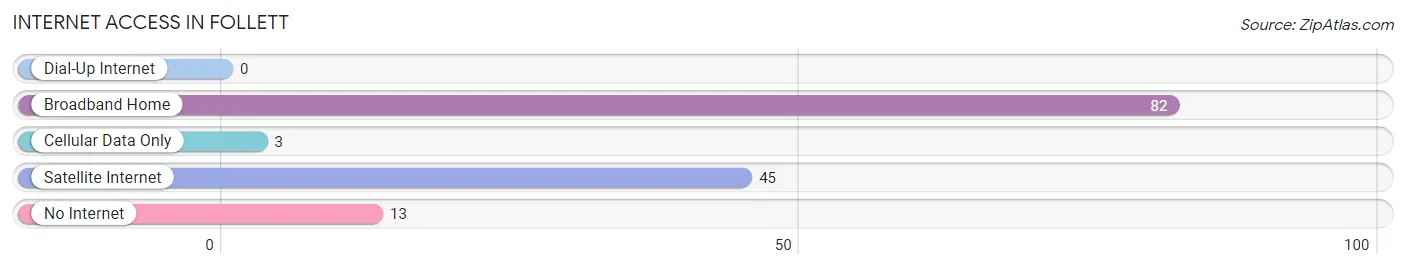
| Internet Type | # Households | % Households |
| Dial-Up Internet | 0 | 0.0% |
| Broadband Home | 82 | 58.6% |
| Cellular Data Only | 3 | 2.1% |
| Satellite Internet | 45 | 32.1% |
| No Internet | 13 | 9.3% |
| Total | 140 | 100.0% |
Follett Summary
Follett is a small town located in Lipscomb County, Texas. It is situated in the northern part of the state, about 50 miles east of Amarillo. The town was founded in 1891 and named after a local rancher, William Follett. The population of Follett was estimated to be around 200 people in 2020.
Geography
Follett is located in the northern part of Texas, in Lipscomb County. It is situated at an elevation of 2,845 feet above sea level. The town is surrounded by rolling hills and prairies, with the nearest major city being Amarillo, located about 50 miles to the west. The climate in Follett is semi-arid, with hot summers and cold winters. The average annual temperature is around 64°F, with the average high temperature in the summer months reaching around 90°F.
Economy
The economy of Follett is largely based on agriculture and ranching. The town is home to several large ranches, which produce cattle, sheep, and other livestock. The town also has a few small businesses, including a grocery store, a hardware store, and a few restaurants.
Demographics
As of the 2020 census, the population of Follett was estimated to be around 200 people. The racial makeup of the town was 97.5% White, 0.5% African American, 0.5% Native American, and 1.5% from other races. The median household income in Follett was estimated to be around $35,000, and the median home value was estimated to be around $90,000.
History
Follett was founded in 1891 by William Follett, a local rancher. The town was originally known as Follett's Ranch, but the name was changed to Follett in 1895. The town grew slowly over the years, and by the early 1900s, it had become a thriving community. The town was home to several businesses, including a bank, a hotel, and a general store.
In the 1920s, the town experienced a period of growth, as the nearby oil fields began to produce. This led to an influx of new residents, and the town's population grew to over 500 people. However, the Great Depression hit the town hard, and the population began to decline. By the 1940s, the population had dropped to around 200 people.
Today, Follett is a small, rural town with a population of around 200 people. The town is still largely dependent on agriculture and ranching, and it is home to several large ranches. The town also has a few small businesses, including a grocery store, a hardware store, and a few restaurants.
Common Questions
What is Per Capita Income in Follett?
Per Capita income in Follett is $30,290.
What is the Median Family Income in Follett?
Median Family Income in Follett is $90,833.
What is the Median Household income in Follett?
Median Household Income in Follett is $80,500.
What is Income or Wage Gap in Follett?
Income or Wage Gap in Follett is 45.2%.
Women in Follett earn 54.8 cents for every dollar earned by a man.
What is Inequality or Gini Index in Follett?
Inequality or Gini Index in Follett is 0.32.
What is the Total Population of Follett?
Total Population of Follett is 396.
What is the Total Male Population of Follett?
Total Male Population of Follett is 184.
What is the Total Female Population of Follett?
Total Female Population of Follett is 212.
What is the Ratio of Males per 100 Females in Follett?
There are 86.79 Males per 100 Females in Follett.
What is the Ratio of Females per 100 Males in Follett?
There are 115.22 Females per 100 Males in Follett.
What is the Median Population Age in Follett?
Median Population Age in Follett is 35.3 Years.
What is the Average Family Size in Follett
Average Family Size in Follett is 2.9 People.
What is the Average Household Size in Follett
Average Household Size in Follett is 2.8 People.
How Large is the Labor Force in Follett?
There are 175 People in the Labor Forcein in Follett.
What is the Percentage of People in the Labor Force in Follett?
59.7% of People are in the Labor Force in Follett.
What is the Unemployment Rate in Follett?
Unemployment Rate in Follett is 1.1%.