Florence, TX Map & Demographics
Florence Map
Florence Overview
$31,902
PER CAPITA INCOME
$61,250
AVG FAMILY INCOME
$51,875
AVG HOUSEHOLD INCOME
7.6%
WAGE / INCOME GAP [ % ]
92.4¢/ $1
WAGE / INCOME GAP [ $ ]
0.51
INEQUALITY / GINI INDEX
1,017
TOTAL POPULATION
594
MALE POPULATION
423
FEMALE POPULATION
140.43
MALES / 100 FEMALES
71.21
FEMALES / 100 MALES
34.9
MEDIAN AGE
3.3
AVG FAMILY SIZE
2.6
AVG HOUSEHOLD SIZE
520
LABOR FORCE [ PEOPLE ]
64.0%
PERCENT IN LABOR FORCE
5.6%
UNEMPLOYMENT RATE
Florence Zip Codes
Income in Florence
Income Overview in Florence
Per Capita Income in Florence is $31,902, while median incomes of families and households are $61,250 and $51,875 respectively.
| Characteristic | Number | Measure |
| Per Capita Income | 1,017 | $31,902 |
| Median Family Income | 244 | $61,250 |
| Mean Family Income | 244 | $89,537 |
| Median Household Income | 398 | $51,875 |
| Mean Household Income | 398 | $79,837 |
| Income Deficit | 244 | $0 |
| Wage / Income Gap (%) | 1,017 | 7.56% |
| Wage / Income Gap ($) | 1,017 | 92.44¢ per $1 |
| Gini / Inequality Index | 1,017 | 0.51 |
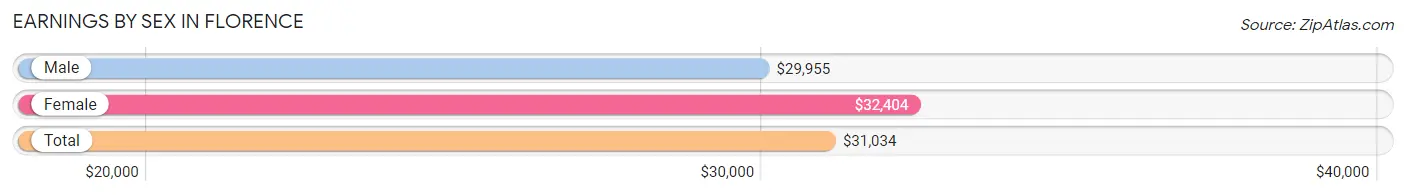
Earnings by Sex in Florence
Average Earnings in Florence are $31,034, $29,955 for men and $32,404 for women, a difference of 7.6%.
| Sex | Number | Average Earnings |
| Male | 375 (62.9%) | $29,955 |
| Female | 221 (37.1%) | $32,404 |
| Total | 596 (100.0%) | $31,034 |
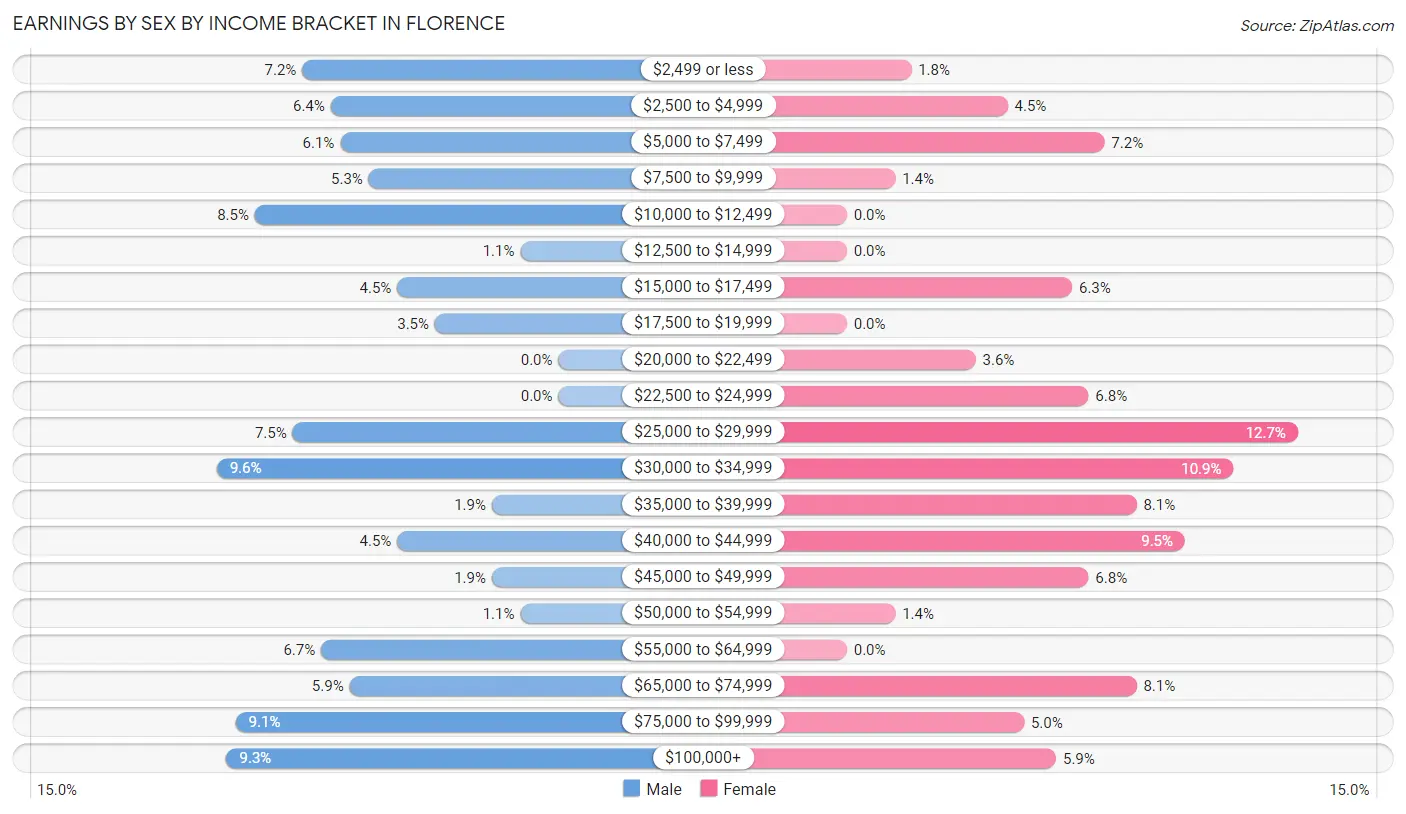
Earnings by Sex by Income Bracket in Florence
The most common earnings brackets in Florence are $30,000 to $34,999 for men (36 | 9.6%) and $25,000 to $29,999 for women (28 | 12.7%).
| Income | Male | Female |
| $2,499 or less | 27 (7.2%) | 4 (1.8%) |
| $2,500 to $4,999 | 24 (6.4%) | 10 (4.5%) |
| $5,000 to $7,499 | 23 (6.1%) | 16 (7.2%) |
| $7,500 to $9,999 | 20 (5.3%) | 3 (1.4%) |
| $10,000 to $12,499 | 32 (8.5%) | 0 (0.0%) |
| $12,500 to $14,999 | 4 (1.1%) | 0 (0.0%) |
| $15,000 to $17,499 | 17 (4.5%) | 14 (6.3%) |
| $17,500 to $19,999 | 13 (3.5%) | 0 (0.0%) |
| $20,000 to $22,499 | 0 (0.0%) | 8 (3.6%) |
| $22,500 to $24,999 | 0 (0.0%) | 15 (6.8%) |
| $25,000 to $29,999 | 28 (7.5%) | 28 (12.7%) |
| $30,000 to $34,999 | 36 (9.6%) | 24 (10.9%) |
| $35,000 to $39,999 | 7 (1.9%) | 18 (8.1%) |
| $40,000 to $44,999 | 17 (4.5%) | 21 (9.5%) |
| $45,000 to $49,999 | 7 (1.9%) | 15 (6.8%) |
| $50,000 to $54,999 | 4 (1.1%) | 3 (1.4%) |
| $55,000 to $64,999 | 25 (6.7%) | 0 (0.0%) |
| $65,000 to $74,999 | 22 (5.9%) | 18 (8.1%) |
| $75,000 to $99,999 | 34 (9.1%) | 11 (5.0%) |
| $100,000+ | 35 (9.3%) | 13 (5.9%) |
| Total | 375 (100.0%) | 221 (100.0%) |
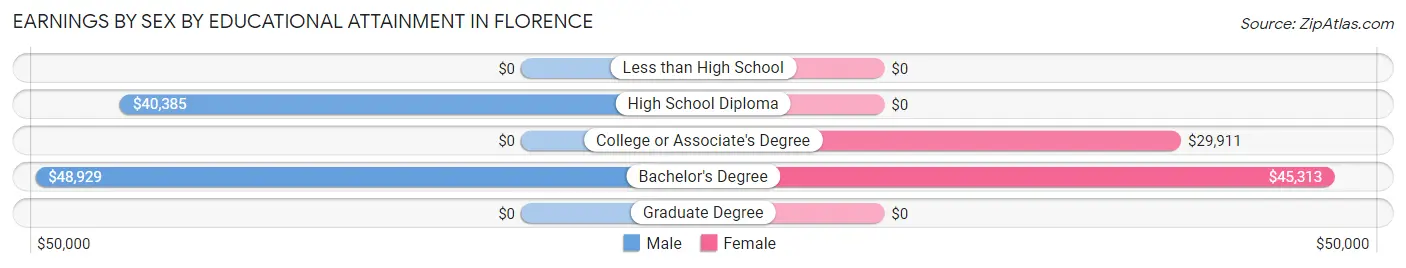
Earnings by Sex by Educational Attainment in Florence
Average earnings in Florence are $41,691 for men and $32,404 for women, a difference of 22.3%. Men with an educational attainment of bachelor's degree enjoy the highest average annual earnings of $48,929, while those with high school diploma education earn the least with $40,385. Women with an educational attainment of bachelor's degree earn the most with the average annual earnings of $45,313, while those with college or associate's degree education have the smallest earnings of $29,911.
| Educational Attainment | Male Income | Female Income |
| Less than High School | - | - |
| High School Diploma | $40,385 | $0 |
| College or Associate's Degree | - | - |
| Bachelor's Degree | $48,929 | $45,313 |
| Graduate Degree | - | - |
| Total | $41,691 | $32,404 |
Family Income in Florence
Family Income Brackets in Florence
According to the Florence family income data, there are 61 families falling into the $100,000 to $149,999 income range, which is the most common income bracket and makes up 25.0% of all families. Conversely, the $10,000 to $14,999 income bracket is the least frequent group with only 4 families (1.6%) belonging to this category.
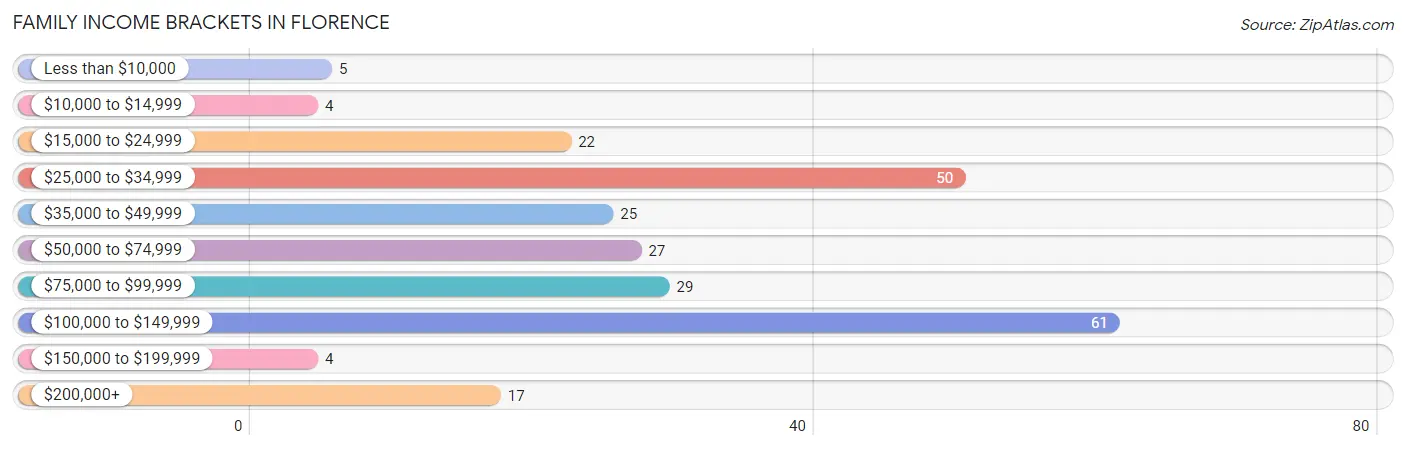
| Income Bracket | # Families | % Families |
| Less than $10,000 | 5 | 2.0% |
| $10,000 to $14,999 | 4 | 1.6% |
| $15,000 to $24,999 | 22 | 9.0% |
| $25,000 to $34,999 | 50 | 20.5% |
| $35,000 to $49,999 | 25 | 10.2% |
| $50,000 to $74,999 | 27 | 11.1% |
| $75,000 to $99,999 | 29 | 11.9% |
| $100,000 to $149,999 | 61 | 25.0% |
| $150,000 to $199,999 | 4 | 1.6% |
| $200,000+ | 17 | 7.0% |
Family Income by Famaliy Size in Florence
4-person families (87 | 35.7%) account for the highest median family income in Florence with $100,433 per family, while 3-person families (42 | 17.2%) have the highest median income of $27,692 per family member.
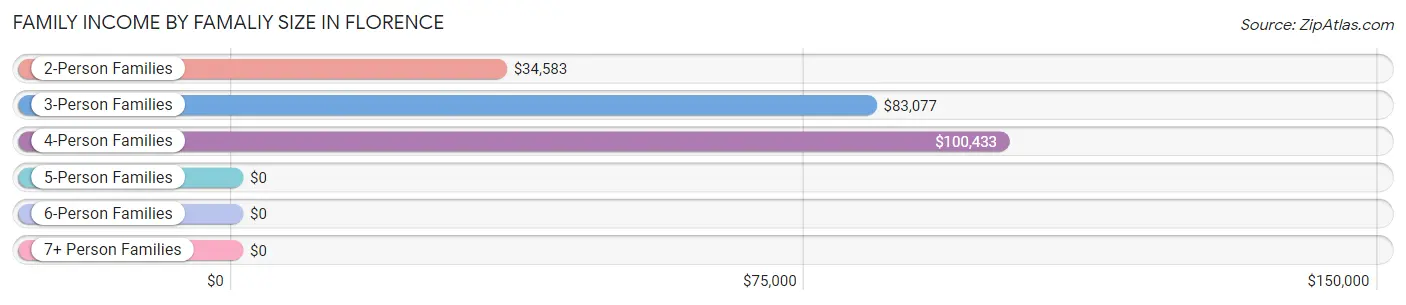
| Income Bracket | # Families | Median Income |
| 2-Person Families | 83 (34.0%) | $34,583 |
| 3-Person Families | 42 (17.2%) | $83,077 |
| 4-Person Families | 87 (35.7%) | $100,433 |
| 5-Person Families | 28 (11.5%) | $0 |
| 6-Person Families | 4 (1.6%) | $0 |
| 7+ Person Families | 0 (0.0%) | $0 |
| Total | 244 (100.0%) | $61,250 |
Family Income by Number of Earners in Florence
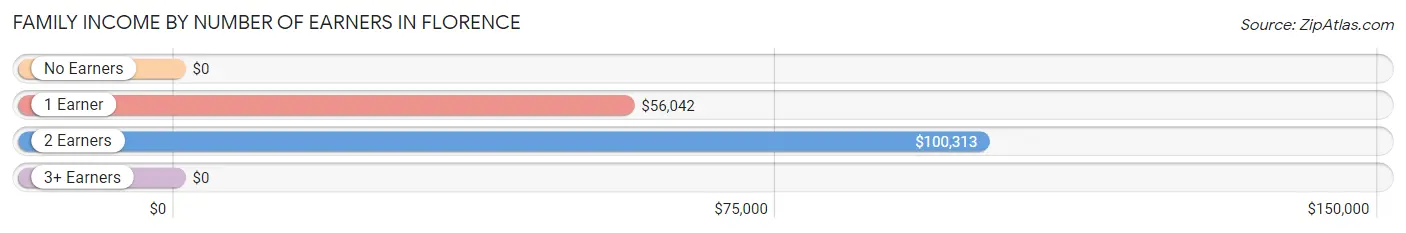
| Number of Earners | # Families | Median Income |
| No Earners | 22 (9.0%) | $0 |
| 1 Earner | 74 (30.3%) | $56,042 |
| 2 Earners | 96 (39.3%) | $100,313 |
| 3+ Earners | 52 (21.3%) | $0 |
| Total | 244 (100.0%) | $61,250 |
Household Income in Florence
Household Income Brackets in Florence
With 83 households falling in the category, the $50,000 to $74,999 income range is the most frequent in Florence, accounting for 20.8% of all households. In contrast, only 4 households (1.0%) fall into the $150,000 to $199,999 income bracket, making it the least populous group.
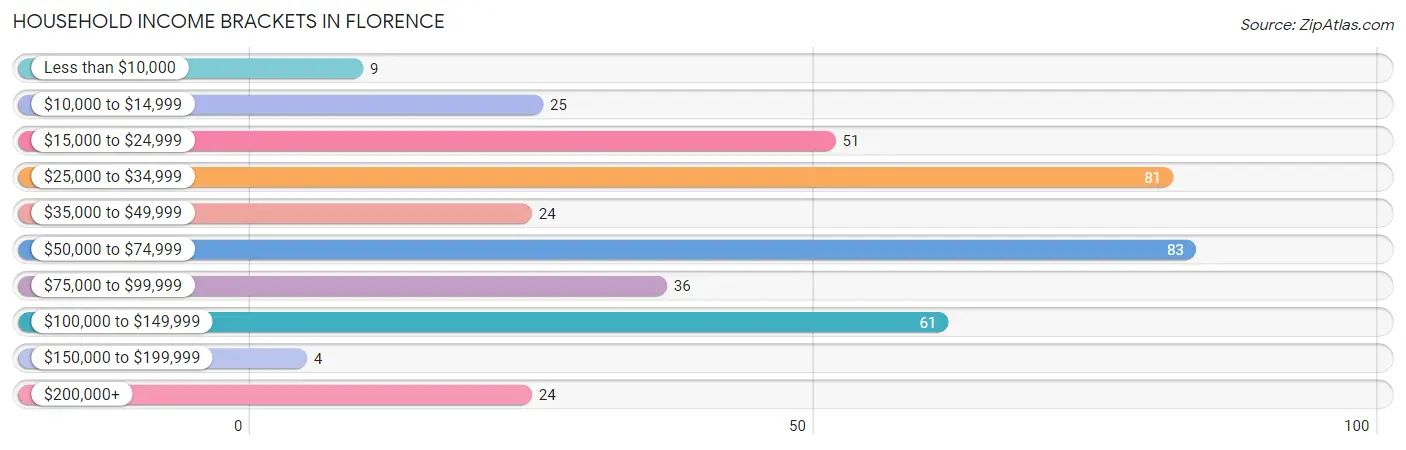
| Income Bracket | # Households | % Households |
| Less than $10,000 | 9 | 2.3% |
| $10,000 to $14,999 | 25 | 6.3% |
| $15,000 to $24,999 | 51 | 12.8% |
| $25,000 to $34,999 | 81 | 20.4% |
| $35,000 to $49,999 | 24 | 6.0% |
| $50,000 to $74,999 | 83 | 20.9% |
| $75,000 to $99,999 | 36 | 9.0% |
| $100,000 to $149,999 | 61 | 15.3% |
| $150,000 to $199,999 | 4 | 1.0% |
| $200,000+ | 24 | 6.0% |
Household Income by Householder Age in Florence
The median household income in Florence is $51,875, with the highest median household income of $78,750 found in the 25 to 44 years age bracket for the primary householder. A total of 142 households (35.7%) fall into this category. Meanwhile, the 15 to 24 years age bracket for the primary householder has the lowest median household income of $28,672, with 49 households (12.3%) in this group.
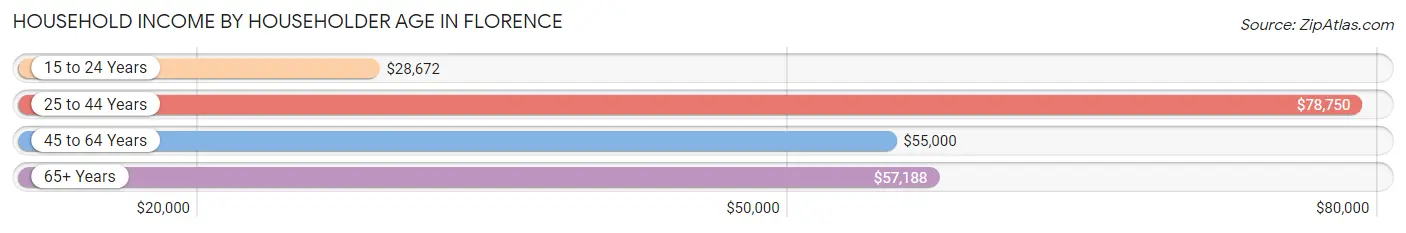
| Income Bracket | # Households | Median Income |
| 15 to 24 Years | 49 (12.3%) | $28,672 |
| 25 to 44 Years | 142 (35.7%) | $78,750 |
| 45 to 64 Years | 148 (37.2%) | $55,000 |
| 65+ Years | 59 (14.8%) | $57,188 |
| Total | 398 (100.0%) | $51,875 |
Poverty in Florence
Income Below Poverty by Sex and Age in Florence
With 16.4% poverty level for males and 10.6% for females among the residents of Florence, 5 year old males and 18 to 24 year old females are the most vulnerable to poverty, with 4 males (100.0%) and 5 females (35.7%) in their respective age groups living below the poverty level.
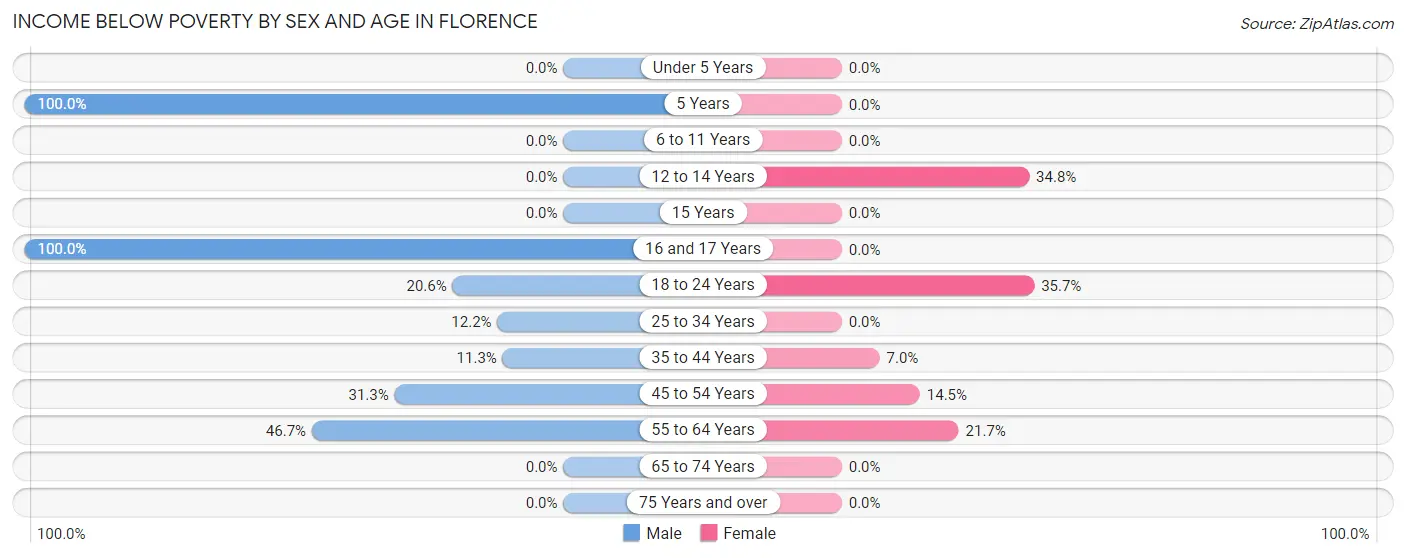
| Age Bracket | Male | Female |
| Under 5 Years | 0 (0.0%) | 0 (0.0%) |
| 5 Years | 4 (100.0%) | 0 (0.0%) |
| 6 to 11 Years | 0 (0.0%) | 0 (0.0%) |
| 12 to 14 Years | 0 (0.0%) | 8 (34.8%) |
| 15 Years | 0 (0.0%) | 0 (0.0%) |
| 16 and 17 Years | 3 (100.0%) | 0 (0.0%) |
| 18 to 24 Years | 22 (20.6%) | 5 (35.7%) |
| 25 to 34 Years | 12 (12.2%) | 0 (0.0%) |
| 35 to 44 Years | 8 (11.3%) | 4 (7.0%) |
| 45 to 54 Years | 26 (31.3%) | 10 (14.5%) |
| 55 to 64 Years | 21 (46.7%) | 18 (21.7%) |
| 65 to 74 Years | 0 (0.0%) | 0 (0.0%) |
| 75 Years and over | 0 (0.0%) | 0 (0.0%) |
| Total | 96 (16.4%) | 45 (10.6%) |
Income Above Poverty by Sex and Age in Florence
According to the poverty statistics in Florence, males aged under 5 years and females aged under 5 years are the age groups that are most secure financially, with 100.0% of males and 100.0% of females in these age groups living above the poverty line.
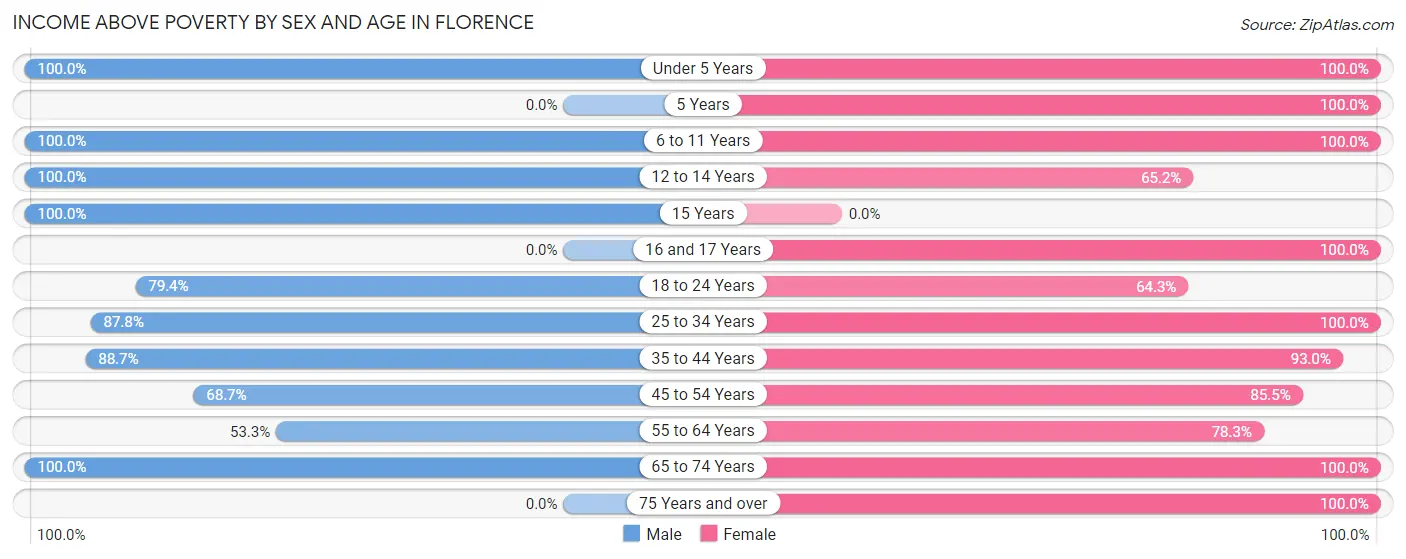
| Age Bracket | Male | Female |
| Under 5 Years | 25 (100.0%) | 13 (100.0%) |
| 5 Years | 0 (0.0%) | 19 (100.0%) |
| 6 to 11 Years | 48 (100.0%) | 16 (100.0%) |
| 12 to 14 Years | 38 (100.0%) | 15 (65.2%) |
| 15 Years | 12 (100.0%) | 0 (0.0%) |
| 16 and 17 Years | 0 (0.0%) | 12 (100.0%) |
| 18 to 24 Years | 85 (79.4%) | 9 (64.3%) |
| 25 to 34 Years | 86 (87.8%) | 75 (100.0%) |
| 35 to 44 Years | 63 (88.7%) | 53 (93.0%) |
| 45 to 54 Years | 57 (68.7%) | 59 (85.5%) |
| 55 to 64 Years | 24 (53.3%) | 65 (78.3%) |
| 65 to 74 Years | 53 (100.0%) | 33 (100.0%) |
| 75 Years and over | 0 (0.0%) | 9 (100.0%) |
| Total | 491 (83.7%) | 378 (89.4%) |
Income Below Poverty Among Married-Couple Families in Florence
The poverty statistics for married-couple families in Florence show that 15.0% or 27 of the total 180 families live below the poverty line. Families with no children have the highest poverty rate of 23.9%, comprising of 17 families. On the other hand, families with 3 or 4 children have the lowest poverty rate of 0.0%, which includes 0 families.
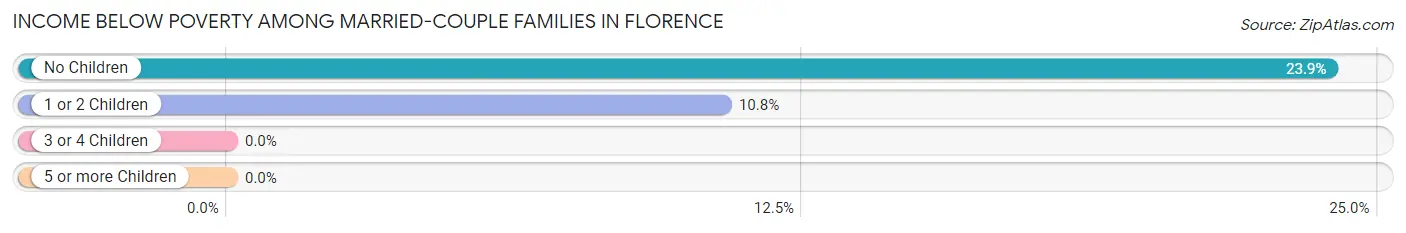
| Children | Above Poverty | Below Poverty |
| No Children | 54 (76.1%) | 17 (23.9%) |
| 1 or 2 Children | 83 (89.2%) | 10 (10.7%) |
| 3 or 4 Children | 16 (100.0%) | 0 (0.0%) |
| 5 or more Children | 0 (0.0%) | 0 (0.0%) |
| Total | 153 (85.0%) | 27 (15.0%) |
Income Below Poverty Among Single-Parent Households in Florence
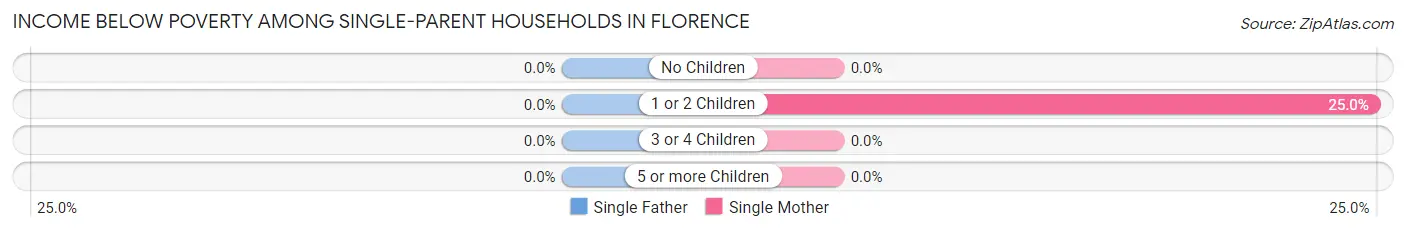
| Children | Single Father | Single Mother |
| No Children | 0 (0.0%) | 0 (0.0%) |
| 1 or 2 Children | 0 (0.0%) | 4 (25.0%) |
| 3 or 4 Children | 0 (0.0%) | 0 (0.0%) |
| 5 or more Children | 0 (0.0%) | 0 (0.0%) |
| Total | 0 (0.0%) | 4 (18.2%) |
Income Below Poverty Among Married-Couple vs Single-Parent Households in Florence
The poverty data for Florence shows that 27 of the married-couple family households (15.0%) and 4 of the single-parent households (6.2%) are living below the poverty level. Within the married-couple family households, those with no children have the highest poverty rate, with 17 households (23.9%) falling below the poverty line. Among the single-parent households, those with 1 or 2 children have the highest poverty rate, with 4 household (11.1%) living below poverty.
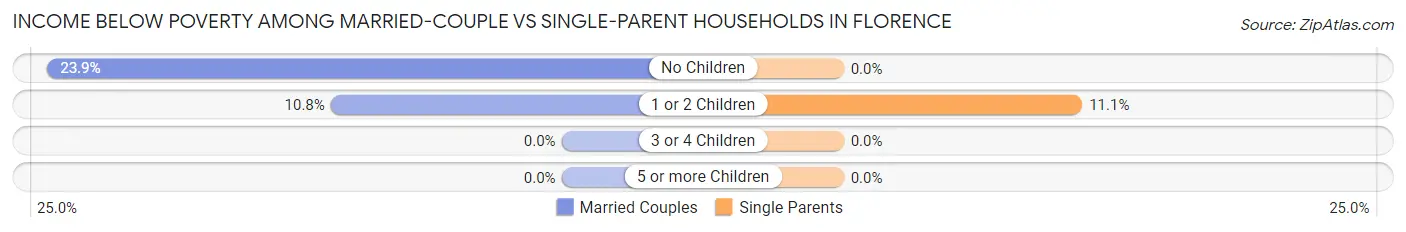
| Children | Married-Couple Families | Single-Parent Households |
| No Children | 17 (23.9%) | 0 (0.0%) |
| 1 or 2 Children | 10 (10.7%) | 4 (11.1%) |
| 3 or 4 Children | 0 (0.0%) | 0 (0.0%) |
| 5 or more Children | 0 (0.0%) | 0 (0.0%) |
| Total | 27 (15.0%) | 4 (6.2%) |
Race in Florence
The most populous races in Florence are White / Caucasian (840 | 82.6%), Hispanic or Latino (339 | 33.3%), and Two or more Races (113 | 11.1%).
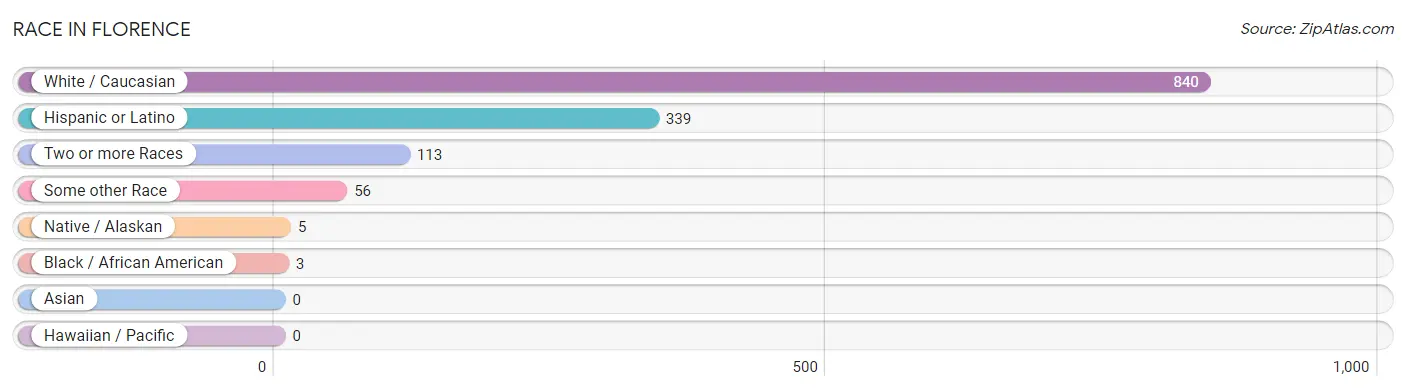
| Race | # Population | % Population |
| Asian | 0 | 0.0% |
| Black / African American | 3 | 0.3% |
| Hawaiian / Pacific | 0 | 0.0% |
| Hispanic or Latino | 339 | 33.3% |
| Native / Alaskan | 5 | 0.5% |
| White / Caucasian | 840 | 82.6% |
| Two or more Races | 113 | 11.1% |
| Some other Race | 56 | 5.5% |
| Total | 1,017 | 100.0% |
Ancestry in Florence
The most populous ancestries reported in Florence are Mexican (324 | 31.9%), Irish (189 | 18.6%), English (150 | 14.7%), German (117 | 11.5%), and American (65 | 6.4%), together accounting for 83.1% of all Florence residents.
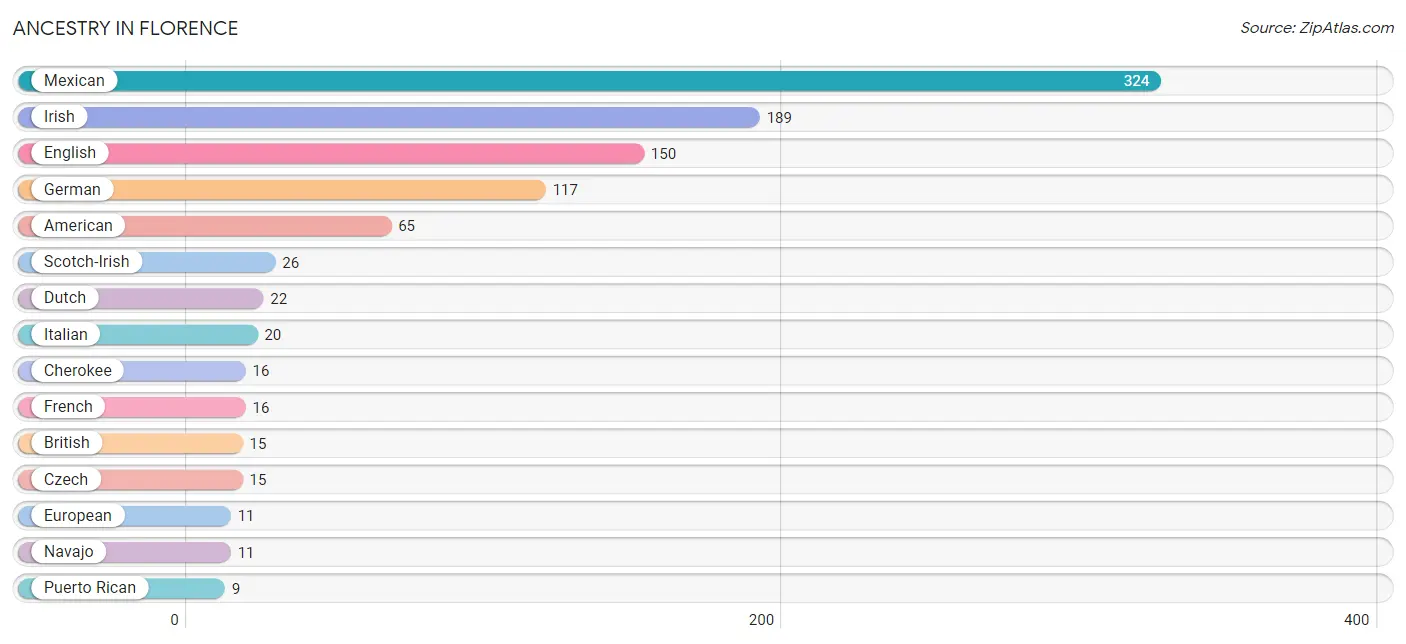
| Ancestry | # Population | % Population |
| American | 65 | 6.4% |
| British | 15 | 1.5% |
| Cherokee | 16 | 1.6% |
| Choctaw | 4 | 0.4% |
| Comanche | 4 | 0.4% |
| Czech | 15 | 1.5% |
| Dutch | 22 | 2.2% |
| English | 150 | 14.7% |
| European | 11 | 1.1% |
| French | 16 | 1.6% |
| German | 117 | 11.5% |
| Irish | 189 | 18.6% |
| Italian | 20 | 2.0% |
| Mexican | 324 | 31.9% |
| Navajo | 11 | 1.1% |
| Polish | 4 | 0.4% |
| Puerto Rican | 9 | 0.9% |
| Scotch-Irish | 26 | 2.6% |
| Spanish | 4 | 0.4% |
| Swedish | 4 | 0.4% |
| Ukrainian | 9 | 0.9% | View All 21 Rows |
Immigrants in Florence
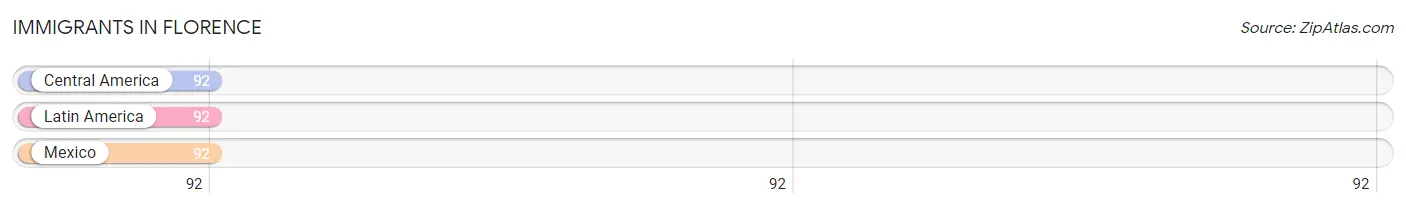
The most numerous immigrant groups reported in Florence came from Central America (92 | 9.0%), Latin America (92 | 9.0%), and Mexico (92 | 9.0%), together accounting for 27.1% of all Florence residents.
| Immigration Origin | # Population | % Population |
| Central America | 92 | 9.0% |
| Latin America | 92 | 9.0% |
| Mexico | 92 | 9.0% | View All 3 Rows |
Sex and Age in Florence
Sex and Age in Florence
The most populous age groups in Florence are 45 to 49 Years (83 | 14.0%) for men and 45 to 49 Years (57 | 13.5%) for women.
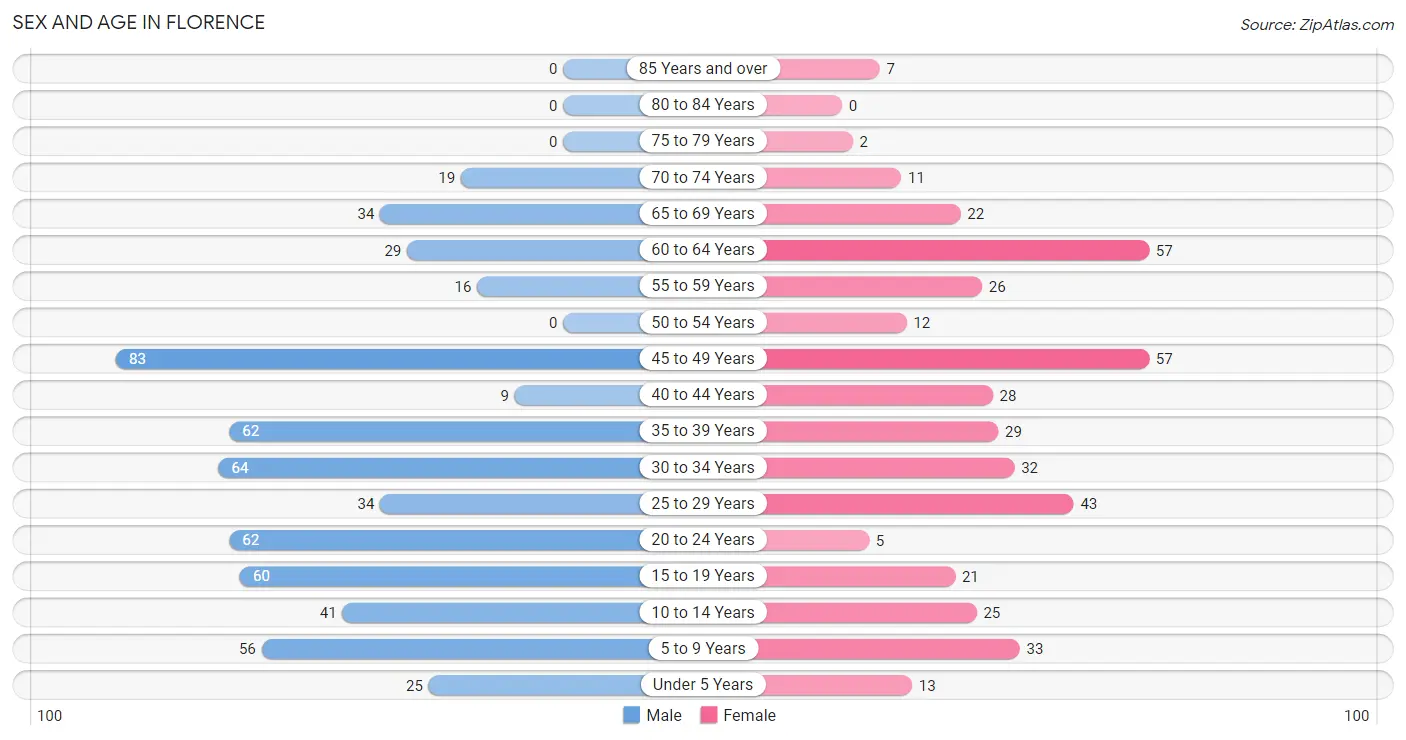
| Age Bracket | Male | Female |
| Under 5 Years | 25 (4.2%) | 13 (3.1%) |
| 5 to 9 Years | 56 (9.4%) | 33 (7.8%) |
| 10 to 14 Years | 41 (6.9%) | 25 (5.9%) |
| 15 to 19 Years | 60 (10.1%) | 21 (5.0%) |
| 20 to 24 Years | 62 (10.4%) | 5 (1.2%) |
| 25 to 29 Years | 34 (5.7%) | 43 (10.2%) |
| 30 to 34 Years | 64 (10.8%) | 32 (7.6%) |
| 35 to 39 Years | 62 (10.4%) | 29 (6.9%) |
| 40 to 44 Years | 9 (1.5%) | 28 (6.6%) |
| 45 to 49 Years | 83 (14.0%) | 57 (13.5%) |
| 50 to 54 Years | 0 (0.0%) | 12 (2.8%) |
| 55 to 59 Years | 16 (2.7%) | 26 (6.1%) |
| 60 to 64 Years | 29 (4.9%) | 57 (13.5%) |
| 65 to 69 Years | 34 (5.7%) | 22 (5.2%) |
| 70 to 74 Years | 19 (3.2%) | 11 (2.6%) |
| 75 to 79 Years | 0 (0.0%) | 2 (0.5%) |
| 80 to 84 Years | 0 (0.0%) | 0 (0.0%) |
| 85 Years and over | 0 (0.0%) | 7 (1.7%) |
| Total | 594 (100.0%) | 423 (100.0%) |
Families and Households in Florence
Median Family Size in Florence
The median family size in Florence is 3.33 persons per family, with married-couple families (180 | 73.8%) accounting for the largest median family size of 3.78 persons per family. On the other hand, single male/father families (42 | 17.2%) represent the smallest median family size with 1.93 persons per family.
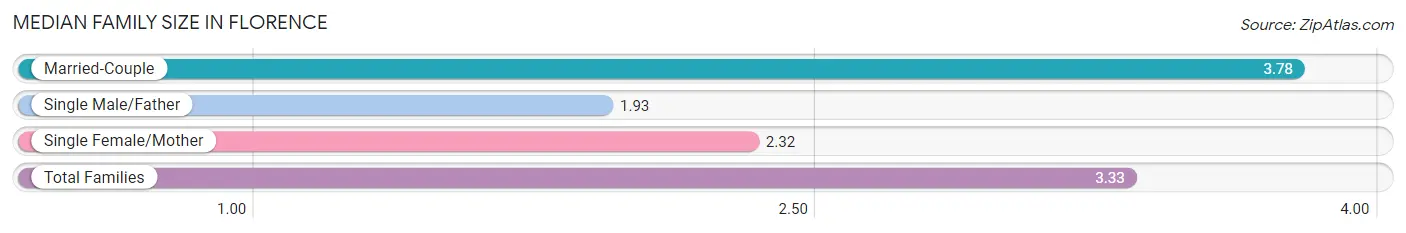
| Family Type | # Families | Family Size |
| Married-Couple | 180 (73.8%) | 3.78 |
| Single Male/Father | 42 (17.2%) | 1.93 |
| Single Female/Mother | 22 (9.0%) | 2.32 |
| Total Families | 244 (100.0%) | 3.33 |
Median Household Size in Florence
The median household size in Florence is 2.56 persons per household, with married-couple households (180 | 45.2%) accounting for the largest median household size of 3.9 persons per household. non-family households (154 | 38.7%) represent the smallest median household size with 1.16 persons per household.
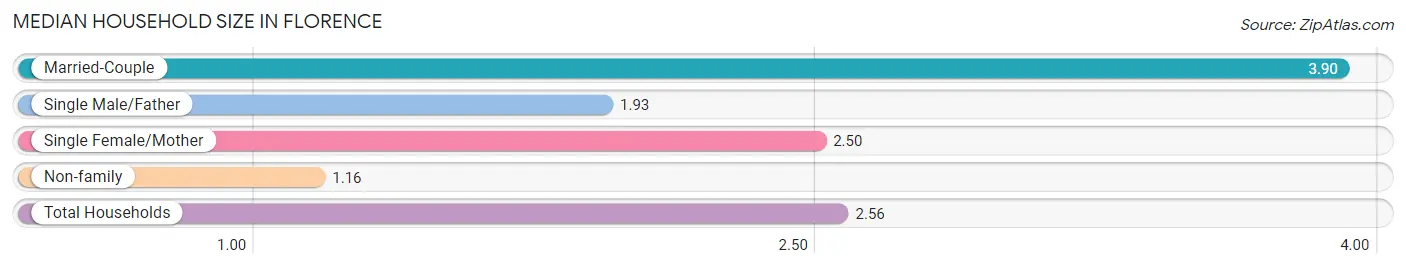
| Household Type | # Households | Household Size |
| Married-Couple | 180 (45.2%) | 3.90 |
| Single Male/Father | 42 (10.5%) | 1.93 |
| Single Female/Mother | 22 (5.5%) | 2.50 |
| Non-family | 154 (38.7%) | 1.16 |
| Total Households | 398 (100.0%) | 2.56 |
Household Size by Marriage Status in Florence
Out of a total of 398 households in Florence, 244 (61.3%) are family households, while 154 (38.7%) are nonfamily households. The most numerous type of family households are 2-person households, comprising 80, and the most common type of nonfamily households are 1-person households, comprising 136.
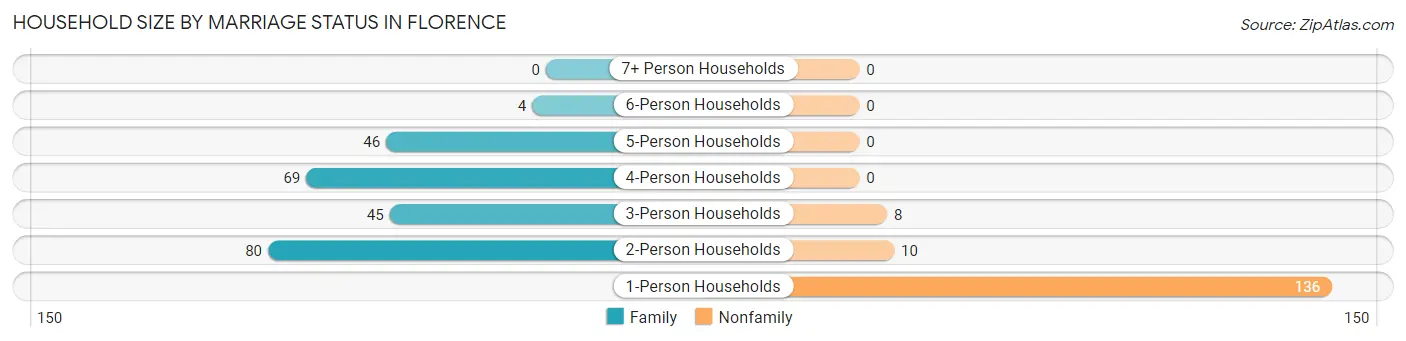
| Household Size | Family Households | Nonfamily Households |
| 1-Person Households | - | 136 (34.2%) |
| 2-Person Households | 80 (20.1%) | 10 (2.5%) |
| 3-Person Households | 45 (11.3%) | 8 (2.0%) |
| 4-Person Households | 69 (17.3%) | 0 (0.0%) |
| 5-Person Households | 46 (11.6%) | 0 (0.0%) |
| 6-Person Households | 4 (1.0%) | 0 (0.0%) |
| 7+ Person Households | 0 (0.0%) | 0 (0.0%) |
| Total | 244 (61.3%) | 154 (38.7%) |
Female Fertility in Florence
Fertility by Age in Florence
Average fertility rate in Florence is 59.0 births per 1,000 women. Women in the age bracket of 20 to 34 years have the highest fertility rate with 163.0 births per 1,000 women. Women in the age bracket of 20 to 34 years acount for 100.0% of all women with births.
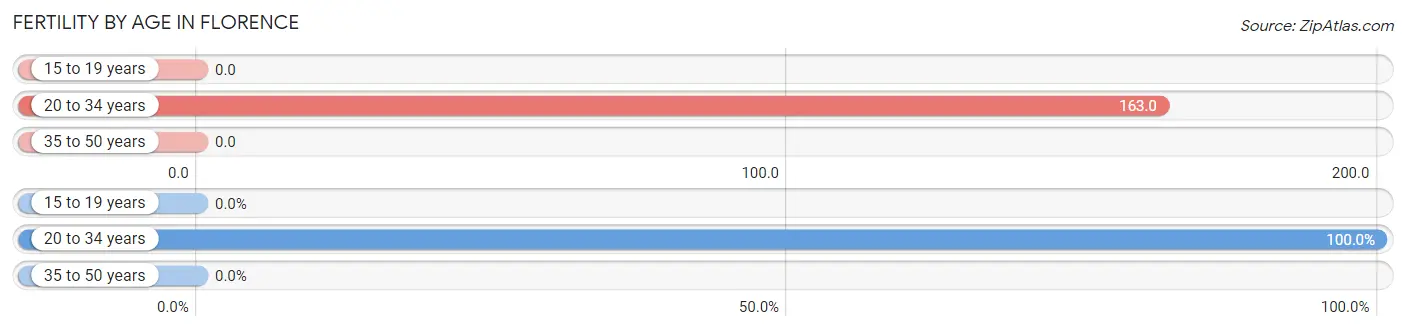
| Age Bracket | Women with Births | Births / 1,000 Women |
| 15 to 19 years | 0 (0.0%) | 0.0 |
| 20 to 34 years | 13 (100.0%) | 163.0 |
| 35 to 50 years | 0 (0.0%) | 0.0 |
| Total | 13 (100.0%) | 59.0 |
Fertility by Age by Marriage Status in Florence
76.9% of women with births (13) in Florence are married. The highest percentage of unmarried women with births falls into 20 to 34 years age bracket with 23.1% of them unmarried at the time of birth, while the lowest percentage of unmarried women with births belong to 20 to 34 years age bracket with 23.1% of them unmarried.
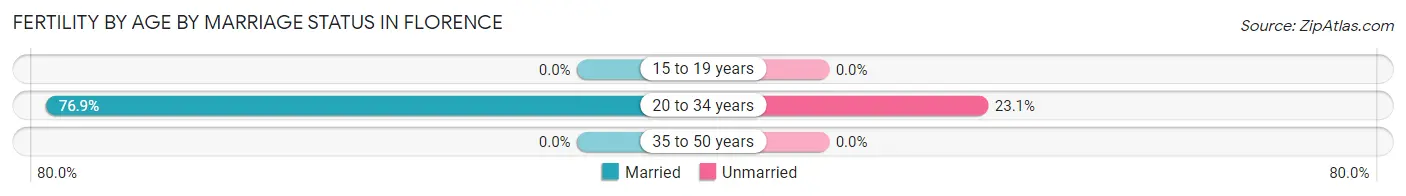
| Age Bracket | Married | Unmarried |
| 15 to 19 years | 0 (0.0%) | 0 (0.0%) |
| 20 to 34 years | 10 (76.9%) | 3 (23.1%) |
| 35 to 50 years | 0 (0.0%) | 0 (0.0%) |
| Total | 10 (76.9%) | 3 (23.1%) |
Fertility by Education in Florence
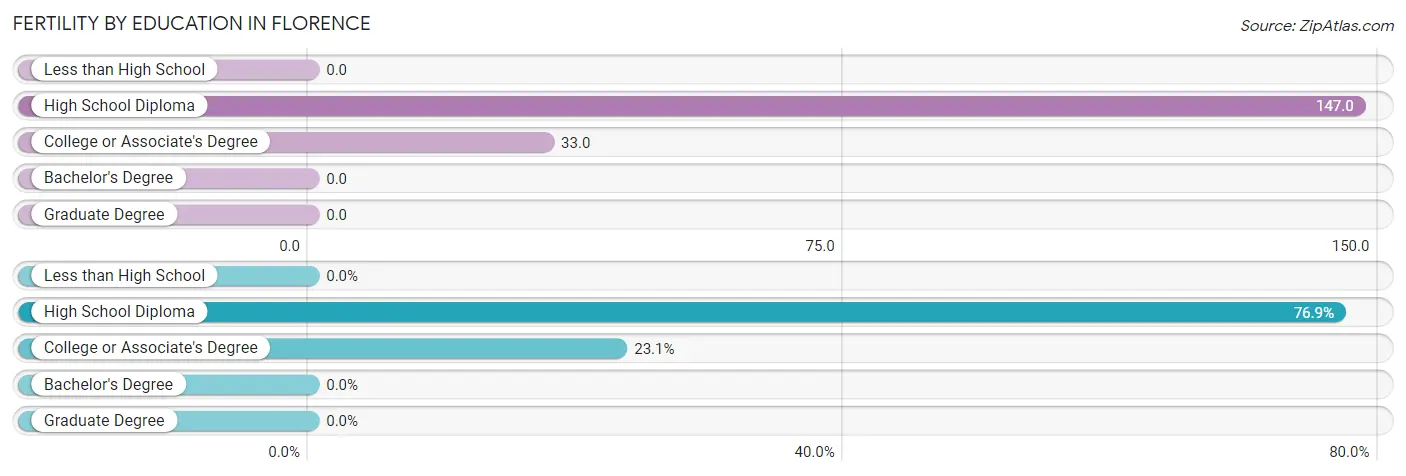
| Educational Attainment | Women with Births | Births / 1,000 Women |
| Less than High School | 0 (0.0%) | 0.0 |
| High School Diploma | 10 (76.9%) | 147.0 |
| College or Associate's Degree | 3 (23.1%) | 33.0 |
| Bachelor's Degree | 0 (0.0%) | 0.0 |
| Graduate Degree | 0 (0.0%) | 0.0 |
| Total | 13 (100.0%) | 59.0 |
Fertility by Education by Marriage Status in Florence
23.1% of women with births in Florence are unmarried. Women with the educational attainment of high school diploma are most likely to be married with 100.0% of them married at childbirth, while women with the educational attainment of college or associate's degree are least likely to be married with 100.0% of them unmarried at childbirth.
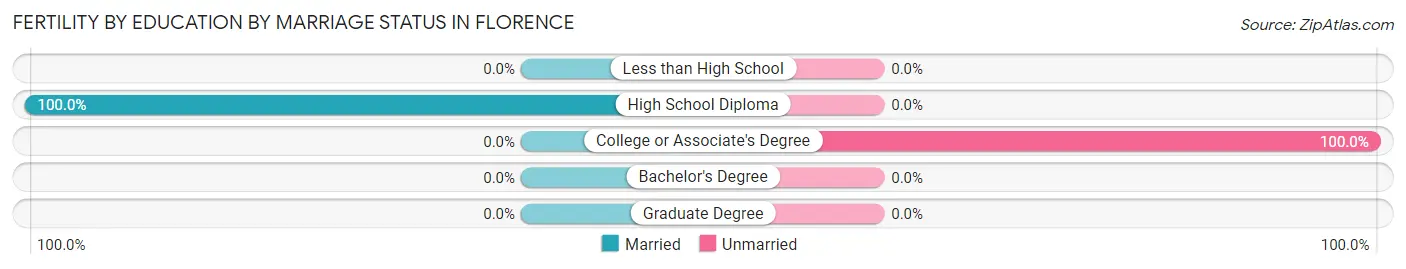
| Educational Attainment | Married | Unmarried |
| Less than High School | 0 (0.0%) | 0 (0.0%) |
| High School Diploma | 10 (100.0%) | 0 (0.0%) |
| College or Associate's Degree | 0 (0.0%) | 3 (100.0%) |
| Bachelor's Degree | 0 (0.0%) | 0 (0.0%) |
| Graduate Degree | 0 (0.0%) | 0 (0.0%) |
| Total | 10 (76.9%) | 3 (23.1%) |
Employment Characteristics in Florence
Employment by Class of Employer in Florence
Among the 491 employed individuals in Florence, private company employees (304 | 61.9%), self-employed (not incorporated) (68 | 13.9%), and not-for-profit organizations (49 | 10.0%) make up the most common classes of employment.
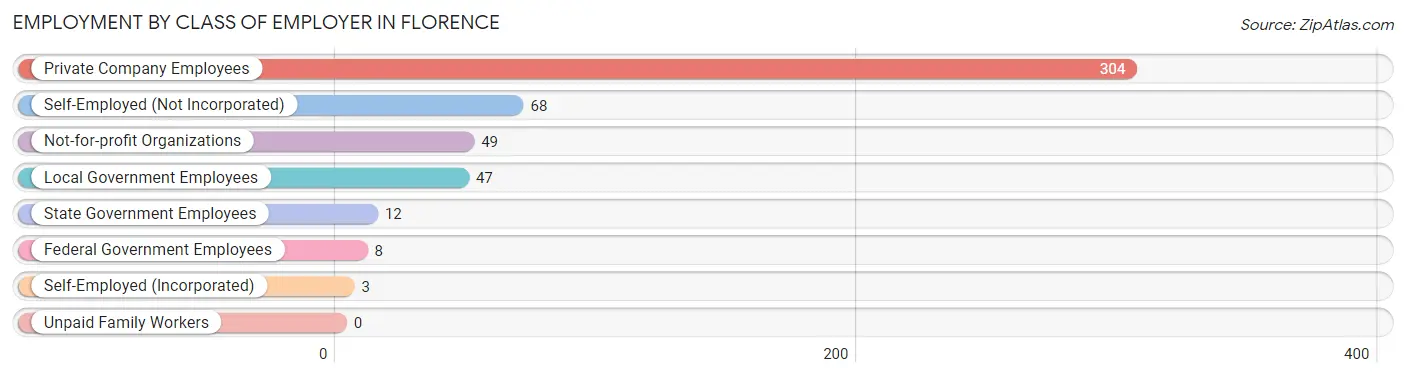
| Employer Class | # Employees | % Employees |
| Private Company Employees | 304 | 61.9% |
| Self-Employed (Incorporated) | 3 | 0.6% |
| Self-Employed (Not Incorporated) | 68 | 13.9% |
| Not-for-profit Organizations | 49 | 10.0% |
| Local Government Employees | 47 | 9.6% |
| State Government Employees | 12 | 2.4% |
| Federal Government Employees | 8 | 1.6% |
| Unpaid Family Workers | 0 | 0.0% |
| Total | 491 | 100.0% |
Employment Status by Age in Florence
According to the labor force statistics for Florence, out of the total population over 16 years of age (812), 64.0% or 520 individuals are in the labor force, with 5.6% or 29 of them unemployed. The age group with the highest labor force participation rate is 35 to 44 years, with 87.5% or 112 individuals in the labor force. Within the labor force, the 16 to 19 years age range has the highest percentage of unemployed individuals, with 85.0% or 17 of them being unemployed.
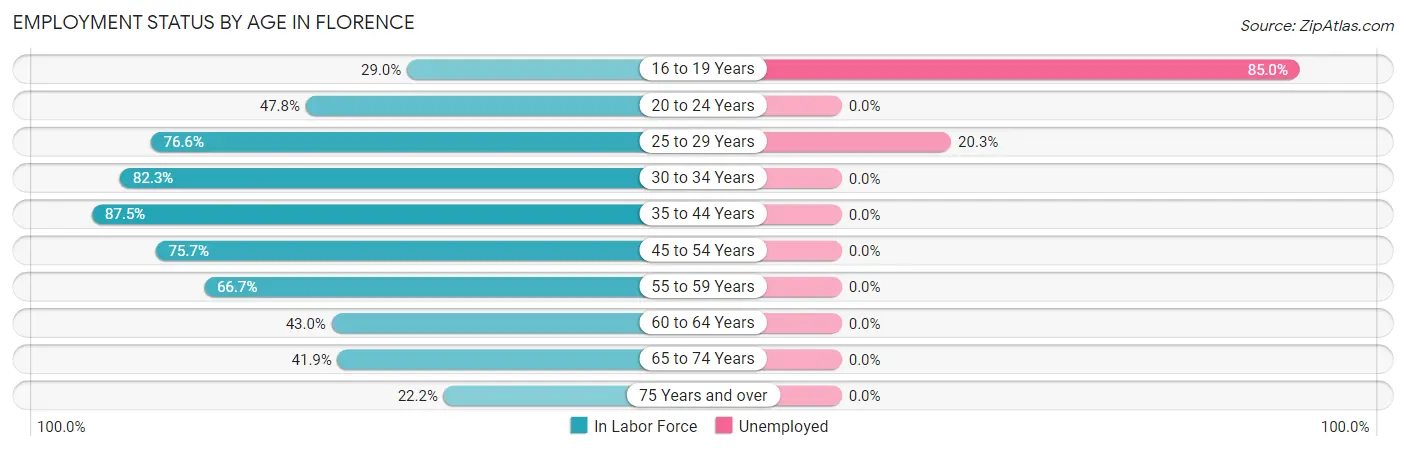
| Age Bracket | In Labor Force | Unemployed |
| 16 to 19 Years | 20 (29.0%) | 17 (85.0%) |
| 20 to 24 Years | 32 (47.8%) | 0 (0.0%) |
| 25 to 29 Years | 59 (76.6%) | 12 (20.3%) |
| 30 to 34 Years | 79 (82.3%) | 0 (0.0%) |
| 35 to 44 Years | 112 (87.5%) | 0 (0.0%) |
| 45 to 54 Years | 115 (75.7%) | 0 (0.0%) |
| 55 to 59 Years | 28 (66.7%) | 0 (0.0%) |
| 60 to 64 Years | 37 (43.0%) | 0 (0.0%) |
| 65 to 74 Years | 36 (41.9%) | 0 (0.0%) |
| 75 Years and over | 2 (22.2%) | 0 (0.0%) |
| Total | 520 (64.0%) | 29 (5.6%) |
Employment Status by Educational Attainment in Florence
According to labor force statistics for Florence, 74.0% of individuals (430) out of the total population between 25 and 64 years of age (581) are in the labor force, with 2.8% or 12 of them being unemployed. The group with the highest labor force participation rate are those with the educational attainment of bachelor's degree or higher, with 95.5% or 64 individuals in the labor force. Within the labor force, individuals with bachelor's degree or higher education have the highest percentage of unemployment, with 18.8% or 12 of them being unemployed.
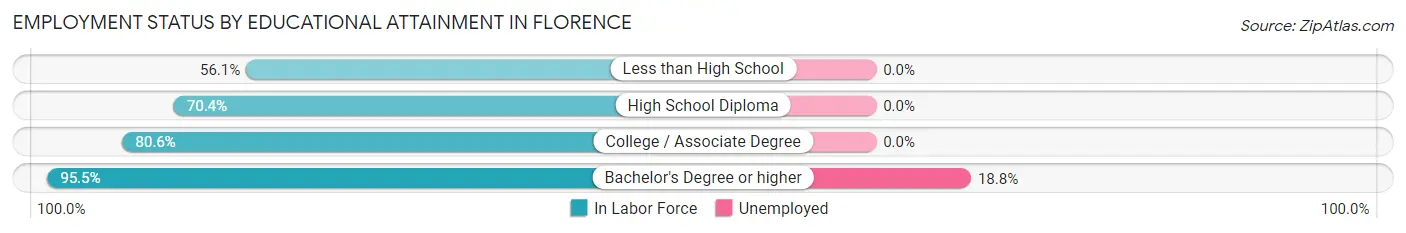
| Educational Attainment | In Labor Force | Unemployed |
| Less than High School | 60 (56.1%) | 0 (0.0%) |
| High School Diploma | 152 (70.4%) | 0 (0.0%) |
| College / Associate Degree | 154 (80.6%) | 0 (0.0%) |
| Bachelor's Degree or higher | 64 (95.5%) | 13 (18.8%) |
| Total | 430 (74.0%) | 16 (2.8%) |
Employment Occupations by Sex in Florence
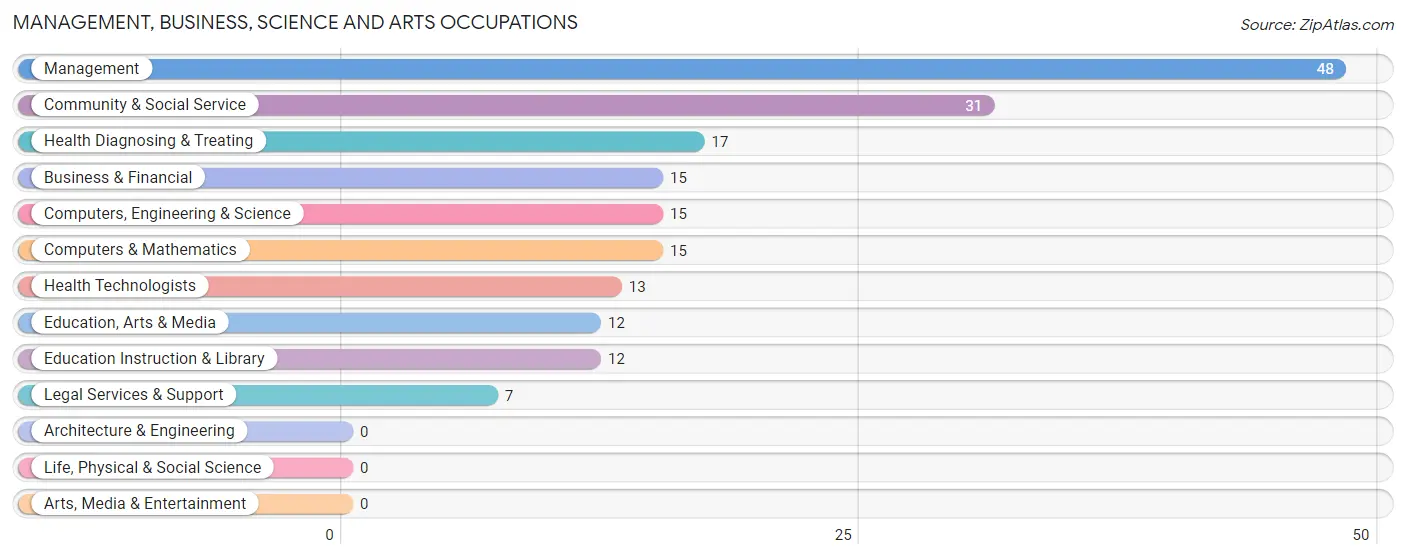
Management, Business, Science and Arts Occupations
The most common Management, Business, Science and Arts occupations in Florence are Management (48 | 9.8%), Community & Social Service (31 | 6.3%), Health Diagnosing & Treating (17 | 3.5%), Business & Financial (15 | 3.0%), and Computers, Engineering & Science (15 | 3.0%).
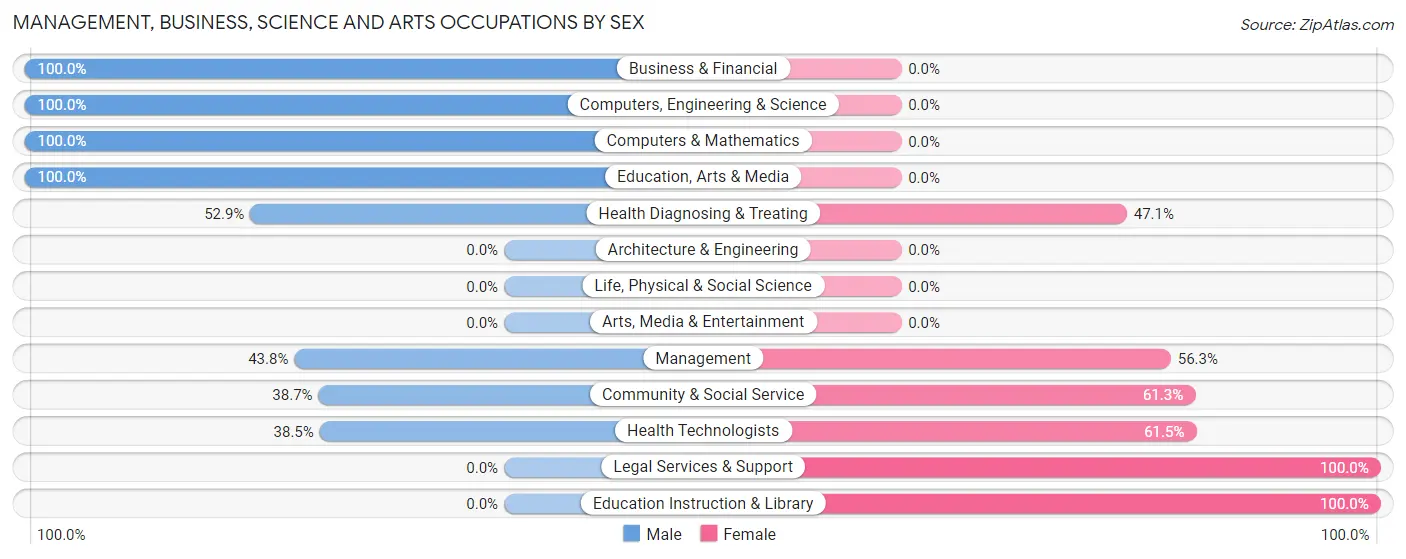
Management, Business, Science and Arts Occupations by Sex
Within the Management, Business, Science and Arts occupations in Florence, the most male-oriented occupations are Business & Financial (100.0%), Computers, Engineering & Science (100.0%), and Computers & Mathematics (100.0%), while the most female-oriented occupations are Legal Services & Support (100.0%), Education Instruction & Library (100.0%), and Health Technologists (61.5%).
| Occupation | Male | Female |
| Management | 21 (43.8%) | 27 (56.2%) |
| Business & Financial | 15 (100.0%) | 0 (0.0%) |
| Computers, Engineering & Science | 15 (100.0%) | 0 (0.0%) |
| Computers & Mathematics | 15 (100.0%) | 0 (0.0%) |
| Architecture & Engineering | 0 (0.0%) | 0 (0.0%) |
| Life, Physical & Social Science | 0 (0.0%) | 0 (0.0%) |
| Community & Social Service | 12 (38.7%) | 19 (61.3%) |
| Education, Arts & Media | 12 (100.0%) | 0 (0.0%) |
| Legal Services & Support | 0 (0.0%) | 7 (100.0%) |
| Education Instruction & Library | 0 (0.0%) | 12 (100.0%) |
| Arts, Media & Entertainment | 0 (0.0%) | 0 (0.0%) |
| Health Diagnosing & Treating | 9 (52.9%) | 8 (47.1%) |
| Health Technologists | 5 (38.5%) | 8 (61.5%) |
| Total (Category) | 72 (57.1%) | 54 (42.9%) |
| Total (Overall) | 276 (56.2%) | 215 (43.8%) |
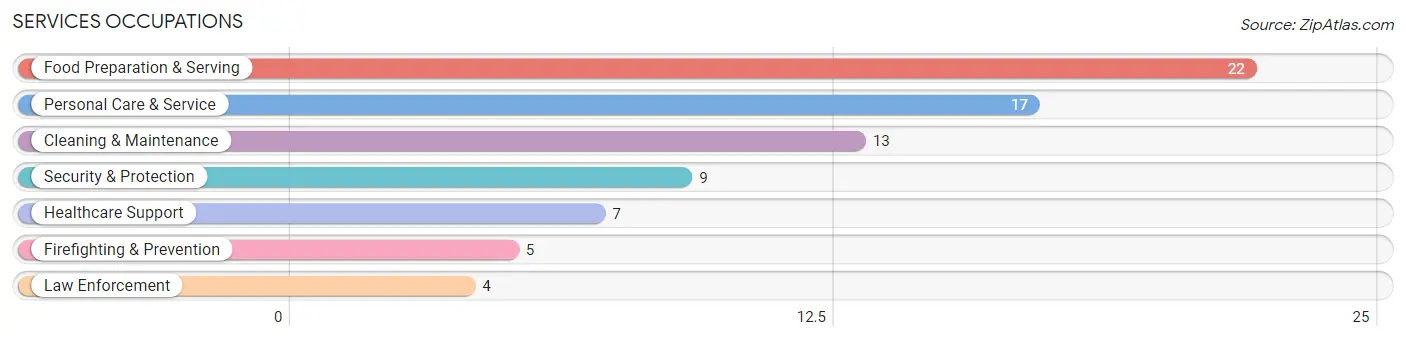
Services Occupations
The most common Services occupations in Florence are Food Preparation & Serving (22 | 4.5%), Personal Care & Service (17 | 3.5%), Cleaning & Maintenance (13 | 2.6%), Security & Protection (9 | 1.8%), and Healthcare Support (7 | 1.4%).
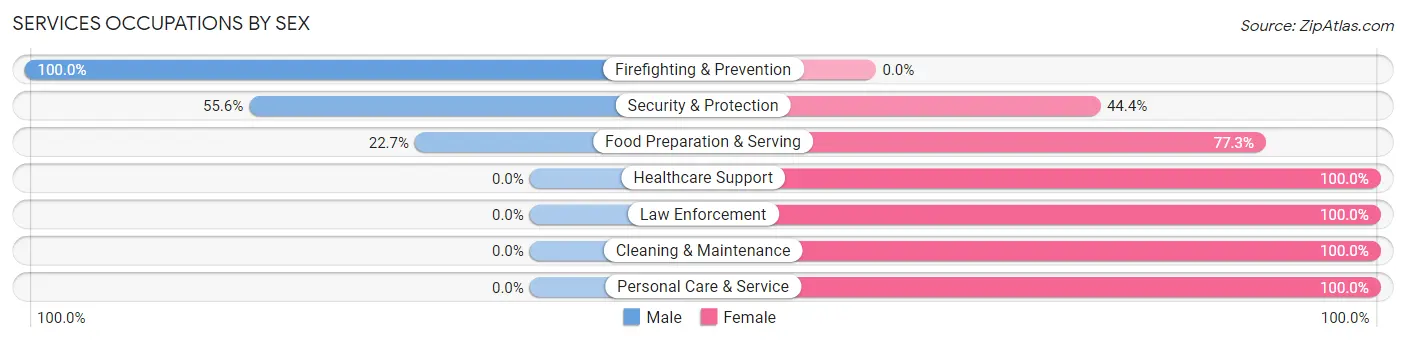
Services Occupations by Sex
Within the Services occupations in Florence, the most male-oriented occupations are Firefighting & Prevention (100.0%), Security & Protection (55.6%), and Food Preparation & Serving (22.7%), while the most female-oriented occupations are Healthcare Support (100.0%), Law Enforcement (100.0%), and Cleaning & Maintenance (100.0%).
| Occupation | Male | Female |
| Healthcare Support | 0 (0.0%) | 7 (100.0%) |
| Security & Protection | 5 (55.6%) | 4 (44.4%) |
| Firefighting & Prevention | 5 (100.0%) | 0 (0.0%) |
| Law Enforcement | 0 (0.0%) | 4 (100.0%) |
| Food Preparation & Serving | 5 (22.7%) | 17 (77.3%) |
| Cleaning & Maintenance | 0 (0.0%) | 13 (100.0%) |
| Personal Care & Service | 0 (0.0%) | 17 (100.0%) |
| Total (Category) | 10 (14.7%) | 58 (85.3%) |
| Total (Overall) | 276 (56.2%) | 215 (43.8%) |
Sales and Office Occupations
The most common Sales and Office occupations in Florence are Office & Administration (90 | 18.3%), and Sales & Related (15 | 3.0%).
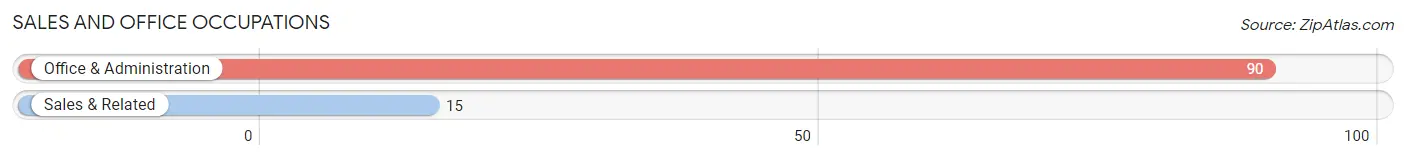
Sales and Office Occupations by Sex

| Occupation | Male | Female |
| Sales & Related | 15 (100.0%) | 0 (0.0%) |
| Office & Administration | 23 (25.6%) | 67 (74.4%) |
| Total (Category) | 38 (36.2%) | 67 (63.8%) |
| Total (Overall) | 276 (56.2%) | 215 (43.8%) |
Natural Resources, Construction and Maintenance Occupations
The most common Natural Resources, Construction and Maintenance occupations in Florence are Construction & Extraction (89 | 18.1%), and Installation, Maintenance & Repair (24 | 4.9%).
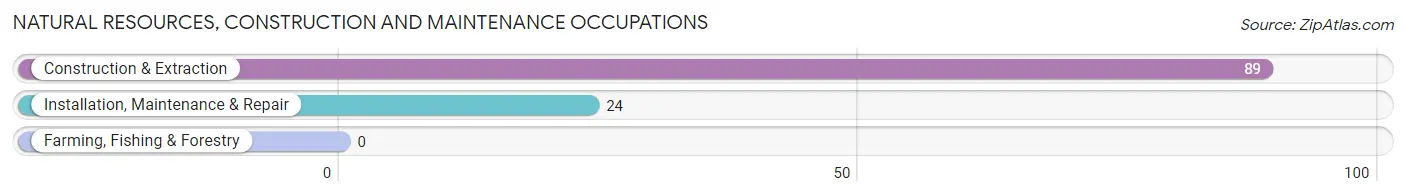
Natural Resources, Construction and Maintenance Occupations by Sex
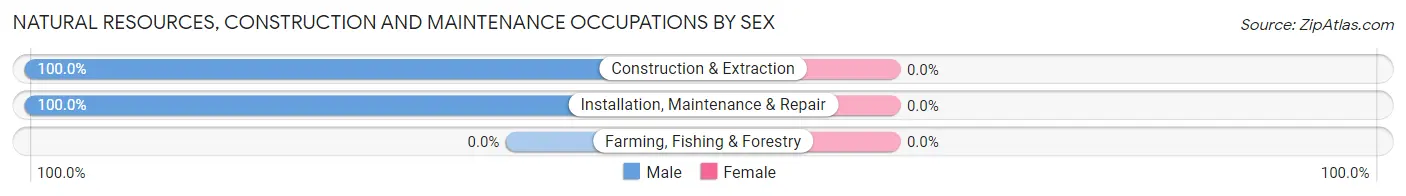
| Occupation | Male | Female |
| Farming, Fishing & Forestry | 0 (0.0%) | 0 (0.0%) |
| Construction & Extraction | 89 (100.0%) | 0 (0.0%) |
| Installation, Maintenance & Repair | 24 (100.0%) | 0 (0.0%) |
| Total (Category) | 113 (100.0%) | 0 (0.0%) |
| Total (Overall) | 276 (56.2%) | 215 (43.8%) |
Production, Transportation and Moving Occupations
The most common Production, Transportation and Moving occupations in Florence are Material Moving (42 | 8.6%), Transportation (28 | 5.7%), and Production (9 | 1.8%).
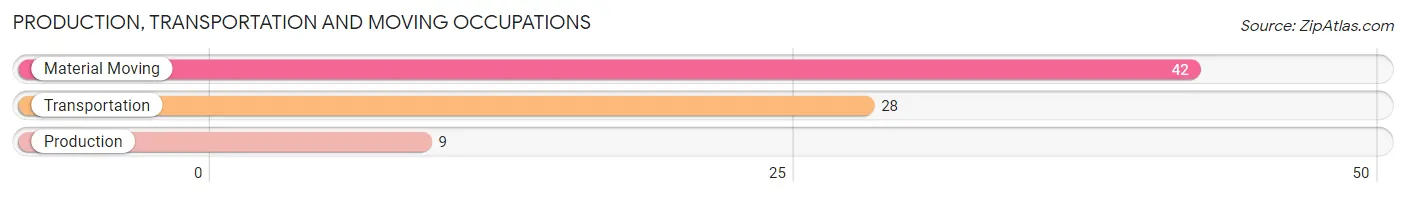
Production, Transportation and Moving Occupations by Sex
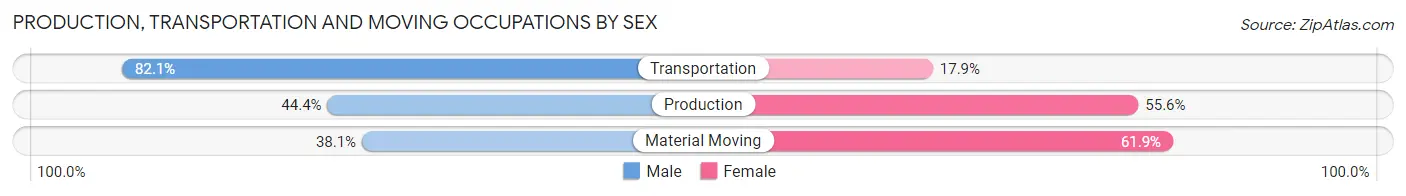
| Occupation | Male | Female |
| Production | 4 (44.4%) | 5 (55.6%) |
| Transportation | 23 (82.1%) | 5 (17.9%) |
| Material Moving | 16 (38.1%) | 26 (61.9%) |
| Total (Category) | 43 (54.4%) | 36 (45.6%) |
| Total (Overall) | 276 (56.2%) | 215 (43.8%) |
Employment Industries by Sex in Florence
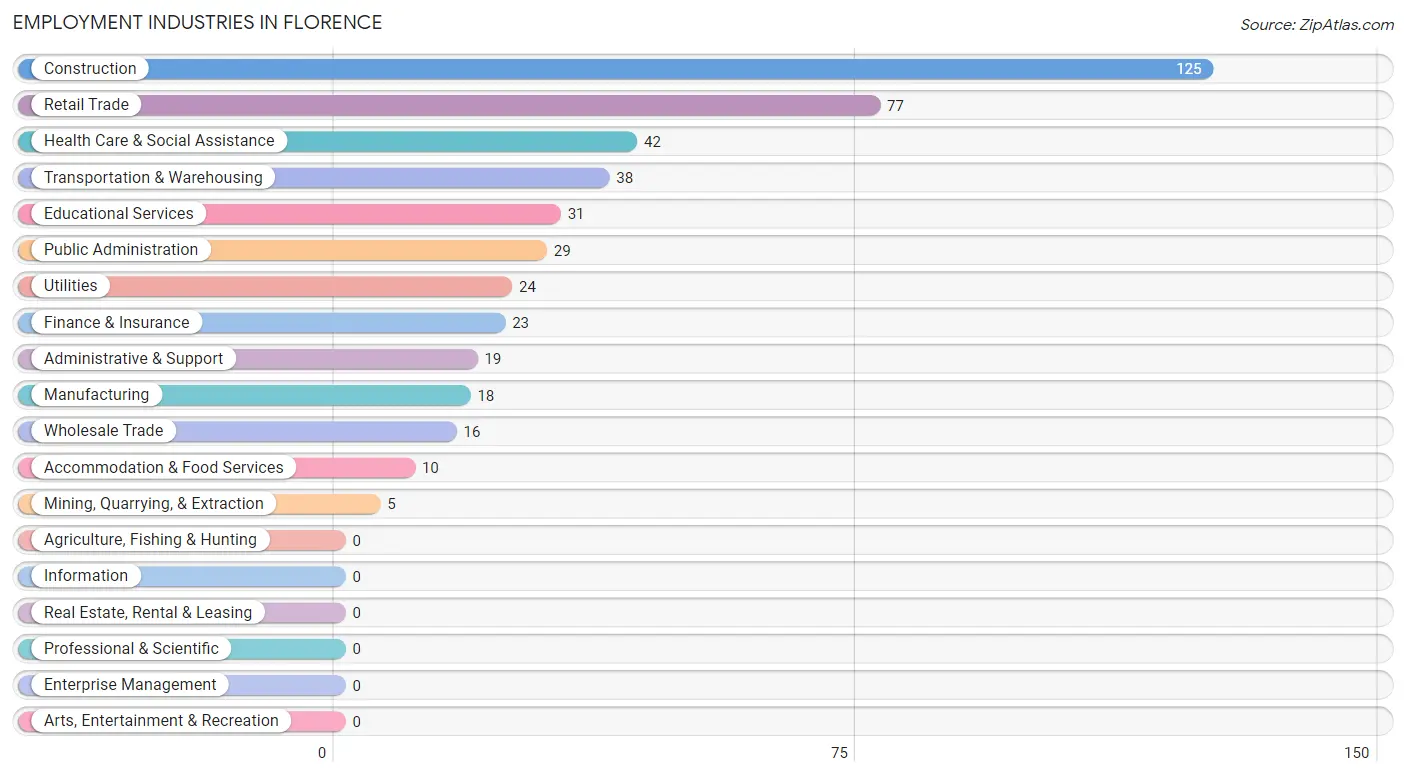
Employment Industries in Florence
The major employment industries in Florence include Construction (125 | 25.5%), Retail Trade (77 | 15.7%), Health Care & Social Assistance (42 | 8.6%), Transportation & Warehousing (38 | 7.7%), and Educational Services (31 | 6.3%).
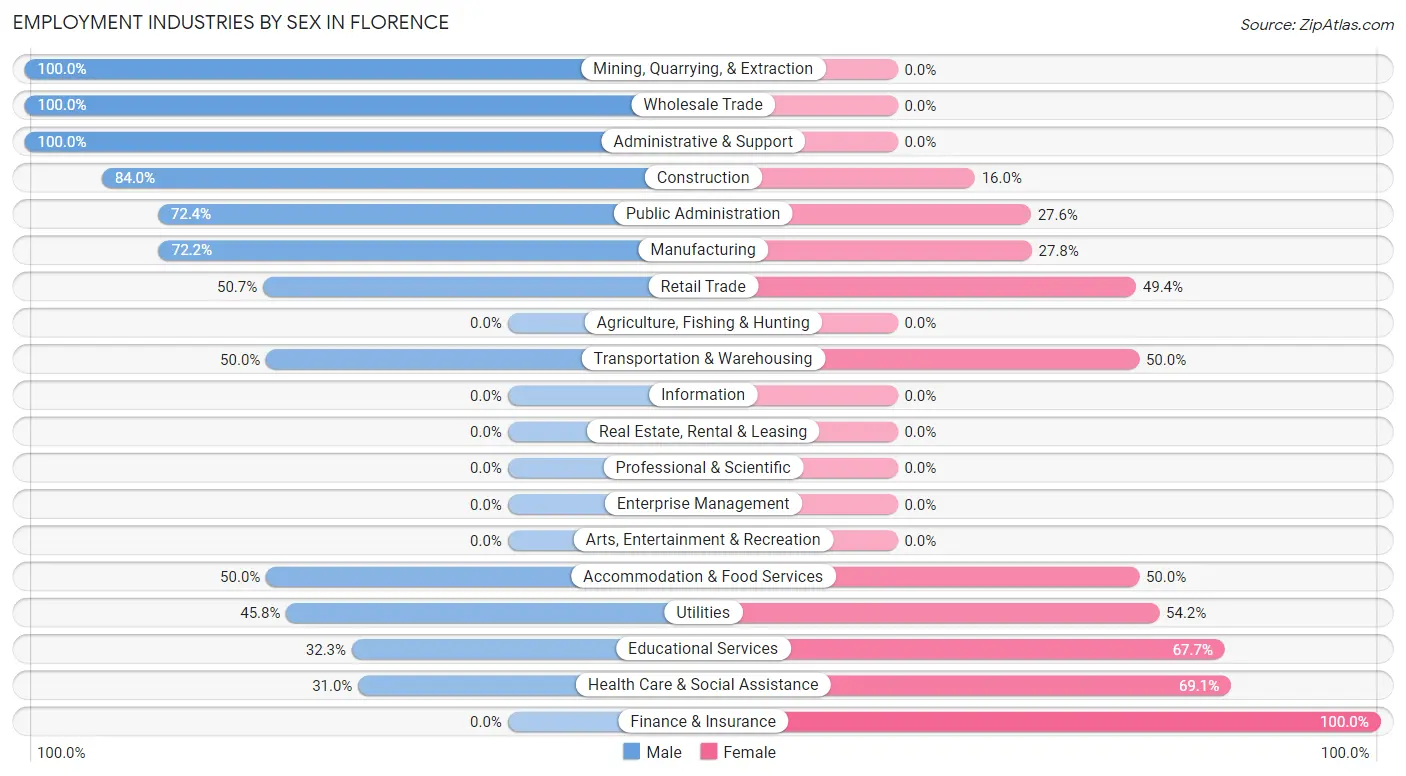
Employment Industries by Sex in Florence
The Florence industries that see more men than women are Mining, Quarrying, & Extraction (100.0%), Wholesale Trade (100.0%), and Administrative & Support (100.0%), whereas the industries that tend to have a higher number of women are Finance & Insurance (100.0%), Health Care & Social Assistance (69.1%), and Educational Services (67.7%).
| Industry | Male | Female |
| Agriculture, Fishing & Hunting | 0 (0.0%) | 0 (0.0%) |
| Mining, Quarrying, & Extraction | 5 (100.0%) | 0 (0.0%) |
| Construction | 105 (84.0%) | 20 (16.0%) |
| Manufacturing | 13 (72.2%) | 5 (27.8%) |
| Wholesale Trade | 16 (100.0%) | 0 (0.0%) |
| Retail Trade | 39 (50.6%) | 38 (49.3%) |
| Transportation & Warehousing | 19 (50.0%) | 19 (50.0%) |
| Utilities | 11 (45.8%) | 13 (54.2%) |
| Information | 0 (0.0%) | 0 (0.0%) |
| Finance & Insurance | 0 (0.0%) | 23 (100.0%) |
| Real Estate, Rental & Leasing | 0 (0.0%) | 0 (0.0%) |
| Professional & Scientific | 0 (0.0%) | 0 (0.0%) |
| Enterprise Management | 0 (0.0%) | 0 (0.0%) |
| Administrative & Support | 19 (100.0%) | 0 (0.0%) |
| Educational Services | 10 (32.3%) | 21 (67.7%) |
| Health Care & Social Assistance | 13 (30.9%) | 29 (69.1%) |
| Arts, Entertainment & Recreation | 0 (0.0%) | 0 (0.0%) |
| Accommodation & Food Services | 5 (50.0%) | 5 (50.0%) |
| Public Administration | 21 (72.4%) | 8 (27.6%) |
| Total | 276 (56.2%) | 215 (43.8%) |
Education in Florence
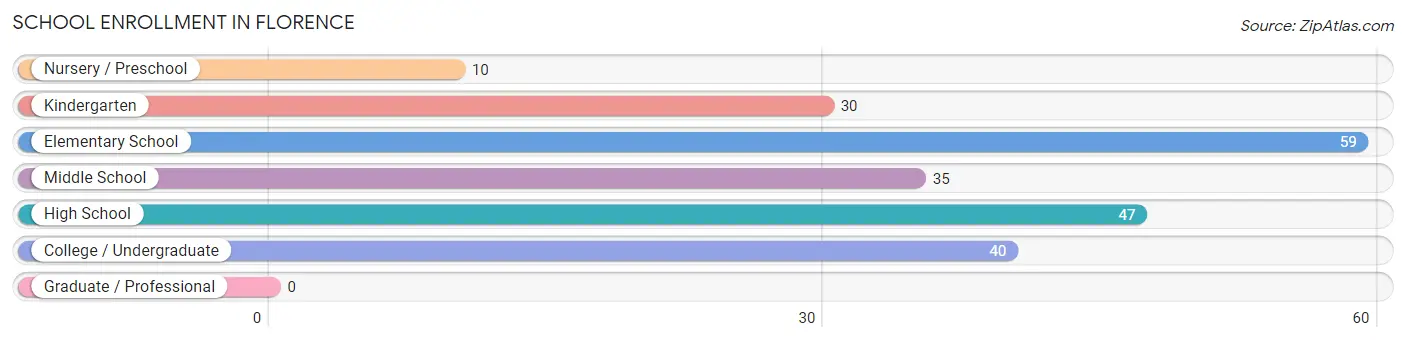
School Enrollment in Florence
The most common levels of schooling among the 221 students in Florence are elementary school (59 | 26.7%), high school (47 | 21.3%), and college / undergraduate (40 | 18.1%).
| School Level | # Students | % Students |
| Nursery / Preschool | 10 | 4.5% |
| Kindergarten | 30 | 13.6% |
| Elementary School | 59 | 26.7% |
| Middle School | 35 | 15.8% |
| High School | 47 | 21.3% |
| College / Undergraduate | 40 | 18.1% |
| Graduate / Professional | 0 | 0.0% |
| Total | 221 | 100.0% |
School Enrollment by Age by Funding Source in Florence
Out of a total of 221 students who are enrolled in schools in Florence, 6 (2.7%) attend a private institution, while the remaining 215 (97.3%) are enrolled in public schools. The age group of 10 to 14 year olds has the highest likelihood of being enrolled in private schools, with 6 (17.6% in the age bracket) enrolled. Conversely, the age group of 3 to 4 year olds has the lowest likelihood of being enrolled in a private school, with 10 (100.0% in the age bracket) attending a public institution.
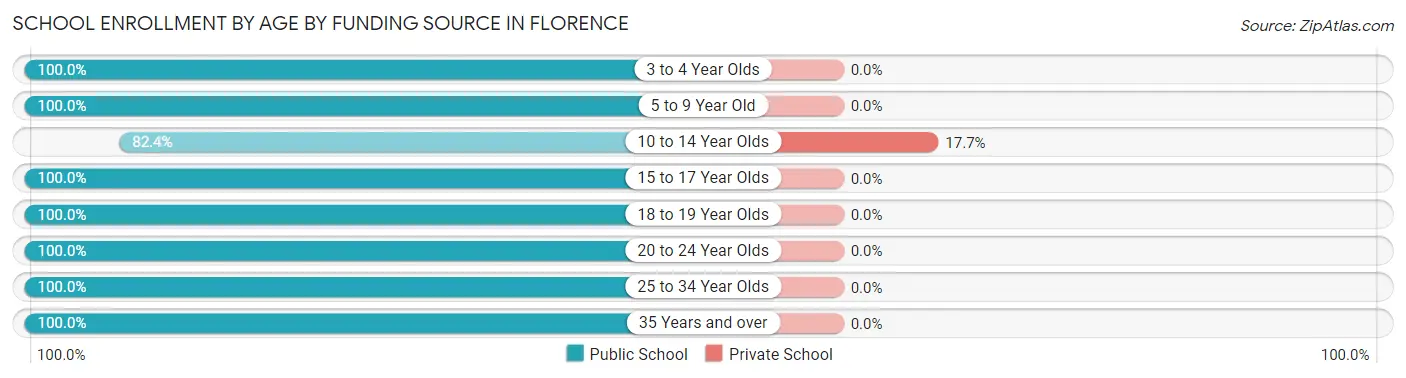
| Age Bracket | Public School | Private School |
| 3 to 4 Year Olds | 10 (100.0%) | 0 (0.0%) |
| 5 to 9 Year Old | 89 (100.0%) | 0 (0.0%) |
| 10 to 14 Year Olds | 28 (82.4%) | 6 (17.6%) |
| 15 to 17 Year Olds | 27 (100.0%) | 0 (0.0%) |
| 18 to 19 Year Olds | 38 (100.0%) | 0 (0.0%) |
| 20 to 24 Year Olds | 5 (100.0%) | 0 (0.0%) |
| 25 to 34 Year Olds | 13 (100.0%) | 0 (0.0%) |
| 35 Years and over | 5 (100.0%) | 0 (0.0%) |
| Total | 215 (97.3%) | 6 (2.7%) |
Educational Attainment by Field of Study in Florence
Social sciences (22 | 21.4%), business (21 | 20.4%), education (18 | 17.5%), engineering (12 | 11.7%), and psychology (11 | 10.7%) are the most common fields of study among 103 individuals in Florence who have obtained a bachelor's degree or higher.
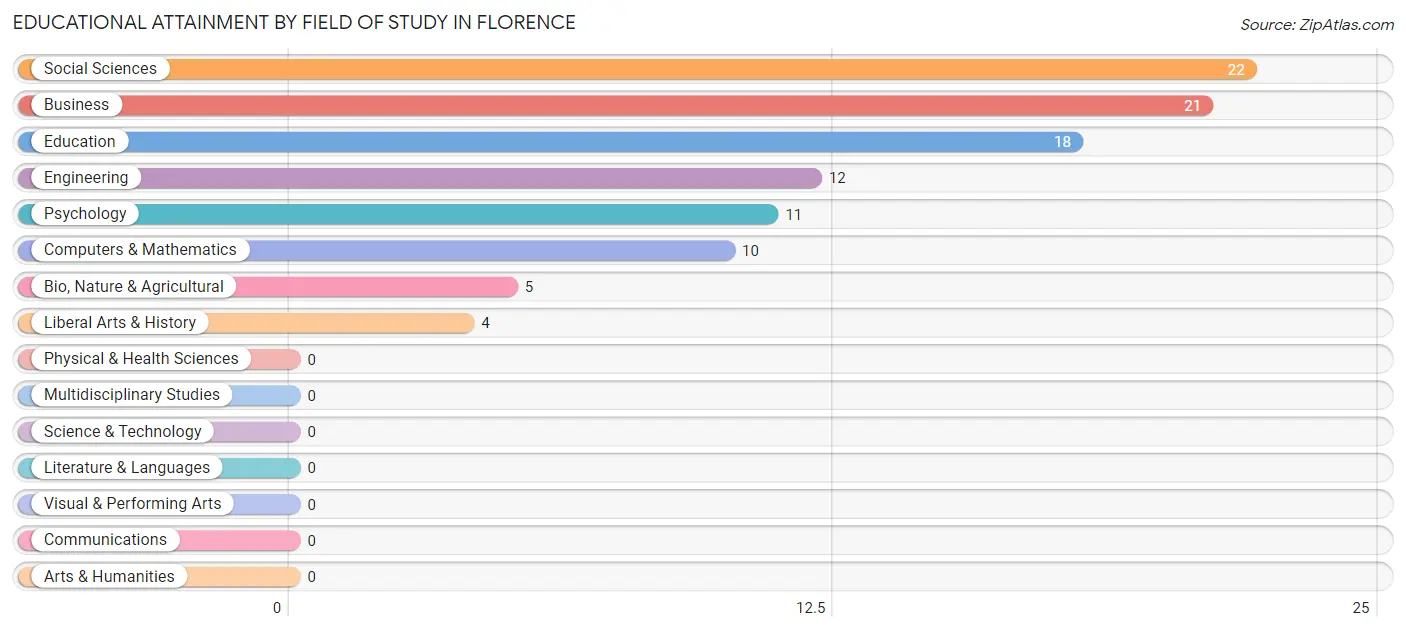
| Field of Study | # Graduates | % Graduates |
| Computers & Mathematics | 10 | 9.7% |
| Bio, Nature & Agricultural | 5 | 4.9% |
| Physical & Health Sciences | 0 | 0.0% |
| Psychology | 11 | 10.7% |
| Social Sciences | 22 | 21.4% |
| Engineering | 12 | 11.7% |
| Multidisciplinary Studies | 0 | 0.0% |
| Science & Technology | 0 | 0.0% |
| Business | 21 | 20.4% |
| Education | 18 | 17.5% |
| Literature & Languages | 0 | 0.0% |
| Liberal Arts & History | 4 | 3.9% |
| Visual & Performing Arts | 0 | 0.0% |
| Communications | 0 | 0.0% |
| Arts & Humanities | 0 | 0.0% |
| Total | 103 | 100.0% |
Transportation & Commute in Florence
Vehicle Availability by Sex in Florence
The most prevalent vehicle ownership categories in Florence are males with 2 vehicles (115, accounting for 41.7%) and females with 2 vehicles (62, making up 53.5%).
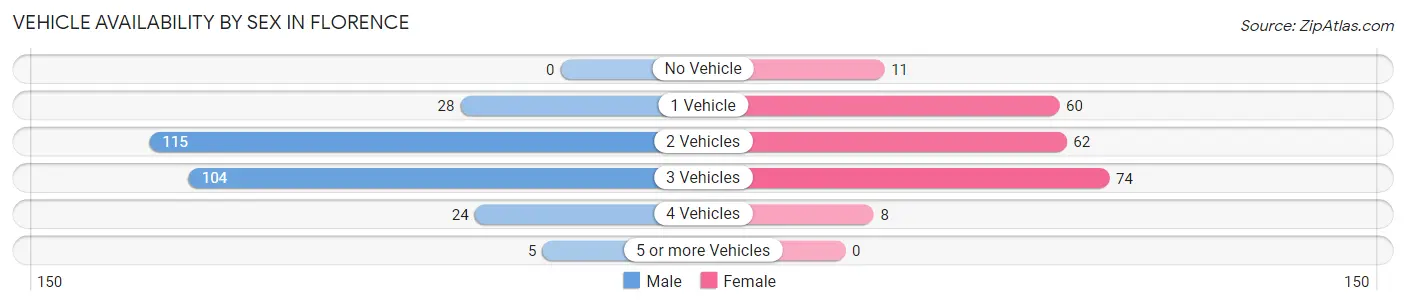
| Vehicles Available | Male | Female |
| No Vehicle | 0 (0.0%) | 11 (5.1%) |
| 1 Vehicle | 28 (10.1%) | 60 (27.9%) |
| 2 Vehicles | 115 (41.7%) | 62 (28.8%) |
| 3 Vehicles | 104 (37.7%) | 74 (34.4%) |
| 4 Vehicles | 24 (8.7%) | 8 (3.7%) |
| 5 or more Vehicles | 5 (1.8%) | 0 (0.0%) |
| Total | 276 (100.0%) | 215 (100.0%) |
Commute Time in Florence
The most frequently occuring commute durations in Florence are 30 to 34 minutes (132 commuters, 30.2%), 25 to 29 minutes (69 commuters, 15.8%), and 5 to 9 minutes (45 commuters, 10.3%).
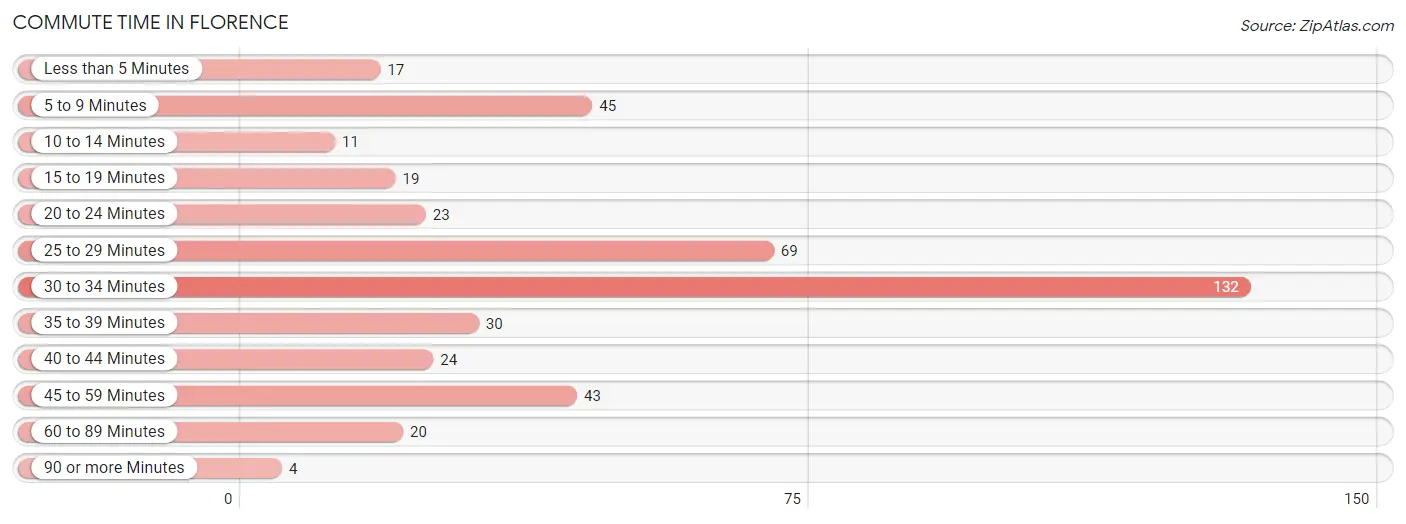
| Commute Time | # Commuters | % Commuters |
| Less than 5 Minutes | 17 | 3.9% |
| 5 to 9 Minutes | 45 | 10.3% |
| 10 to 14 Minutes | 11 | 2.5% |
| 15 to 19 Minutes | 19 | 4.3% |
| 20 to 24 Minutes | 23 | 5.3% |
| 25 to 29 Minutes | 69 | 15.8% |
| 30 to 34 Minutes | 132 | 30.2% |
| 35 to 39 Minutes | 30 | 6.9% |
| 40 to 44 Minutes | 24 | 5.5% |
| 45 to 59 Minutes | 43 | 9.8% |
| 60 to 89 Minutes | 20 | 4.6% |
| 90 or more Minutes | 4 | 0.9% |
Commute Time by Sex in Florence
The most common commute times in Florence are 30 to 34 minutes (105 commuters, 40.7%) for males and 25 to 29 minutes (61 commuters, 34.1%) for females.
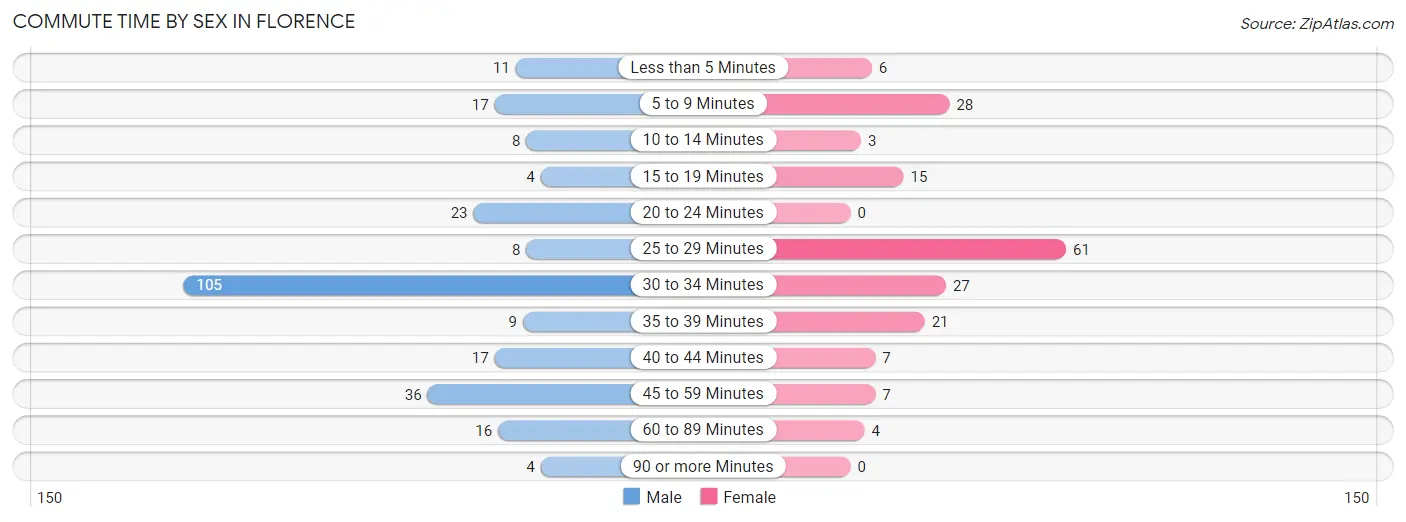
| Commute Time | Male | Female |
| Less than 5 Minutes | 11 (4.3%) | 6 (3.4%) |
| 5 to 9 Minutes | 17 (6.6%) | 28 (15.6%) |
| 10 to 14 Minutes | 8 (3.1%) | 3 (1.7%) |
| 15 to 19 Minutes | 4 (1.5%) | 15 (8.4%) |
| 20 to 24 Minutes | 23 (8.9%) | 0 (0.0%) |
| 25 to 29 Minutes | 8 (3.1%) | 61 (34.1%) |
| 30 to 34 Minutes | 105 (40.7%) | 27 (15.1%) |
| 35 to 39 Minutes | 9 (3.5%) | 21 (11.7%) |
| 40 to 44 Minutes | 17 (6.6%) | 7 (3.9%) |
| 45 to 59 Minutes | 36 (14.0%) | 7 (3.9%) |
| 60 to 89 Minutes | 16 (6.2%) | 4 (2.2%) |
| 90 or more Minutes | 4 (1.5%) | 0 (0.0%) |
Time of Departure to Work by Sex in Florence
The most frequent times of departure to work in Florence are 7:00 AM to 7:29 AM (66, 25.6%) for males and 7:00 AM to 7:29 AM (49, 27.4%) for females.
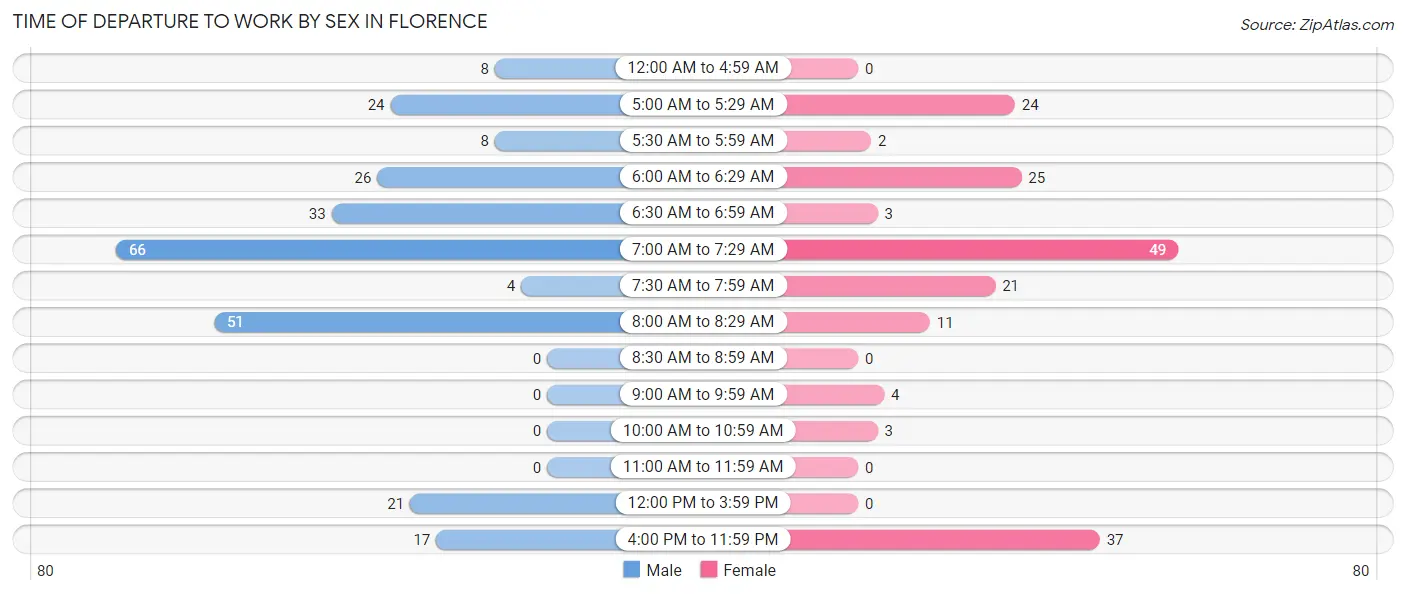
| Time of Departure | Male | Female |
| 12:00 AM to 4:59 AM | 8 (3.1%) | 0 (0.0%) |
| 5:00 AM to 5:29 AM | 24 (9.3%) | 24 (13.4%) |
| 5:30 AM to 5:59 AM | 8 (3.1%) | 2 (1.1%) |
| 6:00 AM to 6:29 AM | 26 (10.1%) | 25 (14.0%) |
| 6:30 AM to 6:59 AM | 33 (12.8%) | 3 (1.7%) |
| 7:00 AM to 7:29 AM | 66 (25.6%) | 49 (27.4%) |
| 7:30 AM to 7:59 AM | 4 (1.5%) | 21 (11.7%) |
| 8:00 AM to 8:29 AM | 51 (19.8%) | 11 (6.1%) |
| 8:30 AM to 8:59 AM | 0 (0.0%) | 0 (0.0%) |
| 9:00 AM to 9:59 AM | 0 (0.0%) | 4 (2.2%) |
| 10:00 AM to 10:59 AM | 0 (0.0%) | 3 (1.7%) |
| 11:00 AM to 11:59 AM | 0 (0.0%) | 0 (0.0%) |
| 12:00 PM to 3:59 PM | 21 (8.1%) | 0 (0.0%) |
| 4:00 PM to 11:59 PM | 17 (6.6%) | 37 (20.7%) |
| Total | 258 (100.0%) | 179 (100.0%) |
Housing Occupancy in Florence
Occupancy by Ownership in Florence
Of the total 398 dwellings in Florence, owner-occupied units account for 234 (58.8%), while renter-occupied units make up 164 (41.2%).
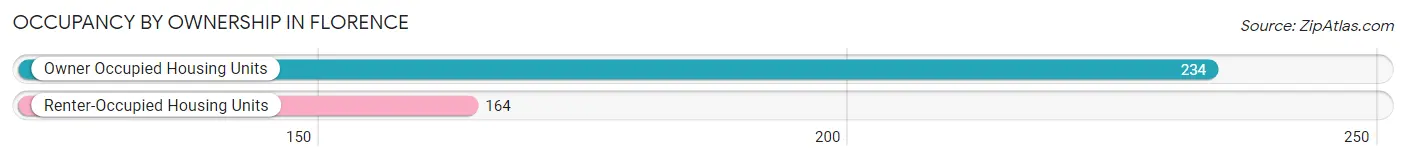
| Occupancy | # Housing Units | % Housing Units |
| Owner Occupied Housing Units | 234 | 58.8% |
| Renter-Occupied Housing Units | 164 | 41.2% |
| Total Occupied Housing Units | 398 | 100.0% |
Occupancy by Household Size in Florence
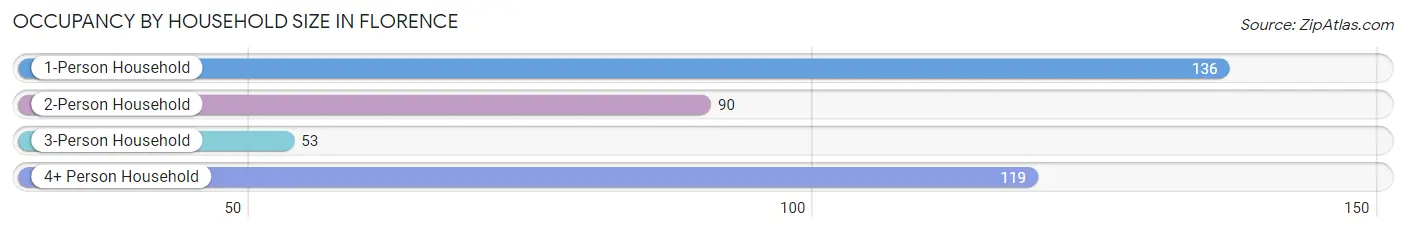
| Household Size | # Housing Units | % Housing Units |
| 1-Person Household | 136 | 34.2% |
| 2-Person Household | 90 | 22.6% |
| 3-Person Household | 53 | 13.3% |
| 4+ Person Household | 119 | 29.9% |
| Total Housing Units | 398 | 100.0% |
Occupancy by Ownership by Household Size in Florence
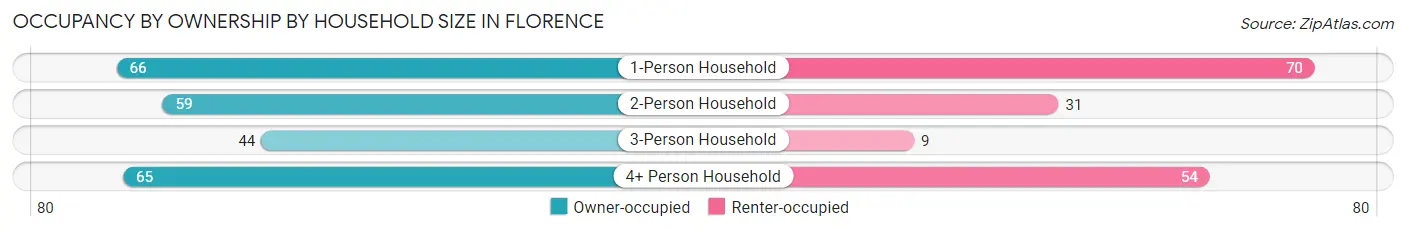
| Household Size | Owner-occupied | Renter-occupied |
| 1-Person Household | 66 (48.5%) | 70 (51.5%) |
| 2-Person Household | 59 (65.6%) | 31 (34.4%) |
| 3-Person Household | 44 (83.0%) | 9 (17.0%) |
| 4+ Person Household | 65 (54.6%) | 54 (45.4%) |
| Total Housing Units | 234 (58.8%) | 164 (41.2%) |
Occupancy by Educational Attainment in Florence
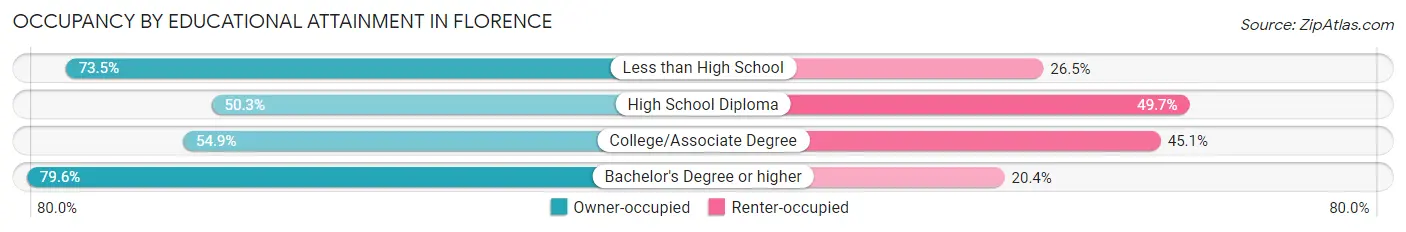
| Household Size | Owner-occupied | Renter-occupied |
| Less than High School | 36 (73.5%) | 13 (26.5%) |
| High School Diploma | 76 (50.3%) | 75 (49.7%) |
| College/Associate Degree | 79 (54.9%) | 65 (45.1%) |
| Bachelor's Degree or higher | 43 (79.6%) | 11 (20.4%) |
Occupancy by Age of Householder in Florence
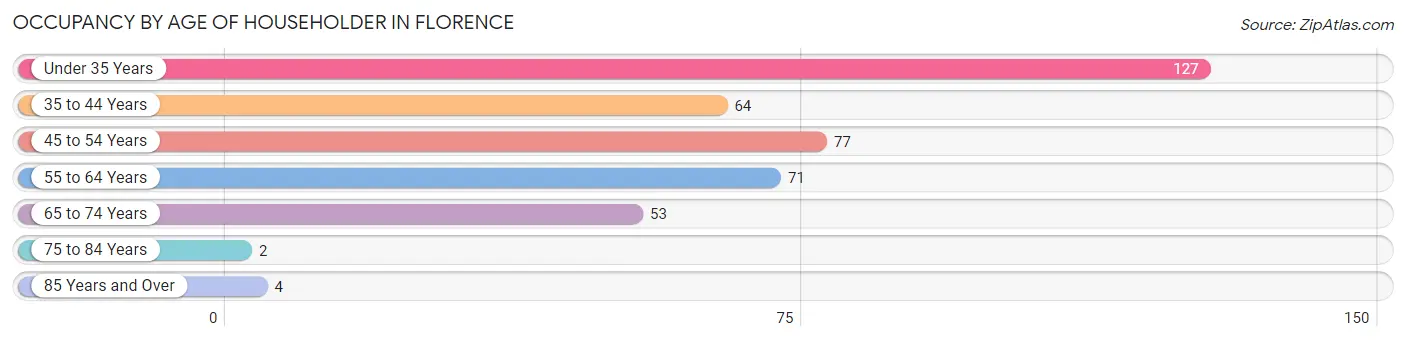
| Age Bracket | # Households | % Households |
| Under 35 Years | 127 | 31.9% |
| 35 to 44 Years | 64 | 16.1% |
| 45 to 54 Years | 77 | 19.4% |
| 55 to 64 Years | 71 | 17.8% |
| 65 to 74 Years | 53 | 13.3% |
| 75 to 84 Years | 2 | 0.5% |
| 85 Years and Over | 4 | 1.0% |
| Total | 398 | 100.0% |
Housing Finances in Florence
Median Income by Occupancy in Florence
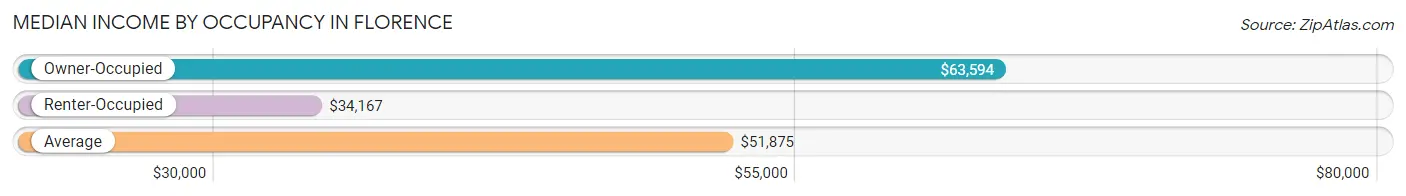
| Occupancy Type | # Households | Median Income |
| Owner-Occupied | 234 (58.8%) | $63,594 |
| Renter-Occupied | 164 (41.2%) | $34,167 |
| Average | 398 (100.0%) | $51,875 |
Occupancy by Householder Income Bracket in Florence
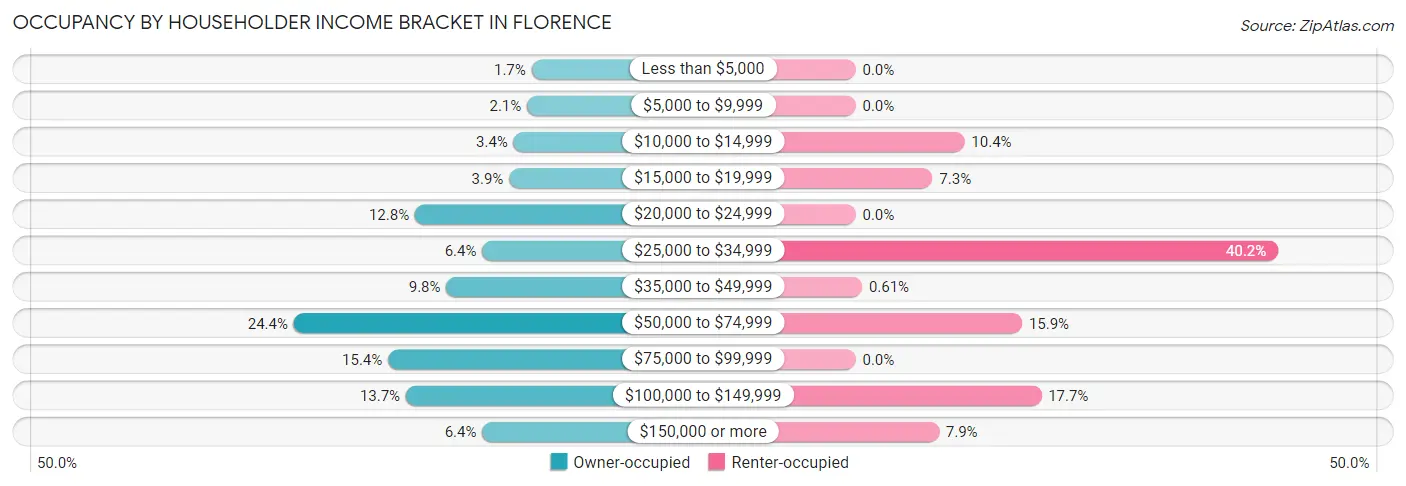
| Income Bracket | Owner-occupied | Renter-occupied |
| Less than $5,000 | 4 (1.7%) | 0 (0.0%) |
| $5,000 to $9,999 | 5 (2.1%) | 0 (0.0%) |
| $10,000 to $14,999 | 8 (3.4%) | 17 (10.4%) |
| $15,000 to $19,999 | 9 (3.8%) | 12 (7.3%) |
| $20,000 to $24,999 | 30 (12.8%) | 0 (0.0%) |
| $25,000 to $34,999 | 15 (6.4%) | 66 (40.2%) |
| $35,000 to $49,999 | 23 (9.8%) | 1 (0.6%) |
| $50,000 to $74,999 | 57 (24.4%) | 26 (15.9%) |
| $75,000 to $99,999 | 36 (15.4%) | 0 (0.0%) |
| $100,000 to $149,999 | 32 (13.7%) | 29 (17.7%) |
| $150,000 or more | 15 (6.4%) | 13 (7.9%) |
| Total | 234 (100.0%) | 164 (100.0%) |
Monthly Housing Cost Tiers in Florence
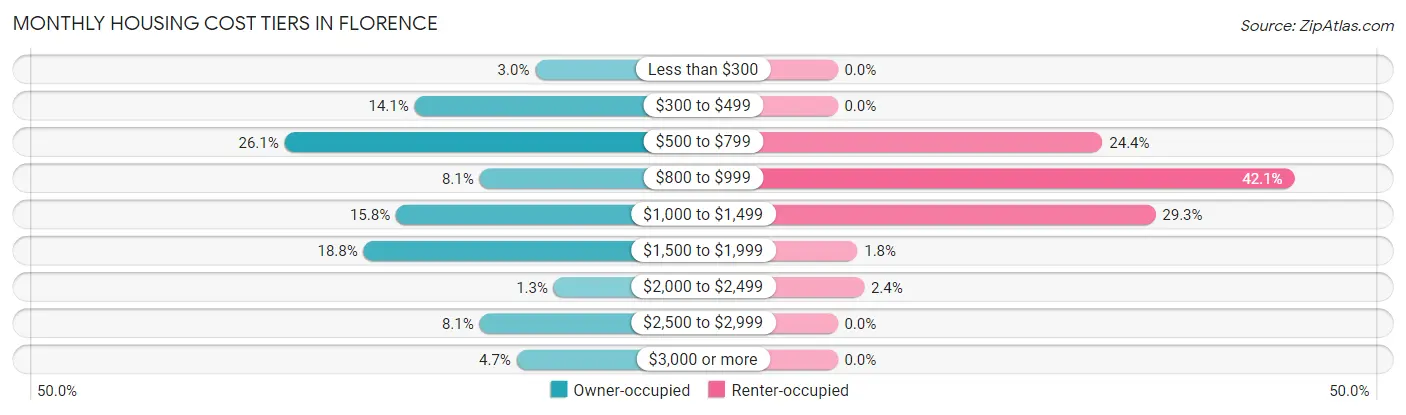
| Monthly Cost | Owner-occupied | Renter-occupied |
| Less than $300 | 7 (3.0%) | 0 (0.0%) |
| $300 to $499 | 33 (14.1%) | 0 (0.0%) |
| $500 to $799 | 61 (26.1%) | 40 (24.4%) |
| $800 to $999 | 19 (8.1%) | 69 (42.1%) |
| $1,000 to $1,499 | 37 (15.8%) | 48 (29.3%) |
| $1,500 to $1,999 | 44 (18.8%) | 3 (1.8%) |
| $2,000 to $2,499 | 3 (1.3%) | 4 (2.4%) |
| $2,500 to $2,999 | 19 (8.1%) | 0 (0.0%) |
| $3,000 or more | 11 (4.7%) | 0 (0.0%) |
| Total | 234 (100.0%) | 164 (100.0%) |
Physical Housing Characteristics in Florence
Housing Structures in Florence
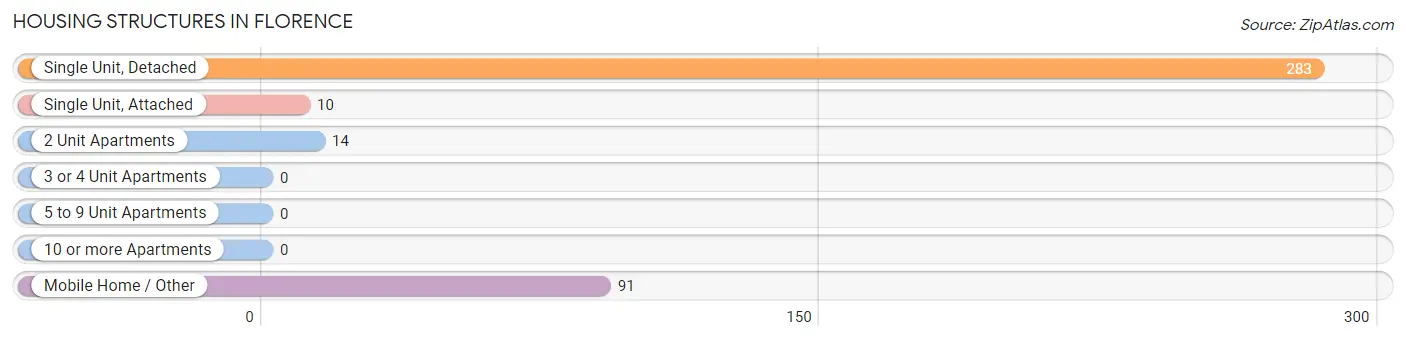
| Structure Type | # Housing Units | % Housing Units |
| Single Unit, Detached | 283 | 71.1% |
| Single Unit, Attached | 10 | 2.5% |
| 2 Unit Apartments | 14 | 3.5% |
| 3 or 4 Unit Apartments | 0 | 0.0% |
| 5 to 9 Unit Apartments | 0 | 0.0% |
| 10 or more Apartments | 0 | 0.0% |
| Mobile Home / Other | 91 | 22.9% |
| Total | 398 | 100.0% |
Housing Structures by Occupancy in Florence
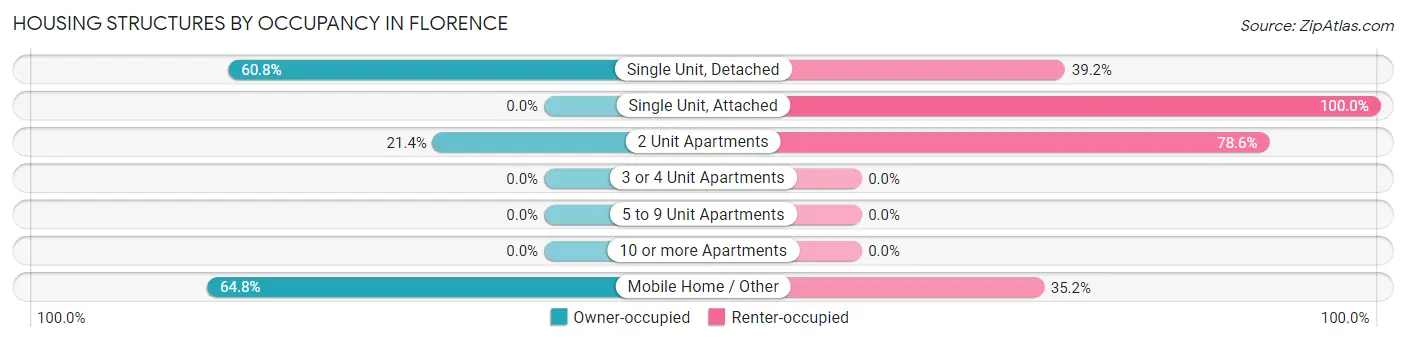
| Structure Type | Owner-occupied | Renter-occupied |
| Single Unit, Detached | 172 (60.8%) | 111 (39.2%) |
| Single Unit, Attached | 0 (0.0%) | 10 (100.0%) |
| 2 Unit Apartments | 3 (21.4%) | 11 (78.6%) |
| 3 or 4 Unit Apartments | 0 (0.0%) | 0 (0.0%) |
| 5 to 9 Unit Apartments | 0 (0.0%) | 0 (0.0%) |
| 10 or more Apartments | 0 (0.0%) | 0 (0.0%) |
| Mobile Home / Other | 59 (64.8%) | 32 (35.2%) |
| Total | 234 (58.8%) | 164 (41.2%) |
Housing Structures by Number of Rooms in Florence
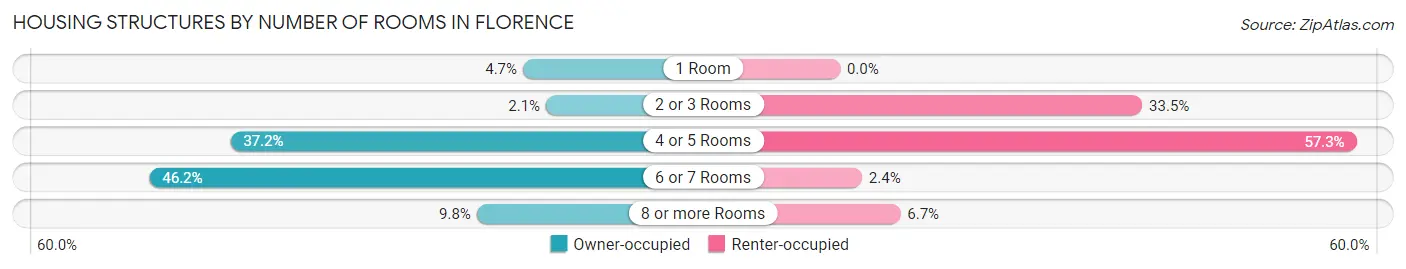
| Number of Rooms | Owner-occupied | Renter-occupied |
| 1 Room | 11 (4.7%) | 0 (0.0%) |
| 2 or 3 Rooms | 5 (2.1%) | 55 (33.5%) |
| 4 or 5 Rooms | 87 (37.2%) | 94 (57.3%) |
| 6 or 7 Rooms | 108 (46.2%) | 4 (2.4%) |
| 8 or more Rooms | 23 (9.8%) | 11 (6.7%) |
| Total | 234 (100.0%) | 164 (100.0%) |
Housing Structure by Heating Type in Florence
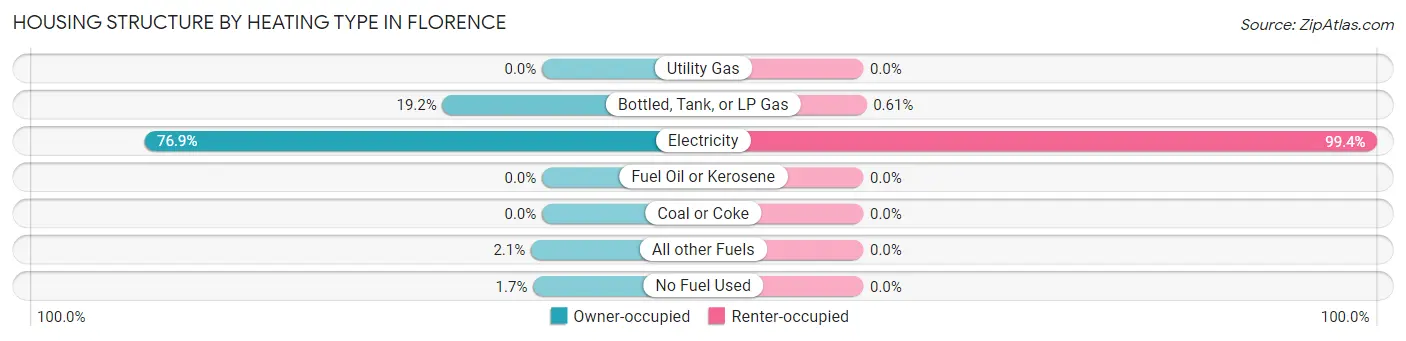
| Heating Type | Owner-occupied | Renter-occupied |
| Utility Gas | 0 (0.0%) | 0 (0.0%) |
| Bottled, Tank, or LP Gas | 45 (19.2%) | 1 (0.6%) |
| Electricity | 180 (76.9%) | 163 (99.4%) |
| Fuel Oil or Kerosene | 0 (0.0%) | 0 (0.0%) |
| Coal or Coke | 0 (0.0%) | 0 (0.0%) |
| All other Fuels | 5 (2.1%) | 0 (0.0%) |
| No Fuel Used | 4 (1.7%) | 0 (0.0%) |
| Total | 234 (100.0%) | 164 (100.0%) |
Household Vehicle Usage in Florence
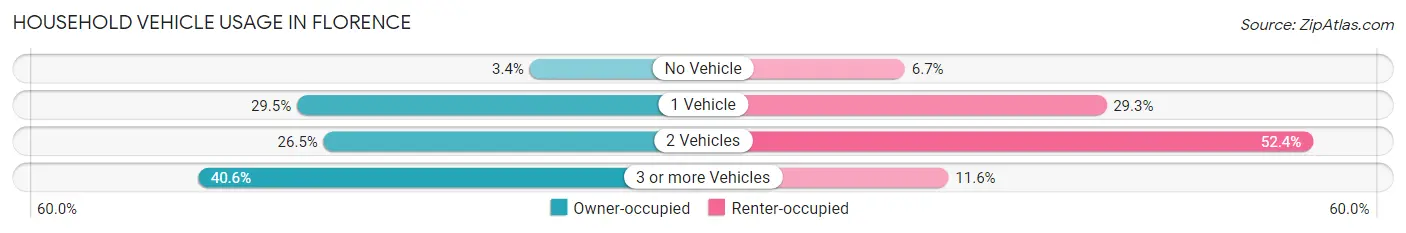
| Vehicles per Household | Owner-occupied | Renter-occupied |
| No Vehicle | 8 (3.4%) | 11 (6.7%) |
| 1 Vehicle | 69 (29.5%) | 48 (29.3%) |
| 2 Vehicles | 62 (26.5%) | 86 (52.4%) |
| 3 or more Vehicles | 95 (40.6%) | 19 (11.6%) |
| Total | 234 (100.0%) | 164 (100.0%) |
Real Estate & Mortgages in Florence
Real Estate and Mortgage Overview in Florence
| Characteristic | Without Mortgage | With Mortgage |
| Housing Units | 93 | 141 |
| Median Property Value | $111,900 | $172,100 |
| Median Household Income | - | - |
| Monthly Housing Costs | $543 | $11 |
| Real Estate Taxes | $1,238 | $9 |
Property Value by Mortgage Status in Florence
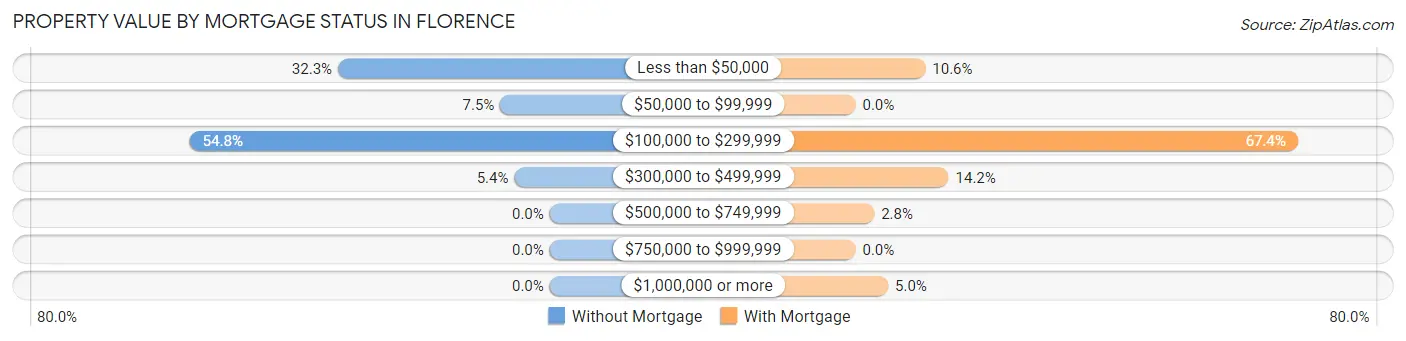
| Property Value | Without Mortgage | With Mortgage |
| Less than $50,000 | 30 (32.3%) | 15 (10.6%) |
| $50,000 to $99,999 | 7 (7.5%) | 0 (0.0%) |
| $100,000 to $299,999 | 51 (54.8%) | 95 (67.4%) |
| $300,000 to $499,999 | 5 (5.4%) | 20 (14.2%) |
| $500,000 to $749,999 | 0 (0.0%) | 4 (2.8%) |
| $750,000 to $999,999 | 0 (0.0%) | 0 (0.0%) |
| $1,000,000 or more | 0 (0.0%) | 7 (5.0%) |
| Total | 93 (100.0%) | 141 (100.0%) |
Household Income by Mortgage Status in Florence
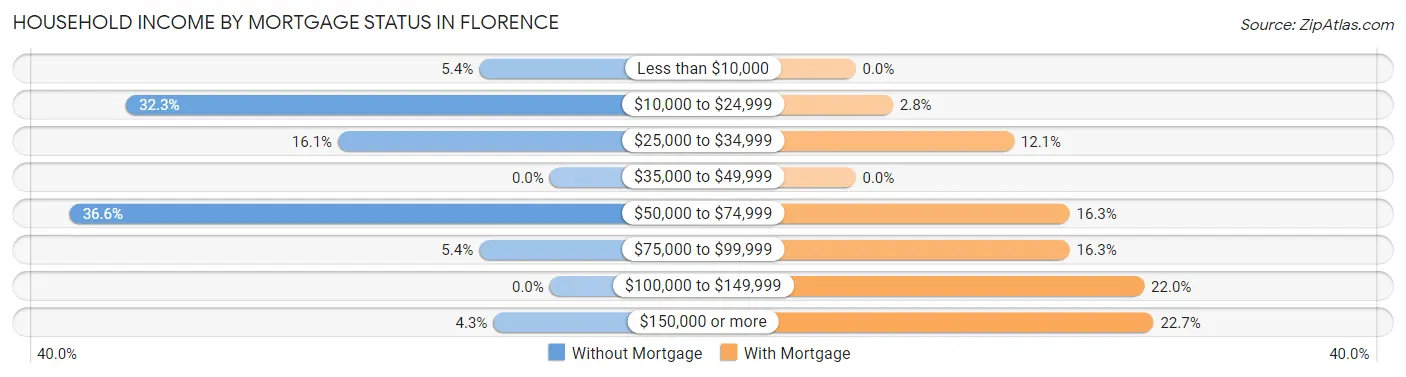
| Household Income | Without Mortgage | With Mortgage |
| Less than $10,000 | 5 (5.4%) | 0 (0.0%) |
| $10,000 to $24,999 | 30 (32.3%) | 4 (2.8%) |
| $25,000 to $34,999 | 15 (16.1%) | 17 (12.1%) |
| $35,000 to $49,999 | 0 (0.0%) | 0 (0.0%) |
| $50,000 to $74,999 | 34 (36.6%) | 23 (16.3%) |
| $75,000 to $99,999 | 5 (5.4%) | 23 (16.3%) |
| $100,000 to $149,999 | 0 (0.0%) | 31 (22.0%) |
| $150,000 or more | 4 (4.3%) | 32 (22.7%) |
| Total | 93 (100.0%) | 141 (100.0%) |
Property Value to Household Income Ratio in Florence
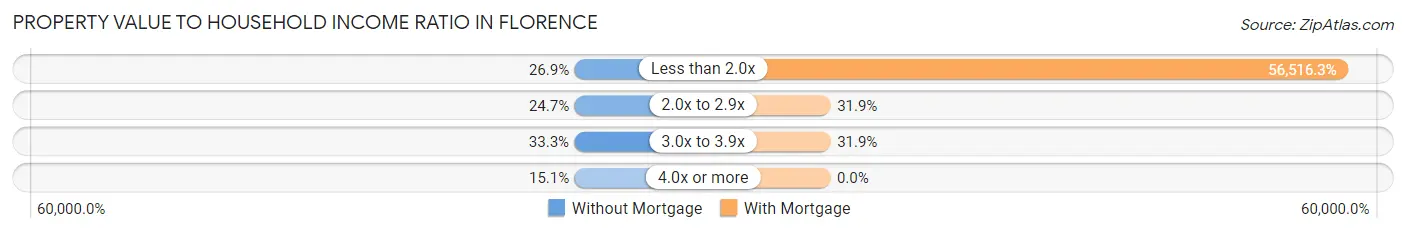
| Value-to-Income Ratio | Without Mortgage | With Mortgage |
| Less than 2.0x | 25 (26.9%) | 79,688 (56,516.3%) |
| 2.0x to 2.9x | 23 (24.7%) | 45 (31.9%) |
| 3.0x to 3.9x | 31 (33.3%) | 45 (31.9%) |
| 4.0x or more | 14 (15.0%) | 0 (0.0%) |
| Total | 93 (100.0%) | 141 (100.0%) |
Real Estate Taxes by Mortgage Status in Florence
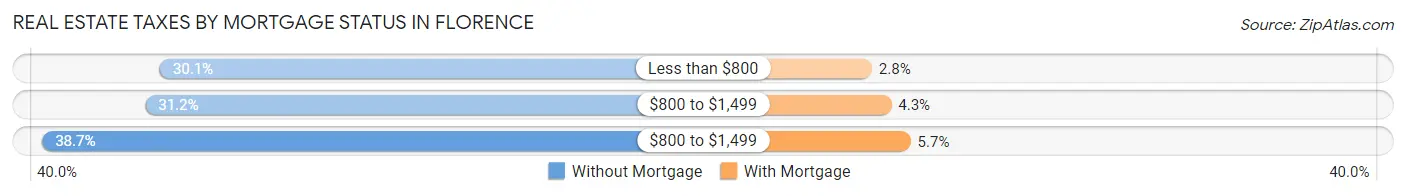
| Property Taxes | Without Mortgage | With Mortgage |
| Less than $800 | 28 (30.1%) | 4 (2.8%) |
| $800 to $1,499 | 29 (31.2%) | 6 (4.3%) |
| $800 to $1,499 | 36 (38.7%) | 8 (5.7%) |
| Total | 93 (100.0%) | 141 (100.0%) |
Health & Disability in Florence
Health Insurance Coverage by Age in Florence
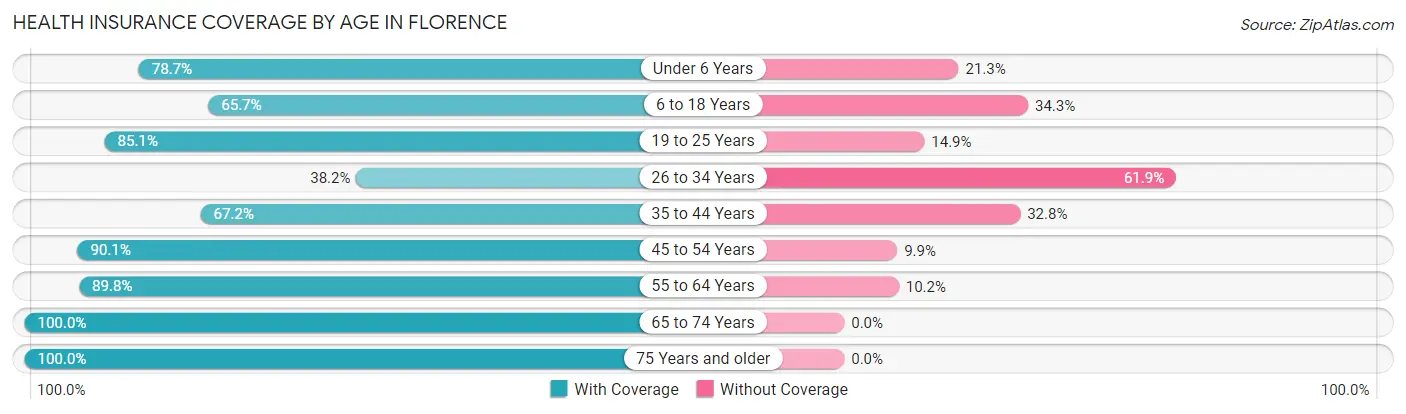
| Age Bracket | With Coverage | Without Coverage |
| Under 6 Years | 48 (78.7%) | 13 (21.3%) |
| 6 to 18 Years | 140 (65.7%) | 73 (34.3%) |
| 19 to 25 Years | 57 (85.1%) | 10 (14.9%) |
| 26 to 34 Years | 66 (38.2%) | 107 (61.9%) |
| 35 to 44 Years | 86 (67.2%) | 42 (32.8%) |
| 45 to 54 Years | 137 (90.1%) | 15 (9.9%) |
| 55 to 64 Years | 115 (89.8%) | 13 (10.2%) |
| 65 to 74 Years | 86 (100.0%) | 0 (0.0%) |
| 75 Years and older | 9 (100.0%) | 0 (0.0%) |
| Total | 744 (73.2%) | 273 (26.8%) |
Health Insurance Coverage by Citizenship Status in Florence
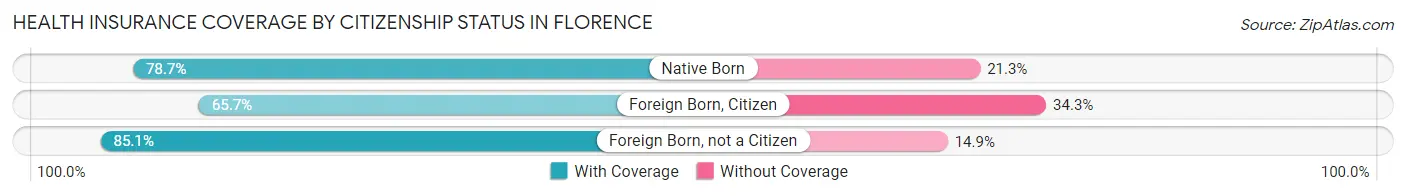
| Citizenship Status | With Coverage | Without Coverage |
| Native Born | 48 (78.7%) | 13 (21.3%) |
| Foreign Born, Citizen | 140 (65.7%) | 73 (34.3%) |
| Foreign Born, not a Citizen | 57 (85.1%) | 10 (14.9%) |
Health Insurance Coverage by Household Income in Florence
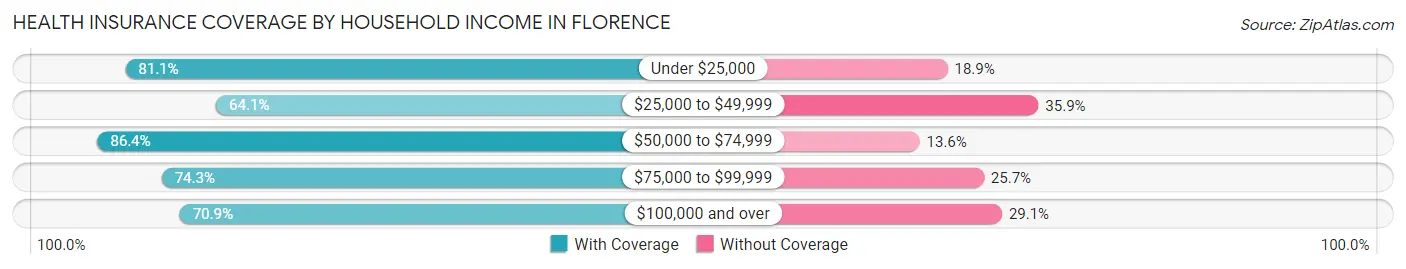
| Household Income | With Coverage | Without Coverage |
| Under $25,000 | 116 (81.1%) | 27 (18.9%) |
| $25,000 to $49,999 | 150 (64.1%) | 84 (35.9%) |
| $50,000 to $74,999 | 114 (86.4%) | 18 (13.6%) |
| $75,000 to $99,999 | 81 (74.3%) | 28 (25.7%) |
| $100,000 and over | 283 (70.9%) | 116 (29.1%) |
Public vs Private Health Insurance Coverage by Age in Florence
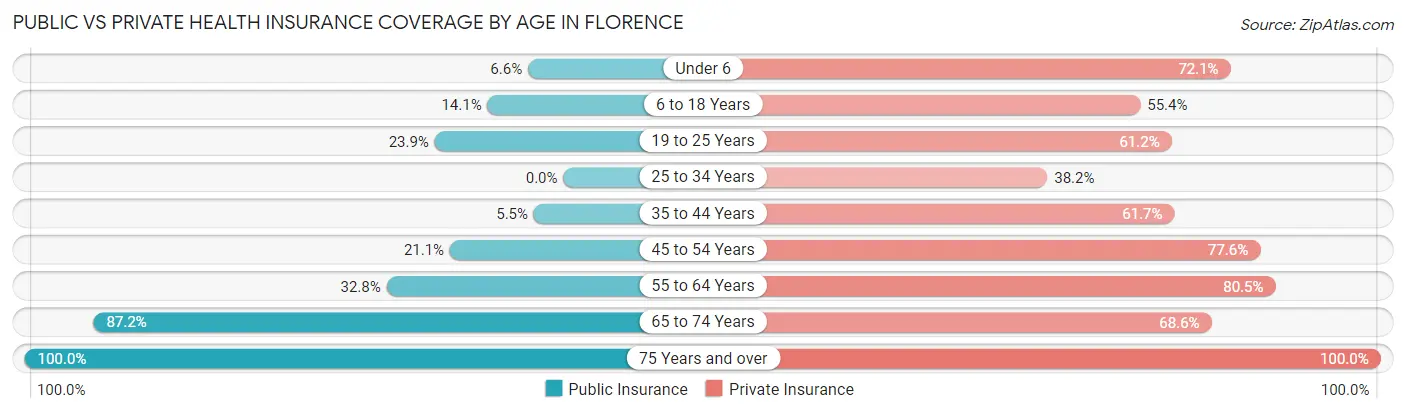
| Age Bracket | Public Insurance | Private Insurance |
| Under 6 | 4 (6.6%) | 44 (72.1%) |
| 6 to 18 Years | 30 (14.1%) | 118 (55.4%) |
| 19 to 25 Years | 16 (23.9%) | 41 (61.2%) |
| 25 to 34 Years | 0 (0.0%) | 66 (38.2%) |
| 35 to 44 Years | 7 (5.5%) | 79 (61.7%) |
| 45 to 54 Years | 32 (21.0%) | 118 (77.6%) |
| 55 to 64 Years | 42 (32.8%) | 103 (80.5%) |
| 65 to 74 Years | 75 (87.2%) | 59 (68.6%) |
| 75 Years and over | 9 (100.0%) | 9 (100.0%) |
| Total | 215 (21.1%) | 637 (62.6%) |
Disability Status by Sex by Age in Florence
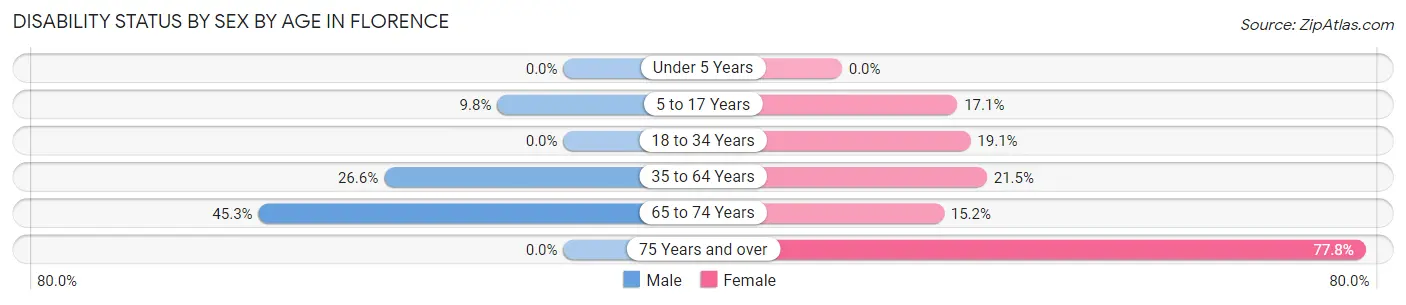
| Age Bracket | Male | Female |
| Under 5 Years | 0 (0.0%) | 0 (0.0%) |
| 5 to 17 Years | 11 (9.8%) | 12 (17.1%) |
| 18 to 34 Years | 0 (0.0%) | 17 (19.1%) |
| 35 to 64 Years | 53 (26.6%) | 45 (21.5%) |
| 65 to 74 Years | 24 (45.3%) | 5 (15.1%) |
| 75 Years and over | 0 (0.0%) | 7 (77.8%) |
Disability Class by Sex by Age in Florence
Disability Class: Hearing Difficulty
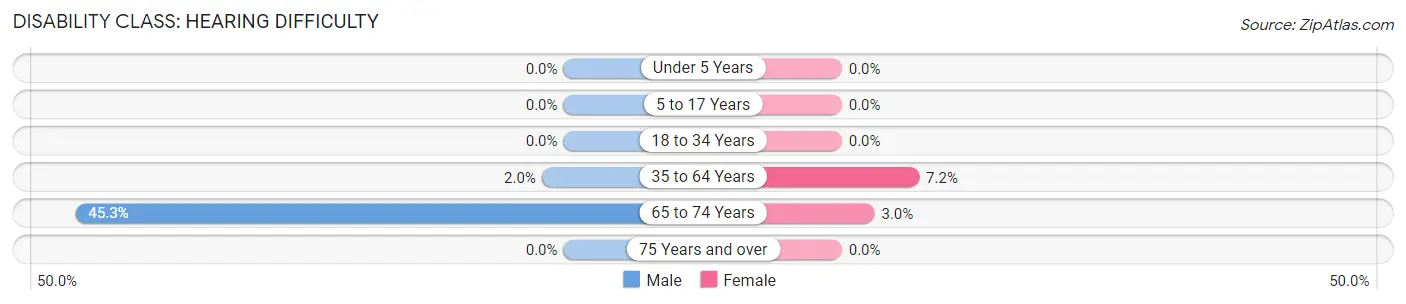
| Age Bracket | Male | Female |
| Under 5 Years | 0 (0.0%) | 0 (0.0%) |
| 5 to 17 Years | 0 (0.0%) | 0 (0.0%) |
| 18 to 34 Years | 0 (0.0%) | 0 (0.0%) |
| 35 to 64 Years | 4 (2.0%) | 15 (7.2%) |
| 65 to 74 Years | 24 (45.3%) | 1 (3.0%) |
| 75 Years and over | 0 (0.0%) | 0 (0.0%) |
Disability Class: Vision Difficulty
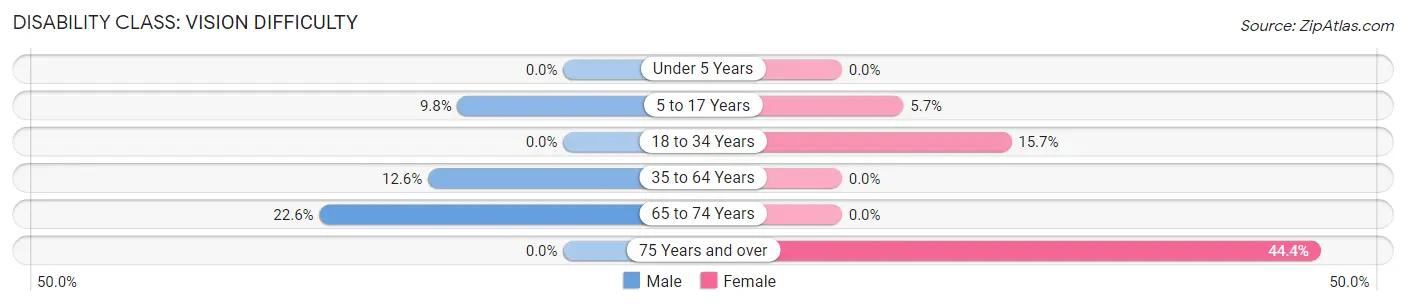
| Age Bracket | Male | Female |
| Under 5 Years | 0 (0.0%) | 0 (0.0%) |
| 5 to 17 Years | 11 (9.8%) | 4 (5.7%) |
| 18 to 34 Years | 0 (0.0%) | 14 (15.7%) |
| 35 to 64 Years | 25 (12.6%) | 0 (0.0%) |
| 65 to 74 Years | 12 (22.6%) | 0 (0.0%) |
| 75 Years and over | 0 (0.0%) | 4 (44.4%) |
Disability Class: Cognitive Difficulty
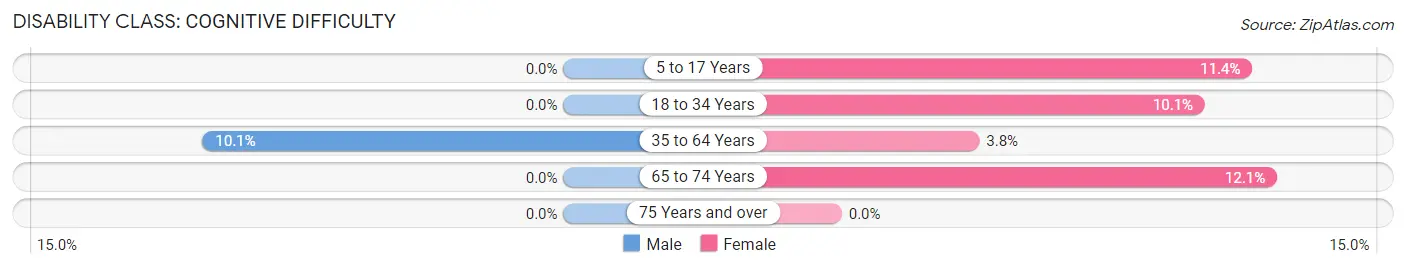
| Age Bracket | Male | Female |
| 5 to 17 Years | 0 (0.0%) | 8 (11.4%) |
| 18 to 34 Years | 0 (0.0%) | 9 (10.1%) |
| 35 to 64 Years | 20 (10.1%) | 8 (3.8%) |
| 65 to 74 Years | 0 (0.0%) | 4 (12.1%) |
| 75 Years and over | 0 (0.0%) | 0 (0.0%) |
Disability Class: Ambulatory Difficulty
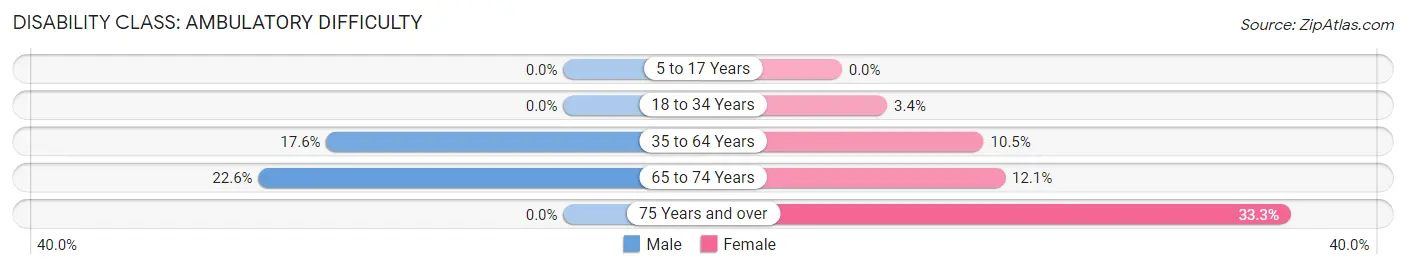
| Age Bracket | Male | Female |
| 5 to 17 Years | 0 (0.0%) | 0 (0.0%) |
| 18 to 34 Years | 0 (0.0%) | 3 (3.4%) |
| 35 to 64 Years | 35 (17.6%) | 22 (10.5%) |
| 65 to 74 Years | 12 (22.6%) | 4 (12.1%) |
| 75 Years and over | 0 (0.0%) | 3 (33.3%) |
Disability Class: Self-Care Difficulty
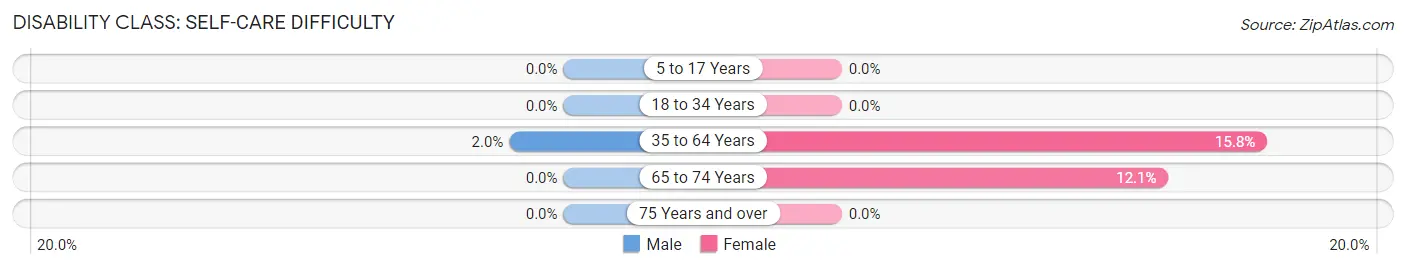
| Age Bracket | Male | Female |
| 5 to 17 Years | 0 (0.0%) | 0 (0.0%) |
| 18 to 34 Years | 0 (0.0%) | 0 (0.0%) |
| 35 to 64 Years | 4 (2.0%) | 33 (15.8%) |
| 65 to 74 Years | 0 (0.0%) | 4 (12.1%) |
| 75 Years and over | 0 (0.0%) | 0 (0.0%) |
Technology Access in Florence
Computing Device Access in Florence
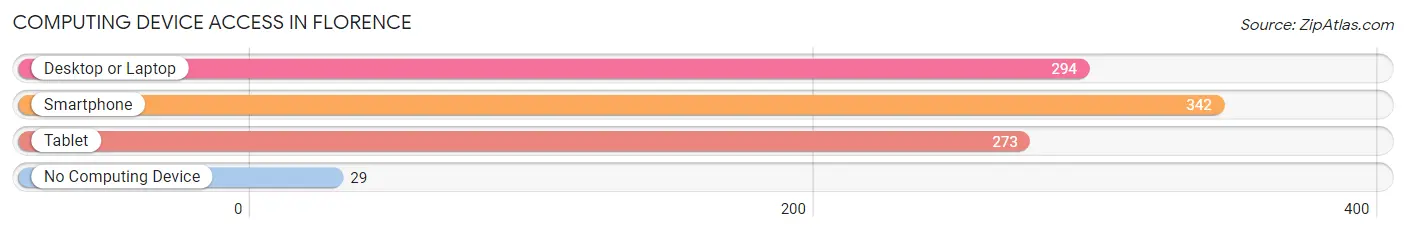
| Device Type | # Households | % Households |
| Desktop or Laptop | 294 | 73.9% |
| Smartphone | 342 | 85.9% |
| Tablet | 273 | 68.6% |
| No Computing Device | 29 | 7.3% |
| Total | 398 | 100.0% |
Internet Access in Florence
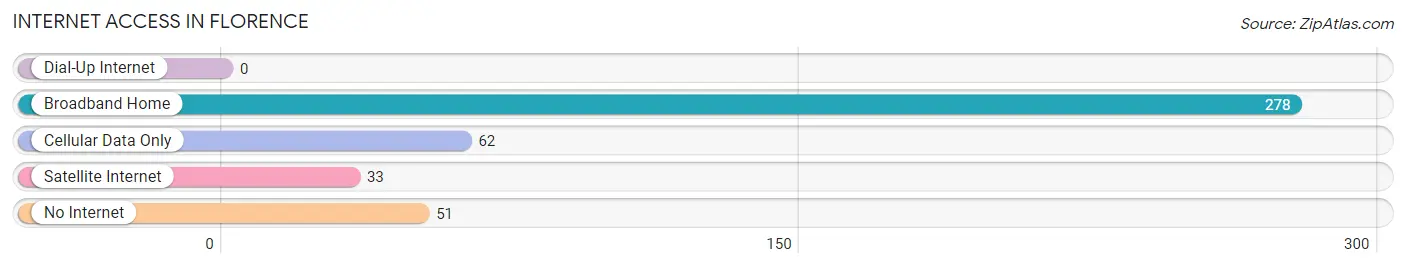
| Internet Type | # Households | % Households |
| Dial-Up Internet | 0 | 0.0% |
| Broadband Home | 278 | 69.9% |
| Cellular Data Only | 62 | 15.6% |
| Satellite Internet | 33 | 8.3% |
| No Internet | 51 | 12.8% |
| Total | 398 | 100.0% |
Florence Summary
Florence, Texas is a small town located in Williamson County, Texas, United States. It is situated about 25 miles north of Austin and is part of the Austin-Round Rock metropolitan area. The population of Florence was 1,097 at the 2010 census.
History
Florence was founded in 1846 by a group of settlers from Kentucky and Tennessee. The town was named after Florence, Alabama, the hometown of one of the settlers. The town was originally located on the banks of the San Gabriel River, but was moved to its current location in 1848.
The town was an important stop on the Chisholm Trail, and was the site of a major battle between the Texas Rangers and Comanche Indians in 1873. The town was also the site of a major battle between the Texas Rangers and the Ku Klux Klan in 1874.
Florence was incorporated in 1876 and has remained a small, rural community ever since. The town has a rich history of ranching and farming, and is still home to several large ranches.
Geography
Florence is located at 30°45'25" North, 97°45'25" West (30.756944, -97.756944). The town is situated on the banks of the San Gabriel River, about 25 miles north of Austin.
The town has a total area of 1.2 square miles, all of which is land. The terrain is mostly flat, with some rolling hills.
Economy
The economy of Florence is largely based on agriculture and ranching. The town is home to several large ranches, and the surrounding area is home to many smaller farms and ranches.
The town also has a small retail sector with several small stores and restaurants
Demographics
As of the 2010 census, there were 1,097 people, 441 households, and 298 families residing in Florence. The population density was 908.3 people per square mile. The racial makeup of the town was 87.2% White, 0.7% African American, 0.2% Native American, 0.2% Asian, 0.1% Pacific Islander, 10.3% from other races, and 1.5% from two or more races. Hispanic or Latino of any race were 20.2% of the population.
There were 441 households, out of which 28.2% had children under the age of 18 living with them, 51.6% were married couples living together, 11.3% had a female householder with no husband present, and 32.7% were non-families. 28.2% of all households were made up of individuals, and 14.3% had someone living alone who was 65 years of age or older. The average household size was 2.48 and the average family size was 3.04.
In the town, the population was spread out, with 25.2% under the age of 18, 7.2% from 18 to 24, 24.2% from 25 to 44, 25.2% from 45 to 64, and 18.2% who were 65 years of age or older. The median age was 40 years. For every 100 females, there were 94.2 males. For every 100 females age 18 and over, there were 91.2 males.
The median income for a household in Florence was $37,500, and the median income for a family was $45,000. Males had a median income of $31,250 versus $25,000 for females. The per capita income for the town was $17,845. About 8.3% of families and 11.2% of the population were below the poverty line, including 14.3% of those under age 18 and 8.3% of those age 65 or over.
Common Questions
What is Per Capita Income in Florence?
Per Capita income in Florence is $31,902.
What is the Median Family Income in Florence?
Median Family Income in Florence is $61,250.
What is the Median Household income in Florence?
Median Household Income in Florence is $51,875.
What is Income or Wage Gap in Florence?
Income or Wage Gap in Florence is 7.6%.
Women in Florence earn 92.4 cents for every dollar earned by a man.
What is Inequality or Gini Index in Florence?
Inequality or Gini Index in Florence is 0.51.
What is the Total Population of Florence?
Total Population of Florence is 1,017.
What is the Total Male Population of Florence?
Total Male Population of Florence is 594.
What is the Total Female Population of Florence?
Total Female Population of Florence is 423.
What is the Ratio of Males per 100 Females in Florence?
There are 140.43 Males per 100 Females in Florence.
What is the Ratio of Females per 100 Males in Florence?
There are 71.21 Females per 100 Males in Florence.
What is the Median Population Age in Florence?
Median Population Age in Florence is 34.9 Years.
What is the Average Family Size in Florence
Average Family Size in Florence is 3.3 People.
What is the Average Household Size in Florence
Average Household Size in Florence is 2.6 People.
How Large is the Labor Force in Florence?
There are 520 People in the Labor Forcein in Florence.
What is the Percentage of People in the Labor Force in Florence?
64.0% of People are in the Labor Force in Florence.
What is the Unemployment Rate in Florence?
Unemployment Rate in Florence is 5.6%.