Flatonia, TX Map & Demographics
Flatonia Map
Flatonia Overview
$25,507
PER CAPITA INCOME
$70,893
AVG FAMILY INCOME
$66,477
AVG HOUSEHOLD INCOME
30.6%
WAGE / INCOME GAP [ % ]
69.4¢/ $1
WAGE / INCOME GAP [ $ ]
0.32
INEQUALITY / GINI INDEX
1,801
TOTAL POPULATION
1,018
MALE POPULATION
783
FEMALE POPULATION
130.01
MALES / 100 FEMALES
76.92
FEMALES / 100 MALES
40.4
MEDIAN AGE
3.7
AVG FAMILY SIZE
3.3
AVG HOUSEHOLD SIZE
793
LABOR FORCE [ PEOPLE ]
59.5%
PERCENT IN LABOR FORCE
0.3%
UNEMPLOYMENT RATE
Flatonia Zip Codes
Flatonia Area Codes
Income in Flatonia
Income Overview in Flatonia
Per Capita Income in Flatonia is $25,507, while median incomes of families and households are $70,893 and $66,477 respectively.
| Characteristic | Number | Measure |
| Per Capita Income | 1,801 | $25,507 |
| Median Family Income | 437 | $70,893 |
| Mean Family Income | 437 | $78,878 |
| Median Household Income | 535 | $66,477 |
| Mean Household Income | 535 | $76,467 |
| Income Deficit | 437 | $0 |
| Wage / Income Gap (%) | 1,801 | 30.64% |
| Wage / Income Gap ($) | 1,801 | 69.36¢ per $1 |
| Gini / Inequality Index | 1,801 | 0.32 |
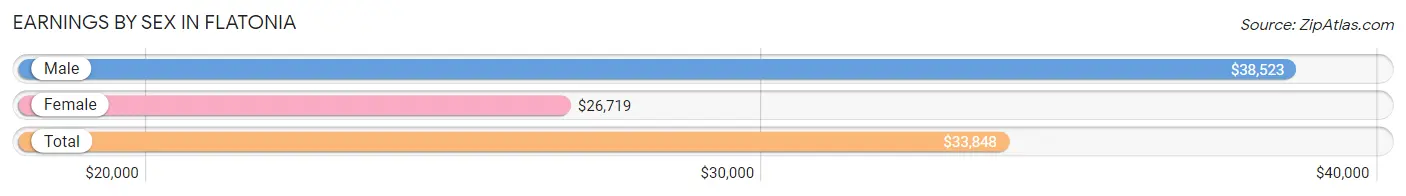
Earnings by Sex in Flatonia
Average Earnings in Flatonia are $33,848, $38,523 for men and $26,719 for women, a difference of 30.6%.
| Sex | Number | Average Earnings |
| Male | 533 (61.8%) | $38,523 |
| Female | 330 (38.2%) | $26,719 |
| Total | 863 (100.0%) | $33,848 |
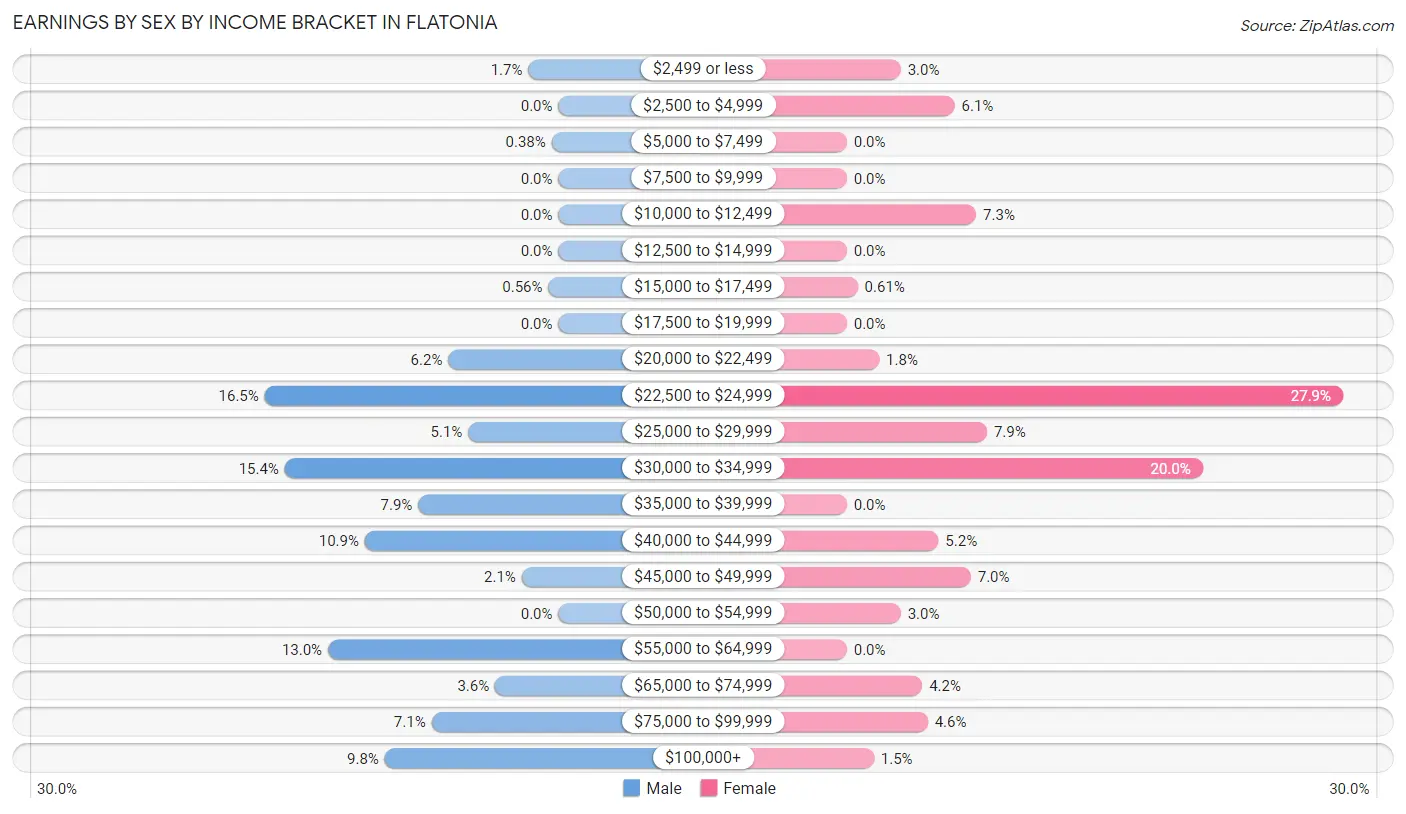
Earnings by Sex by Income Bracket in Flatonia
The most common earnings brackets in Flatonia are $22,500 to $24,999 for men (88 | 16.5%) and $22,500 to $24,999 for women (92 | 27.9%).
| Income | Male | Female |
| $2,499 or less | 9 (1.7%) | 10 (3.0%) |
| $2,500 to $4,999 | 0 (0.0%) | 20 (6.1%) |
| $5,000 to $7,499 | 2 (0.4%) | 0 (0.0%) |
| $7,500 to $9,999 | 0 (0.0%) | 0 (0.0%) |
| $10,000 to $12,499 | 0 (0.0%) | 24 (7.3%) |
| $12,500 to $14,999 | 0 (0.0%) | 0 (0.0%) |
| $15,000 to $17,499 | 3 (0.6%) | 2 (0.6%) |
| $17,500 to $19,999 | 0 (0.0%) | 0 (0.0%) |
| $20,000 to $22,499 | 33 (6.2%) | 6 (1.8%) |
| $22,500 to $24,999 | 88 (16.5%) | 92 (27.9%) |
| $25,000 to $29,999 | 27 (5.1%) | 26 (7.9%) |
| $30,000 to $34,999 | 82 (15.4%) | 66 (20.0%) |
| $35,000 to $39,999 | 42 (7.9%) | 0 (0.0%) |
| $40,000 to $44,999 | 58 (10.9%) | 17 (5.1%) |
| $45,000 to $49,999 | 11 (2.1%) | 23 (7.0%) |
| $50,000 to $54,999 | 0 (0.0%) | 10 (3.0%) |
| $55,000 to $64,999 | 69 (13.0%) | 0 (0.0%) |
| $65,000 to $74,999 | 19 (3.6%) | 14 (4.2%) |
| $75,000 to $99,999 | 38 (7.1%) | 15 (4.5%) |
| $100,000+ | 52 (9.8%) | 5 (1.5%) |
| Total | 533 (100.0%) | 330 (100.0%) |
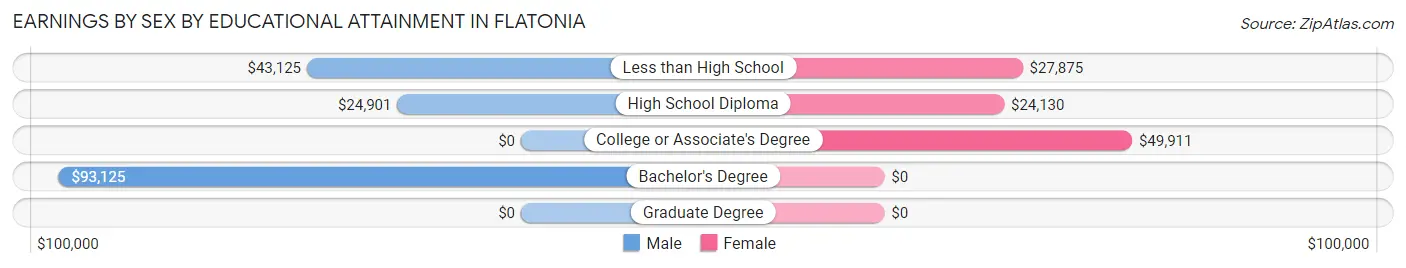
Earnings by Sex by Educational Attainment in Flatonia
Average earnings in Flatonia are $37,803 for men and $25,469 for women, a difference of 32.6%. Men with an educational attainment of bachelor's degree enjoy the highest average annual earnings of $93,125, while those with high school diploma education earn the least with $24,901. Women with an educational attainment of college or associate's degree earn the most with the average annual earnings of $49,911, while those with high school diploma education have the smallest earnings of $24,130.
| Educational Attainment | Male Income | Female Income |
| Less than High School | $43,125 | $27,875 |
| High School Diploma | $24,901 | $24,130 |
| College or Associate's Degree | - | - |
| Bachelor's Degree | $93,125 | $0 |
| Graduate Degree | - | - |
| Total | $37,803 | $25,469 |
Family Income in Flatonia
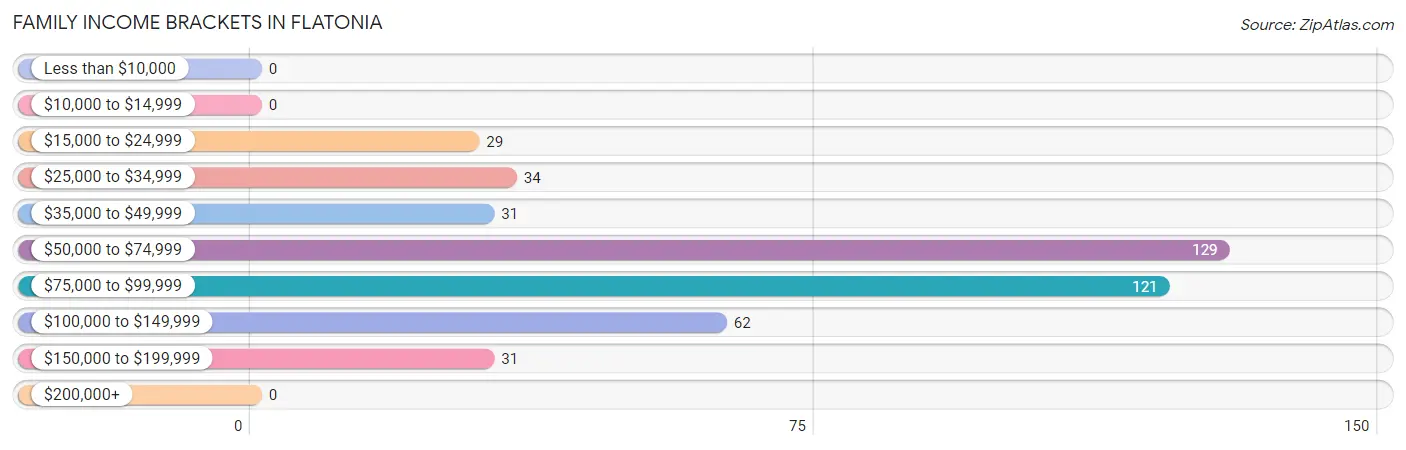
Family Income Brackets in Flatonia
According to the Flatonia family income data, there are 129 families falling into the $50,000 to $74,999 income range, which is the most common income bracket and makes up 29.5% of all families.
| Income Bracket | # Families | % Families |
| Less than $10,000 | 0 | 0.0% |
| $10,000 to $14,999 | 0 | 0.0% |
| $15,000 to $24,999 | 29 | 6.6% |
| $25,000 to $34,999 | 34 | 7.8% |
| $35,000 to $49,999 | 31 | 7.1% |
| $50,000 to $74,999 | 129 | 29.5% |
| $75,000 to $99,999 | 121 | 27.7% |
| $100,000 to $149,999 | 62 | 14.2% |
| $150,000 to $199,999 | 31 | 7.1% |
| $200,000+ | 0 | 0.0% |
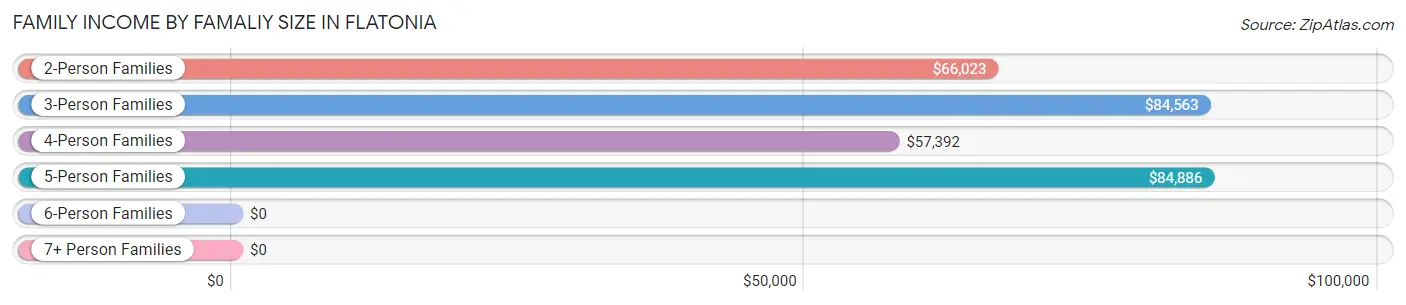
Family Income by Famaliy Size in Flatonia
5-person families (35 | 8.0%) account for the highest median family income in Flatonia with $84,886 per family, while 2-person families (205 | 46.9%) have the highest median income of $33,012 per family member.
| Income Bracket | # Families | Median Income |
| 2-Person Families | 205 (46.9%) | $66,023 |
| 3-Person Families | 67 (15.3%) | $84,563 |
| 4-Person Families | 111 (25.4%) | $57,392 |
| 5-Person Families | 35 (8.0%) | $84,886 |
| 6-Person Families | 19 (4.3%) | $0 |
| 7+ Person Families | 0 (0.0%) | $0 |
| Total | 437 (100.0%) | $70,893 |
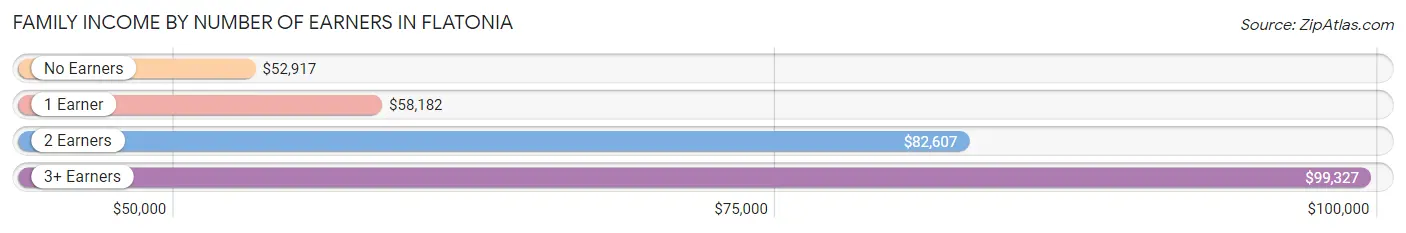
Family Income by Number of Earners in Flatonia
The median family income in Flatonia is $70,893, with families comprising 3+ earners (37) having the highest median family income of $99,327, while families with no earners (81) have the lowest median family income of $52,917, accounting for 8.5% and 18.5% of families, respectively.
| Number of Earners | # Families | Median Income |
| No Earners | 81 (18.5%) | $52,917 |
| 1 Earner | 104 (23.8%) | $58,182 |
| 2 Earners | 215 (49.2%) | $82,607 |
| 3+ Earners | 37 (8.5%) | $99,327 |
| Total | 437 (100.0%) | $70,893 |
Household Income in Flatonia
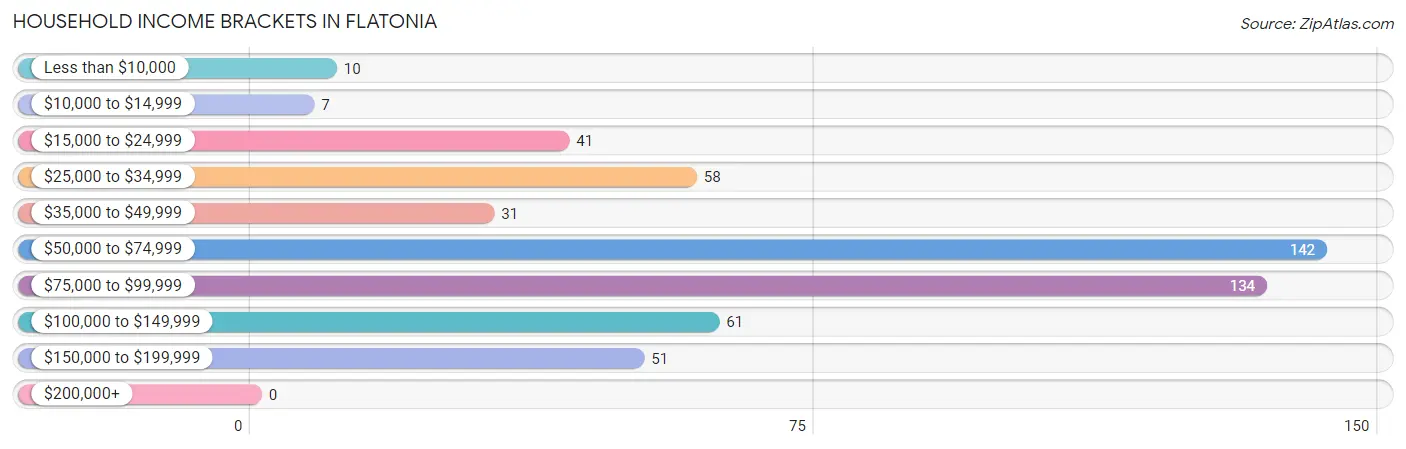
Household Income Brackets in Flatonia
With 142 households falling in the category, the $50,000 to $74,999 income range is the most frequent in Flatonia, accounting for 26.5% of all households.
| Income Bracket | # Households | % Households |
| Less than $10,000 | 10 | 1.9% |
| $10,000 to $14,999 | 7 | 1.3% |
| $15,000 to $24,999 | 41 | 7.7% |
| $25,000 to $34,999 | 58 | 10.8% |
| $35,000 to $49,999 | 31 | 5.8% |
| $50,000 to $74,999 | 142 | 26.5% |
| $75,000 to $99,999 | 134 | 25.0% |
| $100,000 to $149,999 | 61 | 11.4% |
| $150,000 to $199,999 | 51 | 9.5% |
| $200,000+ | 0 | 0.0% |
Household Income by Householder Age in Flatonia
The median household income in Flatonia is $66,477, with the highest median household income of $81,250 found in the 45 to 64 years age bracket for the primary householder. A total of 154 households (28.8%) fall into this category. Meanwhile, the 15 to 24 years age bracket for the primary householder has the lowest median household income of $0, with 6 households (1.1%) in this group.
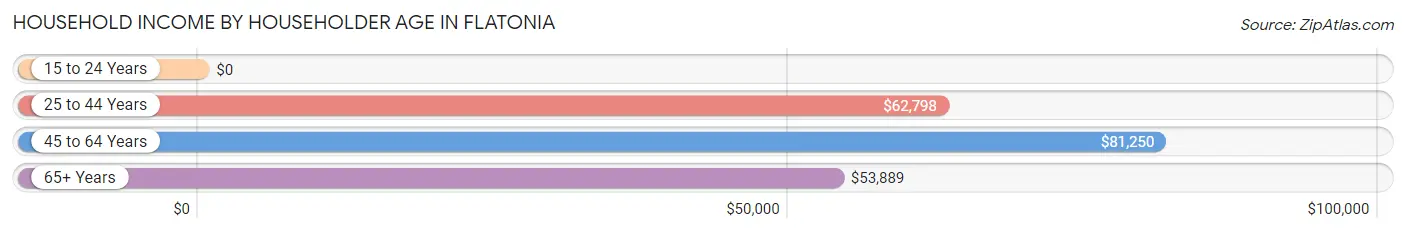
| Income Bracket | # Households | Median Income |
| 15 to 24 Years | 6 (1.1%) | $0 |
| 25 to 44 Years | 195 (36.4%) | $62,798 |
| 45 to 64 Years | 154 (28.8%) | $81,250 |
| 65+ Years | 180 (33.6%) | $53,889 |
| Total | 535 (100.0%) | $66,477 |
Poverty in Flatonia
Income Below Poverty by Sex and Age in Flatonia
With 4.5% poverty level for males and 7.6% for females among the residents of Flatonia, 12 to 14 year old males and 5 year old females are the most vulnerable to poverty, with 11 males (13.3%) and 18 females (100.0%) in their respective age groups living below the poverty level.
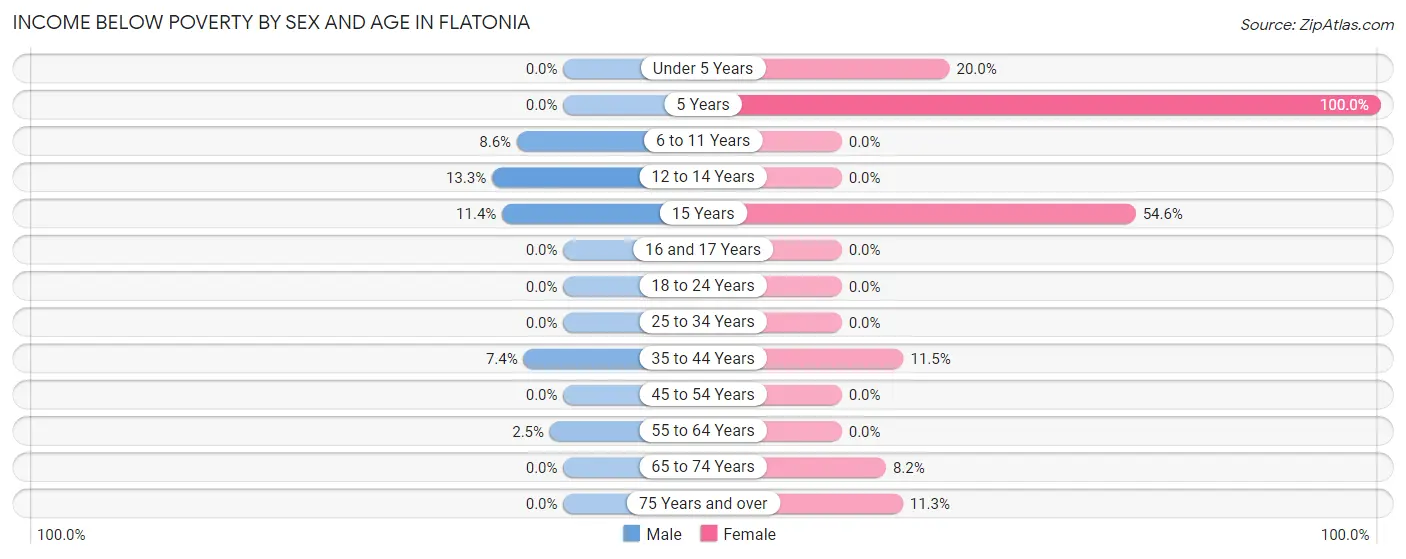
| Age Bracket | Male | Female |
| Under 5 Years | 0 (0.0%) | 5 (20.0%) |
| 5 Years | 0 (0.0%) | 18 (100.0%) |
| 6 to 11 Years | 5 (8.6%) | 0 (0.0%) |
| 12 to 14 Years | 11 (13.3%) | 0 (0.0%) |
| 15 Years | 10 (11.4%) | 6 (54.5%) |
| 16 and 17 Years | 0 (0.0%) | 0 (0.0%) |
| 18 to 24 Years | 0 (0.0%) | 0 (0.0%) |
| 25 to 34 Years | 0 (0.0%) | 0 (0.0%) |
| 35 to 44 Years | 17 (7.4%) | 11 (11.5%) |
| 45 to 54 Years | 0 (0.0%) | 0 (0.0%) |
| 55 to 64 Years | 3 (2.5%) | 0 (0.0%) |
| 65 to 74 Years | 0 (0.0%) | 10 (8.2%) |
| 75 Years and over | 0 (0.0%) | 6 (11.3%) |
| Total | 46 (4.5%) | 56 (7.6%) |
Income Above Poverty by Sex and Age in Flatonia
According to the poverty statistics in Flatonia, males aged under 5 years and females aged 6 to 11 years are the age groups that are most secure financially, with 100.0% of males and 100.0% of females in these age groups living above the poverty line.
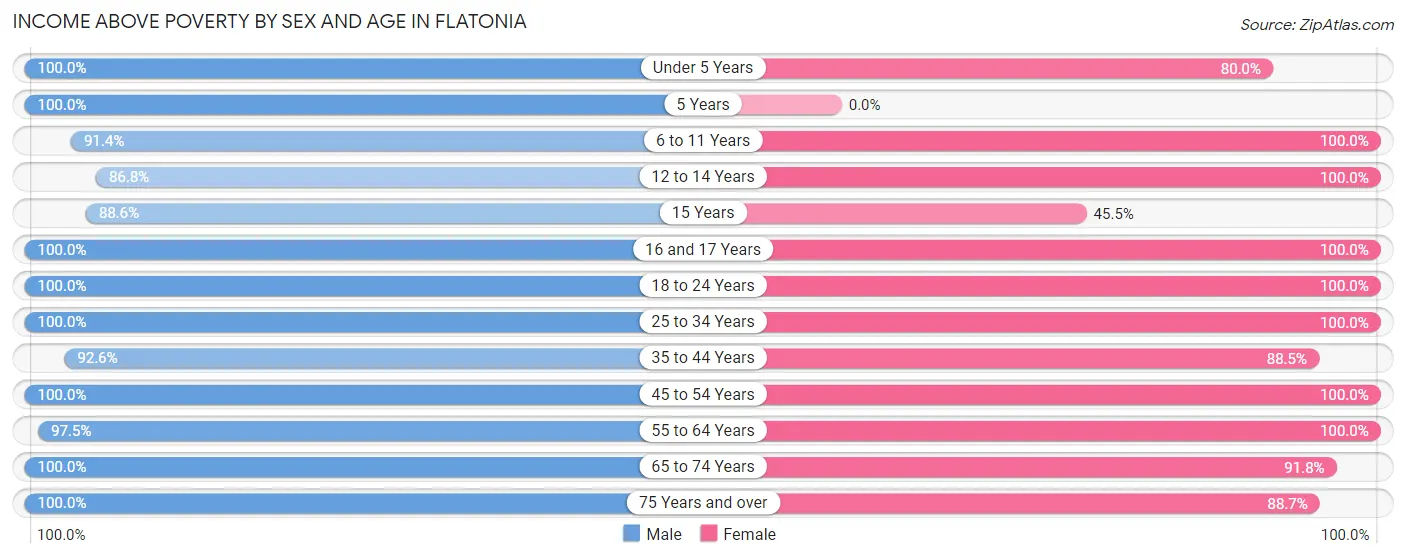
| Age Bracket | Male | Female |
| Under 5 Years | 55 (100.0%) | 20 (80.0%) |
| 5 Years | 9 (100.0%) | 0 (0.0%) |
| 6 to 11 Years | 53 (91.4%) | 106 (100.0%) |
| 12 to 14 Years | 72 (86.8%) | 16 (100.0%) |
| 15 Years | 78 (88.6%) | 5 (45.5%) |
| 16 and 17 Years | 57 (100.0%) | 15 (100.0%) |
| 18 to 24 Years | 48 (100.0%) | 30 (100.0%) |
| 25 to 34 Years | 49 (100.0%) | 30 (100.0%) |
| 35 to 44 Years | 213 (92.6%) | 85 (88.5%) |
| 45 to 54 Years | 84 (100.0%) | 152 (100.0%) |
| 55 to 64 Years | 117 (97.5%) | 67 (100.0%) |
| 65 to 74 Years | 66 (100.0%) | 112 (91.8%) |
| 75 Years and over | 71 (100.0%) | 47 (88.7%) |
| Total | 972 (95.5%) | 685 (92.4%) |
Income Below Poverty Among Married-Couple Families in Flatonia
The poverty statistics for married-couple families in Flatonia show that 2.9% or 11 of the total 375 families live below the poverty line. Families with 3 or 4 children have the highest poverty rate of 57.9%, comprising of 11 families. On the other hand, families with no children have the lowest poverty rate of 0.0%, which includes 0 families.
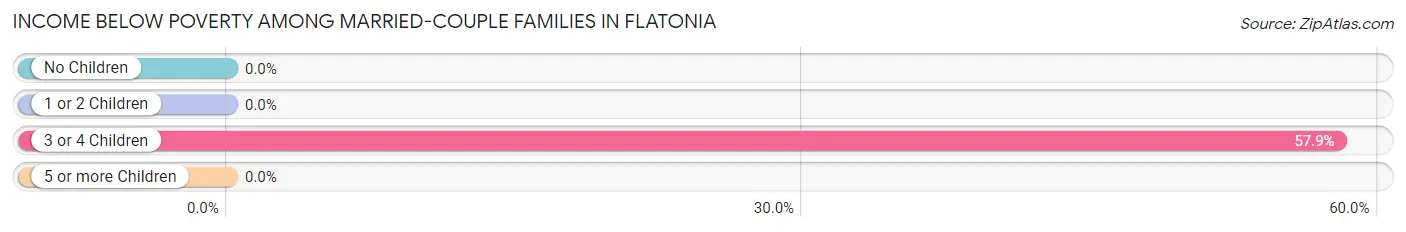
| Children | Above Poverty | Below Poverty |
| No Children | 187 (100.0%) | 0 (0.0%) |
| 1 or 2 Children | 169 (100.0%) | 0 (0.0%) |
| 3 or 4 Children | 8 (42.1%) | 11 (57.9%) |
| 5 or more Children | 0 (0.0%) | 0 (0.0%) |
| Total | 364 (97.1%) | 11 (2.9%) |
Income Below Poverty Among Single-Parent Households in Flatonia
| Children | Single Father | Single Mother |
| No Children | 0 (0.0%) | 0 (0.0%) |
| 1 or 2 Children | 0 (0.0%) | 0 (0.0%) |
| 3 or 4 Children | 0 (0.0%) | 0 (0.0%) |
| 5 or more Children | 0 (0.0%) | 0 (0.0%) |
| Total | 0 (0.0%) | 0 (0.0%) |
Income Below Poverty Among Married-Couple vs Single-Parent Households in Flatonia
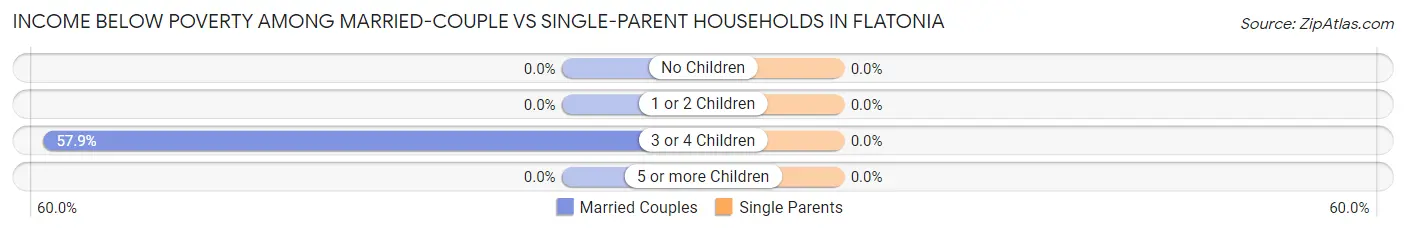
| Children | Married-Couple Families | Single-Parent Households |
| No Children | 0 (0.0%) | 0 (0.0%) |
| 1 or 2 Children | 0 (0.0%) | 0 (0.0%) |
| 3 or 4 Children | 11 (57.9%) | 0 (0.0%) |
| 5 or more Children | 0 (0.0%) | 0 (0.0%) |
| Total | 11 (2.9%) | 0 (0.0%) |
Race in Flatonia
The most populous races in Flatonia are White / Caucasian (1,314 | 73.0%), Hispanic or Latino (1,050 | 58.3%), and Some other Race (339 | 18.8%).
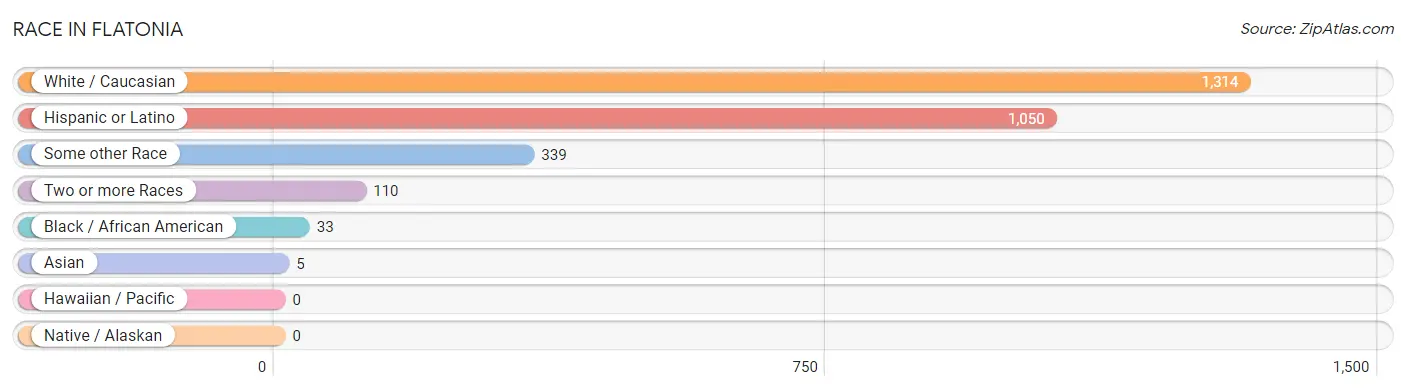
| Race | # Population | % Population |
| Asian | 5 | 0.3% |
| Black / African American | 33 | 1.8% |
| Hawaiian / Pacific | 0 | 0.0% |
| Hispanic or Latino | 1,050 | 58.3% |
| Native / Alaskan | 0 | 0.0% |
| White / Caucasian | 1,314 | 73.0% |
| Two or more Races | 110 | 6.1% |
| Some other Race | 339 | 18.8% |
| Total | 1,801 | 100.0% |
Ancestry in Flatonia
The most populous ancestries reported in Flatonia are Mexican (1,050 | 58.3%), German (233 | 12.9%), Czech (221 | 12.3%), Irish (101 | 5.6%), and English (64 | 3.5%), together accounting for 92.7% of all Flatonia residents.
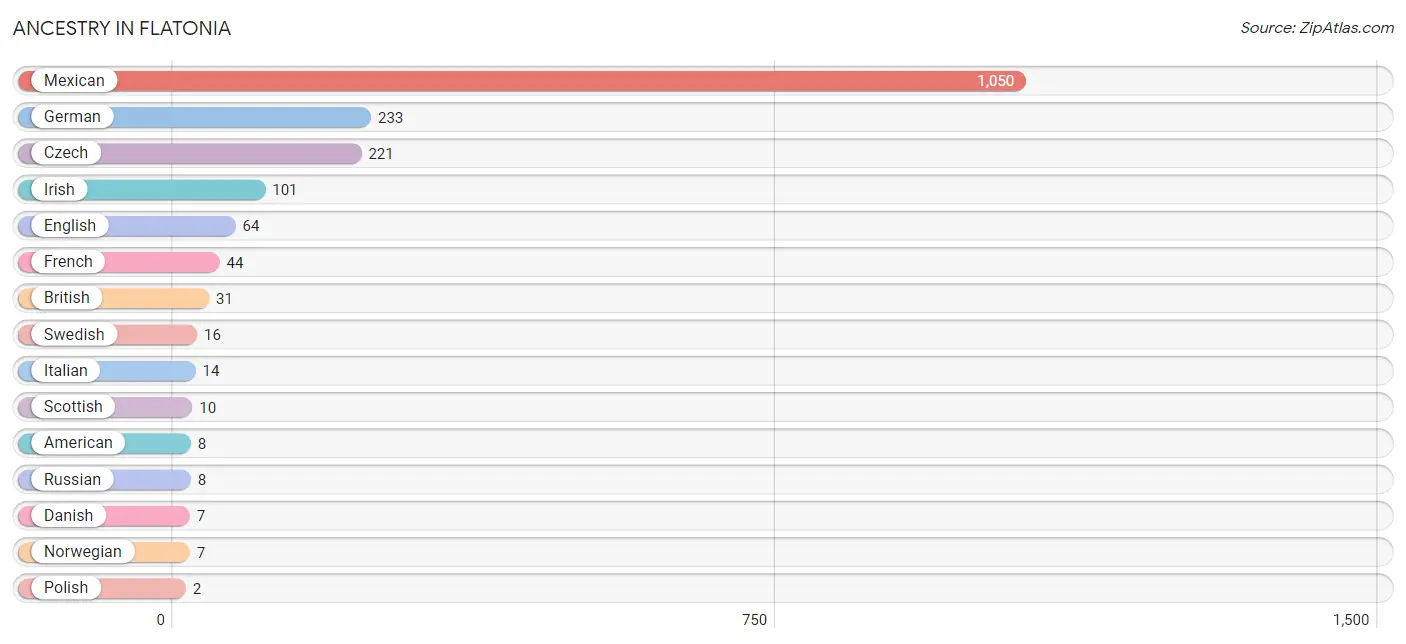
| Ancestry | # Population | % Population |
| American | 8 | 0.4% |
| British | 31 | 1.7% |
| Czech | 221 | 12.3% |
| Danish | 7 | 0.4% |
| English | 64 | 3.5% |
| French | 44 | 2.4% |
| German | 233 | 12.9% |
| Irish | 101 | 5.6% |
| Italian | 14 | 0.8% |
| Mexican | 1,050 | 58.3% |
| Norwegian | 7 | 0.4% |
| Polish | 2 | 0.1% |
| Russian | 8 | 0.4% |
| Scottish | 10 | 0.6% |
| Swedish | 16 | 0.9% | View All 15 Rows |
Immigrants in Flatonia
The most numerous immigrant groups reported in Flatonia came from Central America (344 | 19.1%), Latin America (344 | 19.1%), Mexico (344 | 19.1%), Asia (3 | 0.2%), and Pakistan (3 | 0.2%), together accounting for 57.6% of all Flatonia residents.
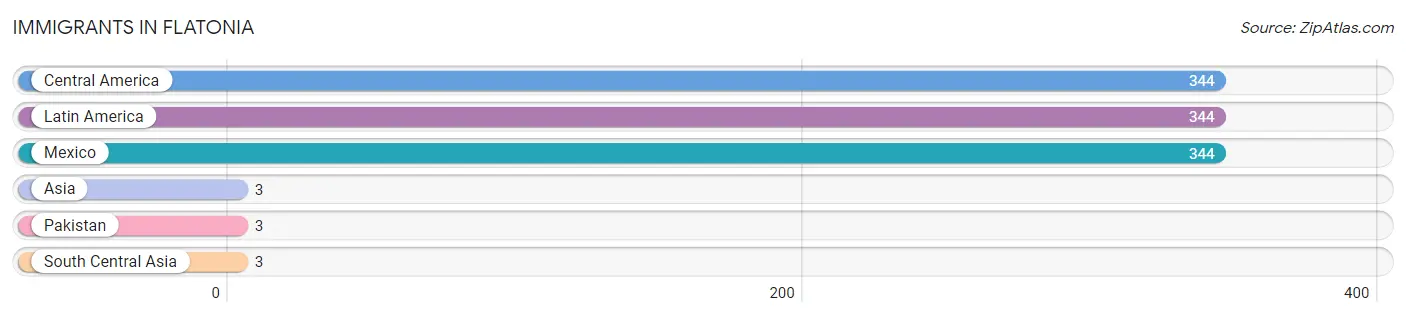
| Immigration Origin | # Population | % Population |
| Asia | 3 | 0.2% |
| Central America | 344 | 19.1% |
| Latin America | 344 | 19.1% |
| Mexico | 344 | 19.1% |
| Pakistan | 3 | 0.2% |
| South Central Asia | 3 | 0.2% | View All 6 Rows |
Sex and Age in Flatonia
Sex and Age in Flatonia
The most populous age groups in Flatonia are 15 to 19 Years (185 | 18.2%) for men and 45 to 49 Years (116 | 14.8%) for women.
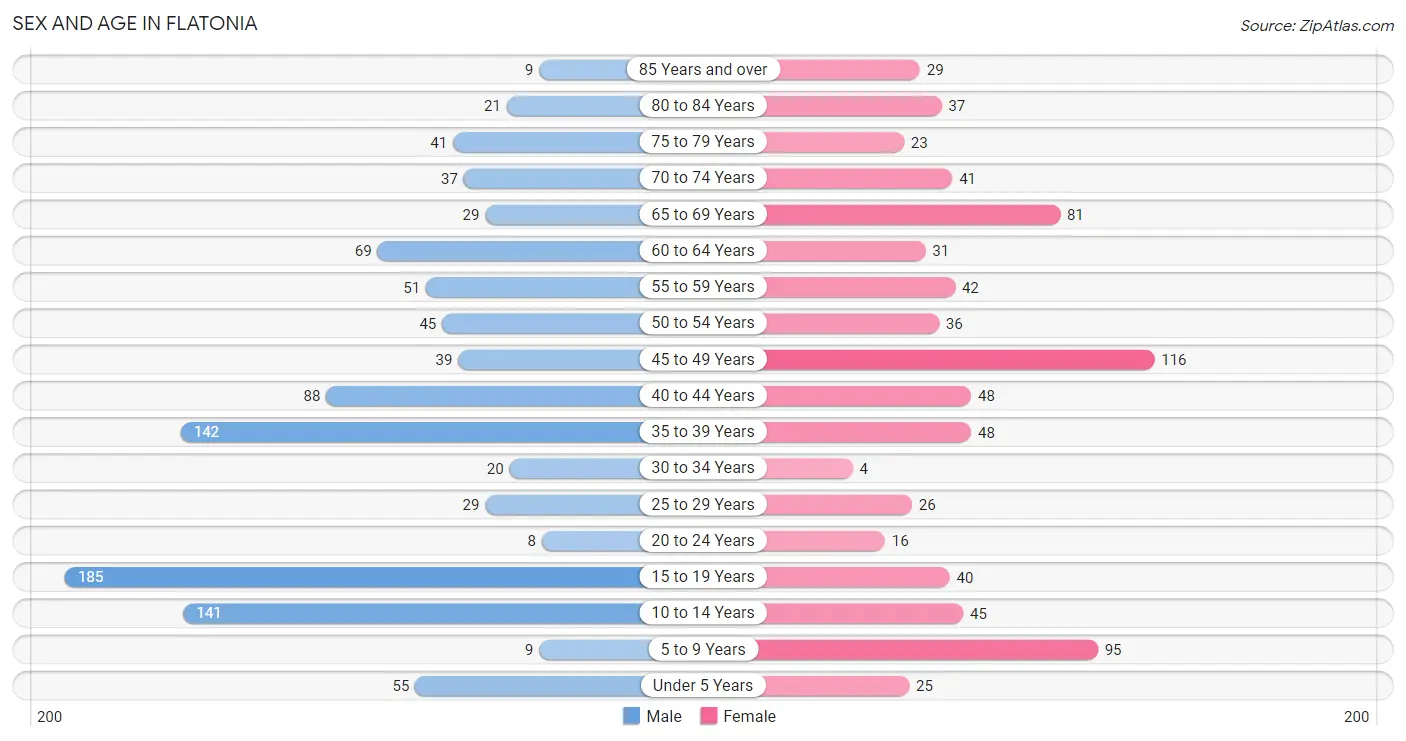
| Age Bracket | Male | Female |
| Under 5 Years | 55 (5.4%) | 25 (3.2%) |
| 5 to 9 Years | 9 (0.9%) | 95 (12.1%) |
| 10 to 14 Years | 141 (13.9%) | 45 (5.8%) |
| 15 to 19 Years | 185 (18.2%) | 40 (5.1%) |
| 20 to 24 Years | 8 (0.8%) | 16 (2.0%) |
| 25 to 29 Years | 29 (2.9%) | 26 (3.3%) |
| 30 to 34 Years | 20 (2.0%) | 4 (0.5%) |
| 35 to 39 Years | 142 (14.0%) | 48 (6.1%) |
| 40 to 44 Years | 88 (8.6%) | 48 (6.1%) |
| 45 to 49 Years | 39 (3.8%) | 116 (14.8%) |
| 50 to 54 Years | 45 (4.4%) | 36 (4.6%) |
| 55 to 59 Years | 51 (5.0%) | 42 (5.4%) |
| 60 to 64 Years | 69 (6.8%) | 31 (4.0%) |
| 65 to 69 Years | 29 (2.9%) | 81 (10.3%) |
| 70 to 74 Years | 37 (3.6%) | 41 (5.2%) |
| 75 to 79 Years | 41 (4.0%) | 23 (2.9%) |
| 80 to 84 Years | 21 (2.1%) | 37 (4.7%) |
| 85 Years and over | 9 (0.9%) | 29 (3.7%) |
| Total | 1,018 (100.0%) | 783 (100.0%) |
Families and Households in Flatonia
Median Family Size in Flatonia
The median family size in Flatonia is 3.74 persons per family, with single female/mother families (38 | 8.7%) accounting for the largest median family size of 5.71 persons per family. On the other hand, married-couple families (375 | 85.8%) represent the smallest median family size with 3.47 persons per family.
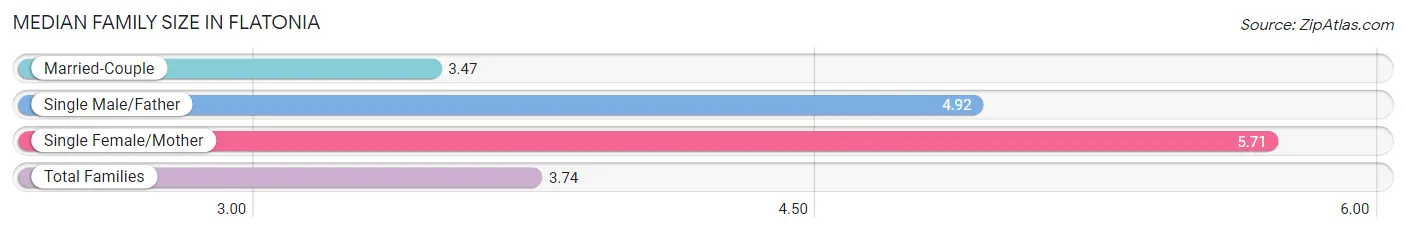
| Family Type | # Families | Family Size |
| Married-Couple | 375 (85.8%) | 3.47 |
| Single Male/Father | 24 (5.5%) | 4.92 |
| Single Female/Mother | 38 (8.7%) | 5.71 |
| Total Families | 437 (100.0%) | 3.74 |
Median Household Size in Flatonia
The median household size in Flatonia is 3.29 persons per household, with single female/mother households (38 | 7.1%) accounting for the largest median household size of 5.71 persons per household. non-family households (98 | 18.3%) represent the smallest median household size with 1.15 persons per household.
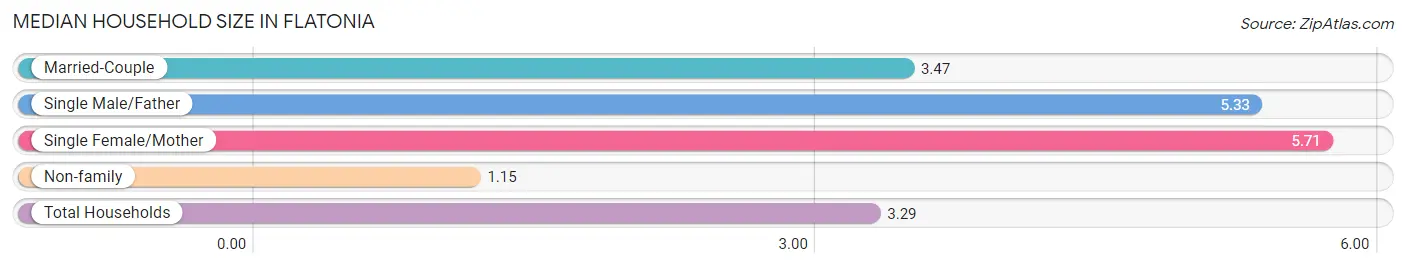
| Household Type | # Households | Household Size |
| Married-Couple | 375 (70.1%) | 3.47 |
| Single Male/Father | 24 (4.5%) | 5.33 |
| Single Female/Mother | 38 (7.1%) | 5.71 |
| Non-family | 98 (18.3%) | 1.15 |
| Total Households | 535 (100.0%) | 3.29 |
Household Size by Marriage Status in Flatonia
Out of a total of 535 households in Flatonia, 437 (81.7%) are family households, while 98 (18.3%) are nonfamily households. The most numerous type of family households are 2-person households, comprising 187, and the most common type of nonfamily households are 1-person households, comprising 79.
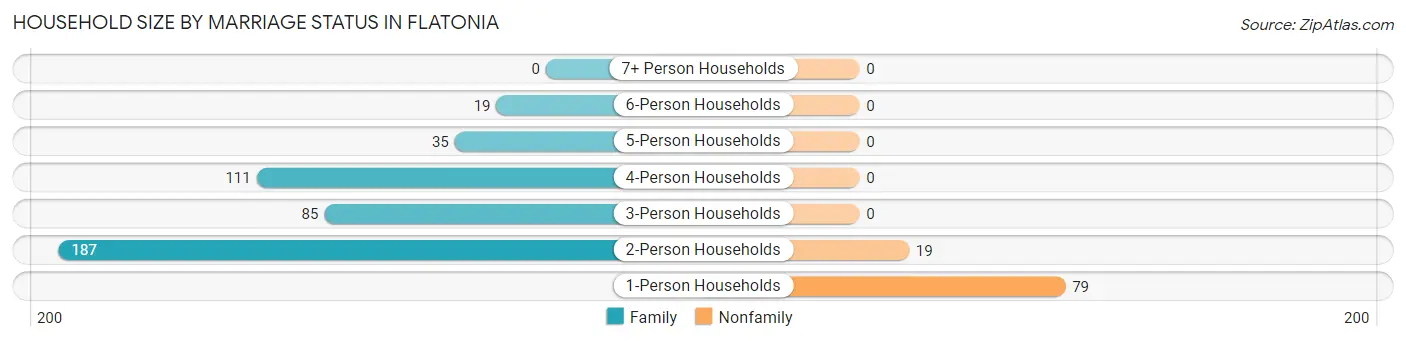
| Household Size | Family Households | Nonfamily Households |
| 1-Person Households | - | 79 (14.8%) |
| 2-Person Households | 187 (34.9%) | 19 (3.5%) |
| 3-Person Households | 85 (15.9%) | 0 (0.0%) |
| 4-Person Households | 111 (20.7%) | 0 (0.0%) |
| 5-Person Households | 35 (6.5%) | 0 (0.0%) |
| 6-Person Households | 19 (3.5%) | 0 (0.0%) |
| 7+ Person Households | 0 (0.0%) | 0 (0.0%) |
| Total | 437 (81.7%) | 98 (18.3%) |
Female Fertility in Flatonia
Fertility by Age in Flatonia
Average fertility rate in Flatonia is 87.0 births per 1,000 women. Women in the age bracket of 20 to 34 years have the highest fertility rate with 348.0 births per 1,000 women. Women in the age bracket of 20 to 34 years acount for 61.5% of all women with births.
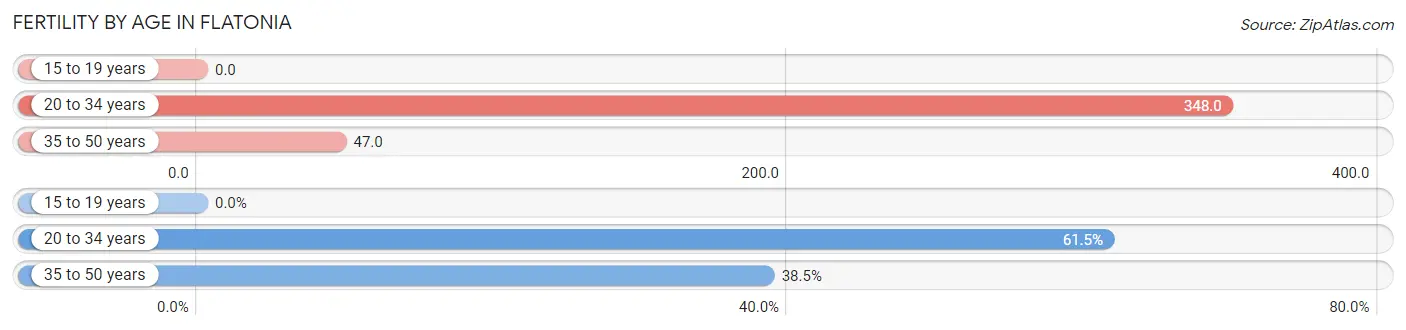
| Age Bracket | Women with Births | Births / 1,000 Women |
| 15 to 19 years | 0 (0.0%) | 0.0 |
| 20 to 34 years | 16 (61.5%) | 348.0 |
| 35 to 50 years | 10 (38.5%) | 47.0 |
| Total | 26 (100.0%) | 87.0 |
Fertility by Age by Marriage Status in Flatonia
57.7% of women with births (26) in Flatonia are married. The highest percentage of unmarried women with births falls into 20 to 34 years age bracket with 68.8% of them unmarried at the time of birth, while the lowest percentage of unmarried women with births belong to 35 to 50 years age bracket with 0.0% of them unmarried.
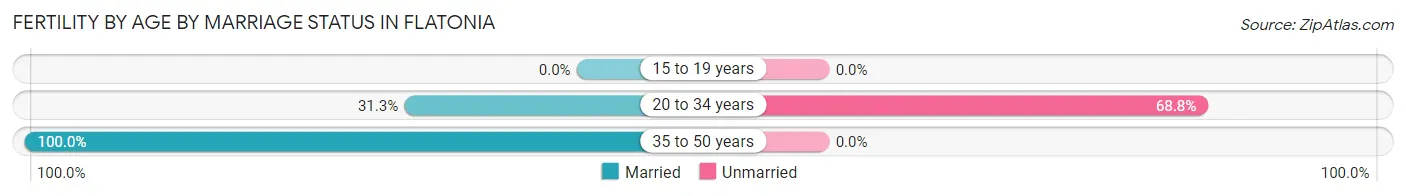
| Age Bracket | Married | Unmarried |
| 15 to 19 years | 0 (0.0%) | 0 (0.0%) |
| 20 to 34 years | 5 (31.2%) | 11 (68.8%) |
| 35 to 50 years | 10 (100.0%) | 0 (0.0%) |
| Total | 15 (57.7%) | 11 (42.3%) |
Fertility by Education in Flatonia
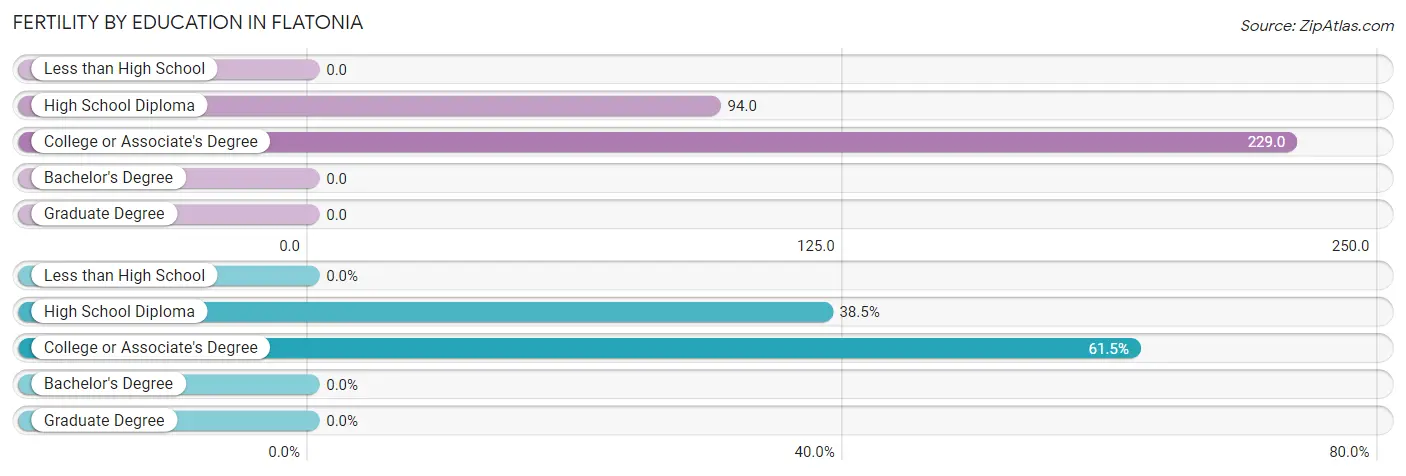
| Educational Attainment | Women with Births | Births / 1,000 Women |
| Less than High School | 0 (0.0%) | 0.0 |
| High School Diploma | 10 (38.5%) | 94.0 |
| College or Associate's Degree | 16 (61.5%) | 229.0 |
| Bachelor's Degree | 0 (0.0%) | 0.0 |
| Graduate Degree | 0 (0.0%) | 0.0 |
| Total | 26 (100.0%) | 87.0 |
Fertility by Education by Marriage Status in Flatonia
42.3% of women with births in Flatonia are unmarried. Women with the educational attainment of high school diploma are most likely to be married with 100.0% of them married at childbirth, while women with the educational attainment of college or associate's degree are least likely to be married with 68.8% of them unmarried at childbirth.
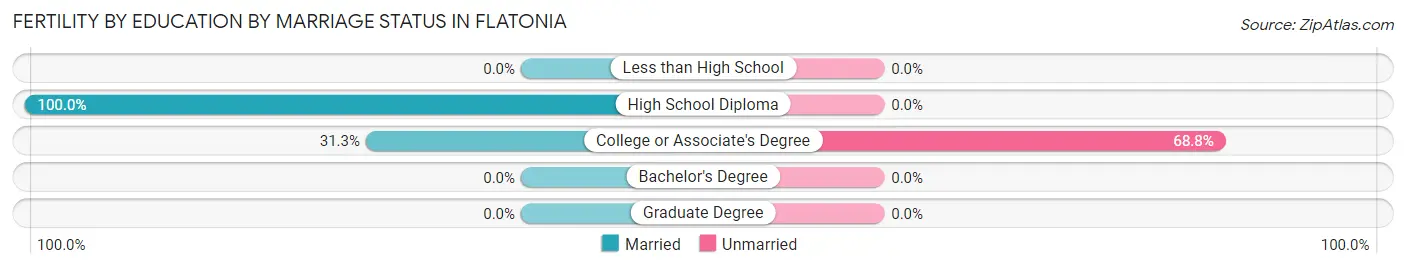
| Educational Attainment | Married | Unmarried |
| Less than High School | 0 (0.0%) | 0 (0.0%) |
| High School Diploma | 10 (100.0%) | 0 (0.0%) |
| College or Associate's Degree | 5 (31.2%) | 11 (68.8%) |
| Bachelor's Degree | 0 (0.0%) | 0 (0.0%) |
| Graduate Degree | 0 (0.0%) | 0 (0.0%) |
| Total | 15 (57.7%) | 11 (42.3%) |
Employment Characteristics in Flatonia
Employment by Class of Employer in Flatonia
Among the 787 employed individuals in Flatonia, private company employees (540 | 68.6%), self-employed (not incorporated) (203 | 25.8%), and local government employees (14 | 1.8%) make up the most common classes of employment.
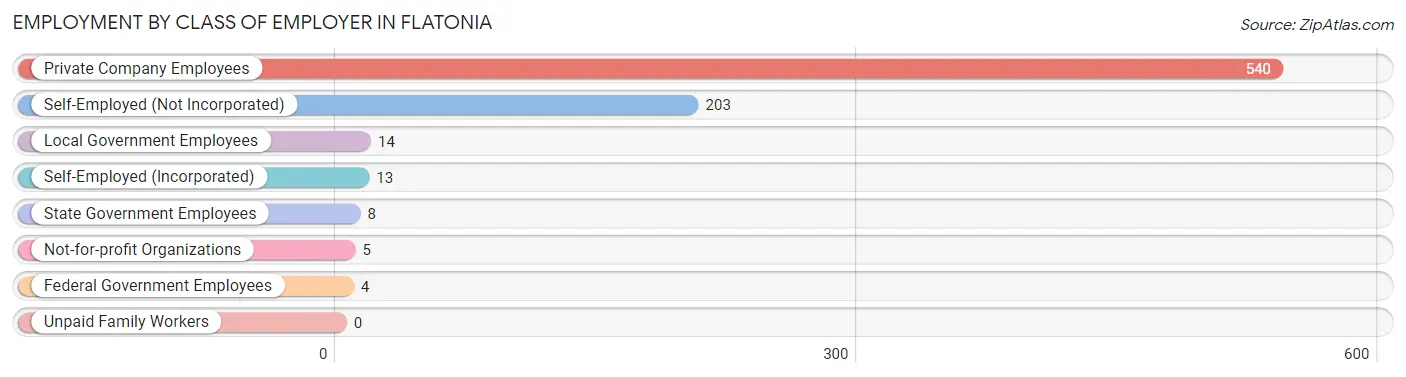
| Employer Class | # Employees | % Employees |
| Private Company Employees | 540 | 68.6% |
| Self-Employed (Incorporated) | 13 | 1.7% |
| Self-Employed (Not Incorporated) | 203 | 25.8% |
| Not-for-profit Organizations | 5 | 0.6% |
| Local Government Employees | 14 | 1.8% |
| State Government Employees | 8 | 1.0% |
| Federal Government Employees | 4 | 0.5% |
| Unpaid Family Workers | 0 | 0.0% |
| Total | 787 | 100.0% |
Employment Status by Age in Flatonia
According to the labor force statistics for Flatonia, out of the total population over 16 years of age (1,332), 59.5% or 793 individuals are in the labor force, with 0.3% or 2 of them unemployed. The age group with the highest labor force participation rate is 25 to 29 years, with 100.0% or 55 individuals in the labor force. Within the labor force, the 65 to 74 years age range has the highest percentage of unemployed individuals, with 4.0% or 2 of them being unemployed.
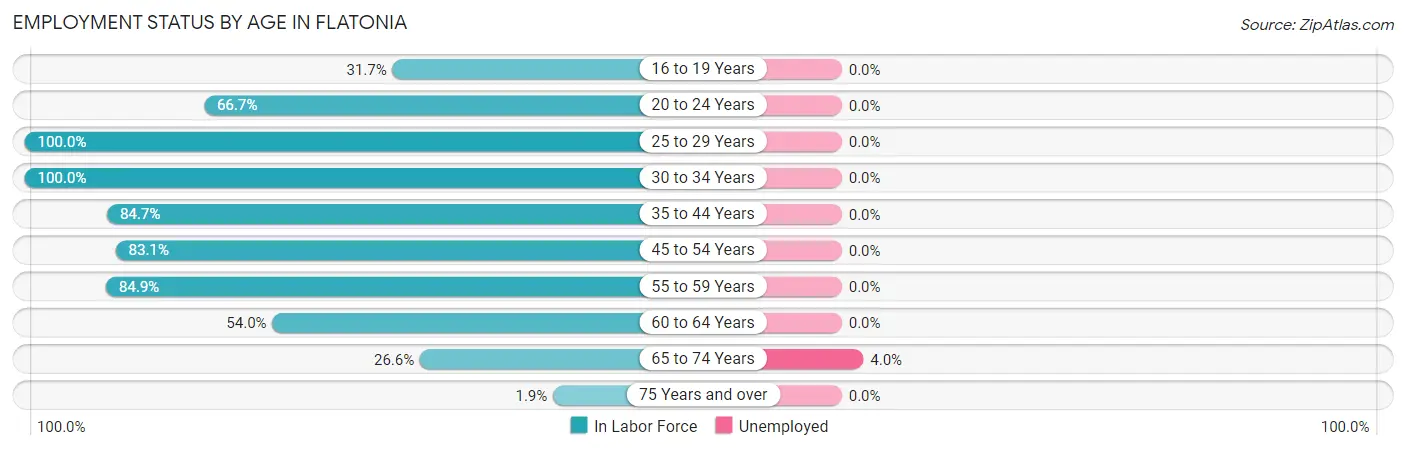
| Age Bracket | In Labor Force | Unemployed |
| 16 to 19 Years | 40 (31.7%) | 0 (0.0%) |
| 20 to 24 Years | 16 (66.7%) | 0 (0.0%) |
| 25 to 29 Years | 55 (100.0%) | 0 (0.0%) |
| 30 to 34 Years | 24 (100.0%) | 0 (0.0%) |
| 35 to 44 Years | 276 (84.7%) | 0 (0.0%) |
| 45 to 54 Years | 196 (83.1%) | 0 (0.0%) |
| 55 to 59 Years | 79 (84.9%) | 0 (0.0%) |
| 60 to 64 Years | 54 (54.0%) | 0 (0.0%) |
| 65 to 74 Years | 50 (26.6%) | 2 (4.0%) |
| 75 Years and over | 3 (1.9%) | 0 (0.0%) |
| Total | 793 (59.5%) | 2 (0.3%) |
Employment Status by Educational Attainment in Flatonia
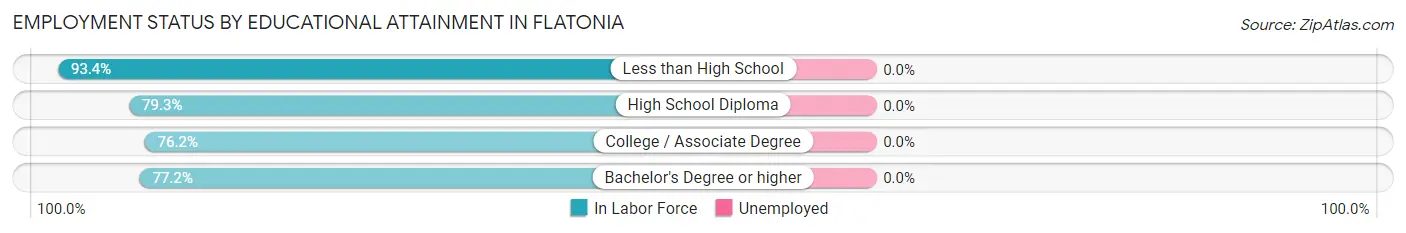
| Educational Attainment | In Labor Force | Unemployed |
| Less than High School | 198 (93.4%) | 0 (0.0%) |
| High School Diploma | 298 (79.3%) | 0 (0.0%) |
| College / Associate Degree | 144 (76.2%) | 0 (0.0%) |
| Bachelor's Degree or higher | 44 (77.2%) | 0 (0.0%) |
| Total | 684 (82.0%) | 0 (0.0%) |
Employment Occupations by Sex in Flatonia
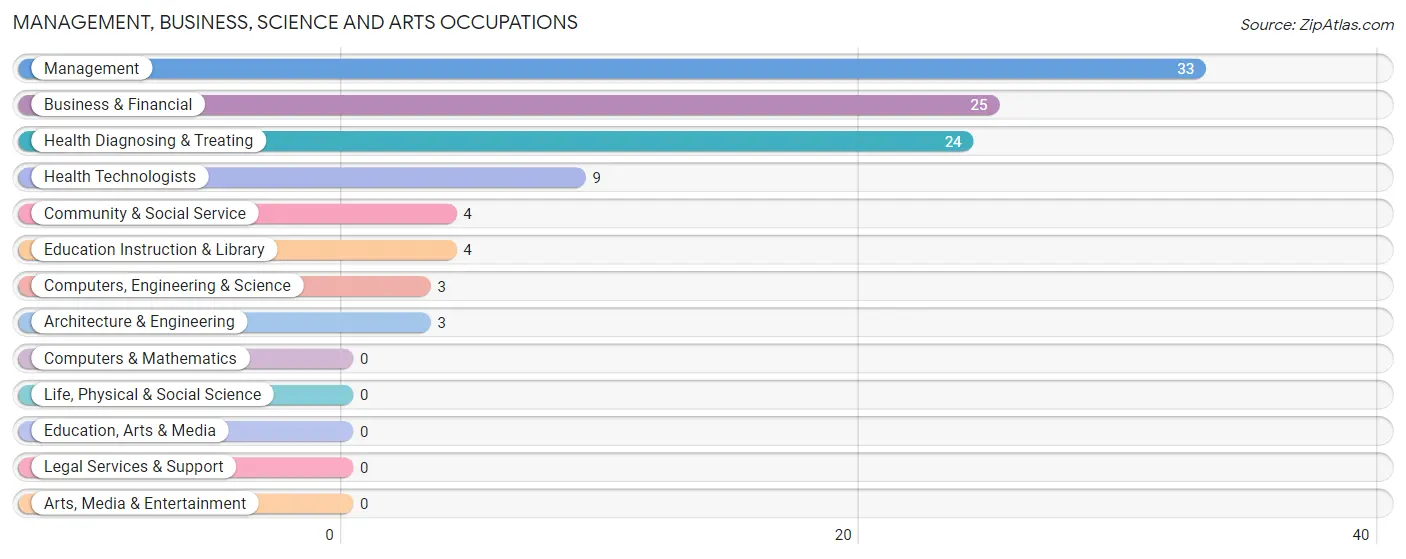
Management, Business, Science and Arts Occupations
The most common Management, Business, Science and Arts occupations in Flatonia are Management (33 | 4.2%), Business & Financial (25 | 3.2%), Health Diagnosing & Treating (24 | 3.0%), Health Technologists (9 | 1.1%), and Community & Social Service (4 | 0.5%).
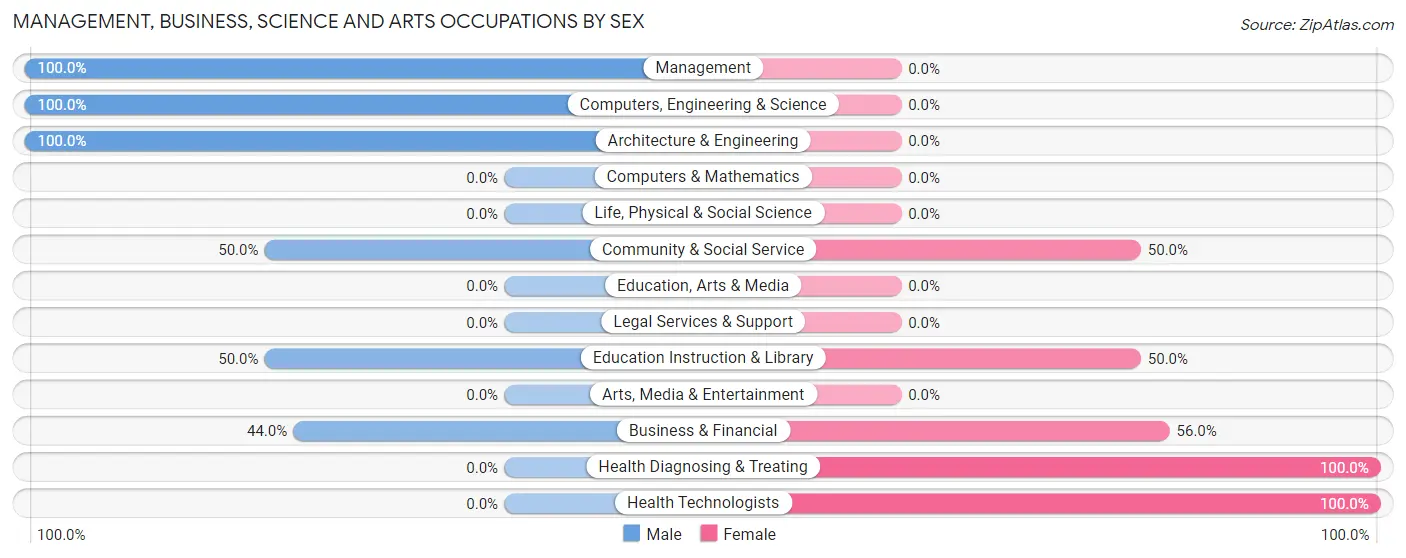
Management, Business, Science and Arts Occupations by Sex
Within the Management, Business, Science and Arts occupations in Flatonia, the most male-oriented occupations are Management (100.0%), Computers, Engineering & Science (100.0%), and Architecture & Engineering (100.0%), while the most female-oriented occupations are Health Diagnosing & Treating (100.0%), Health Technologists (100.0%), and Business & Financial (56.0%).
| Occupation | Male | Female |
| Management | 33 (100.0%) | 0 (0.0%) |
| Business & Financial | 11 (44.0%) | 14 (56.0%) |
| Computers, Engineering & Science | 3 (100.0%) | 0 (0.0%) |
| Computers & Mathematics | 0 (0.0%) | 0 (0.0%) |
| Architecture & Engineering | 3 (100.0%) | 0 (0.0%) |
| Life, Physical & Social Science | 0 (0.0%) | 0 (0.0%) |
| Community & Social Service | 2 (50.0%) | 2 (50.0%) |
| Education, Arts & Media | 0 (0.0%) | 0 (0.0%) |
| Legal Services & Support | 0 (0.0%) | 0 (0.0%) |
| Education Instruction & Library | 2 (50.0%) | 2 (50.0%) |
| Arts, Media & Entertainment | 0 (0.0%) | 0 (0.0%) |
| Health Diagnosing & Treating | 0 (0.0%) | 24 (100.0%) |
| Health Technologists | 0 (0.0%) | 9 (100.0%) |
| Total (Category) | 49 (55.1%) | 40 (44.9%) |
| Total (Overall) | 514 (65.0%) | 277 (35.0%) |
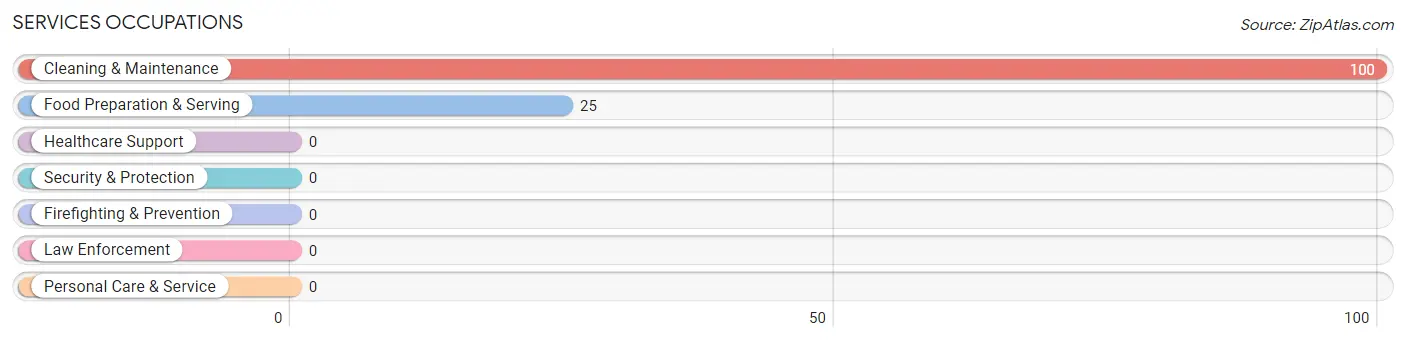
Services Occupations
The most common Services occupations in Flatonia are Cleaning & Maintenance (100 | 12.6%), and Food Preparation & Serving (25 | 3.2%).
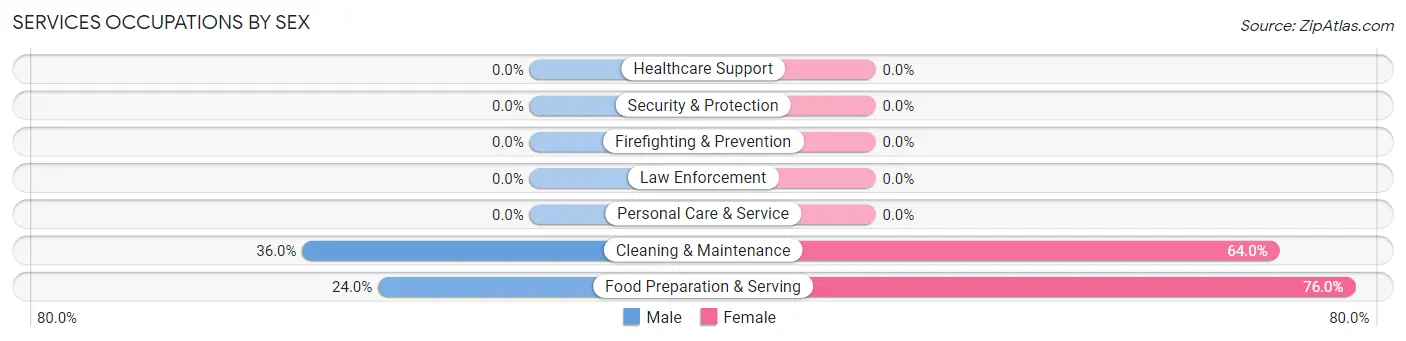
Services Occupations by Sex
Within the Services occupations in Flatonia, the most male-oriented occupations are Cleaning & Maintenance (36.0%), and Food Preparation & Serving (24.0%), while the most female-oriented occupations are Food Preparation & Serving (76.0%), and Cleaning & Maintenance (64.0%).
| Occupation | Male | Female |
| Healthcare Support | 0 (0.0%) | 0 (0.0%) |
| Security & Protection | 0 (0.0%) | 0 (0.0%) |
| Firefighting & Prevention | 0 (0.0%) | 0 (0.0%) |
| Law Enforcement | 0 (0.0%) | 0 (0.0%) |
| Food Preparation & Serving | 6 (24.0%) | 19 (76.0%) |
| Cleaning & Maintenance | 36 (36.0%) | 64 (64.0%) |
| Personal Care & Service | 0 (0.0%) | 0 (0.0%) |
| Total (Category) | 42 (33.6%) | 83 (66.4%) |
| Total (Overall) | 514 (65.0%) | 277 (35.0%) |
Sales and Office Occupations
The most common Sales and Office occupations in Flatonia are Office & Administration (69 | 8.7%), and Sales & Related (39 | 4.9%).
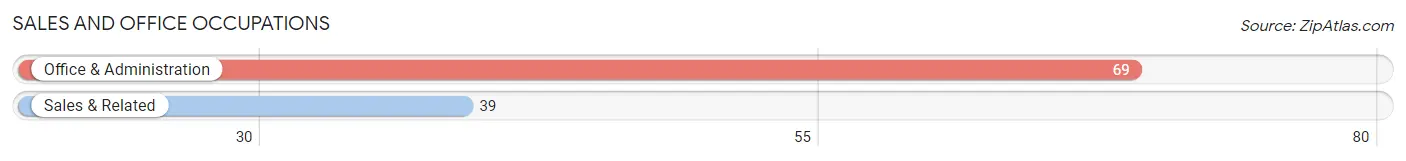
Sales and Office Occupations by Sex

| Occupation | Male | Female |
| Sales & Related | 39 (100.0%) | 0 (0.0%) |
| Office & Administration | 24 (34.8%) | 45 (65.2%) |
| Total (Category) | 63 (58.3%) | 45 (41.7%) |
| Total (Overall) | 514 (65.0%) | 277 (35.0%) |
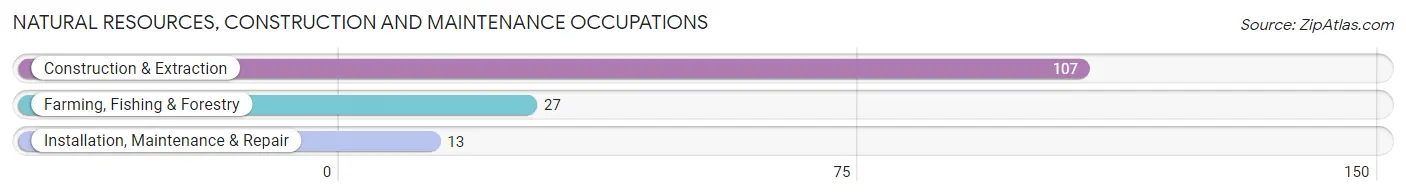
Natural Resources, Construction and Maintenance Occupations
The most common Natural Resources, Construction and Maintenance occupations in Flatonia are Construction & Extraction (107 | 13.5%), Farming, Fishing & Forestry (27 | 3.4%), and Installation, Maintenance & Repair (13 | 1.6%).
Natural Resources, Construction and Maintenance Occupations by Sex
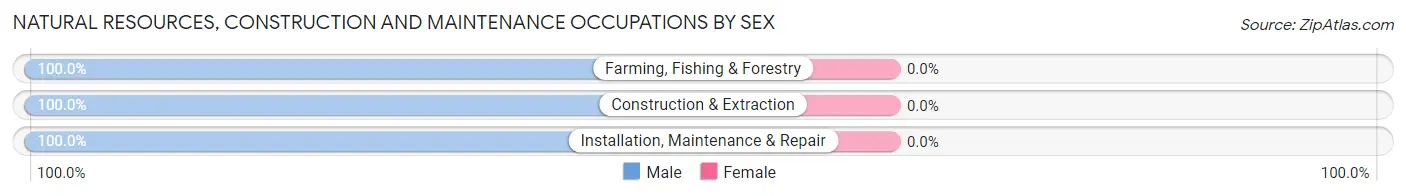
| Occupation | Male | Female |
| Farming, Fishing & Forestry | 27 (100.0%) | 0 (0.0%) |
| Construction & Extraction | 107 (100.0%) | 0 (0.0%) |
| Installation, Maintenance & Repair | 13 (100.0%) | 0 (0.0%) |
| Total (Category) | 147 (100.0%) | 0 (0.0%) |
| Total (Overall) | 514 (65.0%) | 277 (35.0%) |
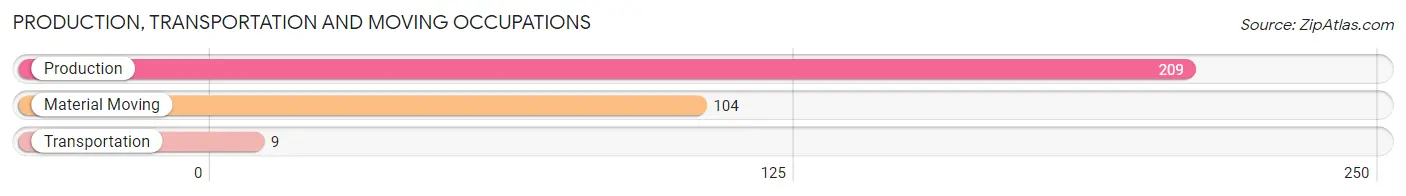
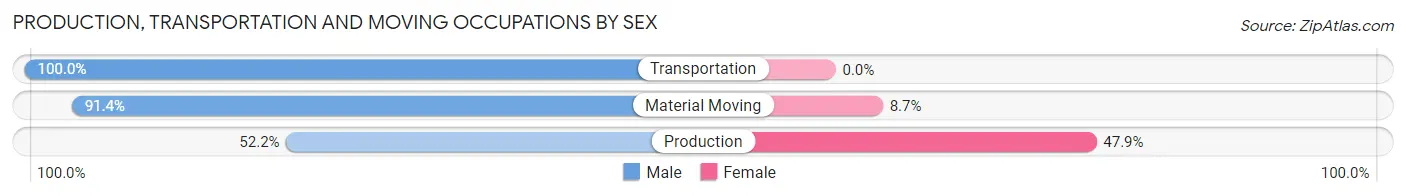
Production, Transportation and Moving Occupations
The most common Production, Transportation and Moving occupations in Flatonia are Production (209 | 26.4%), Material Moving (104 | 13.2%), and Transportation (9 | 1.1%).
Production, Transportation and Moving Occupations by Sex
| Occupation | Male | Female |
| Production | 109 (52.1%) | 100 (47.8%) |
| Transportation | 9 (100.0%) | 0 (0.0%) |
| Material Moving | 95 (91.3%) | 9 (8.6%) |
| Total (Category) | 213 (66.1%) | 109 (33.9%) |
| Total (Overall) | 514 (65.0%) | 277 (35.0%) |
Employment Industries by Sex in Flatonia
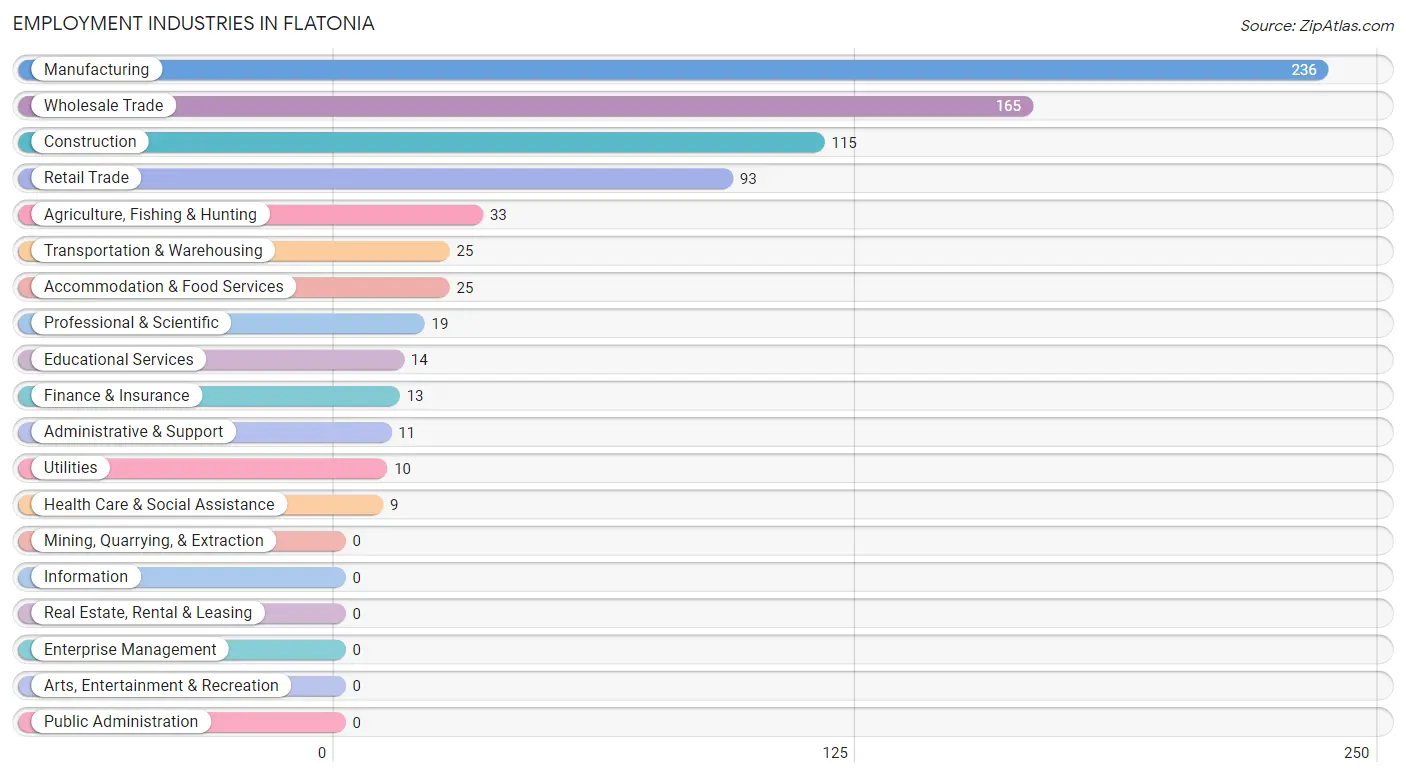
Employment Industries in Flatonia
The major employment industries in Flatonia include Manufacturing (236 | 29.8%), Wholesale Trade (165 | 20.9%), Construction (115 | 14.5%), Retail Trade (93 | 11.8%), and Agriculture, Fishing & Hunting (33 | 4.2%).
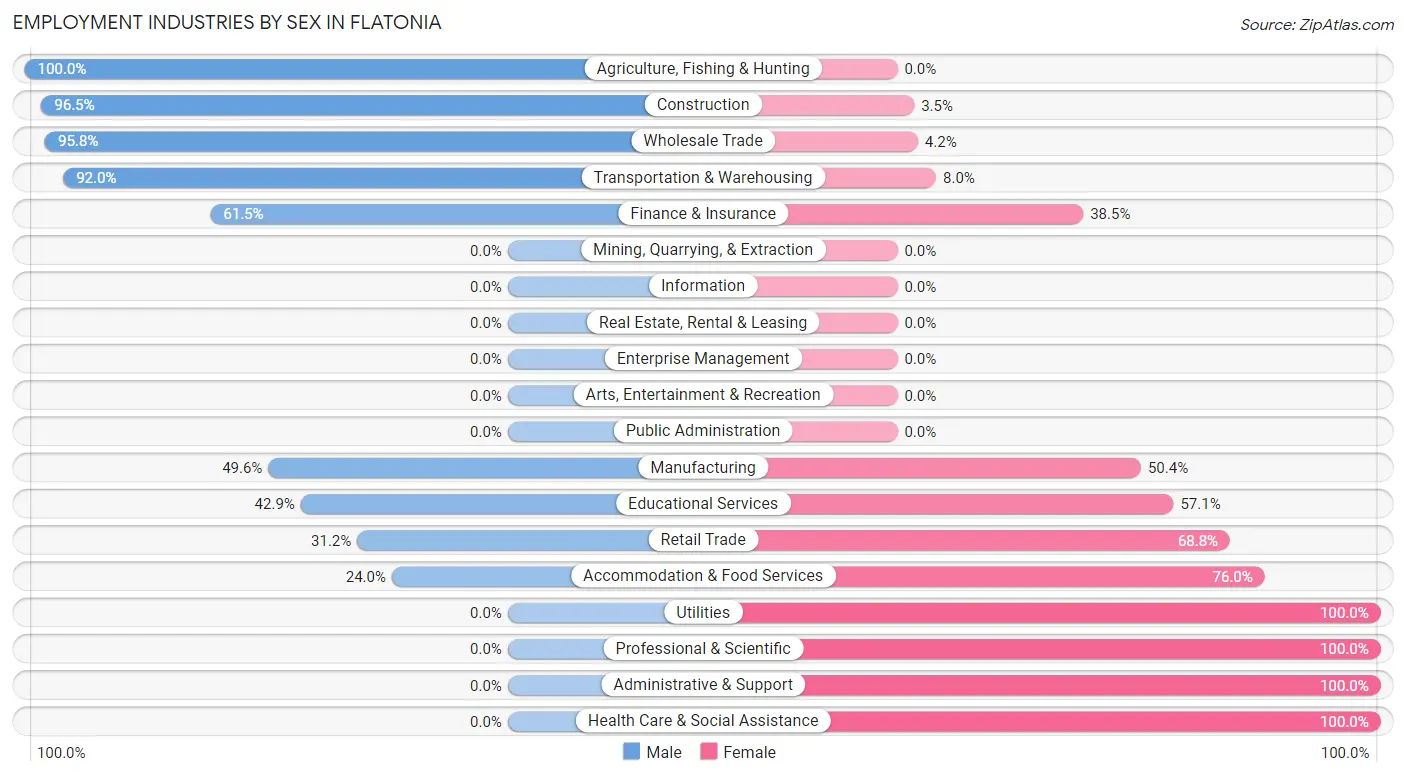
Employment Industries by Sex in Flatonia
The Flatonia industries that see more men than women are Agriculture, Fishing & Hunting (100.0%), Construction (96.5%), and Wholesale Trade (95.8%), whereas the industries that tend to have a higher number of women are Utilities (100.0%), Professional & Scientific (100.0%), and Administrative & Support (100.0%).
| Industry | Male | Female |
| Agriculture, Fishing & Hunting | 33 (100.0%) | 0 (0.0%) |
| Mining, Quarrying, & Extraction | 0 (0.0%) | 0 (0.0%) |
| Construction | 111 (96.5%) | 4 (3.5%) |
| Manufacturing | 117 (49.6%) | 119 (50.4%) |
| Wholesale Trade | 158 (95.8%) | 7 (4.2%) |
| Retail Trade | 29 (31.2%) | 64 (68.8%) |
| Transportation & Warehousing | 23 (92.0%) | 2 (8.0%) |
| Utilities | 0 (0.0%) | 10 (100.0%) |
| Information | 0 (0.0%) | 0 (0.0%) |
| Finance & Insurance | 8 (61.5%) | 5 (38.5%) |
| Real Estate, Rental & Leasing | 0 (0.0%) | 0 (0.0%) |
| Professional & Scientific | 0 (0.0%) | 19 (100.0%) |
| Enterprise Management | 0 (0.0%) | 0 (0.0%) |
| Administrative & Support | 0 (0.0%) | 11 (100.0%) |
| Educational Services | 6 (42.9%) | 8 (57.1%) |
| Health Care & Social Assistance | 0 (0.0%) | 9 (100.0%) |
| Arts, Entertainment & Recreation | 0 (0.0%) | 0 (0.0%) |
| Accommodation & Food Services | 6 (24.0%) | 19 (76.0%) |
| Public Administration | 0 (0.0%) | 0 (0.0%) |
| Total | 514 (65.0%) | 277 (35.0%) |
Education in Flatonia
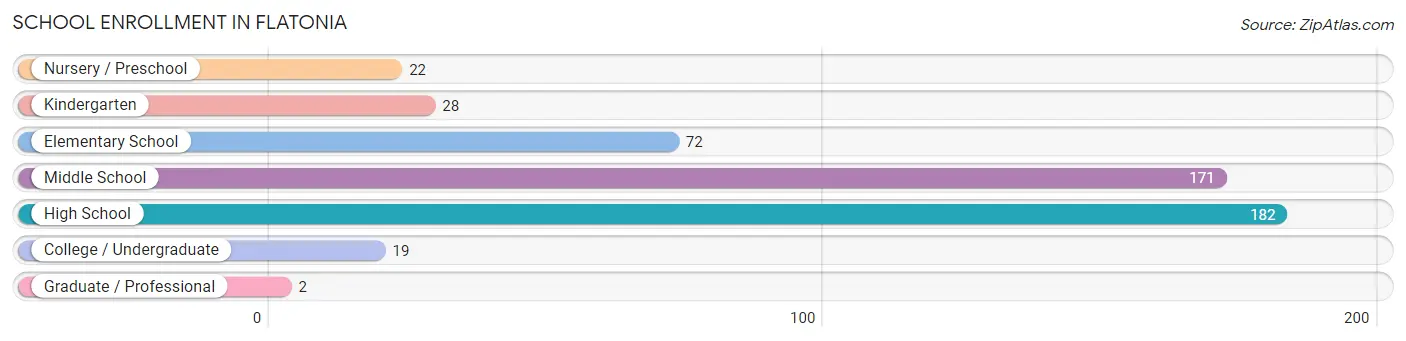
School Enrollment in Flatonia
The most common levels of schooling among the 496 students in Flatonia are high school (182 | 36.7%), middle school (171 | 34.5%), and elementary school (72 | 14.5%).
| School Level | # Students | % Students |
| Nursery / Preschool | 22 | 4.4% |
| Kindergarten | 28 | 5.7% |
| Elementary School | 72 | 14.5% |
| Middle School | 171 | 34.5% |
| High School | 182 | 36.7% |
| College / Undergraduate | 19 | 3.8% |
| Graduate / Professional | 2 | 0.4% |
| Total | 496 | 100.0% |
School Enrollment by Age by Funding Source in Flatonia
Out of a total of 496 students who are enrolled in schools in Flatonia, 30 (6.0%) attend a private institution, while the remaining 466 (94.0%) are enrolled in public schools. The age group of 3 to 4 year olds has the highest likelihood of being enrolled in private schools, with 11 (84.6% in the age bracket) enrolled. Conversely, the age group of 15 to 17 year olds has the lowest likelihood of being enrolled in a private school, with 162 (100.0% in the age bracket) attending a public institution.
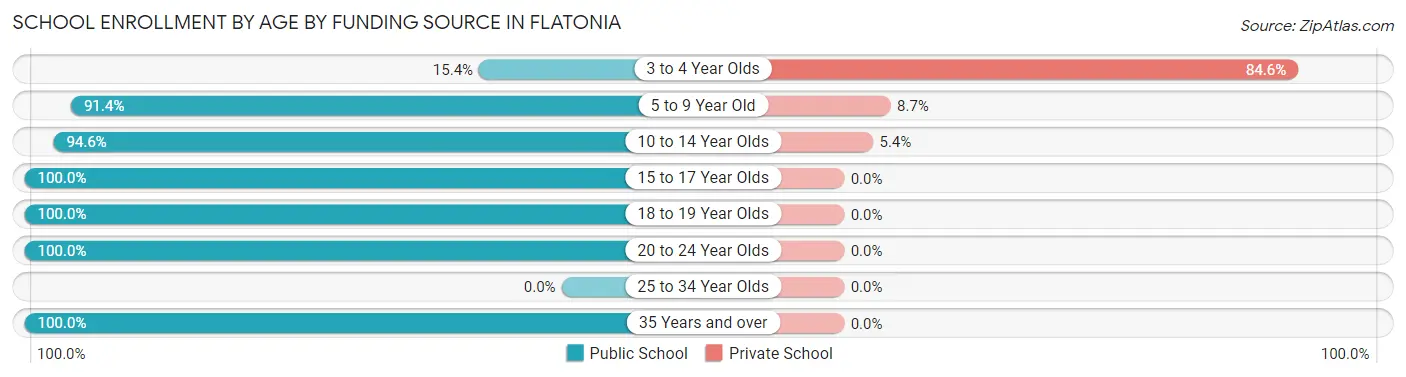
| Age Bracket | Public School | Private School |
| 3 to 4 Year Olds | 2 (15.4%) | 11 (84.6%) |
| 5 to 9 Year Old | 95 (91.3%) | 9 (8.6%) |
| 10 to 14 Year Olds | 176 (94.6%) | 10 (5.4%) |
| 15 to 17 Year Olds | 162 (100.0%) | 0 (0.0%) |
| 18 to 19 Year Olds | 10 (100.0%) | 0 (0.0%) |
| 20 to 24 Year Olds | 19 (100.0%) | 0 (0.0%) |
| 25 to 34 Year Olds | 0 (0.0%) | 0 (0.0%) |
| 35 Years and over | 2 (100.0%) | 0 (0.0%) |
| Total | 466 (94.0%) | 30 (6.0%) |
Educational Attainment by Field of Study in Flatonia
Education (62 | 50.4%), business (24 | 19.5%), arts & humanities (13 | 10.6%), science & technology (11 | 8.9%), and bio, nature & agricultural (7 | 5.7%) are the most common fields of study among 123 individuals in Flatonia who have obtained a bachelor's degree or higher.
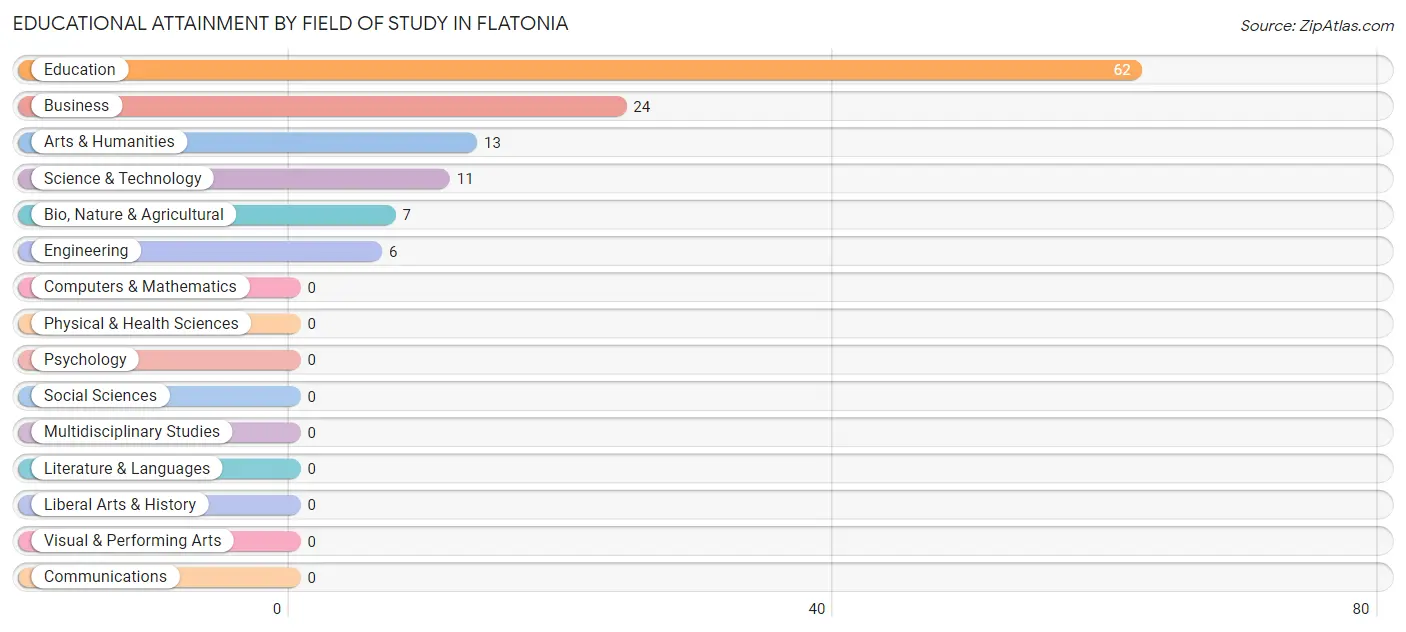
| Field of Study | # Graduates | % Graduates |
| Computers & Mathematics | 0 | 0.0% |
| Bio, Nature & Agricultural | 7 | 5.7% |
| Physical & Health Sciences | 0 | 0.0% |
| Psychology | 0 | 0.0% |
| Social Sciences | 0 | 0.0% |
| Engineering | 6 | 4.9% |
| Multidisciplinary Studies | 0 | 0.0% |
| Science & Technology | 11 | 8.9% |
| Business | 24 | 19.5% |
| Education | 62 | 50.4% |
| Literature & Languages | 0 | 0.0% |
| Liberal Arts & History | 0 | 0.0% |
| Visual & Performing Arts | 0 | 0.0% |
| Communications | 0 | 0.0% |
| Arts & Humanities | 13 | 10.6% |
| Total | 123 | 100.0% |
Transportation & Commute in Flatonia
Vehicle Availability by Sex in Flatonia
The most prevalent vehicle ownership categories in Flatonia are males with 2 vehicles (157, accounting for 30.5%) and females with 2 vehicles (119, making up 57.5%).
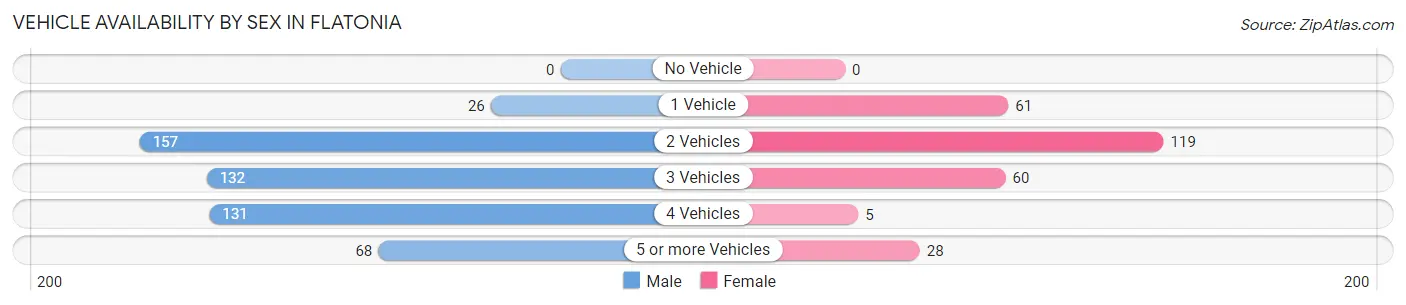
| Vehicles Available | Male | Female |
| No Vehicle | 0 (0.0%) | 0 (0.0%) |
| 1 Vehicle | 26 (5.1%) | 61 (22.3%) |
| 2 Vehicles | 157 (30.5%) | 119 (43.6%) |
| 3 Vehicles | 132 (25.7%) | 60 (22.0%) |
| 4 Vehicles | 131 (25.5%) | 5 (1.8%) |
| 5 or more Vehicles | 68 (13.2%) | 28 (10.3%) |
| Total | 514 (100.0%) | 273 (100.0%) |
Commute Time in Flatonia
The most frequently occuring commute durations in Flatonia are 5 to 9 minutes (256 commuters, 33.5%), 20 to 24 minutes (164 commuters, 21.4%), and 15 to 19 minutes (157 commuters, 20.5%).
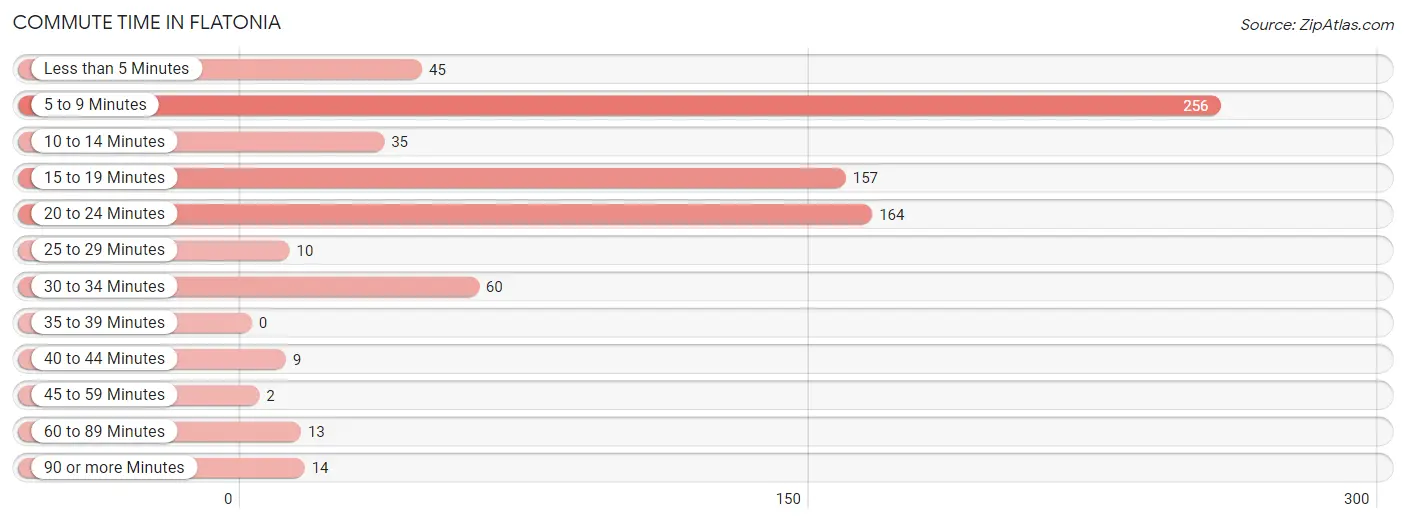
| Commute Time | # Commuters | % Commuters |
| Less than 5 Minutes | 45 | 5.9% |
| 5 to 9 Minutes | 256 | 33.5% |
| 10 to 14 Minutes | 35 | 4.6% |
| 15 to 19 Minutes | 157 | 20.5% |
| 20 to 24 Minutes | 164 | 21.4% |
| 25 to 29 Minutes | 10 | 1.3% |
| 30 to 34 Minutes | 60 | 7.8% |
| 35 to 39 Minutes | 0 | 0.0% |
| 40 to 44 Minutes | 9 | 1.2% |
| 45 to 59 Minutes | 2 | 0.3% |
| 60 to 89 Minutes | 13 | 1.7% |
| 90 or more Minutes | 14 | 1.8% |
Commute Time by Sex in Flatonia
The most common commute times in Flatonia are 5 to 9 minutes (193 commuters, 38.4%) for males and 15 to 19 minutes (77 commuters, 29.4%) for females.
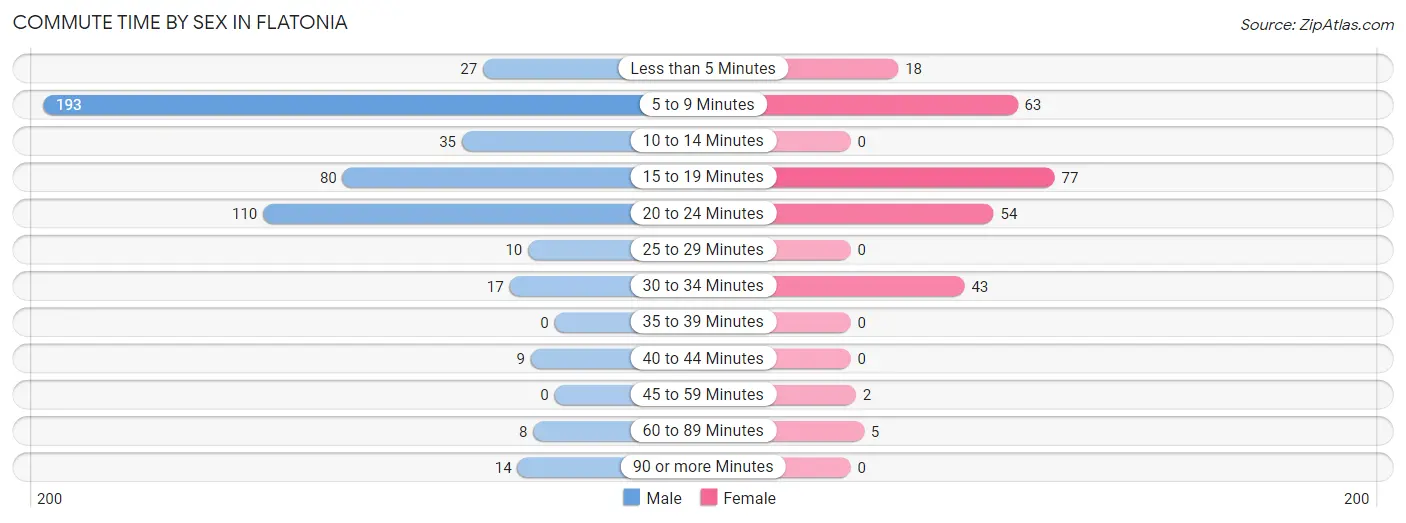
| Commute Time | Male | Female |
| Less than 5 Minutes | 27 (5.4%) | 18 (6.9%) |
| 5 to 9 Minutes | 193 (38.4%) | 63 (24.0%) |
| 10 to 14 Minutes | 35 (7.0%) | 0 (0.0%) |
| 15 to 19 Minutes | 80 (15.9%) | 77 (29.4%) |
| 20 to 24 Minutes | 110 (21.9%) | 54 (20.6%) |
| 25 to 29 Minutes | 10 (2.0%) | 0 (0.0%) |
| 30 to 34 Minutes | 17 (3.4%) | 43 (16.4%) |
| 35 to 39 Minutes | 0 (0.0%) | 0 (0.0%) |
| 40 to 44 Minutes | 9 (1.8%) | 0 (0.0%) |
| 45 to 59 Minutes | 0 (0.0%) | 2 (0.8%) |
| 60 to 89 Minutes | 8 (1.6%) | 5 (1.9%) |
| 90 or more Minutes | 14 (2.8%) | 0 (0.0%) |
Time of Departure to Work by Sex in Flatonia
The most frequent times of departure to work in Flatonia are 7:00 AM to 7:29 AM (235, 46.7%) for males and 7:30 AM to 7:59 AM (75, 28.6%) for females.
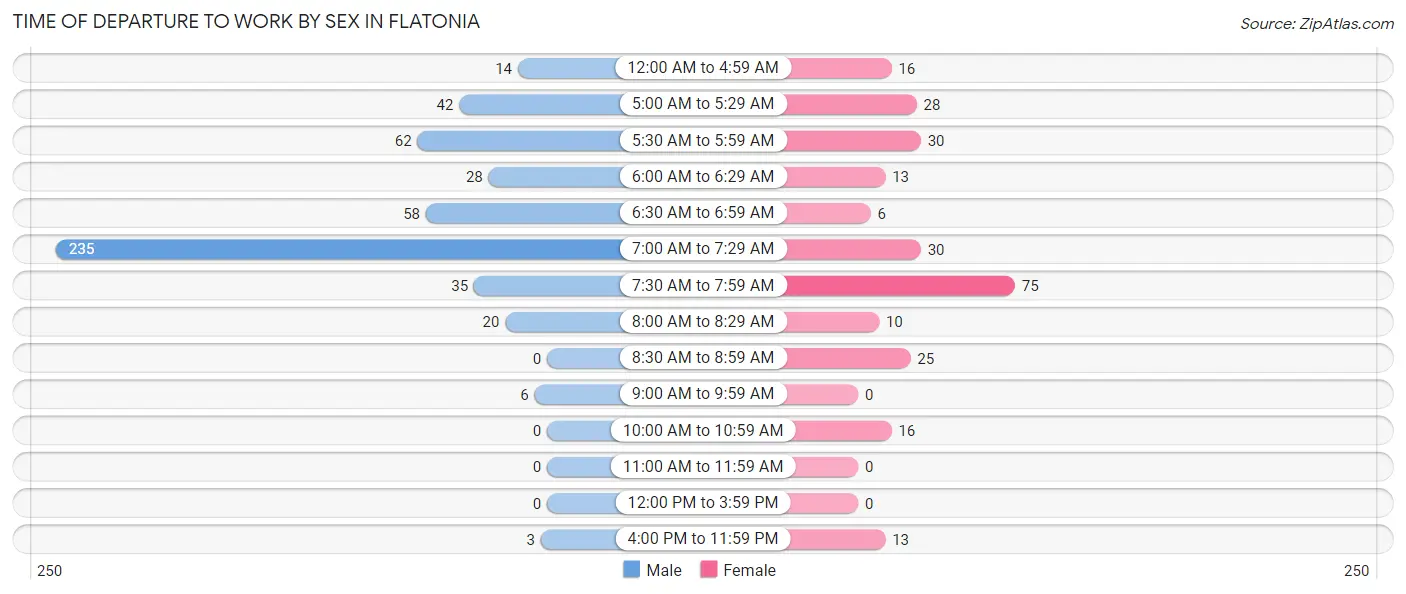
| Time of Departure | Male | Female |
| 12:00 AM to 4:59 AM | 14 (2.8%) | 16 (6.1%) |
| 5:00 AM to 5:29 AM | 42 (8.4%) | 28 (10.7%) |
| 5:30 AM to 5:59 AM | 62 (12.3%) | 30 (11.5%) |
| 6:00 AM to 6:29 AM | 28 (5.6%) | 13 (5.0%) |
| 6:30 AM to 6:59 AM | 58 (11.5%) | 6 (2.3%) |
| 7:00 AM to 7:29 AM | 235 (46.7%) | 30 (11.5%) |
| 7:30 AM to 7:59 AM | 35 (7.0%) | 75 (28.6%) |
| 8:00 AM to 8:29 AM | 20 (4.0%) | 10 (3.8%) |
| 8:30 AM to 8:59 AM | 0 (0.0%) | 25 (9.5%) |
| 9:00 AM to 9:59 AM | 6 (1.2%) | 0 (0.0%) |
| 10:00 AM to 10:59 AM | 0 (0.0%) | 16 (6.1%) |
| 11:00 AM to 11:59 AM | 0 (0.0%) | 0 (0.0%) |
| 12:00 PM to 3:59 PM | 0 (0.0%) | 0 (0.0%) |
| 4:00 PM to 11:59 PM | 3 (0.6%) | 13 (5.0%) |
| Total | 503 (100.0%) | 262 (100.0%) |
Housing Occupancy in Flatonia
Occupancy by Ownership in Flatonia
Of the total 535 dwellings in Flatonia, owner-occupied units account for 429 (80.2%), while renter-occupied units make up 106 (19.8%).
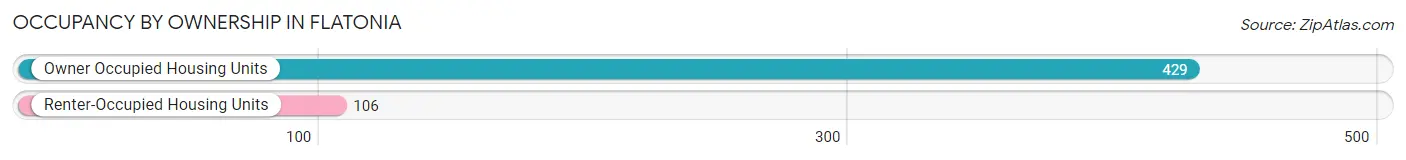
| Occupancy | # Housing Units | % Housing Units |
| Owner Occupied Housing Units | 429 | 80.2% |
| Renter-Occupied Housing Units | 106 | 19.8% |
| Total Occupied Housing Units | 535 | 100.0% |
Occupancy by Household Size in Flatonia
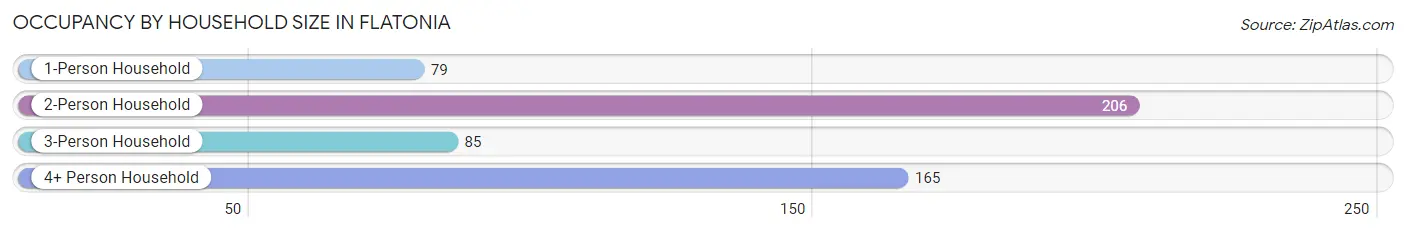
| Household Size | # Housing Units | % Housing Units |
| 1-Person Household | 79 | 14.8% |
| 2-Person Household | 206 | 38.5% |
| 3-Person Household | 85 | 15.9% |
| 4+ Person Household | 165 | 30.8% |
| Total Housing Units | 535 | 100.0% |
Occupancy by Ownership by Household Size in Flatonia
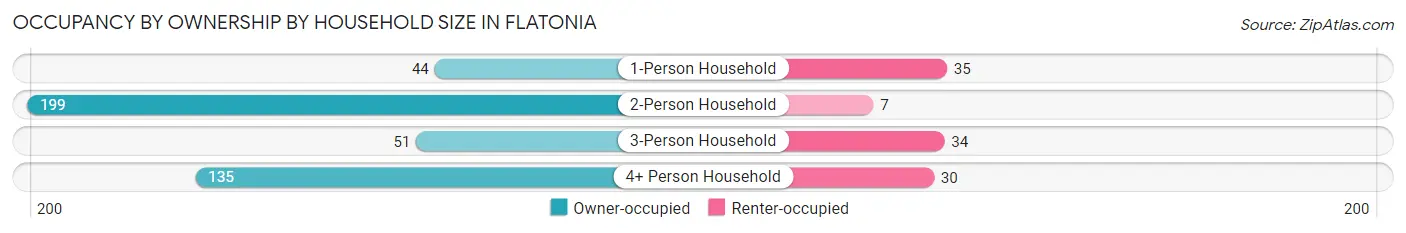
| Household Size | Owner-occupied | Renter-occupied |
| 1-Person Household | 44 (55.7%) | 35 (44.3%) |
| 2-Person Household | 199 (96.6%) | 7 (3.4%) |
| 3-Person Household | 51 (60.0%) | 34 (40.0%) |
| 4+ Person Household | 135 (81.8%) | 30 (18.2%) |
| Total Housing Units | 429 (80.2%) | 106 (19.8%) |
Occupancy by Educational Attainment in Flatonia
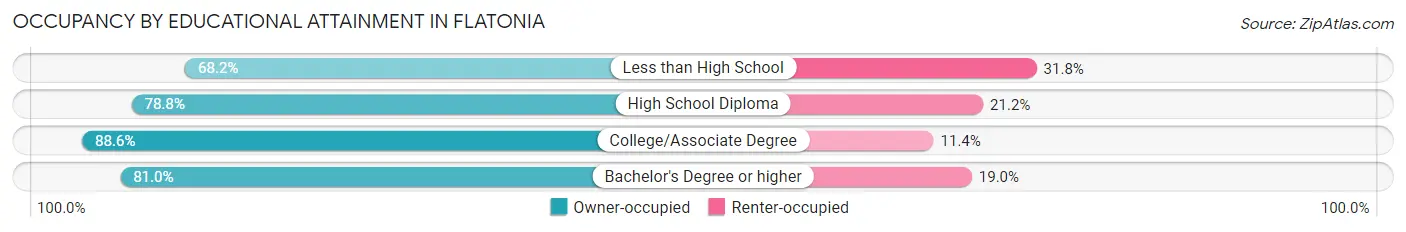
| Household Size | Owner-occupied | Renter-occupied |
| Less than High School | 60 (68.2%) | 28 (31.8%) |
| High School Diploma | 182 (78.8%) | 49 (21.2%) |
| College/Associate Degree | 140 (88.6%) | 18 (11.4%) |
| Bachelor's Degree or higher | 47 (81.0%) | 11 (19.0%) |
Occupancy by Age of Householder in Flatonia
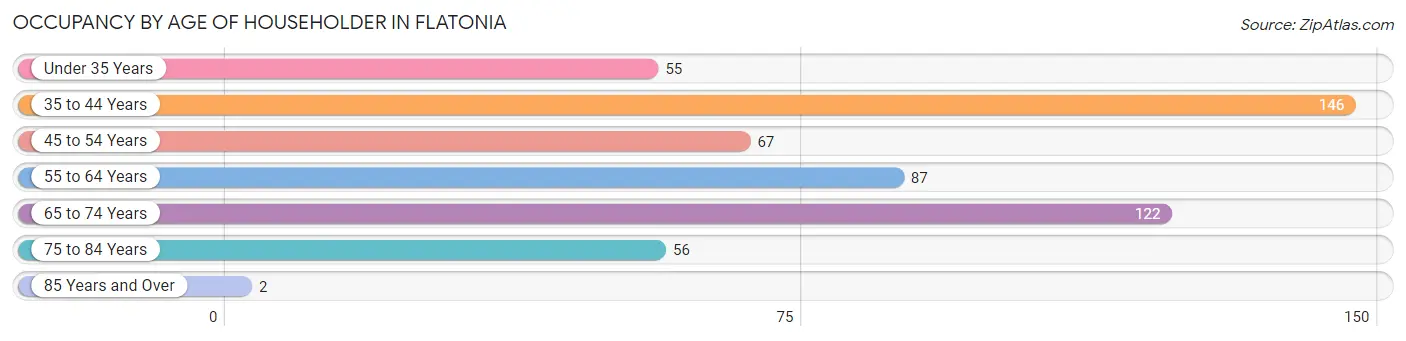
| Age Bracket | # Households | % Households |
| Under 35 Years | 55 | 10.3% |
| 35 to 44 Years | 146 | 27.3% |
| 45 to 54 Years | 67 | 12.5% |
| 55 to 64 Years | 87 | 16.3% |
| 65 to 74 Years | 122 | 22.8% |
| 75 to 84 Years | 56 | 10.5% |
| 85 Years and Over | 2 | 0.4% |
| Total | 535 | 100.0% |
Housing Finances in Flatonia
Median Income by Occupancy in Flatonia
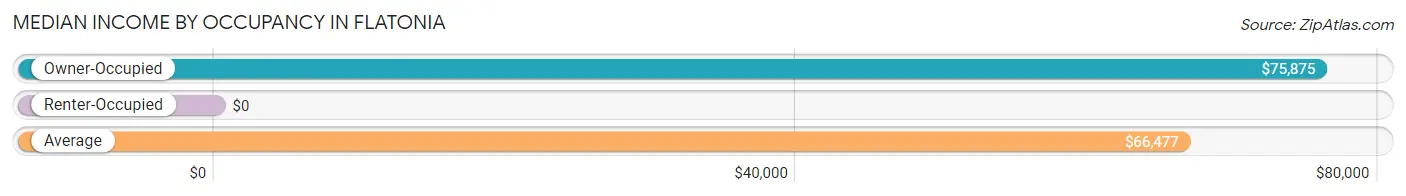
| Occupancy Type | # Households | Median Income |
| Owner-Occupied | 429 (80.2%) | $75,875 |
| Renter-Occupied | 106 (19.8%) | $0 |
| Average | 535 (100.0%) | $66,477 |
Occupancy by Householder Income Bracket in Flatonia
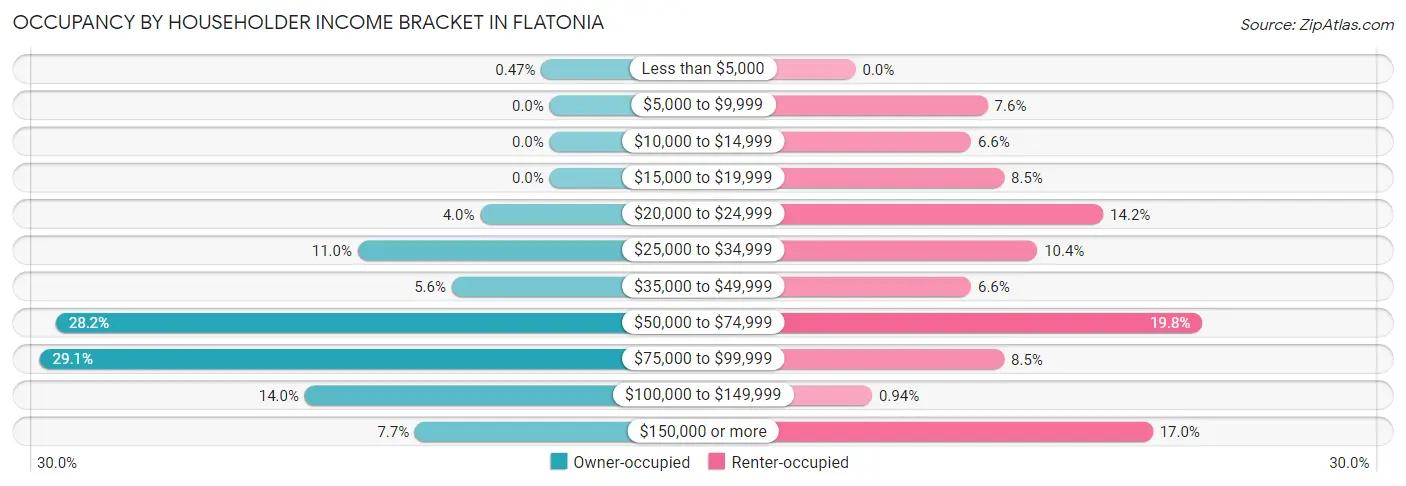
| Income Bracket | Owner-occupied | Renter-occupied |
| Less than $5,000 | 2 (0.5%) | 0 (0.0%) |
| $5,000 to $9,999 | 0 (0.0%) | 8 (7.5%) |
| $10,000 to $14,999 | 0 (0.0%) | 7 (6.6%) |
| $15,000 to $19,999 | 0 (0.0%) | 9 (8.5%) |
| $20,000 to $24,999 | 17 (4.0%) | 15 (14.1%) |
| $25,000 to $34,999 | 47 (11.0%) | 11 (10.4%) |
| $35,000 to $49,999 | 24 (5.6%) | 7 (6.6%) |
| $50,000 to $74,999 | 121 (28.2%) | 21 (19.8%) |
| $75,000 to $99,999 | 125 (29.1%) | 9 (8.5%) |
| $100,000 to $149,999 | 60 (14.0%) | 1 (0.9%) |
| $150,000 or more | 33 (7.7%) | 18 (17.0%) |
| Total | 429 (100.0%) | 106 (100.0%) |
Monthly Housing Cost Tiers in Flatonia
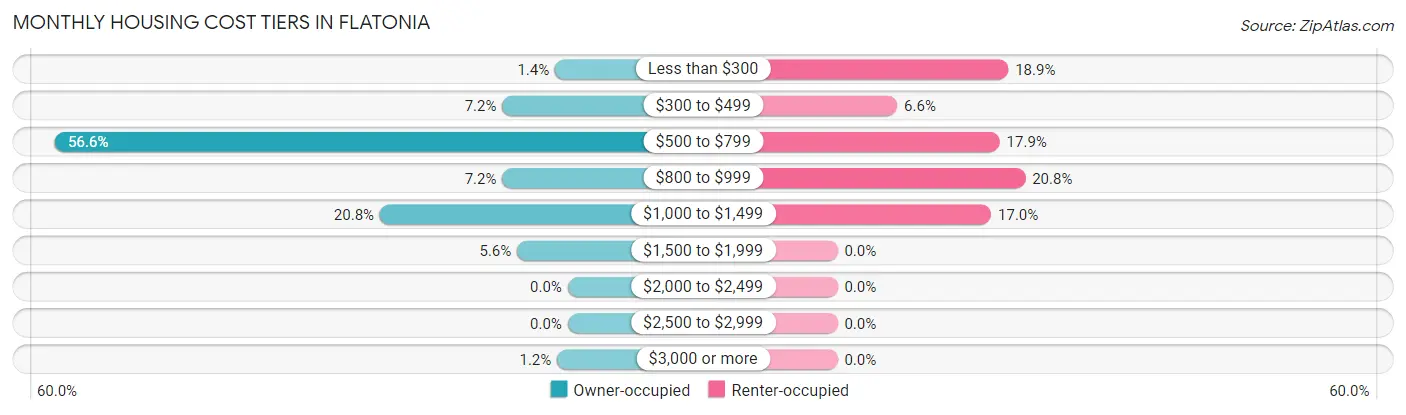
| Monthly Cost | Owner-occupied | Renter-occupied |
| Less than $300 | 6 (1.4%) | 20 (18.9%) |
| $300 to $499 | 31 (7.2%) | 7 (6.6%) |
| $500 to $799 | 243 (56.6%) | 19 (17.9%) |
| $800 to $999 | 31 (7.2%) | 22 (20.7%) |
| $1,000 to $1,499 | 89 (20.7%) | 18 (17.0%) |
| $1,500 to $1,999 | 24 (5.6%) | 0 (0.0%) |
| $2,000 to $2,499 | 0 (0.0%) | 0 (0.0%) |
| $2,500 to $2,999 | 0 (0.0%) | 0 (0.0%) |
| $3,000 or more | 5 (1.2%) | 0 (0.0%) |
| Total | 429 (100.0%) | 106 (100.0%) |
Physical Housing Characteristics in Flatonia
Housing Structures in Flatonia
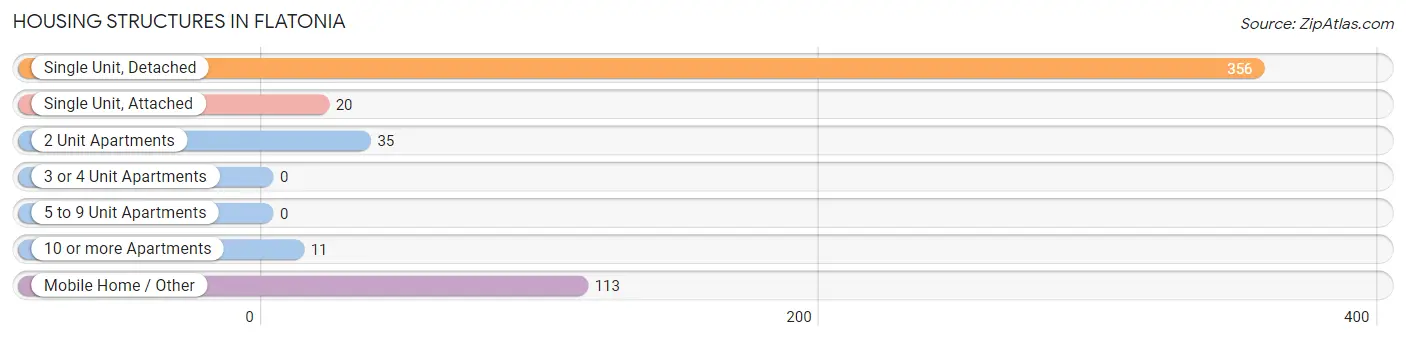
| Structure Type | # Housing Units | % Housing Units |
| Single Unit, Detached | 356 | 66.5% |
| Single Unit, Attached | 20 | 3.7% |
| 2 Unit Apartments | 35 | 6.5% |
| 3 or 4 Unit Apartments | 0 | 0.0% |
| 5 to 9 Unit Apartments | 0 | 0.0% |
| 10 or more Apartments | 11 | 2.1% |
| Mobile Home / Other | 113 | 21.1% |
| Total | 535 | 100.0% |
Housing Structures by Occupancy in Flatonia
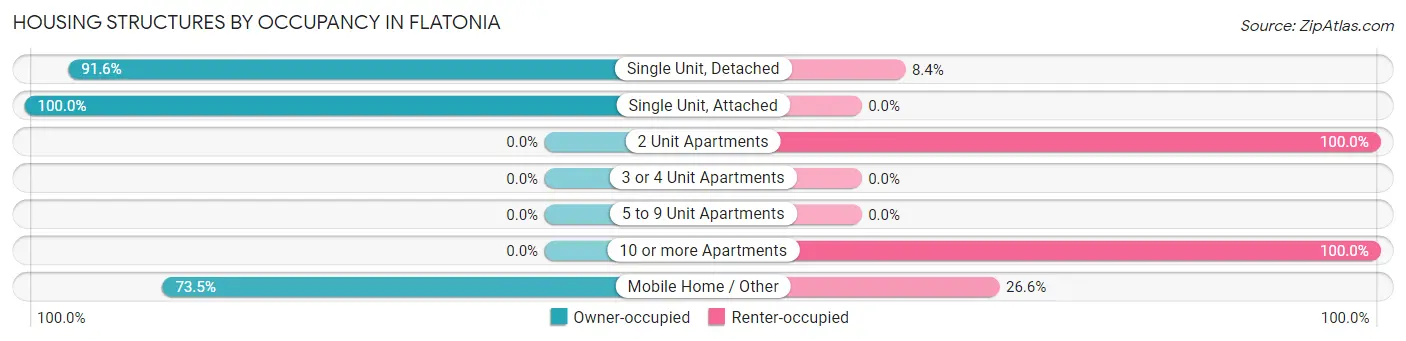
| Structure Type | Owner-occupied | Renter-occupied |
| Single Unit, Detached | 326 (91.6%) | 30 (8.4%) |
| Single Unit, Attached | 20 (100.0%) | 0 (0.0%) |
| 2 Unit Apartments | 0 (0.0%) | 35 (100.0%) |
| 3 or 4 Unit Apartments | 0 (0.0%) | 0 (0.0%) |
| 5 to 9 Unit Apartments | 0 (0.0%) | 0 (0.0%) |
| 10 or more Apartments | 0 (0.0%) | 11 (100.0%) |
| Mobile Home / Other | 83 (73.5%) | 30 (26.6%) |
| Total | 429 (80.2%) | 106 (19.8%) |
Housing Structures by Number of Rooms in Flatonia
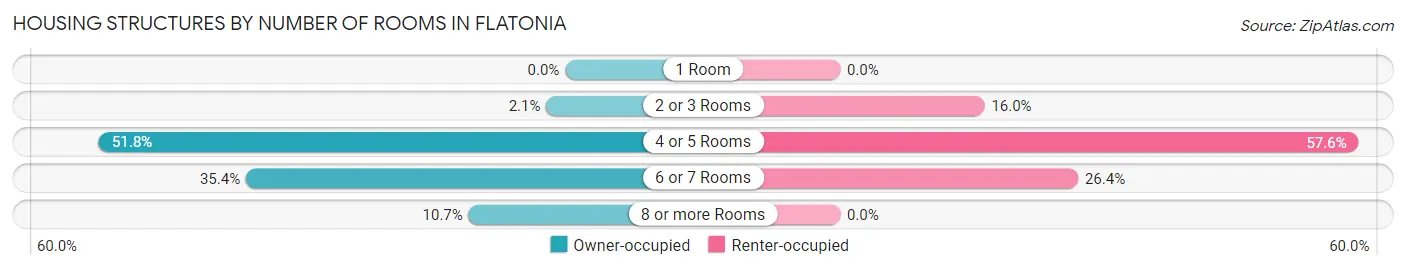
| Number of Rooms | Owner-occupied | Renter-occupied |
| 1 Room | 0 (0.0%) | 0 (0.0%) |
| 2 or 3 Rooms | 9 (2.1%) | 17 (16.0%) |
| 4 or 5 Rooms | 222 (51.7%) | 61 (57.6%) |
| 6 or 7 Rooms | 152 (35.4%) | 28 (26.4%) |
| 8 or more Rooms | 46 (10.7%) | 0 (0.0%) |
| Total | 429 (100.0%) | 106 (100.0%) |
Housing Structure by Heating Type in Flatonia
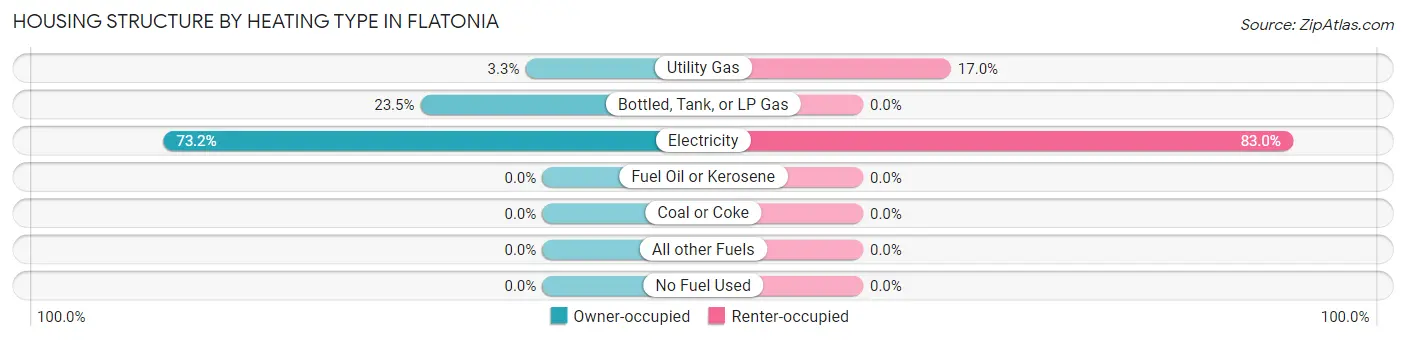
| Heating Type | Owner-occupied | Renter-occupied |
| Utility Gas | 14 (3.3%) | 18 (17.0%) |
| Bottled, Tank, or LP Gas | 101 (23.5%) | 0 (0.0%) |
| Electricity | 314 (73.2%) | 88 (83.0%) |
| Fuel Oil or Kerosene | 0 (0.0%) | 0 (0.0%) |
| Coal or Coke | 0 (0.0%) | 0 (0.0%) |
| All other Fuels | 0 (0.0%) | 0 (0.0%) |
| No Fuel Used | 0 (0.0%) | 0 (0.0%) |
| Total | 429 (100.0%) | 106 (100.0%) |
Household Vehicle Usage in Flatonia
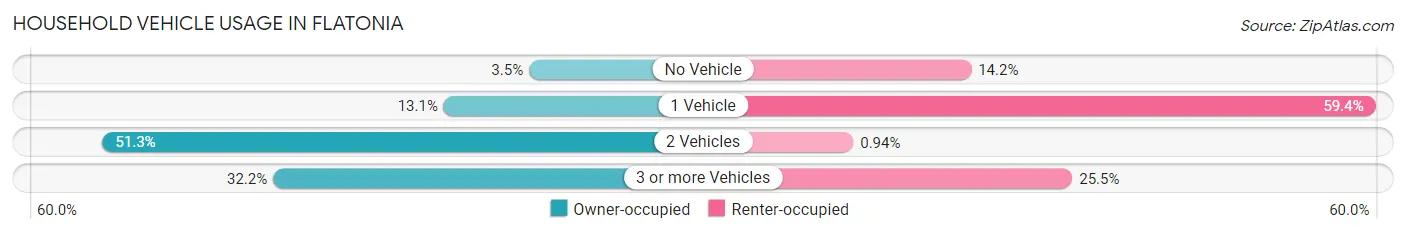
| Vehicles per Household | Owner-occupied | Renter-occupied |
| No Vehicle | 15 (3.5%) | 15 (14.1%) |
| 1 Vehicle | 56 (13.1%) | 63 (59.4%) |
| 2 Vehicles | 220 (51.3%) | 1 (0.9%) |
| 3 or more Vehicles | 138 (32.2%) | 27 (25.5%) |
| Total | 429 (100.0%) | 106 (100.0%) |
Real Estate & Mortgages in Flatonia
Real Estate and Mortgage Overview in Flatonia
| Characteristic | Without Mortgage | With Mortgage |
| Housing Units | 295 | 134 |
| Median Property Value | $171,000 | $172,000 |
| Median Household Income | $67,386 | $5 |
| Monthly Housing Costs | $655 | $5 |
| Real Estate Taxes | $2,581 | $0 |
Property Value by Mortgage Status in Flatonia
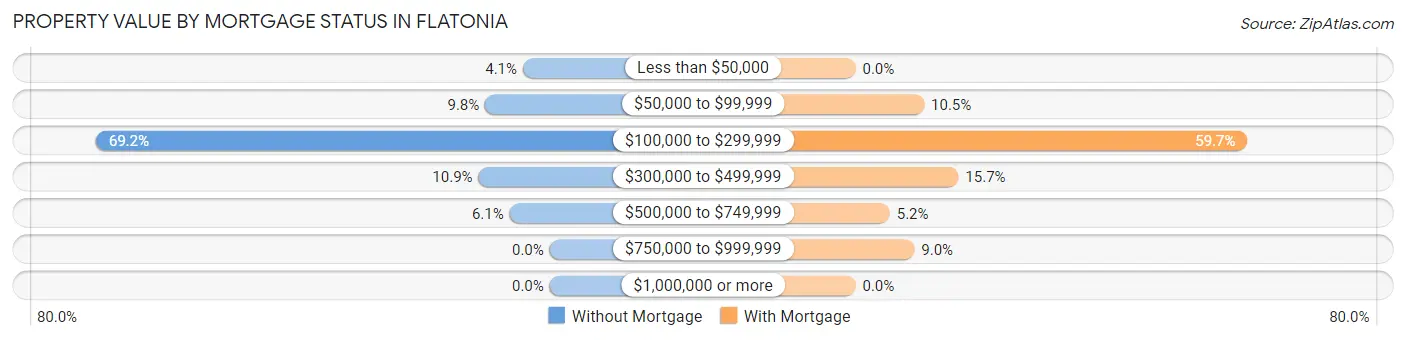
| Property Value | Without Mortgage | With Mortgage |
| Less than $50,000 | 12 (4.1%) | 0 (0.0%) |
| $50,000 to $99,999 | 29 (9.8%) | 14 (10.4%) |
| $100,000 to $299,999 | 204 (69.2%) | 80 (59.7%) |
| $300,000 to $499,999 | 32 (10.8%) | 21 (15.7%) |
| $500,000 to $749,999 | 18 (6.1%) | 7 (5.2%) |
| $750,000 to $999,999 | 0 (0.0%) | 12 (9.0%) |
| $1,000,000 or more | 0 (0.0%) | 0 (0.0%) |
| Total | 295 (100.0%) | 134 (100.0%) |
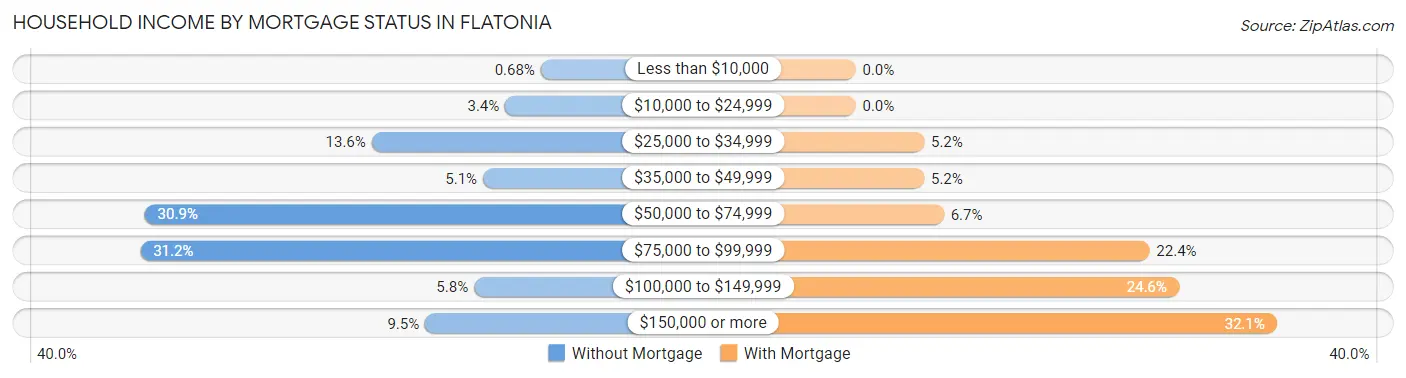
Household Income by Mortgage Status in Flatonia
| Household Income | Without Mortgage | With Mortgage |
| Less than $10,000 | 2 (0.7%) | 0 (0.0%) |
| $10,000 to $24,999 | 10 (3.4%) | 0 (0.0%) |
| $25,000 to $34,999 | 40 (13.6%) | 7 (5.2%) |
| $35,000 to $49,999 | 15 (5.1%) | 7 (5.2%) |
| $50,000 to $74,999 | 91 (30.8%) | 9 (6.7%) |
| $75,000 to $99,999 | 92 (31.2%) | 30 (22.4%) |
| $100,000 to $149,999 | 17 (5.8%) | 33 (24.6%) |
| $150,000 or more | 28 (9.5%) | 43 (32.1%) |
| Total | 295 (100.0%) | 134 (100.0%) |
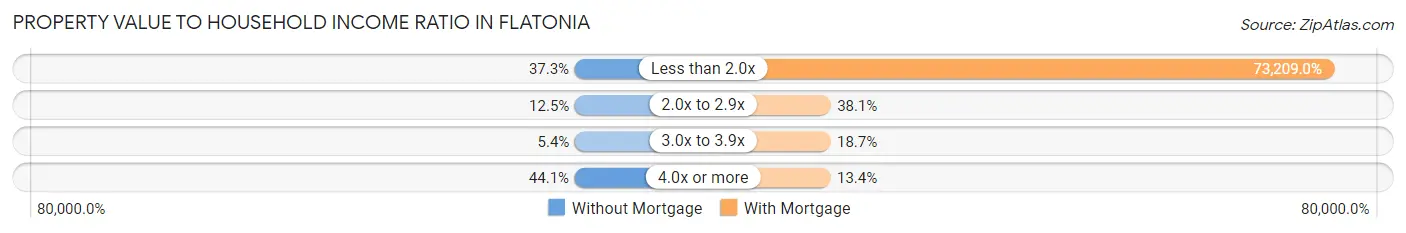
Property Value to Household Income Ratio in Flatonia
| Value-to-Income Ratio | Without Mortgage | With Mortgage |
| Less than 2.0x | 110 (37.3%) | 98,100 (73,209.0%) |
| 2.0x to 2.9x | 37 (12.5%) | 51 (38.1%) |
| 3.0x to 3.9x | 16 (5.4%) | 25 (18.7%) |
| 4.0x or more | 130 (44.1%) | 18 (13.4%) |
| Total | 295 (100.0%) | 134 (100.0%) |
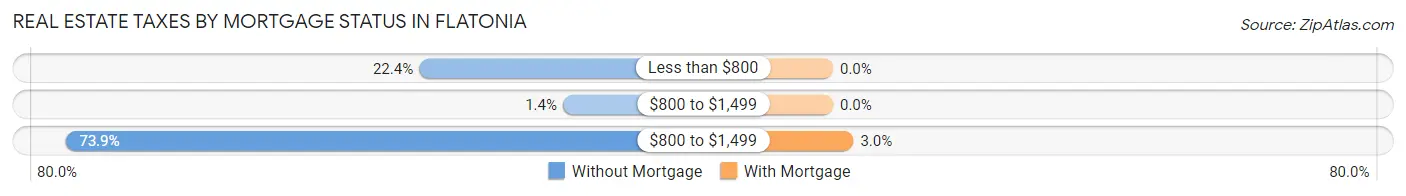
Real Estate Taxes by Mortgage Status in Flatonia
| Property Taxes | Without Mortgage | With Mortgage |
| Less than $800 | 66 (22.4%) | 0 (0.0%) |
| $800 to $1,499 | 4 (1.4%) | 0 (0.0%) |
| $800 to $1,499 | 218 (73.9%) | 4 (3.0%) |
| Total | 295 (100.0%) | 134 (100.0%) |
Health & Disability in Flatonia
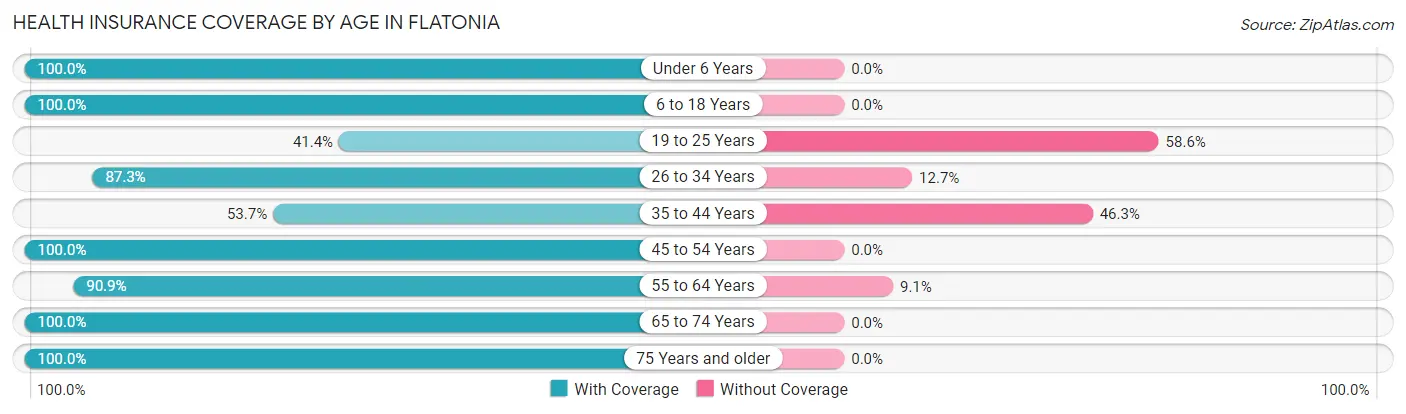
Health Insurance Coverage by Age in Flatonia
| Age Bracket | With Coverage | Without Coverage |
| Under 6 Years | 107 (100.0%) | 0 (0.0%) |
| 6 to 18 Years | 454 (100.0%) | 0 (0.0%) |
| 19 to 25 Years | 24 (41.4%) | 34 (58.6%) |
| 26 to 34 Years | 69 (87.3%) | 10 (12.7%) |
| 35 to 44 Years | 175 (53.7%) | 151 (46.3%) |
| 45 to 54 Years | 236 (100.0%) | 0 (0.0%) |
| 55 to 64 Years | 170 (90.9%) | 17 (9.1%) |
| 65 to 74 Years | 188 (100.0%) | 0 (0.0%) |
| 75 Years and older | 124 (100.0%) | 0 (0.0%) |
| Total | 1,547 (87.9%) | 212 (12.0%) |
Health Insurance Coverage by Citizenship Status in Flatonia

| Citizenship Status | With Coverage | Without Coverage |
| Native Born | 107 (100.0%) | 0 (0.0%) |
| Foreign Born, Citizen | 454 (100.0%) | 0 (0.0%) |
| Foreign Born, not a Citizen | 24 (41.4%) | 34 (58.6%) |
Health Insurance Coverage by Household Income in Flatonia
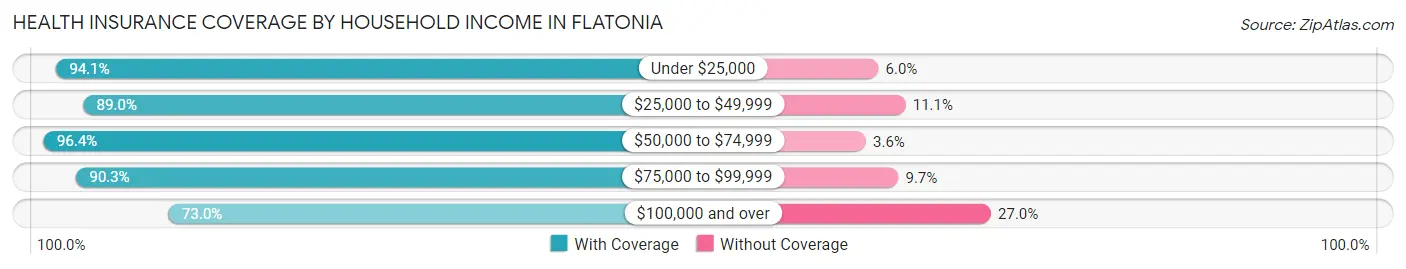
| Household Income | With Coverage | Without Coverage |
| Under $25,000 | 174 (94.1%) | 11 (5.9%) |
| $25,000 to $49,999 | 169 (88.9%) | 21 (11.1%) |
| $50,000 to $74,999 | 453 (96.4%) | 17 (3.6%) |
| $75,000 to $99,999 | 438 (90.3%) | 47 (9.7%) |
| $100,000 and over | 313 (73.0%) | 116 (27.0%) |
Public vs Private Health Insurance Coverage by Age in Flatonia
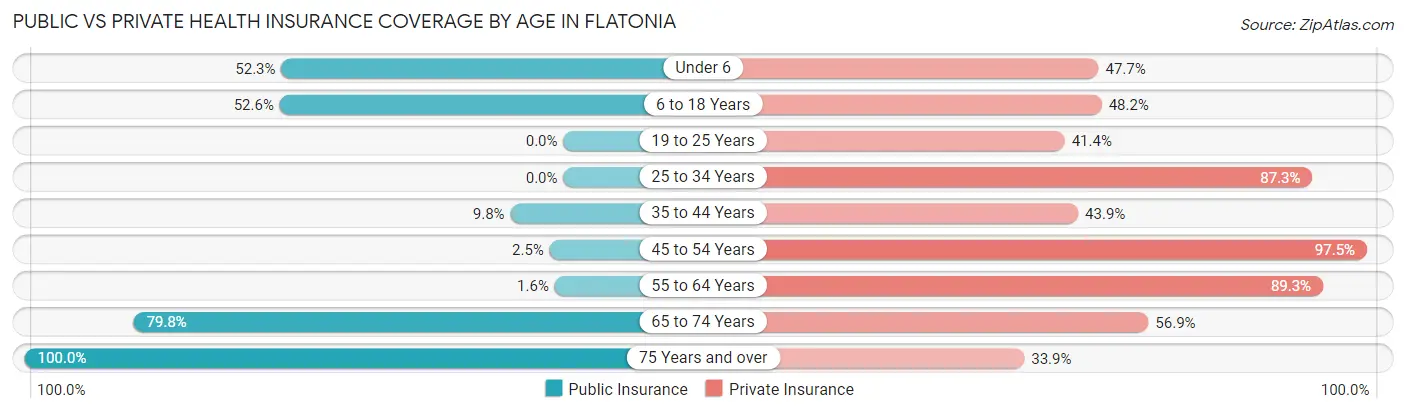
| Age Bracket | Public Insurance | Private Insurance |
| Under 6 | 56 (52.3%) | 51 (47.7%) |
| 6 to 18 Years | 239 (52.6%) | 219 (48.2%) |
| 19 to 25 Years | 0 (0.0%) | 24 (41.4%) |
| 25 to 34 Years | 0 (0.0%) | 69 (87.3%) |
| 35 to 44 Years | 32 (9.8%) | 143 (43.9%) |
| 45 to 54 Years | 6 (2.5%) | 230 (97.5%) |
| 55 to 64 Years | 3 (1.6%) | 167 (89.3%) |
| 65 to 74 Years | 150 (79.8%) | 107 (56.9%) |
| 75 Years and over | 124 (100.0%) | 42 (33.9%) |
| Total | 610 (34.7%) | 1,052 (59.8%) |
Disability Status by Sex by Age in Flatonia
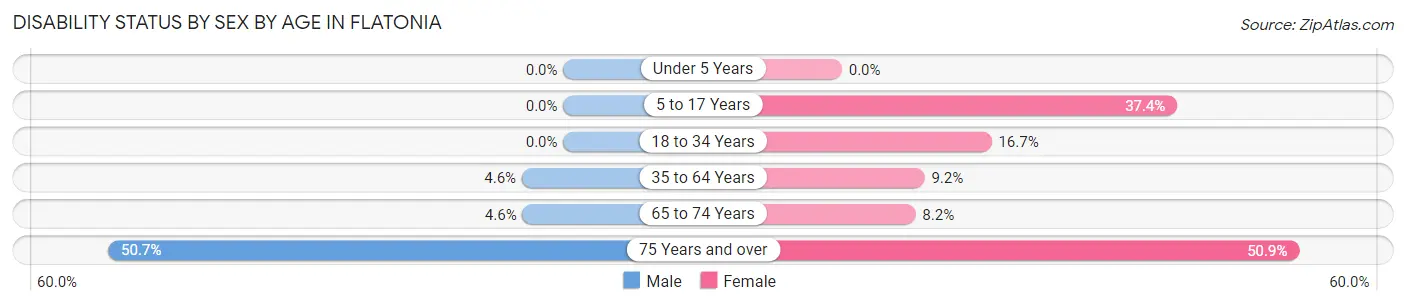
| Age Bracket | Male | Female |
| Under 5 Years | 0 (0.0%) | 0 (0.0%) |
| 5 to 17 Years | 0 (0.0%) | 62 (37.3%) |
| 18 to 34 Years | 0 (0.0%) | 10 (16.7%) |
| 35 to 64 Years | 20 (4.6%) | 29 (9.2%) |
| 65 to 74 Years | 3 (4.5%) | 10 (8.2%) |
| 75 Years and over | 36 (50.7%) | 27 (50.9%) |
Disability Class by Sex by Age in Flatonia
Disability Class: Hearing Difficulty
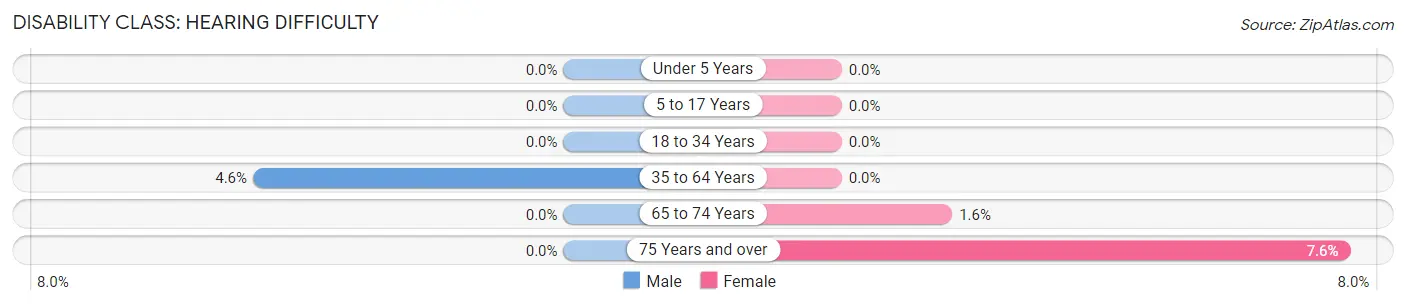
| Age Bracket | Male | Female |
| Under 5 Years | 0 (0.0%) | 0 (0.0%) |
| 5 to 17 Years | 0 (0.0%) | 0 (0.0%) |
| 18 to 34 Years | 0 (0.0%) | 0 (0.0%) |
| 35 to 64 Years | 20 (4.6%) | 0 (0.0%) |
| 65 to 74 Years | 0 (0.0%) | 2 (1.6%) |
| 75 Years and over | 0 (0.0%) | 4 (7.5%) |
Disability Class: Vision Difficulty
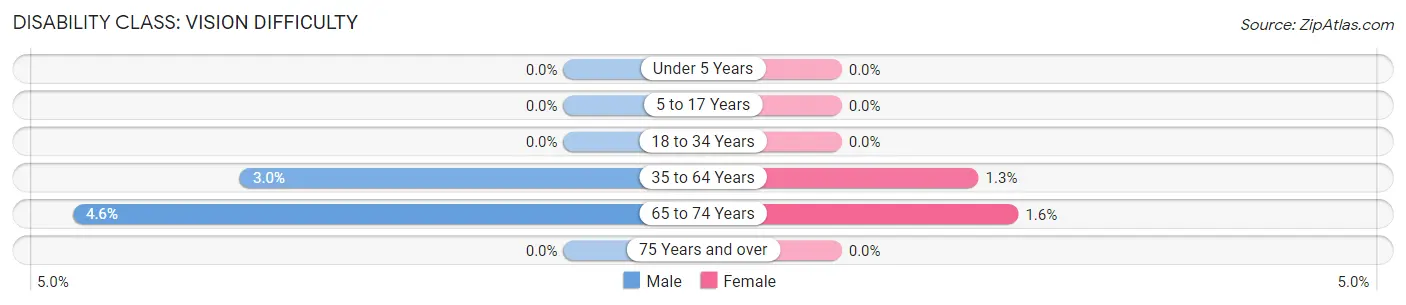
| Age Bracket | Male | Female |
| Under 5 Years | 0 (0.0%) | 0 (0.0%) |
| 5 to 17 Years | 0 (0.0%) | 0 (0.0%) |
| 18 to 34 Years | 0 (0.0%) | 0 (0.0%) |
| 35 to 64 Years | 13 (3.0%) | 4 (1.3%) |
| 65 to 74 Years | 3 (4.5%) | 2 (1.6%) |
| 75 Years and over | 0 (0.0%) | 0 (0.0%) |
Disability Class: Cognitive Difficulty
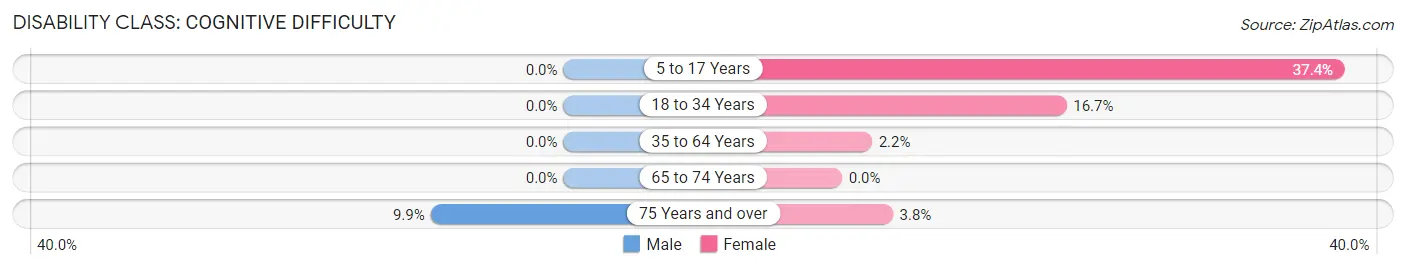
| Age Bracket | Male | Female |
| 5 to 17 Years | 0 (0.0%) | 62 (37.3%) |
| 18 to 34 Years | 0 (0.0%) | 10 (16.7%) |
| 35 to 64 Years | 0 (0.0%) | 7 (2.2%) |
| 65 to 74 Years | 0 (0.0%) | 0 (0.0%) |
| 75 Years and over | 7 (9.9%) | 2 (3.8%) |
Disability Class: Ambulatory Difficulty
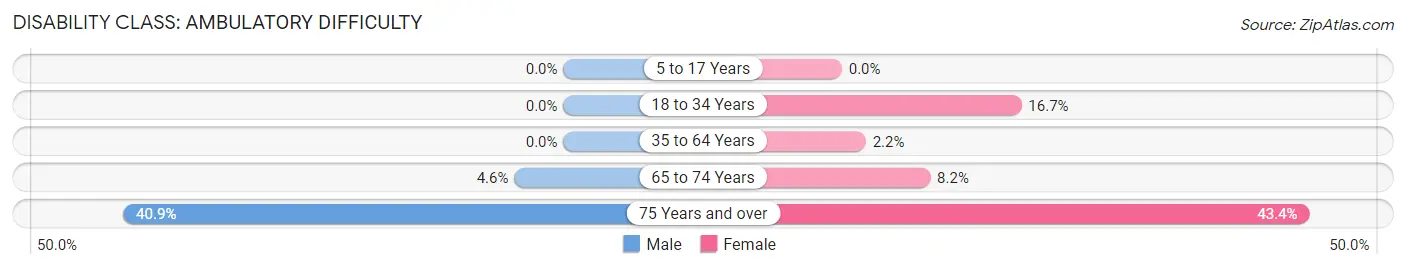
| Age Bracket | Male | Female |
| 5 to 17 Years | 0 (0.0%) | 0 (0.0%) |
| 18 to 34 Years | 0 (0.0%) | 10 (16.7%) |
| 35 to 64 Years | 0 (0.0%) | 7 (2.2%) |
| 65 to 74 Years | 3 (4.5%) | 10 (8.2%) |
| 75 Years and over | 29 (40.8%) | 23 (43.4%) |
Disability Class: Self-Care Difficulty
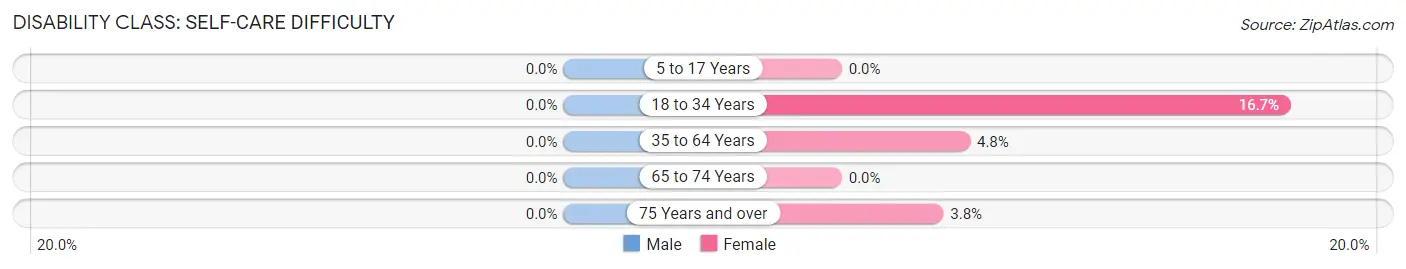
| Age Bracket | Male | Female |
| 5 to 17 Years | 0 (0.0%) | 0 (0.0%) |
| 18 to 34 Years | 0 (0.0%) | 10 (16.7%) |
| 35 to 64 Years | 0 (0.0%) | 15 (4.8%) |
| 65 to 74 Years | 0 (0.0%) | 0 (0.0%) |
| 75 Years and over | 0 (0.0%) | 2 (3.8%) |
Technology Access in Flatonia
Computing Device Access in Flatonia
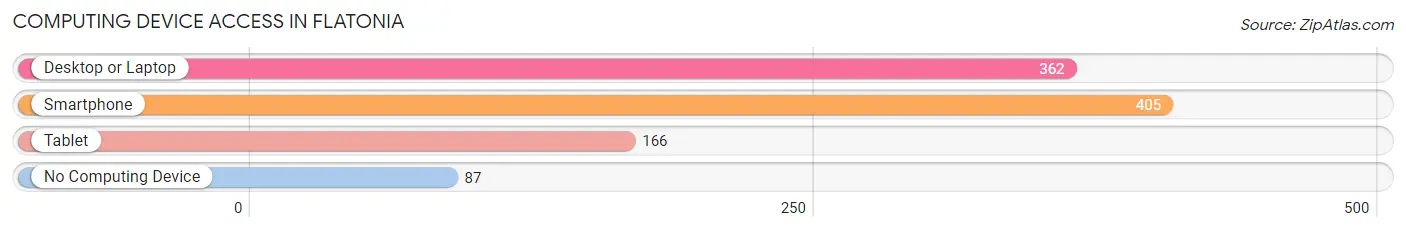
| Device Type | # Households | % Households |
| Desktop or Laptop | 362 | 67.7% |
| Smartphone | 405 | 75.7% |
| Tablet | 166 | 31.0% |
| No Computing Device | 87 | 16.3% |
| Total | 535 | 100.0% |
Internet Access in Flatonia
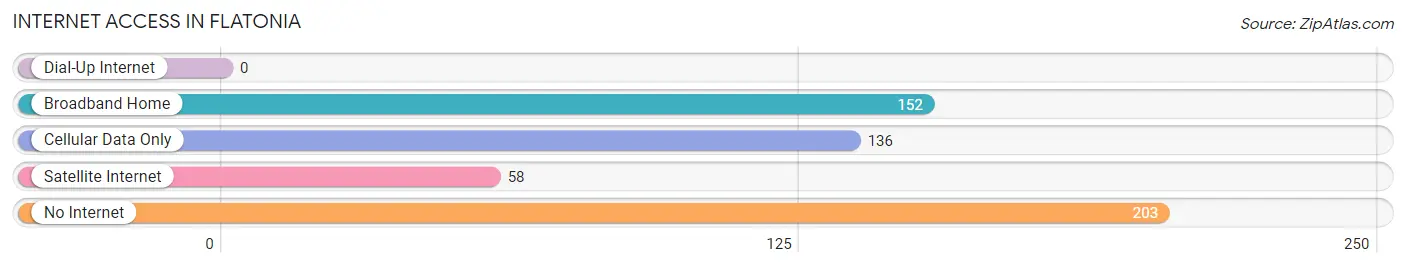
| Internet Type | # Households | % Households |
| Dial-Up Internet | 0 | 0.0% |
| Broadband Home | 152 | 28.4% |
| Cellular Data Only | 136 | 25.4% |
| Satellite Internet | 58 | 10.8% |
| No Internet | 203 | 37.9% |
| Total | 535 | 100.0% |
Flatonia Summary
Flatonia is a small town located in Fayette County, Texas, United States. It is situated along Interstate 10, about halfway between San Antonio and Houston. The population was 1,383 at the 2010 census.
History
Flatonia was founded in 1874 by the Galveston, Harrisburg and San Antonio Railway. The town was named after a local landowner, John Henry Flatonia. The town was incorporated in 1876 and soon became a major shipping point for cattle and cotton. The town was also home to a large German-speaking population, which was reflected in the architecture of the town.
In the early 1900s, Flatonia was a major stop on the Texas and New Orleans Railroad. The town was also home to a large cotton gin and a number of other businesses.
Geography
Flatonia is located at the intersection of Interstate 10 and U.S. Route 90, about halfway between San Antonio and Houston. The town is situated on the western edge of the Blackland Prairie, an area of rolling hills and fertile soil. The town is located in the Central Time Zone.
The climate in Flatonia is generally mild, with hot summers and mild winters. The average annual temperature is around 70 degrees Fahrenheit.
Economy
The economy of Flatonia is largely based on agriculture and ranching. The town is home to a number of farms and ranches, as well as a number of businesses related to the agricultural industry.
The town is also home to a number of small businesses, including restaurants, retail stores, and service providers. The town is also home to a number of manufacturing companies, including a furniture factory and a plastics factory.
Demographics
As of the 2010 census, the population of Flatonia was 1,383. The racial makeup of the town was 79.3% White, 15.2% Hispanic or Latino, 1.2% African American, 0.7% Native American, 0.2% Asian, and 3.4% from other races.
The median household income in Flatonia was $37,917, and the median family income was $45,625. The per capita income was $18,945. About 16.2% of the population was below the poverty line.
The town is served by the Flatonia Independent School District, which includes two elementary schools, a middle school, and a high school. The town is also home to a number of churches, including Baptist, Methodist, and Catholic.
Common Questions
What is Per Capita Income in Flatonia?
Per Capita income in Flatonia is $25,507.
What is the Median Family Income in Flatonia?
Median Family Income in Flatonia is $70,893.
What is the Median Household income in Flatonia?
Median Household Income in Flatonia is $66,477.
What is Income or Wage Gap in Flatonia?
Income or Wage Gap in Flatonia is 30.6%.
Women in Flatonia earn 69.4 cents for every dollar earned by a man.
What is Inequality or Gini Index in Flatonia?
Inequality or Gini Index in Flatonia is 0.32.
What is the Total Population of Flatonia?
Total Population of Flatonia is 1,801.
What is the Total Male Population of Flatonia?
Total Male Population of Flatonia is 1,018.
What is the Total Female Population of Flatonia?
Total Female Population of Flatonia is 783.
What is the Ratio of Males per 100 Females in Flatonia?
There are 130.01 Males per 100 Females in Flatonia.
What is the Ratio of Females per 100 Males in Flatonia?
There are 76.92 Females per 100 Males in Flatonia.
What is the Median Population Age in Flatonia?
Median Population Age in Flatonia is 40.4 Years.
What is the Average Family Size in Flatonia
Average Family Size in Flatonia is 3.7 People.
What is the Average Household Size in Flatonia
Average Household Size in Flatonia is 3.3 People.
How Large is the Labor Force in Flatonia?
There are 793 People in the Labor Forcein in Flatonia.
What is the Percentage of People in the Labor Force in Flatonia?
59.5% of People are in the Labor Force in Flatonia.
What is the Unemployment Rate in Flatonia?
Unemployment Rate in Flatonia is 0.3%.