Falls City, TX Map & Demographics
Falls City Map
Falls City Overview
$32,008
PER CAPITA INCOME
$116,250
AVG FAMILY INCOME
$78,750
AVG HOUSEHOLD INCOME
40.4%
WAGE / INCOME GAP [ % ]
59.6¢/ $1
WAGE / INCOME GAP [ $ ]
0.39
INEQUALITY / GINI INDEX
900
TOTAL POPULATION
497
MALE POPULATION
403
FEMALE POPULATION
123.33
MALES / 100 FEMALES
81.09
FEMALES / 100 MALES
32.2
MEDIAN AGE
3.8
AVG FAMILY SIZE
3.0
AVG HOUSEHOLD SIZE
442
LABOR FORCE [ PEOPLE ]
70.3%
PERCENT IN LABOR FORCE
Falls City Zip Codes
Falls City Area Codes
Income in Falls City
Income Overview in Falls City
Per Capita Income in Falls City is $32,008, while median incomes of families and households are $116,250 and $78,750 respectively.
| Characteristic | Number | Measure |
| Per Capita Income | 900 | $32,008 |
| Median Family Income | 200 | $116,250 |
| Mean Family Income | 200 | $106,575 |
| Median Household Income | 296 | $78,750 |
| Mean Household Income | 296 | $88,336 |
| Income Deficit | 200 | $0 |
| Wage / Income Gap (%) | 900 | 40.40% |
| Wage / Income Gap ($) | 900 | 59.60¢ per $1 |
| Gini / Inequality Index | 900 | 0.39 |
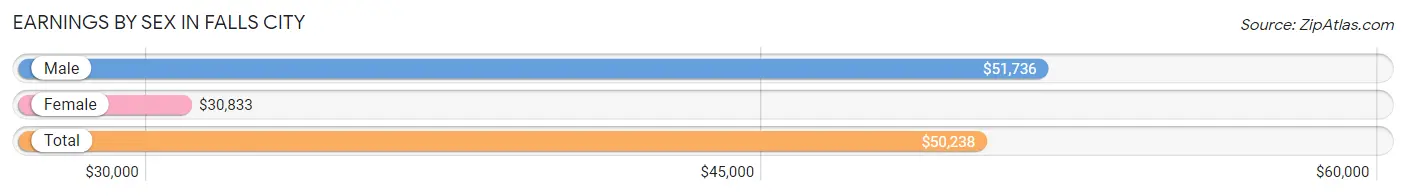
Earnings by Sex in Falls City
Average Earnings in Falls City are $50,238, $51,736 for men and $30,833 for women, a difference of 40.4%.
| Sex | Number | Average Earnings |
| Male | 220 (47.0%) | $51,736 |
| Female | 248 (53.0%) | $30,833 |
| Total | 468 (100.0%) | $50,238 |
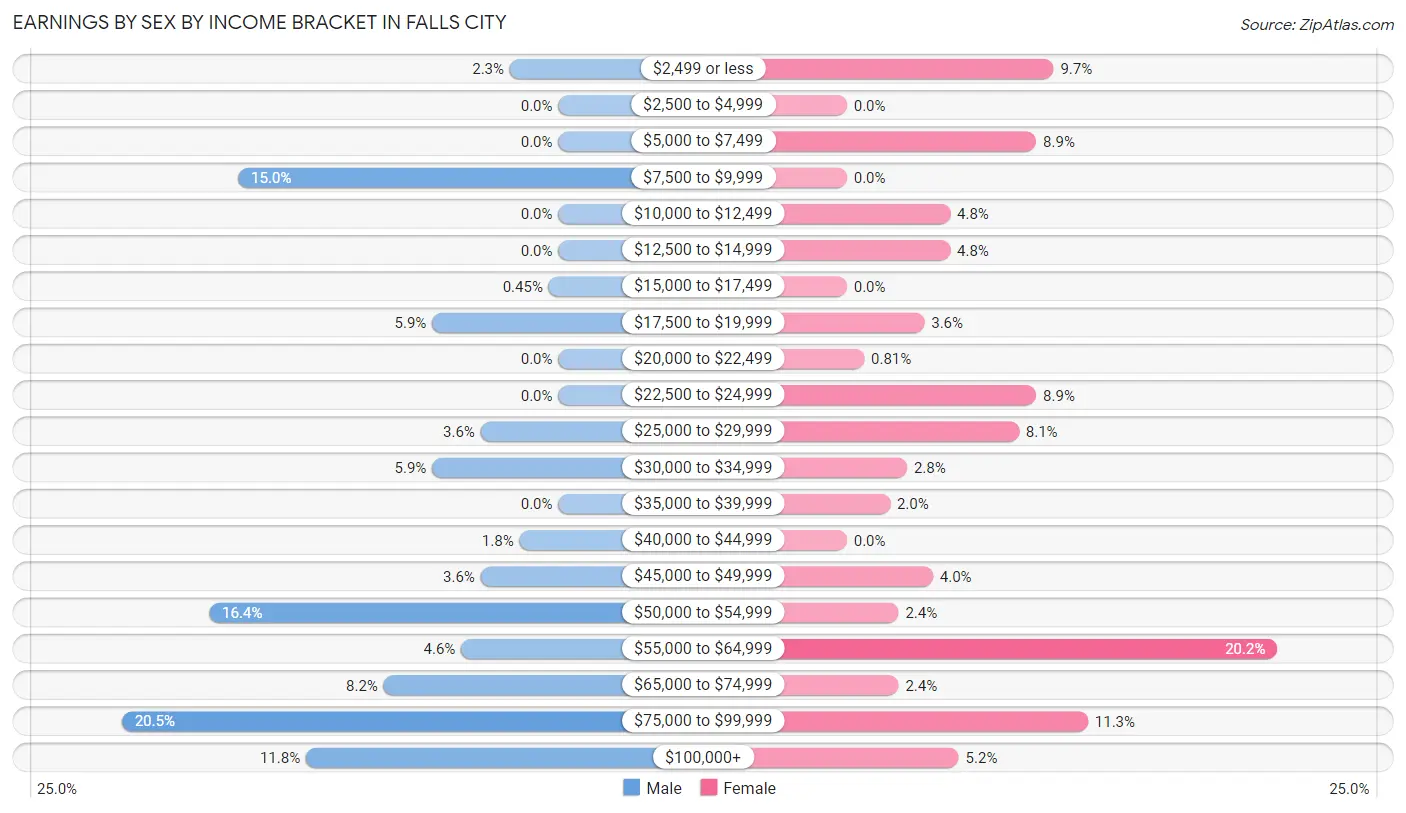
Earnings by Sex by Income Bracket in Falls City
The most common earnings brackets in Falls City are $75,000 to $99,999 for men (45 | 20.4%) and $55,000 to $64,999 for women (50 | 20.2%).
| Income | Male | Female |
| $2,499 or less | 5 (2.3%) | 24 (9.7%) |
| $2,500 to $4,999 | 0 (0.0%) | 0 (0.0%) |
| $5,000 to $7,499 | 0 (0.0%) | 22 (8.9%) |
| $7,500 to $9,999 | 33 (15.0%) | 0 (0.0%) |
| $10,000 to $12,499 | 0 (0.0%) | 12 (4.8%) |
| $12,500 to $14,999 | 0 (0.0%) | 12 (4.8%) |
| $15,000 to $17,499 | 1 (0.4%) | 0 (0.0%) |
| $17,500 to $19,999 | 13 (5.9%) | 9 (3.6%) |
| $20,000 to $22,499 | 0 (0.0%) | 2 (0.8%) |
| $22,500 to $24,999 | 0 (0.0%) | 22 (8.9%) |
| $25,000 to $29,999 | 8 (3.6%) | 20 (8.1%) |
| $30,000 to $34,999 | 13 (5.9%) | 7 (2.8%) |
| $35,000 to $39,999 | 0 (0.0%) | 5 (2.0%) |
| $40,000 to $44,999 | 4 (1.8%) | 0 (0.0%) |
| $45,000 to $49,999 | 8 (3.6%) | 10 (4.0%) |
| $50,000 to $54,999 | 36 (16.4%) | 6 (2.4%) |
| $55,000 to $64,999 | 10 (4.5%) | 50 (20.2%) |
| $65,000 to $74,999 | 18 (8.2%) | 6 (2.4%) |
| $75,000 to $99,999 | 45 (20.4%) | 28 (11.3%) |
| $100,000+ | 26 (11.8%) | 13 (5.2%) |
| Total | 220 (100.0%) | 248 (100.0%) |
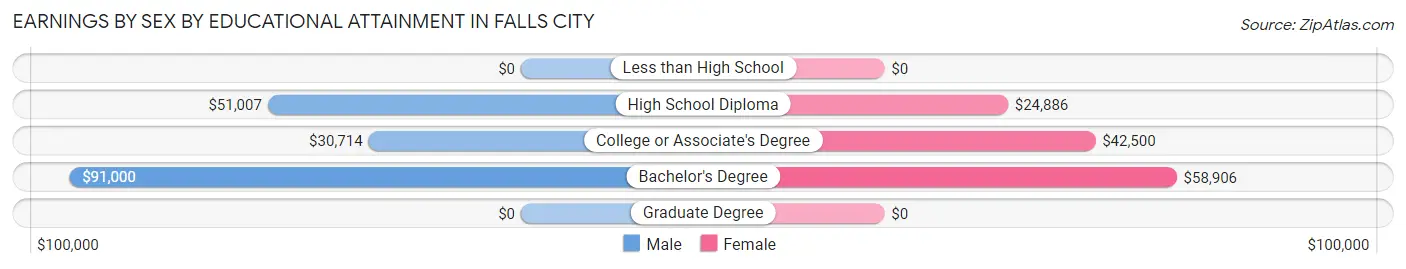
Earnings by Sex by Educational Attainment in Falls City
Average earnings in Falls City are $52,292 for men and $45,875 for women, a difference of 12.3%. Men with an educational attainment of bachelor's degree enjoy the highest average annual earnings of $91,000, while those with college or associate's degree education earn the least with $30,714. Women with an educational attainment of bachelor's degree earn the most with the average annual earnings of $58,906, while those with high school diploma education have the smallest earnings of $24,886.
| Educational Attainment | Male Income | Female Income |
| Less than High School | - | - |
| High School Diploma | $51,007 | $24,886 |
| College or Associate's Degree | $30,714 | $42,500 |
| Bachelor's Degree | $91,000 | $58,906 |
| Graduate Degree | - | - |
| Total | $52,292 | $45,875 |
Family Income in Falls City
Family Income Brackets in Falls City
According to the Falls City family income data, there are 66 families falling into the $150,000 to $199,999 income range, which is the most common income bracket and makes up 33.0% of all families.
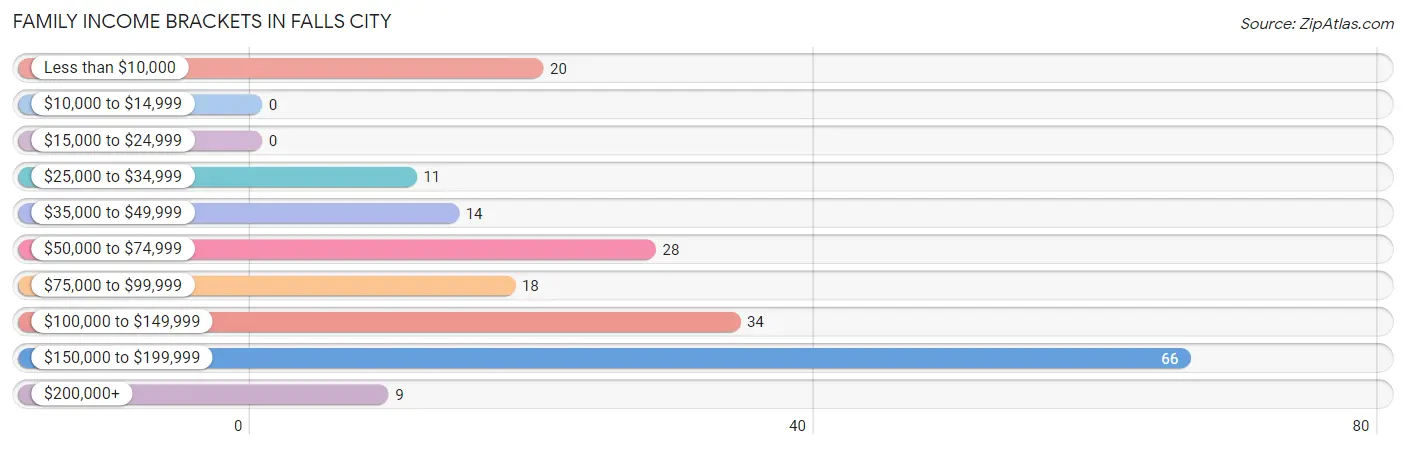
| Income Bracket | # Families | % Families |
| Less than $10,000 | 20 | 10.0% |
| $10,000 to $14,999 | 0 | 0.0% |
| $15,000 to $24,999 | 0 | 0.0% |
| $25,000 to $34,999 | 11 | 5.5% |
| $35,000 to $49,999 | 14 | 7.0% |
| $50,000 to $74,999 | 28 | 14.0% |
| $75,000 to $99,999 | 18 | 9.0% |
| $100,000 to $149,999 | 34 | 17.0% |
| $150,000 to $199,999 | 66 | 33.0% |
| $200,000+ | 9 | 4.5% |
Family Income by Famaliy Size in Falls City
5-person families (21 | 10.5%) account for the highest median family income in Falls City with $172,981 per family, while 3-person families (40 | 20.0%) have the highest median income of $52,708 per family member.
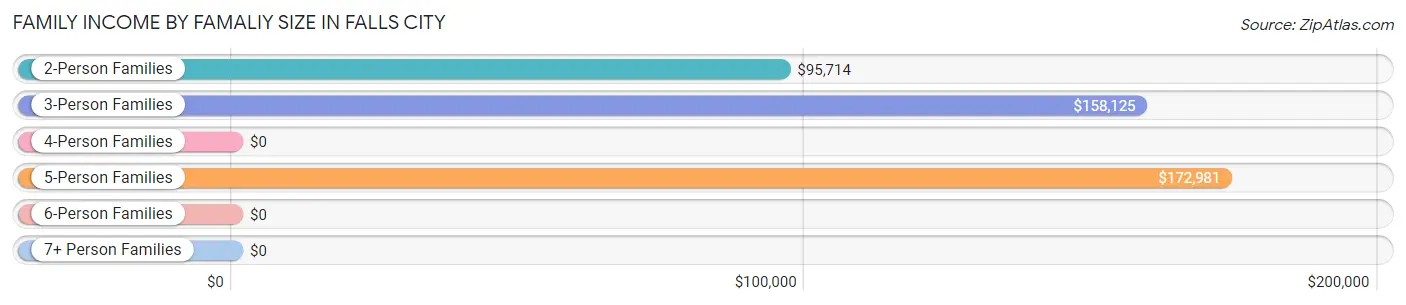
| Income Bracket | # Families | Median Income |
| 2-Person Families | 90 (45.0%) | $95,714 |
| 3-Person Families | 40 (20.0%) | $158,125 |
| 4-Person Families | 42 (21.0%) | $0 |
| 5-Person Families | 21 (10.5%) | $172,981 |
| 6-Person Families | 7 (3.5%) | $0 |
| 7+ Person Families | 0 (0.0%) | $0 |
| Total | 200 (100.0%) | $116,250 |
Family Income by Number of Earners in Falls City
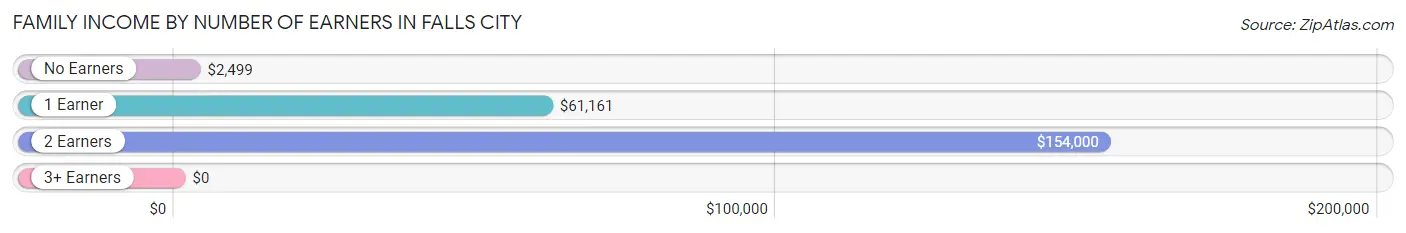
| Number of Earners | # Families | Median Income |
| No Earners | 35 (17.5%) | $2,499 |
| 1 Earner | 45 (22.5%) | $61,161 |
| 2 Earners | 102 (51.0%) | $154,000 |
| 3+ Earners | 18 (9.0%) | $0 |
| Total | 200 (100.0%) | $116,250 |
Household Income in Falls City
Household Income Brackets in Falls City
With 68 households falling in the category, the $150,000 to $199,999 income range is the most frequent in Falls City, accounting for 23.0% of all households.
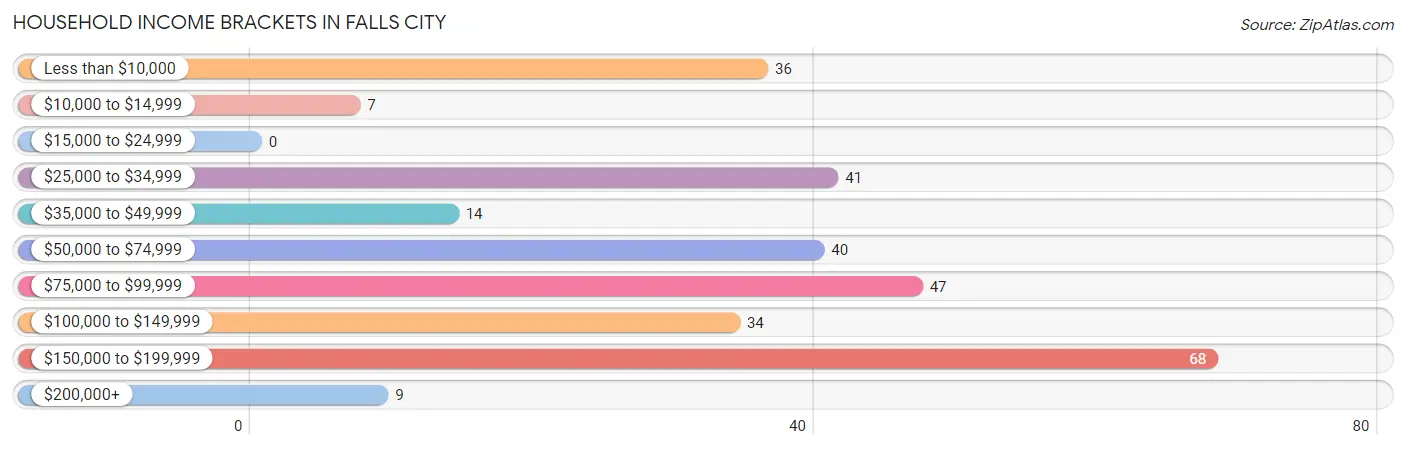
| Income Bracket | # Households | % Households |
| Less than $10,000 | 36 | 12.2% |
| $10,000 to $14,999 | 7 | 2.4% |
| $15,000 to $24,999 | 0 | 0.0% |
| $25,000 to $34,999 | 41 | 13.9% |
| $35,000 to $49,999 | 14 | 4.7% |
| $50,000 to $74,999 | 40 | 13.5% |
| $75,000 to $99,999 | 47 | 15.9% |
| $100,000 to $149,999 | 34 | 11.5% |
| $150,000 to $199,999 | 68 | 23.0% |
| $200,000+ | 9 | 3.0% |
Household Income by Householder Age in Falls City
The median household income in Falls City is $78,750, with the highest median household income of $81,767 found in the 25 to 44 years age bracket for the primary householder. A total of 153 households (51.7%) fall into this category.
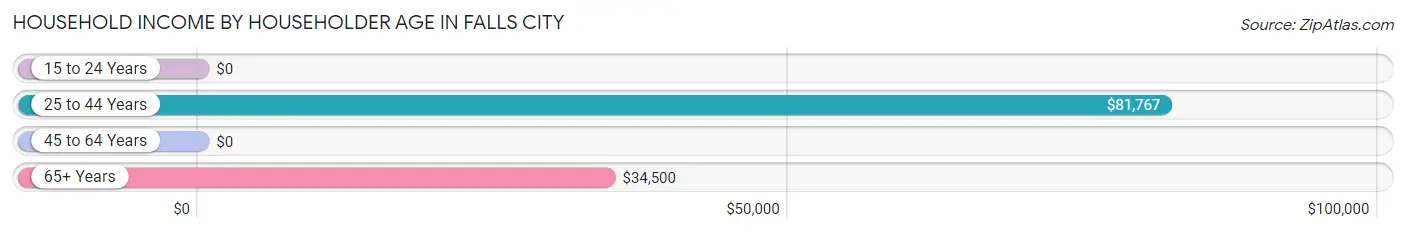
| Income Bracket | # Households | Median Income |
| 15 to 24 Years | 0 (0.0%) | $0 |
| 25 to 44 Years | 153 (51.7%) | $81,767 |
| 45 to 64 Years | 43 (14.5%) | $0 |
| 65+ Years | 100 (33.8%) | $34,500 |
| Total | 296 (100.0%) | $78,750 |
Poverty in Falls City
Income Below Poverty by Sex and Age in Falls City
With 18.1% poverty level for males and 15.4% for females among the residents of Falls City, 6 to 11 year old males and under 5 year old females are the most vulnerable to poverty, with 57 males (40.4%) and 11 females (61.1%) in their respective age groups living below the poverty level.
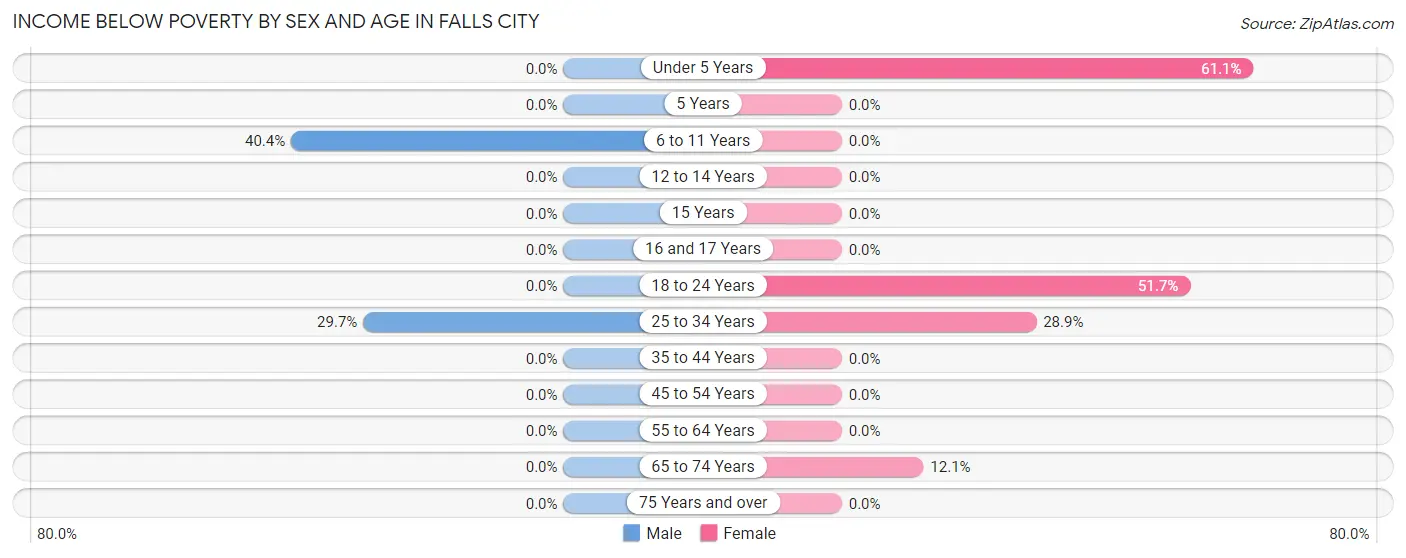
| Age Bracket | Male | Female |
| Under 5 Years | 0 (0.0%) | 11 (61.1%) |
| 5 Years | 0 (0.0%) | 0 (0.0%) |
| 6 to 11 Years | 57 (40.4%) | 0 (0.0%) |
| 12 to 14 Years | 0 (0.0%) | 0 (0.0%) |
| 15 Years | 0 (0.0%) | 0 (0.0%) |
| 16 and 17 Years | 0 (0.0%) | 0 (0.0%) |
| 18 to 24 Years | 0 (0.0%) | 15 (51.7%) |
| 25 to 34 Years | 33 (29.7%) | 28 (28.9%) |
| 35 to 44 Years | 0 (0.0%) | 0 (0.0%) |
| 45 to 54 Years | 0 (0.0%) | 0 (0.0%) |
| 55 to 64 Years | 0 (0.0%) | 0 (0.0%) |
| 65 to 74 Years | 0 (0.0%) | 8 (12.1%) |
| 75 Years and over | 0 (0.0%) | 0 (0.0%) |
| Total | 90 (18.1%) | 62 (15.4%) |
Income Above Poverty by Sex and Age in Falls City
According to the poverty statistics in Falls City, males aged under 5 years and females aged 6 to 11 years are the age groups that are most secure financially, with 100.0% of males and 100.0% of females in these age groups living above the poverty line.
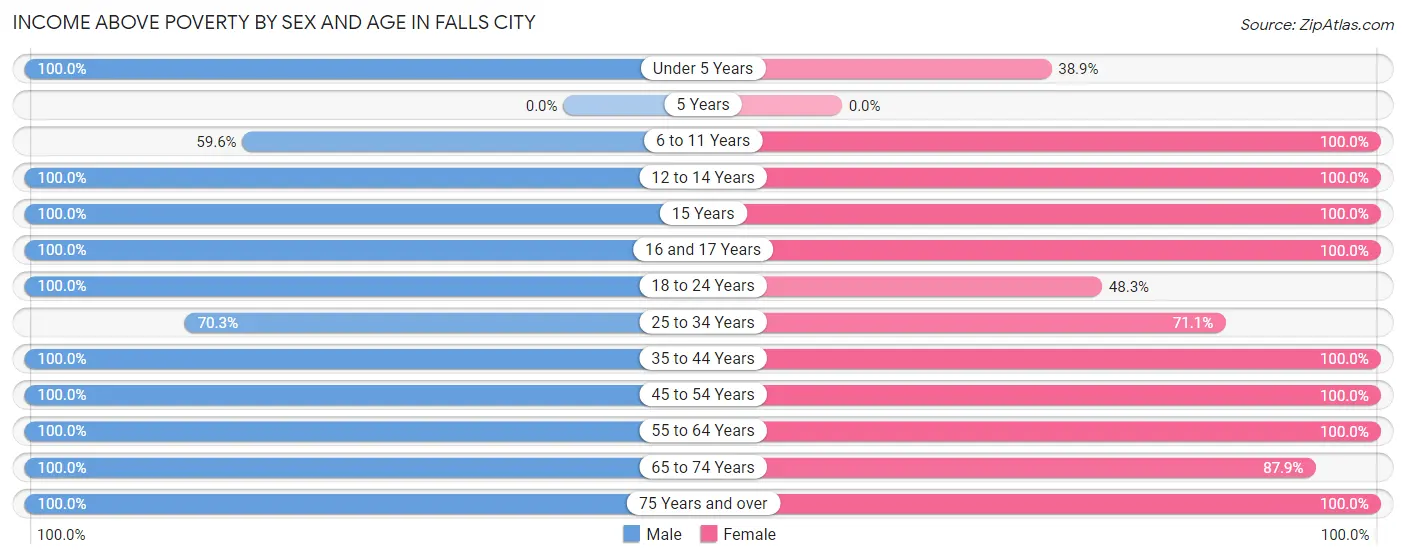
| Age Bracket | Male | Female |
| Under 5 Years | 34 (100.0%) | 7 (38.9%) |
| 5 Years | 0 (0.0%) | 0 (0.0%) |
| 6 to 11 Years | 84 (59.6%) | 45 (100.0%) |
| 12 to 14 Years | 9 (100.0%) | 7 (100.0%) |
| 15 Years | 6 (100.0%) | 11 (100.0%) |
| 16 and 17 Years | 15 (100.0%) | 7 (100.0%) |
| 18 to 24 Years | 25 (100.0%) | 14 (48.3%) |
| 25 to 34 Years | 78 (70.3%) | 69 (71.1%) |
| 35 to 44 Years | 44 (100.0%) | 52 (100.0%) |
| 45 to 54 Years | 16 (100.0%) | 31 (100.0%) |
| 55 to 64 Years | 27 (100.0%) | 33 (100.0%) |
| 65 to 74 Years | 49 (100.0%) | 58 (87.9%) |
| 75 Years and over | 20 (100.0%) | 7 (100.0%) |
| Total | 407 (81.9%) | 341 (84.6%) |
Income Below Poverty Among Married-Couple Families in Falls City
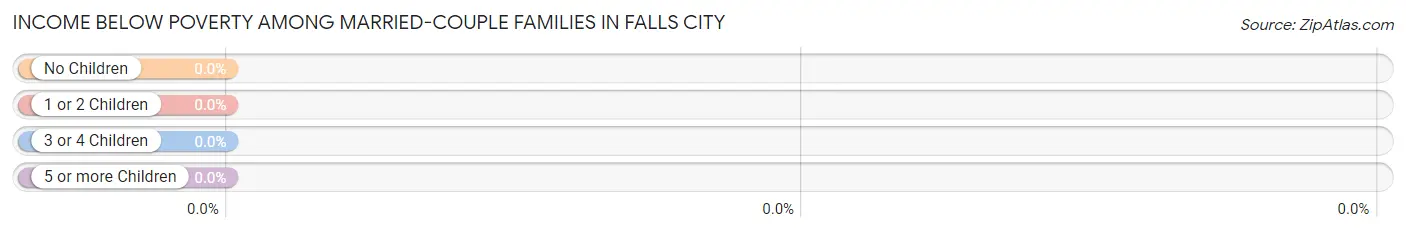
| Children | Above Poverty | Below Poverty |
| No Children | 92 (100.0%) | 0 (0.0%) |
| 1 or 2 Children | 52 (100.0%) | 0 (0.0%) |
| 3 or 4 Children | 15 (100.0%) | 0 (0.0%) |
| 5 or more Children | 0 (0.0%) | 0 (0.0%) |
| Total | 159 (100.0%) | 0 (0.0%) |
Income Below Poverty Among Single-Parent Households in Falls City
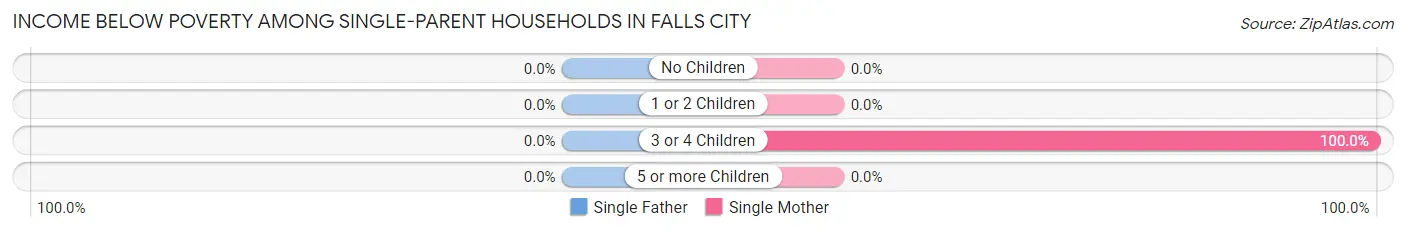
| Children | Single Father | Single Mother |
| No Children | 0 (0.0%) | 0 (0.0%) |
| 1 or 2 Children | 0 (0.0%) | 0 (0.0%) |
| 3 or 4 Children | 0 (0.0%) | 20 (100.0%) |
| 5 or more Children | 0 (0.0%) | 0 (0.0%) |
| Total | 0 (0.0%) | 20 (48.8%) |
Income Below Poverty Among Married-Couple vs Single-Parent Households in Falls City
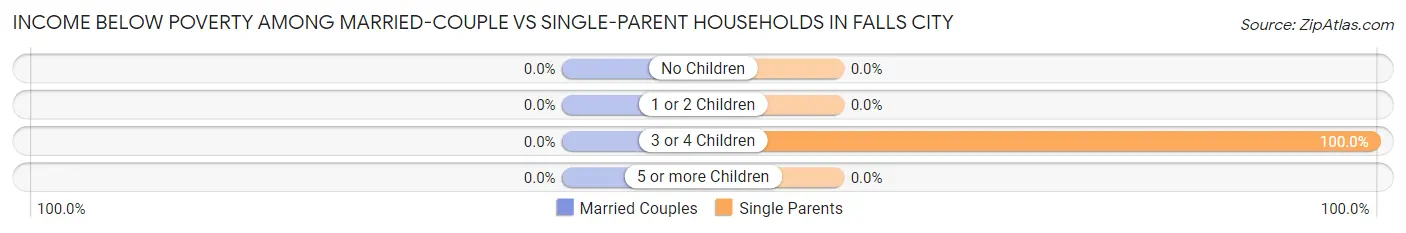
| Children | Married-Couple Families | Single-Parent Households |
| No Children | 0 (0.0%) | 0 (0.0%) |
| 1 or 2 Children | 0 (0.0%) | 0 (0.0%) |
| 3 or 4 Children | 0 (0.0%) | 20 (100.0%) |
| 5 or more Children | 0 (0.0%) | 0 (0.0%) |
| Total | 0 (0.0%) | 20 (48.8%) |
Race in Falls City
The most populous races in Falls City are White / Caucasian (750 | 83.3%), Hispanic or Latino (325 | 36.1%), and Some other Race (87 | 9.7%).
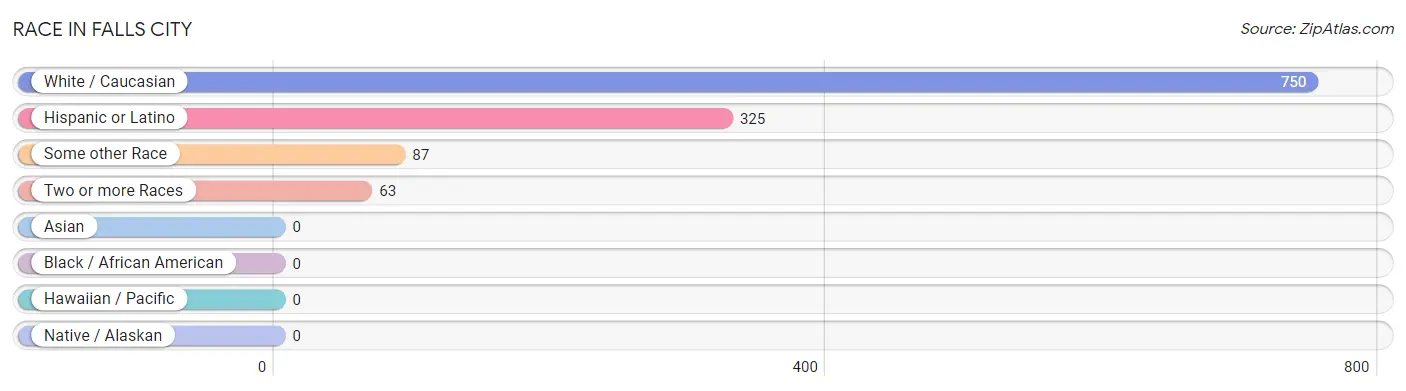
| Race | # Population | % Population |
| Asian | 0 | 0.0% |
| Black / African American | 0 | 0.0% |
| Hawaiian / Pacific | 0 | 0.0% |
| Hispanic or Latino | 325 | 36.1% |
| Native / Alaskan | 0 | 0.0% |
| White / Caucasian | 750 | 83.3% |
| Two or more Races | 63 | 7.0% |
| Some other Race | 87 | 9.7% |
| Total | 900 | 100.0% |
Ancestry in Falls City
The most populous ancestries reported in Falls City are Mexican (321 | 35.7%), Polish (250 | 27.8%), German (136 | 15.1%), Irish (96 | 10.7%), and Italian (29 | 3.2%), together accounting for 92.5% of all Falls City residents.
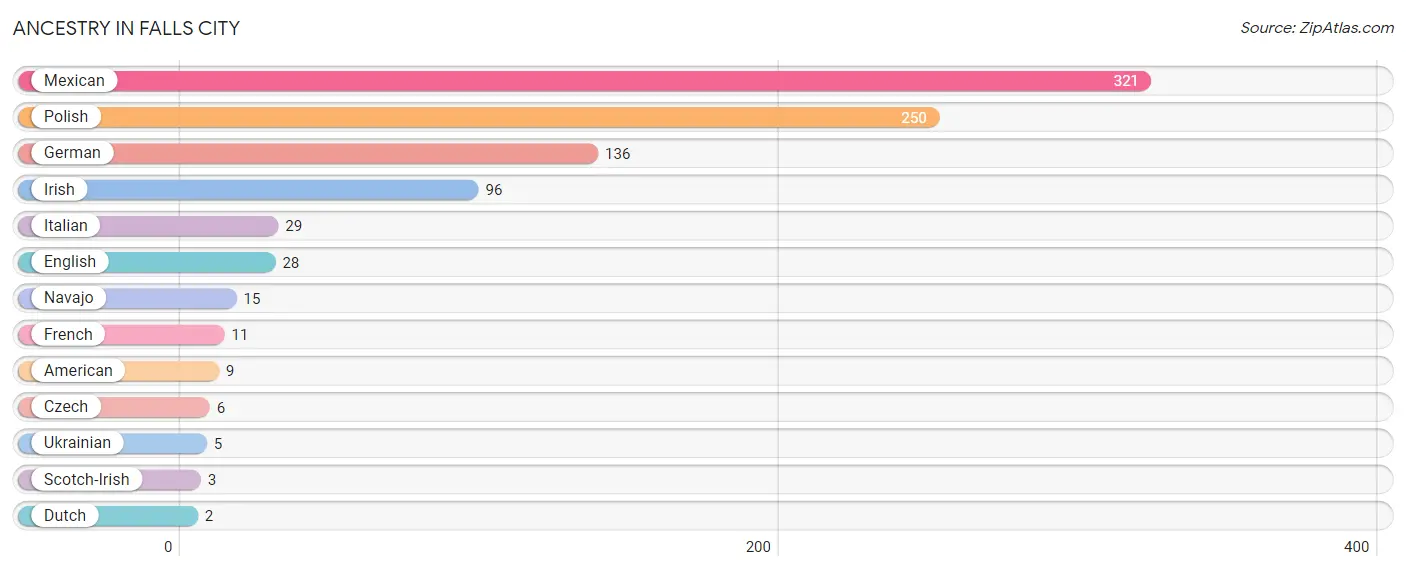
| Ancestry | # Population | % Population |
| American | 9 | 1.0% |
| Czech | 6 | 0.7% |
| Dutch | 2 | 0.2% |
| English | 28 | 3.1% |
| French | 11 | 1.2% |
| German | 136 | 15.1% |
| Irish | 96 | 10.7% |
| Italian | 29 | 3.2% |
| Mexican | 321 | 35.7% |
| Navajo | 15 | 1.7% |
| Polish | 250 | 27.8% |
| Scotch-Irish | 3 | 0.3% |
| Ukrainian | 5 | 0.6% | View All 13 Rows |
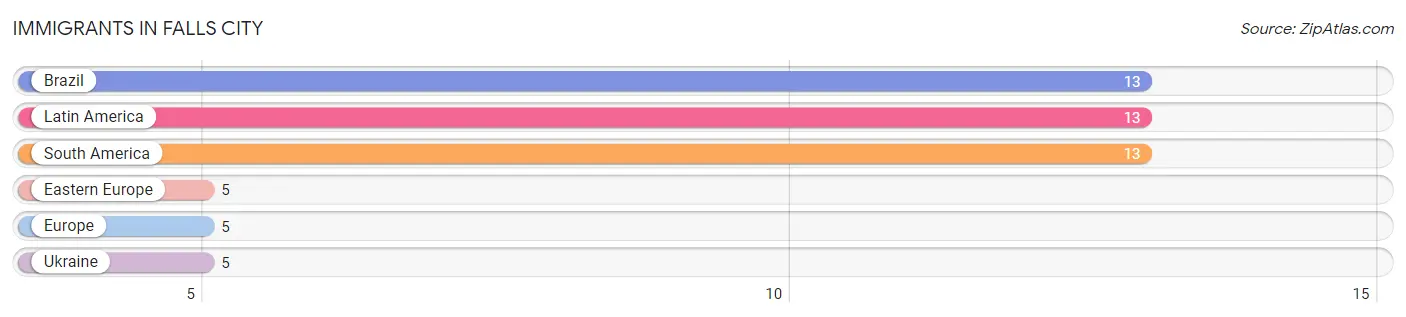
Immigrants in Falls City
The most numerous immigrant groups reported in Falls City came from Brazil (13 | 1.4%), Latin America (13 | 1.4%), South America (13 | 1.4%), Eastern Europe (5 | 0.6%), and Europe (5 | 0.6%), together accounting for 5.4% of all Falls City residents.
| Immigration Origin | # Population | % Population |
| Brazil | 13 | 1.4% |
| Eastern Europe | 5 | 0.6% |
| Europe | 5 | 0.6% |
| Latin America | 13 | 1.4% |
| South America | 13 | 1.4% |
| Ukraine | 5 | 0.6% | View All 6 Rows |
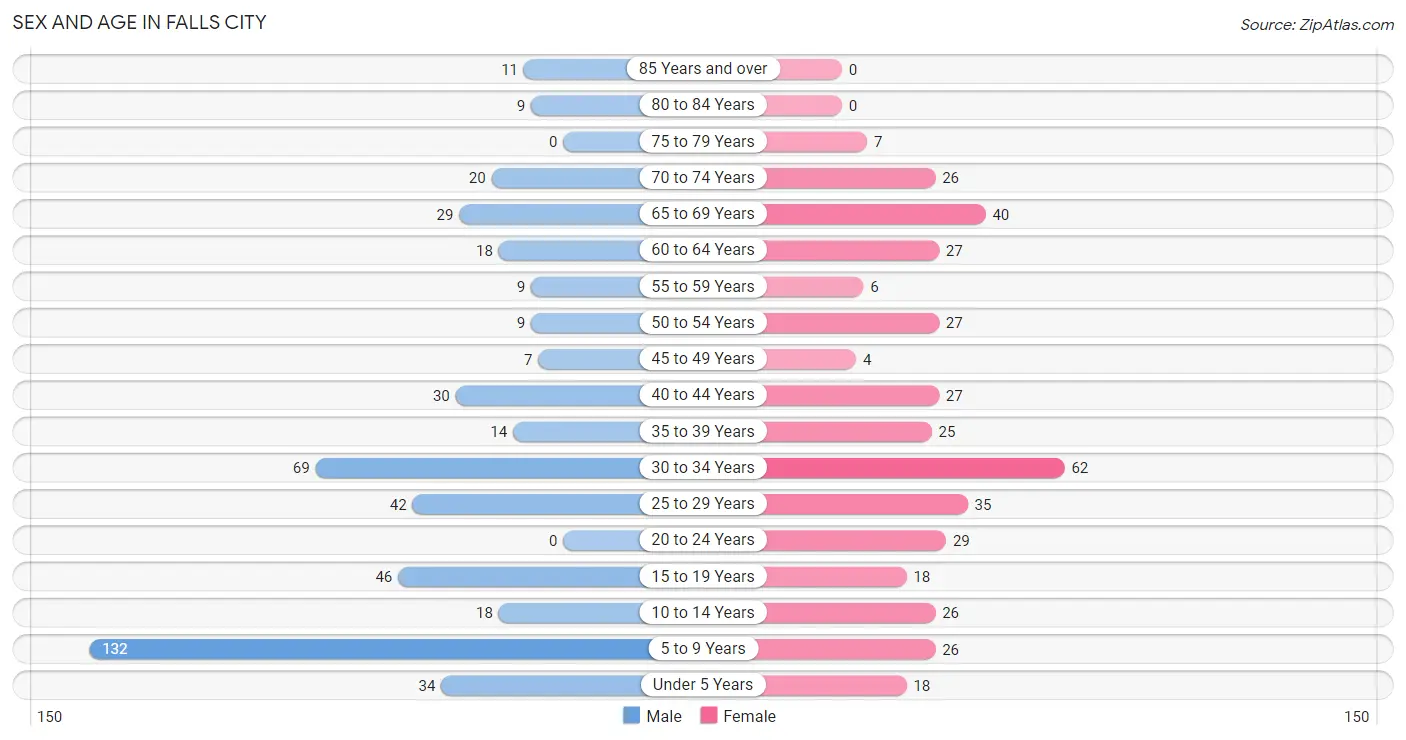
Sex and Age in Falls City
Sex and Age in Falls City
The most populous age groups in Falls City are 5 to 9 Years (132 | 26.6%) for men and 30 to 34 Years (62 | 15.4%) for women.
| Age Bracket | Male | Female |
| Under 5 Years | 34 (6.8%) | 18 (4.5%) |
| 5 to 9 Years | 132 (26.6%) | 26 (6.5%) |
| 10 to 14 Years | 18 (3.6%) | 26 (6.5%) |
| 15 to 19 Years | 46 (9.3%) | 18 (4.5%) |
| 20 to 24 Years | 0 (0.0%) | 29 (7.2%) |
| 25 to 29 Years | 42 (8.5%) | 35 (8.7%) |
| 30 to 34 Years | 69 (13.9%) | 62 (15.4%) |
| 35 to 39 Years | 14 (2.8%) | 25 (6.2%) |
| 40 to 44 Years | 30 (6.0%) | 27 (6.7%) |
| 45 to 49 Years | 7 (1.4%) | 4 (1.0%) |
| 50 to 54 Years | 9 (1.8%) | 27 (6.7%) |
| 55 to 59 Years | 9 (1.8%) | 6 (1.5%) |
| 60 to 64 Years | 18 (3.6%) | 27 (6.7%) |
| 65 to 69 Years | 29 (5.8%) | 40 (9.9%) |
| 70 to 74 Years | 20 (4.0%) | 26 (6.5%) |
| 75 to 79 Years | 0 (0.0%) | 7 (1.7%) |
| 80 to 84 Years | 9 (1.8%) | 0 (0.0%) |
| 85 Years and over | 11 (2.2%) | 0 (0.0%) |
| Total | 497 (100.0%) | 403 (100.0%) |
Families and Households in Falls City
Median Family Size in Falls City
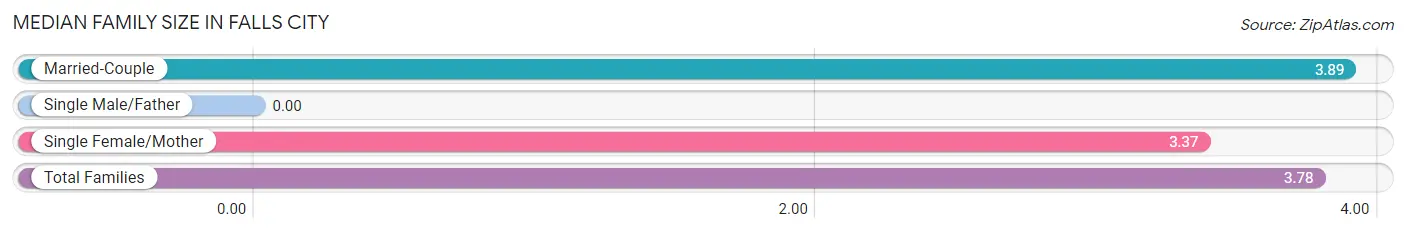
| Family Type | # Families | Family Size |
| Married-Couple | 159 (79.5%) | 3.89 |
| Single Male/Father | 0 (0.0%) | - |
| Single Female/Mother | 41 (20.5%) | 3.37 |
| Total Families | 200 (100.0%) | 3.78 |
Median Household Size in Falls City
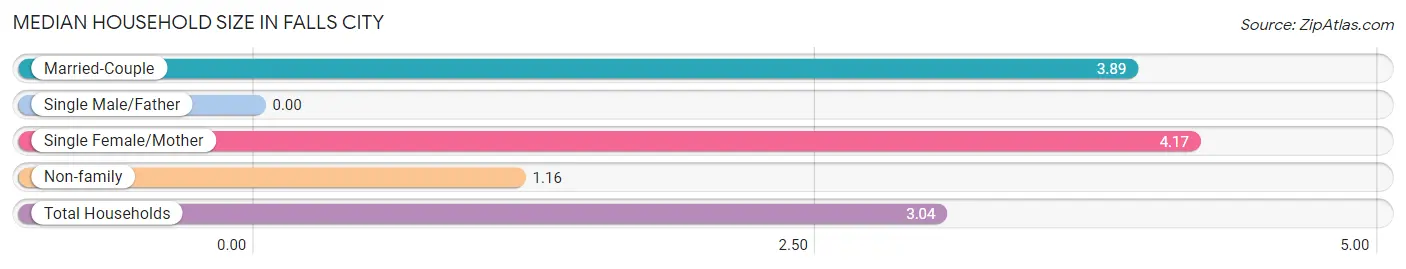
| Household Type | # Households | Household Size |
| Married-Couple | 159 (53.7%) | 3.89 |
| Single Male/Father | 0 (0.0%) | - |
| Single Female/Mother | 41 (13.9%) | 4.17 |
| Non-family | 96 (32.4%) | 1.16 |
| Total Households | 296 (100.0%) | 3.04 |
Household Size by Marriage Status in Falls City
Out of a total of 296 households in Falls City, 200 (67.6%) are family households, while 96 (32.4%) are nonfamily households. The most numerous type of family households are 2-person households, comprising 90, and the most common type of nonfamily households are 1-person households, comprising 67.
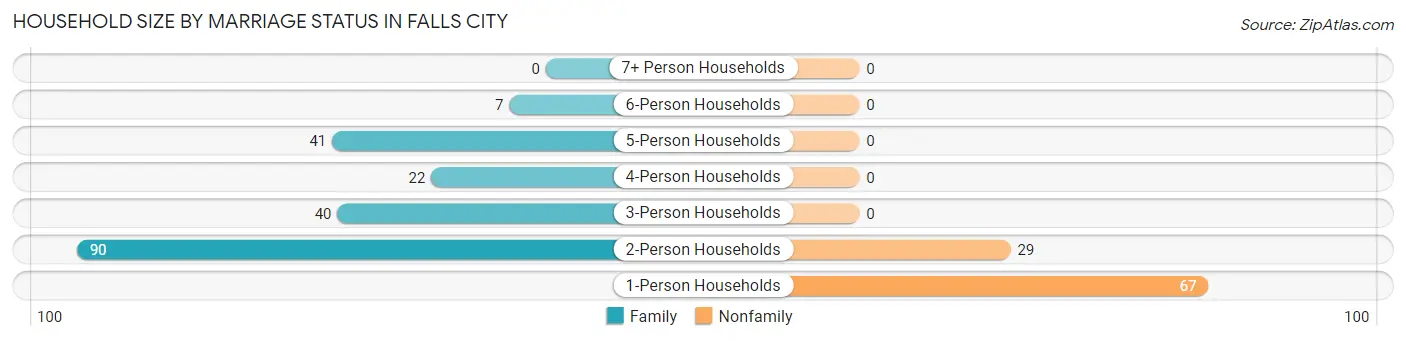
| Household Size | Family Households | Nonfamily Households |
| 1-Person Households | - | 67 (22.6%) |
| 2-Person Households | 90 (30.4%) | 29 (9.8%) |
| 3-Person Households | 40 (13.5%) | 0 (0.0%) |
| 4-Person Households | 22 (7.4%) | 0 (0.0%) |
| 5-Person Households | 41 (13.9%) | 0 (0.0%) |
| 6-Person Households | 7 (2.4%) | 0 (0.0%) |
| 7+ Person Households | 0 (0.0%) | 0 (0.0%) |
| Total | 200 (67.6%) | 96 (32.4%) |
Female Fertility in Falls City
Fertility by Age in Falls City
Average fertility rate in Falls City is 34.0 births per 1,000 women. Women in the age bracket of 35 to 50 years have the highest fertility rate with 109.0 births per 1,000 women. Women in the age bracket of 35 to 50 years acount for 100.0% of all women with births.
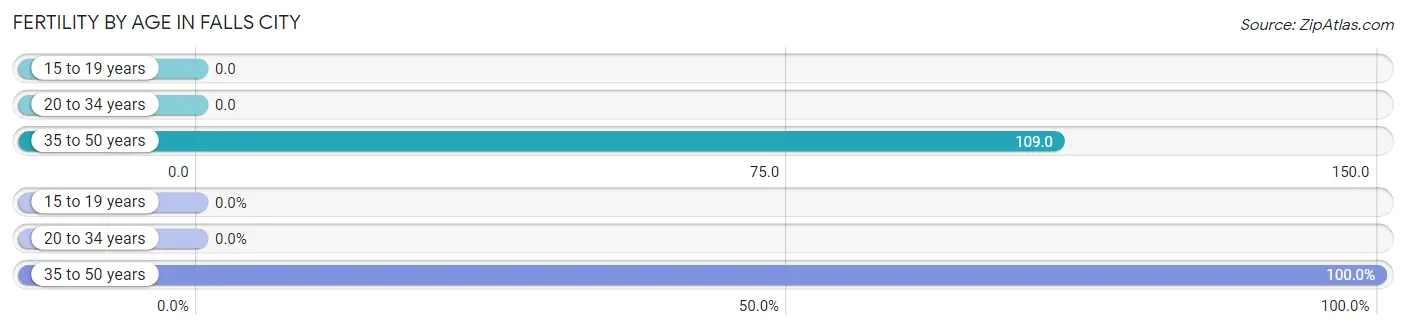
| Age Bracket | Women with Births | Births / 1,000 Women |
| 15 to 19 years | 0 (0.0%) | 0.0 |
| 20 to 34 years | 0 (0.0%) | 0.0 |
| 35 to 50 years | 7 (100.0%) | 109.0 |
| Total | 7 (100.0%) | 34.0 |
Fertility by Age by Marriage Status in Falls City
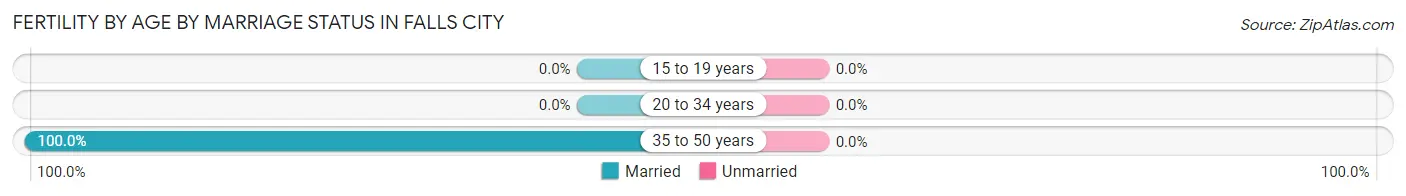
| Age Bracket | Married | Unmarried |
| 15 to 19 years | 0 (0.0%) | 0 (0.0%) |
| 20 to 34 years | 0 (0.0%) | 0 (0.0%) |
| 35 to 50 years | 7 (100.0%) | 0 (0.0%) |
| Total | 7 (100.0%) | 0 (0.0%) |
Fertility by Education in Falls City
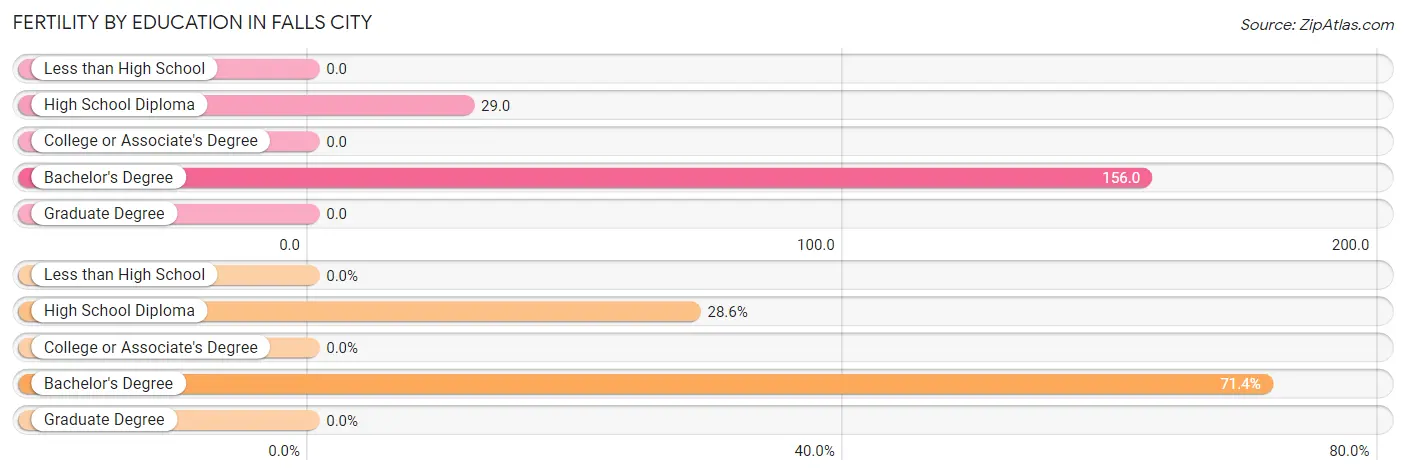
| Educational Attainment | Women with Births | Births / 1,000 Women |
| Less than High School | 0 (0.0%) | 0.0 |
| High School Diploma | 2 (28.6%) | 29.0 |
| College or Associate's Degree | 0 (0.0%) | 0.0 |
| Bachelor's Degree | 5 (71.4%) | 156.0 |
| Graduate Degree | 0 (0.0%) | 0.0 |
| Total | 7 (100.0%) | 34.0 |
Fertility by Education by Marriage Status in Falls City
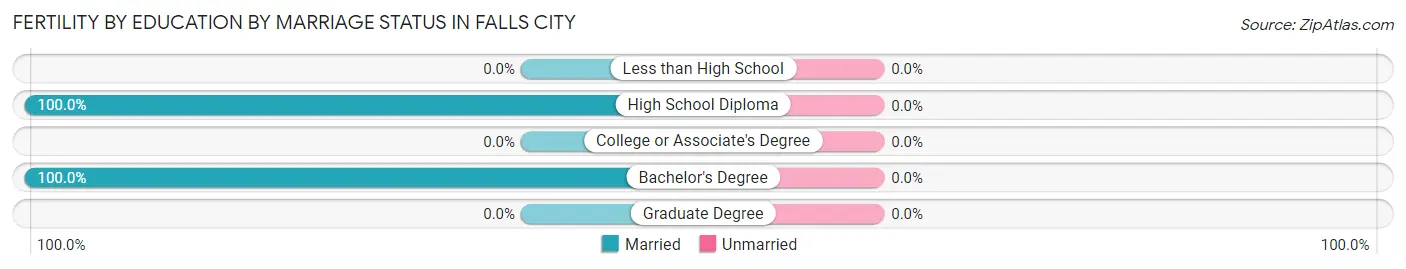
| Educational Attainment | Married | Unmarried |
| Less than High School | 0 (0.0%) | 0 (0.0%) |
| High School Diploma | 2 (100.0%) | 0 (0.0%) |
| College or Associate's Degree | 0 (0.0%) | 0 (0.0%) |
| Bachelor's Degree | 5 (100.0%) | 0 (0.0%) |
| Graduate Degree | 0 (0.0%) | 0 (0.0%) |
| Total | 7 (100.0%) | 0 (0.0%) |
Employment Characteristics in Falls City
Employment by Class of Employer in Falls City
Among the 442 employed individuals in Falls City, private company employees (268 | 60.6%), local government employees (61 | 13.8%), and self-employed (not incorporated) (57 | 12.9%) make up the most common classes of employment.
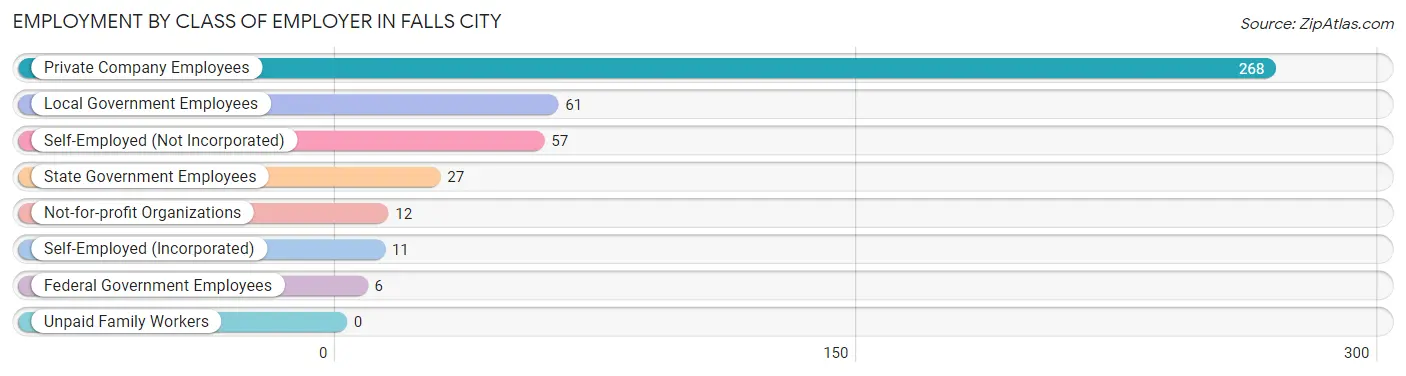
| Employer Class | # Employees | % Employees |
| Private Company Employees | 268 | 60.6% |
| Self-Employed (Incorporated) | 11 | 2.5% |
| Self-Employed (Not Incorporated) | 57 | 12.9% |
| Not-for-profit Organizations | 12 | 2.7% |
| Local Government Employees | 61 | 13.8% |
| State Government Employees | 27 | 6.1% |
| Federal Government Employees | 6 | 1.4% |
| Unpaid Family Workers | 0 | 0.0% |
| Total | 442 | 100.0% |
Employment Status by Age in Falls City
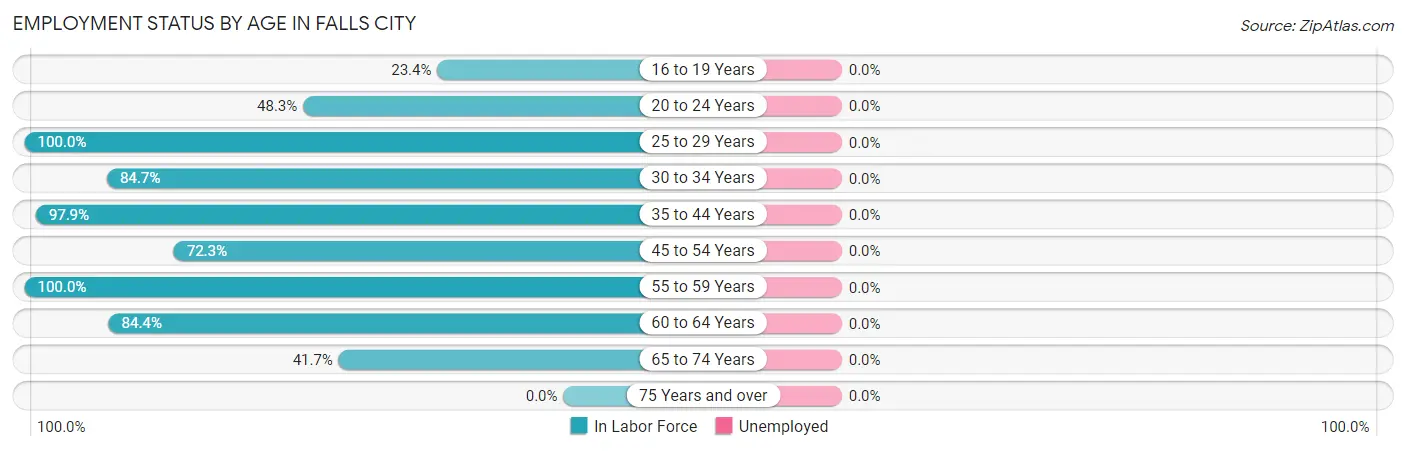
| Age Bracket | In Labor Force | Unemployed |
| 16 to 19 Years | 11 (23.4%) | 0 (0.0%) |
| 20 to 24 Years | 14 (48.3%) | 0 (0.0%) |
| 25 to 29 Years | 77 (100.0%) | 0 (0.0%) |
| 30 to 34 Years | 111 (84.7%) | 0 (0.0%) |
| 35 to 44 Years | 94 (97.9%) | 0 (0.0%) |
| 45 to 54 Years | 34 (72.3%) | 0 (0.0%) |
| 55 to 59 Years | 15 (100.0%) | 0 (0.0%) |
| 60 to 64 Years | 38 (84.4%) | 0 (0.0%) |
| 65 to 74 Years | 48 (41.7%) | 0 (0.0%) |
| 75 Years and over | 0 (0.0%) | 0 (0.0%) |
| Total | 442 (70.3%) | 0 (0.0%) |
Employment Status by Educational Attainment in Falls City
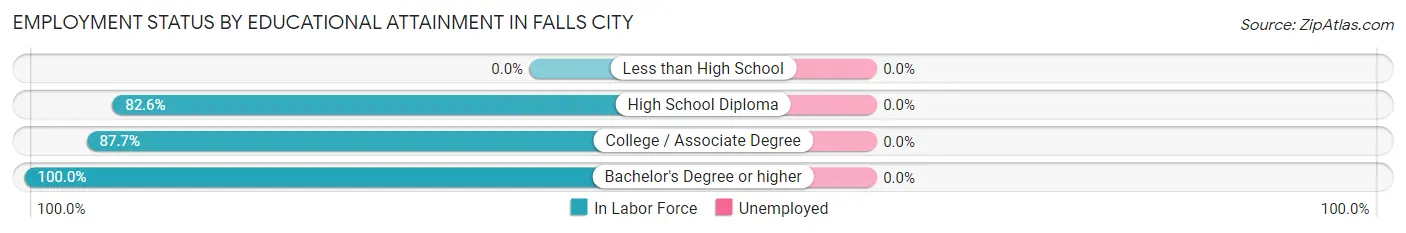
| Educational Attainment | In Labor Force | Unemployed |
| Less than High School | 0 (0.0%) | 0 (0.0%) |
| High School Diploma | 166 (82.6%) | 0 (0.0%) |
| College / Associate Degree | 50 (87.7%) | 0 (0.0%) |
| Bachelor's Degree or higher | 153 (100.0%) | 0 (0.0%) |
| Total | 369 (89.8%) | 0 (0.0%) |
Employment Occupations by Sex in Falls City
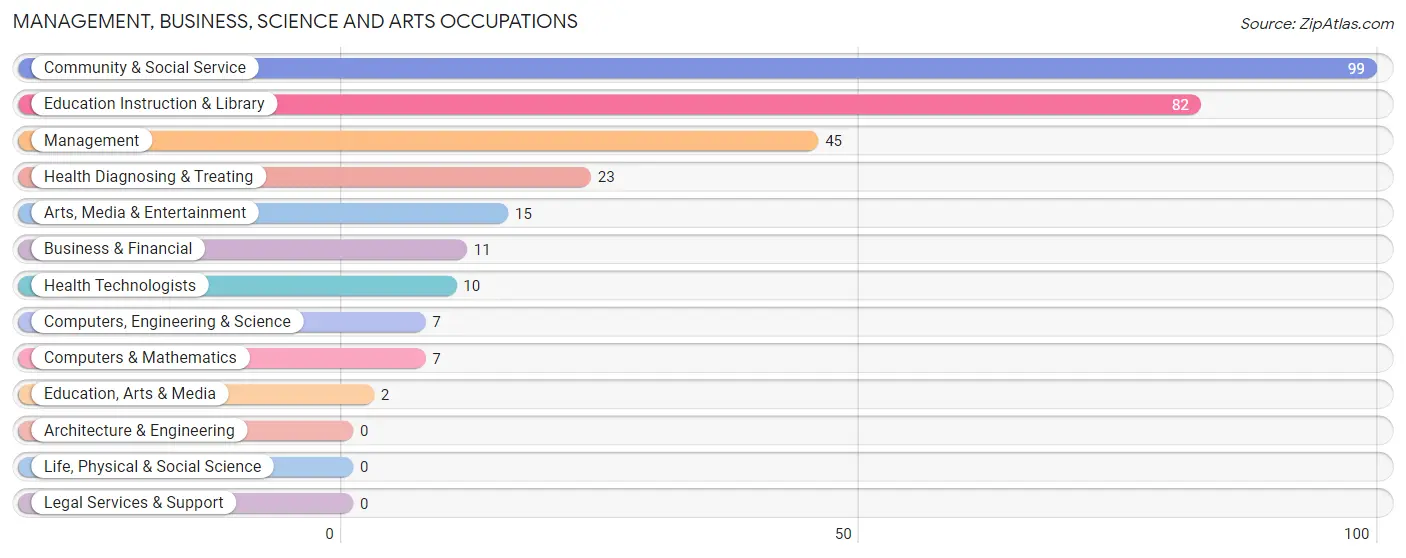
Management, Business, Science and Arts Occupations
The most common Management, Business, Science and Arts occupations in Falls City are Community & Social Service (99 | 22.4%), Education Instruction & Library (82 | 18.5%), Management (45 | 10.2%), Health Diagnosing & Treating (23 | 5.2%), and Arts, Media & Entertainment (15 | 3.4%).
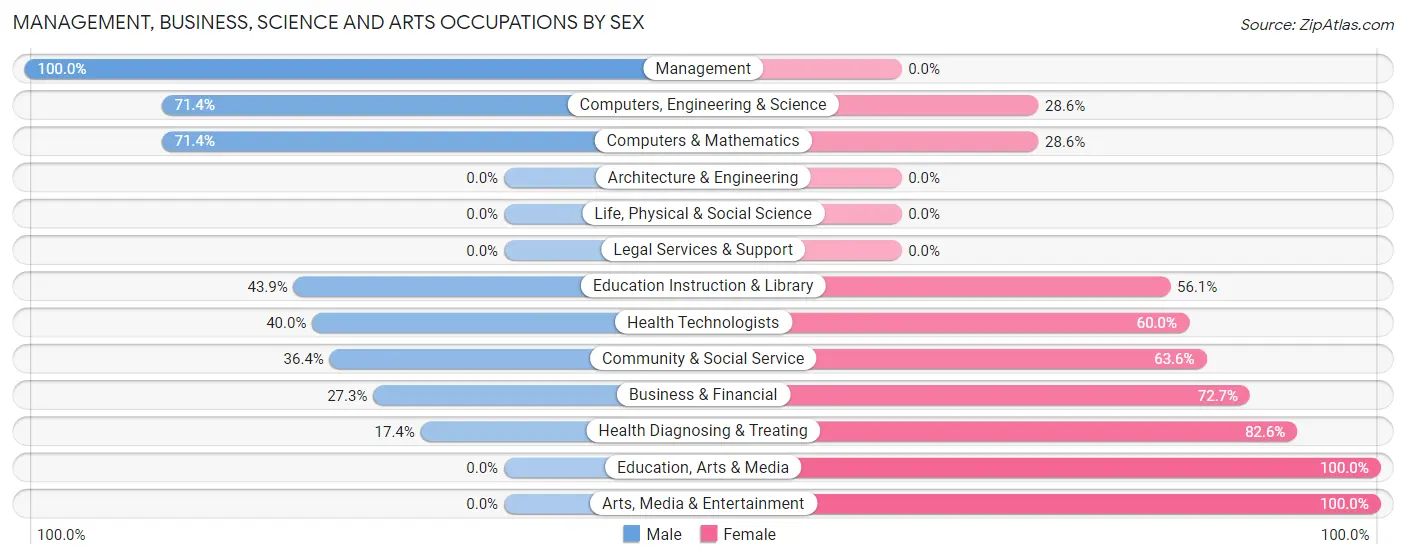
Management, Business, Science and Arts Occupations by Sex
Within the Management, Business, Science and Arts occupations in Falls City, the most male-oriented occupations are Management (100.0%), Computers, Engineering & Science (71.4%), and Computers & Mathematics (71.4%), while the most female-oriented occupations are Education, Arts & Media (100.0%), Arts, Media & Entertainment (100.0%), and Health Diagnosing & Treating (82.6%).
| Occupation | Male | Female |
| Management | 45 (100.0%) | 0 (0.0%) |
| Business & Financial | 3 (27.3%) | 8 (72.7%) |
| Computers, Engineering & Science | 5 (71.4%) | 2 (28.6%) |
| Computers & Mathematics | 5 (71.4%) | 2 (28.6%) |
| Architecture & Engineering | 0 (0.0%) | 0 (0.0%) |
| Life, Physical & Social Science | 0 (0.0%) | 0 (0.0%) |
| Community & Social Service | 36 (36.4%) | 63 (63.6%) |
| Education, Arts & Media | 0 (0.0%) | 2 (100.0%) |
| Legal Services & Support | 0 (0.0%) | 0 (0.0%) |
| Education Instruction & Library | 36 (43.9%) | 46 (56.1%) |
| Arts, Media & Entertainment | 0 (0.0%) | 15 (100.0%) |
| Health Diagnosing & Treating | 4 (17.4%) | 19 (82.6%) |
| Health Technologists | 4 (40.0%) | 6 (60.0%) |
| Total (Category) | 93 (50.3%) | 92 (49.7%) |
| Total (Overall) | 215 (48.6%) | 227 (51.4%) |
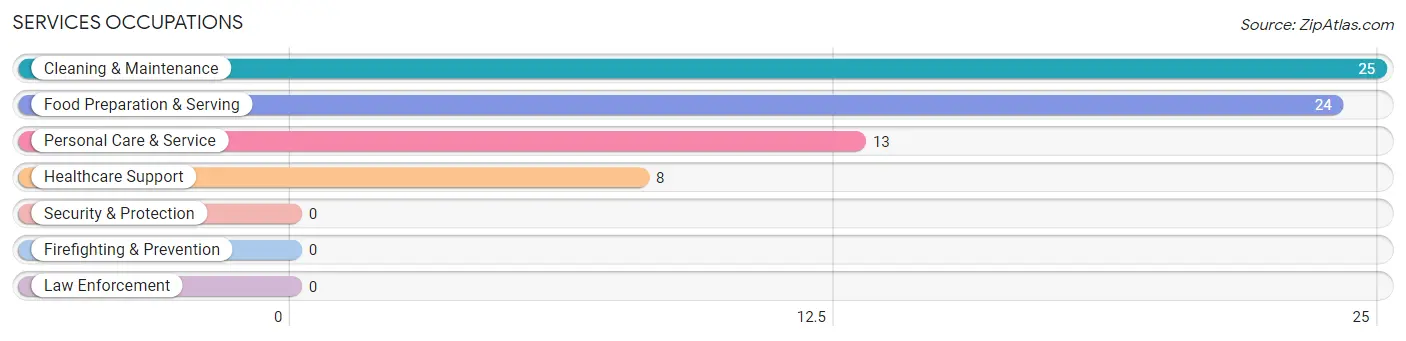
Services Occupations
The most common Services occupations in Falls City are Cleaning & Maintenance (25 | 5.7%), Food Preparation & Serving (24 | 5.4%), Personal Care & Service (13 | 2.9%), and Healthcare Support (8 | 1.8%).
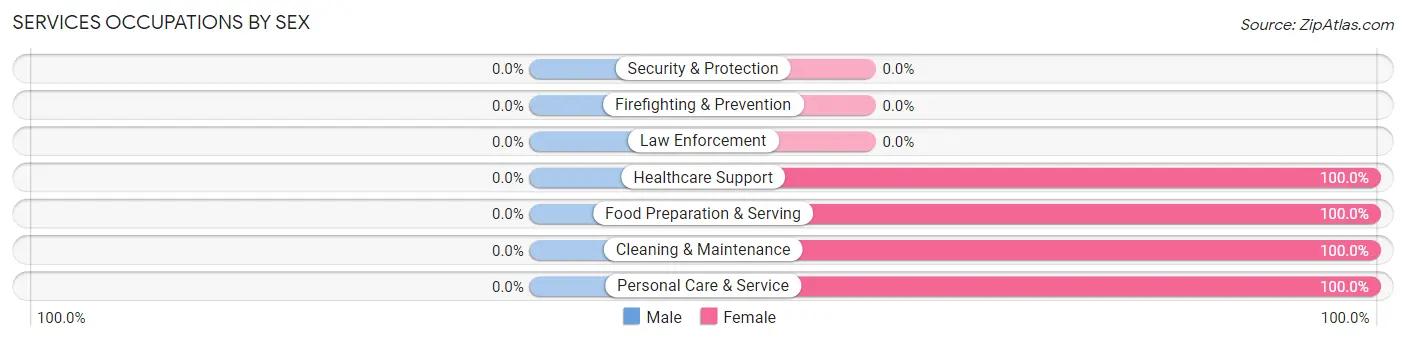
Services Occupations by Sex
| Occupation | Male | Female |
| Healthcare Support | 0 (0.0%) | 8 (100.0%) |
| Security & Protection | 0 (0.0%) | 0 (0.0%) |
| Firefighting & Prevention | 0 (0.0%) | 0 (0.0%) |
| Law Enforcement | 0 (0.0%) | 0 (0.0%) |
| Food Preparation & Serving | 0 (0.0%) | 24 (100.0%) |
| Cleaning & Maintenance | 0 (0.0%) | 25 (100.0%) |
| Personal Care & Service | 0 (0.0%) | 13 (100.0%) |
| Total (Category) | 0 (0.0%) | 70 (100.0%) |
| Total (Overall) | 215 (48.6%) | 227 (51.4%) |
Sales and Office Occupations
The most common Sales and Office occupations in Falls City are Office & Administration (65 | 14.7%), and Sales & Related (17 | 3.8%).
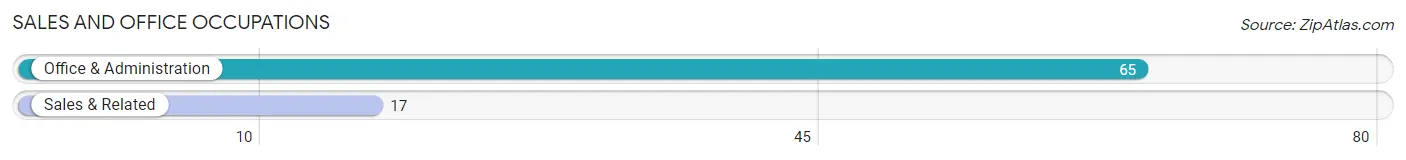
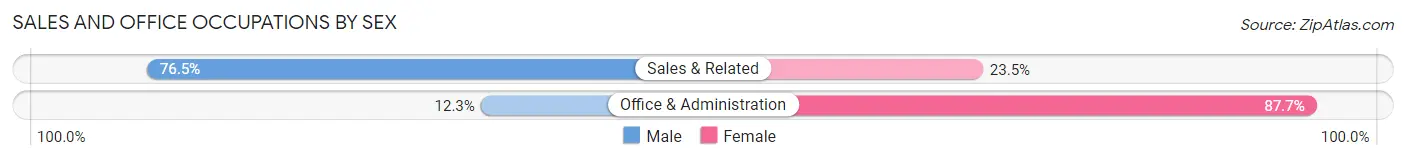
Sales and Office Occupations by Sex
| Occupation | Male | Female |
| Sales & Related | 13 (76.5%) | 4 (23.5%) |
| Office & Administration | 8 (12.3%) | 57 (87.7%) |
| Total (Category) | 21 (25.6%) | 61 (74.4%) |
| Total (Overall) | 215 (48.6%) | 227 (51.4%) |
Natural Resources, Construction and Maintenance Occupations
The most common Natural Resources, Construction and Maintenance occupations in Falls City are Construction & Extraction (81 | 18.3%), and Installation, Maintenance & Repair (4 | 0.9%).
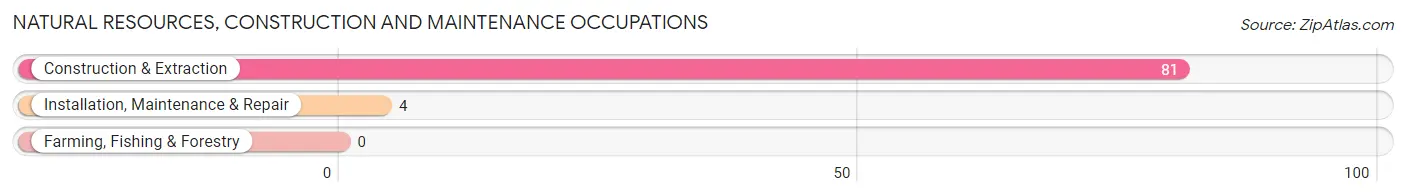
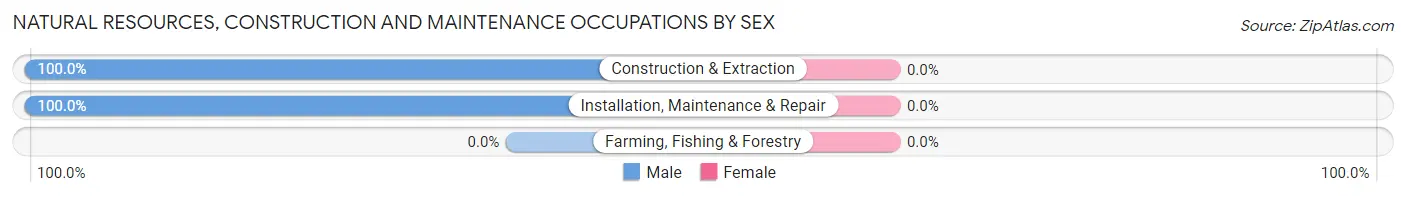
Natural Resources, Construction and Maintenance Occupations by Sex
| Occupation | Male | Female |
| Farming, Fishing & Forestry | 0 (0.0%) | 0 (0.0%) |
| Construction & Extraction | 81 (100.0%) | 0 (0.0%) |
| Installation, Maintenance & Repair | 4 (100.0%) | 0 (0.0%) |
| Total (Category) | 85 (100.0%) | 0 (0.0%) |
| Total (Overall) | 215 (48.6%) | 227 (51.4%) |
Production, Transportation and Moving Occupations
The most common Production, Transportation and Moving occupations in Falls City are Transportation (12 | 2.7%), Production (4 | 0.9%), and Material Moving (4 | 0.9%).
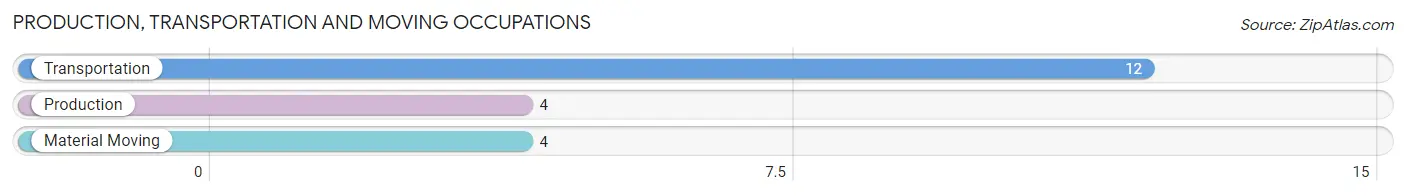
Production, Transportation and Moving Occupations by Sex
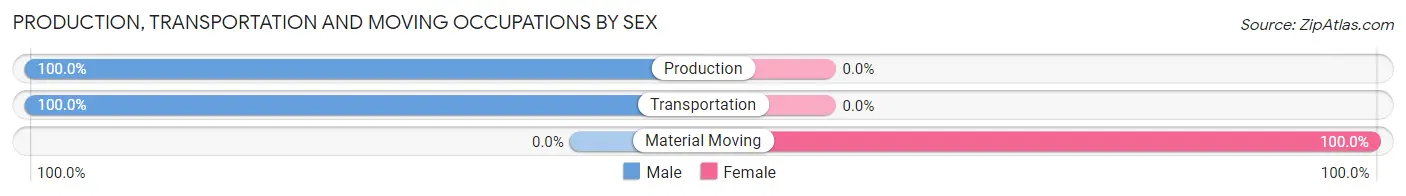
| Occupation | Male | Female |
| Production | 4 (100.0%) | 0 (0.0%) |
| Transportation | 12 (100.0%) | 0 (0.0%) |
| Material Moving | 0 (0.0%) | 4 (100.0%) |
| Total (Category) | 16 (80.0%) | 4 (20.0%) |
| Total (Overall) | 215 (48.6%) | 227 (51.4%) |
Employment Industries by Sex in Falls City
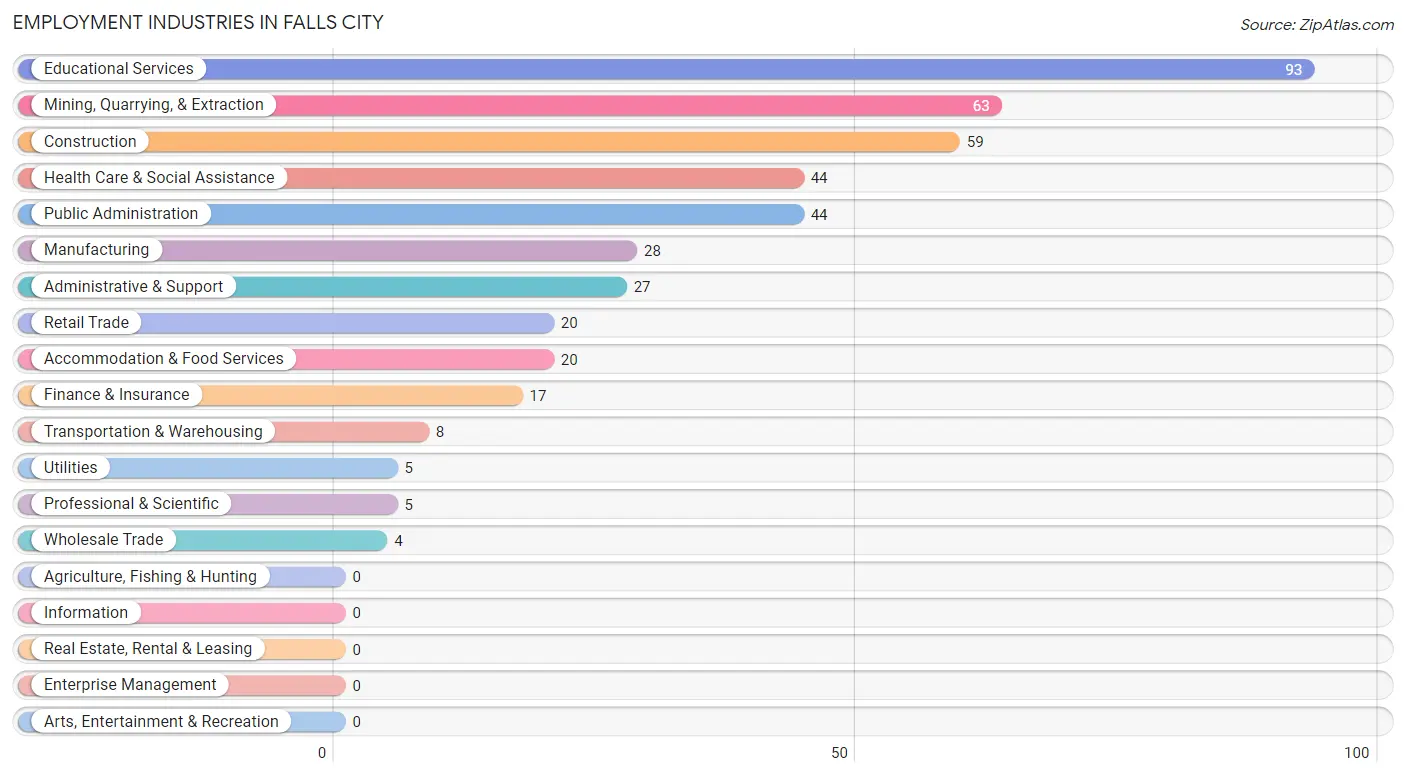
Employment Industries in Falls City
The major employment industries in Falls City include Educational Services (93 | 21.0%), Mining, Quarrying, & Extraction (63 | 14.2%), Construction (59 | 13.4%), Health Care & Social Assistance (44 | 10.0%), and Public Administration (44 | 10.0%).
Employment Industries by Sex in Falls City
The Falls City industries that see more men than women are Wholesale Trade (100.0%), Transportation & Warehousing (100.0%), and Professional & Scientific (100.0%), whereas the industries that tend to have a higher number of women are Accommodation & Food Services (100.0%), Administrative & Support (92.6%), and Health Care & Social Assistance (90.9%).
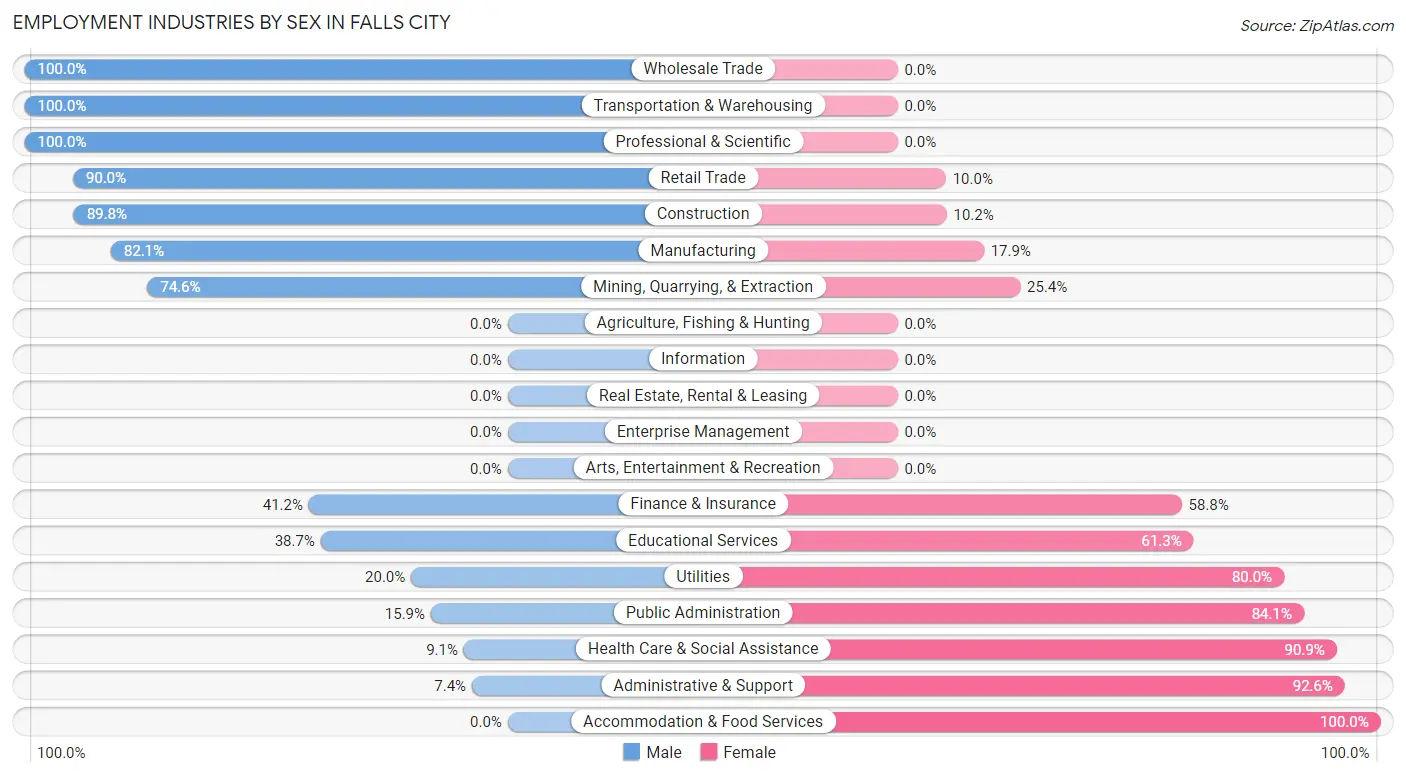
| Industry | Male | Female |
| Agriculture, Fishing & Hunting | 0 (0.0%) | 0 (0.0%) |
| Mining, Quarrying, & Extraction | 47 (74.6%) | 16 (25.4%) |
| Construction | 53 (89.8%) | 6 (10.2%) |
| Manufacturing | 23 (82.1%) | 5 (17.9%) |
| Wholesale Trade | 4 (100.0%) | 0 (0.0%) |
| Retail Trade | 18 (90.0%) | 2 (10.0%) |
| Transportation & Warehousing | 8 (100.0%) | 0 (0.0%) |
| Utilities | 1 (20.0%) | 4 (80.0%) |
| Information | 0 (0.0%) | 0 (0.0%) |
| Finance & Insurance | 7 (41.2%) | 10 (58.8%) |
| Real Estate, Rental & Leasing | 0 (0.0%) | 0 (0.0%) |
| Professional & Scientific | 5 (100.0%) | 0 (0.0%) |
| Enterprise Management | 0 (0.0%) | 0 (0.0%) |
| Administrative & Support | 2 (7.4%) | 25 (92.6%) |
| Educational Services | 36 (38.7%) | 57 (61.3%) |
| Health Care & Social Assistance | 4 (9.1%) | 40 (90.9%) |
| Arts, Entertainment & Recreation | 0 (0.0%) | 0 (0.0%) |
| Accommodation & Food Services | 0 (0.0%) | 20 (100.0%) |
| Public Administration | 7 (15.9%) | 37 (84.1%) |
| Total | 215 (48.6%) | 227 (51.4%) |
Education in Falls City
School Enrollment in Falls City
The most common levels of schooling among the 266 students in Falls City are elementary school (163 | 61.3%), high school (62 | 23.3%), and middle school (30 | 11.3%).
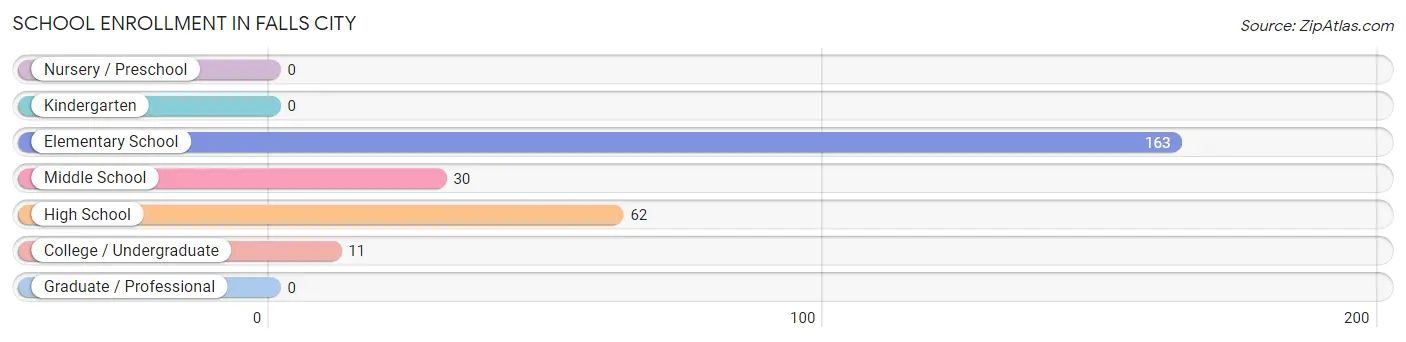
| School Level | # Students | % Students |
| Nursery / Preschool | 0 | 0.0% |
| Kindergarten | 0 | 0.0% |
| Elementary School | 163 | 61.3% |
| Middle School | 30 | 11.3% |
| High School | 62 | 23.3% |
| College / Undergraduate | 11 | 4.1% |
| Graduate / Professional | 0 | 0.0% |
| Total | 266 | 100.0% |
School Enrollment by Age by Funding Source in Falls City
Out of a total of 266 students who are enrolled in schools in Falls City, 5 (1.9%) attend a private institution, while the remaining 261 (98.1%) are enrolled in public schools. The age group of 5 to 9 year old has the highest likelihood of being enrolled in private schools, with 5 (3.2% in the age bracket) enrolled. Conversely, the age group of 10 to 14 year olds has the lowest likelihood of being enrolled in a private school, with 44 (100.0% in the age bracket) attending a public institution.
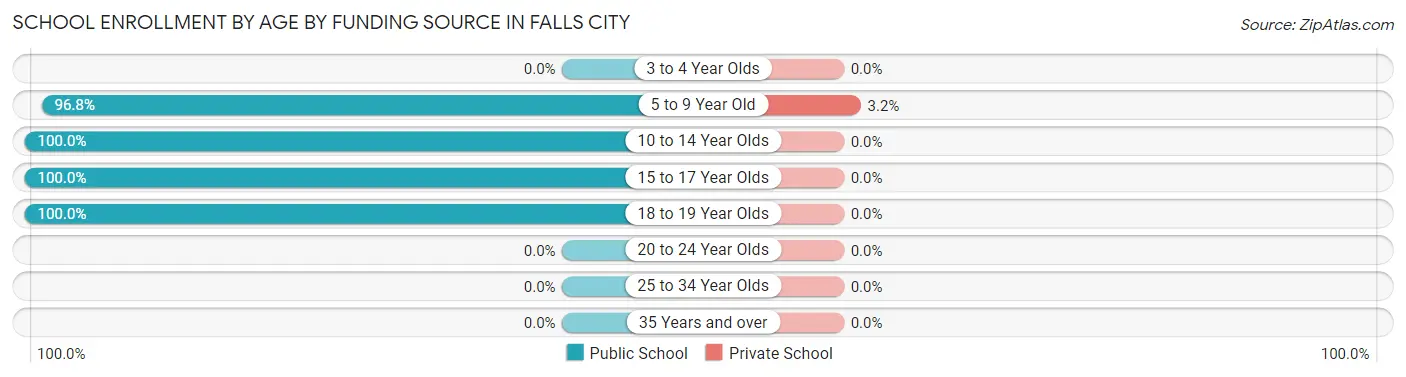
| Age Bracket | Public School | Private School |
| 3 to 4 Year Olds | 0 (0.0%) | 0 (0.0%) |
| 5 to 9 Year Old | 153 (96.8%) | 5 (3.2%) |
| 10 to 14 Year Olds | 44 (100.0%) | 0 (0.0%) |
| 15 to 17 Year Olds | 39 (100.0%) | 0 (0.0%) |
| 18 to 19 Year Olds | 25 (100.0%) | 0 (0.0%) |
| 20 to 24 Year Olds | 0 (0.0%) | 0 (0.0%) |
| 25 to 34 Year Olds | 0 (0.0%) | 0 (0.0%) |
| 35 Years and over | 0 (0.0%) | 0 (0.0%) |
| Total | 261 (98.1%) | 5 (1.9%) |
Educational Attainment by Field of Study in Falls City
Arts & humanities (41 | 21.1%), education (38 | 19.6%), engineering (25 | 12.9%), science & technology (24 | 12.4%), and bio, nature & agricultural (20 | 10.3%) are the most common fields of study among 194 individuals in Falls City who have obtained a bachelor's degree or higher.
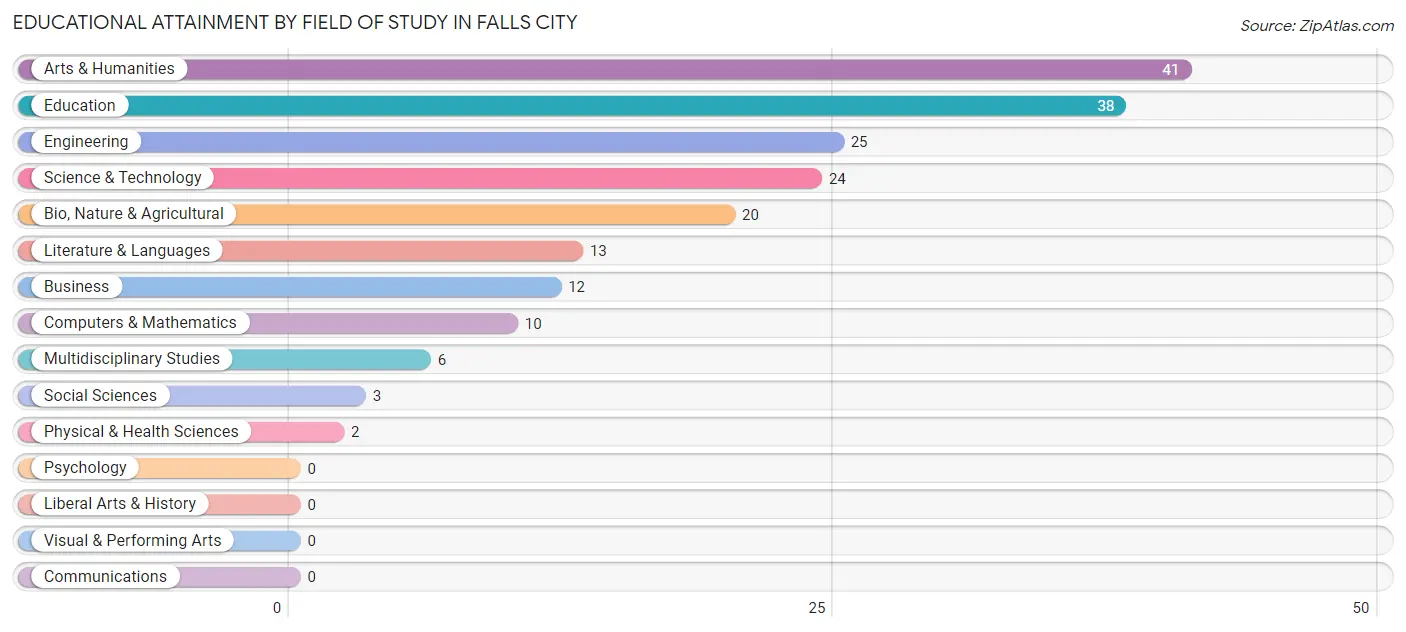
| Field of Study | # Graduates | % Graduates |
| Computers & Mathematics | 10 | 5.1% |
| Bio, Nature & Agricultural | 20 | 10.3% |
| Physical & Health Sciences | 2 | 1.0% |
| Psychology | 0 | 0.0% |
| Social Sciences | 3 | 1.5% |
| Engineering | 25 | 12.9% |
| Multidisciplinary Studies | 6 | 3.1% |
| Science & Technology | 24 | 12.4% |
| Business | 12 | 6.2% |
| Education | 38 | 19.6% |
| Literature & Languages | 13 | 6.7% |
| Liberal Arts & History | 0 | 0.0% |
| Visual & Performing Arts | 0 | 0.0% |
| Communications | 0 | 0.0% |
| Arts & Humanities | 41 | 21.1% |
| Total | 194 | 100.0% |
Transportation & Commute in Falls City
Vehicle Availability by Sex in Falls City
The most prevalent vehicle ownership categories in Falls City are males with 2 vehicles (72, accounting for 33.5%) and females with 2 vehicles (52, making up 31.7%).
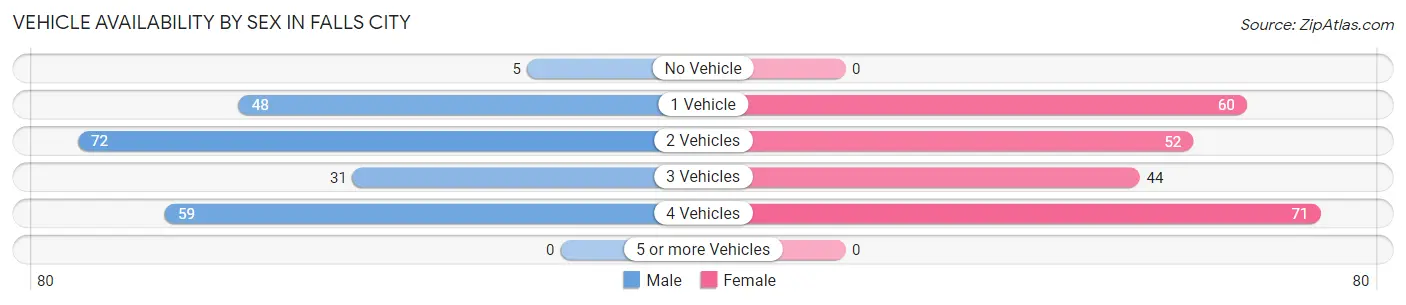
| Vehicles Available | Male | Female |
| No Vehicle | 5 (2.3%) | 0 (0.0%) |
| 1 Vehicle | 48 (22.3%) | 60 (26.4%) |
| 2 Vehicles | 72 (33.5%) | 52 (22.9%) |
| 3 Vehicles | 31 (14.4%) | 44 (19.4%) |
| 4 Vehicles | 59 (27.4%) | 71 (31.3%) |
| 5 or more Vehicles | 0 (0.0%) | 0 (0.0%) |
| Total | 215 (100.0%) | 227 (100.0%) |
Commute Time in Falls City
The most frequently occuring commute durations in Falls City are 60 to 89 minutes (82 commuters, 19.7%), 45 to 59 minutes (81 commuters, 19.5%), and 15 to 19 minutes (80 commuters, 19.2%).
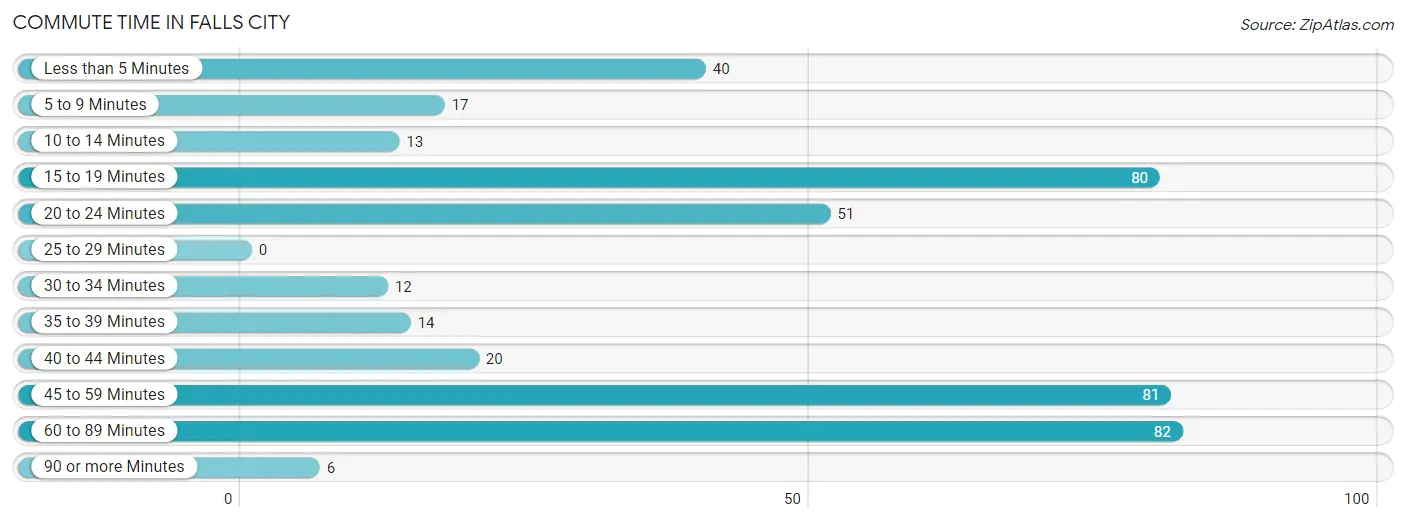
| Commute Time | # Commuters | % Commuters |
| Less than 5 Minutes | 40 | 9.6% |
| 5 to 9 Minutes | 17 | 4.1% |
| 10 to 14 Minutes | 13 | 3.1% |
| 15 to 19 Minutes | 80 | 19.2% |
| 20 to 24 Minutes | 51 | 12.3% |
| 25 to 29 Minutes | 0 | 0.0% |
| 30 to 34 Minutes | 12 | 2.9% |
| 35 to 39 Minutes | 14 | 3.4% |
| 40 to 44 Minutes | 20 | 4.8% |
| 45 to 59 Minutes | 81 | 19.5% |
| 60 to 89 Minutes | 82 | 19.7% |
| 90 or more Minutes | 6 | 1.4% |
Commute Time by Sex in Falls City
The most common commute times in Falls City are 60 to 89 minutes (75 commuters, 38.7%) for males and 15 to 19 minutes (76 commuters, 34.2%) for females.
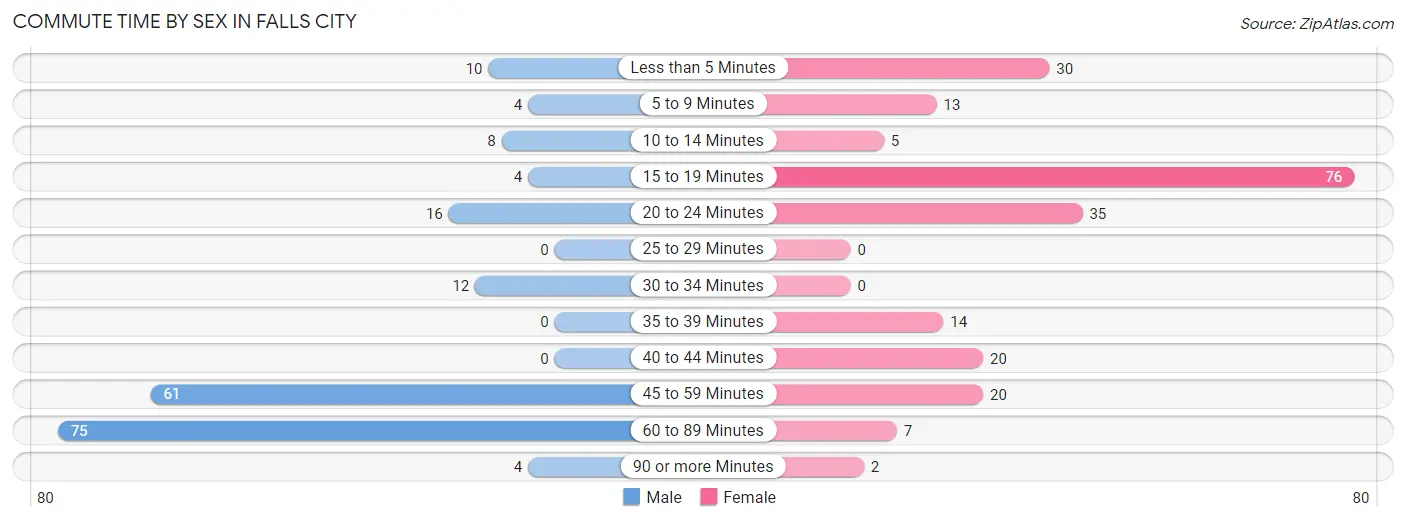
| Commute Time | Male | Female |
| Less than 5 Minutes | 10 (5.1%) | 30 (13.5%) |
| 5 to 9 Minutes | 4 (2.1%) | 13 (5.9%) |
| 10 to 14 Minutes | 8 (4.1%) | 5 (2.2%) |
| 15 to 19 Minutes | 4 (2.1%) | 76 (34.2%) |
| 20 to 24 Minutes | 16 (8.3%) | 35 (15.8%) |
| 25 to 29 Minutes | 0 (0.0%) | 0 (0.0%) |
| 30 to 34 Minutes | 12 (6.2%) | 0 (0.0%) |
| 35 to 39 Minutes | 0 (0.0%) | 14 (6.3%) |
| 40 to 44 Minutes | 0 (0.0%) | 20 (9.0%) |
| 45 to 59 Minutes | 61 (31.4%) | 20 (9.0%) |
| 60 to 89 Minutes | 75 (38.7%) | 7 (3.2%) |
| 90 or more Minutes | 4 (2.1%) | 2 (0.9%) |
Time of Departure to Work by Sex in Falls City
The most frequent times of departure to work in Falls City are 6:30 AM to 6:59 AM (49, 25.3%) for males and 7:00 AM to 7:29 AM (65, 29.3%) for females.
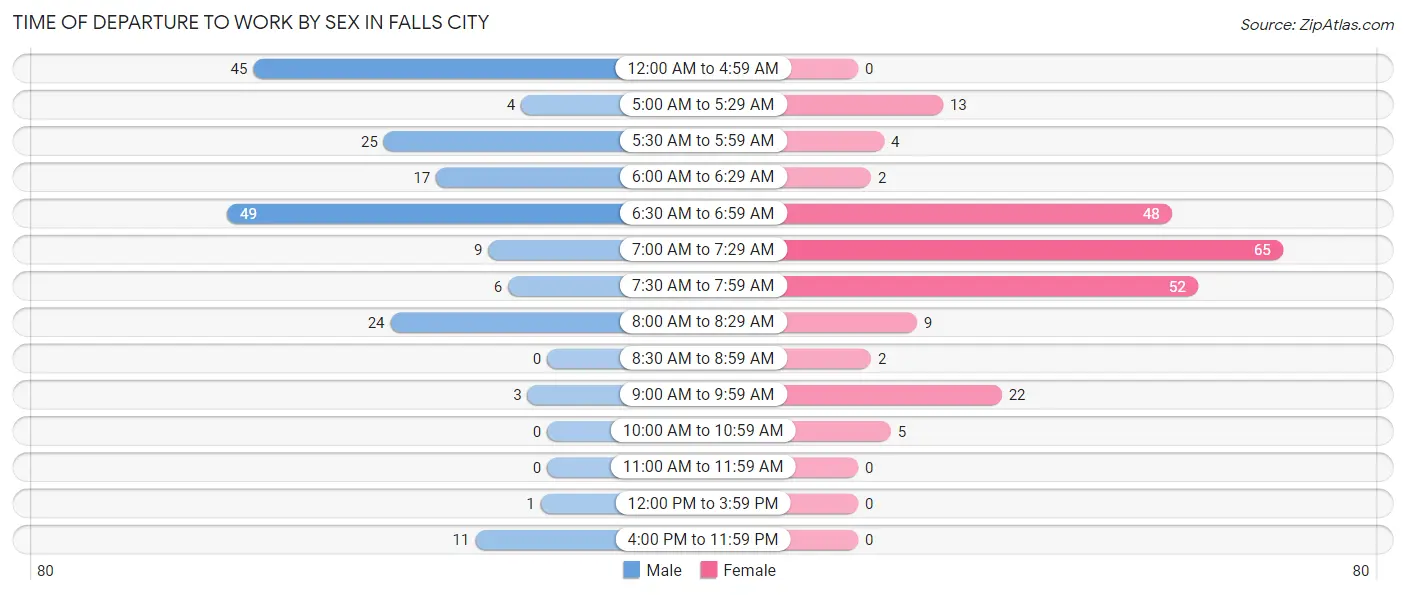
| Time of Departure | Male | Female |
| 12:00 AM to 4:59 AM | 45 (23.2%) | 0 (0.0%) |
| 5:00 AM to 5:29 AM | 4 (2.1%) | 13 (5.9%) |
| 5:30 AM to 5:59 AM | 25 (12.9%) | 4 (1.8%) |
| 6:00 AM to 6:29 AM | 17 (8.8%) | 2 (0.9%) |
| 6:30 AM to 6:59 AM | 49 (25.3%) | 48 (21.6%) |
| 7:00 AM to 7:29 AM | 9 (4.6%) | 65 (29.3%) |
| 7:30 AM to 7:59 AM | 6 (3.1%) | 52 (23.4%) |
| 8:00 AM to 8:29 AM | 24 (12.4%) | 9 (4.1%) |
| 8:30 AM to 8:59 AM | 0 (0.0%) | 2 (0.9%) |
| 9:00 AM to 9:59 AM | 3 (1.5%) | 22 (9.9%) |
| 10:00 AM to 10:59 AM | 0 (0.0%) | 5 (2.2%) |
| 11:00 AM to 11:59 AM | 0 (0.0%) | 0 (0.0%) |
| 12:00 PM to 3:59 PM | 1 (0.5%) | 0 (0.0%) |
| 4:00 PM to 11:59 PM | 11 (5.7%) | 0 (0.0%) |
| Total | 194 (100.0%) | 222 (100.0%) |
Housing Occupancy in Falls City
Occupancy by Ownership in Falls City
Of the total 296 dwellings in Falls City, owner-occupied units account for 187 (63.2%), while renter-occupied units make up 109 (36.8%).
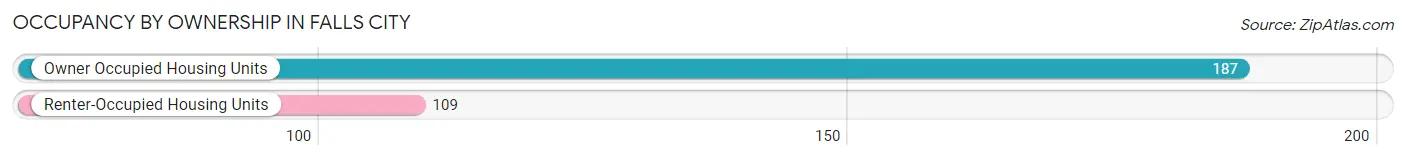
| Occupancy | # Housing Units | % Housing Units |
| Owner Occupied Housing Units | 187 | 63.2% |
| Renter-Occupied Housing Units | 109 | 36.8% |
| Total Occupied Housing Units | 296 | 100.0% |
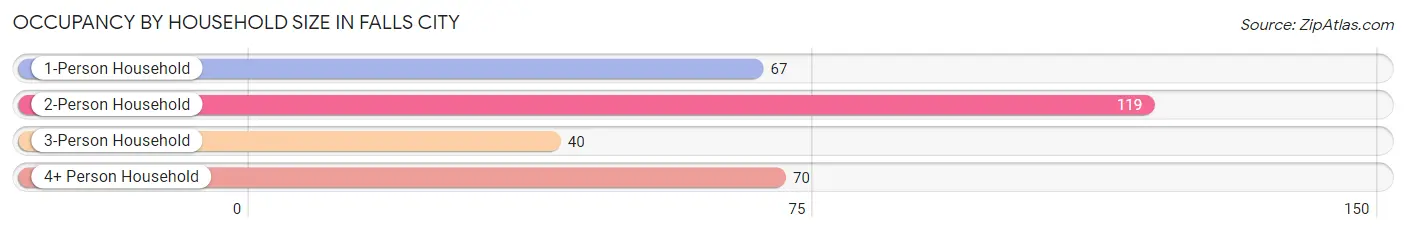
Occupancy by Household Size in Falls City
| Household Size | # Housing Units | % Housing Units |
| 1-Person Household | 67 | 22.6% |
| 2-Person Household | 119 | 40.2% |
| 3-Person Household | 40 | 13.5% |
| 4+ Person Household | 70 | 23.6% |
| Total Housing Units | 296 | 100.0% |
Occupancy by Ownership by Household Size in Falls City
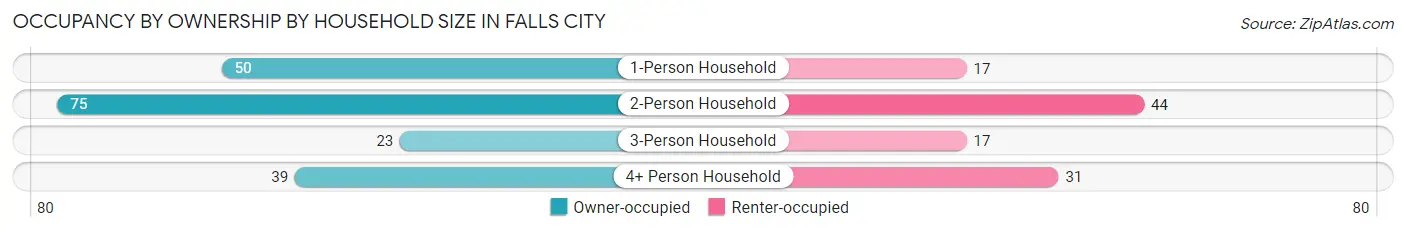
| Household Size | Owner-occupied | Renter-occupied |
| 1-Person Household | 50 (74.6%) | 17 (25.4%) |
| 2-Person Household | 75 (63.0%) | 44 (37.0%) |
| 3-Person Household | 23 (57.5%) | 17 (42.5%) |
| 4+ Person Household | 39 (55.7%) | 31 (44.3%) |
| Total Housing Units | 187 (63.2%) | 109 (36.8%) |
Occupancy by Educational Attainment in Falls City
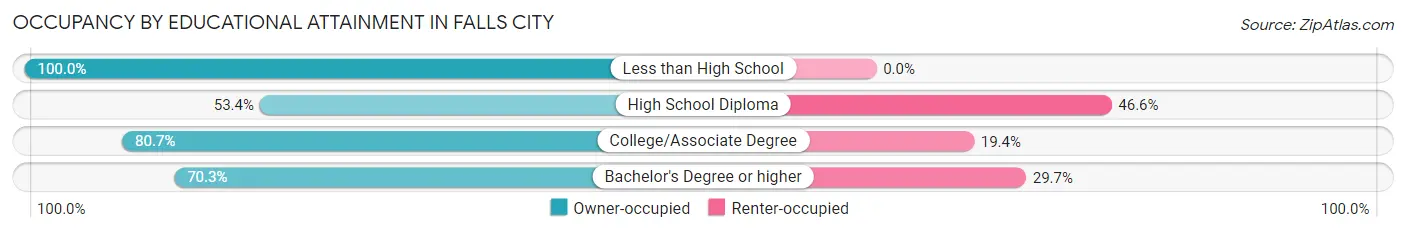
| Household Size | Owner-occupied | Renter-occupied |
| Less than High School | 11 (100.0%) | 0 (0.0%) |
| High School Diploma | 87 (53.4%) | 76 (46.6%) |
| College/Associate Degree | 25 (80.6%) | 6 (19.4%) |
| Bachelor's Degree or higher | 64 (70.3%) | 27 (29.7%) |
Occupancy by Age of Householder in Falls City
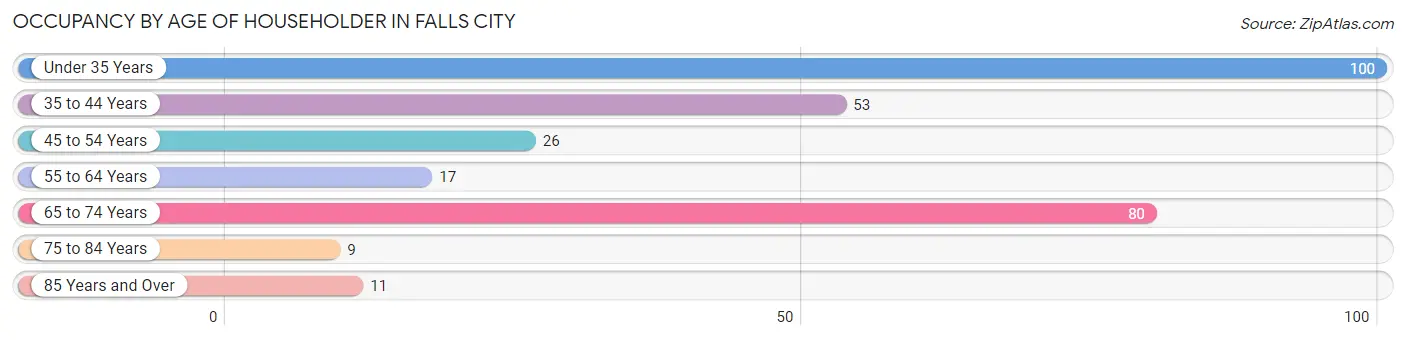
| Age Bracket | # Households | % Households |
| Under 35 Years | 100 | 33.8% |
| 35 to 44 Years | 53 | 17.9% |
| 45 to 54 Years | 26 | 8.8% |
| 55 to 64 Years | 17 | 5.7% |
| 65 to 74 Years | 80 | 27.0% |
| 75 to 84 Years | 9 | 3.0% |
| 85 Years and Over | 11 | 3.7% |
| Total | 296 | 100.0% |
Housing Finances in Falls City
Median Income by Occupancy in Falls City
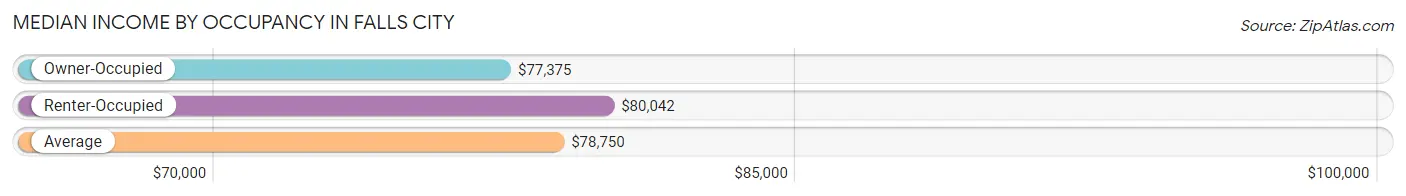
| Occupancy Type | # Households | Median Income |
| Owner-Occupied | 187 (63.2%) | $77,375 |
| Renter-Occupied | 109 (36.8%) | $80,042 |
| Average | 296 (100.0%) | $78,750 |
Occupancy by Householder Income Bracket in Falls City
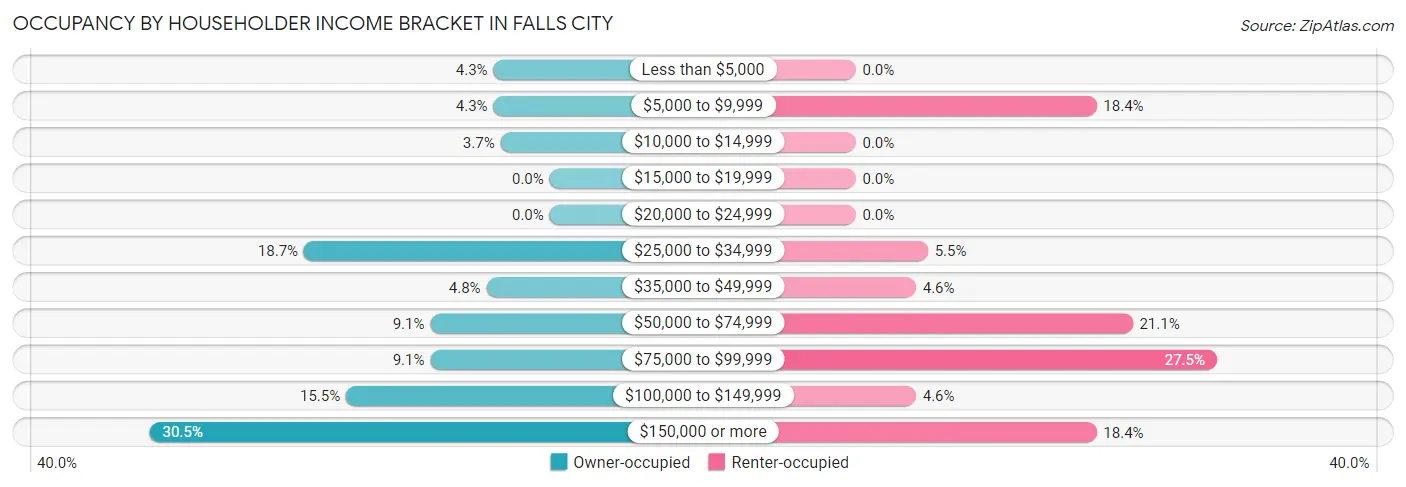
| Income Bracket | Owner-occupied | Renter-occupied |
| Less than $5,000 | 8 (4.3%) | 0 (0.0%) |
| $5,000 to $9,999 | 8 (4.3%) | 20 (18.3%) |
| $10,000 to $14,999 | 7 (3.7%) | 0 (0.0%) |
| $15,000 to $19,999 | 0 (0.0%) | 0 (0.0%) |
| $20,000 to $24,999 | 0 (0.0%) | 0 (0.0%) |
| $25,000 to $34,999 | 35 (18.7%) | 6 (5.5%) |
| $35,000 to $49,999 | 9 (4.8%) | 5 (4.6%) |
| $50,000 to $74,999 | 17 (9.1%) | 23 (21.1%) |
| $75,000 to $99,999 | 17 (9.1%) | 30 (27.5%) |
| $100,000 to $149,999 | 29 (15.5%) | 5 (4.6%) |
| $150,000 or more | 57 (30.5%) | 20 (18.3%) |
| Total | 187 (100.0%) | 109 (100.0%) |
Monthly Housing Cost Tiers in Falls City
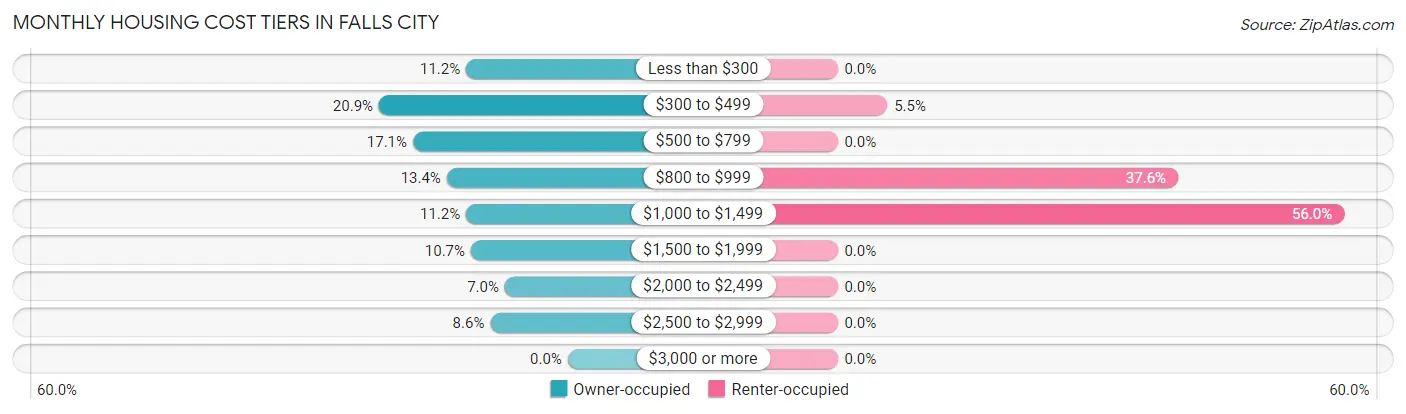
| Monthly Cost | Owner-occupied | Renter-occupied |
| Less than $300 | 21 (11.2%) | 0 (0.0%) |
| $300 to $499 | 39 (20.9%) | 6 (5.5%) |
| $500 to $799 | 32 (17.1%) | 0 (0.0%) |
| $800 to $999 | 25 (13.4%) | 41 (37.6%) |
| $1,000 to $1,499 | 21 (11.2%) | 61 (56.0%) |
| $1,500 to $1,999 | 20 (10.7%) | 0 (0.0%) |
| $2,000 to $2,499 | 13 (7.0%) | 0 (0.0%) |
| $2,500 to $2,999 | 16 (8.6%) | 0 (0.0%) |
| $3,000 or more | 0 (0.0%) | 0 (0.0%) |
| Total | 187 (100.0%) | 109 (100.0%) |
Physical Housing Characteristics in Falls City
Housing Structures in Falls City
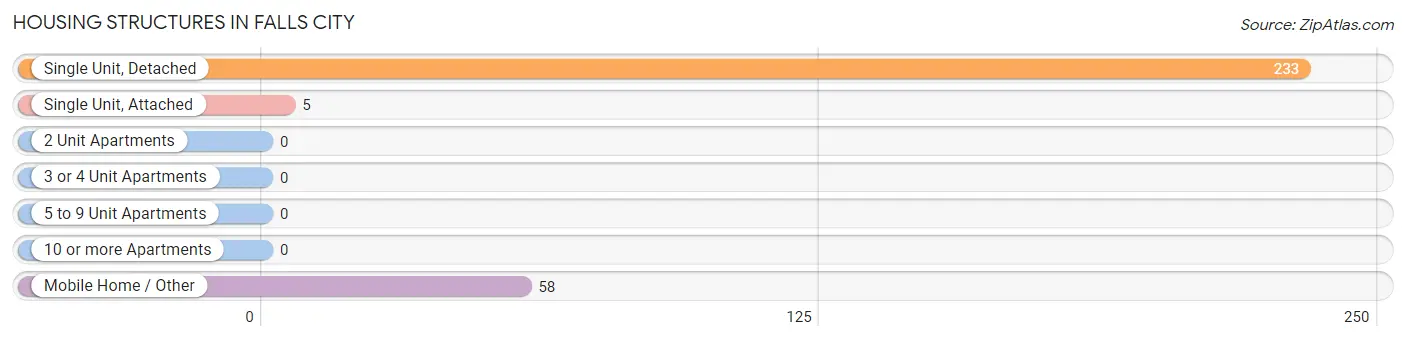
| Structure Type | # Housing Units | % Housing Units |
| Single Unit, Detached | 233 | 78.7% |
| Single Unit, Attached | 5 | 1.7% |
| 2 Unit Apartments | 0 | 0.0% |
| 3 or 4 Unit Apartments | 0 | 0.0% |
| 5 to 9 Unit Apartments | 0 | 0.0% |
| 10 or more Apartments | 0 | 0.0% |
| Mobile Home / Other | 58 | 19.6% |
| Total | 296 | 100.0% |
Housing Structures by Occupancy in Falls City
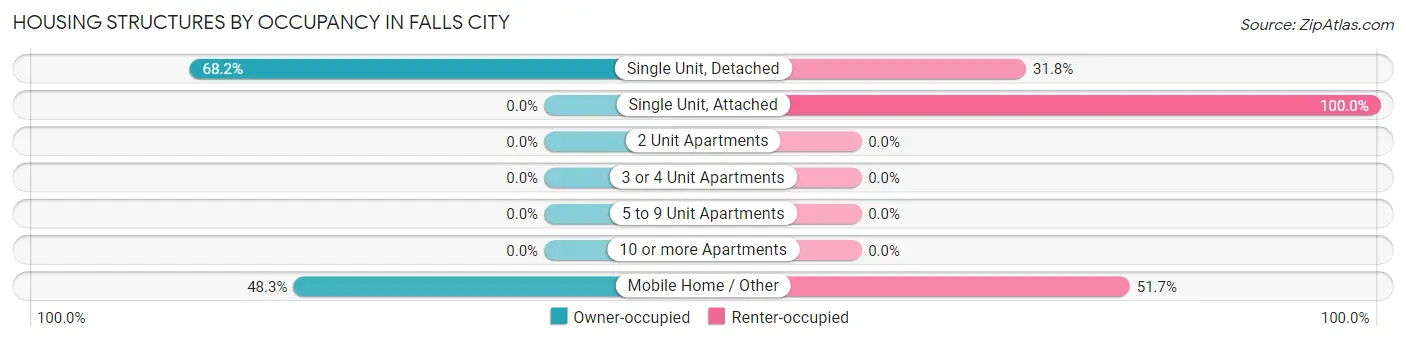
| Structure Type | Owner-occupied | Renter-occupied |
| Single Unit, Detached | 159 (68.2%) | 74 (31.8%) |
| Single Unit, Attached | 0 (0.0%) | 5 (100.0%) |
| 2 Unit Apartments | 0 (0.0%) | 0 (0.0%) |
| 3 or 4 Unit Apartments | 0 (0.0%) | 0 (0.0%) |
| 5 to 9 Unit Apartments | 0 (0.0%) | 0 (0.0%) |
| 10 or more Apartments | 0 (0.0%) | 0 (0.0%) |
| Mobile Home / Other | 28 (48.3%) | 30 (51.7%) |
| Total | 187 (63.2%) | 109 (36.8%) |
Housing Structures by Number of Rooms in Falls City
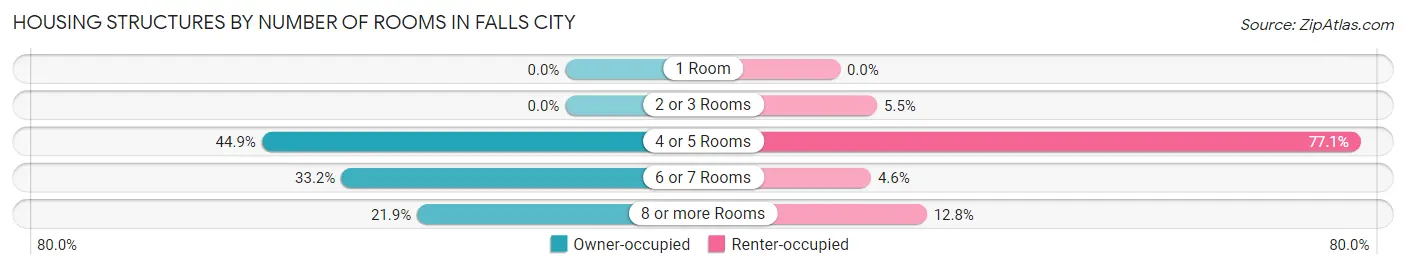
| Number of Rooms | Owner-occupied | Renter-occupied |
| 1 Room | 0 (0.0%) | 0 (0.0%) |
| 2 or 3 Rooms | 0 (0.0%) | 6 (5.5%) |
| 4 or 5 Rooms | 84 (44.9%) | 84 (77.1%) |
| 6 or 7 Rooms | 62 (33.2%) | 5 (4.6%) |
| 8 or more Rooms | 41 (21.9%) | 14 (12.8%) |
| Total | 187 (100.0%) | 109 (100.0%) |
Housing Structure by Heating Type in Falls City
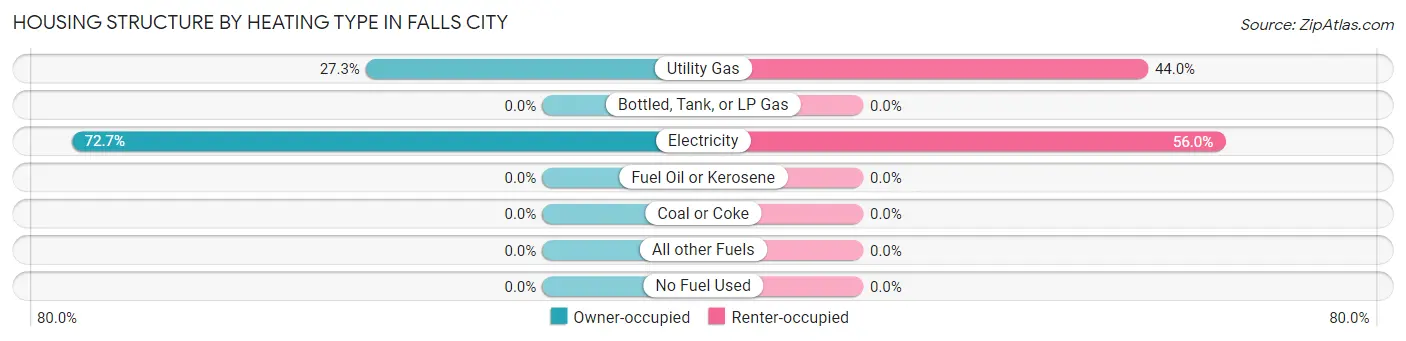
| Heating Type | Owner-occupied | Renter-occupied |
| Utility Gas | 51 (27.3%) | 48 (44.0%) |
| Bottled, Tank, or LP Gas | 0 (0.0%) | 0 (0.0%) |
| Electricity | 136 (72.7%) | 61 (56.0%) |
| Fuel Oil or Kerosene | 0 (0.0%) | 0 (0.0%) |
| Coal or Coke | 0 (0.0%) | 0 (0.0%) |
| All other Fuels | 0 (0.0%) | 0 (0.0%) |
| No Fuel Used | 0 (0.0%) | 0 (0.0%) |
| Total | 187 (100.0%) | 109 (100.0%) |
Household Vehicle Usage in Falls City
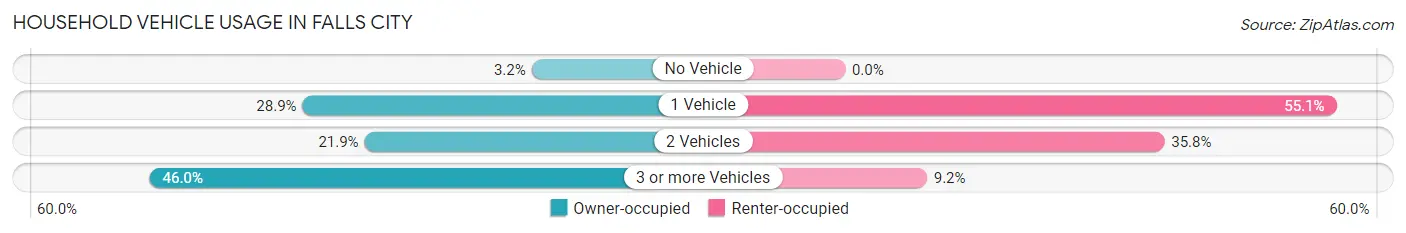
| Vehicles per Household | Owner-occupied | Renter-occupied |
| No Vehicle | 6 (3.2%) | 0 (0.0%) |
| 1 Vehicle | 54 (28.9%) | 60 (55.0%) |
| 2 Vehicles | 41 (21.9%) | 39 (35.8%) |
| 3 or more Vehicles | 86 (46.0%) | 10 (9.2%) |
| Total | 187 (100.0%) | 109 (100.0%) |
Real Estate & Mortgages in Falls City
Real Estate and Mortgage Overview in Falls City
| Characteristic | Without Mortgage | With Mortgage |
| Housing Units | 97 | 90 |
| Median Property Value | $213,100 | $260,300 |
| Median Household Income | $66,250 | $33 |
| Monthly Housing Costs | $439 | $0 |
| Real Estate Taxes | - | - |
Property Value by Mortgage Status in Falls City
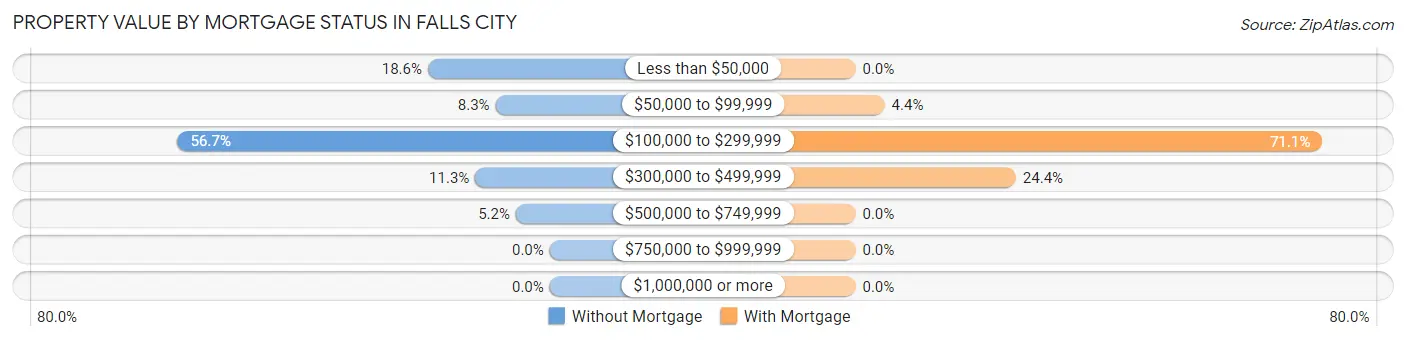
| Property Value | Without Mortgage | With Mortgage |
| Less than $50,000 | 18 (18.6%) | 0 (0.0%) |
| $50,000 to $99,999 | 8 (8.3%) | 4 (4.4%) |
| $100,000 to $299,999 | 55 (56.7%) | 64 (71.1%) |
| $300,000 to $499,999 | 11 (11.3%) | 22 (24.4%) |
| $500,000 to $749,999 | 5 (5.1%) | 0 (0.0%) |
| $750,000 to $999,999 | 0 (0.0%) | 0 (0.0%) |
| $1,000,000 or more | 0 (0.0%) | 0 (0.0%) |
| Total | 97 (100.0%) | 90 (100.0%) |
Household Income by Mortgage Status in Falls City
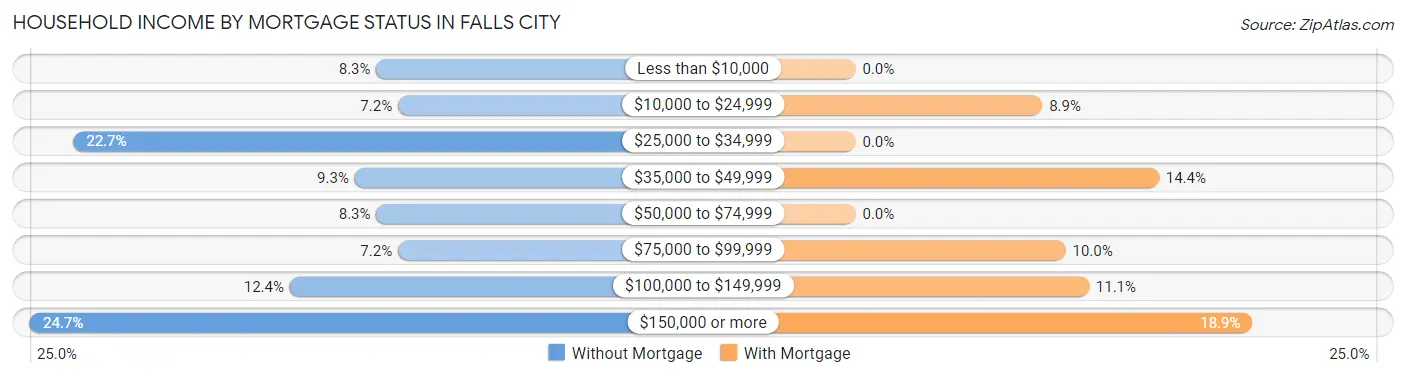
| Household Income | Without Mortgage | With Mortgage |
| Less than $10,000 | 8 (8.3%) | 0 (0.0%) |
| $10,000 to $24,999 | 7 (7.2%) | 8 (8.9%) |
| $25,000 to $34,999 | 22 (22.7%) | 0 (0.0%) |
| $35,000 to $49,999 | 9 (9.3%) | 13 (14.4%) |
| $50,000 to $74,999 | 8 (8.3%) | 0 (0.0%) |
| $75,000 to $99,999 | 7 (7.2%) | 9 (10.0%) |
| $100,000 to $149,999 | 12 (12.4%) | 10 (11.1%) |
| $150,000 or more | 24 (24.7%) | 17 (18.9%) |
| Total | 97 (100.0%) | 90 (100.0%) |
Property Value to Household Income Ratio in Falls City
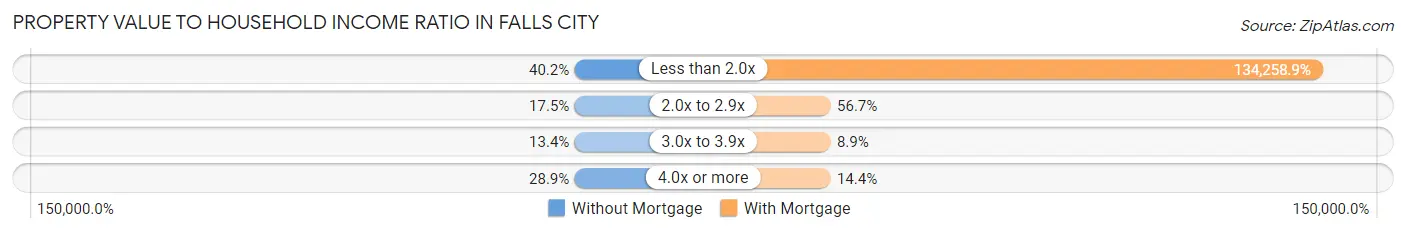
| Value-to-Income Ratio | Without Mortgage | With Mortgage |
| Less than 2.0x | 39 (40.2%) | 120,833 (134,258.9%) |
| 2.0x to 2.9x | 17 (17.5%) | 51 (56.7%) |
| 3.0x to 3.9x | 13 (13.4%) | 8 (8.9%) |
| 4.0x or more | 28 (28.9%) | 13 (14.4%) |
| Total | 97 (100.0%) | 90 (100.0%) |
Real Estate Taxes by Mortgage Status in Falls City
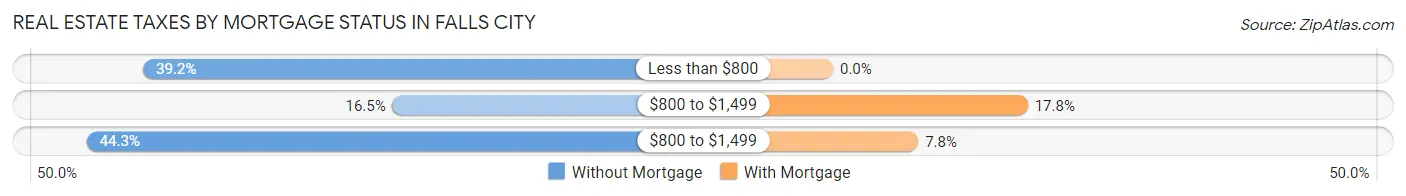
| Property Taxes | Without Mortgage | With Mortgage |
| Less than $800 | 38 (39.2%) | 0 (0.0%) |
| $800 to $1,499 | 16 (16.5%) | 16 (17.8%) |
| $800 to $1,499 | 43 (44.3%) | 7 (7.8%) |
| Total | 97 (100.0%) | 90 (100.0%) |
Health & Disability in Falls City
Health Insurance Coverage by Age in Falls City
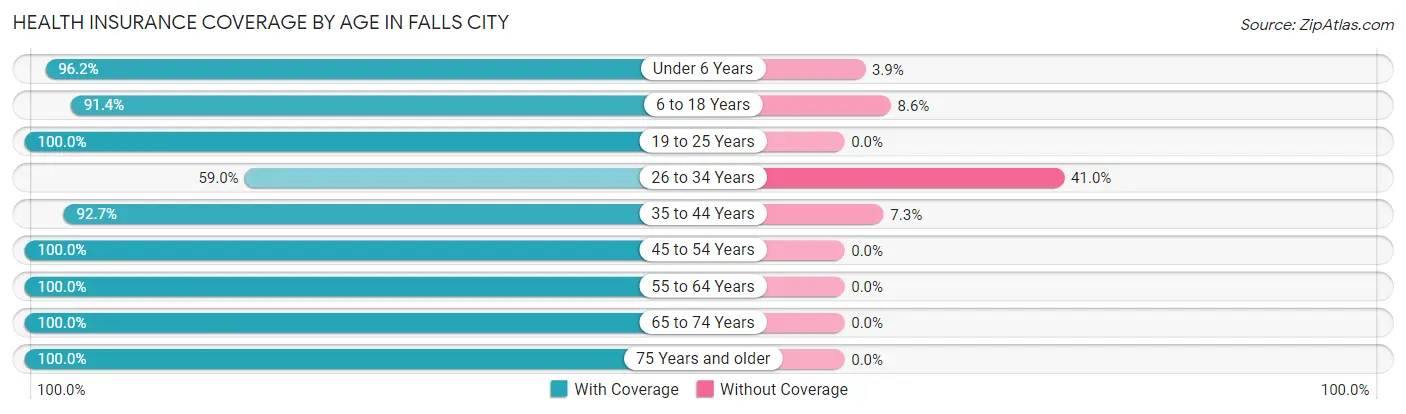
| Age Bracket | With Coverage | Without Coverage |
| Under 6 Years | 50 (96.2%) | 2 (3.8%) |
| 6 to 18 Years | 233 (91.4%) | 22 (8.6%) |
| 19 to 25 Years | 48 (100.0%) | 0 (0.0%) |
| 26 to 34 Years | 118 (59.0%) | 82 (41.0%) |
| 35 to 44 Years | 89 (92.7%) | 7 (7.3%) |
| 45 to 54 Years | 47 (100.0%) | 0 (0.0%) |
| 55 to 64 Years | 60 (100.0%) | 0 (0.0%) |
| 65 to 74 Years | 115 (100.0%) | 0 (0.0%) |
| 75 Years and older | 27 (100.0%) | 0 (0.0%) |
| Total | 787 (87.4%) | 113 (12.6%) |
Health Insurance Coverage by Citizenship Status in Falls City
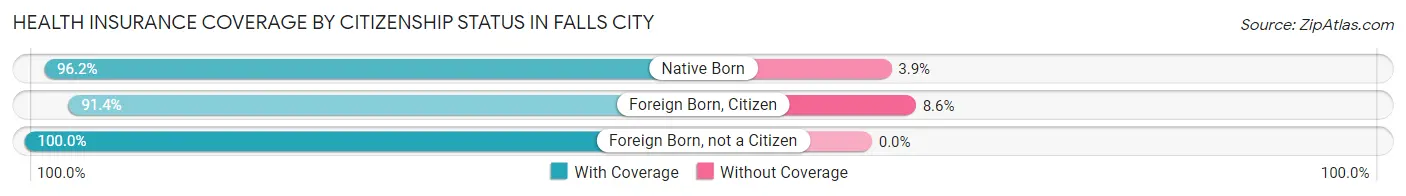
| Citizenship Status | With Coverage | Without Coverage |
| Native Born | 50 (96.2%) | 2 (3.8%) |
| Foreign Born, Citizen | 233 (91.4%) | 22 (8.6%) |
| Foreign Born, not a Citizen | 48 (100.0%) | 0 (0.0%) |
Health Insurance Coverage by Household Income in Falls City
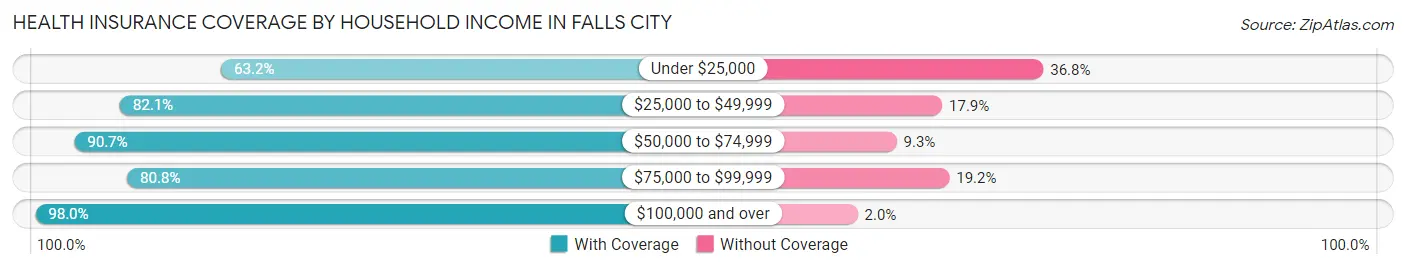
| Household Income | With Coverage | Without Coverage |
| Under $25,000 | 91 (63.2%) | 53 (36.8%) |
| $25,000 to $49,999 | 69 (82.1%) | 15 (17.9%) |
| $50,000 to $74,999 | 68 (90.7%) | 7 (9.3%) |
| $75,000 to $99,999 | 122 (80.8%) | 29 (19.2%) |
| $100,000 and over | 437 (98.0%) | 9 (2.0%) |
Public vs Private Health Insurance Coverage by Age in Falls City
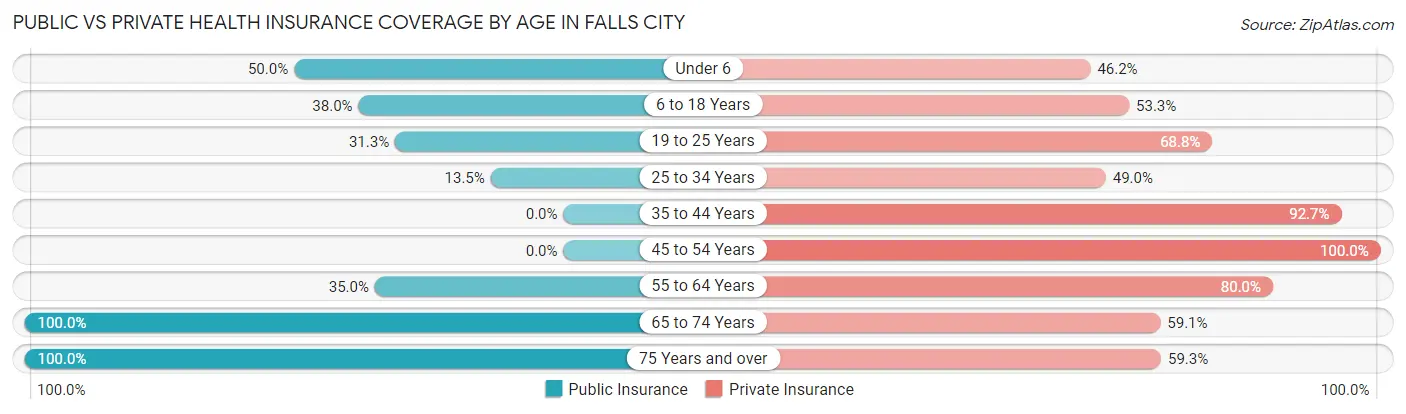
| Age Bracket | Public Insurance | Private Insurance |
| Under 6 | 26 (50.0%) | 24 (46.2%) |
| 6 to 18 Years | 97 (38.0%) | 136 (53.3%) |
| 19 to 25 Years | 15 (31.2%) | 33 (68.8%) |
| 25 to 34 Years | 27 (13.5%) | 98 (49.0%) |
| 35 to 44 Years | 0 (0.0%) | 89 (92.7%) |
| 45 to 54 Years | 0 (0.0%) | 47 (100.0%) |
| 55 to 64 Years | 21 (35.0%) | 48 (80.0%) |
| 65 to 74 Years | 115 (100.0%) | 68 (59.1%) |
| 75 Years and over | 27 (100.0%) | 16 (59.3%) |
| Total | 328 (36.4%) | 559 (62.1%) |
Disability Status by Sex by Age in Falls City
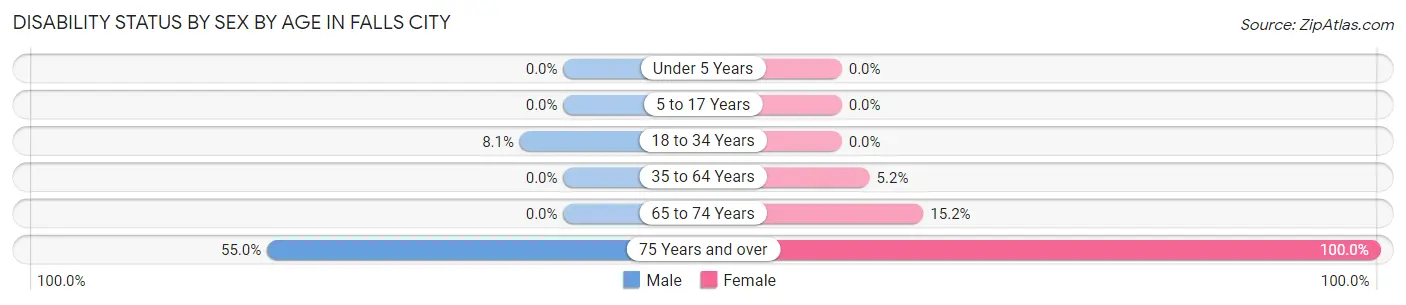
| Age Bracket | Male | Female |
| Under 5 Years | 0 (0.0%) | 0 (0.0%) |
| 5 to 17 Years | 0 (0.0%) | 0 (0.0%) |
| 18 to 34 Years | 11 (8.1%) | 0 (0.0%) |
| 35 to 64 Years | 0 (0.0%) | 6 (5.2%) |
| 65 to 74 Years | 0 (0.0%) | 10 (15.1%) |
| 75 Years and over | 11 (55.0%) | 7 (100.0%) |
Disability Class by Sex by Age in Falls City
Disability Class: Hearing Difficulty
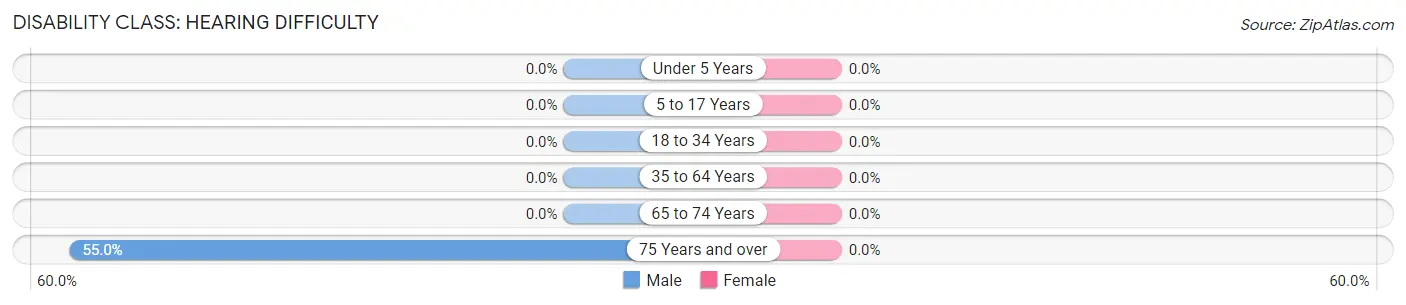
| Age Bracket | Male | Female |
| Under 5 Years | 0 (0.0%) | 0 (0.0%) |
| 5 to 17 Years | 0 (0.0%) | 0 (0.0%) |
| 18 to 34 Years | 0 (0.0%) | 0 (0.0%) |
| 35 to 64 Years | 0 (0.0%) | 0 (0.0%) |
| 65 to 74 Years | 0 (0.0%) | 0 (0.0%) |
| 75 Years and over | 11 (55.0%) | 0 (0.0%) |
Disability Class: Vision Difficulty
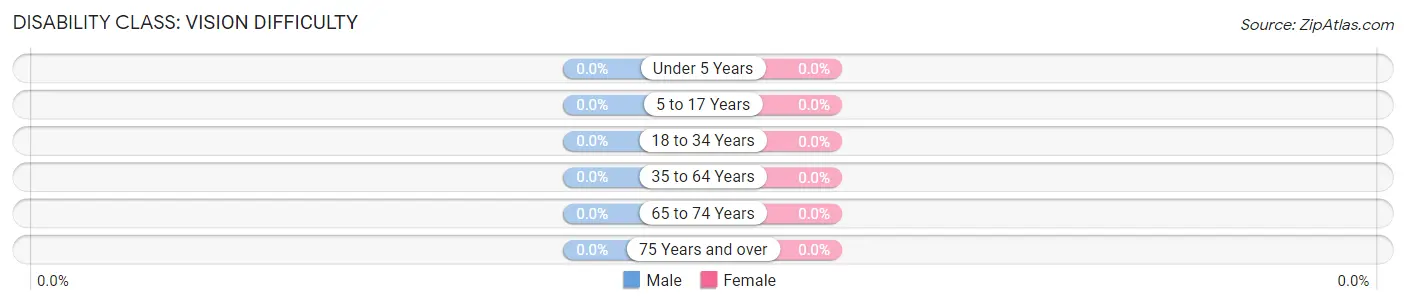
| Age Bracket | Male | Female |
| Under 5 Years | 0 (0.0%) | 0 (0.0%) |
| 5 to 17 Years | 0 (0.0%) | 0 (0.0%) |
| 18 to 34 Years | 0 (0.0%) | 0 (0.0%) |
| 35 to 64 Years | 0 (0.0%) | 0 (0.0%) |
| 65 to 74 Years | 0 (0.0%) | 0 (0.0%) |
| 75 Years and over | 0 (0.0%) | 0 (0.0%) |
Disability Class: Cognitive Difficulty
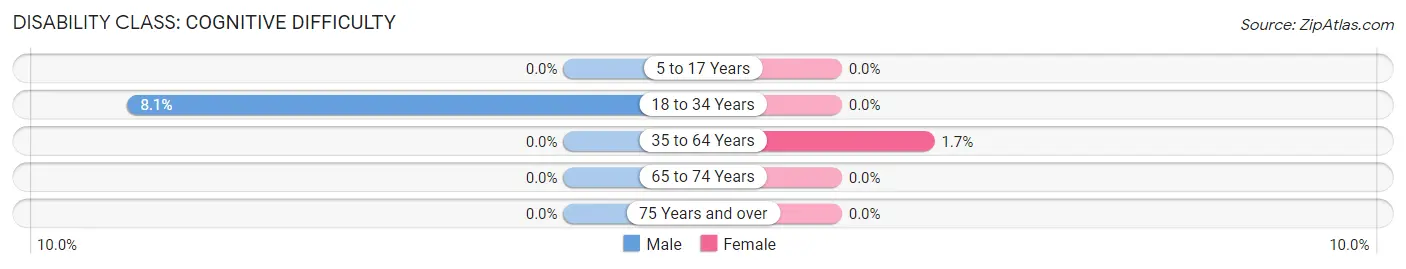
| Age Bracket | Male | Female |
| 5 to 17 Years | 0 (0.0%) | 0 (0.0%) |
| 18 to 34 Years | 11 (8.1%) | 0 (0.0%) |
| 35 to 64 Years | 0 (0.0%) | 2 (1.7%) |
| 65 to 74 Years | 0 (0.0%) | 0 (0.0%) |
| 75 Years and over | 0 (0.0%) | 0 (0.0%) |
Disability Class: Ambulatory Difficulty
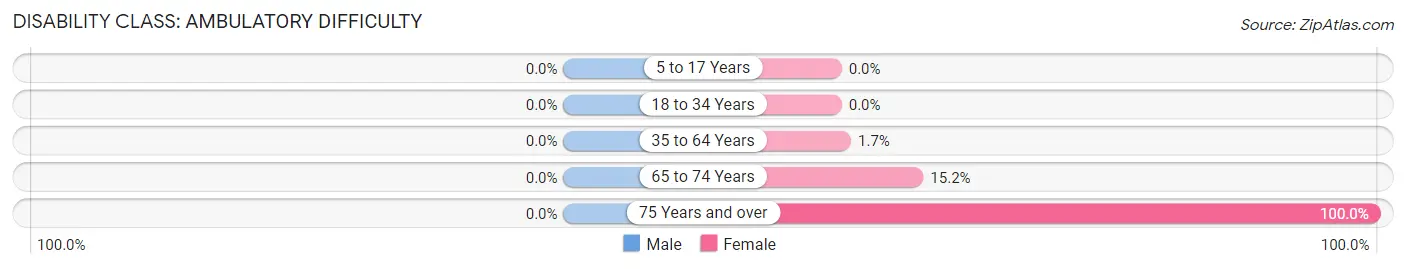
| Age Bracket | Male | Female |
| 5 to 17 Years | 0 (0.0%) | 0 (0.0%) |
| 18 to 34 Years | 0 (0.0%) | 0 (0.0%) |
| 35 to 64 Years | 0 (0.0%) | 2 (1.7%) |
| 65 to 74 Years | 0 (0.0%) | 10 (15.1%) |
| 75 Years and over | 0 (0.0%) | 7 (100.0%) |
Disability Class: Self-Care Difficulty
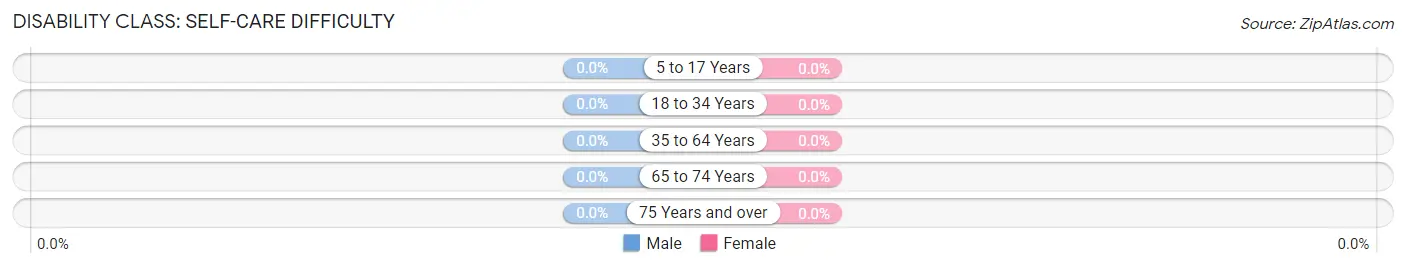
| Age Bracket | Male | Female |
| 5 to 17 Years | 0 (0.0%) | 0 (0.0%) |
| 18 to 34 Years | 0 (0.0%) | 0 (0.0%) |
| 35 to 64 Years | 0 (0.0%) | 0 (0.0%) |
| 65 to 74 Years | 0 (0.0%) | 0 (0.0%) |
| 75 Years and over | 0 (0.0%) | 0 (0.0%) |
Technology Access in Falls City
Computing Device Access in Falls City
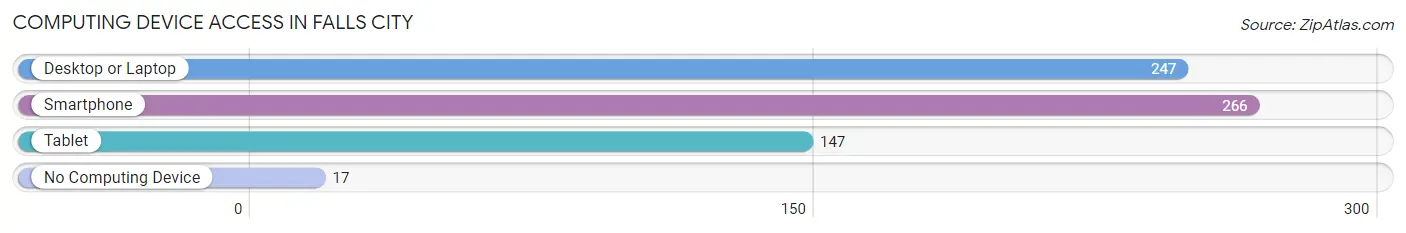
| Device Type | # Households | % Households |
| Desktop or Laptop | 247 | 83.5% |
| Smartphone | 266 | 89.9% |
| Tablet | 147 | 49.7% |
| No Computing Device | 17 | 5.7% |
| Total | 296 | 100.0% |
Internet Access in Falls City
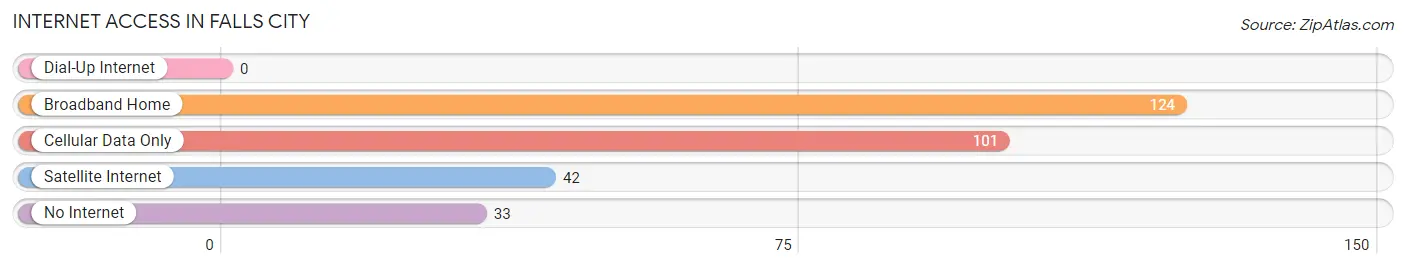
| Internet Type | # Households | % Households |
| Dial-Up Internet | 0 | 0.0% |
| Broadband Home | 124 | 41.9% |
| Cellular Data Only | 101 | 34.1% |
| Satellite Internet | 42 | 14.2% |
| No Internet | 33 | 11.2% |
| Total | 296 | 100.0% |
Falls City Summary
Falls City is a small town located in Karnes County, Texas, United States. It is situated on the San Antonio River, about 30 miles southeast of San Antonio. The population was 1,093 at the 2010 census.
History
Falls City was founded in 1854 by German immigrants who had come to Texas from the German states of Bavaria and Wurttemberg. The town was named after the nearby falls on the San Antonio River. The first settlers were mostly farmers and ranchers, and the town quickly grew to become a thriving agricultural center.
In 1876, the town was incorporated and a post office was established. The town continued to grow and by the early 1900s, it had become a major shipping point for cotton, cattle, and other agricultural products.
In the 1920s, the town began to decline as the railroad bypassed it and the population began to move away. By the 1950s, the population had dropped to just over 500.
In the late 1970s, the town began to experience a resurgence as people began to move back to the area. The population has since grown to over 1,000.
Geography
Falls City is located at 29°17'25" North, 97°59'45" West (29.290278, -97.995833). It is situated on the San Antonio River, about 30 miles southeast of San Antonio.
The town has a total area of 1 2 square miles all of it land
Economy
Falls City is a small, rural town with a primarily agricultural economy. The town is home to several farms and ranches, as well as a few small businesses.
The town is also home to a few manufacturing companies, including a furniture factory and a metal fabrication plant.
Demographics
As of the 2010 census, there were 1,093 people, 431 households, and 298 families residing in the town. The population density was 908.3 people per square mile. There were 486 housing units at an average density of 405.8 per square mile.
The racial makeup of the town was 81.2% White, 0.7% African American, 0.2% Native American, 0.2% Asian, 0.1% Pacific Islander, 15.7% from other races, and 2.0% from two or more races. Hispanic or Latino of any race were 33.2% of the population.
There were 431 households, out of which 33.2% had children under the age of 18 living with them, 51.3% were married couples living together, 12.2% had a female householder with no husband present, and 30.2% were non-families. 25.7% of all households were made up of individuals, and 11.6% had someone living alone who was 65 years of age or older. The average household size was 2.54 and the average family size was 3.06.
In the town, the population was spread out, with 27.2% under the age of 18, 8.2% from 18 to 24, 25.7% from 25 to 44, 24.2% from 45 to 64, and 14.7% who were 65 years of age or older. The median age was 37 years. For every 100 females, there were 94.2 males. For every 100 females age 18 and over, there were 91.2 males.
The median income for a household in the town was $30,000, and the median income for a family was $35,000. Males had a median income of $27,500 versus $20,000 for females. The per capita income for the town was $14,845. About 15.2% of families and 17.7% of the population were below the poverty line, including 22.2% of those under age 18 and 15.2% of those age 65 or over.
Common Questions
What is Per Capita Income in Falls City?
Per Capita income in Falls City is $32,008.
What is the Median Family Income in Falls City?
Median Family Income in Falls City is $116,250.
What is the Median Household income in Falls City?
Median Household Income in Falls City is $78,750.
What is Income or Wage Gap in Falls City?
Income or Wage Gap in Falls City is 40.4%.
Women in Falls City earn 59.6 cents for every dollar earned by a man.
What is Inequality or Gini Index in Falls City?
Inequality or Gini Index in Falls City is 0.39.
What is the Total Population of Falls City?
Total Population of Falls City is 900.
What is the Total Male Population of Falls City?
Total Male Population of Falls City is 497.
What is the Total Female Population of Falls City?
Total Female Population of Falls City is 403.
What is the Ratio of Males per 100 Females in Falls City?
There are 123.33 Males per 100 Females in Falls City.
What is the Ratio of Females per 100 Males in Falls City?
There are 81.09 Females per 100 Males in Falls City.
What is the Median Population Age in Falls City?
Median Population Age in Falls City is 32.2 Years.
What is the Average Family Size in Falls City
Average Family Size in Falls City is 3.8 People.
What is the Average Household Size in Falls City
Average Household Size in Falls City is 3.0 People.
How Large is the Labor Force in Falls City?
There are 442 People in the Labor Forcein in Falls City.
What is the Percentage of People in the Labor Force in Falls City?
70.3% of People are in the Labor Force in Falls City.