Encinal, TX Map & Demographics
Encinal Map
Encinal Overview
$16,610
PER CAPITA INCOME
$49,563
AVG FAMILY INCOME
$49,216
AVG HOUSEHOLD INCOME
0.39
INEQUALITY / GINI INDEX
1,338
TOTAL POPULATION
720
MALE POPULATION
618
FEMALE POPULATION
116.50
MALES / 100 FEMALES
85.83
FEMALES / 100 MALES
38.8
MEDIAN AGE
4.2
AVG FAMILY SIZE
4.0
AVG HOUSEHOLD SIZE
486
LABOR FORCE [ PEOPLE ]
41.4%
PERCENT IN LABOR FORCE
2.1%
UNEMPLOYMENT RATE
Encinal Zip Codes
Encinal Area Codes
Income in Encinal
Income Overview in Encinal
Per Capita Income in Encinal is $16,610, while median incomes of families and households are $49,563 and $49,216 respectively.
| Characteristic | Number | Measure |
| Per Capita Income | 1,338 | $16,610 |
| Median Family Income | 304 | $49,563 |
| Mean Family Income | 304 | $75,216 |
| Median Household Income | 339 | $49,216 |
| Mean Household Income | 339 | $70,651 |
| Income Deficit | 304 | $0 |
| Wage / Income Gap (%) | 1,338 | 0.00% |
| Wage / Income Gap ($) | 1,338 | 100.00¢ per $1 |
| Gini / Inequality Index | 1,338 | 0.39 |
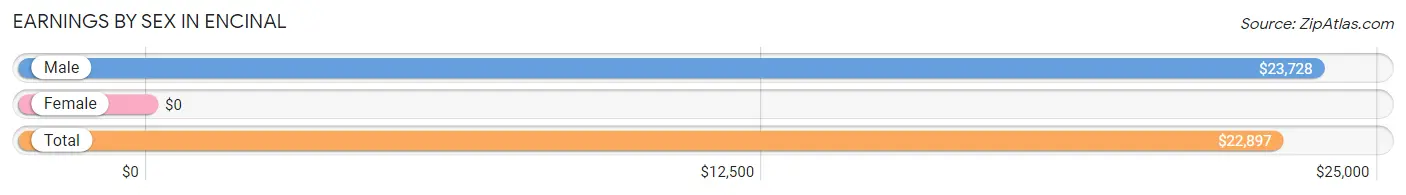
Earnings by Sex in Encinal
| Sex | Number | Average Earnings |
| Male | 257 (54.0%) | $23,728 |
| Female | 219 (46.0%) | $0 |
| Total | 476 (100.0%) | $22,897 |
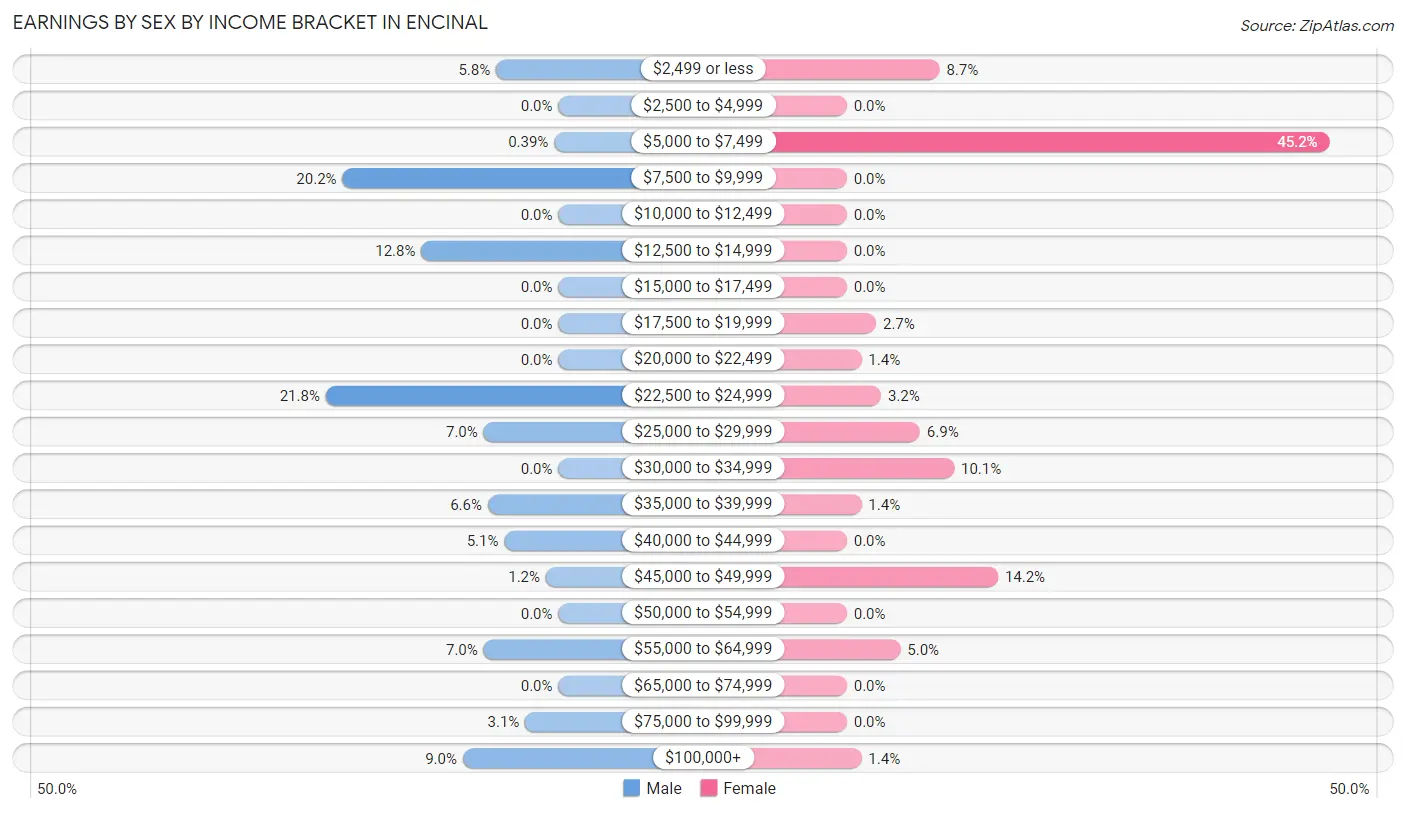
Earnings by Sex by Income Bracket in Encinal
The most common earnings brackets in Encinal are $22,500 to $24,999 for men (56 | 21.8%) and $5,000 to $7,499 for women (99 | 45.2%).
| Income | Male | Female |
| $2,499 or less | 15 (5.8%) | 19 (8.7%) |
| $2,500 to $4,999 | 0 (0.0%) | 0 (0.0%) |
| $5,000 to $7,499 | 1 (0.4%) | 99 (45.2%) |
| $7,500 to $9,999 | 52 (20.2%) | 0 (0.0%) |
| $10,000 to $12,499 | 0 (0.0%) | 0 (0.0%) |
| $12,500 to $14,999 | 33 (12.8%) | 0 (0.0%) |
| $15,000 to $17,499 | 0 (0.0%) | 0 (0.0%) |
| $17,500 to $19,999 | 0 (0.0%) | 6 (2.7%) |
| $20,000 to $22,499 | 0 (0.0%) | 3 (1.4%) |
| $22,500 to $24,999 | 56 (21.8%) | 7 (3.2%) |
| $25,000 to $29,999 | 18 (7.0%) | 15 (6.9%) |
| $30,000 to $34,999 | 0 (0.0%) | 22 (10.1%) |
| $35,000 to $39,999 | 17 (6.6%) | 3 (1.4%) |
| $40,000 to $44,999 | 13 (5.1%) | 0 (0.0%) |
| $45,000 to $49,999 | 3 (1.2%) | 31 (14.2%) |
| $50,000 to $54,999 | 0 (0.0%) | 0 (0.0%) |
| $55,000 to $64,999 | 18 (7.0%) | 11 (5.0%) |
| $65,000 to $74,999 | 0 (0.0%) | 0 (0.0%) |
| $75,000 to $99,999 | 8 (3.1%) | 0 (0.0%) |
| $100,000+ | 23 (8.9%) | 3 (1.4%) |
| Total | 257 (100.0%) | 219 (100.0%) |
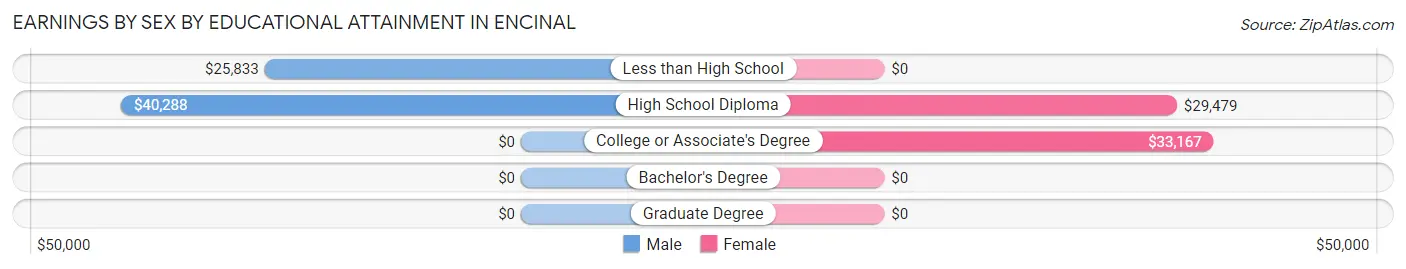
Earnings by Sex by Educational Attainment in Encinal
Average earnings in Encinal are $36,103 for men and $34,716 for women, a difference of 3.8%. Men with an educational attainment of high school diploma enjoy the highest average annual earnings of $40,288, while those with less than high school education earn the least with $25,833. Women with an educational attainment of college or associate's degree earn the most with the average annual earnings of $33,167, while those with high school diploma education have the smallest earnings of $29,479.
| Educational Attainment | Male Income | Female Income |
| Less than High School | $25,833 | $0 |
| High School Diploma | $40,288 | $29,479 |
| College or Associate's Degree | - | - |
| Bachelor's Degree | - | - |
| Graduate Degree | - | - |
| Total | $36,103 | $34,716 |
Family Income in Encinal
Family Income Brackets in Encinal
According to the Encinal family income data, there are 147 families falling into the $35,000 to $49,999 income range, which is the most common income bracket and makes up 48.4% of all families.
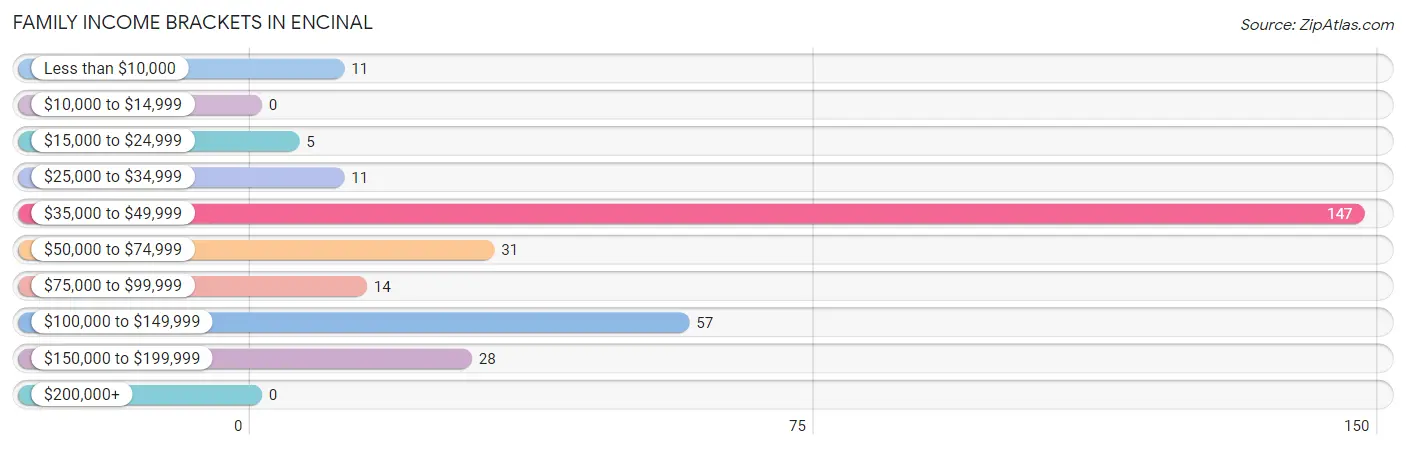
| Income Bracket | # Families | % Families |
| Less than $10,000 | 11 | 3.6% |
| $10,000 to $14,999 | 0 | 0.0% |
| $15,000 to $24,999 | 5 | 1.6% |
| $25,000 to $34,999 | 11 | 3.6% |
| $35,000 to $49,999 | 147 | 48.4% |
| $50,000 to $74,999 | 31 | 10.2% |
| $75,000 to $99,999 | 14 | 4.6% |
| $100,000 to $149,999 | 57 | 18.8% |
| $150,000 to $199,999 | 28 | 9.2% |
| $200,000+ | 0 | 0.0% |
Family Income by Famaliy Size in Encinal
6-person families (39 | 12.8%) account for the highest median family income in Encinal with $146,417 per family, while 4-person families (34 | 11.2%) have the highest median income of $35,719 per family member.
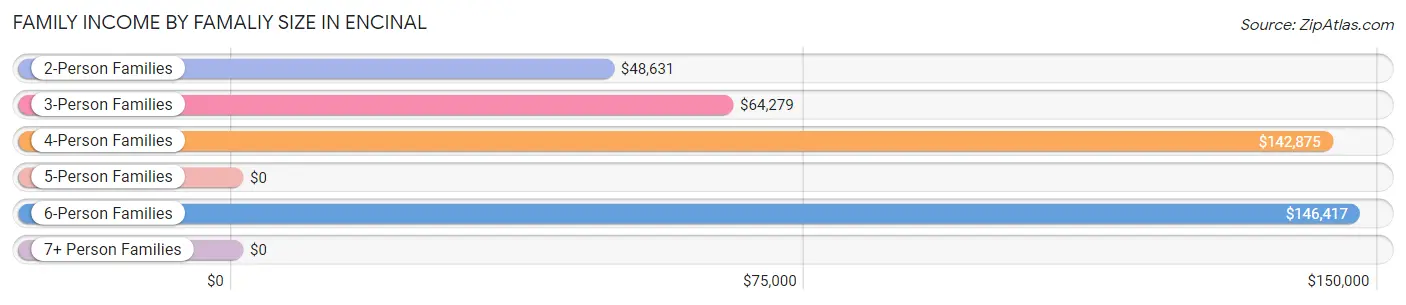
| Income Bracket | # Families | Median Income |
| 2-Person Families | 160 (52.6%) | $48,631 |
| 3-Person Families | 39 (12.8%) | $64,279 |
| 4-Person Families | 34 (11.2%) | $142,875 |
| 5-Person Families | 32 (10.5%) | $0 |
| 6-Person Families | 39 (12.8%) | $146,417 |
| 7+ Person Families | 0 (0.0%) | $0 |
| Total | 304 (100.0%) | $49,563 |
Family Income by Number of Earners in Encinal
The median family income in Encinal is $49,563, with families comprising 3+ earners (50) having the highest median family income of $145,833, while families with 1 earner (195) have the lowest median family income of $48,938, accounting for 16.5% and 64.1% of families, respectively.
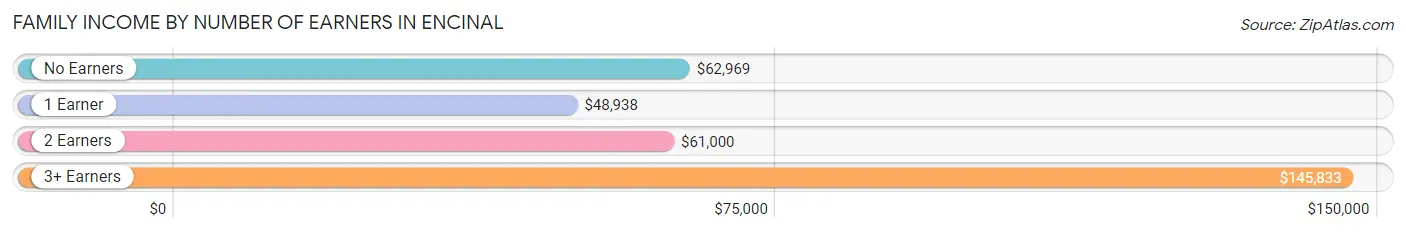
| Number of Earners | # Families | Median Income |
| No Earners | 39 (12.8%) | $62,969 |
| 1 Earner | 195 (64.1%) | $48,938 |
| 2 Earners | 20 (6.6%) | $61,000 |
| 3+ Earners | 50 (16.5%) | $145,833 |
| Total | 304 (100.0%) | $49,563 |
Household Income in Encinal
Household Income Brackets in Encinal
With 147 households falling in the category, the $35,000 to $49,999 income range is the most frequent in Encinal, accounting for 43.4% of all households.
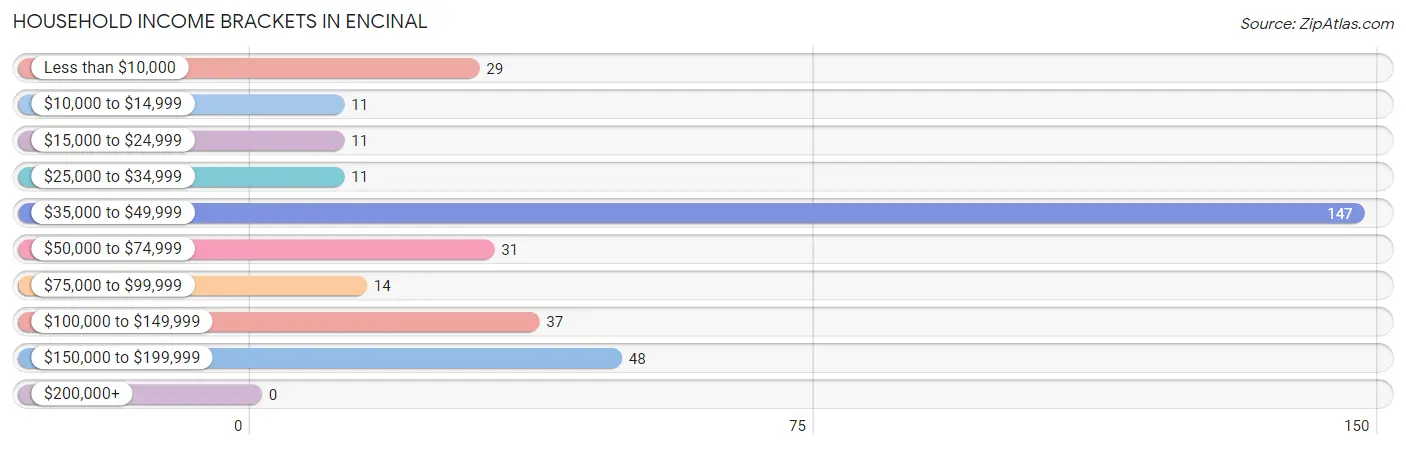
| Income Bracket | # Households | % Households |
| Less than $10,000 | 29 | 8.6% |
| $10,000 to $14,999 | 11 | 3.2% |
| $15,000 to $24,999 | 11 | 3.2% |
| $25,000 to $34,999 | 11 | 3.2% |
| $35,000 to $49,999 | 147 | 43.4% |
| $50,000 to $74,999 | 31 | 9.1% |
| $75,000 to $99,999 | 14 | 4.1% |
| $100,000 to $149,999 | 37 | 10.9% |
| $150,000 to $199,999 | 48 | 14.2% |
| $200,000+ | 0 | 0.0% |
Household Income by Householder Age in Encinal
The median household income in Encinal is $49,216, with the highest median household income of $48,383 found in the 65+ years age bracket for the primary householder. A total of 187 households (55.2%) fall into this category. Meanwhile, the 15 to 24 years age bracket for the primary householder has the lowest median household income of $0, with 15 households (4.4%) in this group.
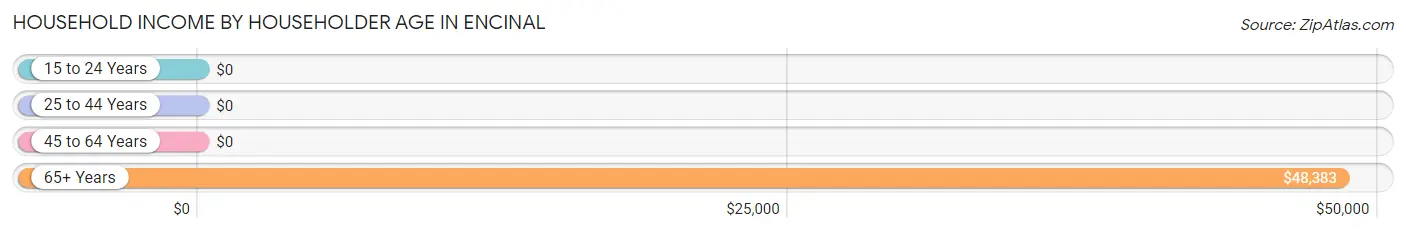
| Income Bracket | # Households | Median Income |
| 15 to 24 Years | 15 (4.4%) | $0 |
| 25 to 44 Years | 32 (9.4%) | $0 |
| 45 to 64 Years | 105 (31.0%) | $0 |
| 65+ Years | 187 (55.2%) | $48,383 |
| Total | 339 (100.0%) | $49,216 |
Poverty in Encinal
Income Below Poverty by Sex and Age in Encinal
With 21.0% poverty level for males and 14.1% for females among the residents of Encinal, 12 to 14 year old males and 15 year old females are the most vulnerable to poverty, with 21 males (84.0%) and 3 females (100.0%) in their respective age groups living below the poverty level.
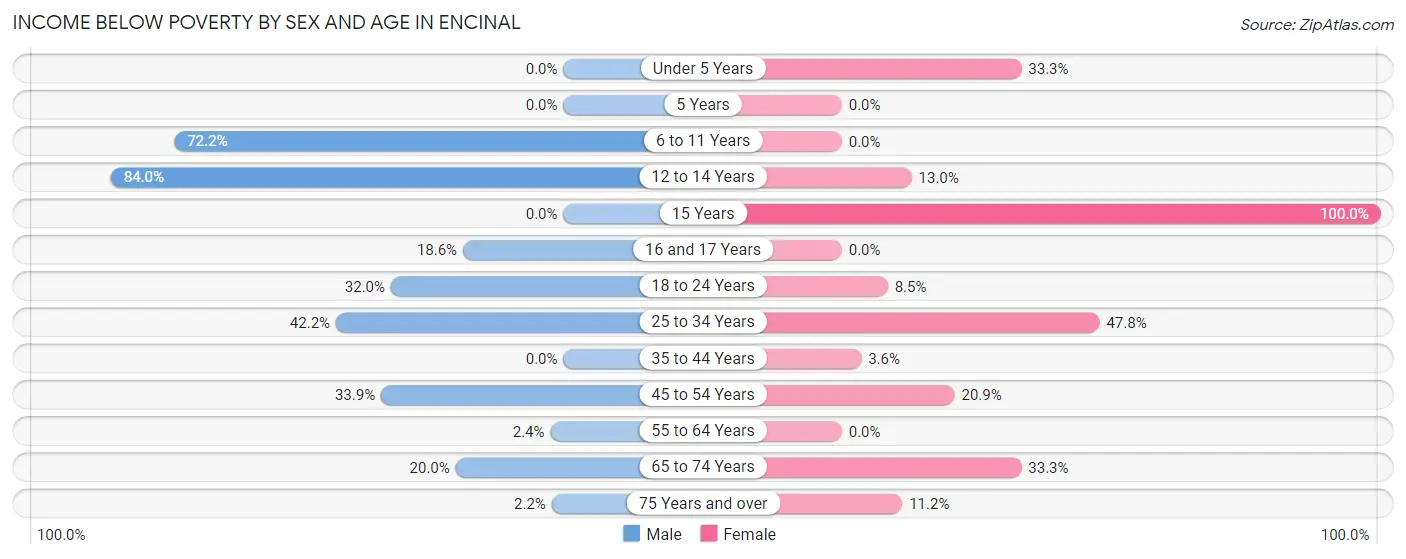
| Age Bracket | Male | Female |
| Under 5 Years | 0 (0.0%) | 2 (33.3%) |
| 5 Years | 0 (0.0%) | 0 (0.0%) |
| 6 to 11 Years | 13 (72.2%) | 0 (0.0%) |
| 12 to 14 Years | 21 (84.0%) | 7 (13.0%) |
| 15 Years | 0 (0.0%) | 3 (100.0%) |
| 16 and 17 Years | 11 (18.6%) | 0 (0.0%) |
| 18 to 24 Years | 57 (32.0%) | 11 (8.5%) |
| 25 to 34 Years | 19 (42.2%) | 22 (47.8%) |
| 35 to 44 Years | 0 (0.0%) | 3 (3.6%) |
| 45 to 54 Years | 22 (33.9%) | 18 (20.9%) |
| 55 to 64 Years | 2 (2.4%) | 0 (0.0%) |
| 65 to 74 Years | 3 (20.0%) | 10 (33.3%) |
| 75 Years and over | 3 (2.2%) | 11 (11.2%) |
| Total | 151 (21.0%) | 87 (14.1%) |
Income Above Poverty by Sex and Age in Encinal
According to the poverty statistics in Encinal, males aged under 5 years and females aged 16 and 17 years are the age groups that are most secure financially, with 100.0% of males and 100.0% of females in these age groups living above the poverty line.
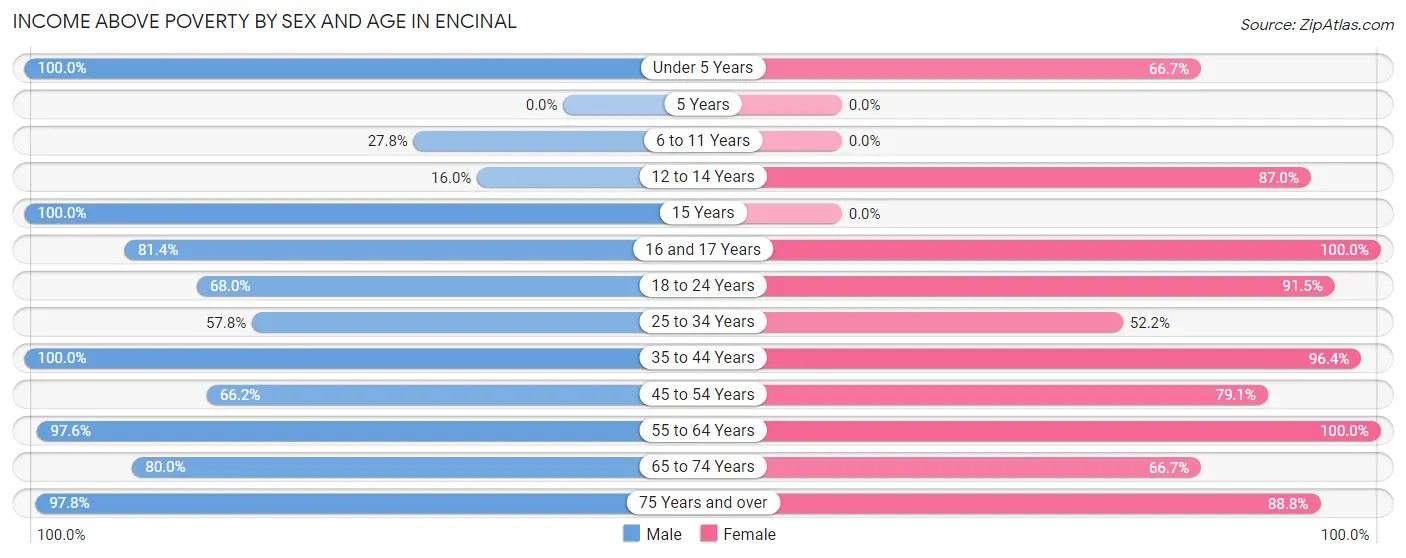
| Age Bracket | Male | Female |
| Under 5 Years | 28 (100.0%) | 4 (66.7%) |
| 5 Years | 0 (0.0%) | 0 (0.0%) |
| 6 to 11 Years | 5 (27.8%) | 0 (0.0%) |
| 12 to 14 Years | 4 (16.0%) | 47 (87.0%) |
| 15 Years | 31 (100.0%) | 0 (0.0%) |
| 16 and 17 Years | 48 (81.4%) | 18 (100.0%) |
| 18 to 24 Years | 121 (68.0%) | 118 (91.5%) |
| 25 to 34 Years | 26 (57.8%) | 24 (52.2%) |
| 35 to 44 Years | 35 (100.0%) | 80 (96.4%) |
| 45 to 54 Years | 43 (66.1%) | 68 (79.1%) |
| 55 to 64 Years | 81 (97.6%) | 65 (100.0%) |
| 65 to 74 Years | 12 (80.0%) | 20 (66.7%) |
| 75 Years and over | 135 (97.8%) | 87 (88.8%) |
| Total | 569 (79.0%) | 531 (85.9%) |
Income Below Poverty Among Married-Couple Families in Encinal
The poverty statistics for married-couple families in Encinal show that 7.9% or 19 of the total 240 families live below the poverty line. Families with 3 or 4 children have the highest poverty rate of 45.8%, comprising of 11 families. On the other hand, families with no children have the lowest poverty rate of 1.6%, which includes 3 families.
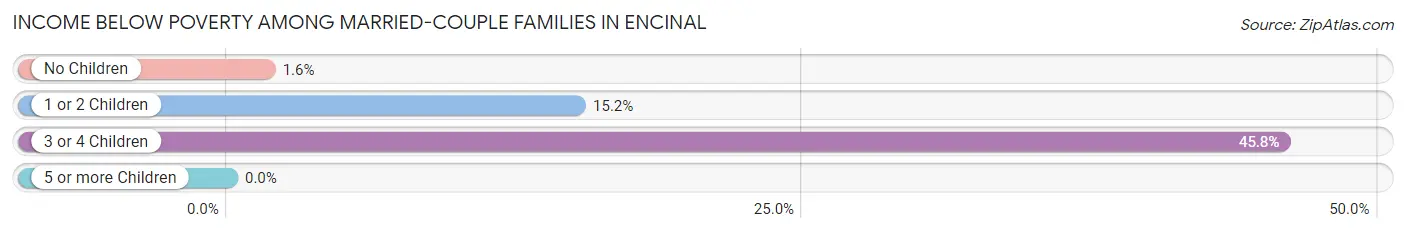
| Children | Above Poverty | Below Poverty |
| No Children | 180 (98.4%) | 3 (1.6%) |
| 1 or 2 Children | 28 (84.9%) | 5 (15.1%) |
| 3 or 4 Children | 13 (54.2%) | 11 (45.8%) |
| 5 or more Children | 0 (0.0%) | 0 (0.0%) |
| Total | 221 (92.1%) | 19 (7.9%) |
Income Below Poverty Among Single-Parent Households in Encinal
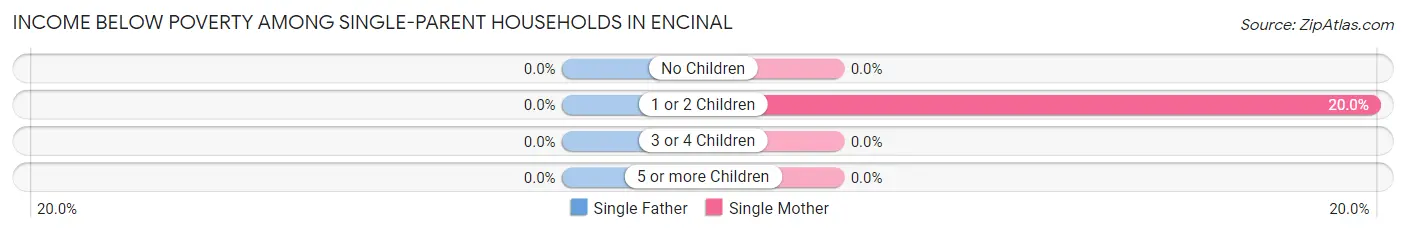
| Children | Single Father | Single Mother |
| No Children | 0 (0.0%) | 0 (0.0%) |
| 1 or 2 Children | 0 (0.0%) | 5 (20.0%) |
| 3 or 4 Children | 0 (0.0%) | 0 (0.0%) |
| 5 or more Children | 0 (0.0%) | 0 (0.0%) |
| Total | 0 (0.0%) | 5 (11.4%) |
Income Below Poverty Among Married-Couple vs Single-Parent Households in Encinal
The poverty data for Encinal shows that 19 of the married-couple family households (7.9%) and 5 of the single-parent households (7.8%) are living below the poverty level. Within the married-couple family households, those with 3 or 4 children have the highest poverty rate, with 11 households (45.8%) falling below the poverty line. Among the single-parent households, those with 1 or 2 children have the highest poverty rate, with 5 household (11.1%) living below poverty.
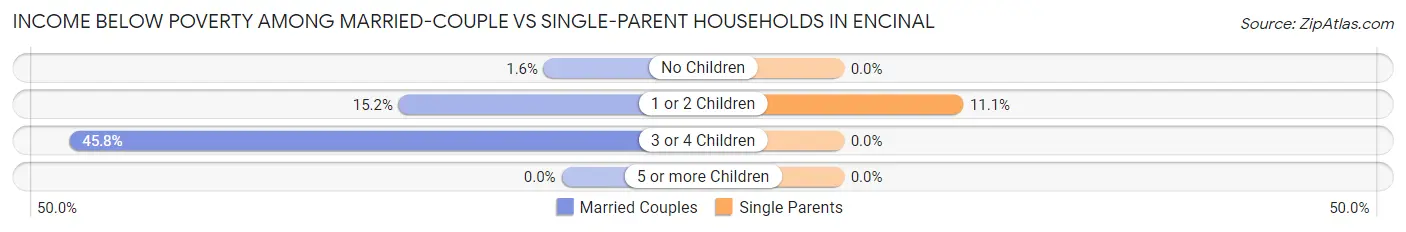
| Children | Married-Couple Families | Single-Parent Households |
| No Children | 3 (1.6%) | 0 (0.0%) |
| 1 or 2 Children | 5 (15.1%) | 5 (11.1%) |
| 3 or 4 Children | 11 (45.8%) | 0 (0.0%) |
| 5 or more Children | 0 (0.0%) | 0 (0.0%) |
| Total | 19 (7.9%) | 5 (7.8%) |
Race in Encinal
The most populous races in Encinal are Hispanic or Latino (1,114 | 83.3%), White / Caucasian (688 | 51.4%), and Two or more Races (534 | 39.9%).
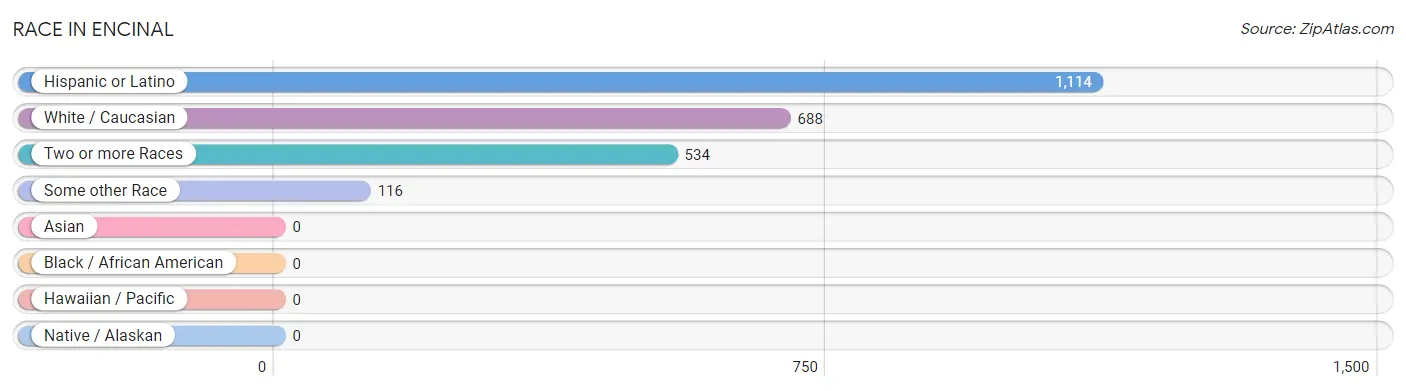
| Race | # Population | % Population |
| Asian | 0 | 0.0% |
| Black / African American | 0 | 0.0% |
| Hawaiian / Pacific | 0 | 0.0% |
| Hispanic or Latino | 1,114 | 83.3% |
| Native / Alaskan | 0 | 0.0% |
| White / Caucasian | 688 | 51.4% |
| Two or more Races | 534 | 39.9% |
| Some other Race | 116 | 8.7% |
| Total | 1,338 | 100.0% |
Ancestry in Encinal
The most populous ancestries reported in Encinal are Mexican (1,114 | 83.3%), Irish (164 | 12.3%), American (126 | 9.4%), German (126 | 9.4%), and English (25 | 1.9%), together accounting for 116.2% of all Encinal residents.
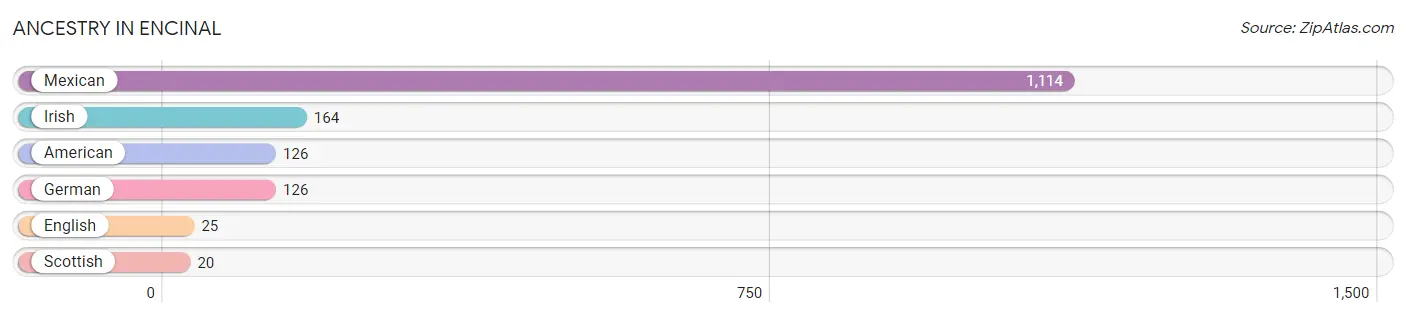
| Ancestry | # Population | % Population |
| American | 126 | 9.4% |
| English | 25 | 1.9% |
| German | 126 | 9.4% |
| Irish | 164 | 12.3% |
| Mexican | 1,114 | 83.3% |
| Scottish | 20 | 1.5% | View All 6 Rows |
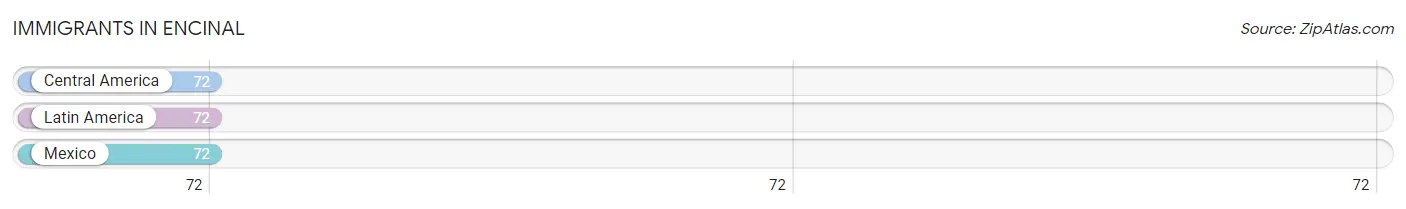
Immigrants in Encinal
The most numerous immigrant groups reported in Encinal came from Central America (72 | 5.4%), Latin America (72 | 5.4%), and Mexico (72 | 5.4%), together accounting for 16.1% of all Encinal residents.
| Immigration Origin | # Population | % Population |
| Central America | 72 | 5.4% |
| Latin America | 72 | 5.4% |
| Mexico | 72 | 5.4% | View All 3 Rows |
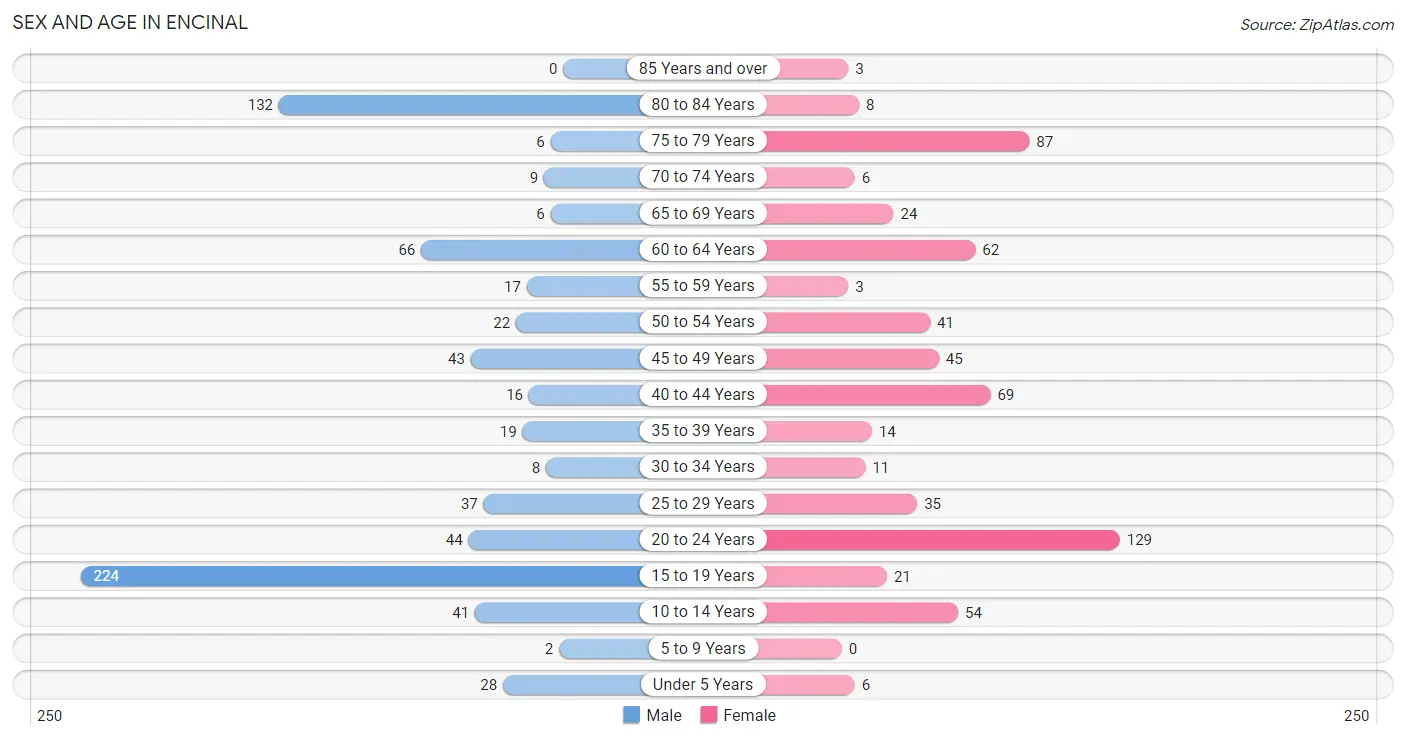
Sex and Age in Encinal
Sex and Age in Encinal
The most populous age groups in Encinal are 15 to 19 Years (224 | 31.1%) for men and 20 to 24 Years (129 | 20.9%) for women.
| Age Bracket | Male | Female |
| Under 5 Years | 28 (3.9%) | 6 (1.0%) |
| 5 to 9 Years | 2 (0.3%) | 0 (0.0%) |
| 10 to 14 Years | 41 (5.7%) | 54 (8.7%) |
| 15 to 19 Years | 224 (31.1%) | 21 (3.4%) |
| 20 to 24 Years | 44 (6.1%) | 129 (20.9%) |
| 25 to 29 Years | 37 (5.1%) | 35 (5.7%) |
| 30 to 34 Years | 8 (1.1%) | 11 (1.8%) |
| 35 to 39 Years | 19 (2.6%) | 14 (2.3%) |
| 40 to 44 Years | 16 (2.2%) | 69 (11.2%) |
| 45 to 49 Years | 43 (6.0%) | 45 (7.3%) |
| 50 to 54 Years | 22 (3.1%) | 41 (6.6%) |
| 55 to 59 Years | 17 (2.4%) | 3 (0.5%) |
| 60 to 64 Years | 66 (9.2%) | 62 (10.0%) |
| 65 to 69 Years | 6 (0.8%) | 24 (3.9%) |
| 70 to 74 Years | 9 (1.3%) | 6 (1.0%) |
| 75 to 79 Years | 6 (0.8%) | 87 (14.1%) |
| 80 to 84 Years | 132 (18.3%) | 8 (1.3%) |
| 85 Years and over | 0 (0.0%) | 3 (0.5%) |
| Total | 720 (100.0%) | 618 (100.0%) |
Families and Households in Encinal
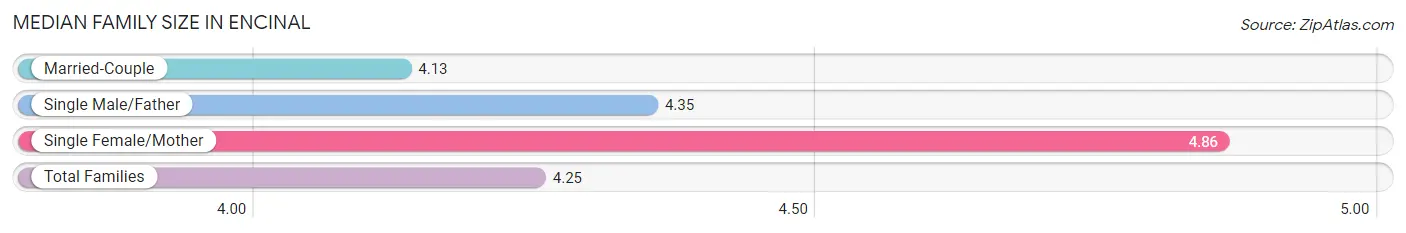
Median Family Size in Encinal
The median family size in Encinal is 4.25 persons per family, with single female/mother families (44 | 14.5%) accounting for the largest median family size of 4.86 persons per family. On the other hand, married-couple families (240 | 78.9%) represent the smallest median family size with 4.13 persons per family.
| Family Type | # Families | Family Size |
| Married-Couple | 240 (78.9%) | 4.13 |
| Single Male/Father | 20 (6.6%) | 4.35 |
| Single Female/Mother | 44 (14.5%) | 4.86 |
| Total Families | 304 (100.0%) | 4.25 |
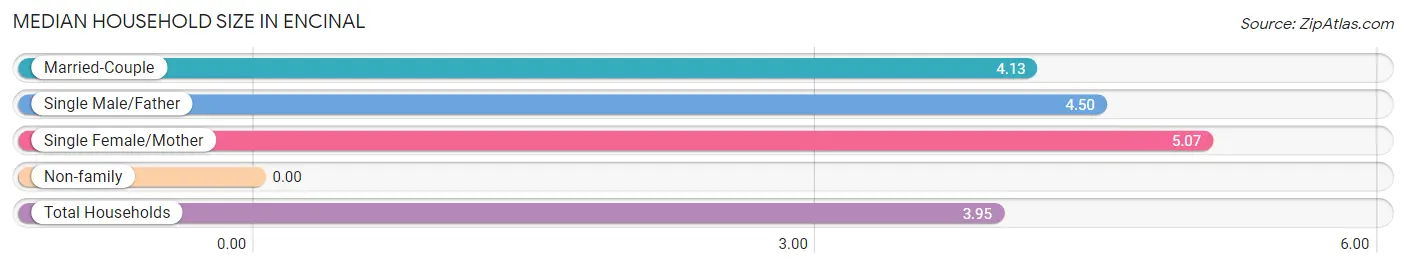
Median Household Size in Encinal
| Household Type | # Households | Household Size |
| Married-Couple | 240 (70.8%) | 4.13 |
| Single Male/Father | 20 (5.9%) | 4.50 |
| Single Female/Mother | 44 (13.0%) | 5.07 |
| Non-family | 35 (10.3%) | - |
| Total Households | 339 (100.0%) | 3.95 |
Household Size by Marriage Status in Encinal
Out of a total of 339 households in Encinal, 304 (89.7%) are family households, while 35 (10.3%) are nonfamily households. The most numerous type of family households are 2-person households, comprising 160, and the most common type of nonfamily households are 1-person households, comprising 35.
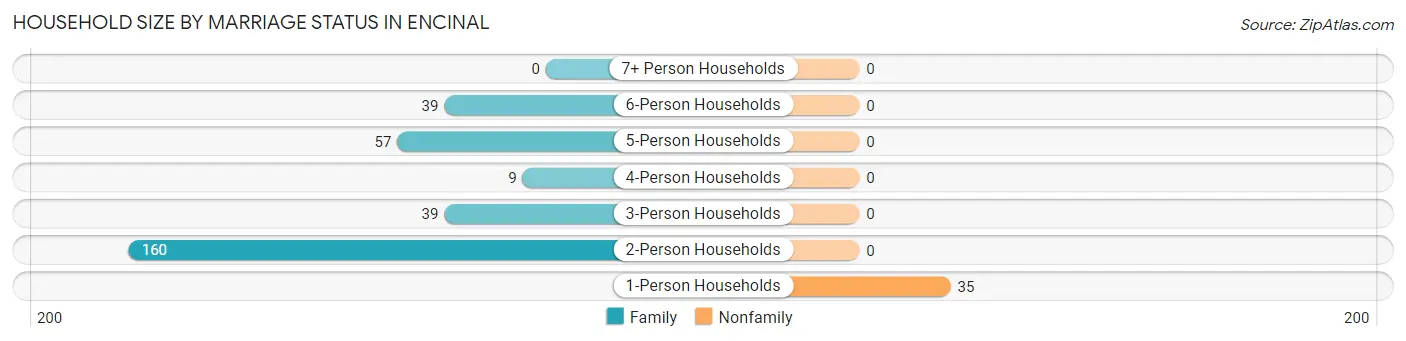
| Household Size | Family Households | Nonfamily Households |
| 1-Person Households | - | 35 (10.3%) |
| 2-Person Households | 160 (47.2%) | 0 (0.0%) |
| 3-Person Households | 39 (11.5%) | 0 (0.0%) |
| 4-Person Households | 9 (2.6%) | 0 (0.0%) |
| 5-Person Households | 57 (16.8%) | 0 (0.0%) |
| 6-Person Households | 39 (11.5%) | 0 (0.0%) |
| 7+ Person Households | 0 (0.0%) | 0 (0.0%) |
| Total | 304 (89.7%) | 35 (10.3%) |
Female Fertility in Encinal
Fertility by Age in Encinal
Average fertility rate in Encinal is 18.0 births per 1,000 women. Women in the age bracket of 20 to 34 years have the highest fertility rate with 34.0 births per 1,000 women. Women in the age bracket of 20 to 34 years acount for 100.0% of all women with births.
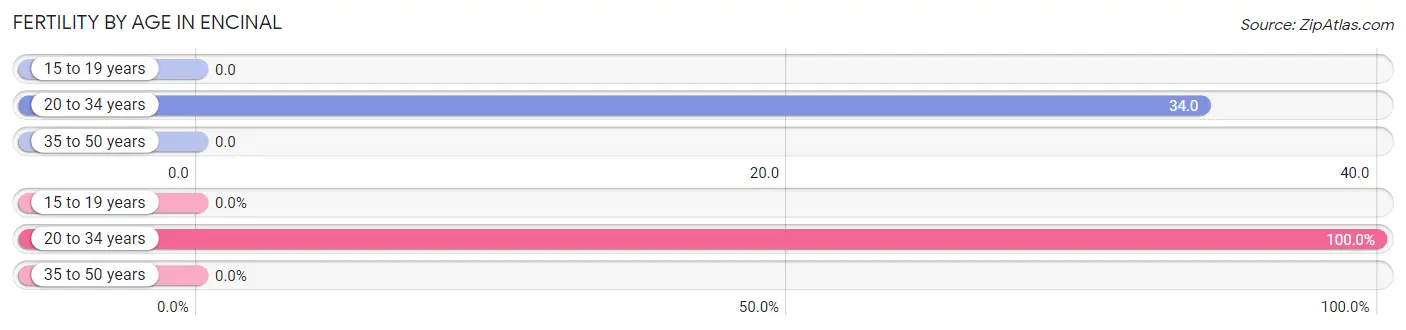
| Age Bracket | Women with Births | Births / 1,000 Women |
| 15 to 19 years | 0 (0.0%) | 0.0 |
| 20 to 34 years | 6 (100.0%) | 34.0 |
| 35 to 50 years | 0 (0.0%) | 0.0 |
| Total | 6 (100.0%) | 18.0 |
Fertility by Age by Marriage Status in Encinal
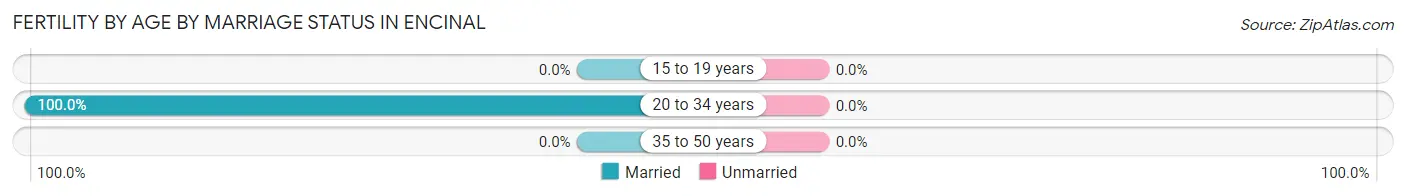
| Age Bracket | Married | Unmarried |
| 15 to 19 years | 0 (0.0%) | 0 (0.0%) |
| 20 to 34 years | 6 (100.0%) | 0 (0.0%) |
| 35 to 50 years | 0 (0.0%) | 0 (0.0%) |
| Total | 6 (100.0%) | 0 (0.0%) |
Fertility by Education in Encinal
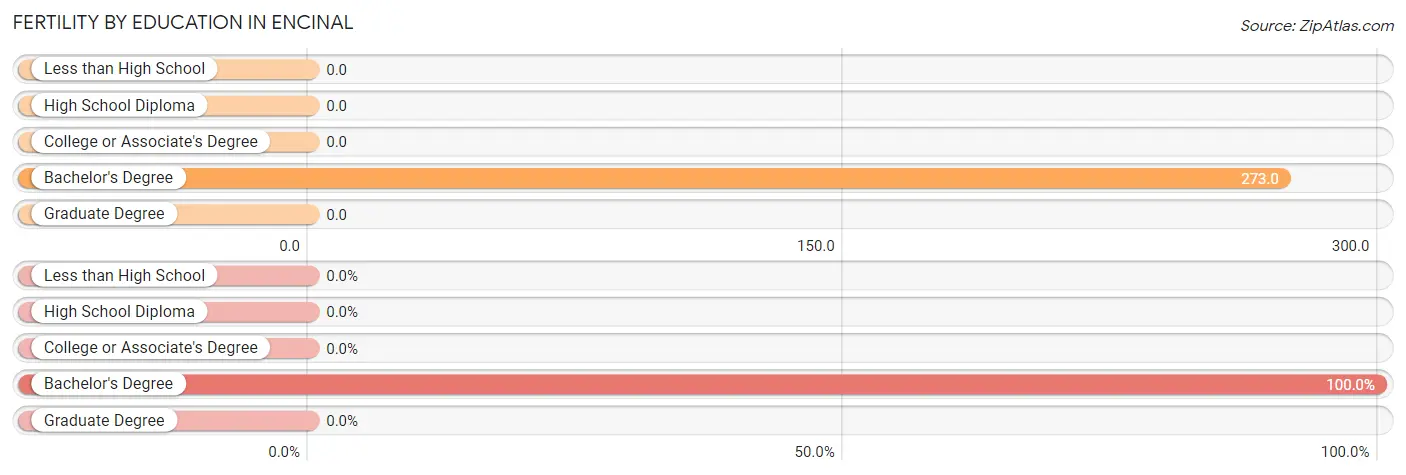
| Educational Attainment | Women with Births | Births / 1,000 Women |
| Less than High School | 0 (0.0%) | 0.0 |
| High School Diploma | 0 (0.0%) | 0.0 |
| College or Associate's Degree | 0 (0.0%) | 0.0 |
| Bachelor's Degree | 6 (100.0%) | 273.0 |
| Graduate Degree | 0 (0.0%) | 0.0 |
| Total | 6 (100.0%) | 18.0 |
Fertility by Education by Marriage Status in Encinal
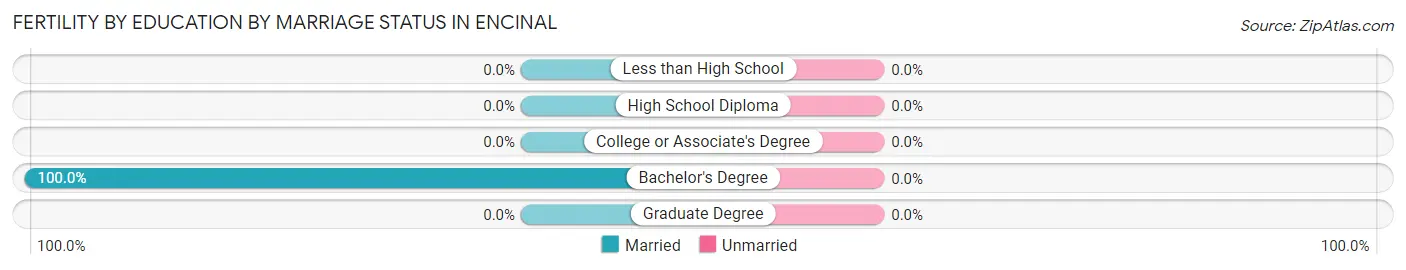
| Educational Attainment | Married | Unmarried |
| Less than High School | 0 (0.0%) | 0 (0.0%) |
| High School Diploma | 0 (0.0%) | 0 (0.0%) |
| College or Associate's Degree | 0 (0.0%) | 0 (0.0%) |
| Bachelor's Degree | 6 (100.0%) | 0 (0.0%) |
| Graduate Degree | 0 (0.0%) | 0 (0.0%) |
| Total | 6 (100.0%) | 0 (0.0%) |
Employment Characteristics in Encinal
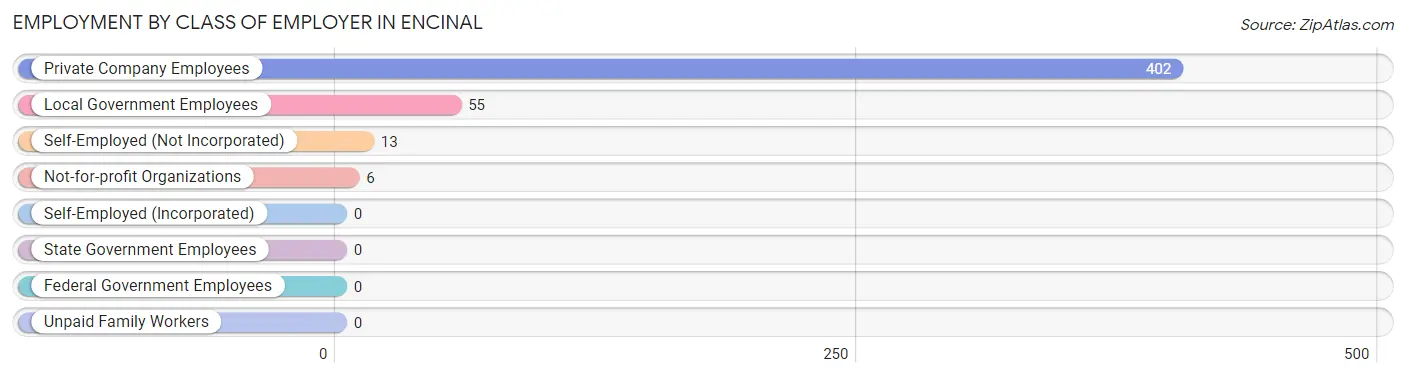
Employment by Class of Employer in Encinal
Among the 476 employed individuals in Encinal, private company employees (402 | 84.5%), local government employees (55 | 11.6%), and self-employed (not incorporated) (13 | 2.7%) make up the most common classes of employment.
| Employer Class | # Employees | % Employees |
| Private Company Employees | 402 | 84.5% |
| Self-Employed (Incorporated) | 0 | 0.0% |
| Self-Employed (Not Incorporated) | 13 | 2.7% |
| Not-for-profit Organizations | 6 | 1.3% |
| Local Government Employees | 55 | 11.6% |
| State Government Employees | 0 | 0.0% |
| Federal Government Employees | 0 | 0.0% |
| Unpaid Family Workers | 0 | 0.0% |
| Total | 476 | 100.0% |
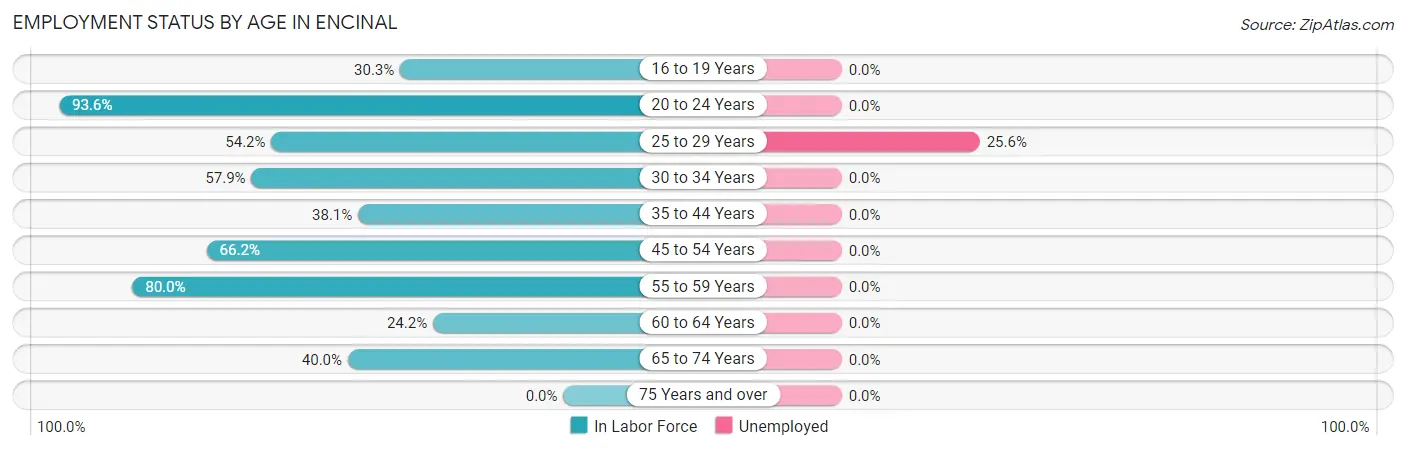
Employment Status by Age in Encinal
According to the labor force statistics for Encinal, out of the total population over 16 years of age (1,173), 41.4% or 486 individuals are in the labor force, with 2.1% or 10 of them unemployed. The age group with the highest labor force participation rate is 20 to 24 years, with 93.6% or 162 individuals in the labor force. Within the labor force, the 25 to 29 years age range has the highest percentage of unemployed individuals, with 25.6% or 10 of them being unemployed.
| Age Bracket | In Labor Force | Unemployed |
| 16 to 19 Years | 64 (30.3%) | 0 (0.0%) |
| 20 to 24 Years | 162 (93.6%) | 0 (0.0%) |
| 25 to 29 Years | 39 (54.2%) | 10 (25.6%) |
| 30 to 34 Years | 11 (57.9%) | 0 (0.0%) |
| 35 to 44 Years | 45 (38.1%) | 0 (0.0%) |
| 45 to 54 Years | 100 (66.2%) | 0 (0.0%) |
| 55 to 59 Years | 16 (80.0%) | 0 (0.0%) |
| 60 to 64 Years | 31 (24.2%) | 0 (0.0%) |
| 65 to 74 Years | 18 (40.0%) | 0 (0.0%) |
| 75 Years and over | 0 (0.0%) | 0 (0.0%) |
| Total | 486 (41.4%) | 10 (2.1%) |
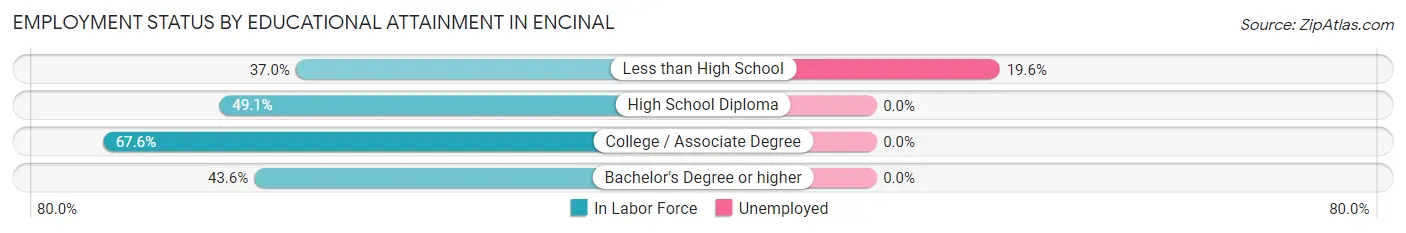
Employment Status by Educational Attainment in Encinal
According to labor force statistics for Encinal, 47.6% of individuals (242) out of the total population between 25 and 64 years of age (508) are in the labor force, with 4.1% or 10 of them being unemployed. The group with the highest labor force participation rate are those with the educational attainment of college / associate degree, with 67.6% or 50 individuals in the labor force. Within the labor force, individuals with less than high school education have the highest percentage of unemployment, with 19.6% or 10 of them being unemployed.
| Educational Attainment | In Labor Force | Unemployed |
| Less than High School | 51 (37.0%) | 27 (19.6%) |
| High School Diploma | 107 (49.1%) | 0 (0.0%) |
| College / Associate Degree | 50 (67.6%) | 0 (0.0%) |
| Bachelor's Degree or higher | 34 (43.6%) | 0 (0.0%) |
| Total | 242 (47.6%) | 21 (4.1%) |
Employment Occupations by Sex in Encinal
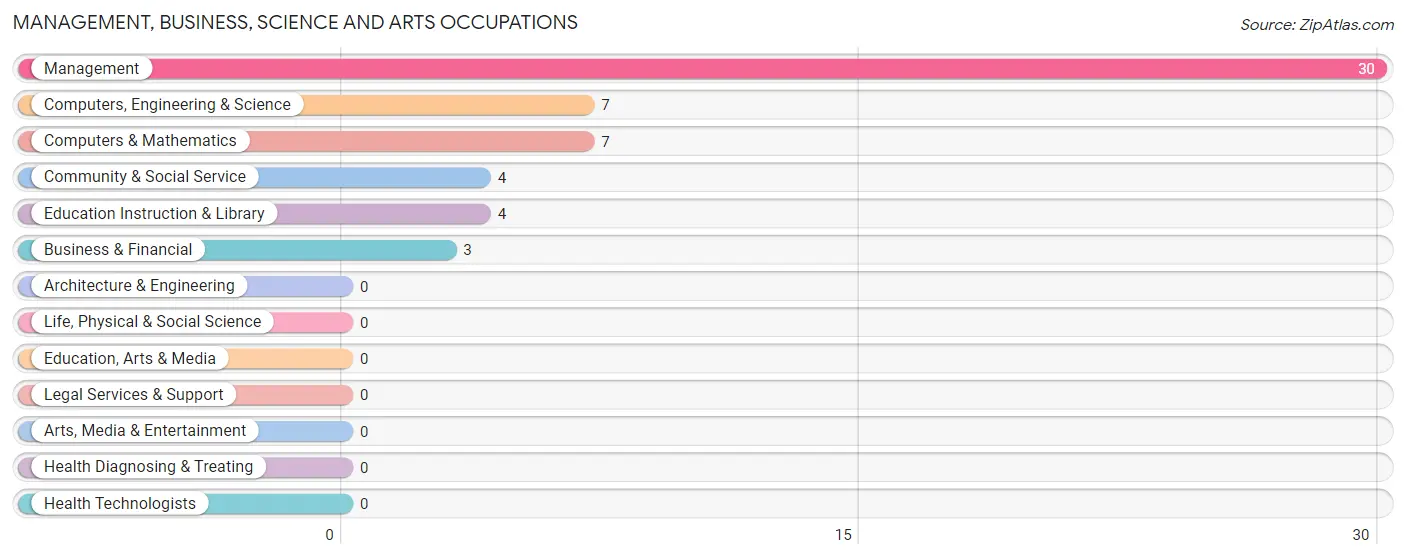
Management, Business, Science and Arts Occupations
The most common Management, Business, Science and Arts occupations in Encinal are Management (30 | 6.3%), Computers, Engineering & Science (7 | 1.5%), Computers & Mathematics (7 | 1.5%), Community & Social Service (4 | 0.8%), and Education Instruction & Library (4 | 0.8%).
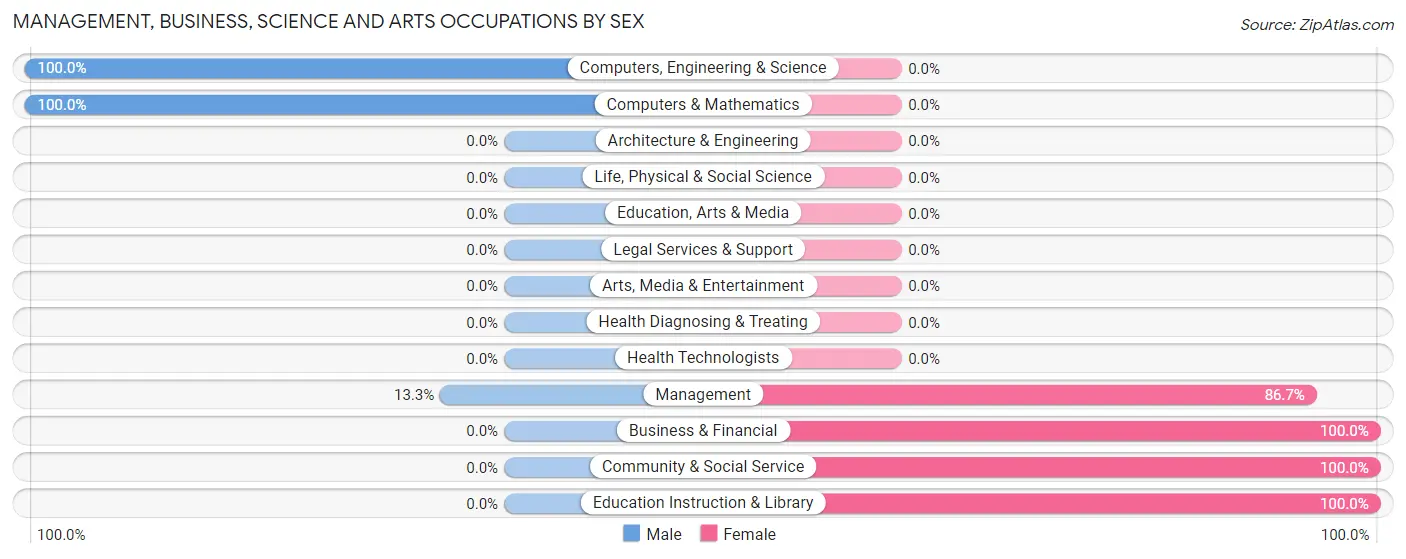
Management, Business, Science and Arts Occupations by Sex
Within the Management, Business, Science and Arts occupations in Encinal, the most male-oriented occupations are Computers, Engineering & Science (100.0%), Computers & Mathematics (100.0%), and Management (13.3%), while the most female-oriented occupations are Business & Financial (100.0%), Community & Social Service (100.0%), and Education Instruction & Library (100.0%).
| Occupation | Male | Female |
| Management | 4 (13.3%) | 26 (86.7%) |
| Business & Financial | 0 (0.0%) | 3 (100.0%) |
| Computers, Engineering & Science | 7 (100.0%) | 0 (0.0%) |
| Computers & Mathematics | 7 (100.0%) | 0 (0.0%) |
| Architecture & Engineering | 0 (0.0%) | 0 (0.0%) |
| Life, Physical & Social Science | 0 (0.0%) | 0 (0.0%) |
| Community & Social Service | 0 (0.0%) | 4 (100.0%) |
| Education, Arts & Media | 0 (0.0%) | 0 (0.0%) |
| Legal Services & Support | 0 (0.0%) | 0 (0.0%) |
| Education Instruction & Library | 0 (0.0%) | 4 (100.0%) |
| Arts, Media & Entertainment | 0 (0.0%) | 0 (0.0%) |
| Health Diagnosing & Treating | 0 (0.0%) | 0 (0.0%) |
| Health Technologists | 0 (0.0%) | 0 (0.0%) |
| Total (Category) | 11 (25.0%) | 33 (75.0%) |
| Total (Overall) | 257 (54.0%) | 219 (46.0%) |
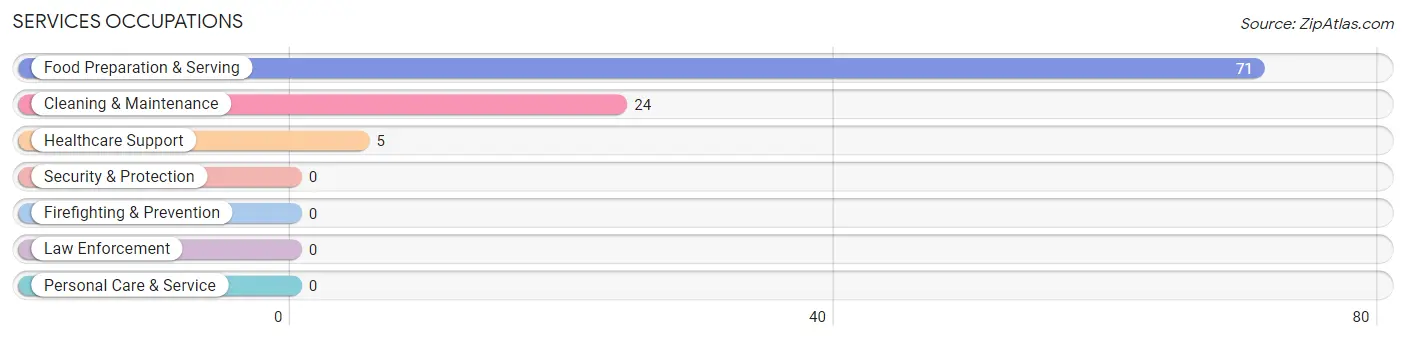
Services Occupations
The most common Services occupations in Encinal are Food Preparation & Serving (71 | 14.9%), Cleaning & Maintenance (24 | 5.0%), and Healthcare Support (5 | 1.1%).
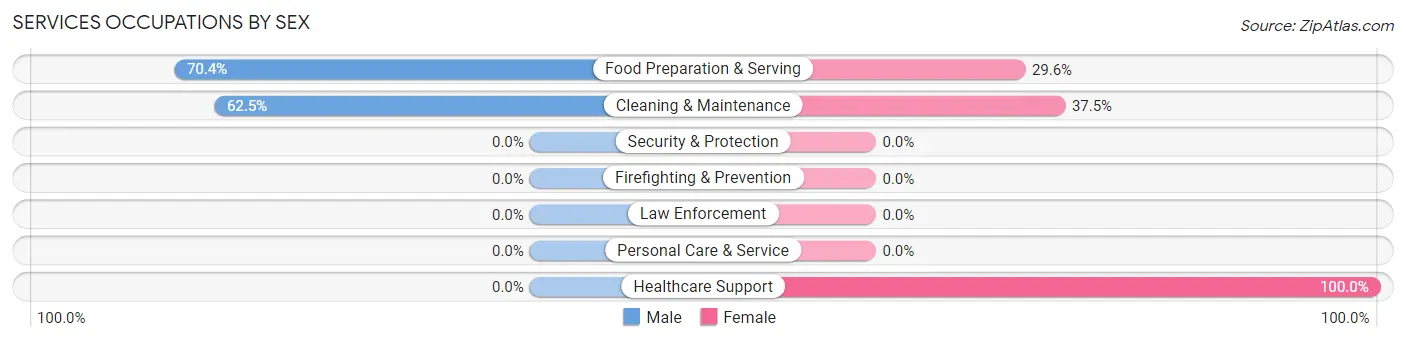
Services Occupations by Sex
Within the Services occupations in Encinal, the most male-oriented occupations are Food Preparation & Serving (70.4%), and Cleaning & Maintenance (62.5%), while the most female-oriented occupations are Healthcare Support (100.0%), Cleaning & Maintenance (37.5%), and Food Preparation & Serving (29.6%).
| Occupation | Male | Female |
| Healthcare Support | 0 (0.0%) | 5 (100.0%) |
| Security & Protection | 0 (0.0%) | 0 (0.0%) |
| Firefighting & Prevention | 0 (0.0%) | 0 (0.0%) |
| Law Enforcement | 0 (0.0%) | 0 (0.0%) |
| Food Preparation & Serving | 50 (70.4%) | 21 (29.6%) |
| Cleaning & Maintenance | 15 (62.5%) | 9 (37.5%) |
| Personal Care & Service | 0 (0.0%) | 0 (0.0%) |
| Total (Category) | 65 (65.0%) | 35 (35.0%) |
| Total (Overall) | 257 (54.0%) | 219 (46.0%) |
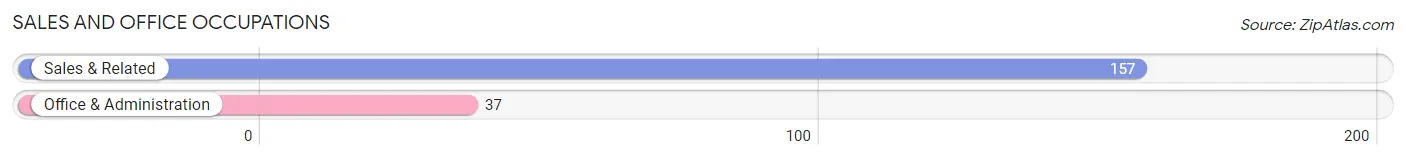
Sales and Office Occupations
The most common Sales and Office occupations in Encinal are Sales & Related (157 | 33.0%), and Office & Administration (37 | 7.8%).
Sales and Office Occupations by Sex
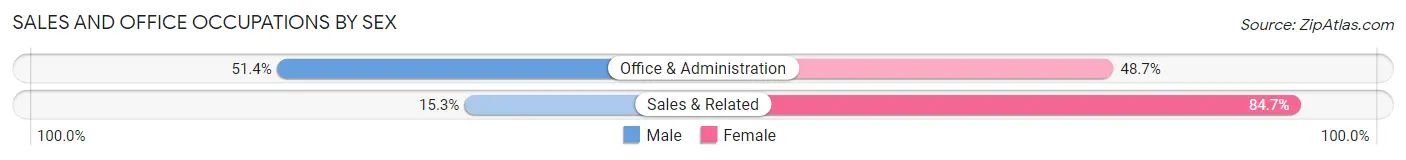
| Occupation | Male | Female |
| Sales & Related | 24 (15.3%) | 133 (84.7%) |
| Office & Administration | 19 (51.3%) | 18 (48.6%) |
| Total (Category) | 43 (22.2%) | 151 (77.8%) |
| Total (Overall) | 257 (54.0%) | 219 (46.0%) |
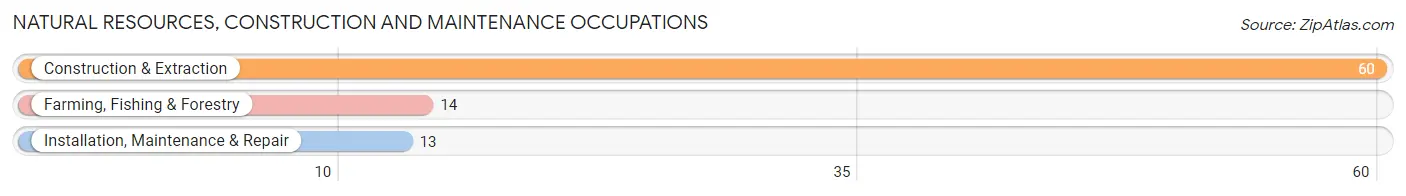
Natural Resources, Construction and Maintenance Occupations
The most common Natural Resources, Construction and Maintenance occupations in Encinal are Construction & Extraction (60 | 12.6%), Farming, Fishing & Forestry (14 | 2.9%), and Installation, Maintenance & Repair (13 | 2.7%).
Natural Resources, Construction and Maintenance Occupations by Sex
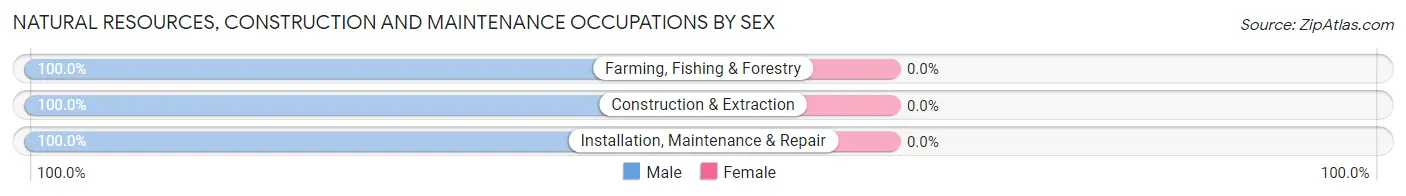
| Occupation | Male | Female |
| Farming, Fishing & Forestry | 14 (100.0%) | 0 (0.0%) |
| Construction & Extraction | 60 (100.0%) | 0 (0.0%) |
| Installation, Maintenance & Repair | 13 (100.0%) | 0 (0.0%) |
| Total (Category) | 87 (100.0%) | 0 (0.0%) |
| Total (Overall) | 257 (54.0%) | 219 (46.0%) |
Production, Transportation and Moving Occupations
The most common Production, Transportation and Moving occupations in Encinal are Transportation (45 | 9.5%), and Production (6 | 1.3%).
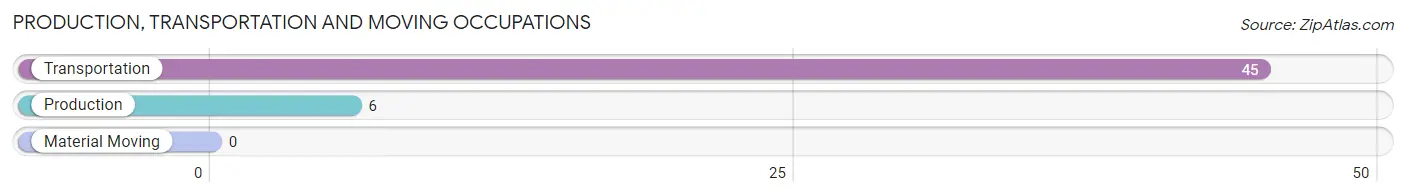
Production, Transportation and Moving Occupations by Sex
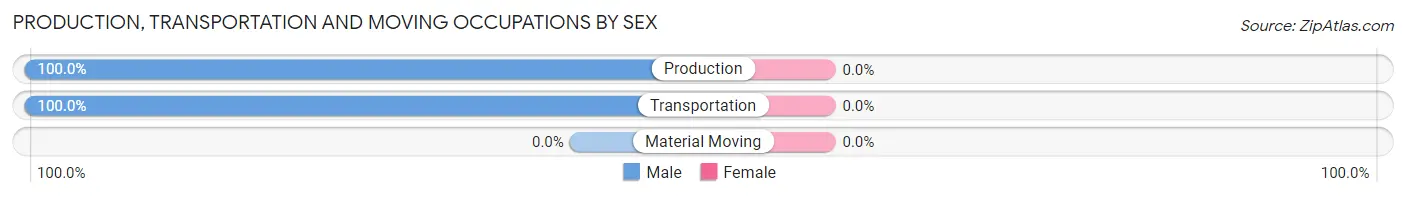
| Occupation | Male | Female |
| Production | 6 (100.0%) | 0 (0.0%) |
| Transportation | 45 (100.0%) | 0 (0.0%) |
| Material Moving | 0 (0.0%) | 0 (0.0%) |
| Total (Category) | 51 (100.0%) | 0 (0.0%) |
| Total (Overall) | 257 (54.0%) | 219 (46.0%) |
Employment Industries by Sex in Encinal
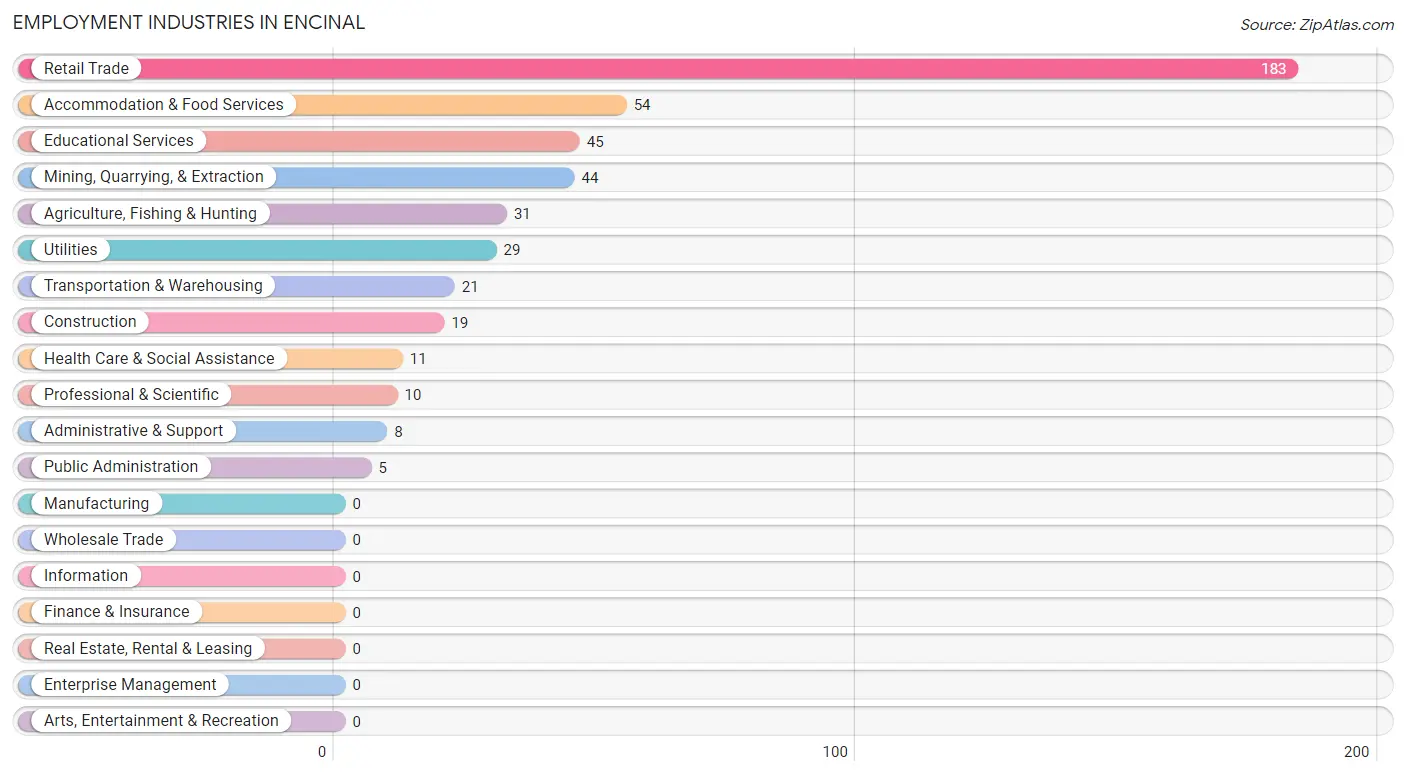
Employment Industries in Encinal
The major employment industries in Encinal include Retail Trade (183 | 38.5%), Accommodation & Food Services (54 | 11.3%), Educational Services (45 | 9.5%), Mining, Quarrying, & Extraction (44 | 9.2%), and Agriculture, Fishing & Hunting (31 | 6.5%).
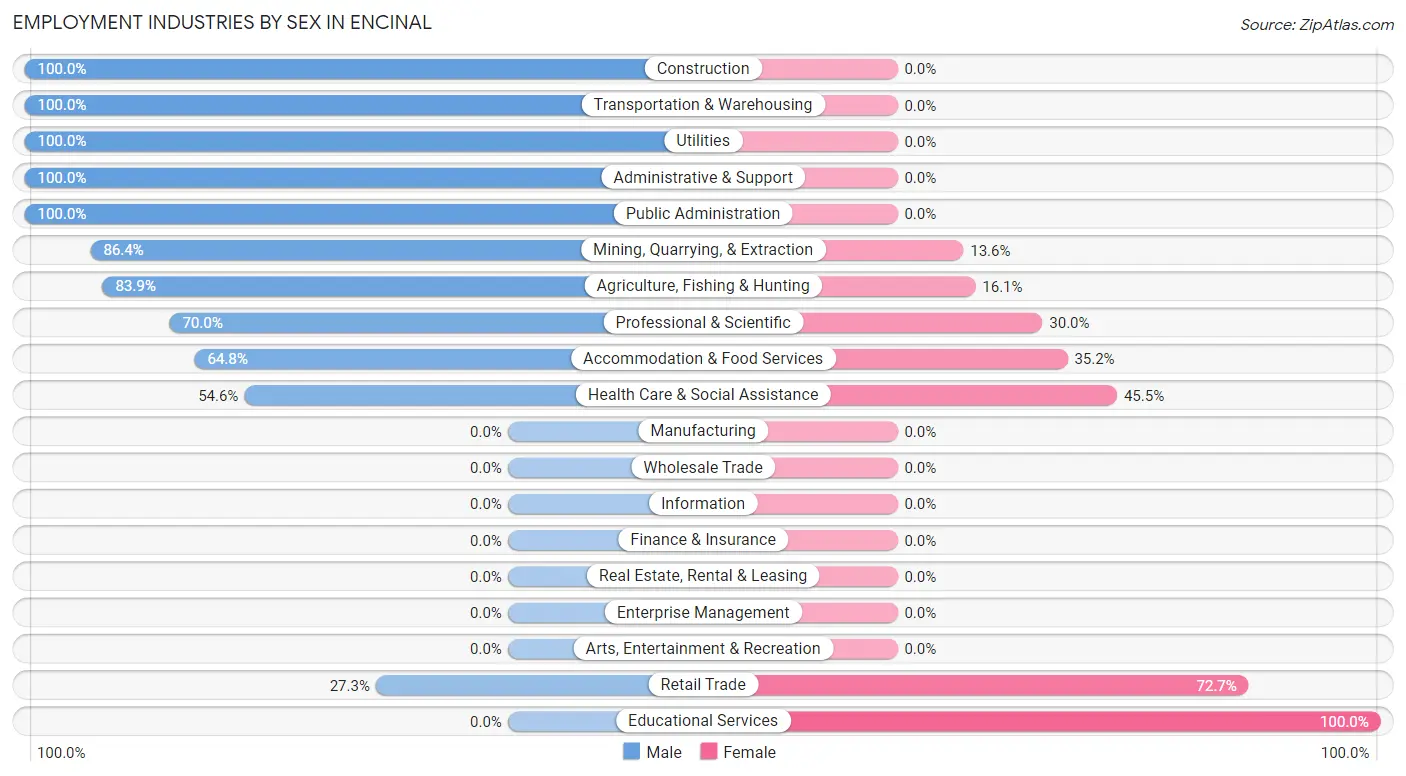
Employment Industries by Sex in Encinal
The Encinal industries that see more men than women are Construction (100.0%), Transportation & Warehousing (100.0%), and Utilities (100.0%), whereas the industries that tend to have a higher number of women are Educational Services (100.0%), Retail Trade (72.7%), and Health Care & Social Assistance (45.5%).
| Industry | Male | Female |
| Agriculture, Fishing & Hunting | 26 (83.9%) | 5 (16.1%) |
| Mining, Quarrying, & Extraction | 38 (86.4%) | 6 (13.6%) |
| Construction | 19 (100.0%) | 0 (0.0%) |
| Manufacturing | 0 (0.0%) | 0 (0.0%) |
| Wholesale Trade | 0 (0.0%) | 0 (0.0%) |
| Retail Trade | 50 (27.3%) | 133 (72.7%) |
| Transportation & Warehousing | 21 (100.0%) | 0 (0.0%) |
| Utilities | 29 (100.0%) | 0 (0.0%) |
| Information | 0 (0.0%) | 0 (0.0%) |
| Finance & Insurance | 0 (0.0%) | 0 (0.0%) |
| Real Estate, Rental & Leasing | 0 (0.0%) | 0 (0.0%) |
| Professional & Scientific | 7 (70.0%) | 3 (30.0%) |
| Enterprise Management | 0 (0.0%) | 0 (0.0%) |
| Administrative & Support | 8 (100.0%) | 0 (0.0%) |
| Educational Services | 0 (0.0%) | 45 (100.0%) |
| Health Care & Social Assistance | 6 (54.5%) | 5 (45.5%) |
| Arts, Entertainment & Recreation | 0 (0.0%) | 0 (0.0%) |
| Accommodation & Food Services | 35 (64.8%) | 19 (35.2%) |
| Public Administration | 5 (100.0%) | 0 (0.0%) |
| Total | 257 (54.0%) | 219 (46.0%) |
Education in Encinal
School Enrollment in Encinal
The most common levels of schooling among the 422 students in Encinal are college / undergraduate (192 | 45.5%), high school (162 | 38.4%), and middle school (64 | 15.2%).
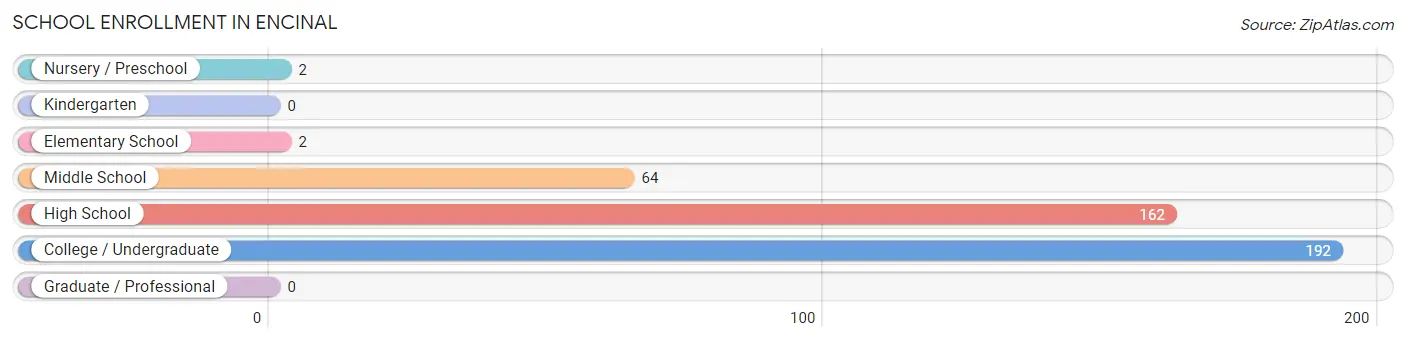
| School Level | # Students | % Students |
| Nursery / Preschool | 2 | 0.5% |
| Kindergarten | 0 | 0.0% |
| Elementary School | 2 | 0.5% |
| Middle School | 64 | 15.2% |
| High School | 162 | 38.4% |
| College / Undergraduate | 192 | 45.5% |
| Graduate / Professional | 0 | 0.0% |
| Total | 422 | 100.0% |
School Enrollment by Age by Funding Source in Encinal
Out of a total of 422 students who are enrolled in schools in Encinal, 248 (58.8%) attend a private institution, while the remaining 174 (41.2%) are enrolled in public schools. The age group of 20 to 24 year olds has the highest likelihood of being enrolled in private schools, with 99 (76.7% in the age bracket) enrolled. Conversely, the age group of 3 to 4 year olds has the lowest likelihood of being enrolled in a private school, with 2 (100.0% in the age bracket) attending a public institution.
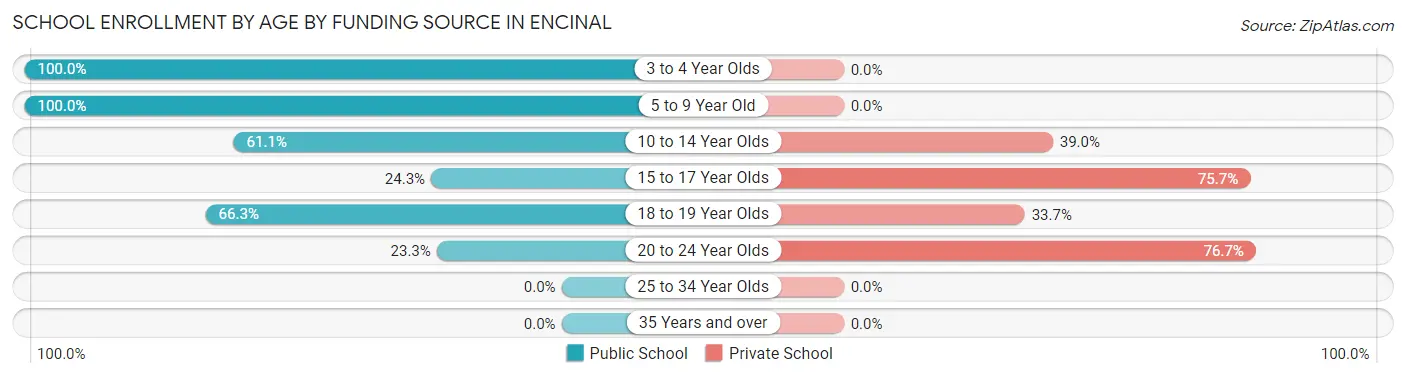
| Age Bracket | Public School | Private School |
| 3 to 4 Year Olds | 2 (100.0%) | 0 (0.0%) |
| 5 to 9 Year Old | 2 (100.0%) | 0 (0.0%) |
| 10 to 14 Year Olds | 58 (61.1%) | 37 (39.0%) |
| 15 to 17 Year Olds | 27 (24.3%) | 84 (75.7%) |
| 18 to 19 Year Olds | 55 (66.3%) | 28 (33.7%) |
| 20 to 24 Year Olds | 30 (23.3%) | 99 (76.7%) |
| 25 to 34 Year Olds | 0 (0.0%) | 0 (0.0%) |
| 35 Years and over | 0 (0.0%) | 0 (0.0%) |
| Total | 174 (41.2%) | 248 (58.8%) |
Educational Attainment by Field of Study in Encinal
Business (51 | 59.3%), education (19 | 22.1%), engineering (8 | 9.3%), and science & technology (8 | 9.3%) are the most common fields of study among 86 individuals in Encinal who have obtained a bachelor's degree or higher.
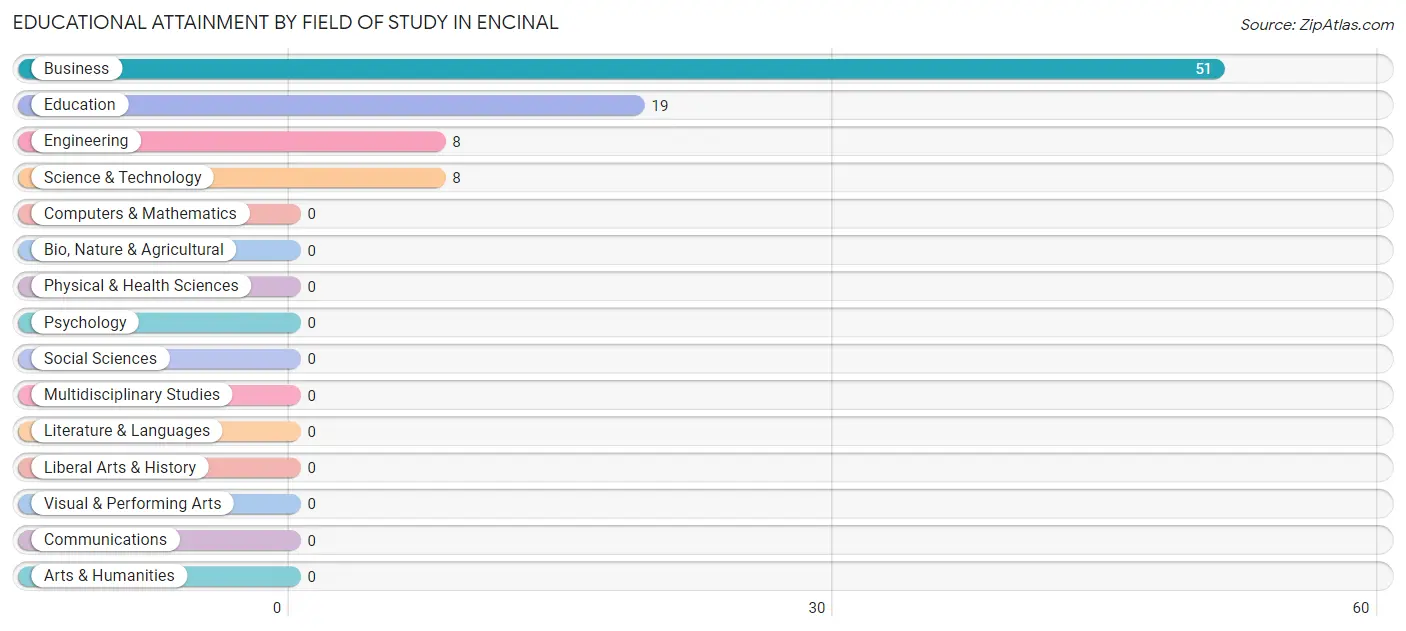
| Field of Study | # Graduates | % Graduates |
| Computers & Mathematics | 0 | 0.0% |
| Bio, Nature & Agricultural | 0 | 0.0% |
| Physical & Health Sciences | 0 | 0.0% |
| Psychology | 0 | 0.0% |
| Social Sciences | 0 | 0.0% |
| Engineering | 8 | 9.3% |
| Multidisciplinary Studies | 0 | 0.0% |
| Science & Technology | 8 | 9.3% |
| Business | 51 | 59.3% |
| Education | 19 | 22.1% |
| Literature & Languages | 0 | 0.0% |
| Liberal Arts & History | 0 | 0.0% |
| Visual & Performing Arts | 0 | 0.0% |
| Communications | 0 | 0.0% |
| Arts & Humanities | 0 | 0.0% |
| Total | 86 | 100.0% |
Transportation & Commute in Encinal
Vehicle Availability by Sex in Encinal
The most prevalent vehicle ownership categories in Encinal are males with 2 vehicles (102, accounting for 39.7%) and females with 2 vehicles (22, making up 46.6%).
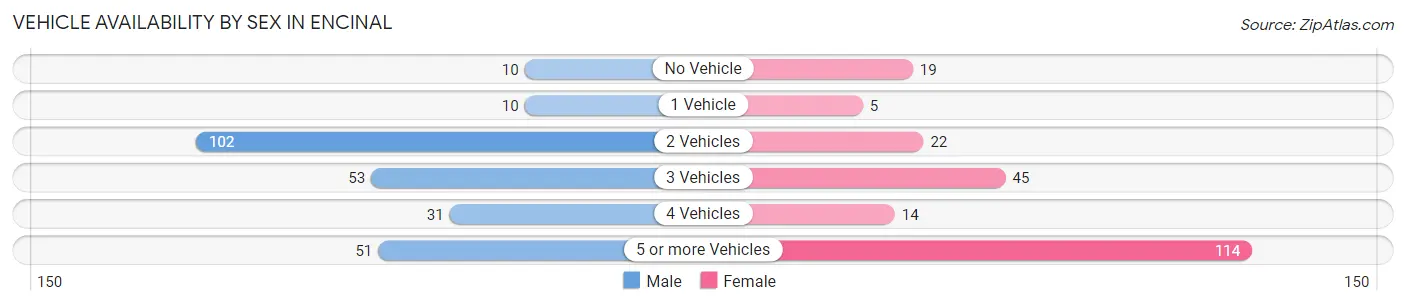
| Vehicles Available | Male | Female |
| No Vehicle | 10 (3.9%) | 19 (8.7%) |
| 1 Vehicle | 10 (3.9%) | 5 (2.3%) |
| 2 Vehicles | 102 (39.7%) | 22 (10.1%) |
| 3 Vehicles | 53 (20.6%) | 45 (20.5%) |
| 4 Vehicles | 31 (12.1%) | 14 (6.4%) |
| 5 or more Vehicles | 51 (19.8%) | 114 (52.0%) |
| Total | 257 (100.0%) | 219 (100.0%) |
Commute Time in Encinal
The most frequently occuring commute durations in Encinal are 5 to 9 minutes (243 commuters, 52.6%), 45 to 59 minutes (49 commuters, 10.6%), and less than 5 minutes (41 commuters, 8.9%).
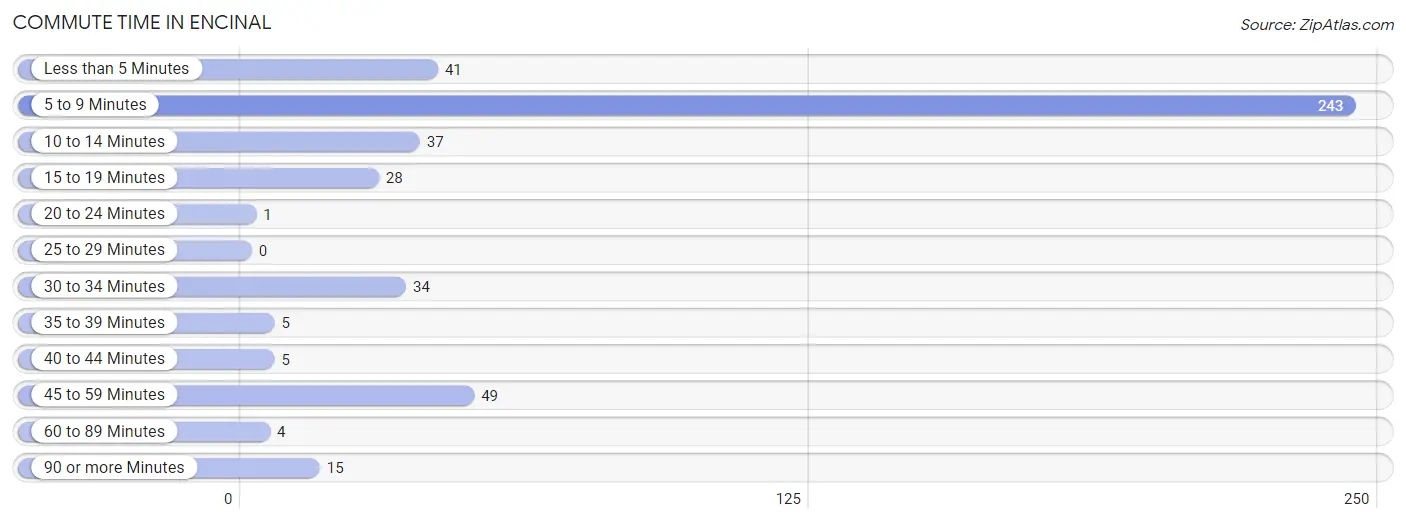
| Commute Time | # Commuters | % Commuters |
| Less than 5 Minutes | 41 | 8.9% |
| 5 to 9 Minutes | 243 | 52.6% |
| 10 to 14 Minutes | 37 | 8.0% |
| 15 to 19 Minutes | 28 | 6.1% |
| 20 to 24 Minutes | 1 | 0.2% |
| 25 to 29 Minutes | 0 | 0.0% |
| 30 to 34 Minutes | 34 | 7.4% |
| 35 to 39 Minutes | 5 | 1.1% |
| 40 to 44 Minutes | 5 | 1.1% |
| 45 to 59 Minutes | 49 | 10.6% |
| 60 to 89 Minutes | 4 | 0.9% |
| 90 or more Minutes | 15 | 3.3% |
Commute Time by Sex in Encinal
The most common commute times in Encinal are 5 to 9 minutes (145 commuters, 58.9%) for males and 5 to 9 minutes (98 commuters, 45.4%) for females.
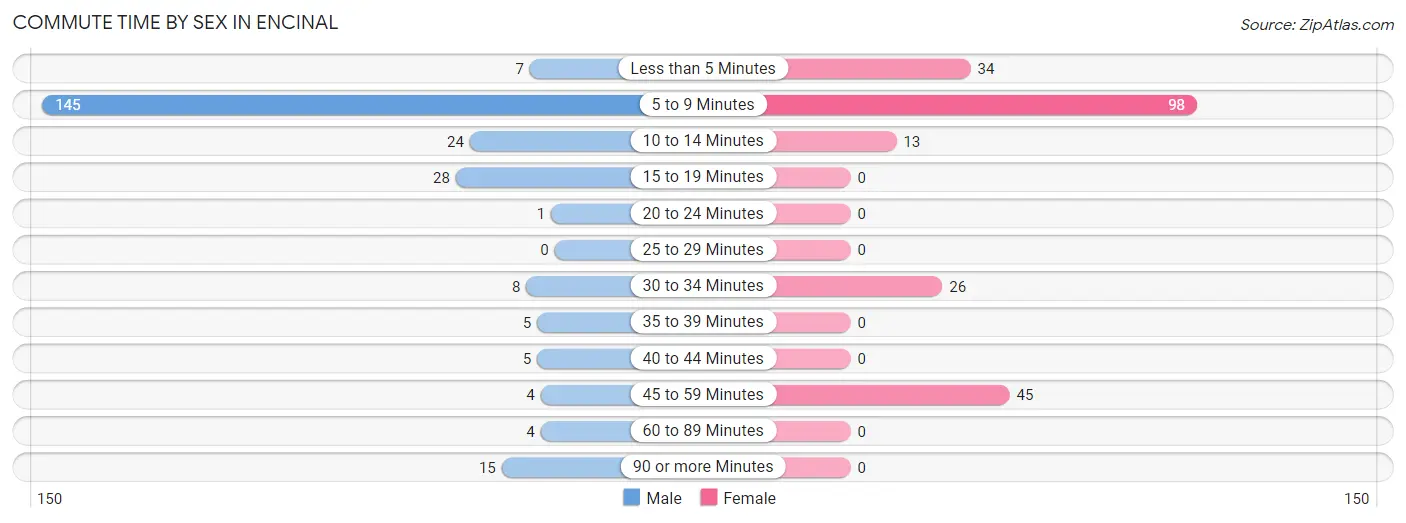
| Commute Time | Male | Female |
| Less than 5 Minutes | 7 (2.9%) | 34 (15.7%) |
| 5 to 9 Minutes | 145 (58.9%) | 98 (45.4%) |
| 10 to 14 Minutes | 24 (9.8%) | 13 (6.0%) |
| 15 to 19 Minutes | 28 (11.4%) | 0 (0.0%) |
| 20 to 24 Minutes | 1 (0.4%) | 0 (0.0%) |
| 25 to 29 Minutes | 0 (0.0%) | 0 (0.0%) |
| 30 to 34 Minutes | 8 (3.3%) | 26 (12.0%) |
| 35 to 39 Minutes | 5 (2.0%) | 0 (0.0%) |
| 40 to 44 Minutes | 5 (2.0%) | 0 (0.0%) |
| 45 to 59 Minutes | 4 (1.6%) | 45 (20.8%) |
| 60 to 89 Minutes | 4 (1.6%) | 0 (0.0%) |
| 90 or more Minutes | 15 (6.1%) | 0 (0.0%) |
Time of Departure to Work by Sex in Encinal
The most frequent times of departure to work in Encinal are 6:30 AM to 6:59 AM (72, 29.3%) for males and 7:00 AM to 7:29 AM (147, 68.1%) for females.
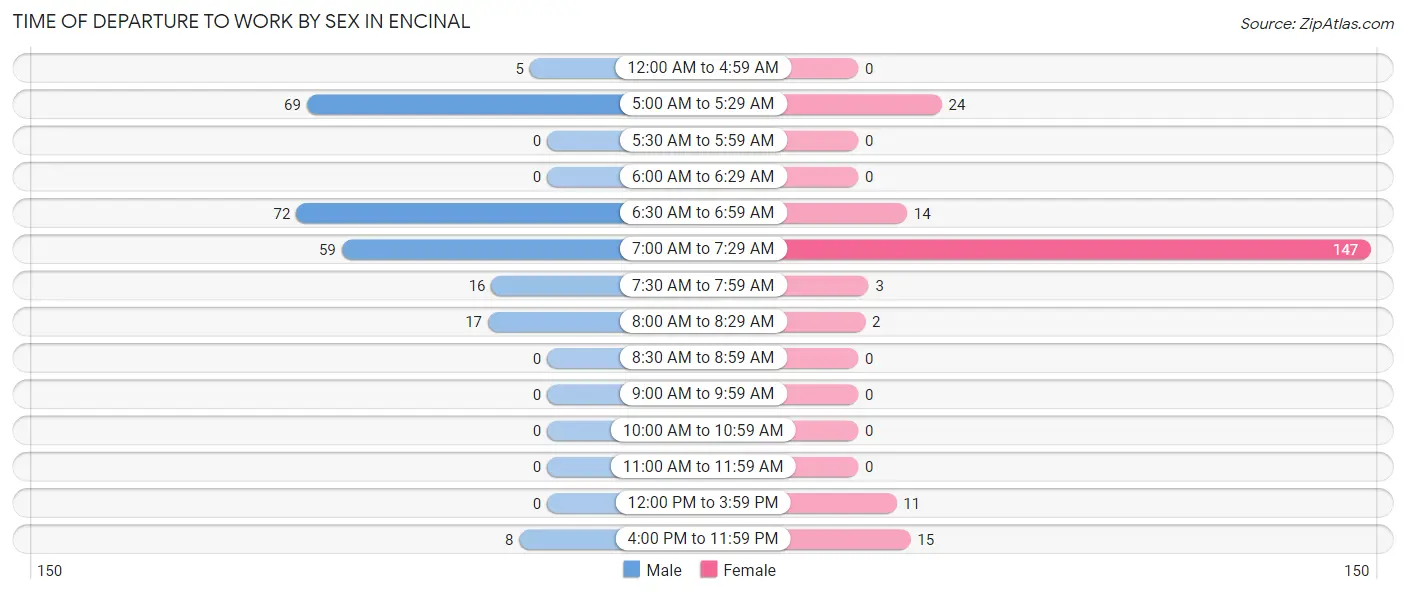
| Time of Departure | Male | Female |
| 12:00 AM to 4:59 AM | 5 (2.0%) | 0 (0.0%) |
| 5:00 AM to 5:29 AM | 69 (28.1%) | 24 (11.1%) |
| 5:30 AM to 5:59 AM | 0 (0.0%) | 0 (0.0%) |
| 6:00 AM to 6:29 AM | 0 (0.0%) | 0 (0.0%) |
| 6:30 AM to 6:59 AM | 72 (29.3%) | 14 (6.5%) |
| 7:00 AM to 7:29 AM | 59 (24.0%) | 147 (68.1%) |
| 7:30 AM to 7:59 AM | 16 (6.5%) | 3 (1.4%) |
| 8:00 AM to 8:29 AM | 17 (6.9%) | 2 (0.9%) |
| 8:30 AM to 8:59 AM | 0 (0.0%) | 0 (0.0%) |
| 9:00 AM to 9:59 AM | 0 (0.0%) | 0 (0.0%) |
| 10:00 AM to 10:59 AM | 0 (0.0%) | 0 (0.0%) |
| 11:00 AM to 11:59 AM | 0 (0.0%) | 0 (0.0%) |
| 12:00 PM to 3:59 PM | 0 (0.0%) | 11 (5.1%) |
| 4:00 PM to 11:59 PM | 8 (3.3%) | 15 (6.9%) |
| Total | 246 (100.0%) | 216 (100.0%) |
Housing Occupancy in Encinal
Occupancy by Ownership in Encinal
Of the total 339 dwellings in Encinal, owner-occupied units account for 309 (91.1%), while renter-occupied units make up 30 (8.8%).
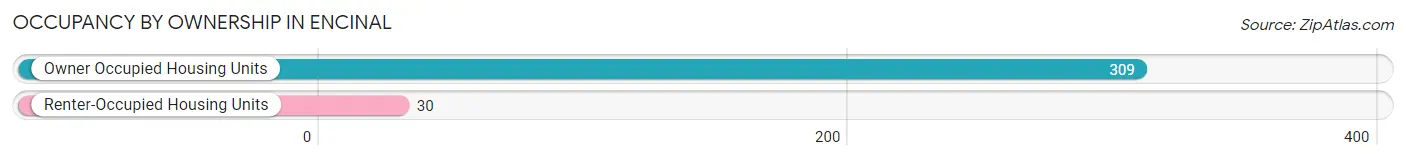
| Occupancy | # Housing Units | % Housing Units |
| Owner Occupied Housing Units | 309 | 91.1% |
| Renter-Occupied Housing Units | 30 | 8.8% |
| Total Occupied Housing Units | 339 | 100.0% |
Occupancy by Household Size in Encinal
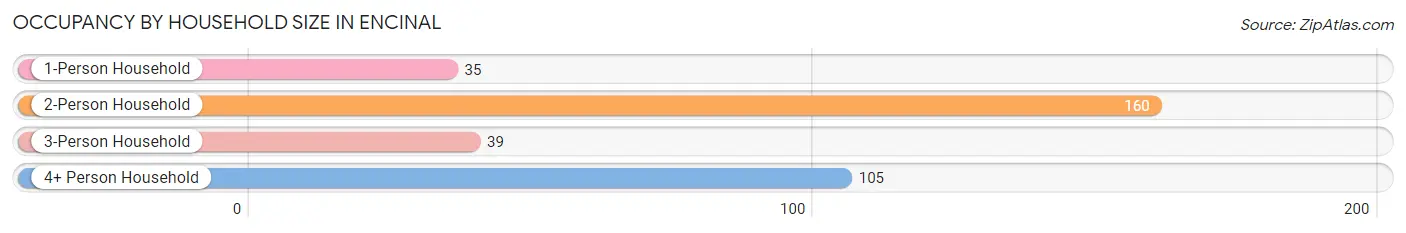
| Household Size | # Housing Units | % Housing Units |
| 1-Person Household | 35 | 10.3% |
| 2-Person Household | 160 | 47.2% |
| 3-Person Household | 39 | 11.5% |
| 4+ Person Household | 105 | 31.0% |
| Total Housing Units | 339 | 100.0% |
Occupancy by Ownership by Household Size in Encinal
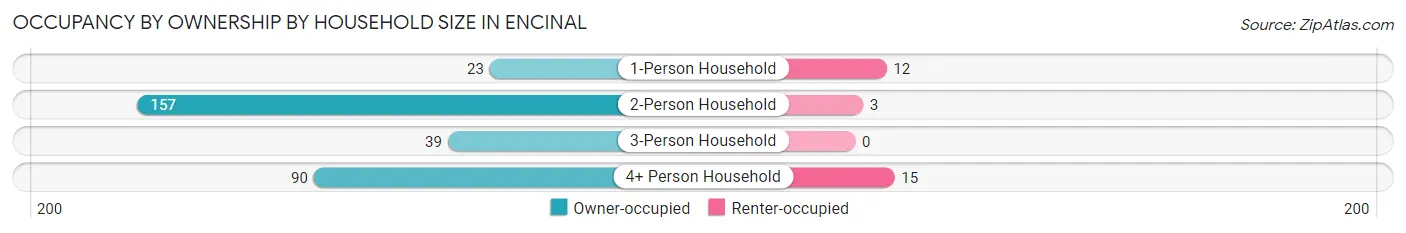
| Household Size | Owner-occupied | Renter-occupied |
| 1-Person Household | 23 (65.7%) | 12 (34.3%) |
| 2-Person Household | 157 (98.1%) | 3 (1.9%) |
| 3-Person Household | 39 (100.0%) | 0 (0.0%) |
| 4+ Person Household | 90 (85.7%) | 15 (14.3%) |
| Total Housing Units | 309 (91.1%) | 30 (8.8%) |
Occupancy by Educational Attainment in Encinal
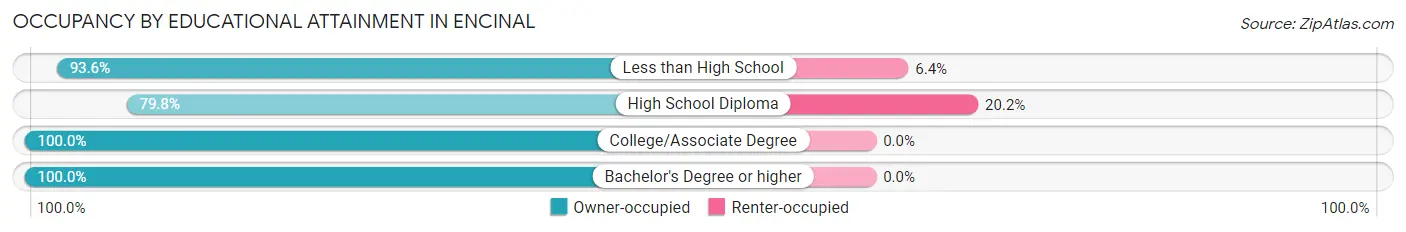
| Household Size | Owner-occupied | Renter-occupied |
| Less than High School | 176 (93.6%) | 12 (6.4%) |
| High School Diploma | 71 (79.8%) | 18 (20.2%) |
| College/Associate Degree | 51 (100.0%) | 0 (0.0%) |
| Bachelor's Degree or higher | 11 (100.0%) | 0 (0.0%) |
Occupancy by Age of Householder in Encinal
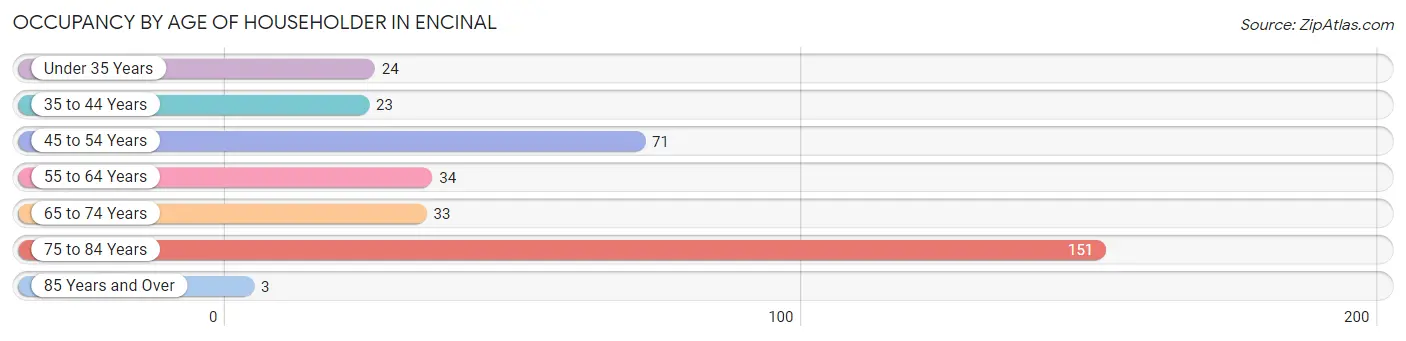
| Age Bracket | # Households | % Households |
| Under 35 Years | 24 | 7.1% |
| 35 to 44 Years | 23 | 6.8% |
| 45 to 54 Years | 71 | 20.9% |
| 55 to 64 Years | 34 | 10.0% |
| 65 to 74 Years | 33 | 9.7% |
| 75 to 84 Years | 151 | 44.5% |
| 85 Years and Over | 3 | 0.9% |
| Total | 339 | 100.0% |
Housing Finances in Encinal
Median Income by Occupancy in Encinal
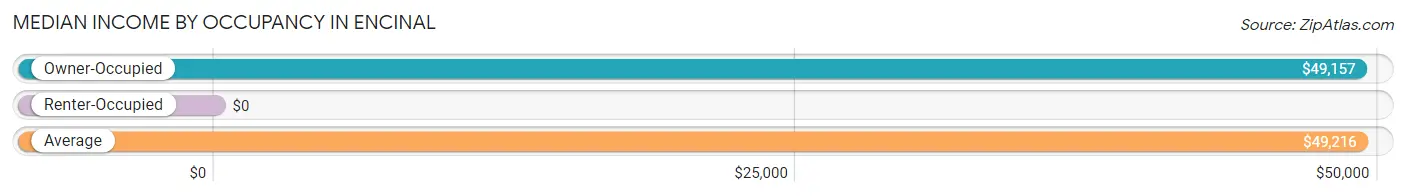
| Occupancy Type | # Households | Median Income |
| Owner-Occupied | 309 (91.1%) | $49,157 |
| Renter-Occupied | 30 (8.8%) | $0 |
| Average | 339 (100.0%) | $49,216 |
Occupancy by Householder Income Bracket in Encinal
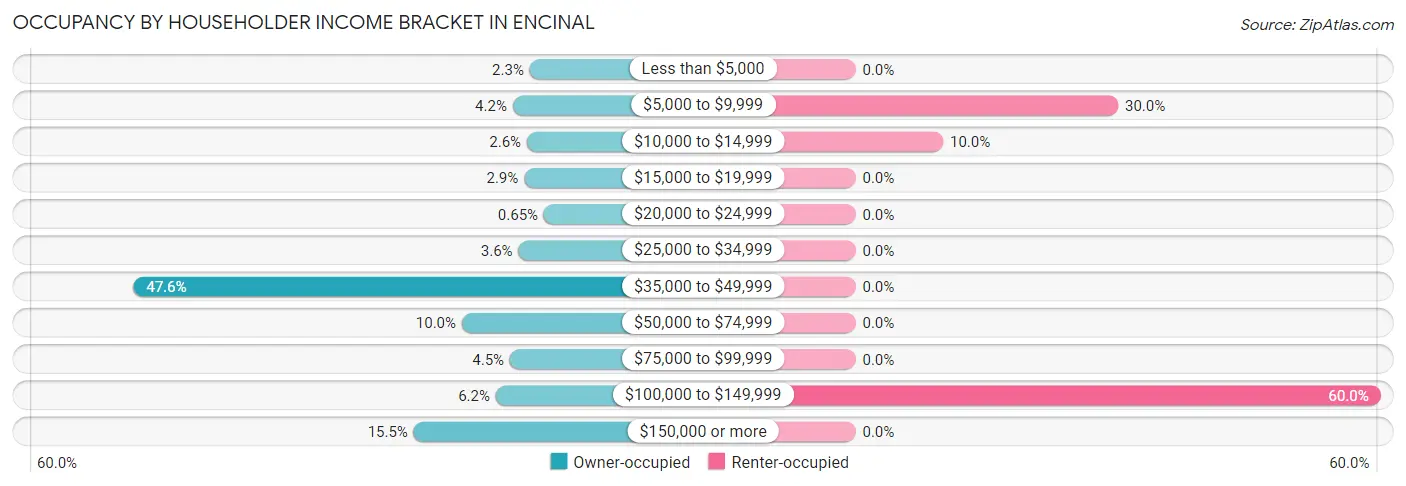
| Income Bracket | Owner-occupied | Renter-occupied |
| Less than $5,000 | 7 (2.3%) | 0 (0.0%) |
| $5,000 to $9,999 | 13 (4.2%) | 9 (30.0%) |
| $10,000 to $14,999 | 8 (2.6%) | 3 (10.0%) |
| $15,000 to $19,999 | 9 (2.9%) | 0 (0.0%) |
| $20,000 to $24,999 | 2 (0.6%) | 0 (0.0%) |
| $25,000 to $34,999 | 11 (3.6%) | 0 (0.0%) |
| $35,000 to $49,999 | 147 (47.6%) | 0 (0.0%) |
| $50,000 to $74,999 | 31 (10.0%) | 0 (0.0%) |
| $75,000 to $99,999 | 14 (4.5%) | 0 (0.0%) |
| $100,000 to $149,999 | 19 (6.1%) | 18 (60.0%) |
| $150,000 or more | 48 (15.5%) | 0 (0.0%) |
| Total | 309 (100.0%) | 30 (100.0%) |
Monthly Housing Cost Tiers in Encinal
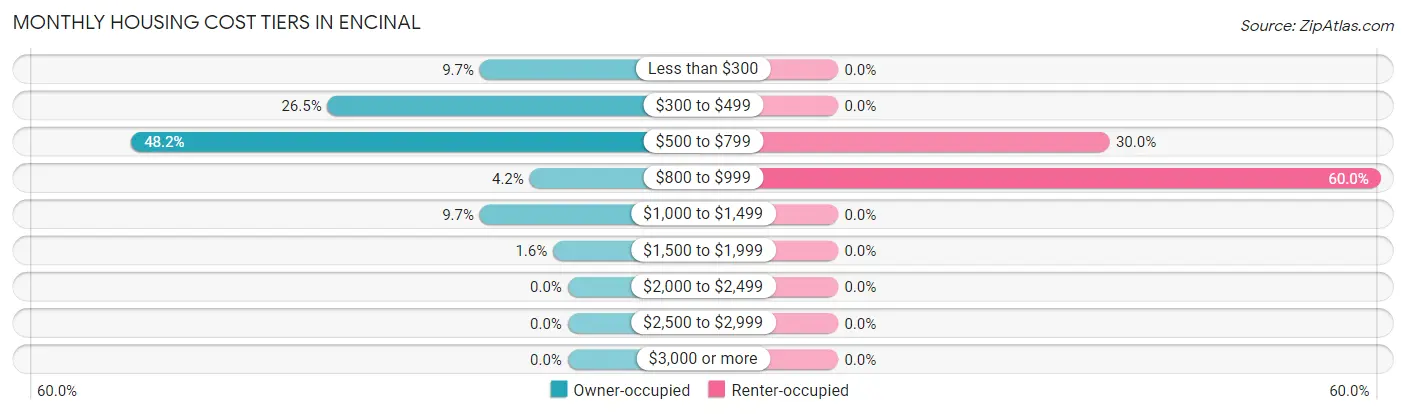
| Monthly Cost | Owner-occupied | Renter-occupied |
| Less than $300 | 30 (9.7%) | 0 (0.0%) |
| $300 to $499 | 82 (26.5%) | 0 (0.0%) |
| $500 to $799 | 149 (48.2%) | 9 (30.0%) |
| $800 to $999 | 13 (4.2%) | 18 (60.0%) |
| $1,000 to $1,499 | 30 (9.7%) | 0 (0.0%) |
| $1,500 to $1,999 | 5 (1.6%) | 0 (0.0%) |
| $2,000 to $2,499 | 0 (0.0%) | 0 (0.0%) |
| $2,500 to $2,999 | 0 (0.0%) | 0 (0.0%) |
| $3,000 or more | 0 (0.0%) | 0 (0.0%) |
| Total | 309 (100.0%) | 30 (100.0%) |
Physical Housing Characteristics in Encinal
Housing Structures in Encinal
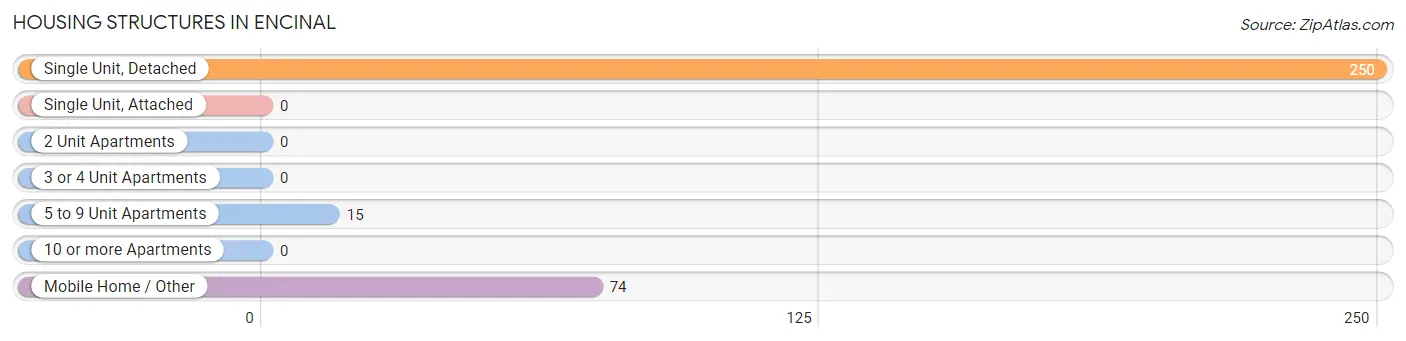
| Structure Type | # Housing Units | % Housing Units |
| Single Unit, Detached | 250 | 73.8% |
| Single Unit, Attached | 0 | 0.0% |
| 2 Unit Apartments | 0 | 0.0% |
| 3 or 4 Unit Apartments | 0 | 0.0% |
| 5 to 9 Unit Apartments | 15 | 4.4% |
| 10 or more Apartments | 0 | 0.0% |
| Mobile Home / Other | 74 | 21.8% |
| Total | 339 | 100.0% |
Housing Structures by Occupancy in Encinal
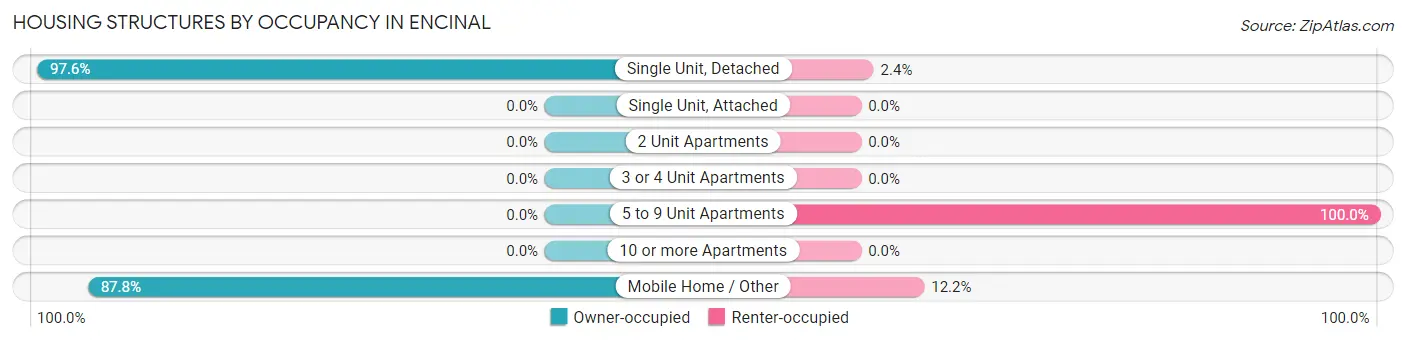
| Structure Type | Owner-occupied | Renter-occupied |
| Single Unit, Detached | 244 (97.6%) | 6 (2.4%) |
| Single Unit, Attached | 0 (0.0%) | 0 (0.0%) |
| 2 Unit Apartments | 0 (0.0%) | 0 (0.0%) |
| 3 or 4 Unit Apartments | 0 (0.0%) | 0 (0.0%) |
| 5 to 9 Unit Apartments | 0 (0.0%) | 15 (100.0%) |
| 10 or more Apartments | 0 (0.0%) | 0 (0.0%) |
| Mobile Home / Other | 65 (87.8%) | 9 (12.2%) |
| Total | 309 (91.1%) | 30 (8.8%) |
Housing Structures by Number of Rooms in Encinal
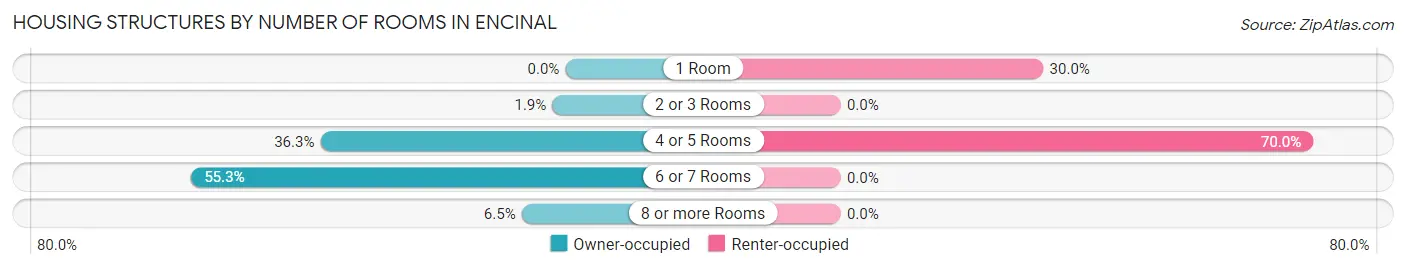
| Number of Rooms | Owner-occupied | Renter-occupied |
| 1 Room | 0 (0.0%) | 9 (30.0%) |
| 2 or 3 Rooms | 6 (1.9%) | 0 (0.0%) |
| 4 or 5 Rooms | 112 (36.2%) | 21 (70.0%) |
| 6 or 7 Rooms | 171 (55.3%) | 0 (0.0%) |
| 8 or more Rooms | 20 (6.5%) | 0 (0.0%) |
| Total | 309 (100.0%) | 30 (100.0%) |
Housing Structure by Heating Type in Encinal
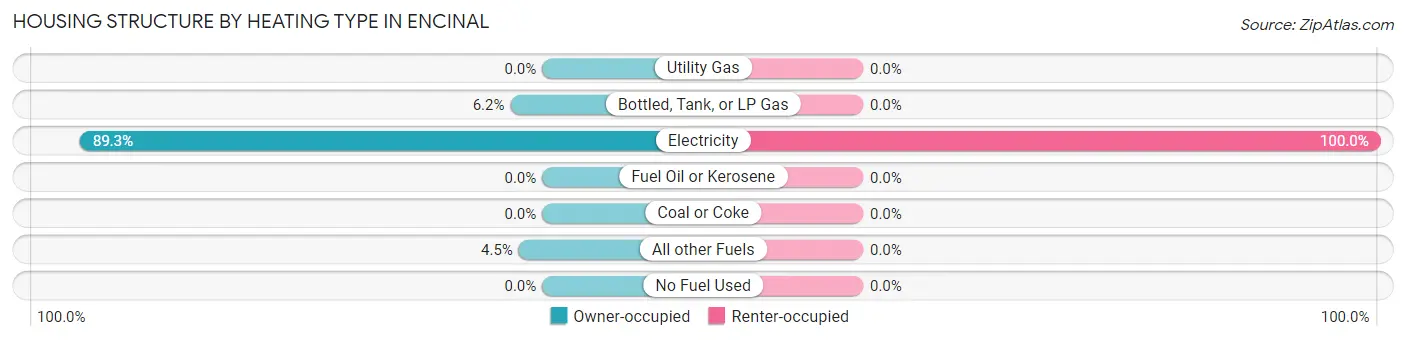
| Heating Type | Owner-occupied | Renter-occupied |
| Utility Gas | 0 (0.0%) | 0 (0.0%) |
| Bottled, Tank, or LP Gas | 19 (6.1%) | 0 (0.0%) |
| Electricity | 276 (89.3%) | 30 (100.0%) |
| Fuel Oil or Kerosene | 0 (0.0%) | 0 (0.0%) |
| Coal or Coke | 0 (0.0%) | 0 (0.0%) |
| All other Fuels | 14 (4.5%) | 0 (0.0%) |
| No Fuel Used | 0 (0.0%) | 0 (0.0%) |
| Total | 309 (100.0%) | 30 (100.0%) |
Household Vehicle Usage in Encinal
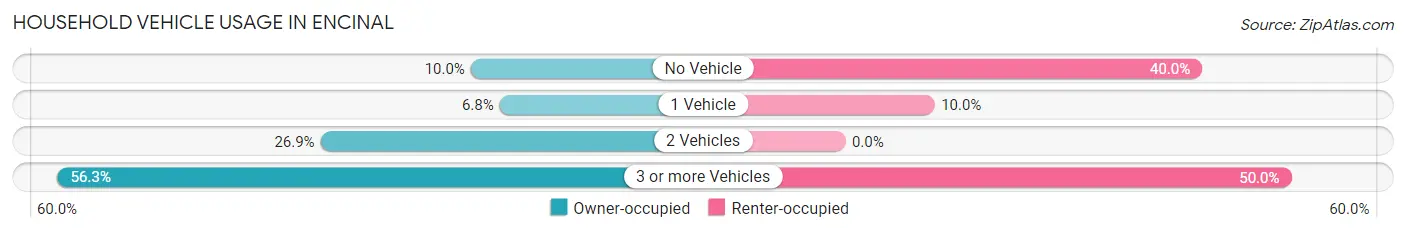
| Vehicles per Household | Owner-occupied | Renter-occupied |
| No Vehicle | 31 (10.0%) | 12 (40.0%) |
| 1 Vehicle | 21 (6.8%) | 3 (10.0%) |
| 2 Vehicles | 83 (26.9%) | 0 (0.0%) |
| 3 or more Vehicles | 174 (56.3%) | 15 (50.0%) |
| Total | 309 (100.0%) | 30 (100.0%) |
Real Estate & Mortgages in Encinal
Real Estate and Mortgage Overview in Encinal
| Characteristic | Without Mortgage | With Mortgage |
| Housing Units | 289 | 20 |
| Median Property Value | $107,800 | $0 |
| Median Household Income | $48,998 | $13 |
| Monthly Housing Costs | $614 | $0 |
| Real Estate Taxes | $1,109 | $0 |
Property Value by Mortgage Status in Encinal
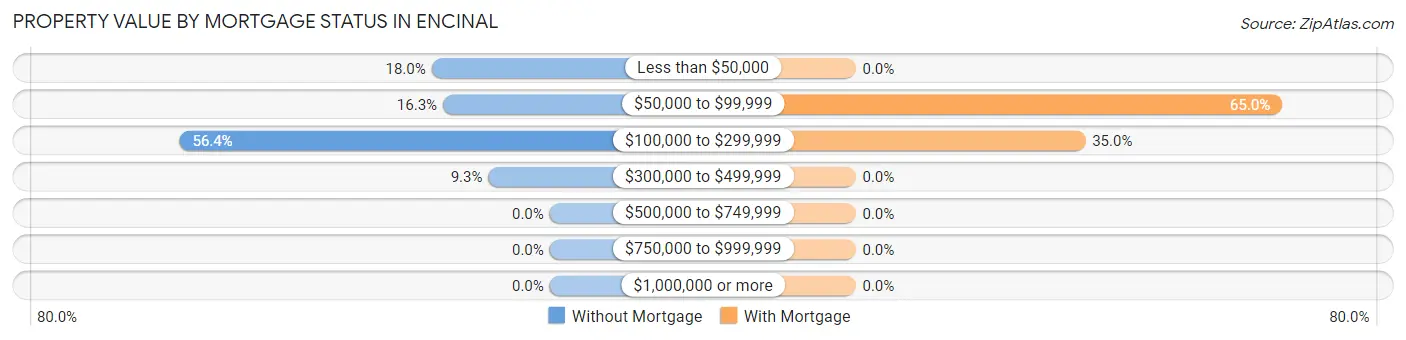
| Property Value | Without Mortgage | With Mortgage |
| Less than $50,000 | 52 (18.0%) | 0 (0.0%) |
| $50,000 to $99,999 | 47 (16.3%) | 13 (65.0%) |
| $100,000 to $299,999 | 163 (56.4%) | 7 (35.0%) |
| $300,000 to $499,999 | 27 (9.3%) | 0 (0.0%) |
| $500,000 to $749,999 | 0 (0.0%) | 0 (0.0%) |
| $750,000 to $999,999 | 0 (0.0%) | 0 (0.0%) |
| $1,000,000 or more | 0 (0.0%) | 0 (0.0%) |
| Total | 289 (100.0%) | 20 (100.0%) |
Household Income by Mortgage Status in Encinal
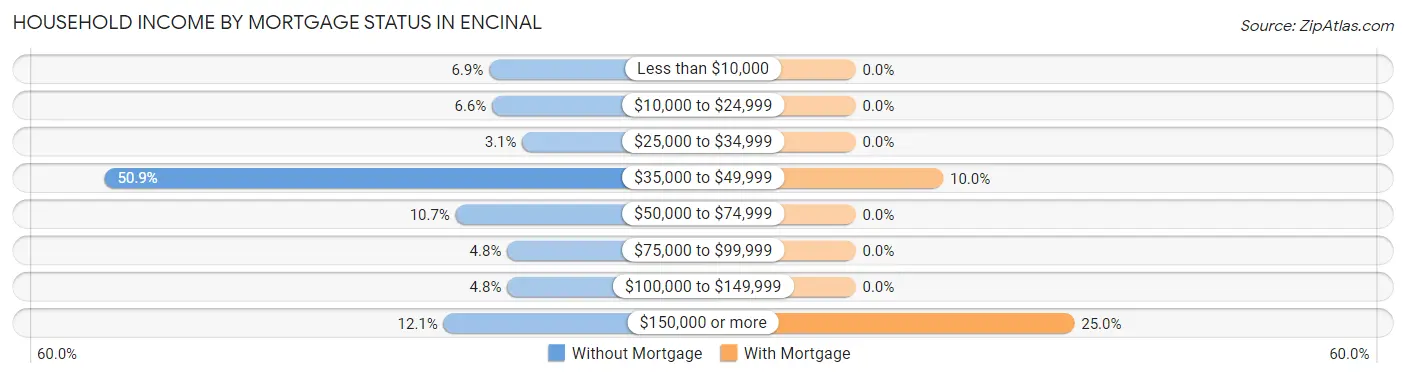
| Household Income | Without Mortgage | With Mortgage |
| Less than $10,000 | 20 (6.9%) | 0 (0.0%) |
| $10,000 to $24,999 | 19 (6.6%) | 0 (0.0%) |
| $25,000 to $34,999 | 9 (3.1%) | 0 (0.0%) |
| $35,000 to $49,999 | 147 (50.9%) | 2 (10.0%) |
| $50,000 to $74,999 | 31 (10.7%) | 0 (0.0%) |
| $75,000 to $99,999 | 14 (4.8%) | 0 (0.0%) |
| $100,000 to $149,999 | 14 (4.8%) | 0 (0.0%) |
| $150,000 or more | 35 (12.1%) | 5 (25.0%) |
| Total | 289 (100.0%) | 20 (100.0%) |
Property Value to Household Income Ratio in Encinal
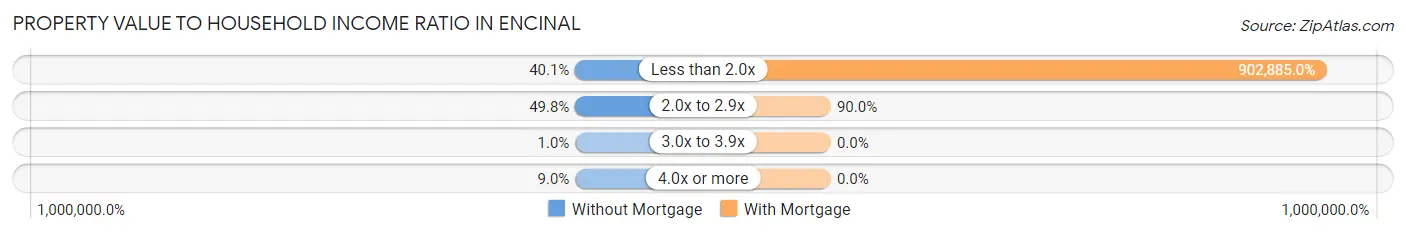
| Value-to-Income Ratio | Without Mortgage | With Mortgage |
| Less than 2.0x | 116 (40.1%) | 180,577 (902,885.0%) |
| 2.0x to 2.9x | 144 (49.8%) | 18 (90.0%) |
| 3.0x to 3.9x | 3 (1.0%) | 0 (0.0%) |
| 4.0x or more | 26 (9.0%) | 0 (0.0%) |
| Total | 289 (100.0%) | 20 (100.0%) |
Real Estate Taxes by Mortgage Status in Encinal
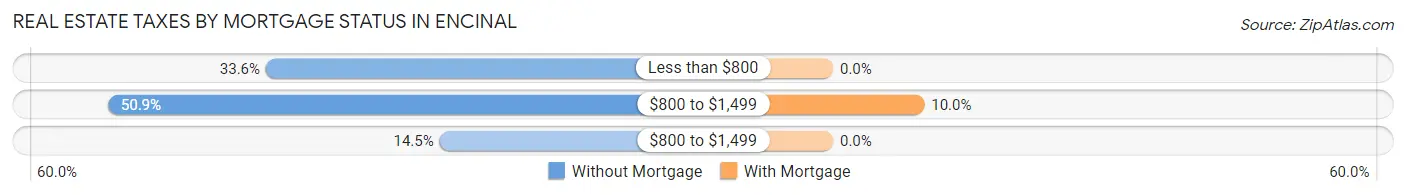
| Property Taxes | Without Mortgage | With Mortgage |
| Less than $800 | 97 (33.6%) | 0 (0.0%) |
| $800 to $1,499 | 147 (50.9%) | 2 (10.0%) |
| $800 to $1,499 | 42 (14.5%) | 0 (0.0%) |
| Total | 289 (100.0%) | 20 (100.0%) |
Health & Disability in Encinal
Health Insurance Coverage by Age in Encinal
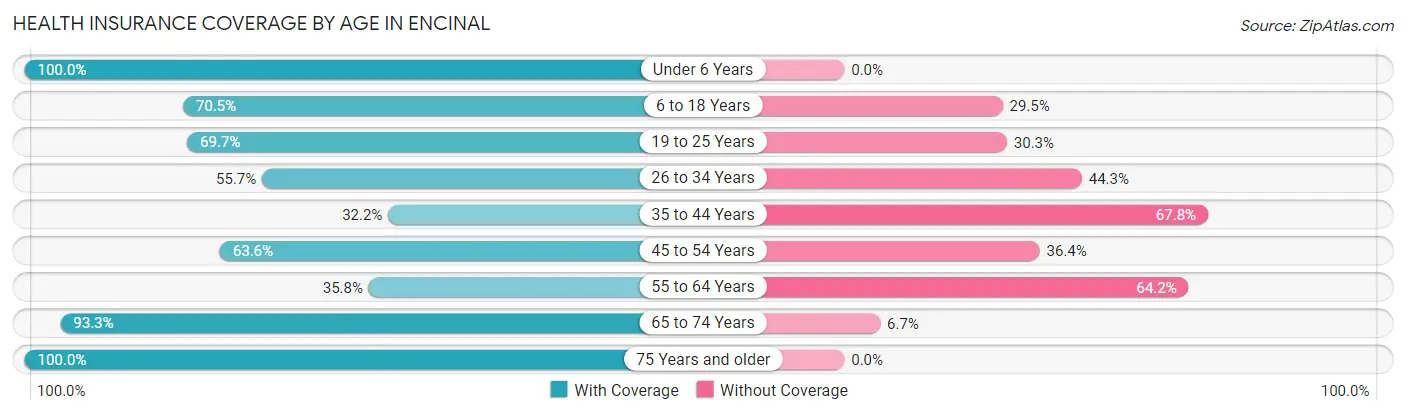
| Age Bracket | With Coverage | Without Coverage |
| Under 6 Years | 34 (100.0%) | 0 (0.0%) |
| 6 to 18 Years | 222 (70.5%) | 93 (29.5%) |
| 19 to 25 Years | 154 (69.7%) | 67 (30.3%) |
| 26 to 34 Years | 39 (55.7%) | 31 (44.3%) |
| 35 to 44 Years | 38 (32.2%) | 80 (67.8%) |
| 45 to 54 Years | 96 (63.6%) | 55 (36.4%) |
| 55 to 64 Years | 53 (35.8%) | 95 (64.2%) |
| 65 to 74 Years | 42 (93.3%) | 3 (6.7%) |
| 75 Years and older | 236 (100.0%) | 0 (0.0%) |
| Total | 914 (68.3%) | 424 (31.7%) |
Health Insurance Coverage by Citizenship Status in Encinal
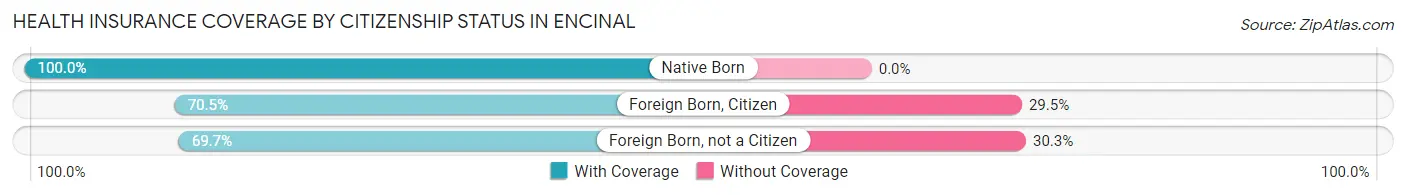
| Citizenship Status | With Coverage | Without Coverage |
| Native Born | 34 (100.0%) | 0 (0.0%) |
| Foreign Born, Citizen | 222 (70.5%) | 93 (29.5%) |
| Foreign Born, not a Citizen | 154 (69.7%) | 67 (30.3%) |
Health Insurance Coverage by Household Income in Encinal
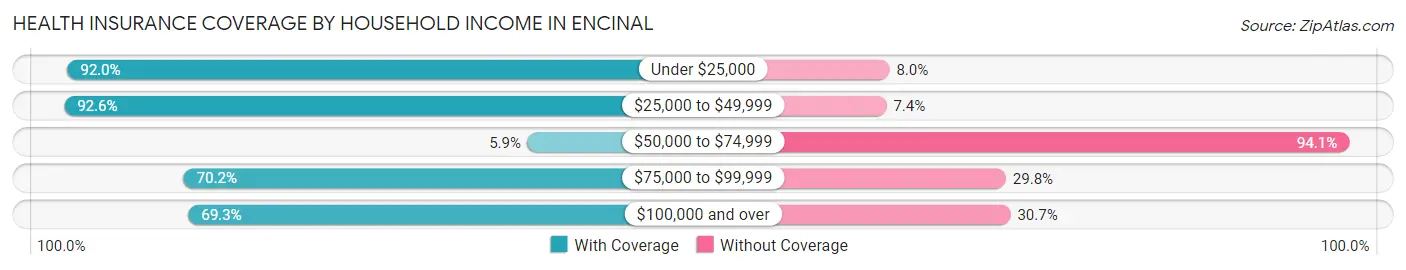
| Household Income | With Coverage | Without Coverage |
| Under $25,000 | 115 (92.0%) | 10 (8.0%) |
| $25,000 to $49,999 | 299 (92.6%) | 24 (7.4%) |
| $50,000 to $74,999 | 11 (5.9%) | 175 (94.1%) |
| $75,000 to $99,999 | 73 (70.2%) | 31 (29.8%) |
| $100,000 and over | 416 (69.3%) | 184 (30.7%) |
Public vs Private Health Insurance Coverage by Age in Encinal
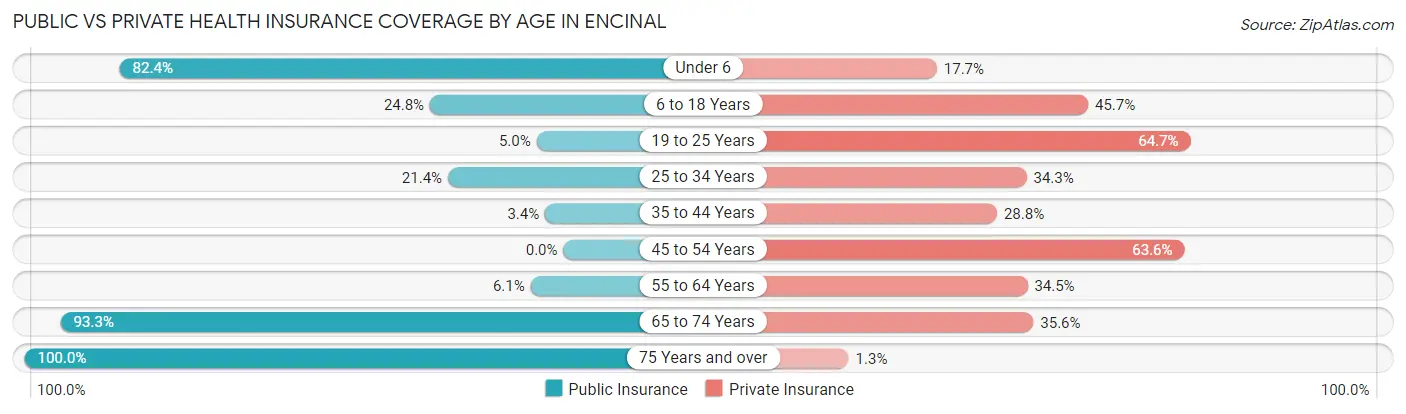
| Age Bracket | Public Insurance | Private Insurance |
| Under 6 | 28 (82.4%) | 6 (17.6%) |
| 6 to 18 Years | 78 (24.8%) | 144 (45.7%) |
| 19 to 25 Years | 11 (5.0%) | 143 (64.7%) |
| 25 to 34 Years | 15 (21.4%) | 24 (34.3%) |
| 35 to 44 Years | 4 (3.4%) | 34 (28.8%) |
| 45 to 54 Years | 0 (0.0%) | 96 (63.6%) |
| 55 to 64 Years | 9 (6.1%) | 51 (34.5%) |
| 65 to 74 Years | 42 (93.3%) | 16 (35.6%) |
| 75 Years and over | 236 (100.0%) | 3 (1.3%) |
| Total | 423 (31.6%) | 517 (38.6%) |
Disability Status by Sex by Age in Encinal
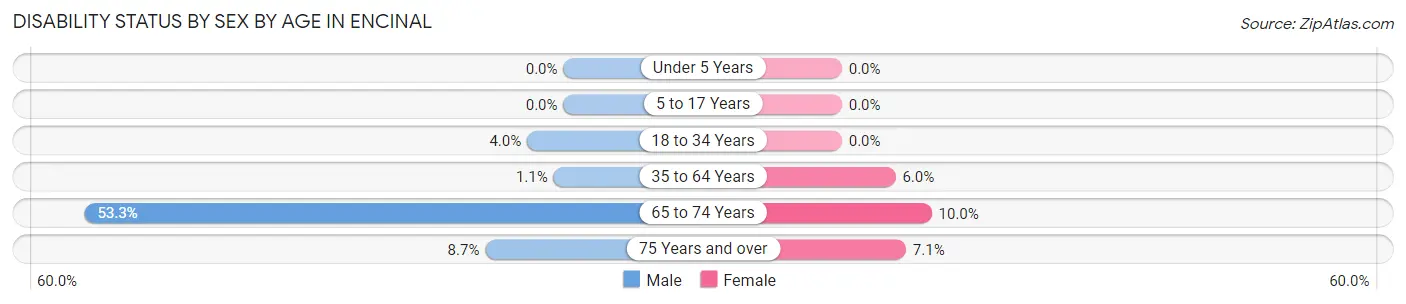
| Age Bracket | Male | Female |
| Under 5 Years | 0 (0.0%) | 0 (0.0%) |
| 5 to 17 Years | 0 (0.0%) | 0 (0.0%) |
| 18 to 34 Years | 9 (4.0%) | 0 (0.0%) |
| 35 to 64 Years | 2 (1.1%) | 14 (6.0%) |
| 65 to 74 Years | 8 (53.3%) | 3 (10.0%) |
| 75 Years and over | 12 (8.7%) | 7 (7.1%) |
Disability Class by Sex by Age in Encinal
Disability Class: Hearing Difficulty
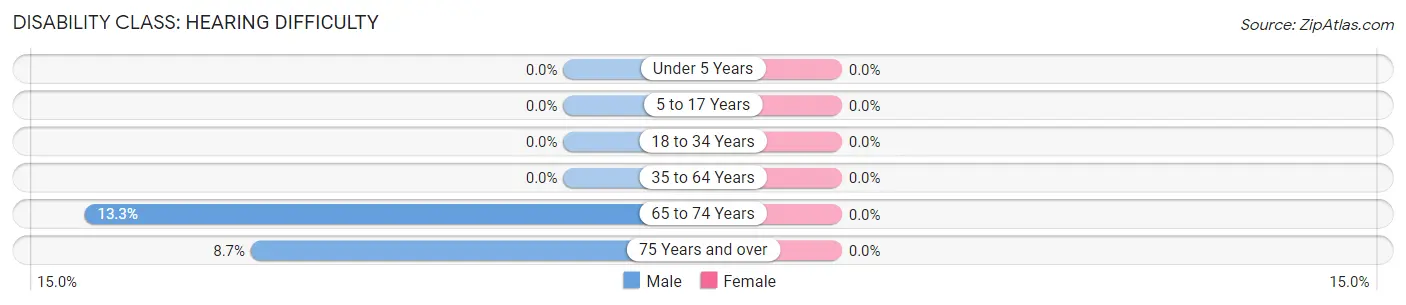
| Age Bracket | Male | Female |
| Under 5 Years | 0 (0.0%) | 0 (0.0%) |
| 5 to 17 Years | 0 (0.0%) | 0 (0.0%) |
| 18 to 34 Years | 0 (0.0%) | 0 (0.0%) |
| 35 to 64 Years | 0 (0.0%) | 0 (0.0%) |
| 65 to 74 Years | 2 (13.3%) | 0 (0.0%) |
| 75 Years and over | 12 (8.7%) | 0 (0.0%) |
Disability Class: Vision Difficulty
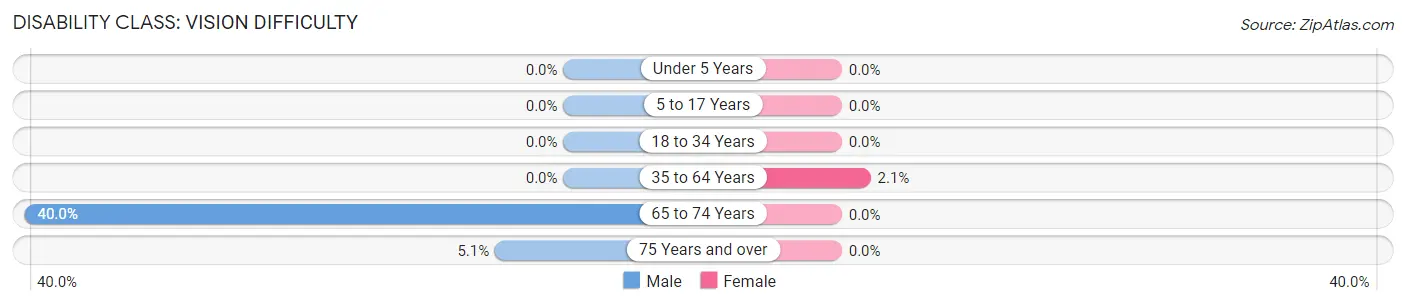
| Age Bracket | Male | Female |
| Under 5 Years | 0 (0.0%) | 0 (0.0%) |
| 5 to 17 Years | 0 (0.0%) | 0 (0.0%) |
| 18 to 34 Years | 0 (0.0%) | 0 (0.0%) |
| 35 to 64 Years | 0 (0.0%) | 5 (2.1%) |
| 65 to 74 Years | 6 (40.0%) | 0 (0.0%) |
| 75 Years and over | 7 (5.1%) | 0 (0.0%) |
Disability Class: Cognitive Difficulty
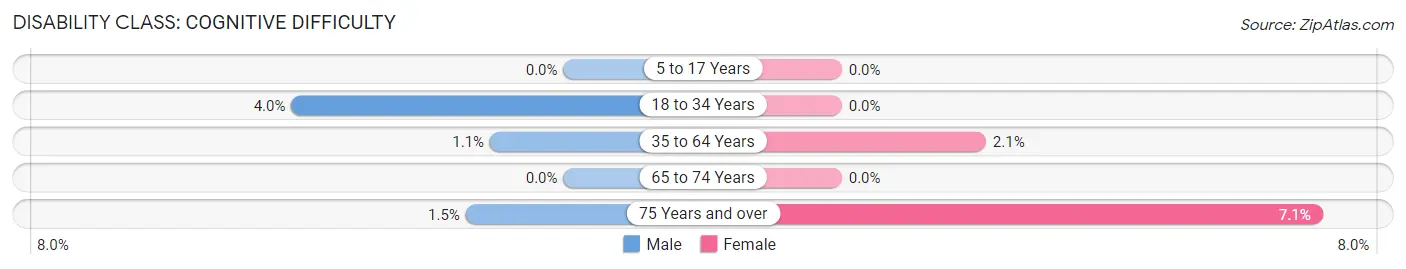
| Age Bracket | Male | Female |
| 5 to 17 Years | 0 (0.0%) | 0 (0.0%) |
| 18 to 34 Years | 9 (4.0%) | 0 (0.0%) |
| 35 to 64 Years | 2 (1.1%) | 5 (2.1%) |
| 65 to 74 Years | 0 (0.0%) | 0 (0.0%) |
| 75 Years and over | 2 (1.5%) | 7 (7.1%) |
Disability Class: Ambulatory Difficulty
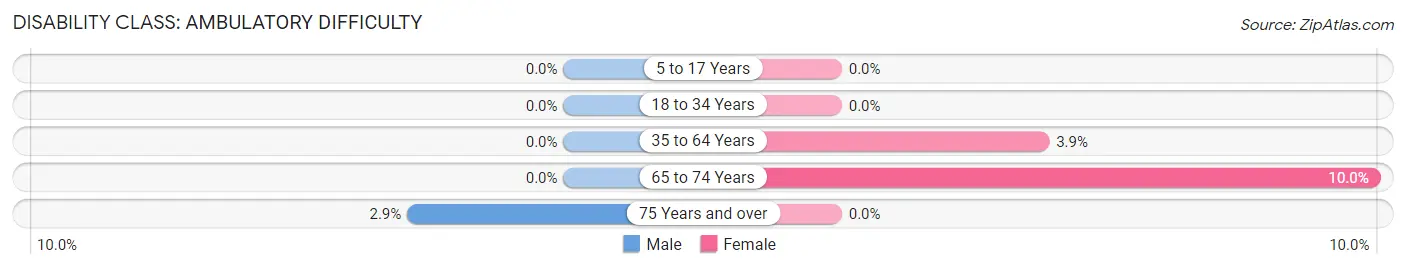
| Age Bracket | Male | Female |
| 5 to 17 Years | 0 (0.0%) | 0 (0.0%) |
| 18 to 34 Years | 0 (0.0%) | 0 (0.0%) |
| 35 to 64 Years | 0 (0.0%) | 9 (3.8%) |
| 65 to 74 Years | 0 (0.0%) | 3 (10.0%) |
| 75 Years and over | 4 (2.9%) | 0 (0.0%) |
Disability Class: Self-Care Difficulty
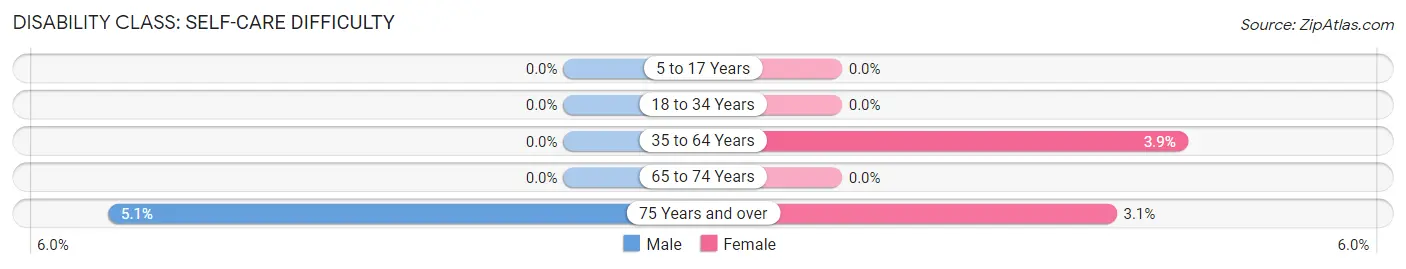
| Age Bracket | Male | Female |
| 5 to 17 Years | 0 (0.0%) | 0 (0.0%) |
| 18 to 34 Years | 0 (0.0%) | 0 (0.0%) |
| 35 to 64 Years | 0 (0.0%) | 9 (3.8%) |
| 65 to 74 Years | 0 (0.0%) | 0 (0.0%) |
| 75 Years and over | 7 (5.1%) | 3 (3.1%) |
Technology Access in Encinal
Computing Device Access in Encinal
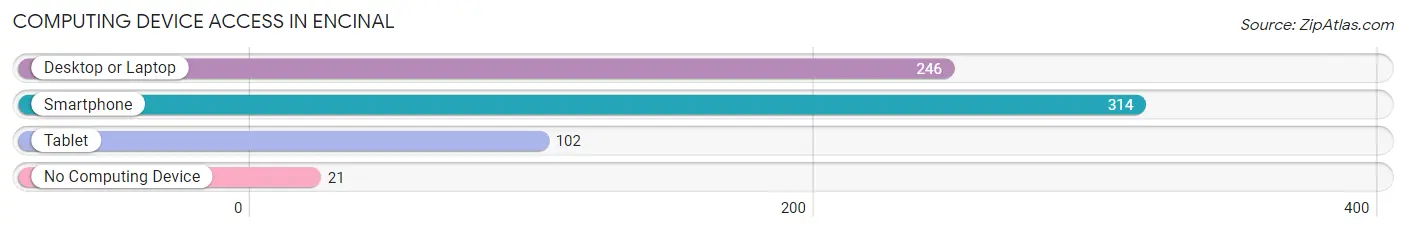
| Device Type | # Households | % Households |
| Desktop or Laptop | 246 | 72.6% |
| Smartphone | 314 | 92.6% |
| Tablet | 102 | 30.1% |
| No Computing Device | 21 | 6.2% |
| Total | 339 | 100.0% |
Internet Access in Encinal
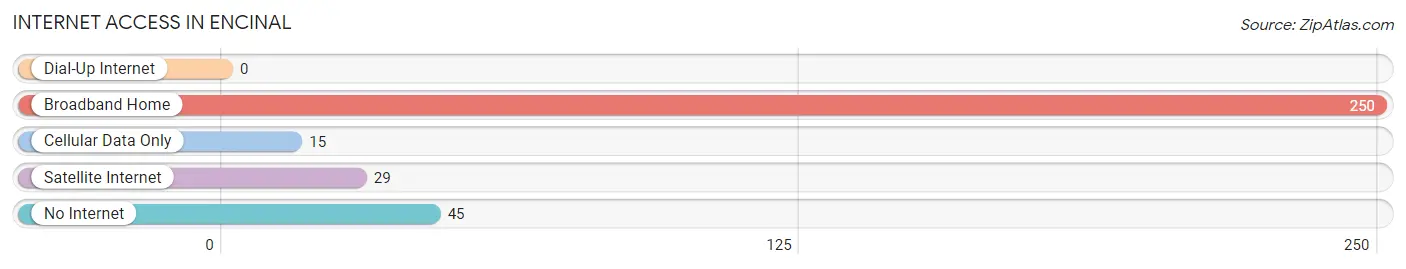
| Internet Type | # Households | % Households |
| Dial-Up Internet | 0 | 0.0% |
| Broadband Home | 250 | 73.8% |
| Cellular Data Only | 15 | 4.4% |
| Satellite Internet | 29 | 8.6% |
| No Internet | 45 | 13.3% |
| Total | 339 | 100.0% |
Encinal Summary
Encinal, Texas is a small town located in La Salle County, Texas. It is situated on the banks of the Nueces River, approximately 30 miles south of Laredo. The town was founded in 1883 and has a population of approximately 1,000 people.
History
Encinal, Texas was founded in 1883 by a group of settlers from Mexico. The settlers were attracted to the area due to its fertile soil and abundant water supply. The town was named after the Encinal de la Salle, a large oak tree that was located near the town. The tree was a symbol of strength and endurance for the settlers.
The town quickly grew and by the early 1900s, it had become a thriving agricultural center. The town was home to several cotton gins, a flour mill, and a cottonseed oil mill. The town also had a post office, a bank, and several stores.
In the early 1900s, the town was also home to a large number of Mexican immigrants. These immigrants were attracted to the area due to its proximity to the border and the availability of jobs in the agricultural industry.
Geography
Encinal, Texas is located in La Salle County, Texas. It is situated on the banks of the Nueces River, approximately 30 miles south of Laredo. The town is located in a semi-arid region of the state and has an average elevation of 590 feet.
The town is surrounded by several small towns and communities, including Cotulla, Catarina, and Freer. The town is also located near the Rio Grande, which serves as the border between the United States and Mexico.
Economy
The economy of Encinal, Texas is largely based on agriculture. The town is home to several cotton gins, a flour mill, and a cottonseed oil mill. The town also has several stores and restaurants.
The town is also home to several oil and gas companies, which are responsible for the majority of the town’s economic activity. The town is also home to several manufacturing companies, which produce a variety of products, including furniture, clothing, and electronics.
Demographics
As of the 2010 census, the population of Encinal, Texas was 1,000 people. The town is predominantly Hispanic, with approximately 95% of the population identifying as Hispanic or Latino. The town is also home to a small number of African Americans, Native Americans, and Asians.
The median household income in Encinal, Texas is $25,000, which is significantly lower than the national average. The town also has a high poverty rate, with approximately 25% of the population living below the poverty line.
Conclusion
Encinal, Texas is a small town located in La Salle County, Texas. It was founded in 1883 and has a population of approximately 1,000 people. The town is largely based on agriculture and is home to several oil and gas companies, manufacturing companies, and stores. The town is predominantly Hispanic, with approximately 95% of the population identifying as Hispanic or Latino. The median household income in Encinal, Texas is $25,000, which is significantly lower than the national average.
Common Questions
What is Per Capita Income in Encinal?
Per Capita income in Encinal is $16,610.
What is the Median Family Income in Encinal?
Median Family Income in Encinal is $49,563.
What is the Median Household income in Encinal?
Median Household Income in Encinal is $49,216.
What is Inequality or Gini Index in Encinal?
Inequality or Gini Index in Encinal is 0.39.
What is the Total Population of Encinal?
Total Population of Encinal is 1,338.
What is the Total Male Population of Encinal?
Total Male Population of Encinal is 720.
What is the Total Female Population of Encinal?
Total Female Population of Encinal is 618.
What is the Ratio of Males per 100 Females in Encinal?
There are 116.50 Males per 100 Females in Encinal.
What is the Ratio of Females per 100 Males in Encinal?
There are 85.83 Females per 100 Males in Encinal.
What is the Median Population Age in Encinal?
Median Population Age in Encinal is 38.8 Years.
What is the Average Family Size in Encinal
Average Family Size in Encinal is 4.2 People.
What is the Average Household Size in Encinal
Average Household Size in Encinal is 4.0 People.
How Large is the Labor Force in Encinal?
There are 486 People in the Labor Forcein in Encinal.
What is the Percentage of People in the Labor Force in Encinal?
41.4% of People are in the Labor Force in Encinal.
What is the Unemployment Rate in Encinal?
Unemployment Rate in Encinal is 2.1%.