Elsa, TX Map & Demographics
Elsa Map
Elsa Overview
$23,203
PER CAPITA INCOME
$52,179
AVG FAMILY INCOME
$44,505
AVG HOUSEHOLD INCOME
42.0%
WAGE / INCOME GAP [ % ]
58.0¢/ $1
WAGE / INCOME GAP [ $ ]
0.45
INEQUALITY / GINI INDEX
5,721
TOTAL POPULATION
2,769
MALE POPULATION
2,952
FEMALE POPULATION
93.80
MALES / 100 FEMALES
106.61
FEMALES / 100 MALES
34.6
MEDIAN AGE
3.5
AVG FAMILY SIZE
3.0
AVG HOUSEHOLD SIZE
2,392
LABOR FORCE [ PEOPLE ]
56.0%
PERCENT IN LABOR FORCE
2.8%
UNEMPLOYMENT RATE
Elsa Zip Codes
Elsa Area Codes
Income in Elsa
Income Overview in Elsa
Per Capita Income in Elsa is $23,203, while median incomes of families and households are $52,179 and $44,505 respectively.
| Characteristic | Number | Measure |
| Per Capita Income | 5,721 | $23,203 |
| Median Family Income | 1,457 | $52,179 |
| Mean Family Income | 1,457 | $74,297 |
| Median Household Income | 1,922 | $44,505 |
| Mean Household Income | 1,922 | $68,745 |
| Income Deficit | 1,457 | $0 |
| Wage / Income Gap (%) | 5,721 | 41.95% |
| Wage / Income Gap ($) | 5,721 | 58.05¢ per $1 |
| Gini / Inequality Index | 5,721 | 0.45 |
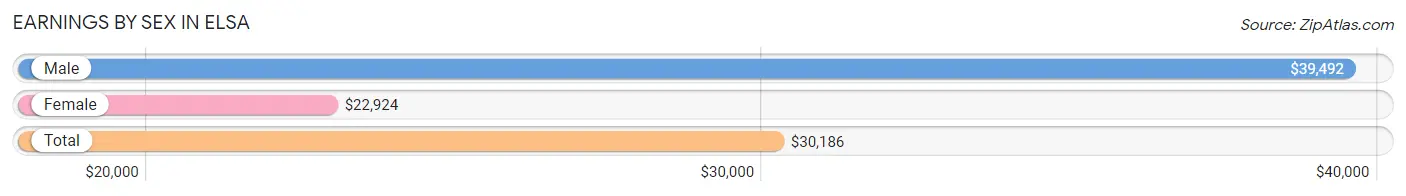
Earnings by Sex in Elsa
Average Earnings in Elsa are $30,186, $39,492 for men and $22,924 for women, a difference of 41.9%.
| Sex | Number | Average Earnings |
| Male | 1,201 (48.5%) | $39,492 |
| Female | 1,274 (51.5%) | $22,924 |
| Total | 2,475 (100.0%) | $30,186 |
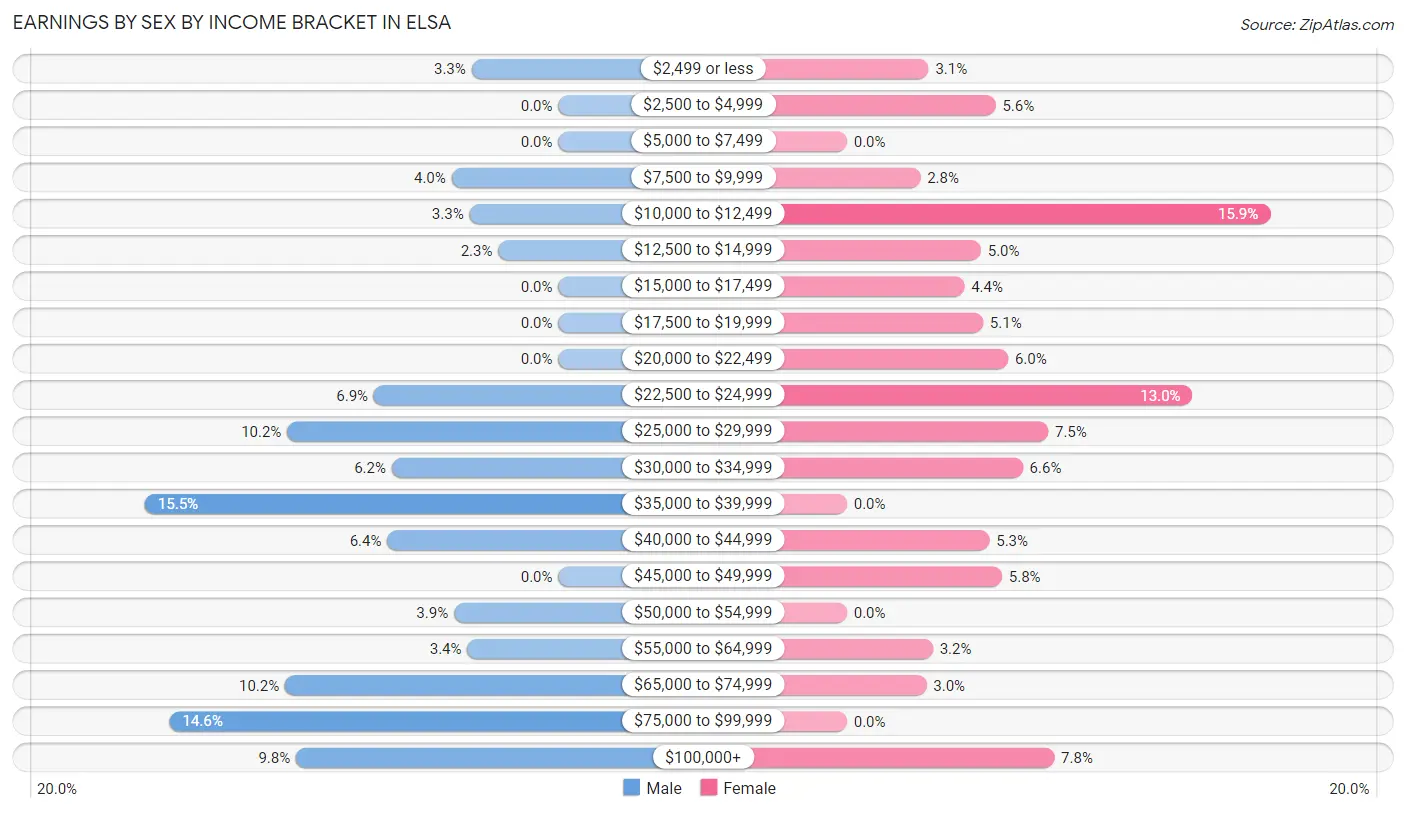
Earnings by Sex by Income Bracket in Elsa
The most common earnings brackets in Elsa are $35,000 to $39,999 for men (186 | 15.5%) and $10,000 to $12,499 for women (202 | 15.9%).
| Income | Male | Female |
| $2,499 or less | 39 (3.3%) | 39 (3.1%) |
| $2,500 to $4,999 | 0 (0.0%) | 71 (5.6%) |
| $5,000 to $7,499 | 0 (0.0%) | 0 (0.0%) |
| $7,500 to $9,999 | 48 (4.0%) | 35 (2.8%) |
| $10,000 to $12,499 | 40 (3.3%) | 202 (15.9%) |
| $12,500 to $14,999 | 27 (2.2%) | 64 (5.0%) |
| $15,000 to $17,499 | 0 (0.0%) | 56 (4.4%) |
| $17,500 to $19,999 | 0 (0.0%) | 65 (5.1%) |
| $20,000 to $22,499 | 0 (0.0%) | 77 (6.0%) |
| $22,500 to $24,999 | 83 (6.9%) | 165 (13.0%) |
| $25,000 to $29,999 | 122 (10.2%) | 96 (7.5%) |
| $30,000 to $34,999 | 75 (6.2%) | 84 (6.6%) |
| $35,000 to $39,999 | 186 (15.5%) | 0 (0.0%) |
| $40,000 to $44,999 | 77 (6.4%) | 68 (5.3%) |
| $45,000 to $49,999 | 0 (0.0%) | 74 (5.8%) |
| $50,000 to $54,999 | 47 (3.9%) | 0 (0.0%) |
| $55,000 to $64,999 | 41 (3.4%) | 41 (3.2%) |
| $65,000 to $74,999 | 123 (10.2%) | 38 (3.0%) |
| $75,000 to $99,999 | 175 (14.6%) | 0 (0.0%) |
| $100,000+ | 118 (9.8%) | 99 (7.8%) |
| Total | 1,201 (100.0%) | 1,274 (100.0%) |
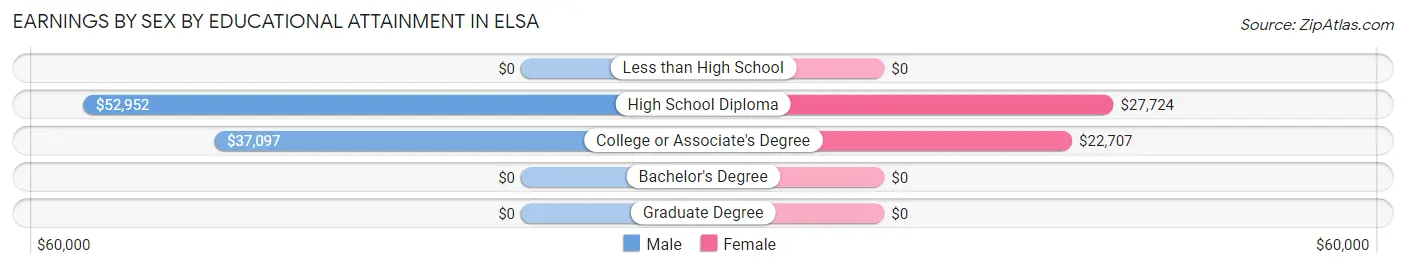
Earnings by Sex by Educational Attainment in Elsa
Average earnings in Elsa are $41,597 for men and $23,739 for women, a difference of 42.9%. Men with an educational attainment of high school diploma enjoy the highest average annual earnings of $52,952, while those with college or associate's degree education earn the least with $37,097. Women with an educational attainment of high school diploma earn the most with the average annual earnings of $27,724, while those with college or associate's degree education have the smallest earnings of $22,707.
| Educational Attainment | Male Income | Female Income |
| Less than High School | - | - |
| High School Diploma | $52,952 | $27,724 |
| College or Associate's Degree | $37,097 | $22,707 |
| Bachelor's Degree | - | - |
| Graduate Degree | - | - |
| Total | $41,597 | $23,739 |
Family Income in Elsa
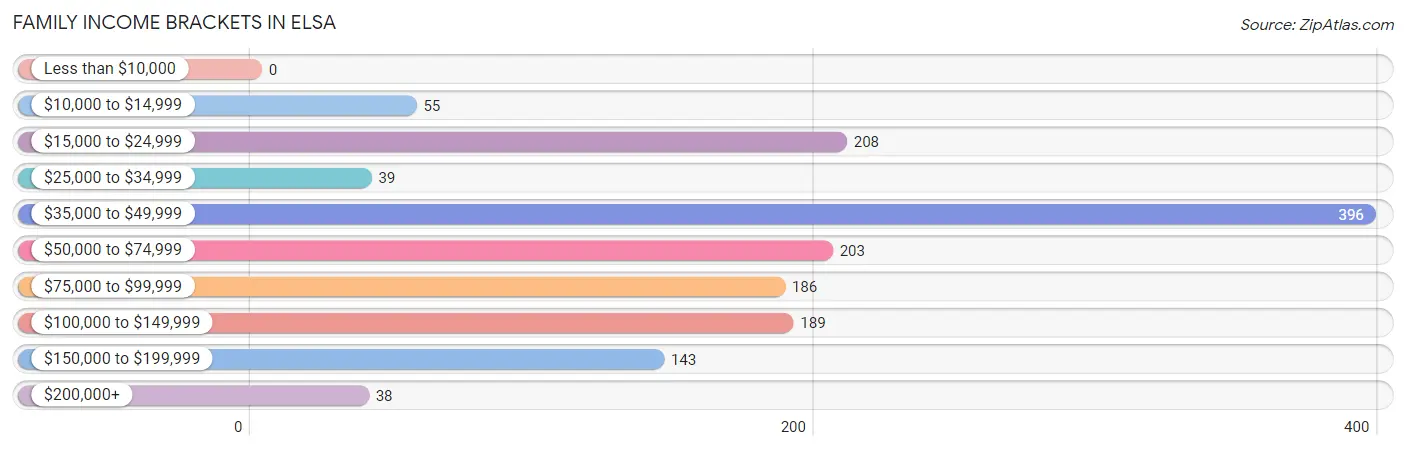
Family Income Brackets in Elsa
According to the Elsa family income data, there are 396 families falling into the $35,000 to $49,999 income range, which is the most common income bracket and makes up 27.2% of all families.
| Income Bracket | # Families | % Families |
| Less than $10,000 | 0 | 0.0% |
| $10,000 to $14,999 | 55 | 3.8% |
| $15,000 to $24,999 | 208 | 14.3% |
| $25,000 to $34,999 | 39 | 2.7% |
| $35,000 to $49,999 | 396 | 27.2% |
| $50,000 to $74,999 | 203 | 13.9% |
| $75,000 to $99,999 | 186 | 12.8% |
| $100,000 to $149,999 | 189 | 13.0% |
| $150,000 to $199,999 | 143 | 9.8% |
| $200,000+ | 38 | 2.6% |
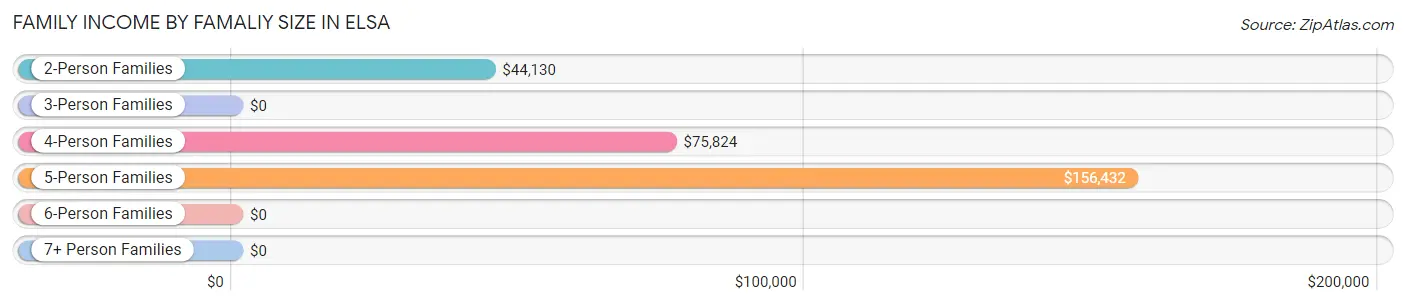
Family Income by Famaliy Size in Elsa
5-person families (213 | 14.6%) account for the highest median family income in Elsa with $156,432 per family, while 5-person families (213 | 14.6%) have the highest median income of $31,286 per family member.
| Income Bracket | # Families | Median Income |
| 2-Person Families | 582 (40.0%) | $44,130 |
| 3-Person Families | 259 (17.8%) | $0 |
| 4-Person Families | 229 (15.7%) | $75,824 |
| 5-Person Families | 213 (14.6%) | $156,432 |
| 6-Person Families | 94 (6.5%) | $0 |
| 7+ Person Families | 80 (5.5%) | $0 |
| Total | 1,457 (100.0%) | $52,179 |
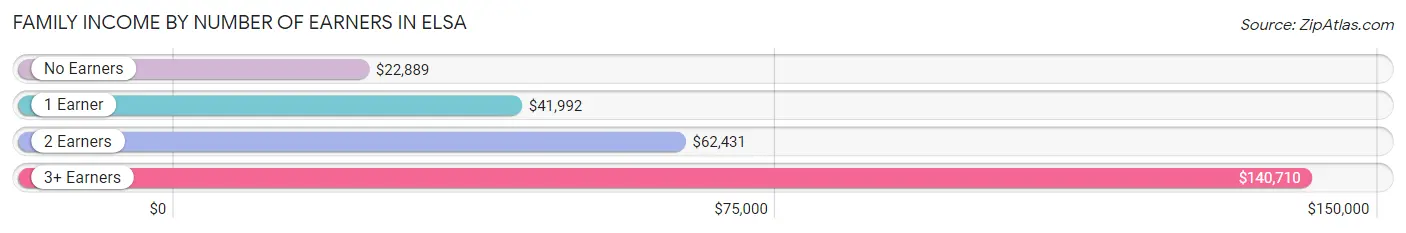
Family Income by Number of Earners in Elsa
The median family income in Elsa is $52,179, with families comprising 3+ earners (233) having the highest median family income of $140,710, while families with no earners (236) have the lowest median family income of $22,889, accounting for 16.0% and 16.2% of families, respectively.
| Number of Earners | # Families | Median Income |
| No Earners | 236 (16.2%) | $22,889 |
| 1 Earner | 526 (36.1%) | $41,992 |
| 2 Earners | 462 (31.7%) | $62,431 |
| 3+ Earners | 233 (16.0%) | $140,710 |
| Total | 1,457 (100.0%) | $52,179 |
Household Income in Elsa
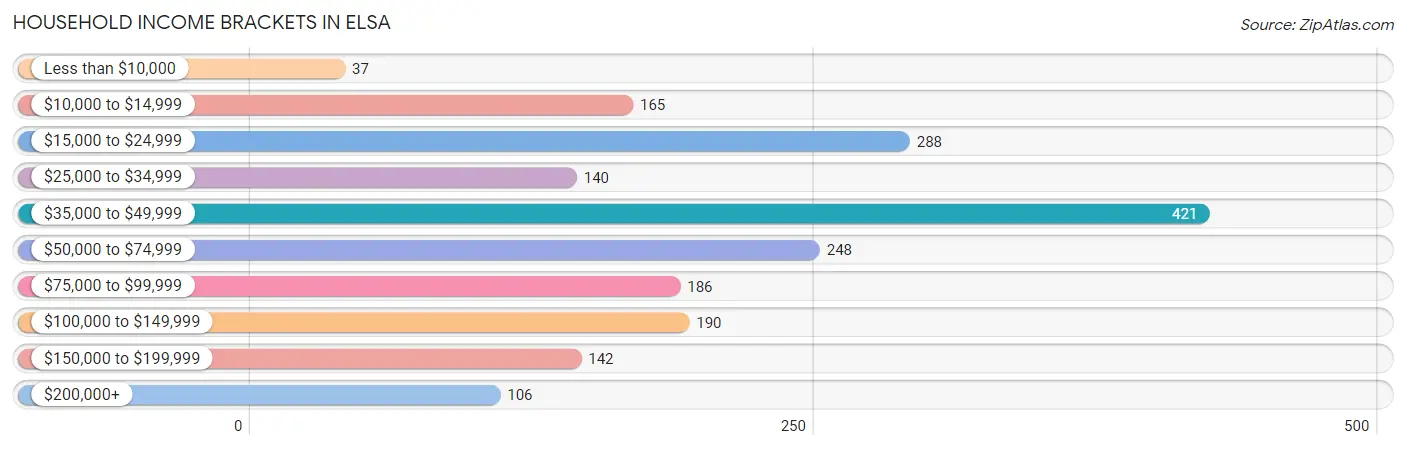
Household Income Brackets in Elsa
With 421 households falling in the category, the $35,000 to $49,999 income range is the most frequent in Elsa, accounting for 21.9% of all households. In contrast, only 37 households (1.9%) fall into the less than $10,000 income bracket, making it the least populous group.
| Income Bracket | # Households | % Households |
| Less than $10,000 | 37 | 1.9% |
| $10,000 to $14,999 | 165 | 8.6% |
| $15,000 to $24,999 | 288 | 15.0% |
| $25,000 to $34,999 | 140 | 7.3% |
| $35,000 to $49,999 | 421 | 21.9% |
| $50,000 to $74,999 | 248 | 12.9% |
| $75,000 to $99,999 | 186 | 9.7% |
| $100,000 to $149,999 | 190 | 9.9% |
| $150,000 to $199,999 | 142 | 7.4% |
| $200,000+ | 106 | 5.5% |
Household Income by Householder Age in Elsa
The median household income in Elsa is $44,505, with the highest median household income of $53,021 found in the 25 to 44 years age bracket for the primary householder. A total of 637 households (33.1%) fall into this category. Meanwhile, the 15 to 24 years age bracket for the primary householder has the lowest median household income of $0, with 94 households (4.9%) in this group.
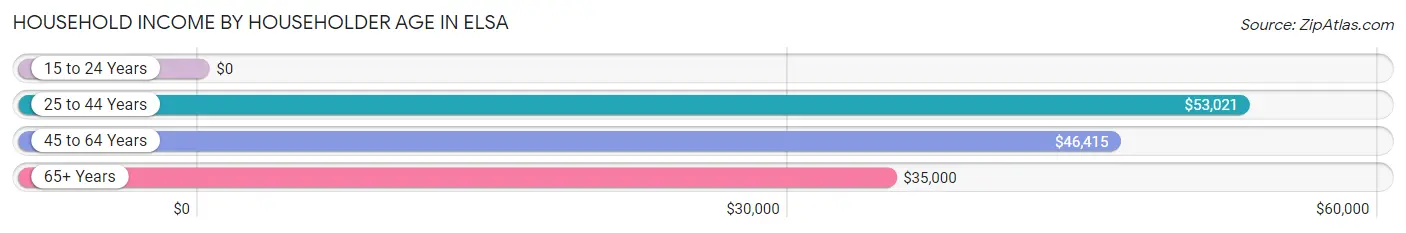
| Income Bracket | # Households | Median Income |
| 15 to 24 Years | 94 (4.9%) | $0 |
| 25 to 44 Years | 637 (33.1%) | $53,021 |
| 45 to 64 Years | 765 (39.8%) | $46,415 |
| 65+ Years | 426 (22.2%) | $35,000 |
| Total | 1,922 (100.0%) | $44,505 |
Poverty in Elsa
Income Below Poverty by Sex and Age in Elsa
With 21.1% poverty level for males and 15.4% for females among the residents of Elsa, 5 year old males and 6 to 11 year old females are the most vulnerable to poverty, with 93 males (84.6%) and 88 females (44.9%) in their respective age groups living below the poverty level.
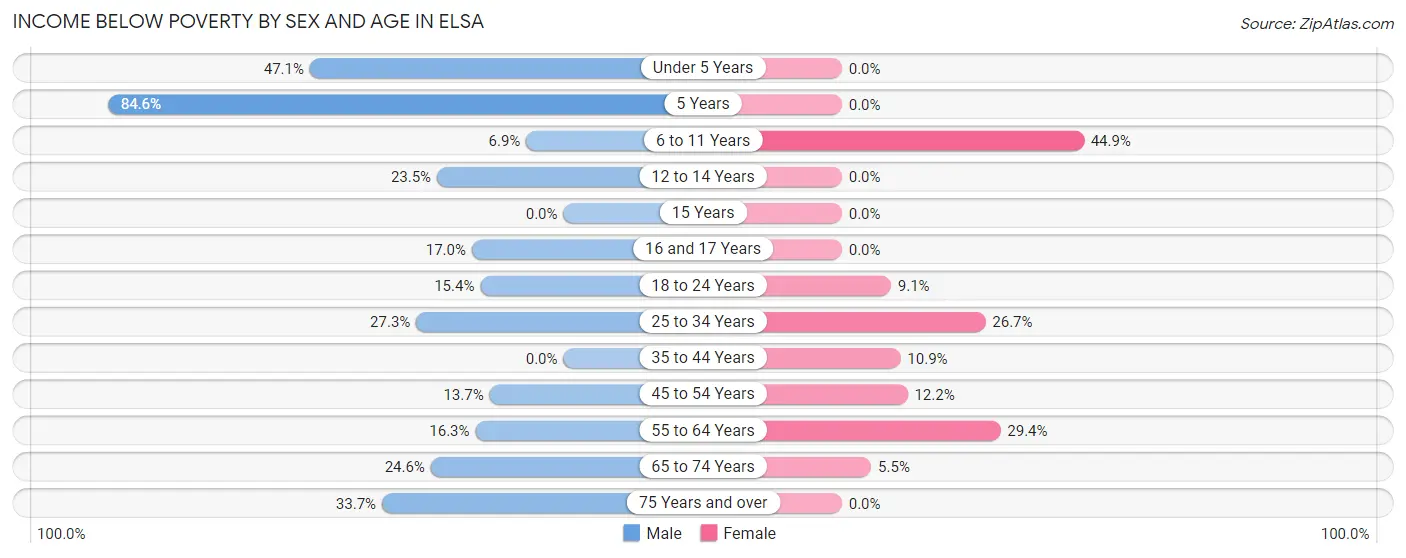
| Age Bracket | Male | Female |
| Under 5 Years | 120 (47.1%) | 0 (0.0%) |
| 5 Years | 93 (84.6%) | 0 (0.0%) |
| 6 to 11 Years | 22 (6.9%) | 88 (44.9%) |
| 12 to 14 Years | 42 (23.5%) | 0 (0.0%) |
| 15 Years | 0 (0.0%) | 0 (0.0%) |
| 16 and 17 Years | 34 (17.0%) | 0 (0.0%) |
| 18 to 24 Years | 27 (15.4%) | 46 (9.1%) |
| 25 to 34 Years | 53 (27.3%) | 89 (26.7%) |
| 35 to 44 Years | 0 (0.0%) | 36 (10.9%) |
| 45 to 54 Years | 58 (13.7%) | 49 (12.2%) |
| 55 to 64 Years | 40 (16.3%) | 113 (29.4%) |
| 65 to 74 Years | 64 (24.6%) | 18 (5.4%) |
| 75 Years and over | 32 (33.7%) | 0 (0.0%) |
| Total | 585 (21.1%) | 439 (15.4%) |
Income Above Poverty by Sex and Age in Elsa
According to the poverty statistics in Elsa, males aged 35 to 44 years and females aged under 5 years are the age groups that are most secure financially, with 100.0% of males and 100.0% of females in these age groups living above the poverty line.
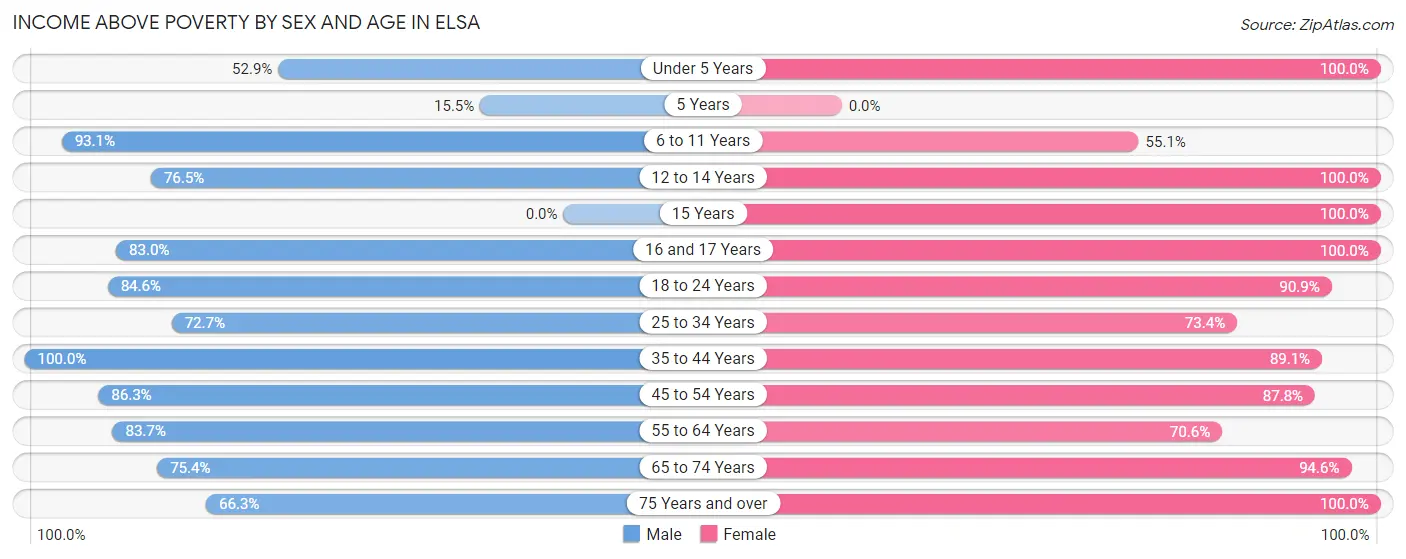
| Age Bracket | Male | Female |
| Under 5 Years | 135 (52.9%) | 124 (100.0%) |
| 5 Years | 17 (15.4%) | 0 (0.0%) |
| 6 to 11 Years | 297 (93.1%) | 108 (55.1%) |
| 12 to 14 Years | 137 (76.5%) | 132 (100.0%) |
| 15 Years | 0 (0.0%) | 34 (100.0%) |
| 16 and 17 Years | 166 (83.0%) | 39 (100.0%) |
| 18 to 24 Years | 148 (84.6%) | 459 (90.9%) |
| 25 to 34 Years | 141 (72.7%) | 245 (73.4%) |
| 35 to 44 Years | 314 (100.0%) | 295 (89.1%) |
| 45 to 54 Years | 365 (86.3%) | 353 (87.8%) |
| 55 to 64 Years | 205 (83.7%) | 271 (70.6%) |
| 65 to 74 Years | 196 (75.4%) | 312 (94.6%) |
| 75 Years and over | 63 (66.3%) | 40 (100.0%) |
| Total | 2,184 (78.9%) | 2,412 (84.6%) |
Income Below Poverty Among Married-Couple Families in Elsa
The poverty statistics for married-couple families in Elsa show that 16.0% or 168 of the total 1,052 families live below the poverty line. Families with 3 or 4 children have the highest poverty rate of 44.3%, comprising of 89 families. On the other hand, families with 1 or 2 children have the lowest poverty rate of 6.2%, which includes 24 families.
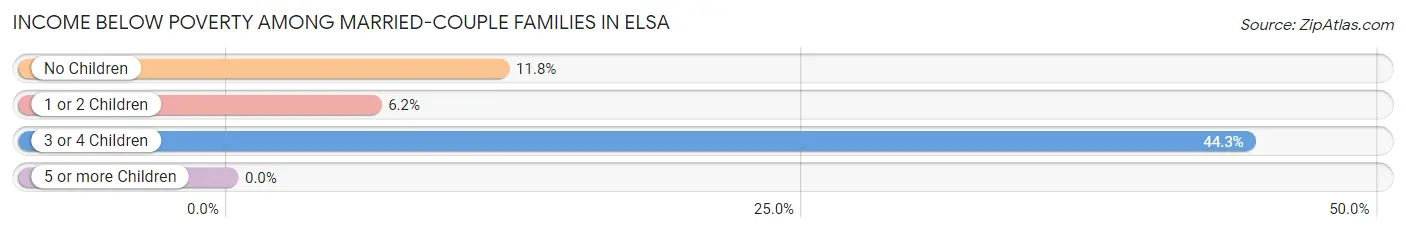
| Children | Above Poverty | Below Poverty |
| No Children | 411 (88.2%) | 55 (11.8%) |
| 1 or 2 Children | 361 (93.8%) | 24 (6.2%) |
| 3 or 4 Children | 112 (55.7%) | 89 (44.3%) |
| 5 or more Children | 0 (0.0%) | 0 (0.0%) |
| Total | 884 (84.0%) | 168 (16.0%) |
Income Below Poverty Among Single-Parent Households in Elsa
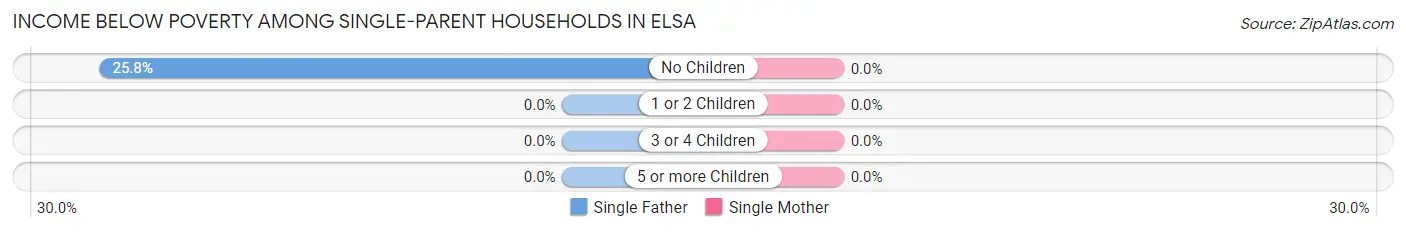
| Children | Single Father | Single Mother |
| No Children | 32 (25.8%) | 0 (0.0%) |
| 1 or 2 Children | 0 (0.0%) | 0 (0.0%) |
| 3 or 4 Children | 0 (0.0%) | 0 (0.0%) |
| 5 or more Children | 0 (0.0%) | 0 (0.0%) |
| Total | 32 (18.8%) | 0 (0.0%) |
Income Below Poverty Among Married-Couple vs Single-Parent Households in Elsa
The poverty data for Elsa shows that 168 of the married-couple family households (16.0%) and 32 of the single-parent households (7.9%) are living below the poverty level. Within the married-couple family households, those with 3 or 4 children have the highest poverty rate, with 89 households (44.3%) falling below the poverty line. Among the single-parent households, those with no children have the highest poverty rate, with 32 household (10.8%) living below poverty.
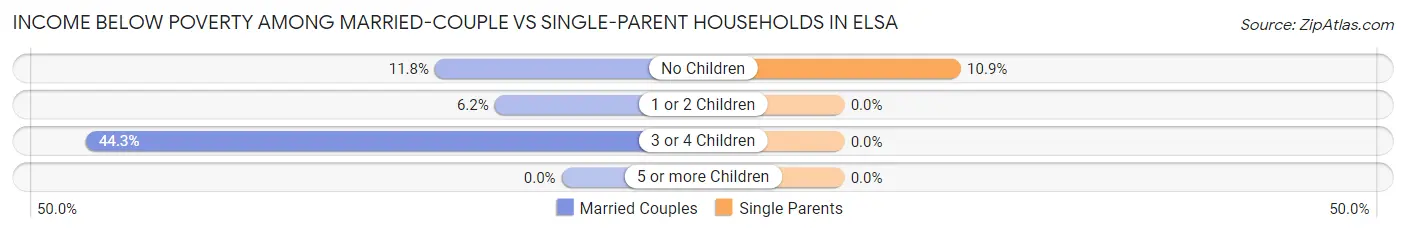
| Children | Married-Couple Families | Single-Parent Households |
| No Children | 55 (11.8%) | 32 (10.8%) |
| 1 or 2 Children | 24 (6.2%) | 0 (0.0%) |
| 3 or 4 Children | 89 (44.3%) | 0 (0.0%) |
| 5 or more Children | 0 (0.0%) | 0 (0.0%) |
| Total | 168 (16.0%) | 32 (7.9%) |
Race in Elsa
The most populous races in Elsa are Hispanic or Latino (5,697 | 99.6%), White / Caucasian (3,314 | 57.9%), and Two or more Races (2,276 | 39.8%).
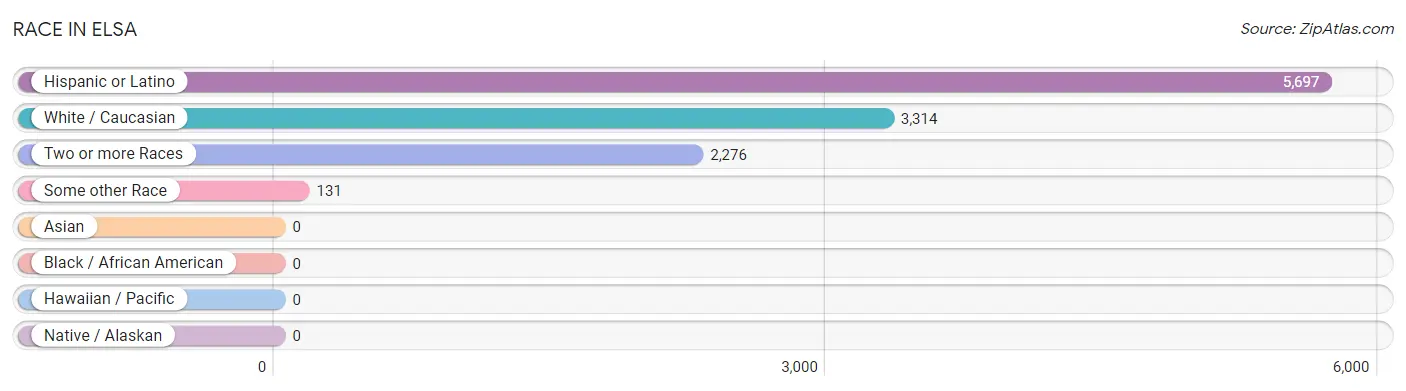
| Race | # Population | % Population |
| Asian | 0 | 0.0% |
| Black / African American | 0 | 0.0% |
| Hawaiian / Pacific | 0 | 0.0% |
| Hispanic or Latino | 5,697 | 99.6% |
| Native / Alaskan | 0 | 0.0% |
| White / Caucasian | 3,314 | 57.9% |
| Two or more Races | 2,276 | 39.8% |
| Some other Race | 131 | 2.3% |
| Total | 5,721 | 100.0% |
Ancestry in Elsa
The most populous ancestries reported in Elsa are Mexican (5,649 | 98.7%), Scottish (32 | 0.6%), and French (31 | 0.5%), together accounting for 99.8% of all Elsa residents.
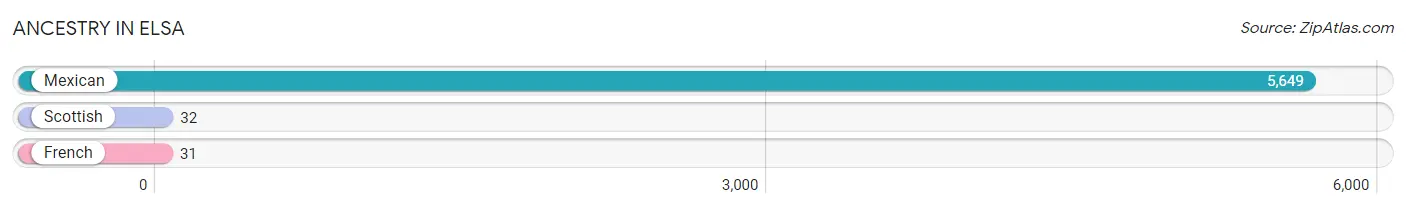
| Ancestry | # Population | % Population |
| French | 31 | 0.5% |
| Mexican | 5,649 | 98.7% |
| Scottish | 32 | 0.6% | View All 3 Rows |
Immigrants in Elsa
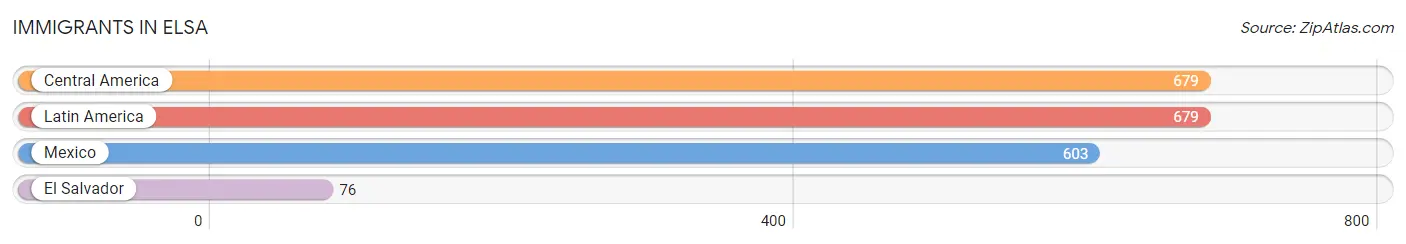
The most numerous immigrant groups reported in Elsa came from Central America (679 | 11.9%), Latin America (679 | 11.9%), Mexico (603 | 10.5%), and El Salvador (76 | 1.3%), together accounting for 35.6% of all Elsa residents.
| Immigration Origin | # Population | % Population |
| Central America | 679 | 11.9% |
| El Salvador | 76 | 1.3% |
| Latin America | 679 | 11.9% |
| Mexico | 603 | 10.5% | View All 4 Rows |
Sex and Age in Elsa
Sex and Age in Elsa
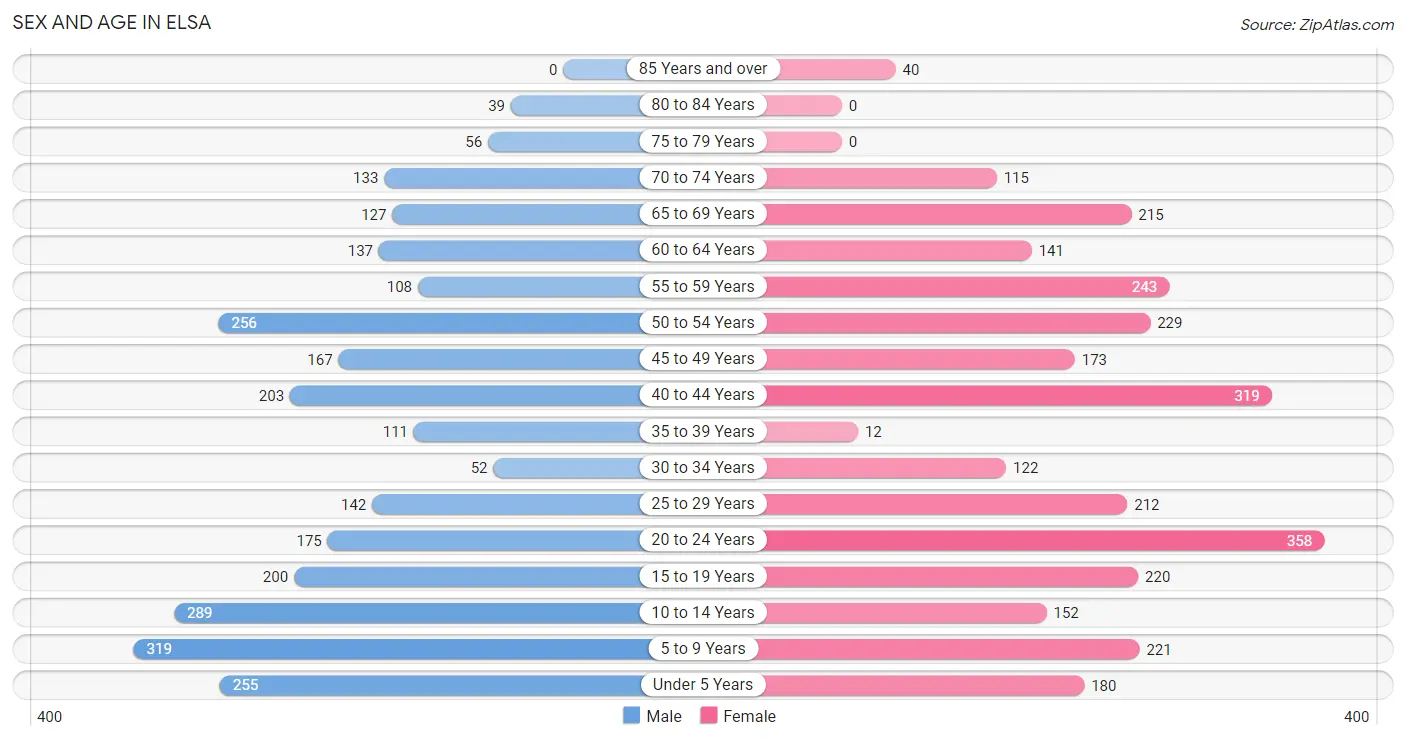
The most populous age groups in Elsa are 5 to 9 Years (319 | 11.5%) for men and 20 to 24 Years (358 | 12.1%) for women.
| Age Bracket | Male | Female |
| Under 5 Years | 255 (9.2%) | 180 (6.1%) |
| 5 to 9 Years | 319 (11.5%) | 221 (7.5%) |
| 10 to 14 Years | 289 (10.4%) | 152 (5.1%) |
| 15 to 19 Years | 200 (7.2%) | 220 (7.4%) |
| 20 to 24 Years | 175 (6.3%) | 358 (12.1%) |
| 25 to 29 Years | 142 (5.1%) | 212 (7.2%) |
| 30 to 34 Years | 52 (1.9%) | 122 (4.1%) |
| 35 to 39 Years | 111 (4.0%) | 12 (0.4%) |
| 40 to 44 Years | 203 (7.3%) | 319 (10.8%) |
| 45 to 49 Years | 167 (6.0%) | 173 (5.9%) |
| 50 to 54 Years | 256 (9.2%) | 229 (7.8%) |
| 55 to 59 Years | 108 (3.9%) | 243 (8.2%) |
| 60 to 64 Years | 137 (5.0%) | 141 (4.8%) |
| 65 to 69 Years | 127 (4.6%) | 215 (7.3%) |
| 70 to 74 Years | 133 (4.8%) | 115 (3.9%) |
| 75 to 79 Years | 56 (2.0%) | 0 (0.0%) |
| 80 to 84 Years | 39 (1.4%) | 0 (0.0%) |
| 85 Years and over | 0 (0.0%) | 40 (1.4%) |
| Total | 2,769 (100.0%) | 2,952 (100.0%) |
Families and Households in Elsa
Median Family Size in Elsa
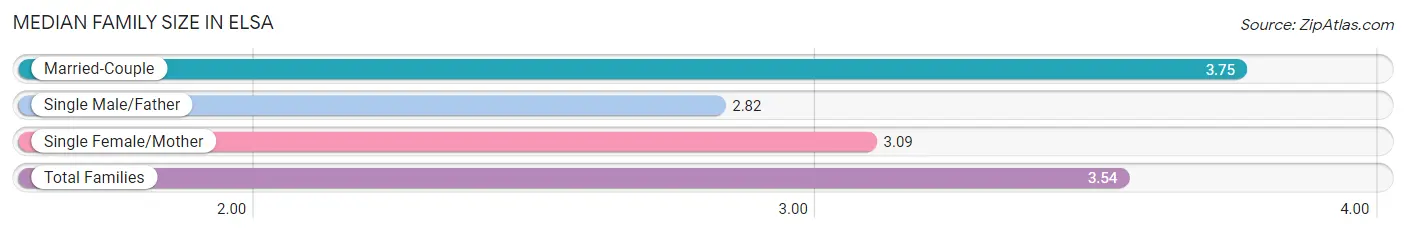
The median family size in Elsa is 3.54 persons per family, with married-couple families (1,052 | 72.2%) accounting for the largest median family size of 3.75 persons per family. On the other hand, single male/father families (170 | 11.7%) represent the smallest median family size with 2.82 persons per family.
| Family Type | # Families | Family Size |
| Married-Couple | 1,052 (72.2%) | 3.75 |
| Single Male/Father | 170 (11.7%) | 2.82 |
| Single Female/Mother | 235 (16.1%) | 3.09 |
| Total Families | 1,457 (100.0%) | 3.54 |
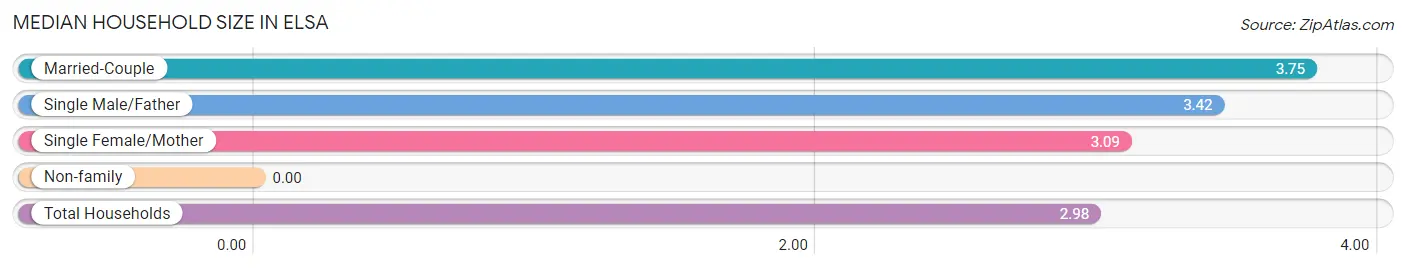
Median Household Size in Elsa
| Household Type | # Households | Household Size |
| Married-Couple | 1,052 (54.7%) | 3.75 |
| Single Male/Father | 170 (8.8%) | 3.42 |
| Single Female/Mother | 235 (12.2%) | 3.09 |
| Non-family | 465 (24.2%) | - |
| Total Households | 1,922 (100.0%) | 2.98 |
Household Size by Marriage Status in Elsa
Out of a total of 1,922 households in Elsa, 1,457 (75.8%) are family households, while 465 (24.2%) are nonfamily households. The most numerous type of family households are 2-person households, comprising 530, and the most common type of nonfamily households are 1-person households, comprising 465.
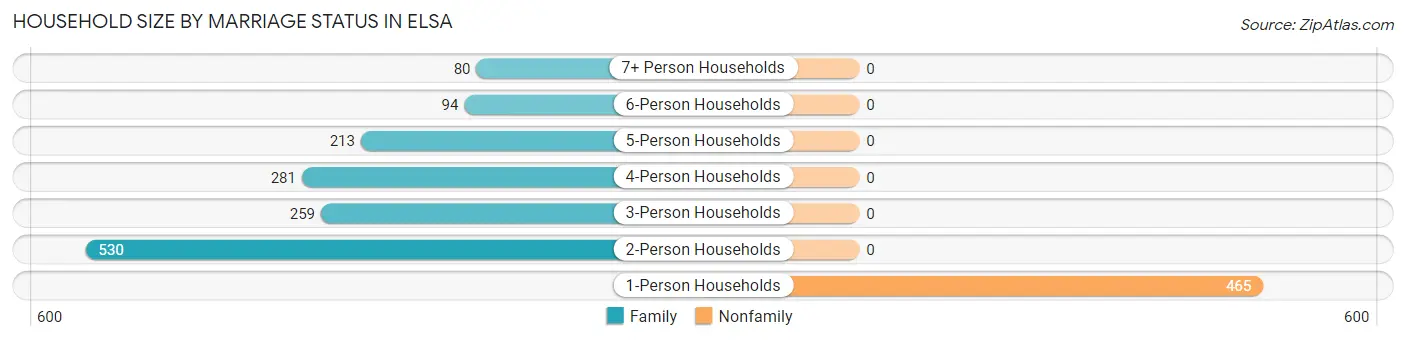
| Household Size | Family Households | Nonfamily Households |
| 1-Person Households | - | 465 (24.2%) |
| 2-Person Households | 530 (27.6%) | 0 (0.0%) |
| 3-Person Households | 259 (13.5%) | 0 (0.0%) |
| 4-Person Households | 281 (14.6%) | 0 (0.0%) |
| 5-Person Households | 213 (11.1%) | 0 (0.0%) |
| 6-Person Households | 94 (4.9%) | 0 (0.0%) |
| 7+ Person Households | 80 (4.2%) | 0 (0.0%) |
| Total | 1,457 (75.8%) | 465 (24.2%) |
Female Fertility in Elsa
Fertility by Age in Elsa
Average fertility rate in Elsa is 34.0 births per 1,000 women. Women in the age bracket of 20 to 34 years have the highest fertility rate with 71.0 births per 1,000 women. Women in the age bracket of 20 to 34 years acount for 100.0% of all women with births.
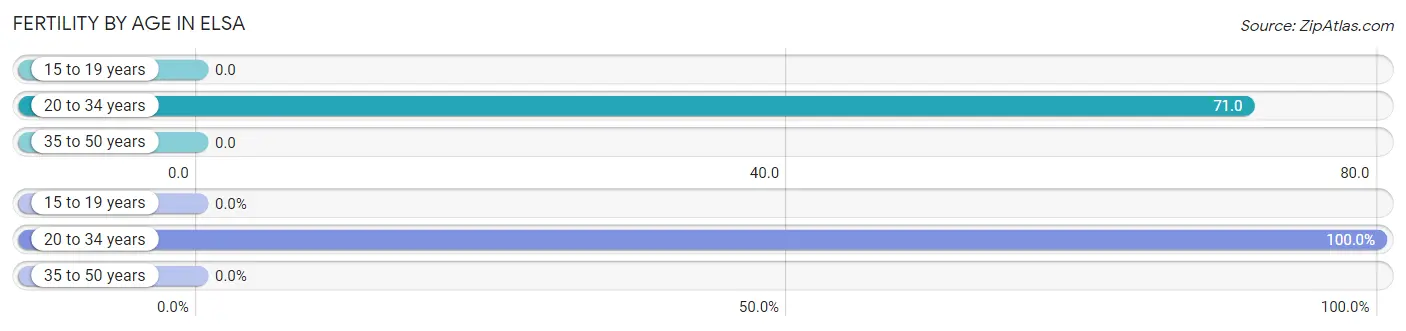
| Age Bracket | Women with Births | Births / 1,000 Women |
| 15 to 19 years | 0 (0.0%) | 0.0 |
| 20 to 34 years | 49 (100.0%) | 71.0 |
| 35 to 50 years | 0 (0.0%) | 0.0 |
| Total | 49 (100.0%) | 34.0 |
Fertility by Age by Marriage Status in Elsa
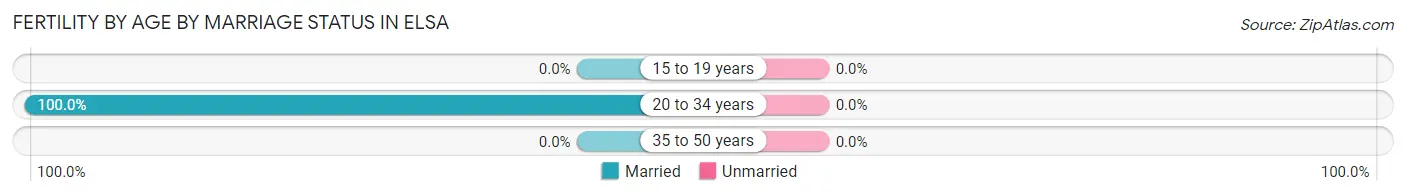
| Age Bracket | Married | Unmarried |
| 15 to 19 years | 0 (0.0%) | 0 (0.0%) |
| 20 to 34 years | 49 (100.0%) | 0 (0.0%) |
| 35 to 50 years | 0 (0.0%) | 0 (0.0%) |
| Total | 49 (100.0%) | 0 (0.0%) |
Fertility by Education in Elsa
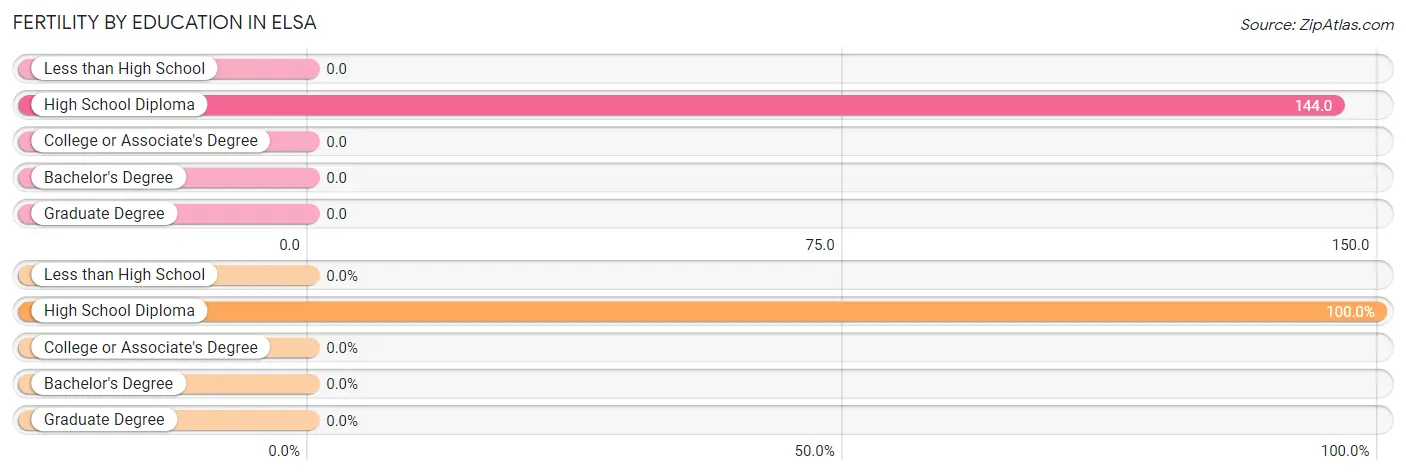
| Educational Attainment | Women with Births | Births / 1,000 Women |
| Less than High School | 0 (0.0%) | 0.0 |
| High School Diploma | 49 (100.0%) | 144.0 |
| College or Associate's Degree | 0 (0.0%) | 0.0 |
| Bachelor's Degree | 0 (0.0%) | 0.0 |
| Graduate Degree | 0 (0.0%) | 0.0 |
| Total | 49 (100.0%) | 34.0 |
Fertility by Education by Marriage Status in Elsa
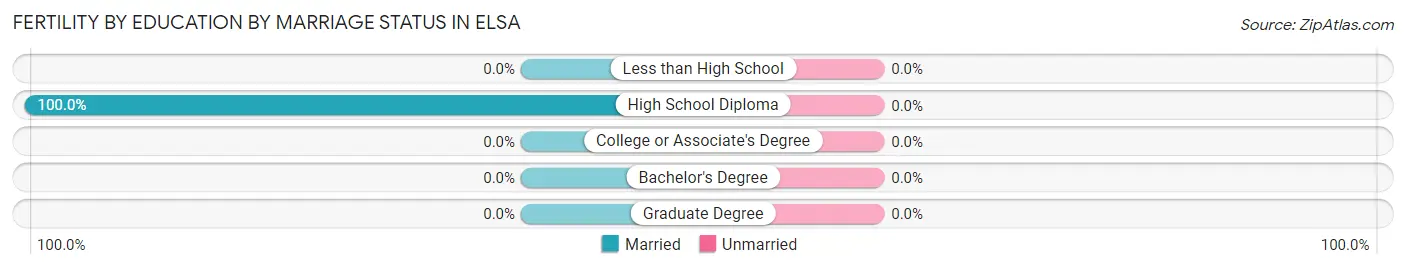
| Educational Attainment | Married | Unmarried |
| Less than High School | 0 (0.0%) | 0 (0.0%) |
| High School Diploma | 49 (100.0%) | 0 (0.0%) |
| College or Associate's Degree | 0 (0.0%) | 0 (0.0%) |
| Bachelor's Degree | 0 (0.0%) | 0 (0.0%) |
| Graduate Degree | 0 (0.0%) | 0 (0.0%) |
| Total | 49 (100.0%) | 0 (0.0%) |
Employment Characteristics in Elsa
Employment by Class of Employer in Elsa
Among the 2,226 employed individuals in Elsa, private company employees (1,407 | 63.2%), state government employees (567 | 25.5%), and local government employees (112 | 5.0%) make up the most common classes of employment.
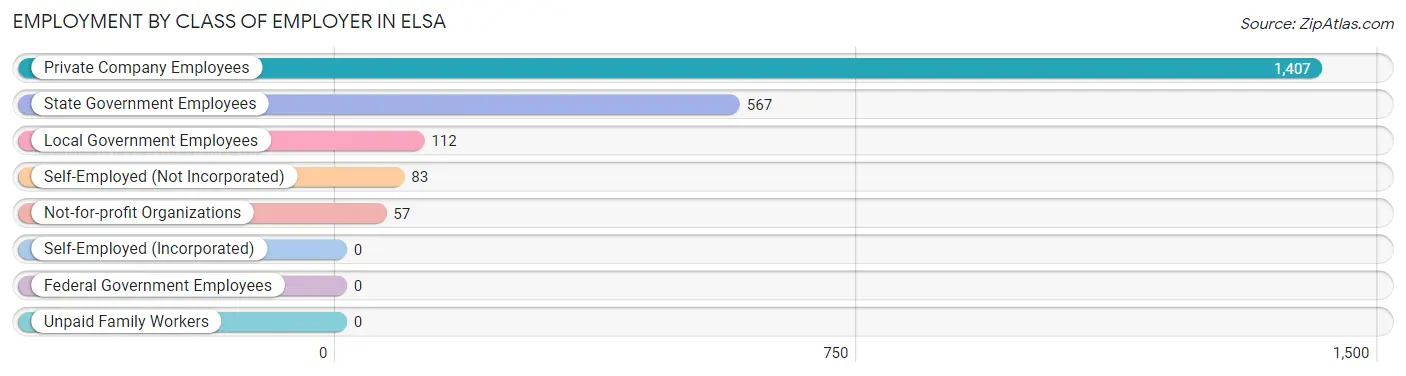
| Employer Class | # Employees | % Employees |
| Private Company Employees | 1,407 | 63.2% |
| Self-Employed (Incorporated) | 0 | 0.0% |
| Self-Employed (Not Incorporated) | 83 | 3.7% |
| Not-for-profit Organizations | 57 | 2.6% |
| Local Government Employees | 112 | 5.0% |
| State Government Employees | 567 | 25.5% |
| Federal Government Employees | 0 | 0.0% |
| Unpaid Family Workers | 0 | 0.0% |
| Total | 2,226 | 100.0% |
Employment Status by Age in Elsa
According to the labor force statistics for Elsa, out of the total population over 16 years of age (4,271), 56.0% or 2,392 individuals are in the labor force, with 2.8% or 67 of them unemployed. The age group with the highest labor force participation rate is 35 to 44 years, with 92.6% or 597 individuals in the labor force. Within the labor force, the 55 to 59 years age range has the highest percentage of unemployed individuals, with 9.1% or 18 of them being unemployed.
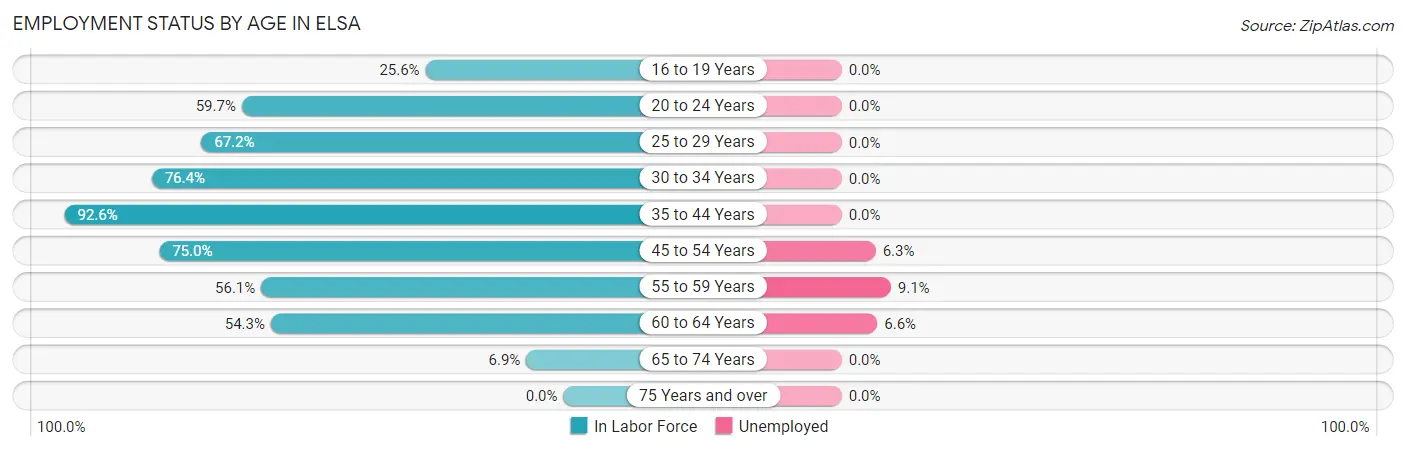
| Age Bracket | In Labor Force | Unemployed |
| 16 to 19 Years | 99 (25.6%) | 0 (0.0%) |
| 20 to 24 Years | 318 (59.7%) | 0 (0.0%) |
| 25 to 29 Years | 238 (67.2%) | 0 (0.0%) |
| 30 to 34 Years | 133 (76.4%) | 0 (0.0%) |
| 35 to 44 Years | 597 (92.6%) | 0 (0.0%) |
| 45 to 54 Years | 619 (75.0%) | 39 (6.3%) |
| 55 to 59 Years | 197 (56.1%) | 18 (9.1%) |
| 60 to 64 Years | 151 (54.3%) | 10 (6.6%) |
| 65 to 74 Years | 41 (6.9%) | 0 (0.0%) |
| 75 Years and over | 0 (0.0%) | 0 (0.0%) |
| Total | 2,392 (56.0%) | 67 (2.8%) |
Employment Status by Educational Attainment in Elsa
According to labor force statistics for Elsa, 73.7% of individuals (1,936) out of the total population between 25 and 64 years of age (2,627) are in the labor force, with 3.5% or 68 of them being unemployed. The group with the highest labor force participation rate are those with the educational attainment of bachelor's degree or higher, with 100.0% or 301 individuals in the labor force. Within the labor force, individuals with high school diploma education have the highest percentage of unemployment, with 7.1% or 57 of them being unemployed.
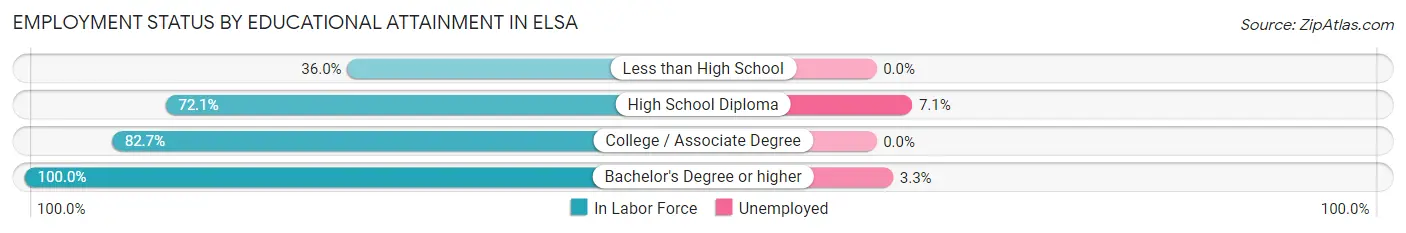
| Educational Attainment | In Labor Force | Unemployed |
| Less than High School | 133 (36.0%) | 0 (0.0%) |
| High School Diploma | 801 (72.1%) | 79 (7.1%) |
| College / Associate Degree | 700 (82.7%) | 0 (0.0%) |
| Bachelor's Degree or higher | 301 (100.0%) | 10 (3.3%) |
| Total | 1,936 (73.7%) | 92 (3.5%) |
Employment Occupations by Sex in Elsa
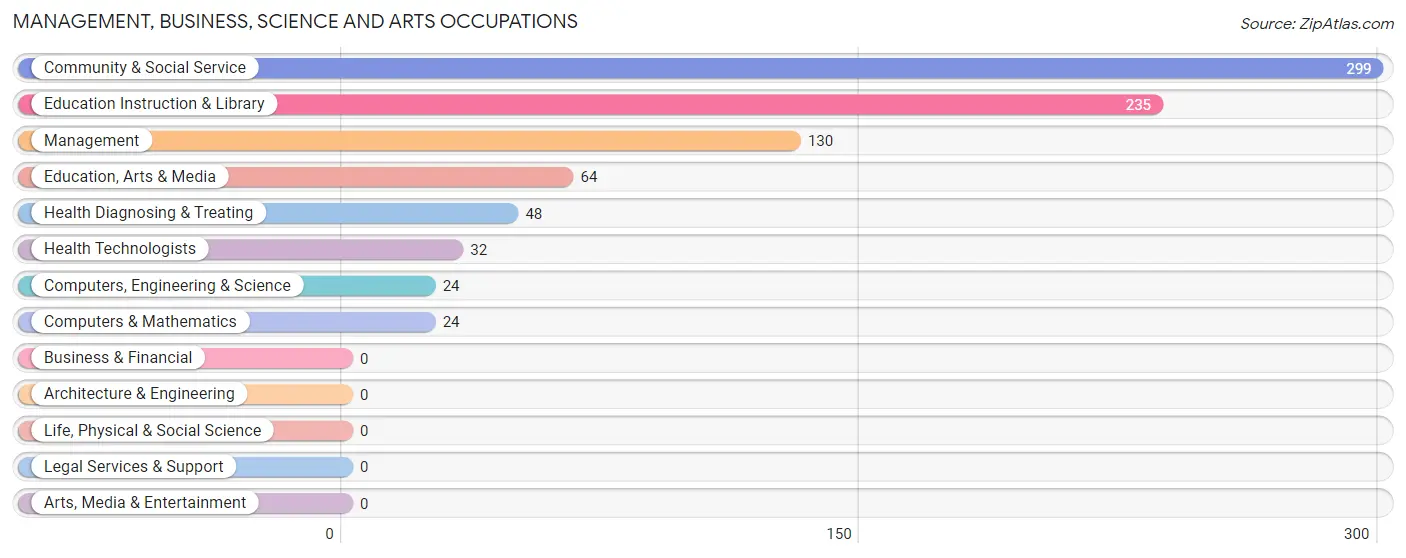
Management, Business, Science and Arts Occupations
The most common Management, Business, Science and Arts occupations in Elsa are Community & Social Service (299 | 12.9%), Education Instruction & Library (235 | 10.1%), Management (130 | 5.6%), Education, Arts & Media (64 | 2.8%), and Health Diagnosing & Treating (48 | 2.1%).
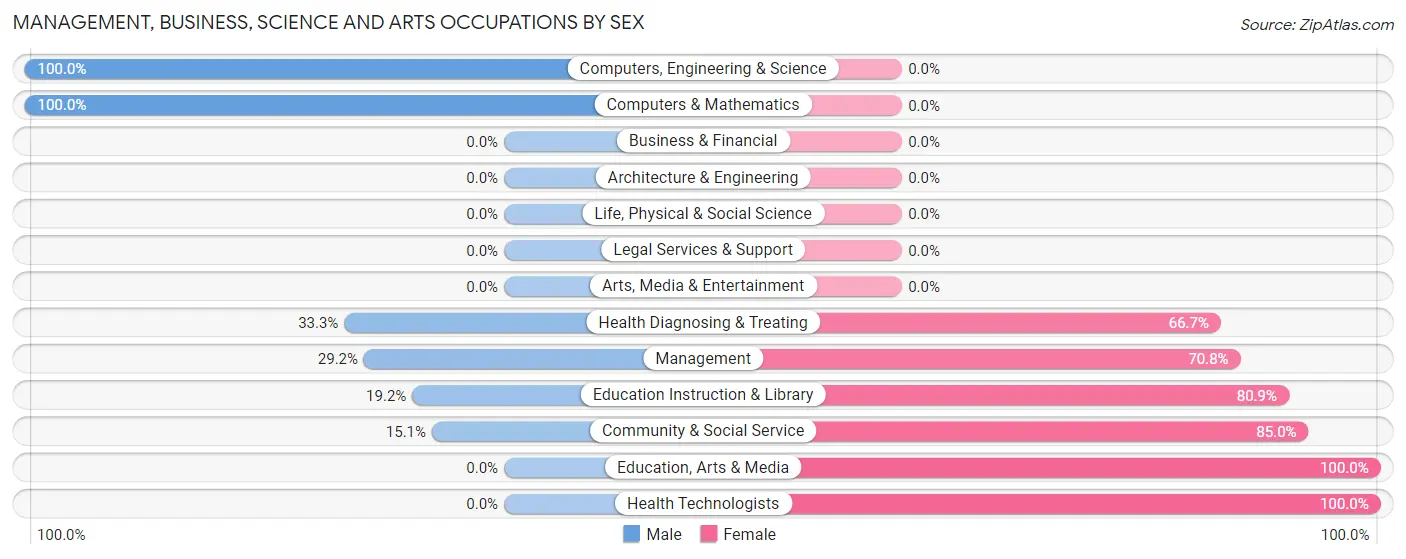
Management, Business, Science and Arts Occupations by Sex
Within the Management, Business, Science and Arts occupations in Elsa, the most male-oriented occupations are Computers, Engineering & Science (100.0%), Computers & Mathematics (100.0%), and Health Diagnosing & Treating (33.3%), while the most female-oriented occupations are Education, Arts & Media (100.0%), Health Technologists (100.0%), and Community & Social Service (85.0%).
| Occupation | Male | Female |
| Management | 38 (29.2%) | 92 (70.8%) |
| Business & Financial | 0 (0.0%) | 0 (0.0%) |
| Computers, Engineering & Science | 24 (100.0%) | 0 (0.0%) |
| Computers & Mathematics | 24 (100.0%) | 0 (0.0%) |
| Architecture & Engineering | 0 (0.0%) | 0 (0.0%) |
| Life, Physical & Social Science | 0 (0.0%) | 0 (0.0%) |
| Community & Social Service | 45 (15.0%) | 254 (85.0%) |
| Education, Arts & Media | 0 (0.0%) | 64 (100.0%) |
| Legal Services & Support | 0 (0.0%) | 0 (0.0%) |
| Education Instruction & Library | 45 (19.2%) | 190 (80.8%) |
| Arts, Media & Entertainment | 0 (0.0%) | 0 (0.0%) |
| Health Diagnosing & Treating | 16 (33.3%) | 32 (66.7%) |
| Health Technologists | 0 (0.0%) | 32 (100.0%) |
| Total (Category) | 123 (24.5%) | 378 (75.4%) |
| Total (Overall) | 1,121 (48.2%) | 1,205 (51.8%) |
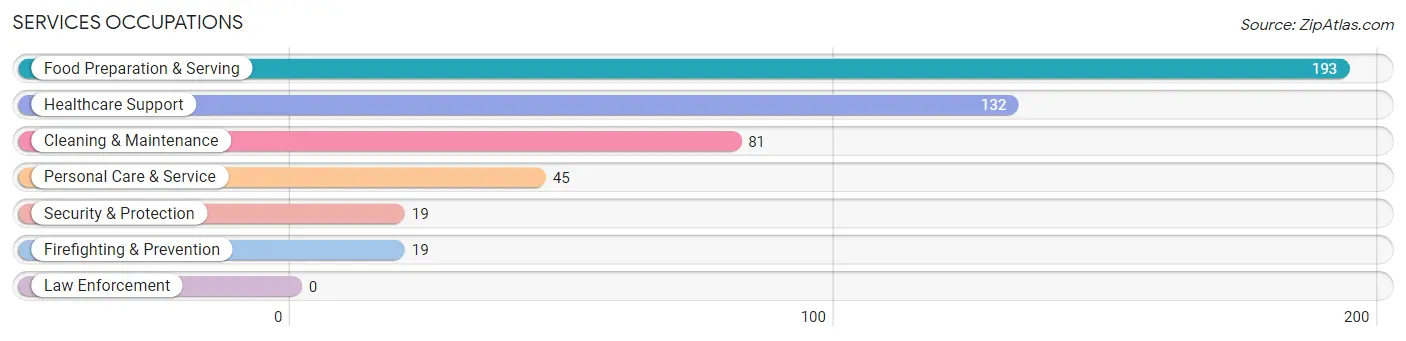
Services Occupations
The most common Services occupations in Elsa are Food Preparation & Serving (193 | 8.3%), Healthcare Support (132 | 5.7%), Cleaning & Maintenance (81 | 3.5%), Personal Care & Service (45 | 1.9%), and Security & Protection (19 | 0.8%).
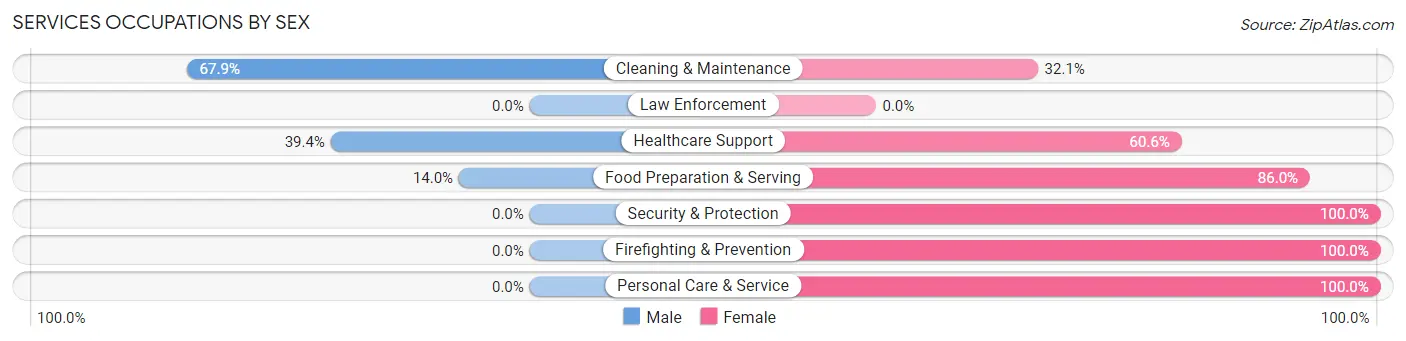
Services Occupations by Sex
Within the Services occupations in Elsa, the most male-oriented occupations are Cleaning & Maintenance (67.9%), Healthcare Support (39.4%), and Food Preparation & Serving (14.0%), while the most female-oriented occupations are Security & Protection (100.0%), Firefighting & Prevention (100.0%), and Personal Care & Service (100.0%).
| Occupation | Male | Female |
| Healthcare Support | 52 (39.4%) | 80 (60.6%) |
| Security & Protection | 0 (0.0%) | 19 (100.0%) |
| Firefighting & Prevention | 0 (0.0%) | 19 (100.0%) |
| Law Enforcement | 0 (0.0%) | 0 (0.0%) |
| Food Preparation & Serving | 27 (14.0%) | 166 (86.0%) |
| Cleaning & Maintenance | 55 (67.9%) | 26 (32.1%) |
| Personal Care & Service | 0 (0.0%) | 45 (100.0%) |
| Total (Category) | 134 (28.5%) | 336 (71.5%) |
| Total (Overall) | 1,121 (48.2%) | 1,205 (51.8%) |
Sales and Office Occupations
The most common Sales and Office occupations in Elsa are Sales & Related (302 | 13.0%), and Office & Administration (236 | 10.2%).
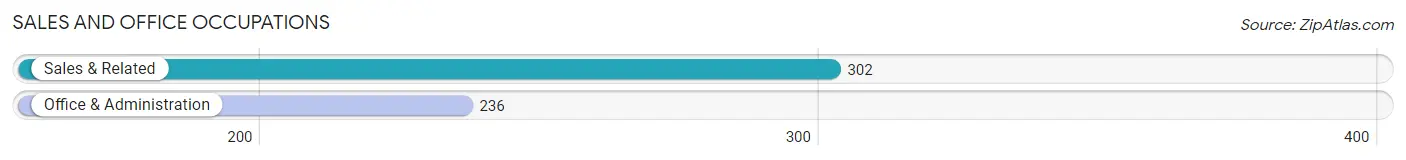
Sales and Office Occupations by Sex
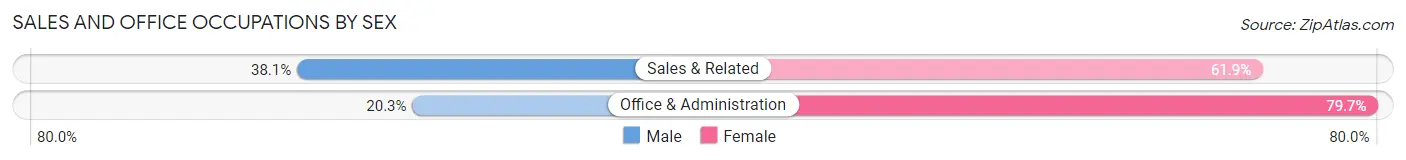
| Occupation | Male | Female |
| Sales & Related | 115 (38.1%) | 187 (61.9%) |
| Office & Administration | 48 (20.3%) | 188 (79.7%) |
| Total (Category) | 163 (30.3%) | 375 (69.7%) |
| Total (Overall) | 1,121 (48.2%) | 1,205 (51.8%) |
Natural Resources, Construction and Maintenance Occupations
The most common Natural Resources, Construction and Maintenance occupations in Elsa are , and Construction & Extraction (315 | 13.5%).
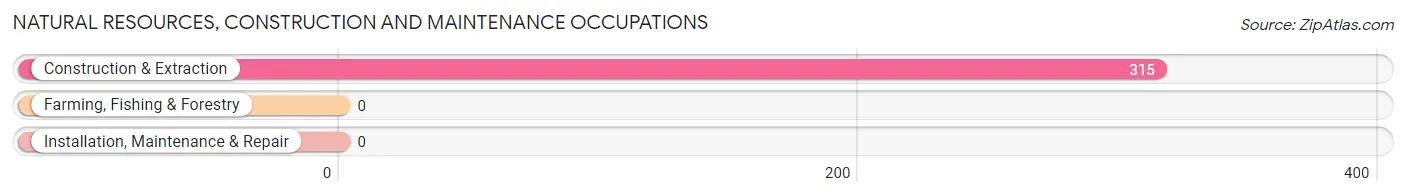
Natural Resources, Construction and Maintenance Occupations by Sex
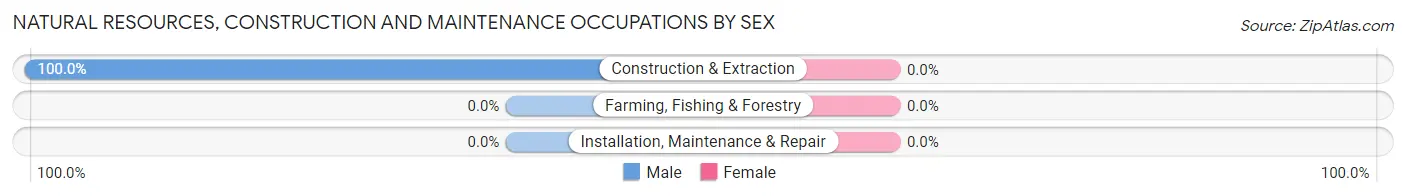
| Occupation | Male | Female |
| Farming, Fishing & Forestry | 0 (0.0%) | 0 (0.0%) |
| Construction & Extraction | 315 (100.0%) | 0 (0.0%) |
| Installation, Maintenance & Repair | 0 (0.0%) | 0 (0.0%) |
| Total (Category) | 315 (100.0%) | 0 (0.0%) |
| Total (Overall) | 1,121 (48.2%) | 1,205 (51.8%) |
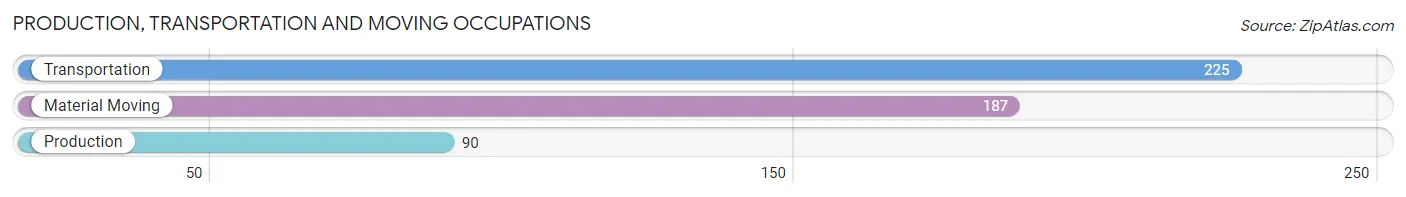
Production, Transportation and Moving Occupations
The most common Production, Transportation and Moving occupations in Elsa are Transportation (225 | 9.7%), Material Moving (187 | 8.0%), and Production (90 | 3.9%).
Production, Transportation and Moving Occupations by Sex
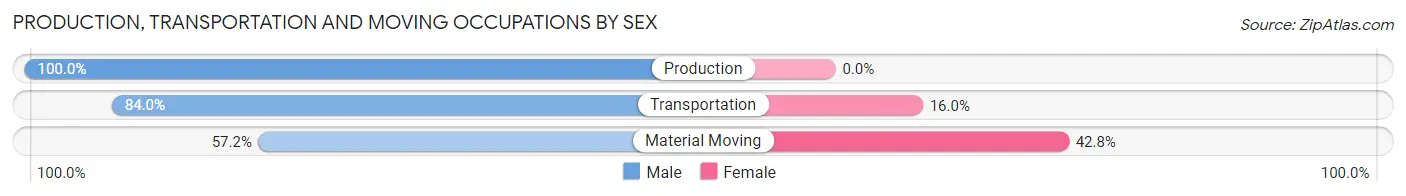
| Occupation | Male | Female |
| Production | 90 (100.0%) | 0 (0.0%) |
| Transportation | 189 (84.0%) | 36 (16.0%) |
| Material Moving | 107 (57.2%) | 80 (42.8%) |
| Total (Category) | 386 (76.9%) | 116 (23.1%) |
| Total (Overall) | 1,121 (48.2%) | 1,205 (51.8%) |
Employment Industries by Sex in Elsa
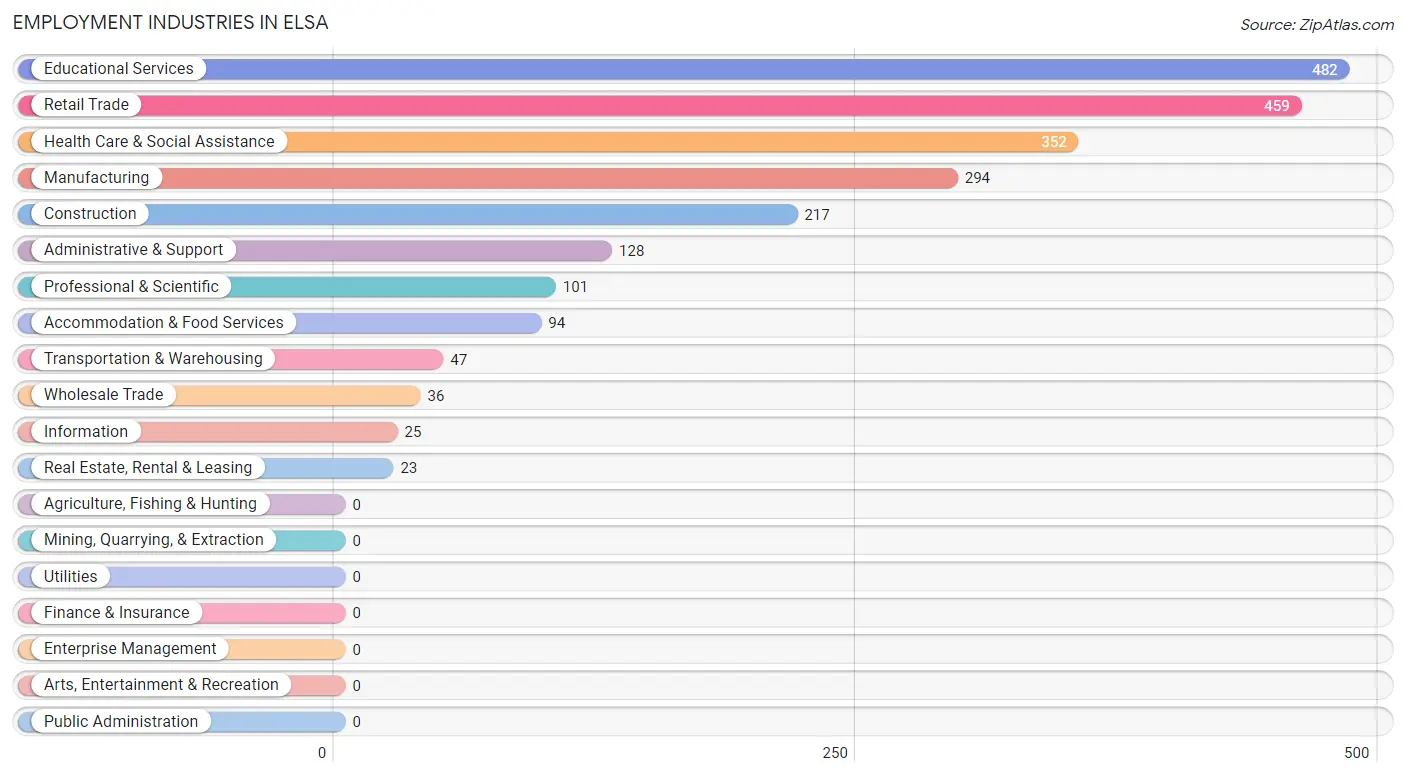
Employment Industries in Elsa
The major employment industries in Elsa include Educational Services (482 | 20.7%), Retail Trade (459 | 19.7%), Health Care & Social Assistance (352 | 15.1%), Manufacturing (294 | 12.6%), and Construction (217 | 9.3%).
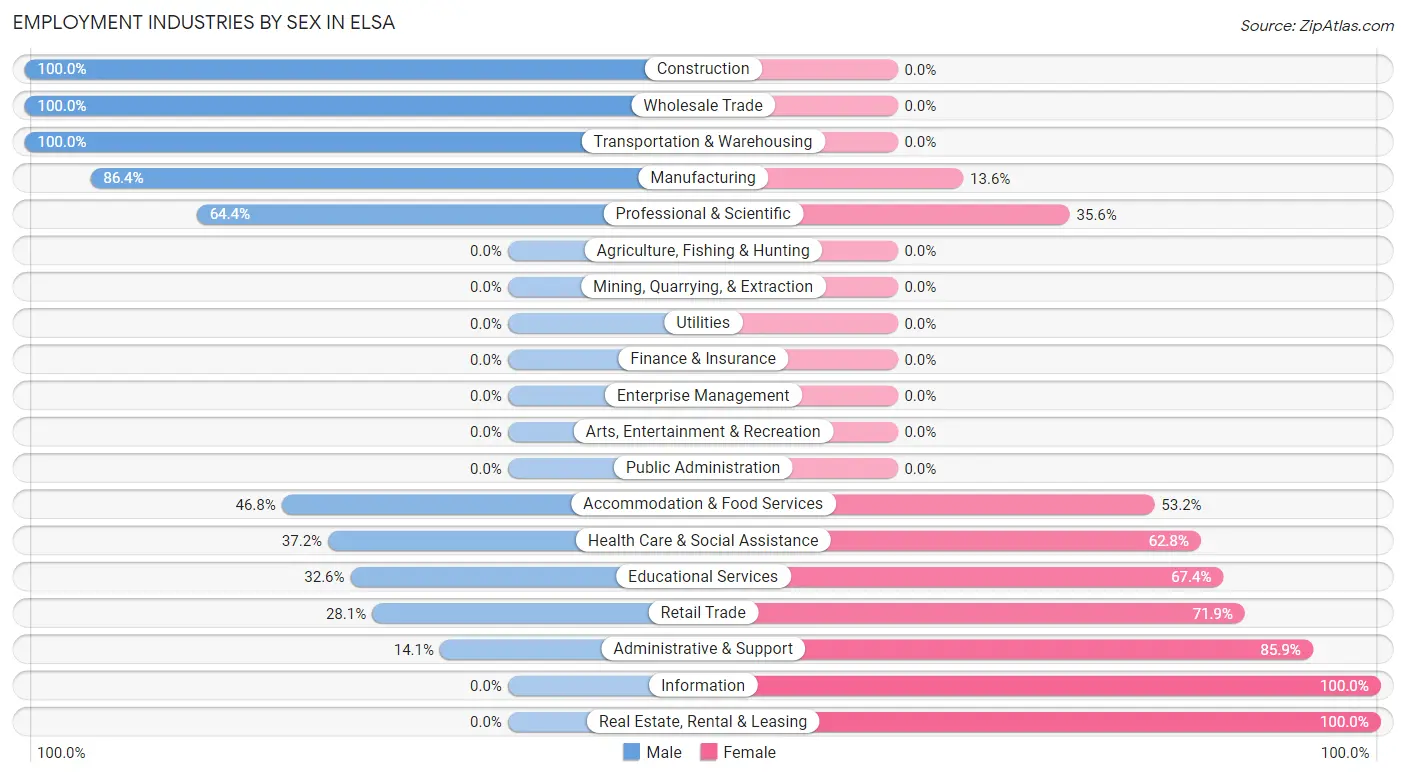
Employment Industries by Sex in Elsa
The Elsa industries that see more men than women are Construction (100.0%), Wholesale Trade (100.0%), and Transportation & Warehousing (100.0%), whereas the industries that tend to have a higher number of women are Information (100.0%), Real Estate, Rental & Leasing (100.0%), and Administrative & Support (85.9%).
| Industry | Male | Female |
| Agriculture, Fishing & Hunting | 0 (0.0%) | 0 (0.0%) |
| Mining, Quarrying, & Extraction | 0 (0.0%) | 0 (0.0%) |
| Construction | 217 (100.0%) | 0 (0.0%) |
| Manufacturing | 254 (86.4%) | 40 (13.6%) |
| Wholesale Trade | 36 (100.0%) | 0 (0.0%) |
| Retail Trade | 129 (28.1%) | 330 (71.9%) |
| Transportation & Warehousing | 47 (100.0%) | 0 (0.0%) |
| Utilities | 0 (0.0%) | 0 (0.0%) |
| Information | 0 (0.0%) | 25 (100.0%) |
| Finance & Insurance | 0 (0.0%) | 0 (0.0%) |
| Real Estate, Rental & Leasing | 0 (0.0%) | 23 (100.0%) |
| Professional & Scientific | 65 (64.4%) | 36 (35.6%) |
| Enterprise Management | 0 (0.0%) | 0 (0.0%) |
| Administrative & Support | 18 (14.1%) | 110 (85.9%) |
| Educational Services | 157 (32.6%) | 325 (67.4%) |
| Health Care & Social Assistance | 131 (37.2%) | 221 (62.8%) |
| Arts, Entertainment & Recreation | 0 (0.0%) | 0 (0.0%) |
| Accommodation & Food Services | 44 (46.8%) | 50 (53.2%) |
| Public Administration | 0 (0.0%) | 0 (0.0%) |
| Total | 1,121 (48.2%) | 1,205 (51.8%) |
Education in Elsa
School Enrollment in Elsa
The most common levels of schooling among the 1,855 students in Elsa are college / undergraduate (588 | 31.7%), elementary school (430 | 23.2%), and middle school (399 | 21.5%).
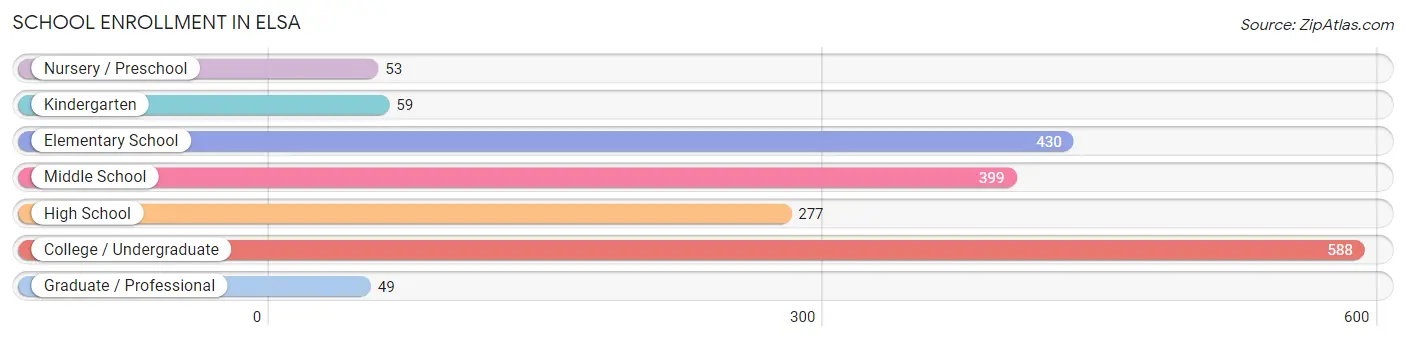
| School Level | # Students | % Students |
| Nursery / Preschool | 53 | 2.9% |
| Kindergarten | 59 | 3.2% |
| Elementary School | 430 | 23.2% |
| Middle School | 399 | 21.5% |
| High School | 277 | 14.9% |
| College / Undergraduate | 588 | 31.7% |
| Graduate / Professional | 49 | 2.6% |
| Total | 1,855 | 100.0% |
School Enrollment by Age by Funding Source in Elsa
Out of a total of 1,855 students who are enrolled in schools in Elsa, 250 (13.5%) attend a private institution, while the remaining 1,605 (86.5%) are enrolled in public schools. The age group of 18 to 19 year olds has the highest likelihood of being enrolled in private schools, with 110 (74.8% in the age bracket) enrolled. Conversely, the age group of 3 to 4 year olds has the lowest likelihood of being enrolled in a private school, with 53 (100.0% in the age bracket) attending a public institution.
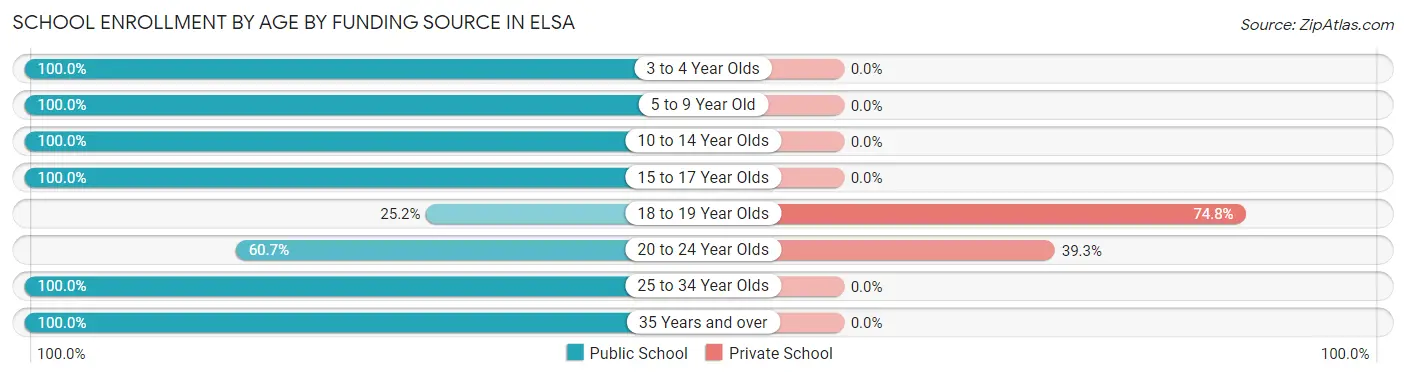
| Age Bracket | Public School | Private School |
| 3 to 4 Year Olds | 53 (100.0%) | 0 (0.0%) |
| 5 to 9 Year Old | 489 (100.0%) | 0 (0.0%) |
| 10 to 14 Year Olds | 441 (100.0%) | 0 (0.0%) |
| 15 to 17 Year Olds | 235 (100.0%) | 0 (0.0%) |
| 18 to 19 Year Olds | 37 (25.2%) | 110 (74.8%) |
| 20 to 24 Year Olds | 216 (60.7%) | 140 (39.3%) |
| 25 to 34 Year Olds | 50 (100.0%) | 0 (0.0%) |
| 35 Years and over | 84 (100.0%) | 0 (0.0%) |
| Total | 1,605 (86.5%) | 250 (13.5%) |
Educational Attainment by Field of Study in Elsa
Education (138 | 45.9%), business (67 | 22.3%), liberal arts & history (55 | 18.3%), and social sciences (41 | 13.6%) are the most common fields of study among 301 individuals in Elsa who have obtained a bachelor's degree or higher.
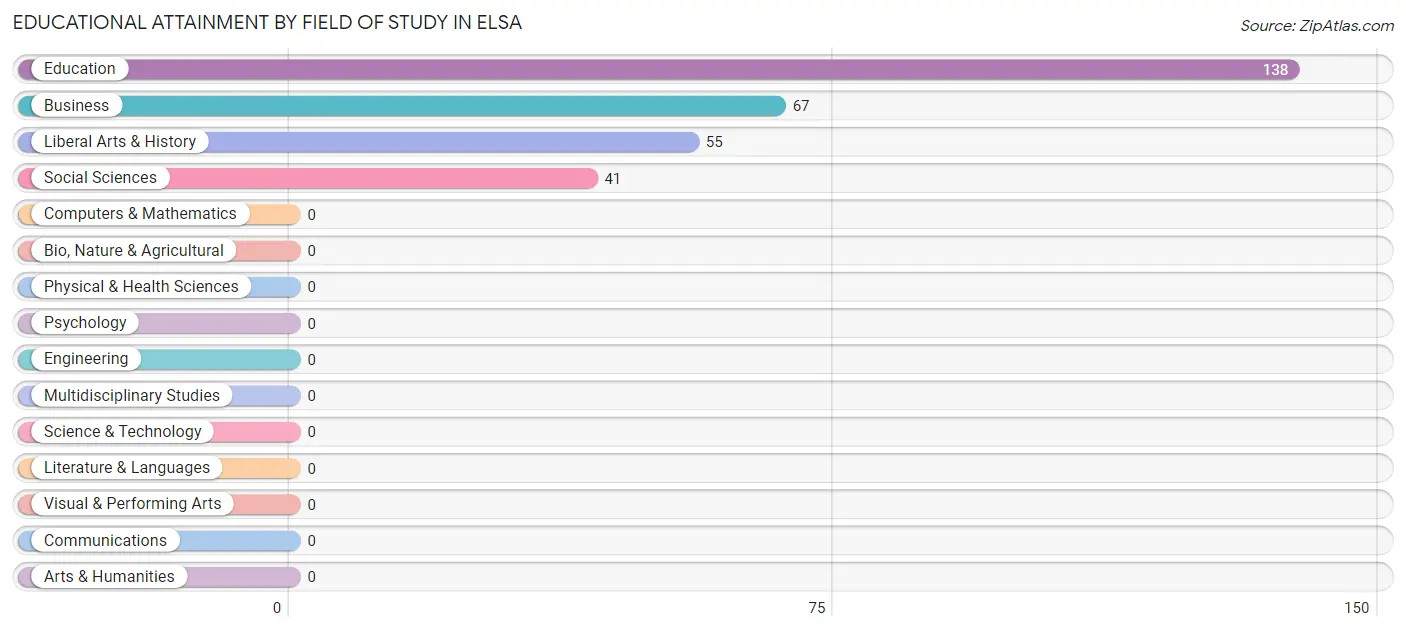
| Field of Study | # Graduates | % Graduates |
| Computers & Mathematics | 0 | 0.0% |
| Bio, Nature & Agricultural | 0 | 0.0% |
| Physical & Health Sciences | 0 | 0.0% |
| Psychology | 0 | 0.0% |
| Social Sciences | 41 | 13.6% |
| Engineering | 0 | 0.0% |
| Multidisciplinary Studies | 0 | 0.0% |
| Science & Technology | 0 | 0.0% |
| Business | 67 | 22.3% |
| Education | 138 | 45.9% |
| Literature & Languages | 0 | 0.0% |
| Liberal Arts & History | 55 | 18.3% |
| Visual & Performing Arts | 0 | 0.0% |
| Communications | 0 | 0.0% |
| Arts & Humanities | 0 | 0.0% |
| Total | 301 | 100.0% |
Transportation & Commute in Elsa
Vehicle Availability by Sex in Elsa
The most prevalent vehicle ownership categories in Elsa are males with 2 vehicles (347, accounting for 32.8%) and females with 2 vehicles (364, making up 29.7%).
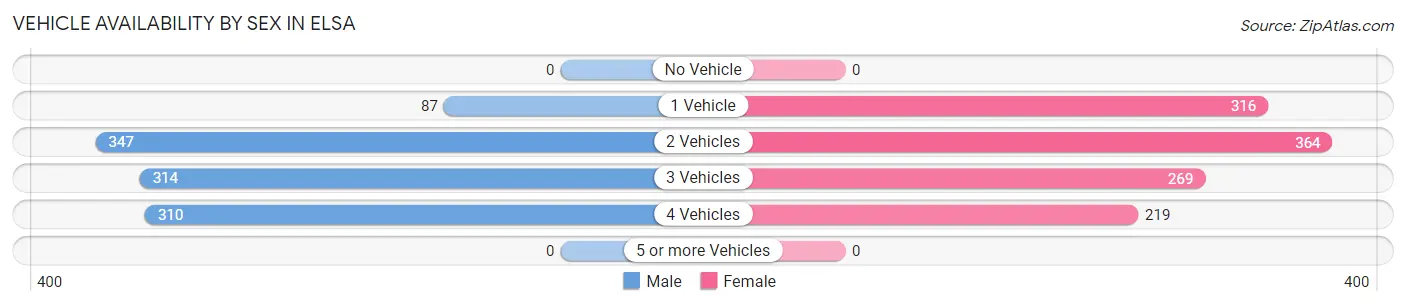
| Vehicles Available | Male | Female |
| No Vehicle | 0 (0.0%) | 0 (0.0%) |
| 1 Vehicle | 87 (8.2%) | 316 (27.1%) |
| 2 Vehicles | 347 (32.8%) | 364 (31.2%) |
| 3 Vehicles | 314 (29.7%) | 269 (23.0%) |
| 4 Vehicles | 310 (29.3%) | 219 (18.8%) |
| 5 or more Vehicles | 0 (0.0%) | 0 (0.0%) |
| Total | 1,058 (100.0%) | 1,168 (100.0%) |
Commute Time in Elsa
The most frequently occuring commute durations in Elsa are 30 to 34 minutes (534 commuters, 25.6%), 15 to 19 minutes (305 commuters, 14.6%), and 5 to 9 minutes (276 commuters, 13.2%).
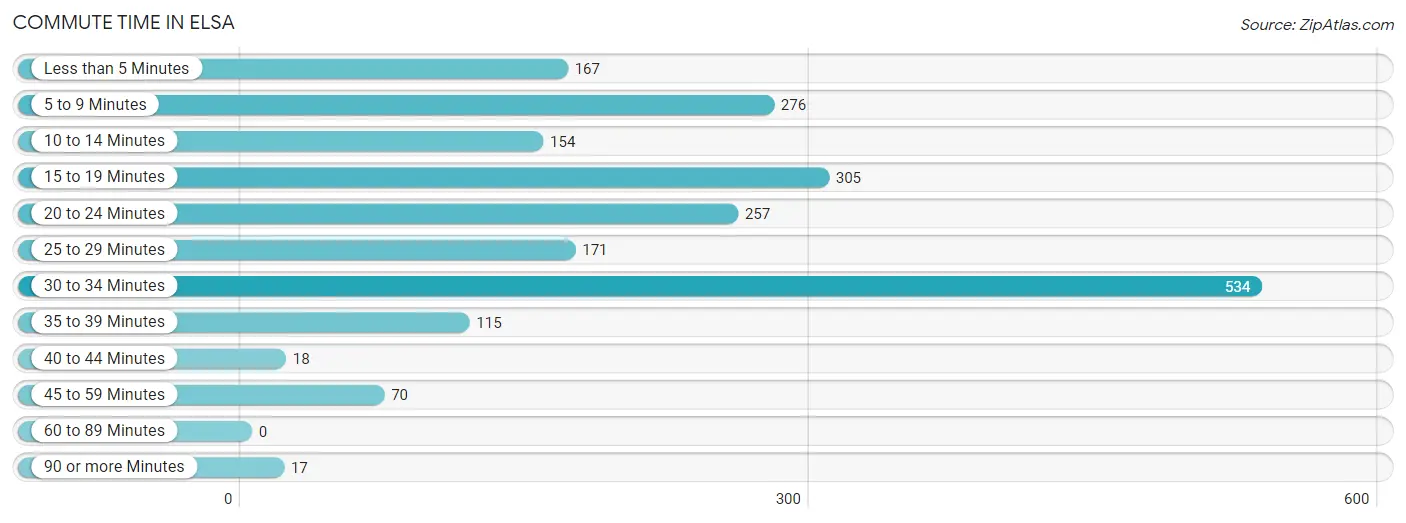
| Commute Time | # Commuters | % Commuters |
| Less than 5 Minutes | 167 | 8.0% |
| 5 to 9 Minutes | 276 | 13.2% |
| 10 to 14 Minutes | 154 | 7.4% |
| 15 to 19 Minutes | 305 | 14.6% |
| 20 to 24 Minutes | 257 | 12.3% |
| 25 to 29 Minutes | 171 | 8.2% |
| 30 to 34 Minutes | 534 | 25.6% |
| 35 to 39 Minutes | 115 | 5.5% |
| 40 to 44 Minutes | 18 | 0.9% |
| 45 to 59 Minutes | 70 | 3.4% |
| 60 to 89 Minutes | 0 | 0.0% |
| 90 or more Minutes | 17 | 0.8% |
Commute Time by Sex in Elsa
The most common commute times in Elsa are 30 to 34 minutes (259 commuters, 26.0%) for males and 30 to 34 minutes (275 commuters, 25.3%) for females.
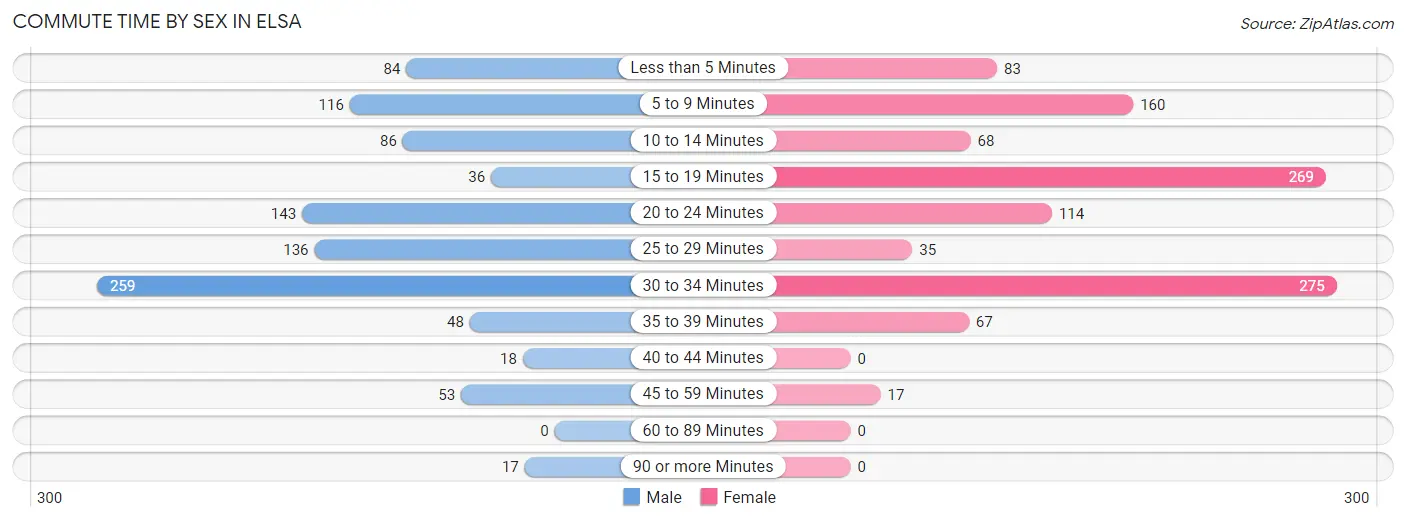
| Commute Time | Male | Female |
| Less than 5 Minutes | 84 (8.4%) | 83 (7.6%) |
| 5 to 9 Minutes | 116 (11.7%) | 160 (14.7%) |
| 10 to 14 Minutes | 86 (8.6%) | 68 (6.2%) |
| 15 to 19 Minutes | 36 (3.6%) | 269 (24.7%) |
| 20 to 24 Minutes | 143 (14.4%) | 114 (10.5%) |
| 25 to 29 Minutes | 136 (13.7%) | 35 (3.2%) |
| 30 to 34 Minutes | 259 (26.0%) | 275 (25.3%) |
| 35 to 39 Minutes | 48 (4.8%) | 67 (6.2%) |
| 40 to 44 Minutes | 18 (1.8%) | 0 (0.0%) |
| 45 to 59 Minutes | 53 (5.3%) | 17 (1.6%) |
| 60 to 89 Minutes | 0 (0.0%) | 0 (0.0%) |
| 90 or more Minutes | 17 (1.7%) | 0 (0.0%) |
Time of Departure to Work by Sex in Elsa
The most frequent times of departure to work in Elsa are 5:30 AM to 5:59 AM (212, 21.3%) for males and 7:30 AM to 7:59 AM (251, 23.1%) for females.
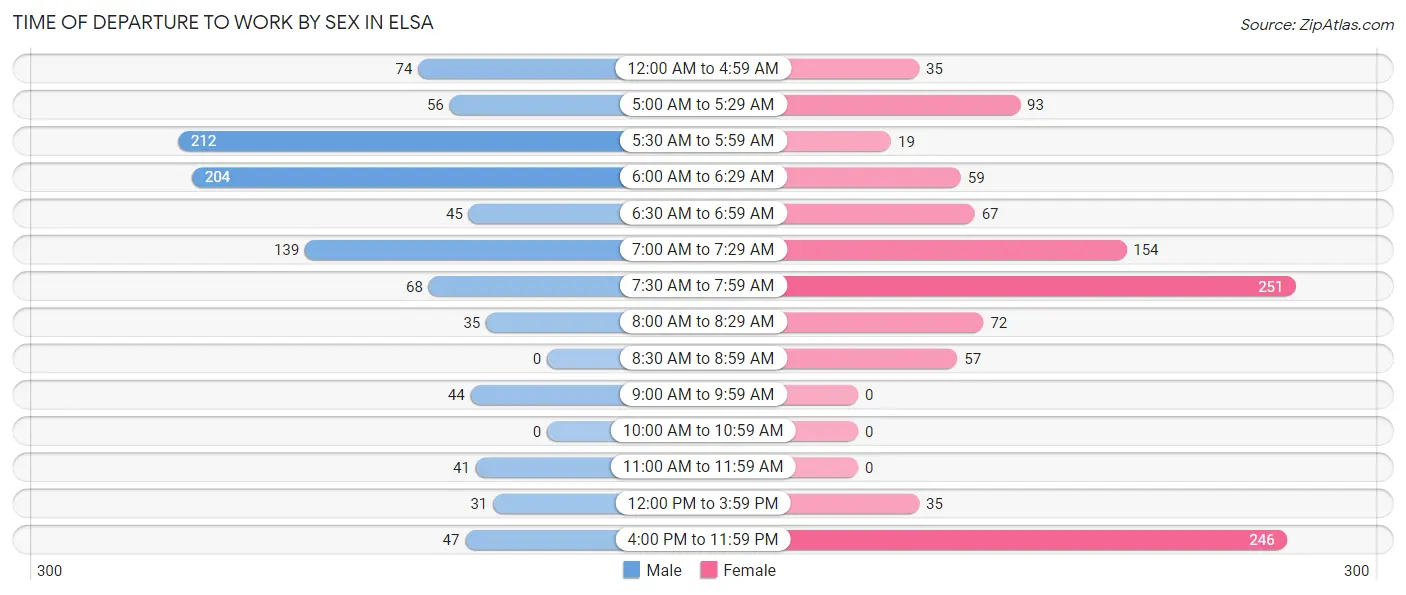
| Time of Departure | Male | Female |
| 12:00 AM to 4:59 AM | 74 (7.4%) | 35 (3.2%) |
| 5:00 AM to 5:29 AM | 56 (5.6%) | 93 (8.6%) |
| 5:30 AM to 5:59 AM | 212 (21.3%) | 19 (1.8%) |
| 6:00 AM to 6:29 AM | 204 (20.5%) | 59 (5.4%) |
| 6:30 AM to 6:59 AM | 45 (4.5%) | 67 (6.2%) |
| 7:00 AM to 7:29 AM | 139 (14.0%) | 154 (14.1%) |
| 7:30 AM to 7:59 AM | 68 (6.8%) | 251 (23.1%) |
| 8:00 AM to 8:29 AM | 35 (3.5%) | 72 (6.6%) |
| 8:30 AM to 8:59 AM | 0 (0.0%) | 57 (5.2%) |
| 9:00 AM to 9:59 AM | 44 (4.4%) | 0 (0.0%) |
| 10:00 AM to 10:59 AM | 0 (0.0%) | 0 (0.0%) |
| 11:00 AM to 11:59 AM | 41 (4.1%) | 0 (0.0%) |
| 12:00 PM to 3:59 PM | 31 (3.1%) | 35 (3.2%) |
| 4:00 PM to 11:59 PM | 47 (4.7%) | 246 (22.6%) |
| Total | 996 (100.0%) | 1,088 (100.0%) |
Housing Occupancy in Elsa
Occupancy by Ownership in Elsa
Of the total 1,922 dwellings in Elsa, owner-occupied units account for 1,423 (74.0%), while renter-occupied units make up 499 (26.0%).
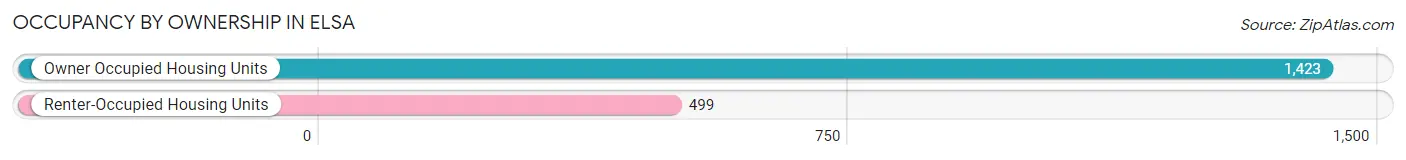
| Occupancy | # Housing Units | % Housing Units |
| Owner Occupied Housing Units | 1,423 | 74.0% |
| Renter-Occupied Housing Units | 499 | 26.0% |
| Total Occupied Housing Units | 1,922 | 100.0% |
Occupancy by Household Size in Elsa
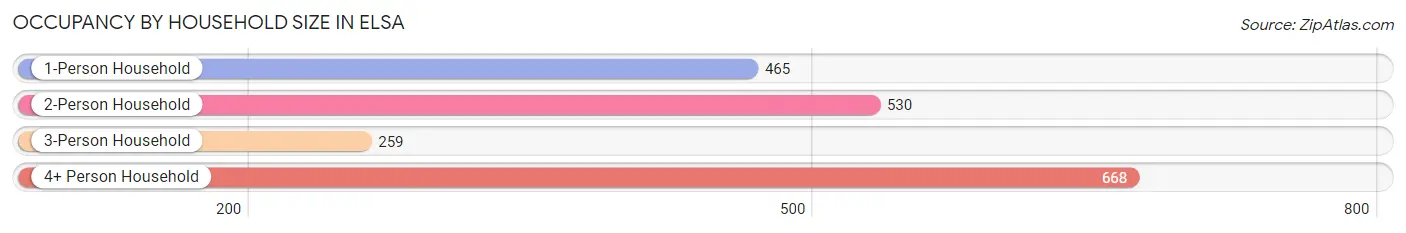
| Household Size | # Housing Units | % Housing Units |
| 1-Person Household | 465 | 24.2% |
| 2-Person Household | 530 | 27.6% |
| 3-Person Household | 259 | 13.5% |
| 4+ Person Household | 668 | 34.8% |
| Total Housing Units | 1,922 | 100.0% |
Occupancy by Ownership by Household Size in Elsa
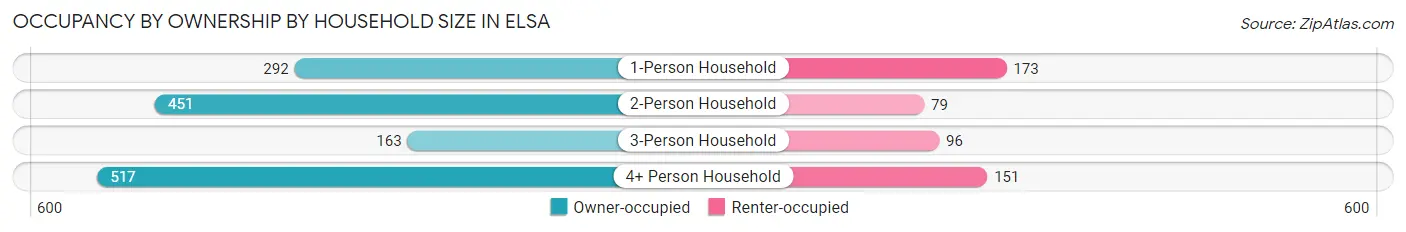
| Household Size | Owner-occupied | Renter-occupied |
| 1-Person Household | 292 (62.8%) | 173 (37.2%) |
| 2-Person Household | 451 (85.1%) | 79 (14.9%) |
| 3-Person Household | 163 (62.9%) | 96 (37.1%) |
| 4+ Person Household | 517 (77.4%) | 151 (22.6%) |
| Total Housing Units | 1,423 (74.0%) | 499 (26.0%) |
Occupancy by Educational Attainment in Elsa
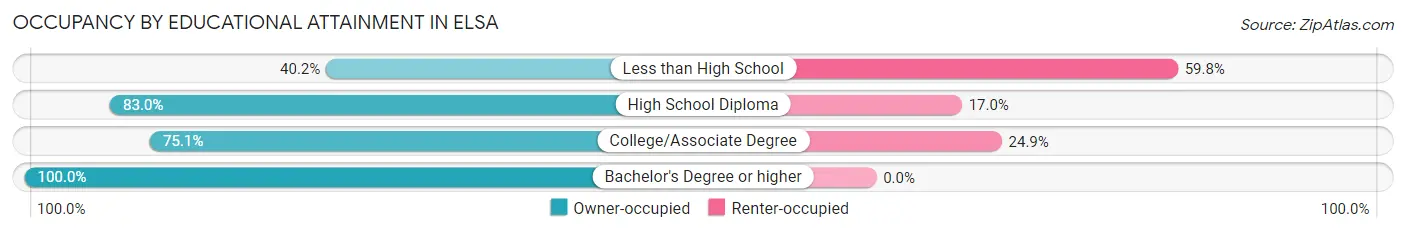
| Household Size | Owner-occupied | Renter-occupied |
| Less than High School | 148 (40.2%) | 220 (59.8%) |
| High School Diploma | 651 (83.0%) | 133 (17.0%) |
| College/Associate Degree | 441 (75.1%) | 146 (24.9%) |
| Bachelor's Degree or higher | 183 (100.0%) | 0 (0.0%) |
Occupancy by Age of Householder in Elsa
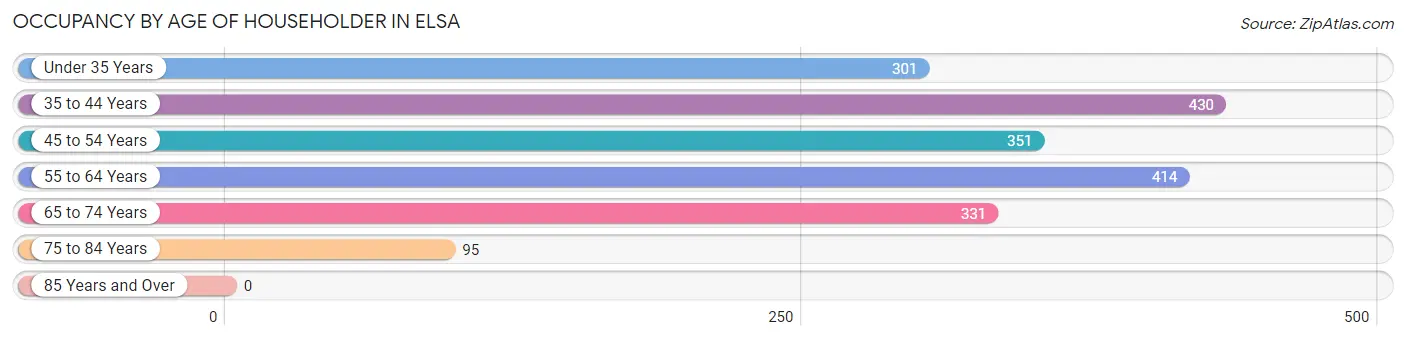
| Age Bracket | # Households | % Households |
| Under 35 Years | 301 | 15.7% |
| 35 to 44 Years | 430 | 22.4% |
| 45 to 54 Years | 351 | 18.3% |
| 55 to 64 Years | 414 | 21.5% |
| 65 to 74 Years | 331 | 17.2% |
| 75 to 84 Years | 95 | 4.9% |
| 85 Years and Over | 0 | 0.0% |
| Total | 1,922 | 100.0% |
Housing Finances in Elsa
Median Income by Occupancy in Elsa
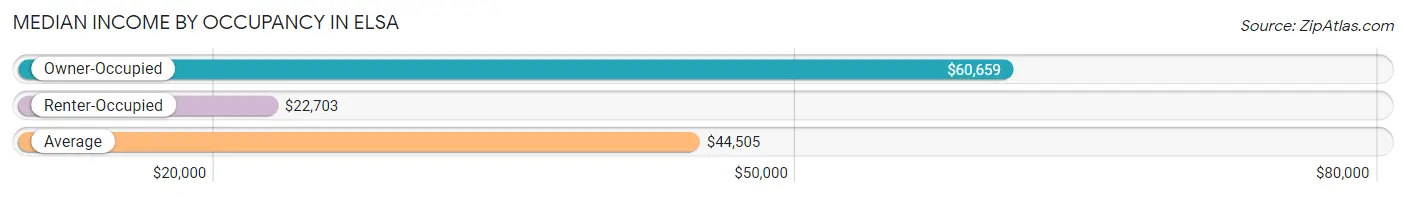
| Occupancy Type | # Households | Median Income |
| Owner-Occupied | 1,423 (74.0%) | $60,659 |
| Renter-Occupied | 499 (26.0%) | $22,703 |
| Average | 1,922 (100.0%) | $44,505 |
Occupancy by Householder Income Bracket in Elsa
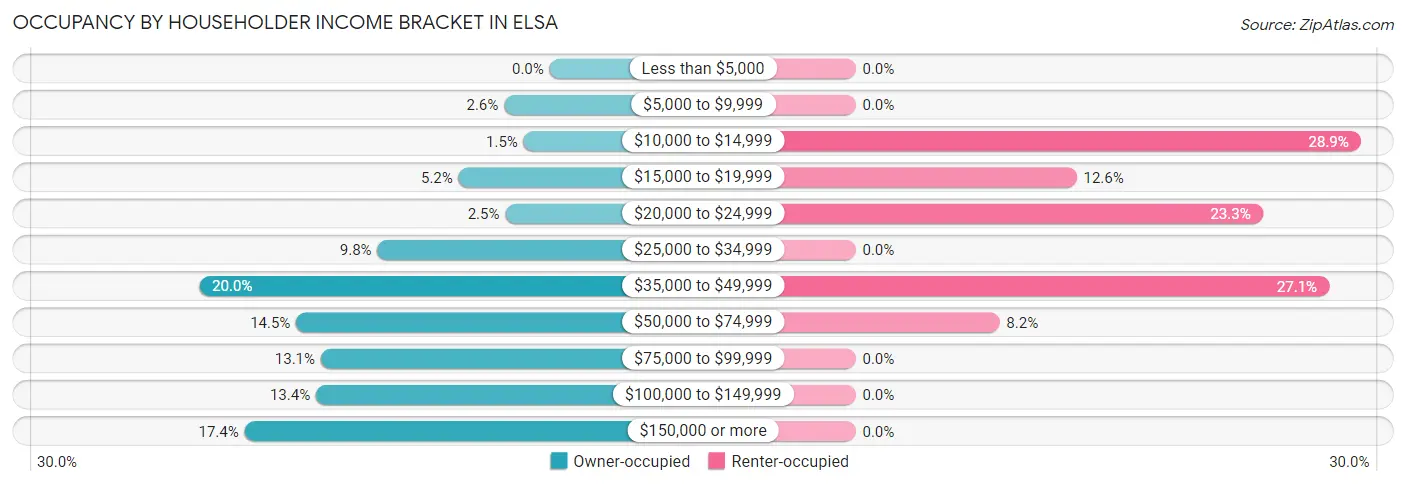
| Income Bracket | Owner-occupied | Renter-occupied |
| Less than $5,000 | 0 (0.0%) | 0 (0.0%) |
| $5,000 to $9,999 | 37 (2.6%) | 0 (0.0%) |
| $10,000 to $14,999 | 21 (1.5%) | 144 (28.9%) |
| $15,000 to $19,999 | 74 (5.2%) | 63 (12.6%) |
| $20,000 to $24,999 | 36 (2.5%) | 116 (23.3%) |
| $25,000 to $34,999 | 140 (9.8%) | 0 (0.0%) |
| $35,000 to $49,999 | 285 (20.0%) | 135 (27.1%) |
| $50,000 to $74,999 | 206 (14.5%) | 41 (8.2%) |
| $75,000 to $99,999 | 186 (13.1%) | 0 (0.0%) |
| $100,000 to $149,999 | 190 (13.4%) | 0 (0.0%) |
| $150,000 or more | 248 (17.4%) | 0 (0.0%) |
| Total | 1,423 (100.0%) | 499 (100.0%) |
Monthly Housing Cost Tiers in Elsa
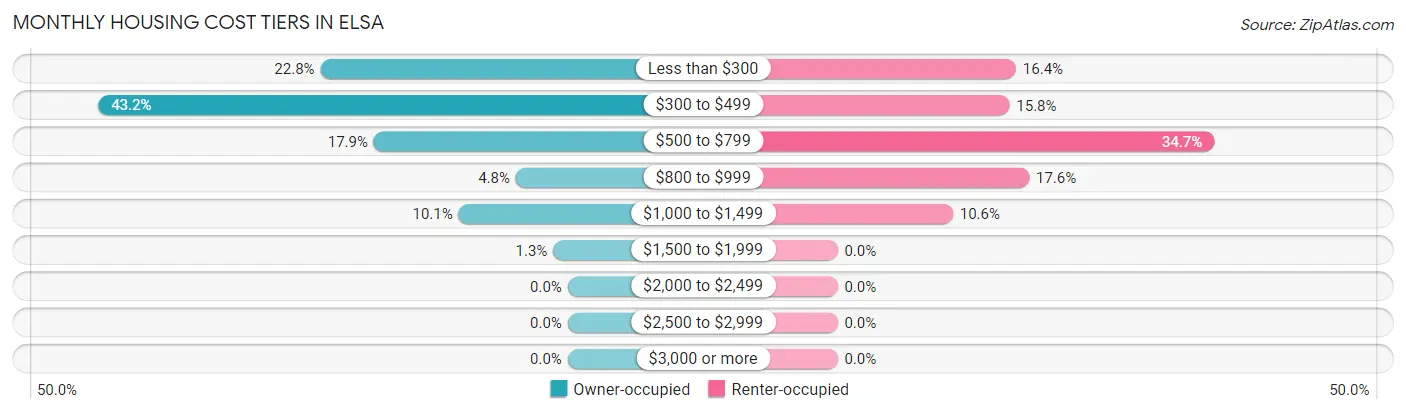
| Monthly Cost | Owner-occupied | Renter-occupied |
| Less than $300 | 324 (22.8%) | 82 (16.4%) |
| $300 to $499 | 615 (43.2%) | 79 (15.8%) |
| $500 to $799 | 254 (17.8%) | 173 (34.7%) |
| $800 to $999 | 68 (4.8%) | 88 (17.6%) |
| $1,000 to $1,499 | 143 (10.1%) | 53 (10.6%) |
| $1,500 to $1,999 | 19 (1.3%) | 0 (0.0%) |
| $2,000 to $2,499 | 0 (0.0%) | 0 (0.0%) |
| $2,500 to $2,999 | 0 (0.0%) | 0 (0.0%) |
| $3,000 or more | 0 (0.0%) | 0 (0.0%) |
| Total | 1,423 (100.0%) | 499 (100.0%) |
Physical Housing Characteristics in Elsa
Housing Structures in Elsa
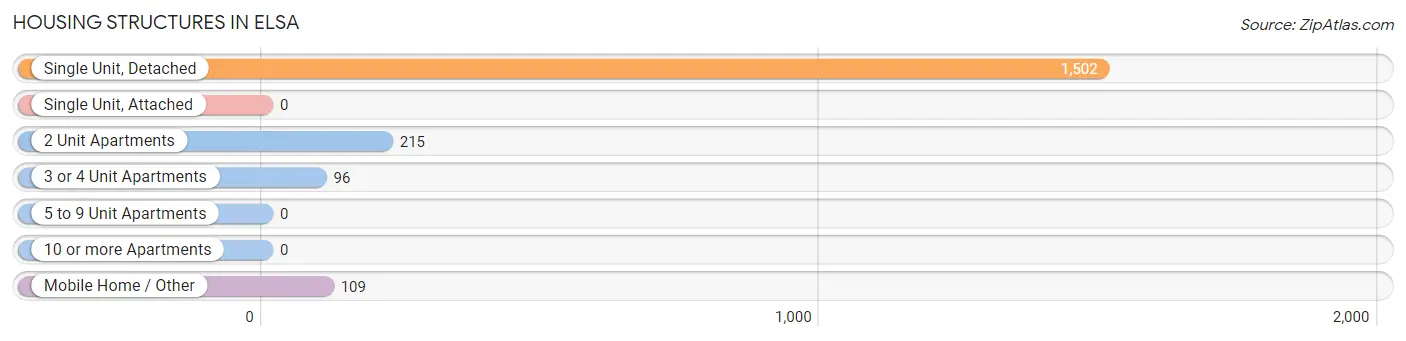
| Structure Type | # Housing Units | % Housing Units |
| Single Unit, Detached | 1,502 | 78.1% |
| Single Unit, Attached | 0 | 0.0% |
| 2 Unit Apartments | 215 | 11.2% |
| 3 or 4 Unit Apartments | 96 | 5.0% |
| 5 to 9 Unit Apartments | 0 | 0.0% |
| 10 or more Apartments | 0 | 0.0% |
| Mobile Home / Other | 109 | 5.7% |
| Total | 1,922 | 100.0% |
Housing Structures by Occupancy in Elsa
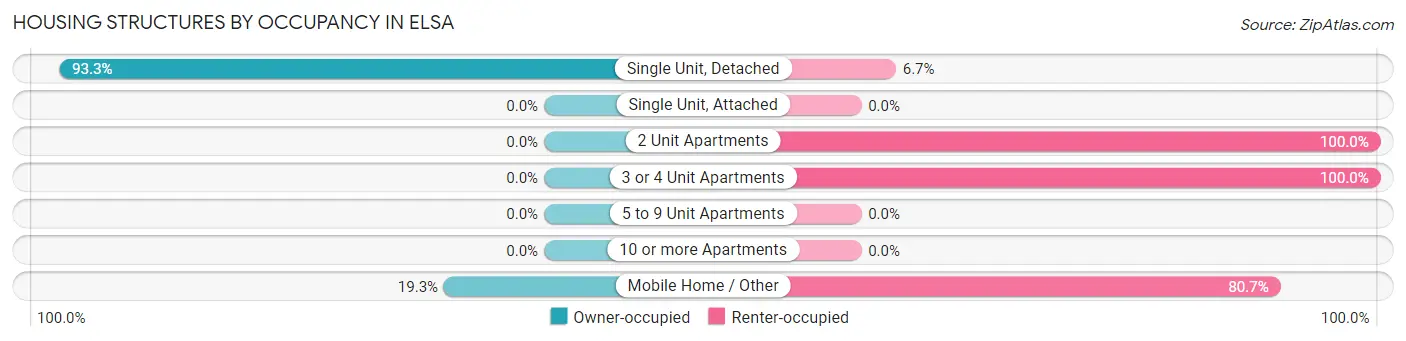
| Structure Type | Owner-occupied | Renter-occupied |
| Single Unit, Detached | 1,402 (93.3%) | 100 (6.7%) |
| Single Unit, Attached | 0 (0.0%) | 0 (0.0%) |
| 2 Unit Apartments | 0 (0.0%) | 215 (100.0%) |
| 3 or 4 Unit Apartments | 0 (0.0%) | 96 (100.0%) |
| 5 to 9 Unit Apartments | 0 (0.0%) | 0 (0.0%) |
| 10 or more Apartments | 0 (0.0%) | 0 (0.0%) |
| Mobile Home / Other | 21 (19.3%) | 88 (80.7%) |
| Total | 1,423 (74.0%) | 499 (26.0%) |
Housing Structures by Number of Rooms in Elsa
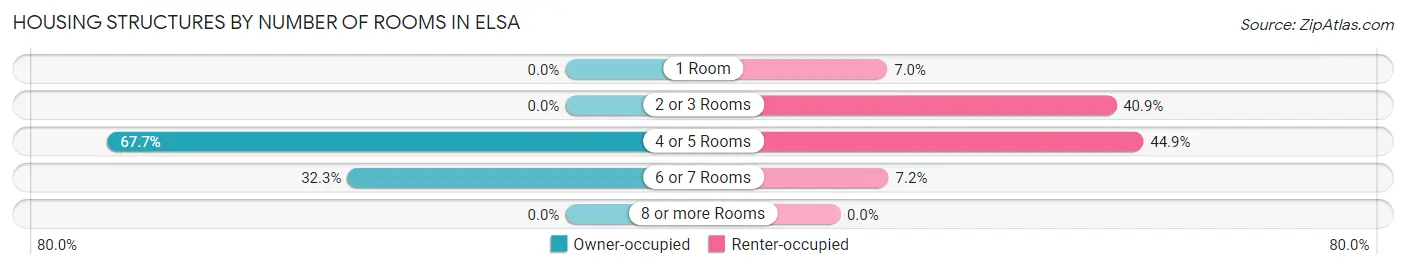
| Number of Rooms | Owner-occupied | Renter-occupied |
| 1 Room | 0 (0.0%) | 35 (7.0%) |
| 2 or 3 Rooms | 0 (0.0%) | 204 (40.9%) |
| 4 or 5 Rooms | 964 (67.7%) | 224 (44.9%) |
| 6 or 7 Rooms | 459 (32.3%) | 36 (7.2%) |
| 8 or more Rooms | 0 (0.0%) | 0 (0.0%) |
| Total | 1,423 (100.0%) | 499 (100.0%) |
Housing Structure by Heating Type in Elsa
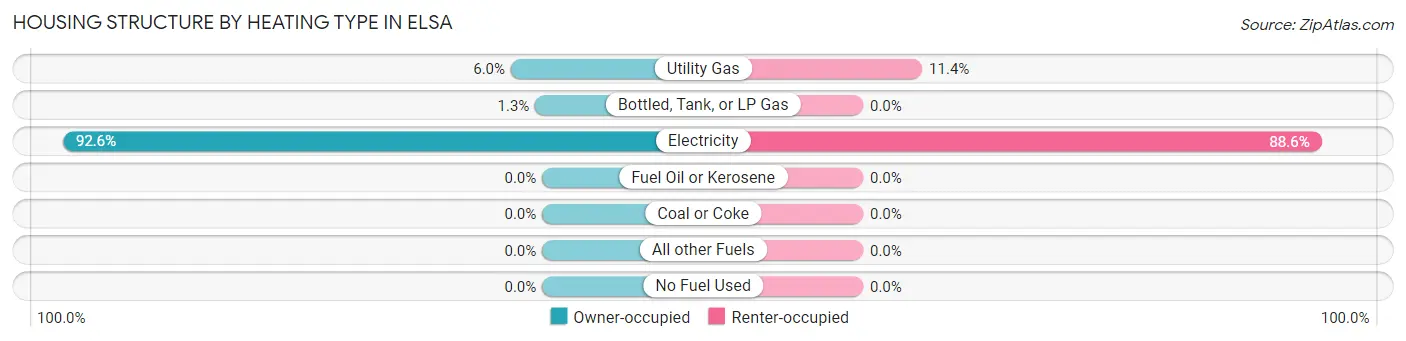
| Heating Type | Owner-occupied | Renter-occupied |
| Utility Gas | 86 (6.0%) | 57 (11.4%) |
| Bottled, Tank, or LP Gas | 19 (1.3%) | 0 (0.0%) |
| Electricity | 1,318 (92.6%) | 442 (88.6%) |
| Fuel Oil or Kerosene | 0 (0.0%) | 0 (0.0%) |
| Coal or Coke | 0 (0.0%) | 0 (0.0%) |
| All other Fuels | 0 (0.0%) | 0 (0.0%) |
| No Fuel Used | 0 (0.0%) | 0 (0.0%) |
| Total | 1,423 (100.0%) | 499 (100.0%) |
Household Vehicle Usage in Elsa
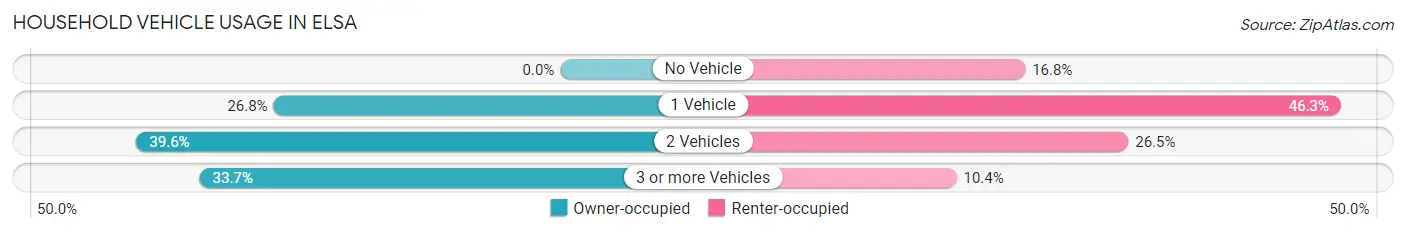
| Vehicles per Household | Owner-occupied | Renter-occupied |
| No Vehicle | 0 (0.0%) | 84 (16.8%) |
| 1 Vehicle | 381 (26.8%) | 231 (46.3%) |
| 2 Vehicles | 563 (39.6%) | 132 (26.5%) |
| 3 or more Vehicles | 479 (33.7%) | 52 (10.4%) |
| Total | 1,423 (100.0%) | 499 (100.0%) |
Real Estate & Mortgages in Elsa
Real Estate and Mortgage Overview in Elsa
| Characteristic | Without Mortgage | With Mortgage |
| Housing Units | 1,193 | 230 |
| Median Property Value | $58,000 | $80,600 |
| Median Household Income | $57,120 | $143 |
| Monthly Housing Costs | $383 | $0 |
| Real Estate Taxes | $1,171 | $0 |
Property Value by Mortgage Status in Elsa
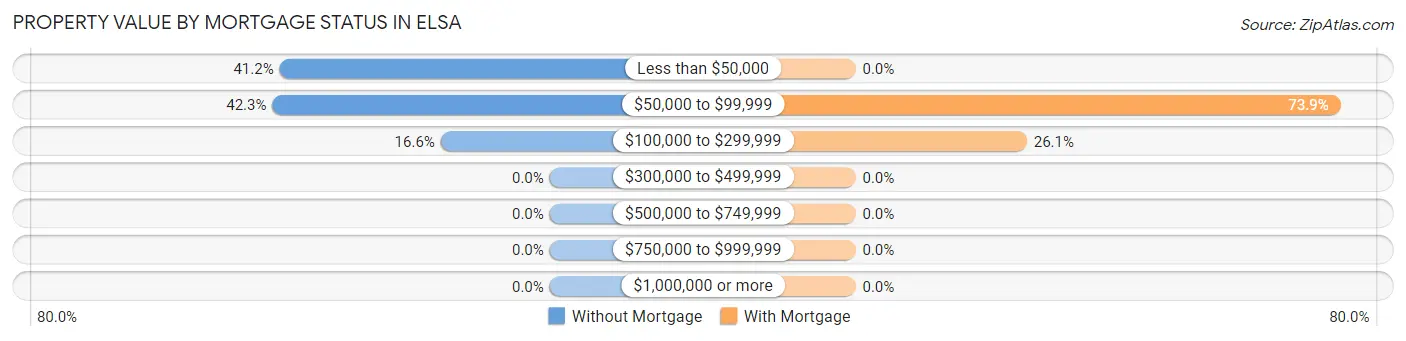
| Property Value | Without Mortgage | With Mortgage |
| Less than $50,000 | 491 (41.2%) | 0 (0.0%) |
| $50,000 to $99,999 | 504 (42.2%) | 170 (73.9%) |
| $100,000 to $299,999 | 198 (16.6%) | 60 (26.1%) |
| $300,000 to $499,999 | 0 (0.0%) | 0 (0.0%) |
| $500,000 to $749,999 | 0 (0.0%) | 0 (0.0%) |
| $750,000 to $999,999 | 0 (0.0%) | 0 (0.0%) |
| $1,000,000 or more | 0 (0.0%) | 0 (0.0%) |
| Total | 1,193 (100.0%) | 230 (100.0%) |
Household Income by Mortgage Status in Elsa
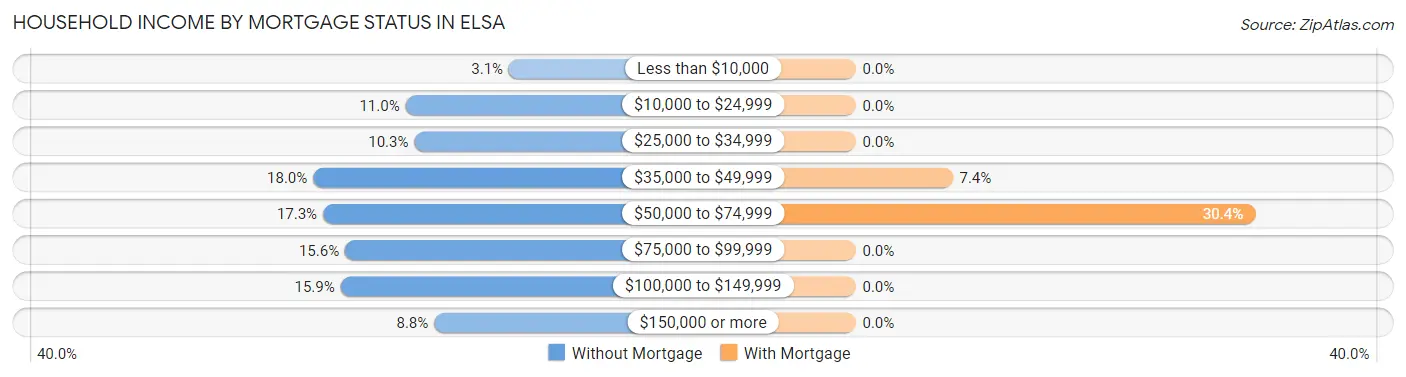
| Household Income | Without Mortgage | With Mortgage |
| Less than $10,000 | 37 (3.1%) | 0 (0.0%) |
| $10,000 to $24,999 | 131 (11.0%) | 0 (0.0%) |
| $25,000 to $34,999 | 123 (10.3%) | 0 (0.0%) |
| $35,000 to $49,999 | 215 (18.0%) | 17 (7.4%) |
| $50,000 to $74,999 | 206 (17.3%) | 70 (30.4%) |
| $75,000 to $99,999 | 186 (15.6%) | 0 (0.0%) |
| $100,000 to $149,999 | 190 (15.9%) | 0 (0.0%) |
| $150,000 or more | 105 (8.8%) | 0 (0.0%) |
| Total | 1,193 (100.0%) | 230 (100.0%) |
Property Value to Household Income Ratio in Elsa
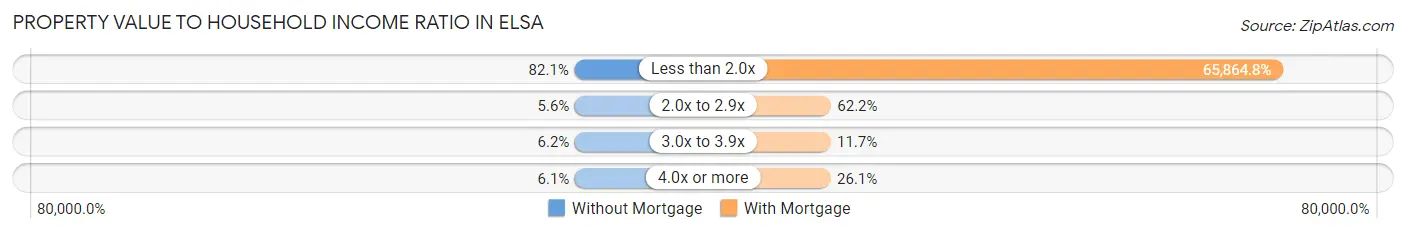
| Value-to-Income Ratio | Without Mortgage | With Mortgage |
| Less than 2.0x | 979 (82.1%) | 151,489 (65,864.8%) |
| 2.0x to 2.9x | 67 (5.6%) | 143 (62.2%) |
| 3.0x to 3.9x | 74 (6.2%) | 27 (11.7%) |
| 4.0x or more | 73 (6.1%) | 60 (26.1%) |
| Total | 1,193 (100.0%) | 230 (100.0%) |
Real Estate Taxes by Mortgage Status in Elsa
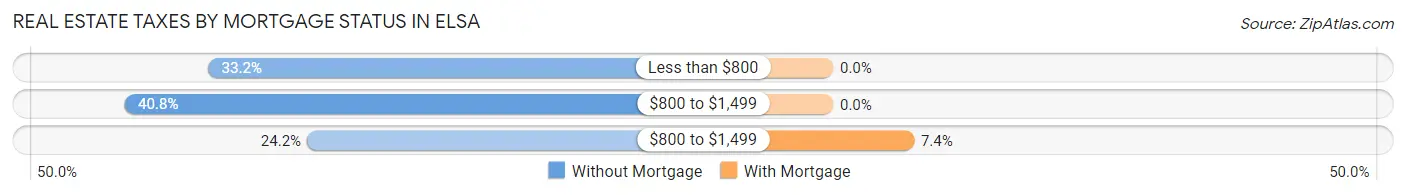
| Property Taxes | Without Mortgage | With Mortgage |
| Less than $800 | 396 (33.2%) | 0 (0.0%) |
| $800 to $1,499 | 487 (40.8%) | 0 (0.0%) |
| $800 to $1,499 | 289 (24.2%) | 17 (7.4%) |
| Total | 1,193 (100.0%) | 230 (100.0%) |
Health & Disability in Elsa
Health Insurance Coverage by Age in Elsa
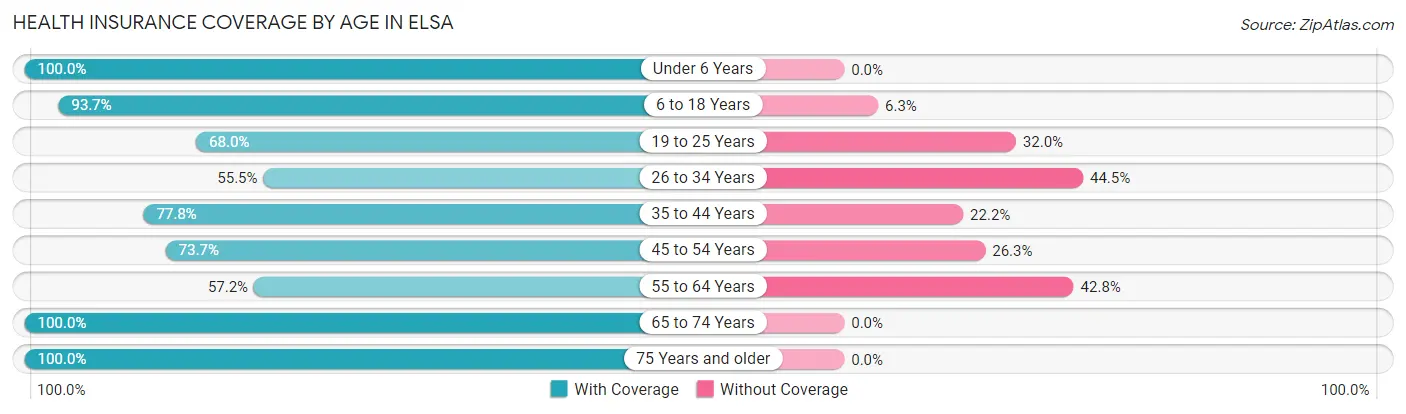
| Age Bracket | With Coverage | Without Coverage |
| Under 6 Years | 545 (100.0%) | 0 (0.0%) |
| 6 to 18 Years | 1,146 (93.7%) | 77 (6.3%) |
| 19 to 25 Years | 476 (68.0%) | 224 (32.0%) |
| 26 to 34 Years | 238 (55.5%) | 191 (44.5%) |
| 35 to 44 Years | 502 (77.8%) | 143 (22.2%) |
| 45 to 54 Years | 608 (73.7%) | 217 (26.3%) |
| 55 to 64 Years | 360 (57.2%) | 269 (42.8%) |
| 65 to 74 Years | 590 (100.0%) | 0 (0.0%) |
| 75 Years and older | 135 (100.0%) | 0 (0.0%) |
| Total | 4,600 (80.4%) | 1,121 (19.6%) |
Health Insurance Coverage by Citizenship Status in Elsa
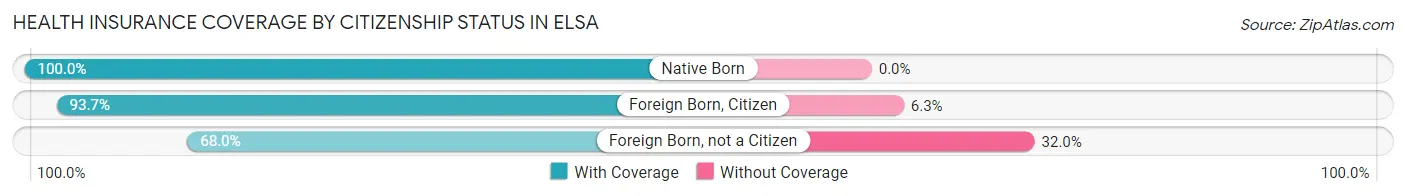
| Citizenship Status | With Coverage | Without Coverage |
| Native Born | 545 (100.0%) | 0 (0.0%) |
| Foreign Born, Citizen | 1,146 (93.7%) | 77 (6.3%) |
| Foreign Born, not a Citizen | 476 (68.0%) | 224 (32.0%) |
Health Insurance Coverage by Household Income in Elsa
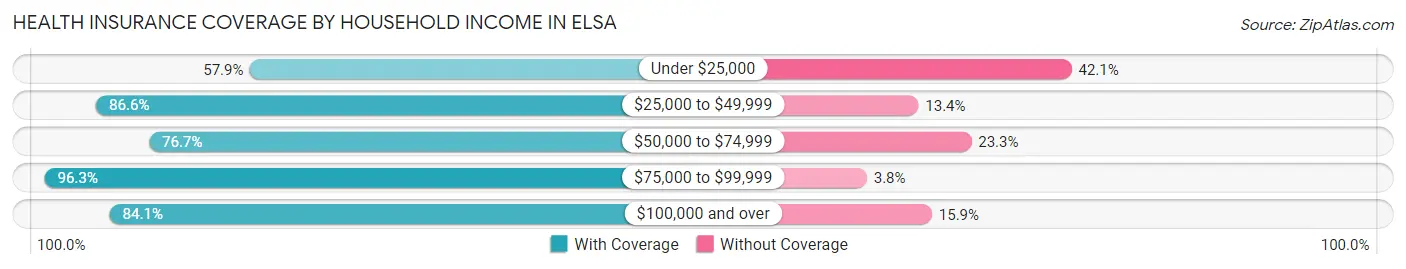
| Household Income | With Coverage | Without Coverage |
| Under $25,000 | 619 (57.9%) | 450 (42.1%) |
| $25,000 to $49,999 | 1,363 (86.6%) | 211 (13.4%) |
| $50,000 to $74,999 | 559 (76.7%) | 170 (23.3%) |
| $75,000 to $99,999 | 667 (96.3%) | 26 (3.7%) |
| $100,000 and over | 1,392 (84.1%) | 264 (15.9%) |
Public vs Private Health Insurance Coverage by Age in Elsa
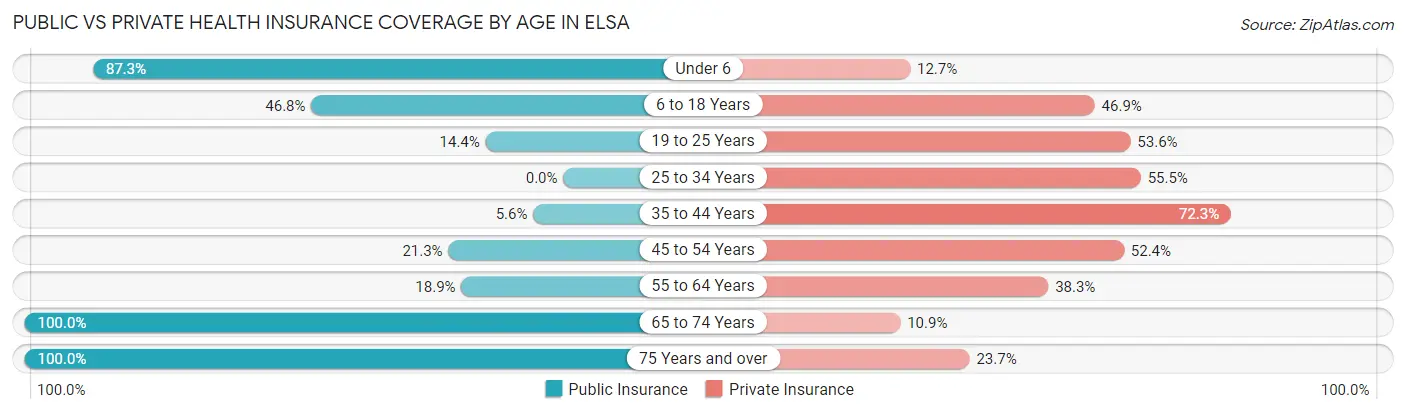
| Age Bracket | Public Insurance | Private Insurance |
| Under 6 | 476 (87.3%) | 69 (12.7%) |
| 6 to 18 Years | 572 (46.8%) | 574 (46.9%) |
| 19 to 25 Years | 101 (14.4%) | 375 (53.6%) |
| 25 to 34 Years | 0 (0.0%) | 238 (55.5%) |
| 35 to 44 Years | 36 (5.6%) | 466 (72.3%) |
| 45 to 54 Years | 176 (21.3%) | 432 (52.4%) |
| 55 to 64 Years | 119 (18.9%) | 241 (38.3%) |
| 65 to 74 Years | 590 (100.0%) | 64 (10.8%) |
| 75 Years and over | 135 (100.0%) | 32 (23.7%) |
| Total | 2,205 (38.5%) | 2,491 (43.5%) |
Disability Status by Sex by Age in Elsa
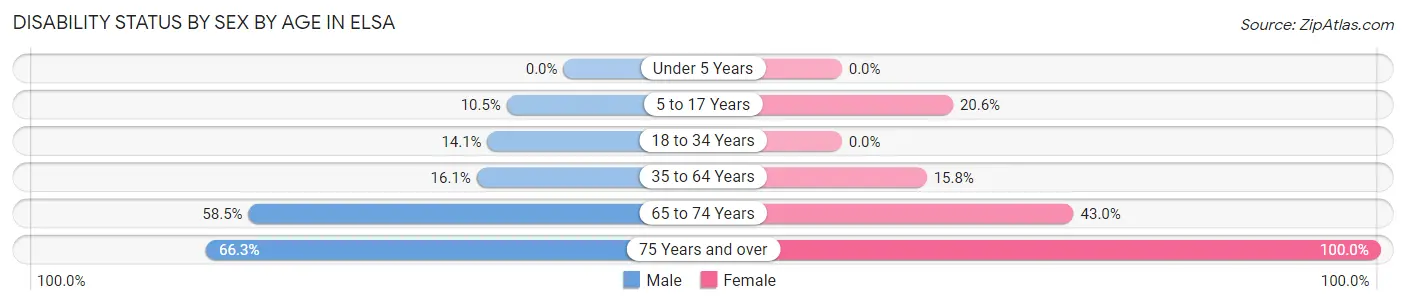
| Age Bracket | Male | Female |
| Under 5 Years | 0 (0.0%) | 0 (0.0%) |
| 5 to 17 Years | 85 (10.5%) | 92 (20.6%) |
| 18 to 34 Years | 52 (14.1%) | 0 (0.0%) |
| 35 to 64 Years | 158 (16.1%) | 176 (15.8%) |
| 65 to 74 Years | 152 (58.5%) | 142 (43.0%) |
| 75 Years and over | 63 (66.3%) | 40 (100.0%) |
Disability Class by Sex by Age in Elsa
Disability Class: Hearing Difficulty
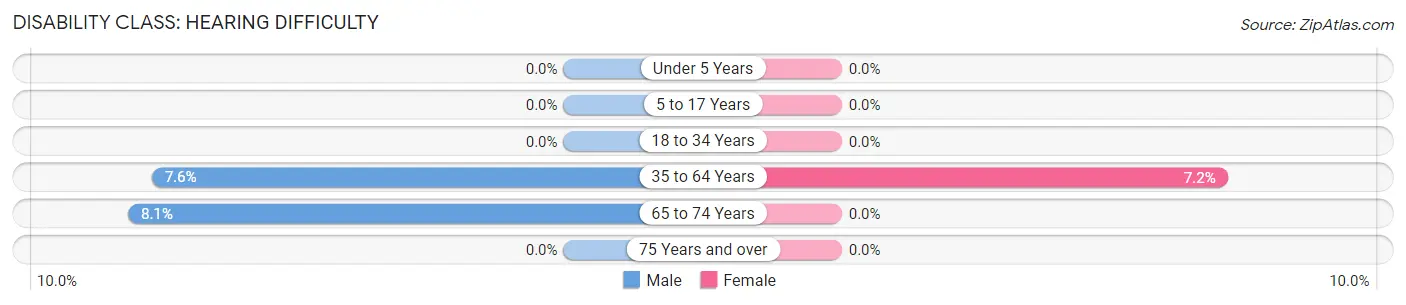
| Age Bracket | Male | Female |
| Under 5 Years | 0 (0.0%) | 0 (0.0%) |
| 5 to 17 Years | 0 (0.0%) | 0 (0.0%) |
| 18 to 34 Years | 0 (0.0%) | 0 (0.0%) |
| 35 to 64 Years | 75 (7.6%) | 80 (7.2%) |
| 65 to 74 Years | 21 (8.1%) | 0 (0.0%) |
| 75 Years and over | 0 (0.0%) | 0 (0.0%) |
Disability Class: Vision Difficulty
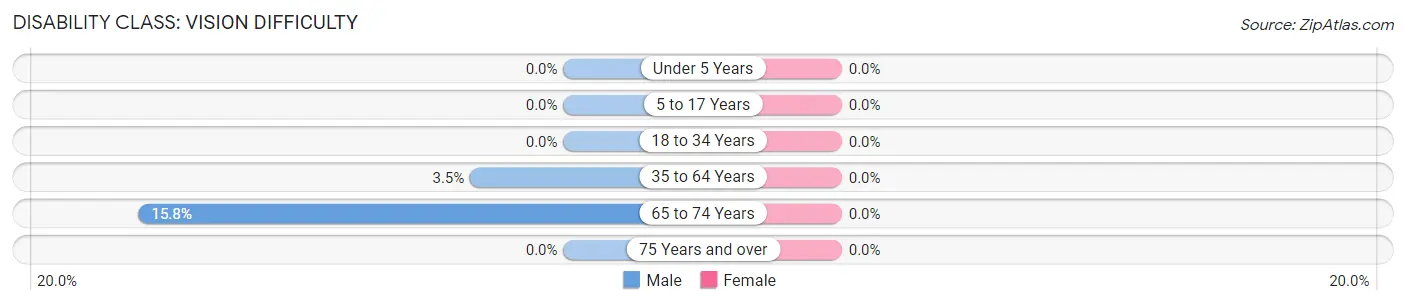
| Age Bracket | Male | Female |
| Under 5 Years | 0 (0.0%) | 0 (0.0%) |
| 5 to 17 Years | 0 (0.0%) | 0 (0.0%) |
| 18 to 34 Years | 0 (0.0%) | 0 (0.0%) |
| 35 to 64 Years | 34 (3.5%) | 0 (0.0%) |
| 65 to 74 Years | 41 (15.8%) | 0 (0.0%) |
| 75 Years and over | 0 (0.0%) | 0 (0.0%) |
Disability Class: Cognitive Difficulty
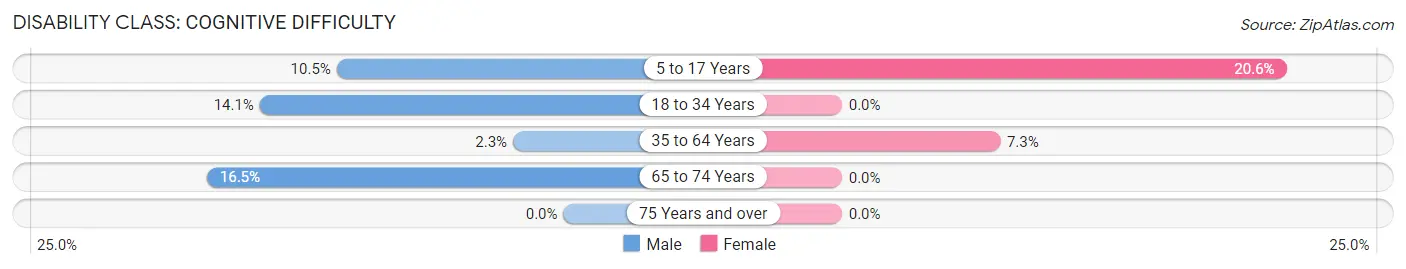
| Age Bracket | Male | Female |
| 5 to 17 Years | 85 (10.5%) | 92 (20.6%) |
| 18 to 34 Years | 52 (14.1%) | 0 (0.0%) |
| 35 to 64 Years | 23 (2.3%) | 82 (7.3%) |
| 65 to 74 Years | 43 (16.5%) | 0 (0.0%) |
| 75 Years and over | 0 (0.0%) | 0 (0.0%) |
Disability Class: Ambulatory Difficulty
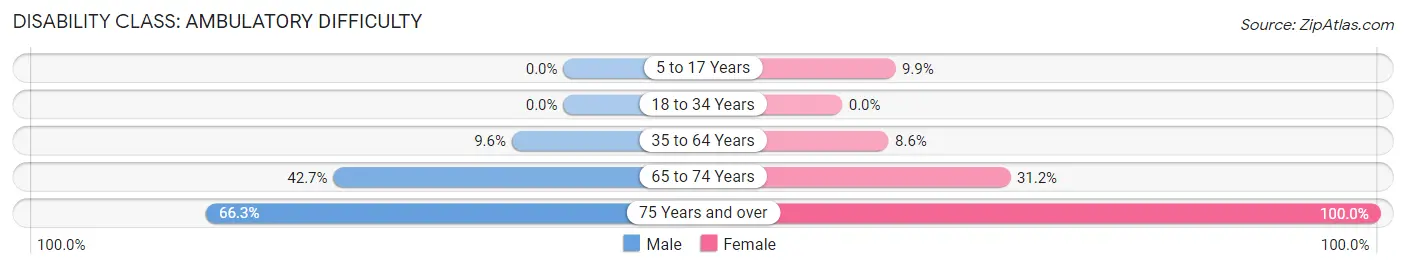
| Age Bracket | Male | Female |
| 5 to 17 Years | 0 (0.0%) | 44 (9.9%) |
| 18 to 34 Years | 0 (0.0%) | 0 (0.0%) |
| 35 to 64 Years | 94 (9.6%) | 96 (8.6%) |
| 65 to 74 Years | 111 (42.7%) | 103 (31.2%) |
| 75 Years and over | 63 (66.3%) | 40 (100.0%) |
Disability Class: Self-Care Difficulty
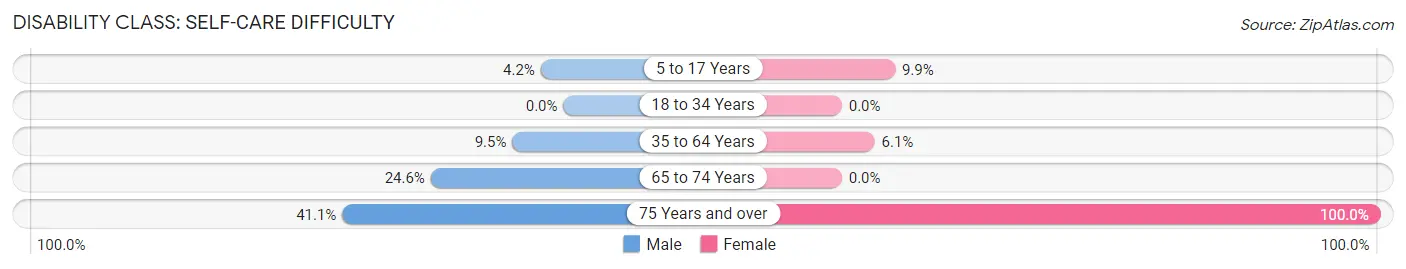
| Age Bracket | Male | Female |
| 5 to 17 Years | 34 (4.2%) | 44 (9.9%) |
| 18 to 34 Years | 0 (0.0%) | 0 (0.0%) |
| 35 to 64 Years | 93 (9.5%) | 68 (6.1%) |
| 65 to 74 Years | 64 (24.6%) | 0 (0.0%) |
| 75 Years and over | 39 (41.0%) | 40 (100.0%) |
Technology Access in Elsa
Computing Device Access in Elsa
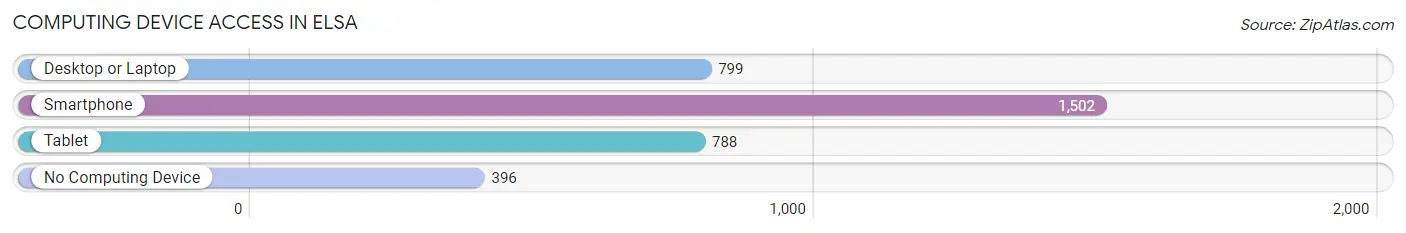
| Device Type | # Households | % Households |
| Desktop or Laptop | 799 | 41.6% |
| Smartphone | 1,502 | 78.1% |
| Tablet | 788 | 41.0% |
| No Computing Device | 396 | 20.6% |
| Total | 1,922 | 100.0% |
Internet Access in Elsa
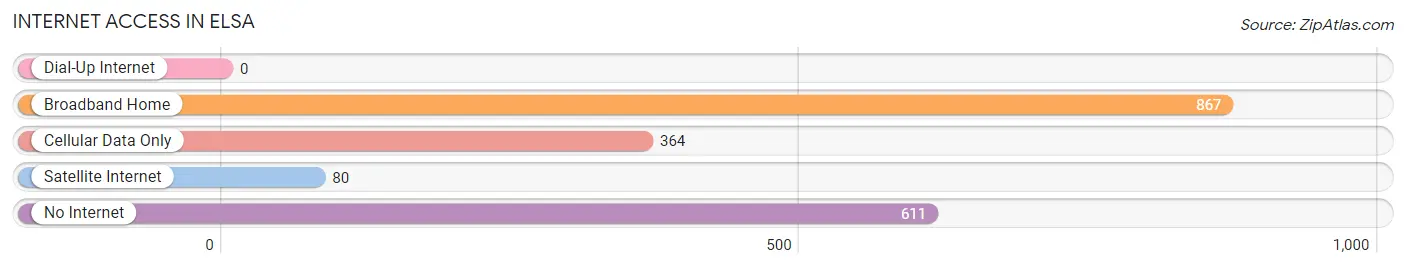
| Internet Type | # Households | % Households |
| Dial-Up Internet | 0 | 0.0% |
| Broadband Home | 867 | 45.1% |
| Cellular Data Only | 364 | 18.9% |
| Satellite Internet | 80 | 4.2% |
| No Internet | 611 | 31.8% |
| Total | 1,922 | 100.0% |
Elsa Summary
Elsa is a city located in Hidalgo County, Texas, United States. It is part of the McAllen–Edinburg–Mission Metropolitan Statistical Area. The population was estimated to be 17,817 in 2019.
Geography
Elsa is located at 26°10'17" North, 97°59'17" West (26.171445, -97.988106). It is situated at an elevation of approximately 50 feet (15 m) above sea level.
The city is located in the Rio Grande Valley, a region of south Texas that is known for its fertile soil and warm climate. The city is bordered by the cities of Edinburg to the north, McAllen to the east, and Pharr to the south.
History
The area that is now Elsa was originally inhabited by the Coahuiltecan Indians. The first European settlers arrived in the area in the late 19th century. The city was founded in 1910 and was named after Elsa, the daughter of one of the first settlers.
In the early 20th century, Elsa was a small farming community. The population grew steadily throughout the century, and by the 1990s, the city had become a bedroom community for the larger cities of McAllen and Edinburg.
Economy
Elsa’s economy is largely based on agriculture and tourism. The city is home to several large farms that produce a variety of crops, including cotton, corn, sorghum, and vegetables.
The city is also home to several manufacturing companies, including a plastics factory and a furniture factory. In addition, Elsa is home to several retail stores, restaurants, and other businesses.
Demographics
As of the 2010 census, the population of Elsa was 16,413. The racial makeup of the city was 79.2% Hispanic or Latino, 17.2% White, 0.7% African American, 0.3% Native American, 0.2% Asian, and 2.6% from other races.
The median household income in Elsa was $25,945 in 2019, and the median home value was $90,000. The city has a poverty rate of 28.3%.
Conclusion
Elsa is a small city located in Hidalgo County, Texas. It is part of the McAllen–Edinburg–Mission Metropolitan Statistical Area. The city has a population of 17,817 and is known for its agricultural economy and warm climate. The city is home to several large farms, manufacturing companies, and retail stores. The population of Elsa is largely Hispanic or Latino, and the median household income is $25,945.
Common Questions
What is Per Capita Income in Elsa?
Per Capita income in Elsa is $23,203.
What is the Median Family Income in Elsa?
Median Family Income in Elsa is $52,179.
What is the Median Household income in Elsa?
Median Household Income in Elsa is $44,505.
What is Income or Wage Gap in Elsa?
Income or Wage Gap in Elsa is 42.0%.
Women in Elsa earn 58.0 cents for every dollar earned by a man.
What is Inequality or Gini Index in Elsa?
Inequality or Gini Index in Elsa is 0.45.
What is the Total Population of Elsa?
Total Population of Elsa is 5,721.
What is the Total Male Population of Elsa?
Total Male Population of Elsa is 2,769.
What is the Total Female Population of Elsa?
Total Female Population of Elsa is 2,952.
What is the Ratio of Males per 100 Females in Elsa?
There are 93.80 Males per 100 Females in Elsa.
What is the Ratio of Females per 100 Males in Elsa?
There are 106.61 Females per 100 Males in Elsa.
What is the Median Population Age in Elsa?
Median Population Age in Elsa is 34.6 Years.
What is the Average Family Size in Elsa
Average Family Size in Elsa is 3.5 People.
What is the Average Household Size in Elsa
Average Household Size in Elsa is 3.0 People.
How Large is the Labor Force in Elsa?
There are 2,392 People in the Labor Forcein in Elsa.
What is the Percentage of People in the Labor Force in Elsa?
56.0% of People are in the Labor Force in Elsa.
What is the Unemployment Rate in Elsa?
Unemployment Rate in Elsa is 2.8%.