Edna, TX Map & Demographics
Edna Map
Edna Overview
$24,868
PER CAPITA INCOME
$66,400
AVG FAMILY INCOME
$60,361
AVG HOUSEHOLD INCOME
58.2%
WAGE / INCOME GAP [ % ]
41.8¢/ $1
WAGE / INCOME GAP [ $ ]
$7,654
FAMILY INCOME DEFICIT
0.41
INEQUALITY / GINI INDEX
5,985
TOTAL POPULATION
2,885
MALE POPULATION
3,100
FEMALE POPULATION
93.06
MALES / 100 FEMALES
107.45
FEMALES / 100 MALES
38.3
MEDIAN AGE
3.3
AVG FAMILY SIZE
2.9
AVG HOUSEHOLD SIZE
2,559
LABOR FORCE [ PEOPLE ]
55.3%
PERCENT IN LABOR FORCE
7.3%
UNEMPLOYMENT RATE
Edna Zip Codes
Edna Area Codes
Income in Edna
Income Overview in Edna
Per Capita Income in Edna is $24,868, while median incomes of families and households are $66,400 and $60,361 respectively.
| Characteristic | Number | Measure |
| Per Capita Income | 5,985 | $24,868 |
| Median Family Income | 1,532 | $66,400 |
| Mean Family Income | 1,532 | $76,163 |
| Median Household Income | 2,003 | $60,361 |
| Mean Household Income | 2,003 | $70,048 |
| Income Deficit | 1,532 | $7,654 |
| Wage / Income Gap (%) | 5,985 | 58.16% |
| Wage / Income Gap ($) | 5,985 | 41.84¢ per $1 |
| Gini / Inequality Index | 5,985 | 0.41 |
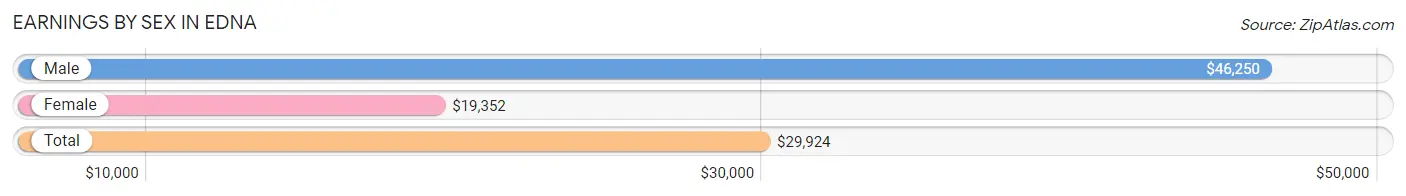
Earnings by Sex in Edna
Average Earnings in Edna are $29,924, $46,250 for men and $19,352 for women, a difference of 58.2%.
| Sex | Number | Average Earnings |
| Male | 1,377 (50.0%) | $46,250 |
| Female | 1,374 (49.9%) | $19,352 |
| Total | 2,751 (100.0%) | $29,924 |
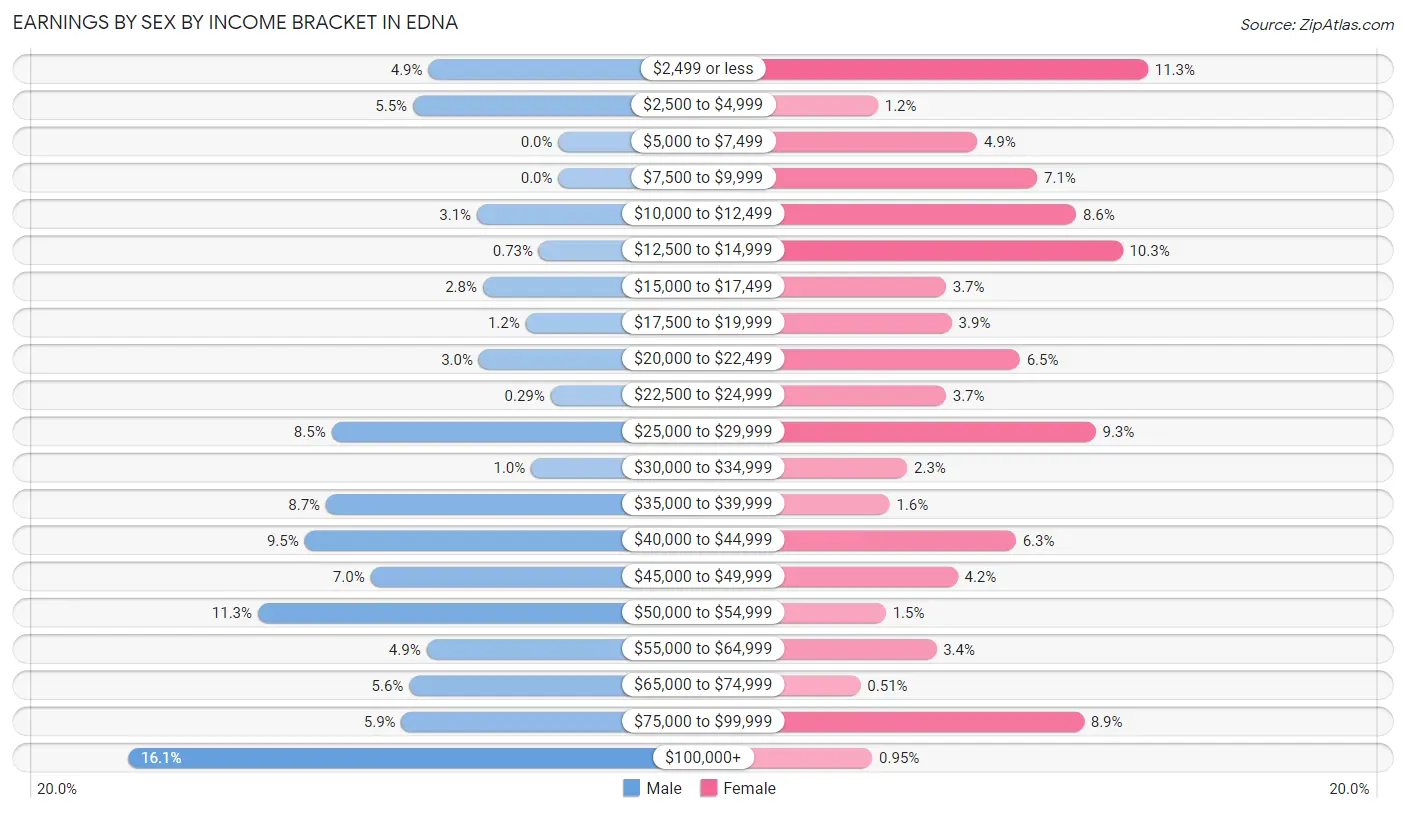
Earnings by Sex by Income Bracket in Edna
The most common earnings brackets in Edna are $100,000+ for men (222 | 16.1%) and $2,499 or less for women (155 | 11.3%).
| Income | Male | Female |
| $2,499 or less | 67 (4.9%) | 155 (11.3%) |
| $2,500 to $4,999 | 75 (5.4%) | 16 (1.2%) |
| $5,000 to $7,499 | 0 (0.0%) | 67 (4.9%) |
| $7,500 to $9,999 | 0 (0.0%) | 98 (7.1%) |
| $10,000 to $12,499 | 42 (3.0%) | 118 (8.6%) |
| $12,500 to $14,999 | 10 (0.7%) | 142 (10.3%) |
| $15,000 to $17,499 | 39 (2.8%) | 51 (3.7%) |
| $17,500 to $19,999 | 17 (1.2%) | 54 (3.9%) |
| $20,000 to $22,499 | 41 (3.0%) | 89 (6.5%) |
| $22,500 to $24,999 | 4 (0.3%) | 51 (3.7%) |
| $25,000 to $29,999 | 117 (8.5%) | 128 (9.3%) |
| $30,000 to $34,999 | 14 (1.0%) | 31 (2.3%) |
| $35,000 to $39,999 | 120 (8.7%) | 22 (1.6%) |
| $40,000 to $44,999 | 131 (9.5%) | 87 (6.3%) |
| $45,000 to $49,999 | 97 (7.0%) | 57 (4.2%) |
| $50,000 to $54,999 | 155 (11.3%) | 20 (1.5%) |
| $55,000 to $64,999 | 68 (4.9%) | 46 (3.4%) |
| $65,000 to $74,999 | 77 (5.6%) | 7 (0.5%) |
| $75,000 to $99,999 | 81 (5.9%) | 122 (8.9%) |
| $100,000+ | 222 (16.1%) | 13 (0.9%) |
| Total | 1,377 (100.0%) | 1,374 (100.0%) |
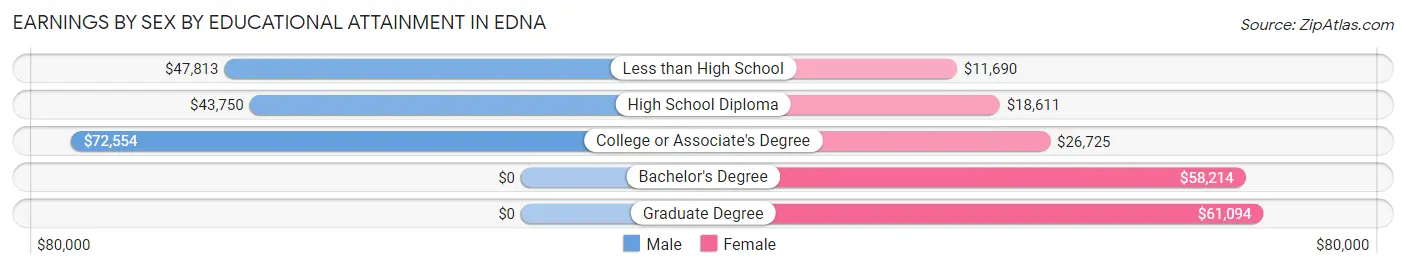
Earnings by Sex by Educational Attainment in Edna
Average earnings in Edna are $49,240 for men and $22,078 for women, a difference of 55.2%. Men with an educational attainment of college or associate's degree enjoy the highest average annual earnings of $72,554, while those with high school diploma education earn the least with $43,750. Women with an educational attainment of graduate degree earn the most with the average annual earnings of $61,094, while those with less than high school education have the smallest earnings of $11,690.
| Educational Attainment | Male Income | Female Income |
| Less than High School | $47,813 | $11,690 |
| High School Diploma | $43,750 | $18,611 |
| College or Associate's Degree | $72,554 | $26,725 |
| Bachelor's Degree | - | - |
| Graduate Degree | - | - |
| Total | $49,240 | $22,078 |
Family Income in Edna
Family Income Brackets in Edna
According to the Edna family income data, there are 352 families falling into the $50,000 to $74,999 income range, which is the most common income bracket and makes up 23.0% of all families. Conversely, the less than $10,000 income bracket is the least frequent group with only 34 families (2.2%) belonging to this category.
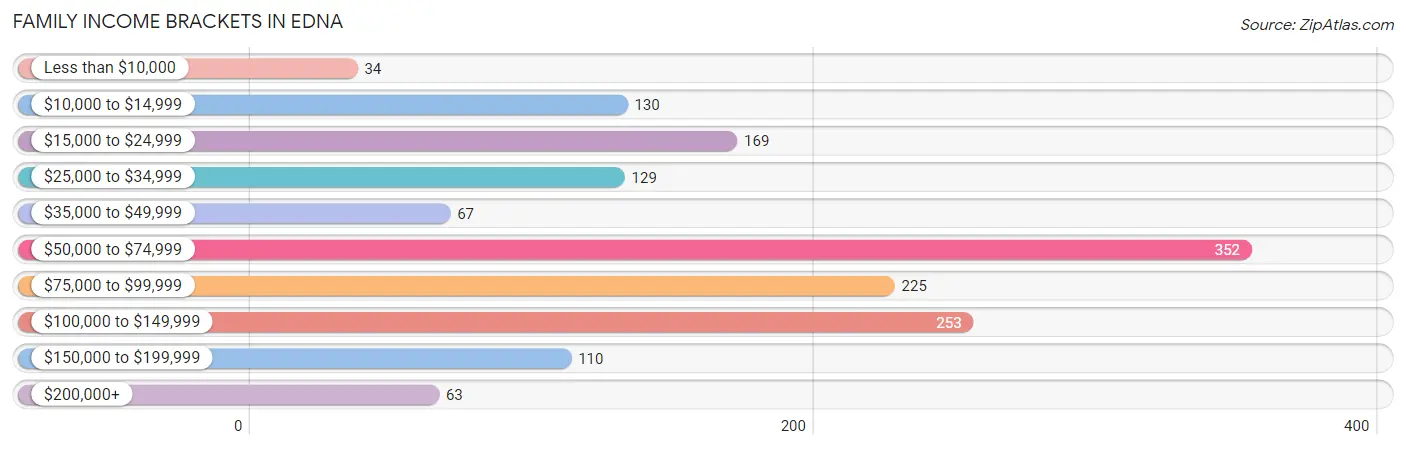
| Income Bracket | # Families | % Families |
| Less than $10,000 | 34 | 2.2% |
| $10,000 to $14,999 | 130 | 8.5% |
| $15,000 to $24,999 | 169 | 11.0% |
| $25,000 to $34,999 | 129 | 8.4% |
| $35,000 to $49,999 | 67 | 4.4% |
| $50,000 to $74,999 | 352 | 23.0% |
| $75,000 to $99,999 | 225 | 14.7% |
| $100,000 to $149,999 | 253 | 16.5% |
| $150,000 to $199,999 | 110 | 7.2% |
| $200,000+ | 63 | 4.1% |
Family Income by Famaliy Size in Edna
4-person families (337 | 22.0%) account for the highest median family income in Edna with $84,728 per family, while 2-person families (711 | 46.4%) have the highest median income of $30,097 per family member.
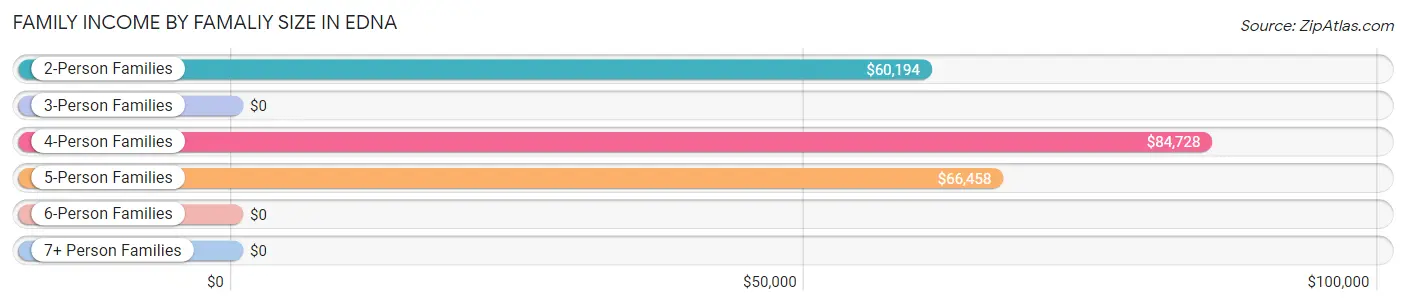
| Income Bracket | # Families | Median Income |
| 2-Person Families | 711 (46.4%) | $60,194 |
| 3-Person Families | 265 (17.3%) | $0 |
| 4-Person Families | 337 (22.0%) | $84,728 |
| 5-Person Families | 139 (9.1%) | $66,458 |
| 6-Person Families | 33 (2.1%) | $0 |
| 7+ Person Families | 47 (3.1%) | $0 |
| Total | 1,532 (100.0%) | $66,400 |
Family Income by Number of Earners in Edna
The median family income in Edna is $66,400, with families comprising 3+ earners (155) having the highest median family income of $117,011, while families with 1 earner (599) have the lowest median family income of $32,014, accounting for 10.1% and 39.1% of families, respectively.
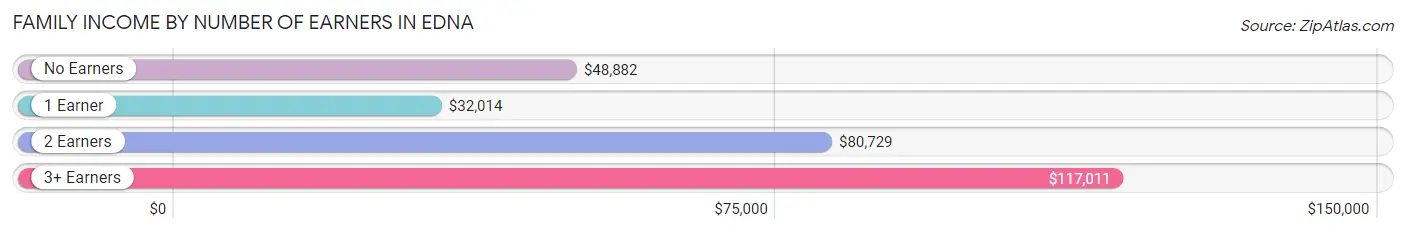
| Number of Earners | # Families | Median Income |
| No Earners | 181 (11.8%) | $48,882 |
| 1 Earner | 599 (39.1%) | $32,014 |
| 2 Earners | 597 (39.0%) | $80,729 |
| 3+ Earners | 155 (10.1%) | $117,011 |
| Total | 1,532 (100.0%) | $66,400 |
Household Income in Edna
Household Income Brackets in Edna
With 399 households falling in the category, the $50,000 to $74,999 income range is the most frequent in Edna, accounting for 19.9% of all households. In contrast, only 62 households (3.1%) fall into the $200,000+ income bracket, making it the least populous group.
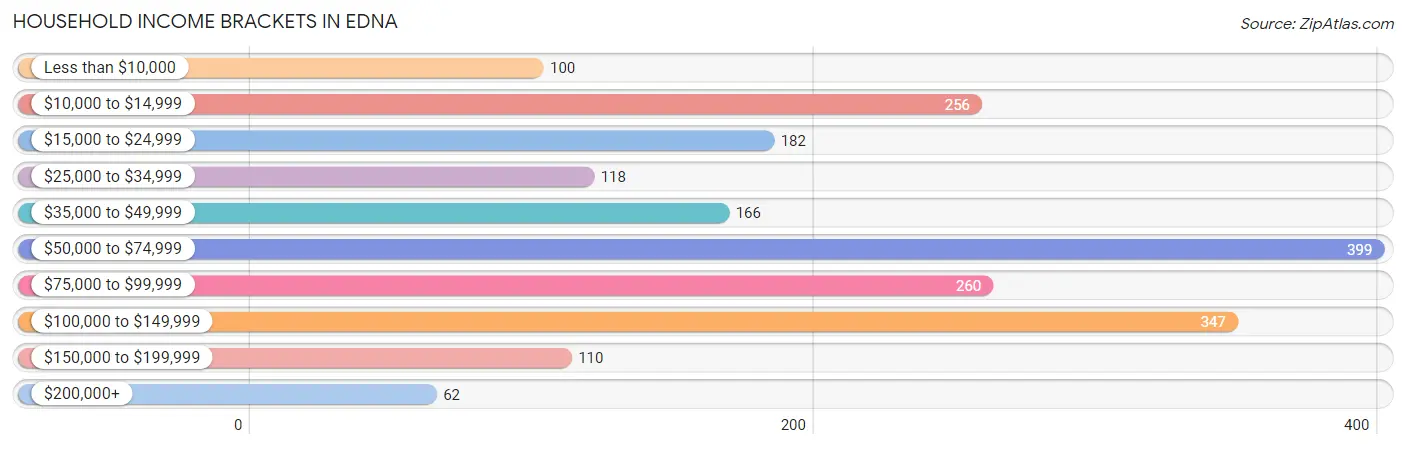
| Income Bracket | # Households | % Households |
| Less than $10,000 | 100 | 5.0% |
| $10,000 to $14,999 | 256 | 12.8% |
| $15,000 to $24,999 | 182 | 9.1% |
| $25,000 to $34,999 | 118 | 5.9% |
| $35,000 to $49,999 | 166 | 8.3% |
| $50,000 to $74,999 | 399 | 19.9% |
| $75,000 to $99,999 | 260 | 13.0% |
| $100,000 to $149,999 | 347 | 17.3% |
| $150,000 to $199,999 | 110 | 5.5% |
| $200,000+ | 62 | 3.1% |
Household Income by Householder Age in Edna
The median household income in Edna is $60,361, with the highest median household income of $73,704 found in the 25 to 44 years age bracket for the primary householder. A total of 760 households (37.9%) fall into this category. Meanwhile, the 15 to 24 years age bracket for the primary householder has the lowest median household income of $0, with 45 households (2.2%) in this group.
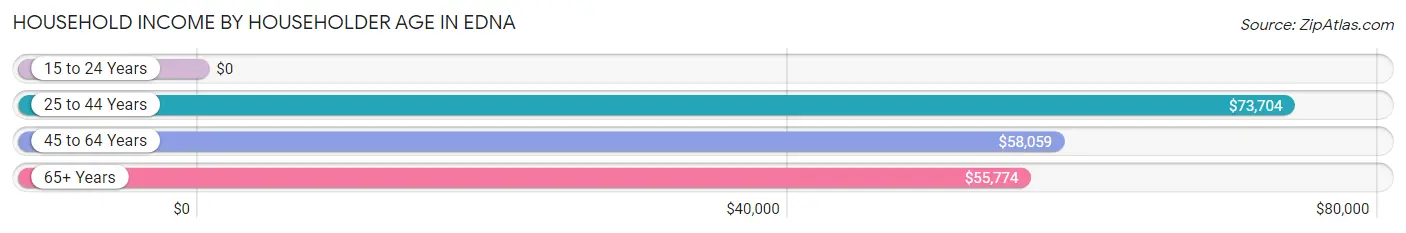
| Income Bracket | # Households | Median Income |
| 15 to 24 Years | 45 (2.2%) | $0 |
| 25 to 44 Years | 760 (37.9%) | $73,704 |
| 45 to 64 Years | 699 (34.9%) | $58,059 |
| 65+ Years | 499 (24.9%) | $55,774 |
| Total | 2,003 (100.0%) | $60,361 |
Poverty in Edna
Income Below Poverty by Sex and Age in Edna
With 22.4% poverty level for males and 15.5% for females among the residents of Edna, 16 and 17 year old males and 65 to 74 year old females are the most vulnerable to poverty, with 70 males (39.1%) and 52 females (34.0%) in their respective age groups living below the poverty level.
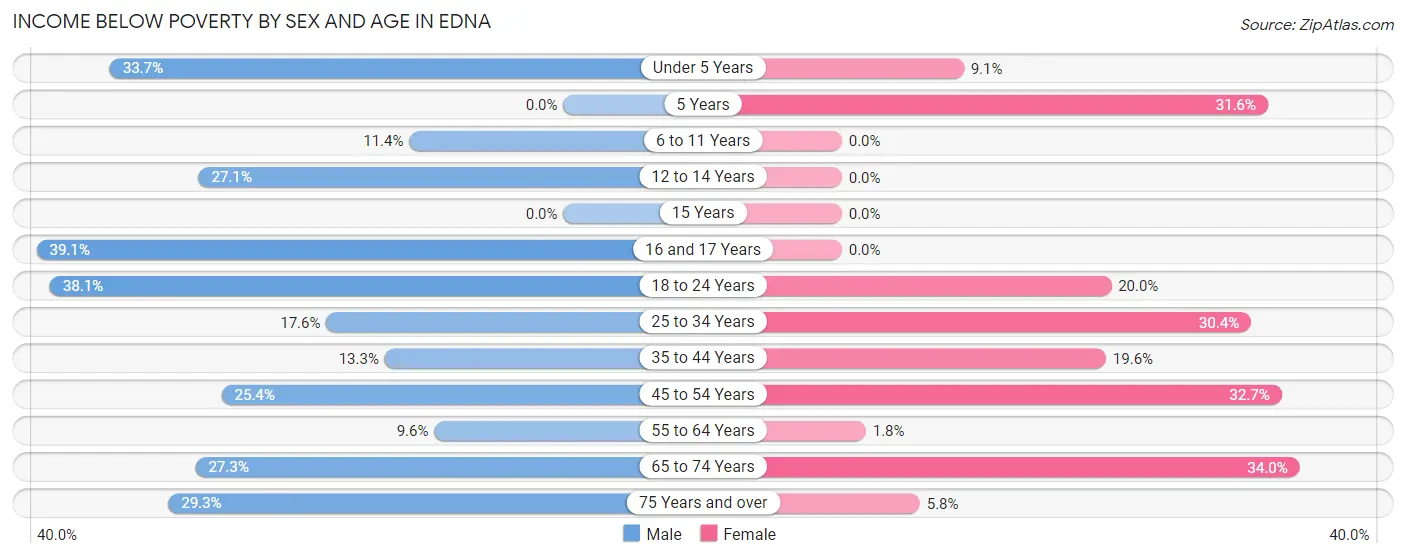
| Age Bracket | Male | Female |
| Under 5 Years | 66 (33.7%) | 18 (9.0%) |
| 5 Years | 0 (0.0%) | 31 (31.6%) |
| 6 to 11 Years | 27 (11.4%) | 0 (0.0%) |
| 12 to 14 Years | 52 (27.1%) | 0 (0.0%) |
| 15 Years | 0 (0.0%) | 0 (0.0%) |
| 16 and 17 Years | 70 (39.1%) | 0 (0.0%) |
| 18 to 24 Years | 77 (38.1%) | 28 (20.0%) |
| 25 to 34 Years | 41 (17.6%) | 93 (30.4%) |
| 35 to 44 Years | 59 (13.3%) | 100 (19.6%) |
| 45 to 54 Years | 69 (25.4%) | 127 (32.7%) |
| 55 to 64 Years | 32 (9.6%) | 5 (1.8%) |
| 65 to 74 Years | 62 (27.3%) | 52 (34.0%) |
| 75 Years and over | 66 (29.3%) | 21 (5.8%) |
| Total | 621 (22.4%) | 475 (15.5%) |
Income Above Poverty by Sex and Age in Edna
According to the poverty statistics in Edna, males aged 5 years and females aged 6 to 11 years are the age groups that are most secure financially, with 100.0% of males and 100.0% of females in these age groups living above the poverty line.
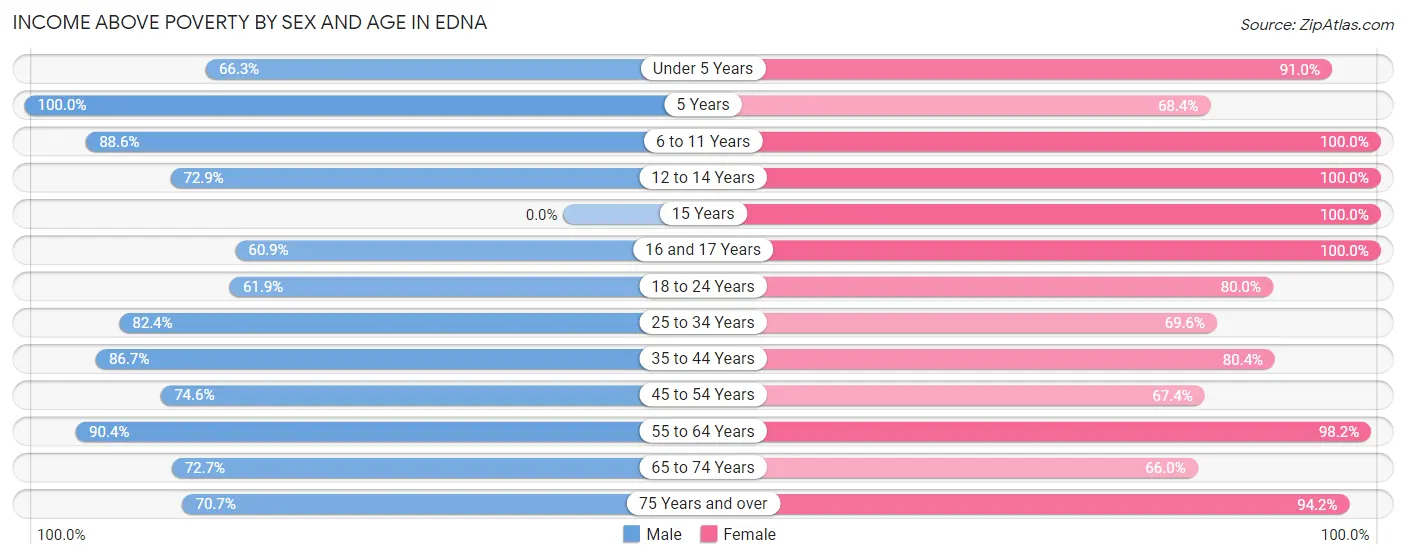
| Age Bracket | Male | Female |
| Under 5 Years | 130 (66.3%) | 181 (90.9%) |
| 5 Years | 29 (100.0%) | 67 (68.4%) |
| 6 to 11 Years | 209 (88.6%) | 269 (100.0%) |
| 12 to 14 Years | 140 (72.9%) | 133 (100.0%) |
| 15 Years | 0 (0.0%) | 5 (100.0%) |
| 16 and 17 Years | 109 (60.9%) | 212 (100.0%) |
| 18 to 24 Years | 125 (61.9%) | 112 (80.0%) |
| 25 to 34 Years | 192 (82.4%) | 213 (69.6%) |
| 35 to 44 Years | 386 (86.7%) | 410 (80.4%) |
| 45 to 54 Years | 203 (74.6%) | 262 (67.3%) |
| 55 to 64 Years | 302 (90.4%) | 276 (98.2%) |
| 65 to 74 Years | 165 (72.7%) | 101 (66.0%) |
| 75 Years and over | 159 (70.7%) | 342 (94.2%) |
| Total | 2,149 (77.6%) | 2,583 (84.5%) |
Income Below Poverty Among Married-Couple Families in Edna
The poverty statistics for married-couple families in Edna show that 8.1% or 89 of the total 1,098 families live below the poverty line. Families with no children have the highest poverty rate of 12.8%, comprising of 76 families. On the other hand, families with 3 or 4 children have the lowest poverty rate of 0.0%, which includes 0 families.
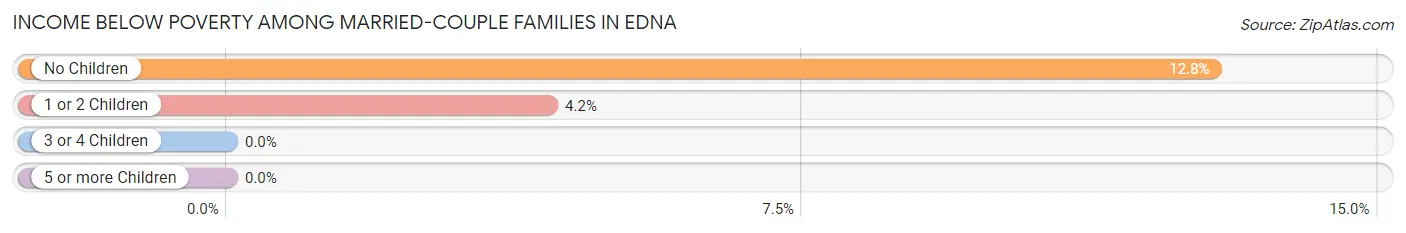
| Children | Above Poverty | Below Poverty |
| No Children | 516 (87.2%) | 76 (12.8%) |
| 1 or 2 Children | 298 (95.8%) | 13 (4.2%) |
| 3 or 4 Children | 195 (100.0%) | 0 (0.0%) |
| 5 or more Children | 0 (0.0%) | 0 (0.0%) |
| Total | 1,009 (91.9%) | 89 (8.1%) |
Income Below Poverty Among Single-Parent Households in Edna
According to the poverty data in Edna, 55.9% or 90 single-father households and 28.6% or 78 single-mother households are living below the poverty line. Among single-father households, those with no children have the highest poverty rate, with 49 households (62.8%) experiencing poverty. Likewise, among single-mother households, those with 3 or 4 children have the highest poverty rate, with 17 households (50.0%) falling below the poverty line.
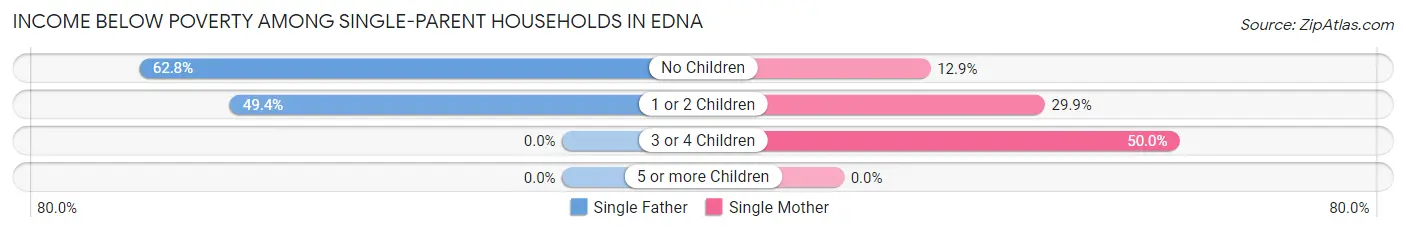
| Children | Single Father | Single Mother |
| No Children | 49 (62.8%) | 8 (12.9%) |
| 1 or 2 Children | 41 (49.4%) | 53 (29.9%) |
| 3 or 4 Children | 0 (0.0%) | 17 (50.0%) |
| 5 or more Children | 0 (0.0%) | 0 (0.0%) |
| Total | 90 (55.9%) | 78 (28.6%) |
Income Below Poverty Among Married-Couple vs Single-Parent Households in Edna
The poverty data for Edna shows that 89 of the married-couple family households (8.1%) and 168 of the single-parent households (38.7%) are living below the poverty level. Within the married-couple family households, those with no children have the highest poverty rate, with 76 households (12.8%) falling below the poverty line. Among the single-parent households, those with 3 or 4 children have the highest poverty rate, with 17 household (50.0%) living below poverty.
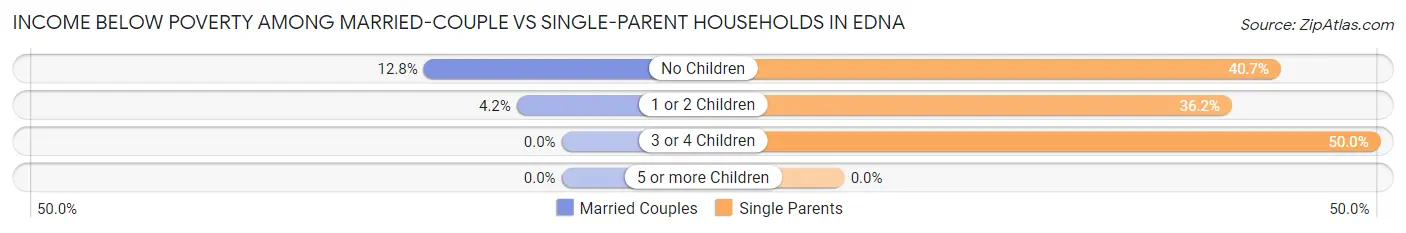
| Children | Married-Couple Families | Single-Parent Households |
| No Children | 76 (12.8%) | 57 (40.7%) |
| 1 or 2 Children | 13 (4.2%) | 94 (36.1%) |
| 3 or 4 Children | 0 (0.0%) | 17 (50.0%) |
| 5 or more Children | 0 (0.0%) | 0 (0.0%) |
| Total | 89 (8.1%) | 168 (38.7%) |
Race in Edna
The most populous races in Edna are White / Caucasian (4,193 | 70.1%), Hispanic or Latino (2,287 | 38.2%), and Black / African American (736 | 12.3%).
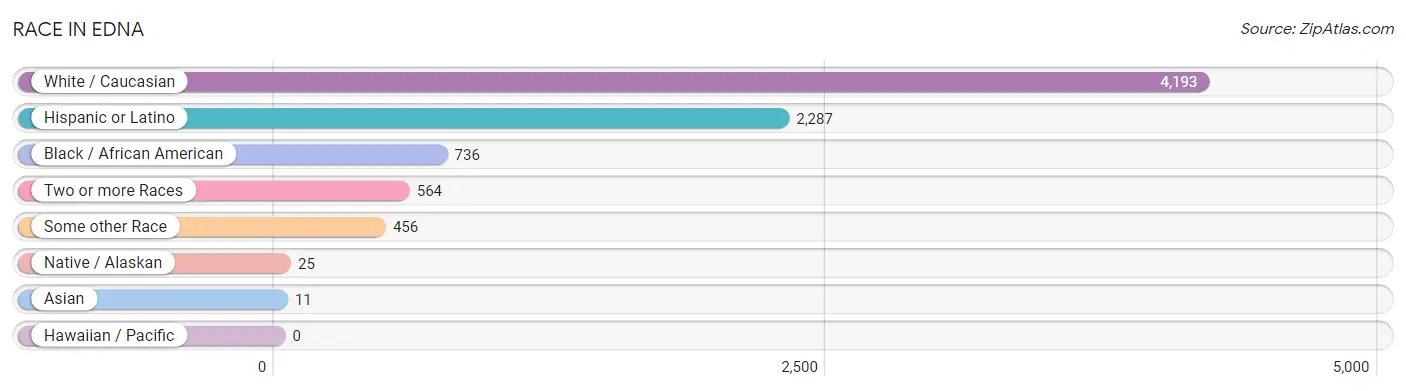
| Race | # Population | % Population |
| Asian | 11 | 0.2% |
| Black / African American | 736 | 12.3% |
| Hawaiian / Pacific | 0 | 0.0% |
| Hispanic or Latino | 2,287 | 38.2% |
| Native / Alaskan | 25 | 0.4% |
| White / Caucasian | 4,193 | 70.1% |
| Two or more Races | 564 | 9.4% |
| Some other Race | 456 | 7.6% |
| Total | 5,985 | 100.0% |
Ancestry in Edna
The most populous ancestries reported in Edna are Mexican (2,052 | 34.3%), German (800 | 13.4%), Irish (435 | 7.3%), Czech (434 | 7.2%), and Cherokee (254 | 4.2%), together accounting for 66.4% of all Edna residents.
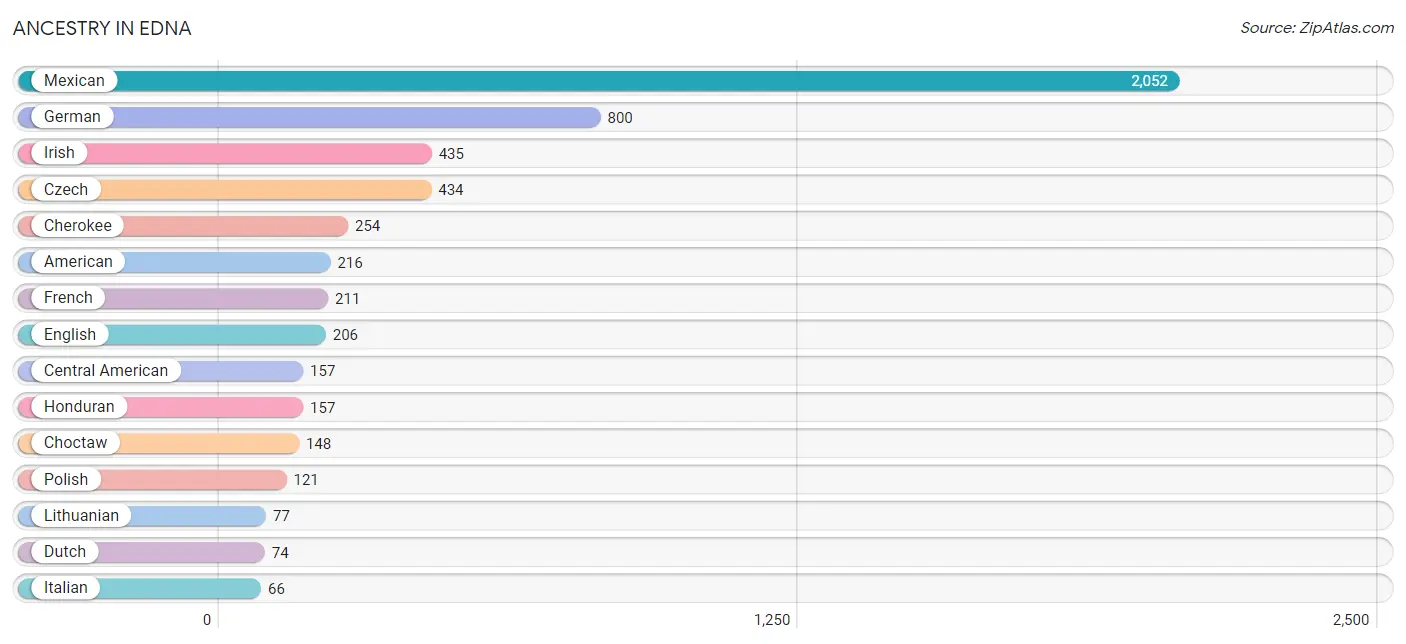
| Ancestry | # Population | % Population |
| African | 12 | 0.2% |
| American | 216 | 3.6% |
| Central American | 157 | 2.6% |
| Cherokee | 254 | 4.2% |
| Cheyenne | 24 | 0.4% |
| Choctaw | 148 | 2.5% |
| Comanche | 8 | 0.1% |
| Creek | 7 | 0.1% |
| Croatian | 14 | 0.2% |
| Czech | 434 | 7.2% |
| Dutch | 74 | 1.2% |
| English | 206 | 3.4% |
| European | 17 | 0.3% |
| French | 211 | 3.5% |
| French Canadian | 12 | 0.2% |
| German | 800 | 13.4% |
| Honduran | 157 | 2.6% |
| Irish | 435 | 7.3% |
| Italian | 66 | 1.1% |
| Lithuanian | 77 | 1.3% |
| Mexican | 2,052 | 34.3% |
| Norwegian | 64 | 1.1% |
| Polish | 121 | 2.0% |
| Portuguese | 9 | 0.2% |
| Romanian | 12 | 0.2% |
| Scandinavian | 6 | 0.1% |
| Scotch-Irish | 7 | 0.1% |
| Scottish | 10 | 0.2% |
| South American Indian | 15 | 0.3% |
| Spanish | 32 | 0.5% |
| Sri Lankan | 10 | 0.2% |
| Subsaharan African | 12 | 0.2% |
| Swedish | 13 | 0.2% |
| Thai | 11 | 0.2% |
| Ukrainian | 9 | 0.2% | View All 35 Rows |
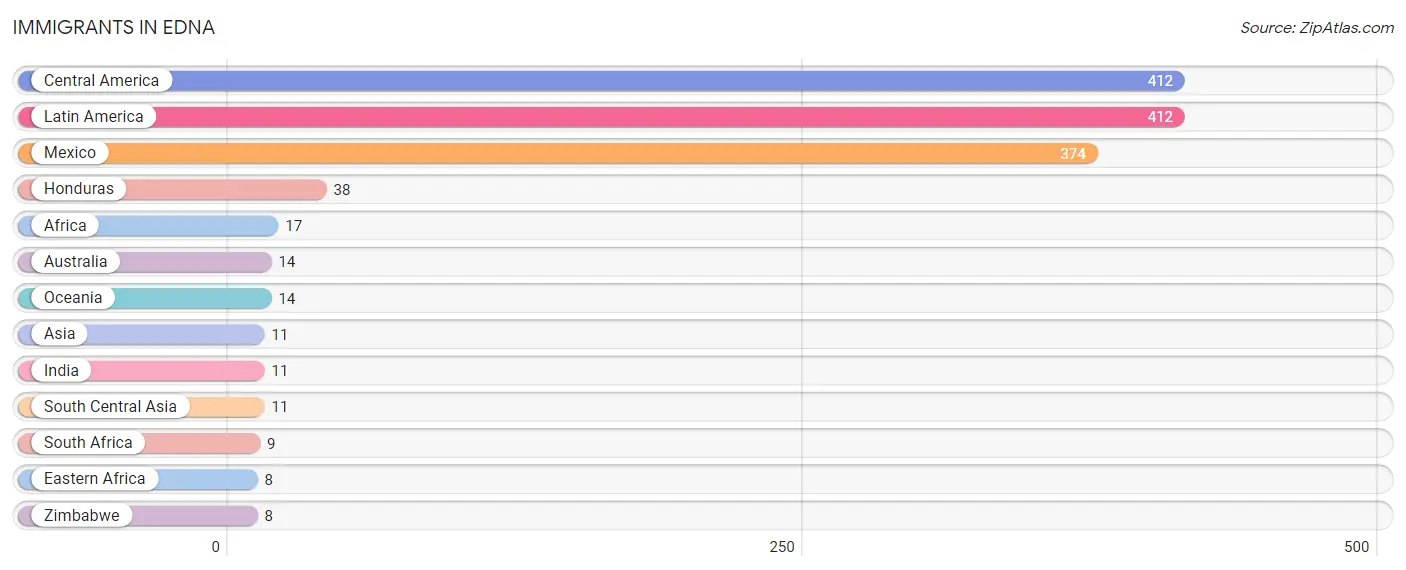
Immigrants in Edna
The most numerous immigrant groups reported in Edna came from Central America (412 | 6.9%), Latin America (412 | 6.9%), Mexico (374 | 6.2%), Honduras (38 | 0.6%), and Africa (17 | 0.3%), together accounting for 20.9% of all Edna residents.
| Immigration Origin | # Population | % Population |
| Africa | 17 | 0.3% |
| Asia | 11 | 0.2% |
| Australia | 14 | 0.2% |
| Central America | 412 | 6.9% |
| Eastern Africa | 8 | 0.1% |
| Honduras | 38 | 0.6% |
| India | 11 | 0.2% |
| Latin America | 412 | 6.9% |
| Mexico | 374 | 6.2% |
| Oceania | 14 | 0.2% |
| South Africa | 9 | 0.2% |
| South Central Asia | 11 | 0.2% |
| Zimbabwe | 8 | 0.1% | View All 13 Rows |
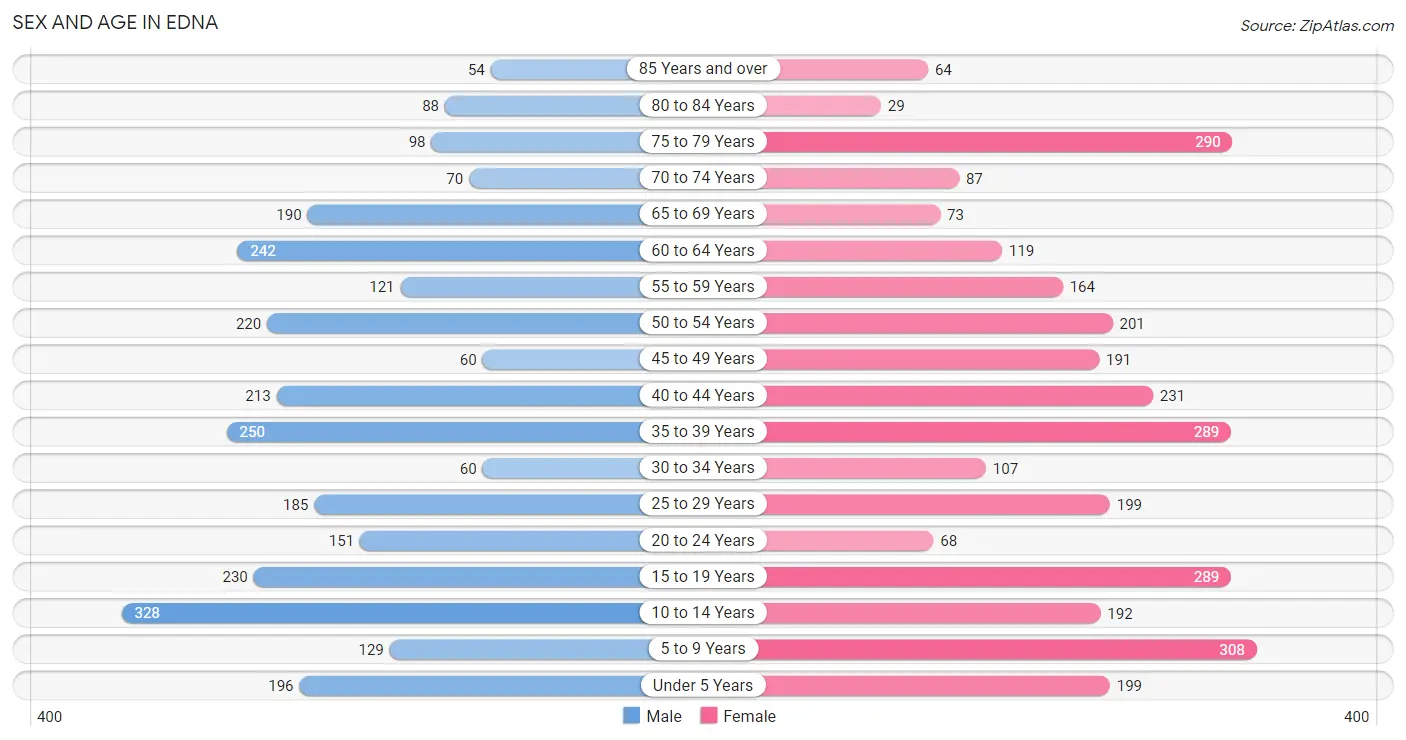
Sex and Age in Edna
Sex and Age in Edna
The most populous age groups in Edna are 10 to 14 Years (328 | 11.4%) for men and 5 to 9 Years (308 | 9.9%) for women.
| Age Bracket | Male | Female |
| Under 5 Years | 196 (6.8%) | 199 (6.4%) |
| 5 to 9 Years | 129 (4.5%) | 308 (9.9%) |
| 10 to 14 Years | 328 (11.4%) | 192 (6.2%) |
| 15 to 19 Years | 230 (8.0%) | 289 (9.3%) |
| 20 to 24 Years | 151 (5.2%) | 68 (2.2%) |
| 25 to 29 Years | 185 (6.4%) | 199 (6.4%) |
| 30 to 34 Years | 60 (2.1%) | 107 (3.5%) |
| 35 to 39 Years | 250 (8.7%) | 289 (9.3%) |
| 40 to 44 Years | 213 (7.4%) | 231 (7.4%) |
| 45 to 49 Years | 60 (2.1%) | 191 (6.2%) |
| 50 to 54 Years | 220 (7.6%) | 201 (6.5%) |
| 55 to 59 Years | 121 (4.2%) | 164 (5.3%) |
| 60 to 64 Years | 242 (8.4%) | 119 (3.8%) |
| 65 to 69 Years | 190 (6.6%) | 73 (2.4%) |
| 70 to 74 Years | 70 (2.4%) | 87 (2.8%) |
| 75 to 79 Years | 98 (3.4%) | 290 (9.3%) |
| 80 to 84 Years | 88 (3.0%) | 29 (0.9%) |
| 85 Years and over | 54 (1.9%) | 64 (2.1%) |
| Total | 2,885 (100.0%) | 3,100 (100.0%) |
Families and Households in Edna
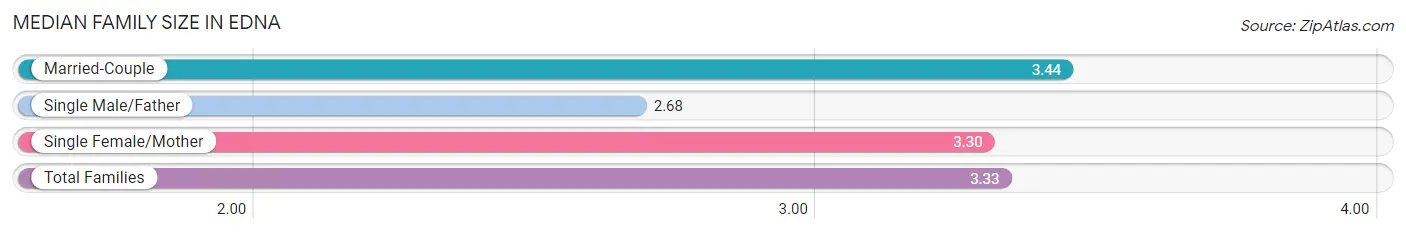
Median Family Size in Edna
The median family size in Edna is 3.33 persons per family, with married-couple families (1,098 | 71.7%) accounting for the largest median family size of 3.44 persons per family. On the other hand, single male/father families (161 | 10.5%) represent the smallest median family size with 2.68 persons per family.
| Family Type | # Families | Family Size |
| Married-Couple | 1,098 (71.7%) | 3.44 |
| Single Male/Father | 161 (10.5%) | 2.68 |
| Single Female/Mother | 273 (17.8%) | 3.30 |
| Total Families | 1,532 (100.0%) | 3.33 |
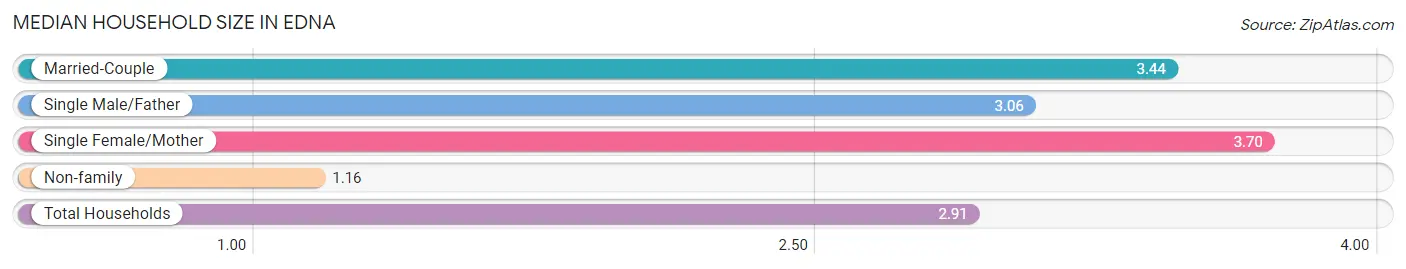
Median Household Size in Edna
The median household size in Edna is 2.91 persons per household, with single female/mother households (273 | 13.6%) accounting for the largest median household size of 3.7 persons per household. non-family households (471 | 23.5%) represent the smallest median household size with 1.16 persons per household.
| Household Type | # Households | Household Size |
| Married-Couple | 1,098 (54.8%) | 3.44 |
| Single Male/Father | 161 (8.0%) | 3.06 |
| Single Female/Mother | 273 (13.6%) | 3.70 |
| Non-family | 471 (23.5%) | 1.16 |
| Total Households | 2,003 (100.0%) | 2.91 |
Household Size by Marriage Status in Edna
Out of a total of 2,003 households in Edna, 1,532 (76.5%) are family households, while 471 (23.5%) are nonfamily households. The most numerous type of family households are 2-person households, comprising 694, and the most common type of nonfamily households are 1-person households, comprising 438.
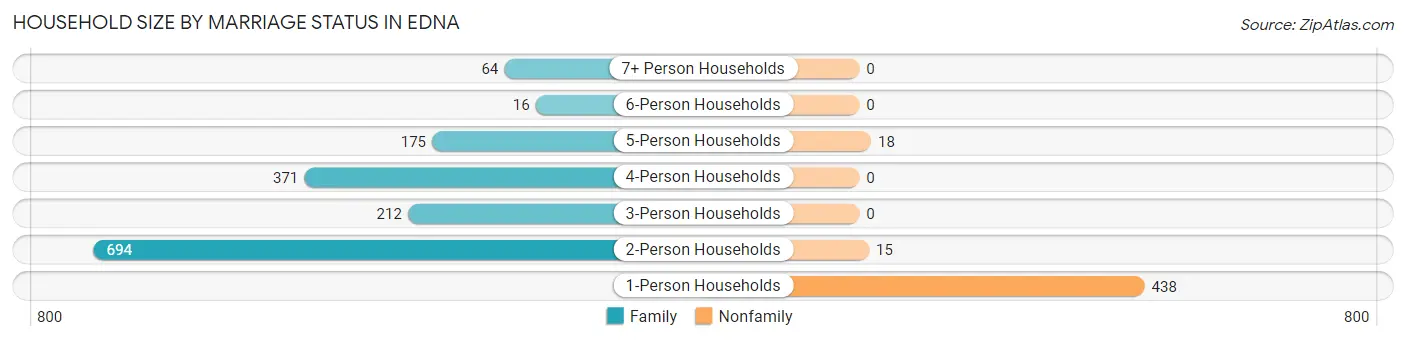
| Household Size | Family Households | Nonfamily Households |
| 1-Person Households | - | 438 (21.9%) |
| 2-Person Households | 694 (34.6%) | 15 (0.7%) |
| 3-Person Households | 212 (10.6%) | 0 (0.0%) |
| 4-Person Households | 371 (18.5%) | 0 (0.0%) |
| 5-Person Households | 175 (8.7%) | 18 (0.9%) |
| 6-Person Households | 16 (0.8%) | 0 (0.0%) |
| 7+ Person Households | 64 (3.2%) | 0 (0.0%) |
| Total | 1,532 (76.5%) | 471 (23.5%) |
Female Fertility in Edna
Fertility by Age in Edna
Average fertility rate in Edna is 53.0 births per 1,000 women. Women in the age bracket of 20 to 34 years have the highest fertility rate with 147.0 births per 1,000 women. Women in the age bracket of 20 to 34 years acount for 74.3% of all women with births.
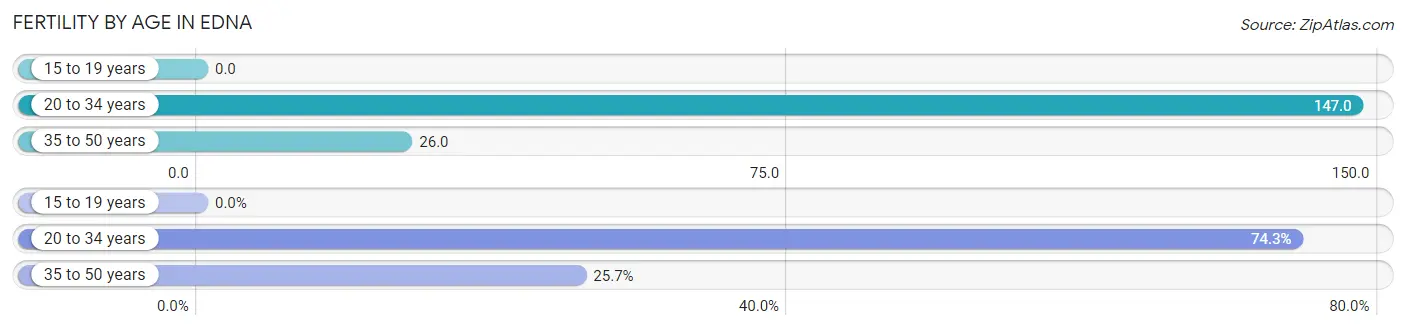
| Age Bracket | Women with Births | Births / 1,000 Women |
| 15 to 19 years | 0 (0.0%) | 0.0 |
| 20 to 34 years | 55 (74.3%) | 147.0 |
| 35 to 50 years | 19 (25.7%) | 26.0 |
| Total | 74 (100.0%) | 53.0 |
Fertility by Age by Marriage Status in Edna
77.0% of women with births (74) in Edna are married. The highest percentage of unmarried women with births falls into 20 to 34 years age bracket with 30.9% of them unmarried at the time of birth, while the lowest percentage of unmarried women with births belong to 35 to 50 years age bracket with 0.0% of them unmarried.
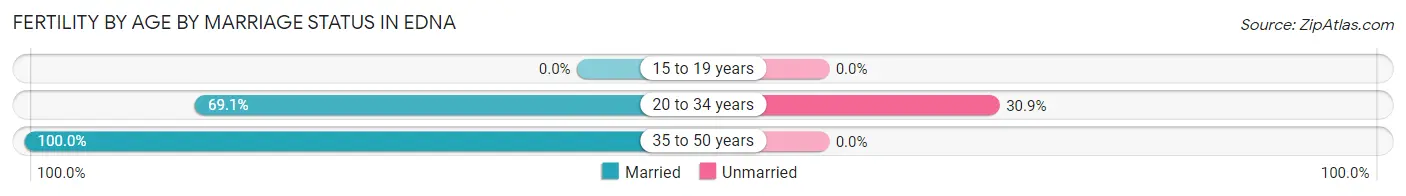
| Age Bracket | Married | Unmarried |
| 15 to 19 years | 0 (0.0%) | 0 (0.0%) |
| 20 to 34 years | 38 (69.1%) | 17 (30.9%) |
| 35 to 50 years | 19 (100.0%) | 0 (0.0%) |
| Total | 57 (77.0%) | 17 (23.0%) |
Fertility by Education in Edna
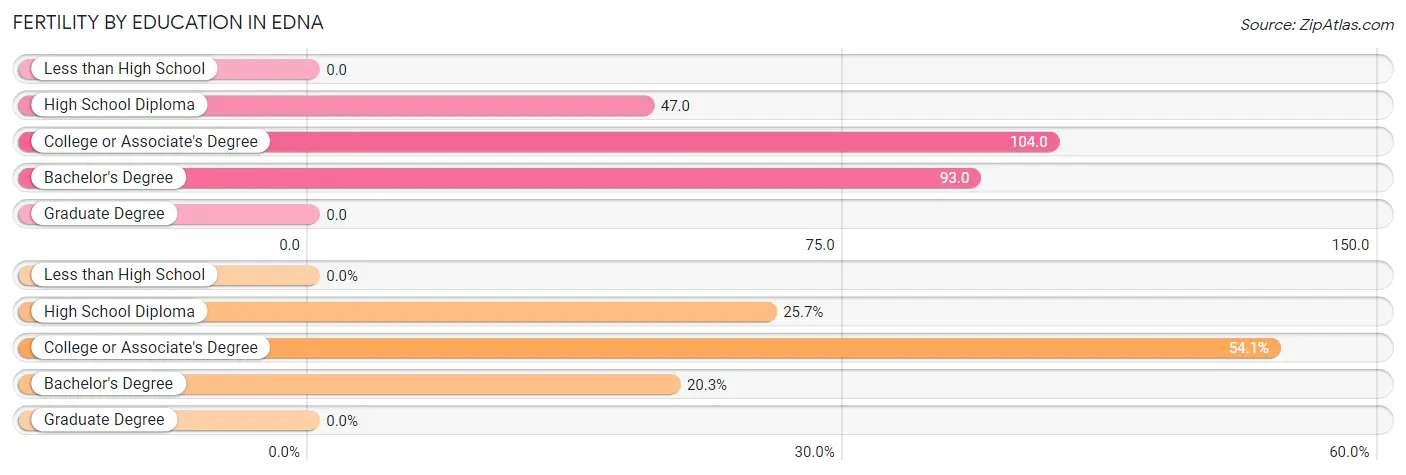
| Educational Attainment | Women with Births | Births / 1,000 Women |
| Less than High School | 0 (0.0%) | 0.0 |
| High School Diploma | 19 (25.7%) | 47.0 |
| College or Associate's Degree | 40 (54.0%) | 104.0 |
| Bachelor's Degree | 15 (20.3%) | 93.0 |
| Graduate Degree | 0 (0.0%) | 0.0 |
| Total | 74 (100.0%) | 53.0 |
Fertility by Education by Marriage Status in Edna
23.0% of women with births in Edna are unmarried. Women with the educational attainment of high school diploma are most likely to be married with 100.0% of them married at childbirth, while women with the educational attainment of college or associate's degree are least likely to be married with 42.5% of them unmarried at childbirth.
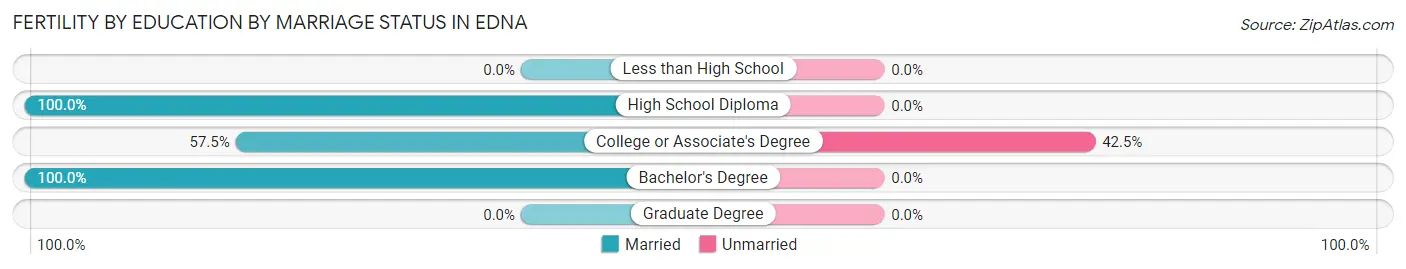
| Educational Attainment | Married | Unmarried |
| Less than High School | 0 (0.0%) | 0 (0.0%) |
| High School Diploma | 19 (100.0%) | 0 (0.0%) |
| College or Associate's Degree | 23 (57.5%) | 17 (42.5%) |
| Bachelor's Degree | 15 (100.0%) | 0 (0.0%) |
| Graduate Degree | 0 (0.0%) | 0 (0.0%) |
| Total | 57 (77.0%) | 17 (23.0%) |
Employment Characteristics in Edna
Employment by Class of Employer in Edna
Among the 2,373 employed individuals in Edna, private company employees (1,742 | 73.4%), local government employees (269 | 11.3%), and self-employed (not incorporated) (159 | 6.7%) make up the most common classes of employment.
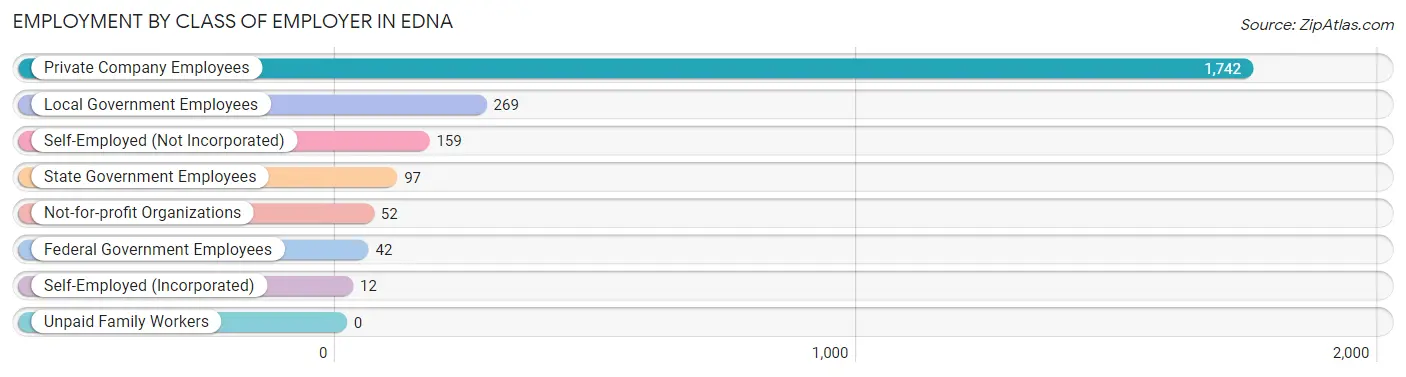
| Employer Class | # Employees | % Employees |
| Private Company Employees | 1,742 | 73.4% |
| Self-Employed (Incorporated) | 12 | 0.5% |
| Self-Employed (Not Incorporated) | 159 | 6.7% |
| Not-for-profit Organizations | 52 | 2.2% |
| Local Government Employees | 269 | 11.3% |
| State Government Employees | 97 | 4.1% |
| Federal Government Employees | 42 | 1.8% |
| Unpaid Family Workers | 0 | 0.0% |
| Total | 2,373 | 100.0% |
Employment Status by Age in Edna
According to the labor force statistics for Edna, out of the total population over 16 years of age (4,628), 55.3% or 2,559 individuals are in the labor force, with 7.3% or 187 of them unemployed. The age group with the highest labor force participation rate is 25 to 29 years, with 97.4% or 374 individuals in the labor force. Within the labor force, the 25 to 29 years age range has the highest percentage of unemployed individuals, with 20.1% or 75 of them being unemployed.
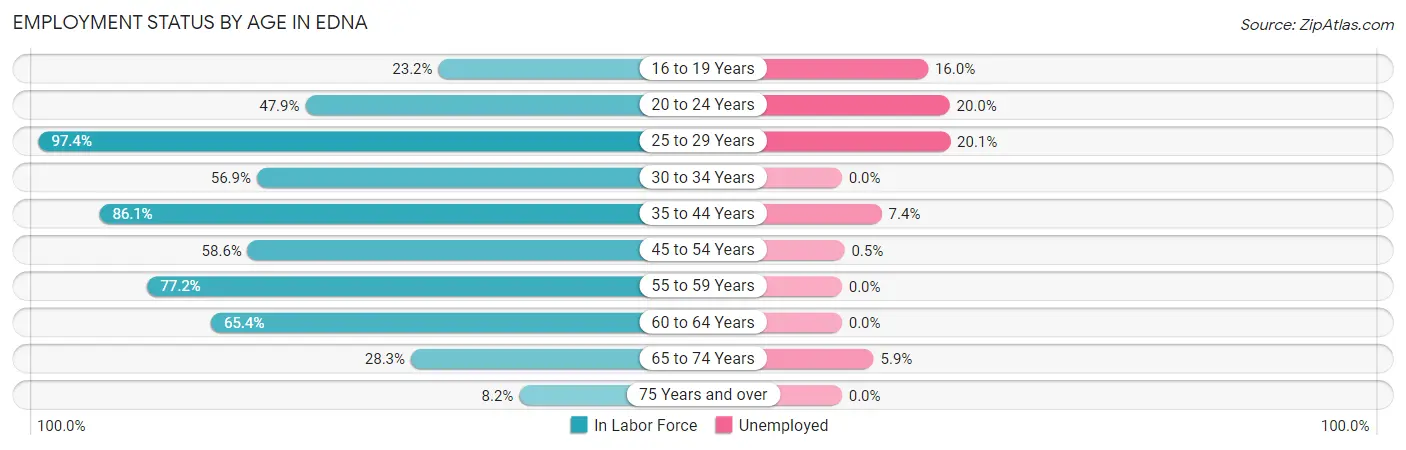
| Age Bracket | In Labor Force | Unemployed |
| 16 to 19 Years | 119 (23.2%) | 19 (16.0%) |
| 20 to 24 Years | 105 (47.9%) | 21 (20.0%) |
| 25 to 29 Years | 374 (97.4%) | 75 (20.1%) |
| 30 to 34 Years | 95 (56.9%) | 0 (0.0%) |
| 35 to 44 Years | 846 (86.1%) | 63 (7.4%) |
| 45 to 54 Years | 394 (58.6%) | 2 (0.5%) |
| 55 to 59 Years | 220 (77.2%) | 0 (0.0%) |
| 60 to 64 Years | 236 (65.4%) | 0 (0.0%) |
| 65 to 74 Years | 119 (28.3%) | 7 (5.9%) |
| 75 Years and over | 51 (8.2%) | 0 (0.0%) |
| Total | 2,559 (55.3%) | 187 (7.3%) |
Employment Status by Educational Attainment in Edna
According to labor force statistics for Edna, 75.9% of individuals (2,165) out of the total population between 25 and 64 years of age (2,852) are in the labor force, with 6.5% or 141 of them being unemployed. The group with the highest labor force participation rate are those with the educational attainment of bachelor's degree or higher, with 87.0% or 334 individuals in the labor force. Within the labor force, individuals with less than high school education have the highest percentage of unemployment, with 21.9% or 91 of them being unemployed.
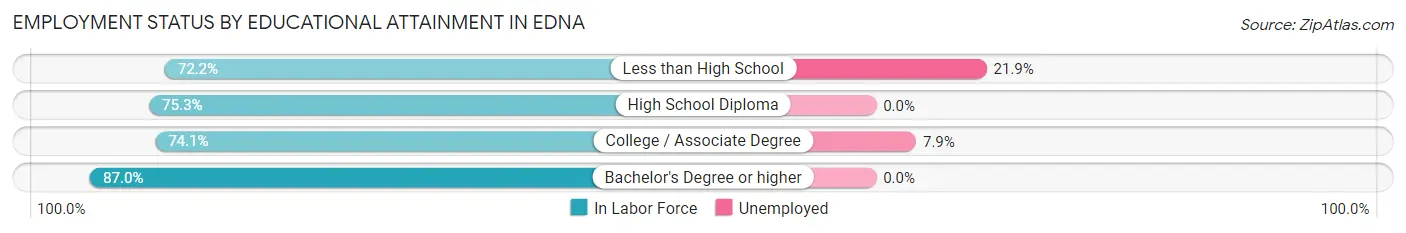
| Educational Attainment | In Labor Force | Unemployed |
| Less than High School | 416 (72.2%) | 126 (21.9%) |
| High School Diploma | 800 (75.3%) | 0 (0.0%) |
| College / Associate Degree | 615 (74.1%) | 66 (7.9%) |
| Bachelor's Degree or higher | 334 (87.0%) | 0 (0.0%) |
| Total | 2,165 (75.9%) | 185 (6.5%) |
Employment Occupations by Sex in Edna
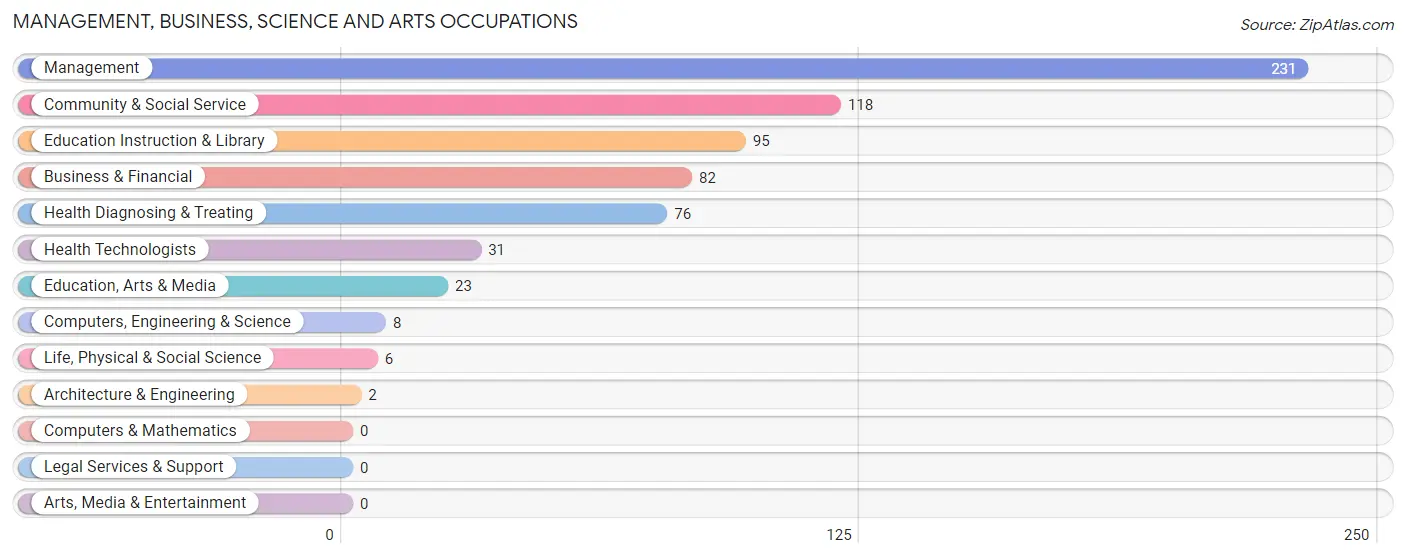
Management, Business, Science and Arts Occupations
The most common Management, Business, Science and Arts occupations in Edna are Management (231 | 9.8%), Community & Social Service (118 | 5.0%), Education Instruction & Library (95 | 4.0%), Business & Financial (82 | 3.5%), and Health Diagnosing & Treating (76 | 3.2%).
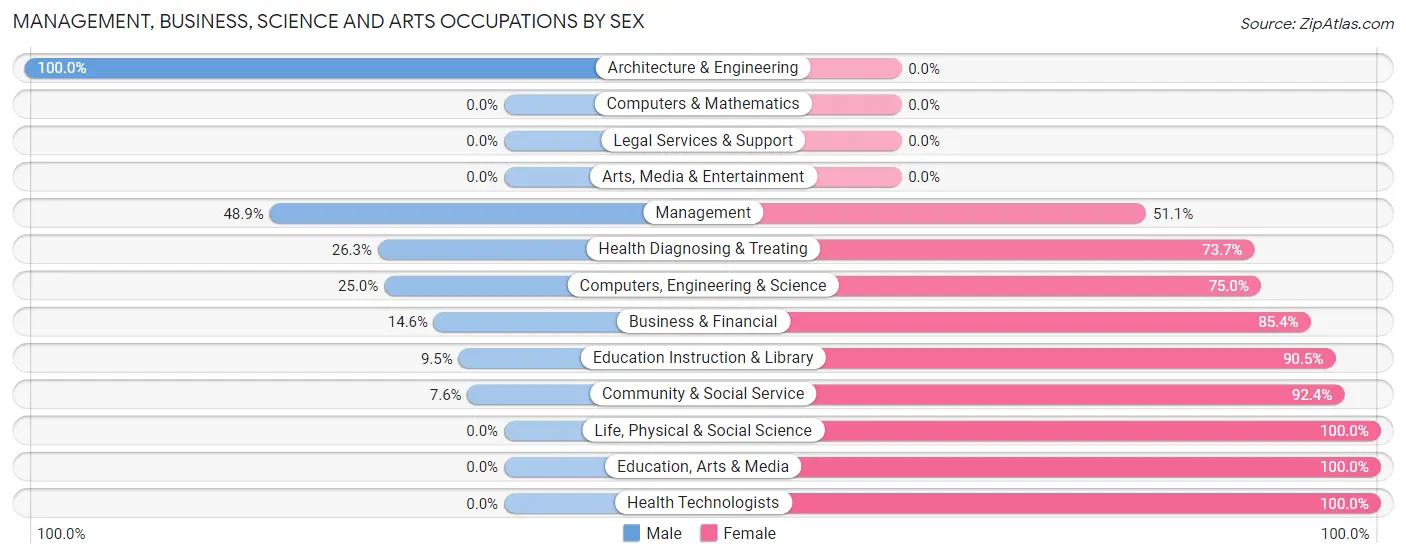
Management, Business, Science and Arts Occupations by Sex
Within the Management, Business, Science and Arts occupations in Edna, the most male-oriented occupations are Architecture & Engineering (100.0%), Management (48.9%), and Health Diagnosing & Treating (26.3%), while the most female-oriented occupations are Life, Physical & Social Science (100.0%), Education, Arts & Media (100.0%), and Health Technologists (100.0%).
| Occupation | Male | Female |
| Management | 113 (48.9%) | 118 (51.1%) |
| Business & Financial | 12 (14.6%) | 70 (85.4%) |
| Computers, Engineering & Science | 2 (25.0%) | 6 (75.0%) |
| Computers & Mathematics | 0 (0.0%) | 0 (0.0%) |
| Architecture & Engineering | 2 (100.0%) | 0 (0.0%) |
| Life, Physical & Social Science | 0 (0.0%) | 6 (100.0%) |
| Community & Social Service | 9 (7.6%) | 109 (92.4%) |
| Education, Arts & Media | 0 (0.0%) | 23 (100.0%) |
| Legal Services & Support | 0 (0.0%) | 0 (0.0%) |
| Education Instruction & Library | 9 (9.5%) | 86 (90.5%) |
| Arts, Media & Entertainment | 0 (0.0%) | 0 (0.0%) |
| Health Diagnosing & Treating | 20 (26.3%) | 56 (73.7%) |
| Health Technologists | 0 (0.0%) | 31 (100.0%) |
| Total (Category) | 156 (30.3%) | 359 (69.7%) |
| Total (Overall) | 1,211 (51.2%) | 1,152 (48.7%) |
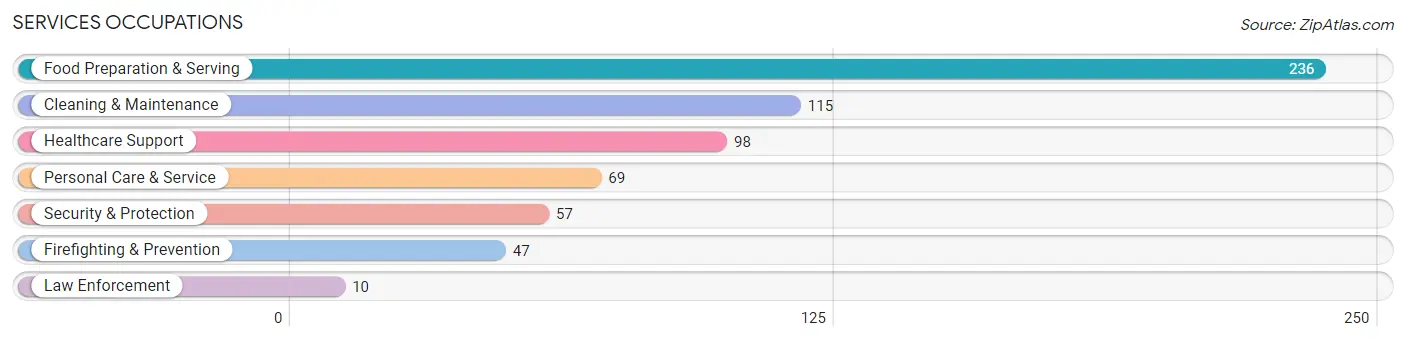
Services Occupations
The most common Services occupations in Edna are Food Preparation & Serving (236 | 10.0%), Cleaning & Maintenance (115 | 4.9%), Healthcare Support (98 | 4.2%), Personal Care & Service (69 | 2.9%), and Security & Protection (57 | 2.4%).
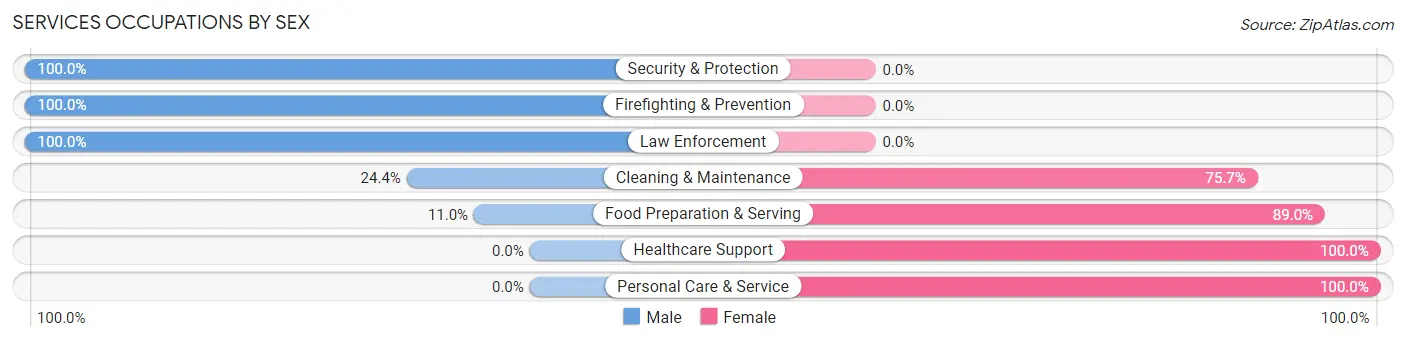
Services Occupations by Sex
Within the Services occupations in Edna, the most male-oriented occupations are Security & Protection (100.0%), Firefighting & Prevention (100.0%), and Law Enforcement (100.0%), while the most female-oriented occupations are Healthcare Support (100.0%), Personal Care & Service (100.0%), and Food Preparation & Serving (89.0%).
| Occupation | Male | Female |
| Healthcare Support | 0 (0.0%) | 98 (100.0%) |
| Security & Protection | 57 (100.0%) | 0 (0.0%) |
| Firefighting & Prevention | 47 (100.0%) | 0 (0.0%) |
| Law Enforcement | 10 (100.0%) | 0 (0.0%) |
| Food Preparation & Serving | 26 (11.0%) | 210 (89.0%) |
| Cleaning & Maintenance | 28 (24.3%) | 87 (75.6%) |
| Personal Care & Service | 0 (0.0%) | 69 (100.0%) |
| Total (Category) | 111 (19.3%) | 464 (80.7%) |
| Total (Overall) | 1,211 (51.2%) | 1,152 (48.7%) |
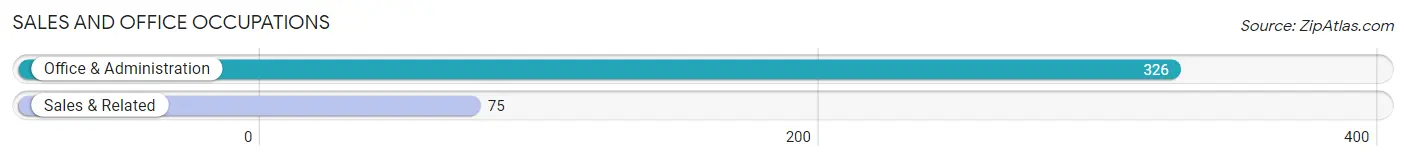
Sales and Office Occupations
The most common Sales and Office occupations in Edna are Office & Administration (326 | 13.8%), and Sales & Related (75 | 3.2%).
Sales and Office Occupations by Sex
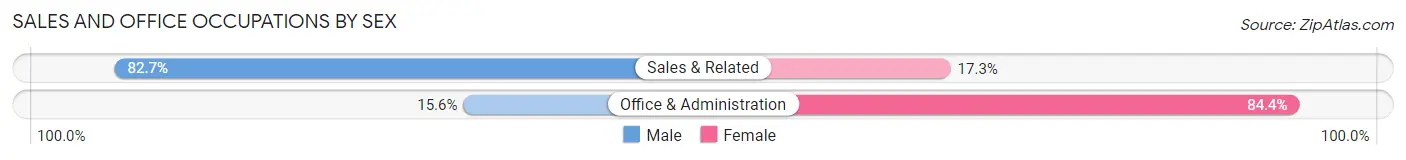
| Occupation | Male | Female |
| Sales & Related | 62 (82.7%) | 13 (17.3%) |
| Office & Administration | 51 (15.6%) | 275 (84.4%) |
| Total (Category) | 113 (28.2%) | 288 (71.8%) |
| Total (Overall) | 1,211 (51.2%) | 1,152 (48.7%) |
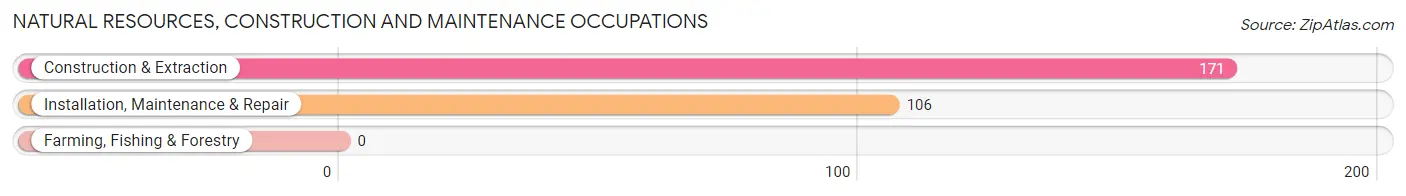
Natural Resources, Construction and Maintenance Occupations
The most common Natural Resources, Construction and Maintenance occupations in Edna are Construction & Extraction (171 | 7.2%), and Installation, Maintenance & Repair (106 | 4.5%).
Natural Resources, Construction and Maintenance Occupations by Sex
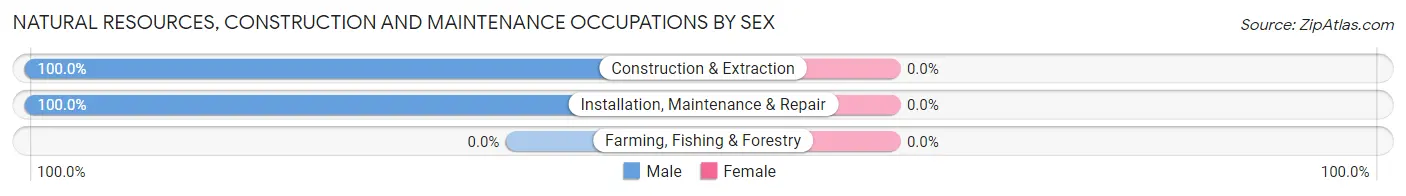
| Occupation | Male | Female |
| Farming, Fishing & Forestry | 0 (0.0%) | 0 (0.0%) |
| Construction & Extraction | 171 (100.0%) | 0 (0.0%) |
| Installation, Maintenance & Repair | 106 (100.0%) | 0 (0.0%) |
| Total (Category) | 277 (100.0%) | 0 (0.0%) |
| Total (Overall) | 1,211 (51.2%) | 1,152 (48.7%) |
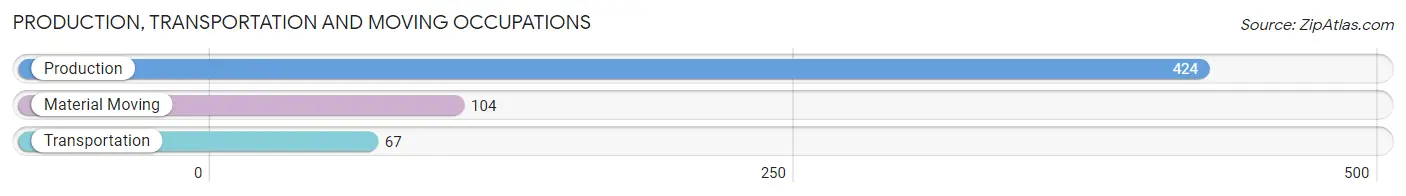
Production, Transportation and Moving Occupations
The most common Production, Transportation and Moving occupations in Edna are Production (424 | 17.9%), Material Moving (104 | 4.4%), and Transportation (67 | 2.8%).
Production, Transportation and Moving Occupations by Sex
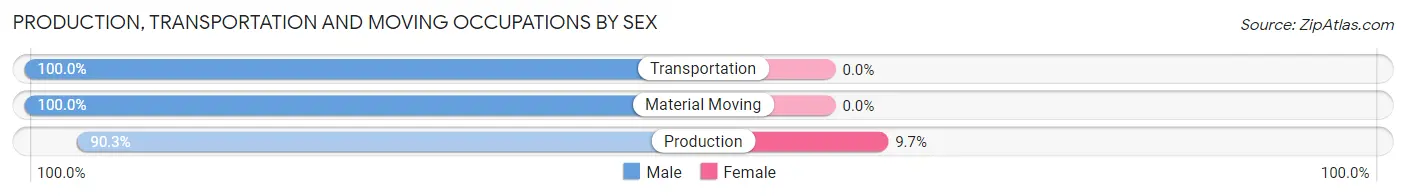
| Occupation | Male | Female |
| Production | 383 (90.3%) | 41 (9.7%) |
| Transportation | 67 (100.0%) | 0 (0.0%) |
| Material Moving | 104 (100.0%) | 0 (0.0%) |
| Total (Category) | 554 (93.1%) | 41 (6.9%) |
| Total (Overall) | 1,211 (51.2%) | 1,152 (48.7%) |
Employment Industries by Sex in Edna
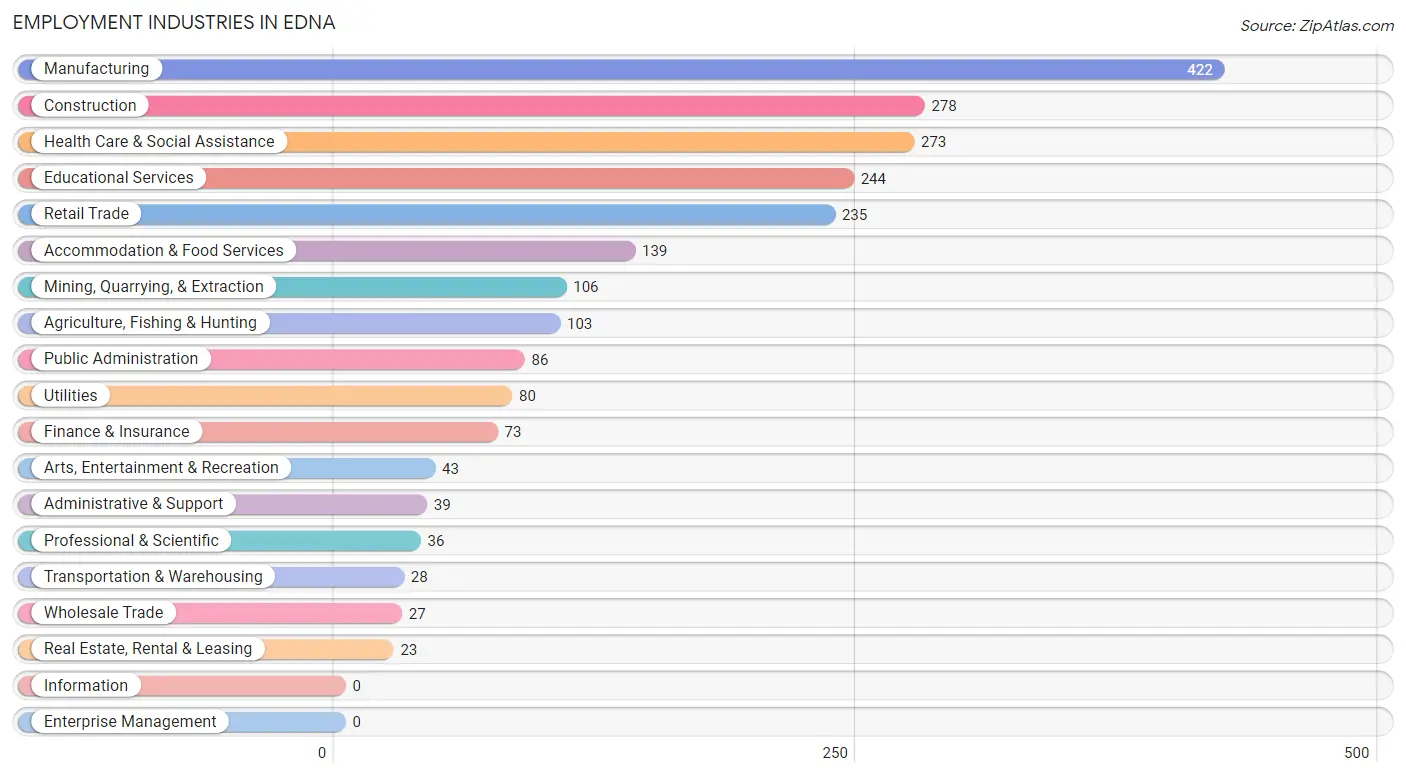
Employment Industries in Edna
The major employment industries in Edna include Manufacturing (422 | 17.9%), Construction (278 | 11.8%), Health Care & Social Assistance (273 | 11.6%), Educational Services (244 | 10.3%), and Retail Trade (235 | 9.9%).
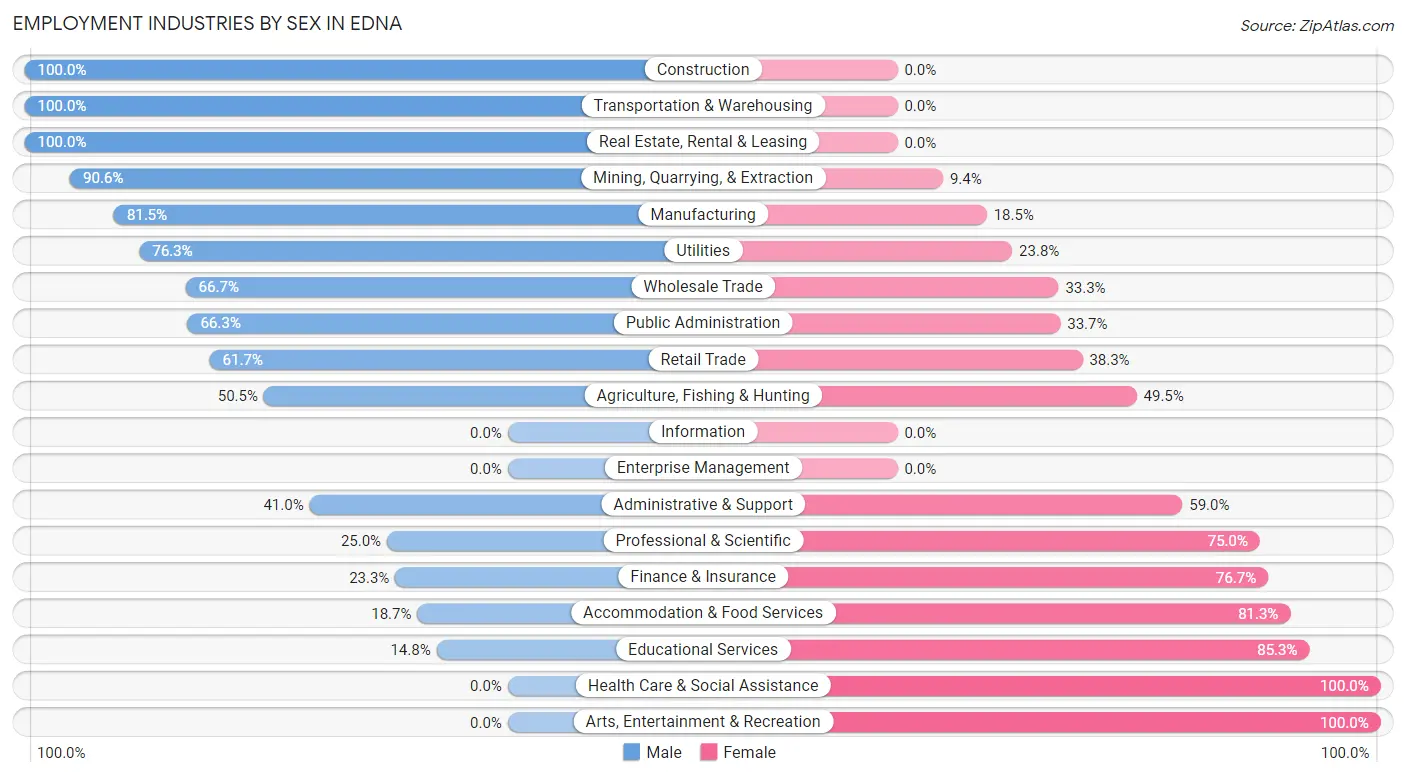
Employment Industries by Sex in Edna
The Edna industries that see more men than women are Construction (100.0%), Transportation & Warehousing (100.0%), and Real Estate, Rental & Leasing (100.0%), whereas the industries that tend to have a higher number of women are Health Care & Social Assistance (100.0%), Arts, Entertainment & Recreation (100.0%), and Educational Services (85.3%).
| Industry | Male | Female |
| Agriculture, Fishing & Hunting | 52 (50.5%) | 51 (49.5%) |
| Mining, Quarrying, & Extraction | 96 (90.6%) | 10 (9.4%) |
| Construction | 278 (100.0%) | 0 (0.0%) |
| Manufacturing | 344 (81.5%) | 78 (18.5%) |
| Wholesale Trade | 18 (66.7%) | 9 (33.3%) |
| Retail Trade | 145 (61.7%) | 90 (38.3%) |
| Transportation & Warehousing | 28 (100.0%) | 0 (0.0%) |
| Utilities | 61 (76.2%) | 19 (23.7%) |
| Information | 0 (0.0%) | 0 (0.0%) |
| Finance & Insurance | 17 (23.3%) | 56 (76.7%) |
| Real Estate, Rental & Leasing | 23 (100.0%) | 0 (0.0%) |
| Professional & Scientific | 9 (25.0%) | 27 (75.0%) |
| Enterprise Management | 0 (0.0%) | 0 (0.0%) |
| Administrative & Support | 16 (41.0%) | 23 (59.0%) |
| Educational Services | 36 (14.7%) | 208 (85.3%) |
| Health Care & Social Assistance | 0 (0.0%) | 273 (100.0%) |
| Arts, Entertainment & Recreation | 0 (0.0%) | 43 (100.0%) |
| Accommodation & Food Services | 26 (18.7%) | 113 (81.3%) |
| Public Administration | 57 (66.3%) | 29 (33.7%) |
| Total | 1,211 (51.2%) | 1,152 (48.7%) |
Education in Edna
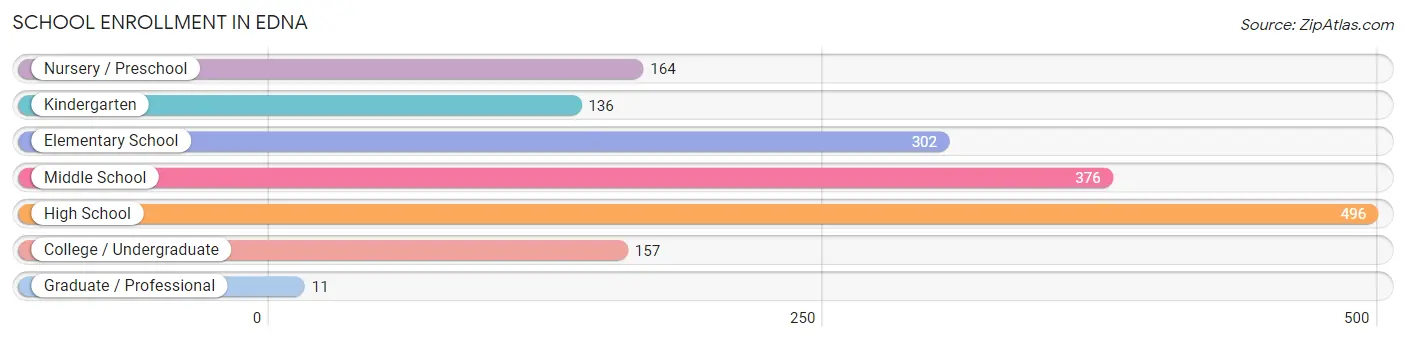
School Enrollment in Edna
The most common levels of schooling among the 1,642 students in Edna are high school (496 | 30.2%), middle school (376 | 22.9%), and elementary school (302 | 18.4%).
| School Level | # Students | % Students |
| Nursery / Preschool | 164 | 10.0% |
| Kindergarten | 136 | 8.3% |
| Elementary School | 302 | 18.4% |
| Middle School | 376 | 22.9% |
| High School | 496 | 30.2% |
| College / Undergraduate | 157 | 9.6% |
| Graduate / Professional | 11 | 0.7% |
| Total | 1,642 | 100.0% |
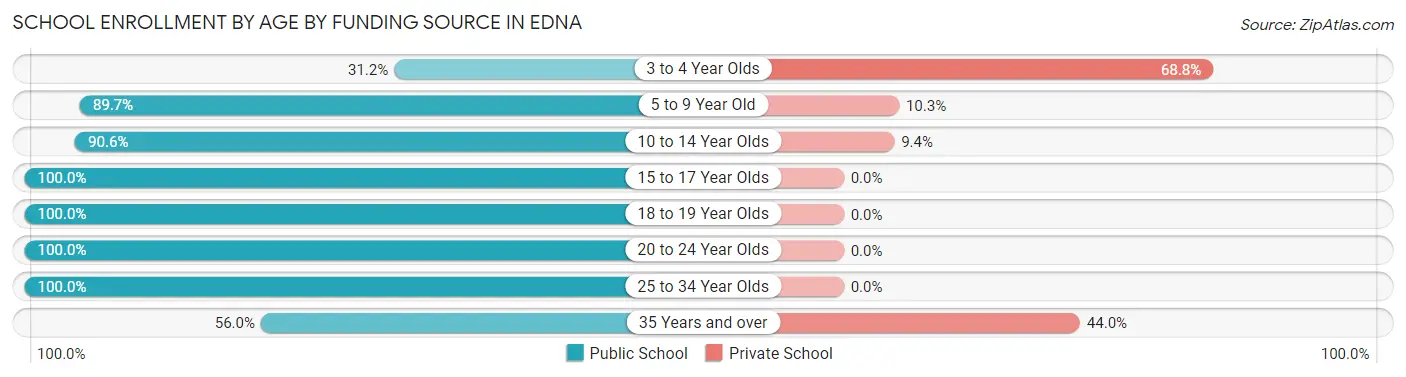
School Enrollment by Age by Funding Source in Edna
Out of a total of 1,642 students who are enrolled in schools in Edna, 181 (11.0%) attend a private institution, while the remaining 1,461 (89.0%) are enrolled in public schools. The age group of 3 to 4 year olds has the highest likelihood of being enrolled in private schools, with 75 (68.8% in the age bracket) enrolled. Conversely, the age group of 15 to 17 year olds has the lowest likelihood of being enrolled in a private school, with 396 (100.0% in the age bracket) attending a public institution.
| Age Bracket | Public School | Private School |
| 3 to 4 Year Olds | 34 (31.2%) | 75 (68.8%) |
| 5 to 9 Year Old | 392 (89.7%) | 45 (10.3%) |
| 10 to 14 Year Olds | 471 (90.6%) | 49 (9.4%) |
| 15 to 17 Year Olds | 396 (100.0%) | 0 (0.0%) |
| 18 to 19 Year Olds | 92 (100.0%) | 0 (0.0%) |
| 20 to 24 Year Olds | 39 (100.0%) | 0 (0.0%) |
| 25 to 34 Year Olds | 24 (100.0%) | 0 (0.0%) |
| 35 Years and over | 14 (56.0%) | 11 (44.0%) |
| Total | 1,461 (89.0%) | 181 (11.0%) |
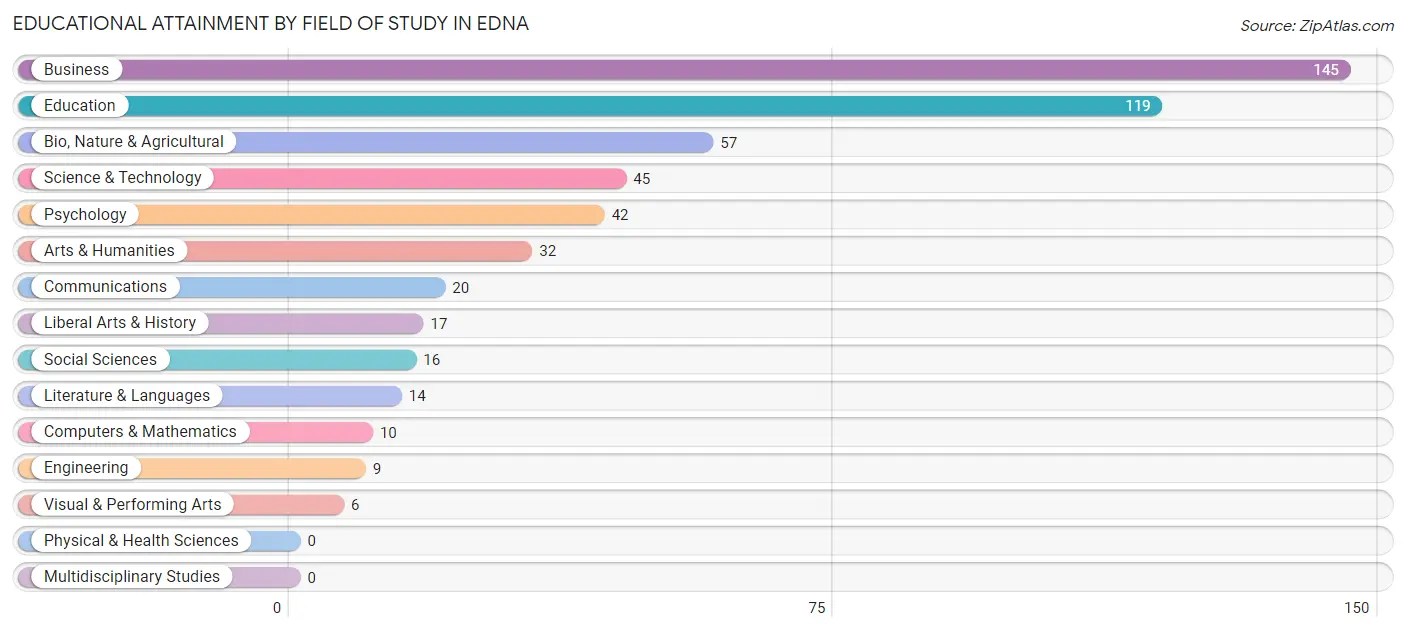
Educational Attainment by Field of Study in Edna
Business (145 | 27.3%), education (119 | 22.4%), bio, nature & agricultural (57 | 10.7%), science & technology (45 | 8.5%), and psychology (42 | 7.9%) are the most common fields of study among 532 individuals in Edna who have obtained a bachelor's degree or higher.
| Field of Study | # Graduates | % Graduates |
| Computers & Mathematics | 10 | 1.9% |
| Bio, Nature & Agricultural | 57 | 10.7% |
| Physical & Health Sciences | 0 | 0.0% |
| Psychology | 42 | 7.9% |
| Social Sciences | 16 | 3.0% |
| Engineering | 9 | 1.7% |
| Multidisciplinary Studies | 0 | 0.0% |
| Science & Technology | 45 | 8.5% |
| Business | 145 | 27.3% |
| Education | 119 | 22.4% |
| Literature & Languages | 14 | 2.6% |
| Liberal Arts & History | 17 | 3.2% |
| Visual & Performing Arts | 6 | 1.1% |
| Communications | 20 | 3.8% |
| Arts & Humanities | 32 | 6.0% |
| Total | 532 | 100.0% |
Transportation & Commute in Edna
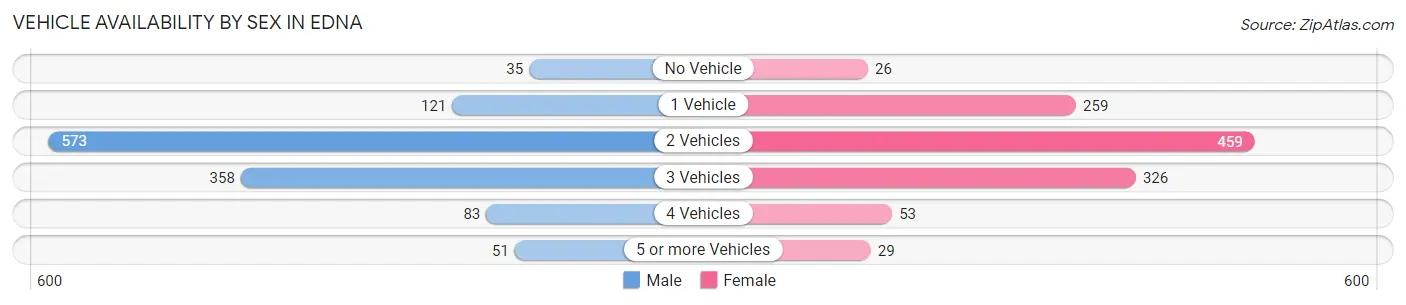
Vehicle Availability by Sex in Edna
The most prevalent vehicle ownership categories in Edna are males with 2 vehicles (573, accounting for 46.9%) and females with 2 vehicles (459, making up 49.7%).
| Vehicles Available | Male | Female |
| No Vehicle | 35 (2.9%) | 26 (2.3%) |
| 1 Vehicle | 121 (9.9%) | 259 (22.5%) |
| 2 Vehicles | 573 (46.9%) | 459 (39.8%) |
| 3 Vehicles | 358 (29.3%) | 326 (28.3%) |
| 4 Vehicles | 83 (6.8%) | 53 (4.6%) |
| 5 or more Vehicles | 51 (4.2%) | 29 (2.5%) |
| Total | 1,221 (100.0%) | 1,152 (100.0%) |
Commute Time in Edna
The most frequently occuring commute durations in Edna are 30 to 34 minutes (613 commuters, 26.6%), 5 to 9 minutes (414 commuters, 17.9%), and 10 to 14 minutes (344 commuters, 14.9%).
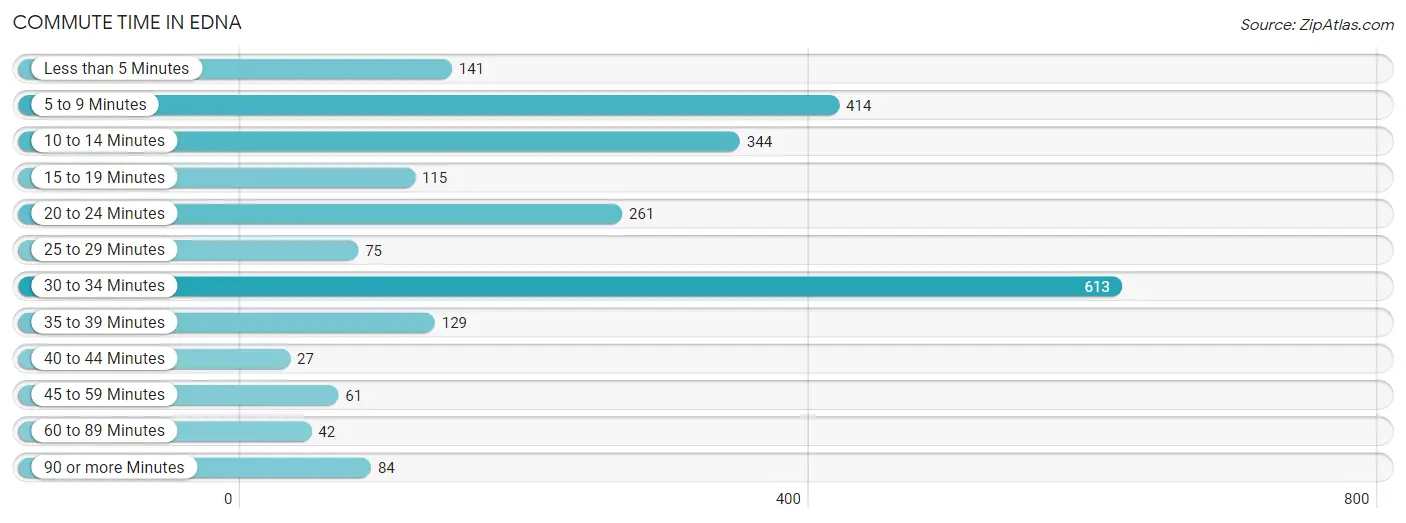
| Commute Time | # Commuters | % Commuters |
| Less than 5 Minutes | 141 | 6.1% |
| 5 to 9 Minutes | 414 | 17.9% |
| 10 to 14 Minutes | 344 | 14.9% |
| 15 to 19 Minutes | 115 | 5.0% |
| 20 to 24 Minutes | 261 | 11.3% |
| 25 to 29 Minutes | 75 | 3.3% |
| 30 to 34 Minutes | 613 | 26.6% |
| 35 to 39 Minutes | 129 | 5.6% |
| 40 to 44 Minutes | 27 | 1.2% |
| 45 to 59 Minutes | 61 | 2.6% |
| 60 to 89 Minutes | 42 | 1.8% |
| 90 or more Minutes | 84 | 3.6% |
Commute Time by Sex in Edna
The most common commute times in Edna are 30 to 34 minutes (385 commuters, 33.4%) for males and 5 to 9 minutes (306 commuters, 26.6%) for females.
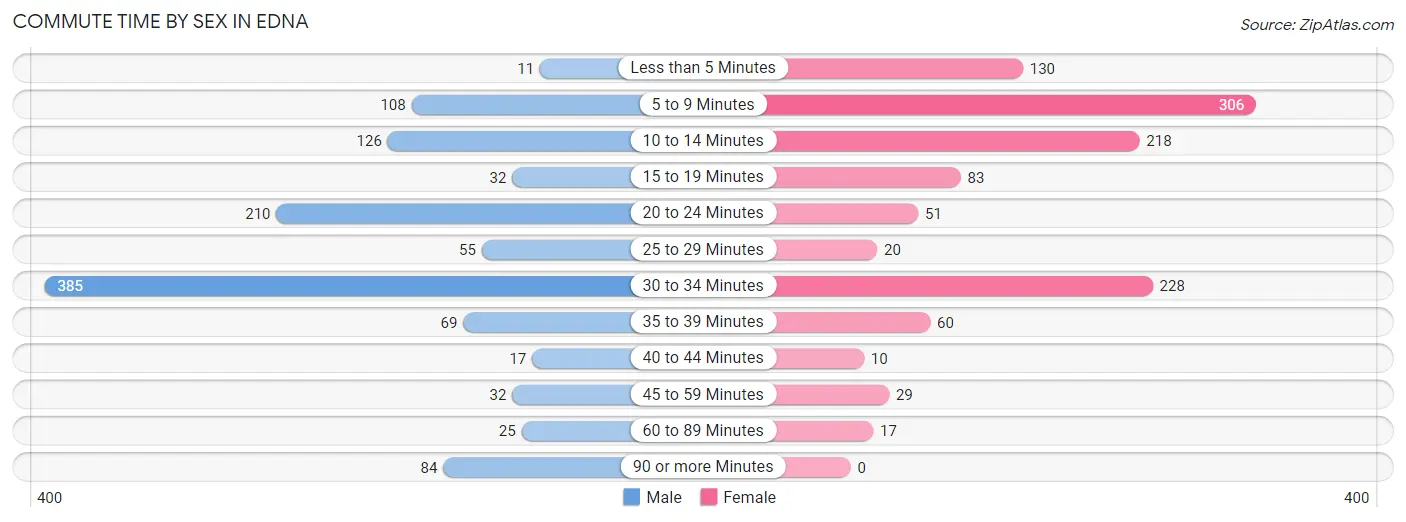
| Commute Time | Male | Female |
| Less than 5 Minutes | 11 (0.9%) | 130 (11.3%) |
| 5 to 9 Minutes | 108 (9.4%) | 306 (26.6%) |
| 10 to 14 Minutes | 126 (10.9%) | 218 (18.9%) |
| 15 to 19 Minutes | 32 (2.8%) | 83 (7.2%) |
| 20 to 24 Minutes | 210 (18.2%) | 51 (4.4%) |
| 25 to 29 Minutes | 55 (4.8%) | 20 (1.7%) |
| 30 to 34 Minutes | 385 (33.4%) | 228 (19.8%) |
| 35 to 39 Minutes | 69 (6.0%) | 60 (5.2%) |
| 40 to 44 Minutes | 17 (1.5%) | 10 (0.9%) |
| 45 to 59 Minutes | 32 (2.8%) | 29 (2.5%) |
| 60 to 89 Minutes | 25 (2.2%) | 17 (1.5%) |
| 90 or more Minutes | 84 (7.3%) | 0 (0.0%) |
Time of Departure to Work by Sex in Edna
The most frequent times of departure to work in Edna are 7:00 AM to 7:29 AM (261, 22.6%) for males and 7:30 AM to 7:59 AM (360, 31.2%) for females.
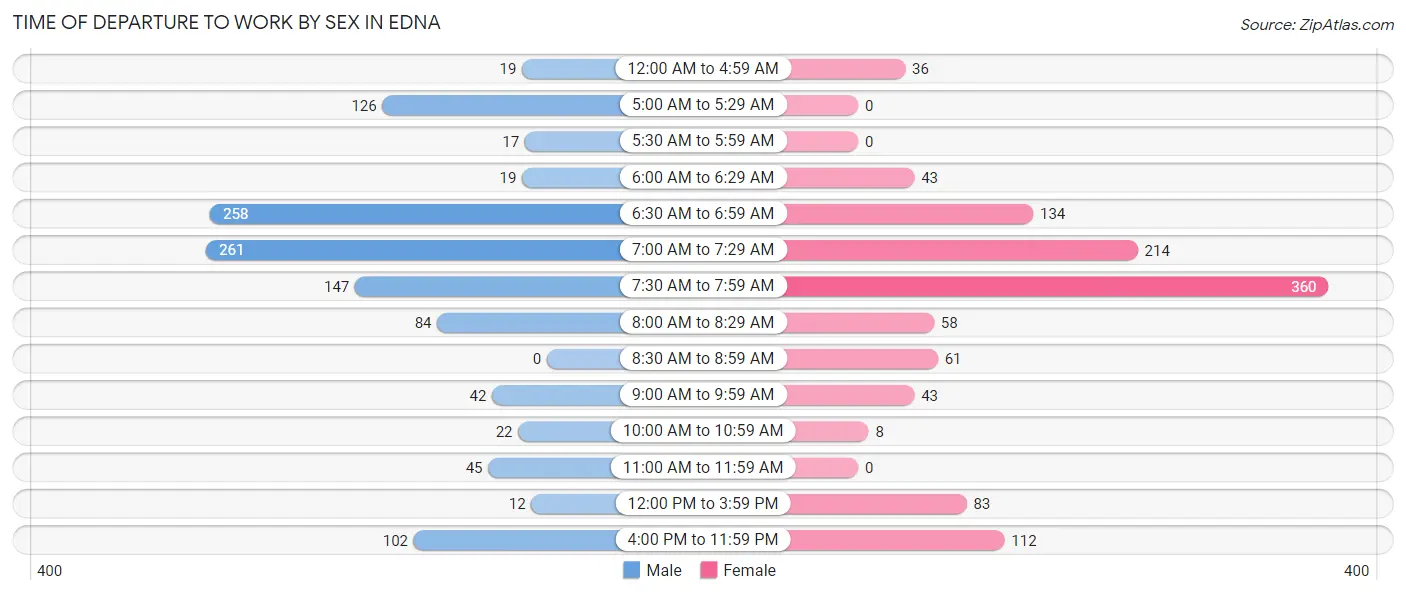
| Time of Departure | Male | Female |
| 12:00 AM to 4:59 AM | 19 (1.7%) | 36 (3.1%) |
| 5:00 AM to 5:29 AM | 126 (10.9%) | 0 (0.0%) |
| 5:30 AM to 5:59 AM | 17 (1.5%) | 0 (0.0%) |
| 6:00 AM to 6:29 AM | 19 (1.7%) | 43 (3.7%) |
| 6:30 AM to 6:59 AM | 258 (22.4%) | 134 (11.6%) |
| 7:00 AM to 7:29 AM | 261 (22.6%) | 214 (18.6%) |
| 7:30 AM to 7:59 AM | 147 (12.7%) | 360 (31.2%) |
| 8:00 AM to 8:29 AM | 84 (7.3%) | 58 (5.0%) |
| 8:30 AM to 8:59 AM | 0 (0.0%) | 61 (5.3%) |
| 9:00 AM to 9:59 AM | 42 (3.6%) | 43 (3.7%) |
| 10:00 AM to 10:59 AM | 22 (1.9%) | 8 (0.7%) |
| 11:00 AM to 11:59 AM | 45 (3.9%) | 0 (0.0%) |
| 12:00 PM to 3:59 PM | 12 (1.0%) | 83 (7.2%) |
| 4:00 PM to 11:59 PM | 102 (8.8%) | 112 (9.7%) |
| Total | 1,154 (100.0%) | 1,152 (100.0%) |
Housing Occupancy in Edna
Occupancy by Ownership in Edna
Of the total 2,003 dwellings in Edna, owner-occupied units account for 1,321 (65.9%), while renter-occupied units make up 682 (34.1%).
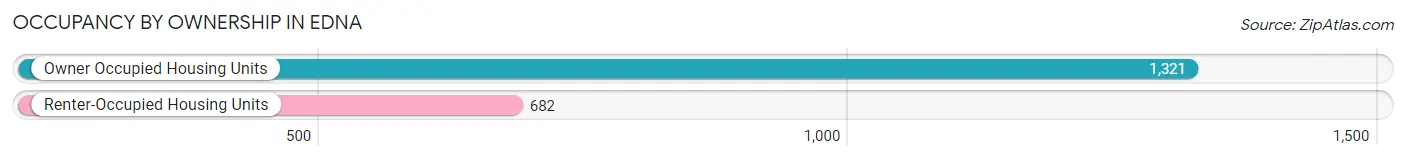
| Occupancy | # Housing Units | % Housing Units |
| Owner Occupied Housing Units | 1,321 | 65.9% |
| Renter-Occupied Housing Units | 682 | 34.1% |
| Total Occupied Housing Units | 2,003 | 100.0% |
Occupancy by Household Size in Edna
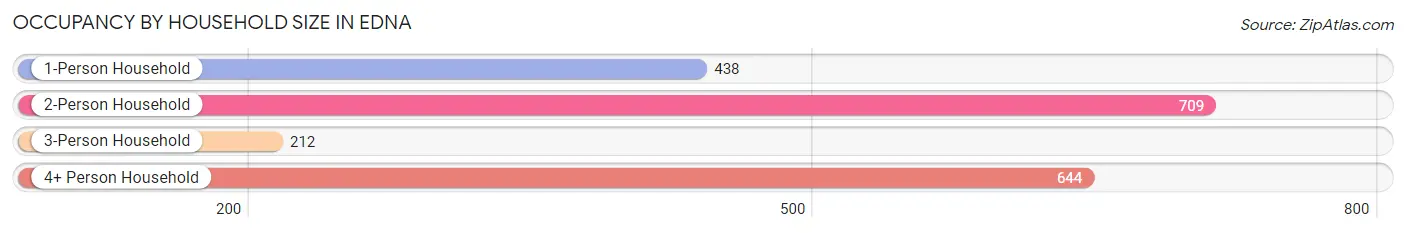
| Household Size | # Housing Units | % Housing Units |
| 1-Person Household | 438 | 21.9% |
| 2-Person Household | 709 | 35.4% |
| 3-Person Household | 212 | 10.6% |
| 4+ Person Household | 644 | 32.2% |
| Total Housing Units | 2,003 | 100.0% |
Occupancy by Ownership by Household Size in Edna
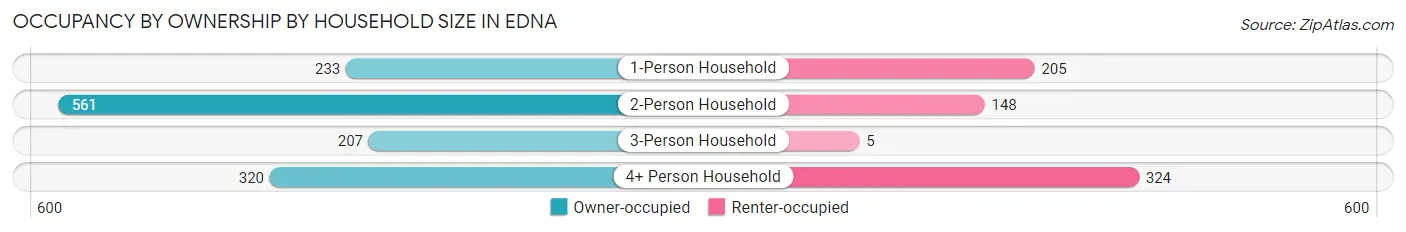
| Household Size | Owner-occupied | Renter-occupied |
| 1-Person Household | 233 (53.2%) | 205 (46.8%) |
| 2-Person Household | 561 (79.1%) | 148 (20.9%) |
| 3-Person Household | 207 (97.6%) | 5 (2.4%) |
| 4+ Person Household | 320 (49.7%) | 324 (50.3%) |
| Total Housing Units | 1,321 (65.9%) | 682 (34.1%) |
Occupancy by Educational Attainment in Edna
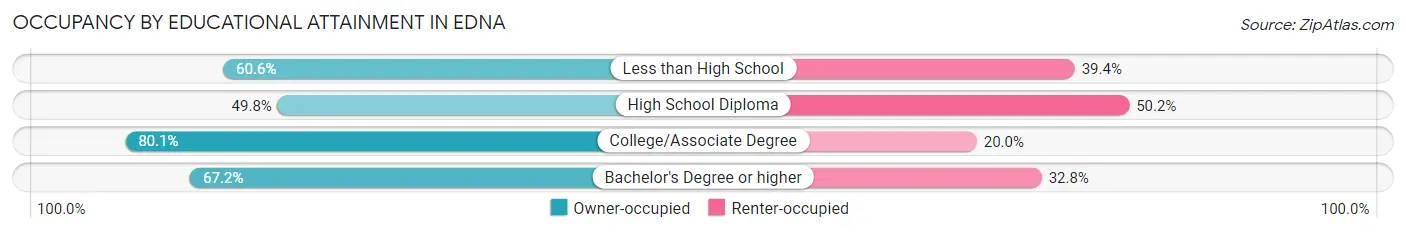
| Household Size | Owner-occupied | Renter-occupied |
| Less than High School | 211 (60.6%) | 137 (39.4%) |
| High School Diploma | 285 (49.8%) | 287 (50.2%) |
| College/Associate Degree | 606 (80.0%) | 151 (20.0%) |
| Bachelor's Degree or higher | 219 (67.2%) | 107 (32.8%) |
Occupancy by Age of Householder in Edna
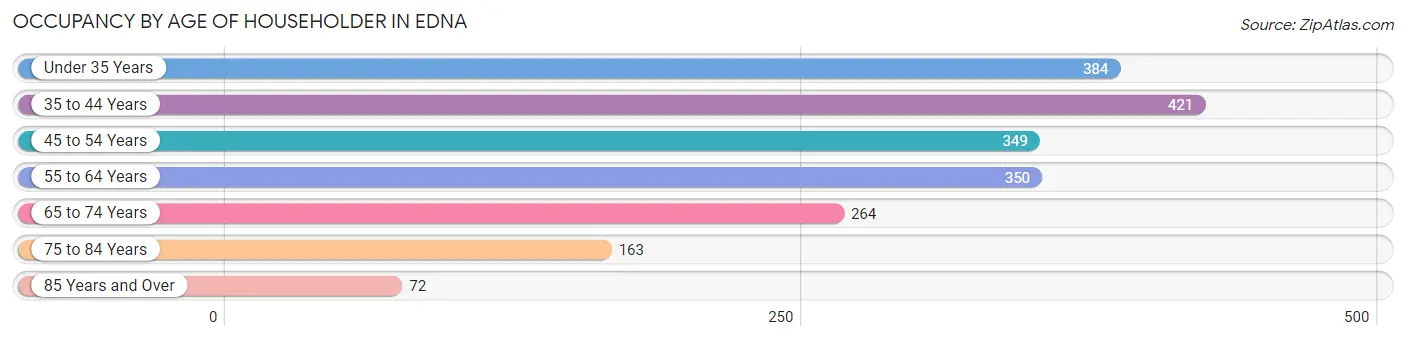
| Age Bracket | # Households | % Households |
| Under 35 Years | 384 | 19.2% |
| 35 to 44 Years | 421 | 21.0% |
| 45 to 54 Years | 349 | 17.4% |
| 55 to 64 Years | 350 | 17.5% |
| 65 to 74 Years | 264 | 13.2% |
| 75 to 84 Years | 163 | 8.1% |
| 85 Years and Over | 72 | 3.6% |
| Total | 2,003 | 100.0% |
Housing Finances in Edna
Median Income by Occupancy in Edna
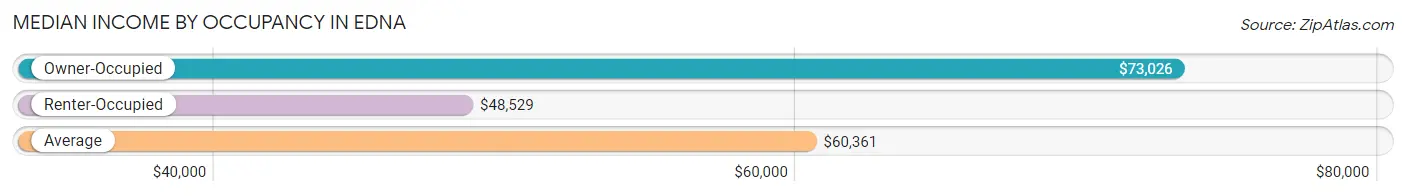
| Occupancy Type | # Households | Median Income |
| Owner-Occupied | 1,321 (65.9%) | $73,026 |
| Renter-Occupied | 682 (34.1%) | $48,529 |
| Average | 2,003 (100.0%) | $60,361 |
Occupancy by Householder Income Bracket in Edna
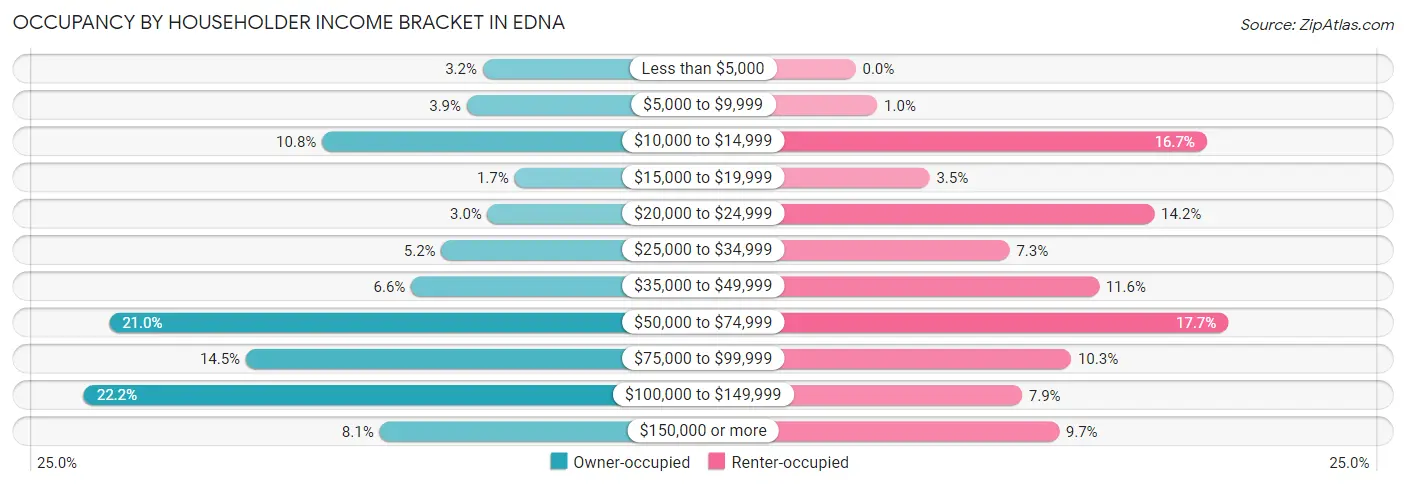
| Income Bracket | Owner-occupied | Renter-occupied |
| Less than $5,000 | 42 (3.2%) | 0 (0.0%) |
| $5,000 to $9,999 | 52 (3.9%) | 7 (1.0%) |
| $10,000 to $14,999 | 143 (10.8%) | 114 (16.7%) |
| $15,000 to $19,999 | 22 (1.7%) | 24 (3.5%) |
| $20,000 to $24,999 | 39 (2.9%) | 97 (14.2%) |
| $25,000 to $34,999 | 68 (5.1%) | 50 (7.3%) |
| $35,000 to $49,999 | 87 (6.6%) | 79 (11.6%) |
| $50,000 to $74,999 | 277 (21.0%) | 121 (17.7%) |
| $75,000 to $99,999 | 191 (14.5%) | 70 (10.3%) |
| $100,000 to $149,999 | 293 (22.2%) | 54 (7.9%) |
| $150,000 or more | 107 (8.1%) | 66 (9.7%) |
| Total | 1,321 (100.0%) | 682 (100.0%) |
Monthly Housing Cost Tiers in Edna
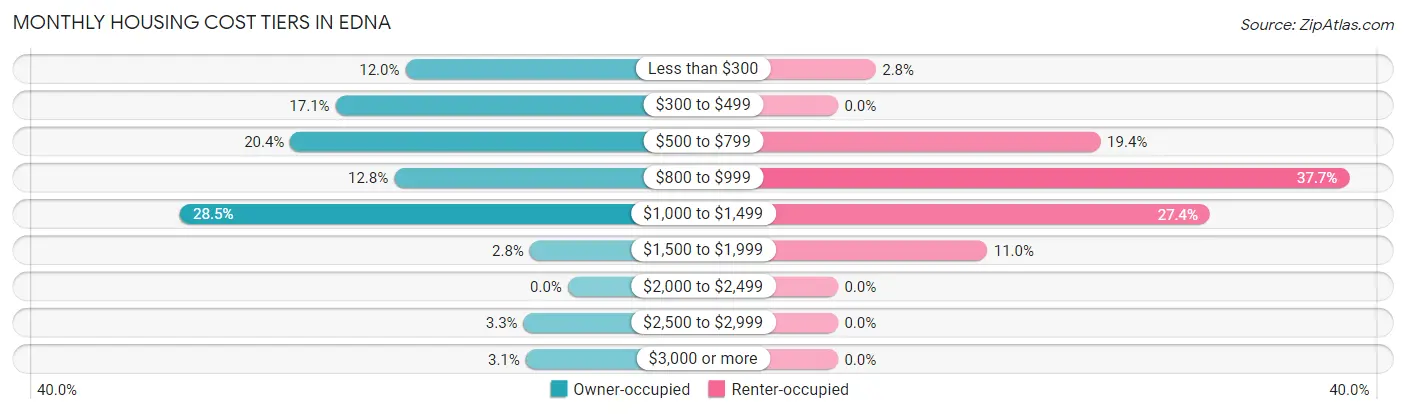
| Monthly Cost | Owner-occupied | Renter-occupied |
| Less than $300 | 158 (12.0%) | 19 (2.8%) |
| $300 to $499 | 226 (17.1%) | 0 (0.0%) |
| $500 to $799 | 270 (20.4%) | 132 (19.4%) |
| $800 to $999 | 169 (12.8%) | 257 (37.7%) |
| $1,000 to $1,499 | 377 (28.5%) | 187 (27.4%) |
| $1,500 to $1,999 | 37 (2.8%) | 75 (11.0%) |
| $2,000 to $2,499 | 0 (0.0%) | 0 (0.0%) |
| $2,500 to $2,999 | 43 (3.3%) | 0 (0.0%) |
| $3,000 or more | 41 (3.1%) | 0 (0.0%) |
| Total | 1,321 (100.0%) | 682 (100.0%) |
Physical Housing Characteristics in Edna
Housing Structures in Edna
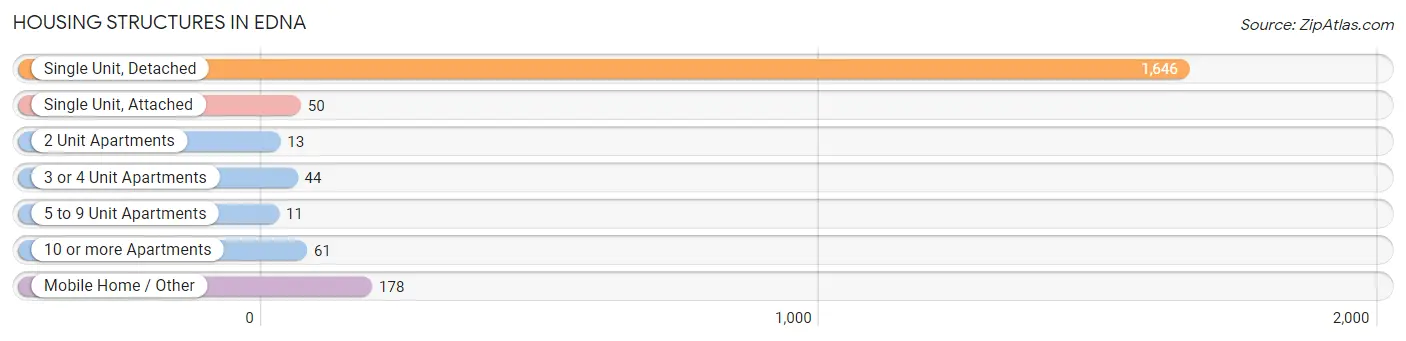
| Structure Type | # Housing Units | % Housing Units |
| Single Unit, Detached | 1,646 | 82.2% |
| Single Unit, Attached | 50 | 2.5% |
| 2 Unit Apartments | 13 | 0.6% |
| 3 or 4 Unit Apartments | 44 | 2.2% |
| 5 to 9 Unit Apartments | 11 | 0.5% |
| 10 or more Apartments | 61 | 3.0% |
| Mobile Home / Other | 178 | 8.9% |
| Total | 2,003 | 100.0% |
Housing Structures by Occupancy in Edna
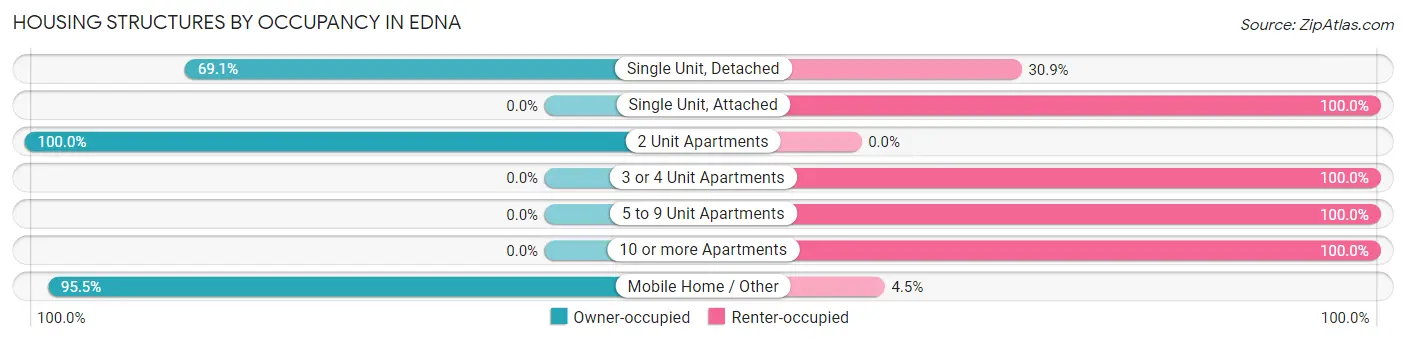
| Structure Type | Owner-occupied | Renter-occupied |
| Single Unit, Detached | 1,138 (69.1%) | 508 (30.9%) |
| Single Unit, Attached | 0 (0.0%) | 50 (100.0%) |
| 2 Unit Apartments | 13 (100.0%) | 0 (0.0%) |
| 3 or 4 Unit Apartments | 0 (0.0%) | 44 (100.0%) |
| 5 to 9 Unit Apartments | 0 (0.0%) | 11 (100.0%) |
| 10 or more Apartments | 0 (0.0%) | 61 (100.0%) |
| Mobile Home / Other | 170 (95.5%) | 8 (4.5%) |
| Total | 1,321 (65.9%) | 682 (34.1%) |
Housing Structures by Number of Rooms in Edna
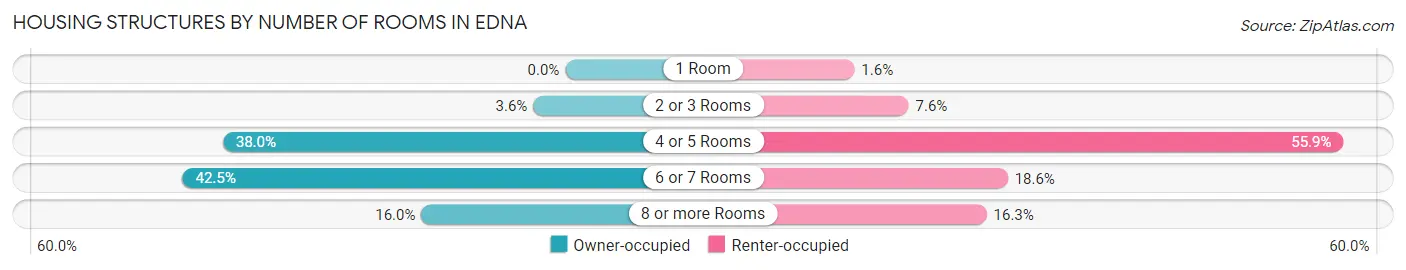
| Number of Rooms | Owner-occupied | Renter-occupied |
| 1 Room | 0 (0.0%) | 11 (1.6%) |
| 2 or 3 Rooms | 47 (3.6%) | 52 (7.6%) |
| 4 or 5 Rooms | 502 (38.0%) | 381 (55.9%) |
| 6 or 7 Rooms | 561 (42.5%) | 127 (18.6%) |
| 8 or more Rooms | 211 (16.0%) | 111 (16.3%) |
| Total | 1,321 (100.0%) | 682 (100.0%) |
Housing Structure by Heating Type in Edna
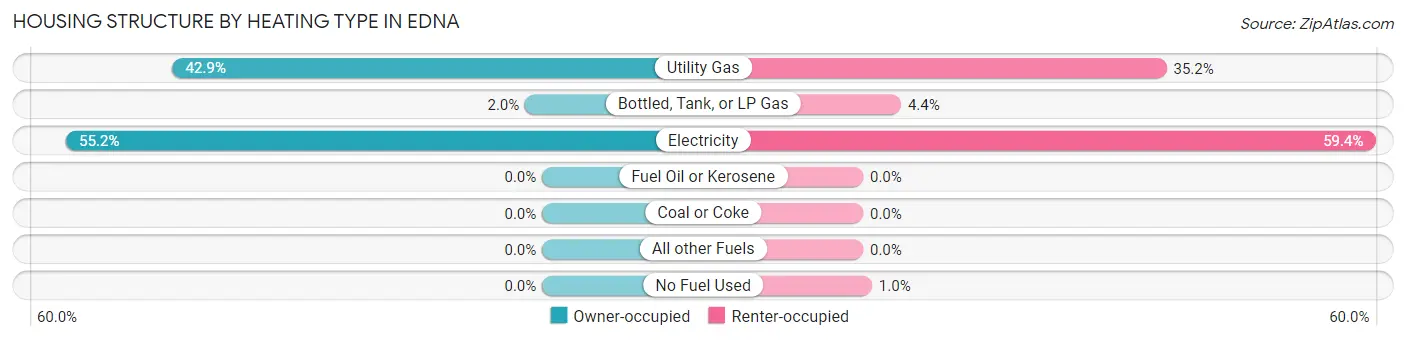
| Heating Type | Owner-occupied | Renter-occupied |
| Utility Gas | 566 (42.8%) | 240 (35.2%) |
| Bottled, Tank, or LP Gas | 26 (2.0%) | 30 (4.4%) |
| Electricity | 729 (55.2%) | 405 (59.4%) |
| Fuel Oil or Kerosene | 0 (0.0%) | 0 (0.0%) |
| Coal or Coke | 0 (0.0%) | 0 (0.0%) |
| All other Fuels | 0 (0.0%) | 0 (0.0%) |
| No Fuel Used | 0 (0.0%) | 7 (1.0%) |
| Total | 1,321 (100.0%) | 682 (100.0%) |
Household Vehicle Usage in Edna
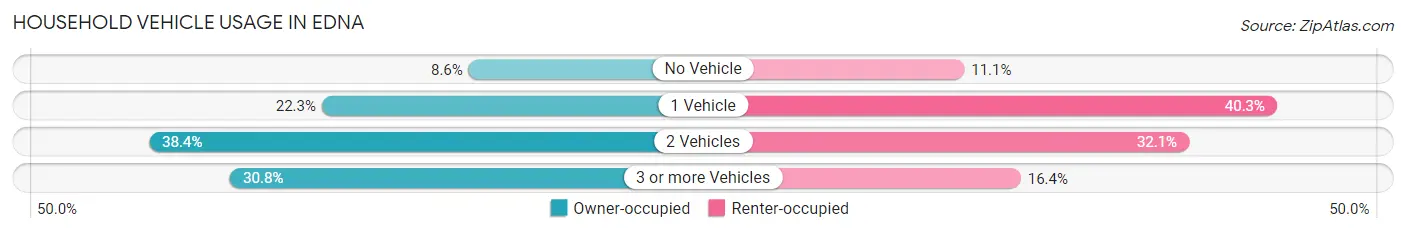
| Vehicles per Household | Owner-occupied | Renter-occupied |
| No Vehicle | 113 (8.6%) | 76 (11.1%) |
| 1 Vehicle | 294 (22.3%) | 275 (40.3%) |
| 2 Vehicles | 507 (38.4%) | 219 (32.1%) |
| 3 or more Vehicles | 407 (30.8%) | 112 (16.4%) |
| Total | 1,321 (100.0%) | 682 (100.0%) |
Real Estate & Mortgages in Edna
Real Estate and Mortgage Overview in Edna
| Characteristic | Without Mortgage | With Mortgage |
| Housing Units | 715 | 606 |
| Median Property Value | $101,300 | $100,200 |
| Median Household Income | $59,402 | $57 |
| Monthly Housing Costs | $486 | $41 |
| Real Estate Taxes | $1,031 | $29 |
Property Value by Mortgage Status in Edna
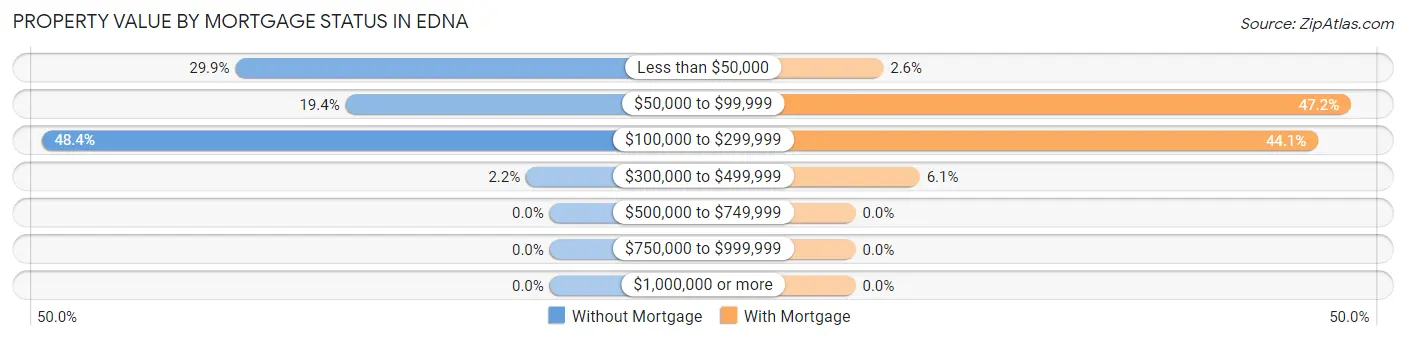
| Property Value | Without Mortgage | With Mortgage |
| Less than $50,000 | 214 (29.9%) | 16 (2.6%) |
| $50,000 to $99,999 | 139 (19.4%) | 286 (47.2%) |
| $100,000 to $299,999 | 346 (48.4%) | 267 (44.1%) |
| $300,000 to $499,999 | 16 (2.2%) | 37 (6.1%) |
| $500,000 to $749,999 | 0 (0.0%) | 0 (0.0%) |
| $750,000 to $999,999 | 0 (0.0%) | 0 (0.0%) |
| $1,000,000 or more | 0 (0.0%) | 0 (0.0%) |
| Total | 715 (100.0%) | 606 (100.0%) |
Household Income by Mortgage Status in Edna
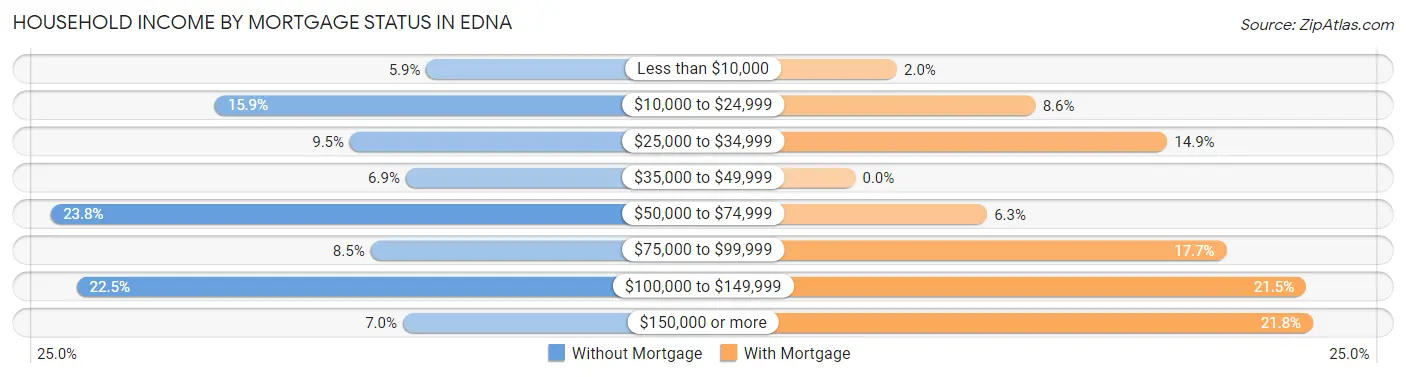
| Household Income | Without Mortgage | With Mortgage |
| Less than $10,000 | 42 (5.9%) | 12 (2.0%) |
| $10,000 to $24,999 | 114 (15.9%) | 52 (8.6%) |
| $25,000 to $34,999 | 68 (9.5%) | 90 (14.8%) |
| $35,000 to $49,999 | 49 (6.9%) | 0 (0.0%) |
| $50,000 to $74,999 | 170 (23.8%) | 38 (6.3%) |
| $75,000 to $99,999 | 61 (8.5%) | 107 (17.7%) |
| $100,000 to $149,999 | 161 (22.5%) | 130 (21.4%) |
| $150,000 or more | 50 (7.0%) | 132 (21.8%) |
| Total | 715 (100.0%) | 606 (100.0%) |
Property Value to Household Income Ratio in Edna
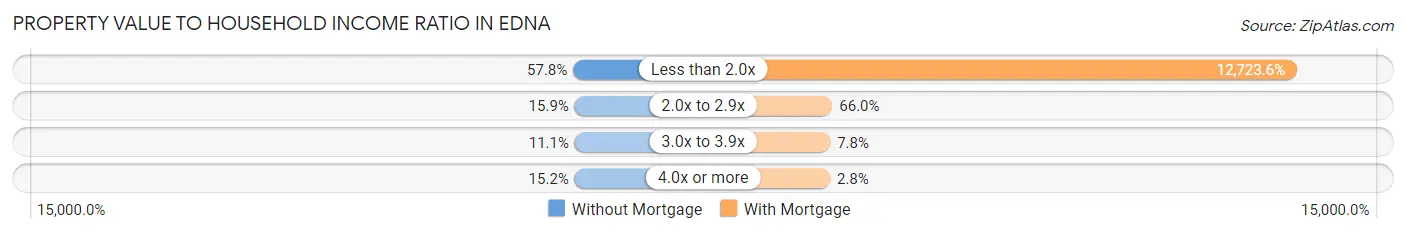
| Value-to-Income Ratio | Without Mortgage | With Mortgage |
| Less than 2.0x | 413 (57.8%) | 77,105 (12,723.6%) |
| 2.0x to 2.9x | 114 (15.9%) | 400 (66.0%) |
| 3.0x to 3.9x | 79 (11.1%) | 47 (7.8%) |
| 4.0x or more | 109 (15.2%) | 17 (2.8%) |
| Total | 715 (100.0%) | 606 (100.0%) |
Real Estate Taxes by Mortgage Status in Edna
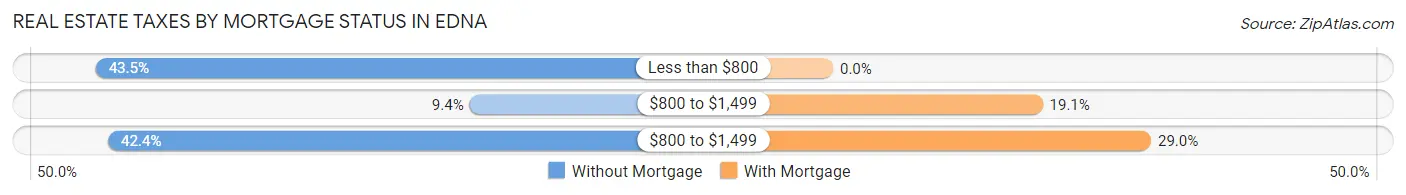
| Property Taxes | Without Mortgage | With Mortgage |
| Less than $800 | 311 (43.5%) | 0 (0.0%) |
| $800 to $1,499 | 67 (9.4%) | 116 (19.1%) |
| $800 to $1,499 | 303 (42.4%) | 176 (29.0%) |
| Total | 715 (100.0%) | 606 (100.0%) |
Health & Disability in Edna
Health Insurance Coverage by Age in Edna
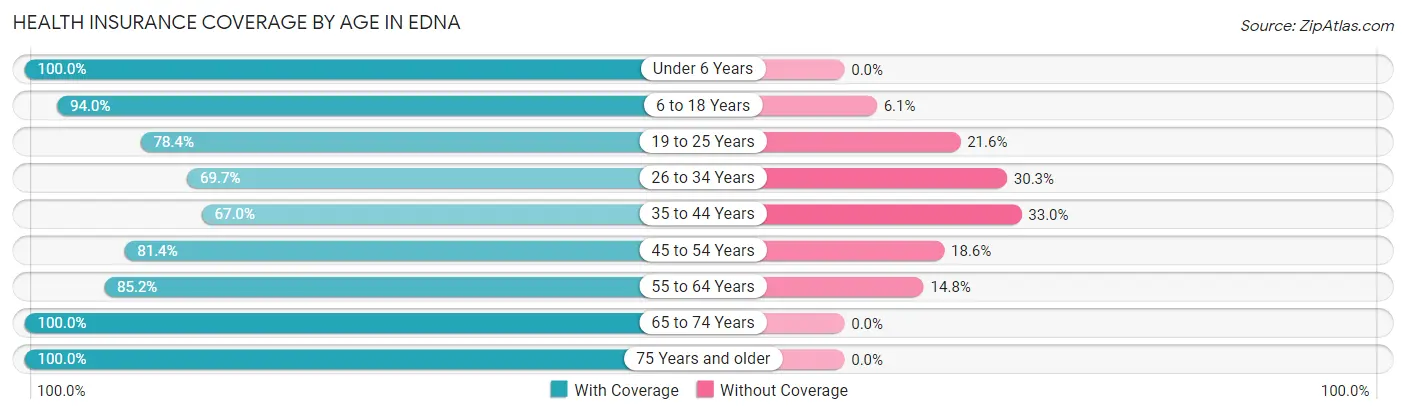
| Age Bracket | With Coverage | Without Coverage |
| Under 6 Years | 522 (100.0%) | 0 (0.0%) |
| 6 to 18 Years | 1,195 (94.0%) | 77 (6.0%) |
| 19 to 25 Years | 290 (78.4%) | 80 (21.6%) |
| 26 to 34 Years | 324 (69.7%) | 141 (30.3%) |
| 35 to 44 Years | 633 (67.0%) | 312 (33.0%) |
| 45 to 54 Years | 538 (81.4%) | 123 (18.6%) |
| 55 to 64 Years | 524 (85.2%) | 91 (14.8%) |
| 65 to 74 Years | 380 (100.0%) | 0 (0.0%) |
| 75 Years and older | 588 (100.0%) | 0 (0.0%) |
| Total | 4,994 (85.8%) | 824 (14.2%) |
Health Insurance Coverage by Citizenship Status in Edna
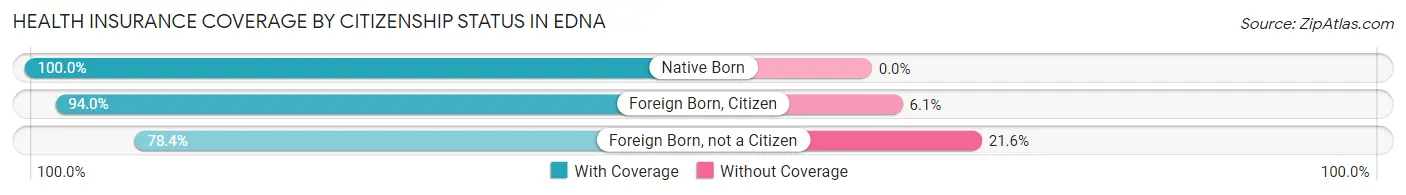
| Citizenship Status | With Coverage | Without Coverage |
| Native Born | 522 (100.0%) | 0 (0.0%) |
| Foreign Born, Citizen | 1,195 (94.0%) | 77 (6.0%) |
| Foreign Born, not a Citizen | 290 (78.4%) | 80 (21.6%) |
Health Insurance Coverage by Household Income in Edna
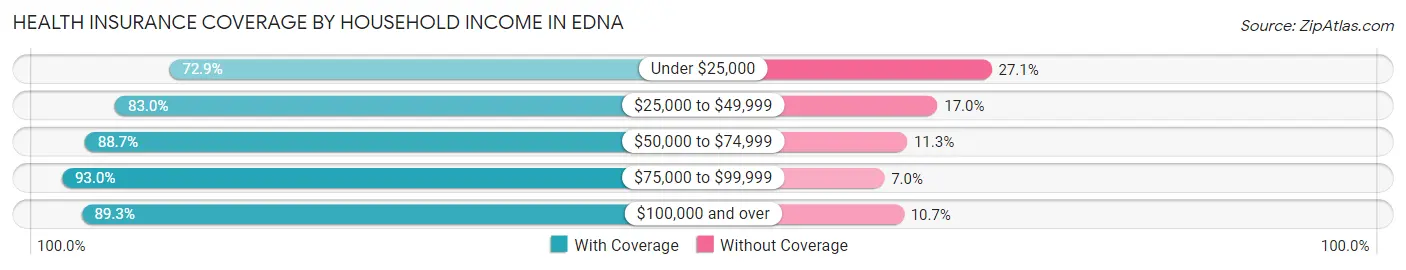
| Household Income | With Coverage | Without Coverage |
| Under $25,000 | 825 (72.9%) | 307 (27.1%) |
| $25,000 to $49,999 | 656 (83.0%) | 134 (17.0%) |
| $50,000 to $74,999 | 897 (88.7%) | 114 (11.3%) |
| $75,000 to $99,999 | 969 (93.0%) | 73 (7.0%) |
| $100,000 and over | 1,643 (89.3%) | 196 (10.7%) |
Public vs Private Health Insurance Coverage by Age in Edna
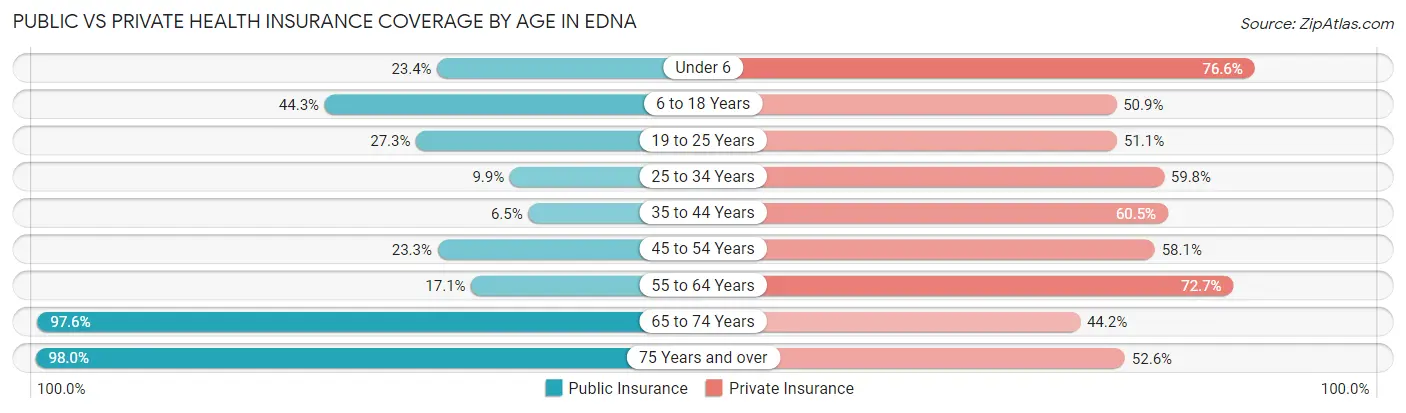
| Age Bracket | Public Insurance | Private Insurance |
| Under 6 | 122 (23.4%) | 400 (76.6%) |
| 6 to 18 Years | 563 (44.3%) | 648 (50.9%) |
| 19 to 25 Years | 101 (27.3%) | 189 (51.1%) |
| 25 to 34 Years | 46 (9.9%) | 278 (59.8%) |
| 35 to 44 Years | 61 (6.5%) | 572 (60.5%) |
| 45 to 54 Years | 154 (23.3%) | 384 (58.1%) |
| 55 to 64 Years | 105 (17.1%) | 447 (72.7%) |
| 65 to 74 Years | 371 (97.6%) | 168 (44.2%) |
| 75 Years and over | 576 (98.0%) | 309 (52.5%) |
| Total | 2,099 (36.1%) | 3,395 (58.4%) |
Disability Status by Sex by Age in Edna
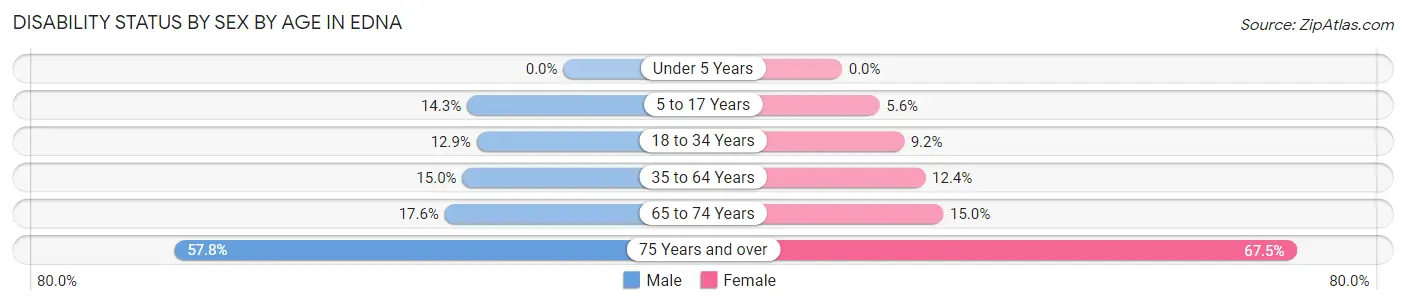
| Age Bracket | Male | Female |
| Under 5 Years | 0 (0.0%) | 0 (0.0%) |
| 5 to 17 Years | 91 (14.3%) | 40 (5.6%) |
| 18 to 34 Years | 56 (12.9%) | 41 (9.2%) |
| 35 to 64 Years | 156 (15.0%) | 146 (12.4%) |
| 65 to 74 Years | 40 (17.6%) | 23 (15.0%) |
| 75 Years and over | 130 (57.8%) | 245 (67.5%) |
Disability Class by Sex by Age in Edna
Disability Class: Hearing Difficulty
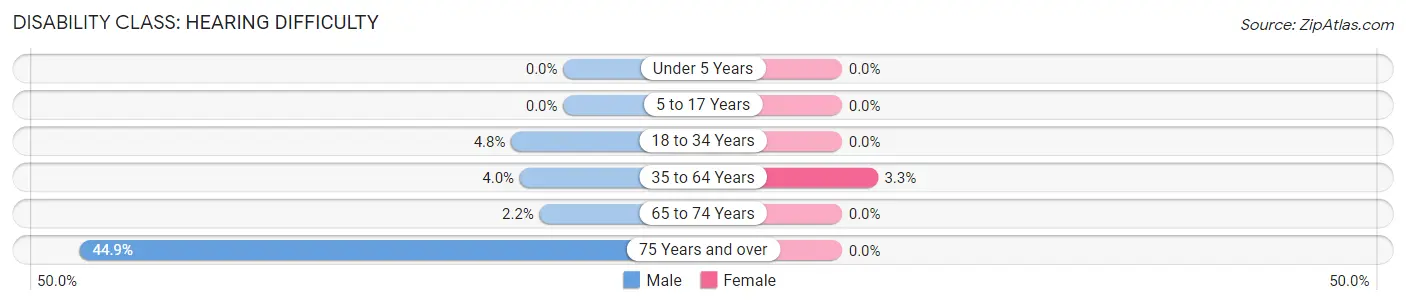
| Age Bracket | Male | Female |
| Under 5 Years | 0 (0.0%) | 0 (0.0%) |
| 5 to 17 Years | 0 (0.0%) | 0 (0.0%) |
| 18 to 34 Years | 21 (4.8%) | 0 (0.0%) |
| 35 to 64 Years | 42 (4.0%) | 39 (3.3%) |
| 65 to 74 Years | 5 (2.2%) | 0 (0.0%) |
| 75 Years and over | 101 (44.9%) | 0 (0.0%) |
Disability Class: Vision Difficulty
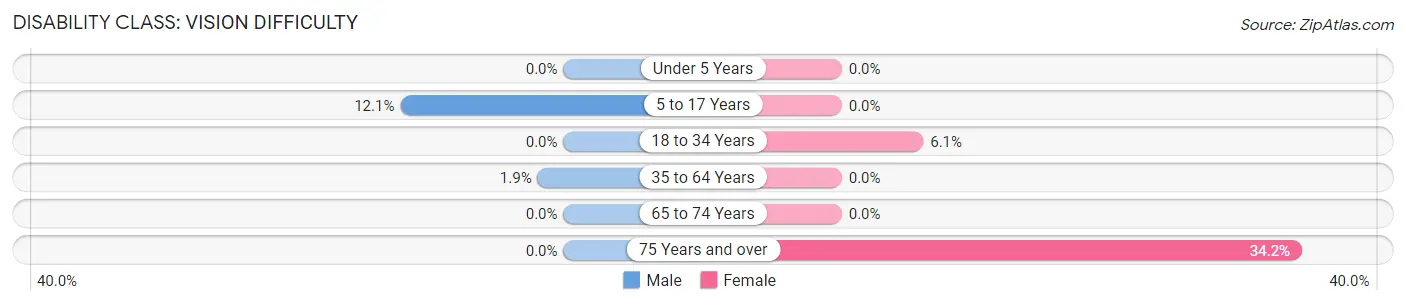
| Age Bracket | Male | Female |
| Under 5 Years | 0 (0.0%) | 0 (0.0%) |
| 5 to 17 Years | 77 (12.1%) | 0 (0.0%) |
| 18 to 34 Years | 0 (0.0%) | 27 (6.0%) |
| 35 to 64 Years | 20 (1.9%) | 0 (0.0%) |
| 65 to 74 Years | 0 (0.0%) | 0 (0.0%) |
| 75 Years and over | 0 (0.0%) | 124 (34.2%) |
Disability Class: Cognitive Difficulty
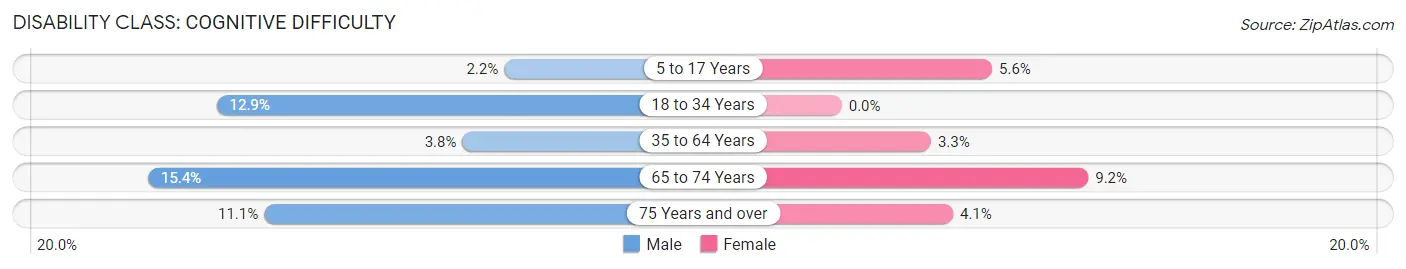
| Age Bracket | Male | Female |
| 5 to 17 Years | 14 (2.2%) | 40 (5.6%) |
| 18 to 34 Years | 56 (12.9%) | 0 (0.0%) |
| 35 to 64 Years | 39 (3.7%) | 39 (3.3%) |
| 65 to 74 Years | 35 (15.4%) | 14 (9.1%) |
| 75 Years and over | 25 (11.1%) | 15 (4.1%) |
Disability Class: Ambulatory Difficulty
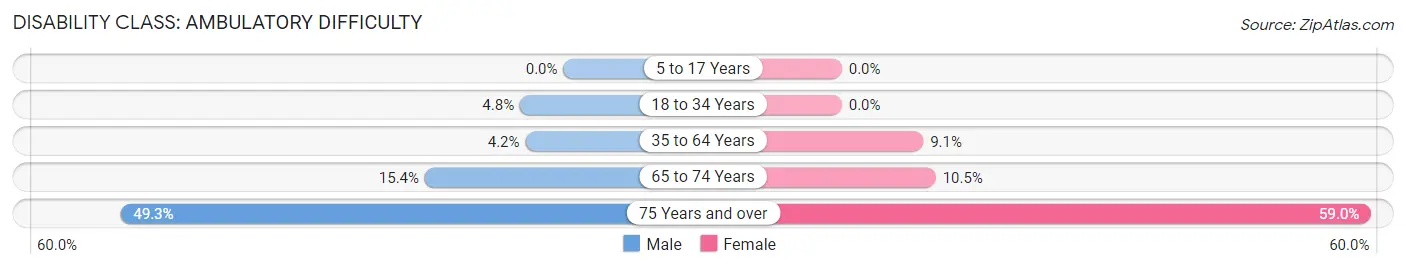
| Age Bracket | Male | Female |
| 5 to 17 Years | 0 (0.0%) | 0 (0.0%) |
| 18 to 34 Years | 21 (4.8%) | 0 (0.0%) |
| 35 to 64 Years | 44 (4.2%) | 107 (9.1%) |
| 65 to 74 Years | 35 (15.4%) | 16 (10.5%) |
| 75 Years and over | 111 (49.3%) | 214 (59.0%) |
Disability Class: Self-Care Difficulty
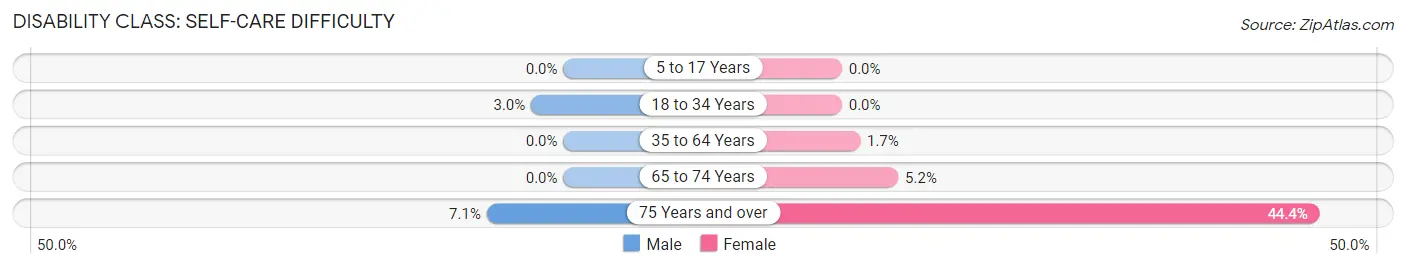
| Age Bracket | Male | Female |
| 5 to 17 Years | 0 (0.0%) | 0 (0.0%) |
| 18 to 34 Years | 13 (3.0%) | 0 (0.0%) |
| 35 to 64 Years | 0 (0.0%) | 20 (1.7%) |
| 65 to 74 Years | 0 (0.0%) | 8 (5.2%) |
| 75 Years and over | 16 (7.1%) | 161 (44.4%) |
Technology Access in Edna
Computing Device Access in Edna
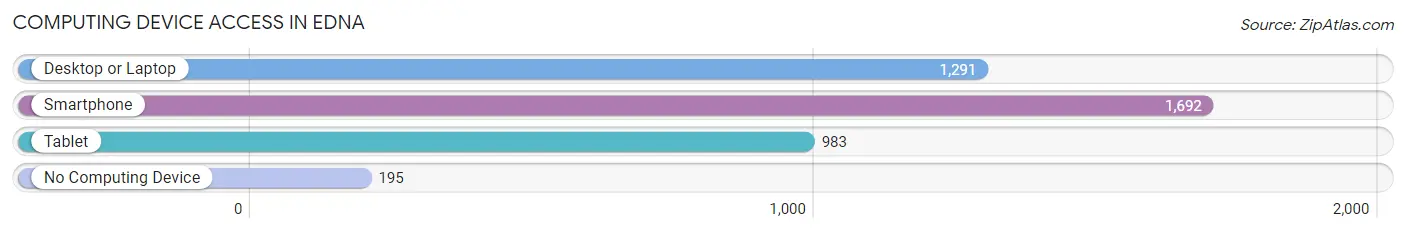
| Device Type | # Households | % Households |
| Desktop or Laptop | 1,291 | 64.4% |
| Smartphone | 1,692 | 84.5% |
| Tablet | 983 | 49.1% |
| No Computing Device | 195 | 9.7% |
| Total | 2,003 | 100.0% |
Internet Access in Edna
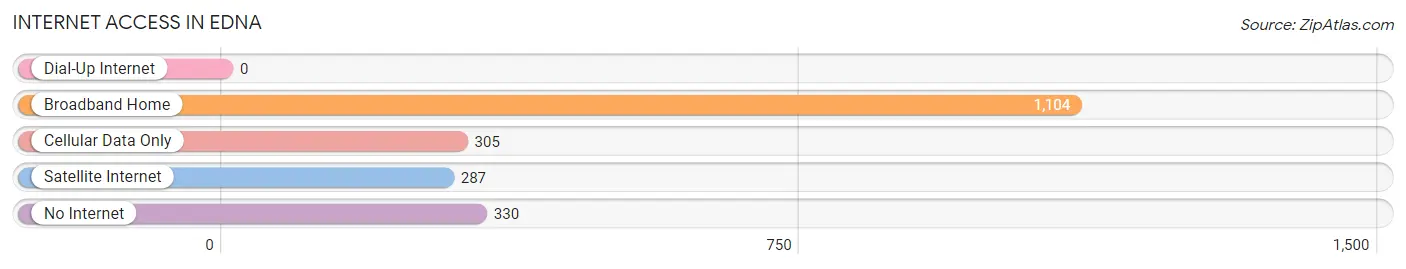
| Internet Type | # Households | % Households |
| Dial-Up Internet | 0 | 0.0% |
| Broadband Home | 1,104 | 55.1% |
| Cellular Data Only | 305 | 15.2% |
| Satellite Internet | 287 | 14.3% |
| No Internet | 330 | 16.5% |
| Total | 2,003 | 100.0% |
Edna Summary
Edna, Texas is a small city located in Jackson County, Texas. It is situated about halfway between Houston and Corpus Christi, and is the county seat of Jackson County. The city was founded in 1883 and named after Edna, the daughter of a local rancher. The population of Edna was 2,611 at the 2010 census.
Geography
Edna is located at 28°56'25" North, 96°37'17" West (28.940278, -96.621389). It is situated in the Coastal Plains region of Texas, and is about halfway between Houston and Corpus Christi. The city is located on the banks of the Lavaca River, and is surrounded by rolling hills and farmland. The climate is humid subtropical, with hot summers and mild winters.
Economy
The economy of Edna is largely based on agriculture and oil and gas production. The city is home to several large farms and ranches, and is a major producer of cotton, corn, and other crops. The oil and gas industry is also a major employer in the area, with several oil and gas companies operating in the area.
In addition to agriculture and oil and gas, Edna is home to several small businesses, including restaurants, retail stores, and service providers. The city is also home to a number of manufacturing companies, including a plastics plant and a paper mill.
Demographics
As of the 2010 census, the population of Edna was 2,611. The racial makeup of the city was 79.2% White, 16.2% Hispanic or Latino, 1.2% African American, 0.7% Native American, 0.3% Asian, and 2.4% from other races. The median household income was $31,250, and the median family income was $37,500.
Education
Edna is served by the Edna Independent School District, which includes Edna Elementary School, Edna Junior High School, and Edna High School. The city is also home to a branch of the Victoria College, which offers a variety of courses and programs.
Conclusion
Edna, Texas is a small city located in Jackson County, Texas. It is situated about halfway between Houston and Corpus Christi, and is the county seat of Jackson County. The city was founded in 1883 and named after Edna, the daughter of a local rancher. The economy of Edna is largely based on agriculture and oil and gas production, and the city is home to several small businesses, including restaurants, retail stores, and service providers. The population of Edna was 2,611 at the 2010 census, and the racial makeup of the city was 79.2% White, 16.2% Hispanic or Latino, 1.2% African American, 0.7% Native American, 0.3% Asian, and 2.4% from other races. The city is served by the Edna Independent School District, which includes Edna Elementary School, Edna Junior High School, and Edna High School.
Common Questions
What is Per Capita Income in Edna?
Per Capita income in Edna is $24,868.
What is the Median Family Income in Edna?
Median Family Income in Edna is $66,400.
What is the Median Household income in Edna?
Median Household Income in Edna is $60,361.
What is Income or Wage Gap in Edna?
Income or Wage Gap in Edna is 58.2%.
Women in Edna earn 41.8 cents for every dollar earned by a man.
What is Family Income Deficit in Edna?
Family Income Deficit in Edna is $7,654.
Families that are below poverty line in Edna earn $7,654 less on average than the poverty threshold level.
What is Inequality or Gini Index in Edna?
Inequality or Gini Index in Edna is 0.41.
What is the Total Population of Edna?
Total Population of Edna is 5,985.
What is the Total Male Population of Edna?
Total Male Population of Edna is 2,885.
What is the Total Female Population of Edna?
Total Female Population of Edna is 3,100.
What is the Ratio of Males per 100 Females in Edna?
There are 93.06 Males per 100 Females in Edna.
What is the Ratio of Females per 100 Males in Edna?
There are 107.45 Females per 100 Males in Edna.
What is the Median Population Age in Edna?
Median Population Age in Edna is 38.3 Years.
What is the Average Family Size in Edna
Average Family Size in Edna is 3.3 People.
What is the Average Household Size in Edna
Average Household Size in Edna is 2.9 People.
How Large is the Labor Force in Edna?
There are 2,559 People in the Labor Forcein in Edna.
What is the Percentage of People in the Labor Force in Edna?
55.3% of People are in the Labor Force in Edna.
What is the Unemployment Rate in Edna?
Unemployment Rate in Edna is 7.3%.