Edcouch, TX Map & Demographics
Edcouch Map
Edcouch Overview
$19,983
PER CAPITA INCOME
$58,194
AVG FAMILY INCOME
$38,594
AVG HOUSEHOLD INCOME
10.0%
WAGE / INCOME GAP [ % ]
90.0¢/ $1
WAGE / INCOME GAP [ $ ]
$7,927
FAMILY INCOME DEFICIT
0.46
INEQUALITY / GINI INDEX
2,754
TOTAL POPULATION
1,378
MALE POPULATION
1,376
FEMALE POPULATION
100.15
MALES / 100 FEMALES
99.85
FEMALES / 100 MALES
38.9
MEDIAN AGE
3.4
AVG FAMILY SIZE
2.8
AVG HOUSEHOLD SIZE
1,171
LABOR FORCE [ PEOPLE ]
54.3%
PERCENT IN LABOR FORCE
7.8%
UNEMPLOYMENT RATE
Edcouch Zip Codes
Edcouch Area Codes
Income in Edcouch
Income Overview in Edcouch
Per Capita Income in Edcouch is $19,983, while median incomes of families and households are $58,194 and $38,594 respectively.
| Characteristic | Number | Measure |
| Per Capita Income | 2,754 | $19,983 |
| Median Family Income | 713 | $58,194 |
| Mean Family Income | 713 | $67,386 |
| Median Household Income | 977 | $38,594 |
| Mean Household Income | 977 | $54,210 |
| Income Deficit | 713 | $7,927 |
| Wage / Income Gap (%) | 2,754 | 9.96% |
| Wage / Income Gap ($) | 2,754 | 90.04¢ per $1 |
| Gini / Inequality Index | 2,754 | 0.46 |
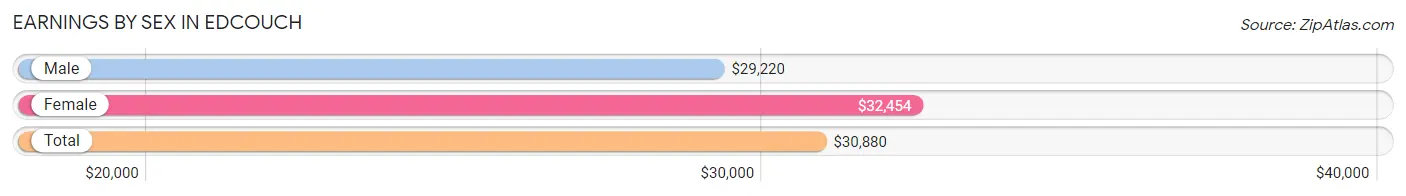
Earnings by Sex in Edcouch
Average Earnings in Edcouch are $30,880, $29,220 for men and $32,454 for women, a difference of 10.0%.
| Sex | Number | Average Earnings |
| Male | 644 (55.1%) | $29,220 |
| Female | 524 (44.9%) | $32,454 |
| Total | 1,168 (100.0%) | $30,880 |
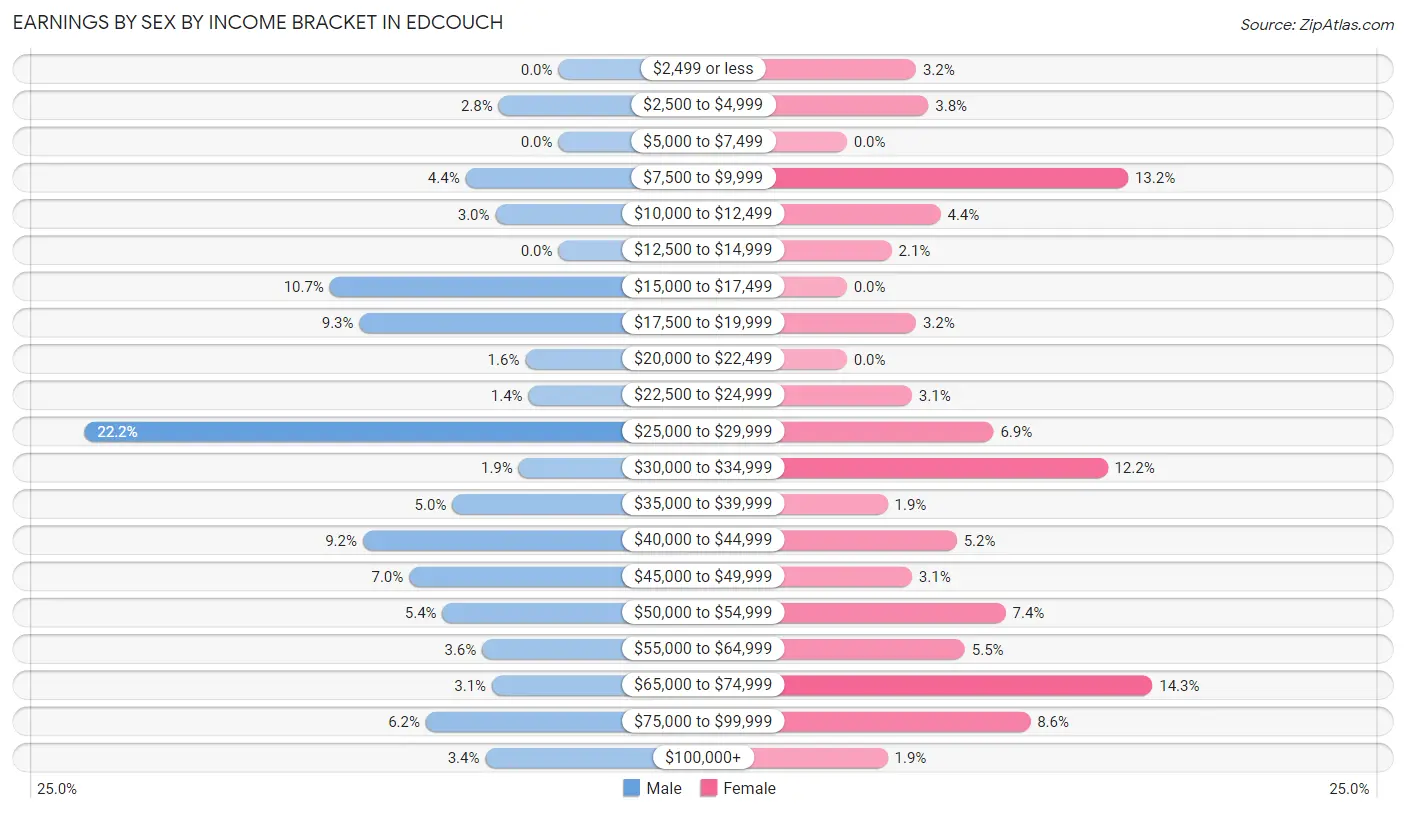
Earnings by Sex by Income Bracket in Edcouch
The most common earnings brackets in Edcouch are $25,000 to $29,999 for men (143 | 22.2%) and $65,000 to $74,999 for women (75 | 14.3%).
| Income | Male | Female |
| $2,499 or less | 0 (0.0%) | 17 (3.2%) |
| $2,500 to $4,999 | 18 (2.8%) | 20 (3.8%) |
| $5,000 to $7,499 | 0 (0.0%) | 0 (0.0%) |
| $7,500 to $9,999 | 28 (4.3%) | 69 (13.2%) |
| $10,000 to $12,499 | 19 (2.9%) | 23 (4.4%) |
| $12,500 to $14,999 | 0 (0.0%) | 11 (2.1%) |
| $15,000 to $17,499 | 69 (10.7%) | 0 (0.0%) |
| $17,500 to $19,999 | 60 (9.3%) | 17 (3.2%) |
| $20,000 to $22,499 | 10 (1.5%) | 0 (0.0%) |
| $22,500 to $24,999 | 9 (1.4%) | 16 (3.0%) |
| $25,000 to $29,999 | 143 (22.2%) | 36 (6.9%) |
| $30,000 to $34,999 | 12 (1.9%) | 64 (12.2%) |
| $35,000 to $39,999 | 32 (5.0%) | 10 (1.9%) |
| $40,000 to $44,999 | 59 (9.2%) | 27 (5.1%) |
| $45,000 to $49,999 | 45 (7.0%) | 16 (3.0%) |
| $50,000 to $54,999 | 35 (5.4%) | 39 (7.4%) |
| $55,000 to $64,999 | 23 (3.6%) | 29 (5.5%) |
| $65,000 to $74,999 | 20 (3.1%) | 75 (14.3%) |
| $75,000 to $99,999 | 40 (6.2%) | 45 (8.6%) |
| $100,000+ | 22 (3.4%) | 10 (1.9%) |
| Total | 644 (100.0%) | 524 (100.0%) |
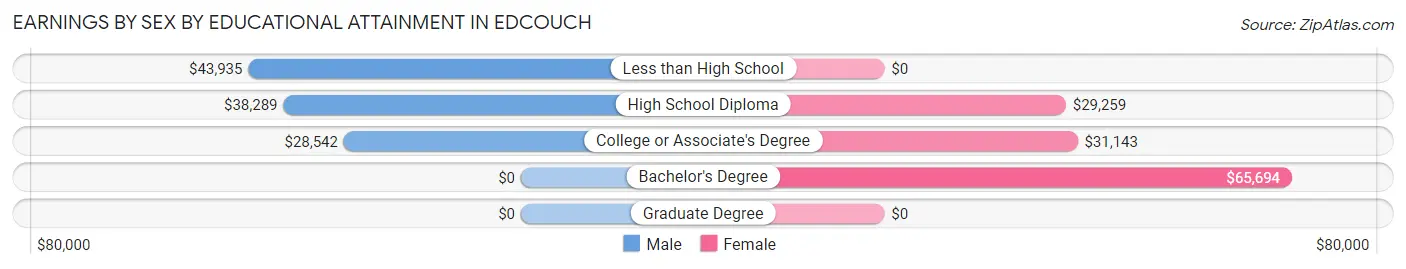
Earnings by Sex by Educational Attainment in Edcouch
Average earnings in Edcouch are $36,635 for men and $32,500 for women, a difference of 11.3%. Men with an educational attainment of less than high school enjoy the highest average annual earnings of $43,935, while those with college or associate's degree education earn the least with $28,542. Women with an educational attainment of bachelor's degree earn the most with the average annual earnings of $65,694, while those with high school diploma education have the smallest earnings of $29,259.
| Educational Attainment | Male Income | Female Income |
| Less than High School | $43,935 | $0 |
| High School Diploma | $38,289 | $29,259 |
| College or Associate's Degree | $28,542 | $31,143 |
| Bachelor's Degree | - | - |
| Graduate Degree | - | - |
| Total | $36,635 | $32,500 |
Family Income in Edcouch
Family Income Brackets in Edcouch
According to the Edcouch family income data, there are 144 families falling into the $75,000 to $99,999 income range, which is the most common income bracket and makes up 20.2% of all families.
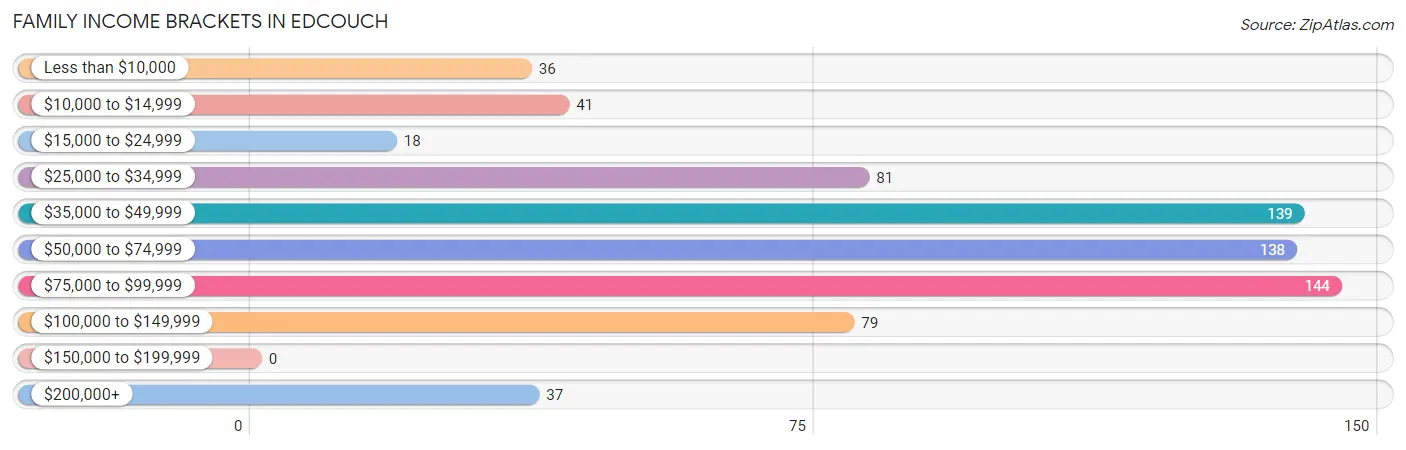
| Income Bracket | # Families | % Families |
| Less than $10,000 | 36 | 5.0% |
| $10,000 to $14,999 | 41 | 5.8% |
| $15,000 to $24,999 | 18 | 2.5% |
| $25,000 to $34,999 | 81 | 11.4% |
| $35,000 to $49,999 | 139 | 19.5% |
| $50,000 to $74,999 | 138 | 19.4% |
| $75,000 to $99,999 | 144 | 20.2% |
| $100,000 to $149,999 | 79 | 11.1% |
| $150,000 to $199,999 | 0 | 0.0% |
| $200,000+ | 37 | 5.2% |
Family Income by Famaliy Size in Edcouch
3-person families (216 | 30.3%) account for the highest median family income in Edcouch with $65,806 per family, while 3-person families (216 | 30.3%) have the highest median income of $21,935 per family member.
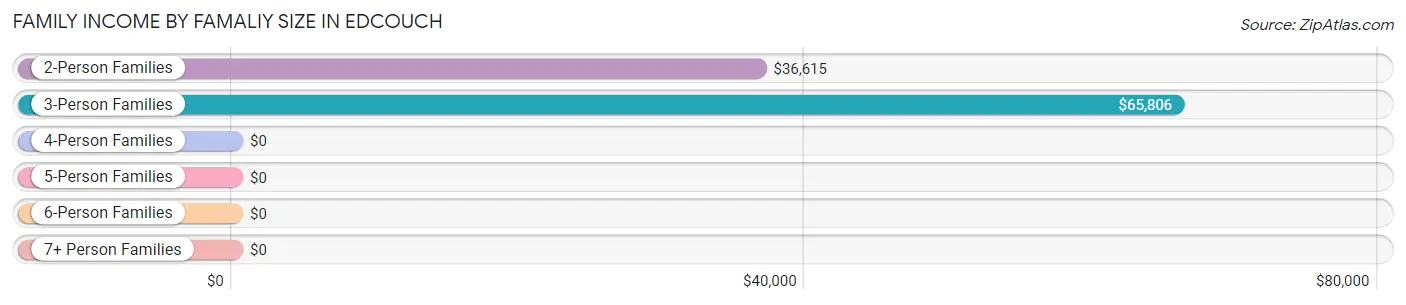
| Income Bracket | # Families | Median Income |
| 2-Person Families | 272 (38.2%) | $36,615 |
| 3-Person Families | 216 (30.3%) | $65,806 |
| 4-Person Families | 95 (13.3%) | $0 |
| 5-Person Families | 68 (9.5%) | $0 |
| 6-Person Families | 35 (4.9%) | $0 |
| 7+ Person Families | 27 (3.8%) | $0 |
| Total | 713 (100.0%) | $58,194 |
Family Income by Number of Earners in Edcouch
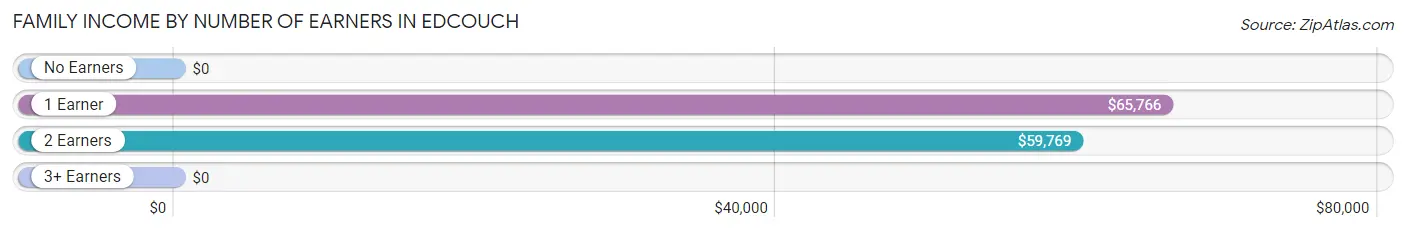
| Number of Earners | # Families | Median Income |
| No Earners | 158 (22.2%) | $0 |
| 1 Earner | 195 (27.4%) | $65,766 |
| 2 Earners | 259 (36.3%) | $59,769 |
| 3+ Earners | 101 (14.2%) | $0 |
| Total | 713 (100.0%) | $58,194 |
Household Income in Edcouch
Household Income Brackets in Edcouch
With 160 households falling in the category, the $75,000 to $99,999 income range is the most frequent in Edcouch, accounting for 16.4% of all households.
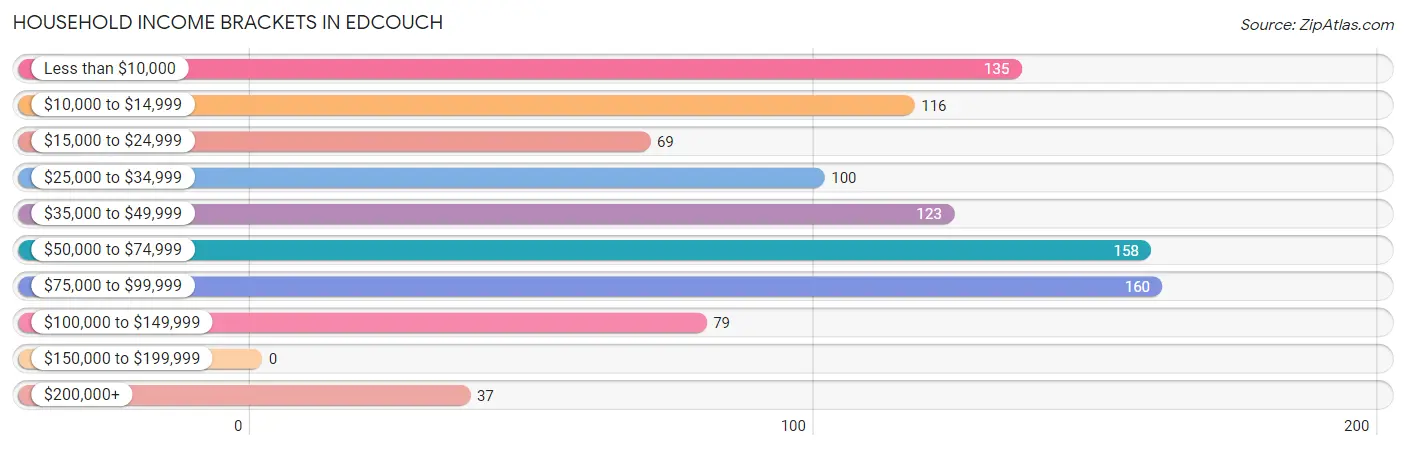
| Income Bracket | # Households | % Households |
| Less than $10,000 | 135 | 13.8% |
| $10,000 to $14,999 | 116 | 11.9% |
| $15,000 to $24,999 | 69 | 7.1% |
| $25,000 to $34,999 | 100 | 10.2% |
| $35,000 to $49,999 | 123 | 12.6% |
| $50,000 to $74,999 | 158 | 16.2% |
| $75,000 to $99,999 | 160 | 16.4% |
| $100,000 to $149,999 | 79 | 8.1% |
| $150,000 to $199,999 | 0 | 0.0% |
| $200,000+ | 37 | 3.8% |
Household Income by Householder Age in Edcouch
The median household income in Edcouch is $38,594, with the highest median household income of $58,704 found in the 45 to 64 years age bracket for the primary householder. A total of 342 households (35.0%) fall into this category. Meanwhile, the 15 to 24 years age bracket for the primary householder has the lowest median household income of $0, with 59 households (6.0%) in this group.
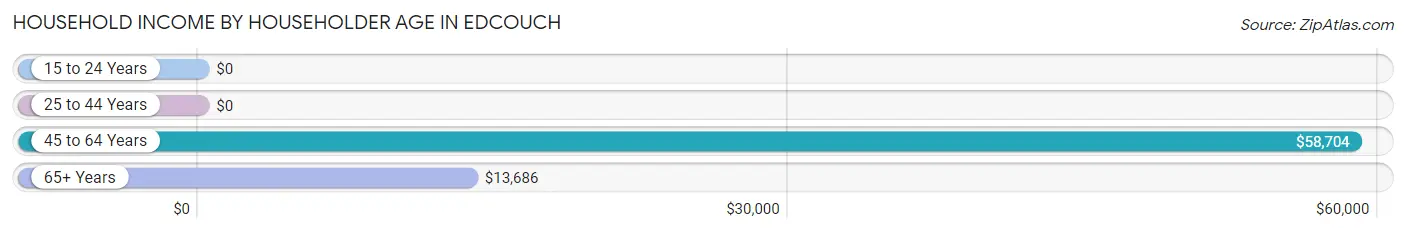
| Income Bracket | # Households | Median Income |
| 15 to 24 Years | 59 (6.0%) | $0 |
| 25 to 44 Years | 286 (29.3%) | $0 |
| 45 to 64 Years | 342 (35.0%) | $58,704 |
| 65+ Years | 290 (29.7%) | $13,686 |
| Total | 977 (100.0%) | $38,594 |
Poverty in Edcouch
Income Below Poverty by Sex and Age in Edcouch
With 23.6% poverty level for males and 27.5% for females among the residents of Edcouch, 75 year old and over males and 15 year old females are the most vulnerable to poverty, with 57 males (76.0%) and 9 females (100.0%) in their respective age groups living below the poverty level.
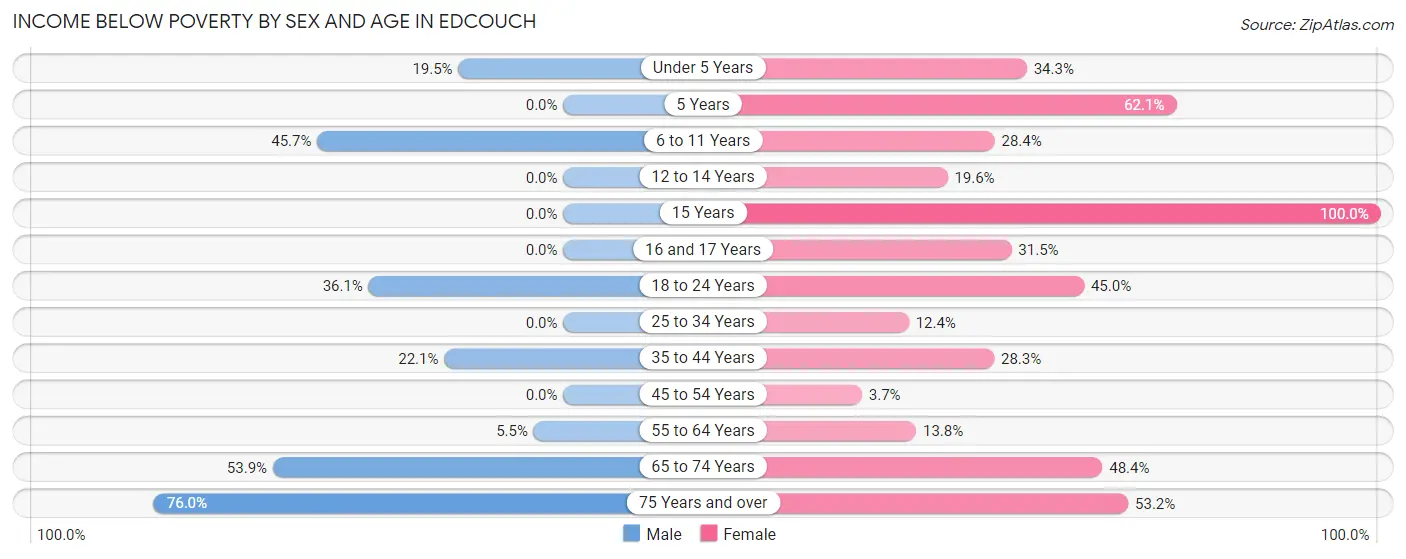
| Age Bracket | Male | Female |
| Under 5 Years | 22 (19.5%) | 23 (34.3%) |
| 5 Years | 0 (0.0%) | 18 (62.1%) |
| 6 to 11 Years | 58 (45.7%) | 36 (28.3%) |
| 12 to 14 Years | 0 (0.0%) | 10 (19.6%) |
| 15 Years | 0 (0.0%) | 9 (100.0%) |
| 16 and 17 Years | 0 (0.0%) | 17 (31.5%) |
| 18 to 24 Years | 56 (36.1%) | 49 (45.0%) |
| 25 to 34 Years | 0 (0.0%) | 19 (12.4%) |
| 35 to 44 Years | 61 (22.1%) | 52 (28.3%) |
| 45 to 54 Years | 0 (0.0%) | 8 (3.7%) |
| 55 to 64 Years | 9 (5.5%) | 20 (13.8%) |
| 65 to 74 Years | 62 (53.9%) | 59 (48.4%) |
| 75 Years and over | 57 (76.0%) | 59 (53.1%) |
| Total | 325 (23.6%) | 379 (27.5%) |
Income Above Poverty by Sex and Age in Edcouch
According to the poverty statistics in Edcouch, males aged 5 years and females aged 45 to 54 years are the age groups that are most secure financially, with 100.0% of males and 96.3% of females in these age groups living above the poverty line.
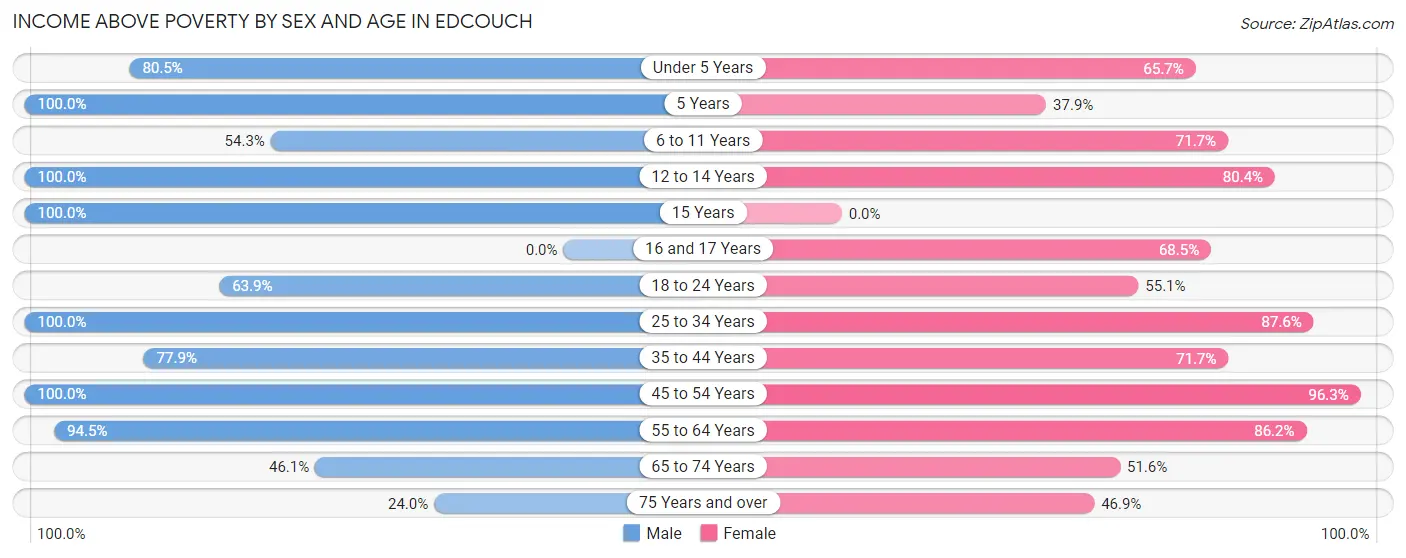
| Age Bracket | Male | Female |
| Under 5 Years | 91 (80.5%) | 44 (65.7%) |
| 5 Years | 26 (100.0%) | 11 (37.9%) |
| 6 to 11 Years | 69 (54.3%) | 91 (71.7%) |
| 12 to 14 Years | 30 (100.0%) | 41 (80.4%) |
| 15 Years | 18 (100.0%) | 0 (0.0%) |
| 16 and 17 Years | 0 (0.0%) | 37 (68.5%) |
| 18 to 24 Years | 99 (63.9%) | 60 (55.0%) |
| 25 to 34 Years | 147 (100.0%) | 134 (87.6%) |
| 35 to 44 Years | 215 (77.9%) | 132 (71.7%) |
| 45 to 54 Years | 132 (100.0%) | 207 (96.3%) |
| 55 to 64 Years | 155 (94.5%) | 125 (86.2%) |
| 65 to 74 Years | 53 (46.1%) | 63 (51.6%) |
| 75 Years and over | 18 (24.0%) | 52 (46.9%) |
| Total | 1,053 (76.4%) | 997 (72.5%) |
Income Below Poverty Among Married-Couple Families in Edcouch
The poverty statistics for married-couple families in Edcouch show that 10.5% or 49 of the total 468 families live below the poverty line. Families with 5 or more children have the highest poverty rate of 100.0%, comprising of 19 families. On the other hand, families with 3 or 4 children have the lowest poverty rate of 0.0%, which includes 0 families.
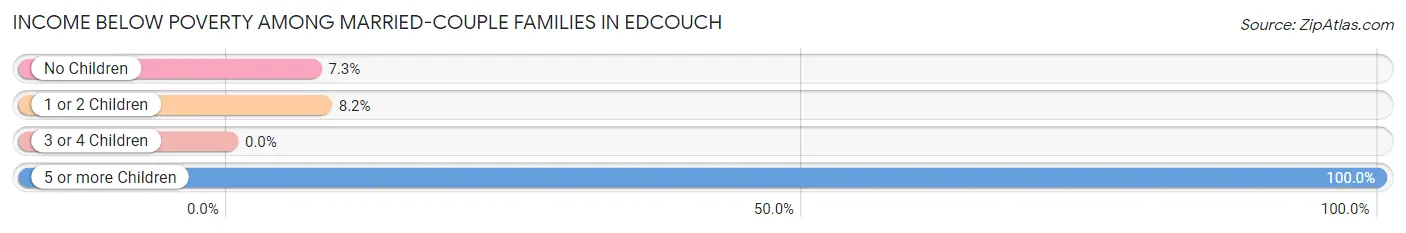
| Children | Above Poverty | Below Poverty |
| No Children | 281 (92.7%) | 22 (7.3%) |
| 1 or 2 Children | 90 (91.8%) | 8 (8.2%) |
| 3 or 4 Children | 48 (100.0%) | 0 (0.0%) |
| 5 or more Children | 0 (0.0%) | 19 (100.0%) |
| Total | 419 (89.5%) | 49 (10.5%) |
Income Below Poverty Among Single-Parent Households in Edcouch
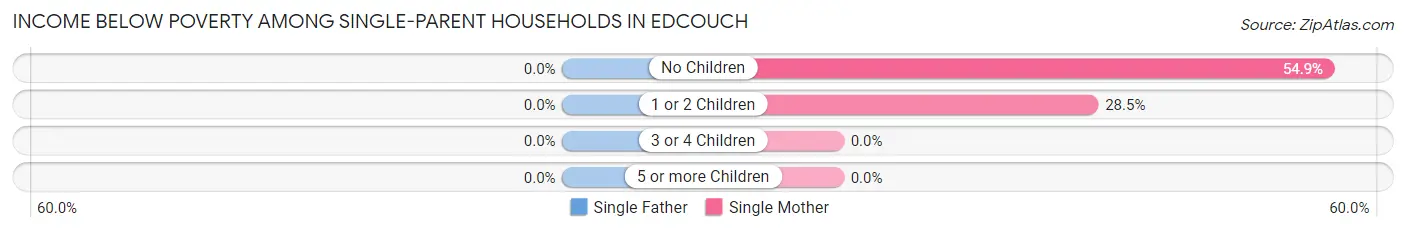
| Children | Single Father | Single Mother |
| No Children | 0 (0.0%) | 56 (54.9%) |
| 1 or 2 Children | 0 (0.0%) | 33 (28.4%) |
| 3 or 4 Children | 0 (0.0%) | 0 (0.0%) |
| 5 or more Children | 0 (0.0%) | 0 (0.0%) |
| Total | 0 (0.0%) | 89 (40.8%) |
Income Below Poverty Among Married-Couple vs Single-Parent Households in Edcouch
The poverty data for Edcouch shows that 49 of the married-couple family households (10.5%) and 89 of the single-parent households (36.3%) are living below the poverty level. Within the married-couple family households, those with 5 or more children have the highest poverty rate, with 19 households (100.0%) falling below the poverty line. Among the single-parent households, those with no children have the highest poverty rate, with 56 household (43.4%) living below poverty.
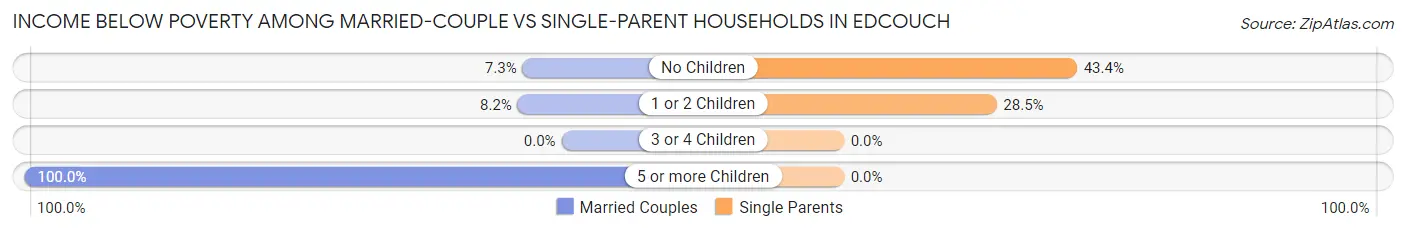
| Children | Married-Couple Families | Single-Parent Households |
| No Children | 22 (7.3%) | 56 (43.4%) |
| 1 or 2 Children | 8 (8.2%) | 33 (28.4%) |
| 3 or 4 Children | 0 (0.0%) | 0 (0.0%) |
| 5 or more Children | 19 (100.0%) | 0 (0.0%) |
| Total | 49 (10.5%) | 89 (36.3%) |
Race in Edcouch
The most populous races in Edcouch are Hispanic or Latino (2,724 | 98.9%), White / Caucasian (1,763 | 64.0%), and Two or more Races (991 | 36.0%).
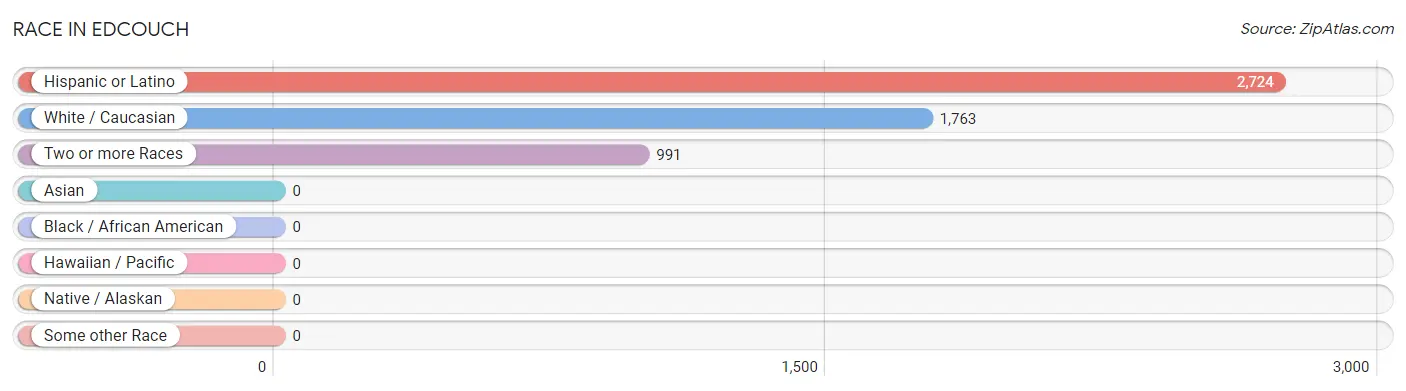
| Race | # Population | % Population |
| Asian | 0 | 0.0% |
| Black / African American | 0 | 0.0% |
| Hawaiian / Pacific | 0 | 0.0% |
| Hispanic or Latino | 2,724 | 98.9% |
| Native / Alaskan | 0 | 0.0% |
| White / Caucasian | 1,763 | 64.0% |
| Two or more Races | 991 | 36.0% |
| Some other Race | 0 | 0.0% |
| Total | 2,754 | 100.0% |
Ancestry in Edcouch
The most populous ancestries reported in Edcouch are Mexican (2,724 | 98.9%), American (47 | 1.7%), French (36 | 1.3%), English (25 | 0.9%), and Italian (7 | 0.3%), together accounting for 103.1% of all Edcouch residents.
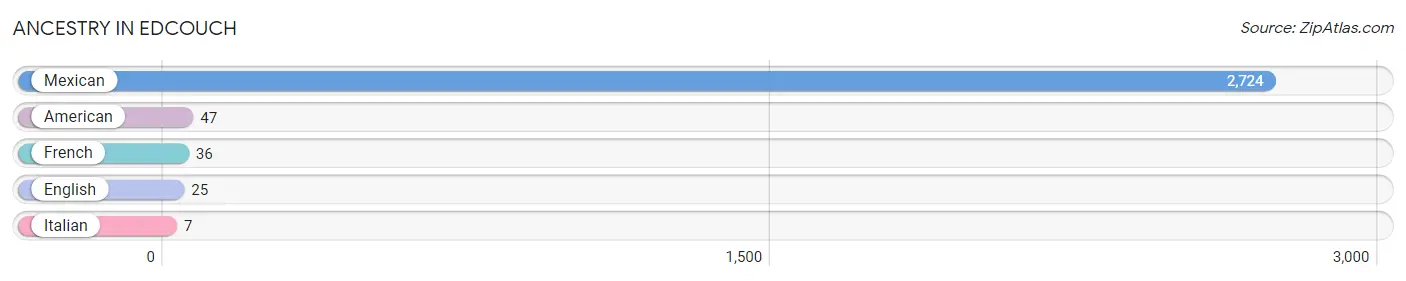
| Ancestry | # Population | % Population |
| American | 47 | 1.7% |
| English | 25 | 0.9% |
| French | 36 | 1.3% |
| Italian | 7 | 0.3% |
| Mexican | 2,724 | 98.9% | View All 5 Rows |
Immigrants in Edcouch
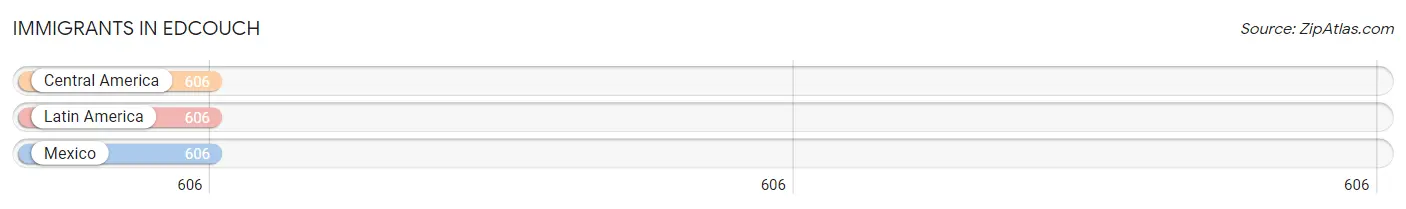
The most numerous immigrant groups reported in Edcouch came from Central America (606 | 22.0%), Latin America (606 | 22.0%), and Mexico (606 | 22.0%), together accounting for 66.0% of all Edcouch residents.
| Immigration Origin | # Population | % Population |
| Central America | 606 | 22.0% |
| Latin America | 606 | 22.0% |
| Mexico | 606 | 22.0% | View All 3 Rows |
Sex and Age in Edcouch
Sex and Age in Edcouch
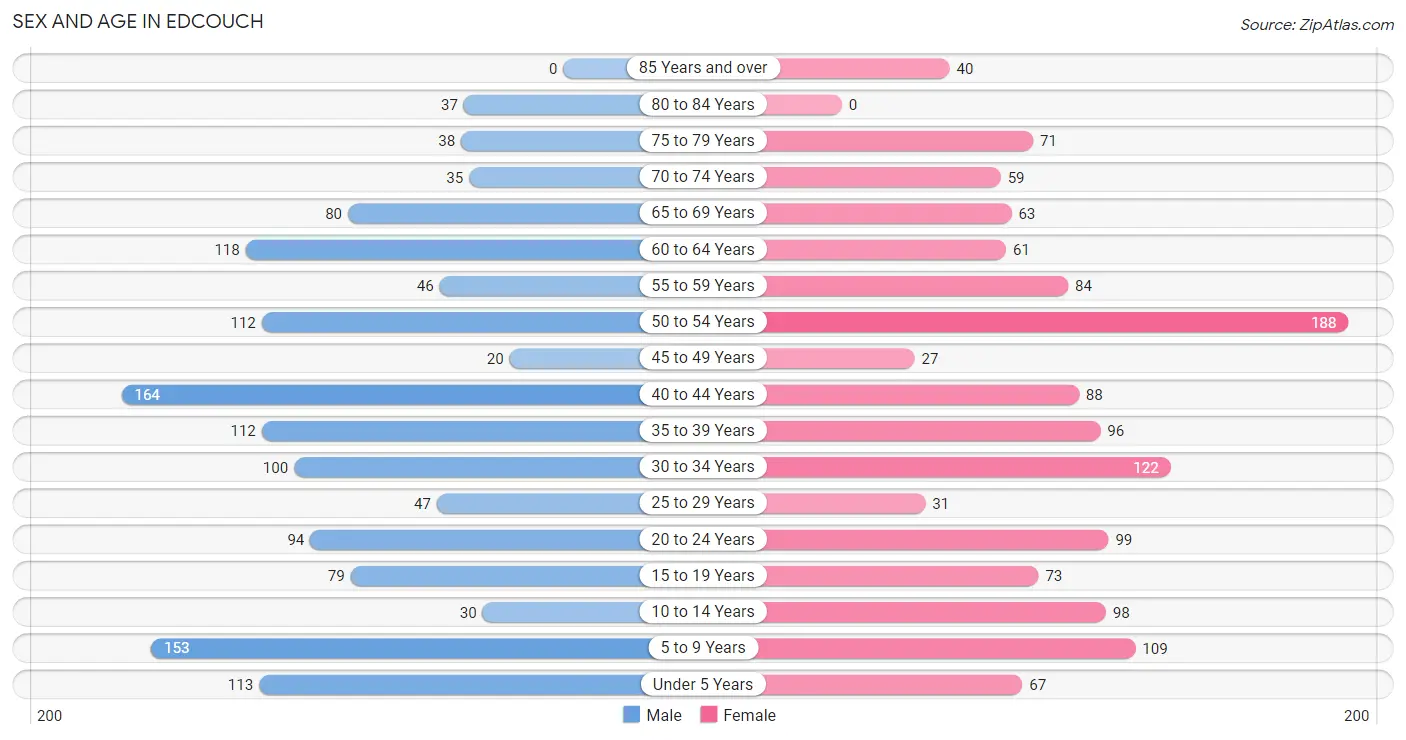
The most populous age groups in Edcouch are 40 to 44 Years (164 | 11.9%) for men and 50 to 54 Years (188 | 13.7%) for women.
| Age Bracket | Male | Female |
| Under 5 Years | 113 (8.2%) | 67 (4.9%) |
| 5 to 9 Years | 153 (11.1%) | 109 (7.9%) |
| 10 to 14 Years | 30 (2.2%) | 98 (7.1%) |
| 15 to 19 Years | 79 (5.7%) | 73 (5.3%) |
| 20 to 24 Years | 94 (6.8%) | 99 (7.2%) |
| 25 to 29 Years | 47 (3.4%) | 31 (2.2%) |
| 30 to 34 Years | 100 (7.3%) | 122 (8.9%) |
| 35 to 39 Years | 112 (8.1%) | 96 (7.0%) |
| 40 to 44 Years | 164 (11.9%) | 88 (6.4%) |
| 45 to 49 Years | 20 (1.5%) | 27 (2.0%) |
| 50 to 54 Years | 112 (8.1%) | 188 (13.7%) |
| 55 to 59 Years | 46 (3.3%) | 84 (6.1%) |
| 60 to 64 Years | 118 (8.6%) | 61 (4.4%) |
| 65 to 69 Years | 80 (5.8%) | 63 (4.6%) |
| 70 to 74 Years | 35 (2.5%) | 59 (4.3%) |
| 75 to 79 Years | 38 (2.8%) | 71 (5.2%) |
| 80 to 84 Years | 37 (2.7%) | 0 (0.0%) |
| 85 Years and over | 0 (0.0%) | 40 (2.9%) |
| Total | 1,378 (100.0%) | 1,376 (100.0%) |
Families and Households in Edcouch
Median Family Size in Edcouch
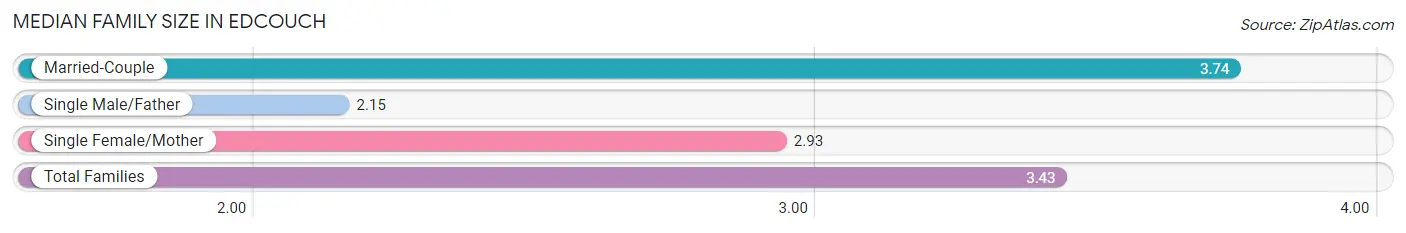
The median family size in Edcouch is 3.43 persons per family, with married-couple families (468 | 65.6%) accounting for the largest median family size of 3.74 persons per family. On the other hand, single male/father families (27 | 3.8%) represent the smallest median family size with 2.15 persons per family.
| Family Type | # Families | Family Size |
| Married-Couple | 468 (65.6%) | 3.74 |
| Single Male/Father | 27 (3.8%) | 2.15 |
| Single Female/Mother | 218 (30.6%) | 2.93 |
| Total Families | 713 (100.0%) | 3.43 |
Median Household Size in Edcouch
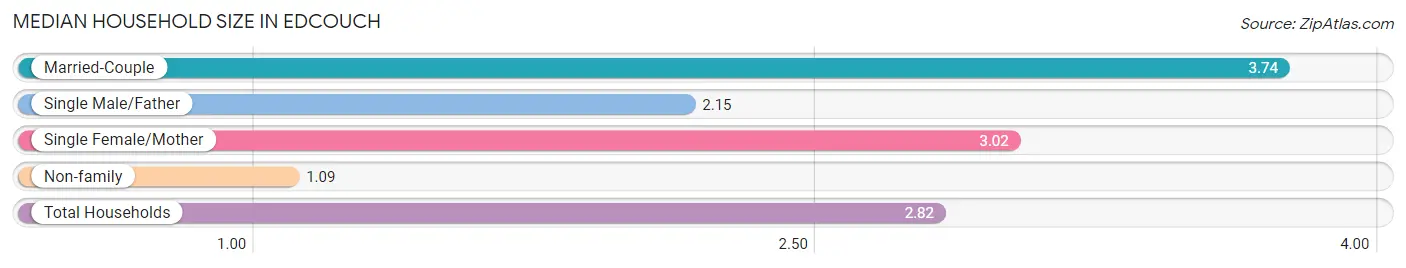
The median household size in Edcouch is 2.82 persons per household, with married-couple households (468 | 47.9%) accounting for the largest median household size of 3.74 persons per household. non-family households (264 | 27.0%) represent the smallest median household size with 1.09 persons per household.
| Household Type | # Households | Household Size |
| Married-Couple | 468 (47.9%) | 3.74 |
| Single Male/Father | 27 (2.8%) | 2.15 |
| Single Female/Mother | 218 (22.3%) | 3.02 |
| Non-family | 264 (27.0%) | 1.09 |
| Total Households | 977 (100.0%) | 2.82 |
Household Size by Marriage Status in Edcouch
Out of a total of 977 households in Edcouch, 713 (73.0%) are family households, while 264 (27.0%) are nonfamily households. The most numerous type of family households are 2-person households, comprising 256, and the most common type of nonfamily households are 1-person households, comprising 245.
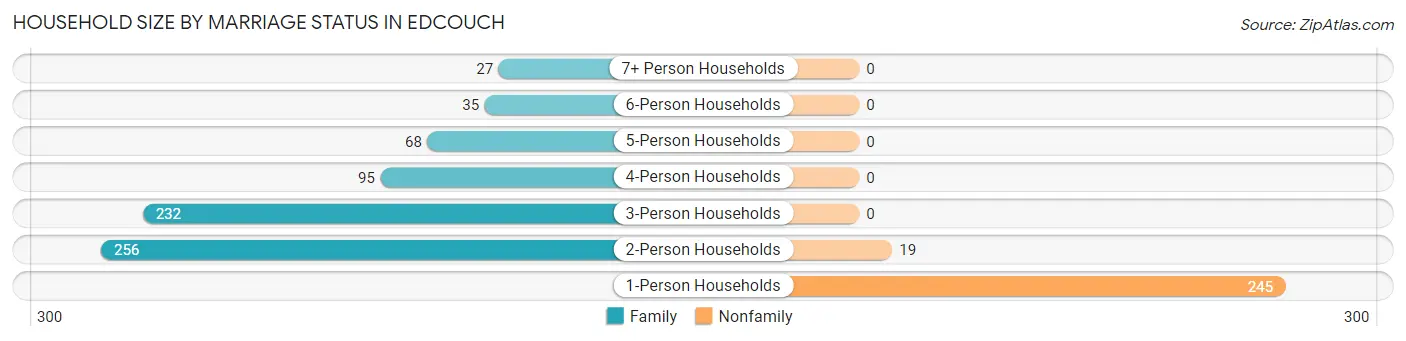
| Household Size | Family Households | Nonfamily Households |
| 1-Person Households | - | 245 (25.1%) |
| 2-Person Households | 256 (26.2%) | 19 (1.9%) |
| 3-Person Households | 232 (23.7%) | 0 (0.0%) |
| 4-Person Households | 95 (9.7%) | 0 (0.0%) |
| 5-Person Households | 68 (7.0%) | 0 (0.0%) |
| 6-Person Households | 35 (3.6%) | 0 (0.0%) |
| 7+ Person Households | 27 (2.8%) | 0 (0.0%) |
| Total | 713 (73.0%) | 264 (27.0%) |
Female Fertility in Edcouch
Fertility by Age in Edcouch
| Age Bracket | Women with Births | Births / 1,000 Women |
| 15 to 19 years | 0 (0.0%) | 0.0 |
| 20 to 34 years | 0 (0.0%) | 0.0 |
| 35 to 50 years | 0 (0.0%) | 0.0 |
| Total | 0 (0.0%) | 0.0 |
Fertility by Age by Marriage Status in Edcouch
| Age Bracket | Married | Unmarried |
| 15 to 19 years | 0 (0.0%) | 0 (0.0%) |
| 20 to 34 years | 0 (0.0%) | 0 (0.0%) |
| 35 to 50 years | 0 (0.0%) | 0 (0.0%) |
| Total | 0 (0.0%) | 0 (0.0%) |
Fertility by Education in Edcouch
| Educational Attainment | Women with Births | Births / 1,000 Women |
| Less than High School | 0 (0.0%) | 0.0 |
| High School Diploma | 0 (0.0%) | 0.0 |
| College or Associate's Degree | 0 (0.0%) | 0.0 |
| Bachelor's Degree | 0 (0.0%) | 0.0 |
| Graduate Degree | 0 (0.0%) | 0.0 |
| Total | 0 (0.0%) | 0.0 |
Fertility by Education by Marriage Status in Edcouch
| Educational Attainment | Married | Unmarried |
| Less than High School | 0 (0.0%) | 0 (0.0%) |
| High School Diploma | 0 (0.0%) | 0 (0.0%) |
| College or Associate's Degree | 0 (0.0%) | 0 (0.0%) |
| Bachelor's Degree | 0 (0.0%) | 0 (0.0%) |
| Graduate Degree | 0 (0.0%) | 0 (0.0%) |
| Total | 0 (0.0%) | 0 (0.0%) |
Employment Characteristics in Edcouch
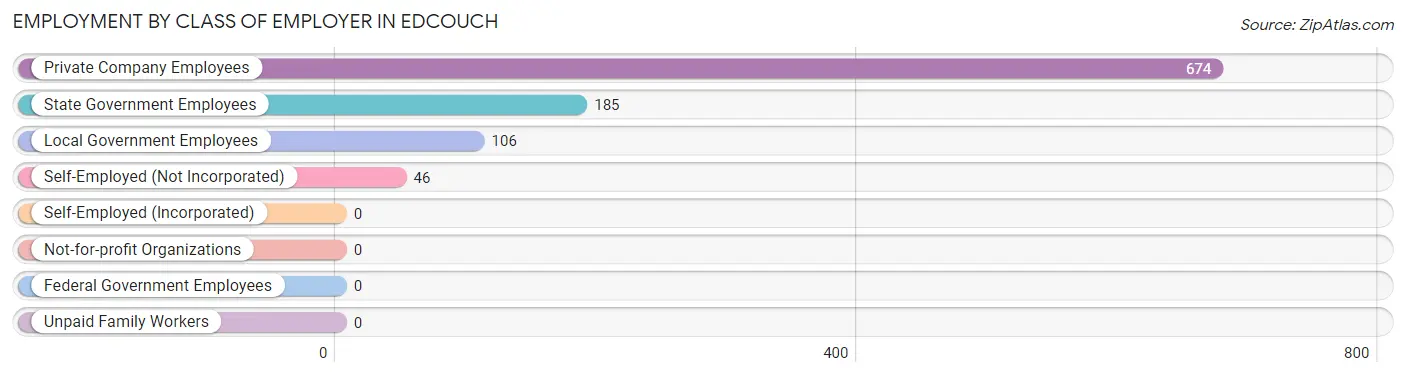
Employment by Class of Employer in Edcouch
Among the 1,011 employed individuals in Edcouch, private company employees (674 | 66.7%), state government employees (185 | 18.3%), and local government employees (106 | 10.5%) make up the most common classes of employment.
| Employer Class | # Employees | % Employees |
| Private Company Employees | 674 | 66.7% |
| Self-Employed (Incorporated) | 0 | 0.0% |
| Self-Employed (Not Incorporated) | 46 | 4.5% |
| Not-for-profit Organizations | 0 | 0.0% |
| Local Government Employees | 106 | 10.5% |
| State Government Employees | 185 | 18.3% |
| Federal Government Employees | 0 | 0.0% |
| Unpaid Family Workers | 0 | 0.0% |
| Total | 1,011 | 100.0% |
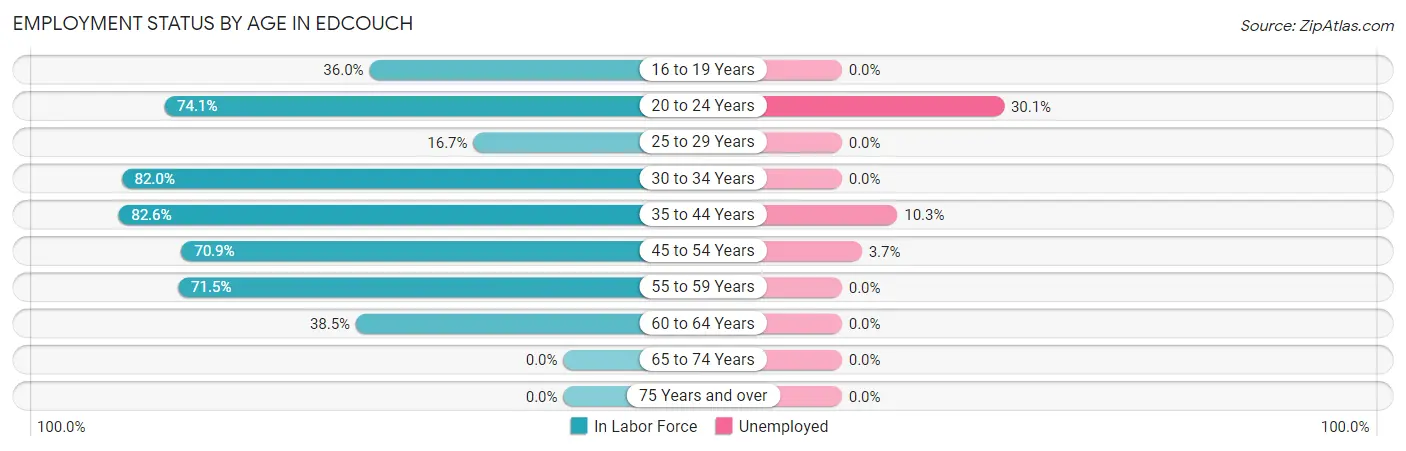
Employment Status by Age in Edcouch
According to the labor force statistics for Edcouch, out of the total population over 16 years of age (2,157), 54.3% or 1,171 individuals are in the labor force, with 7.8% or 91 of them unemployed. The age group with the highest labor force participation rate is 35 to 44 years, with 82.6% or 380 individuals in the labor force. Within the labor force, the 20 to 24 years age range has the highest percentage of unemployed individuals, with 30.1% or 43 of them being unemployed.
| Age Bracket | In Labor Force | Unemployed |
| 16 to 19 Years | 45 (36.0%) | 0 (0.0%) |
| 20 to 24 Years | 143 (74.1%) | 43 (30.1%) |
| 25 to 29 Years | 13 (16.7%) | 0 (0.0%) |
| 30 to 34 Years | 182 (82.0%) | 0 (0.0%) |
| 35 to 44 Years | 380 (82.6%) | 39 (10.3%) |
| 45 to 54 Years | 246 (70.9%) | 9 (3.7%) |
| 55 to 59 Years | 93 (71.5%) | 0 (0.0%) |
| 60 to 64 Years | 69 (38.5%) | 0 (0.0%) |
| 65 to 74 Years | 0 (0.0%) | 0 (0.0%) |
| 75 Years and over | 0 (0.0%) | 0 (0.0%) |
| Total | 1,171 (54.3%) | 91 (7.8%) |
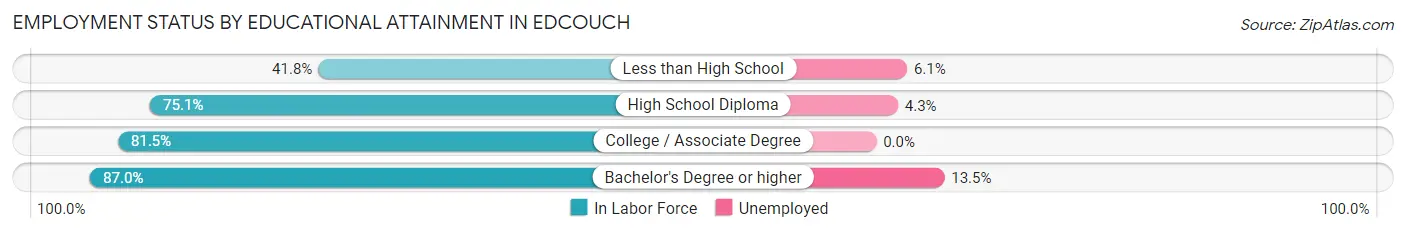
Employment Status by Educational Attainment in Edcouch
According to labor force statistics for Edcouch, 69.4% of individuals (983) out of the total population between 25 and 64 years of age (1,416) are in the labor force, with 4.9% or 48 of them being unemployed. The group with the highest labor force participation rate are those with the educational attainment of bachelor's degree or higher, with 87.0% or 141 individuals in the labor force. Within the labor force, individuals with bachelor's degree or higher education have the highest percentage of unemployment, with 13.5% or 19 of them being unemployed.
| Educational Attainment | In Labor Force | Unemployed |
| Less than High School | 148 (41.8%) | 22 (6.1%) |
| High School Diploma | 461 (75.1%) | 26 (4.3%) |
| College / Associate Degree | 233 (81.5%) | 0 (0.0%) |
| Bachelor's Degree or higher | 141 (87.0%) | 22 (13.5%) |
| Total | 983 (69.4%) | 69 (4.9%) |
Employment Occupations by Sex in Edcouch
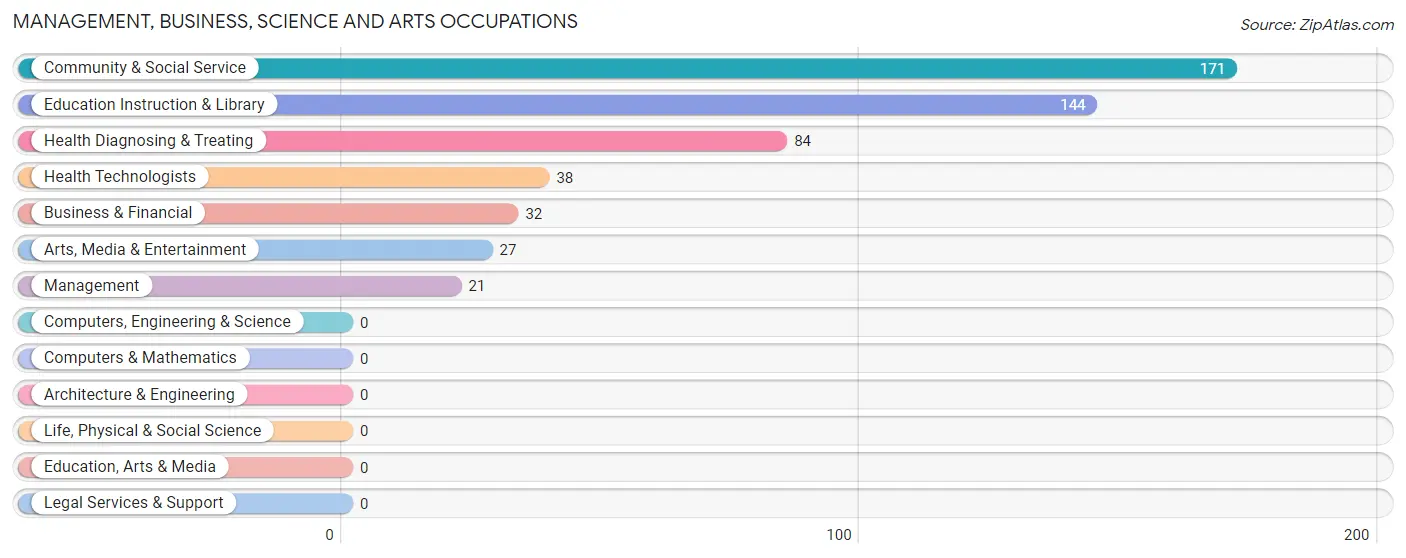
Management, Business, Science and Arts Occupations
The most common Management, Business, Science and Arts occupations in Edcouch are Community & Social Service (171 | 15.8%), Education Instruction & Library (144 | 13.3%), Health Diagnosing & Treating (84 | 7.8%), Health Technologists (38 | 3.5%), and Business & Financial (32 | 3.0%).
Management, Business, Science and Arts Occupations by Sex
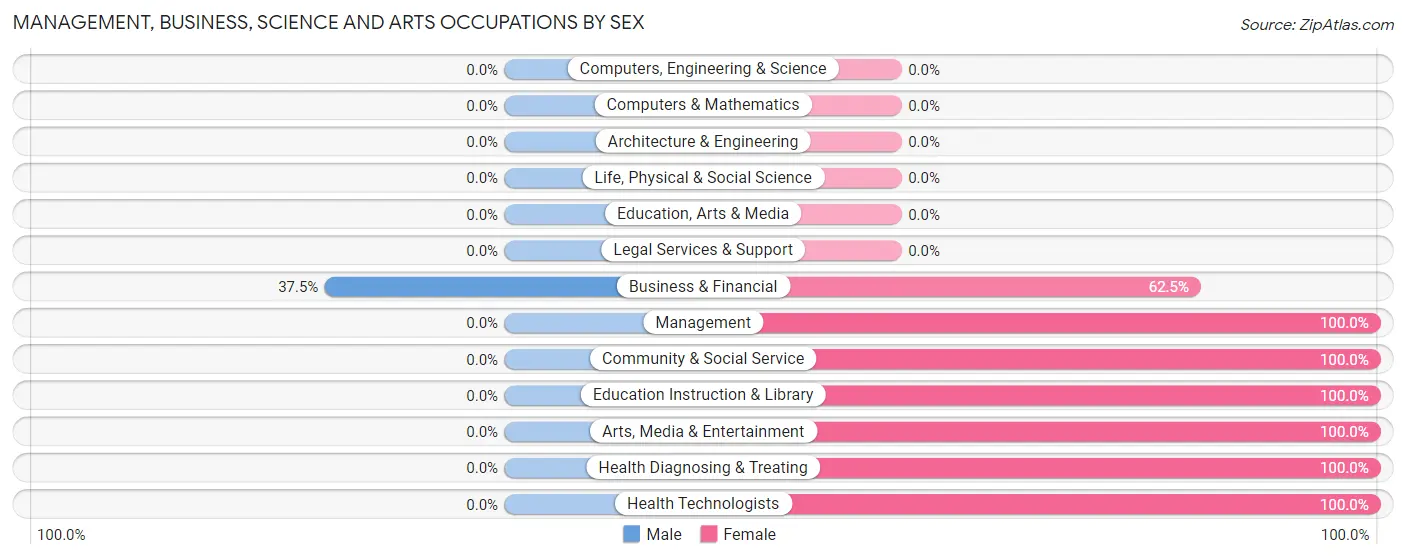
| Occupation | Male | Female |
| Management | 0 (0.0%) | 21 (100.0%) |
| Business & Financial | 12 (37.5%) | 20 (62.5%) |
| Computers, Engineering & Science | 0 (0.0%) | 0 (0.0%) |
| Computers & Mathematics | 0 (0.0%) | 0 (0.0%) |
| Architecture & Engineering | 0 (0.0%) | 0 (0.0%) |
| Life, Physical & Social Science | 0 (0.0%) | 0 (0.0%) |
| Community & Social Service | 0 (0.0%) | 171 (100.0%) |
| Education, Arts & Media | 0 (0.0%) | 0 (0.0%) |
| Legal Services & Support | 0 (0.0%) | 0 (0.0%) |
| Education Instruction & Library | 0 (0.0%) | 144 (100.0%) |
| Arts, Media & Entertainment | 0 (0.0%) | 27 (100.0%) |
| Health Diagnosing & Treating | 0 (0.0%) | 84 (100.0%) |
| Health Technologists | 0 (0.0%) | 38 (100.0%) |
| Total (Category) | 12 (3.9%) | 296 (96.1%) |
| Total (Overall) | 573 (53.1%) | 507 (46.9%) |
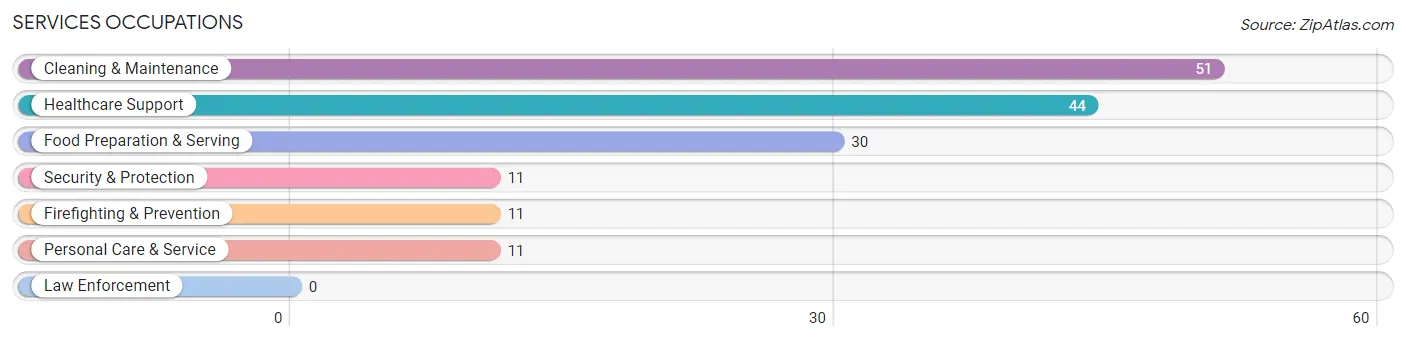
Services Occupations
The most common Services occupations in Edcouch are Cleaning & Maintenance (51 | 4.7%), Healthcare Support (44 | 4.1%), Food Preparation & Serving (30 | 2.8%), Security & Protection (11 | 1.0%), and Firefighting & Prevention (11 | 1.0%).
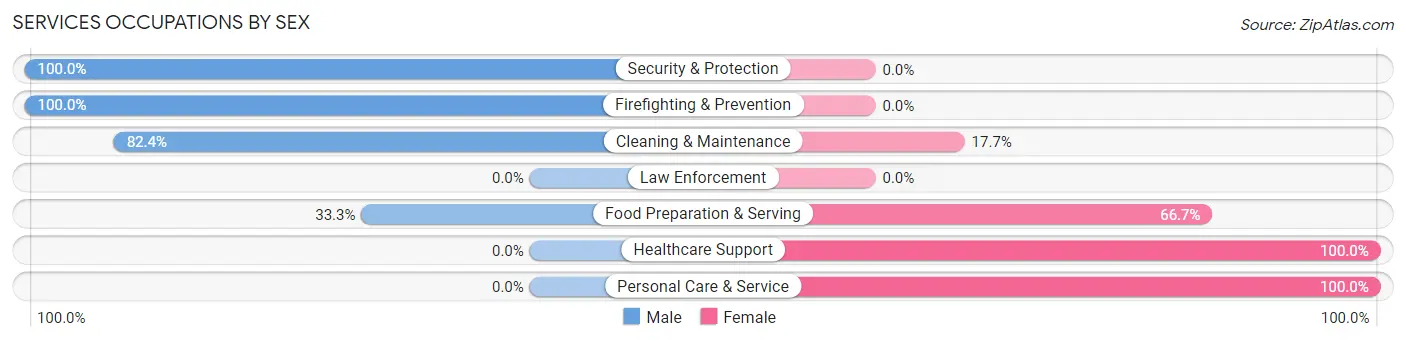
Services Occupations by Sex
Within the Services occupations in Edcouch, the most male-oriented occupations are Security & Protection (100.0%), Firefighting & Prevention (100.0%), and Cleaning & Maintenance (82.4%), while the most female-oriented occupations are Healthcare Support (100.0%), Personal Care & Service (100.0%), and Food Preparation & Serving (66.7%).
| Occupation | Male | Female |
| Healthcare Support | 0 (0.0%) | 44 (100.0%) |
| Security & Protection | 11 (100.0%) | 0 (0.0%) |
| Firefighting & Prevention | 11 (100.0%) | 0 (0.0%) |
| Law Enforcement | 0 (0.0%) | 0 (0.0%) |
| Food Preparation & Serving | 10 (33.3%) | 20 (66.7%) |
| Cleaning & Maintenance | 42 (82.4%) | 9 (17.6%) |
| Personal Care & Service | 0 (0.0%) | 11 (100.0%) |
| Total (Category) | 63 (42.9%) | 84 (57.1%) |
| Total (Overall) | 573 (53.1%) | 507 (46.9%) |
Sales and Office Occupations
The most common Sales and Office occupations in Edcouch are Office & Administration (163 | 15.1%), and Sales & Related (116 | 10.7%).
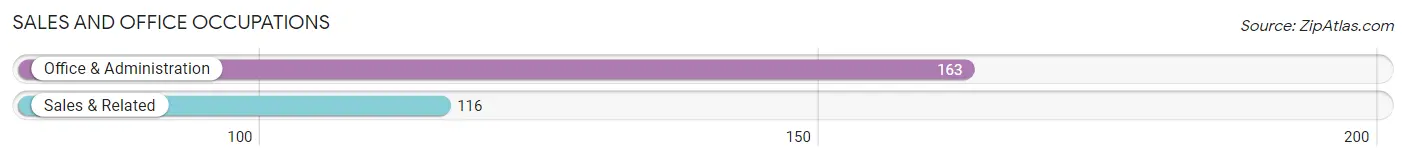
Sales and Office Occupations by Sex

| Occupation | Male | Female |
| Sales & Related | 116 (100.0%) | 0 (0.0%) |
| Office & Administration | 36 (22.1%) | 127 (77.9%) |
| Total (Category) | 152 (54.5%) | 127 (45.5%) |
| Total (Overall) | 573 (53.1%) | 507 (46.9%) |
Natural Resources, Construction and Maintenance Occupations
The most common Natural Resources, Construction and Maintenance occupations in Edcouch are Installation, Maintenance & Repair (102 | 9.4%), Construction & Extraction (96 | 8.9%), and Farming, Fishing & Forestry (38 | 3.5%).
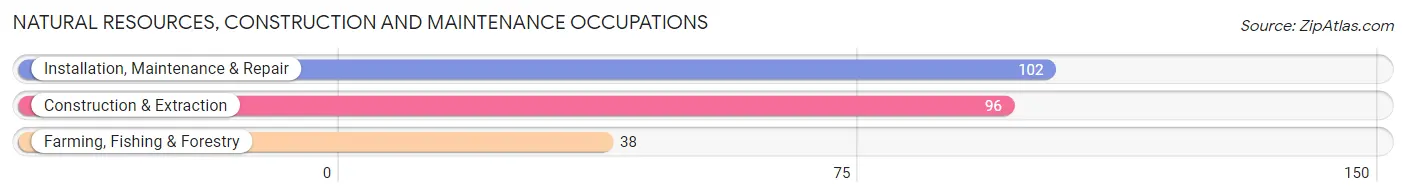
Natural Resources, Construction and Maintenance Occupations by Sex
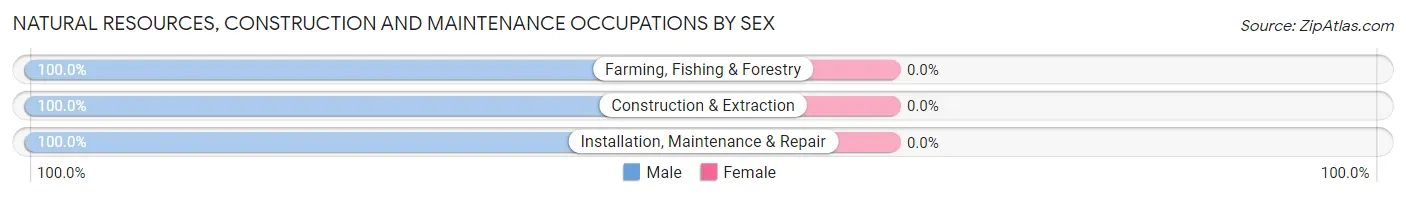
| Occupation | Male | Female |
| Farming, Fishing & Forestry | 38 (100.0%) | 0 (0.0%) |
| Construction & Extraction | 96 (100.0%) | 0 (0.0%) |
| Installation, Maintenance & Repair | 102 (100.0%) | 0 (0.0%) |
| Total (Category) | 236 (100.0%) | 0 (0.0%) |
| Total (Overall) | 573 (53.1%) | 507 (46.9%) |
Production, Transportation and Moving Occupations
The most common Production, Transportation and Moving occupations in Edcouch are Transportation (48 | 4.4%), Production (34 | 3.2%), and Material Moving (28 | 2.6%).
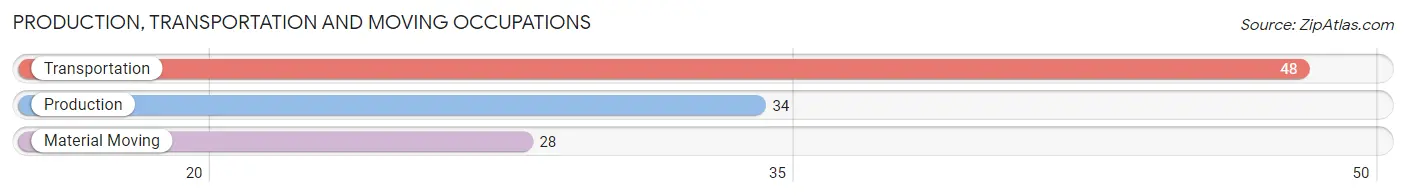
Production, Transportation and Moving Occupations by Sex
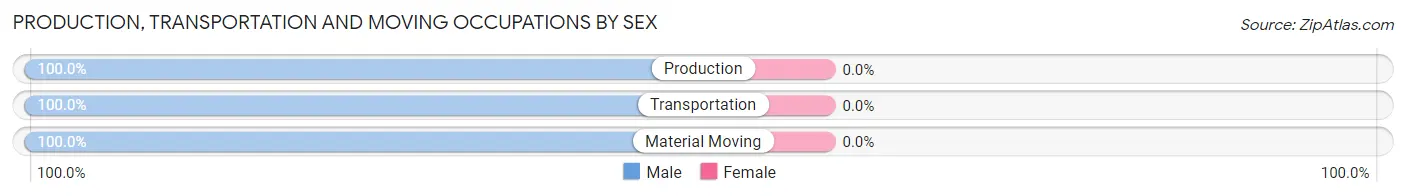
| Occupation | Male | Female |
| Production | 34 (100.0%) | 0 (0.0%) |
| Transportation | 48 (100.0%) | 0 (0.0%) |
| Material Moving | 28 (100.0%) | 0 (0.0%) |
| Total (Category) | 110 (100.0%) | 0 (0.0%) |
| Total (Overall) | 573 (53.1%) | 507 (46.9%) |
Employment Industries by Sex in Edcouch
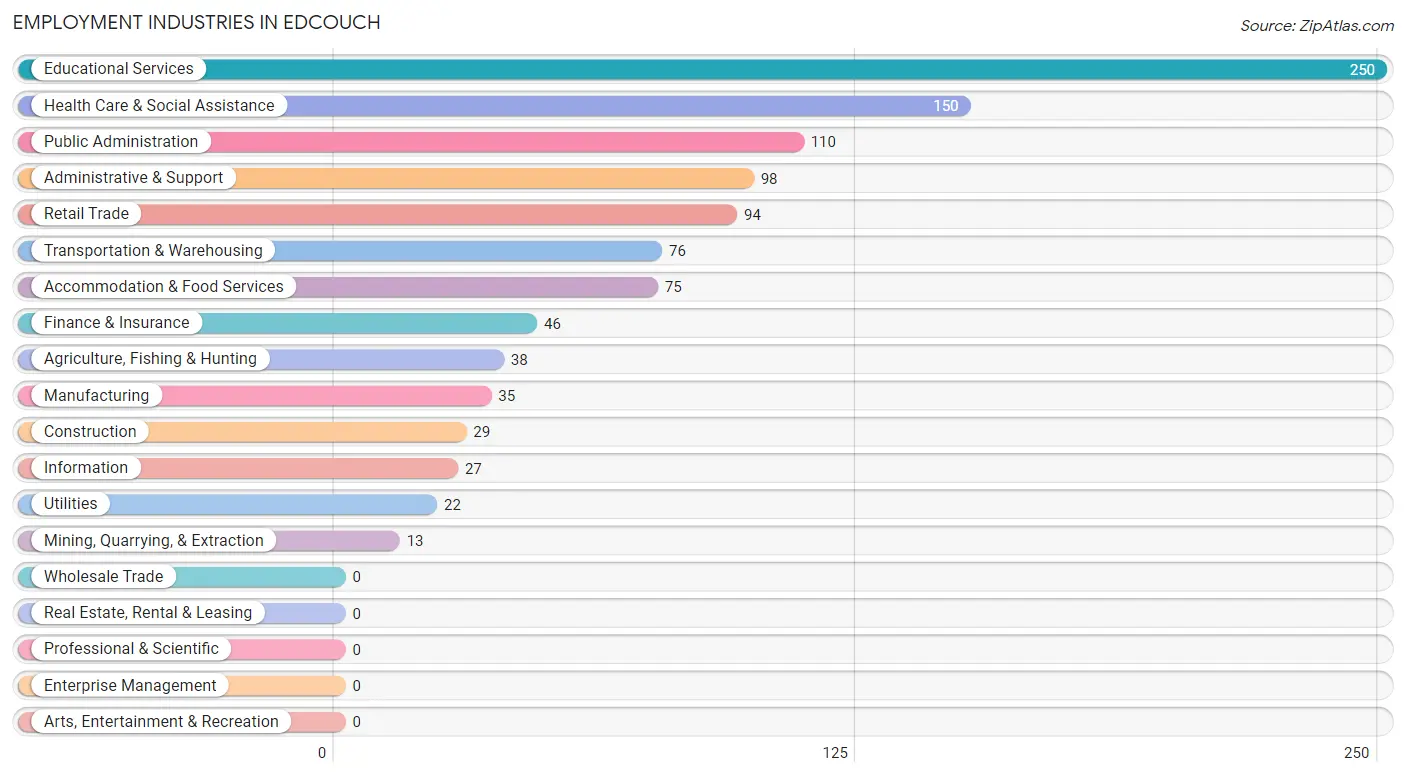
Employment Industries in Edcouch
The major employment industries in Edcouch include Educational Services (250 | 23.2%), Health Care & Social Assistance (150 | 13.9%), Public Administration (110 | 10.2%), Administrative & Support (98 | 9.1%), and Retail Trade (94 | 8.7%).
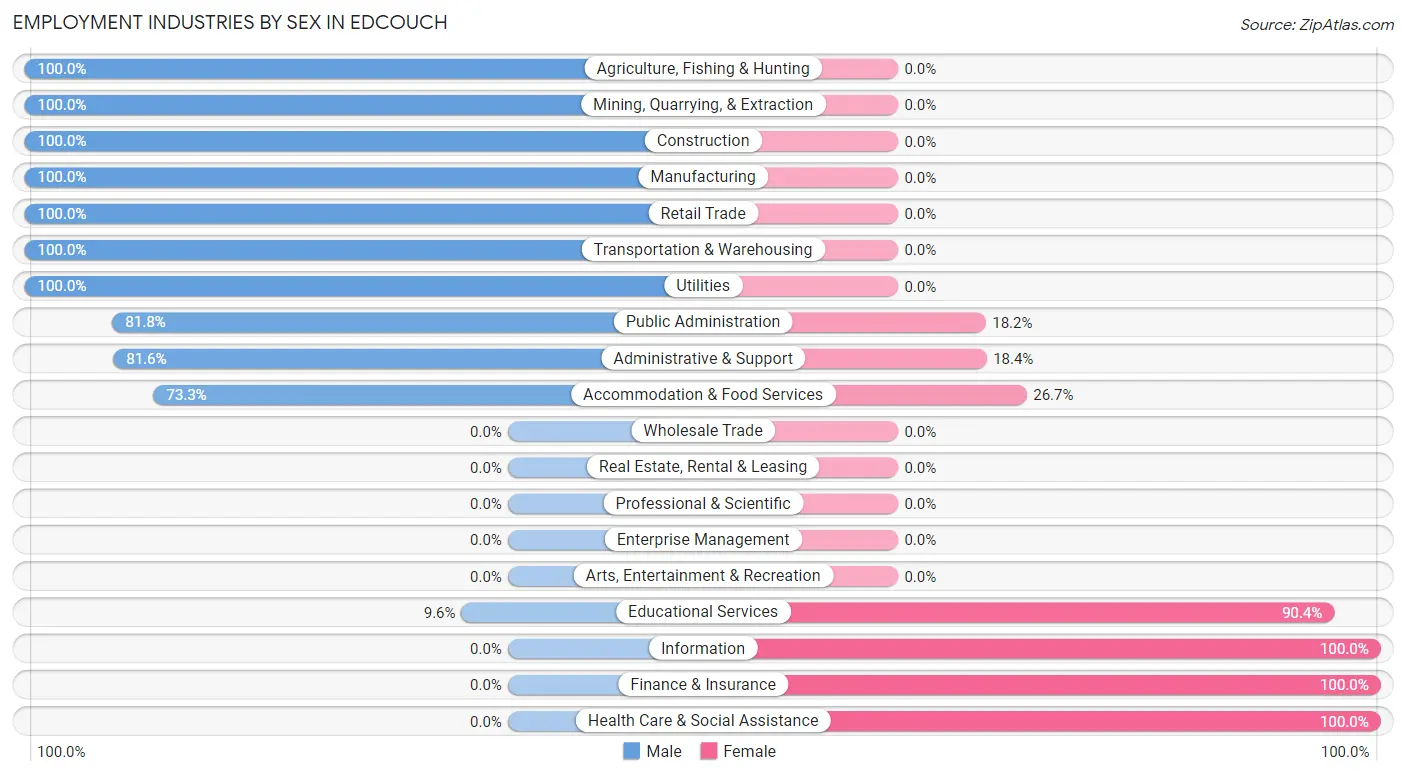
Employment Industries by Sex in Edcouch
The Edcouch industries that see more men than women are Agriculture, Fishing & Hunting (100.0%), Mining, Quarrying, & Extraction (100.0%), and Construction (100.0%), whereas the industries that tend to have a higher number of women are Information (100.0%), Finance & Insurance (100.0%), and Health Care & Social Assistance (100.0%).
| Industry | Male | Female |
| Agriculture, Fishing & Hunting | 38 (100.0%) | 0 (0.0%) |
| Mining, Quarrying, & Extraction | 13 (100.0%) | 0 (0.0%) |
| Construction | 29 (100.0%) | 0 (0.0%) |
| Manufacturing | 35 (100.0%) | 0 (0.0%) |
| Wholesale Trade | 0 (0.0%) | 0 (0.0%) |
| Retail Trade | 94 (100.0%) | 0 (0.0%) |
| Transportation & Warehousing | 76 (100.0%) | 0 (0.0%) |
| Utilities | 22 (100.0%) | 0 (0.0%) |
| Information | 0 (0.0%) | 27 (100.0%) |
| Finance & Insurance | 0 (0.0%) | 46 (100.0%) |
| Real Estate, Rental & Leasing | 0 (0.0%) | 0 (0.0%) |
| Professional & Scientific | 0 (0.0%) | 0 (0.0%) |
| Enterprise Management | 0 (0.0%) | 0 (0.0%) |
| Administrative & Support | 80 (81.6%) | 18 (18.4%) |
| Educational Services | 24 (9.6%) | 226 (90.4%) |
| Health Care & Social Assistance | 0 (0.0%) | 150 (100.0%) |
| Arts, Entertainment & Recreation | 0 (0.0%) | 0 (0.0%) |
| Accommodation & Food Services | 55 (73.3%) | 20 (26.7%) |
| Public Administration | 90 (81.8%) | 20 (18.2%) |
| Total | 573 (53.1%) | 507 (46.9%) |
Education in Edcouch
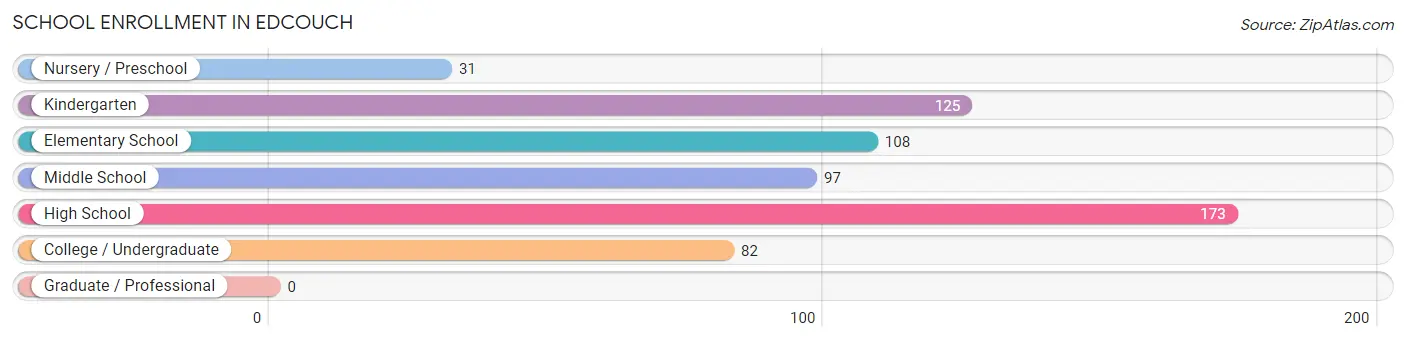
School Enrollment in Edcouch
The most common levels of schooling among the 616 students in Edcouch are high school (173 | 28.1%), kindergarten (125 | 20.3%), and elementary school (108 | 17.5%).
| School Level | # Students | % Students |
| Nursery / Preschool | 31 | 5.0% |
| Kindergarten | 125 | 20.3% |
| Elementary School | 108 | 17.5% |
| Middle School | 97 | 15.8% |
| High School | 173 | 28.1% |
| College / Undergraduate | 82 | 13.3% |
| Graduate / Professional | 0 | 0.0% |
| Total | 616 | 100.0% |
School Enrollment by Age by Funding Source in Edcouch
Out of a total of 616 students who are enrolled in schools in Edcouch, 41 (6.7%) attend a private institution, while the remaining 575 (93.3%) are enrolled in public schools. The age group of 3 to 4 year olds has the highest likelihood of being enrolled in private schools, with 31 (100.0% in the age bracket) enrolled. Conversely, the age group of 5 to 9 year old has the lowest likelihood of being enrolled in a private school, with 252 (100.0% in the age bracket) attending a public institution.
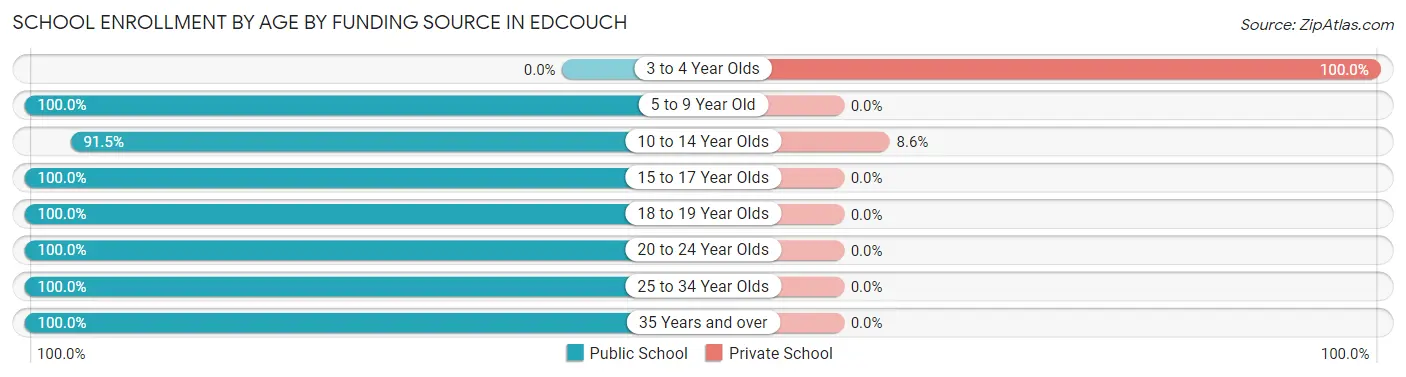
| Age Bracket | Public School | Private School |
| 3 to 4 Year Olds | 0 (0.0%) | 31 (100.0%) |
| 5 to 9 Year Old | 252 (100.0%) | 0 (0.0%) |
| 10 to 14 Year Olds | 107 (91.4%) | 10 (8.6%) |
| 15 to 17 Year Olds | 81 (100.0%) | 0 (0.0%) |
| 18 to 19 Year Olds | 53 (100.0%) | 0 (0.0%) |
| 20 to 24 Year Olds | 40 (100.0%) | 0 (0.0%) |
| 25 to 34 Year Olds | 30 (100.0%) | 0 (0.0%) |
| 35 Years and over | 12 (100.0%) | 0 (0.0%) |
| Total | 575 (93.3%) | 41 (6.7%) |
Educational Attainment by Field of Study in Edcouch
Business (78 | 42.4%), liberal arts & history (43 | 23.4%), science & technology (28 | 15.2%), arts & humanities (19 | 10.3%), and education (16 | 8.7%) are the most common fields of study among 184 individuals in Edcouch who have obtained a bachelor's degree or higher.
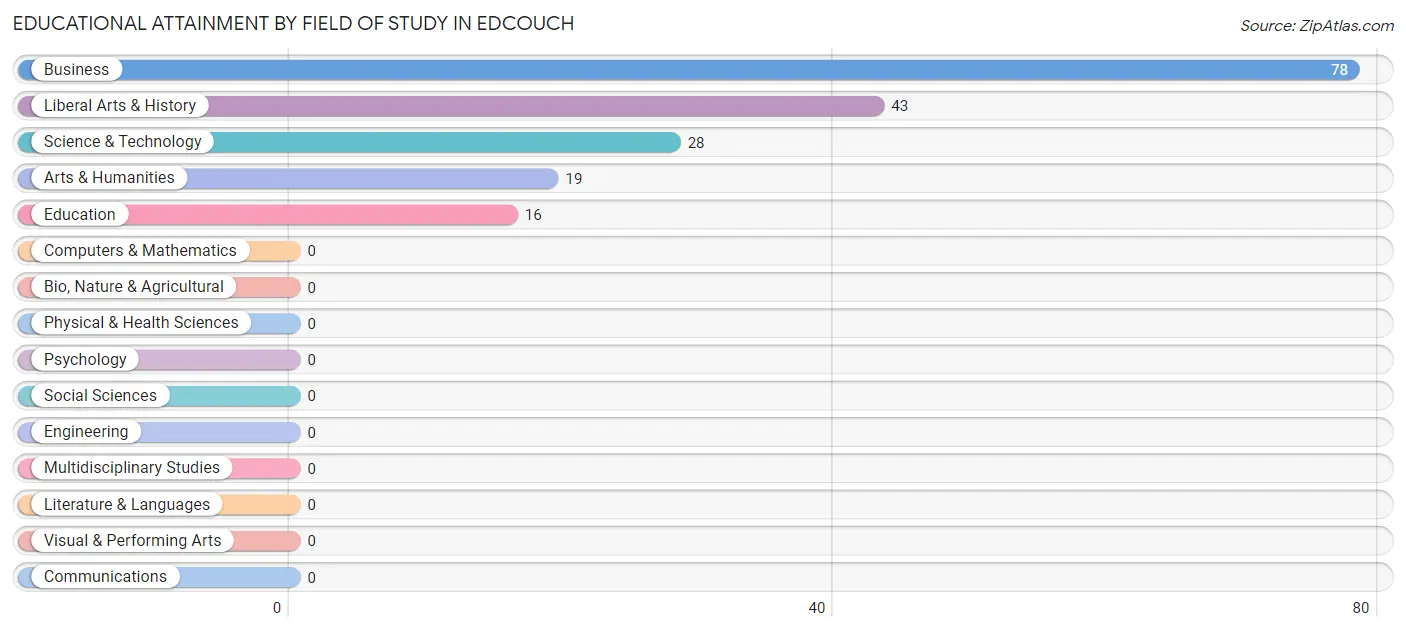
| Field of Study | # Graduates | % Graduates |
| Computers & Mathematics | 0 | 0.0% |
| Bio, Nature & Agricultural | 0 | 0.0% |
| Physical & Health Sciences | 0 | 0.0% |
| Psychology | 0 | 0.0% |
| Social Sciences | 0 | 0.0% |
| Engineering | 0 | 0.0% |
| Multidisciplinary Studies | 0 | 0.0% |
| Science & Technology | 28 | 15.2% |
| Business | 78 | 42.4% |
| Education | 16 | 8.7% |
| Literature & Languages | 0 | 0.0% |
| Liberal Arts & History | 43 | 23.4% |
| Visual & Performing Arts | 0 | 0.0% |
| Communications | 0 | 0.0% |
| Arts & Humanities | 19 | 10.3% |
| Total | 184 | 100.0% |
Transportation & Commute in Edcouch
Vehicle Availability by Sex in Edcouch
The most prevalent vehicle ownership categories in Edcouch are males with 2 vehicles (323, accounting for 56.4%) and females with 2 vehicles (123, making up 73.7%).
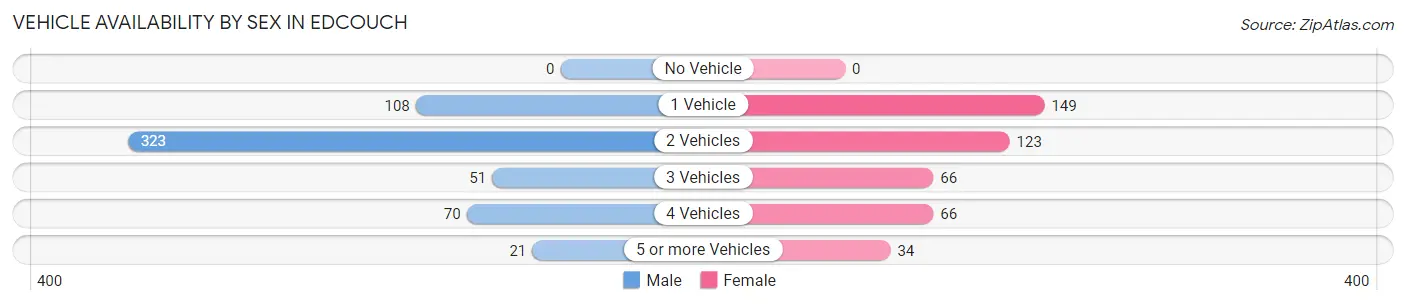
| Vehicles Available | Male | Female |
| No Vehicle | 0 (0.0%) | 0 (0.0%) |
| 1 Vehicle | 108 (18.9%) | 149 (34.0%) |
| 2 Vehicles | 323 (56.4%) | 123 (28.1%) |
| 3 Vehicles | 51 (8.9%) | 66 (15.1%) |
| 4 Vehicles | 70 (12.2%) | 66 (15.1%) |
| 5 or more Vehicles | 21 (3.7%) | 34 (7.8%) |
| Total | 573 (100.0%) | 438 (100.0%) |
Commute Time in Edcouch
The most frequently occuring commute durations in Edcouch are 5 to 9 minutes (261 commuters, 27.1%), 20 to 24 minutes (159 commuters, 16.5%), and 15 to 19 minutes (120 commuters, 12.5%).
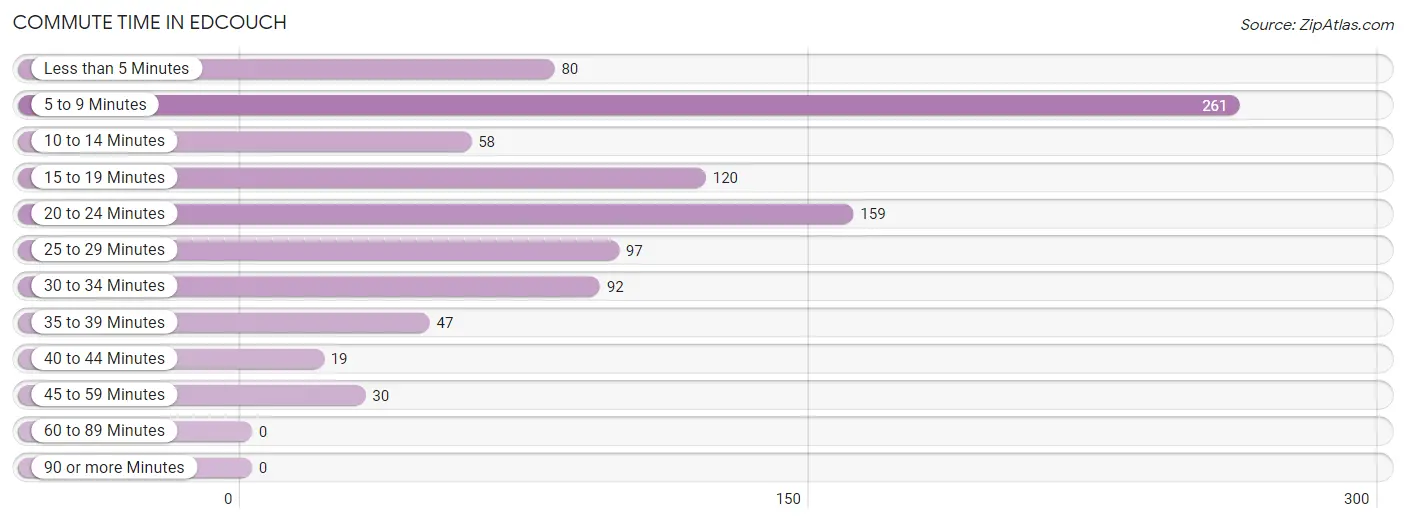
| Commute Time | # Commuters | % Commuters |
| Less than 5 Minutes | 80 | 8.3% |
| 5 to 9 Minutes | 261 | 27.1% |
| 10 to 14 Minutes | 58 | 6.0% |
| 15 to 19 Minutes | 120 | 12.5% |
| 20 to 24 Minutes | 159 | 16.5% |
| 25 to 29 Minutes | 97 | 10.1% |
| 30 to 34 Minutes | 92 | 9.6% |
| 35 to 39 Minutes | 47 | 4.9% |
| 40 to 44 Minutes | 19 | 2.0% |
| 45 to 59 Minutes | 30 | 3.1% |
| 60 to 89 Minutes | 0 | 0.0% |
| 90 or more Minutes | 0 | 0.0% |
Commute Time by Sex in Edcouch
The most common commute times in Edcouch are 5 to 9 minutes (131 commuters, 24.1%) for males and 5 to 9 minutes (130 commuters, 31.0%) for females.
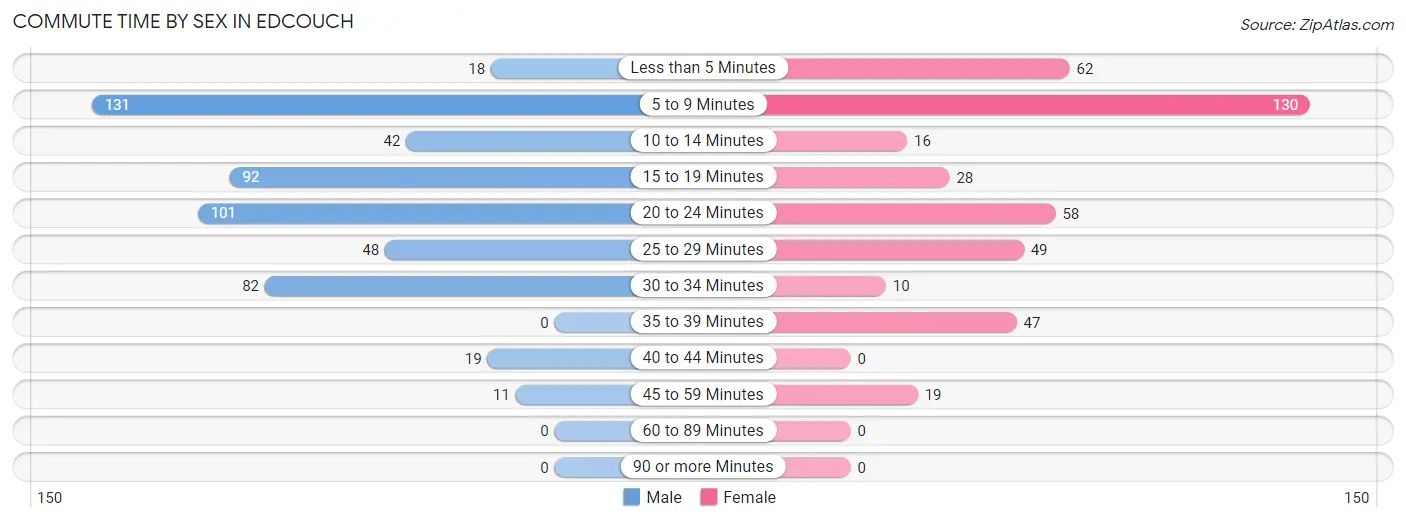
| Commute Time | Male | Female |
| Less than 5 Minutes | 18 (3.3%) | 62 (14.8%) |
| 5 to 9 Minutes | 131 (24.1%) | 130 (31.0%) |
| 10 to 14 Minutes | 42 (7.7%) | 16 (3.8%) |
| 15 to 19 Minutes | 92 (16.9%) | 28 (6.7%) |
| 20 to 24 Minutes | 101 (18.6%) | 58 (13.8%) |
| 25 to 29 Minutes | 48 (8.8%) | 49 (11.7%) |
| 30 to 34 Minutes | 82 (15.1%) | 10 (2.4%) |
| 35 to 39 Minutes | 0 (0.0%) | 47 (11.2%) |
| 40 to 44 Minutes | 19 (3.5%) | 0 (0.0%) |
| 45 to 59 Minutes | 11 (2.0%) | 19 (4.5%) |
| 60 to 89 Minutes | 0 (0.0%) | 0 (0.0%) |
| 90 or more Minutes | 0 (0.0%) | 0 (0.0%) |
Time of Departure to Work by Sex in Edcouch
The most frequent times of departure to work in Edcouch are 7:30 AM to 7:59 AM (139, 25.6%) for males and 7:30 AM to 7:59 AM (111, 26.5%) for females.
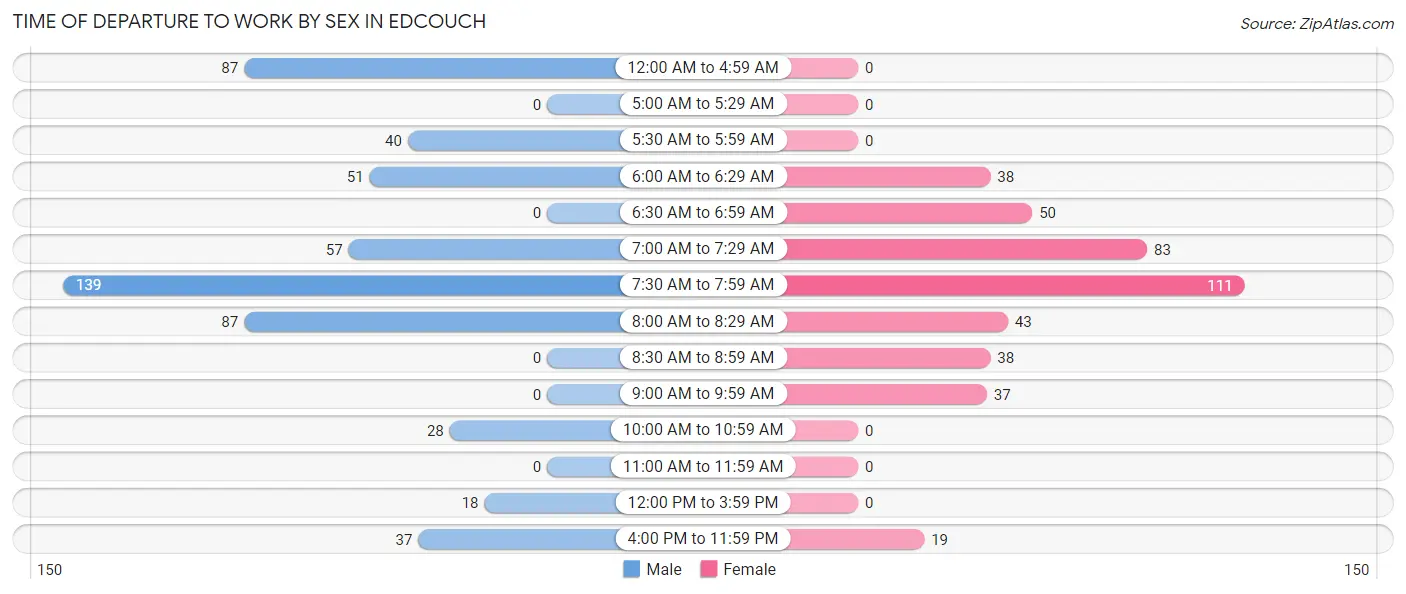
| Time of Departure | Male | Female |
| 12:00 AM to 4:59 AM | 87 (16.0%) | 0 (0.0%) |
| 5:00 AM to 5:29 AM | 0 (0.0%) | 0 (0.0%) |
| 5:30 AM to 5:59 AM | 40 (7.3%) | 0 (0.0%) |
| 6:00 AM to 6:29 AM | 51 (9.4%) | 38 (9.1%) |
| 6:30 AM to 6:59 AM | 0 (0.0%) | 50 (11.9%) |
| 7:00 AM to 7:29 AM | 57 (10.5%) | 83 (19.8%) |
| 7:30 AM to 7:59 AM | 139 (25.6%) | 111 (26.5%) |
| 8:00 AM to 8:29 AM | 87 (16.0%) | 43 (10.3%) |
| 8:30 AM to 8:59 AM | 0 (0.0%) | 38 (9.1%) |
| 9:00 AM to 9:59 AM | 0 (0.0%) | 37 (8.8%) |
| 10:00 AM to 10:59 AM | 28 (5.1%) | 0 (0.0%) |
| 11:00 AM to 11:59 AM | 0 (0.0%) | 0 (0.0%) |
| 12:00 PM to 3:59 PM | 18 (3.3%) | 0 (0.0%) |
| 4:00 PM to 11:59 PM | 37 (6.8%) | 19 (4.5%) |
| Total | 544 (100.0%) | 419 (100.0%) |
Housing Occupancy in Edcouch
Occupancy by Ownership in Edcouch
Of the total 977 dwellings in Edcouch, owner-occupied units account for 515 (52.7%), while renter-occupied units make up 462 (47.3%).
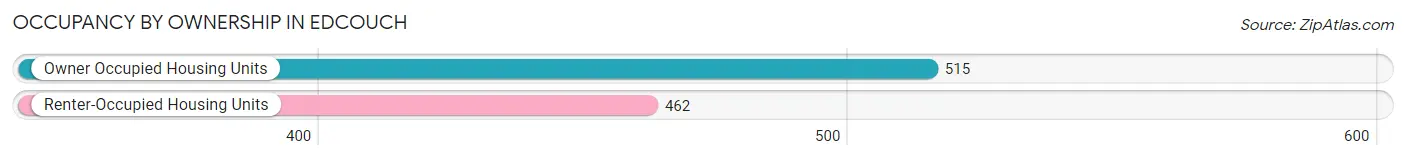
| Occupancy | # Housing Units | % Housing Units |
| Owner Occupied Housing Units | 515 | 52.7% |
| Renter-Occupied Housing Units | 462 | 47.3% |
| Total Occupied Housing Units | 977 | 100.0% |
Occupancy by Household Size in Edcouch
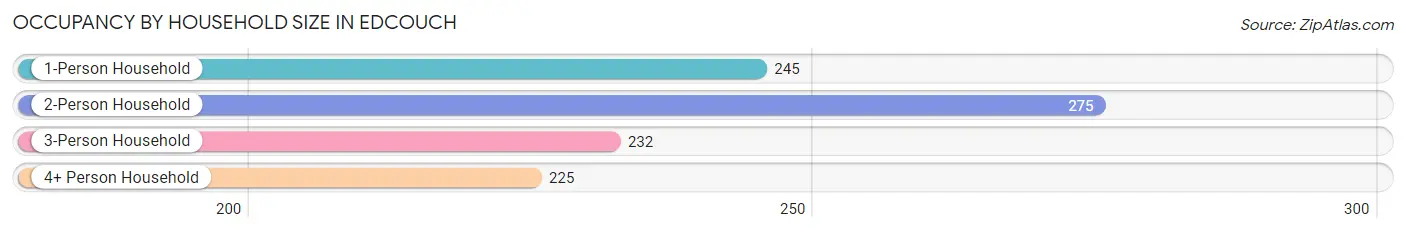
| Household Size | # Housing Units | % Housing Units |
| 1-Person Household | 245 | 25.1% |
| 2-Person Household | 275 | 28.1% |
| 3-Person Household | 232 | 23.7% |
| 4+ Person Household | 225 | 23.0% |
| Total Housing Units | 977 | 100.0% |
Occupancy by Ownership by Household Size in Edcouch
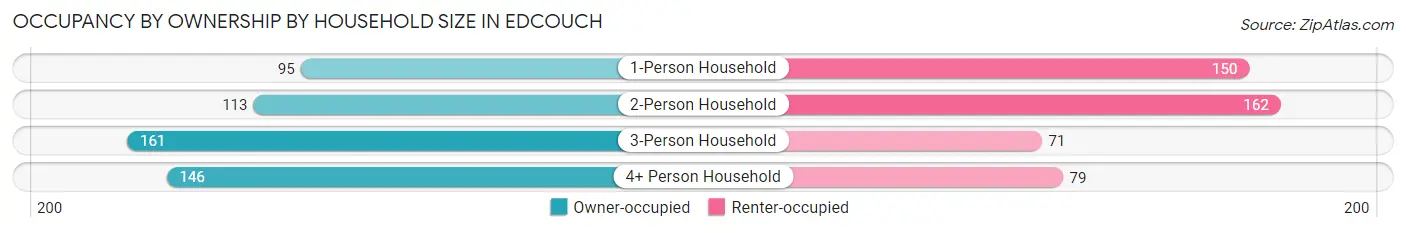
| Household Size | Owner-occupied | Renter-occupied |
| 1-Person Household | 95 (38.8%) | 150 (61.2%) |
| 2-Person Household | 113 (41.1%) | 162 (58.9%) |
| 3-Person Household | 161 (69.4%) | 71 (30.6%) |
| 4+ Person Household | 146 (64.9%) | 79 (35.1%) |
| Total Housing Units | 515 (52.7%) | 462 (47.3%) |
Occupancy by Educational Attainment in Edcouch

| Household Size | Owner-occupied | Renter-occupied |
| Less than High School | 142 (43.3%) | 186 (56.7%) |
| High School Diploma | 241 (69.1%) | 108 (30.9%) |
| College/Associate Degree | 86 (44.1%) | 109 (55.9%) |
| Bachelor's Degree or higher | 46 (43.8%) | 59 (56.2%) |
Occupancy by Age of Householder in Edcouch
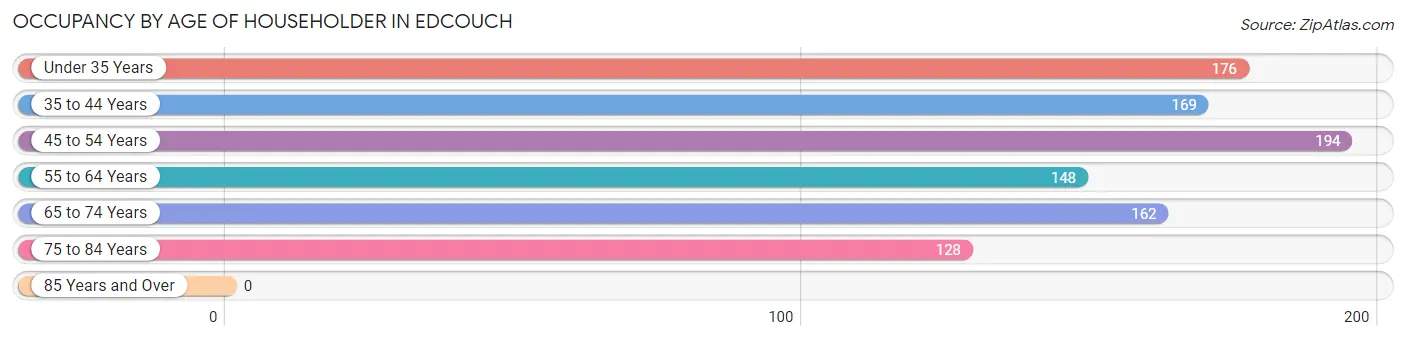
| Age Bracket | # Households | % Households |
| Under 35 Years | 176 | 18.0% |
| 35 to 44 Years | 169 | 17.3% |
| 45 to 54 Years | 194 | 19.9% |
| 55 to 64 Years | 148 | 15.1% |
| 65 to 74 Years | 162 | 16.6% |
| 75 to 84 Years | 128 | 13.1% |
| 85 Years and Over | 0 | 0.0% |
| Total | 977 | 100.0% |
Housing Finances in Edcouch
Median Income by Occupancy in Edcouch
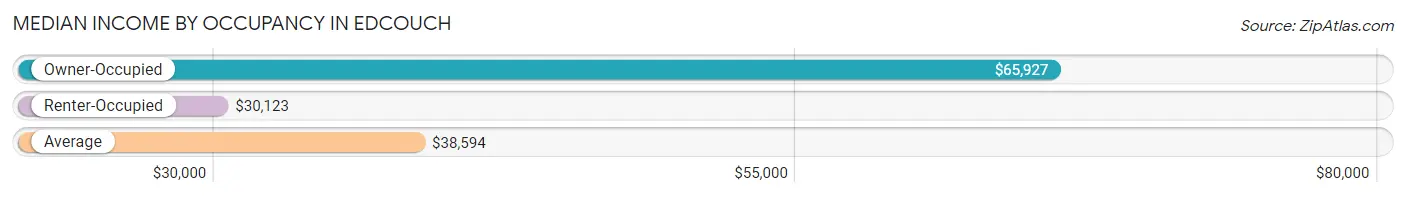
| Occupancy Type | # Households | Median Income |
| Owner-Occupied | 515 (52.7%) | $65,927 |
| Renter-Occupied | 462 (47.3%) | $30,123 |
| Average | 977 (100.0%) | $38,594 |
Occupancy by Householder Income Bracket in Edcouch
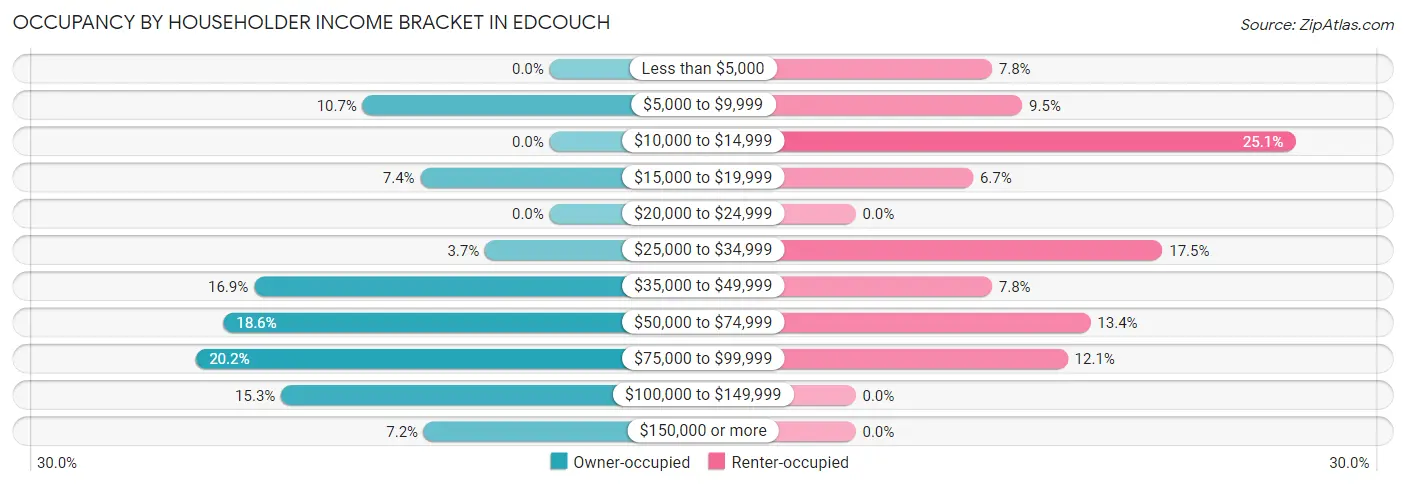
| Income Bracket | Owner-occupied | Renter-occupied |
| Less than $5,000 | 0 (0.0%) | 36 (7.8%) |
| $5,000 to $9,999 | 55 (10.7%) | 44 (9.5%) |
| $10,000 to $14,999 | 0 (0.0%) | 116 (25.1%) |
| $15,000 to $19,999 | 38 (7.4%) | 31 (6.7%) |
| $20,000 to $24,999 | 0 (0.0%) | 0 (0.0%) |
| $25,000 to $34,999 | 19 (3.7%) | 81 (17.5%) |
| $35,000 to $49,999 | 87 (16.9%) | 36 (7.8%) |
| $50,000 to $74,999 | 96 (18.6%) | 62 (13.4%) |
| $75,000 to $99,999 | 104 (20.2%) | 56 (12.1%) |
| $100,000 to $149,999 | 79 (15.3%) | 0 (0.0%) |
| $150,000 or more | 37 (7.2%) | 0 (0.0%) |
| Total | 515 (100.0%) | 462 (100.0%) |
Monthly Housing Cost Tiers in Edcouch
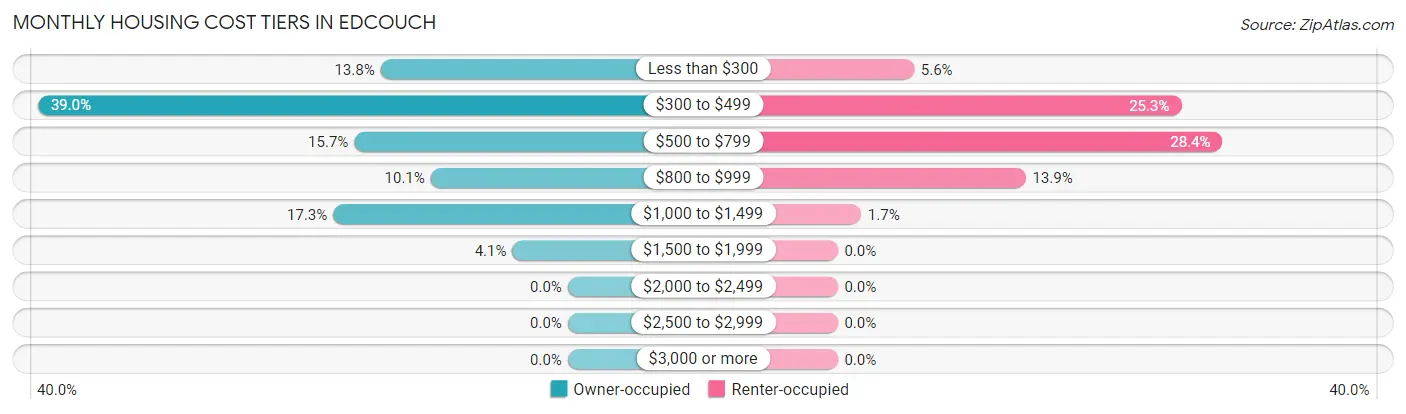
| Monthly Cost | Owner-occupied | Renter-occupied |
| Less than $300 | 71 (13.8%) | 26 (5.6%) |
| $300 to $499 | 201 (39.0%) | 117 (25.3%) |
| $500 to $799 | 81 (15.7%) | 131 (28.3%) |
| $800 to $999 | 52 (10.1%) | 64 (13.9%) |
| $1,000 to $1,499 | 89 (17.3%) | 8 (1.7%) |
| $1,500 to $1,999 | 21 (4.1%) | 0 (0.0%) |
| $2,000 to $2,499 | 0 (0.0%) | 0 (0.0%) |
| $2,500 to $2,999 | 0 (0.0%) | 0 (0.0%) |
| $3,000 or more | 0 (0.0%) | 0 (0.0%) |
| Total | 515 (100.0%) | 462 (100.0%) |
Physical Housing Characteristics in Edcouch
Housing Structures in Edcouch
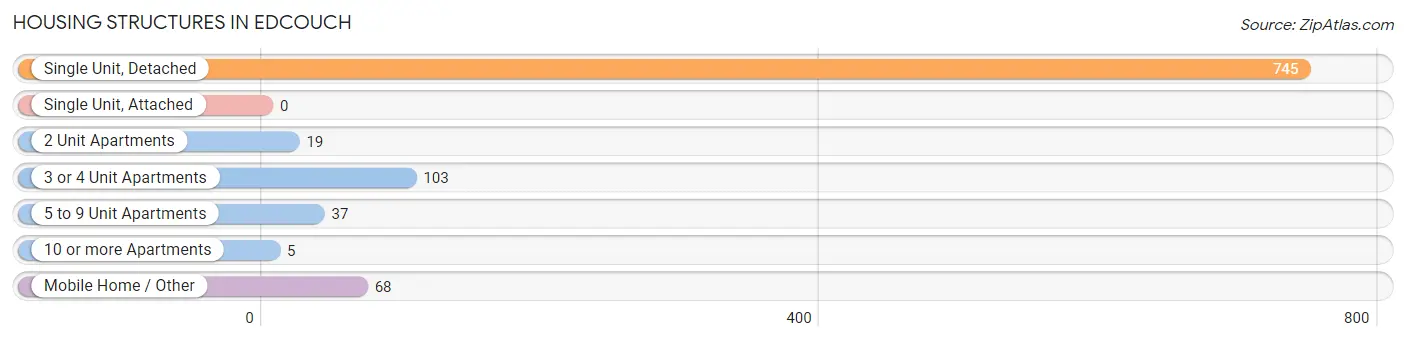
| Structure Type | # Housing Units | % Housing Units |
| Single Unit, Detached | 745 | 76.2% |
| Single Unit, Attached | 0 | 0.0% |
| 2 Unit Apartments | 19 | 1.9% |
| 3 or 4 Unit Apartments | 103 | 10.5% |
| 5 to 9 Unit Apartments | 37 | 3.8% |
| 10 or more Apartments | 5 | 0.5% |
| Mobile Home / Other | 68 | 7.0% |
| Total | 977 | 100.0% |
Housing Structures by Occupancy in Edcouch
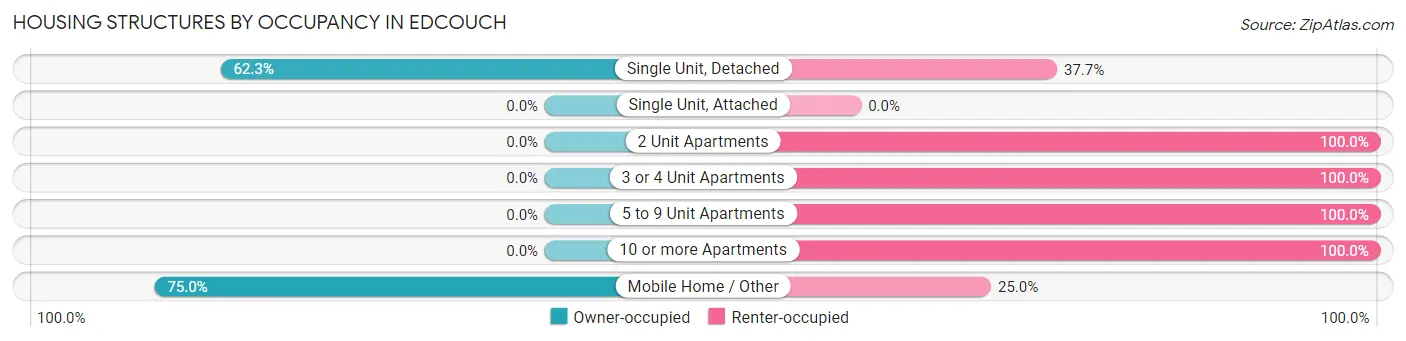
| Structure Type | Owner-occupied | Renter-occupied |
| Single Unit, Detached | 464 (62.3%) | 281 (37.7%) |
| Single Unit, Attached | 0 (0.0%) | 0 (0.0%) |
| 2 Unit Apartments | 0 (0.0%) | 19 (100.0%) |
| 3 or 4 Unit Apartments | 0 (0.0%) | 103 (100.0%) |
| 5 to 9 Unit Apartments | 0 (0.0%) | 37 (100.0%) |
| 10 or more Apartments | 0 (0.0%) | 5 (100.0%) |
| Mobile Home / Other | 51 (75.0%) | 17 (25.0%) |
| Total | 515 (52.7%) | 462 (47.3%) |
Housing Structures by Number of Rooms in Edcouch
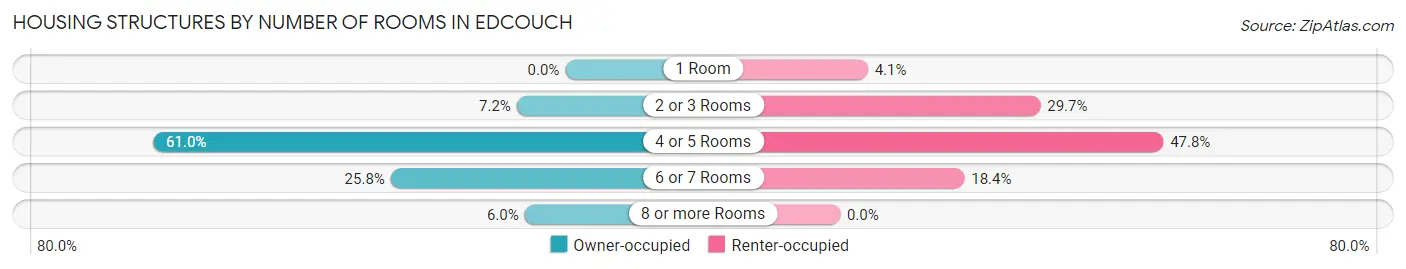
| Number of Rooms | Owner-occupied | Renter-occupied |
| 1 Room | 0 (0.0%) | 19 (4.1%) |
| 2 or 3 Rooms | 37 (7.2%) | 137 (29.6%) |
| 4 or 5 Rooms | 314 (61.0%) | 221 (47.8%) |
| 6 or 7 Rooms | 133 (25.8%) | 85 (18.4%) |
| 8 or more Rooms | 31 (6.0%) | 0 (0.0%) |
| Total | 515 (100.0%) | 462 (100.0%) |
Housing Structure by Heating Type in Edcouch
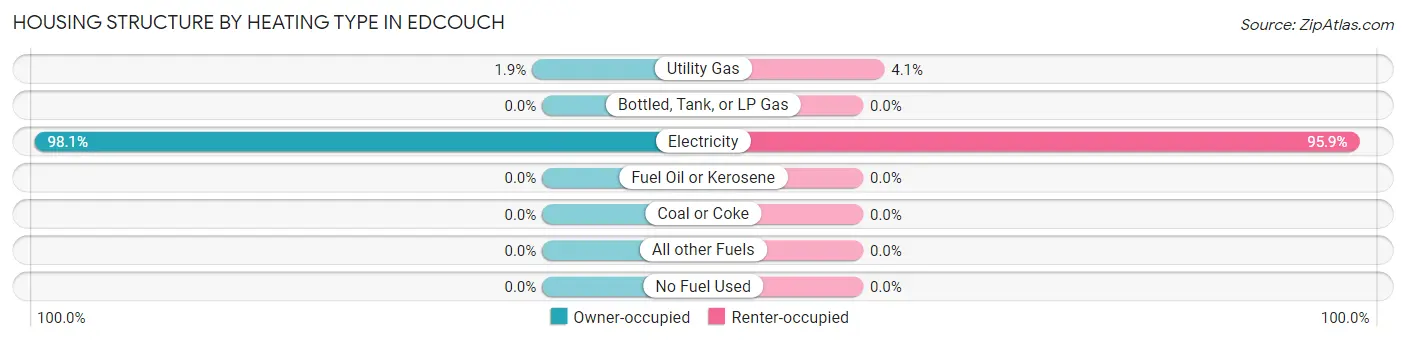
| Heating Type | Owner-occupied | Renter-occupied |
| Utility Gas | 10 (1.9%) | 19 (4.1%) |
| Bottled, Tank, or LP Gas | 0 (0.0%) | 0 (0.0%) |
| Electricity | 505 (98.1%) | 443 (95.9%) |
| Fuel Oil or Kerosene | 0 (0.0%) | 0 (0.0%) |
| Coal or Coke | 0 (0.0%) | 0 (0.0%) |
| All other Fuels | 0 (0.0%) | 0 (0.0%) |
| No Fuel Used | 0 (0.0%) | 0 (0.0%) |
| Total | 515 (100.0%) | 462 (100.0%) |
Household Vehicle Usage in Edcouch
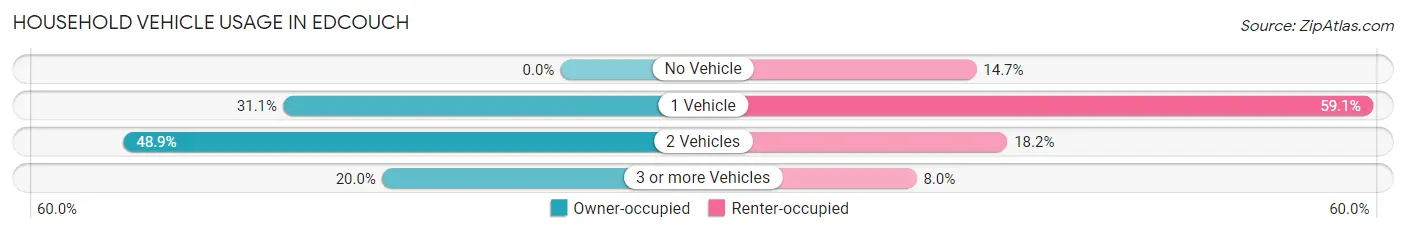
| Vehicles per Household | Owner-occupied | Renter-occupied |
| No Vehicle | 0 (0.0%) | 68 (14.7%) |
| 1 Vehicle | 160 (31.1%) | 273 (59.1%) |
| 2 Vehicles | 252 (48.9%) | 84 (18.2%) |
| 3 or more Vehicles | 103 (20.0%) | 37 (8.0%) |
| Total | 515 (100.0%) | 462 (100.0%) |
Real Estate & Mortgages in Edcouch
Real Estate and Mortgage Overview in Edcouch
| Characteristic | Without Mortgage | With Mortgage |
| Housing Units | 335 | 180 |
| Median Property Value | $48,200 | $92,800 |
| Median Household Income | $58,102 | $21 |
| Monthly Housing Costs | $369 | $0 |
| Real Estate Taxes | $896 | $0 |
Property Value by Mortgage Status in Edcouch
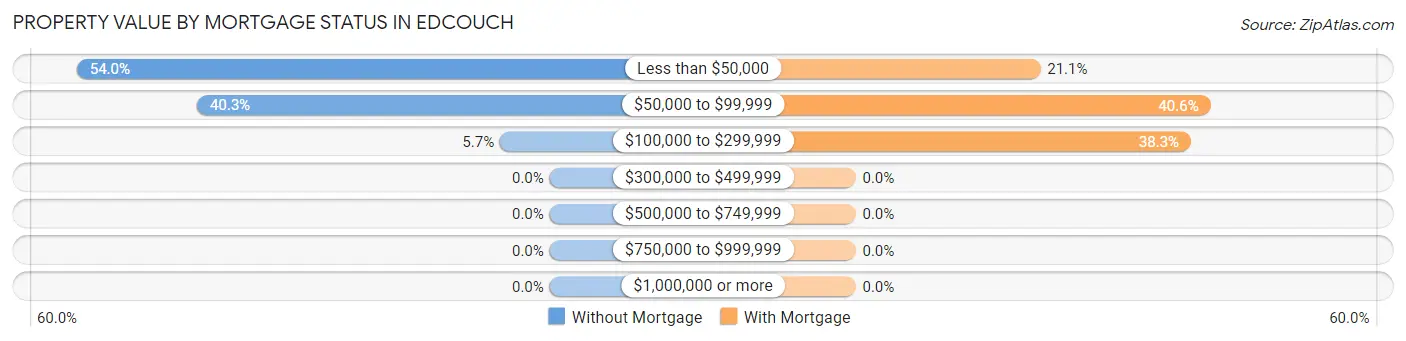
| Property Value | Without Mortgage | With Mortgage |
| Less than $50,000 | 181 (54.0%) | 38 (21.1%) |
| $50,000 to $99,999 | 135 (40.3%) | 73 (40.6%) |
| $100,000 to $299,999 | 19 (5.7%) | 69 (38.3%) |
| $300,000 to $499,999 | 0 (0.0%) | 0 (0.0%) |
| $500,000 to $749,999 | 0 (0.0%) | 0 (0.0%) |
| $750,000 to $999,999 | 0 (0.0%) | 0 (0.0%) |
| $1,000,000 or more | 0 (0.0%) | 0 (0.0%) |
| Total | 335 (100.0%) | 180 (100.0%) |
Household Income by Mortgage Status in Edcouch
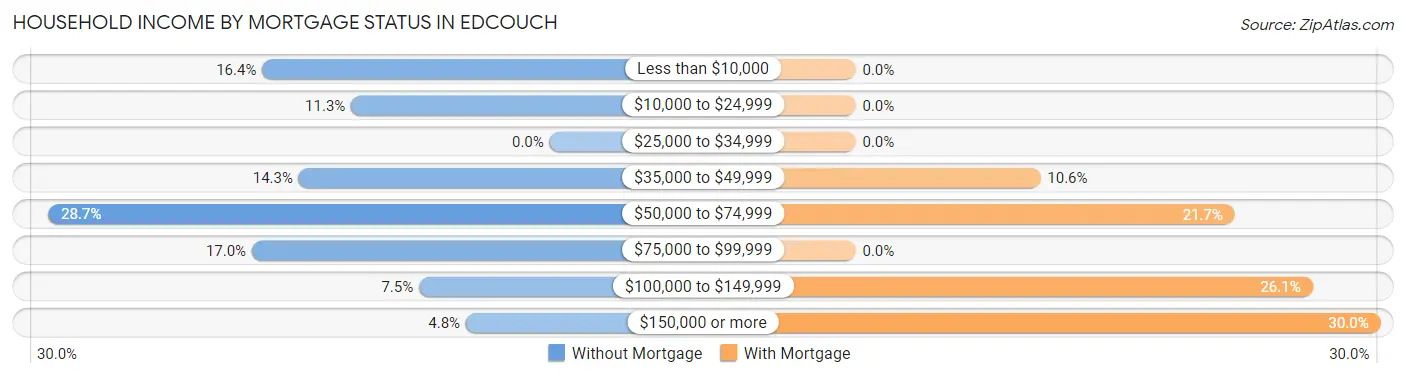
| Household Income | Without Mortgage | With Mortgage |
| Less than $10,000 | 55 (16.4%) | 0 (0.0%) |
| $10,000 to $24,999 | 38 (11.3%) | 0 (0.0%) |
| $25,000 to $34,999 | 0 (0.0%) | 0 (0.0%) |
| $35,000 to $49,999 | 48 (14.3%) | 19 (10.6%) |
| $50,000 to $74,999 | 96 (28.7%) | 39 (21.7%) |
| $75,000 to $99,999 | 57 (17.0%) | 0 (0.0%) |
| $100,000 to $149,999 | 25 (7.5%) | 47 (26.1%) |
| $150,000 or more | 16 (4.8%) | 54 (30.0%) |
| Total | 335 (100.0%) | 180 (100.0%) |
Property Value to Household Income Ratio in Edcouch
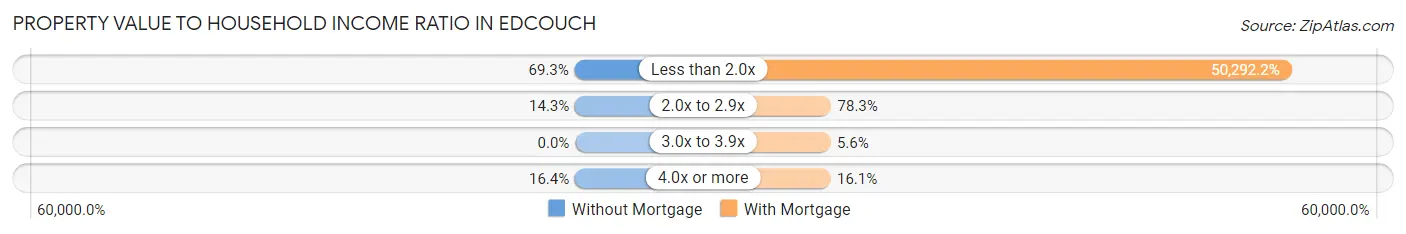
| Value-to-Income Ratio | Without Mortgage | With Mortgage |
| Less than 2.0x | 232 (69.3%) | 90,526 (50,292.2%) |
| 2.0x to 2.9x | 48 (14.3%) | 141 (78.3%) |
| 3.0x to 3.9x | 0 (0.0%) | 10 (5.6%) |
| 4.0x or more | 55 (16.4%) | 29 (16.1%) |
| Total | 335 (100.0%) | 180 (100.0%) |
Real Estate Taxes by Mortgage Status in Edcouch
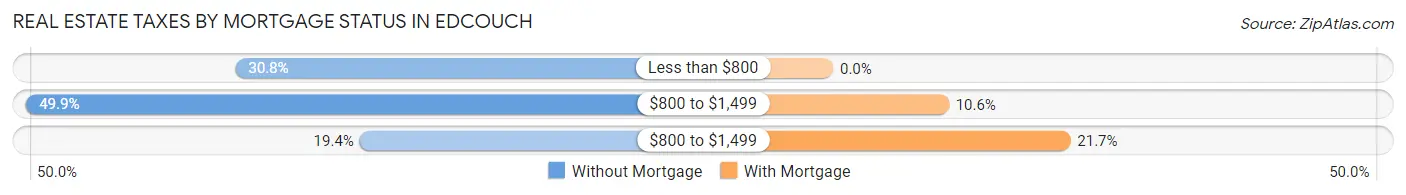
| Property Taxes | Without Mortgage | With Mortgage |
| Less than $800 | 103 (30.7%) | 0 (0.0%) |
| $800 to $1,499 | 167 (49.8%) | 19 (10.6%) |
| $800 to $1,499 | 65 (19.4%) | 39 (21.7%) |
| Total | 335 (100.0%) | 180 (100.0%) |
Health & Disability in Edcouch
Health Insurance Coverage by Age in Edcouch
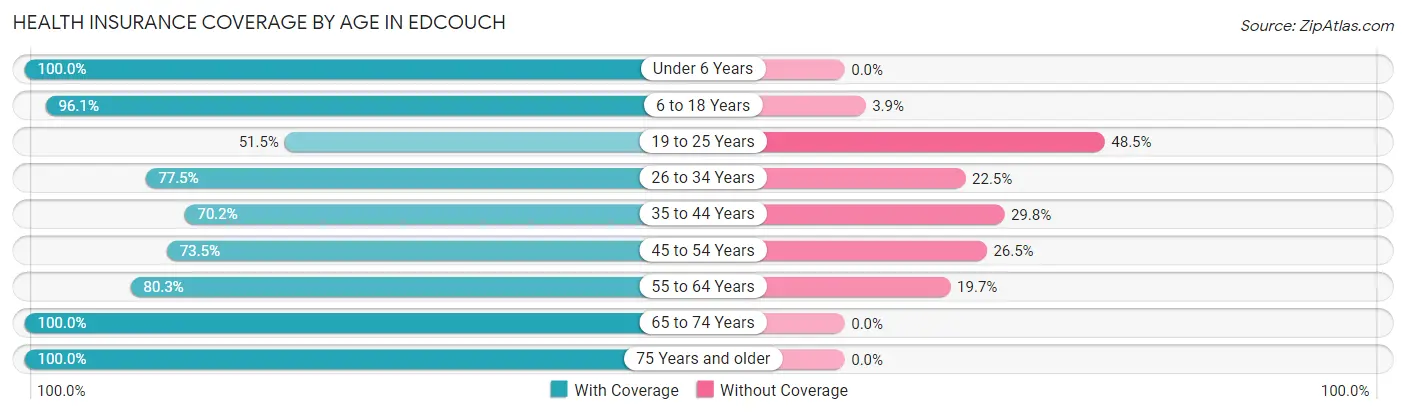
| Age Bracket | With Coverage | Without Coverage |
| Under 6 Years | 235 (100.0%) | 0 (0.0%) |
| 6 to 18 Years | 443 (96.1%) | 18 (3.9%) |
| 19 to 25 Years | 137 (51.5%) | 129 (48.5%) |
| 26 to 34 Years | 196 (77.5%) | 57 (22.5%) |
| 35 to 44 Years | 323 (70.2%) | 137 (29.8%) |
| 45 to 54 Years | 255 (73.5%) | 92 (26.5%) |
| 55 to 64 Years | 248 (80.3%) | 61 (19.7%) |
| 65 to 74 Years | 237 (100.0%) | 0 (0.0%) |
| 75 Years and older | 186 (100.0%) | 0 (0.0%) |
| Total | 2,260 (82.1%) | 494 (17.9%) |
Health Insurance Coverage by Citizenship Status in Edcouch
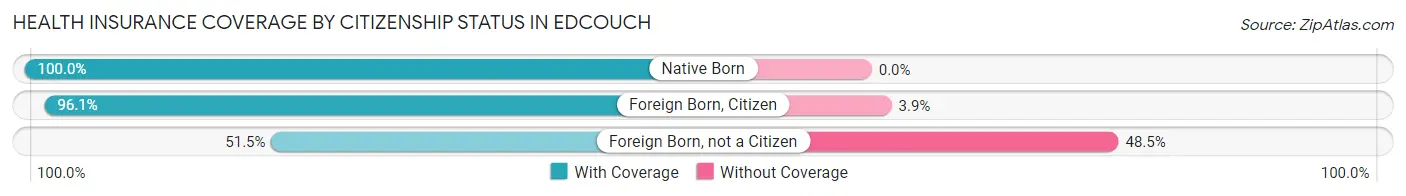
| Citizenship Status | With Coverage | Without Coverage |
| Native Born | 235 (100.0%) | 0 (0.0%) |
| Foreign Born, Citizen | 443 (96.1%) | 18 (3.9%) |
| Foreign Born, not a Citizen | 137 (51.5%) | 129 (48.5%) |
Health Insurance Coverage by Household Income in Edcouch
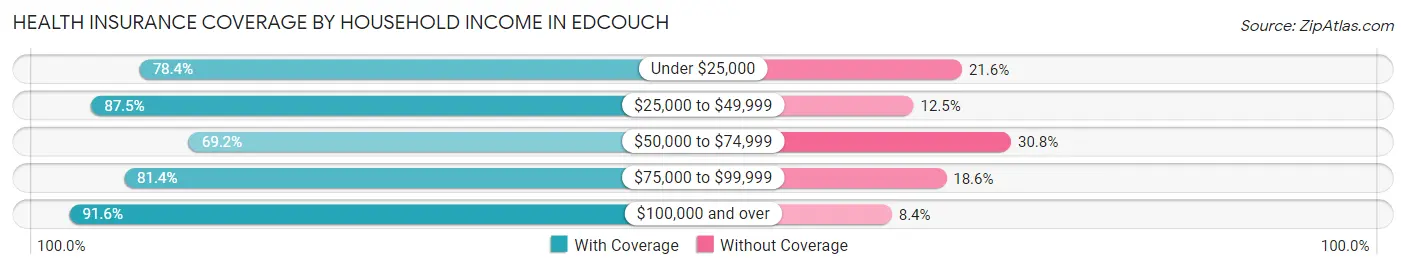
| Household Income | With Coverage | Without Coverage |
| Under $25,000 | 367 (78.4%) | 101 (21.6%) |
| $25,000 to $49,999 | 693 (87.5%) | 99 (12.5%) |
| $50,000 to $74,999 | 344 (69.2%) | 153 (30.8%) |
| $75,000 to $99,999 | 454 (81.4%) | 104 (18.6%) |
| $100,000 and over | 402 (91.6%) | 37 (8.4%) |
Public vs Private Health Insurance Coverage by Age in Edcouch
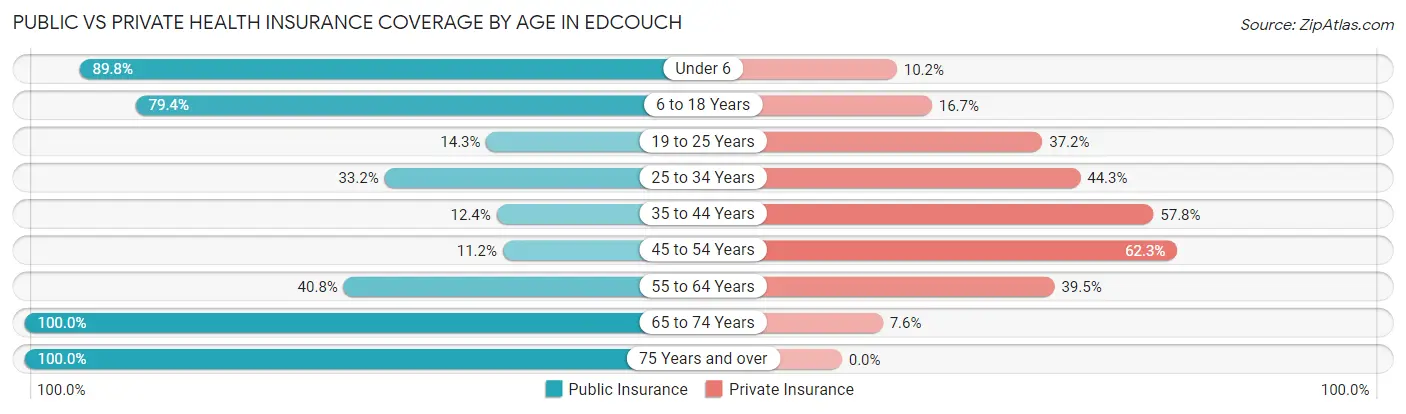
| Age Bracket | Public Insurance | Private Insurance |
| Under 6 | 211 (89.8%) | 24 (10.2%) |
| 6 to 18 Years | 366 (79.4%) | 77 (16.7%) |
| 19 to 25 Years | 38 (14.3%) | 99 (37.2%) |
| 25 to 34 Years | 84 (33.2%) | 112 (44.3%) |
| 35 to 44 Years | 57 (12.4%) | 266 (57.8%) |
| 45 to 54 Years | 39 (11.2%) | 216 (62.3%) |
| 55 to 64 Years | 126 (40.8%) | 122 (39.5%) |
| 65 to 74 Years | 237 (100.0%) | 18 (7.6%) |
| 75 Years and over | 186 (100.0%) | 0 (0.0%) |
| Total | 1,344 (48.8%) | 934 (33.9%) |
Disability Status by Sex by Age in Edcouch
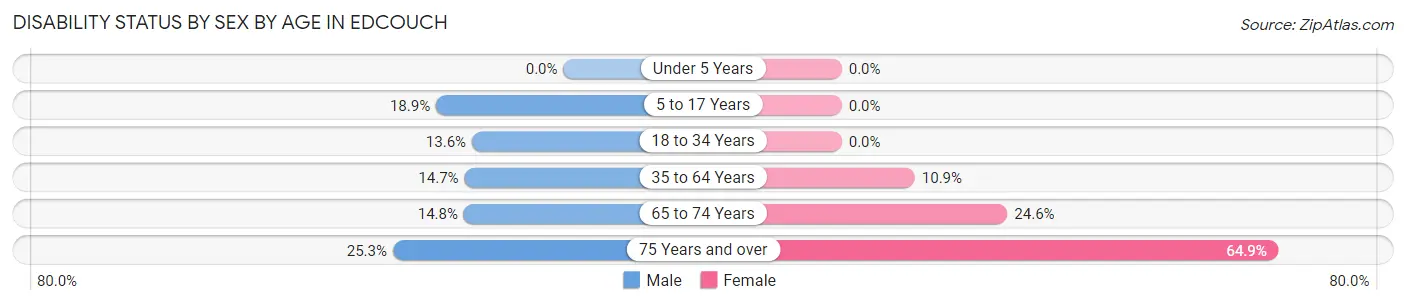
| Age Bracket | Male | Female |
| Under 5 Years | 0 (0.0%) | 0 (0.0%) |
| 5 to 17 Years | 38 (18.9%) | 0 (0.0%) |
| 18 to 34 Years | 41 (13.6%) | 0 (0.0%) |
| 35 to 64 Years | 84 (14.7%) | 59 (10.8%) |
| 65 to 74 Years | 17 (14.8%) | 30 (24.6%) |
| 75 Years and over | 19 (25.3%) | 72 (64.9%) |
Disability Class by Sex by Age in Edcouch
Disability Class: Hearing Difficulty
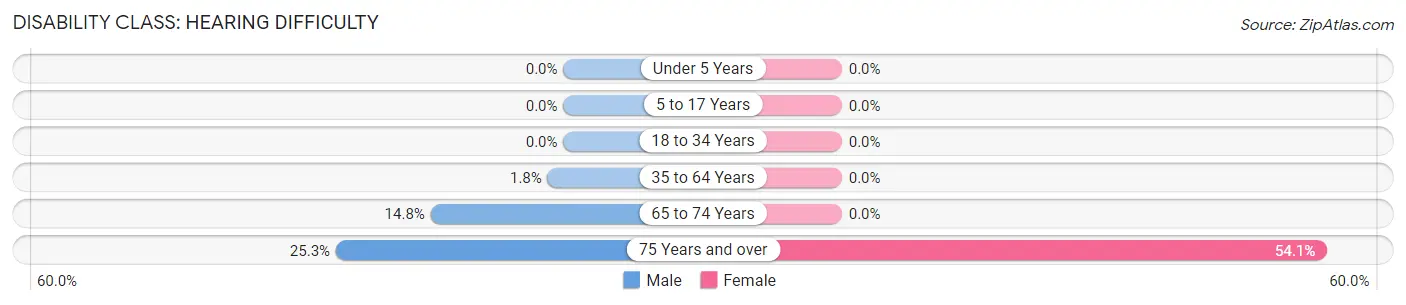
| Age Bracket | Male | Female |
| Under 5 Years | 0 (0.0%) | 0 (0.0%) |
| 5 to 17 Years | 0 (0.0%) | 0 (0.0%) |
| 18 to 34 Years | 0 (0.0%) | 0 (0.0%) |
| 35 to 64 Years | 10 (1.8%) | 0 (0.0%) |
| 65 to 74 Years | 17 (14.8%) | 0 (0.0%) |
| 75 Years and over | 19 (25.3%) | 60 (54.0%) |
Disability Class: Vision Difficulty
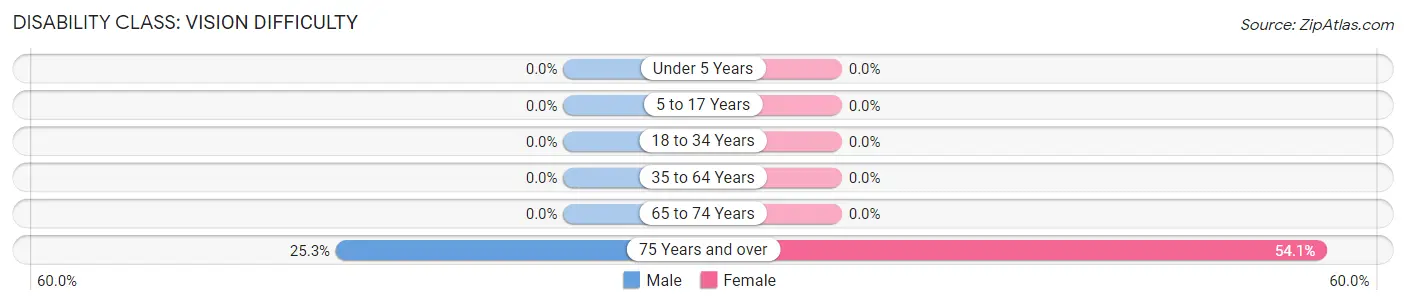
| Age Bracket | Male | Female |
| Under 5 Years | 0 (0.0%) | 0 (0.0%) |
| 5 to 17 Years | 0 (0.0%) | 0 (0.0%) |
| 18 to 34 Years | 0 (0.0%) | 0 (0.0%) |
| 35 to 64 Years | 0 (0.0%) | 0 (0.0%) |
| 65 to 74 Years | 0 (0.0%) | 0 (0.0%) |
| 75 Years and over | 19 (25.3%) | 60 (54.0%) |
Disability Class: Cognitive Difficulty
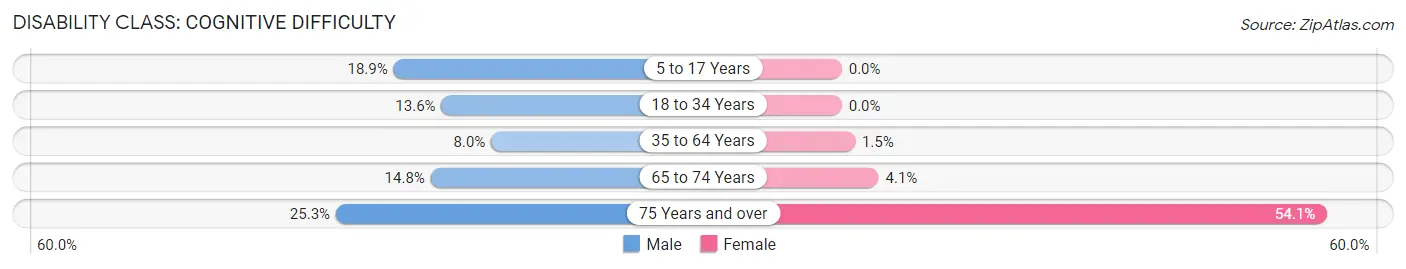
| Age Bracket | Male | Female |
| 5 to 17 Years | 38 (18.9%) | 0 (0.0%) |
| 18 to 34 Years | 41 (13.6%) | 0 (0.0%) |
| 35 to 64 Years | 46 (8.0%) | 8 (1.5%) |
| 65 to 74 Years | 17 (14.8%) | 5 (4.1%) |
| 75 Years and over | 19 (25.3%) | 60 (54.0%) |
Disability Class: Ambulatory Difficulty
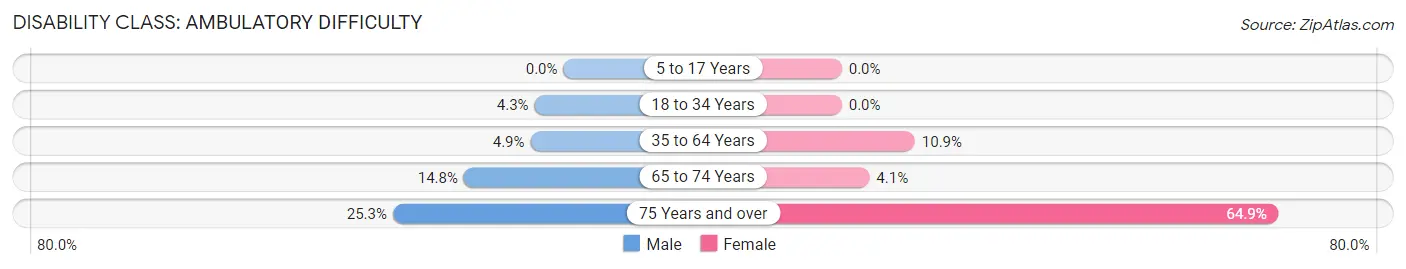
| Age Bracket | Male | Female |
| 5 to 17 Years | 0 (0.0%) | 0 (0.0%) |
| 18 to 34 Years | 13 (4.3%) | 0 (0.0%) |
| 35 to 64 Years | 28 (4.9%) | 59 (10.8%) |
| 65 to 74 Years | 17 (14.8%) | 5 (4.1%) |
| 75 Years and over | 19 (25.3%) | 72 (64.9%) |
Disability Class: Self-Care Difficulty
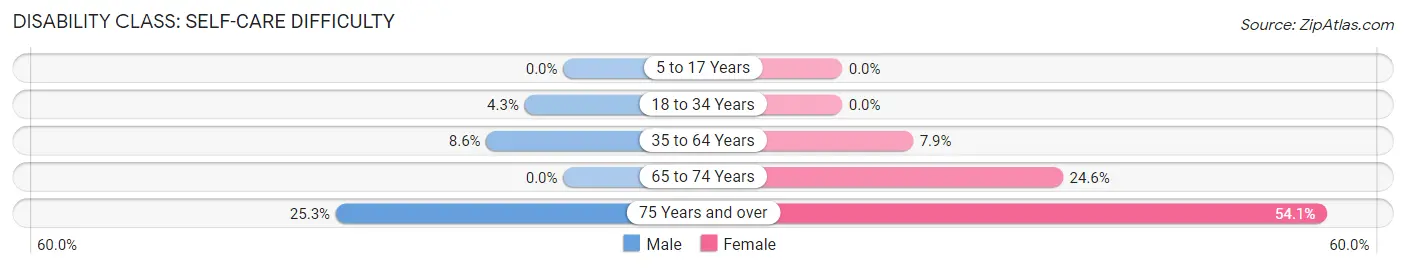
| Age Bracket | Male | Female |
| 5 to 17 Years | 0 (0.0%) | 0 (0.0%) |
| 18 to 34 Years | 13 (4.3%) | 0 (0.0%) |
| 35 to 64 Years | 49 (8.6%) | 43 (7.9%) |
| 65 to 74 Years | 0 (0.0%) | 30 (24.6%) |
| 75 Years and over | 19 (25.3%) | 60 (54.0%) |
Technology Access in Edcouch
Computing Device Access in Edcouch
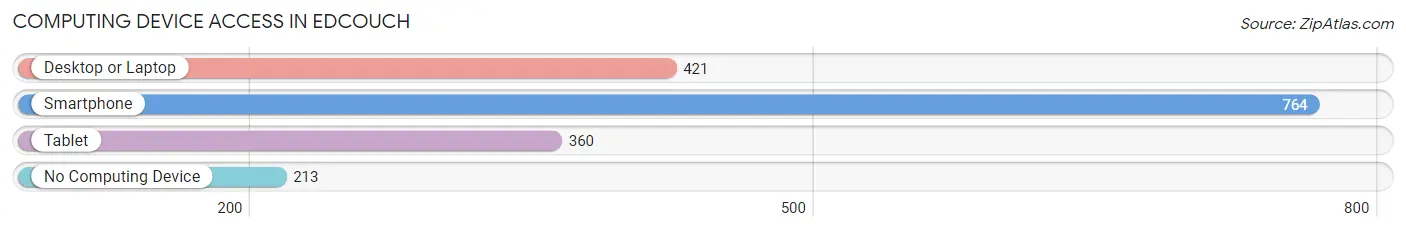
| Device Type | # Households | % Households |
| Desktop or Laptop | 421 | 43.1% |
| Smartphone | 764 | 78.2% |
| Tablet | 360 | 36.8% |
| No Computing Device | 213 | 21.8% |
| Total | 977 | 100.0% |
Internet Access in Edcouch
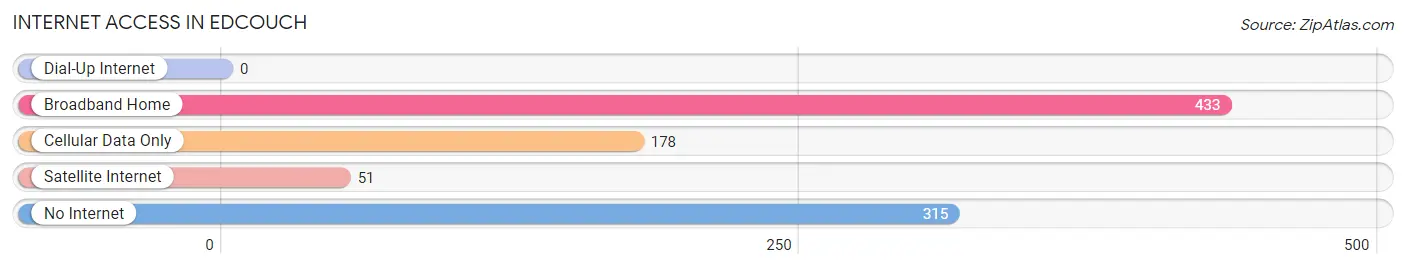
| Internet Type | # Households | % Households |
| Dial-Up Internet | 0 | 0.0% |
| Broadband Home | 433 | 44.3% |
| Cellular Data Only | 178 | 18.2% |
| Satellite Internet | 51 | 5.2% |
| No Internet | 315 | 32.2% |
| Total | 977 | 100.0% |
Edcouch Summary
Edcouch, Texas is a small town located in the Rio Grande Valley of South Texas. It is situated in Hidalgo County, approximately 20 miles west of McAllen and 25 miles east of Harlingen. The town was founded in 1883 by a group of settlers from the nearby town of Elsa. The town was named after the Edcouch family, who were among the first settlers.
Geography
Edcouch is located at 26°14'N 97°59'W (26.23, -97.98). It is situated at an elevation of approximately 40 feet (12 m) above sea level. The town is located in the Rio Grande Valley, which is a flat, low-lying area of South Texas. The Rio Grande River forms the border between the United States and Mexico, and the town is located approximately 10 miles (16 km) from the river. The climate in Edcouch is subtropical, with hot summers and mild winters.
Economy
The economy of Edcouch is largely based on agriculture. The town is located in an area known as the Winter Garden Region, which is one of the most productive agricultural regions in the United States. The main crops grown in the area are cotton, sorghum, corn, and vegetables. The town is also home to several large poultry farms. In addition to agriculture, Edcouch is home to several small businesses, including restaurants, retail stores, and service providers.
Demographics
As of the 2010 census, the population of Edcouch was 2,717. The racial makeup of the town was 79.3% White, 0.3% African American, 0.2% Native American, 0.2% Asian, 0.1% Pacific Islander, 18.7% from other races, and 1.4% from two or more races. Hispanic or Latino of any race were 97.2% of the population.
The median household income in Edcouch was $25,938, and the median family income was $30,938. The per capita income for the town was $11,845. About 24.3% of families and 28.2% of the population were below the poverty line, including 37.2% of those under age 18 and 24.2% of those age 65 or over.
Conclusion
Edcouch, Texas is a small town located in the Rio Grande Valley of South Texas. It is situated in Hidalgo County, approximately 20 miles west of McAllen and 25 miles east of Harlingen. The town was founded in 1883 by a group of settlers from the nearby town of Elsa. The town is located in an area known as the Winter Garden Region, which is one of the most productive agricultural regions in the United States. The economy of Edcouch is largely based on agriculture, and the town is also home to several small businesses. As of the 2010 census, the population of Edcouch was 2,717. The racial makeup of the town was 79.3% White, 0.3% African American, 0.2% Native American, 0.2% Asian, 0.1% Pacific Islander, 18.7% from other races, and 1.4% from two or more races. Hispanic or Latino of any race were 97.2% of the population. The median household income in Edcouch was $25,938, and the median family income was $30,938. The per capita income for the town was $11,845.
Common Questions
What is Per Capita Income in Edcouch?
Per Capita income in Edcouch is $19,983.
What is the Median Family Income in Edcouch?
Median Family Income in Edcouch is $58,194.
What is the Median Household income in Edcouch?
Median Household Income in Edcouch is $38,594.
What is Income or Wage Gap in Edcouch?
Income or Wage Gap in Edcouch is 10.0%.
Women in Edcouch earn 90.0 cents for every dollar earned by a man.
What is Family Income Deficit in Edcouch?
Family Income Deficit in Edcouch is $7,927.
Families that are below poverty line in Edcouch earn $7,927 less on average than the poverty threshold level.
What is Inequality or Gini Index in Edcouch?
Inequality or Gini Index in Edcouch is 0.46.
What is the Total Population of Edcouch?
Total Population of Edcouch is 2,754.
What is the Total Male Population of Edcouch?
Total Male Population of Edcouch is 1,378.
What is the Total Female Population of Edcouch?
Total Female Population of Edcouch is 1,376.
What is the Ratio of Males per 100 Females in Edcouch?
There are 100.15 Males per 100 Females in Edcouch.
What is the Ratio of Females per 100 Males in Edcouch?
There are 99.85 Females per 100 Males in Edcouch.
What is the Median Population Age in Edcouch?
Median Population Age in Edcouch is 38.9 Years.
What is the Average Family Size in Edcouch
Average Family Size in Edcouch is 3.4 People.
What is the Average Household Size in Edcouch
Average Household Size in Edcouch is 2.8 People.
How Large is the Labor Force in Edcouch?
There are 1,171 People in the Labor Forcein in Edcouch.
What is the Percentage of People in the Labor Force in Edcouch?
54.3% of People are in the Labor Force in Edcouch.
What is the Unemployment Rate in Edcouch?
Unemployment Rate in Edcouch is 7.8%.