Eagle Pass, TX Map & Demographics
Eagle Pass Map
Eagle Pass Overview
$22,353
PER CAPITA INCOME
$65,718
AVG FAMILY INCOME
$52,254
AVG HOUSEHOLD INCOME
40.3%
WAGE / INCOME GAP [ % ]
59.7¢/ $1
WAGE / INCOME GAP [ $ ]
$9,942
FAMILY INCOME DEFICIT
0.45
INEQUALITY / GINI INDEX
28,166
TOTAL POPULATION
13,562
MALE POPULATION
14,604
FEMALE POPULATION
92.86
MALES / 100 FEMALES
107.68
FEMALES / 100 MALES
29.7
MEDIAN AGE
3.5
AVG FAMILY SIZE
3.0
AVG HOUSEHOLD SIZE
12,767
LABOR FORCE [ PEOPLE ]
60.9%
PERCENT IN LABOR FORCE
6.8%
UNEMPLOYMENT RATE
Eagle Pass Zip Codes
Eagle Pass Area Codes
Income in Eagle Pass
Income Overview in Eagle Pass
Per Capita Income in Eagle Pass is $22,353, while median incomes of families and households are $65,718 and $52,254 respectively.
| Characteristic | Number | Measure |
| Per Capita Income | 28,166 | $22,353 |
| Median Family Income | 7,261 | $65,718 |
| Mean Family Income | 7,261 | $73,933 |
| Median Household Income | 9,150 | $52,254 |
| Mean Household Income | 9,150 | $65,925 |
| Income Deficit | 7,261 | $9,942 |
| Wage / Income Gap (%) | 28,166 | 40.29% |
| Wage / Income Gap ($) | 28,166 | 59.71¢ per $1 |
| Gini / Inequality Index | 28,166 | 0.45 |
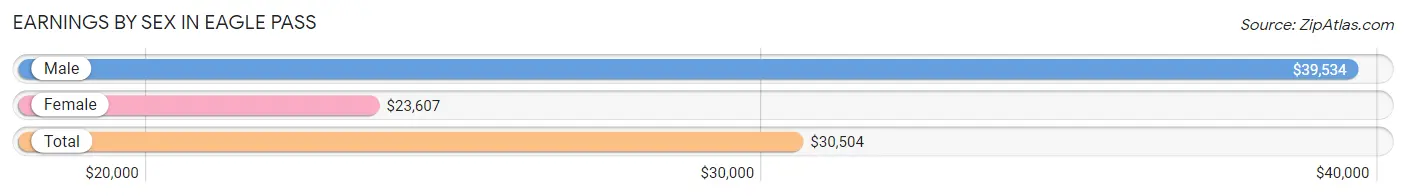
Earnings by Sex in Eagle Pass
Average Earnings in Eagle Pass are $30,504, $39,534 for men and $23,607 for women, a difference of 40.3%.
| Sex | Number | Average Earnings |
| Male | 7,367 (54.8%) | $39,534 |
| Female | 6,087 (45.2%) | $23,607 |
| Total | 13,454 (100.0%) | $30,504 |
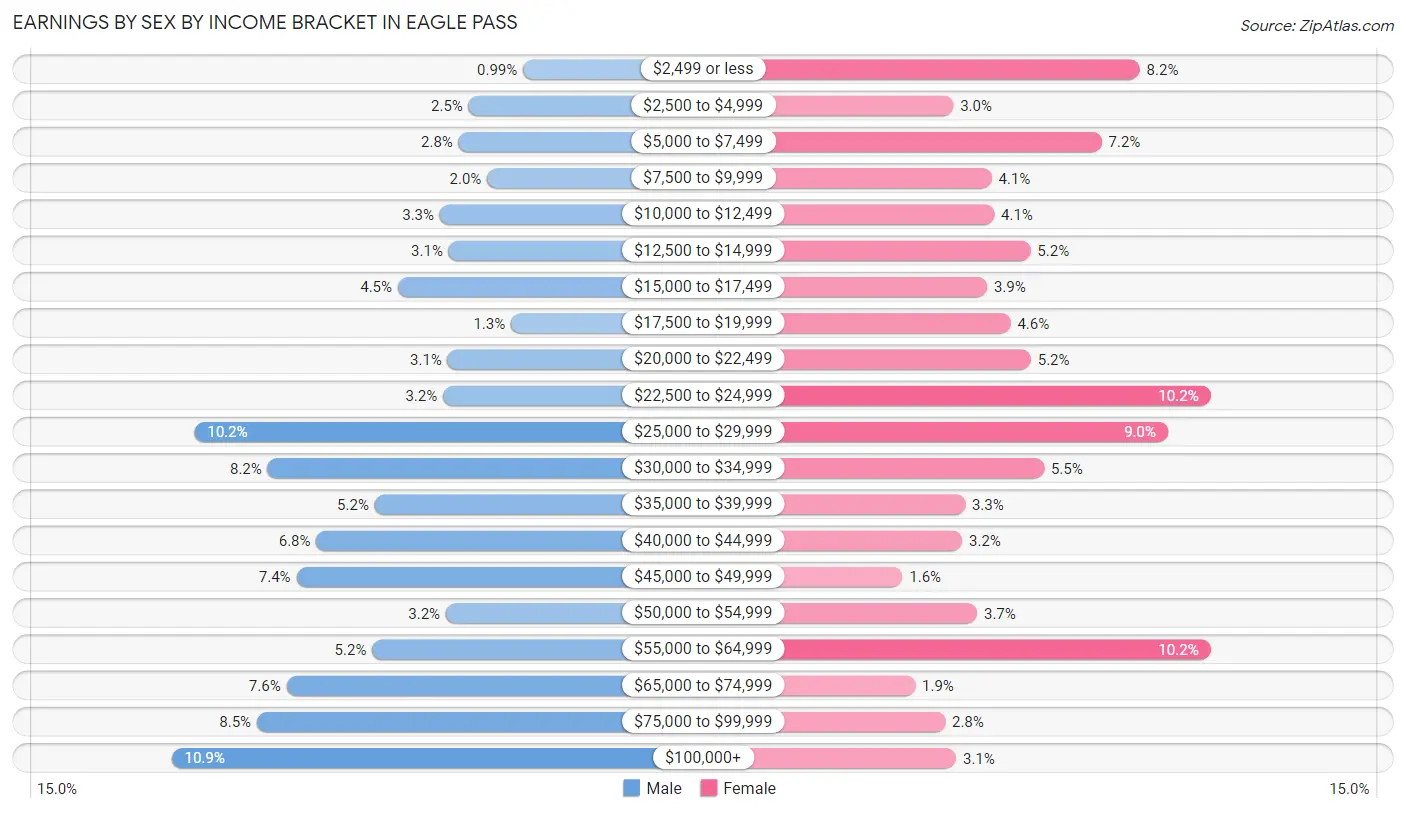
Earnings by Sex by Income Bracket in Eagle Pass
The most common earnings brackets in Eagle Pass are $100,000+ for men (801 | 10.9%) and $22,500 to $24,999 for women (622 | 10.2%).
| Income | Male | Female |
| $2,499 or less | 73 (1.0%) | 501 (8.2%) |
| $2,500 to $4,999 | 186 (2.5%) | 182 (3.0%) |
| $5,000 to $7,499 | 206 (2.8%) | 436 (7.2%) |
| $7,500 to $9,999 | 147 (2.0%) | 248 (4.1%) |
| $10,000 to $12,499 | 245 (3.3%) | 252 (4.1%) |
| $12,500 to $14,999 | 227 (3.1%) | 314 (5.2%) |
| $15,000 to $17,499 | 332 (4.5%) | 240 (3.9%) |
| $17,500 to $19,999 | 98 (1.3%) | 280 (4.6%) |
| $20,000 to $22,499 | 229 (3.1%) | 315 (5.2%) |
| $22,500 to $24,999 | 239 (3.2%) | 622 (10.2%) |
| $25,000 to $29,999 | 754 (10.2%) | 549 (9.0%) |
| $30,000 to $34,999 | 602 (8.2%) | 337 (5.5%) |
| $35,000 to $39,999 | 380 (5.2%) | 202 (3.3%) |
| $40,000 to $44,999 | 501 (6.8%) | 197 (3.2%) |
| $45,000 to $49,999 | 542 (7.4%) | 95 (1.6%) |
| $50,000 to $54,999 | 233 (3.2%) | 223 (3.7%) |
| $55,000 to $64,999 | 385 (5.2%) | 622 (10.2%) |
| $65,000 to $74,999 | 563 (7.6%) | 117 (1.9%) |
| $75,000 to $99,999 | 624 (8.5%) | 168 (2.8%) |
| $100,000+ | 801 (10.9%) | 187 (3.1%) |
| Total | 7,367 (100.0%) | 6,087 (100.0%) |
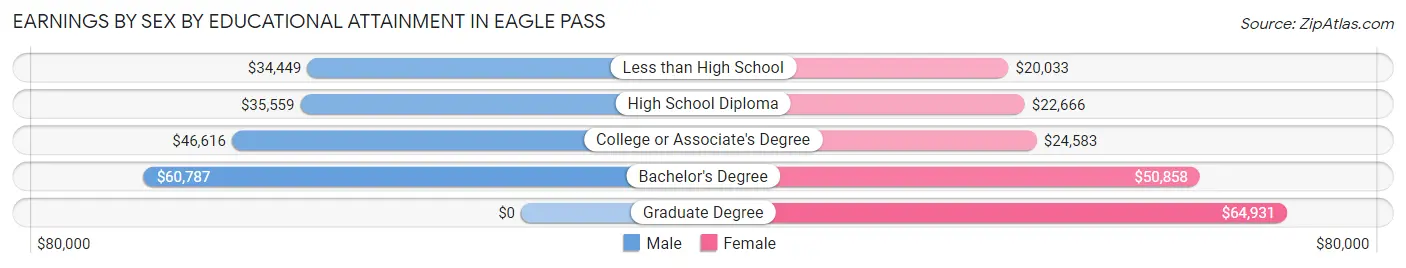
Earnings by Sex by Educational Attainment in Eagle Pass
Average earnings in Eagle Pass are $45,065 for men and $25,321 for women, a difference of 43.8%. Men with an educational attainment of bachelor's degree enjoy the highest average annual earnings of $60,787, while those with less than high school education earn the least with $34,449. Women with an educational attainment of graduate degree earn the most with the average annual earnings of $64,931, while those with less than high school education have the smallest earnings of $20,033.
| Educational Attainment | Male Income | Female Income |
| Less than High School | $34,449 | $20,033 |
| High School Diploma | $35,559 | $22,666 |
| College or Associate's Degree | $46,616 | $24,583 |
| Bachelor's Degree | $60,787 | $50,858 |
| Graduate Degree | - | - |
| Total | $45,065 | $25,321 |
Family Income in Eagle Pass
Family Income Brackets in Eagle Pass
According to the Eagle Pass family income data, there are 1,459 families falling into the $100,000 to $149,999 income range, which is the most common income bracket and makes up 20.1% of all families. Conversely, the $150,000 to $199,999 income bracket is the least frequent group with only 269 families (3.7%) belonging to this category.
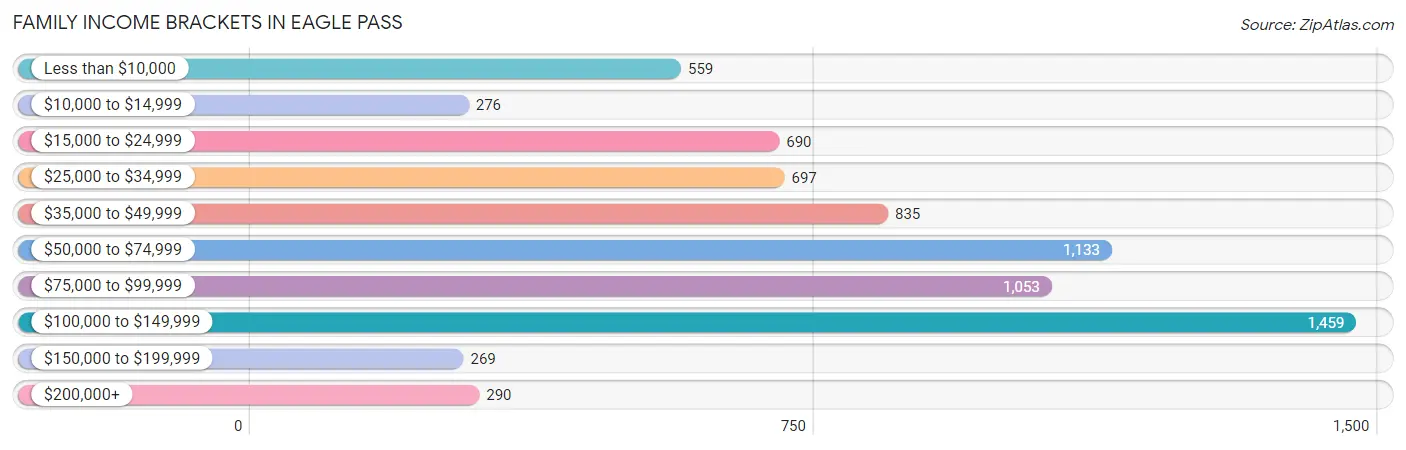
| Income Bracket | # Families | % Families |
| Less than $10,000 | 559 | 7.7% |
| $10,000 to $14,999 | 276 | 3.8% |
| $15,000 to $24,999 | 690 | 9.5% |
| $25,000 to $34,999 | 697 | 9.6% |
| $35,000 to $49,999 | 835 | 11.5% |
| $50,000 to $74,999 | 1,133 | 15.6% |
| $75,000 to $99,999 | 1,053 | 14.5% |
| $100,000 to $149,999 | 1,459 | 20.1% |
| $150,000 to $199,999 | 269 | 3.7% |
| $200,000+ | 290 | 4.0% |
Family Income by Famaliy Size in Eagle Pass
5-person families (1,109 | 15.3%) account for the highest median family income in Eagle Pass with $85,919 per family, while 3-person families (1,990 | 27.4%) have the highest median income of $22,591 per family member.
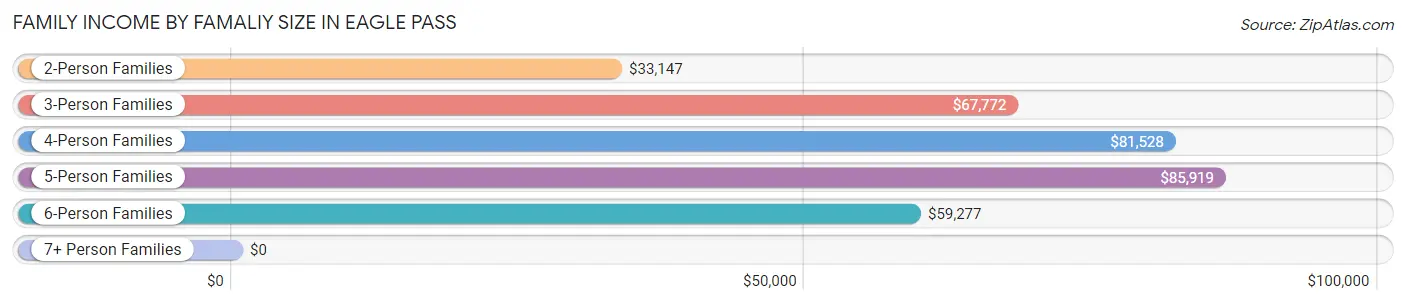
| Income Bracket | # Families | Median Income |
| 2-Person Families | 2,179 (30.0%) | $33,147 |
| 3-Person Families | 1,990 (27.4%) | $67,772 |
| 4-Person Families | 1,478 (20.4%) | $81,528 |
| 5-Person Families | 1,109 (15.3%) | $85,919 |
| 6-Person Families | 390 (5.4%) | $59,277 |
| 7+ Person Families | 115 (1.6%) | $0 |
| Total | 7,261 (100.0%) | $65,718 |
Family Income by Number of Earners in Eagle Pass
The median family income in Eagle Pass is $65,718, with families comprising 3+ earners (972) having the highest median family income of $112,727, while families with no earners (827) have the lowest median family income of $17,707, accounting for 13.4% and 11.4% of families, respectively.
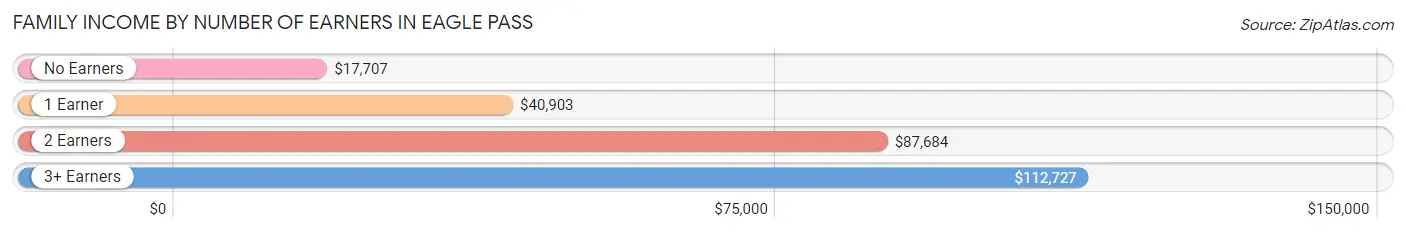
| Number of Earners | # Families | Median Income |
| No Earners | 827 (11.4%) | $17,707 |
| 1 Earner | 2,653 (36.5%) | $40,903 |
| 2 Earners | 2,809 (38.7%) | $87,684 |
| 3+ Earners | 972 (13.4%) | $112,727 |
| Total | 7,261 (100.0%) | $65,718 |
Household Income in Eagle Pass
Household Income Brackets in Eagle Pass
With 1,482 households falling in the category, the $100,000 to $149,999 income range is the most frequent in Eagle Pass, accounting for 16.2% of all households. In contrast, only 302 households (3.3%) fall into the $150,000 to $199,999 income bracket, making it the least populous group.
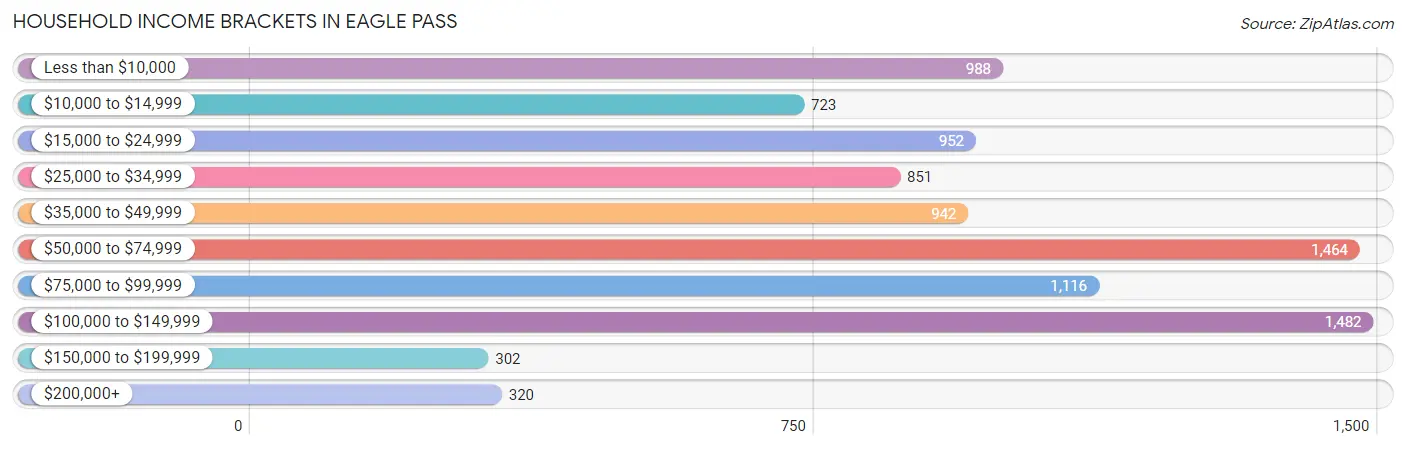
| Income Bracket | # Households | % Households |
| Less than $10,000 | 988 | 10.8% |
| $10,000 to $14,999 | 723 | 7.9% |
| $15,000 to $24,999 | 952 | 10.4% |
| $25,000 to $34,999 | 851 | 9.3% |
| $35,000 to $49,999 | 942 | 10.3% |
| $50,000 to $74,999 | 1,464 | 16.0% |
| $75,000 to $99,999 | 1,116 | 12.2% |
| $100,000 to $149,999 | 1,482 | 16.2% |
| $150,000 to $199,999 | 302 | 3.3% |
| $200,000+ | 320 | 3.5% |
Household Income by Householder Age in Eagle Pass
The median household income in Eagle Pass is $52,254, with the highest median household income of $68,428 found in the 25 to 44 years age bracket for the primary householder. A total of 3,190 households (34.9%) fall into this category. Meanwhile, the 65+ years age bracket for the primary householder has the lowest median household income of $24,488, with 1,891 households (20.7%) in this group.
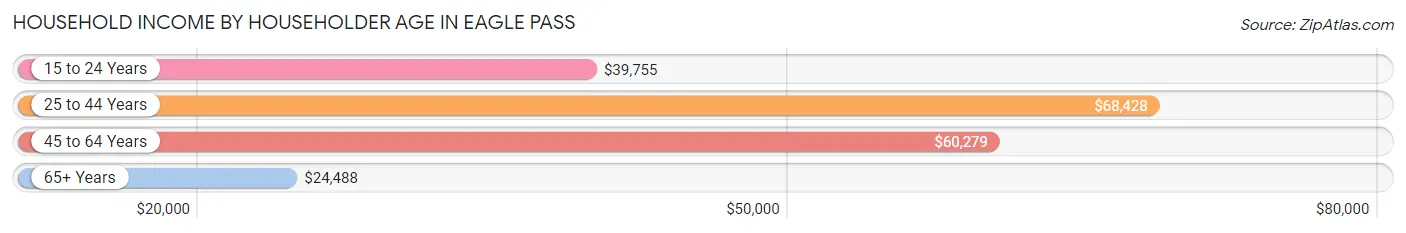
| Income Bracket | # Households | Median Income |
| 15 to 24 Years | 448 (4.9%) | $39,755 |
| 25 to 44 Years | 3,190 (34.9%) | $68,428 |
| 45 to 64 Years | 3,621 (39.6%) | $60,279 |
| 65+ Years | 1,891 (20.7%) | $24,488 |
| Total | 9,150 (100.0%) | $52,254 |
Poverty in Eagle Pass
Income Below Poverty by Sex and Age in Eagle Pass
With 19.5% poverty level for males and 26.9% for females among the residents of Eagle Pass, 5 year old males and 15 year old females are the most vulnerable to poverty, with 138 males (61.1%) and 92 females (70.2%) in their respective age groups living below the poverty level.
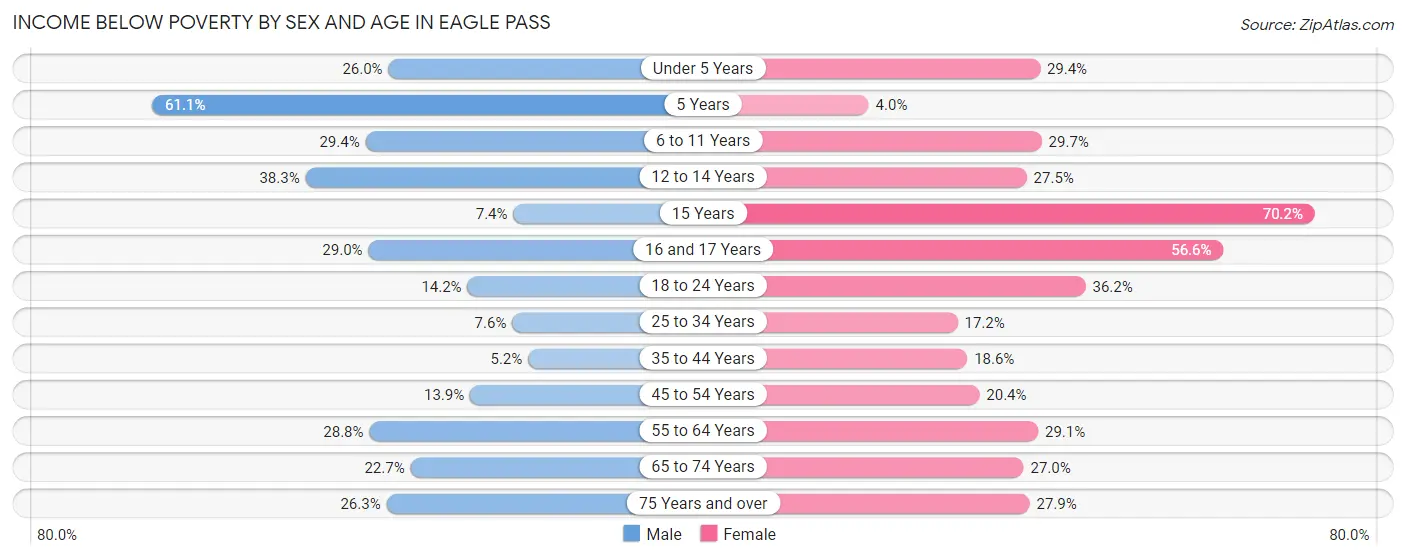
| Age Bracket | Male | Female |
| Under 5 Years | 307 (26.0%) | 438 (29.4%) |
| 5 Years | 138 (61.1%) | 12 (4.0%) |
| 6 to 11 Years | 359 (29.4%) | 368 (29.7%) |
| 12 to 14 Years | 286 (38.3%) | 112 (27.5%) |
| 15 Years | 19 (7.4%) | 92 (70.2%) |
| 16 and 17 Years | 130 (28.9%) | 354 (56.6%) |
| 18 to 24 Years | 233 (14.2%) | 598 (36.2%) |
| 25 to 34 Years | 155 (7.6%) | 413 (17.2%) |
| 35 to 44 Years | 72 (5.2%) | 254 (18.6%) |
| 45 to 54 Years | 247 (13.9%) | 322 (20.4%) |
| 55 to 64 Years | 367 (28.8%) | 401 (29.1%) |
| 65 to 74 Years | 158 (22.7%) | 248 (27.0%) |
| 75 Years and over | 141 (26.3%) | 276 (27.9%) |
| Total | 2,612 (19.5%) | 3,888 (26.9%) |
Income Above Poverty by Sex and Age in Eagle Pass
According to the poverty statistics in Eagle Pass, males aged 35 to 44 years and females aged 5 years are the age groups that are most secure financially, with 94.8% of males and 96.0% of females in these age groups living above the poverty line.
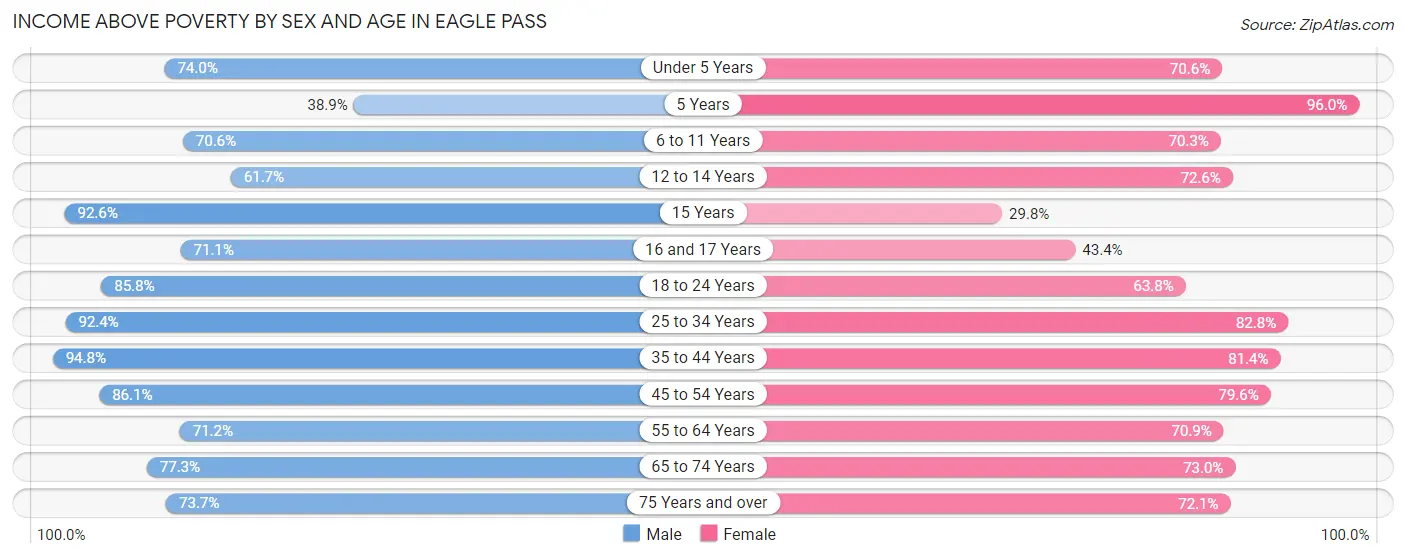
| Age Bracket | Male | Female |
| Under 5 Years | 875 (74.0%) | 1,051 (70.6%) |
| 5 Years | 88 (38.9%) | 289 (96.0%) |
| 6 to 11 Years | 863 (70.6%) | 872 (70.3%) |
| 12 to 14 Years | 461 (61.7%) | 296 (72.6%) |
| 15 Years | 237 (92.6%) | 39 (29.8%) |
| 16 and 17 Years | 319 (71.1%) | 271 (43.4%) |
| 18 to 24 Years | 1,403 (85.8%) | 1,054 (63.8%) |
| 25 to 34 Years | 1,887 (92.4%) | 1,990 (82.8%) |
| 35 to 44 Years | 1,305 (94.8%) | 1,110 (81.4%) |
| 45 to 54 Years | 1,535 (86.1%) | 1,254 (79.6%) |
| 55 to 64 Years | 907 (71.2%) | 975 (70.9%) |
| 65 to 74 Years | 538 (77.3%) | 671 (73.0%) |
| 75 Years and over | 396 (73.7%) | 714 (72.1%) |
| Total | 10,814 (80.5%) | 10,586 (73.1%) |
Income Below Poverty Among Married-Couple Families in Eagle Pass
The poverty statistics for married-couple families in Eagle Pass show that 10.1% or 490 of the total 4,856 families live below the poverty line. Families with 3 or 4 children have the highest poverty rate of 16.1%, comprising of 94 families. On the other hand, families with 5 or more children have the lowest poverty rate of 0.0%, which includes 0 families.
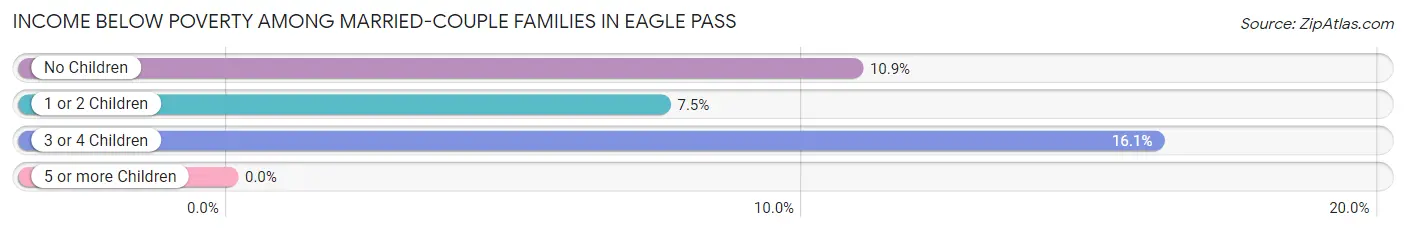
| Children | Above Poverty | Below Poverty |
| No Children | 2,007 (89.1%) | 245 (10.9%) |
| 1 or 2 Children | 1,853 (92.5%) | 151 (7.5%) |
| 3 or 4 Children | 489 (83.9%) | 94 (16.1%) |
| 5 or more Children | 17 (100.0%) | 0 (0.0%) |
| Total | 4,366 (89.9%) | 490 (10.1%) |
Income Below Poverty Among Single-Parent Households in Eagle Pass
According to the poverty data in Eagle Pass, 43.1% or 211 single-father households and 46.5% or 891 single-mother households are living below the poverty line. Among single-father households, those with 5 or more children have the highest poverty rate, with 33 households (100.0%) experiencing poverty. Likewise, among single-mother households, those with 1 or 2 children have the highest poverty rate, with 562 households (54.0%) falling below the poverty line.
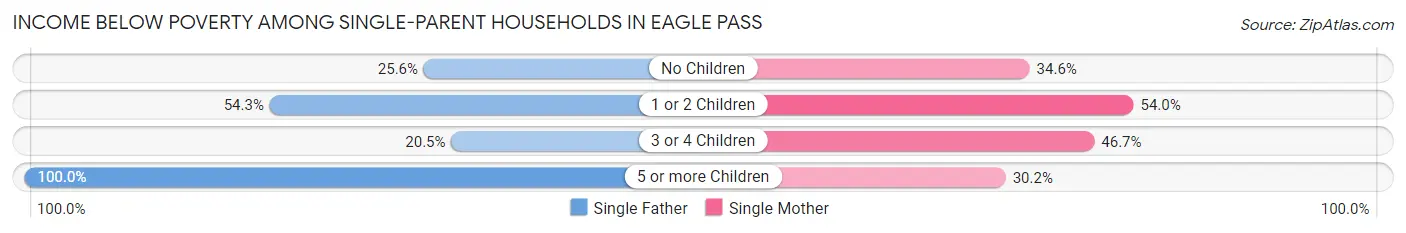
| Children | Single Father | Single Mother |
| No Children | 51 (25.6%) | 177 (34.6%) |
| 1 or 2 Children | 119 (54.3%) | 562 (54.0%) |
| 3 or 4 Children | 8 (20.5%) | 120 (46.7%) |
| 5 or more Children | 33 (100.0%) | 32 (30.2%) |
| Total | 211 (43.1%) | 891 (46.5%) |
Income Below Poverty Among Married-Couple vs Single-Parent Households in Eagle Pass
The poverty data for Eagle Pass shows that 490 of the married-couple family households (10.1%) and 1,102 of the single-parent households (45.8%) are living below the poverty level. Within the married-couple family households, those with 3 or 4 children have the highest poverty rate, with 94 households (16.1%) falling below the poverty line. Among the single-parent households, those with 1 or 2 children have the highest poverty rate, with 681 household (54.0%) living below poverty.
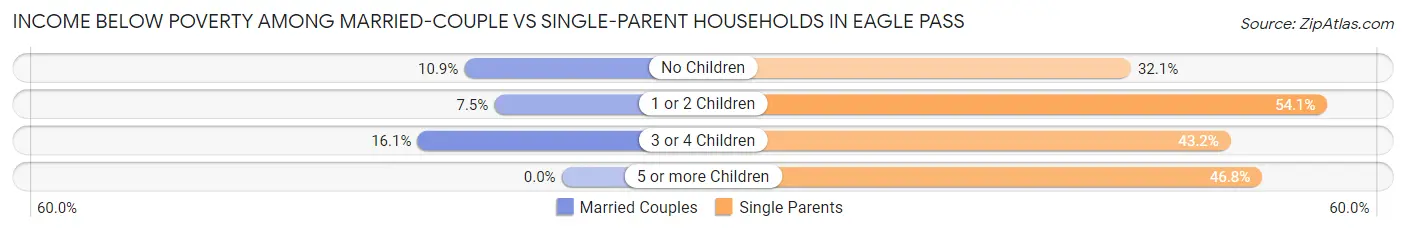
| Children | Married-Couple Families | Single-Parent Households |
| No Children | 245 (10.9%) | 228 (32.1%) |
| 1 or 2 Children | 151 (7.5%) | 681 (54.0%) |
| 3 or 4 Children | 94 (16.1%) | 128 (43.2%) |
| 5 or more Children | 0 (0.0%) | 65 (46.8%) |
| Total | 490 (10.1%) | 1,102 (45.8%) |
Race in Eagle Pass
The most populous races in Eagle Pass are Hispanic or Latino (27,142 | 96.4%), White / Caucasian (16,112 | 57.2%), and Two or more Races (9,829 | 34.9%).
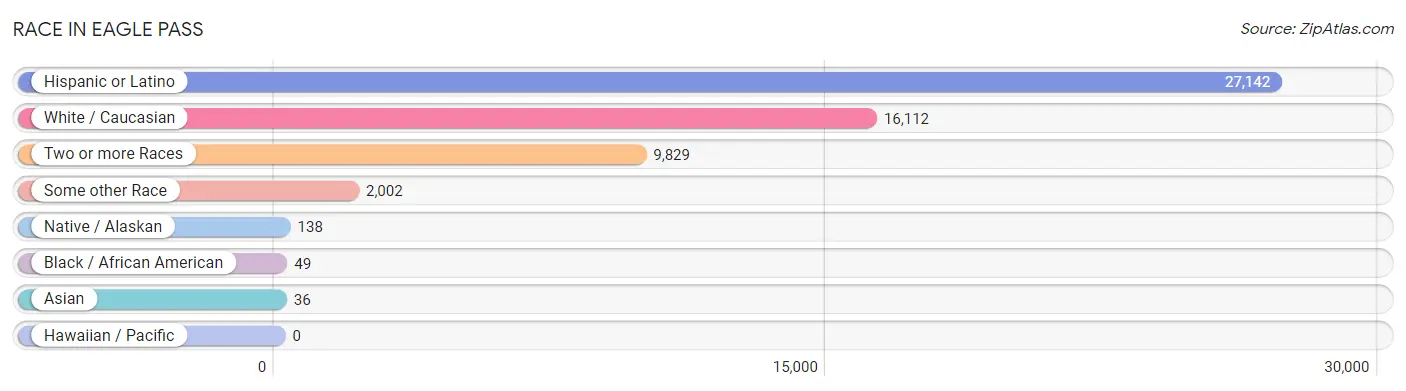
| Race | # Population | % Population |
| Asian | 36 | 0.1% |
| Black / African American | 49 | 0.2% |
| Hawaiian / Pacific | 0 | 0.0% |
| Hispanic or Latino | 27,142 | 96.4% |
| Native / Alaskan | 138 | 0.5% |
| White / Caucasian | 16,112 | 57.2% |
| Two or more Races | 9,829 | 34.9% |
| Some other Race | 2,002 | 7.1% |
| Total | 28,166 | 100.0% |
Ancestry in Eagle Pass
The most populous ancestries reported in Eagle Pass are Mexican (26,087 | 92.6%), German (213 | 0.8%), Irish (197 | 0.7%), American (175 | 0.6%), and Italian (168 | 0.6%), together accounting for 95.3% of all Eagle Pass residents.
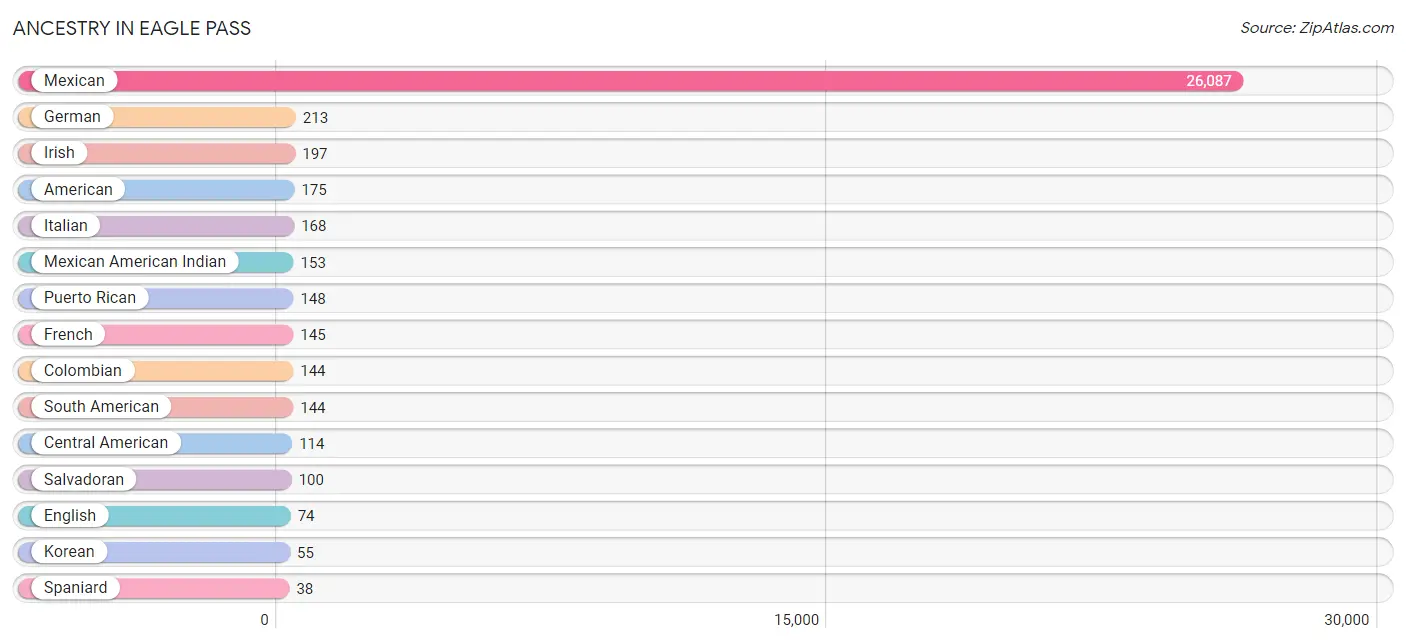
| Ancestry | # Population | % Population |
| African | 2 | 0.0% |
| American | 175 | 0.6% |
| Central American | 114 | 0.4% |
| Cherokee | 1 | 0.0% |
| Colombian | 144 | 0.5% |
| English | 74 | 0.3% |
| European | 28 | 0.1% |
| French | 145 | 0.5% |
| German | 213 | 0.8% |
| Guatemalan | 8 | 0.0% |
| Honduran | 6 | 0.0% |
| Irish | 197 | 0.7% |
| Italian | 168 | 0.6% |
| Korean | 55 | 0.2% |
| Mexican | 26,087 | 92.6% |
| Mexican American Indian | 153 | 0.5% |
| Polish | 16 | 0.1% |
| Puerto Rican | 148 | 0.5% |
| Salvadoran | 100 | 0.4% |
| Scotch-Irish | 12 | 0.0% |
| Scottish | 23 | 0.1% |
| South American | 144 | 0.5% |
| Spaniard | 38 | 0.1% |
| Spanish | 21 | 0.1% |
| Subsaharan African | 2 | 0.0% | View All 25 Rows |
Immigrants in Eagle Pass
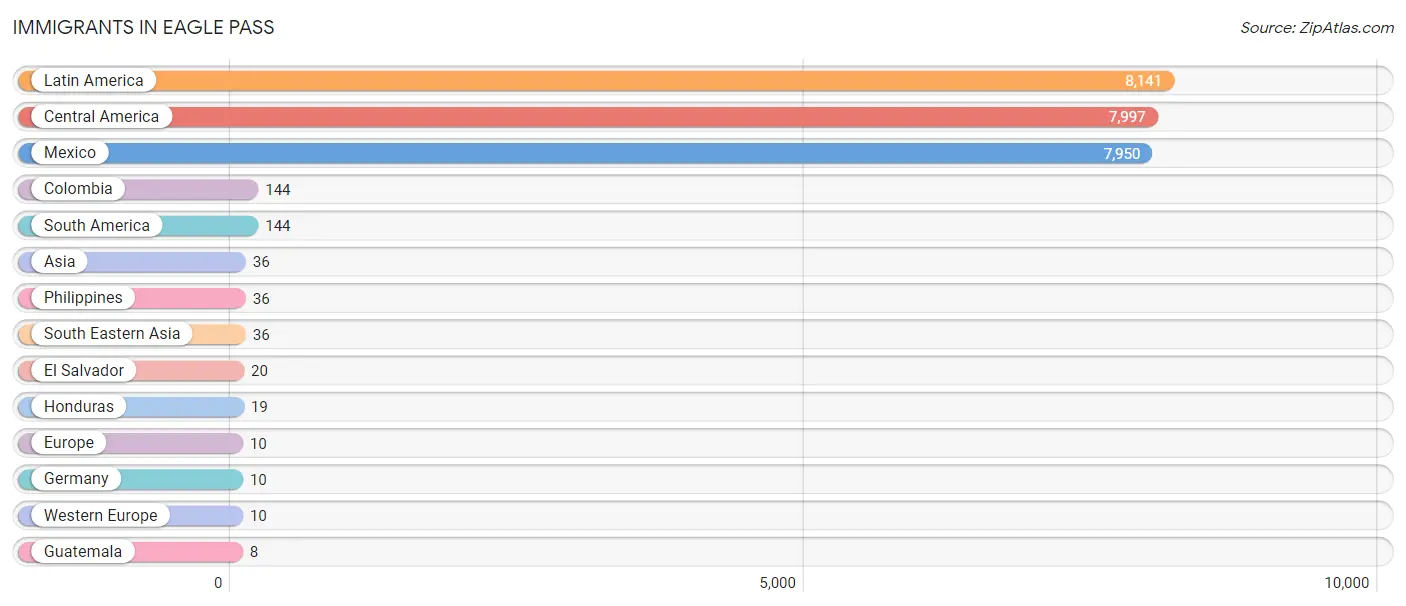
The most numerous immigrant groups reported in Eagle Pass came from Latin America (8,141 | 28.9%), Central America (7,997 | 28.4%), Mexico (7,950 | 28.2%), Colombia (144 | 0.5%), and South America (144 | 0.5%), together accounting for 86.5% of all Eagle Pass residents.
| Immigration Origin | # Population | % Population |
| Asia | 36 | 0.1% |
| Central America | 7,997 | 28.4% |
| Colombia | 144 | 0.5% |
| El Salvador | 20 | 0.1% |
| Europe | 10 | 0.0% |
| Germany | 10 | 0.0% |
| Guatemala | 8 | 0.0% |
| Honduras | 19 | 0.1% |
| Latin America | 8,141 | 28.9% |
| Mexico | 7,950 | 28.2% |
| Philippines | 36 | 0.1% |
| South America | 144 | 0.5% |
| South Eastern Asia | 36 | 0.1% |
| Western Europe | 10 | 0.0% | View All 14 Rows |
Sex and Age in Eagle Pass
Sex and Age in Eagle Pass
The most populous age groups in Eagle Pass are 15 to 19 Years (1,321 | 9.7%) for men and Under 5 Years (1,489 | 10.2%) for women.
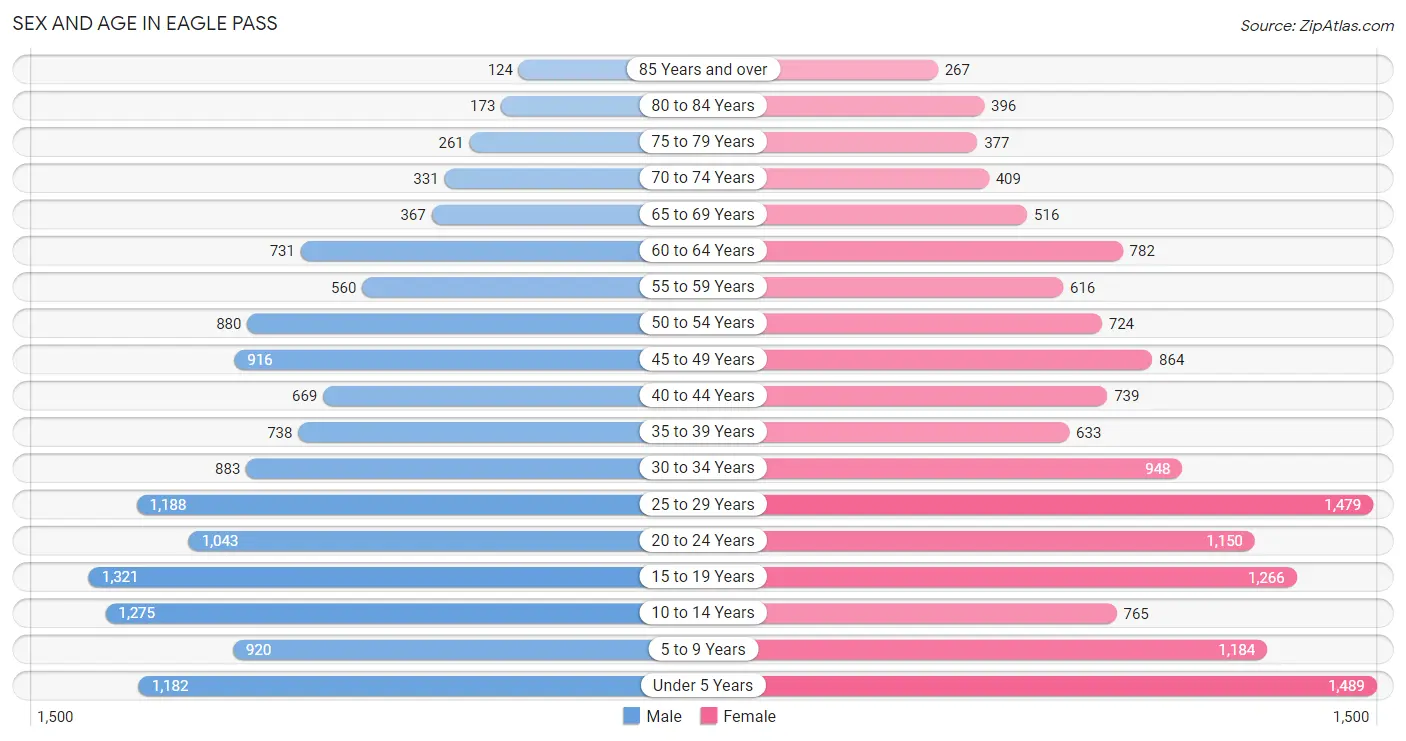
| Age Bracket | Male | Female |
| Under 5 Years | 1,182 (8.7%) | 1,489 (10.2%) |
| 5 to 9 Years | 920 (6.8%) | 1,184 (8.1%) |
| 10 to 14 Years | 1,275 (9.4%) | 765 (5.2%) |
| 15 to 19 Years | 1,321 (9.7%) | 1,266 (8.7%) |
| 20 to 24 Years | 1,043 (7.7%) | 1,150 (7.9%) |
| 25 to 29 Years | 1,188 (8.8%) | 1,479 (10.1%) |
| 30 to 34 Years | 883 (6.5%) | 948 (6.5%) |
| 35 to 39 Years | 738 (5.4%) | 633 (4.3%) |
| 40 to 44 Years | 669 (4.9%) | 739 (5.1%) |
| 45 to 49 Years | 916 (6.8%) | 864 (5.9%) |
| 50 to 54 Years | 880 (6.5%) | 724 (5.0%) |
| 55 to 59 Years | 560 (4.1%) | 616 (4.2%) |
| 60 to 64 Years | 731 (5.4%) | 782 (5.3%) |
| 65 to 69 Years | 367 (2.7%) | 516 (3.5%) |
| 70 to 74 Years | 331 (2.4%) | 409 (2.8%) |
| 75 to 79 Years | 261 (1.9%) | 377 (2.6%) |
| 80 to 84 Years | 173 (1.3%) | 396 (2.7%) |
| 85 Years and over | 124 (0.9%) | 267 (1.8%) |
| Total | 13,562 (100.0%) | 14,604 (100.0%) |
Families and Households in Eagle Pass
Median Family Size in Eagle Pass
The median family size in Eagle Pass is 3.54 persons per family, with married-couple families (4,856 | 66.9%) accounting for the largest median family size of 3.57 persons per family. On the other hand, single male/father families (490 | 6.8%) represent the smallest median family size with 3.14 persons per family.
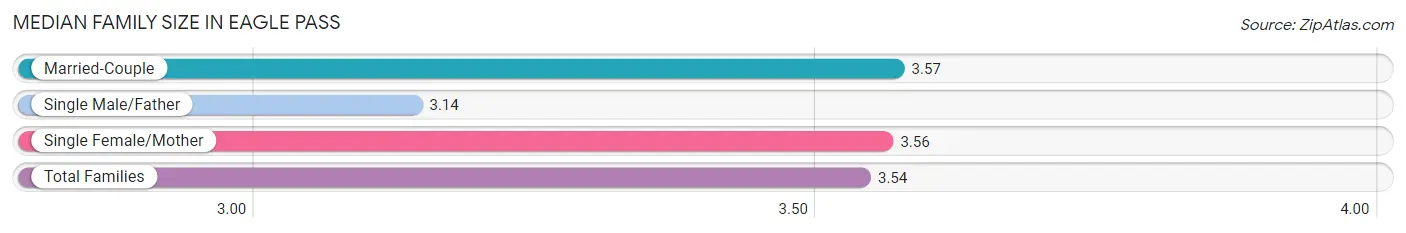
| Family Type | # Families | Family Size |
| Married-Couple | 4,856 (66.9%) | 3.57 |
| Single Male/Father | 490 (6.8%) | 3.14 |
| Single Female/Mother | 1,915 (26.4%) | 3.56 |
| Total Families | 7,261 (100.0%) | 3.54 |
Median Household Size in Eagle Pass
The median household size in Eagle Pass is 3.05 persons per household, with single female/mother households (1,915 | 20.9%) accounting for the largest median household size of 3.59 persons per household. non-family households (1,889 | 20.6%) represent the smallest median household size with 1.07 persons per household.
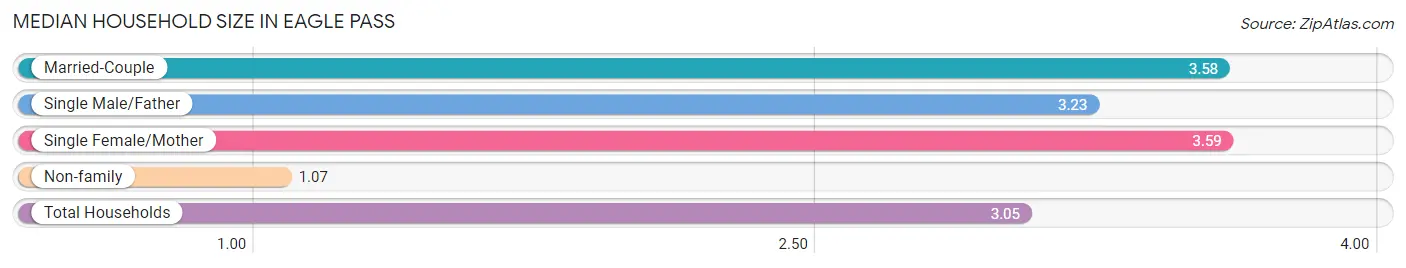
| Household Type | # Households | Household Size |
| Married-Couple | 4,856 (53.1%) | 3.58 |
| Single Male/Father | 490 (5.4%) | 3.23 |
| Single Female/Mother | 1,915 (20.9%) | 3.59 |
| Non-family | 1,889 (20.6%) | 1.07 |
| Total Households | 9,150 (100.0%) | 3.05 |
Household Size by Marriage Status in Eagle Pass
Out of a total of 9,150 households in Eagle Pass, 7,261 (79.4%) are family households, while 1,889 (20.6%) are nonfamily households. The most numerous type of family households are 2-person households, comprising 2,108, and the most common type of nonfamily households are 1-person households, comprising 1,684.
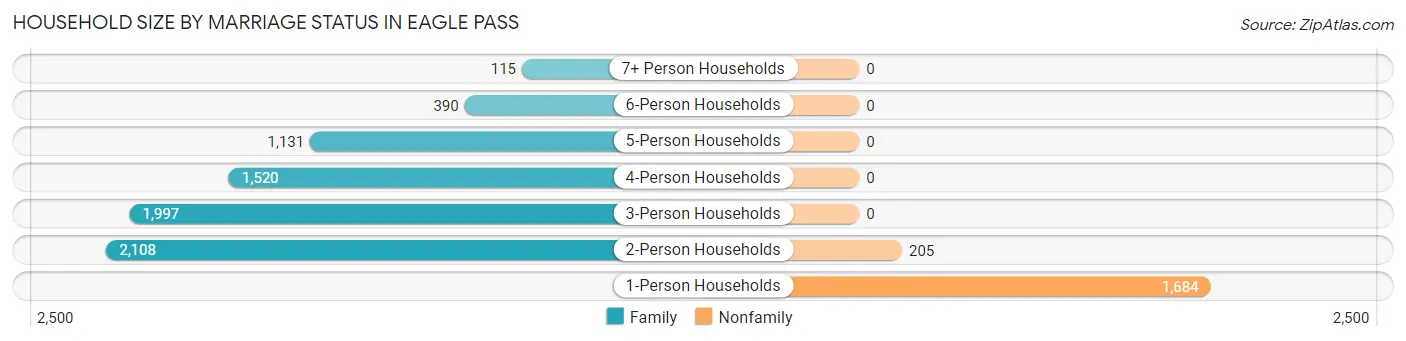
| Household Size | Family Households | Nonfamily Households |
| 1-Person Households | - | 1,684 (18.4%) |
| 2-Person Households | 2,108 (23.0%) | 205 (2.2%) |
| 3-Person Households | 1,997 (21.8%) | 0 (0.0%) |
| 4-Person Households | 1,520 (16.6%) | 0 (0.0%) |
| 5-Person Households | 1,131 (12.4%) | 0 (0.0%) |
| 6-Person Households | 390 (4.3%) | 0 (0.0%) |
| 7+ Person Households | 115 (1.3%) | 0 (0.0%) |
| Total | 7,261 (79.4%) | 1,889 (20.6%) |
Female Fertility in Eagle Pass
Fertility by Age in Eagle Pass
Average fertility rate in Eagle Pass is 68.0 births per 1,000 women. Women in the age bracket of 20 to 34 years have the highest fertility rate with 125.0 births per 1,000 women. Women in the age bracket of 20 to 34 years acount for 91.8% of all women with births.
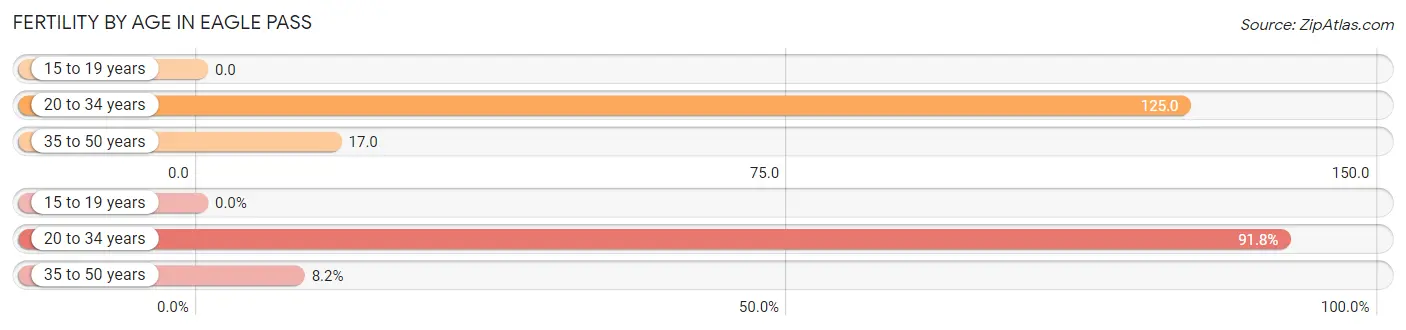
| Age Bracket | Women with Births | Births / 1,000 Women |
| 15 to 19 years | 0 (0.0%) | 0.0 |
| 20 to 34 years | 448 (91.8%) | 125.0 |
| 35 to 50 years | 40 (8.2%) | 17.0 |
| Total | 488 (100.0%) | 68.0 |
Fertility by Age by Marriage Status in Eagle Pass
80.9% of women with births (488) in Eagle Pass are married. The highest percentage of unmarried women with births falls into 35 to 50 years age bracket with 42.5% of them unmarried at the time of birth, while the lowest percentage of unmarried women with births belong to 20 to 34 years age bracket with 17.0% of them unmarried.
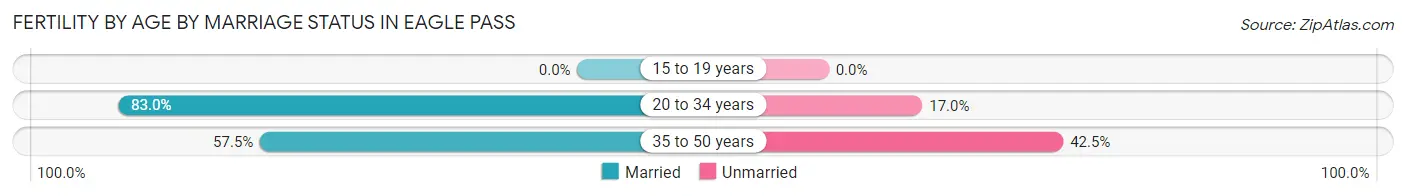
| Age Bracket | Married | Unmarried |
| 15 to 19 years | 0 (0.0%) | 0 (0.0%) |
| 20 to 34 years | 372 (83.0%) | 76 (17.0%) |
| 35 to 50 years | 23 (57.5%) | 17 (42.5%) |
| Total | 395 (80.9%) | 93 (19.1%) |
Fertility by Education in Eagle Pass
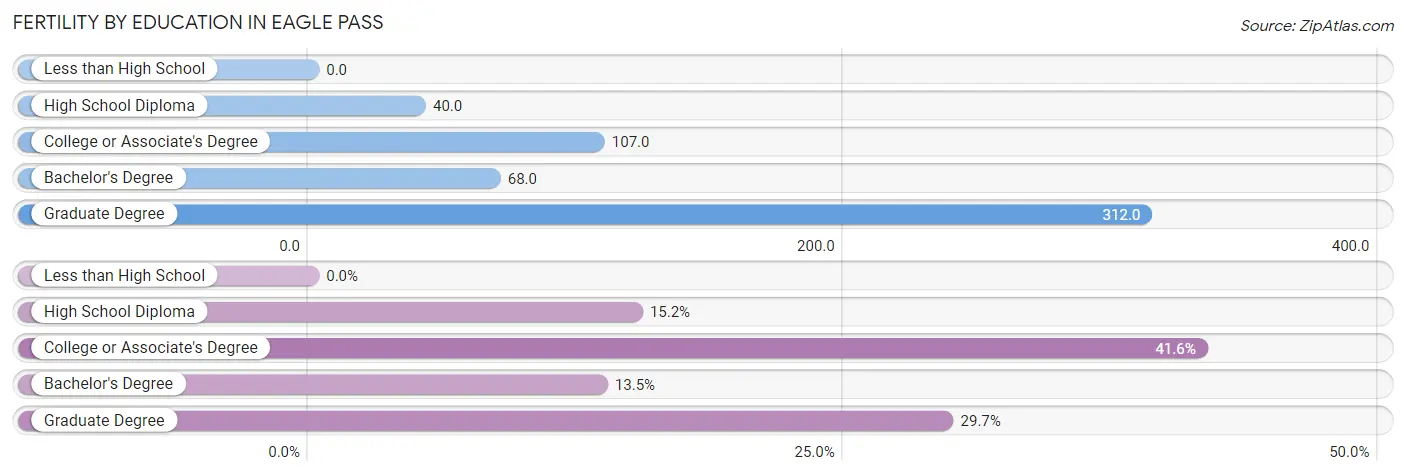
| Educational Attainment | Women with Births | Births / 1,000 Women |
| Less than High School | 0 (0.0%) | 0.0 |
| High School Diploma | 74 (15.2%) | 40.0 |
| College or Associate's Degree | 203 (41.6%) | 107.0 |
| Bachelor's Degree | 66 (13.5%) | 68.0 |
| Graduate Degree | 145 (29.7%) | 312.0 |
| Total | 488 (100.0%) | 68.0 |
Fertility by Education by Marriage Status in Eagle Pass
19.1% of women with births in Eagle Pass are unmarried. Women with the educational attainment of graduate degree are most likely to be married with 100.0% of them married at childbirth, while women with the educational attainment of bachelor's degree are least likely to be married with 62.1% of them unmarried at childbirth.
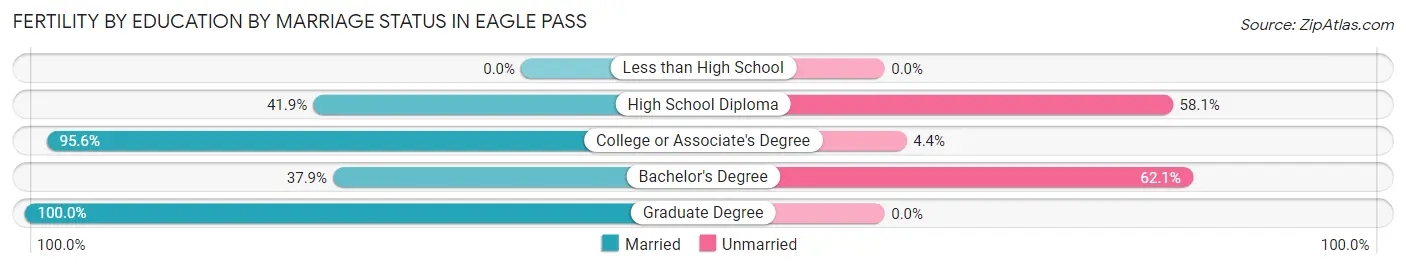
| Educational Attainment | Married | Unmarried |
| Less than High School | 0 (0.0%) | 0 (0.0%) |
| High School Diploma | 31 (41.9%) | 43 (58.1%) |
| College or Associate's Degree | 194 (95.6%) | 9 (4.4%) |
| Bachelor's Degree | 25 (37.9%) | 41 (62.1%) |
| Graduate Degree | 145 (100.0%) | 0 (0.0%) |
| Total | 395 (80.9%) | 93 (19.1%) |
Employment Characteristics in Eagle Pass
Employment by Class of Employer in Eagle Pass
Among the 11,770 employed individuals in Eagle Pass, private company employees (7,066 | 60.0%), local government employees (1,659 | 14.1%), and federal government employees (1,238 | 10.5%) make up the most common classes of employment.
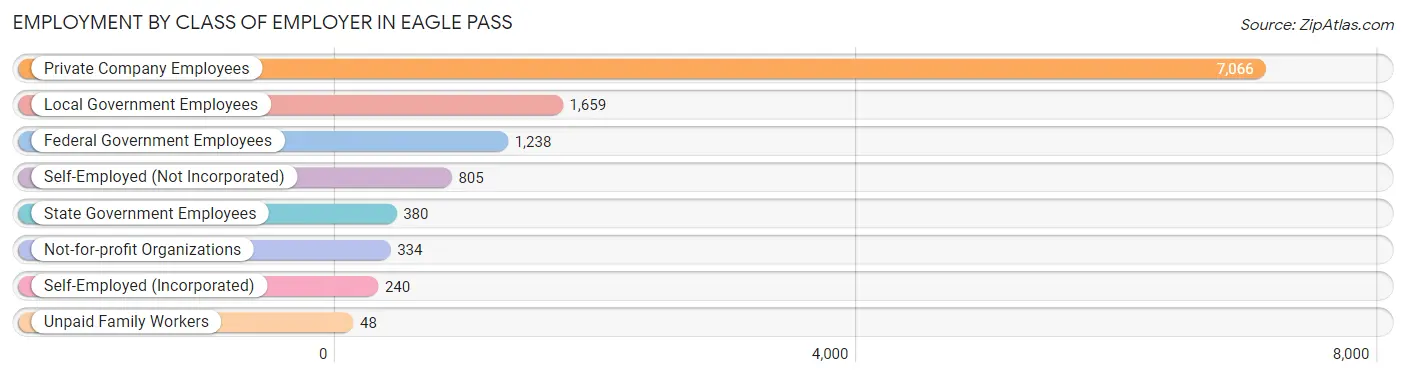
| Employer Class | # Employees | % Employees |
| Private Company Employees | 7,066 | 60.0% |
| Self-Employed (Incorporated) | 240 | 2.0% |
| Self-Employed (Not Incorporated) | 805 | 6.8% |
| Not-for-profit Organizations | 334 | 2.8% |
| Local Government Employees | 1,659 | 14.1% |
| State Government Employees | 380 | 3.2% |
| Federal Government Employees | 1,238 | 10.5% |
| Unpaid Family Workers | 48 | 0.4% |
| Total | 11,770 | 100.0% |
Employment Status by Age in Eagle Pass
According to the labor force statistics for Eagle Pass, out of the total population over 16 years of age (20,964), 60.9% or 12,767 individuals are in the labor force, with 6.8% or 868 of them unemployed. The age group with the highest labor force participation rate is 35 to 44 years, with 84.4% or 2,345 individuals in the labor force. Within the labor force, the 20 to 24 years age range has the highest percentage of unemployed individuals, with 24.9% or 341 of them being unemployed.
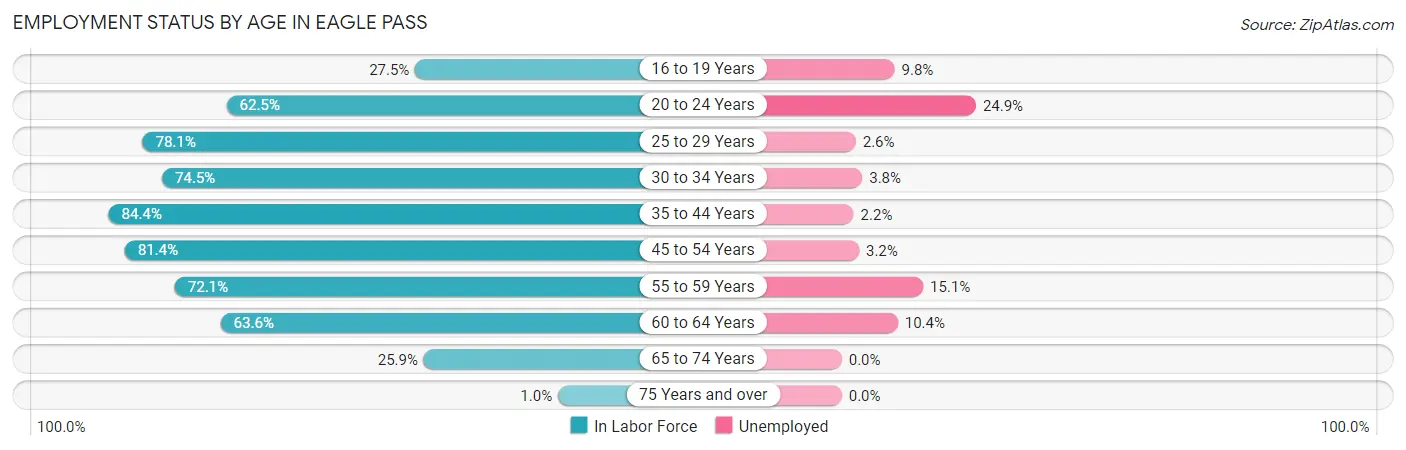
| Age Bracket | In Labor Force | Unemployed |
| 16 to 19 Years | 605 (27.5%) | 59 (9.8%) |
| 20 to 24 Years | 1,371 (62.5%) | 341 (24.9%) |
| 25 to 29 Years | 2,083 (78.1%) | 54 (2.6%) |
| 30 to 34 Years | 1,364 (74.5%) | 52 (3.8%) |
| 35 to 44 Years | 2,345 (84.4%) | 52 (2.2%) |
| 45 to 54 Years | 2,755 (81.4%) | 88 (3.2%) |
| 55 to 59 Years | 848 (72.1%) | 128 (15.1%) |
| 60 to 64 Years | 962 (63.6%) | 100 (10.4%) |
| 65 to 74 Years | 420 (25.9%) | 0 (0.0%) |
| 75 Years and over | 16 (1.0%) | 0 (0.0%) |
| Total | 12,767 (60.9%) | 868 (6.8%) |
Employment Status by Educational Attainment in Eagle Pass
According to labor force statistics for Eagle Pass, 77.6% of individuals (10,360) out of the total population between 25 and 64 years of age (13,350) are in the labor force, with 4.6% or 477 of them being unemployed. The group with the highest labor force participation rate are those with the educational attainment of bachelor's degree or higher, with 88.2% or 3,236 individuals in the labor force. Within the labor force, individuals with college / associate degree education have the highest percentage of unemployment, with 6.1% or 170 of them being unemployed.
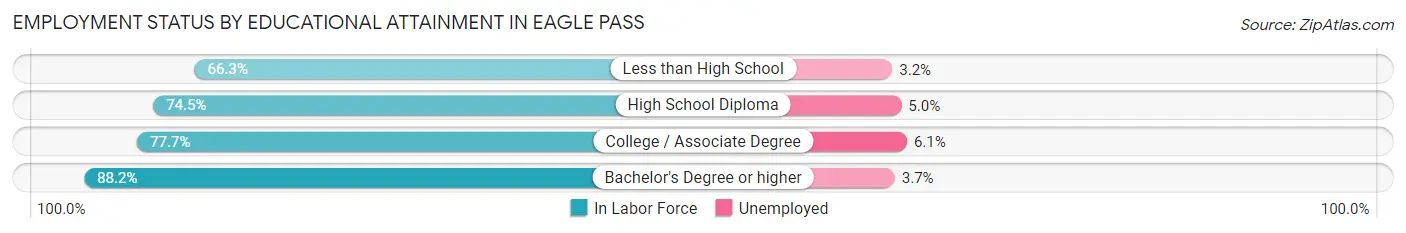
| Educational Attainment | In Labor Force | Unemployed |
| Less than High School | 1,671 (66.3%) | 81 (3.2%) |
| High School Diploma | 2,666 (74.5%) | 179 (5.0%) |
| College / Associate Degree | 2,783 (77.7%) | 219 (6.1%) |
| Bachelor's Degree or higher | 3,236 (88.2%) | 136 (3.7%) |
| Total | 10,360 (77.6%) | 614 (4.6%) |
Employment Occupations by Sex in Eagle Pass
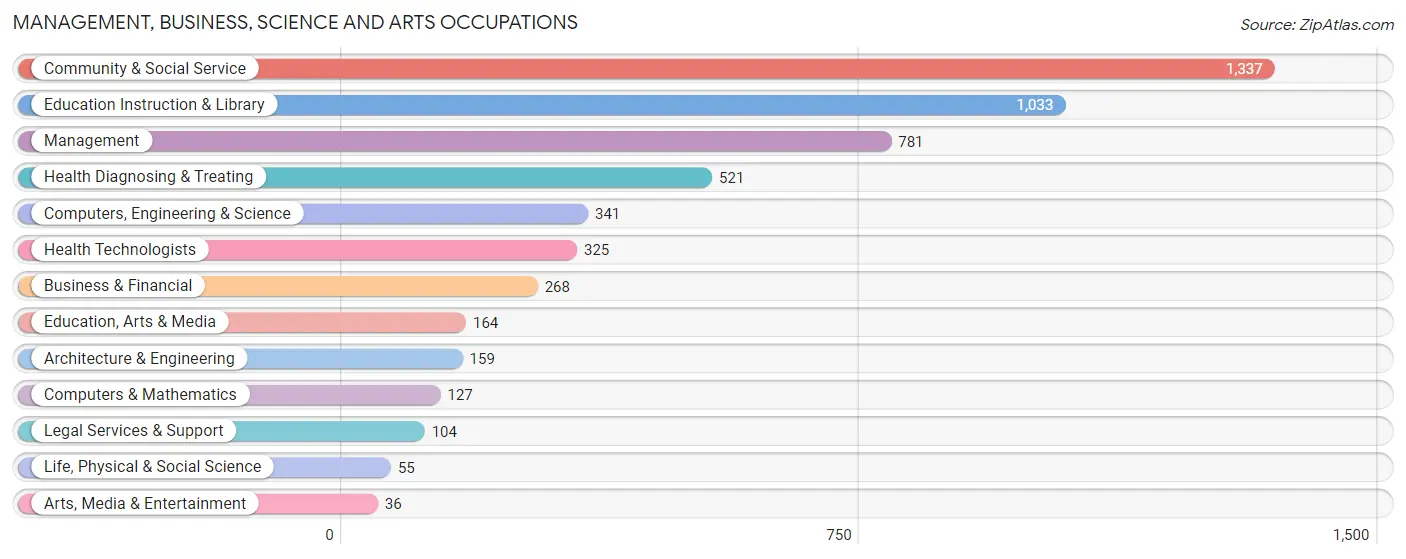
Management, Business, Science and Arts Occupations
The most common Management, Business, Science and Arts occupations in Eagle Pass are Community & Social Service (1,337 | 11.3%), Education Instruction & Library (1,033 | 8.7%), Management (781 | 6.6%), Health Diagnosing & Treating (521 | 4.4%), and Computers, Engineering & Science (341 | 2.9%).
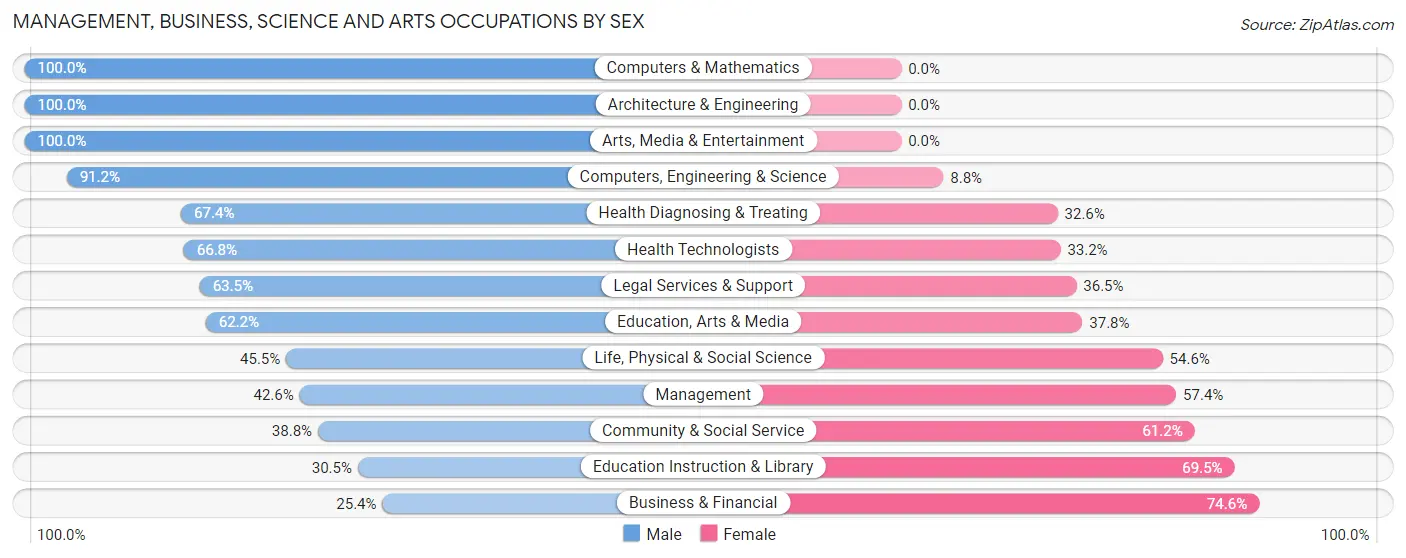
Management, Business, Science and Arts Occupations by Sex
Within the Management, Business, Science and Arts occupations in Eagle Pass, the most male-oriented occupations are Computers & Mathematics (100.0%), Architecture & Engineering (100.0%), and Arts, Media & Entertainment (100.0%), while the most female-oriented occupations are Business & Financial (74.6%), Education Instruction & Library (69.5%), and Community & Social Service (61.2%).
| Occupation | Male | Female |
| Management | 333 (42.6%) | 448 (57.4%) |
| Business & Financial | 68 (25.4%) | 200 (74.6%) |
| Computers, Engineering & Science | 311 (91.2%) | 30 (8.8%) |
| Computers & Mathematics | 127 (100.0%) | 0 (0.0%) |
| Architecture & Engineering | 159 (100.0%) | 0 (0.0%) |
| Life, Physical & Social Science | 25 (45.5%) | 30 (54.5%) |
| Community & Social Service | 519 (38.8%) | 818 (61.2%) |
| Education, Arts & Media | 102 (62.2%) | 62 (37.8%) |
| Legal Services & Support | 66 (63.5%) | 38 (36.5%) |
| Education Instruction & Library | 315 (30.5%) | 718 (69.5%) |
| Arts, Media & Entertainment | 36 (100.0%) | 0 (0.0%) |
| Health Diagnosing & Treating | 351 (67.4%) | 170 (32.6%) |
| Health Technologists | 217 (66.8%) | 108 (33.2%) |
| Total (Category) | 1,582 (48.7%) | 1,666 (51.3%) |
| Total (Overall) | 6,810 (57.3%) | 5,066 (42.7%) |
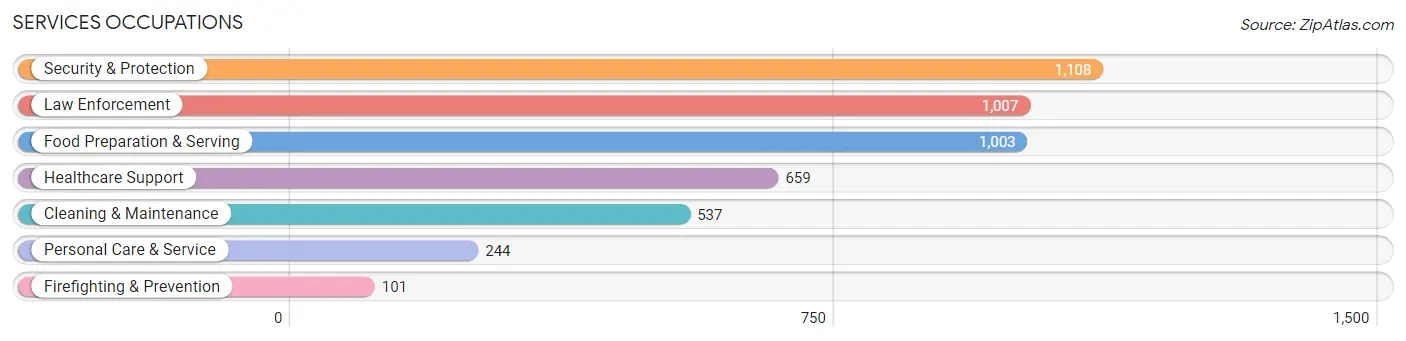
Services Occupations
The most common Services occupations in Eagle Pass are Security & Protection (1,108 | 9.3%), Law Enforcement (1,007 | 8.5%), Food Preparation & Serving (1,003 | 8.5%), Healthcare Support (659 | 5.6%), and Cleaning & Maintenance (537 | 4.5%).
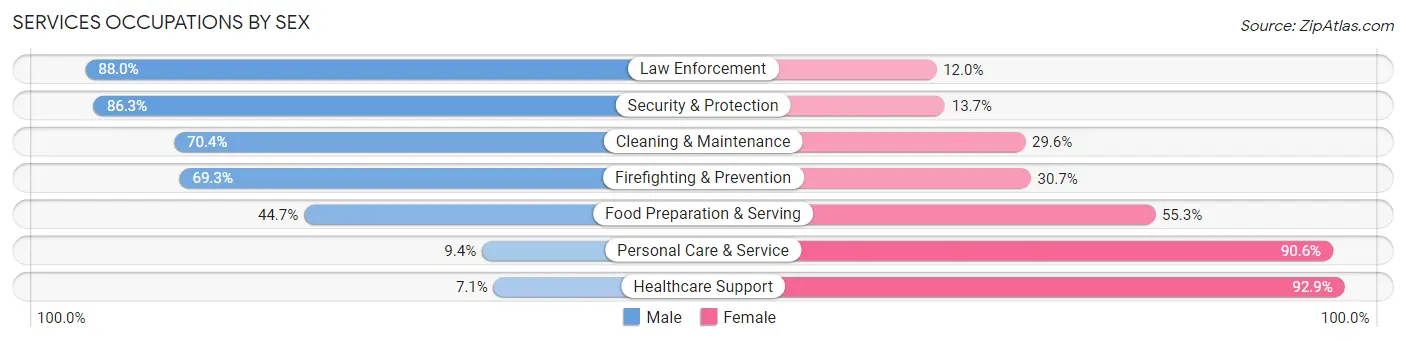
Services Occupations by Sex
Within the Services occupations in Eagle Pass, the most male-oriented occupations are Law Enforcement (88.0%), Security & Protection (86.3%), and Cleaning & Maintenance (70.4%), while the most female-oriented occupations are Healthcare Support (92.9%), Personal Care & Service (90.6%), and Food Preparation & Serving (55.3%).
| Occupation | Male | Female |
| Healthcare Support | 47 (7.1%) | 612 (92.9%) |
| Security & Protection | 956 (86.3%) | 152 (13.7%) |
| Firefighting & Prevention | 70 (69.3%) | 31 (30.7%) |
| Law Enforcement | 886 (88.0%) | 121 (12.0%) |
| Food Preparation & Serving | 448 (44.7%) | 555 (55.3%) |
| Cleaning & Maintenance | 378 (70.4%) | 159 (29.6%) |
| Personal Care & Service | 23 (9.4%) | 221 (90.6%) |
| Total (Category) | 1,852 (52.1%) | 1,699 (47.8%) |
| Total (Overall) | 6,810 (57.3%) | 5,066 (42.7%) |
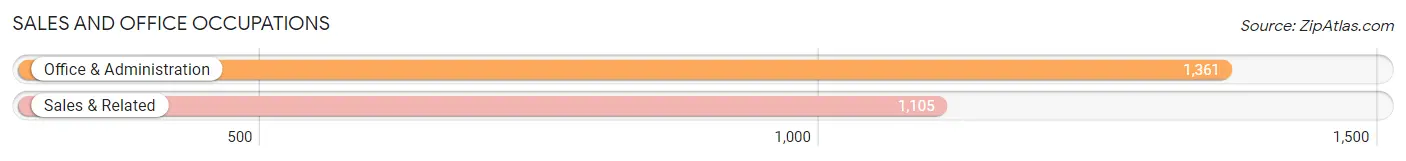
Sales and Office Occupations
The most common Sales and Office occupations in Eagle Pass are Office & Administration (1,361 | 11.5%), and Sales & Related (1,105 | 9.3%).
Sales and Office Occupations by Sex
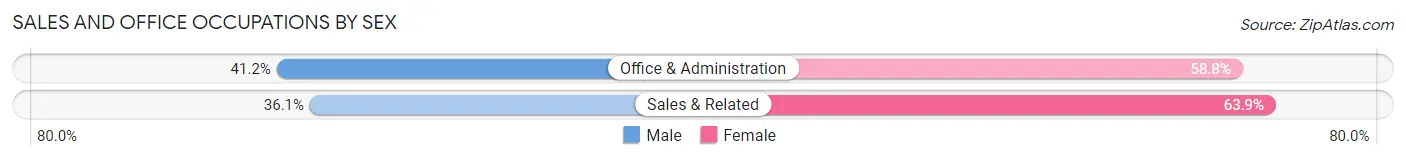
| Occupation | Male | Female |
| Sales & Related | 399 (36.1%) | 706 (63.9%) |
| Office & Administration | 561 (41.2%) | 800 (58.8%) |
| Total (Category) | 960 (38.9%) | 1,506 (61.1%) |
| Total (Overall) | 6,810 (57.3%) | 5,066 (42.7%) |
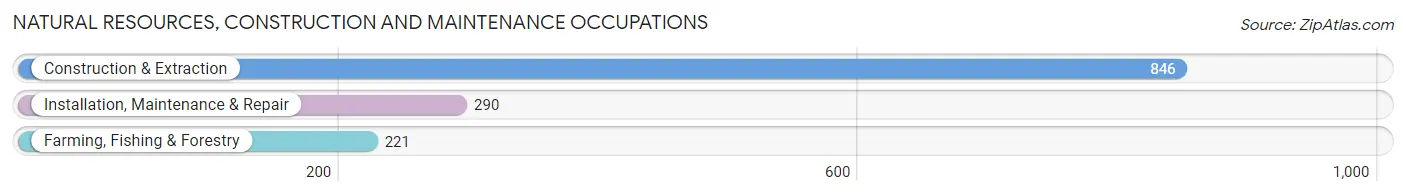
Natural Resources, Construction and Maintenance Occupations
The most common Natural Resources, Construction and Maintenance occupations in Eagle Pass are Construction & Extraction (846 | 7.1%), Installation, Maintenance & Repair (290 | 2.4%), and Farming, Fishing & Forestry (221 | 1.9%).
Natural Resources, Construction and Maintenance Occupations by Sex
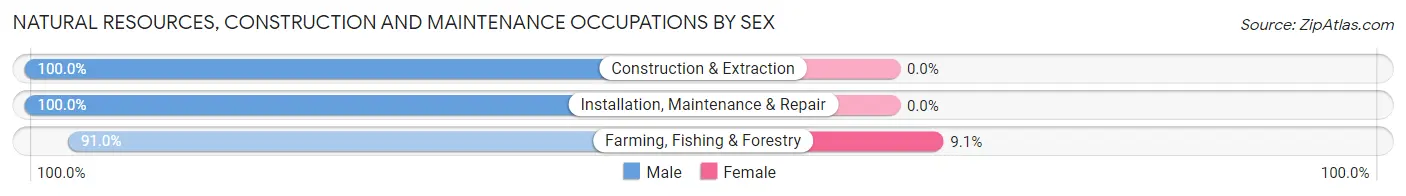
| Occupation | Male | Female |
| Farming, Fishing & Forestry | 201 (90.9%) | 20 (9.0%) |
| Construction & Extraction | 846 (100.0%) | 0 (0.0%) |
| Installation, Maintenance & Repair | 290 (100.0%) | 0 (0.0%) |
| Total (Category) | 1,337 (98.5%) | 20 (1.5%) |
| Total (Overall) | 6,810 (57.3%) | 5,066 (42.7%) |
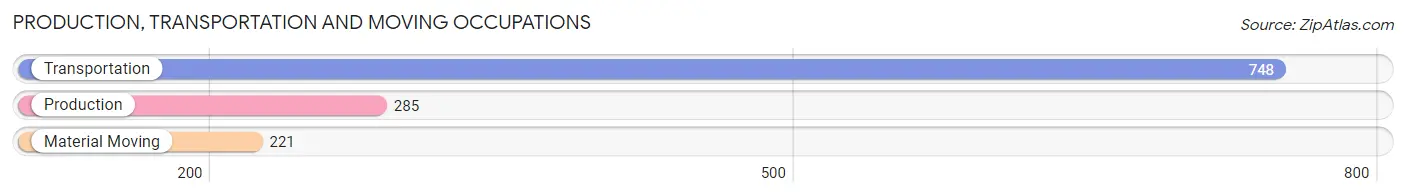
Production, Transportation and Moving Occupations
The most common Production, Transportation and Moving occupations in Eagle Pass are Transportation (748 | 6.3%), Production (285 | 2.4%), and Material Moving (221 | 1.9%).
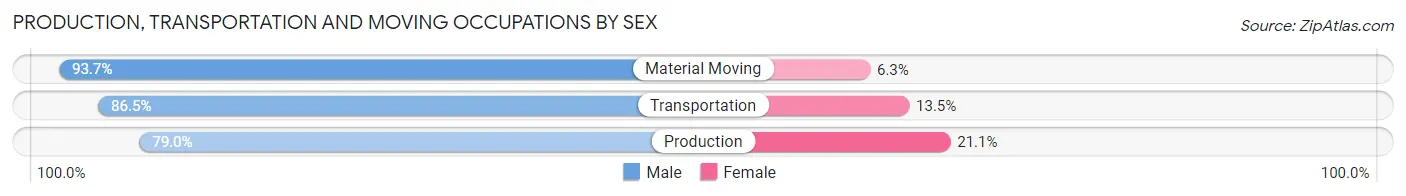
Production, Transportation and Moving Occupations by Sex
| Occupation | Male | Female |
| Production | 225 (78.9%) | 60 (21.0%) |
| Transportation | 647 (86.5%) | 101 (13.5%) |
| Material Moving | 207 (93.7%) | 14 (6.3%) |
| Total (Category) | 1,079 (86.0%) | 175 (14.0%) |
| Total (Overall) | 6,810 (57.3%) | 5,066 (42.7%) |
Employment Industries by Sex in Eagle Pass
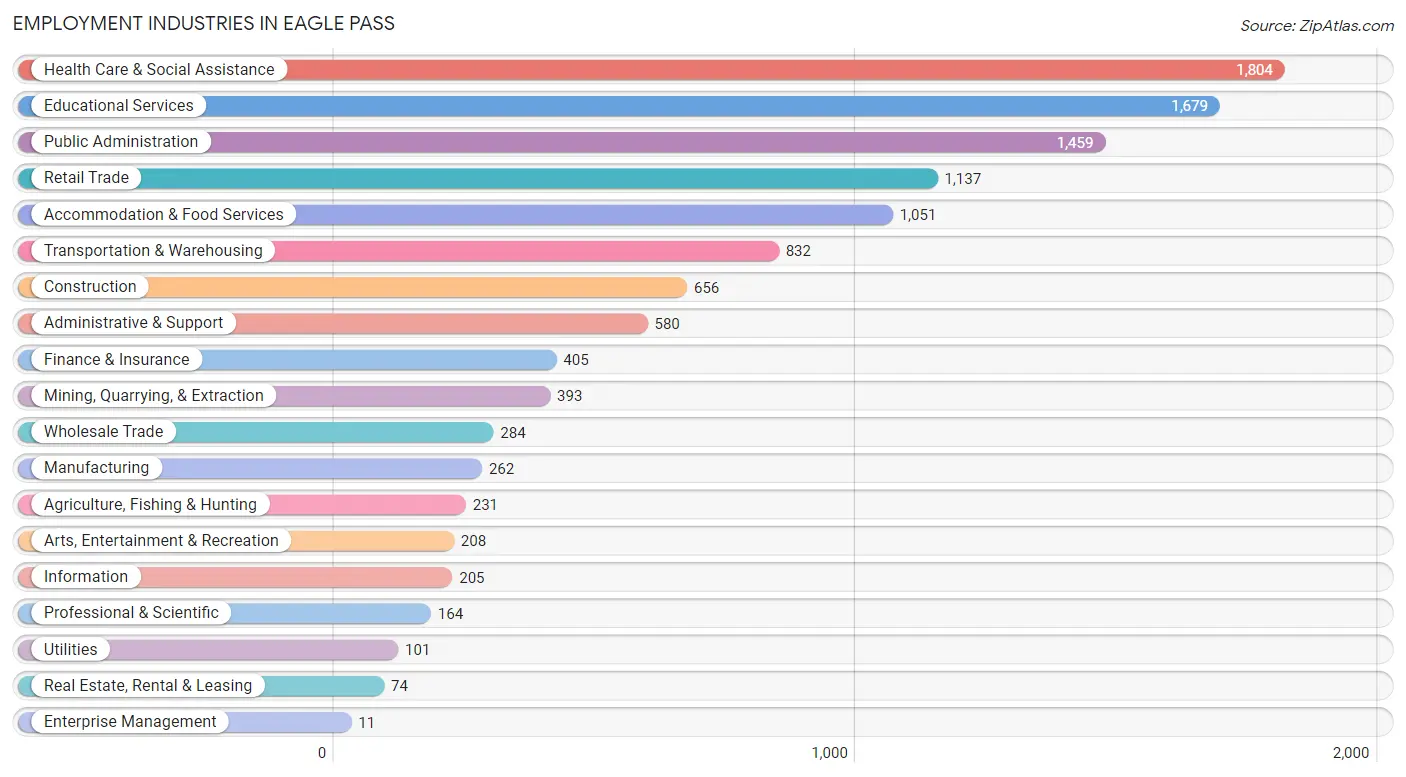
Employment Industries in Eagle Pass
The major employment industries in Eagle Pass include Health Care & Social Assistance (1,804 | 15.2%), Educational Services (1,679 | 14.1%), Public Administration (1,459 | 12.3%), Retail Trade (1,137 | 9.6%), and Accommodation & Food Services (1,051 | 8.8%).
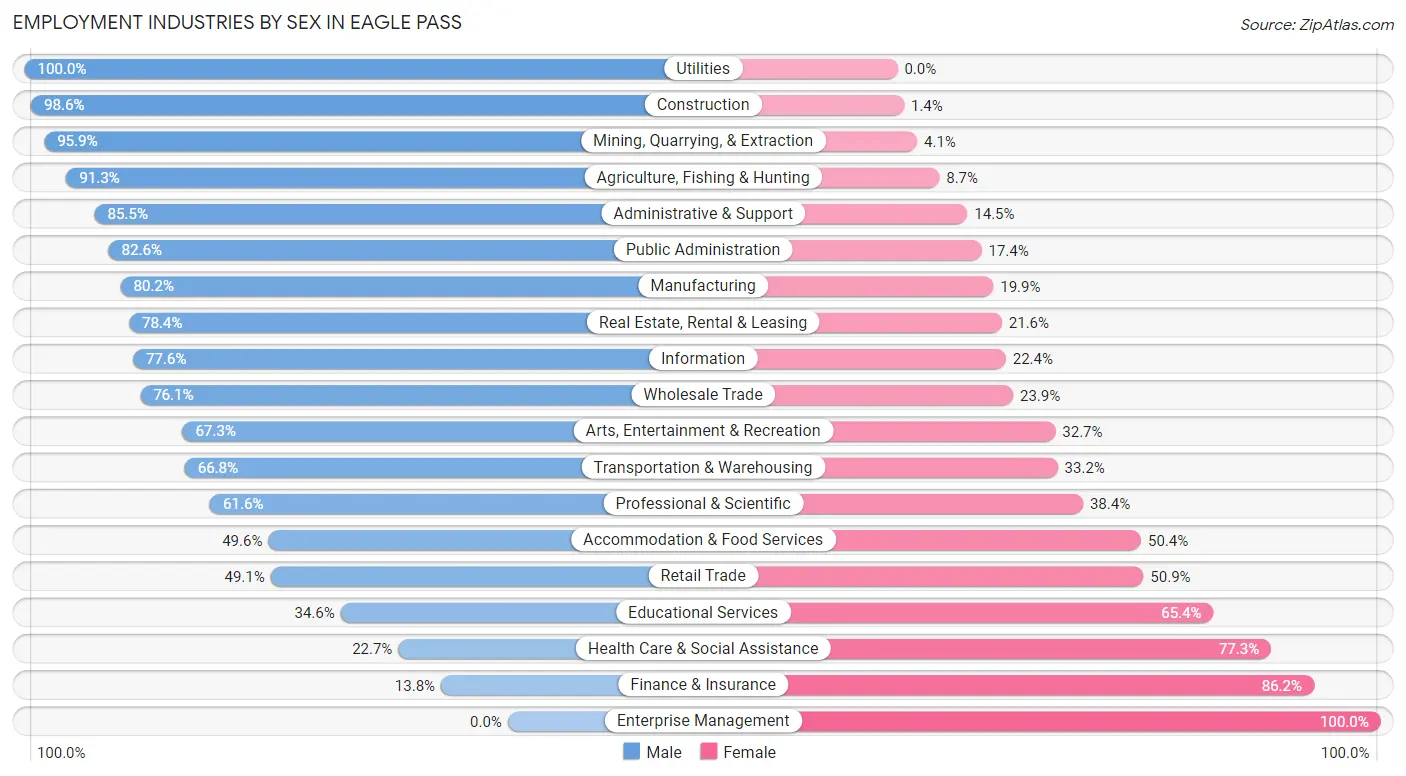
Employment Industries by Sex in Eagle Pass
The Eagle Pass industries that see more men than women are Utilities (100.0%), Construction (98.6%), and Mining, Quarrying, & Extraction (95.9%), whereas the industries that tend to have a higher number of women are Enterprise Management (100.0%), Finance & Insurance (86.2%), and Health Care & Social Assistance (77.3%).
| Industry | Male | Female |
| Agriculture, Fishing & Hunting | 211 (91.3%) | 20 (8.7%) |
| Mining, Quarrying, & Extraction | 377 (95.9%) | 16 (4.1%) |
| Construction | 647 (98.6%) | 9 (1.4%) |
| Manufacturing | 210 (80.1%) | 52 (19.9%) |
| Wholesale Trade | 216 (76.1%) | 68 (23.9%) |
| Retail Trade | 558 (49.1%) | 579 (50.9%) |
| Transportation & Warehousing | 556 (66.8%) | 276 (33.2%) |
| Utilities | 101 (100.0%) | 0 (0.0%) |
| Information | 159 (77.6%) | 46 (22.4%) |
| Finance & Insurance | 56 (13.8%) | 349 (86.2%) |
| Real Estate, Rental & Leasing | 58 (78.4%) | 16 (21.6%) |
| Professional & Scientific | 101 (61.6%) | 63 (38.4%) |
| Enterprise Management | 0 (0.0%) | 11 (100.0%) |
| Administrative & Support | 496 (85.5%) | 84 (14.5%) |
| Educational Services | 581 (34.6%) | 1,098 (65.4%) |
| Health Care & Social Assistance | 409 (22.7%) | 1,395 (77.3%) |
| Arts, Entertainment & Recreation | 140 (67.3%) | 68 (32.7%) |
| Accommodation & Food Services | 521 (49.6%) | 530 (50.4%) |
| Public Administration | 1,205 (82.6%) | 254 (17.4%) |
| Total | 6,810 (57.3%) | 5,066 (42.7%) |
Education in Eagle Pass
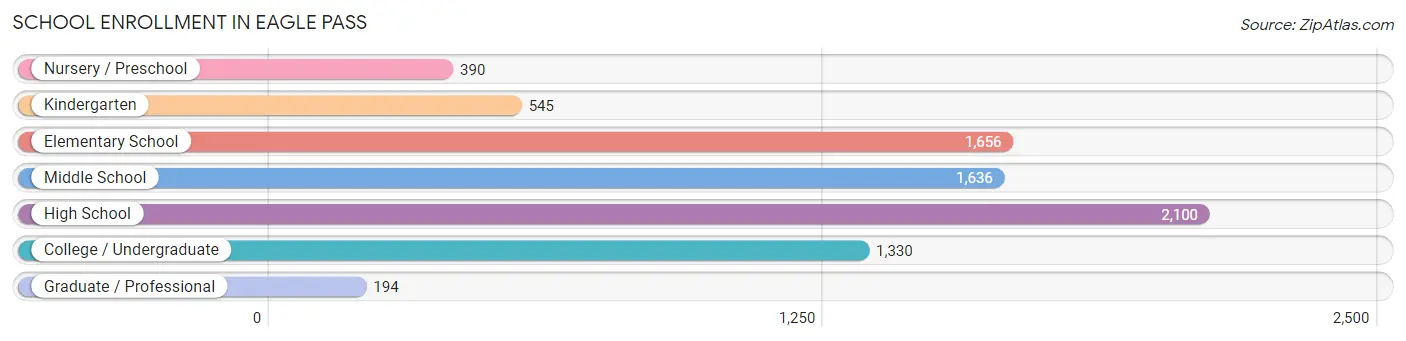
School Enrollment in Eagle Pass
The most common levels of schooling among the 7,851 students in Eagle Pass are high school (2,100 | 26.8%), elementary school (1,656 | 21.1%), and middle school (1,636 | 20.8%).
| School Level | # Students | % Students |
| Nursery / Preschool | 390 | 5.0% |
| Kindergarten | 545 | 6.9% |
| Elementary School | 1,656 | 21.1% |
| Middle School | 1,636 | 20.8% |
| High School | 2,100 | 26.8% |
| College / Undergraduate | 1,330 | 16.9% |
| Graduate / Professional | 194 | 2.5% |
| Total | 7,851 | 100.0% |
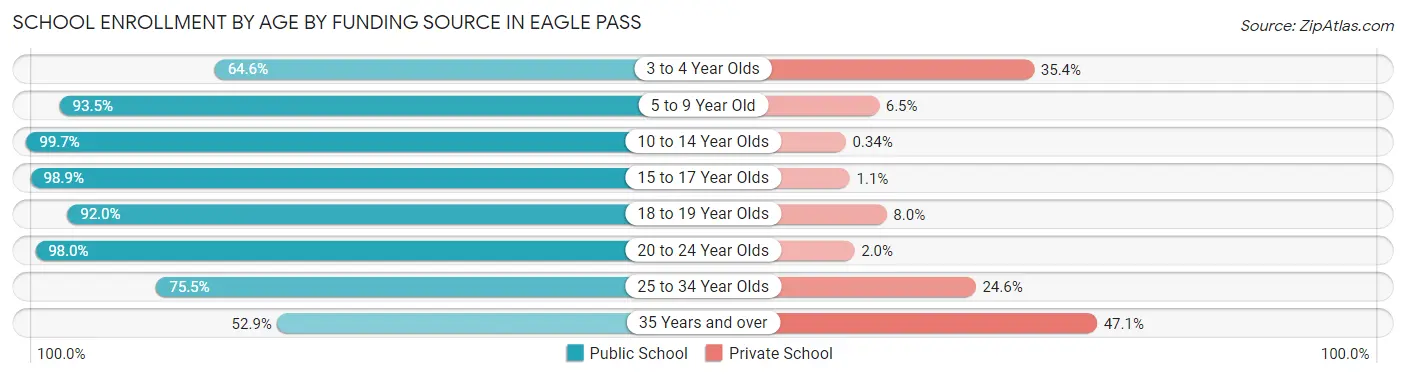
School Enrollment by Age by Funding Source in Eagle Pass
Out of a total of 7,851 students who are enrolled in schools in Eagle Pass, 581 (7.4%) attend a private institution, while the remaining 7,270 (92.6%) are enrolled in public schools. The age group of 35 years and over has the highest likelihood of being enrolled in private schools, with 173 (47.1% in the age bracket) enrolled. Conversely, the age group of 10 to 14 year olds has the lowest likelihood of being enrolled in a private school, with 2,033 (99.7% in the age bracket) attending a public institution.
| Age Bracket | Public School | Private School |
| 3 to 4 Year Olds | 217 (64.6%) | 119 (35.4%) |
| 5 to 9 Year Old | 1,871 (93.5%) | 131 (6.5%) |
| 10 to 14 Year Olds | 2,033 (99.7%) | 7 (0.3%) |
| 15 to 17 Year Olds | 1,445 (98.9%) | 16 (1.1%) |
| 18 to 19 Year Olds | 844 (92.0%) | 73 (8.0%) |
| 20 to 24 Year Olds | 494 (98.0%) | 10 (2.0%) |
| 25 to 34 Year Olds | 169 (75.4%) | 55 (24.5%) |
| 35 Years and over | 194 (52.9%) | 173 (47.1%) |
| Total | 7,270 (92.6%) | 581 (7.4%) |
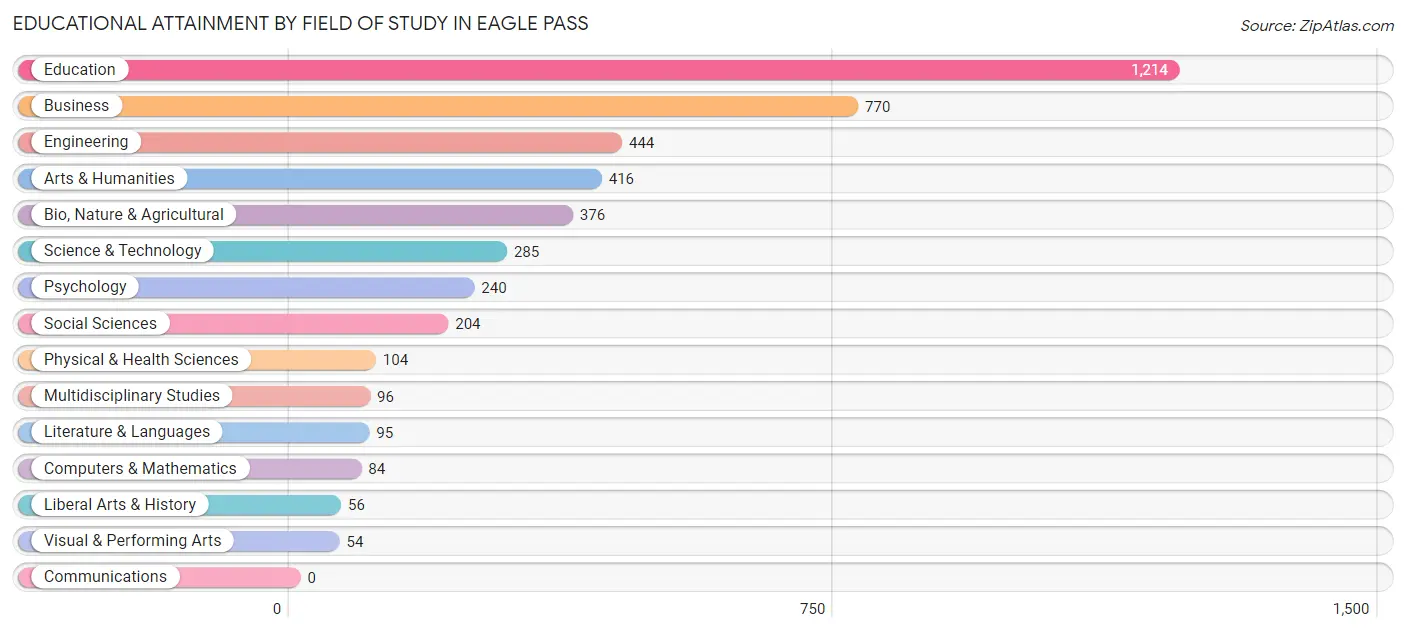
Educational Attainment by Field of Study in Eagle Pass
Education (1,214 | 27.4%), business (770 | 17.3%), engineering (444 | 10.0%), arts & humanities (416 | 9.4%), and bio, nature & agricultural (376 | 8.5%) are the most common fields of study among 4,438 individuals in Eagle Pass who have obtained a bachelor's degree or higher.
| Field of Study | # Graduates | % Graduates |
| Computers & Mathematics | 84 | 1.9% |
| Bio, Nature & Agricultural | 376 | 8.5% |
| Physical & Health Sciences | 104 | 2.3% |
| Psychology | 240 | 5.4% |
| Social Sciences | 204 | 4.6% |
| Engineering | 444 | 10.0% |
| Multidisciplinary Studies | 96 | 2.2% |
| Science & Technology | 285 | 6.4% |
| Business | 770 | 17.3% |
| Education | 1,214 | 27.4% |
| Literature & Languages | 95 | 2.1% |
| Liberal Arts & History | 56 | 1.3% |
| Visual & Performing Arts | 54 | 1.2% |
| Communications | 0 | 0.0% |
| Arts & Humanities | 416 | 9.4% |
| Total | 4,438 | 100.0% |
Transportation & Commute in Eagle Pass
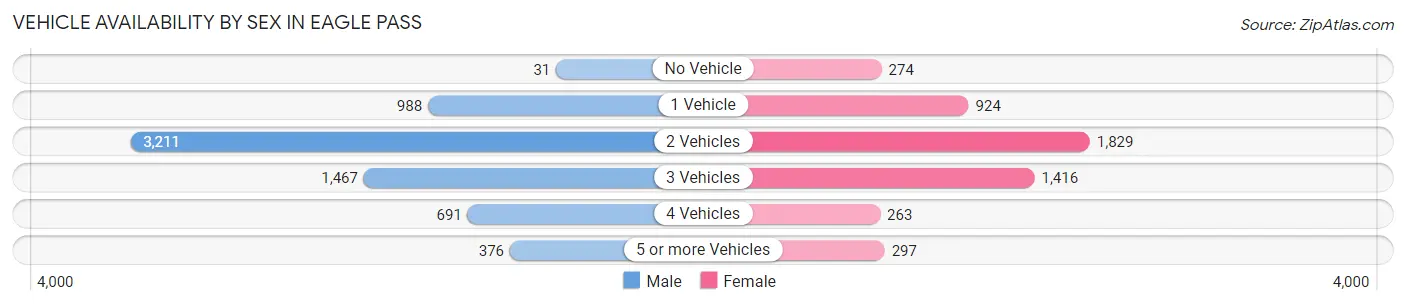
Vehicle Availability by Sex in Eagle Pass
The most prevalent vehicle ownership categories in Eagle Pass are males with 2 vehicles (3,211, accounting for 47.5%) and females with 2 vehicles (1,829, making up 64.2%).
| Vehicles Available | Male | Female |
| No Vehicle | 31 (0.5%) | 274 (5.5%) |
| 1 Vehicle | 988 (14.6%) | 924 (18.5%) |
| 2 Vehicles | 3,211 (47.5%) | 1,829 (36.6%) |
| 3 Vehicles | 1,467 (21.7%) | 1,416 (28.3%) |
| 4 Vehicles | 691 (10.2%) | 263 (5.3%) |
| 5 or more Vehicles | 376 (5.6%) | 297 (5.9%) |
| Total | 6,764 (100.0%) | 5,003 (100.0%) |
Commute Time in Eagle Pass
The most frequently occuring commute durations in Eagle Pass are 15 to 19 minutes (2,833 commuters, 25.5%), 10 to 14 minutes (2,344 commuters, 21.1%), and 5 to 9 minutes (1,994 commuters, 17.9%).
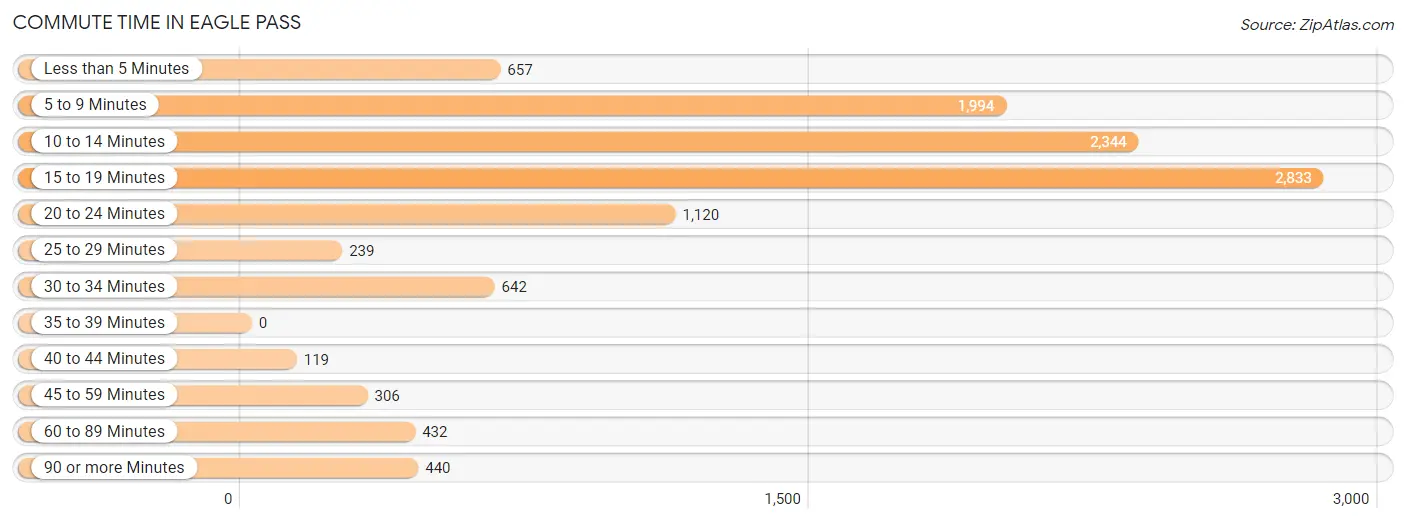
| Commute Time | # Commuters | % Commuters |
| Less than 5 Minutes | 657 | 5.9% |
| 5 to 9 Minutes | 1,994 | 17.9% |
| 10 to 14 Minutes | 2,344 | 21.1% |
| 15 to 19 Minutes | 2,833 | 25.5% |
| 20 to 24 Minutes | 1,120 | 10.1% |
| 25 to 29 Minutes | 239 | 2.1% |
| 30 to 34 Minutes | 642 | 5.8% |
| 35 to 39 Minutes | 0 | 0.0% |
| 40 to 44 Minutes | 119 | 1.1% |
| 45 to 59 Minutes | 306 | 2.8% |
| 60 to 89 Minutes | 432 | 3.9% |
| 90 or more Minutes | 440 | 4.0% |
Commute Time by Sex in Eagle Pass
The most common commute times in Eagle Pass are 15 to 19 minutes (1,716 commuters, 26.4%) for males and 15 to 19 minutes (1,117 commuters, 24.1%) for females.
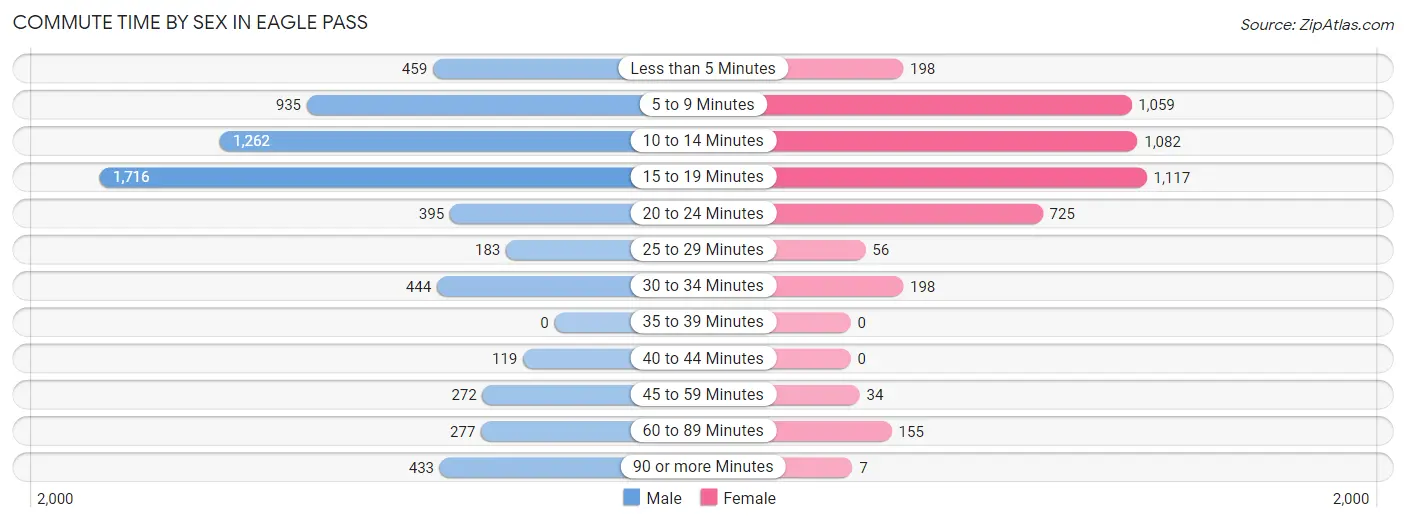
| Commute Time | Male | Female |
| Less than 5 Minutes | 459 (7.1%) | 198 (4.3%) |
| 5 to 9 Minutes | 935 (14.4%) | 1,059 (22.9%) |
| 10 to 14 Minutes | 1,262 (19.4%) | 1,082 (23.4%) |
| 15 to 19 Minutes | 1,716 (26.4%) | 1,117 (24.1%) |
| 20 to 24 Minutes | 395 (6.1%) | 725 (15.7%) |
| 25 to 29 Minutes | 183 (2.8%) | 56 (1.2%) |
| 30 to 34 Minutes | 444 (6.8%) | 198 (4.3%) |
| 35 to 39 Minutes | 0 (0.0%) | 0 (0.0%) |
| 40 to 44 Minutes | 119 (1.8%) | 0 (0.0%) |
| 45 to 59 Minutes | 272 (4.2%) | 34 (0.7%) |
| 60 to 89 Minutes | 277 (4.3%) | 155 (3.4%) |
| 90 or more Minutes | 433 (6.7%) | 7 (0.2%) |
Time of Departure to Work by Sex in Eagle Pass
The most frequent times of departure to work in Eagle Pass are 8:00 AM to 8:29 AM (1,171, 18.0%) for males and 7:30 AM to 7:59 AM (1,158, 25.0%) for females.
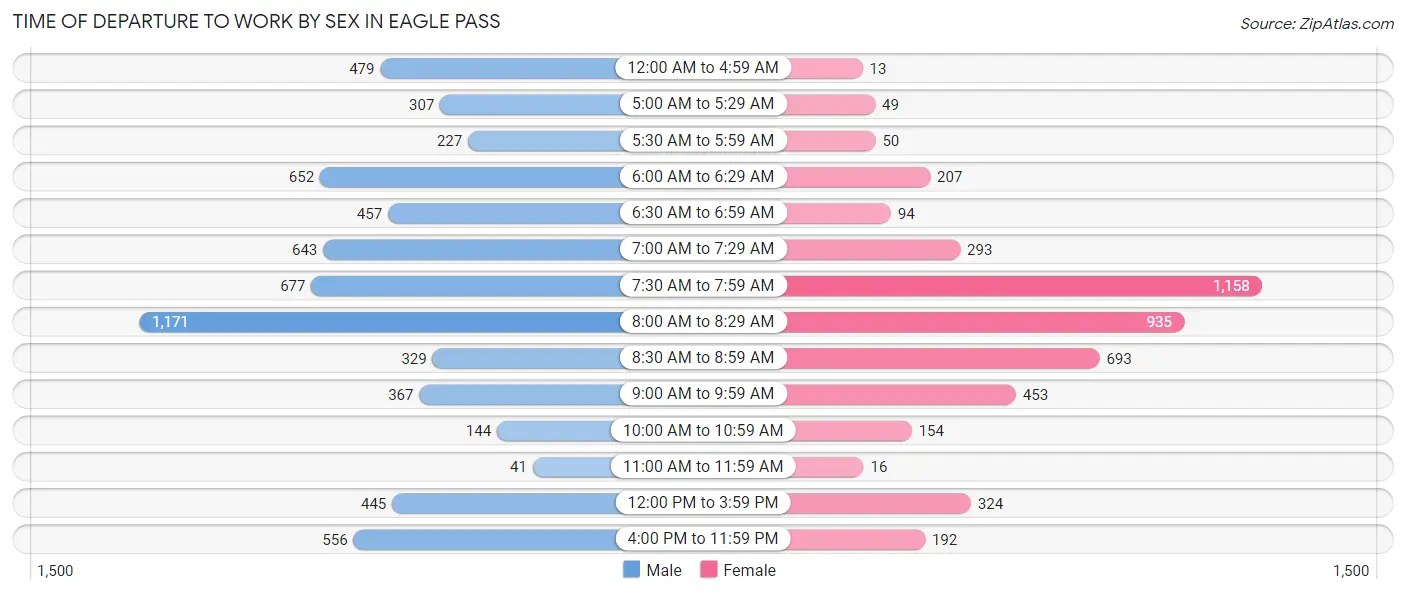
| Time of Departure | Male | Female |
| 12:00 AM to 4:59 AM | 479 (7.4%) | 13 (0.3%) |
| 5:00 AM to 5:29 AM | 307 (4.7%) | 49 (1.1%) |
| 5:30 AM to 5:59 AM | 227 (3.5%) | 50 (1.1%) |
| 6:00 AM to 6:29 AM | 652 (10.0%) | 207 (4.5%) |
| 6:30 AM to 6:59 AM | 457 (7.0%) | 94 (2.0%) |
| 7:00 AM to 7:29 AM | 643 (9.9%) | 293 (6.3%) |
| 7:30 AM to 7:59 AM | 677 (10.4%) | 1,158 (25.0%) |
| 8:00 AM to 8:29 AM | 1,171 (18.0%) | 935 (20.2%) |
| 8:30 AM to 8:59 AM | 329 (5.1%) | 693 (15.0%) |
| 9:00 AM to 9:59 AM | 367 (5.7%) | 453 (9.8%) |
| 10:00 AM to 10:59 AM | 144 (2.2%) | 154 (3.3%) |
| 11:00 AM to 11:59 AM | 41 (0.6%) | 16 (0.4%) |
| 12:00 PM to 3:59 PM | 445 (6.9%) | 324 (7.0%) |
| 4:00 PM to 11:59 PM | 556 (8.6%) | 192 (4.2%) |
| Total | 6,495 (100.0%) | 4,631 (100.0%) |
Housing Occupancy in Eagle Pass
Occupancy by Ownership in Eagle Pass
Of the total 9,150 dwellings in Eagle Pass, owner-occupied units account for 5,164 (56.4%), while renter-occupied units make up 3,986 (43.6%).
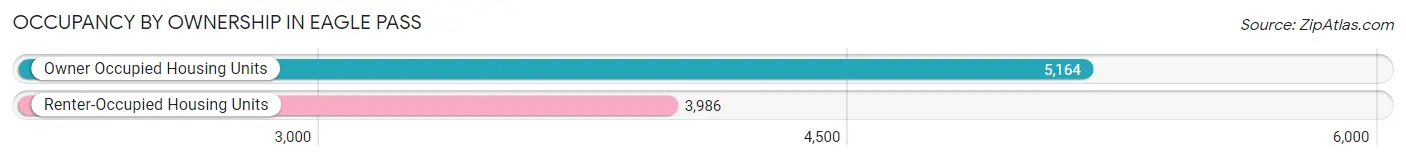
| Occupancy | # Housing Units | % Housing Units |
| Owner Occupied Housing Units | 5,164 | 56.4% |
| Renter-Occupied Housing Units | 3,986 | 43.6% |
| Total Occupied Housing Units | 9,150 | 100.0% |
Occupancy by Household Size in Eagle Pass
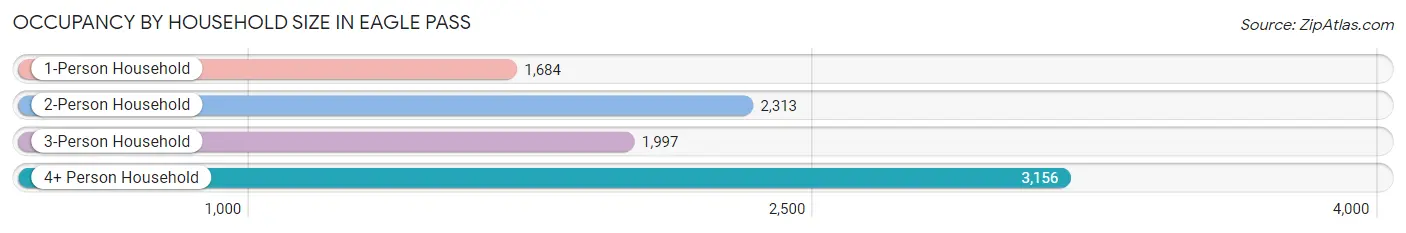
| Household Size | # Housing Units | % Housing Units |
| 1-Person Household | 1,684 | 18.4% |
| 2-Person Household | 2,313 | 25.3% |
| 3-Person Household | 1,997 | 21.8% |
| 4+ Person Household | 3,156 | 34.5% |
| Total Housing Units | 9,150 | 100.0% |
Occupancy by Ownership by Household Size in Eagle Pass
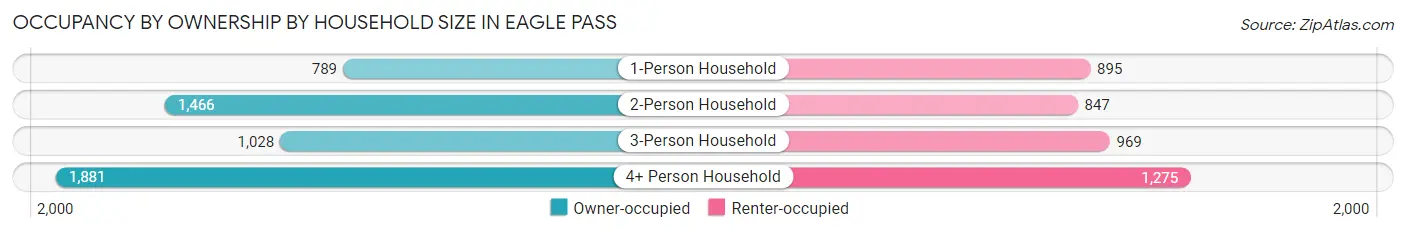
| Household Size | Owner-occupied | Renter-occupied |
| 1-Person Household | 789 (46.9%) | 895 (53.1%) |
| 2-Person Household | 1,466 (63.4%) | 847 (36.6%) |
| 3-Person Household | 1,028 (51.5%) | 969 (48.5%) |
| 4+ Person Household | 1,881 (59.6%) | 1,275 (40.4%) |
| Total Housing Units | 5,164 (56.4%) | 3,986 (43.6%) |
Occupancy by Educational Attainment in Eagle Pass
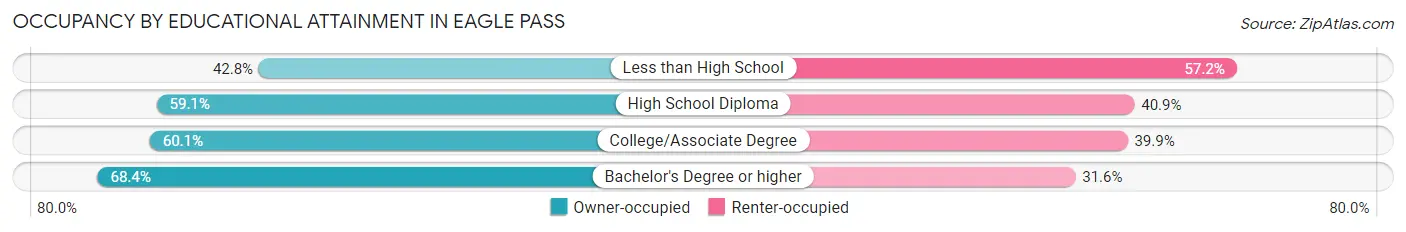
| Household Size | Owner-occupied | Renter-occupied |
| Less than High School | 1,215 (42.8%) | 1,622 (57.2%) |
| High School Diploma | 1,138 (59.1%) | 789 (40.9%) |
| College/Associate Degree | 1,379 (60.1%) | 914 (39.9%) |
| Bachelor's Degree or higher | 1,432 (68.4%) | 661 (31.6%) |
Occupancy by Age of Householder in Eagle Pass
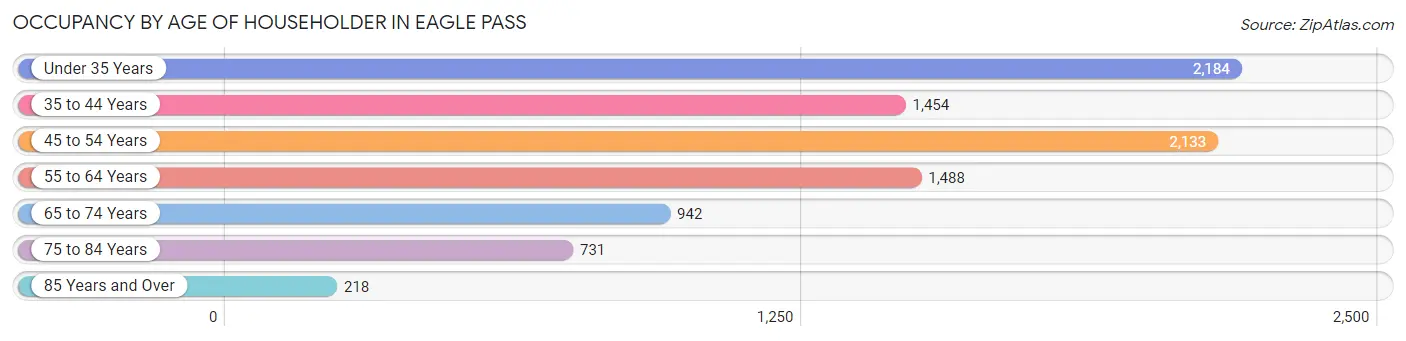
| Age Bracket | # Households | % Households |
| Under 35 Years | 2,184 | 23.9% |
| 35 to 44 Years | 1,454 | 15.9% |
| 45 to 54 Years | 2,133 | 23.3% |
| 55 to 64 Years | 1,488 | 16.3% |
| 65 to 74 Years | 942 | 10.3% |
| 75 to 84 Years | 731 | 8.0% |
| 85 Years and Over | 218 | 2.4% |
| Total | 9,150 | 100.0% |
Housing Finances in Eagle Pass
Median Income by Occupancy in Eagle Pass
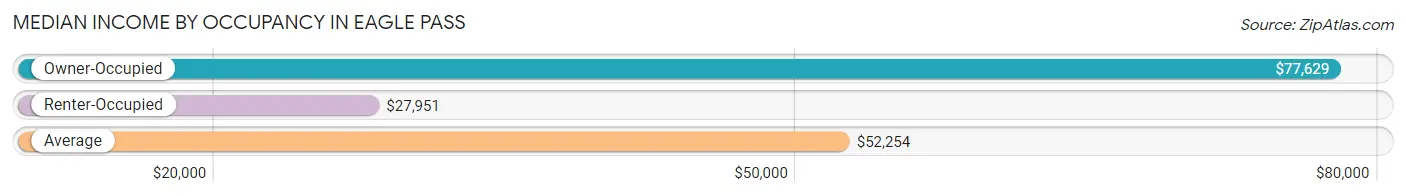
| Occupancy Type | # Households | Median Income |
| Owner-Occupied | 5,164 (56.4%) | $77,629 |
| Renter-Occupied | 3,986 (43.6%) | $27,951 |
| Average | 9,150 (100.0%) | $52,254 |
Occupancy by Householder Income Bracket in Eagle Pass
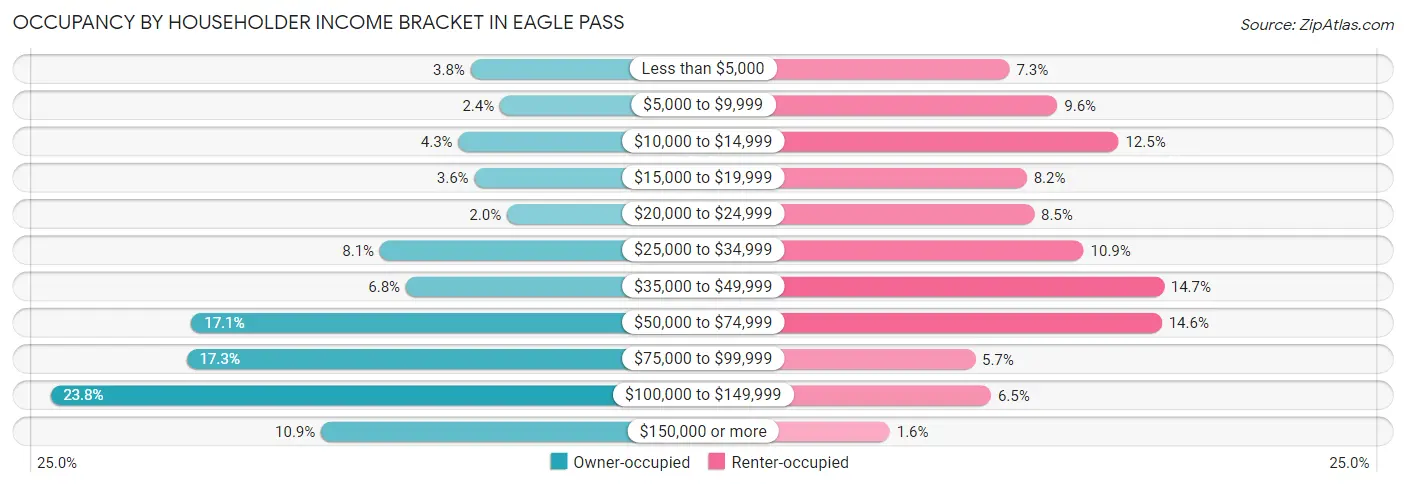
| Income Bracket | Owner-occupied | Renter-occupied |
| Less than $5,000 | 194 (3.8%) | 292 (7.3%) |
| $5,000 to $9,999 | 122 (2.4%) | 383 (9.6%) |
| $10,000 to $14,999 | 224 (4.3%) | 499 (12.5%) |
| $15,000 to $19,999 | 185 (3.6%) | 325 (8.2%) |
| $20,000 to $24,999 | 105 (2.0%) | 339 (8.5%) |
| $25,000 to $34,999 | 417 (8.1%) | 433 (10.9%) |
| $35,000 to $49,999 | 353 (6.8%) | 585 (14.7%) |
| $50,000 to $74,999 | 881 (17.1%) | 581 (14.6%) |
| $75,000 to $99,999 | 893 (17.3%) | 227 (5.7%) |
| $100,000 to $149,999 | 1,228 (23.8%) | 257 (6.5%) |
| $150,000 or more | 562 (10.9%) | 65 (1.6%) |
| Total | 5,164 (100.0%) | 3,986 (100.0%) |
Monthly Housing Cost Tiers in Eagle Pass
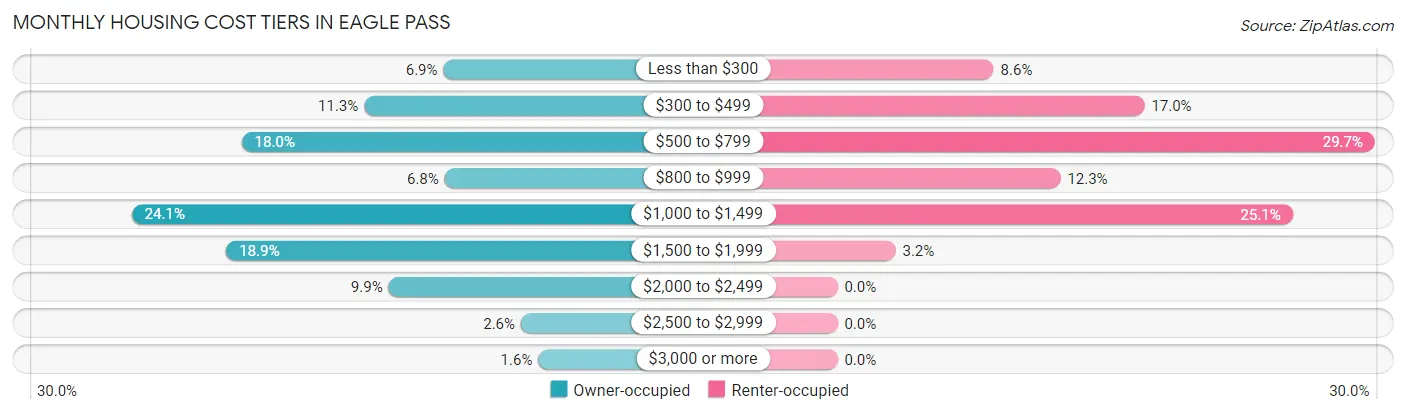
| Monthly Cost | Owner-occupied | Renter-occupied |
| Less than $300 | 355 (6.9%) | 344 (8.6%) |
| $300 to $499 | 581 (11.3%) | 676 (17.0%) |
| $500 to $799 | 930 (18.0%) | 1,183 (29.7%) |
| $800 to $999 | 351 (6.8%) | 491 (12.3%) |
| $1,000 to $1,499 | 1,244 (24.1%) | 1,002 (25.1%) |
| $1,500 to $1,999 | 974 (18.9%) | 128 (3.2%) |
| $2,000 to $2,499 | 511 (9.9%) | 0 (0.0%) |
| $2,500 to $2,999 | 134 (2.6%) | 0 (0.0%) |
| $3,000 or more | 84 (1.6%) | 0 (0.0%) |
| Total | 5,164 (100.0%) | 3,986 (100.0%) |
Physical Housing Characteristics in Eagle Pass
Housing Structures in Eagle Pass
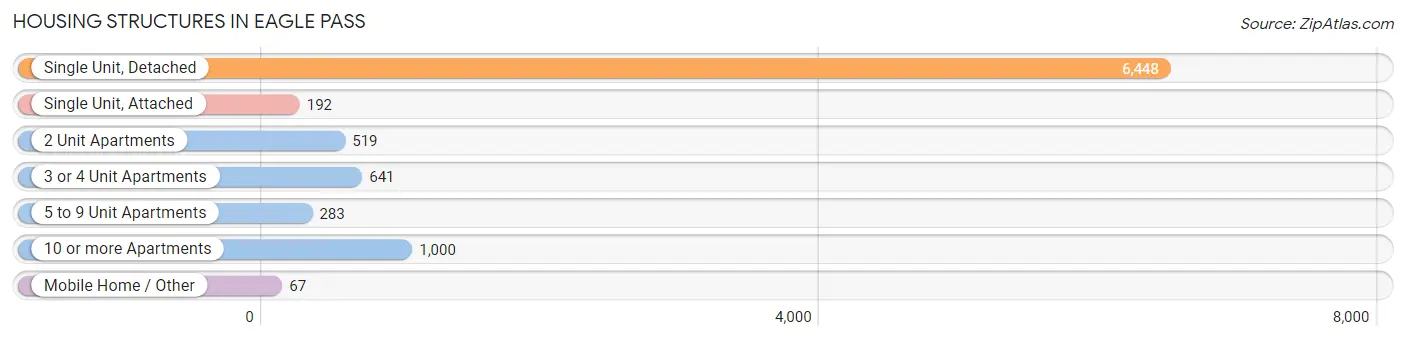
| Structure Type | # Housing Units | % Housing Units |
| Single Unit, Detached | 6,448 | 70.5% |
| Single Unit, Attached | 192 | 2.1% |
| 2 Unit Apartments | 519 | 5.7% |
| 3 or 4 Unit Apartments | 641 | 7.0% |
| 5 to 9 Unit Apartments | 283 | 3.1% |
| 10 or more Apartments | 1,000 | 10.9% |
| Mobile Home / Other | 67 | 0.7% |
| Total | 9,150 | 100.0% |
Housing Structures by Occupancy in Eagle Pass
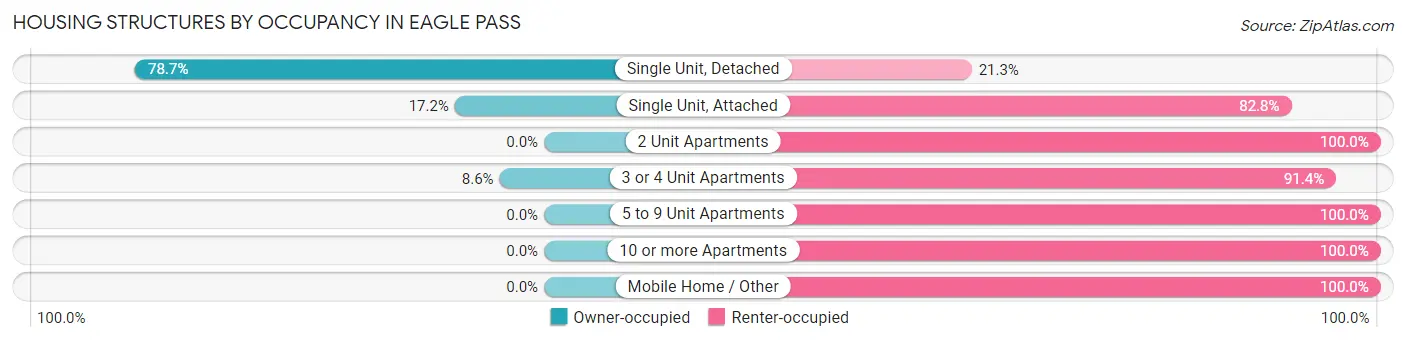
| Structure Type | Owner-occupied | Renter-occupied |
| Single Unit, Detached | 5,076 (78.7%) | 1,372 (21.3%) |
| Single Unit, Attached | 33 (17.2%) | 159 (82.8%) |
| 2 Unit Apartments | 0 (0.0%) | 519 (100.0%) |
| 3 or 4 Unit Apartments | 55 (8.6%) | 586 (91.4%) |
| 5 to 9 Unit Apartments | 0 (0.0%) | 283 (100.0%) |
| 10 or more Apartments | 0 (0.0%) | 1,000 (100.0%) |
| Mobile Home / Other | 0 (0.0%) | 67 (100.0%) |
| Total | 5,164 (56.4%) | 3,986 (43.6%) |
Housing Structures by Number of Rooms in Eagle Pass
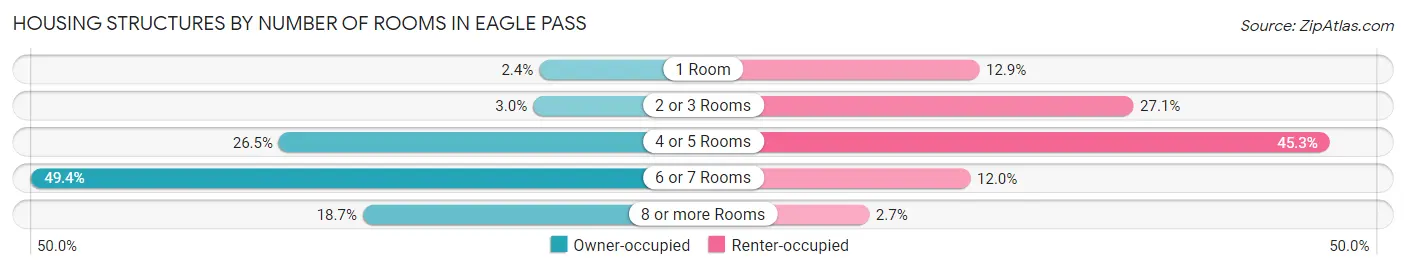
| Number of Rooms | Owner-occupied | Renter-occupied |
| 1 Room | 125 (2.4%) | 513 (12.9%) |
| 2 or 3 Rooms | 154 (3.0%) | 1,081 (27.1%) |
| 4 or 5 Rooms | 1,368 (26.5%) | 1,805 (45.3%) |
| 6 or 7 Rooms | 2,550 (49.4%) | 480 (12.0%) |
| 8 or more Rooms | 967 (18.7%) | 107 (2.7%) |
| Total | 5,164 (100.0%) | 3,986 (100.0%) |
Housing Structure by Heating Type in Eagle Pass
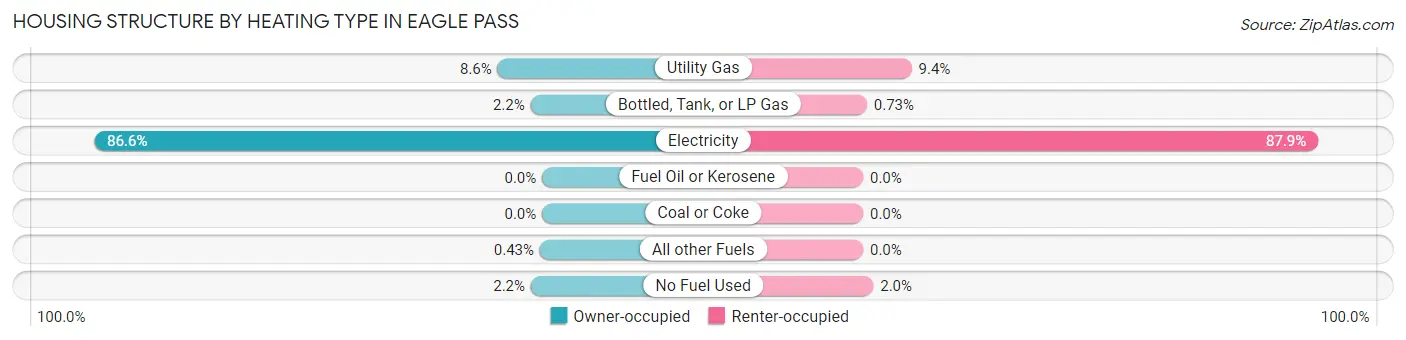
| Heating Type | Owner-occupied | Renter-occupied |
| Utility Gas | 444 (8.6%) | 374 (9.4%) |
| Bottled, Tank, or LP Gas | 115 (2.2%) | 29 (0.7%) |
| Electricity | 4,471 (86.6%) | 3,504 (87.9%) |
| Fuel Oil or Kerosene | 0 (0.0%) | 0 (0.0%) |
| Coal or Coke | 0 (0.0%) | 0 (0.0%) |
| All other Fuels | 22 (0.4%) | 0 (0.0%) |
| No Fuel Used | 112 (2.2%) | 79 (2.0%) |
| Total | 5,164 (100.0%) | 3,986 (100.0%) |
Household Vehicle Usage in Eagle Pass
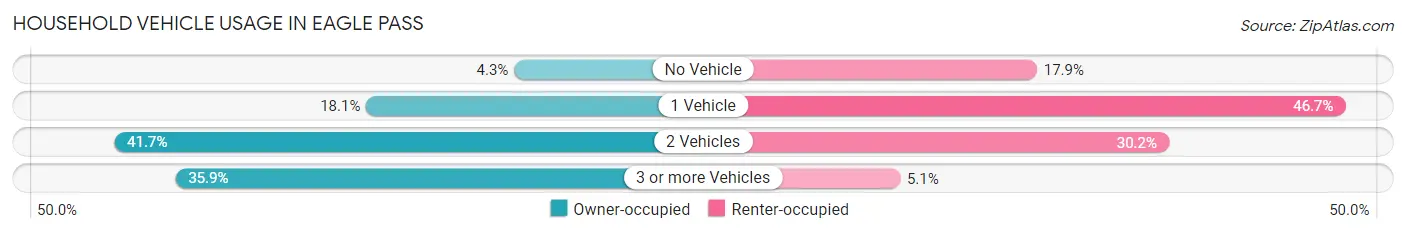
| Vehicles per Household | Owner-occupied | Renter-occupied |
| No Vehicle | 222 (4.3%) | 714 (17.9%) |
| 1 Vehicle | 935 (18.1%) | 1,862 (46.7%) |
| 2 Vehicles | 2,151 (41.6%) | 1,205 (30.2%) |
| 3 or more Vehicles | 1,856 (35.9%) | 205 (5.1%) |
| Total | 5,164 (100.0%) | 3,986 (100.0%) |
Real Estate & Mortgages in Eagle Pass
Real Estate and Mortgage Overview in Eagle Pass
| Characteristic | Without Mortgage | With Mortgage |
| Housing Units | 2,092 | 3,072 |
| Median Property Value | $130,300 | $202,500 |
| Median Household Income | $60,500 | $324 |
| Monthly Housing Costs | $537 | $80 |
| Real Estate Taxes | $2,324 | $99 |
Property Value by Mortgage Status in Eagle Pass
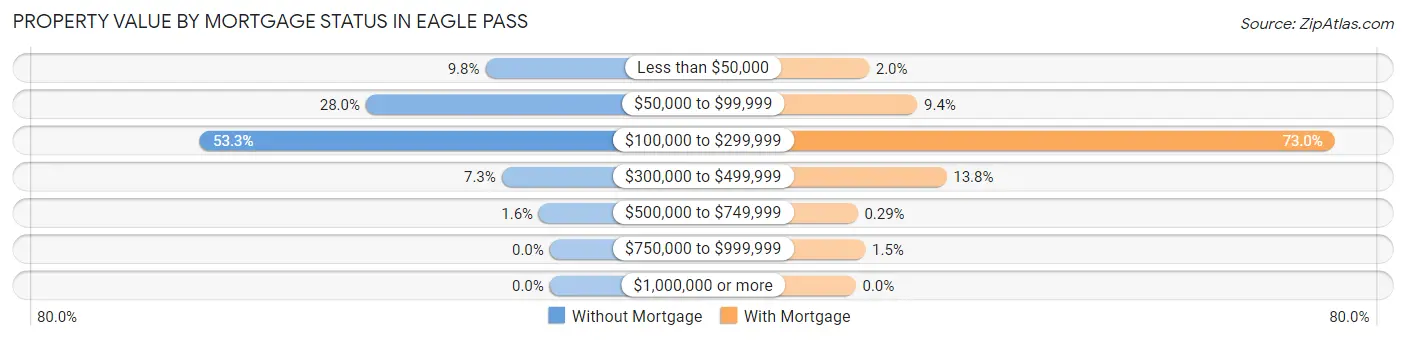
| Property Value | Without Mortgage | With Mortgage |
| Less than $50,000 | 205 (9.8%) | 62 (2.0%) |
| $50,000 to $99,999 | 586 (28.0%) | 288 (9.4%) |
| $100,000 to $299,999 | 1,114 (53.2%) | 2,243 (73.0%) |
| $300,000 to $499,999 | 153 (7.3%) | 425 (13.8%) |
| $500,000 to $749,999 | 34 (1.6%) | 9 (0.3%) |
| $750,000 to $999,999 | 0 (0.0%) | 45 (1.5%) |
| $1,000,000 or more | 0 (0.0%) | 0 (0.0%) |
| Total | 2,092 (100.0%) | 3,072 (100.0%) |
Household Income by Mortgage Status in Eagle Pass
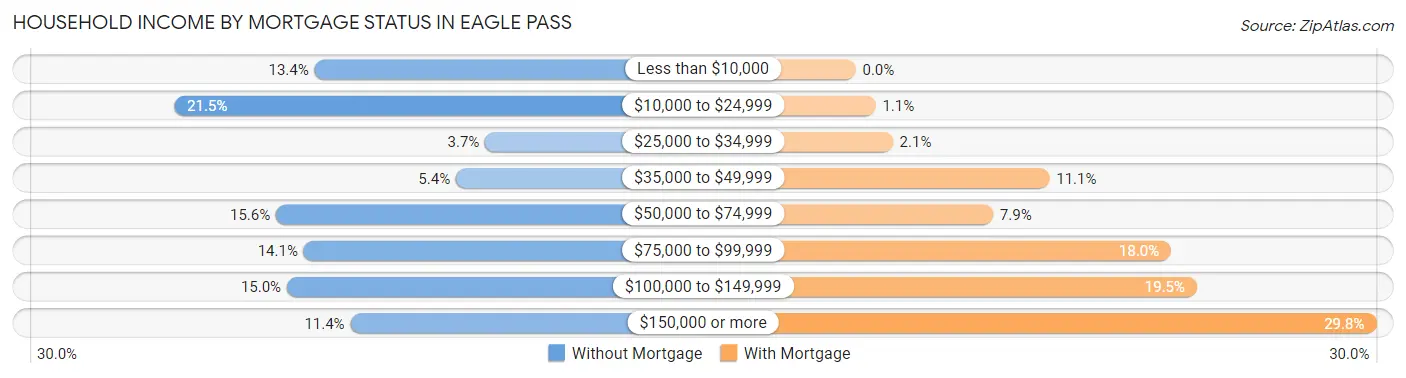
| Household Income | Without Mortgage | With Mortgage |
| Less than $10,000 | 281 (13.4%) | 0 (0.0%) |
| $10,000 to $24,999 | 449 (21.5%) | 35 (1.1%) |
| $25,000 to $34,999 | 77 (3.7%) | 65 (2.1%) |
| $35,000 to $49,999 | 112 (5.3%) | 340 (11.1%) |
| $50,000 to $74,999 | 327 (15.6%) | 241 (7.9%) |
| $75,000 to $99,999 | 294 (14.1%) | 554 (18.0%) |
| $100,000 to $149,999 | 314 (15.0%) | 599 (19.5%) |
| $150,000 or more | 238 (11.4%) | 914 (29.7%) |
| Total | 2,092 (100.0%) | 3,072 (100.0%) |
Property Value to Household Income Ratio in Eagle Pass
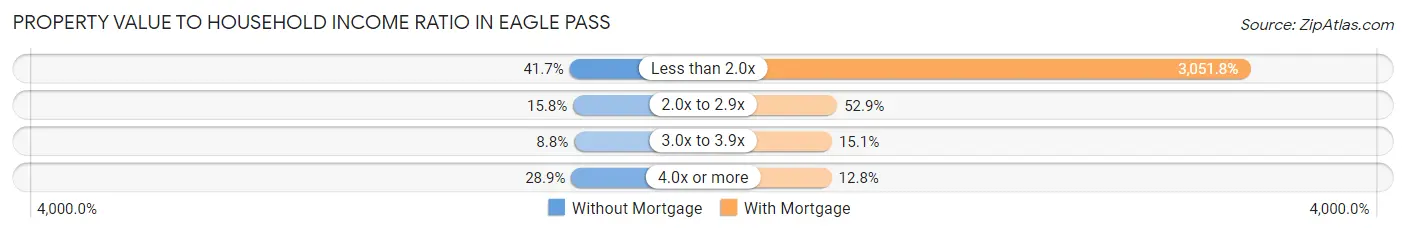
| Value-to-Income Ratio | Without Mortgage | With Mortgage |
| Less than 2.0x | 872 (41.7%) | 93,750 (3,051.8%) |
| 2.0x to 2.9x | 330 (15.8%) | 1,624 (52.9%) |
| 3.0x to 3.9x | 185 (8.8%) | 464 (15.1%) |
| 4.0x or more | 604 (28.9%) | 392 (12.8%) |
| Total | 2,092 (100.0%) | 3,072 (100.0%) |
Real Estate Taxes by Mortgage Status in Eagle Pass

| Property Taxes | Without Mortgage | With Mortgage |
| Less than $800 | 214 (10.2%) | 35 (1.1%) |
| $800 to $1,499 | 494 (23.6%) | 94 (3.1%) |
| $800 to $1,499 | 1,316 (62.9%) | 348 (11.3%) |
| Total | 2,092 (100.0%) | 3,072 (100.0%) |
Health & Disability in Eagle Pass
Health Insurance Coverage by Age in Eagle Pass
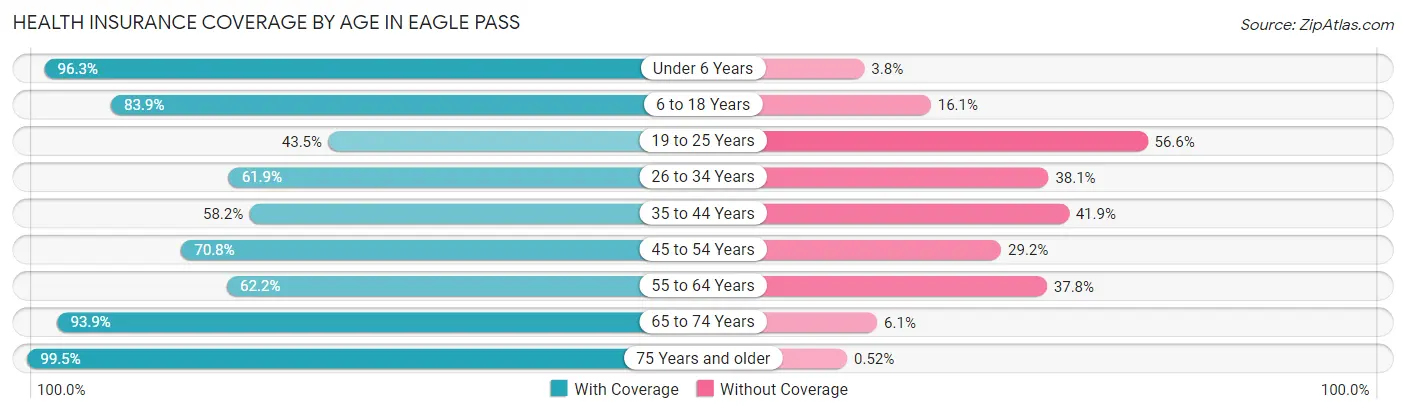
| Age Bracket | With Coverage | Without Coverage |
| Under 6 Years | 3,078 (96.3%) | 120 (3.7%) |
| 6 to 18 Years | 4,814 (83.9%) | 926 (16.1%) |
| 19 to 25 Years | 1,307 (43.4%) | 1,701 (56.6%) |
| 26 to 34 Years | 2,504 (61.9%) | 1,539 (38.1%) |
| 35 to 44 Years | 1,594 (58.2%) | 1,147 (41.8%) |
| 45 to 54 Years | 2,376 (70.8%) | 982 (29.2%) |
| 55 to 64 Years | 1,649 (62.2%) | 1,001 (37.8%) |
| 65 to 74 Years | 1,516 (93.9%) | 99 (6.1%) |
| 75 Years and older | 1,519 (99.5%) | 8 (0.5%) |
| Total | 20,357 (73.0%) | 7,523 (27.0%) |
Health Insurance Coverage by Citizenship Status in Eagle Pass
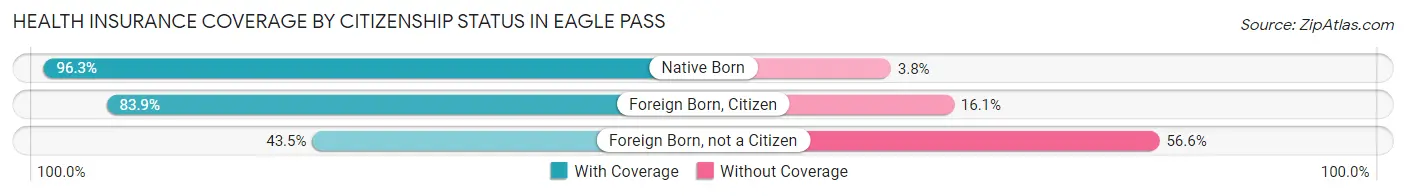
| Citizenship Status | With Coverage | Without Coverage |
| Native Born | 3,078 (96.3%) | 120 (3.7%) |
| Foreign Born, Citizen | 4,814 (83.9%) | 926 (16.1%) |
| Foreign Born, not a Citizen | 1,307 (43.4%) | 1,701 (56.6%) |
Health Insurance Coverage by Household Income in Eagle Pass
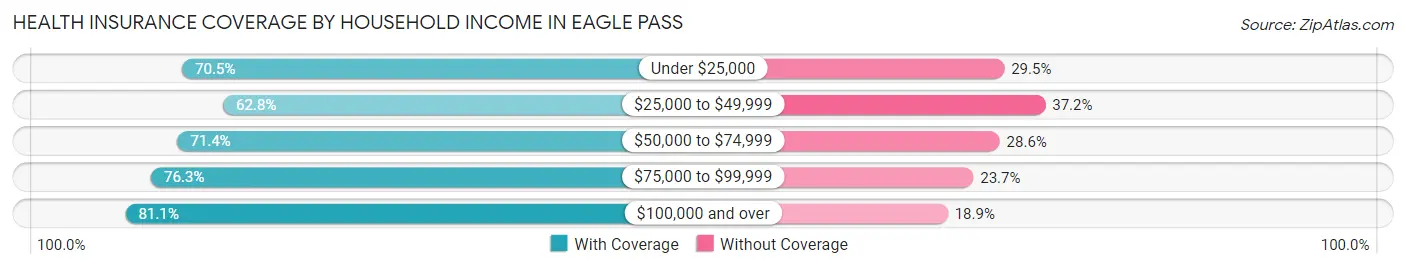
| Household Income | With Coverage | Without Coverage |
| Under $25,000 | 4,108 (70.5%) | 1,719 (29.5%) |
| $25,000 to $49,999 | 3,384 (62.8%) | 2,004 (37.2%) |
| $50,000 to $74,999 | 3,286 (71.4%) | 1,319 (28.6%) |
| $75,000 to $99,999 | 3,116 (76.3%) | 968 (23.7%) |
| $100,000 and over | 6,438 (81.1%) | 1,501 (18.9%) |
Public vs Private Health Insurance Coverage by Age in Eagle Pass
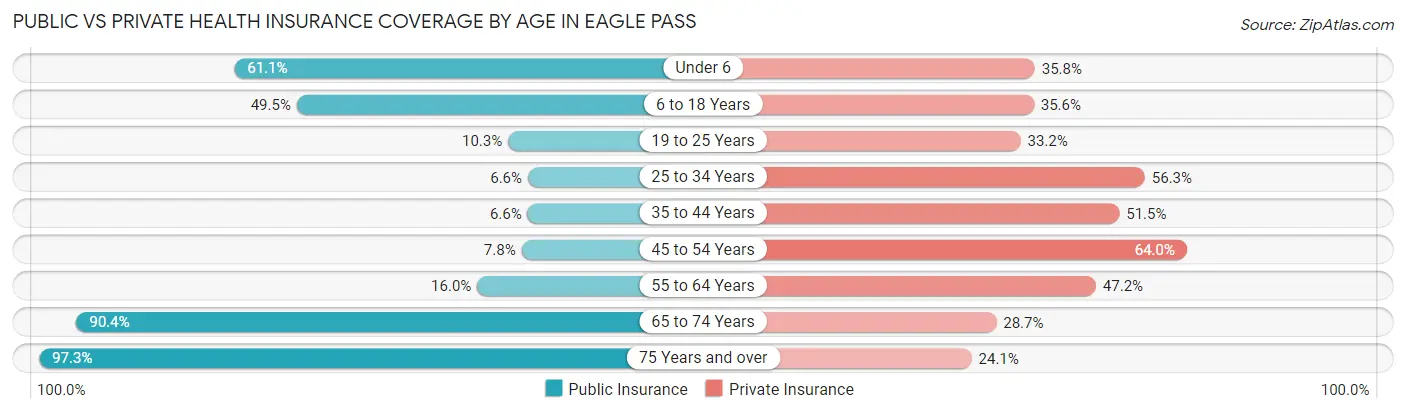
| Age Bracket | Public Insurance | Private Insurance |
| Under 6 | 1,953 (61.1%) | 1,146 (35.8%) |
| 6 to 18 Years | 2,841 (49.5%) | 2,046 (35.6%) |
| 19 to 25 Years | 309 (10.3%) | 998 (33.2%) |
| 25 to 34 Years | 266 (6.6%) | 2,274 (56.2%) |
| 35 to 44 Years | 182 (6.6%) | 1,412 (51.5%) |
| 45 to 54 Years | 261 (7.8%) | 2,150 (64.0%) |
| 55 to 64 Years | 424 (16.0%) | 1,250 (47.2%) |
| 65 to 74 Years | 1,460 (90.4%) | 463 (28.7%) |
| 75 Years and over | 1,486 (97.3%) | 368 (24.1%) |
| Total | 9,182 (32.9%) | 12,107 (43.4%) |
Disability Status by Sex by Age in Eagle Pass
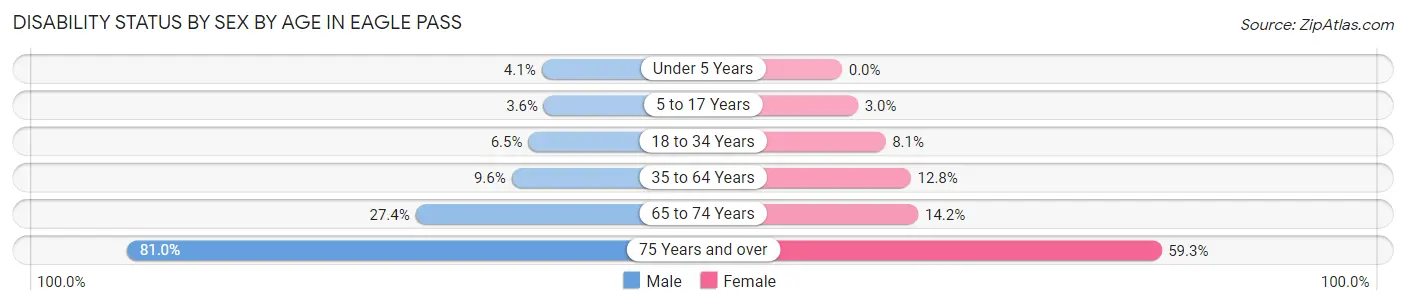
| Age Bracket | Male | Female |
| Under 5 Years | 48 (4.1%) | 0 (0.0%) |
| 5 to 17 Years | 105 (3.6%) | 80 (3.0%) |
| 18 to 34 Years | 238 (6.5%) | 327 (8.1%) |
| 35 to 64 Years | 426 (9.6%) | 551 (12.8%) |
| 65 to 74 Years | 191 (27.4%) | 130 (14.1%) |
| 75 Years and over | 435 (81.0%) | 587 (59.3%) |
Disability Class by Sex by Age in Eagle Pass
Disability Class: Hearing Difficulty
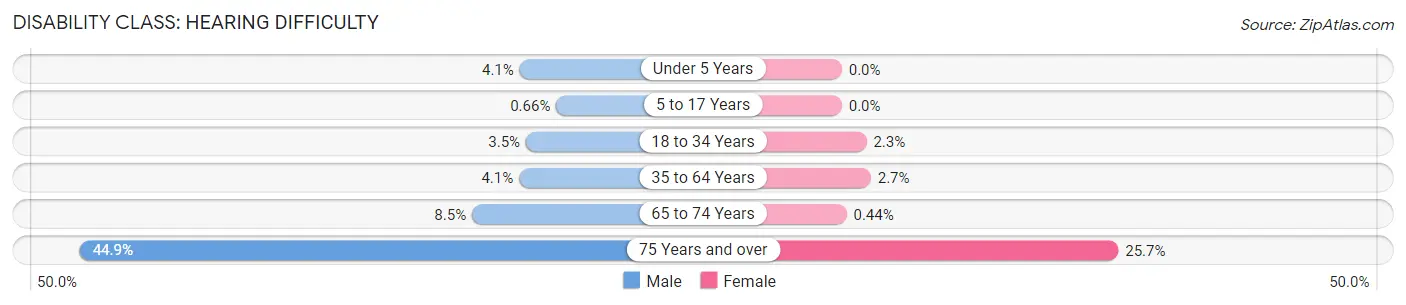
| Age Bracket | Male | Female |
| Under 5 Years | 48 (4.1%) | 0 (0.0%) |
| 5 to 17 Years | 19 (0.7%) | 0 (0.0%) |
| 18 to 34 Years | 127 (3.5%) | 93 (2.3%) |
| 35 to 64 Years | 182 (4.1%) | 116 (2.7%) |
| 65 to 74 Years | 59 (8.5%) | 4 (0.4%) |
| 75 Years and over | 241 (44.9%) | 254 (25.7%) |
Disability Class: Vision Difficulty
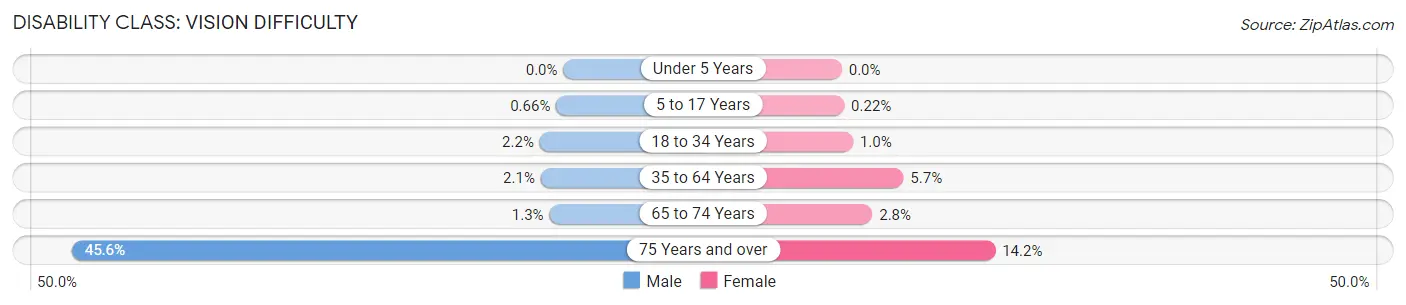
| Age Bracket | Male | Female |
| Under 5 Years | 0 (0.0%) | 0 (0.0%) |
| 5 to 17 Years | 19 (0.7%) | 6 (0.2%) |
| 18 to 34 Years | 80 (2.2%) | 42 (1.0%) |
| 35 to 64 Years | 93 (2.1%) | 247 (5.7%) |
| 65 to 74 Years | 9 (1.3%) | 26 (2.8%) |
| 75 Years and over | 245 (45.6%) | 141 (14.2%) |
Disability Class: Cognitive Difficulty
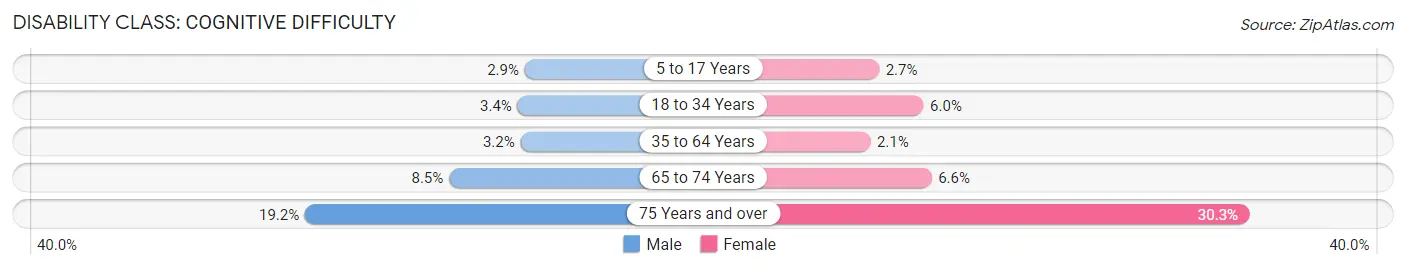
| Age Bracket | Male | Female |
| 5 to 17 Years | 83 (2.9%) | 74 (2.7%) |
| 18 to 34 Years | 124 (3.4%) | 245 (6.0%) |
| 35 to 64 Years | 141 (3.2%) | 90 (2.1%) |
| 65 to 74 Years | 59 (8.5%) | 61 (6.6%) |
| 75 Years and over | 103 (19.2%) | 300 (30.3%) |
Disability Class: Ambulatory Difficulty
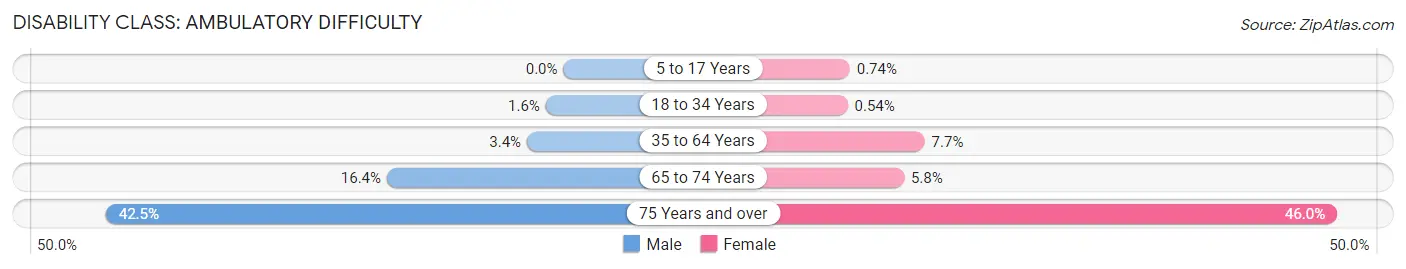
| Age Bracket | Male | Female |
| 5 to 17 Years | 0 (0.0%) | 20 (0.7%) |
| 18 to 34 Years | 60 (1.6%) | 22 (0.5%) |
| 35 to 64 Years | 150 (3.4%) | 332 (7.7%) |
| 65 to 74 Years | 114 (16.4%) | 53 (5.8%) |
| 75 Years and over | 228 (42.5%) | 455 (46.0%) |
Disability Class: Self-Care Difficulty
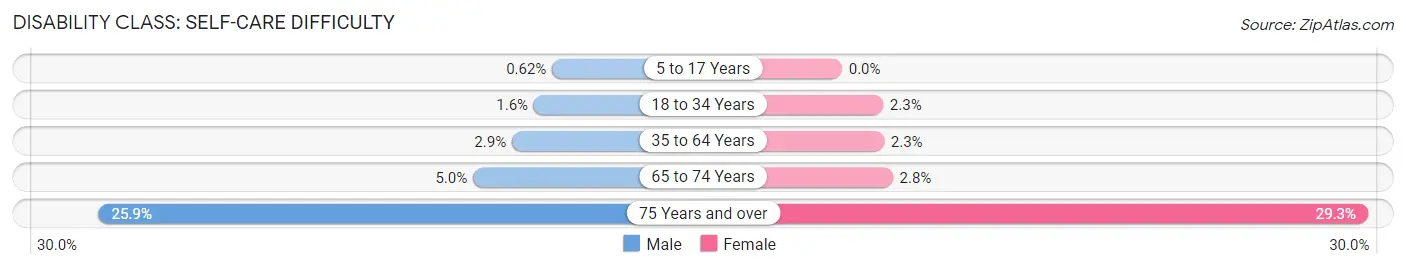
| Age Bracket | Male | Female |
| 5 to 17 Years | 18 (0.6%) | 0 (0.0%) |
| 18 to 34 Years | 60 (1.6%) | 93 (2.3%) |
| 35 to 64 Years | 127 (2.9%) | 101 (2.3%) |
| 65 to 74 Years | 35 (5.0%) | 26 (2.8%) |
| 75 Years and over | 139 (25.9%) | 290 (29.3%) |
Technology Access in Eagle Pass
Computing Device Access in Eagle Pass
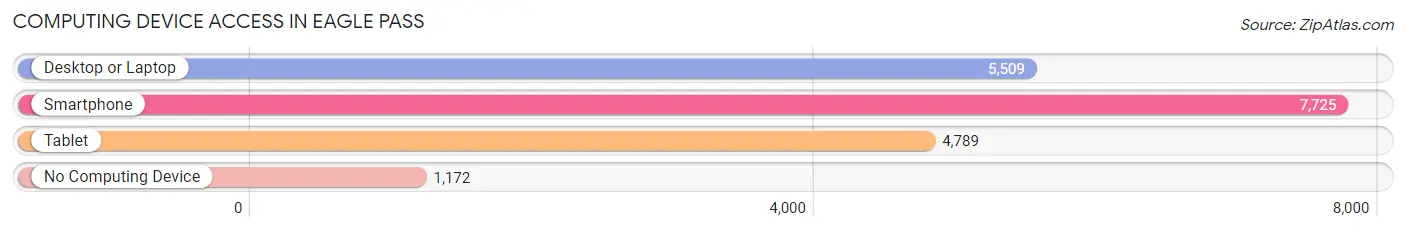
| Device Type | # Households | % Households |
| Desktop or Laptop | 5,509 | 60.2% |
| Smartphone | 7,725 | 84.4% |
| Tablet | 4,789 | 52.3% |
| No Computing Device | 1,172 | 12.8% |
| Total | 9,150 | 100.0% |
Internet Access in Eagle Pass
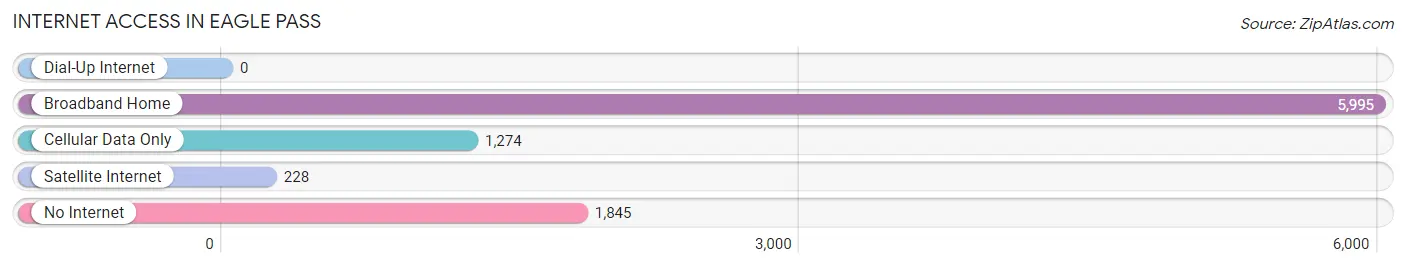
| Internet Type | # Households | % Households |
| Dial-Up Internet | 0 | 0.0% |
| Broadband Home | 5,995 | 65.5% |
| Cellular Data Only | 1,274 | 13.9% |
| Satellite Internet | 228 | 2.5% |
| No Internet | 1,845 | 20.2% |
| Total | 9,150 | 100.0% |
Eagle Pass Summary
Eagle Pass is a city located in Maverick County, Texas, United States. It is located on the Rio Grande, across the border from Piedras Negras, Coahuila, Mexico. As of the 2010 census, the city had a population of 26,255. Eagle Pass is the largest city in and the county seat of Maverick County.
History
The area around Eagle Pass has been inhabited for thousands of years by various indigenous peoples. In the 16th century, the area was explored by Spanish explorers, who named the area “Paso del Águila” (Eagle Pass). The area was part of the Spanish colonial province of Coahuila y Tejas, and later part of the independent Republic of Texas.
In 1849, a fort was established by the United States Army to protect the area from Native American raids. The fort was named Fort Duncan, after Colonel James Duncan, who had served in the Mexican-American War. The fort was abandoned in 1859, but was re-established in 1868. In 1881, the town of Eagle Pass was established around the fort.
Geography
Eagle Pass is located in Maverick County, Texas, at the confluence of the Rio Grande and the Devils River. It is situated on the border with Mexico, across the Rio Grande from the city of Piedras Negras, Coahuila. The city has a total area of 11.2 square miles, of which 11.1 square miles is land and 0.1 square miles is water.
Climate
Eagle Pass has a semi-arid climate, with hot summers and mild winters. The average annual temperature is 73.2°F, with an average high of 92.3°F in July and an average low of 53.2°F in January. The average annual precipitation is 19.3 inches.
Demographics
As of the 2010 census, there were 26,255 people, 6,945 households, and 5,093 families residing in the city. The population density was 2,364.2 people per square mile. The racial makeup of the city was 77.2% White, 0.7% African American, 0.6% Native American, 0.4% Asian, 0.1% Pacific Islander, 19.2% from other races, and 2.8% from two or more races. Hispanic or Latino of any race were 90.5% of the population.
Economy
Eagle Pass is a major port of entry into the United States from Mexico. The city is home to several international bridges, including the Eagle Pass-Piedras Negras International Bridge, the Camino Real International Bridge, and the Free Trade International Bridge. The city is also home to the Eagle Pass Industrial Park, which is home to several manufacturing and distribution companies.
The city's economy is also supported by tourism, retail, and services. The city is home to several tourist attractions, including Fort Duncan Museum, Maverick County Lake, and the Kickapoo Lucky Eagle Casino. The city is also home to several retail stores, restaurants, and other services.
Conclusion
Eagle Pass is a city located in Maverick County, Texas, United States. It is located on the Rio Grande, across the border from Piedras Negras, Coahuila, Mexico. As of the 2010 census, the city had a population of 26,255. Eagle Pass is the largest city in and the county seat of Maverick County. The area around Eagle Pass has been inhabited for thousands of years by various indigenous peoples. The city is a major port of entry into the United States from Mexico, and its economy is supported by tourism, retail, and services.
Common Questions
What is Per Capita Income in Eagle Pass?
Per Capita income in Eagle Pass is $22,353.
What is the Median Family Income in Eagle Pass?
Median Family Income in Eagle Pass is $65,718.
What is the Median Household income in Eagle Pass?
Median Household Income in Eagle Pass is $52,254.
What is Income or Wage Gap in Eagle Pass?
Income or Wage Gap in Eagle Pass is 40.3%.
Women in Eagle Pass earn 59.7 cents for every dollar earned by a man.
What is Family Income Deficit in Eagle Pass?
Family Income Deficit in Eagle Pass is $9,942.
Families that are below poverty line in Eagle Pass earn $9,942 less on average than the poverty threshold level.
What is Inequality or Gini Index in Eagle Pass?
Inequality or Gini Index in Eagle Pass is 0.45.
What is the Total Population of Eagle Pass?
Total Population of Eagle Pass is 28,166.
What is the Total Male Population of Eagle Pass?
Total Male Population of Eagle Pass is 13,562.
What is the Total Female Population of Eagle Pass?
Total Female Population of Eagle Pass is 14,604.
What is the Ratio of Males per 100 Females in Eagle Pass?
There are 92.86 Males per 100 Females in Eagle Pass.
What is the Ratio of Females per 100 Males in Eagle Pass?
There are 107.68 Females per 100 Males in Eagle Pass.
What is the Median Population Age in Eagle Pass?
Median Population Age in Eagle Pass is 29.7 Years.
What is the Average Family Size in Eagle Pass
Average Family Size in Eagle Pass is 3.5 People.
What is the Average Household Size in Eagle Pass
Average Household Size in Eagle Pass is 3.0 People.
How Large is the Labor Force in Eagle Pass?
There are 12,767 People in the Labor Forcein in Eagle Pass.
What is the Percentage of People in the Labor Force in Eagle Pass?
60.9% of People are in the Labor Force in Eagle Pass.
What is the Unemployment Rate in Eagle Pass?
Unemployment Rate in Eagle Pass is 6.8%.