Donna, TX Map & Demographics
Donna Map
Donna Overview
$15,605
PER CAPITA INCOME
$45,417
AVG FAMILY INCOME
$34,049
AVG HOUSEHOLD INCOME
29.0%
WAGE / INCOME GAP [ % ]
71.0¢/ $1
WAGE / INCOME GAP [ $ ]
$13,961
FAMILY INCOME DEFICIT
0.48
INEQUALITY / GINI INDEX
16,742
TOTAL POPULATION
7,817
MALE POPULATION
8,925
FEMALE POPULATION
87.59
MALES / 100 FEMALES
114.17
FEMALES / 100 MALES
30.2
MEDIAN AGE
4.1
AVG FAMILY SIZE
3.2
AVG HOUSEHOLD SIZE
5,846
LABOR FORCE [ PEOPLE ]
50.2%
PERCENT IN LABOR FORCE
4.2%
UNEMPLOYMENT RATE
Donna Zip Codes
Donna Area Codes
Income in Donna
Income Overview in Donna
Per Capita Income in Donna is $15,605, while median incomes of families and households are $45,417 and $34,049 respectively.
| Characteristic | Number | Measure |
| Per Capita Income | 16,742 | $15,605 |
| Median Family Income | 3,678 | $45,417 |
| Mean Family Income | 3,678 | $55,484 |
| Median Household Income | 5,173 | $34,049 |
| Mean Household Income | 5,173 | $47,825 |
| Income Deficit | 3,678 | $13,961 |
| Wage / Income Gap (%) | 16,742 | 28.96% |
| Wage / Income Gap ($) | 16,742 | 71.04¢ per $1 |
| Gini / Inequality Index | 16,742 | 0.48 |
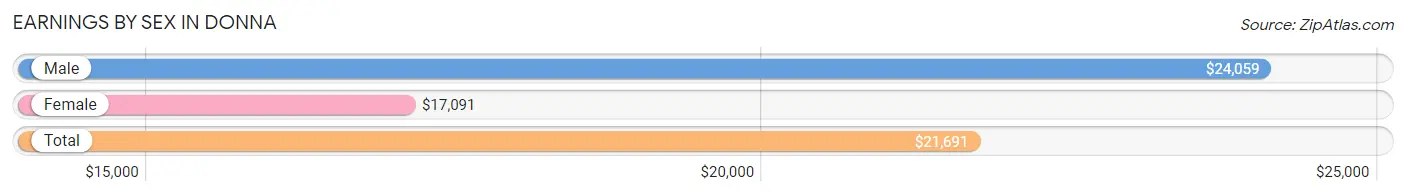
Earnings by Sex in Donna
Average Earnings in Donna are $21,691, $24,059 for men and $17,091 for women, a difference of 29.0%.
| Sex | Number | Average Earnings |
| Male | 3,277 (51.6%) | $24,059 |
| Female | 3,069 (48.4%) | $17,091 |
| Total | 6,346 (100.0%) | $21,691 |
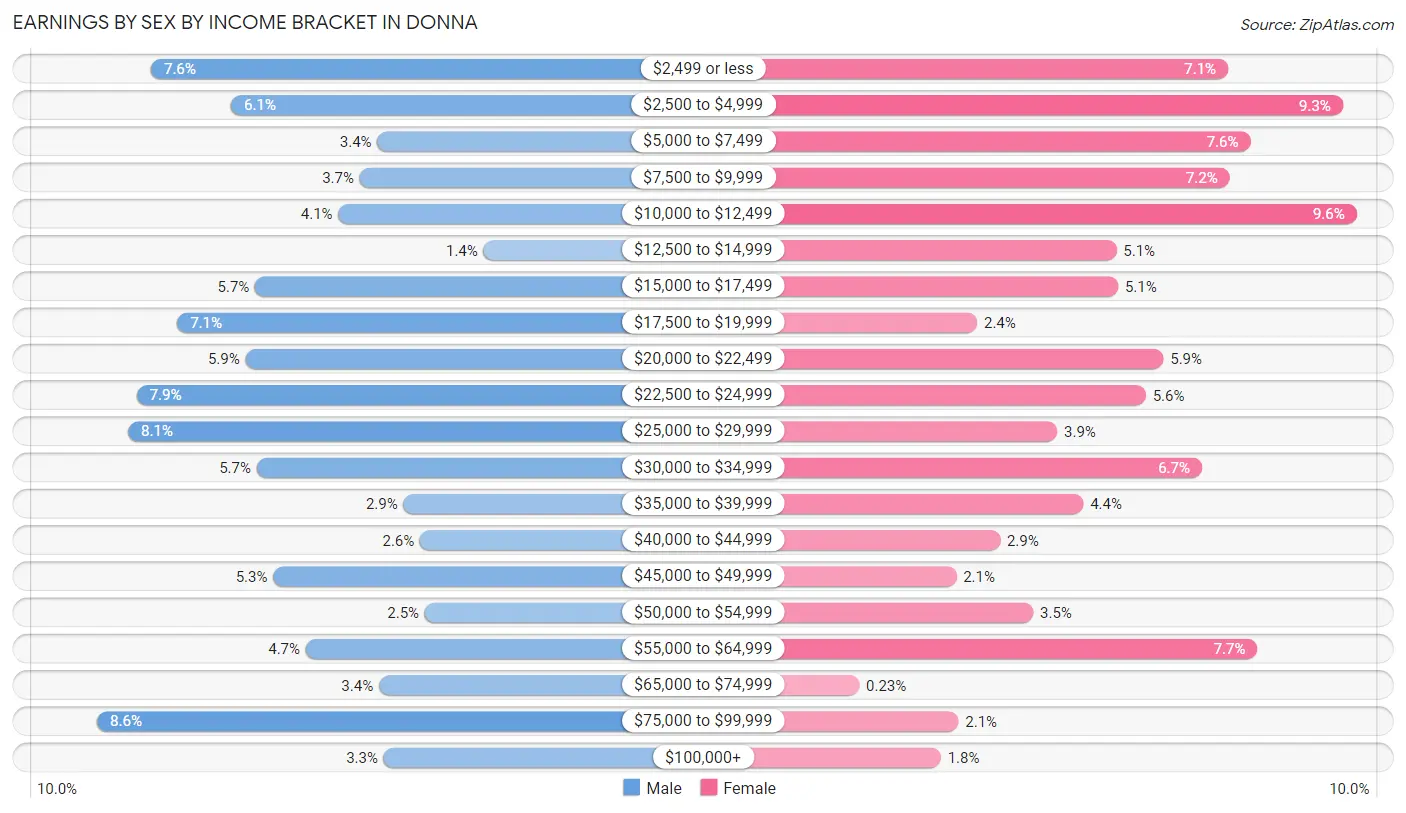
Earnings by Sex by Income Bracket in Donna
The most common earnings brackets in Donna are $75,000 to $99,999 for men (283 | 8.6%) and $10,000 to $12,499 for women (293 | 9.6%).
| Income | Male | Female |
| $2,499 or less | 250 (7.6%) | 219 (7.1%) |
| $2,500 to $4,999 | 201 (6.1%) | 285 (9.3%) |
| $5,000 to $7,499 | 111 (3.4%) | 232 (7.6%) |
| $7,500 to $9,999 | 122 (3.7%) | 220 (7.2%) |
| $10,000 to $12,499 | 135 (4.1%) | 293 (9.6%) |
| $12,500 to $14,999 | 46 (1.4%) | 155 (5.1%) |
| $15,000 to $17,499 | 186 (5.7%) | 156 (5.1%) |
| $17,500 to $19,999 | 234 (7.1%) | 75 (2.4%) |
| $20,000 to $22,499 | 192 (5.9%) | 182 (5.9%) |
| $22,500 to $24,999 | 259 (7.9%) | 172 (5.6%) |
| $25,000 to $29,999 | 264 (8.1%) | 121 (3.9%) |
| $30,000 to $34,999 | 185 (5.7%) | 204 (6.7%) |
| $35,000 to $39,999 | 95 (2.9%) | 136 (4.4%) |
| $40,000 to $44,999 | 85 (2.6%) | 88 (2.9%) |
| $45,000 to $49,999 | 175 (5.3%) | 63 (2.1%) |
| $50,000 to $54,999 | 82 (2.5%) | 107 (3.5%) |
| $55,000 to $64,999 | 155 (4.7%) | 236 (7.7%) |
| $65,000 to $74,999 | 110 (3.4%) | 7 (0.2%) |
| $75,000 to $99,999 | 283 (8.6%) | 64 (2.1%) |
| $100,000+ | 107 (3.3%) | 54 (1.8%) |
| Total | 3,277 (100.0%) | 3,069 (100.0%) |
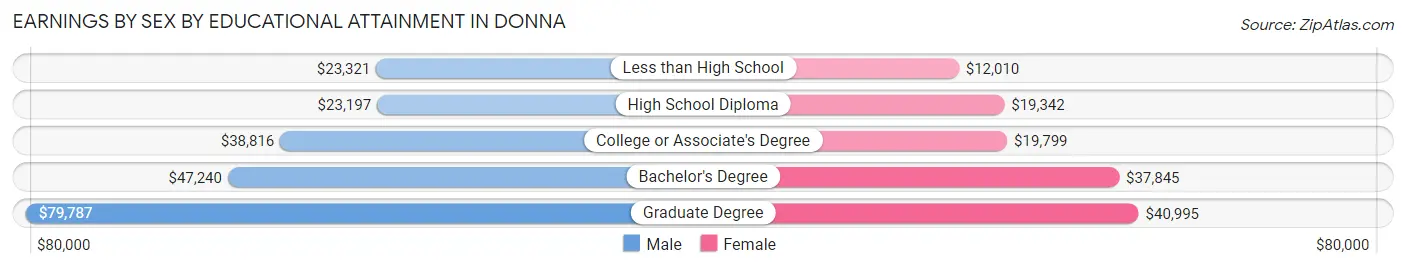
Earnings by Sex by Educational Attainment in Donna
Average earnings in Donna are $26,934 for men and $21,422 for women, a difference of 20.5%. Men with an educational attainment of graduate degree enjoy the highest average annual earnings of $79,787, while those with high school diploma education earn the least with $23,197. Women with an educational attainment of graduate degree earn the most with the average annual earnings of $40,995, while those with less than high school education have the smallest earnings of $12,010.
| Educational Attainment | Male Income | Female Income |
| Less than High School | $23,321 | $12,010 |
| High School Diploma | $23,197 | $19,342 |
| College or Associate's Degree | $38,816 | $19,799 |
| Bachelor's Degree | $47,240 | $37,845 |
| Graduate Degree | $79,787 | $40,995 |
| Total | $26,934 | $21,422 |
Family Income in Donna
Family Income Brackets in Donna
According to the Donna family income data, there are 666 families falling into the $50,000 to $74,999 income range, which is the most common income bracket and makes up 18.1% of all families. Conversely, the $150,000 to $199,999 income bracket is the least frequent group with only 63 families (1.7%) belonging to this category.
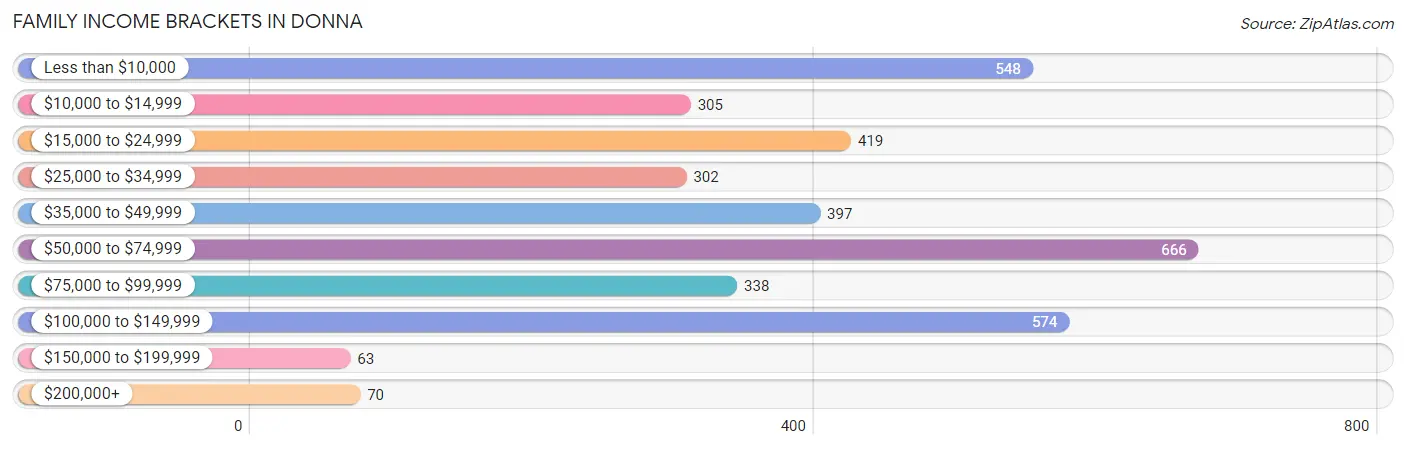
| Income Bracket | # Families | % Families |
| Less than $10,000 | 548 | 14.9% |
| $10,000 to $14,999 | 305 | 8.3% |
| $15,000 to $24,999 | 419 | 11.4% |
| $25,000 to $34,999 | 302 | 8.2% |
| $35,000 to $49,999 | 397 | 10.8% |
| $50,000 to $74,999 | 666 | 18.1% |
| $75,000 to $99,999 | 338 | 9.2% |
| $100,000 to $149,999 | 574 | 15.6% |
| $150,000 to $199,999 | 63 | 1.7% |
| $200,000+ | 70 | 1.9% |
Family Income by Famaliy Size in Donna
7+ person families (307 | 8.4%) account for the highest median family income in Donna with $67,854 per family, while 2-person families (1,210 | 32.9%) have the highest median income of $20,972 per family member.
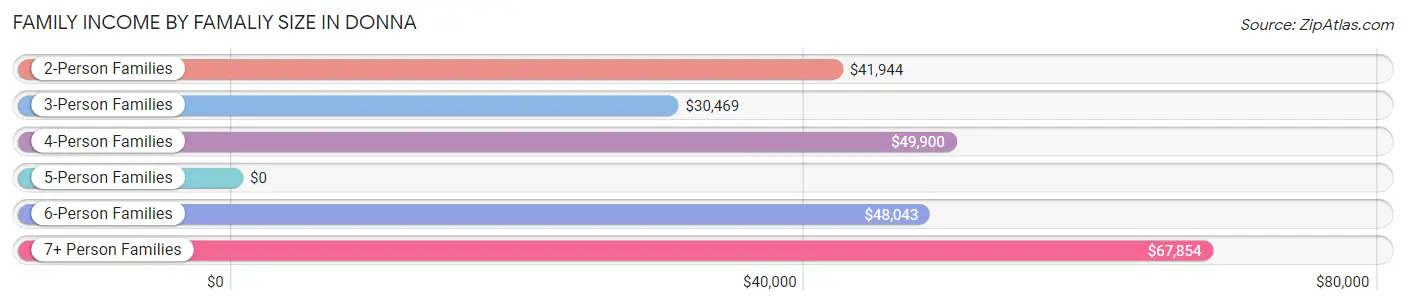
| Income Bracket | # Families | Median Income |
| 2-Person Families | 1,210 (32.9%) | $41,944 |
| 3-Person Families | 853 (23.2%) | $30,469 |
| 4-Person Families | 530 (14.4%) | $49,900 |
| 5-Person Families | 606 (16.5%) | $0 |
| 6-Person Families | 172 (4.7%) | $48,043 |
| 7+ Person Families | 307 (8.4%) | $67,854 |
| Total | 3,678 (100.0%) | $45,417 |
Family Income by Number of Earners in Donna
The median family income in Donna is $45,417, with families comprising 3+ earners (686) having the highest median family income of $101,111, while families with no earners (881) have the lowest median family income of $17,372, accounting for 18.6% and 23.9% of families, respectively.
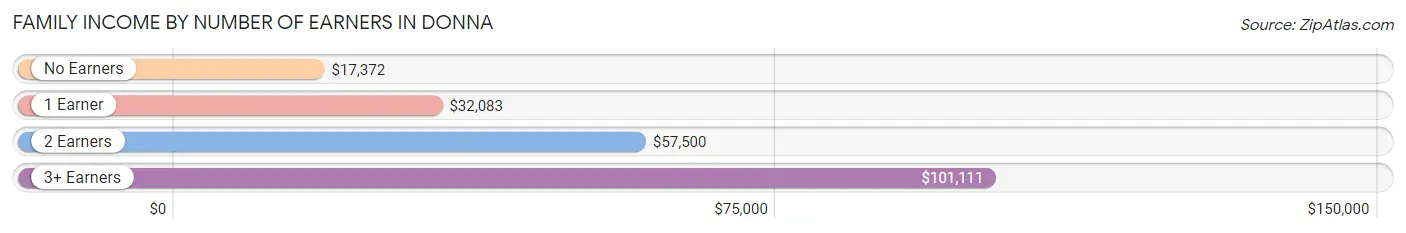
| Number of Earners | # Families | Median Income |
| No Earners | 881 (23.9%) | $17,372 |
| 1 Earner | 1,169 (31.8%) | $32,083 |
| 2 Earners | 942 (25.6%) | $57,500 |
| 3+ Earners | 686 (18.6%) | $101,111 |
| Total | 3,678 (100.0%) | $45,417 |
Household Income in Donna
Household Income Brackets in Donna
With 802 households falling in the category, the less than $10,000 income range is the most frequent in Donna, accounting for 15.5% of all households. In contrast, only 62 households (1.2%) fall into the $150,000 to $199,999 income bracket, making it the least populous group.
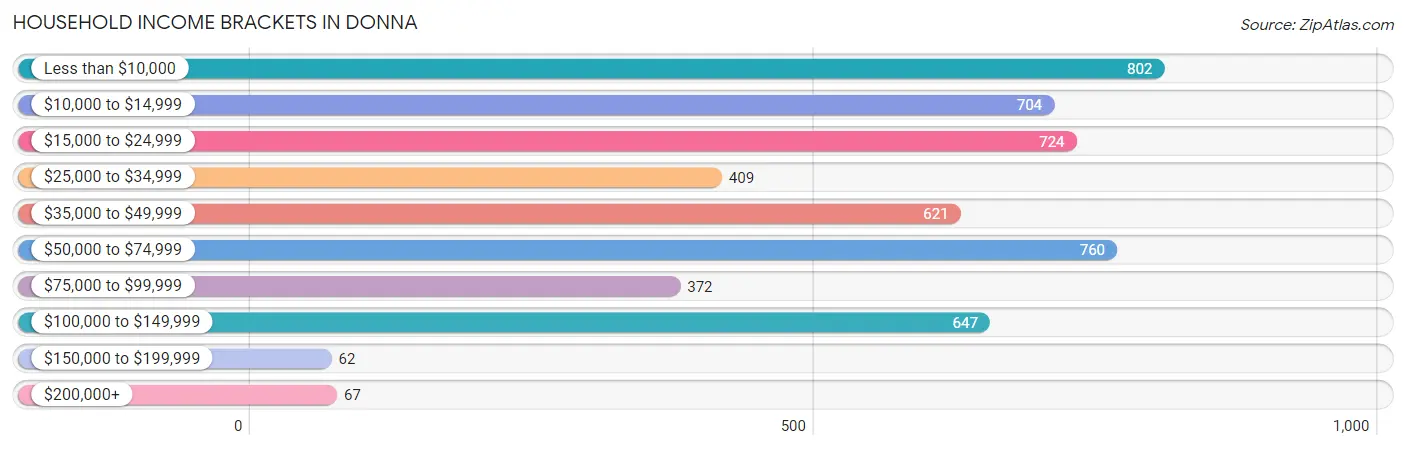
| Income Bracket | # Households | % Households |
| Less than $10,000 | 802 | 15.5% |
| $10,000 to $14,999 | 704 | 13.6% |
| $15,000 to $24,999 | 724 | 14.0% |
| $25,000 to $34,999 | 409 | 7.9% |
| $35,000 to $49,999 | 621 | 12.0% |
| $50,000 to $74,999 | 760 | 14.7% |
| $75,000 to $99,999 | 372 | 7.2% |
| $100,000 to $149,999 | 647 | 12.5% |
| $150,000 to $199,999 | 62 | 1.2% |
| $200,000+ | 67 | 1.3% |
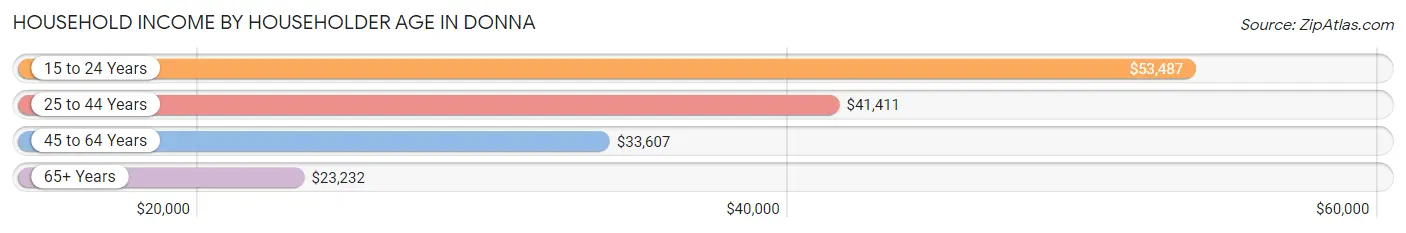
Household Income by Householder Age in Donna
The median household income in Donna is $34,049, with the highest median household income of $53,487 found in the 15 to 24 years age bracket for the primary householder. A total of 73 households (1.4%) fall into this category. Meanwhile, the 65+ years age bracket for the primary householder has the lowest median household income of $23,232, with 1,788 households (34.6%) in this group.
| Income Bracket | # Households | Median Income |
| 15 to 24 Years | 73 (1.4%) | $53,487 |
| 25 to 44 Years | 1,462 (28.3%) | $41,411 |
| 45 to 64 Years | 1,850 (35.8%) | $33,607 |
| 65+ Years | 1,788 (34.6%) | $23,232 |
| Total | 5,173 (100.0%) | $34,049 |
Poverty in Donna
Income Below Poverty by Sex and Age in Donna
With 35.1% poverty level for males and 40.6% for females among the residents of Donna, 12 to 14 year old males and 12 to 14 year old females are the most vulnerable to poverty, with 515 males (75.7%) and 384 females (67.1%) in their respective age groups living below the poverty level.
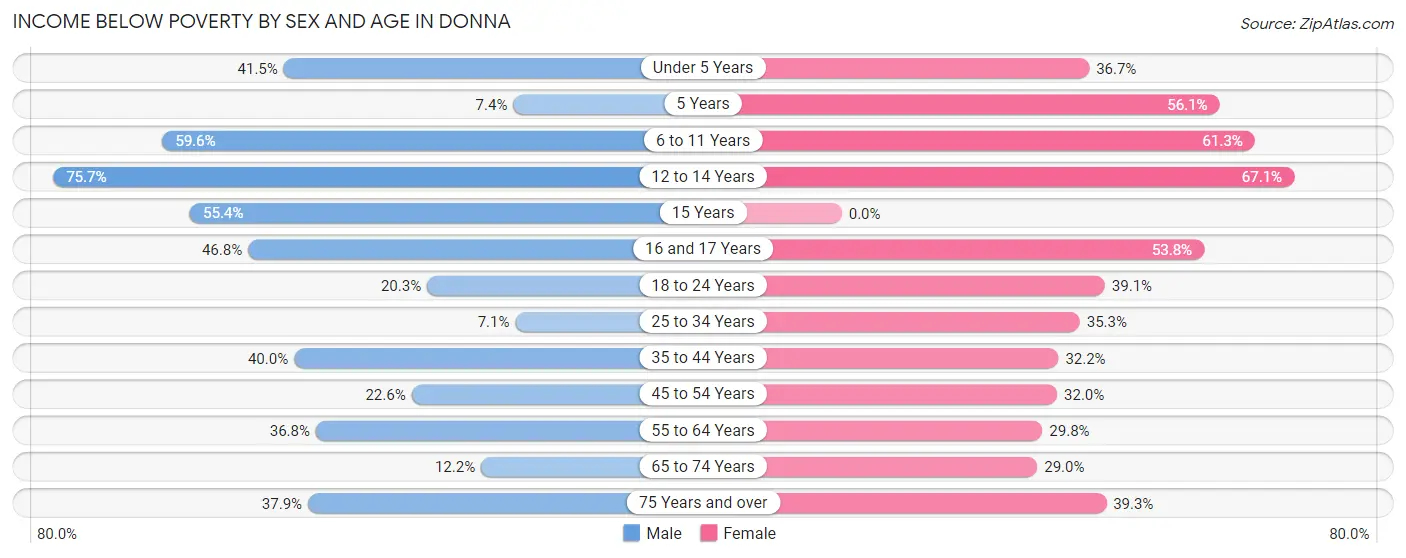
| Age Bracket | Male | Female |
| Under 5 Years | 243 (41.5%) | 284 (36.7%) |
| 5 Years | 9 (7.4%) | 97 (56.1%) |
| 6 to 11 Years | 555 (59.6%) | 659 (61.3%) |
| 12 to 14 Years | 515 (75.7%) | 384 (67.1%) |
| 15 Years | 46 (55.4%) | 0 (0.0%) |
| 16 and 17 Years | 96 (46.8%) | 271 (53.8%) |
| 18 to 24 Years | 164 (20.3%) | 302 (39.1%) |
| 25 to 34 Years | 55 (7.1%) | 329 (35.3%) |
| 35 to 44 Years | 346 (40.0%) | 276 (32.2%) |
| 45 to 54 Years | 212 (22.6%) | 243 (32.0%) |
| 55 to 64 Years | 218 (36.8%) | 294 (29.8%) |
| 65 to 74 Years | 86 (12.2%) | 216 (29.0%) |
| 75 Years and over | 198 (37.9%) | 267 (39.3%) |
| Total | 2,743 (35.1%) | 3,622 (40.6%) |
Income Above Poverty by Sex and Age in Donna
According to the poverty statistics in Donna, males aged 25 to 34 years and females aged 15 years are the age groups that are most secure financially, with 92.9% of males and 100.0% of females in these age groups living above the poverty line.
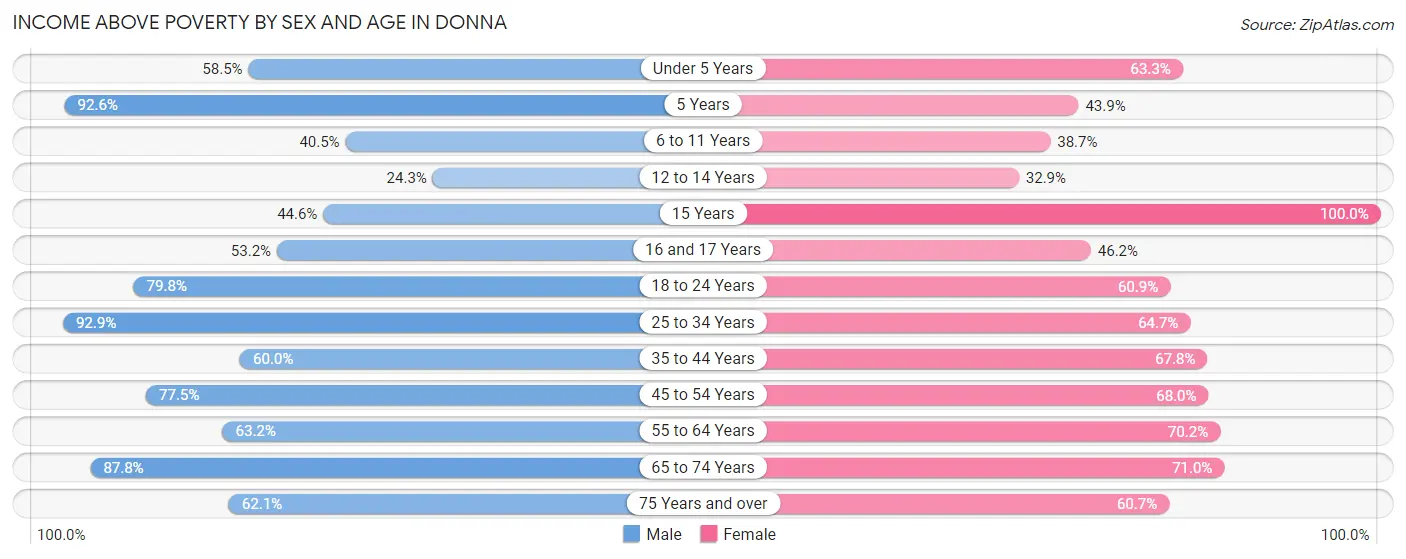
| Age Bracket | Male | Female |
| Under 5 Years | 342 (58.5%) | 489 (63.3%) |
| 5 Years | 112 (92.6%) | 76 (43.9%) |
| 6 to 11 Years | 377 (40.5%) | 416 (38.7%) |
| 12 to 14 Years | 165 (24.3%) | 188 (32.9%) |
| 15 Years | 37 (44.6%) | 95 (100.0%) |
| 16 and 17 Years | 109 (53.2%) | 233 (46.2%) |
| 18 to 24 Years | 646 (79.7%) | 471 (60.9%) |
| 25 to 34 Years | 716 (92.9%) | 602 (64.7%) |
| 35 to 44 Years | 519 (60.0%) | 582 (67.8%) |
| 45 to 54 Years | 728 (77.4%) | 517 (68.0%) |
| 55 to 64 Years | 375 (63.2%) | 693 (70.2%) |
| 65 to 74 Years | 617 (87.8%) | 528 (71.0%) |
| 75 Years and over | 324 (62.1%) | 413 (60.7%) |
| Total | 5,067 (64.9%) | 5,303 (59.4%) |
Income Below Poverty Among Married-Couple Families in Donna
The poverty statistics for married-couple families in Donna show that 18.4% or 413 of the total 2,241 families live below the poverty line. Families with 5 or more children have the highest poverty rate of 59.0%, comprising of 56 families. On the other hand, families with no children have the lowest poverty rate of 14.1%, which includes 171 families.
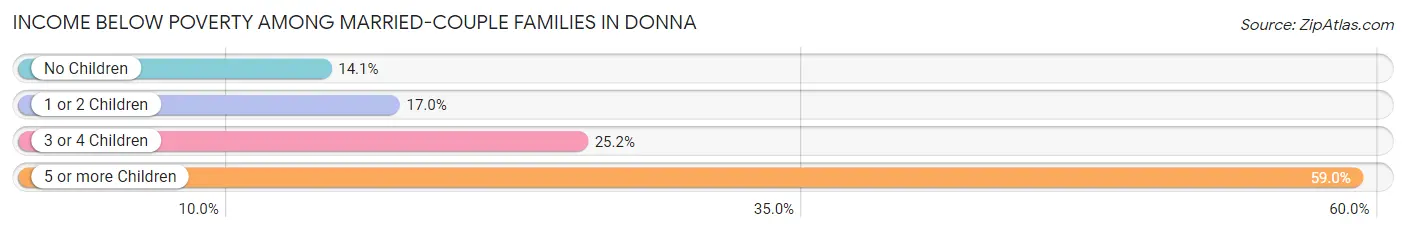
| Children | Above Poverty | Below Poverty |
| No Children | 1,045 (85.9%) | 171 (14.1%) |
| 1 or 2 Children | 492 (83.0%) | 101 (17.0%) |
| 3 or 4 Children | 252 (74.8%) | 85 (25.2%) |
| 5 or more Children | 39 (41.0%) | 56 (59.0%) |
| Total | 1,828 (81.6%) | 413 (18.4%) |
Income Below Poverty Among Single-Parent Households in Donna
According to the poverty data in Donna, 37.7% or 90 single-father households and 60.4% or 723 single-mother households are living below the poverty line. Among single-father households, those with 1 or 2 children have the highest poverty rate, with 49 households (41.2%) experiencing poverty. Likewise, among single-mother households, those with 5 or more children have the highest poverty rate, with 24 households (100.0%) falling below the poverty line.
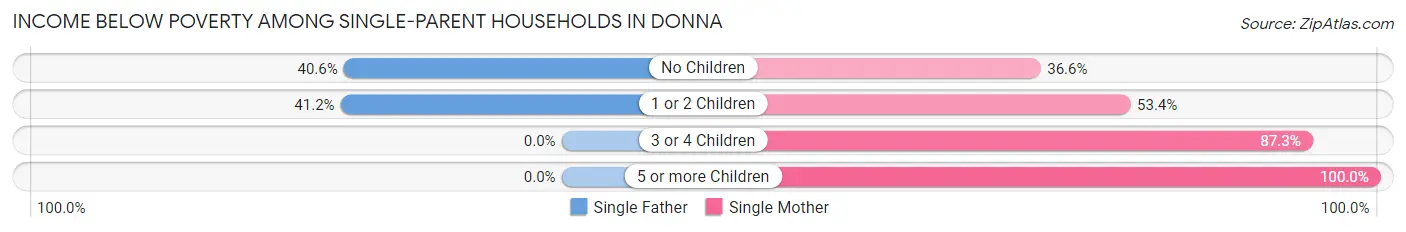
| Children | Single Father | Single Mother |
| No Children | 41 (40.6%) | 111 (36.6%) |
| 1 or 2 Children | 49 (41.2%) | 271 (53.3%) |
| 3 or 4 Children | 0 (0.0%) | 317 (87.3%) |
| 5 or more Children | 0 (0.0%) | 24 (100.0%) |
| Total | 90 (37.7%) | 723 (60.4%) |
Income Below Poverty Among Married-Couple vs Single-Parent Households in Donna
The poverty data for Donna shows that 413 of the married-couple family households (18.4%) and 813 of the single-parent households (56.6%) are living below the poverty level. Within the married-couple family households, those with 5 or more children have the highest poverty rate, with 56 households (59.0%) falling below the poverty line. Among the single-parent households, those with 5 or more children have the highest poverty rate, with 24 household (100.0%) living below poverty.
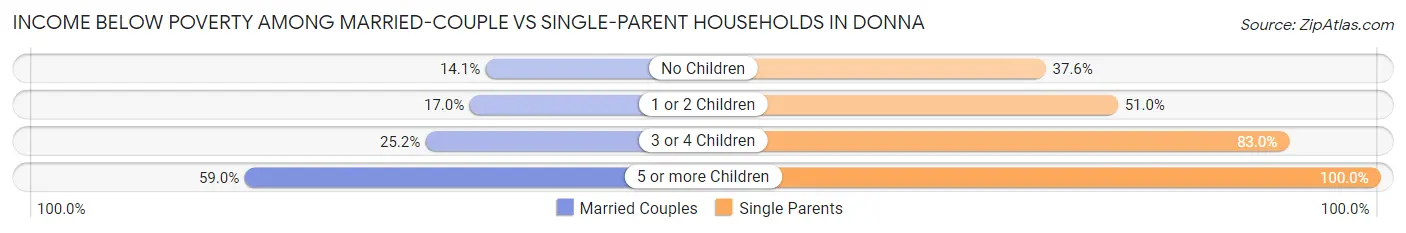
| Children | Married-Couple Families | Single-Parent Households |
| No Children | 171 (14.1%) | 152 (37.6%) |
| 1 or 2 Children | 101 (17.0%) | 320 (51.0%) |
| 3 or 4 Children | 85 (25.2%) | 317 (83.0%) |
| 5 or more Children | 56 (59.0%) | 24 (100.0%) |
| Total | 413 (18.4%) | 813 (56.6%) |
Race in Donna
The most populous races in Donna are Hispanic or Latino (15,633 | 93.4%), White / Caucasian (10,027 | 59.9%), and Two or more Races (4,802 | 28.7%).
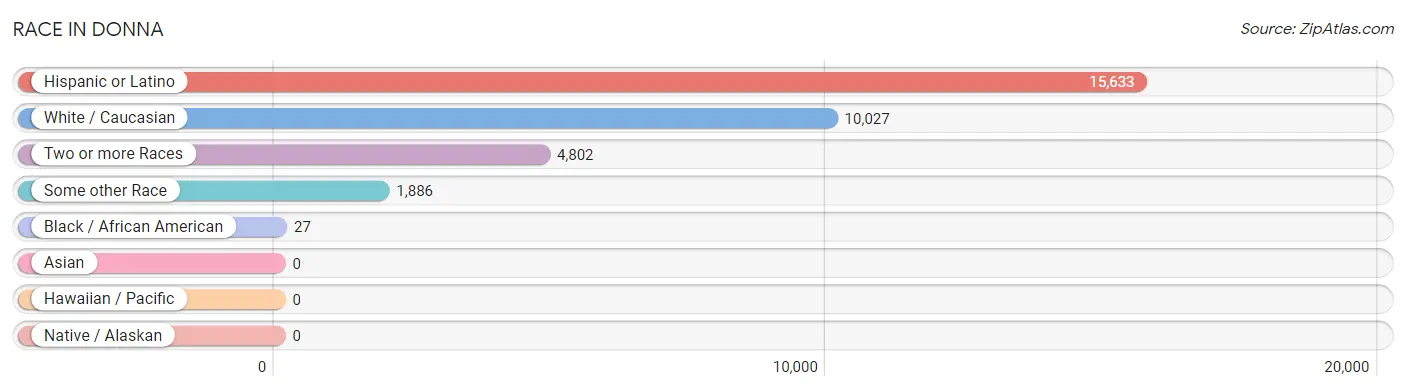
| Race | # Population | % Population |
| Asian | 0 | 0.0% |
| Black / African American | 27 | 0.2% |
| Hawaiian / Pacific | 0 | 0.0% |
| Hispanic or Latino | 15,633 | 93.4% |
| Native / Alaskan | 0 | 0.0% |
| White / Caucasian | 10,027 | 59.9% |
| Two or more Races | 4,802 | 28.7% |
| Some other Race | 1,886 | 11.3% |
| Total | 16,742 | 100.0% |
Ancestry in Donna
The most populous ancestries reported in Donna are Mexican (14,786 | 88.3%), American (670 | 4.0%), German (266 | 1.6%), English (214 | 1.3%), and Irish (150 | 0.9%), together accounting for 96.1% of all Donna residents.
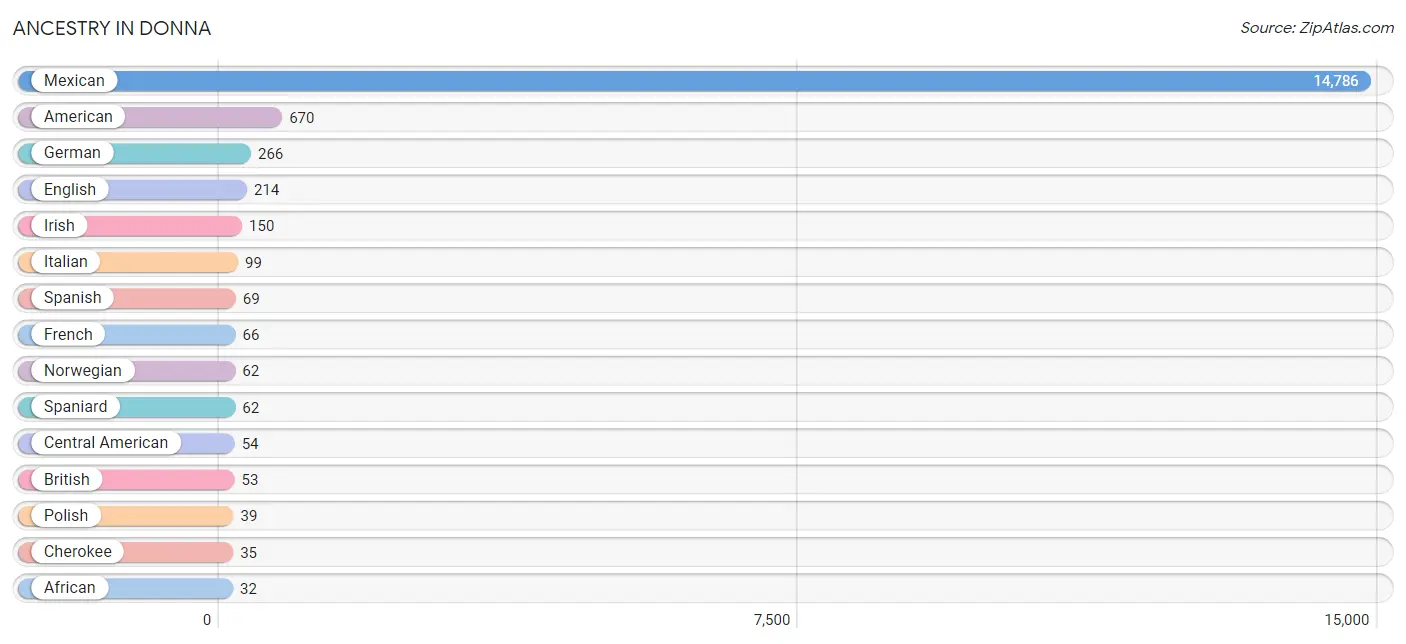
| Ancestry | # Population | % Population |
| African | 32 | 0.2% |
| American | 670 | 4.0% |
| Arab | 6 | 0.0% |
| Austrian | 7 | 0.0% |
| British | 53 | 0.3% |
| Canadian | 8 | 0.1% |
| Central American | 54 | 0.3% |
| Cherokee | 35 | 0.2% |
| Cuban | 1 | 0.0% |
| Czech | 17 | 0.1% |
| Danish | 26 | 0.2% |
| Egyptian | 1 | 0.0% |
| English | 214 | 1.3% |
| French | 66 | 0.4% |
| French Canadian | 12 | 0.1% |
| German | 266 | 1.6% |
| Guatemalan | 23 | 0.1% |
| Irish | 150 | 0.9% |
| Italian | 99 | 0.6% |
| Mexican | 14,786 | 88.3% |
| Norwegian | 62 | 0.4% |
| Polish | 39 | 0.2% |
| Puerto Rican | 10 | 0.1% |
| Salvadoran | 31 | 0.2% |
| Scottish | 13 | 0.1% |
| Serbian | 11 | 0.1% |
| Spaniard | 62 | 0.4% |
| Spanish | 69 | 0.4% |
| Subsaharan African | 32 | 0.2% |
| Swedish | 7 | 0.0% | View All 30 Rows |
Immigrants in Donna
The most numerous immigrant groups reported in Donna came from Central America (2,914 | 17.4%), Latin America (2,914 | 17.4%), Mexico (2,859 | 17.1%), El Salvador (31 | 0.2%), and Guatemala (23 | 0.1%), together accounting for 52.2% of all Donna residents.
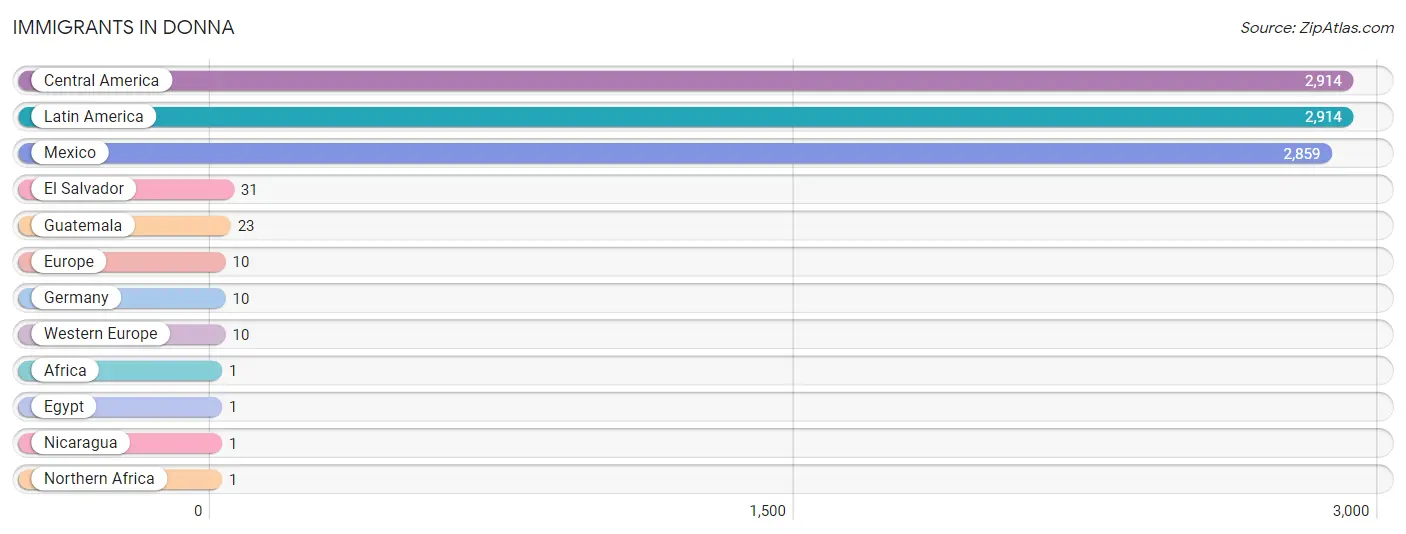
| Immigration Origin | # Population | % Population |
| Africa | 1 | 0.0% |
| Central America | 2,914 | 17.4% |
| Egypt | 1 | 0.0% |
| El Salvador | 31 | 0.2% |
| Europe | 10 | 0.1% |
| Germany | 10 | 0.1% |
| Guatemala | 23 | 0.1% |
| Latin America | 2,914 | 17.4% |
| Mexico | 2,859 | 17.1% |
| Nicaragua | 1 | 0.0% |
| Northern Africa | 1 | 0.0% |
| Western Europe | 10 | 0.1% | View All 12 Rows |
Sex and Age in Donna
Sex and Age in Donna
The most populous age groups in Donna are 10 to 14 Years (1,105 | 14.1%) for men and 10 to 14 Years (935 | 10.5%) for women.
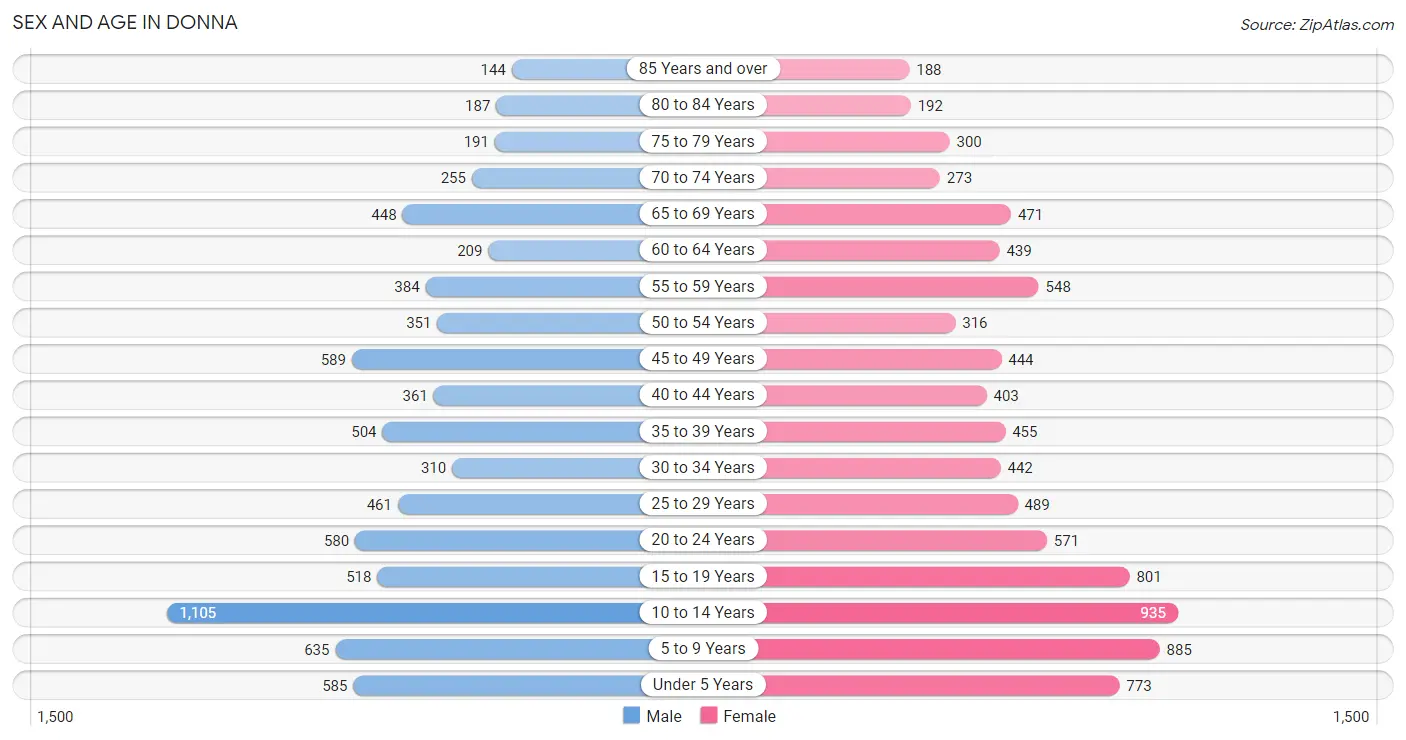
| Age Bracket | Male | Female |
| Under 5 Years | 585 (7.5%) | 773 (8.7%) |
| 5 to 9 Years | 635 (8.1%) | 885 (9.9%) |
| 10 to 14 Years | 1,105 (14.1%) | 935 (10.5%) |
| 15 to 19 Years | 518 (6.6%) | 801 (9.0%) |
| 20 to 24 Years | 580 (7.4%) | 571 (6.4%) |
| 25 to 29 Years | 461 (5.9%) | 489 (5.5%) |
| 30 to 34 Years | 310 (4.0%) | 442 (5.0%) |
| 35 to 39 Years | 504 (6.5%) | 455 (5.1%) |
| 40 to 44 Years | 361 (4.6%) | 403 (4.5%) |
| 45 to 49 Years | 589 (7.5%) | 444 (5.0%) |
| 50 to 54 Years | 351 (4.5%) | 316 (3.5%) |
| 55 to 59 Years | 384 (4.9%) | 548 (6.1%) |
| 60 to 64 Years | 209 (2.7%) | 439 (4.9%) |
| 65 to 69 Years | 448 (5.7%) | 471 (5.3%) |
| 70 to 74 Years | 255 (3.3%) | 273 (3.1%) |
| 75 to 79 Years | 191 (2.4%) | 300 (3.4%) |
| 80 to 84 Years | 187 (2.4%) | 192 (2.1%) |
| 85 Years and over | 144 (1.8%) | 188 (2.1%) |
| Total | 7,817 (100.0%) | 8,925 (100.0%) |
Families and Households in Donna
Median Family Size in Donna
The median family size in Donna is 4.07 persons per family, with married-couple families (2,241 | 60.9%) accounting for the largest median family size of 4.16 persons per family. On the other hand, single male/father families (239 | 6.5%) represent the smallest median family size with 3.33 persons per family.
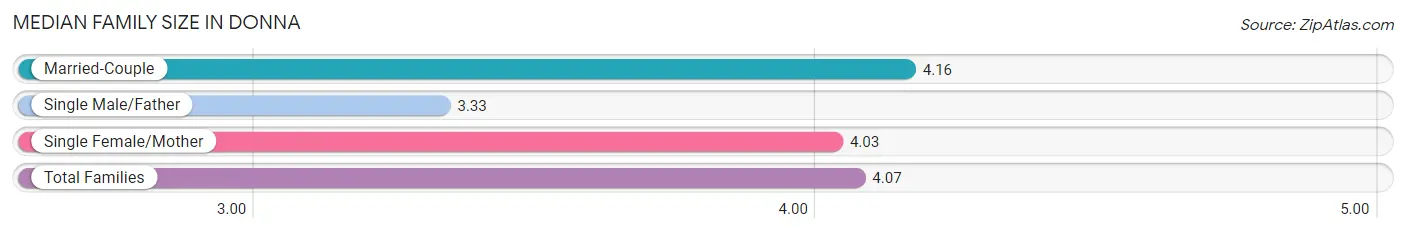
| Family Type | # Families | Family Size |
| Married-Couple | 2,241 (60.9%) | 4.16 |
| Single Male/Father | 239 (6.5%) | 3.33 |
| Single Female/Mother | 1,198 (32.6%) | 4.03 |
| Total Families | 3,678 (100.0%) | 4.07 |
Median Household Size in Donna
The median household size in Donna is 3.24 persons per household, with married-couple households (2,241 | 43.3%) accounting for the largest median household size of 4.17 persons per household. non-family households (1,495 | 28.9%) represent the smallest median household size with 1.06 persons per household.
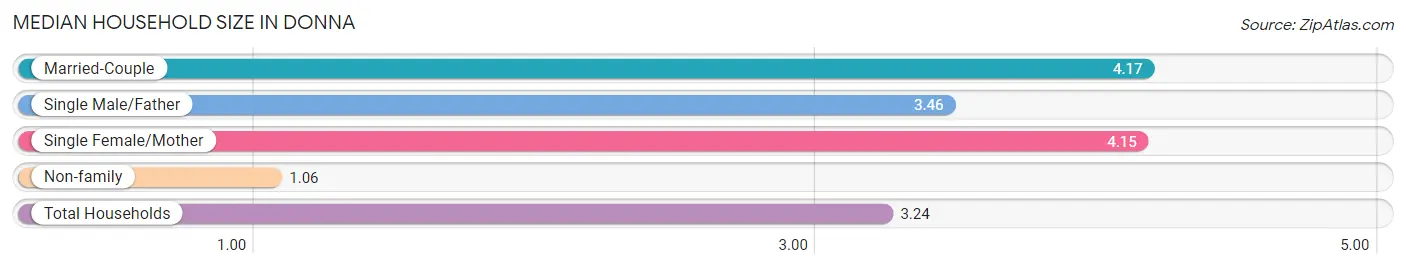
| Household Type | # Households | Household Size |
| Married-Couple | 2,241 (43.3%) | 4.17 |
| Single Male/Father | 239 (4.6%) | 3.46 |
| Single Female/Mother | 1,198 (23.2%) | 4.15 |
| Non-family | 1,495 (28.9%) | 1.06 |
| Total Households | 5,173 (100.0%) | 3.24 |
Household Size by Marriage Status in Donna
Out of a total of 5,173 households in Donna, 3,678 (71.1%) are family households, while 1,495 (28.9%) are nonfamily households. The most numerous type of family households are 2-person households, comprising 1,201, and the most common type of nonfamily households are 1-person households, comprising 1,411.
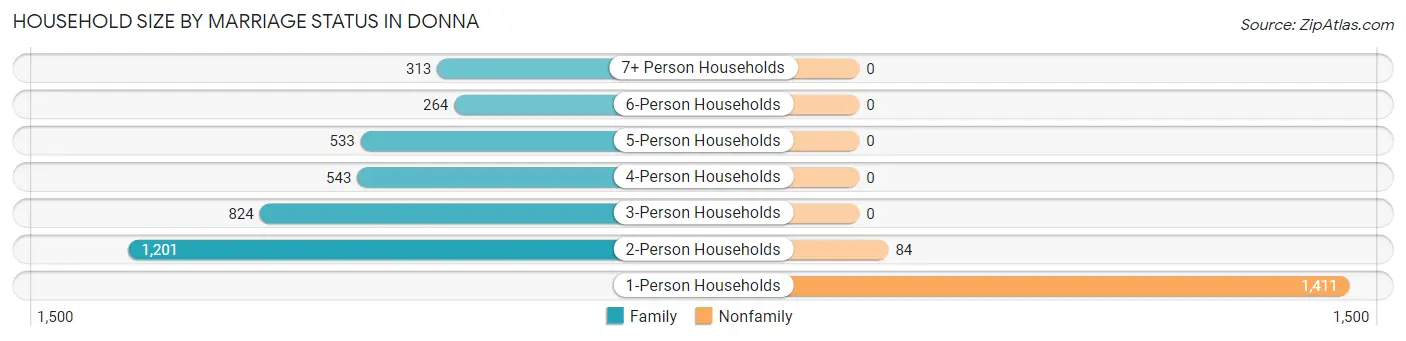
| Household Size | Family Households | Nonfamily Households |
| 1-Person Households | - | 1,411 (27.3%) |
| 2-Person Households | 1,201 (23.2%) | 84 (1.6%) |
| 3-Person Households | 824 (15.9%) | 0 (0.0%) |
| 4-Person Households | 543 (10.5%) | 0 (0.0%) |
| 5-Person Households | 533 (10.3%) | 0 (0.0%) |
| 6-Person Households | 264 (5.1%) | 0 (0.0%) |
| 7+ Person Households | 313 (6.0%) | 0 (0.0%) |
| Total | 3,678 (71.1%) | 1,495 (28.9%) |
Female Fertility in Donna
Fertility by Age in Donna
Average fertility rate in Donna is 74.0 births per 1,000 women. Women in the age bracket of 20 to 34 years have the highest fertility rate with 142.0 births per 1,000 women. Women in the age bracket of 20 to 34 years acount for 79.2% of all women with births.
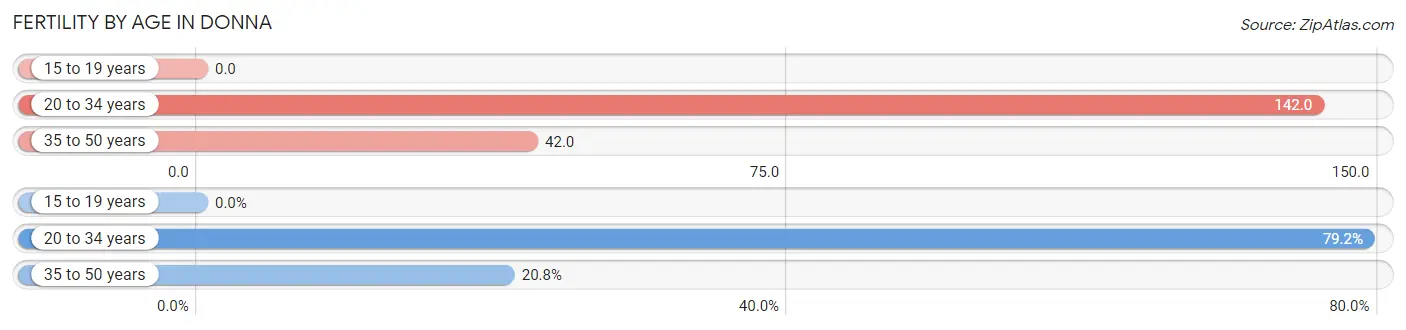
| Age Bracket | Women with Births | Births / 1,000 Women |
| 15 to 19 years | 0 (0.0%) | 0.0 |
| 20 to 34 years | 213 (79.2%) | 142.0 |
| 35 to 50 years | 56 (20.8%) | 42.0 |
| Total | 269 (100.0%) | 74.0 |
Fertility by Age by Marriage Status in Donna
81.0% of women with births (269) in Donna are married. The highest percentage of unmarried women with births falls into 20 to 34 years age bracket with 23.9% of them unmarried at the time of birth, while the lowest percentage of unmarried women with births belong to 35 to 50 years age bracket with 0.0% of them unmarried.
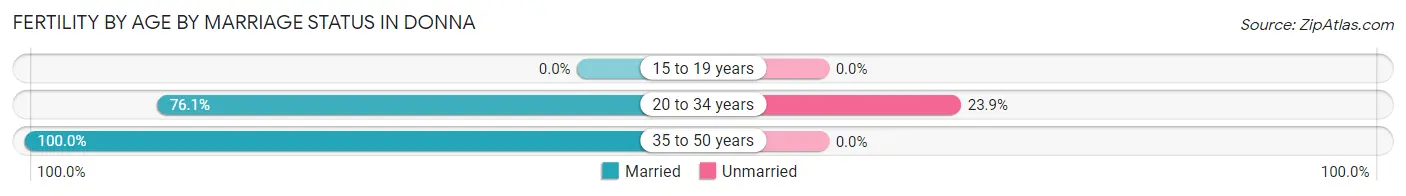
| Age Bracket | Married | Unmarried |
| 15 to 19 years | 0 (0.0%) | 0 (0.0%) |
| 20 to 34 years | 162 (76.1%) | 51 (23.9%) |
| 35 to 50 years | 56 (100.0%) | 0 (0.0%) |
| Total | 218 (81.0%) | 51 (19.0%) |
Fertility by Education in Donna
Average fertility rate in Donna is 74.0 births per 1,000 women. Women with the education attainment of bachelor's degree have the highest fertility rate of 205.0 births per 1,000 women, while women with the education attainment of less than high school have the lowest fertility at 36.0 births per 1,000 women. Women with the education attainment of bachelor's degree represent 30.9% of all women with births.
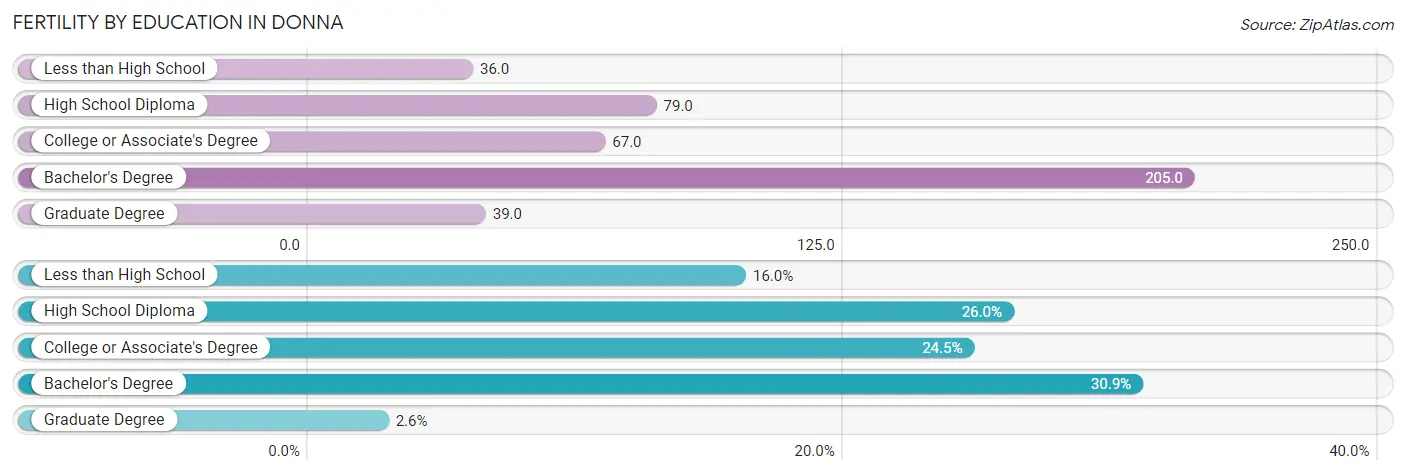
| Educational Attainment | Women with Births | Births / 1,000 Women |
| Less than High School | 43 (16.0%) | 36.0 |
| High School Diploma | 70 (26.0%) | 79.0 |
| College or Associate's Degree | 66 (24.5%) | 67.0 |
| Bachelor's Degree | 83 (30.9%) | 205.0 |
| Graduate Degree | 7 (2.6%) | 39.0 |
| Total | 269 (100.0%) | 74.0 |
Fertility by Education by Marriage Status in Donna
19.0% of women with births in Donna are unmarried. Women with the educational attainment of college or associate's degree are most likely to be married with 100.0% of them married at childbirth, while women with the educational attainment of high school diploma are least likely to be married with 51.4% of them unmarried at childbirth.
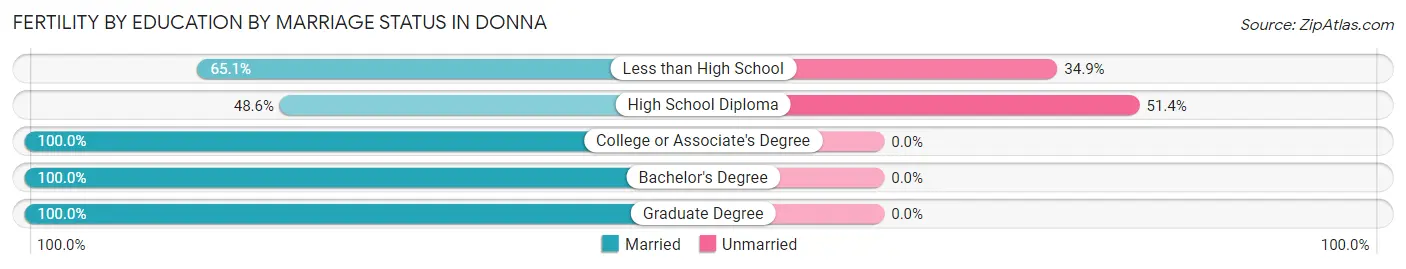
| Educational Attainment | Married | Unmarried |
| Less than High School | 28 (65.1%) | 15 (34.9%) |
| High School Diploma | 34 (48.6%) | 36 (51.4%) |
| College or Associate's Degree | 66 (100.0%) | 0 (0.0%) |
| Bachelor's Degree | 83 (100.0%) | 0 (0.0%) |
| Graduate Degree | 7 (100.0%) | 0 (0.0%) |
| Total | 218 (81.0%) | 51 (19.0%) |
Employment Characteristics in Donna
Employment by Class of Employer in Donna
Among the 5,470 employed individuals in Donna, private company employees (3,583 | 65.5%), self-employed (not incorporated) (638 | 11.7%), and local government employees (557 | 10.2%) make up the most common classes of employment.
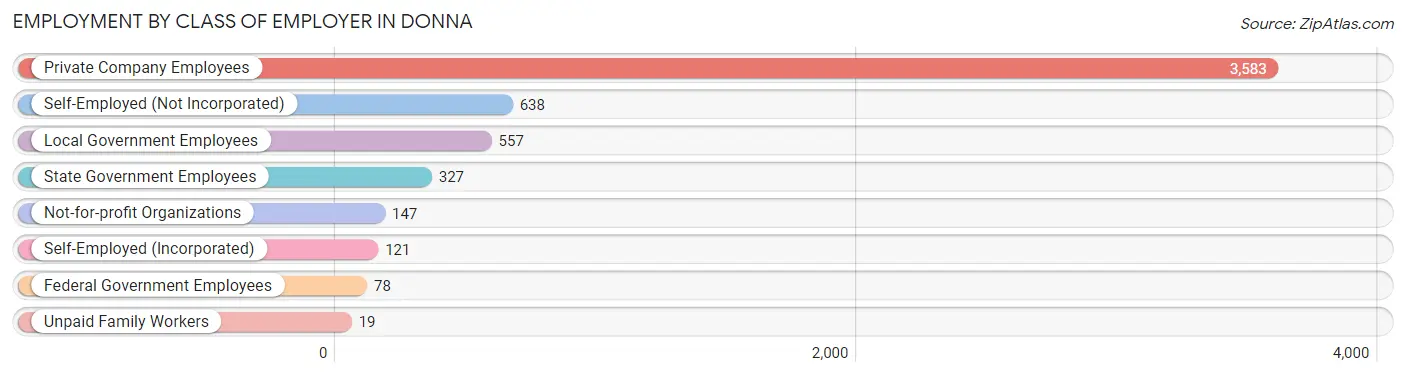
| Employer Class | # Employees | % Employees |
| Private Company Employees | 3,583 | 65.5% |
| Self-Employed (Incorporated) | 121 | 2.2% |
| Self-Employed (Not Incorporated) | 638 | 11.7% |
| Not-for-profit Organizations | 147 | 2.7% |
| Local Government Employees | 557 | 10.2% |
| State Government Employees | 327 | 6.0% |
| Federal Government Employees | 78 | 1.4% |
| Unpaid Family Workers | 19 | 0.4% |
| Total | 5,470 | 100.0% |
Employment Status by Age in Donna
According to the labor force statistics for Donna, out of the total population over 16 years of age (11,646), 50.2% or 5,846 individuals are in the labor force, with 4.2% or 246 of them unemployed. The age group with the highest labor force participation rate is 25 to 29 years, with 80.8% or 768 individuals in the labor force. Within the labor force, the 75 years and over age range has the highest percentage of unemployed individuals, with 14.3% or 9 of them being unemployed.
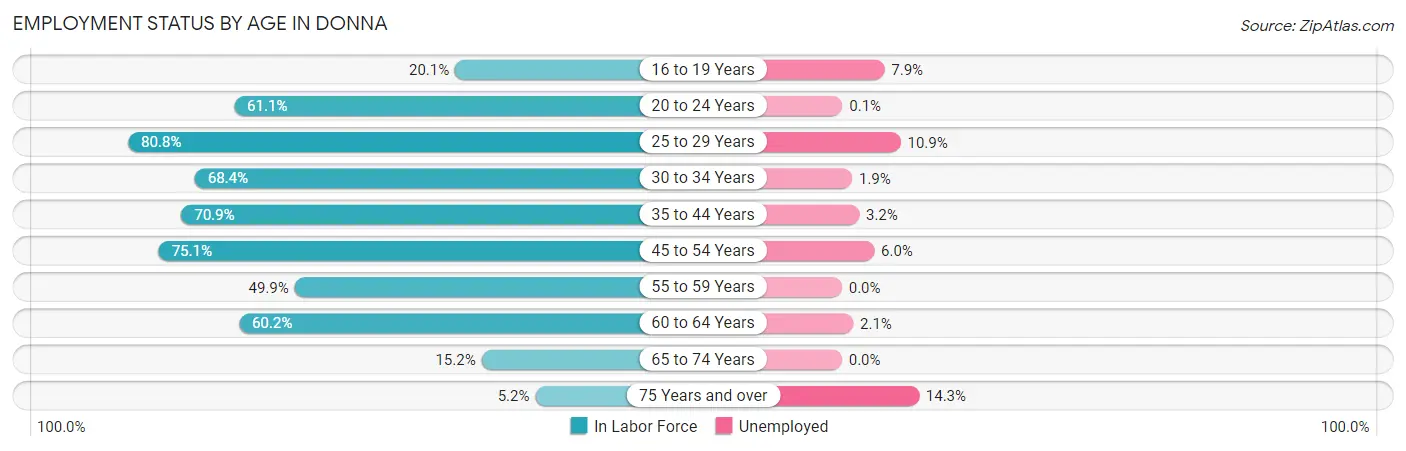
| Age Bracket | In Labor Force | Unemployed |
| 16 to 19 Years | 229 (20.1%) | 18 (7.9%) |
| 20 to 24 Years | 703 (61.1%) | 1 (0.1%) |
| 25 to 29 Years | 768 (80.8%) | 84 (10.9%) |
| 30 to 34 Years | 514 (68.4%) | 10 (1.9%) |
| 35 to 44 Years | 1,222 (70.9%) | 39 (3.2%) |
| 45 to 54 Years | 1,277 (75.1%) | 77 (6.0%) |
| 55 to 59 Years | 465 (49.9%) | 0 (0.0%) |
| 60 to 64 Years | 390 (60.2%) | 8 (2.1%) |
| 65 to 74 Years | 220 (15.2%) | 0 (0.0%) |
| 75 Years and over | 63 (5.2%) | 9 (14.3%) |
| Total | 5,846 (50.2%) | 246 (4.2%) |
Employment Status by Educational Attainment in Donna
According to labor force statistics for Donna, 69.1% of individuals (4,633) out of the total population between 25 and 64 years of age (6,705) are in the labor force, with 4.7% or 218 of them being unemployed. The group with the highest labor force participation rate are those with the educational attainment of bachelor's degree or higher, with 88.5% or 754 individuals in the labor force. Within the labor force, individuals with less than high school education have the highest percentage of unemployment, with 14.5% or 164 of them being unemployed.
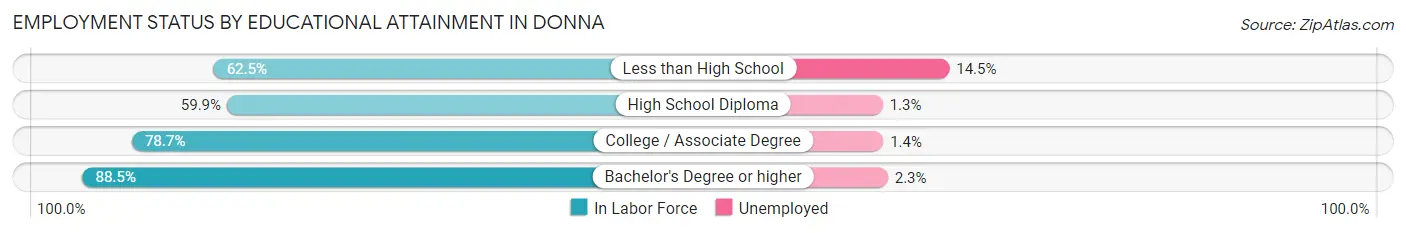
| Educational Attainment | In Labor Force | Unemployed |
| Less than High School | 1,129 (62.5%) | 262 (14.5%) |
| High School Diploma | 1,379 (59.9%) | 30 (1.3%) |
| College / Associate Degree | 1,373 (78.7%) | 24 (1.4%) |
| Bachelor's Degree or higher | 754 (88.5%) | 20 (2.3%) |
| Total | 4,633 (69.1%) | 315 (4.7%) |
Employment Occupations by Sex in Donna
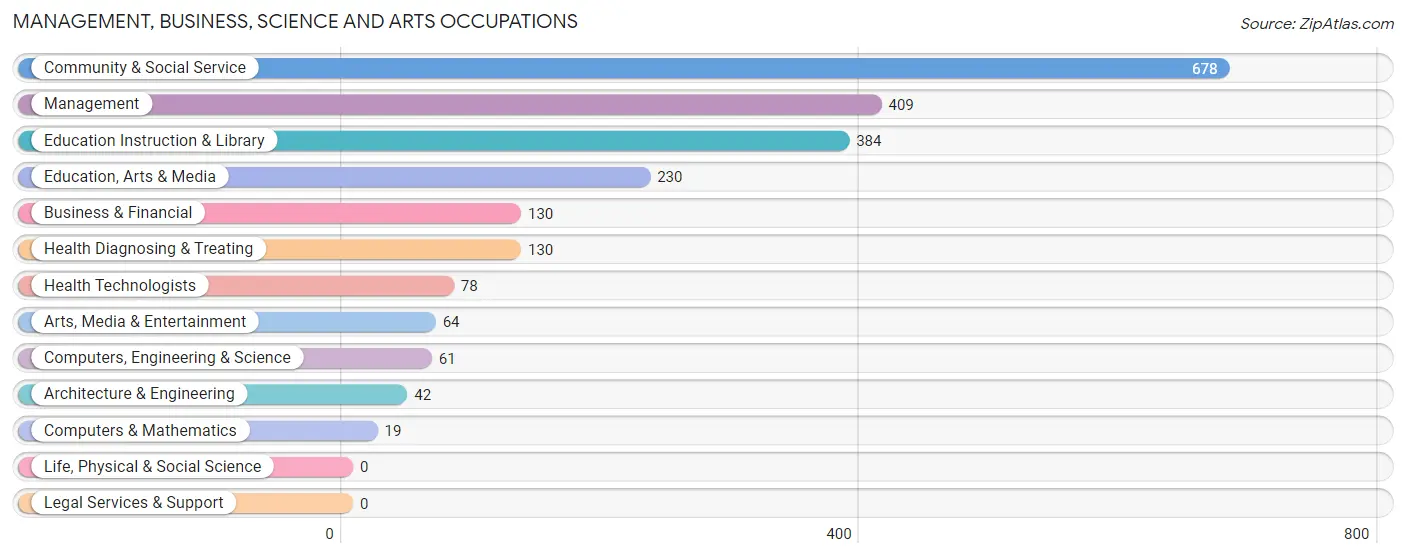
Management, Business, Science and Arts Occupations
The most common Management, Business, Science and Arts occupations in Donna are Community & Social Service (678 | 12.1%), Management (409 | 7.3%), Education Instruction & Library (384 | 6.9%), Education, Arts & Media (230 | 4.1%), and Business & Financial (130 | 2.3%).
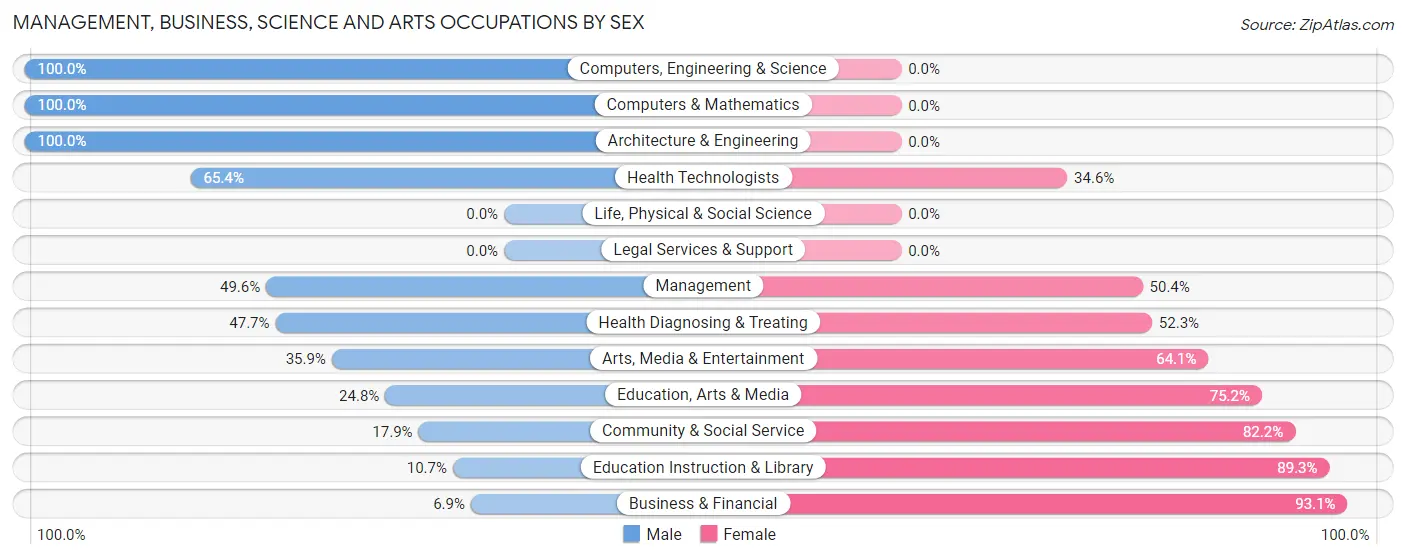
Management, Business, Science and Arts Occupations by Sex
Within the Management, Business, Science and Arts occupations in Donna, the most male-oriented occupations are Computers, Engineering & Science (100.0%), Computers & Mathematics (100.0%), and Architecture & Engineering (100.0%), while the most female-oriented occupations are Business & Financial (93.1%), Education Instruction & Library (89.3%), and Community & Social Service (82.2%).
| Occupation | Male | Female |
| Management | 203 (49.6%) | 206 (50.4%) |
| Business & Financial | 9 (6.9%) | 121 (93.1%) |
| Computers, Engineering & Science | 61 (100.0%) | 0 (0.0%) |
| Computers & Mathematics | 19 (100.0%) | 0 (0.0%) |
| Architecture & Engineering | 42 (100.0%) | 0 (0.0%) |
| Life, Physical & Social Science | 0 (0.0%) | 0 (0.0%) |
| Community & Social Service | 121 (17.8%) | 557 (82.2%) |
| Education, Arts & Media | 57 (24.8%) | 173 (75.2%) |
| Legal Services & Support | 0 (0.0%) | 0 (0.0%) |
| Education Instruction & Library | 41 (10.7%) | 343 (89.3%) |
| Arts, Media & Entertainment | 23 (35.9%) | 41 (64.1%) |
| Health Diagnosing & Treating | 62 (47.7%) | 68 (52.3%) |
| Health Technologists | 51 (65.4%) | 27 (34.6%) |
| Total (Category) | 456 (32.4%) | 952 (67.6%) |
| Total (Overall) | 2,861 (51.0%) | 2,744 (49.0%) |
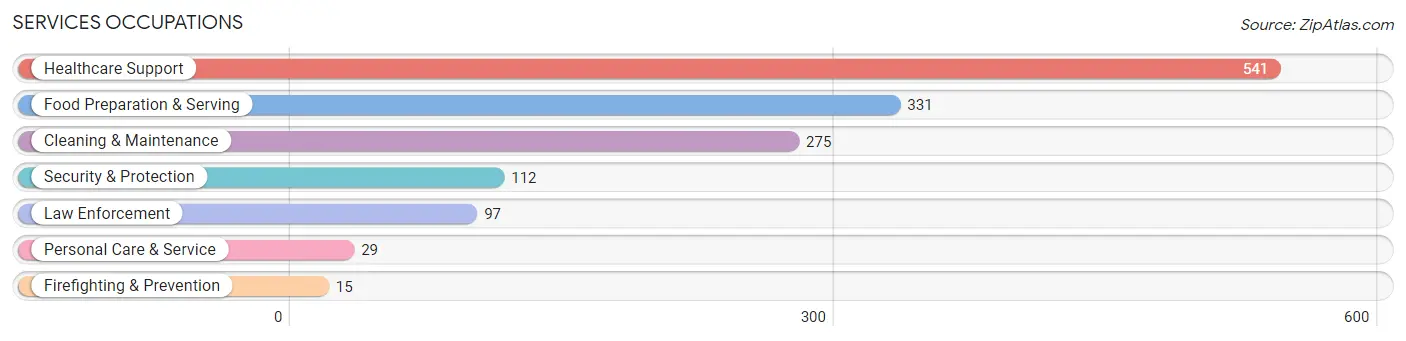
Services Occupations
The most common Services occupations in Donna are Healthcare Support (541 | 9.7%), Food Preparation & Serving (331 | 5.9%), Cleaning & Maintenance (275 | 4.9%), Security & Protection (112 | 2.0%), and Law Enforcement (97 | 1.7%).
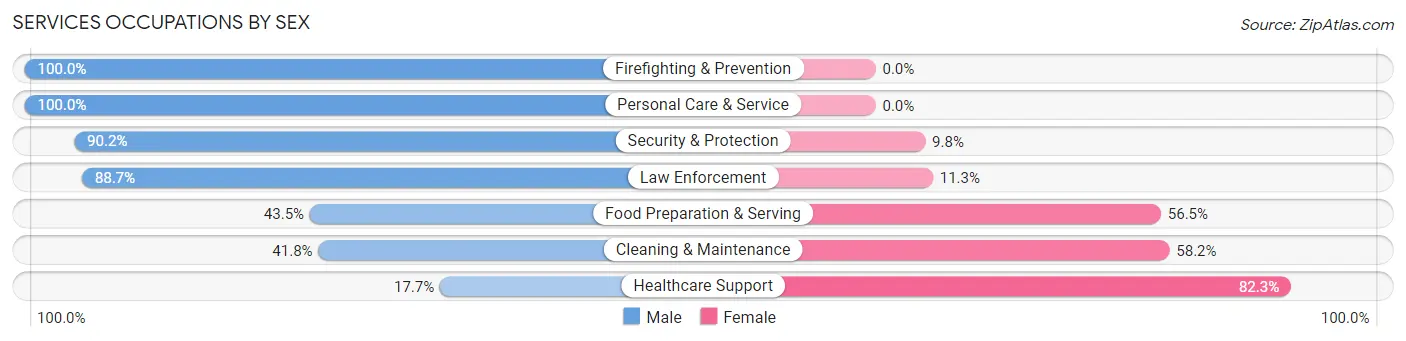
Services Occupations by Sex
Within the Services occupations in Donna, the most male-oriented occupations are Firefighting & Prevention (100.0%), Personal Care & Service (100.0%), and Security & Protection (90.2%), while the most female-oriented occupations are Healthcare Support (82.3%), Cleaning & Maintenance (58.2%), and Food Preparation & Serving (56.5%).
| Occupation | Male | Female |
| Healthcare Support | 96 (17.7%) | 445 (82.3%) |
| Security & Protection | 101 (90.2%) | 11 (9.8%) |
| Firefighting & Prevention | 15 (100.0%) | 0 (0.0%) |
| Law Enforcement | 86 (88.7%) | 11 (11.3%) |
| Food Preparation & Serving | 144 (43.5%) | 187 (56.5%) |
| Cleaning & Maintenance | 115 (41.8%) | 160 (58.2%) |
| Personal Care & Service | 29 (100.0%) | 0 (0.0%) |
| Total (Category) | 485 (37.7%) | 803 (62.3%) |
| Total (Overall) | 2,861 (51.0%) | 2,744 (49.0%) |
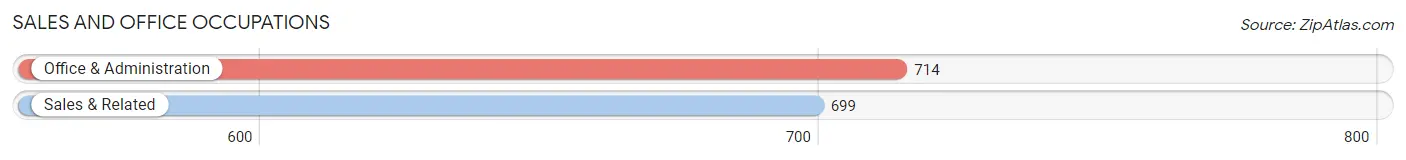
Sales and Office Occupations
The most common Sales and Office occupations in Donna are Office & Administration (714 | 12.7%), and Sales & Related (699 | 12.5%).
Sales and Office Occupations by Sex
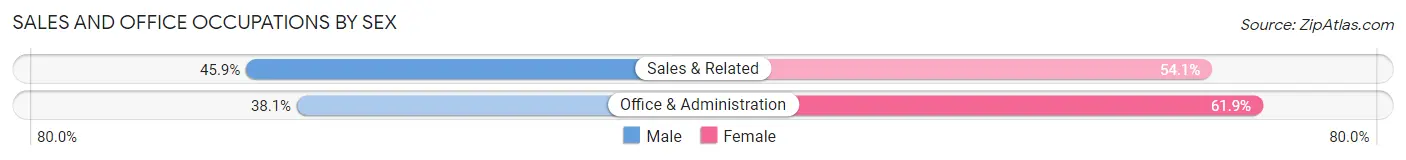
| Occupation | Male | Female |
| Sales & Related | 321 (45.9%) | 378 (54.1%) |
| Office & Administration | 272 (38.1%) | 442 (61.9%) |
| Total (Category) | 593 (42.0%) | 820 (58.0%) |
| Total (Overall) | 2,861 (51.0%) | 2,744 (49.0%) |
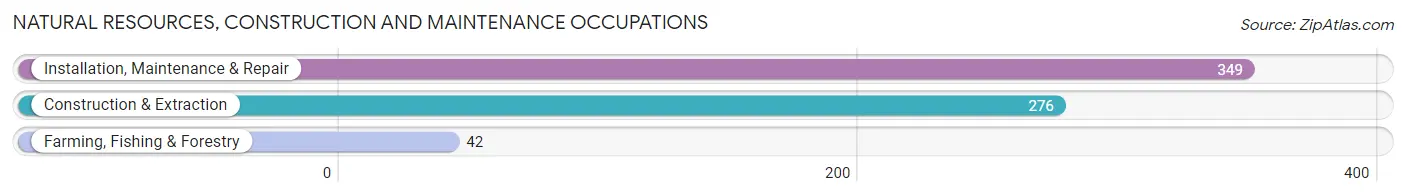
Natural Resources, Construction and Maintenance Occupations
The most common Natural Resources, Construction and Maintenance occupations in Donna are Installation, Maintenance & Repair (349 | 6.2%), Construction & Extraction (276 | 4.9%), and Farming, Fishing & Forestry (42 | 0.7%).
Natural Resources, Construction and Maintenance Occupations by Sex
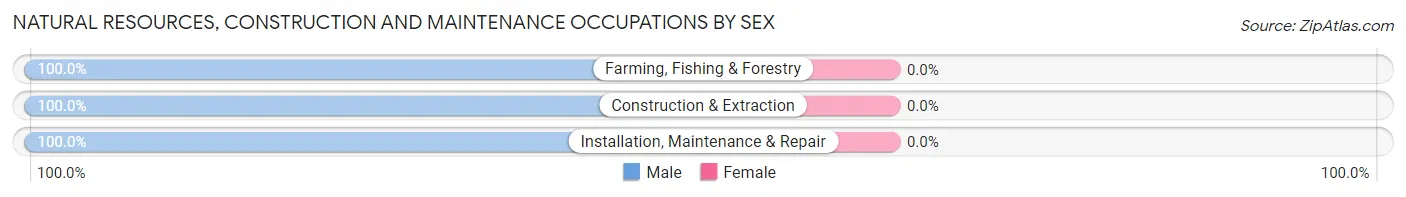
| Occupation | Male | Female |
| Farming, Fishing & Forestry | 42 (100.0%) | 0 (0.0%) |
| Construction & Extraction | 276 (100.0%) | 0 (0.0%) |
| Installation, Maintenance & Repair | 349 (100.0%) | 0 (0.0%) |
| Total (Category) | 667 (100.0%) | 0 (0.0%) |
| Total (Overall) | 2,861 (51.0%) | 2,744 (49.0%) |
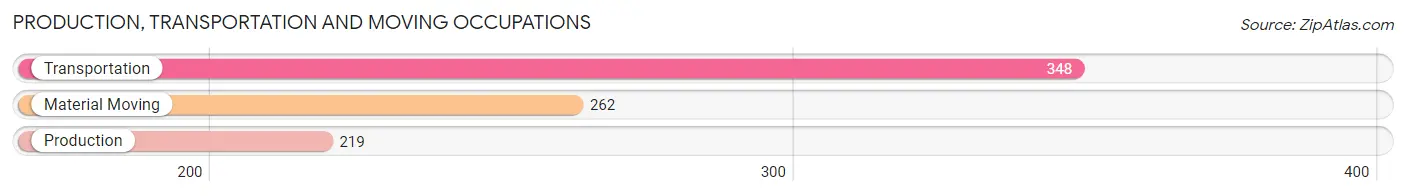
Production, Transportation and Moving Occupations
The most common Production, Transportation and Moving occupations in Donna are Transportation (348 | 6.2%), Material Moving (262 | 4.7%), and Production (219 | 3.9%).
Production, Transportation and Moving Occupations by Sex
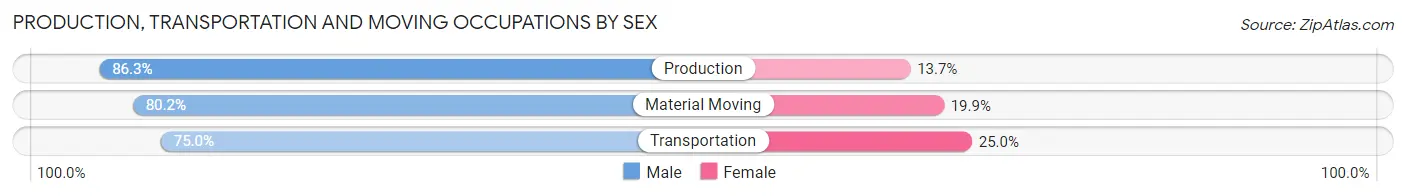
| Occupation | Male | Female |
| Production | 189 (86.3%) | 30 (13.7%) |
| Transportation | 261 (75.0%) | 87 (25.0%) |
| Material Moving | 210 (80.1%) | 52 (19.9%) |
| Total (Category) | 660 (79.6%) | 169 (20.4%) |
| Total (Overall) | 2,861 (51.0%) | 2,744 (49.0%) |
Employment Industries by Sex in Donna
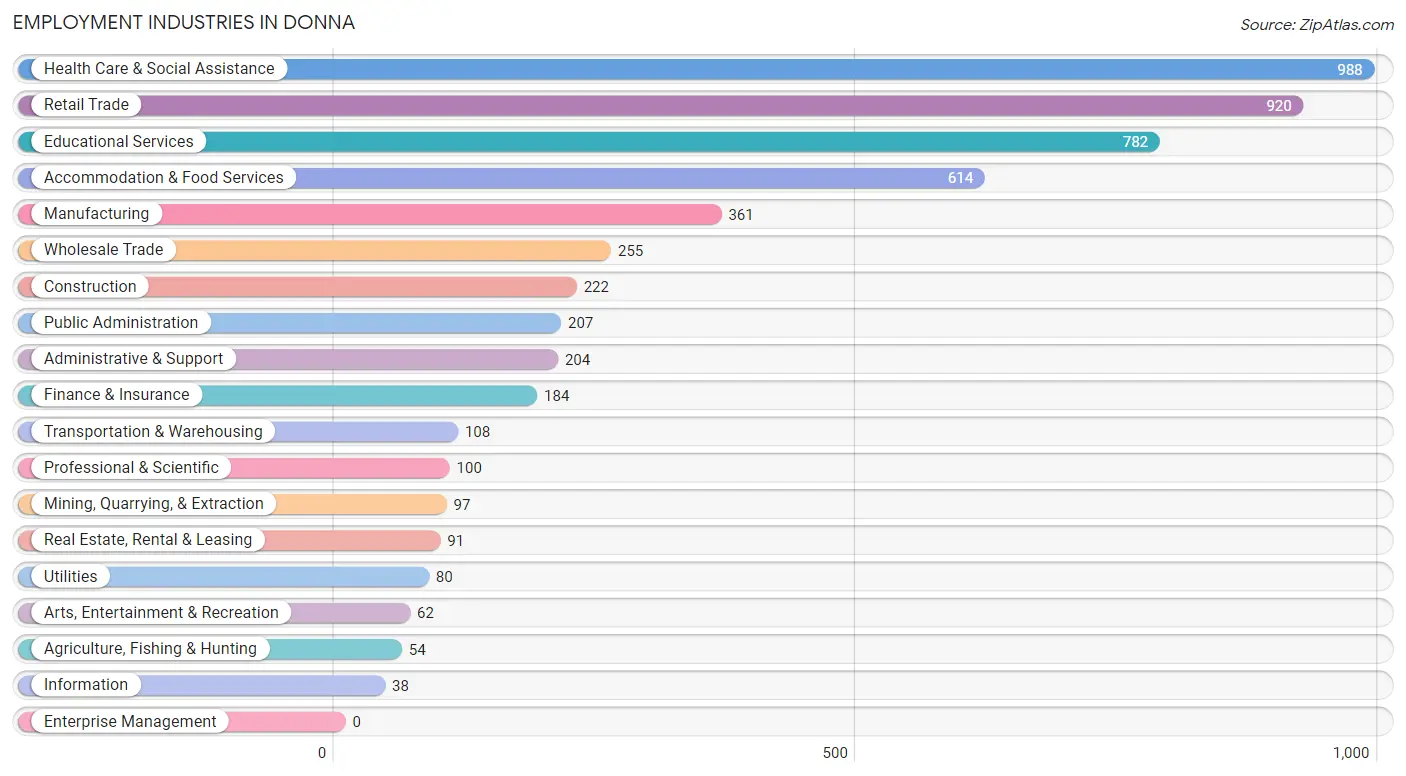
Employment Industries in Donna
The major employment industries in Donna include Health Care & Social Assistance (988 | 17.6%), Retail Trade (920 | 16.4%), Educational Services (782 | 14.0%), Accommodation & Food Services (614 | 11.0%), and Manufacturing (361 | 6.4%).
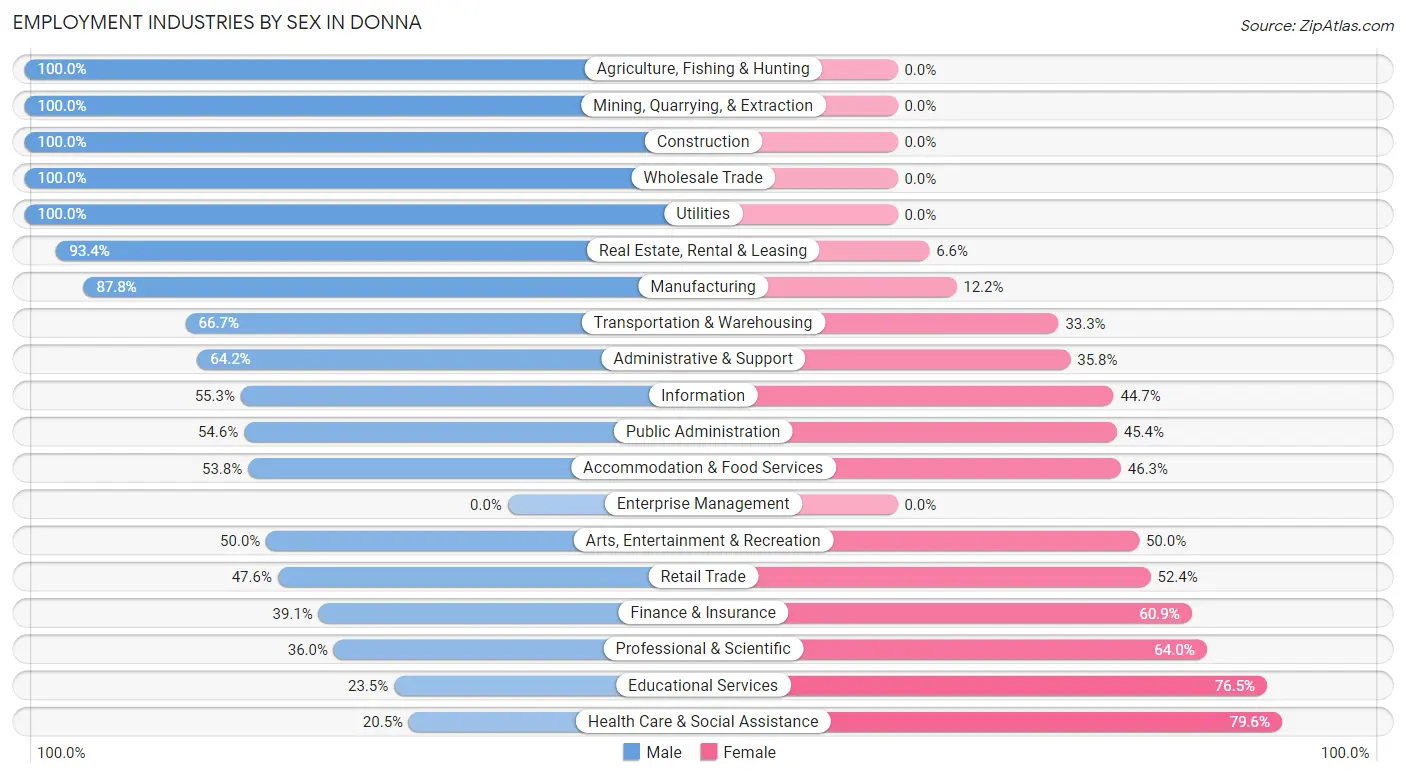
Employment Industries by Sex in Donna
The Donna industries that see more men than women are Agriculture, Fishing & Hunting (100.0%), Mining, Quarrying, & Extraction (100.0%), and Construction (100.0%), whereas the industries that tend to have a higher number of women are Health Care & Social Assistance (79.5%), Educational Services (76.5%), and Professional & Scientific (64.0%).
| Industry | Male | Female |
| Agriculture, Fishing & Hunting | 54 (100.0%) | 0 (0.0%) |
| Mining, Quarrying, & Extraction | 97 (100.0%) | 0 (0.0%) |
| Construction | 222 (100.0%) | 0 (0.0%) |
| Manufacturing | 317 (87.8%) | 44 (12.2%) |
| Wholesale Trade | 255 (100.0%) | 0 (0.0%) |
| Retail Trade | 438 (47.6%) | 482 (52.4%) |
| Transportation & Warehousing | 72 (66.7%) | 36 (33.3%) |
| Utilities | 80 (100.0%) | 0 (0.0%) |
| Information | 21 (55.3%) | 17 (44.7%) |
| Finance & Insurance | 72 (39.1%) | 112 (60.9%) |
| Real Estate, Rental & Leasing | 85 (93.4%) | 6 (6.6%) |
| Professional & Scientific | 36 (36.0%) | 64 (64.0%) |
| Enterprise Management | 0 (0.0%) | 0 (0.0%) |
| Administrative & Support | 131 (64.2%) | 73 (35.8%) |
| Educational Services | 184 (23.5%) | 598 (76.5%) |
| Health Care & Social Assistance | 202 (20.4%) | 786 (79.5%) |
| Arts, Entertainment & Recreation | 31 (50.0%) | 31 (50.0%) |
| Accommodation & Food Services | 330 (53.7%) | 284 (46.3%) |
| Public Administration | 113 (54.6%) | 94 (45.4%) |
| Total | 2,861 (51.0%) | 2,744 (49.0%) |
Education in Donna
School Enrollment in Donna
The most common levels of schooling among the 5,278 students in Donna are middle school (1,786 | 33.8%), elementary school (1,498 | 28.4%), and high school (1,007 | 19.1%).
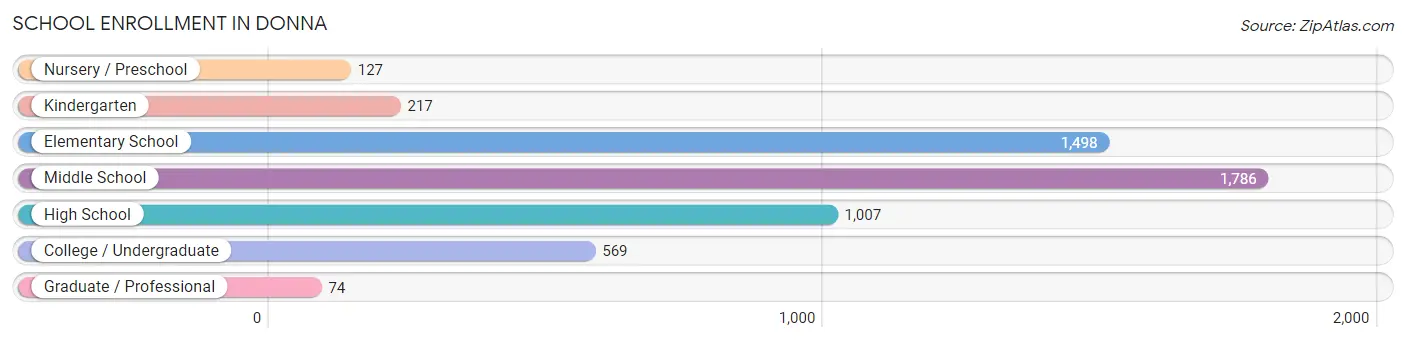
| School Level | # Students | % Students |
| Nursery / Preschool | 127 | 2.4% |
| Kindergarten | 217 | 4.1% |
| Elementary School | 1,498 | 28.4% |
| Middle School | 1,786 | 33.8% |
| High School | 1,007 | 19.1% |
| College / Undergraduate | 569 | 10.8% |
| Graduate / Professional | 74 | 1.4% |
| Total | 5,278 | 100.0% |
School Enrollment by Age by Funding Source in Donna
Out of a total of 5,278 students who are enrolled in schools in Donna, 375 (7.1%) attend a private institution, while the remaining 4,903 (92.9%) are enrolled in public schools. The age group of 20 to 24 year olds has the highest likelihood of being enrolled in private schools, with 188 (49.9% in the age bracket) enrolled. Conversely, the age group of 3 to 4 year olds has the lowest likelihood of being enrolled in a private school, with 166 (100.0% in the age bracket) attending a public institution.
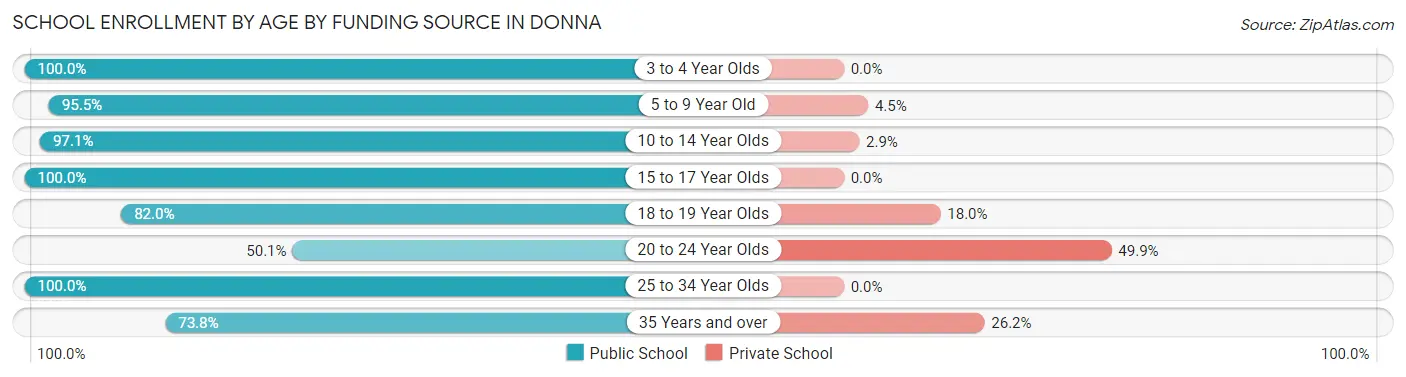
| Age Bracket | Public School | Private School |
| 3 to 4 Year Olds | 166 (100.0%) | 0 (0.0%) |
| 5 to 9 Year Old | 1,370 (95.5%) | 65 (4.5%) |
| 10 to 14 Year Olds | 1,932 (97.1%) | 57 (2.9%) |
| 15 to 17 Year Olds | 887 (100.0%) | 0 (0.0%) |
| 18 to 19 Year Olds | 173 (82.0%) | 38 (18.0%) |
| 20 to 24 Year Olds | 189 (50.1%) | 188 (49.9%) |
| 25 to 34 Year Olds | 110 (100.0%) | 0 (0.0%) |
| 35 Years and over | 76 (73.8%) | 27 (26.2%) |
| Total | 4,903 (92.9%) | 375 (7.1%) |
Educational Attainment by Field of Study in Donna
Education (321 | 25.2%), arts & humanities (183 | 14.3%), business (172 | 13.5%), liberal arts & history (112 | 8.8%), and engineering (111 | 8.7%) are the most common fields of study among 1,275 individuals in Donna who have obtained a bachelor's degree or higher.
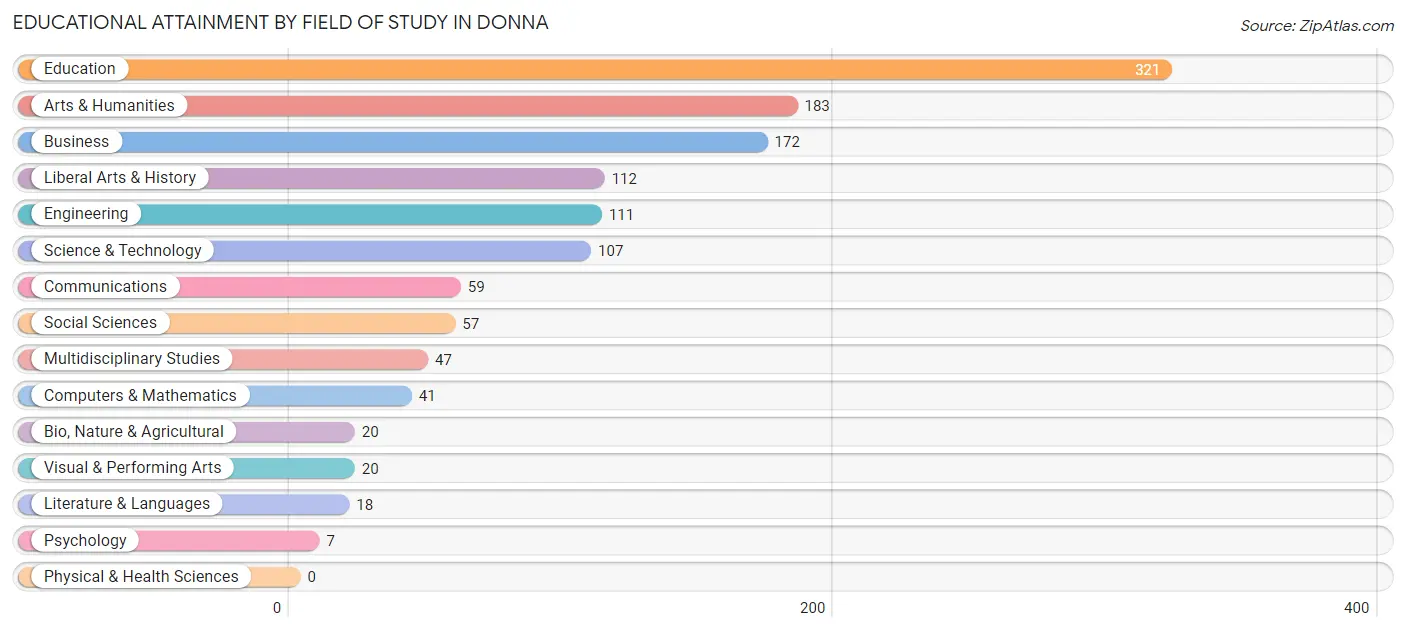
| Field of Study | # Graduates | % Graduates |
| Computers & Mathematics | 41 | 3.2% |
| Bio, Nature & Agricultural | 20 | 1.6% |
| Physical & Health Sciences | 0 | 0.0% |
| Psychology | 7 | 0.5% |
| Social Sciences | 57 | 4.5% |
| Engineering | 111 | 8.7% |
| Multidisciplinary Studies | 47 | 3.7% |
| Science & Technology | 107 | 8.4% |
| Business | 172 | 13.5% |
| Education | 321 | 25.2% |
| Literature & Languages | 18 | 1.4% |
| Liberal Arts & History | 112 | 8.8% |
| Visual & Performing Arts | 20 | 1.6% |
| Communications | 59 | 4.6% |
| Arts & Humanities | 183 | 14.3% |
| Total | 1,275 | 100.0% |
Transportation & Commute in Donna
Vehicle Availability by Sex in Donna
The most prevalent vehicle ownership categories in Donna are males with 2 vehicles (1,074, accounting for 38.2%) and females with 2 vehicles (848, making up 40.5%).
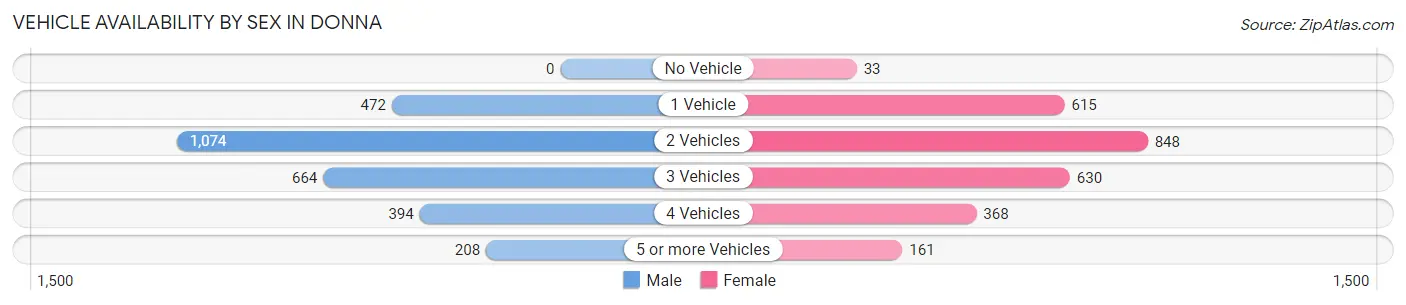
| Vehicles Available | Male | Female |
| No Vehicle | 0 (0.0%) | 33 (1.2%) |
| 1 Vehicle | 472 (16.8%) | 615 (23.2%) |
| 2 Vehicles | 1,074 (38.2%) | 848 (31.9%) |
| 3 Vehicles | 664 (23.6%) | 630 (23.7%) |
| 4 Vehicles | 394 (14.0%) | 368 (13.9%) |
| 5 or more Vehicles | 208 (7.4%) | 161 (6.1%) |
| Total | 2,812 (100.0%) | 2,655 (100.0%) |
Commute Time in Donna
The most frequently occuring commute durations in Donna are 10 to 14 minutes (863 commuters, 17.1%), 15 to 19 minutes (770 commuters, 15.3%), and 5 to 9 minutes (694 commuters, 13.8%).
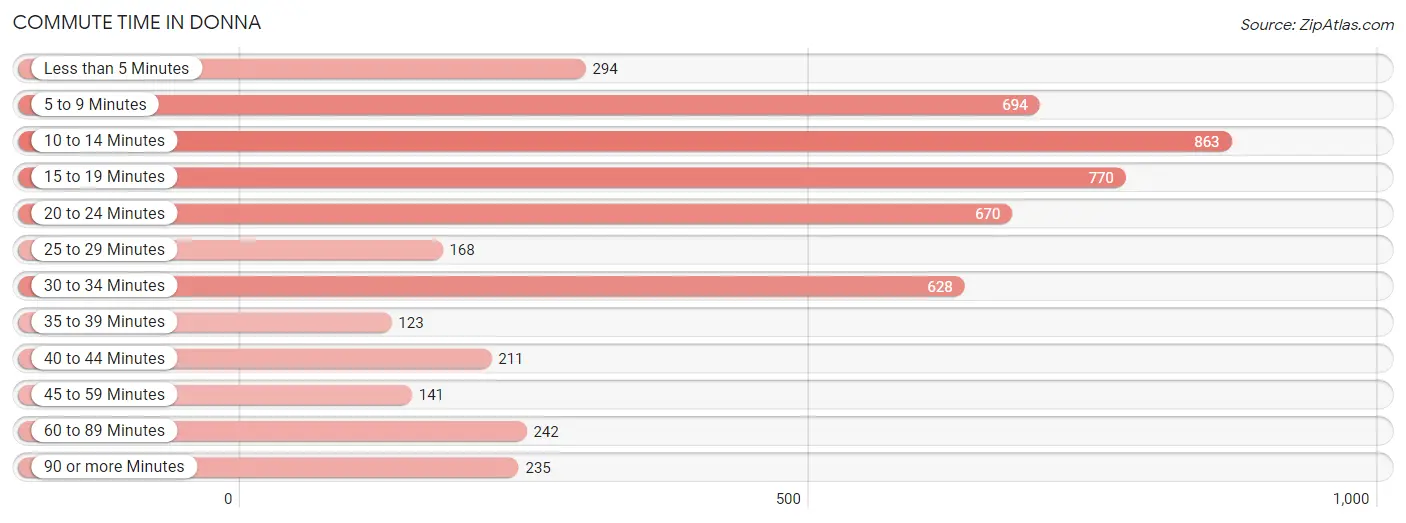
| Commute Time | # Commuters | % Commuters |
| Less than 5 Minutes | 294 | 5.8% |
| 5 to 9 Minutes | 694 | 13.8% |
| 10 to 14 Minutes | 863 | 17.1% |
| 15 to 19 Minutes | 770 | 15.3% |
| 20 to 24 Minutes | 670 | 13.3% |
| 25 to 29 Minutes | 168 | 3.3% |
| 30 to 34 Minutes | 628 | 12.5% |
| 35 to 39 Minutes | 123 | 2.4% |
| 40 to 44 Minutes | 211 | 4.2% |
| 45 to 59 Minutes | 141 | 2.8% |
| 60 to 89 Minutes | 242 | 4.8% |
| 90 or more Minutes | 235 | 4.7% |
Commute Time by Sex in Donna
The most common commute times in Donna are 30 to 34 minutes (440 commuters, 17.1%) for males and 10 to 14 minutes (638 commuters, 25.9%) for females.
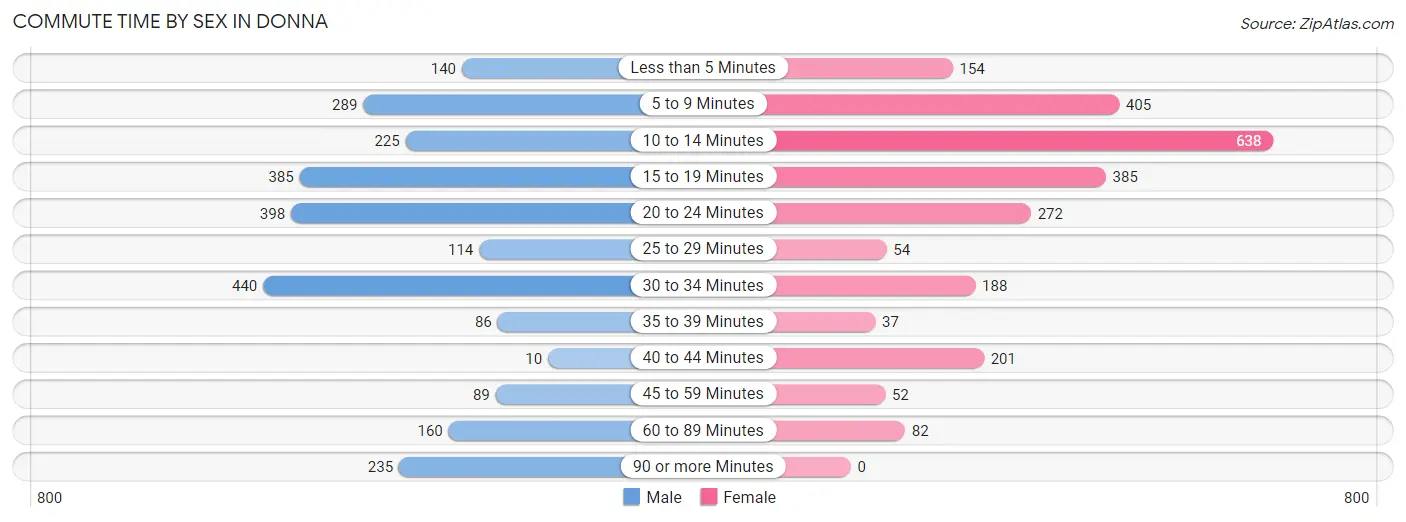
| Commute Time | Male | Female |
| Less than 5 Minutes | 140 (5.4%) | 154 (6.2%) |
| 5 to 9 Minutes | 289 (11.2%) | 405 (16.4%) |
| 10 to 14 Minutes | 225 (8.7%) | 638 (25.9%) |
| 15 to 19 Minutes | 385 (15.0%) | 385 (15.6%) |
| 20 to 24 Minutes | 398 (15.5%) | 272 (11.0%) |
| 25 to 29 Minutes | 114 (4.4%) | 54 (2.2%) |
| 30 to 34 Minutes | 440 (17.1%) | 188 (7.6%) |
| 35 to 39 Minutes | 86 (3.4%) | 37 (1.5%) |
| 40 to 44 Minutes | 10 (0.4%) | 201 (8.1%) |
| 45 to 59 Minutes | 89 (3.5%) | 52 (2.1%) |
| 60 to 89 Minutes | 160 (6.2%) | 82 (3.3%) |
| 90 or more Minutes | 235 (9.1%) | 0 (0.0%) |
Time of Departure to Work by Sex in Donna
The most frequent times of departure to work in Donna are 7:00 AM to 7:29 AM (507, 19.7%) for males and 7:00 AM to 7:29 AM (608, 24.6%) for females.
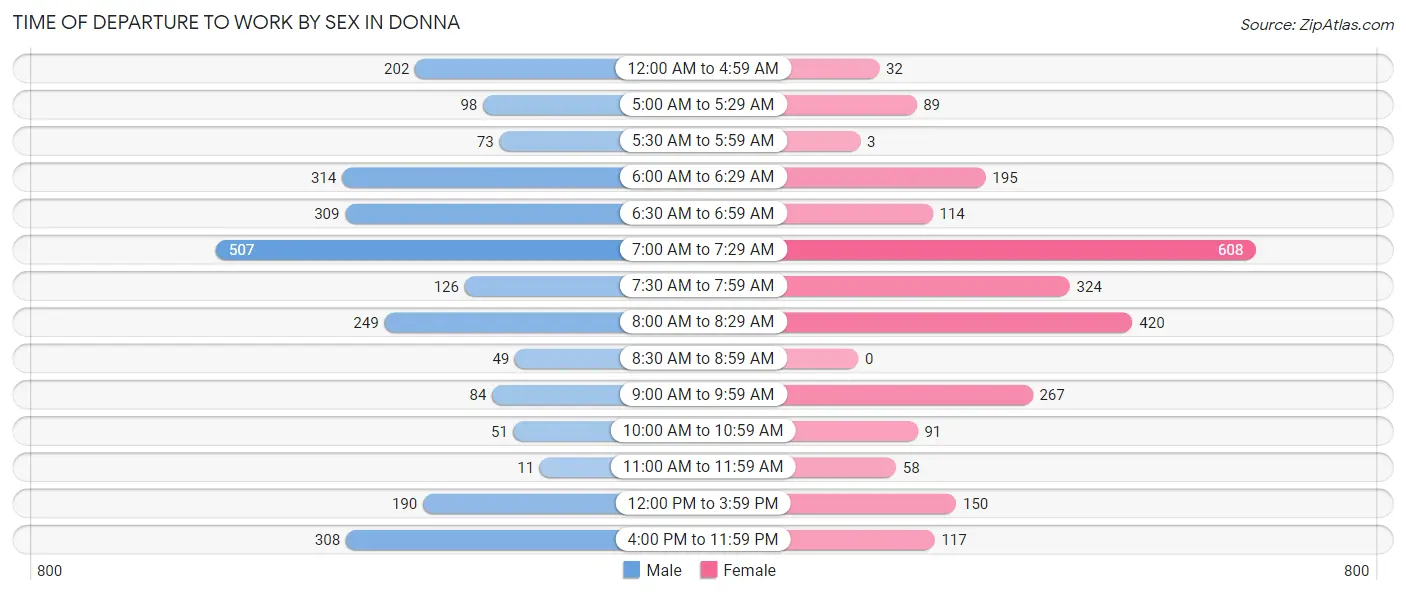
| Time of Departure | Male | Female |
| 12:00 AM to 4:59 AM | 202 (7.9%) | 32 (1.3%) |
| 5:00 AM to 5:29 AM | 98 (3.8%) | 89 (3.6%) |
| 5:30 AM to 5:59 AM | 73 (2.8%) | 3 (0.1%) |
| 6:00 AM to 6:29 AM | 314 (12.2%) | 195 (7.9%) |
| 6:30 AM to 6:59 AM | 309 (12.0%) | 114 (4.6%) |
| 7:00 AM to 7:29 AM | 507 (19.7%) | 608 (24.6%) |
| 7:30 AM to 7:59 AM | 126 (4.9%) | 324 (13.1%) |
| 8:00 AM to 8:29 AM | 249 (9.7%) | 420 (17.0%) |
| 8:30 AM to 8:59 AM | 49 (1.9%) | 0 (0.0%) |
| 9:00 AM to 9:59 AM | 84 (3.3%) | 267 (10.8%) |
| 10:00 AM to 10:59 AM | 51 (2.0%) | 91 (3.7%) |
| 11:00 AM to 11:59 AM | 11 (0.4%) | 58 (2.4%) |
| 12:00 PM to 3:59 PM | 190 (7.4%) | 150 (6.1%) |
| 4:00 PM to 11:59 PM | 308 (12.0%) | 117 (4.7%) |
| Total | 2,571 (100.0%) | 2,468 (100.0%) |
Housing Occupancy in Donna
Occupancy by Ownership in Donna
Of the total 5,173 dwellings in Donna, owner-occupied units account for 3,079 (59.5%), while renter-occupied units make up 2,094 (40.5%).
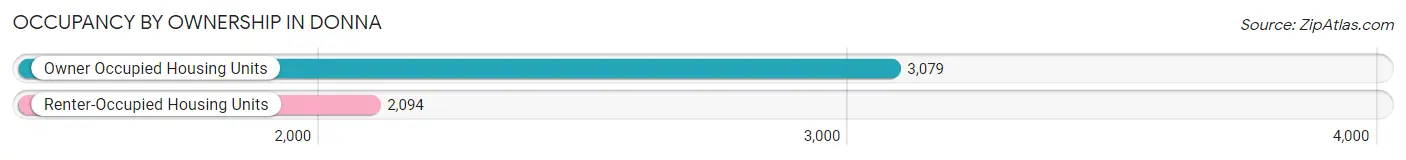
| Occupancy | # Housing Units | % Housing Units |
| Owner Occupied Housing Units | 3,079 | 59.5% |
| Renter-Occupied Housing Units | 2,094 | 40.5% |
| Total Occupied Housing Units | 5,173 | 100.0% |
Occupancy by Household Size in Donna
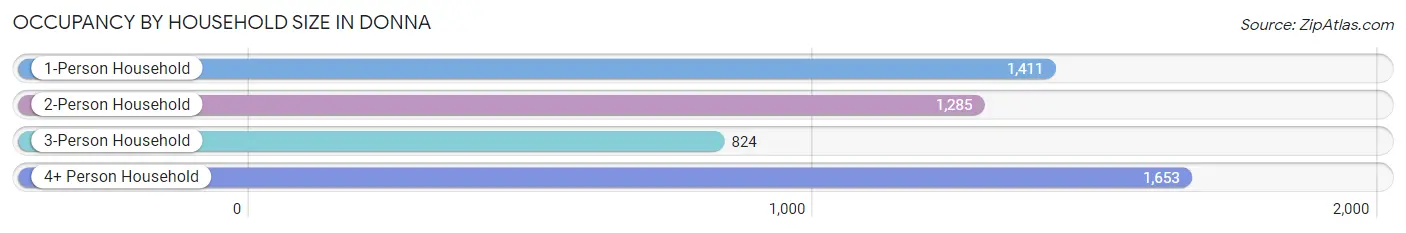
| Household Size | # Housing Units | % Housing Units |
| 1-Person Household | 1,411 | 27.3% |
| 2-Person Household | 1,285 | 24.8% |
| 3-Person Household | 824 | 15.9% |
| 4+ Person Household | 1,653 | 32.0% |
| Total Housing Units | 5,173 | 100.0% |
Occupancy by Ownership by Household Size in Donna
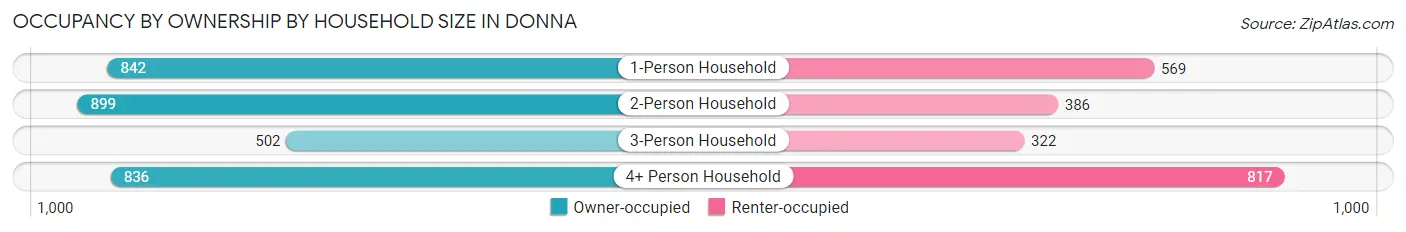
| Household Size | Owner-occupied | Renter-occupied |
| 1-Person Household | 842 (59.7%) | 569 (40.3%) |
| 2-Person Household | 899 (70.0%) | 386 (30.0%) |
| 3-Person Household | 502 (60.9%) | 322 (39.1%) |
| 4+ Person Household | 836 (50.6%) | 817 (49.4%) |
| Total Housing Units | 3,079 (59.5%) | 2,094 (40.5%) |
Occupancy by Educational Attainment in Donna
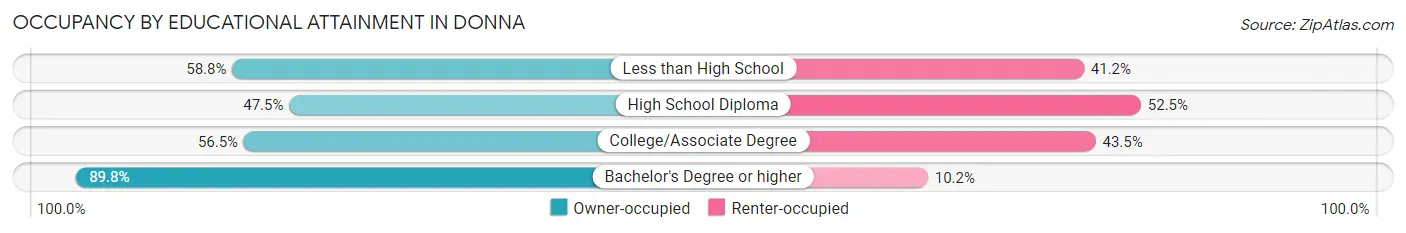
| Household Size | Owner-occupied | Renter-occupied |
| Less than High School | 1,287 (58.8%) | 901 (41.2%) |
| High School Diploma | 593 (47.5%) | 655 (52.5%) |
| College/Associate Degree | 612 (56.5%) | 471 (43.5%) |
| Bachelor's Degree or higher | 587 (89.8%) | 67 (10.2%) |
Occupancy by Age of Householder in Donna
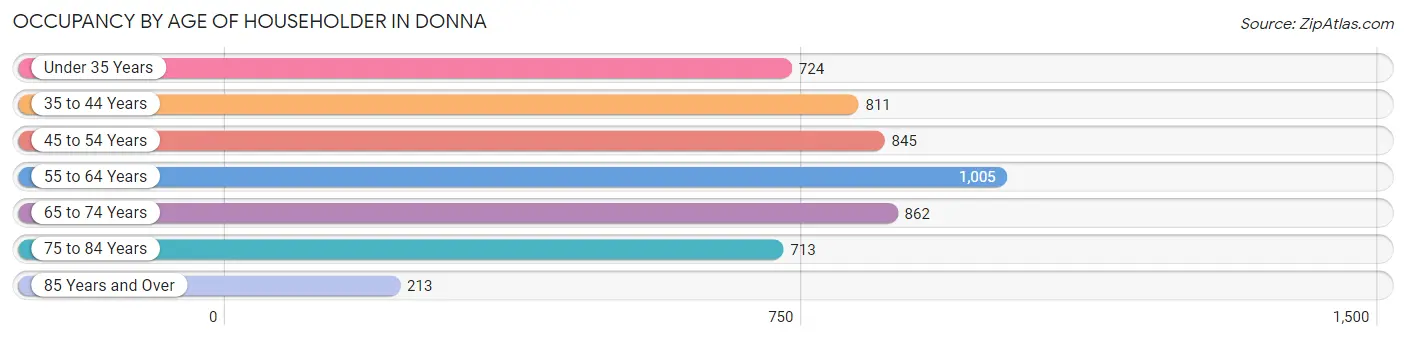
| Age Bracket | # Households | % Households |
| Under 35 Years | 724 | 14.0% |
| 35 to 44 Years | 811 | 15.7% |
| 45 to 54 Years | 845 | 16.3% |
| 55 to 64 Years | 1,005 | 19.4% |
| 65 to 74 Years | 862 | 16.7% |
| 75 to 84 Years | 713 | 13.8% |
| 85 Years and Over | 213 | 4.1% |
| Total | 5,173 | 100.0% |
Housing Finances in Donna
Median Income by Occupancy in Donna
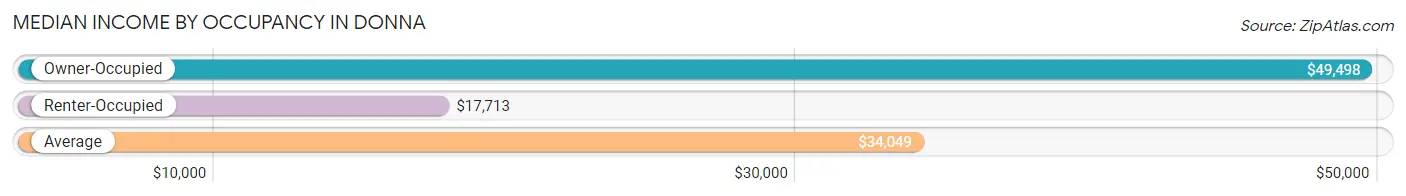
| Occupancy Type | # Households | Median Income |
| Owner-Occupied | 3,079 (59.5%) | $49,498 |
| Renter-Occupied | 2,094 (40.5%) | $17,713 |
| Average | 5,173 (100.0%) | $34,049 |
Occupancy by Householder Income Bracket in Donna
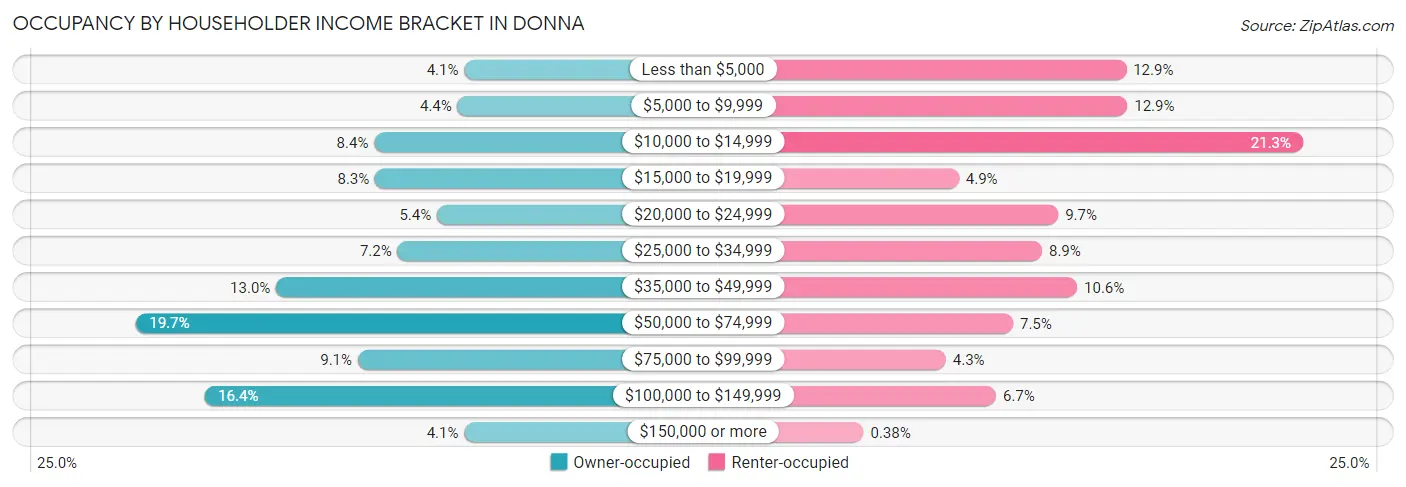
| Income Bracket | Owner-occupied | Renter-occupied |
| Less than $5,000 | 125 (4.1%) | 270 (12.9%) |
| $5,000 to $9,999 | 135 (4.4%) | 271 (12.9%) |
| $10,000 to $14,999 | 257 (8.4%) | 446 (21.3%) |
| $15,000 to $19,999 | 256 (8.3%) | 103 (4.9%) |
| $20,000 to $24,999 | 165 (5.4%) | 202 (9.7%) |
| $25,000 to $34,999 | 223 (7.2%) | 186 (8.9%) |
| $35,000 to $49,999 | 401 (13.0%) | 221 (10.5%) |
| $50,000 to $74,999 | 606 (19.7%) | 157 (7.5%) |
| $75,000 to $99,999 | 281 (9.1%) | 90 (4.3%) |
| $100,000 to $149,999 | 505 (16.4%) | 140 (6.7%) |
| $150,000 or more | 125 (4.1%) | 8 (0.4%) |
| Total | 3,079 (100.0%) | 2,094 (100.0%) |
Monthly Housing Cost Tiers in Donna
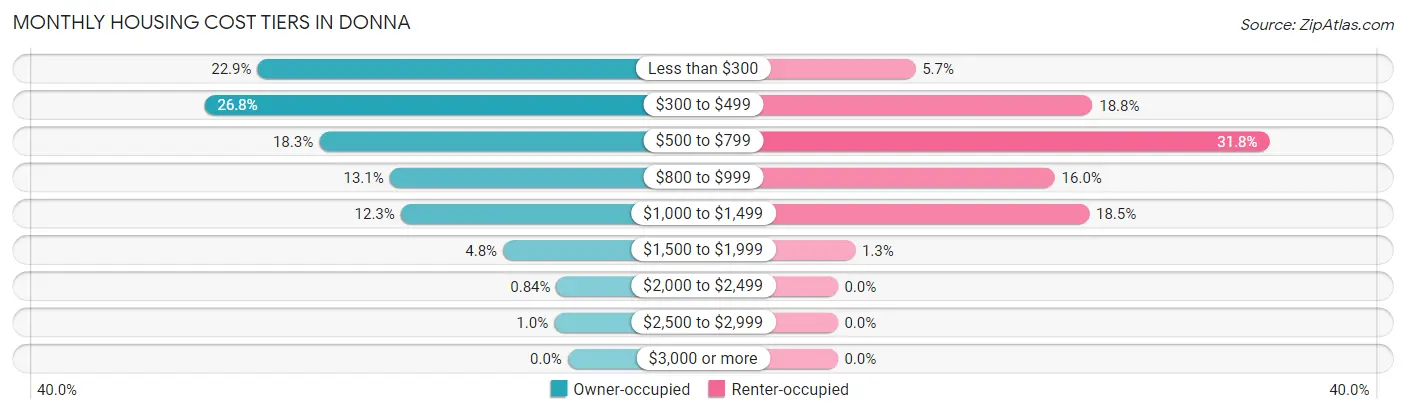
| Monthly Cost | Owner-occupied | Renter-occupied |
| Less than $300 | 704 (22.9%) | 120 (5.7%) |
| $300 to $499 | 824 (26.8%) | 393 (18.8%) |
| $500 to $799 | 564 (18.3%) | 666 (31.8%) |
| $800 to $999 | 404 (13.1%) | 335 (16.0%) |
| $1,000 to $1,499 | 379 (12.3%) | 388 (18.5%) |
| $1,500 to $1,999 | 147 (4.8%) | 27 (1.3%) |
| $2,000 to $2,499 | 26 (0.8%) | 0 (0.0%) |
| $2,500 to $2,999 | 31 (1.0%) | 0 (0.0%) |
| $3,000 or more | 0 (0.0%) | 0 (0.0%) |
| Total | 3,079 (100.0%) | 2,094 (100.0%) |
Physical Housing Characteristics in Donna
Housing Structures in Donna
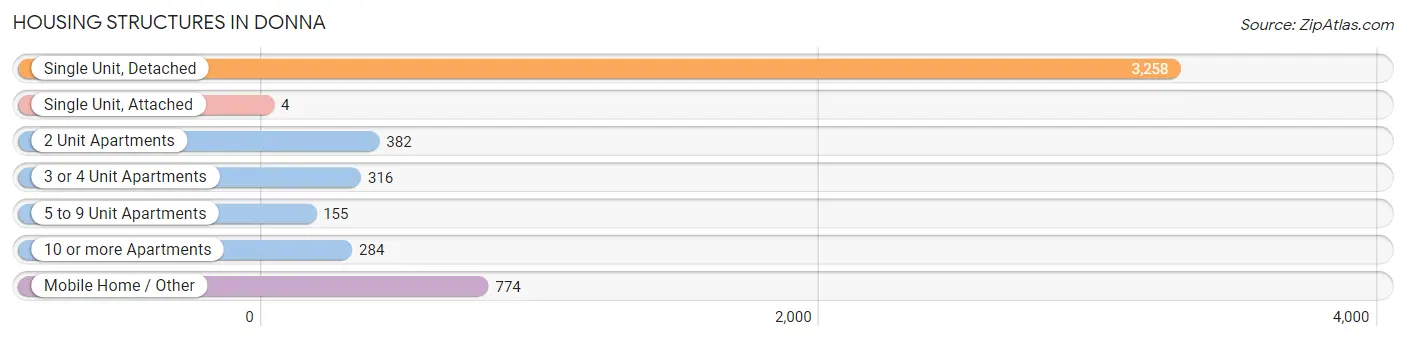
| Structure Type | # Housing Units | % Housing Units |
| Single Unit, Detached | 3,258 | 63.0% |
| Single Unit, Attached | 4 | 0.1% |
| 2 Unit Apartments | 382 | 7.4% |
| 3 or 4 Unit Apartments | 316 | 6.1% |
| 5 to 9 Unit Apartments | 155 | 3.0% |
| 10 or more Apartments | 284 | 5.5% |
| Mobile Home / Other | 774 | 15.0% |
| Total | 5,173 | 100.0% |
Housing Structures by Occupancy in Donna
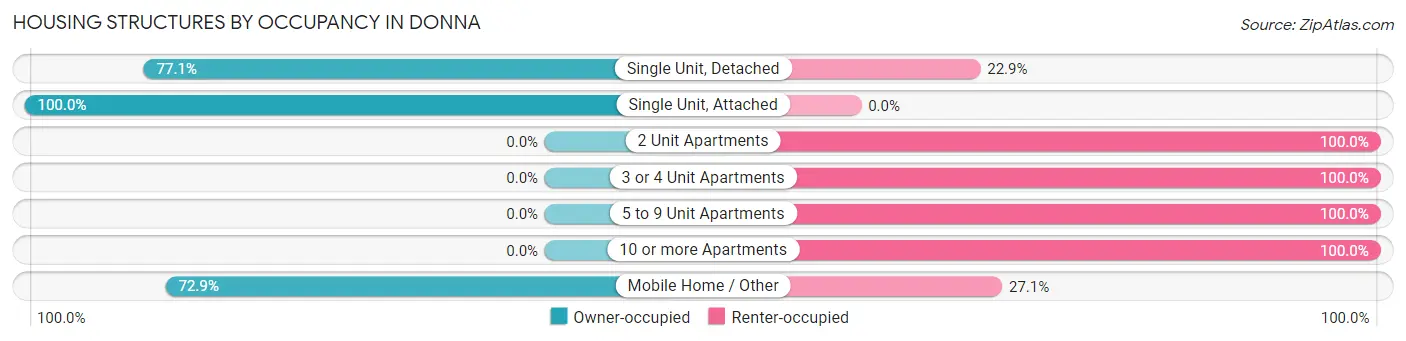
| Structure Type | Owner-occupied | Renter-occupied |
| Single Unit, Detached | 2,511 (77.1%) | 747 (22.9%) |
| Single Unit, Attached | 4 (100.0%) | 0 (0.0%) |
| 2 Unit Apartments | 0 (0.0%) | 382 (100.0%) |
| 3 or 4 Unit Apartments | 0 (0.0%) | 316 (100.0%) |
| 5 to 9 Unit Apartments | 0 (0.0%) | 155 (100.0%) |
| 10 or more Apartments | 0 (0.0%) | 284 (100.0%) |
| Mobile Home / Other | 564 (72.9%) | 210 (27.1%) |
| Total | 3,079 (59.5%) | 2,094 (40.5%) |
Housing Structures by Number of Rooms in Donna
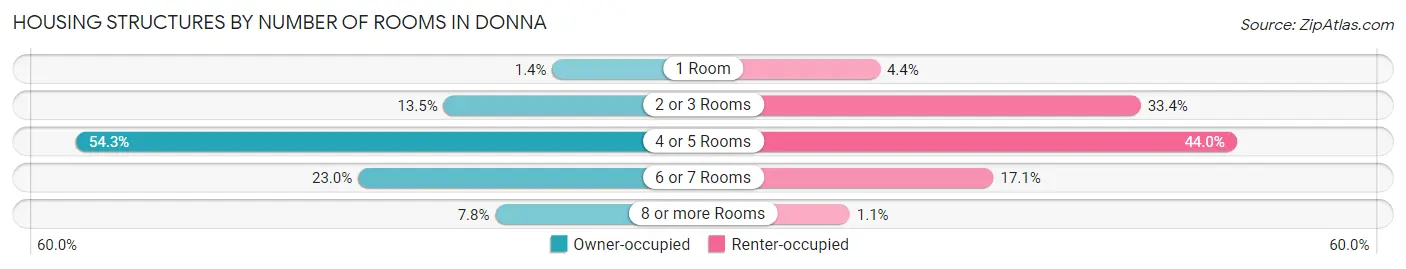
| Number of Rooms | Owner-occupied | Renter-occupied |
| 1 Room | 44 (1.4%) | 93 (4.4%) |
| 2 or 3 Rooms | 416 (13.5%) | 699 (33.4%) |
| 4 or 5 Rooms | 1,672 (54.3%) | 922 (44.0%) |
| 6 or 7 Rooms | 708 (23.0%) | 357 (17.1%) |
| 8 or more Rooms | 239 (7.8%) | 23 (1.1%) |
| Total | 3,079 (100.0%) | 2,094 (100.0%) |
Housing Structure by Heating Type in Donna
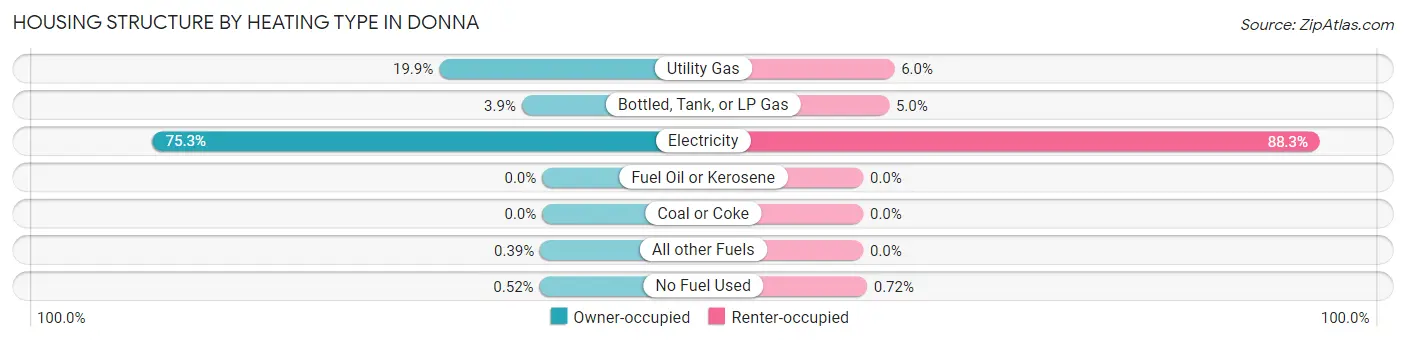
| Heating Type | Owner-occupied | Renter-occupied |
| Utility Gas | 613 (19.9%) | 126 (6.0%) |
| Bottled, Tank, or LP Gas | 121 (3.9%) | 105 (5.0%) |
| Electricity | 2,317 (75.2%) | 1,848 (88.2%) |
| Fuel Oil or Kerosene | 0 (0.0%) | 0 (0.0%) |
| Coal or Coke | 0 (0.0%) | 0 (0.0%) |
| All other Fuels | 12 (0.4%) | 0 (0.0%) |
| No Fuel Used | 16 (0.5%) | 15 (0.7%) |
| Total | 3,079 (100.0%) | 2,094 (100.0%) |
Household Vehicle Usage in Donna
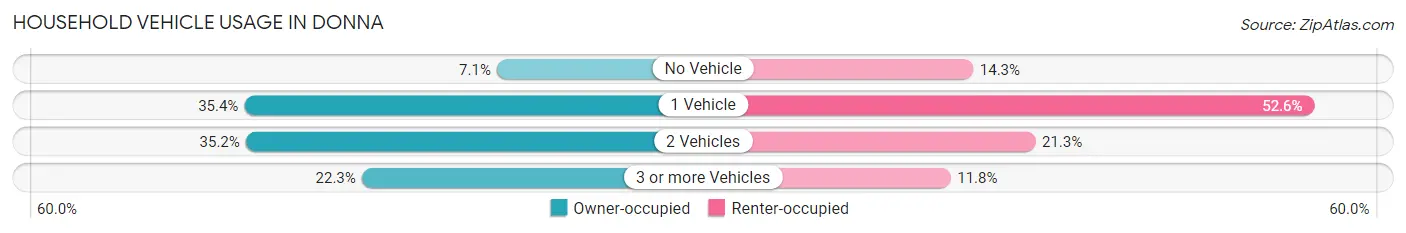
| Vehicles per Household | Owner-occupied | Renter-occupied |
| No Vehicle | 219 (7.1%) | 300 (14.3%) |
| 1 Vehicle | 1,090 (35.4%) | 1,101 (52.6%) |
| 2 Vehicles | 1,085 (35.2%) | 446 (21.3%) |
| 3 or more Vehicles | 685 (22.3%) | 247 (11.8%) |
| Total | 3,079 (100.0%) | 2,094 (100.0%) |
Real Estate & Mortgages in Donna
Real Estate and Mortgage Overview in Donna
| Characteristic | Without Mortgage | With Mortgage |
| Housing Units | 2,227 | 852 |
| Median Property Value | $54,800 | $110,700 |
| Median Household Income | $43,763 | $69 |
| Monthly Housing Costs | $383 | $0 |
| Real Estate Taxes | $1,002 | $33 |
Property Value by Mortgage Status in Donna
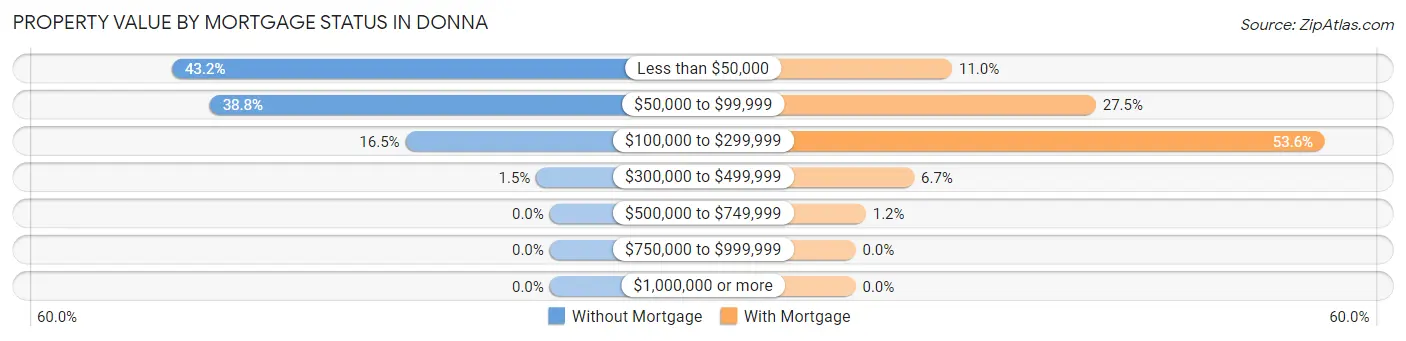
| Property Value | Without Mortgage | With Mortgage |
| Less than $50,000 | 961 (43.1%) | 94 (11.0%) |
| $50,000 to $99,999 | 865 (38.8%) | 234 (27.5%) |
| $100,000 to $299,999 | 367 (16.5%) | 457 (53.6%) |
| $300,000 to $499,999 | 34 (1.5%) | 57 (6.7%) |
| $500,000 to $749,999 | 0 (0.0%) | 10 (1.2%) |
| $750,000 to $999,999 | 0 (0.0%) | 0 (0.0%) |
| $1,000,000 or more | 0 (0.0%) | 0 (0.0%) |
| Total | 2,227 (100.0%) | 852 (100.0%) |
Household Income by Mortgage Status in Donna
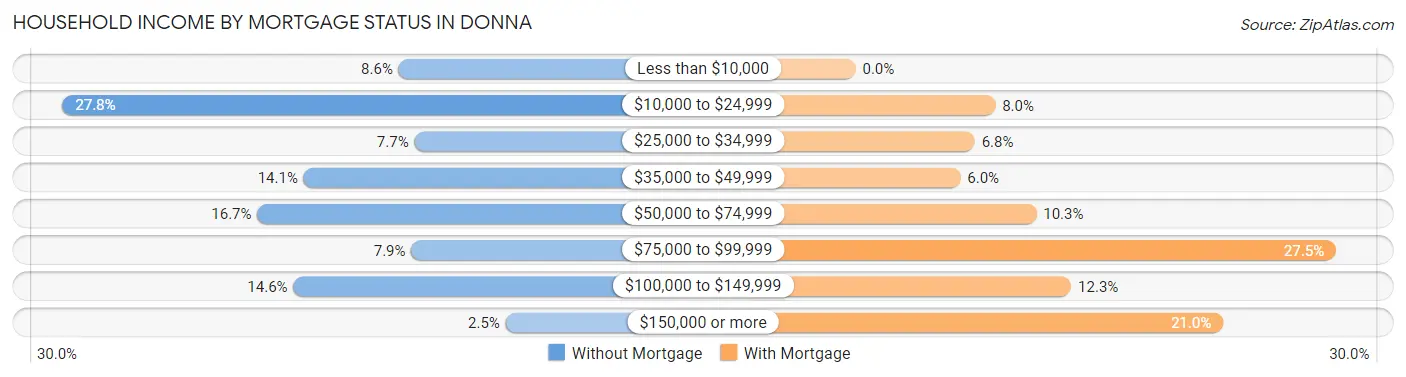
| Household Income | Without Mortgage | With Mortgage |
| Less than $10,000 | 192 (8.6%) | 0 (0.0%) |
| $10,000 to $24,999 | 620 (27.8%) | 68 (8.0%) |
| $25,000 to $34,999 | 172 (7.7%) | 58 (6.8%) |
| $35,000 to $49,999 | 313 (14.1%) | 51 (6.0%) |
| $50,000 to $74,999 | 372 (16.7%) | 88 (10.3%) |
| $75,000 to $99,999 | 176 (7.9%) | 234 (27.5%) |
| $100,000 to $149,999 | 326 (14.6%) | 105 (12.3%) |
| $150,000 or more | 56 (2.5%) | 179 (21.0%) |
| Total | 2,227 (100.0%) | 852 (100.0%) |
Property Value to Household Income Ratio in Donna
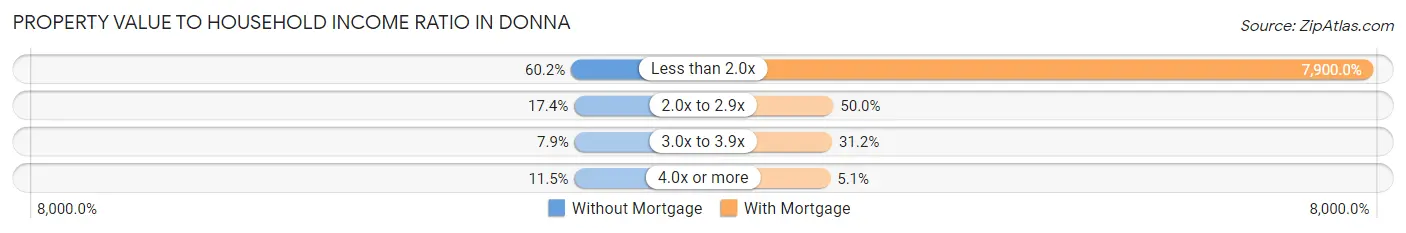
| Value-to-Income Ratio | Without Mortgage | With Mortgage |
| Less than 2.0x | 1,340 (60.2%) | 67,308 (7,900.0%) |
| 2.0x to 2.9x | 387 (17.4%) | 426 (50.0%) |
| 3.0x to 3.9x | 176 (7.9%) | 266 (31.2%) |
| 4.0x or more | 257 (11.5%) | 43 (5.1%) |
| Total | 2,227 (100.0%) | 852 (100.0%) |
Real Estate Taxes by Mortgage Status in Donna
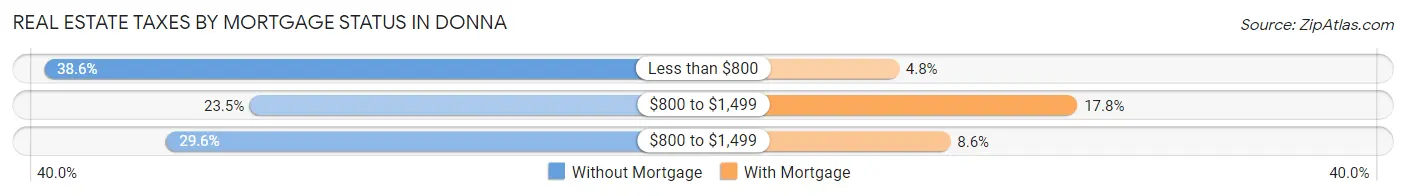
| Property Taxes | Without Mortgage | With Mortgage |
| Less than $800 | 859 (38.6%) | 41 (4.8%) |
| $800 to $1,499 | 524 (23.5%) | 152 (17.8%) |
| $800 to $1,499 | 660 (29.6%) | 73 (8.6%) |
| Total | 2,227 (100.0%) | 852 (100.0%) |
Health & Disability in Donna
Health Insurance Coverage by Age in Donna
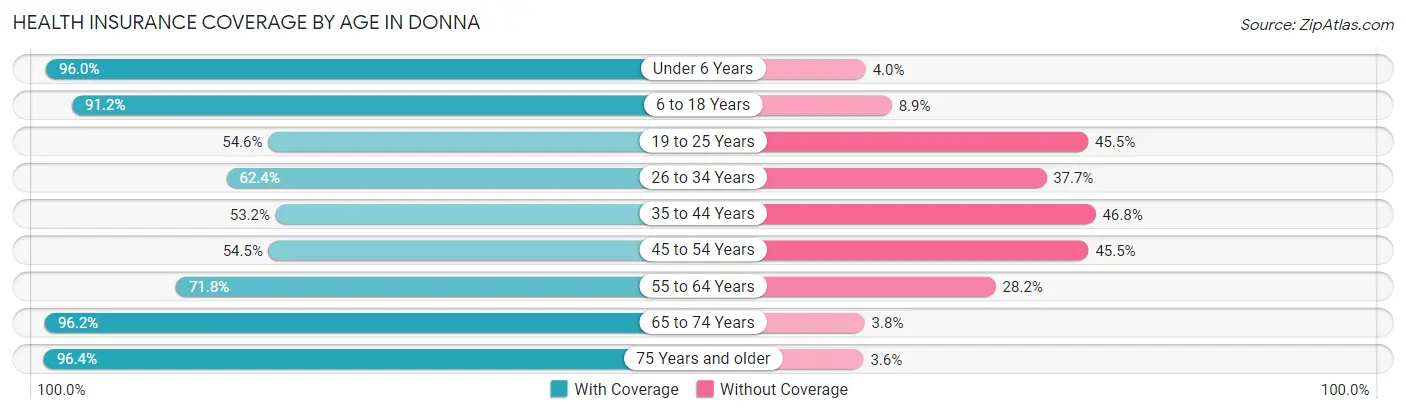
| Age Bracket | With Coverage | Without Coverage |
| Under 6 Years | 1,586 (96.0%) | 66 (4.0%) |
| 6 to 18 Years | 3,954 (91.1%) | 384 (8.8%) |
| 19 to 25 Years | 887 (54.5%) | 739 (45.5%) |
| 26 to 34 Years | 919 (62.4%) | 555 (37.7%) |
| 35 to 44 Years | 916 (53.2%) | 807 (46.8%) |
| 45 to 54 Years | 926 (54.5%) | 774 (45.5%) |
| 55 to 64 Years | 1,134 (71.8%) | 446 (28.2%) |
| 65 to 74 Years | 1,392 (96.2%) | 55 (3.8%) |
| 75 Years and older | 1,159 (96.4%) | 43 (3.6%) |
| Total | 12,873 (76.9%) | 3,869 (23.1%) |
Health Insurance Coverage by Citizenship Status in Donna
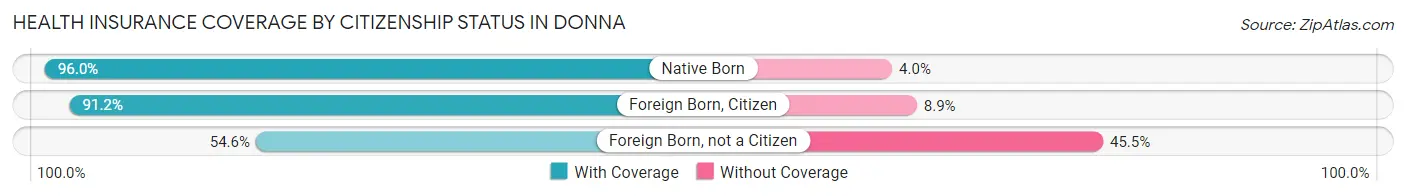
| Citizenship Status | With Coverage | Without Coverage |
| Native Born | 1,586 (96.0%) | 66 (4.0%) |
| Foreign Born, Citizen | 3,954 (91.1%) | 384 (8.8%) |
| Foreign Born, not a Citizen | 887 (54.5%) | 739 (45.5%) |
Health Insurance Coverage by Household Income in Donna
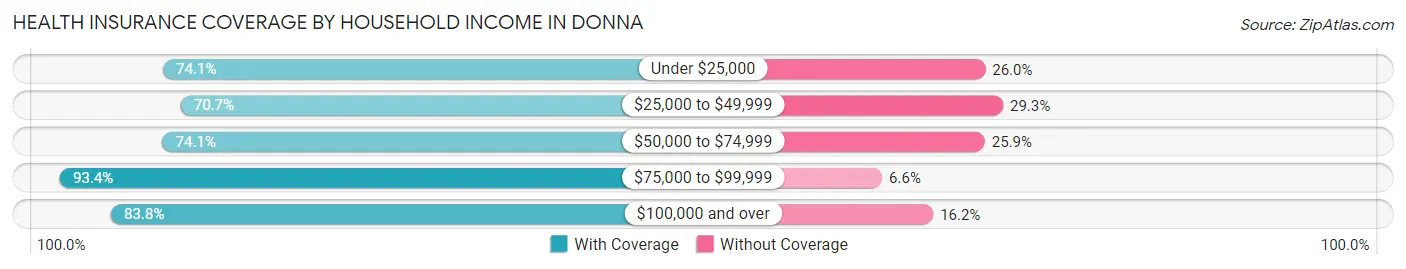
| Household Income | With Coverage | Without Coverage |
| Under $25,000 | 4,100 (74.1%) | 1,437 (26.0%) |
| $25,000 to $49,999 | 2,612 (70.7%) | 1,081 (29.3%) |
| $50,000 to $74,999 | 2,069 (74.1%) | 722 (25.9%) |
| $75,000 to $99,999 | 1,352 (93.4%) | 96 (6.6%) |
| $100,000 and over | 2,739 (83.8%) | 529 (16.2%) |
Public vs Private Health Insurance Coverage by Age in Donna
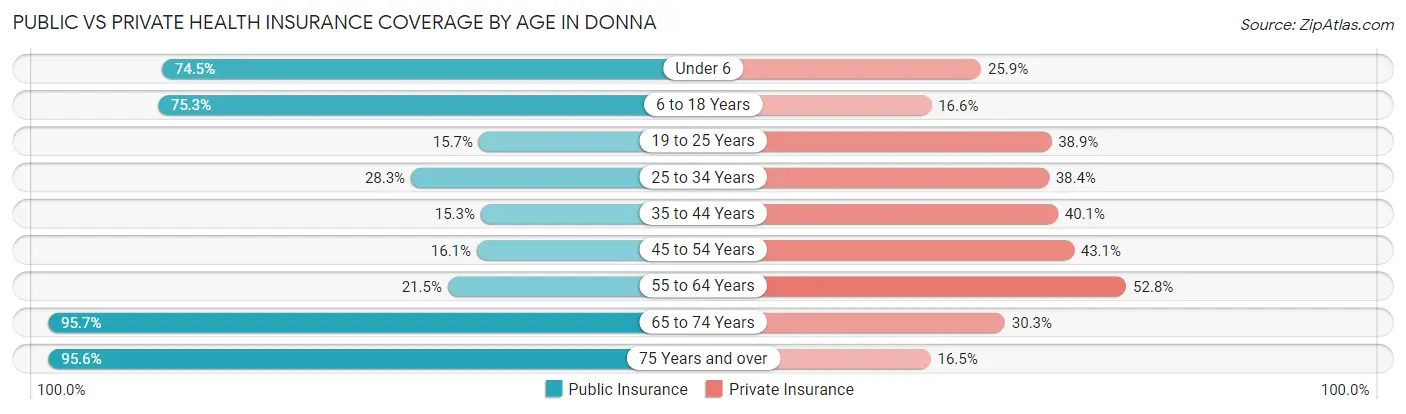
| Age Bracket | Public Insurance | Private Insurance |
| Under 6 | 1,231 (74.5%) | 427 (25.9%) |
| 6 to 18 Years | 3,265 (75.3%) | 720 (16.6%) |
| 19 to 25 Years | 255 (15.7%) | 632 (38.9%) |
| 25 to 34 Years | 417 (28.3%) | 566 (38.4%) |
| 35 to 44 Years | 264 (15.3%) | 691 (40.1%) |
| 45 to 54 Years | 273 (16.1%) | 732 (43.1%) |
| 55 to 64 Years | 339 (21.5%) | 834 (52.8%) |
| 65 to 74 Years | 1,384 (95.7%) | 438 (30.3%) |
| 75 Years and over | 1,149 (95.6%) | 198 (16.5%) |
| Total | 8,577 (51.2%) | 5,238 (31.3%) |
Disability Status by Sex by Age in Donna
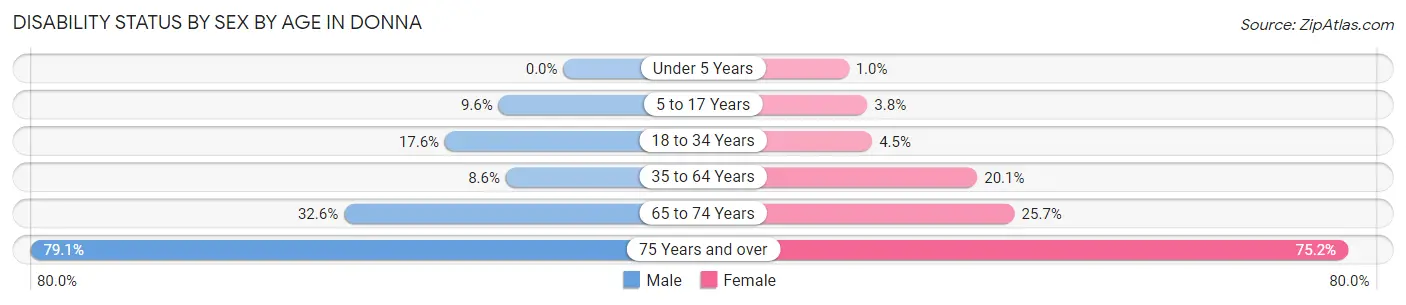
| Age Bracket | Male | Female |
| Under 5 Years | 0 (0.0%) | 8 (1.0%) |
| 5 to 17 Years | 195 (9.6%) | 92 (3.8%) |
| 18 to 34 Years | 278 (17.6%) | 77 (4.5%) |
| 35 to 64 Years | 205 (8.6%) | 524 (20.1%) |
| 65 to 74 Years | 229 (32.6%) | 191 (25.7%) |
| 75 Years and over | 413 (79.1%) | 511 (75.1%) |
Disability Class by Sex by Age in Donna
Disability Class: Hearing Difficulty
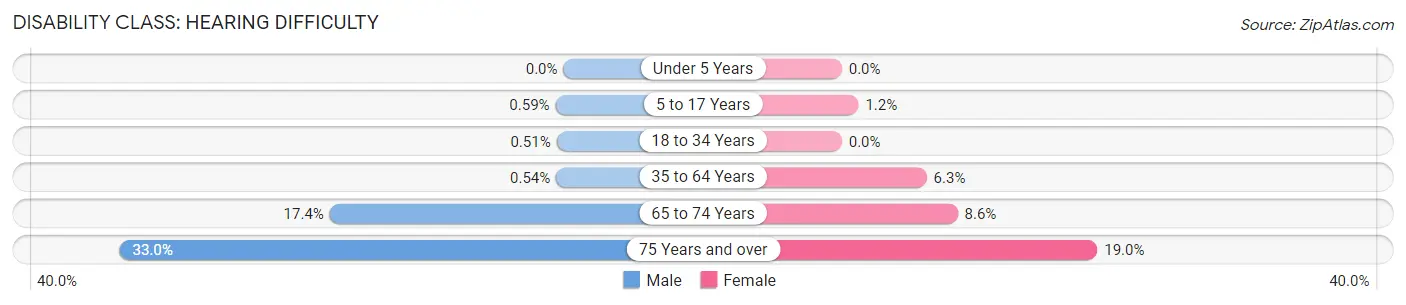
| Age Bracket | Male | Female |
| Under 5 Years | 0 (0.0%) | 0 (0.0%) |
| 5 to 17 Years | 12 (0.6%) | 30 (1.2%) |
| 18 to 34 Years | 8 (0.5%) | 0 (0.0%) |
| 35 to 64 Years | 13 (0.5%) | 164 (6.3%) |
| 65 to 74 Years | 122 (17.3%) | 64 (8.6%) |
| 75 Years and over | 172 (33.0%) | 129 (19.0%) |
Disability Class: Vision Difficulty
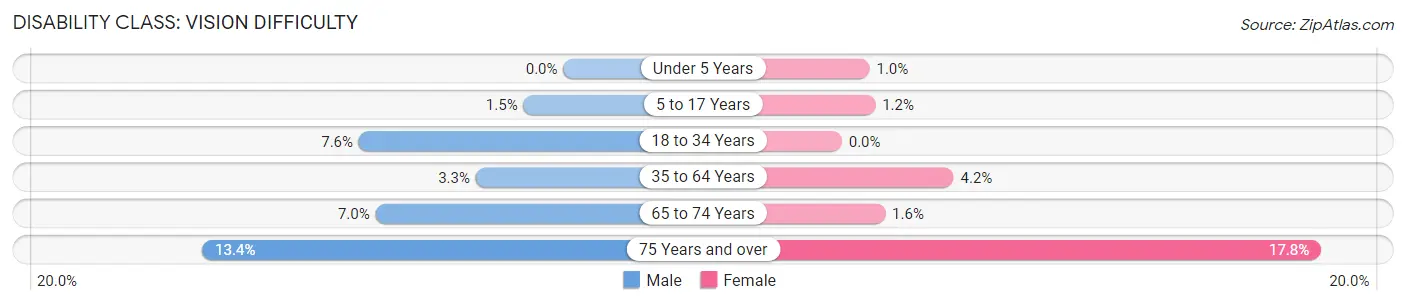
| Age Bracket | Male | Female |
| Under 5 Years | 0 (0.0%) | 8 (1.0%) |
| 5 to 17 Years | 30 (1.5%) | 30 (1.2%) |
| 18 to 34 Years | 120 (7.6%) | 0 (0.0%) |
| 35 to 64 Years | 78 (3.3%) | 108 (4.2%) |
| 65 to 74 Years | 49 (7.0%) | 12 (1.6%) |
| 75 Years and over | 70 (13.4%) | 121 (17.8%) |
Disability Class: Cognitive Difficulty
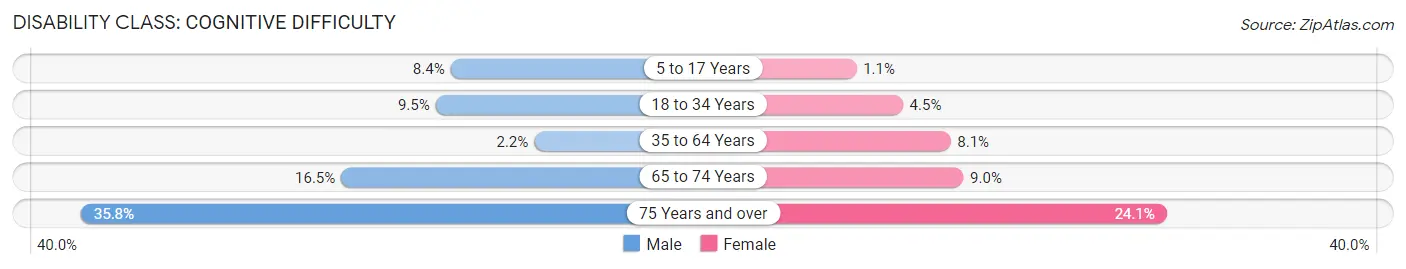
| Age Bracket | Male | Female |
| 5 to 17 Years | 170 (8.4%) | 26 (1.1%) |
| 18 to 34 Years | 150 (9.5%) | 77 (4.5%) |
| 35 to 64 Years | 52 (2.2%) | 210 (8.1%) |
| 65 to 74 Years | 116 (16.5%) | 67 (9.0%) |
| 75 Years and over | 187 (35.8%) | 164 (24.1%) |
Disability Class: Ambulatory Difficulty
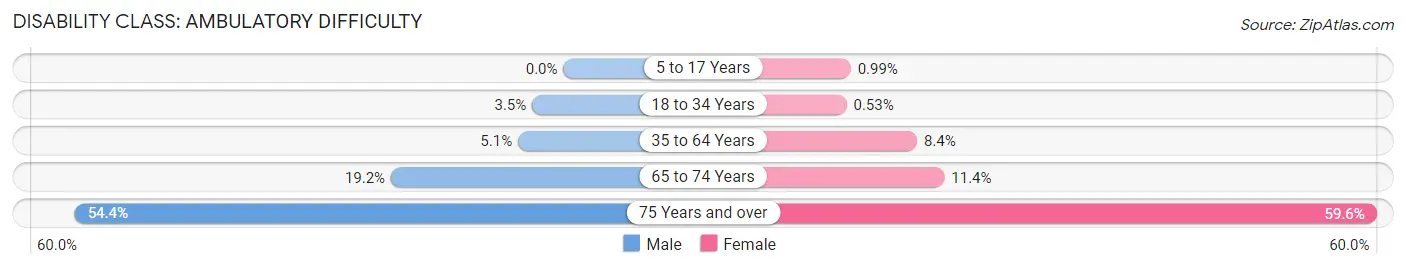
| Age Bracket | Male | Female |
| 5 to 17 Years | 0 (0.0%) | 24 (1.0%) |
| 18 to 34 Years | 55 (3.5%) | 9 (0.5%) |
| 35 to 64 Years | 121 (5.1%) | 218 (8.4%) |
| 65 to 74 Years | 135 (19.2%) | 85 (11.4%) |
| 75 Years and over | 284 (54.4%) | 405 (59.6%) |
Disability Class: Self-Care Difficulty
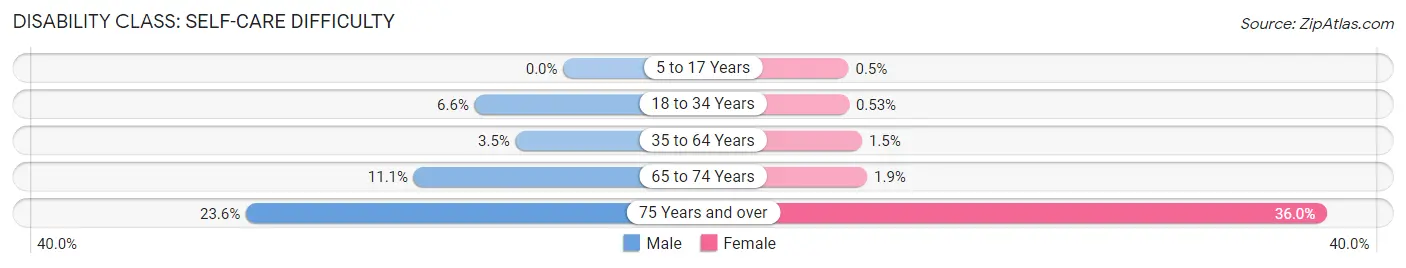
| Age Bracket | Male | Female |
| 5 to 17 Years | 0 (0.0%) | 12 (0.5%) |
| 18 to 34 Years | 104 (6.6%) | 9 (0.5%) |
| 35 to 64 Years | 85 (3.5%) | 39 (1.5%) |
| 65 to 74 Years | 78 (11.1%) | 14 (1.9%) |
| 75 Years and over | 123 (23.6%) | 245 (36.0%) |
Technology Access in Donna
Computing Device Access in Donna
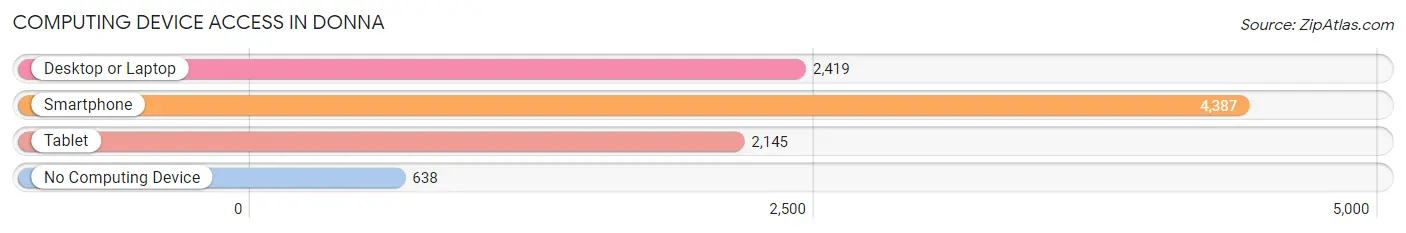
| Device Type | # Households | % Households |
| Desktop or Laptop | 2,419 | 46.8% |
| Smartphone | 4,387 | 84.8% |
| Tablet | 2,145 | 41.5% |
| No Computing Device | 638 | 12.3% |
| Total | 5,173 | 100.0% |
Internet Access in Donna
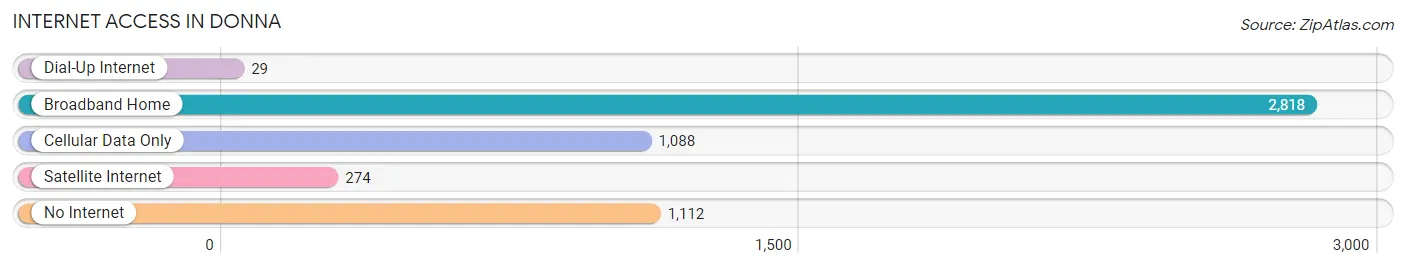
| Internet Type | # Households | % Households |
| Dial-Up Internet | 29 | 0.6% |
| Broadband Home | 2,818 | 54.5% |
| Cellular Data Only | 1,088 | 21.0% |
| Satellite Internet | 274 | 5.3% |
| No Internet | 1,112 | 21.5% |
| Total | 5,173 | 100.0% |
Donna Summary
Donna, Texas is a city located in Hidalgo County, Texas, United States. It is part of the McAllen–Edinburg–Mission Metropolitan Statistical Area. The population was 15,798 at the 2010 census, up from 11,818 at the 2000 census.
History
Donna, Texas was founded in 1910 by the Donna Land and Irrigation Company. The company was formed by a group of investors from St. Louis, Missouri, who purchased the land from the King Ranch. The town was named after Donna Hooks, the daughter of one of the investors. The town was incorporated in 1911 and the first mayor was J.W. Hooks.
In the early years, Donna was a small agricultural community, with cotton and sugar cane being the main crops. The town also had a few stores and a post office. In the 1920s, the town began to grow as more people moved to the area. The population increased from 1,000 in 1920 to 2,000 in 1930.
In the 1940s, the town began to experience a period of growth and development. The population increased to 3,000 in 1950 and 4,000 in 1960. During this time, the town also saw the construction of a new school, a hospital, and a library.
In the 1970s, the town experienced a period of decline as the population decreased to 3,000 in 1980. However, in the 1990s, the population began to increase again, reaching 11,818 in 2000.
Geography
Donna is located at 26°10'25" North, 98°6'25" West (26.173611, -98.106944). It is situated in the Rio Grande Valley of South Texas, approximately 20 miles west of McAllen and 20 miles east of Harlingen.
The city has a total area of 5.2 square miles, all of which is land. The terrain is mostly flat, with some rolling hills. The climate is subtropical, with hot summers and mild winters.
Economy
The economy of Donna is largely based on agriculture and tourism. The city is home to several large farms, which produce cotton, sugar cane, and other crops. The city is also home to several tourist attractions, including the Donna Nature Park and the Donna Historical Museum.
The city is also home to several manufacturing companies, including a plastics factory and a furniture factory. The city is also home to several retail stores, restaurants, and other businesses.
Demographics
As of the 2010 census, there were 15,798 people, 4,845 households, and 3,845 families residing in the city. The population density was 3,039.2 people per square mile. The racial makeup of the city was 77.3% White, 0.7% African American, 0.5% Native American, 0.3% Asian, 0.1% Pacific Islander, 19.2% from other races, and 2.0% from two or more races. Hispanic or Latino of any race were 97.3% of the population.
The median income for a household in the city was $25,945, and the median income for a family was $30,917. The per capita income for the city was $10,945. About 28.2% of families and 32.2% of the population were below the poverty line, including 43.3% of those under age 18 and 24.2% of those age 65 or over.
Common Questions
What is Per Capita Income in Donna?
Per Capita income in Donna is $15,605.
What is the Median Family Income in Donna?
Median Family Income in Donna is $45,417.
What is the Median Household income in Donna?
Median Household Income in Donna is $34,049.
What is Income or Wage Gap in Donna?
Income or Wage Gap in Donna is 29.0%.
Women in Donna earn 71.0 cents for every dollar earned by a man.
What is Family Income Deficit in Donna?
Family Income Deficit in Donna is $13,961.
Families that are below poverty line in Donna earn $13,961 less on average than the poverty threshold level.
What is Inequality or Gini Index in Donna?
Inequality or Gini Index in Donna is 0.48.
What is the Total Population of Donna?
Total Population of Donna is 16,742.
What is the Total Male Population of Donna?
Total Male Population of Donna is 7,817.
What is the Total Female Population of Donna?
Total Female Population of Donna is 8,925.
What is the Ratio of Males per 100 Females in Donna?
There are 87.59 Males per 100 Females in Donna.
What is the Ratio of Females per 100 Males in Donna?
There are 114.17 Females per 100 Males in Donna.
What is the Median Population Age in Donna?
Median Population Age in Donna is 30.2 Years.
What is the Average Family Size in Donna
Average Family Size in Donna is 4.1 People.
What is the Average Household Size in Donna
Average Household Size in Donna is 3.2 People.
How Large is the Labor Force in Donna?
There are 5,846 People in the Labor Forcein in Donna.
What is the Percentage of People in the Labor Force in Donna?
50.2% of People are in the Labor Force in Donna.
What is the Unemployment Rate in Donna?
Unemployment Rate in Donna is 4.2%.