Dilley, TX Map & Demographics
Dilley Map
Dilley Overview
$21,938
PER CAPITA INCOME
$101,250
AVG FAMILY INCOME
$59,044
AVG HOUSEHOLD INCOME
12.1%
WAGE / INCOME GAP [ % ]
87.9¢/ $1
WAGE / INCOME GAP [ $ ]
0.42
INEQUALITY / GINI INDEX
3,342
TOTAL POPULATION
2,384
MALE POPULATION
958
FEMALE POPULATION
248.85
MALES / 100 FEMALES
40.18
FEMALES / 100 MALES
33.2
MEDIAN AGE
4.2
AVG FAMILY SIZE
3.3
AVG HOUSEHOLD SIZE
1,361
LABOR FORCE [ PEOPLE ]
52.4%
PERCENT IN LABOR FORCE
1.5%
UNEMPLOYMENT RATE
Dilley Zip Codes
Dilley Area Codes
Income in Dilley
Income Overview in Dilley
Per Capita Income in Dilley is $21,938, while median incomes of families and households are $101,250 and $59,044 respectively.
| Characteristic | Number | Measure |
| Per Capita Income | 3,342 | $21,938 |
| Median Family Income | 528 | $101,250 |
| Mean Family Income | 528 | $86,545 |
| Median Household Income | 797 | $59,044 |
| Mean Household Income | 797 | $72,390 |
| Income Deficit | 528 | $0 |
| Wage / Income Gap (%) | 3,342 | 12.06% |
| Wage / Income Gap ($) | 3,342 | 87.94¢ per $1 |
| Gini / Inequality Index | 3,342 | 0.42 |
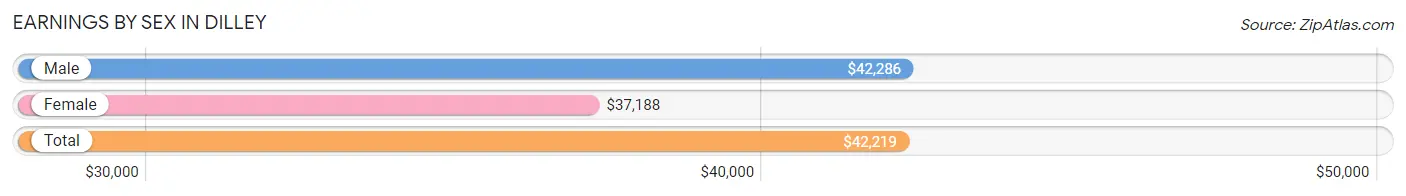
Earnings by Sex in Dilley
Average Earnings in Dilley are $42,219, $42,286 for men and $37,188 for women, a difference of 12.1%.
| Sex | Number | Average Earnings |
| Male | 984 (67.6%) | $42,286 |
| Female | 471 (32.4%) | $37,188 |
| Total | 1,455 (100.0%) | $42,219 |
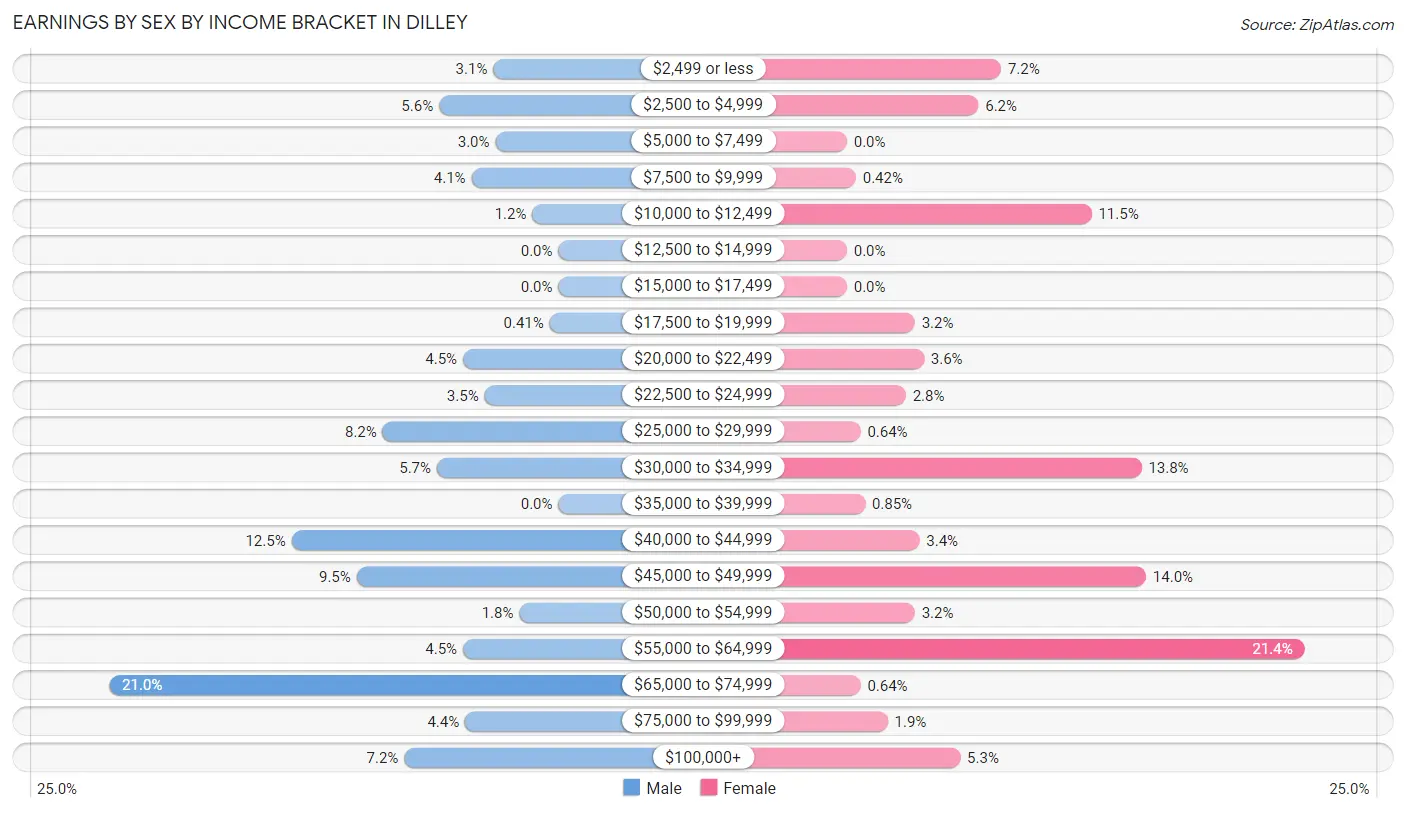
Earnings by Sex by Income Bracket in Dilley
The most common earnings brackets in Dilley are $65,000 to $74,999 for men (207 | 21.0%) and $55,000 to $64,999 for women (101 | 21.4%).
| Income | Male | Female |
| $2,499 or less | 30 (3.0%) | 34 (7.2%) |
| $2,500 to $4,999 | 55 (5.6%) | 29 (6.2%) |
| $5,000 to $7,499 | 29 (2.9%) | 0 (0.0%) |
| $7,500 to $9,999 | 40 (4.1%) | 2 (0.4%) |
| $10,000 to $12,499 | 12 (1.2%) | 54 (11.5%) |
| $12,500 to $14,999 | 0 (0.0%) | 0 (0.0%) |
| $15,000 to $17,499 | 0 (0.0%) | 0 (0.0%) |
| $17,500 to $19,999 | 4 (0.4%) | 15 (3.2%) |
| $20,000 to $22,499 | 44 (4.5%) | 17 (3.6%) |
| $22,500 to $24,999 | 34 (3.5%) | 13 (2.8%) |
| $25,000 to $29,999 | 81 (8.2%) | 3 (0.6%) |
| $30,000 to $34,999 | 56 (5.7%) | 65 (13.8%) |
| $35,000 to $39,999 | 0 (0.0%) | 4 (0.9%) |
| $40,000 to $44,999 | 123 (12.5%) | 16 (3.4%) |
| $45,000 to $49,999 | 93 (9.5%) | 66 (14.0%) |
| $50,000 to $54,999 | 18 (1.8%) | 15 (3.2%) |
| $55,000 to $64,999 | 44 (4.5%) | 101 (21.4%) |
| $65,000 to $74,999 | 207 (21.0%) | 3 (0.6%) |
| $75,000 to $99,999 | 43 (4.4%) | 9 (1.9%) |
| $100,000+ | 71 (7.2%) | 25 (5.3%) |
| Total | 984 (100.0%) | 471 (100.0%) |
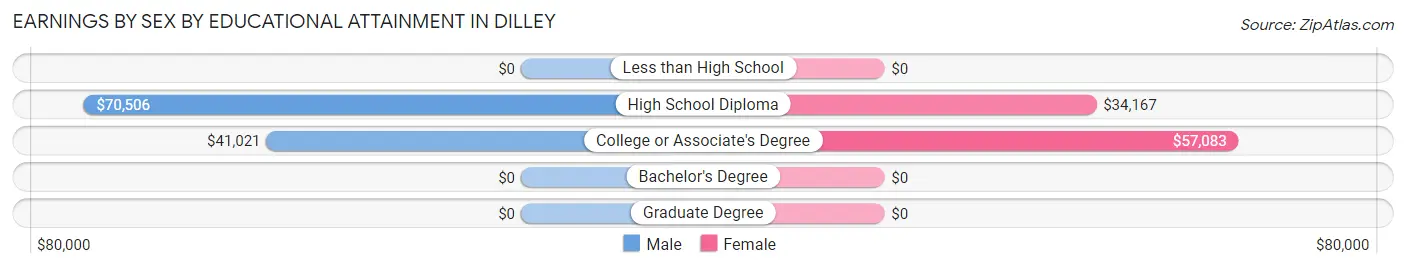
Earnings by Sex by Educational Attainment in Dilley
Average earnings in Dilley are $46,370 for men and $46,600 for women, a difference of 0.5%. Men with an educational attainment of high school diploma enjoy the highest average annual earnings of $70,506, while those with college or associate's degree education earn the least with $41,021. Women with an educational attainment of college or associate's degree earn the most with the average annual earnings of $57,083, while those with high school diploma education have the smallest earnings of $34,167.
| Educational Attainment | Male Income | Female Income |
| Less than High School | - | - |
| High School Diploma | $70,506 | $34,167 |
| College or Associate's Degree | $41,021 | $57,083 |
| Bachelor's Degree | - | - |
| Graduate Degree | - | - |
| Total | $46,370 | $46,600 |
Family Income in Dilley
Family Income Brackets in Dilley
According to the Dilley family income data, there are 241 families falling into the $100,000 to $149,999 income range, which is the most common income bracket and makes up 45.6% of all families.
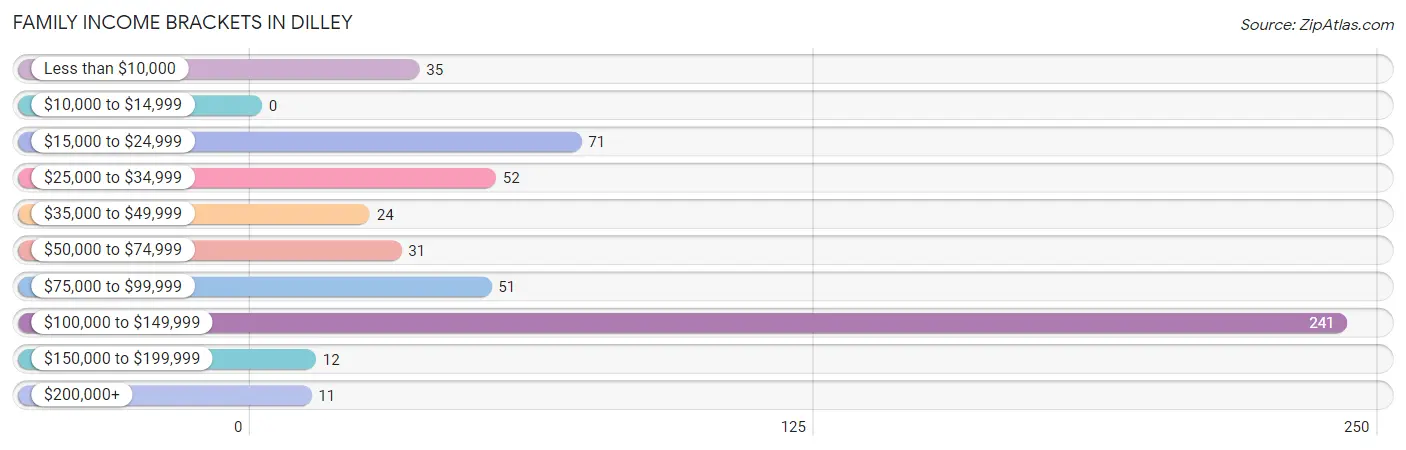
| Income Bracket | # Families | % Families |
| Less than $10,000 | 35 | 6.6% |
| $10,000 to $14,999 | 0 | 0.0% |
| $15,000 to $24,999 | 71 | 13.4% |
| $25,000 to $34,999 | 52 | 9.8% |
| $35,000 to $49,999 | 24 | 4.5% |
| $50,000 to $74,999 | 31 | 5.9% |
| $75,000 to $99,999 | 51 | 9.7% |
| $100,000 to $149,999 | 241 | 45.6% |
| $150,000 to $199,999 | 12 | 2.3% |
| $200,000+ | 11 | 2.1% |
Family Income by Famaliy Size in Dilley
4-person families (184 | 34.8%) account for the highest median family income in Dilley with $130,129 per family, while 4-person families (184 | 34.8%) have the highest median income of $32,532 per family member.
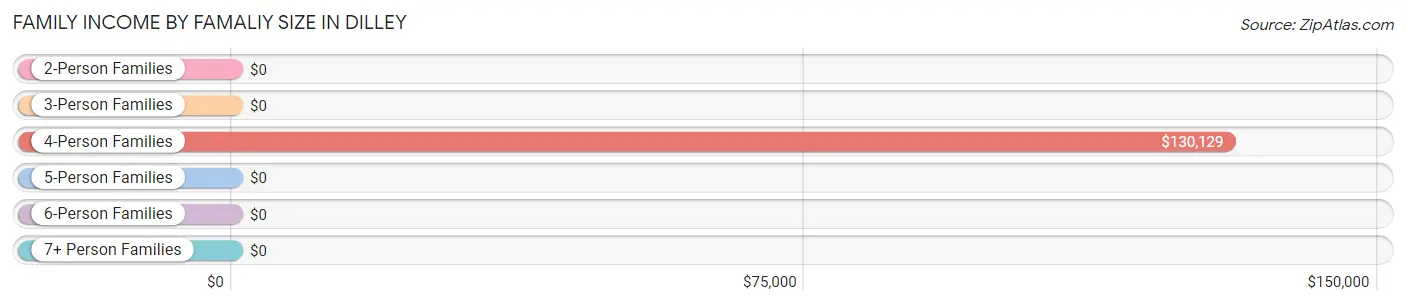
| Income Bracket | # Families | Median Income |
| 2-Person Families | 209 (39.6%) | $0 |
| 3-Person Families | 11 (2.1%) | $0 |
| 4-Person Families | 184 (34.8%) | $130,129 |
| 5-Person Families | 101 (19.1%) | $0 |
| 6-Person Families | 0 (0.0%) | $0 |
| 7+ Person Families | 23 (4.4%) | $0 |
| Total | 528 (100.0%) | $101,250 |
Family Income by Number of Earners in Dilley
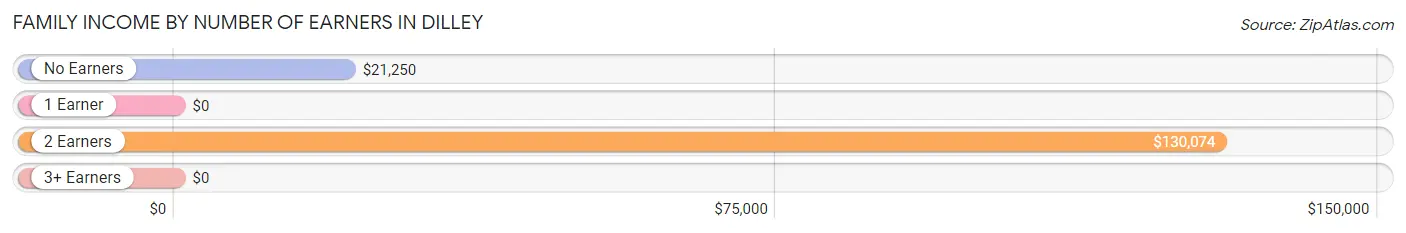
| Number of Earners | # Families | Median Income |
| No Earners | 51 (9.7%) | $21,250 |
| 1 Earner | 159 (30.1%) | $0 |
| 2 Earners | 302 (57.2%) | $130,074 |
| 3+ Earners | 16 (3.0%) | $0 |
| Total | 528 (100.0%) | $101,250 |
Household Income in Dilley
Household Income Brackets in Dilley
With 281 households falling in the category, the $100,000 to $149,999 income range is the most frequent in Dilley, accounting for 35.3% of all households. In contrast, only 11 households (1.4%) fall into the $200,000+ income bracket, making it the least populous group.
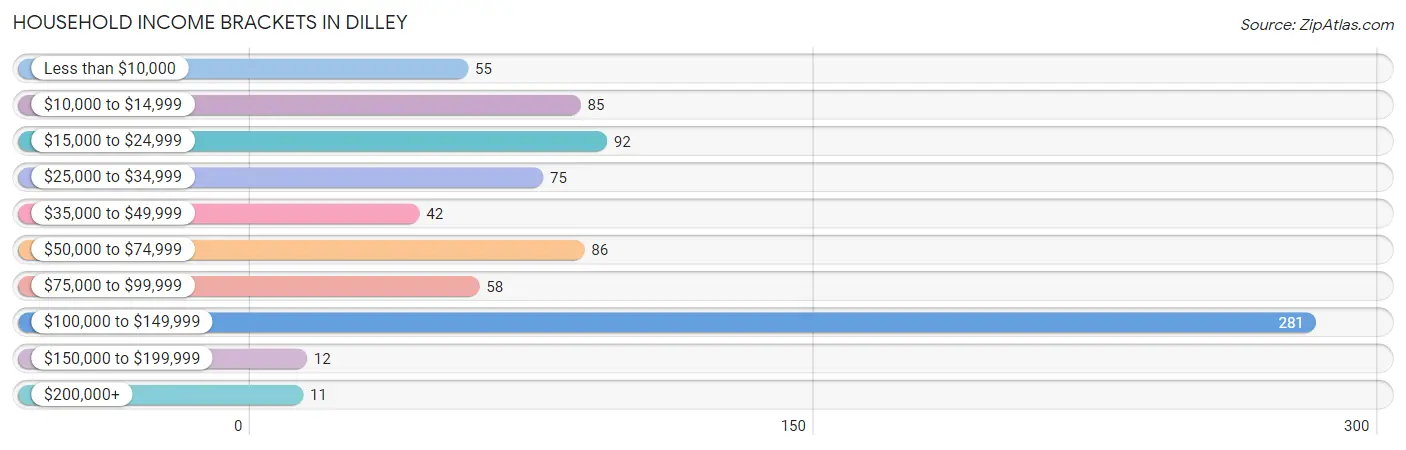
| Income Bracket | # Households | % Households |
| Less than $10,000 | 55 | 6.9% |
| $10,000 to $14,999 | 85 | 10.7% |
| $15,000 to $24,999 | 92 | 11.5% |
| $25,000 to $34,999 | 75 | 9.4% |
| $35,000 to $49,999 | 42 | 5.3% |
| $50,000 to $74,999 | 86 | 10.8% |
| $75,000 to $99,999 | 58 | 7.3% |
| $100,000 to $149,999 | 281 | 35.3% |
| $150,000 to $199,999 | 12 | 1.5% |
| $200,000+ | 11 | 1.4% |
Household Income by Householder Age in Dilley
The median household income in Dilley is $59,044, with the highest median household income of $89,063 found in the 25 to 44 years age bracket for the primary householder. A total of 335 households (42.0%) fall into this category. Meanwhile, the 15 to 24 years age bracket for the primary householder has the lowest median household income of $0, with 15 households (1.9%) in this group.
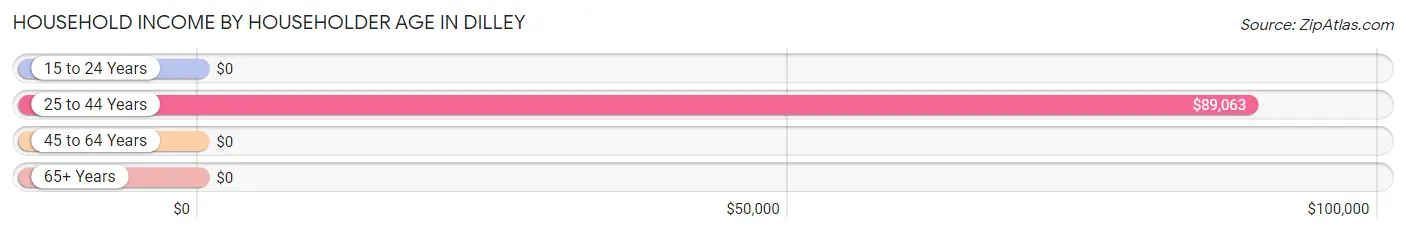
| Income Bracket | # Households | Median Income |
| 15 to 24 Years | 15 (1.9%) | $0 |
| 25 to 44 Years | 335 (42.0%) | $89,063 |
| 45 to 64 Years | 228 (28.6%) | $0 |
| 65+ Years | 219 (27.5%) | $0 |
| Total | 797 (100.0%) | $59,044 |
Poverty in Dilley
Income Below Poverty by Sex and Age in Dilley
With 11.9% poverty level for males and 23.0% for females among the residents of Dilley, 25 to 34 year old males and under 5 year old females are the most vulnerable to poverty, with 49 males (68.1%) and 22 females (52.4%) in their respective age groups living below the poverty level.
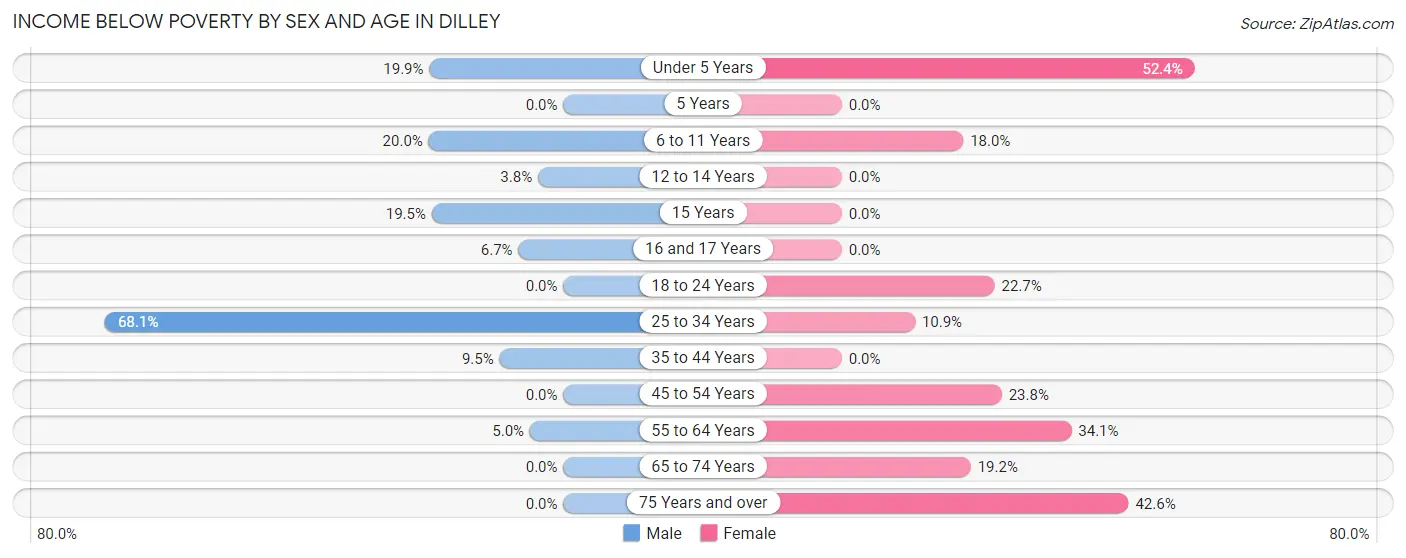
| Age Bracket | Male | Female |
| Under 5 Years | 40 (19.9%) | 22 (52.4%) |
| 5 Years | 0 (0.0%) | 0 (0.0%) |
| 6 to 11 Years | 38 (20.0%) | 11 (18.0%) |
| 12 to 14 Years | 4 (3.8%) | 0 (0.0%) |
| 15 Years | 17 (19.5%) | 0 (0.0%) |
| 16 and 17 Years | 3 (6.7%) | 0 (0.0%) |
| 18 to 24 Years | 0 (0.0%) | 22 (22.7%) |
| 25 to 34 Years | 49 (68.1%) | 19 (10.9%) |
| 35 to 44 Years | 43 (9.5%) | 0 (0.0%) |
| 45 to 54 Years | 0 (0.0%) | 19 (23.7%) |
| 55 to 64 Years | 6 (5.0%) | 45 (34.1%) |
| 65 to 74 Years | 0 (0.0%) | 9 (19.2%) |
| 75 Years and over | 0 (0.0%) | 63 (42.6%) |
| Total | 200 (11.9%) | 210 (23.0%) |
Income Above Poverty by Sex and Age in Dilley
According to the poverty statistics in Dilley, males aged 18 to 24 years and females aged 5 years are the age groups that are most secure financially, with 100.0% of males and 100.0% of females in these age groups living above the poverty line.
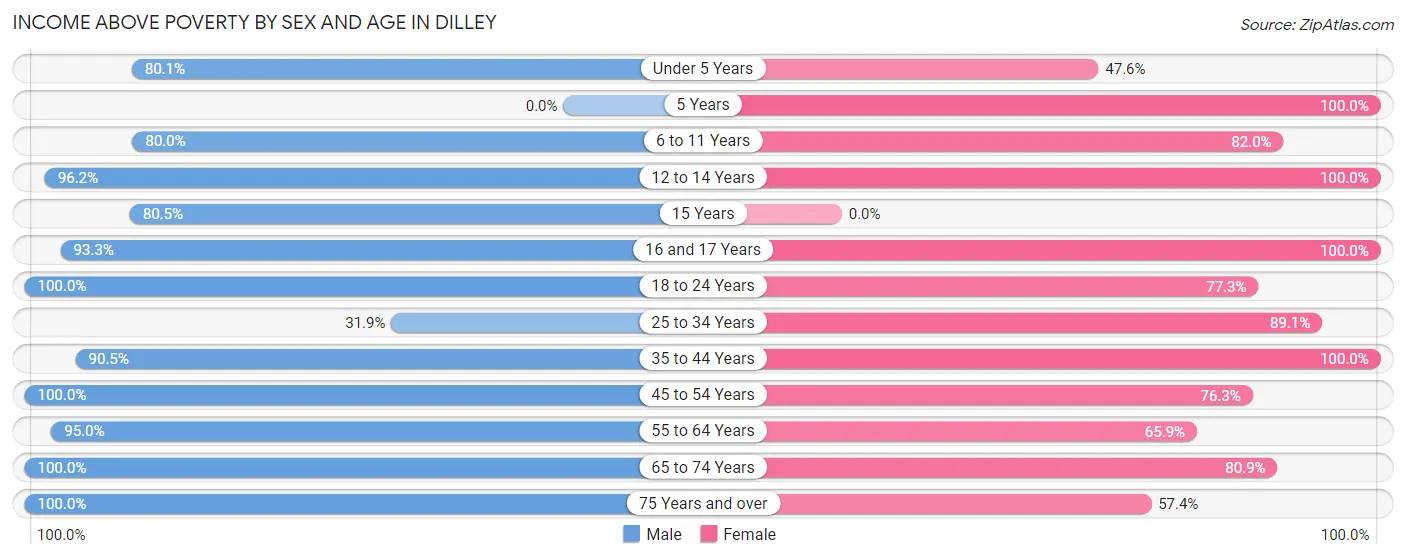
| Age Bracket | Male | Female |
| Under 5 Years | 161 (80.1%) | 20 (47.6%) |
| 5 Years | 0 (0.0%) | 14 (100.0%) |
| 6 to 11 Years | 152 (80.0%) | 50 (82.0%) |
| 12 to 14 Years | 102 (96.2%) | 25 (100.0%) |
| 15 Years | 70 (80.5%) | 0 (0.0%) |
| 16 and 17 Years | 42 (93.3%) | 12 (100.0%) |
| 18 to 24 Years | 171 (100.0%) | 75 (77.3%) |
| 25 to 34 Years | 23 (31.9%) | 156 (89.1%) |
| 35 to 44 Years | 411 (90.5%) | 82 (100.0%) |
| 45 to 54 Years | 138 (100.0%) | 61 (76.2%) |
| 55 to 64 Years | 115 (95.0%) | 87 (65.9%) |
| 65 to 74 Years | 35 (100.0%) | 38 (80.8%) |
| 75 Years and over | 64 (100.0%) | 85 (57.4%) |
| Total | 1,484 (88.1%) | 705 (77.0%) |
Income Below Poverty Among Married-Couple Families in Dilley
The poverty statistics for married-couple families in Dilley show that 20.2% or 84 of the total 415 families live below the poverty line. Families with 5 or more children have the highest poverty rate of 100.0%, comprising of 8 families. On the other hand, families with no children have the lowest poverty rate of 4.6%, which includes 6 families.
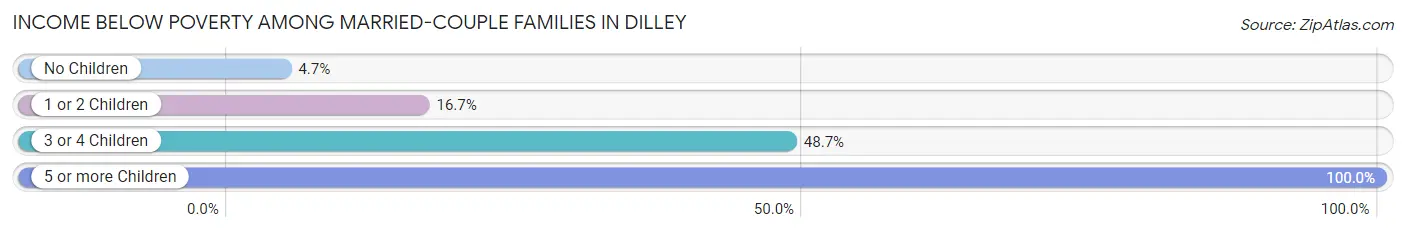
| Children | Above Poverty | Below Poverty |
| No Children | 123 (95.4%) | 6 (4.6%) |
| 1 or 2 Children | 170 (83.3%) | 34 (16.7%) |
| 3 or 4 Children | 38 (51.3%) | 36 (48.6%) |
| 5 or more Children | 0 (0.0%) | 8 (100.0%) |
| Total | 331 (79.8%) | 84 (20.2%) |
Income Below Poverty Among Single-Parent Households in Dilley
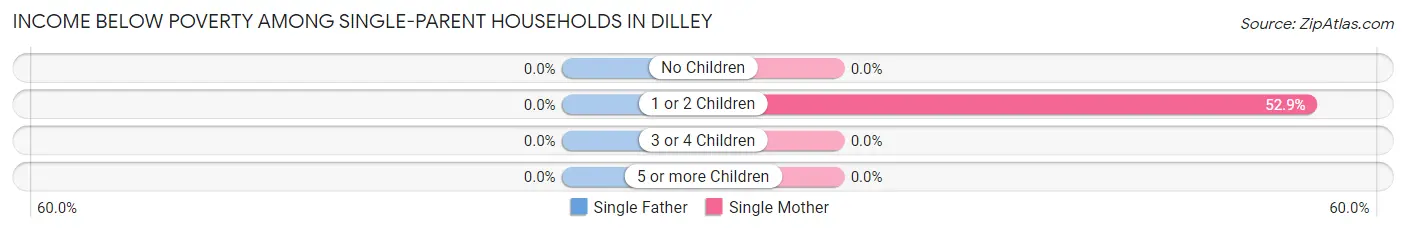
| Children | Single Father | Single Mother |
| No Children | 0 (0.0%) | 0 (0.0%) |
| 1 or 2 Children | 0 (0.0%) | 9 (52.9%) |
| 3 or 4 Children | 0 (0.0%) | 0 (0.0%) |
| 5 or more Children | 0 (0.0%) | 0 (0.0%) |
| Total | 0 (0.0%) | 9 (15.2%) |
Income Below Poverty Among Married-Couple vs Single-Parent Households in Dilley
The poverty data for Dilley shows that 84 of the married-couple family households (20.2%) and 9 of the single-parent households (8.0%) are living below the poverty level. Within the married-couple family households, those with 5 or more children have the highest poverty rate, with 8 households (100.0%) falling below the poverty line. Among the single-parent households, those with 1 or 2 children have the highest poverty rate, with 9 household (33.3%) living below poverty.
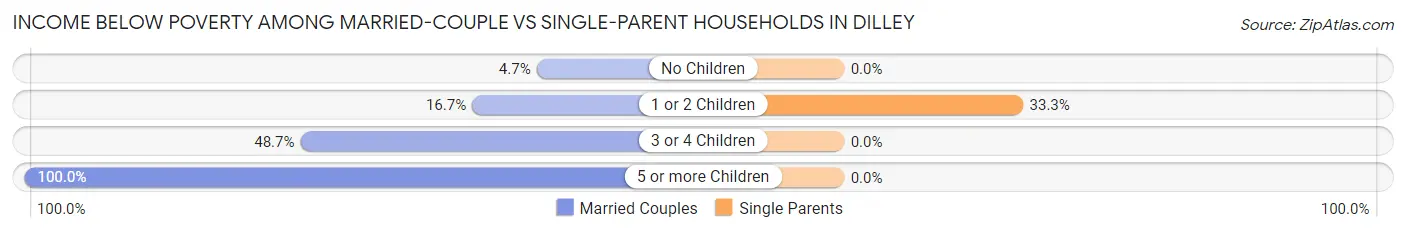
| Children | Married-Couple Families | Single-Parent Households |
| No Children | 6 (4.6%) | 0 (0.0%) |
| 1 or 2 Children | 34 (16.7%) | 9 (33.3%) |
| 3 or 4 Children | 36 (48.6%) | 0 (0.0%) |
| 5 or more Children | 8 (100.0%) | 0 (0.0%) |
| Total | 84 (20.2%) | 9 (8.0%) |
Race in Dilley
The most populous races in Dilley are Hispanic or Latino (2,775 | 83.0%), White / Caucasian (2,170 | 64.9%), and Two or more Races (923 | 27.6%).
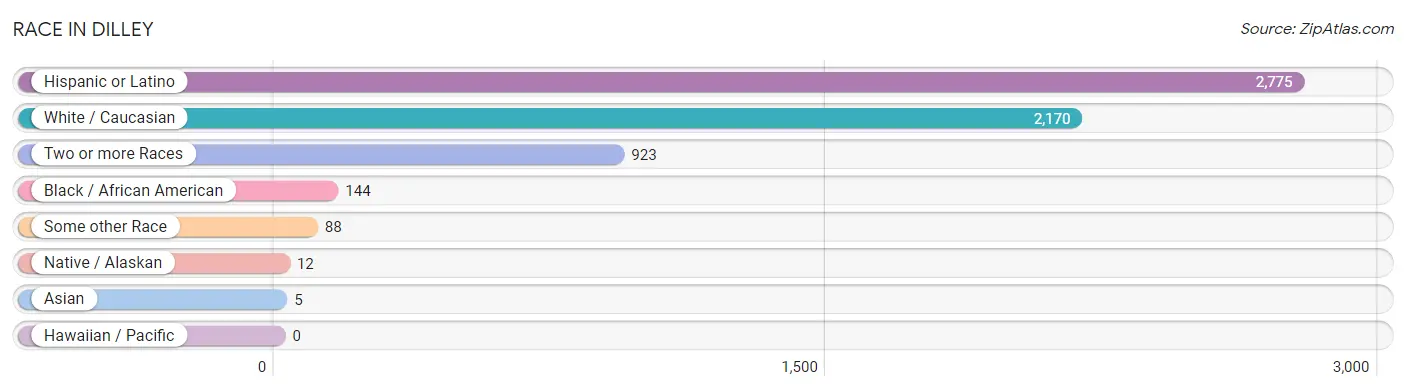
| Race | # Population | % Population |
| Asian | 5 | 0.2% |
| Black / African American | 144 | 4.3% |
| Hawaiian / Pacific | 0 | 0.0% |
| Hispanic or Latino | 2,775 | 83.0% |
| Native / Alaskan | 12 | 0.4% |
| White / Caucasian | 2,170 | 64.9% |
| Two or more Races | 923 | 27.6% |
| Some other Race | 88 | 2.6% |
| Total | 3,342 | 100.0% |
Ancestry in Dilley
The most populous ancestries reported in Dilley are Mexican (2,507 | 75.0%), Irish (198 | 5.9%), Spanish (173 | 5.2%), American (165 | 4.9%), and English (69 | 2.1%), together accounting for 93.1% of all Dilley residents.
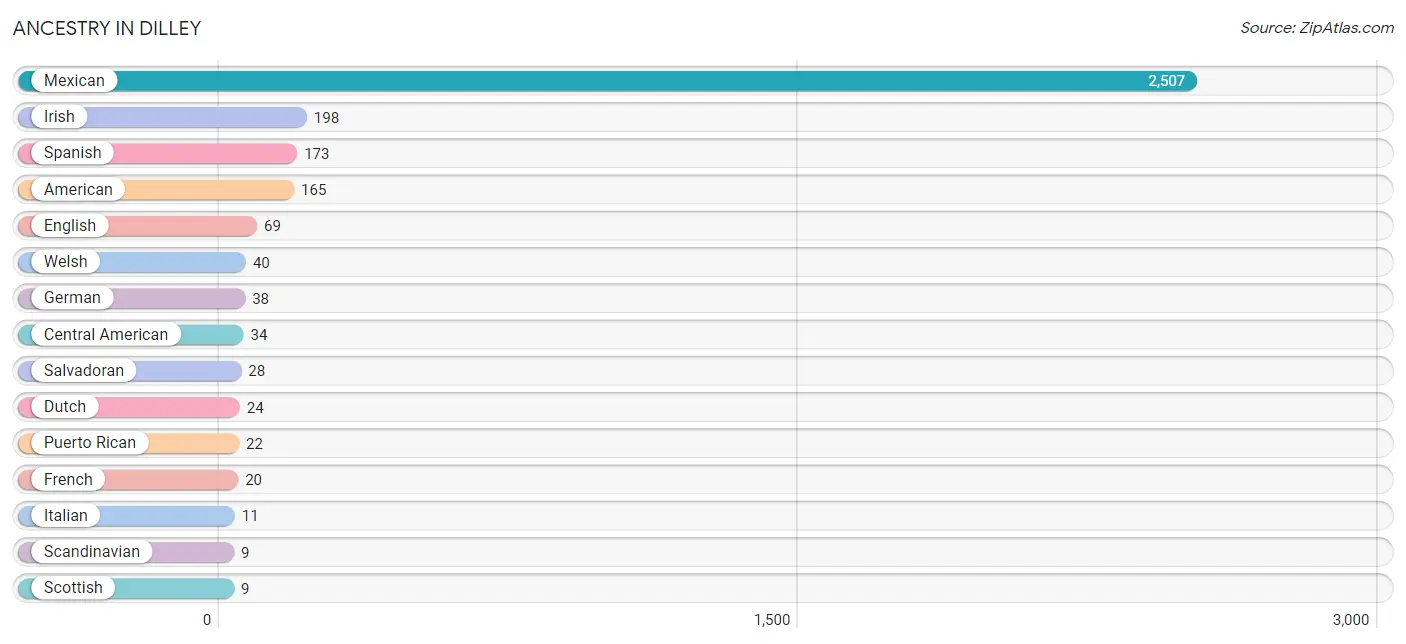
| Ancestry | # Population | % Population |
| African | 5 | 0.2% |
| American | 165 | 4.9% |
| Apache | 6 | 0.2% |
| Blackfeet | 5 | 0.2% |
| Burmese | 5 | 0.2% |
| Central American | 34 | 1.0% |
| Cherokee | 1 | 0.0% |
| Cuban | 6 | 0.2% |
| Dutch | 24 | 0.7% |
| English | 69 | 2.1% |
| French | 20 | 0.6% |
| French Canadian | 1 | 0.0% |
| German | 38 | 1.1% |
| Guatemalan | 6 | 0.2% |
| Irish | 198 | 5.9% |
| Italian | 11 | 0.3% |
| Mexican | 2,507 | 75.0% |
| Mexican American Indian | 6 | 0.2% |
| Norwegian | 5 | 0.2% |
| Polish | 3 | 0.1% |
| Puerto Rican | 22 | 0.7% |
| Salvadoran | 28 | 0.8% |
| Scandinavian | 9 | 0.3% |
| Scottish | 9 | 0.3% |
| Spanish | 173 | 5.2% |
| Subsaharan African | 5 | 0.2% |
| Welsh | 40 | 1.2% | View All 27 Rows |
Immigrants in Dilley
The most numerous immigrant groups reported in Dilley came from Central America (128 | 3.8%), Latin America (128 | 3.8%), Mexico (94 | 2.8%), El Salvador (28 | 0.8%), and Honduras (6 | 0.2%), together accounting for 11.5% of all Dilley residents.
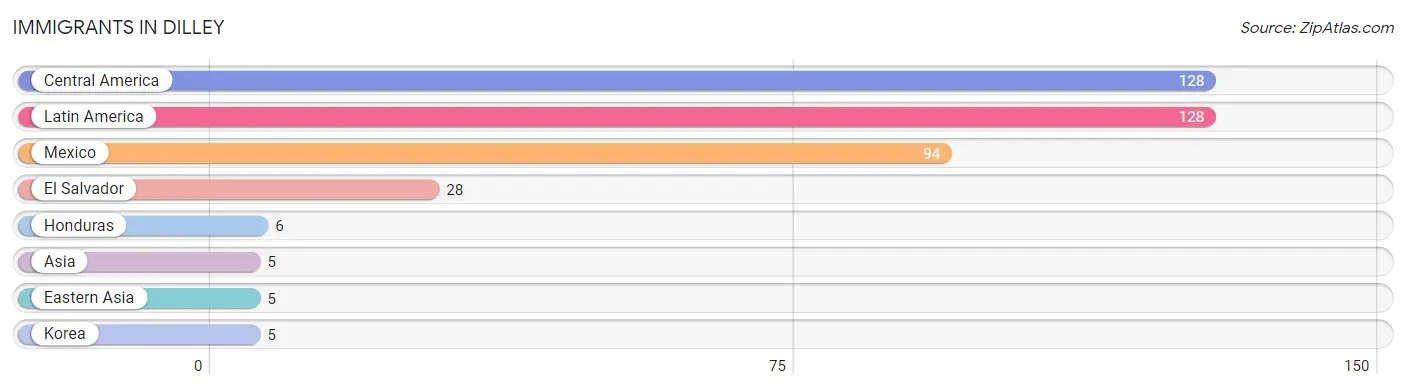
| Immigration Origin | # Population | % Population |
| Asia | 5 | 0.2% |
| Central America | 128 | 3.8% |
| Eastern Asia | 5 | 0.2% |
| El Salvador | 28 | 0.8% |
| Honduras | 6 | 0.2% |
| Korea | 5 | 0.2% |
| Latin America | 128 | 3.8% |
| Mexico | 94 | 2.8% | View All 8 Rows |
Sex and Age in Dilley
Sex and Age in Dilley
The most populous age groups in Dilley are 35 to 39 Years (436 | 18.3%) for men and 30 to 34 Years (116 | 12.1%) for women.
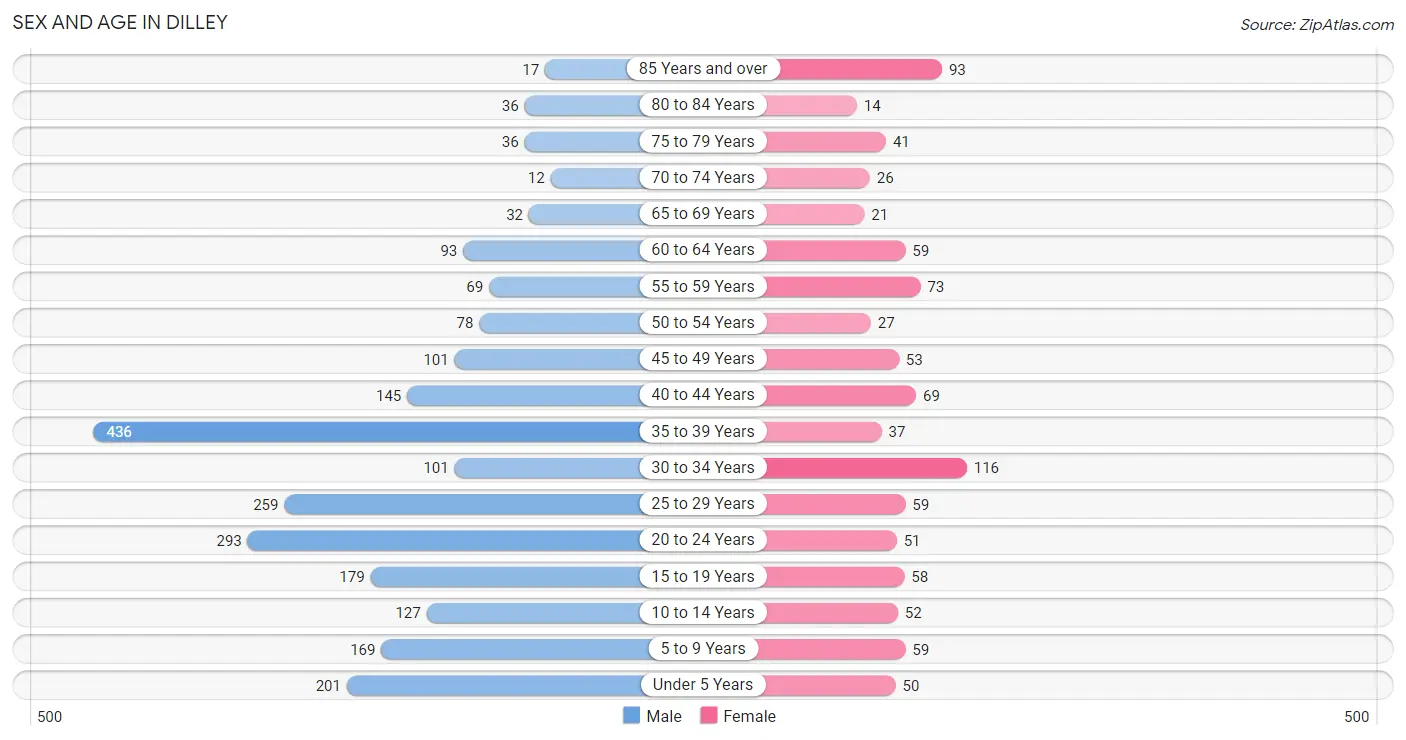
| Age Bracket | Male | Female |
| Under 5 Years | 201 (8.4%) | 50 (5.2%) |
| 5 to 9 Years | 169 (7.1%) | 59 (6.2%) |
| 10 to 14 Years | 127 (5.3%) | 52 (5.4%) |
| 15 to 19 Years | 179 (7.5%) | 58 (6.0%) |
| 20 to 24 Years | 293 (12.3%) | 51 (5.3%) |
| 25 to 29 Years | 259 (10.9%) | 59 (6.2%) |
| 30 to 34 Years | 101 (4.2%) | 116 (12.1%) |
| 35 to 39 Years | 436 (18.3%) | 37 (3.9%) |
| 40 to 44 Years | 145 (6.1%) | 69 (7.2%) |
| 45 to 49 Years | 101 (4.2%) | 53 (5.5%) |
| 50 to 54 Years | 78 (3.3%) | 27 (2.8%) |
| 55 to 59 Years | 69 (2.9%) | 73 (7.6%) |
| 60 to 64 Years | 93 (3.9%) | 59 (6.2%) |
| 65 to 69 Years | 32 (1.3%) | 21 (2.2%) |
| 70 to 74 Years | 12 (0.5%) | 26 (2.7%) |
| 75 to 79 Years | 36 (1.5%) | 41 (4.3%) |
| 80 to 84 Years | 36 (1.5%) | 14 (1.5%) |
| 85 Years and over | 17 (0.7%) | 93 (9.7%) |
| Total | 2,384 (100.0%) | 958 (100.0%) |
Families and Households in Dilley
Median Family Size in Dilley
The median family size in Dilley is 4.25 persons per family, with single female/mother families (59 | 11.2%) accounting for the largest median family size of 6.59 persons per family. On the other hand, single male/father families (54 | 10.2%) represent the smallest median family size with 1.83 persons per family.
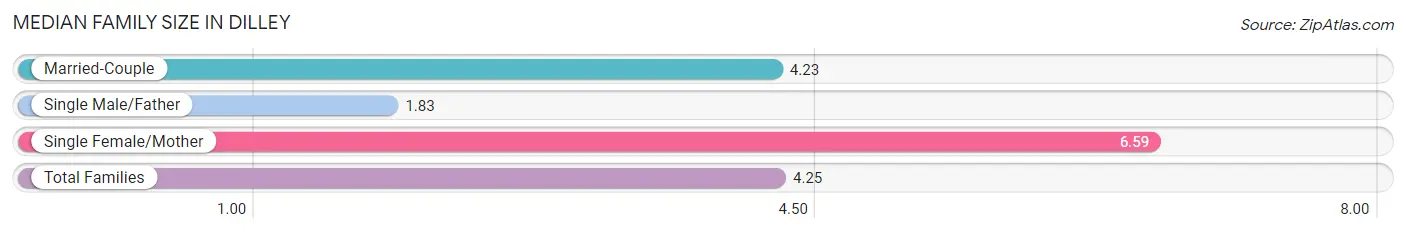
| Family Type | # Families | Family Size |
| Married-Couple | 415 (78.6%) | 4.23 |
| Single Male/Father | 54 (10.2%) | 1.83 |
| Single Female/Mother | 59 (11.2%) | 6.59 |
| Total Families | 528 (100.0%) | 4.25 |
Median Household Size in Dilley
The median household size in Dilley is 3.28 persons per household, with single female/mother households (59 | 7.4%) accounting for the largest median household size of 6.95 persons per household. non-family households (269 | 33.8%) represent the smallest median household size with 1.32 persons per household.
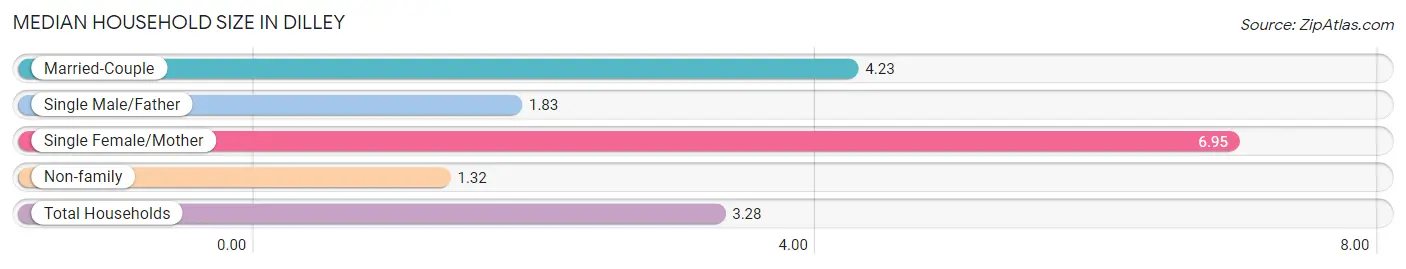
| Household Type | # Households | Household Size |
| Married-Couple | 415 (52.1%) | 4.23 |
| Single Male/Father | 54 (6.8%) | 1.83 |
| Single Female/Mother | 59 (7.4%) | 6.95 |
| Non-family | 269 (33.8%) | 1.32 |
| Total Households | 797 (100.0%) | 3.28 |
Household Size by Marriage Status in Dilley
Out of a total of 797 households in Dilley, 528 (66.2%) are family households, while 269 (33.8%) are nonfamily households. The most numerous type of family households are 2-person households, comprising 205, and the most common type of nonfamily households are 1-person households, comprising 207.
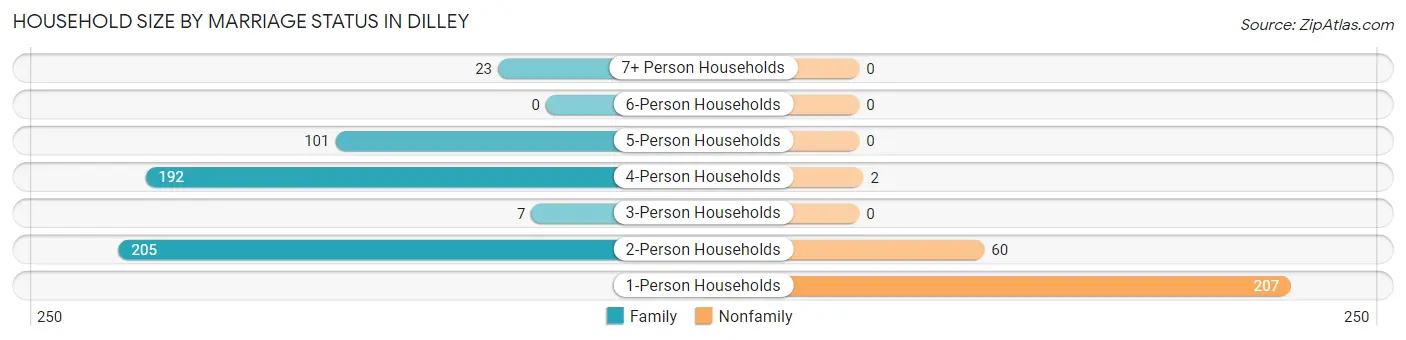
| Household Size | Family Households | Nonfamily Households |
| 1-Person Households | - | 207 (26.0%) |
| 2-Person Households | 205 (25.7%) | 60 (7.5%) |
| 3-Person Households | 7 (0.9%) | 0 (0.0%) |
| 4-Person Households | 192 (24.1%) | 2 (0.3%) |
| 5-Person Households | 101 (12.7%) | 0 (0.0%) |
| 6-Person Households | 0 (0.0%) | 0 (0.0%) |
| 7+ Person Households | 23 (2.9%) | 0 (0.0%) |
| Total | 528 (66.2%) | 269 (33.8%) |
Female Fertility in Dilley
Fertility by Age in Dilley
Average fertility rate in Dilley is 352.0 births per 1,000 women. Women in the age bracket of 20 to 34 years have the highest fertility rate with 527.0 births per 1,000 women. Women in the age bracket of 20 to 34 years acount for 74.8% of all women with births.
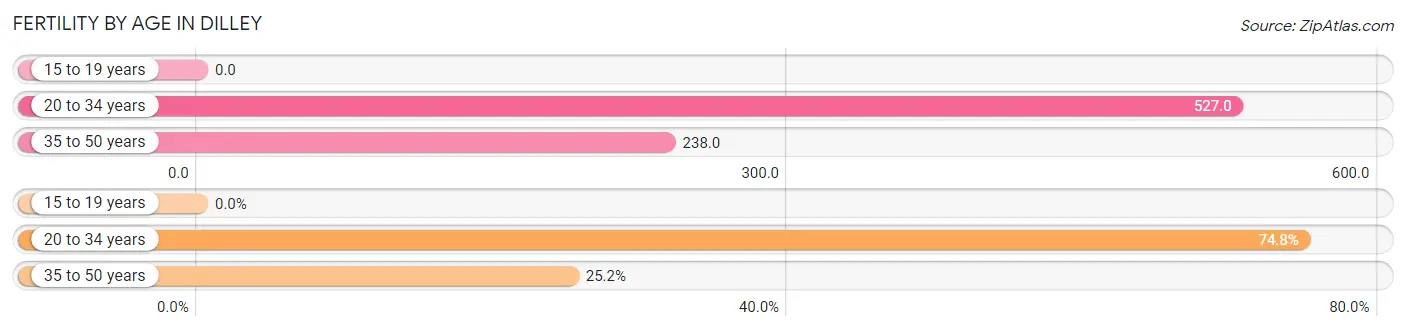
| Age Bracket | Women with Births | Births / 1,000 Women |
| 15 to 19 years | 0 (0.0%) | 0.0 |
| 20 to 34 years | 119 (74.8%) | 527.0 |
| 35 to 50 years | 40 (25.2%) | 238.0 |
| Total | 159 (100.0%) | 352.0 |
Fertility by Age by Marriage Status in Dilley
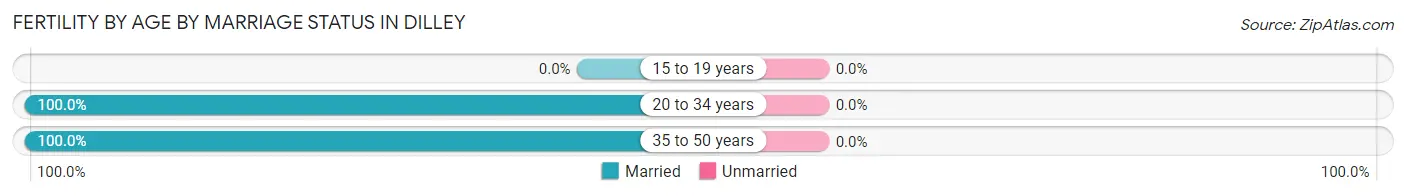
| Age Bracket | Married | Unmarried |
| 15 to 19 years | 0 (0.0%) | 0 (0.0%) |
| 20 to 34 years | 119 (100.0%) | 0 (0.0%) |
| 35 to 50 years | 40 (100.0%) | 0 (0.0%) |
| Total | 159 (100.0%) | 0 (0.0%) |
Fertility by Education in Dilley
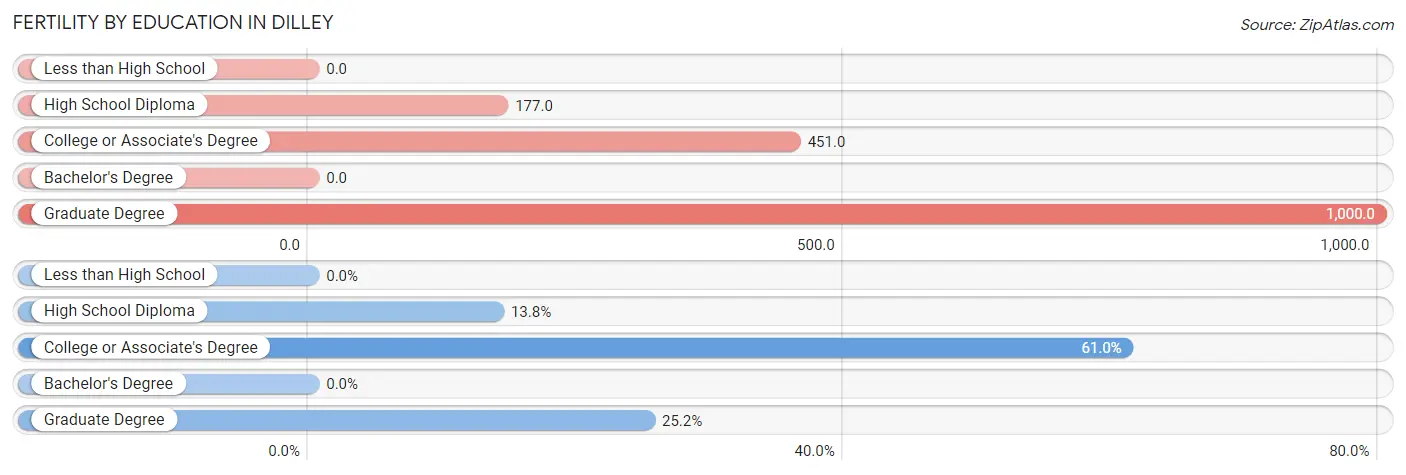
| Educational Attainment | Women with Births | Births / 1,000 Women |
| Less than High School | 0 (0.0%) | 0.0 |
| High School Diploma | 22 (13.8%) | 177.0 |
| College or Associate's Degree | 97 (61.0%) | 451.0 |
| Bachelor's Degree | 0 (0.0%) | 0.0 |
| Graduate Degree | 40 (25.2%) | 1,000.0 |
| Total | 159 (100.0%) | 352.0 |
Fertility by Education by Marriage Status in Dilley
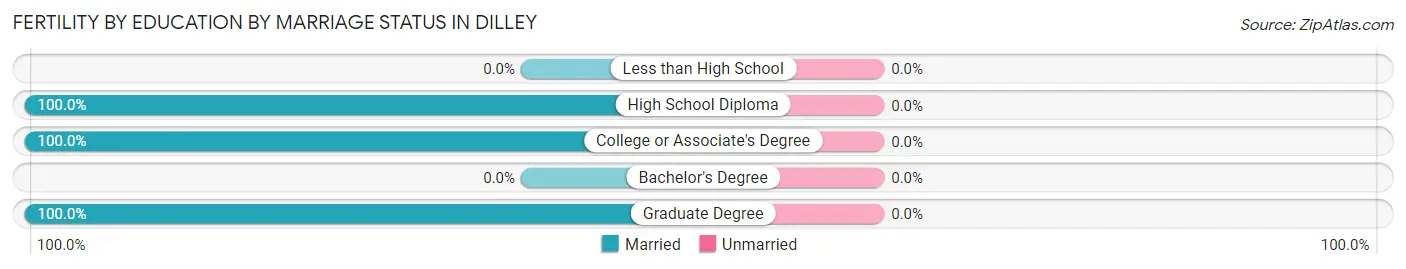
| Educational Attainment | Married | Unmarried |
| Less than High School | 0 (0.0%) | 0 (0.0%) |
| High School Diploma | 22 (100.0%) | 0 (0.0%) |
| College or Associate's Degree | 97 (100.0%) | 0 (0.0%) |
| Bachelor's Degree | 0 (0.0%) | 0 (0.0%) |
| Graduate Degree | 40 (100.0%) | 0 (0.0%) |
| Total | 159 (100.0%) | 0 (0.0%) |
Employment Characteristics in Dilley
Employment by Class of Employer in Dilley
Among the 1,341 employed individuals in Dilley, private company employees (892 | 66.5%), state government employees (142 | 10.6%), and self-employed (not incorporated) (97 | 7.2%) make up the most common classes of employment.
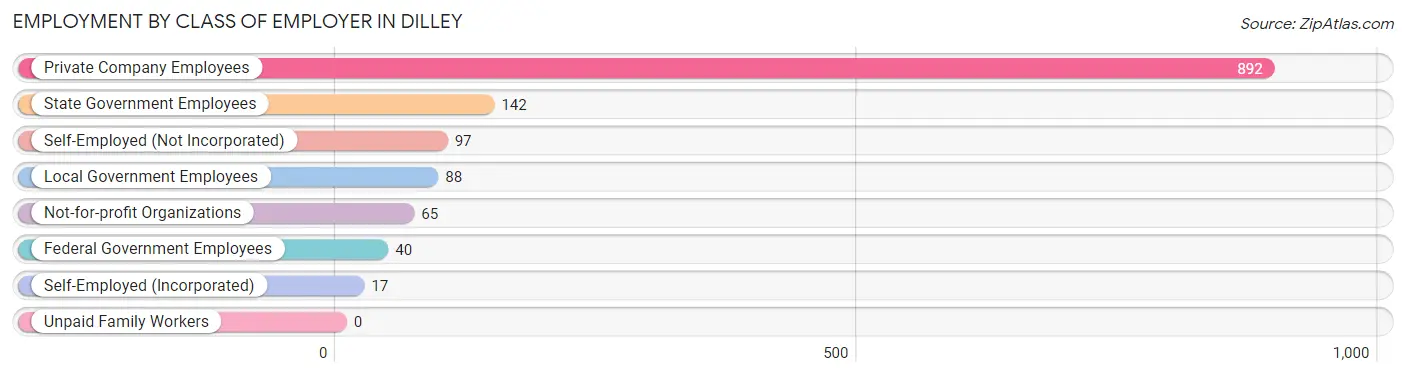
| Employer Class | # Employees | % Employees |
| Private Company Employees | 892 | 66.5% |
| Self-Employed (Incorporated) | 17 | 1.3% |
| Self-Employed (Not Incorporated) | 97 | 7.2% |
| Not-for-profit Organizations | 65 | 4.9% |
| Local Government Employees | 88 | 6.6% |
| State Government Employees | 142 | 10.6% |
| Federal Government Employees | 40 | 3.0% |
| Unpaid Family Workers | 0 | 0.0% |
| Total | 1,341 | 100.0% |
Employment Status by Age in Dilley
According to the labor force statistics for Dilley, out of the total population over 16 years of age (2,597), 52.4% or 1,361 individuals are in the labor force, with 1.5% or 20 of them unemployed. The age group with the highest labor force participation rate is 45 to 54 years, with 76.1% or 197 individuals in the labor force. Within the labor force, the 55 to 59 years age range has the highest percentage of unemployed individuals, with 9.4% or 6 of them being unemployed.
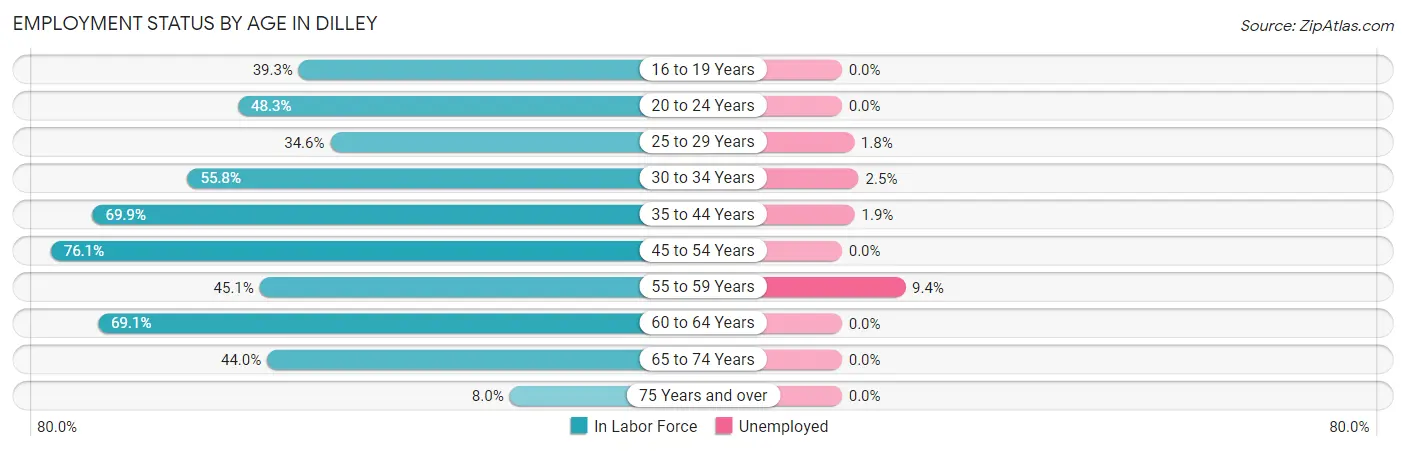
| Age Bracket | In Labor Force | Unemployed |
| 16 to 19 Years | 59 (39.3%) | 0 (0.0%) |
| 20 to 24 Years | 166 (48.3%) | 0 (0.0%) |
| 25 to 29 Years | 110 (34.6%) | 2 (1.8%) |
| 30 to 34 Years | 121 (55.8%) | 3 (2.5%) |
| 35 to 44 Years | 480 (69.9%) | 9 (1.9%) |
| 45 to 54 Years | 197 (76.1%) | 0 (0.0%) |
| 55 to 59 Years | 64 (45.1%) | 6 (9.4%) |
| 60 to 64 Years | 105 (69.1%) | 0 (0.0%) |
| 65 to 74 Years | 40 (44.0%) | 0 (0.0%) |
| 75 Years and over | 19 (8.0%) | 0 (0.0%) |
| Total | 1,361 (52.4%) | 20 (1.5%) |
Employment Status by Educational Attainment in Dilley
According to labor force statistics for Dilley, 60.7% of individuals (1,077) out of the total population between 25 and 64 years of age (1,775) are in the labor force, with 1.9% or 20 of them being unemployed. The group with the highest labor force participation rate are those with the educational attainment of bachelor's degree or higher, with 78.1% or 132 individuals in the labor force. Within the labor force, individuals with bachelor's degree or higher education have the highest percentage of unemployment, with 4.5% or 6 of them being unemployed.
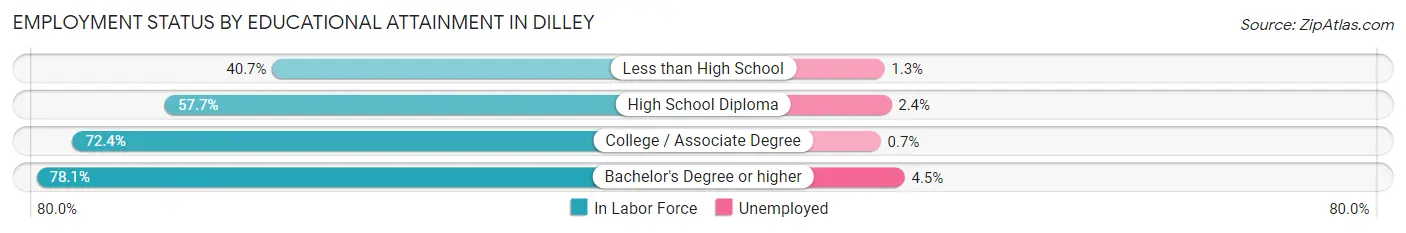
| Educational Attainment | In Labor Force | Unemployed |
| Less than High School | 156 (40.7%) | 5 (1.3%) |
| High School Diploma | 379 (57.7%) | 16 (2.4%) |
| College / Associate Degree | 410 (72.4%) | 4 (0.7%) |
| Bachelor's Degree or higher | 132 (78.1%) | 8 (4.5%) |
| Total | 1,077 (60.7%) | 34 (1.9%) |
Employment Occupations by Sex in Dilley
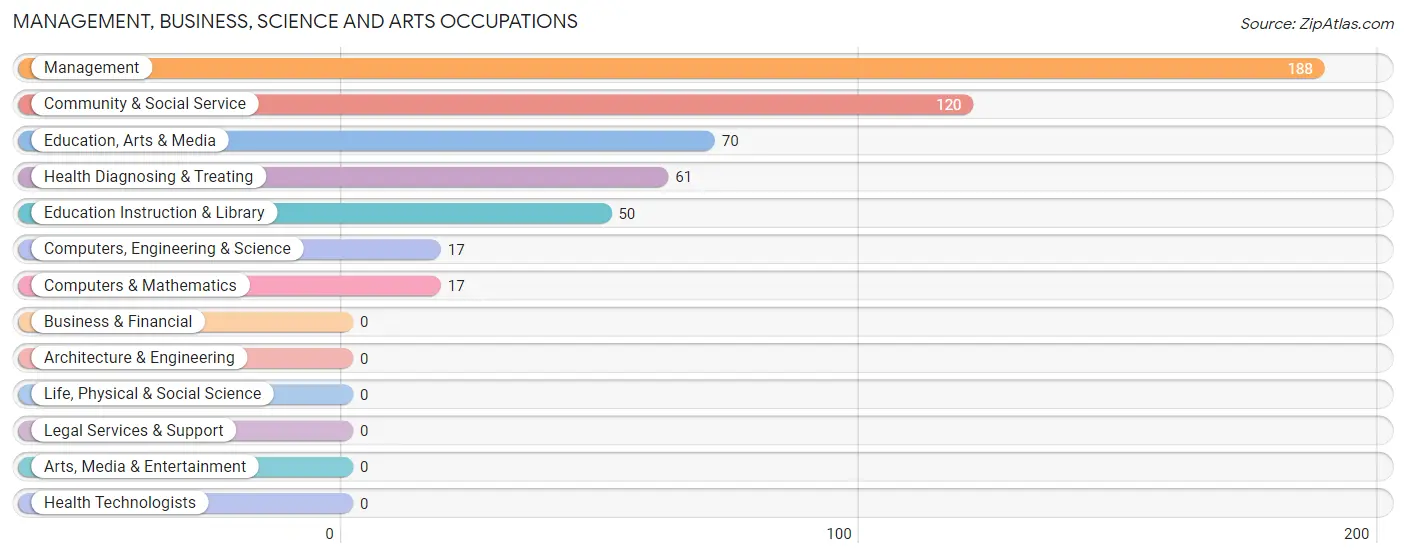
Management, Business, Science and Arts Occupations
The most common Management, Business, Science and Arts occupations in Dilley are Management (188 | 14.0%), Community & Social Service (120 | 8.9%), Education, Arts & Media (70 | 5.2%), Health Diagnosing & Treating (61 | 4.5%), and Education Instruction & Library (50 | 3.7%).
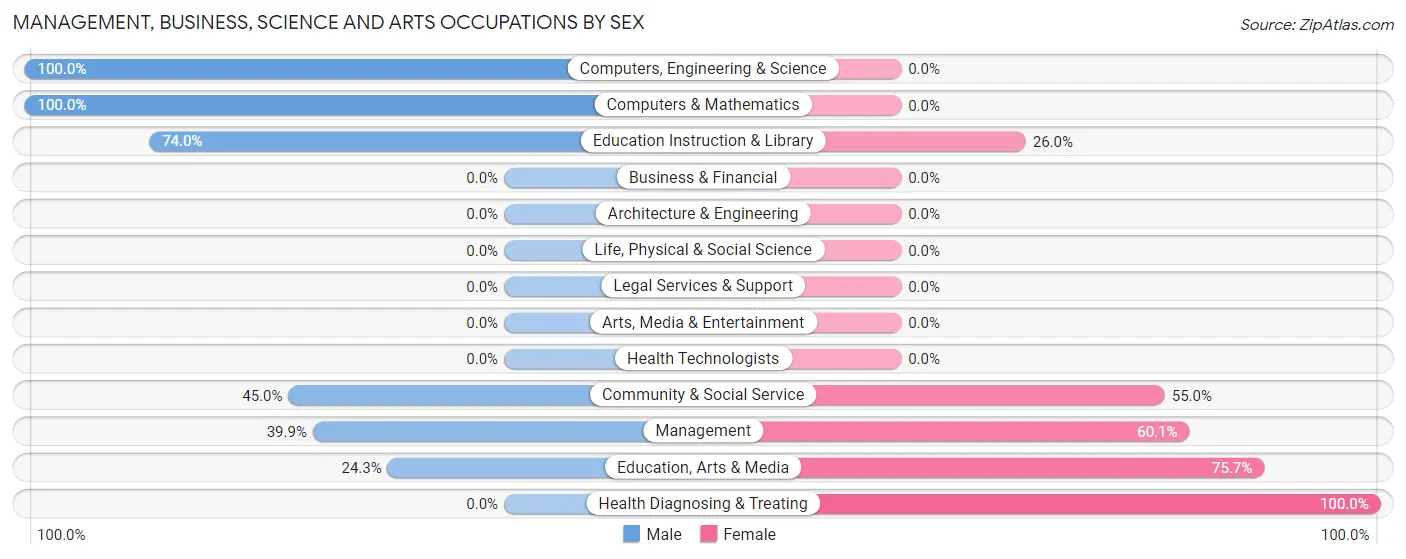
Management, Business, Science and Arts Occupations by Sex
Within the Management, Business, Science and Arts occupations in Dilley, the most male-oriented occupations are Computers, Engineering & Science (100.0%), Computers & Mathematics (100.0%), and Education Instruction & Library (74.0%), while the most female-oriented occupations are Health Diagnosing & Treating (100.0%), Education, Arts & Media (75.7%), and Management (60.1%).
| Occupation | Male | Female |
| Management | 75 (39.9%) | 113 (60.1%) |
| Business & Financial | 0 (0.0%) | 0 (0.0%) |
| Computers, Engineering & Science | 17 (100.0%) | 0 (0.0%) |
| Computers & Mathematics | 17 (100.0%) | 0 (0.0%) |
| Architecture & Engineering | 0 (0.0%) | 0 (0.0%) |
| Life, Physical & Social Science | 0 (0.0%) | 0 (0.0%) |
| Community & Social Service | 54 (45.0%) | 66 (55.0%) |
| Education, Arts & Media | 17 (24.3%) | 53 (75.7%) |
| Legal Services & Support | 0 (0.0%) | 0 (0.0%) |
| Education Instruction & Library | 37 (74.0%) | 13 (26.0%) |
| Arts, Media & Entertainment | 0 (0.0%) | 0 (0.0%) |
| Health Diagnosing & Treating | 0 (0.0%) | 61 (100.0%) |
| Health Technologists | 0 (0.0%) | 0 (0.0%) |
| Total (Category) | 146 (37.8%) | 240 (62.2%) |
| Total (Overall) | 915 (68.2%) | 426 (31.8%) |
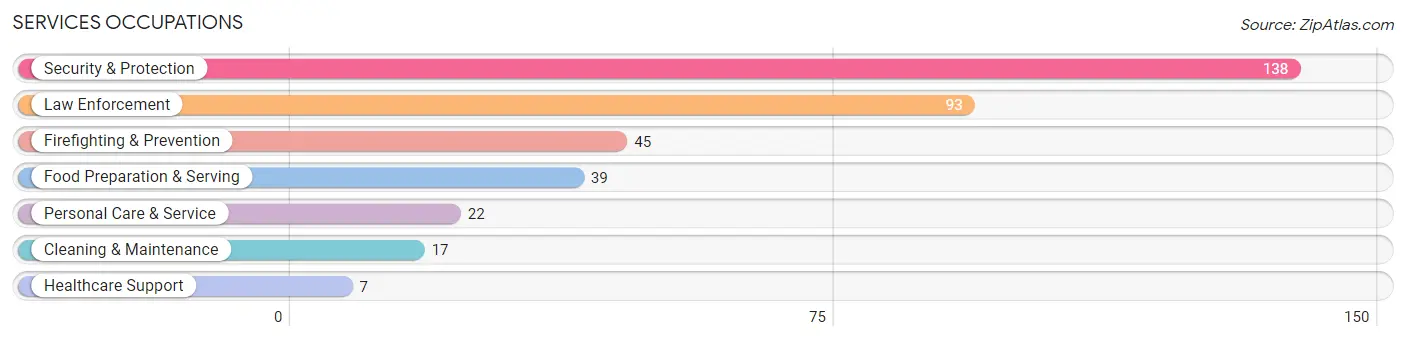
Services Occupations
The most common Services occupations in Dilley are Security & Protection (138 | 10.3%), Law Enforcement (93 | 6.9%), Firefighting & Prevention (45 | 3.4%), Food Preparation & Serving (39 | 2.9%), and Personal Care & Service (22 | 1.6%).
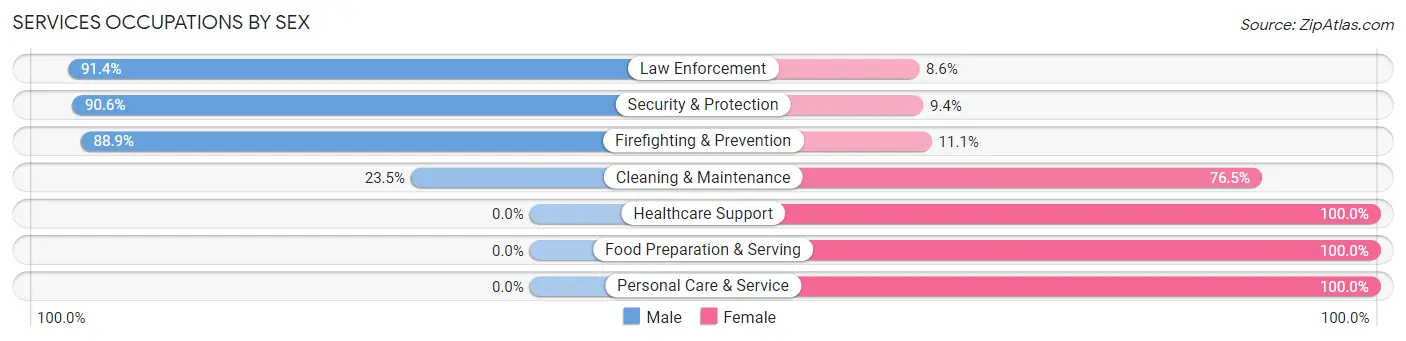
Services Occupations by Sex
Within the Services occupations in Dilley, the most male-oriented occupations are Law Enforcement (91.4%), Security & Protection (90.6%), and Firefighting & Prevention (88.9%), while the most female-oriented occupations are Healthcare Support (100.0%), Food Preparation & Serving (100.0%), and Personal Care & Service (100.0%).
| Occupation | Male | Female |
| Healthcare Support | 0 (0.0%) | 7 (100.0%) |
| Security & Protection | 125 (90.6%) | 13 (9.4%) |
| Firefighting & Prevention | 40 (88.9%) | 5 (11.1%) |
| Law Enforcement | 85 (91.4%) | 8 (8.6%) |
| Food Preparation & Serving | 0 (0.0%) | 39 (100.0%) |
| Cleaning & Maintenance | 4 (23.5%) | 13 (76.5%) |
| Personal Care & Service | 0 (0.0%) | 22 (100.0%) |
| Total (Category) | 129 (57.9%) | 94 (42.1%) |
| Total (Overall) | 915 (68.2%) | 426 (31.8%) |
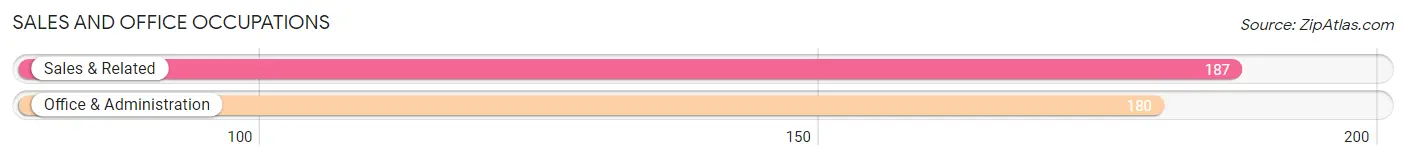
Sales and Office Occupations
The most common Sales and Office occupations in Dilley are Sales & Related (187 | 13.9%), and Office & Administration (180 | 13.4%).
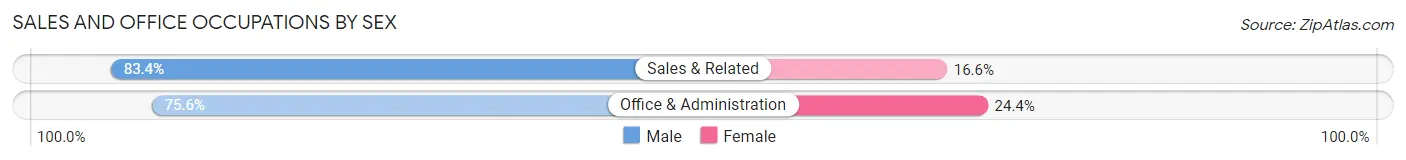
Sales and Office Occupations by Sex
| Occupation | Male | Female |
| Sales & Related | 156 (83.4%) | 31 (16.6%) |
| Office & Administration | 136 (75.6%) | 44 (24.4%) |
| Total (Category) | 292 (79.6%) | 75 (20.4%) |
| Total (Overall) | 915 (68.2%) | 426 (31.8%) |
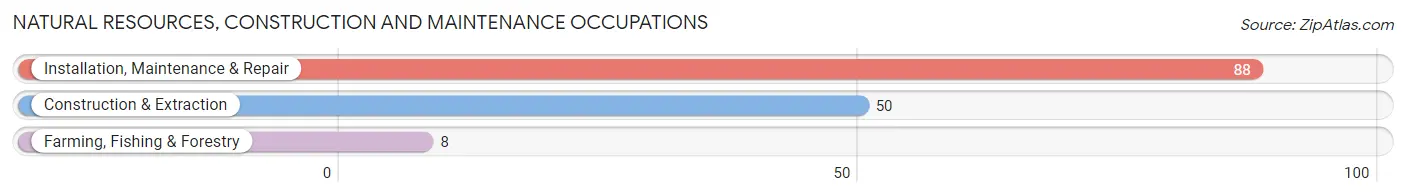
Natural Resources, Construction and Maintenance Occupations
The most common Natural Resources, Construction and Maintenance occupations in Dilley are Installation, Maintenance & Repair (88 | 6.6%), Construction & Extraction (50 | 3.7%), and Farming, Fishing & Forestry (8 | 0.6%).
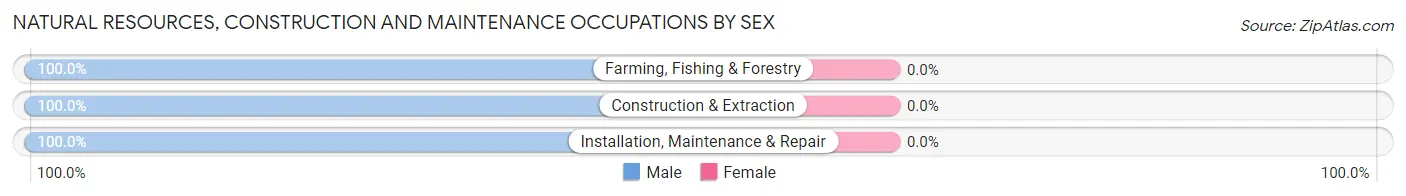
Natural Resources, Construction and Maintenance Occupations by Sex
| Occupation | Male | Female |
| Farming, Fishing & Forestry | 8 (100.0%) | 0 (0.0%) |
| Construction & Extraction | 50 (100.0%) | 0 (0.0%) |
| Installation, Maintenance & Repair | 88 (100.0%) | 0 (0.0%) |
| Total (Category) | 146 (100.0%) | 0 (0.0%) |
| Total (Overall) | 915 (68.2%) | 426 (31.8%) |
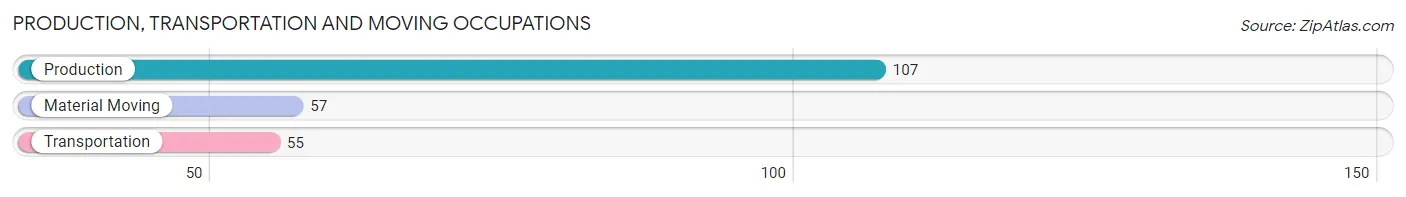
Production, Transportation and Moving Occupations
The most common Production, Transportation and Moving occupations in Dilley are Production (107 | 8.0%), Material Moving (57 | 4.3%), and Transportation (55 | 4.1%).
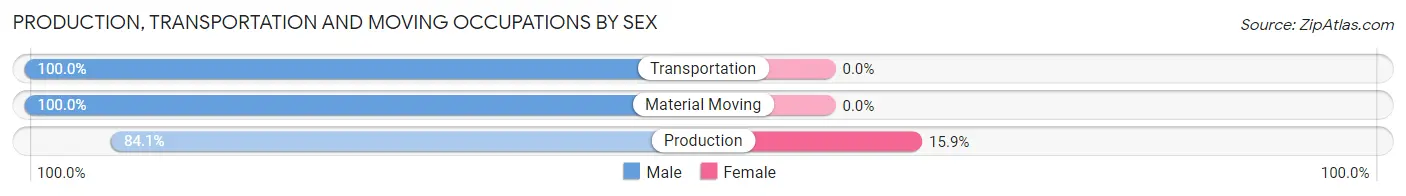
Production, Transportation and Moving Occupations by Sex
| Occupation | Male | Female |
| Production | 90 (84.1%) | 17 (15.9%) |
| Transportation | 55 (100.0%) | 0 (0.0%) |
| Material Moving | 57 (100.0%) | 0 (0.0%) |
| Total (Category) | 202 (92.2%) | 17 (7.8%) |
| Total (Overall) | 915 (68.2%) | 426 (31.8%) |
Employment Industries by Sex in Dilley
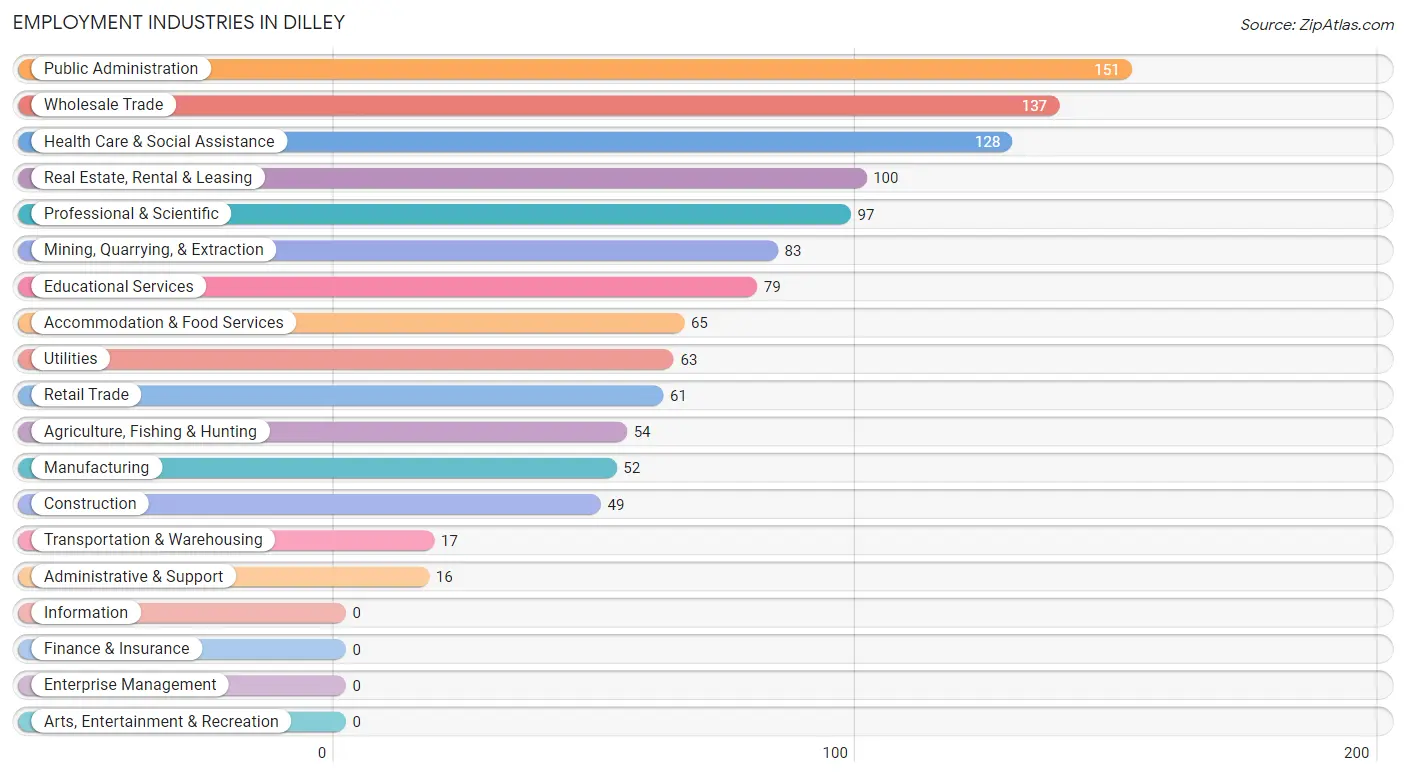
Employment Industries in Dilley
The major employment industries in Dilley include Public Administration (151 | 11.3%), Wholesale Trade (137 | 10.2%), Health Care & Social Assistance (128 | 9.6%), Real Estate, Rental & Leasing (100 | 7.5%), and Professional & Scientific (97 | 7.2%).
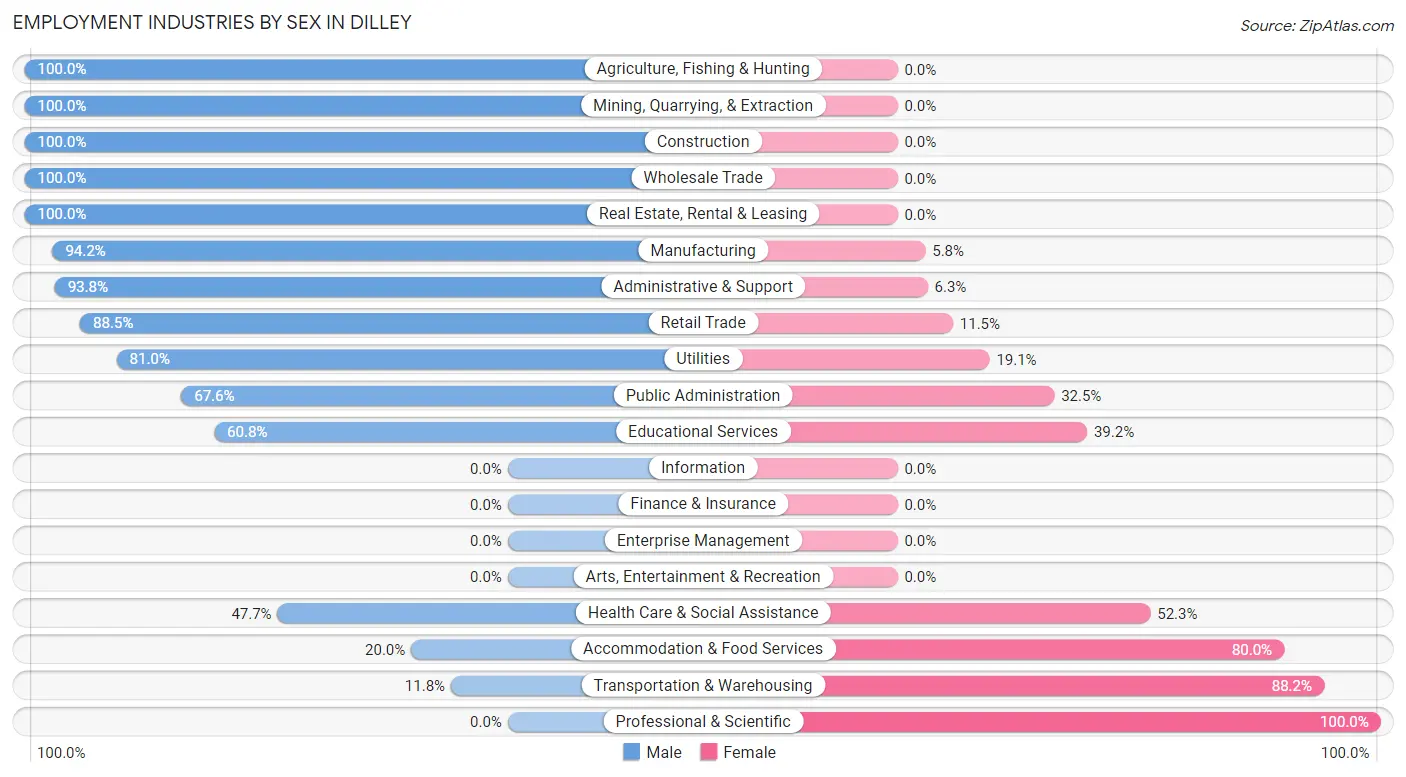
Employment Industries by Sex in Dilley
The Dilley industries that see more men than women are Agriculture, Fishing & Hunting (100.0%), Mining, Quarrying, & Extraction (100.0%), and Construction (100.0%), whereas the industries that tend to have a higher number of women are Professional & Scientific (100.0%), Transportation & Warehousing (88.2%), and Accommodation & Food Services (80.0%).
| Industry | Male | Female |
| Agriculture, Fishing & Hunting | 54 (100.0%) | 0 (0.0%) |
| Mining, Quarrying, & Extraction | 83 (100.0%) | 0 (0.0%) |
| Construction | 49 (100.0%) | 0 (0.0%) |
| Manufacturing | 49 (94.2%) | 3 (5.8%) |
| Wholesale Trade | 137 (100.0%) | 0 (0.0%) |
| Retail Trade | 54 (88.5%) | 7 (11.5%) |
| Transportation & Warehousing | 2 (11.8%) | 15 (88.2%) |
| Utilities | 51 (80.9%) | 12 (19.1%) |
| Information | 0 (0.0%) | 0 (0.0%) |
| Finance & Insurance | 0 (0.0%) | 0 (0.0%) |
| Real Estate, Rental & Leasing | 100 (100.0%) | 0 (0.0%) |
| Professional & Scientific | 0 (0.0%) | 97 (100.0%) |
| Enterprise Management | 0 (0.0%) | 0 (0.0%) |
| Administrative & Support | 15 (93.8%) | 1 (6.2%) |
| Educational Services | 48 (60.8%) | 31 (39.2%) |
| Health Care & Social Assistance | 61 (47.7%) | 67 (52.3%) |
| Arts, Entertainment & Recreation | 0 (0.0%) | 0 (0.0%) |
| Accommodation & Food Services | 13 (20.0%) | 52 (80.0%) |
| Public Administration | 102 (67.5%) | 49 (32.5%) |
| Total | 915 (68.2%) | 426 (31.8%) |
Education in Dilley
School Enrollment in Dilley
The most common levels of schooling among the 1,045 students in Dilley are high school (265 | 25.4%), college / undergraduate (224 | 21.4%), and elementary school (185 | 17.7%).
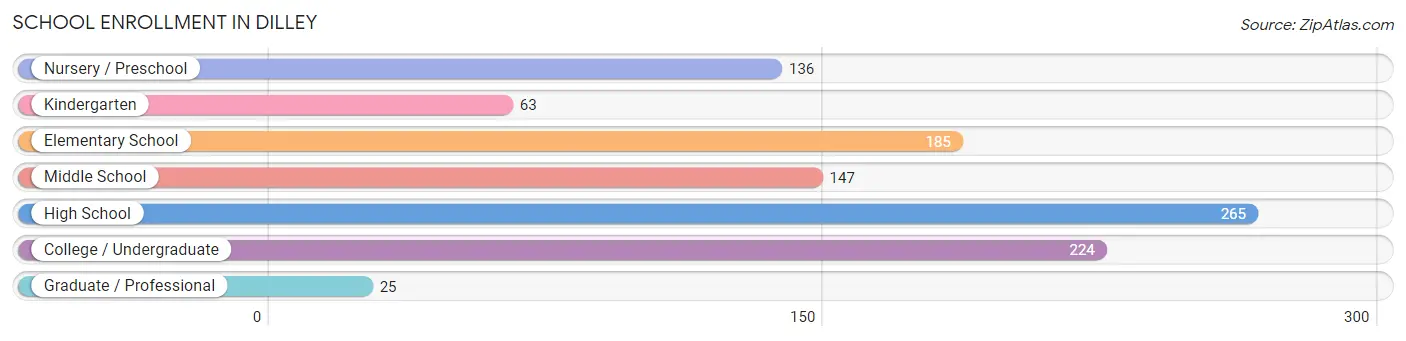
| School Level | # Students | % Students |
| Nursery / Preschool | 136 | 13.0% |
| Kindergarten | 63 | 6.0% |
| Elementary School | 185 | 17.7% |
| Middle School | 147 | 14.1% |
| High School | 265 | 25.4% |
| College / Undergraduate | 224 | 21.4% |
| Graduate / Professional | 25 | 2.4% |
| Total | 1,045 | 100.0% |
School Enrollment by Age by Funding Source in Dilley
Out of a total of 1,045 students who are enrolled in schools in Dilley, 65 (6.2%) attend a private institution, while the remaining 980 (93.8%) are enrolled in public schools. The age group of 18 to 19 year olds has the highest likelihood of being enrolled in private schools, with 47 (87.0% in the age bracket) enrolled. Conversely, the age group of 3 to 4 year olds has the lowest likelihood of being enrolled in a private school, with 156 (100.0% in the age bracket) attending a public institution.
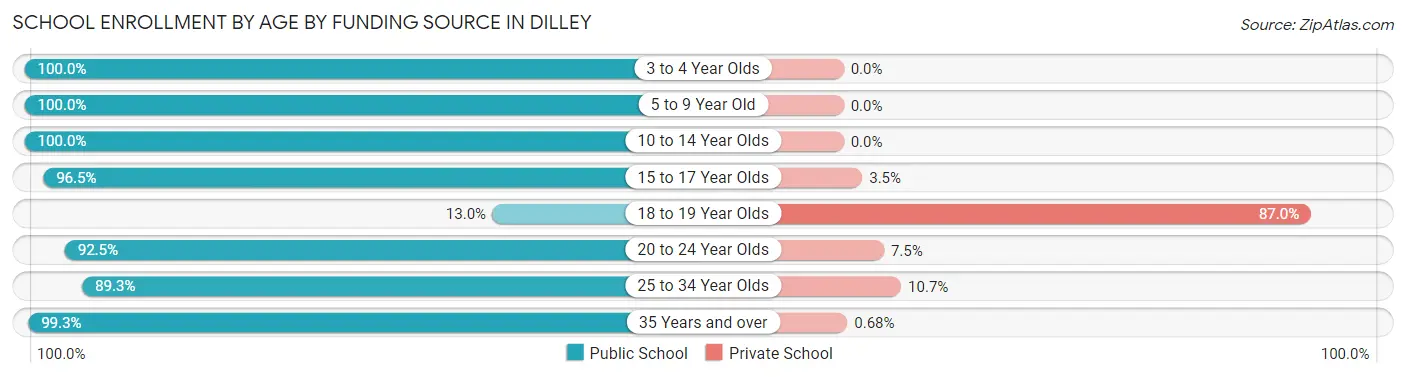
| Age Bracket | Public School | Private School |
| 3 to 4 Year Olds | 156 (100.0%) | 0 (0.0%) |
| 5 to 9 Year Old | 228 (100.0%) | 0 (0.0%) |
| 10 to 14 Year Olds | 179 (100.0%) | 0 (0.0%) |
| 15 to 17 Year Olds | 139 (96.5%) | 5 (3.5%) |
| 18 to 19 Year Olds | 7 (13.0%) | 47 (87.0%) |
| 20 to 24 Year Olds | 74 (92.5%) | 6 (7.5%) |
| 25 to 34 Year Olds | 50 (89.3%) | 6 (10.7%) |
| 35 Years and over | 147 (99.3%) | 1 (0.7%) |
| Total | 980 (93.8%) | 65 (6.2%) |
Educational Attainment by Field of Study in Dilley
Education (70 | 32.7%), social sciences (40 | 18.7%), physical & health sciences (25 | 11.7%), arts & humanities (20 | 9.3%), and computers & mathematics (17 | 7.9%) are the most common fields of study among 214 individuals in Dilley who have obtained a bachelor's degree or higher.
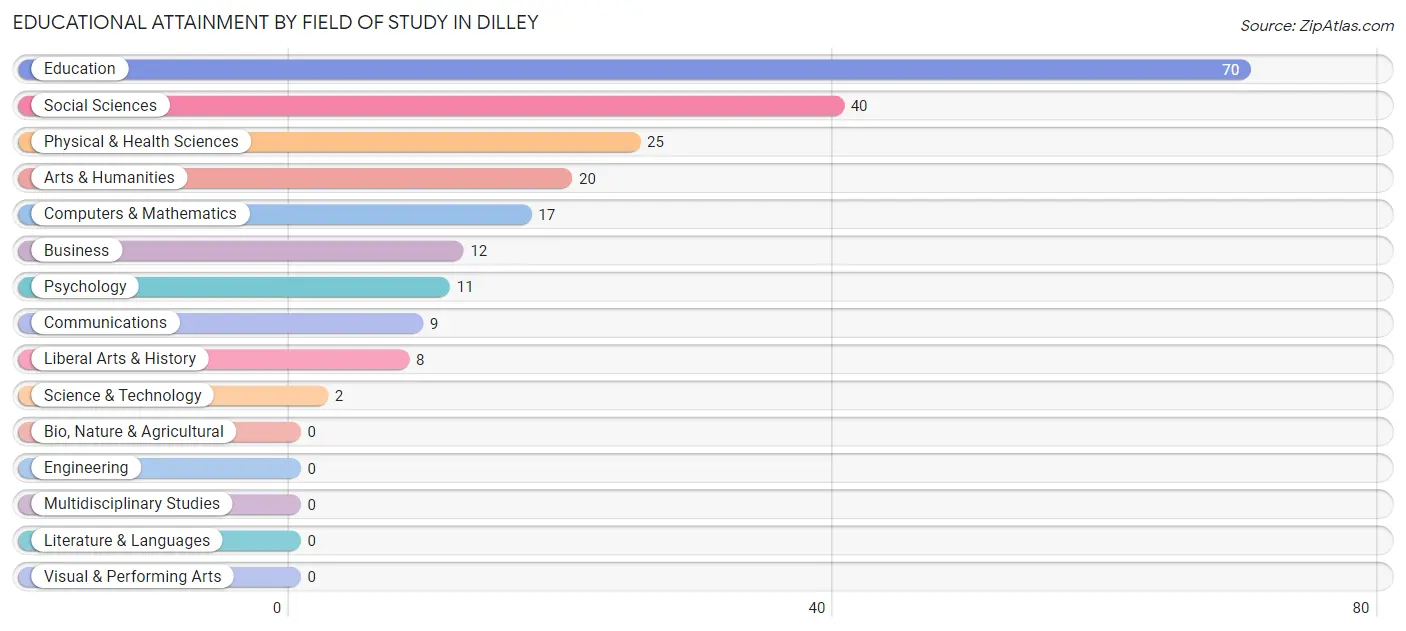
| Field of Study | # Graduates | % Graduates |
| Computers & Mathematics | 17 | 7.9% |
| Bio, Nature & Agricultural | 0 | 0.0% |
| Physical & Health Sciences | 25 | 11.7% |
| Psychology | 11 | 5.1% |
| Social Sciences | 40 | 18.7% |
| Engineering | 0 | 0.0% |
| Multidisciplinary Studies | 0 | 0.0% |
| Science & Technology | 2 | 0.9% |
| Business | 12 | 5.6% |
| Education | 70 | 32.7% |
| Literature & Languages | 0 | 0.0% |
| Liberal Arts & History | 8 | 3.7% |
| Visual & Performing Arts | 0 | 0.0% |
| Communications | 9 | 4.2% |
| Arts & Humanities | 20 | 9.3% |
| Total | 214 | 100.0% |
Transportation & Commute in Dilley
Vehicle Availability by Sex in Dilley
The most prevalent vehicle ownership categories in Dilley are males with 2 vehicles (444, accounting for 48.5%) and females with 2 vehicles (185, making up 104.2%).
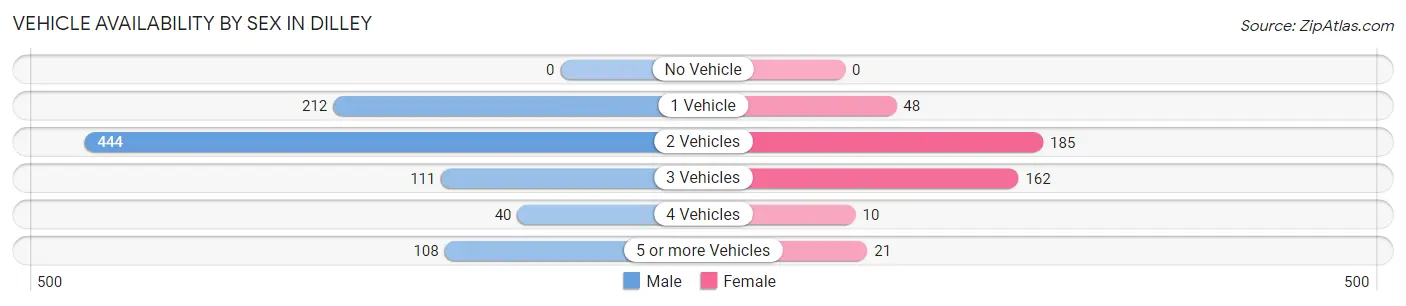
| Vehicles Available | Male | Female |
| No Vehicle | 0 (0.0%) | 0 (0.0%) |
| 1 Vehicle | 212 (23.2%) | 48 (11.3%) |
| 2 Vehicles | 444 (48.5%) | 185 (43.4%) |
| 3 Vehicles | 111 (12.1%) | 162 (38.0%) |
| 4 Vehicles | 40 (4.4%) | 10 (2.4%) |
| 5 or more Vehicles | 108 (11.8%) | 21 (4.9%) |
| Total | 915 (100.0%) | 426 (100.0%) |
Commute Time in Dilley
The most frequently occuring commute durations in Dilley are 20 to 24 minutes (333 commuters, 27.5%), less than 5 minutes (277 commuters, 22.9%), and 5 to 9 minutes (277 commuters, 22.9%).
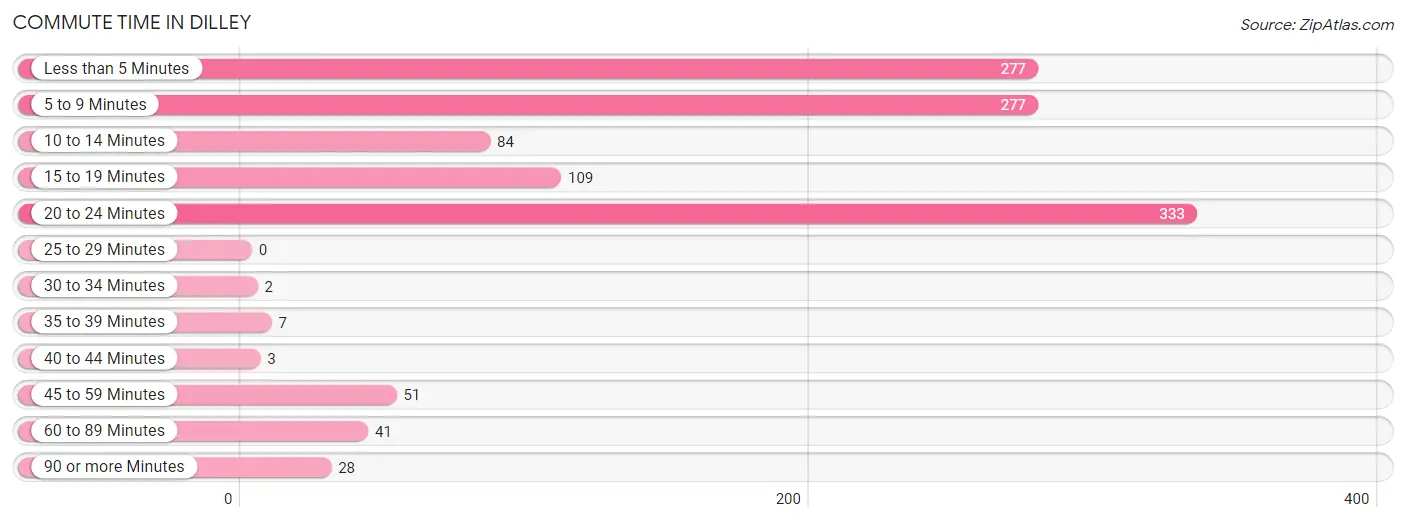
| Commute Time | # Commuters | % Commuters |
| Less than 5 Minutes | 277 | 22.9% |
| 5 to 9 Minutes | 277 | 22.9% |
| 10 to 14 Minutes | 84 | 6.9% |
| 15 to 19 Minutes | 109 | 9.0% |
| 20 to 24 Minutes | 333 | 27.5% |
| 25 to 29 Minutes | 0 | 0.0% |
| 30 to 34 Minutes | 2 | 0.2% |
| 35 to 39 Minutes | 7 | 0.6% |
| 40 to 44 Minutes | 3 | 0.3% |
| 45 to 59 Minutes | 51 | 4.2% |
| 60 to 89 Minutes | 41 | 3.4% |
| 90 or more Minutes | 28 | 2.3% |
Commute Time by Sex in Dilley
The most common commute times in Dilley are 20 to 24 minutes (263 commuters, 29.1%) for males and less than 5 minutes (90 commuters, 29.3%) for females.
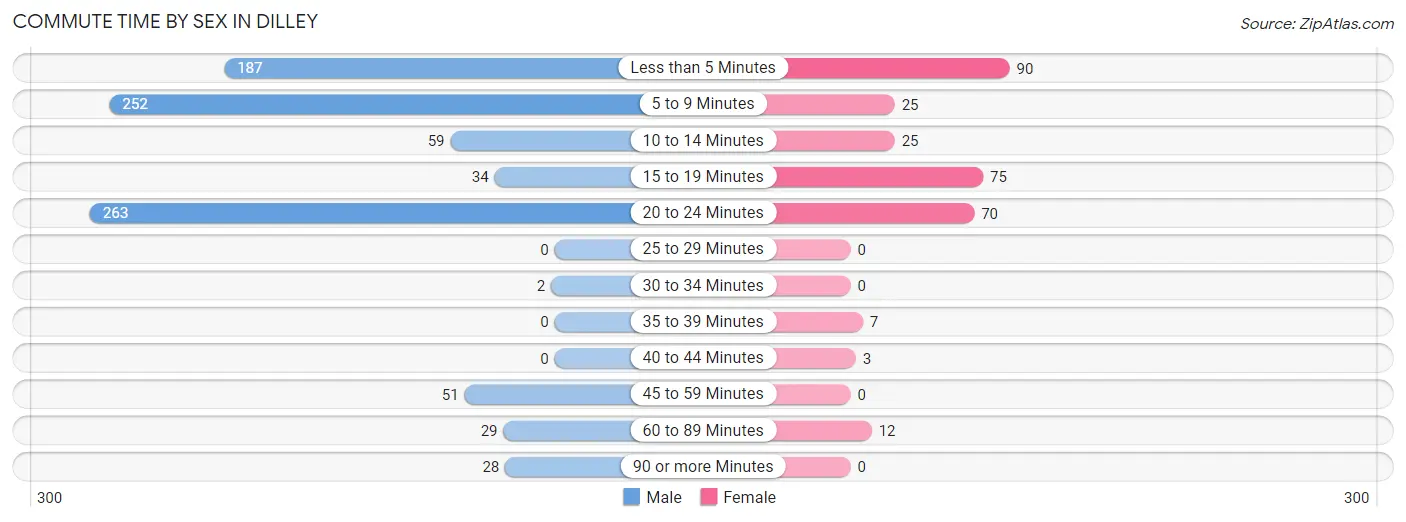
| Commute Time | Male | Female |
| Less than 5 Minutes | 187 (20.7%) | 90 (29.3%) |
| 5 to 9 Minutes | 252 (27.9%) | 25 (8.1%) |
| 10 to 14 Minutes | 59 (6.5%) | 25 (8.1%) |
| 15 to 19 Minutes | 34 (3.8%) | 75 (24.4%) |
| 20 to 24 Minutes | 263 (29.1%) | 70 (22.8%) |
| 25 to 29 Minutes | 0 (0.0%) | 0 (0.0%) |
| 30 to 34 Minutes | 2 (0.2%) | 0 (0.0%) |
| 35 to 39 Minutes | 0 (0.0%) | 7 (2.3%) |
| 40 to 44 Minutes | 0 (0.0%) | 3 (1.0%) |
| 45 to 59 Minutes | 51 (5.6%) | 0 (0.0%) |
| 60 to 89 Minutes | 29 (3.2%) | 12 (3.9%) |
| 90 or more Minutes | 28 (3.1%) | 0 (0.0%) |
Time of Departure to Work by Sex in Dilley
The most frequent times of departure to work in Dilley are 5:30 AM to 5:59 AM (211, 23.3%) for males and 7:30 AM to 7:59 AM (113, 36.8%) for females.
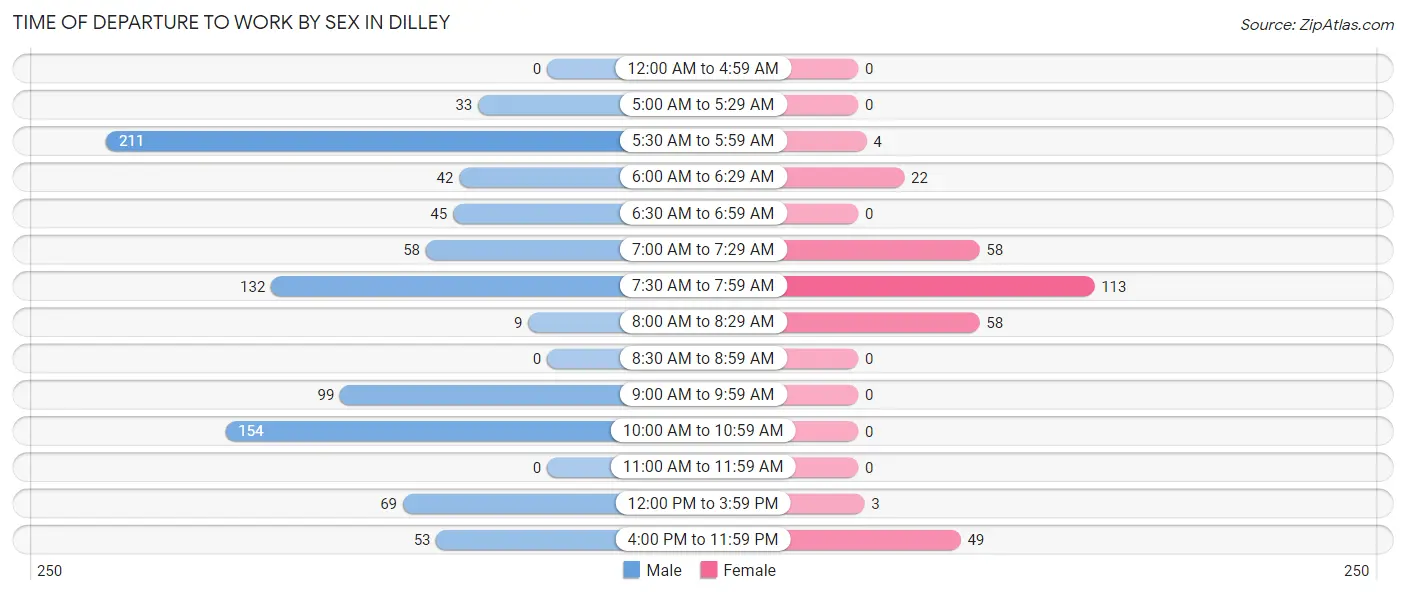
| Time of Departure | Male | Female |
| 12:00 AM to 4:59 AM | 0 (0.0%) | 0 (0.0%) |
| 5:00 AM to 5:29 AM | 33 (3.6%) | 0 (0.0%) |
| 5:30 AM to 5:59 AM | 211 (23.3%) | 4 (1.3%) |
| 6:00 AM to 6:29 AM | 42 (4.6%) | 22 (7.2%) |
| 6:30 AM to 6:59 AM | 45 (5.0%) | 0 (0.0%) |
| 7:00 AM to 7:29 AM | 58 (6.4%) | 58 (18.9%) |
| 7:30 AM to 7:59 AM | 132 (14.6%) | 113 (36.8%) |
| 8:00 AM to 8:29 AM | 9 (1.0%) | 58 (18.9%) |
| 8:30 AM to 8:59 AM | 0 (0.0%) | 0 (0.0%) |
| 9:00 AM to 9:59 AM | 99 (10.9%) | 0 (0.0%) |
| 10:00 AM to 10:59 AM | 154 (17.0%) | 0 (0.0%) |
| 11:00 AM to 11:59 AM | 0 (0.0%) | 0 (0.0%) |
| 12:00 PM to 3:59 PM | 69 (7.6%) | 3 (1.0%) |
| 4:00 PM to 11:59 PM | 53 (5.9%) | 49 (16.0%) |
| Total | 905 (100.0%) | 307 (100.0%) |
Housing Occupancy in Dilley
Occupancy by Ownership in Dilley
Of the total 797 dwellings in Dilley, owner-occupied units account for 583 (73.2%), while renter-occupied units make up 214 (26.9%).
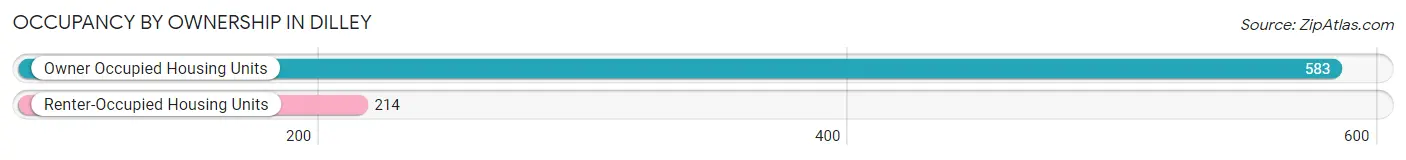
| Occupancy | # Housing Units | % Housing Units |
| Owner Occupied Housing Units | 583 | 73.2% |
| Renter-Occupied Housing Units | 214 | 26.9% |
| Total Occupied Housing Units | 797 | 100.0% |
Occupancy by Household Size in Dilley
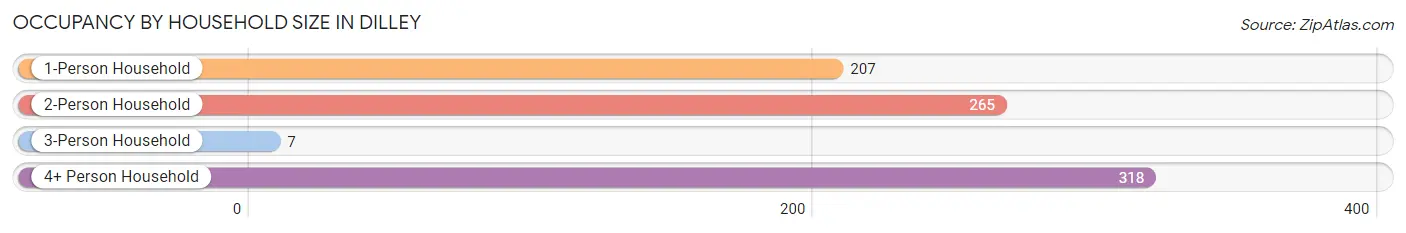
| Household Size | # Housing Units | % Housing Units |
| 1-Person Household | 207 | 26.0% |
| 2-Person Household | 265 | 33.3% |
| 3-Person Household | 7 | 0.9% |
| 4+ Person Household | 318 | 39.9% |
| Total Housing Units | 797 | 100.0% |
Occupancy by Ownership by Household Size in Dilley
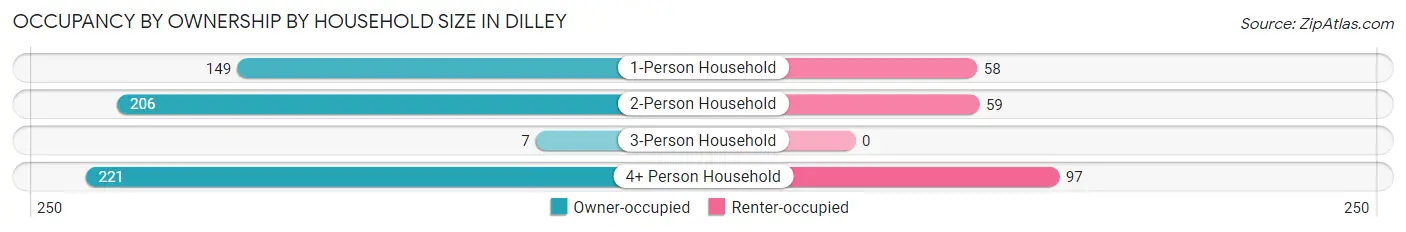
| Household Size | Owner-occupied | Renter-occupied |
| 1-Person Household | 149 (72.0%) | 58 (28.0%) |
| 2-Person Household | 206 (77.7%) | 59 (22.3%) |
| 3-Person Household | 7 (100.0%) | 0 (0.0%) |
| 4+ Person Household | 221 (69.5%) | 97 (30.5%) |
| Total Housing Units | 583 (73.2%) | 214 (26.9%) |
Occupancy by Educational Attainment in Dilley
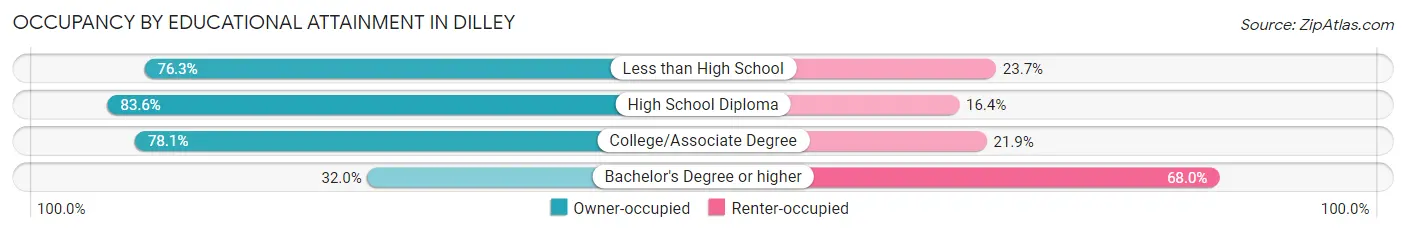
| Household Size | Owner-occupied | Renter-occupied |
| Less than High School | 196 (76.3%) | 61 (23.7%) |
| High School Diploma | 173 (83.6%) | 34 (16.4%) |
| College/Associate Degree | 182 (78.1%) | 51 (21.9%) |
| Bachelor's Degree or higher | 32 (32.0%) | 68 (68.0%) |
Occupancy by Age of Householder in Dilley
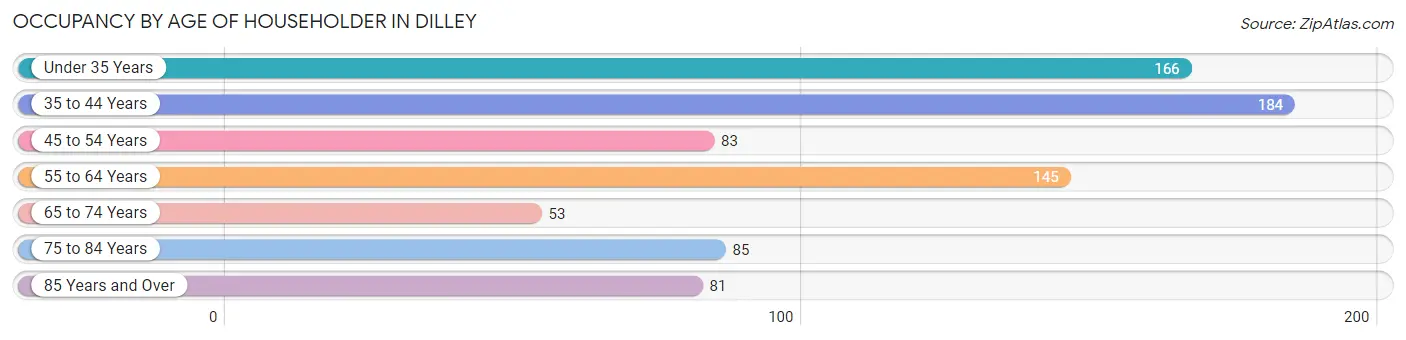
| Age Bracket | # Households | % Households |
| Under 35 Years | 166 | 20.8% |
| 35 to 44 Years | 184 | 23.1% |
| 45 to 54 Years | 83 | 10.4% |
| 55 to 64 Years | 145 | 18.2% |
| 65 to 74 Years | 53 | 6.7% |
| 75 to 84 Years | 85 | 10.7% |
| 85 Years and Over | 81 | 10.2% |
| Total | 797 | 100.0% |
Housing Finances in Dilley
Median Income by Occupancy in Dilley
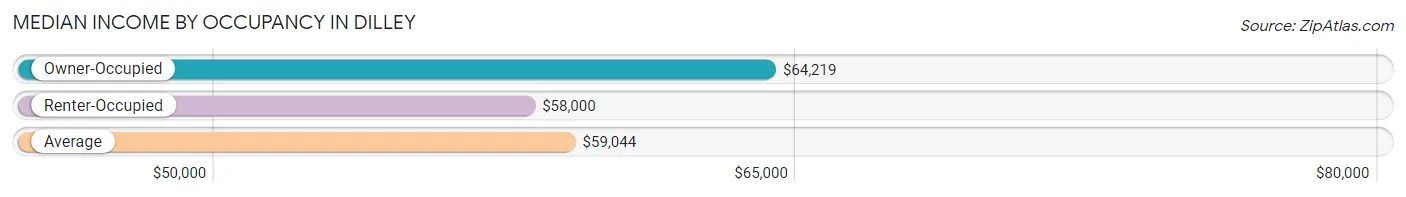
| Occupancy Type | # Households | Median Income |
| Owner-Occupied | 583 (73.2%) | $64,219 |
| Renter-Occupied | 214 (26.9%) | $58,000 |
| Average | 797 (100.0%) | $59,044 |
Occupancy by Householder Income Bracket in Dilley
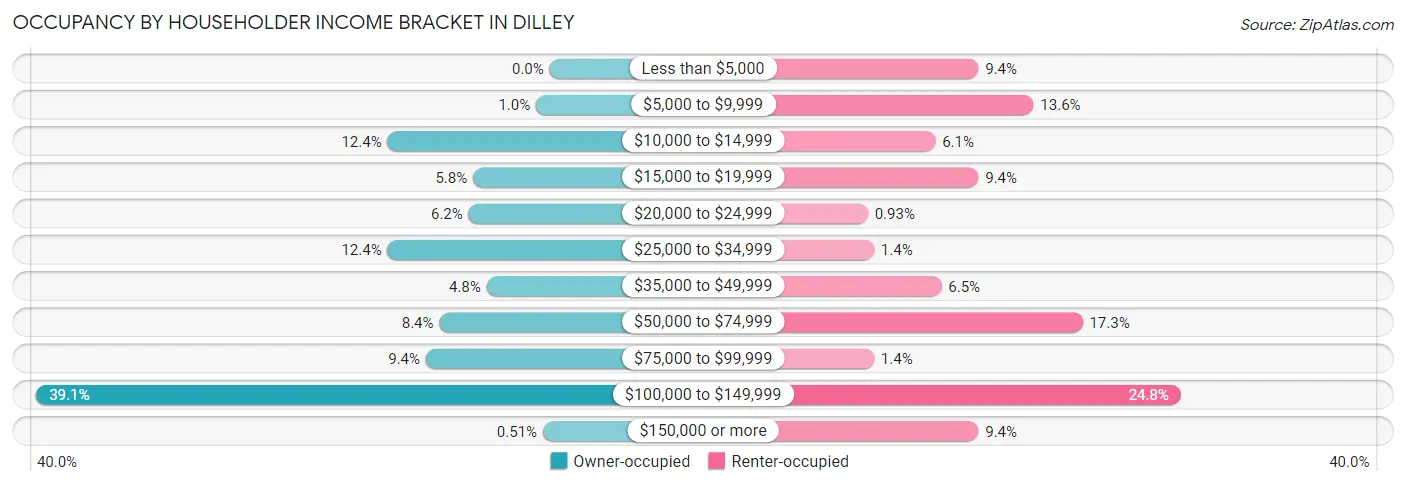
| Income Bracket | Owner-occupied | Renter-occupied |
| Less than $5,000 | 0 (0.0%) | 20 (9.3%) |
| $5,000 to $9,999 | 6 (1.0%) | 29 (13.6%) |
| $10,000 to $14,999 | 72 (12.3%) | 13 (6.1%) |
| $15,000 to $19,999 | 34 (5.8%) | 20 (9.3%) |
| $20,000 to $24,999 | 36 (6.2%) | 2 (0.9%) |
| $25,000 to $34,999 | 72 (12.3%) | 3 (1.4%) |
| $35,000 to $49,999 | 28 (4.8%) | 14 (6.5%) |
| $50,000 to $74,999 | 49 (8.4%) | 37 (17.3%) |
| $75,000 to $99,999 | 55 (9.4%) | 3 (1.4%) |
| $100,000 to $149,999 | 228 (39.1%) | 53 (24.8%) |
| $150,000 or more | 3 (0.5%) | 20 (9.3%) |
| Total | 583 (100.0%) | 214 (100.0%) |
Monthly Housing Cost Tiers in Dilley
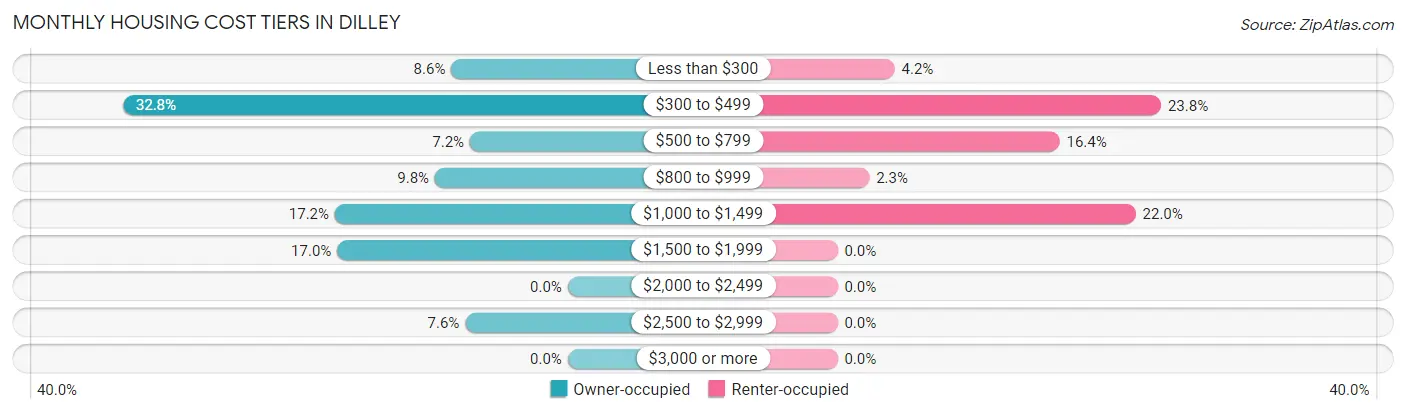
| Monthly Cost | Owner-occupied | Renter-occupied |
| Less than $300 | 50 (8.6%) | 9 (4.2%) |
| $300 to $499 | 191 (32.8%) | 51 (23.8%) |
| $500 to $799 | 42 (7.2%) | 35 (16.4%) |
| $800 to $999 | 57 (9.8%) | 5 (2.3%) |
| $1,000 to $1,499 | 100 (17.2%) | 47 (22.0%) |
| $1,500 to $1,999 | 99 (17.0%) | 0 (0.0%) |
| $2,000 to $2,499 | 0 (0.0%) | 0 (0.0%) |
| $2,500 to $2,999 | 44 (7.5%) | 0 (0.0%) |
| $3,000 or more | 0 (0.0%) | 0 (0.0%) |
| Total | 583 (100.0%) | 214 (100.0%) |
Physical Housing Characteristics in Dilley
Housing Structures in Dilley
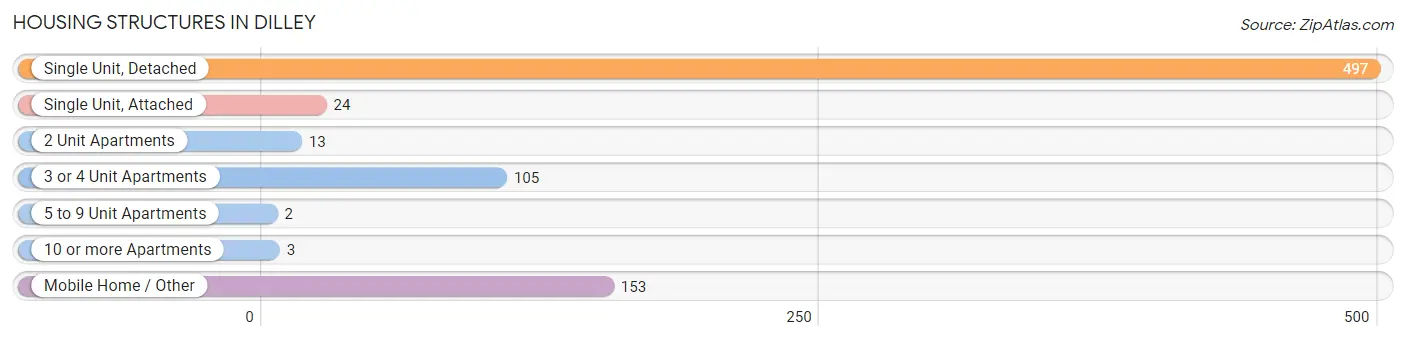
| Structure Type | # Housing Units | % Housing Units |
| Single Unit, Detached | 497 | 62.4% |
| Single Unit, Attached | 24 | 3.0% |
| 2 Unit Apartments | 13 | 1.6% |
| 3 or 4 Unit Apartments | 105 | 13.2% |
| 5 to 9 Unit Apartments | 2 | 0.3% |
| 10 or more Apartments | 3 | 0.4% |
| Mobile Home / Other | 153 | 19.2% |
| Total | 797 | 100.0% |
Housing Structures by Occupancy in Dilley
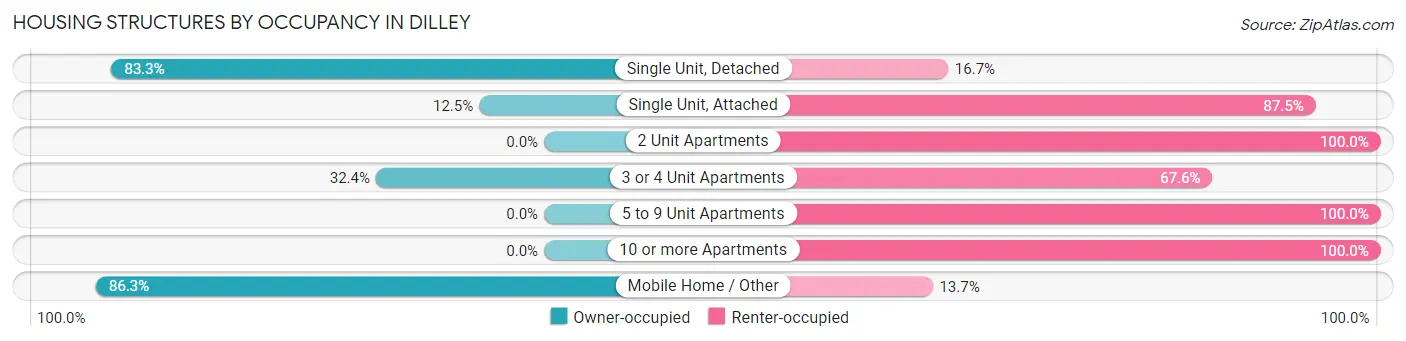
| Structure Type | Owner-occupied | Renter-occupied |
| Single Unit, Detached | 414 (83.3%) | 83 (16.7%) |
| Single Unit, Attached | 3 (12.5%) | 21 (87.5%) |
| 2 Unit Apartments | 0 (0.0%) | 13 (100.0%) |
| 3 or 4 Unit Apartments | 34 (32.4%) | 71 (67.6%) |
| 5 to 9 Unit Apartments | 0 (0.0%) | 2 (100.0%) |
| 10 or more Apartments | 0 (0.0%) | 3 (100.0%) |
| Mobile Home / Other | 132 (86.3%) | 21 (13.7%) |
| Total | 583 (73.2%) | 214 (26.9%) |
Housing Structures by Number of Rooms in Dilley
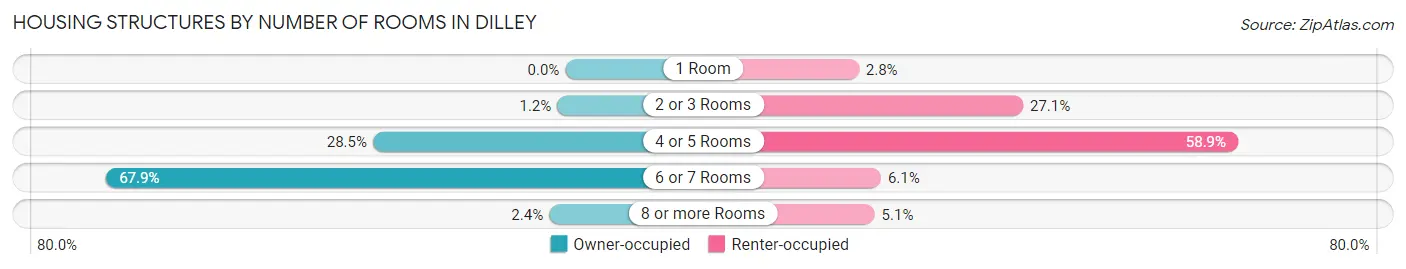
| Number of Rooms | Owner-occupied | Renter-occupied |
| 1 Room | 0 (0.0%) | 6 (2.8%) |
| 2 or 3 Rooms | 7 (1.2%) | 58 (27.1%) |
| 4 or 5 Rooms | 166 (28.5%) | 126 (58.9%) |
| 6 or 7 Rooms | 396 (67.9%) | 13 (6.1%) |
| 8 or more Rooms | 14 (2.4%) | 11 (5.1%) |
| Total | 583 (100.0%) | 214 (100.0%) |
Housing Structure by Heating Type in Dilley
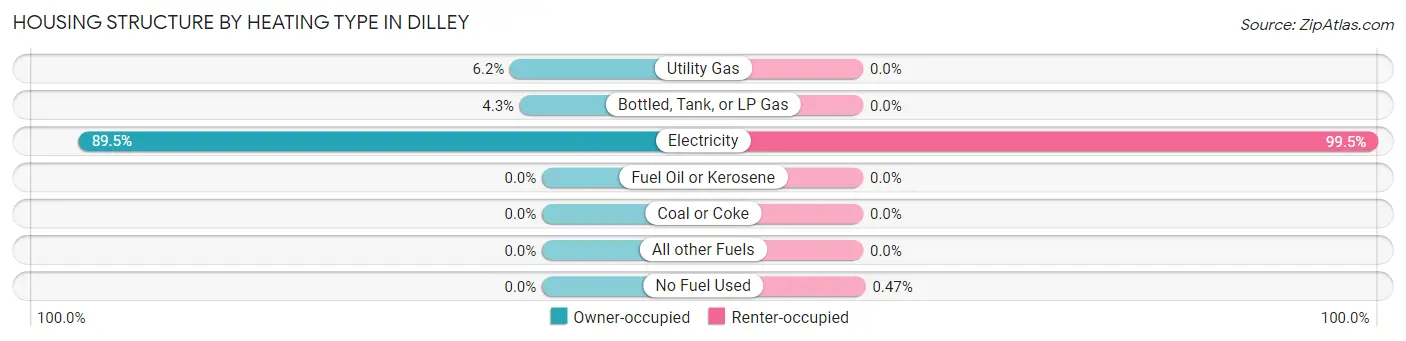
| Heating Type | Owner-occupied | Renter-occupied |
| Utility Gas | 36 (6.2%) | 0 (0.0%) |
| Bottled, Tank, or LP Gas | 25 (4.3%) | 0 (0.0%) |
| Electricity | 522 (89.5%) | 213 (99.5%) |
| Fuel Oil or Kerosene | 0 (0.0%) | 0 (0.0%) |
| Coal or Coke | 0 (0.0%) | 0 (0.0%) |
| All other Fuels | 0 (0.0%) | 0 (0.0%) |
| No Fuel Used | 0 (0.0%) | 1 (0.5%) |
| Total | 583 (100.0%) | 214 (100.0%) |
Household Vehicle Usage in Dilley
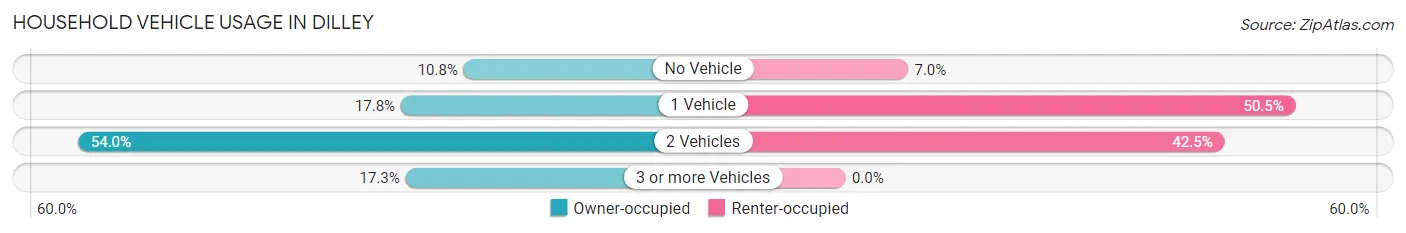
| Vehicles per Household | Owner-occupied | Renter-occupied |
| No Vehicle | 63 (10.8%) | 15 (7.0%) |
| 1 Vehicle | 104 (17.8%) | 108 (50.5%) |
| 2 Vehicles | 315 (54.0%) | 91 (42.5%) |
| 3 or more Vehicles | 101 (17.3%) | 0 (0.0%) |
| Total | 583 (100.0%) | 214 (100.0%) |
Real Estate & Mortgages in Dilley
Real Estate and Mortgage Overview in Dilley
| Characteristic | Without Mortgage | With Mortgage |
| Housing Units | 401 | 182 |
| Median Property Value | $88,500 | $177,100 |
| Median Household Income | $32,066 | $0 |
| Monthly Housing Costs | $474 | $0 |
| Real Estate Taxes | $1,161 | $0 |
Property Value by Mortgage Status in Dilley
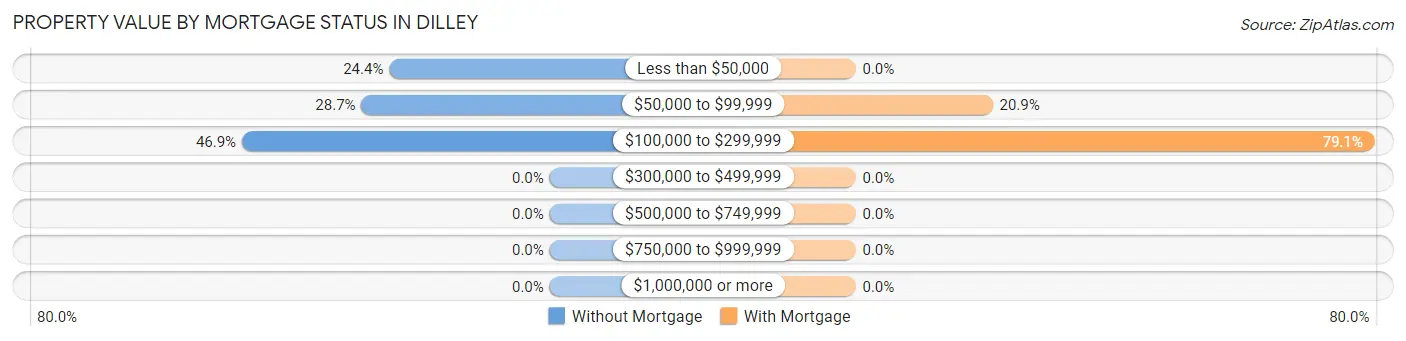
| Property Value | Without Mortgage | With Mortgage |
| Less than $50,000 | 98 (24.4%) | 0 (0.0%) |
| $50,000 to $99,999 | 115 (28.7%) | 38 (20.9%) |
| $100,000 to $299,999 | 188 (46.9%) | 144 (79.1%) |
| $300,000 to $499,999 | 0 (0.0%) | 0 (0.0%) |
| $500,000 to $749,999 | 0 (0.0%) | 0 (0.0%) |
| $750,000 to $999,999 | 0 (0.0%) | 0 (0.0%) |
| $1,000,000 or more | 0 (0.0%) | 0 (0.0%) |
| Total | 401 (100.0%) | 182 (100.0%) |
Household Income by Mortgage Status in Dilley
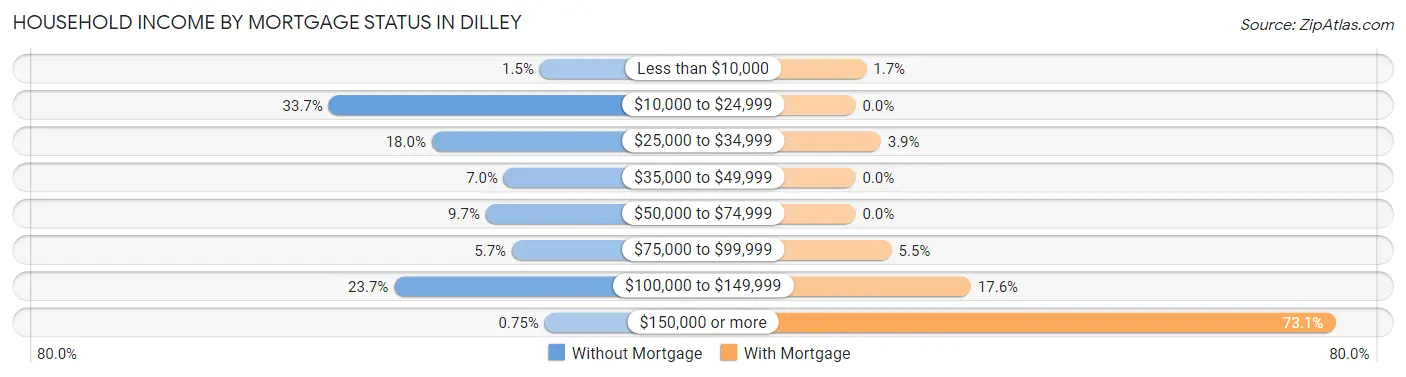
| Household Income | Without Mortgage | With Mortgage |
| Less than $10,000 | 6 (1.5%) | 3 (1.7%) |
| $10,000 to $24,999 | 135 (33.7%) | 0 (0.0%) |
| $25,000 to $34,999 | 72 (18.0%) | 7 (3.8%) |
| $35,000 to $49,999 | 28 (7.0%) | 0 (0.0%) |
| $50,000 to $74,999 | 39 (9.7%) | 0 (0.0%) |
| $75,000 to $99,999 | 23 (5.7%) | 10 (5.5%) |
| $100,000 to $149,999 | 95 (23.7%) | 32 (17.6%) |
| $150,000 or more | 3 (0.7%) | 133 (73.1%) |
| Total | 401 (100.0%) | 182 (100.0%) |
Property Value to Household Income Ratio in Dilley
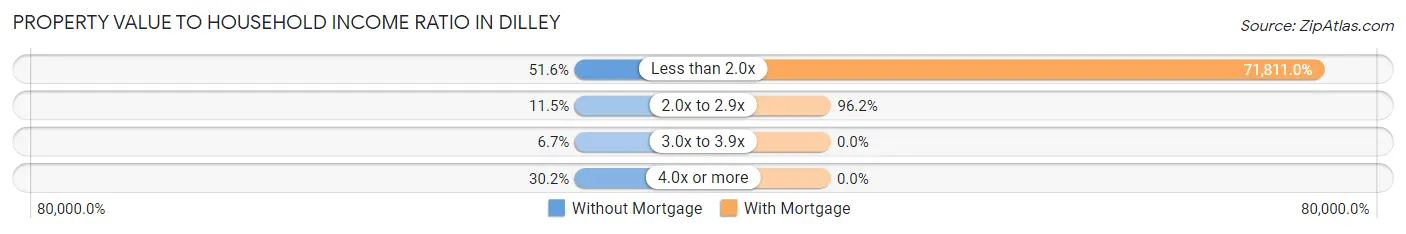
| Value-to-Income Ratio | Without Mortgage | With Mortgage |
| Less than 2.0x | 207 (51.6%) | 130,696 (71,811.0%) |
| 2.0x to 2.9x | 46 (11.5%) | 175 (96.2%) |
| 3.0x to 3.9x | 27 (6.7%) | 0 (0.0%) |
| 4.0x or more | 121 (30.2%) | 0 (0.0%) |
| Total | 401 (100.0%) | 182 (100.0%) |
Real Estate Taxes by Mortgage Status in Dilley
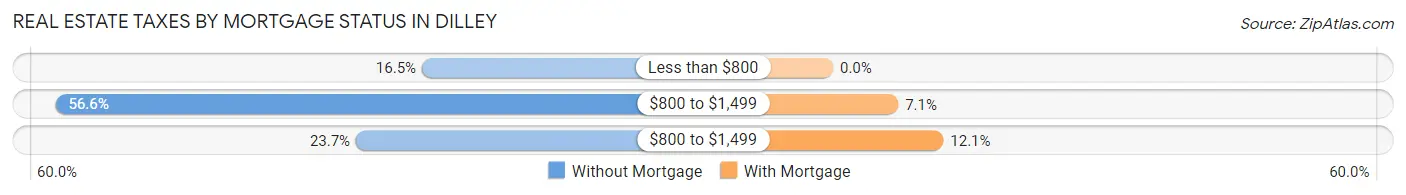
| Property Taxes | Without Mortgage | With Mortgage |
| Less than $800 | 66 (16.5%) | 0 (0.0%) |
| $800 to $1,499 | 227 (56.6%) | 13 (7.1%) |
| $800 to $1,499 | 95 (23.7%) | 22 (12.1%) |
| Total | 401 (100.0%) | 182 (100.0%) |
Health & Disability in Dilley
Health Insurance Coverage by Age in Dilley
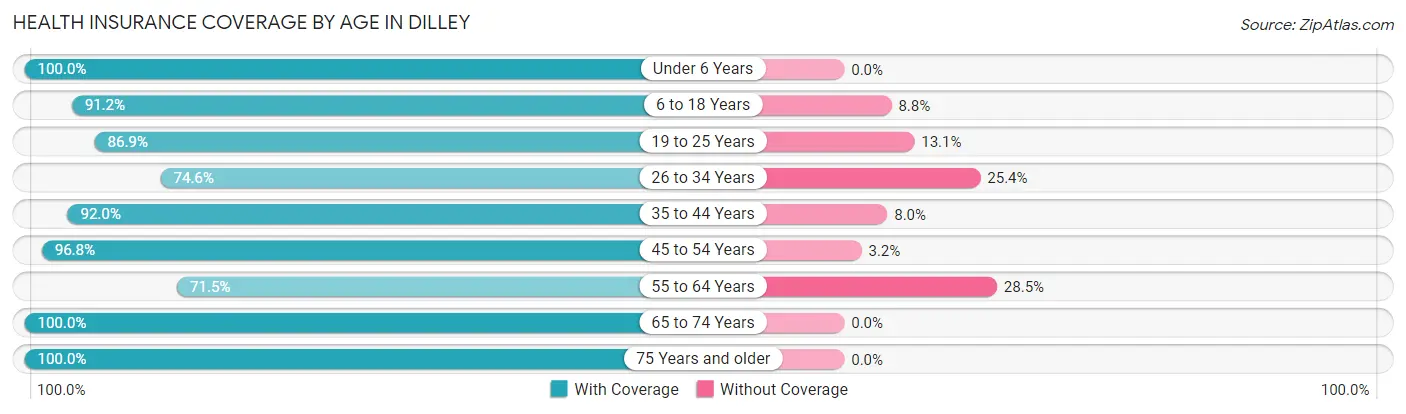
| Age Bracket | With Coverage | Without Coverage |
| Under 6 Years | 265 (100.0%) | 0 (0.0%) |
| 6 to 18 Years | 570 (91.2%) | 55 (8.8%) |
| 19 to 25 Years | 193 (86.9%) | 29 (13.1%) |
| 26 to 34 Years | 153 (74.6%) | 52 (25.4%) |
| 35 to 44 Years | 493 (92.0%) | 43 (8.0%) |
| 45 to 54 Years | 211 (96.8%) | 7 (3.2%) |
| 55 to 64 Years | 181 (71.5%) | 72 (28.5%) |
| 65 to 74 Years | 82 (100.0%) | 0 (0.0%) |
| 75 Years and older | 212 (100.0%) | 0 (0.0%) |
| Total | 2,360 (90.1%) | 258 (9.9%) |
Health Insurance Coverage by Citizenship Status in Dilley
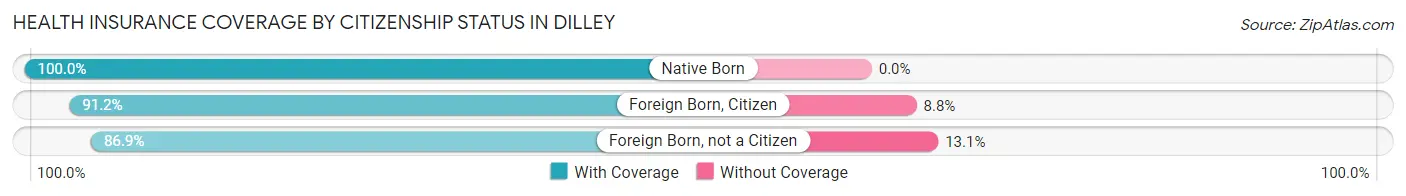
| Citizenship Status | With Coverage | Without Coverage |
| Native Born | 265 (100.0%) | 0 (0.0%) |
| Foreign Born, Citizen | 570 (91.2%) | 55 (8.8%) |
| Foreign Born, not a Citizen | 193 (86.9%) | 29 (13.1%) |
Health Insurance Coverage by Household Income in Dilley
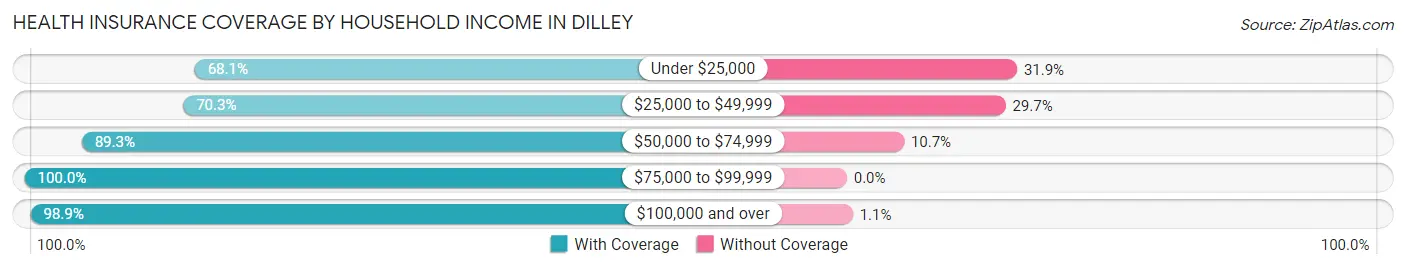
| Household Income | With Coverage | Without Coverage |
| Under $25,000 | 297 (68.1%) | 139 (31.9%) |
| $25,000 to $49,999 | 130 (70.3%) | 55 (29.7%) |
| $50,000 to $74,999 | 425 (89.3%) | 51 (10.7%) |
| $75,000 to $99,999 | 348 (100.0%) | 0 (0.0%) |
| $100,000 and over | 1,160 (98.9%) | 13 (1.1%) |
Public vs Private Health Insurance Coverage by Age in Dilley
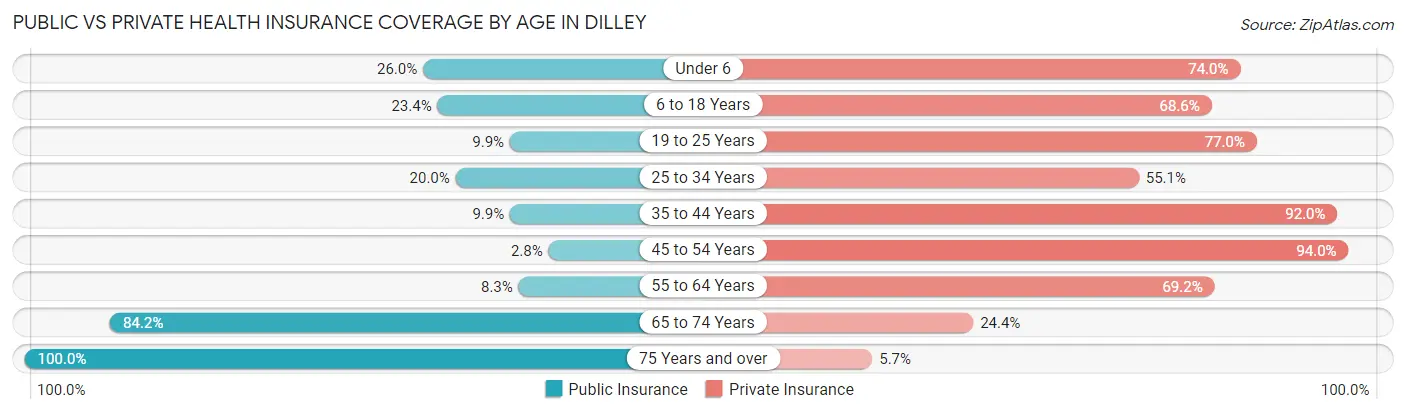
| Age Bracket | Public Insurance | Private Insurance |
| Under 6 | 69 (26.0%) | 196 (74.0%) |
| 6 to 18 Years | 146 (23.4%) | 429 (68.6%) |
| 19 to 25 Years | 22 (9.9%) | 171 (77.0%) |
| 25 to 34 Years | 41 (20.0%) | 113 (55.1%) |
| 35 to 44 Years | 53 (9.9%) | 493 (92.0%) |
| 45 to 54 Years | 6 (2.8%) | 205 (94.0%) |
| 55 to 64 Years | 21 (8.3%) | 175 (69.2%) |
| 65 to 74 Years | 69 (84.2%) | 20 (24.4%) |
| 75 Years and over | 212 (100.0%) | 12 (5.7%) |
| Total | 639 (24.4%) | 1,814 (69.3%) |
Disability Status by Sex by Age in Dilley
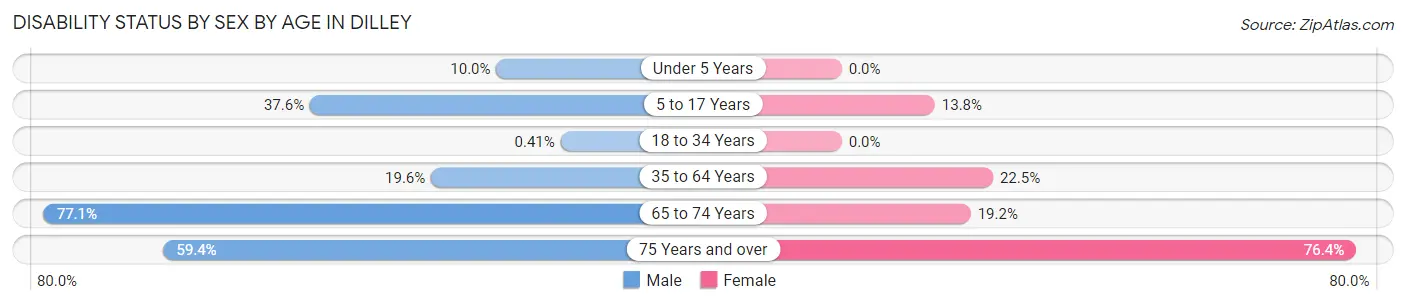
| Age Bracket | Male | Female |
| Under 5 Years | 20 (10.0%) | 0 (0.0%) |
| 5 to 17 Years | 161 (37.6%) | 17 (13.8%) |
| 18 to 34 Years | 1 (0.4%) | 0 (0.0%) |
| 35 to 64 Years | 140 (19.6%) | 66 (22.5%) |
| 65 to 74 Years | 27 (77.1%) | 9 (19.2%) |
| 75 Years and over | 38 (59.4%) | 113 (76.3%) |
Disability Class by Sex by Age in Dilley
Disability Class: Hearing Difficulty
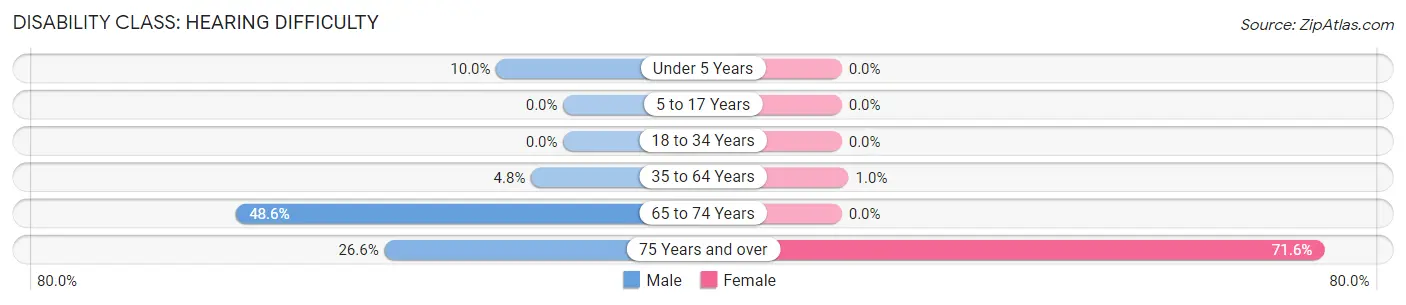
| Age Bracket | Male | Female |
| Under 5 Years | 20 (10.0%) | 0 (0.0%) |
| 5 to 17 Years | 0 (0.0%) | 0 (0.0%) |
| 18 to 34 Years | 0 (0.0%) | 0 (0.0%) |
| 35 to 64 Years | 34 (4.8%) | 3 (1.0%) |
| 65 to 74 Years | 17 (48.6%) | 0 (0.0%) |
| 75 Years and over | 17 (26.6%) | 106 (71.6%) |
Disability Class: Vision Difficulty
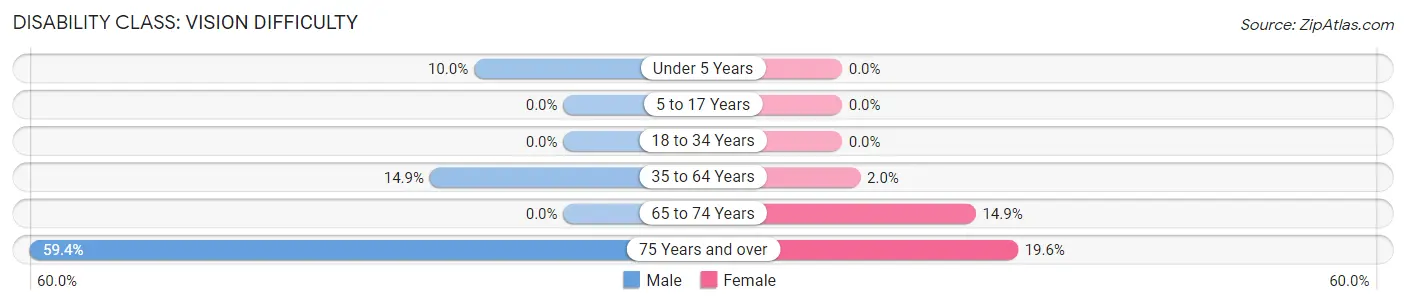
| Age Bracket | Male | Female |
| Under 5 Years | 20 (10.0%) | 0 (0.0%) |
| 5 to 17 Years | 0 (0.0%) | 0 (0.0%) |
| 18 to 34 Years | 0 (0.0%) | 0 (0.0%) |
| 35 to 64 Years | 106 (14.9%) | 6 (2.0%) |
| 65 to 74 Years | 0 (0.0%) | 7 (14.9%) |
| 75 Years and over | 38 (59.4%) | 29 (19.6%) |
Disability Class: Cognitive Difficulty
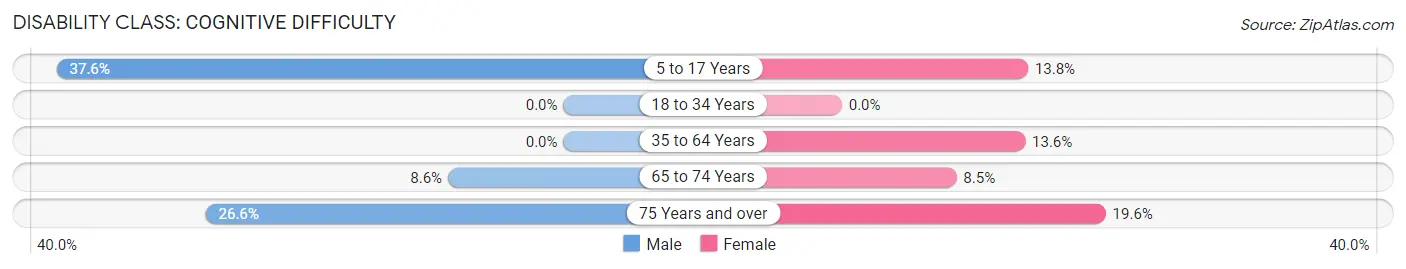
| Age Bracket | Male | Female |
| 5 to 17 Years | 161 (37.6%) | 17 (13.8%) |
| 18 to 34 Years | 0 (0.0%) | 0 (0.0%) |
| 35 to 64 Years | 0 (0.0%) | 40 (13.6%) |
| 65 to 74 Years | 3 (8.6%) | 4 (8.5%) |
| 75 Years and over | 17 (26.6%) | 29 (19.6%) |
Disability Class: Ambulatory Difficulty
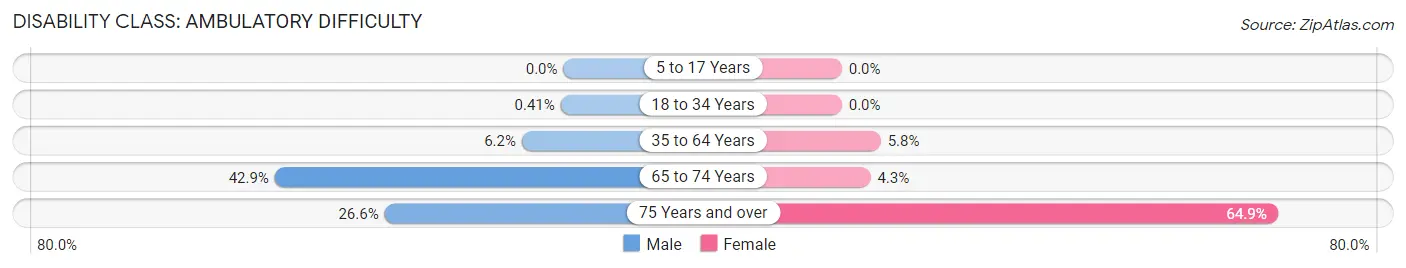
| Age Bracket | Male | Female |
| 5 to 17 Years | 0 (0.0%) | 0 (0.0%) |
| 18 to 34 Years | 1 (0.4%) | 0 (0.0%) |
| 35 to 64 Years | 44 (6.2%) | 17 (5.8%) |
| 65 to 74 Years | 15 (42.9%) | 2 (4.3%) |
| 75 Years and over | 17 (26.6%) | 96 (64.9%) |
Disability Class: Self-Care Difficulty
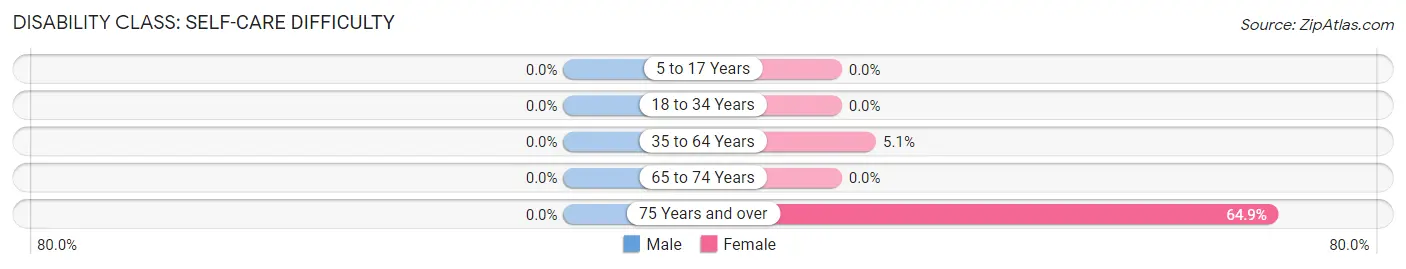
| Age Bracket | Male | Female |
| 5 to 17 Years | 0 (0.0%) | 0 (0.0%) |
| 18 to 34 Years | 0 (0.0%) | 0 (0.0%) |
| 35 to 64 Years | 0 (0.0%) | 15 (5.1%) |
| 65 to 74 Years | 0 (0.0%) | 0 (0.0%) |
| 75 Years and over | 0 (0.0%) | 96 (64.9%) |
Technology Access in Dilley
Computing Device Access in Dilley
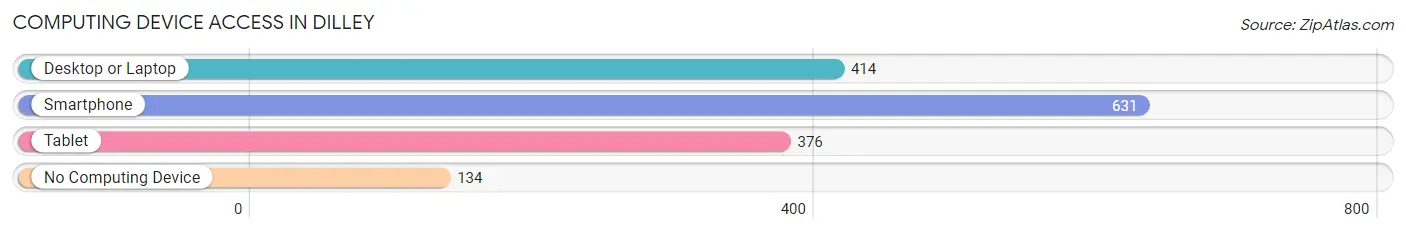
| Device Type | # Households | % Households |
| Desktop or Laptop | 414 | 51.9% |
| Smartphone | 631 | 79.2% |
| Tablet | 376 | 47.2% |
| No Computing Device | 134 | 16.8% |
| Total | 797 | 100.0% |
Internet Access in Dilley
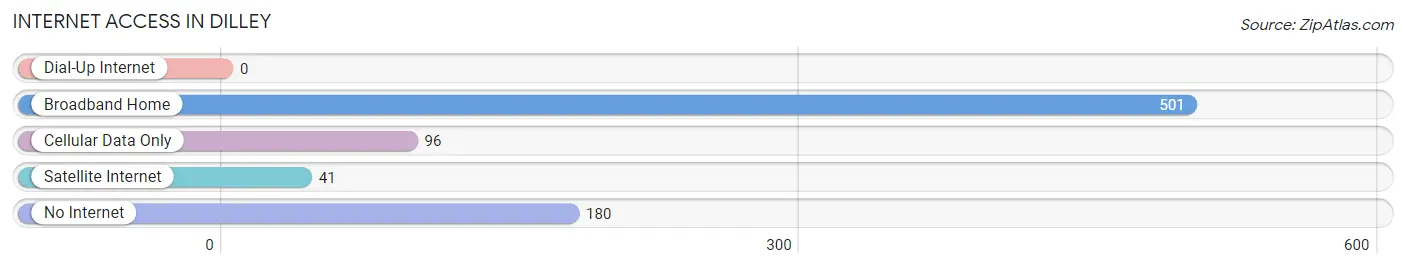
| Internet Type | # Households | % Households |
| Dial-Up Internet | 0 | 0.0% |
| Broadband Home | 501 | 62.9% |
| Cellular Data Only | 96 | 12.0% |
| Satellite Internet | 41 | 5.1% |
| No Internet | 180 | 22.6% |
| Total | 797 | 100.0% |
Dilley Summary
Dilley is a small town located in Frio County, Texas, United States. It is situated about 70 miles southwest of San Antonio and is part of the San Antonio–New Braunfels Metropolitan Statistical Area. The population of Dilley was 2,076 at the 2010 census.
History
The area that is now Dilley was first settled in the late 19th century by ranchers and farmers. The town was founded in 1909 and named after rancher and businessman John Dilley. The town was incorporated in 1911 and a post office was established in 1912.
In the early 20th century, Dilley was a thriving agricultural center, with cotton, corn, and sorghum being the main crops. The town also had a number of businesses, including a bank, a hotel, a movie theater, and a newspaper.
In the 1950s, the town began to decline as the population shifted to larger cities. In the 1970s, the town was revitalized with the construction of a new school and the opening of a new hospital.
Geography
Dilley is located at 28°45'25" North, 99°17'45" West (28.756944, -99.295833). The town is situated in the rolling hills of the South Texas Plains, about 70 miles southwest of San Antonio.
The climate in Dilley is semi-arid, with hot summers and mild winters. The average annual temperature is 68°F (20°C), and the average annual precipitation is 22 inches (56 cm).
Economy
The economy of Dilley is largely based on agriculture. The main crops are cotton, corn, and sorghum. The town also has a number of businesses, including a bank, a hotel, a movie theater, and a newspaper.
The town is also home to a number of oil and gas companies, as well as a number of manufacturing companies.
Demographics
As of the 2010 census, the population of Dilley was 2,076. The racial makeup of the town was 75.3% White, 0.7% African American, 0.3% Native American, 0.2% Asian, 0.1% Pacific Islander, 21.3% from other races, and 2.3% from two or more races. Hispanic or Latino of any race were 78.2% of the population.
The median income for a household in Dilley was $25,938, and the median income for a family was $30,000. The per capita income for the town was $12,845. About 24.3% of families and 28.2% of the population were below the poverty line, including 37.2% of those under age 18 and 16.2% of those age 65 or over.
Common Questions
What is Per Capita Income in Dilley?
Per Capita income in Dilley is $21,938.
What is the Median Family Income in Dilley?
Median Family Income in Dilley is $101,250.
What is the Median Household income in Dilley?
Median Household Income in Dilley is $59,044.
What is Income or Wage Gap in Dilley?
Income or Wage Gap in Dilley is 12.1%.
Women in Dilley earn 87.9 cents for every dollar earned by a man.
What is Inequality or Gini Index in Dilley?
Inequality or Gini Index in Dilley is 0.42.
What is the Total Population of Dilley?
Total Population of Dilley is 3,342.
What is the Total Male Population of Dilley?
Total Male Population of Dilley is 2,384.
What is the Total Female Population of Dilley?
Total Female Population of Dilley is 958.
What is the Ratio of Males per 100 Females in Dilley?
There are 248.85 Males per 100 Females in Dilley.
What is the Ratio of Females per 100 Males in Dilley?
There are 40.18 Females per 100 Males in Dilley.
What is the Median Population Age in Dilley?
Median Population Age in Dilley is 33.2 Years.
What is the Average Family Size in Dilley
Average Family Size in Dilley is 4.2 People.
What is the Average Household Size in Dilley
Average Household Size in Dilley is 3.3 People.
How Large is the Labor Force in Dilley?
There are 1,361 People in the Labor Forcein in Dilley.
What is the Percentage of People in the Labor Force in Dilley?
52.4% of People are in the Labor Force in Dilley.
What is the Unemployment Rate in Dilley?
Unemployment Rate in Dilley is 1.5%.