Dickinson, TX Map & Demographics
Dickinson Map
Dickinson Overview
$35,980
PER CAPITA INCOME
$96,225
AVG FAMILY INCOME
$81,739
AVG HOUSEHOLD INCOME
43.6%
WAGE / INCOME GAP [ % ]
56.4¢/ $1
WAGE / INCOME GAP [ $ ]
0.41
INEQUALITY / GINI INDEX
21,475
TOTAL POPULATION
10,423
MALE POPULATION
11,052
FEMALE POPULATION
94.31
MALES / 100 FEMALES
106.03
FEMALES / 100 MALES
35.8
MEDIAN AGE
3.2
AVG FAMILY SIZE
2.6
AVG HOUSEHOLD SIZE
10,963
LABOR FORCE [ PEOPLE ]
67.6%
PERCENT IN LABOR FORCE
4.4%
UNEMPLOYMENT RATE
Dickinson Zip Codes
Income in Dickinson
Income Overview in Dickinson
Per Capita Income in Dickinson is $35,980, while median incomes of families and households are $96,225 and $81,739 respectively.
| Characteristic | Number | Measure |
| Per Capita Income | 21,475 | $35,980 |
| Median Family Income | 5,690 | $96,225 |
| Mean Family Income | 5,690 | $107,368 |
| Median Household Income | 8,104 | $81,739 |
| Mean Household Income | 8,104 | $95,777 |
| Income Deficit | 5,690 | $0 |
| Wage / Income Gap (%) | 21,475 | 43.60% |
| Wage / Income Gap ($) | 21,475 | 56.40¢ per $1 |
| Gini / Inequality Index | 21,475 | 0.41 |
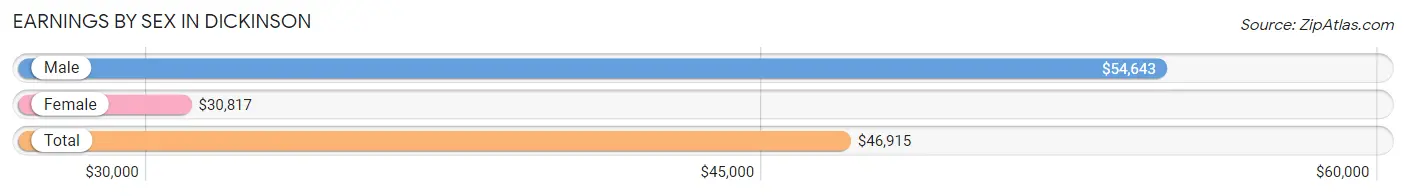
Earnings by Sex in Dickinson
Average Earnings in Dickinson are $46,915, $54,643 for men and $30,817 for women, a difference of 43.6%.
| Sex | Number | Average Earnings |
| Male | 6,446 (57.7%) | $54,643 |
| Female | 4,729 (42.3%) | $30,817 |
| Total | 11,175 (100.0%) | $46,915 |
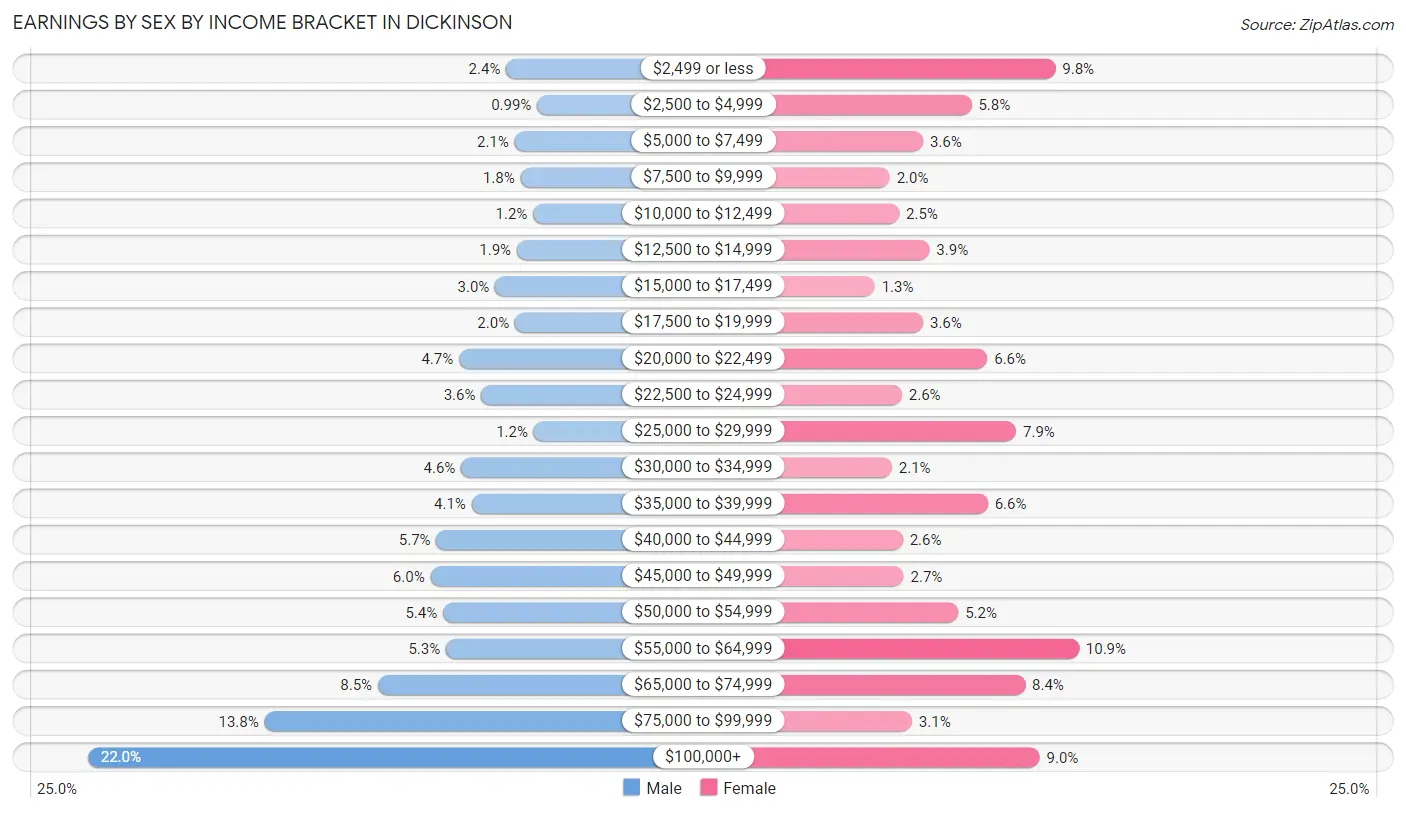
Earnings by Sex by Income Bracket in Dickinson
The most common earnings brackets in Dickinson are $100,000+ for men (1,421 | 22.0%) and $55,000 to $64,999 for women (514 | 10.9%).
| Income | Male | Female |
| $2,499 or less | 157 (2.4%) | 462 (9.8%) |
| $2,500 to $4,999 | 64 (1.0%) | 276 (5.8%) |
| $5,000 to $7,499 | 132 (2.1%) | 169 (3.6%) |
| $7,500 to $9,999 | 114 (1.8%) | 95 (2.0%) |
| $10,000 to $12,499 | 76 (1.2%) | 116 (2.5%) |
| $12,500 to $14,999 | 125 (1.9%) | 183 (3.9%) |
| $15,000 to $17,499 | 191 (3.0%) | 62 (1.3%) |
| $17,500 to $19,999 | 131 (2.0%) | 169 (3.6%) |
| $20,000 to $22,499 | 300 (4.6%) | 311 (6.6%) |
| $22,500 to $24,999 | 233 (3.6%) | 122 (2.6%) |
| $25,000 to $29,999 | 74 (1.1%) | 375 (7.9%) |
| $30,000 to $34,999 | 293 (4.5%) | 100 (2.1%) |
| $35,000 to $39,999 | 262 (4.1%) | 312 (6.6%) |
| $40,000 to $44,999 | 368 (5.7%) | 124 (2.6%) |
| $45,000 to $49,999 | 386 (6.0%) | 126 (2.7%) |
| $50,000 to $54,999 | 348 (5.4%) | 247 (5.2%) |
| $55,000 to $64,999 | 339 (5.3%) | 514 (10.9%) |
| $65,000 to $74,999 | 545 (8.5%) | 395 (8.4%) |
| $75,000 to $99,999 | 887 (13.8%) | 144 (3.0%) |
| $100,000+ | 1,421 (22.0%) | 427 (9.0%) |
| Total | 6,446 (100.0%) | 4,729 (100.0%) |
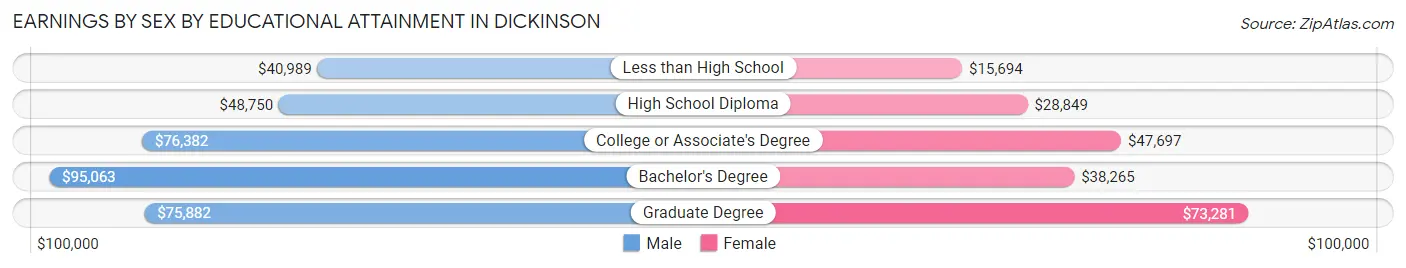
Earnings by Sex by Educational Attainment in Dickinson
Average earnings in Dickinson are $64,901 for men and $38,602 for women, a difference of 40.5%. Men with an educational attainment of bachelor's degree enjoy the highest average annual earnings of $95,063, while those with less than high school education earn the least with $40,989. Women with an educational attainment of graduate degree earn the most with the average annual earnings of $73,281, while those with less than high school education have the smallest earnings of $15,694.
| Educational Attainment | Male Income | Female Income |
| Less than High School | $40,989 | $15,694 |
| High School Diploma | $48,750 | $28,849 |
| College or Associate's Degree | $76,382 | $47,697 |
| Bachelor's Degree | $95,063 | $38,265 |
| Graduate Degree | $75,882 | $73,281 |
| Total | $64,901 | $38,602 |
Family Income in Dickinson
Family Income Brackets in Dickinson
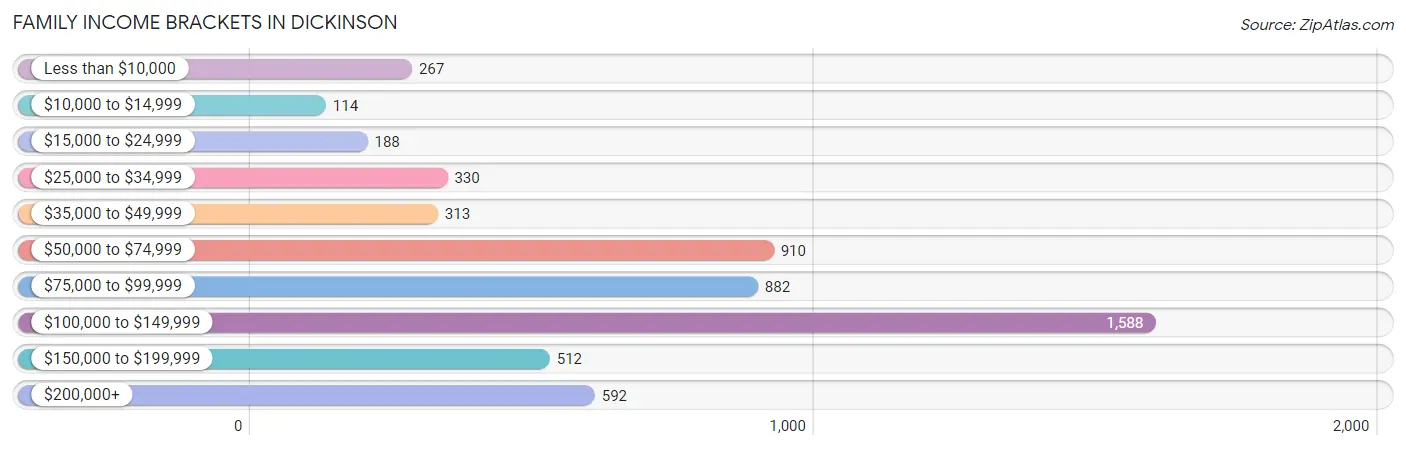
According to the Dickinson family income data, there are 1,588 families falling into the $100,000 to $149,999 income range, which is the most common income bracket and makes up 27.9% of all families. Conversely, the $10,000 to $14,999 income bracket is the least frequent group with only 114 families (2.0%) belonging to this category.
| Income Bracket | # Families | % Families |
| Less than $10,000 | 267 | 4.7% |
| $10,000 to $14,999 | 114 | 2.0% |
| $15,000 to $24,999 | 188 | 3.3% |
| $25,000 to $34,999 | 330 | 5.8% |
| $35,000 to $49,999 | 313 | 5.5% |
| $50,000 to $74,999 | 910 | 16.0% |
| $75,000 to $99,999 | 882 | 15.5% |
| $100,000 to $149,999 | 1,588 | 27.9% |
| $150,000 to $199,999 | 512 | 9.0% |
| $200,000+ | 592 | 10.4% |
Family Income by Famaliy Size in Dickinson
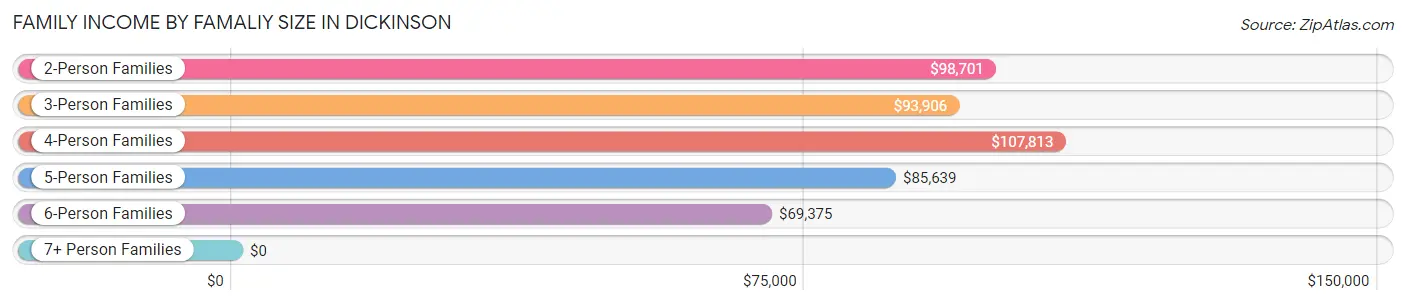
4-person families (1,051 | 18.5%) account for the highest median family income in Dickinson with $107,813 per family, while 2-person families (2,464 | 43.3%) have the highest median income of $49,350 per family member.
| Income Bracket | # Families | Median Income |
| 2-Person Families | 2,464 (43.3%) | $98,701 |
| 3-Person Families | 1,105 (19.4%) | $93,906 |
| 4-Person Families | 1,051 (18.5%) | $107,813 |
| 5-Person Families | 815 (14.3%) | $85,639 |
| 6-Person Families | 219 (3.8%) | $69,375 |
| 7+ Person Families | 36 (0.6%) | $0 |
| Total | 5,690 (100.0%) | $96,225 |
Family Income by Number of Earners in Dickinson
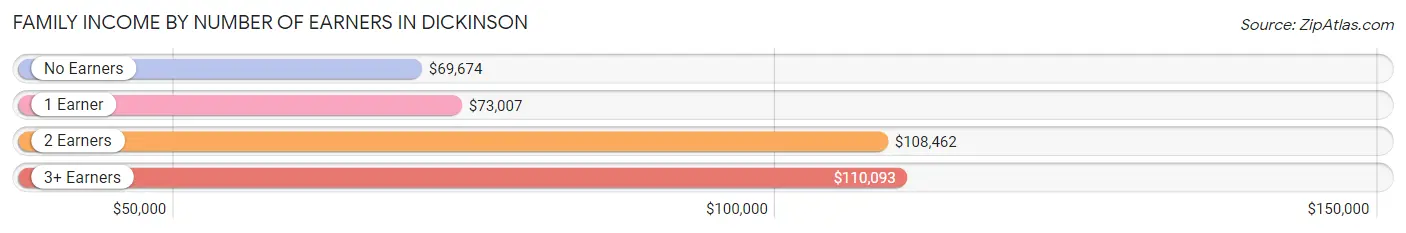
The median family income in Dickinson is $96,225, with families comprising 3+ earners (708) having the highest median family income of $110,093, while families with no earners (568) have the lowest median family income of $69,674, accounting for 12.4% and 10.0% of families, respectively.
| Number of Earners | # Families | Median Income |
| No Earners | 568 (10.0%) | $69,674 |
| 1 Earner | 2,166 (38.1%) | $73,007 |
| 2 Earners | 2,248 (39.5%) | $108,462 |
| 3+ Earners | 708 (12.4%) | $110,093 |
| Total | 5,690 (100.0%) | $96,225 |
Household Income in Dickinson
Household Income Brackets in Dickinson
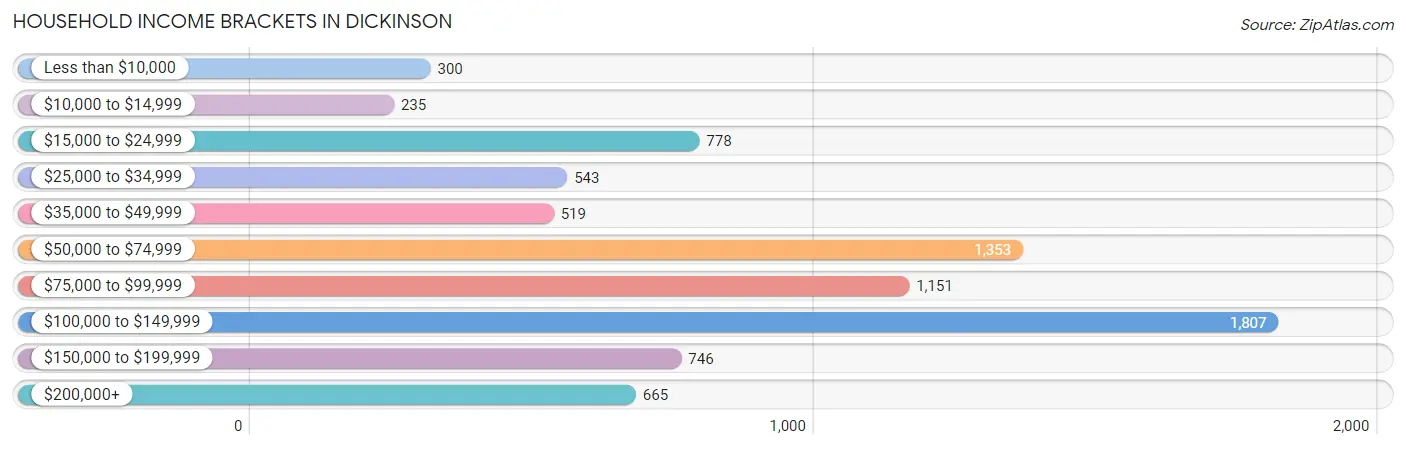
With 1,807 households falling in the category, the $100,000 to $149,999 income range is the most frequent in Dickinson, accounting for 22.3% of all households. In contrast, only 235 households (2.9%) fall into the $10,000 to $14,999 income bracket, making it the least populous group.
| Income Bracket | # Households | % Households |
| Less than $10,000 | 300 | 3.7% |
| $10,000 to $14,999 | 235 | 2.9% |
| $15,000 to $24,999 | 778 | 9.6% |
| $25,000 to $34,999 | 543 | 6.7% |
| $35,000 to $49,999 | 519 | 6.4% |
| $50,000 to $74,999 | 1,353 | 16.7% |
| $75,000 to $99,999 | 1,151 | 14.2% |
| $100,000 to $149,999 | 1,807 | 22.3% |
| $150,000 to $199,999 | 746 | 9.2% |
| $200,000+ | 665 | 8.2% |
Household Income by Householder Age in Dickinson
The median household income in Dickinson is $81,739, with the highest median household income of $88,487 found in the 25 to 44 years age bracket for the primary householder. A total of 2,937 households (36.2%) fall into this category. Meanwhile, the 15 to 24 years age bracket for the primary householder has the lowest median household income of $0, with 465 households (5.7%) in this group.
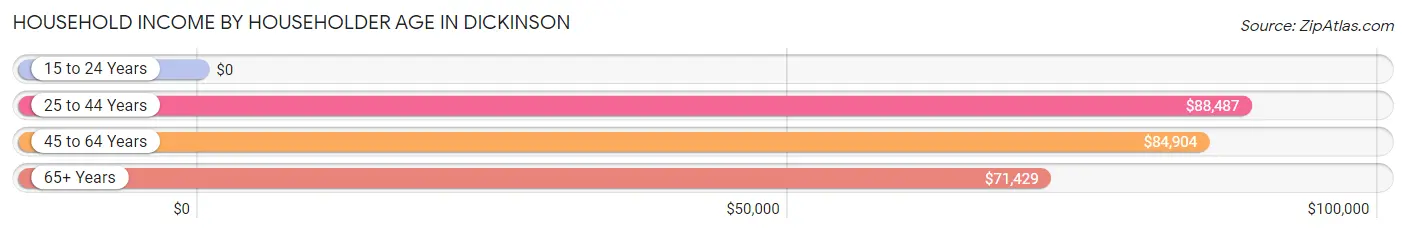
| Income Bracket | # Households | Median Income |
| 15 to 24 Years | 465 (5.7%) | $0 |
| 25 to 44 Years | 2,937 (36.2%) | $88,487 |
| 45 to 64 Years | 3,164 (39.0%) | $84,904 |
| 65+ Years | 1,538 (19.0%) | $71,429 |
| Total | 8,104 (100.0%) | $81,739 |
Poverty in Dickinson
Income Below Poverty by Sex and Age in Dickinson
With 10.5% poverty level for males and 14.8% for females among the residents of Dickinson, 6 to 11 year old males and 16 and 17 year old females are the most vulnerable to poverty, with 270 males (33.3%) and 111 females (33.0%) in their respective age groups living below the poverty level.
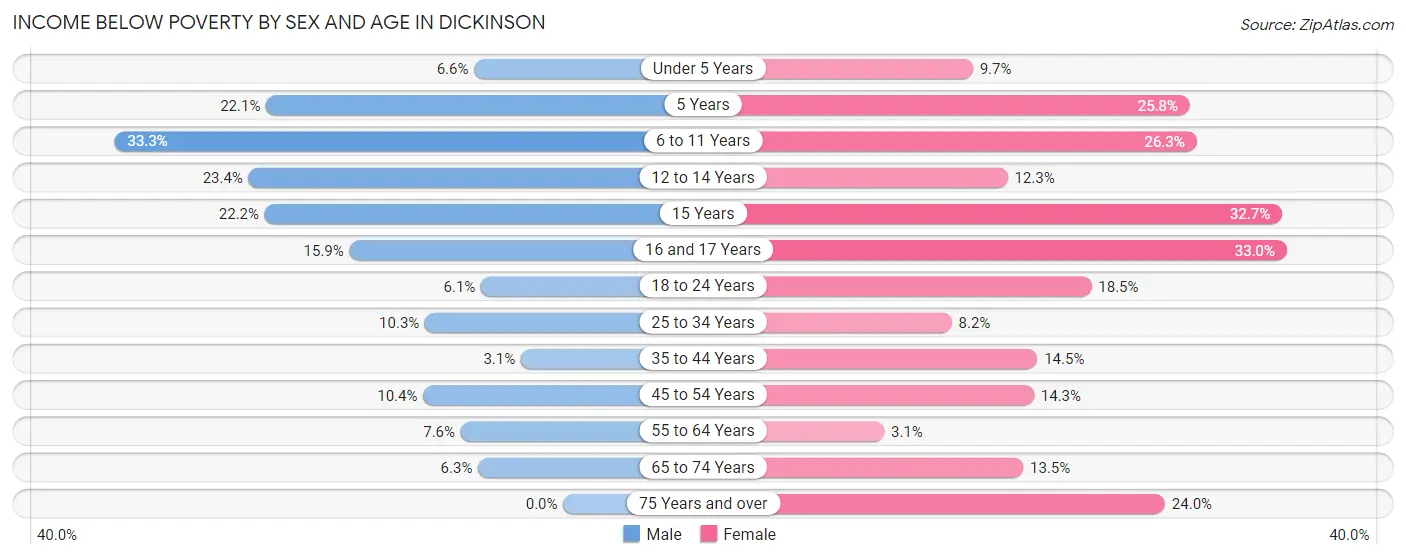
| Age Bracket | Male | Female |
| Under 5 Years | 36 (6.6%) | 79 (9.7%) |
| 5 Years | 45 (22.1%) | 77 (25.8%) |
| 6 to 11 Years | 270 (33.3%) | 251 (26.3%) |
| 12 to 14 Years | 103 (23.4%) | 101 (12.3%) |
| 15 Years | 37 (22.2%) | 67 (32.7%) |
| 16 and 17 Years | 40 (15.9%) | 111 (33.0%) |
| 18 to 24 Years | 60 (6.1%) | 197 (18.5%) |
| 25 to 34 Years | 135 (10.3%) | 111 (8.2%) |
| 35 to 44 Years | 52 (3.1%) | 205 (14.5%) |
| 45 to 54 Years | 185 (10.4%) | 138 (14.3%) |
| 55 to 64 Years | 90 (7.6%) | 42 (3.1%) |
| 65 to 74 Years | 46 (6.3%) | 133 (13.5%) |
| 75 Years and over | 0 (0.0%) | 119 (24.0%) |
| Total | 1,099 (10.5%) | 1,631 (14.8%) |
Income Above Poverty by Sex and Age in Dickinson
According to the poverty statistics in Dickinson, males aged 75 years and over and females aged 55 to 64 years are the age groups that are most secure financially, with 100.0% of males and 96.9% of females in these age groups living above the poverty line.
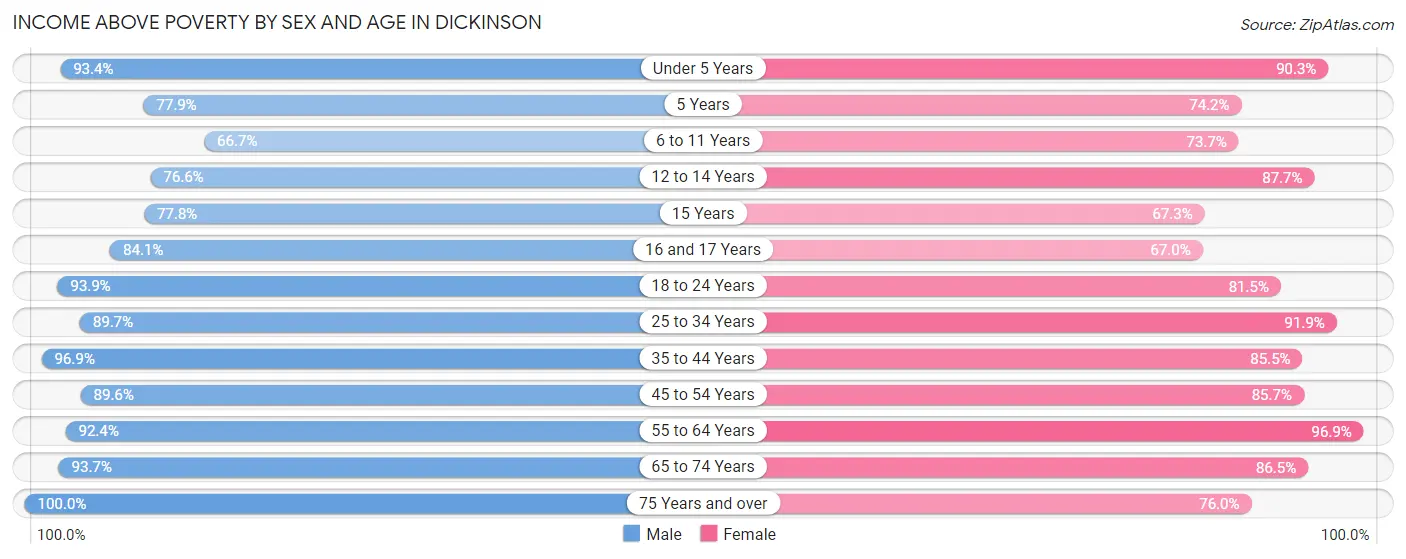
| Age Bracket | Male | Female |
| Under 5 Years | 509 (93.4%) | 734 (90.3%) |
| 5 Years | 159 (77.9%) | 221 (74.2%) |
| 6 to 11 Years | 540 (66.7%) | 702 (73.7%) |
| 12 to 14 Years | 338 (76.6%) | 720 (87.7%) |
| 15 Years | 130 (77.8%) | 138 (67.3%) |
| 16 and 17 Years | 212 (84.1%) | 225 (67.0%) |
| 18 to 24 Years | 924 (93.9%) | 866 (81.5%) |
| 25 to 34 Years | 1,181 (89.7%) | 1,251 (91.8%) |
| 35 to 44 Years | 1,605 (96.9%) | 1,208 (85.5%) |
| 45 to 54 Years | 1,594 (89.6%) | 830 (85.7%) |
| 55 to 64 Years | 1,093 (92.4%) | 1,294 (96.9%) |
| 65 to 74 Years | 682 (93.7%) | 855 (86.5%) |
| 75 Years and over | 357 (100.0%) | 377 (76.0%) |
| Total | 9,324 (89.5%) | 9,421 (85.2%) |
Income Below Poverty Among Married-Couple Families in Dickinson
The poverty statistics for married-couple families in Dickinson show that 4.3% or 191 of the total 4,390 families live below the poverty line. Families with 3 or 4 children have the highest poverty rate of 13.5%, comprising of 72 families. On the other hand, families with no children have the lowest poverty rate of 0.3%, which includes 7 families.
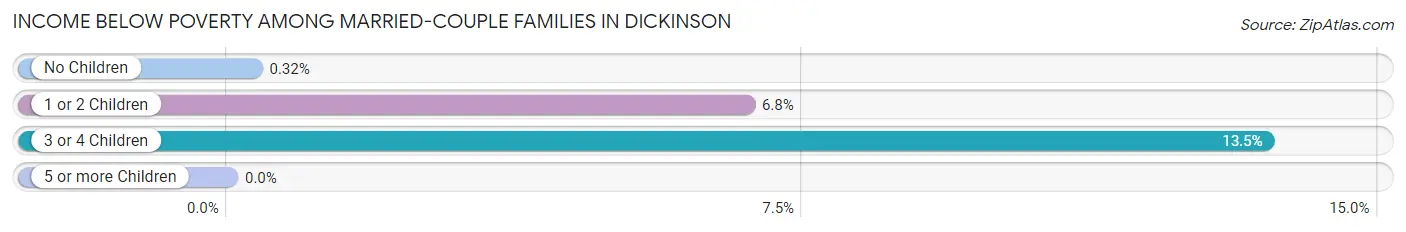
| Children | Above Poverty | Below Poverty |
| No Children | 2,191 (99.7%) | 7 (0.3%) |
| 1 or 2 Children | 1,548 (93.2%) | 112 (6.8%) |
| 3 or 4 Children | 460 (86.5%) | 72 (13.5%) |
| 5 or more Children | 0 (0.0%) | 0 (0.0%) |
| Total | 4,199 (95.7%) | 191 (4.3%) |
Income Below Poverty Among Single-Parent Households in Dickinson
According to the poverty data in Dickinson, 13.1% or 43 single-father households and 35.7% or 347 single-mother households are living below the poverty line. Among single-father households, those with 1 or 2 children have the highest poverty rate, with 43 households (28.9%) experiencing poverty. Likewise, among single-mother households, those with 3 or 4 children have the highest poverty rate, with 159 households (86.0%) falling below the poverty line.
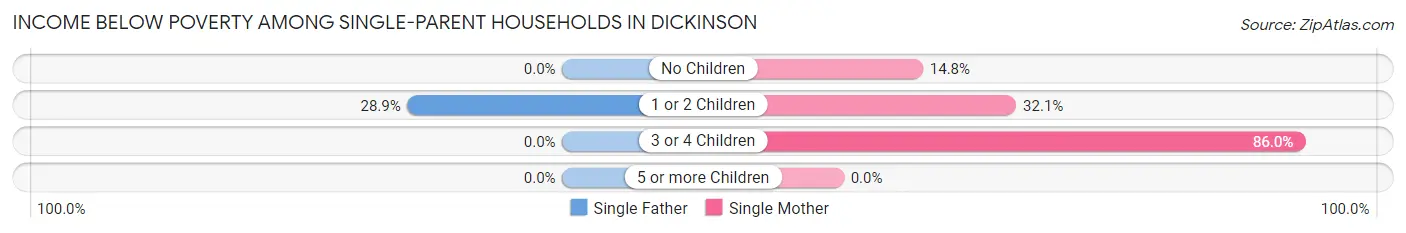
| Children | Single Father | Single Mother |
| No Children | 0 (0.0%) | 55 (14.7%) |
| 1 or 2 Children | 43 (28.9%) | 133 (32.1%) |
| 3 or 4 Children | 0 (0.0%) | 159 (86.0%) |
| 5 or more Children | 0 (0.0%) | 0 (0.0%) |
| Total | 43 (13.1%) | 347 (35.7%) |
Income Below Poverty Among Married-Couple vs Single-Parent Households in Dickinson
The poverty data for Dickinson shows that 191 of the married-couple family households (4.3%) and 390 of the single-parent households (30.0%) are living below the poverty level. Within the married-couple family households, those with 3 or 4 children have the highest poverty rate, with 72 households (13.5%) falling below the poverty line. Among the single-parent households, those with 3 or 4 children have the highest poverty rate, with 159 household (83.3%) living below poverty.
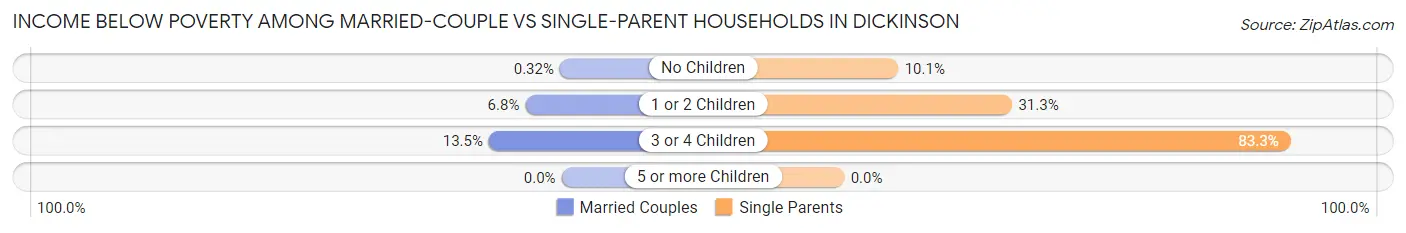
| Children | Married-Couple Families | Single-Parent Households |
| No Children | 7 (0.3%) | 55 (10.1%) |
| 1 or 2 Children | 112 (6.8%) | 176 (31.3%) |
| 3 or 4 Children | 72 (13.5%) | 159 (83.3%) |
| 5 or more Children | 0 (0.0%) | 0 (0.0%) |
| Total | 191 (4.3%) | 390 (30.0%) |
Race in Dickinson
The most populous races in Dickinson are White / Caucasian (14,775 | 68.8%), Hispanic or Latino (8,504 | 39.6%), and Two or more Races (3,611 | 16.8%).
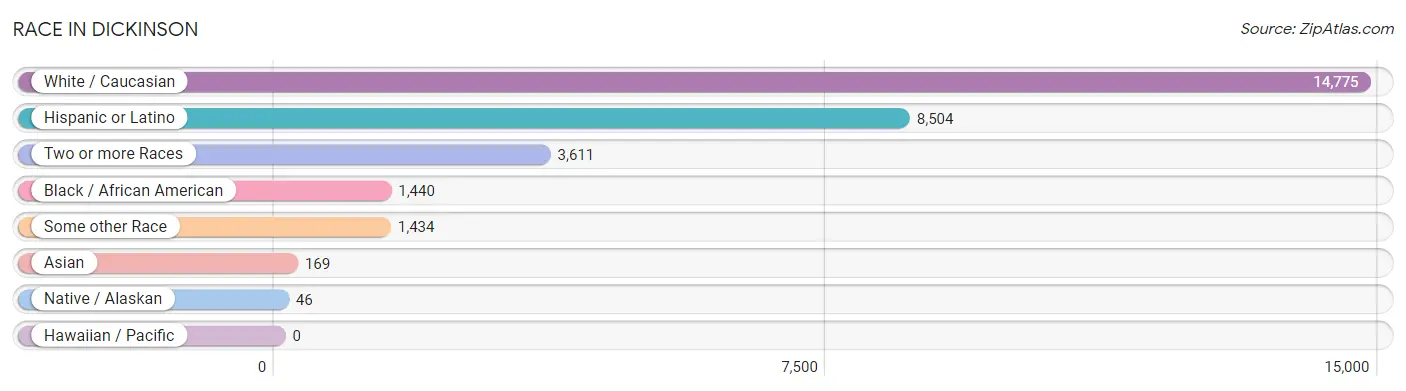
| Race | # Population | % Population |
| Asian | 169 | 0.8% |
| Black / African American | 1,440 | 6.7% |
| Hawaiian / Pacific | 0 | 0.0% |
| Hispanic or Latino | 8,504 | 39.6% |
| Native / Alaskan | 46 | 0.2% |
| White / Caucasian | 14,775 | 68.8% |
| Two or more Races | 3,611 | 16.8% |
| Some other Race | 1,434 | 6.7% |
| Total | 21,475 | 100.0% |
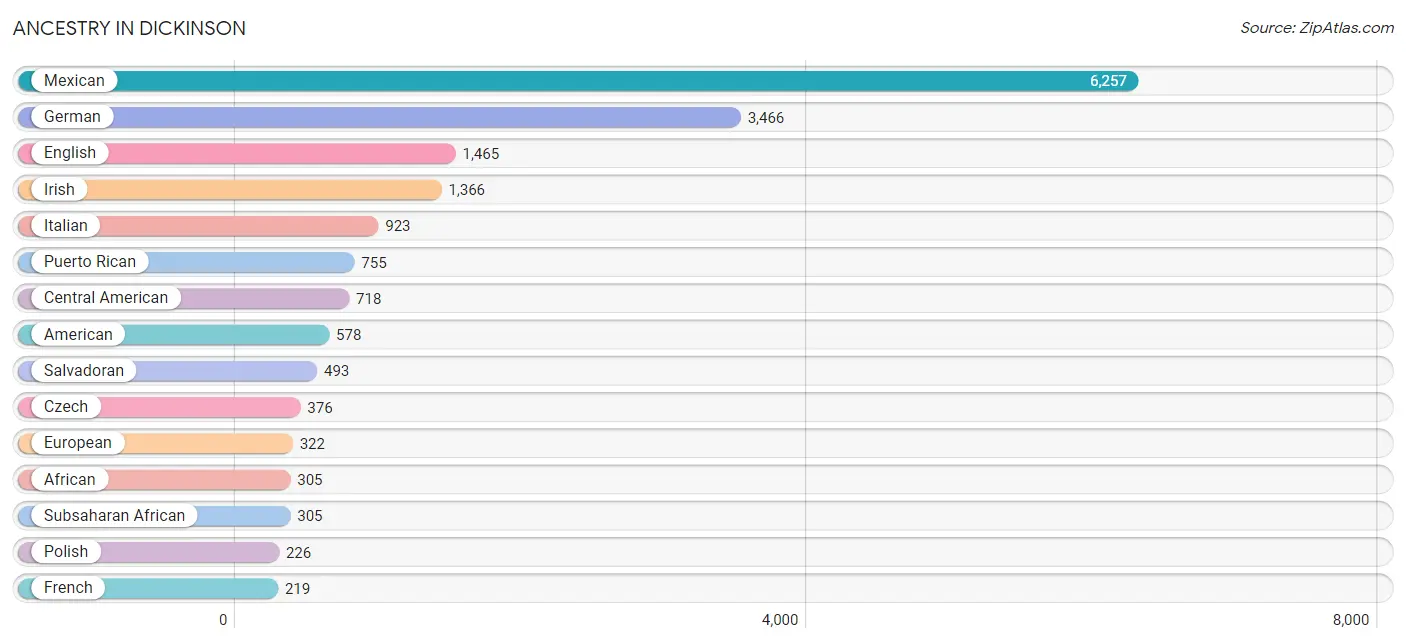
Ancestry in Dickinson
The most populous ancestries reported in Dickinson are Mexican (6,257 | 29.1%), German (3,466 | 16.1%), English (1,465 | 6.8%), Irish (1,366 | 6.4%), and Italian (923 | 4.3%), together accounting for 62.8% of all Dickinson residents.
| Ancestry | # Population | % Population |
| African | 305 | 1.4% |
| American | 578 | 2.7% |
| Apache | 33 | 0.2% |
| Arab | 106 | 0.5% |
| Austrian | 29 | 0.1% |
| Bhutanese | 11 | 0.1% |
| Blackfeet | 5 | 0.0% |
| British | 77 | 0.4% |
| Burmese | 16 | 0.1% |
| Canadian | 12 | 0.1% |
| Central American | 718 | 3.3% |
| Cherokee | 68 | 0.3% |
| Choctaw | 7 | 0.0% |
| Costa Rican | 41 | 0.2% |
| Cuban | 27 | 0.1% |
| Czech | 376 | 1.8% |
| Czechoslovakian | 13 | 0.1% |
| Danish | 55 | 0.3% |
| Dominican | 16 | 0.1% |
| Dutch | 173 | 0.8% |
| English | 1,465 | 6.8% |
| European | 322 | 1.5% |
| French | 219 | 1.0% |
| French Canadian | 142 | 0.7% |
| German | 3,466 | 16.1% |
| Greek | 24 | 0.1% |
| Guatemalan | 165 | 0.8% |
| Honduran | 19 | 0.1% |
| Hungarian | 57 | 0.3% |
| Irish | 1,366 | 6.4% |
| Italian | 923 | 4.3% |
| Korean | 179 | 0.8% |
| Mexican | 6,257 | 29.1% |
| Moroccan | 106 | 0.5% |
| Northern European | 45 | 0.2% |
| Norwegian | 15 | 0.1% |
| Polish | 226 | 1.1% |
| Puerto Rican | 755 | 3.5% |
| Russian | 24 | 0.1% |
| Salvadoran | 493 | 2.3% |
| Scotch-Irish | 110 | 0.5% |
| Scottish | 154 | 0.7% |
| Slovene | 7 | 0.0% |
| Spaniard | 157 | 0.7% |
| Spanish | 81 | 0.4% |
| Sri Lankan | 54 | 0.3% |
| Subsaharan African | 305 | 1.4% |
| Swedish | 57 | 0.3% |
| Swiss | 93 | 0.4% |
| Ukrainian | 11 | 0.1% |
| Welsh | 46 | 0.2% | View All 51 Rows |
Immigrants in Dickinson
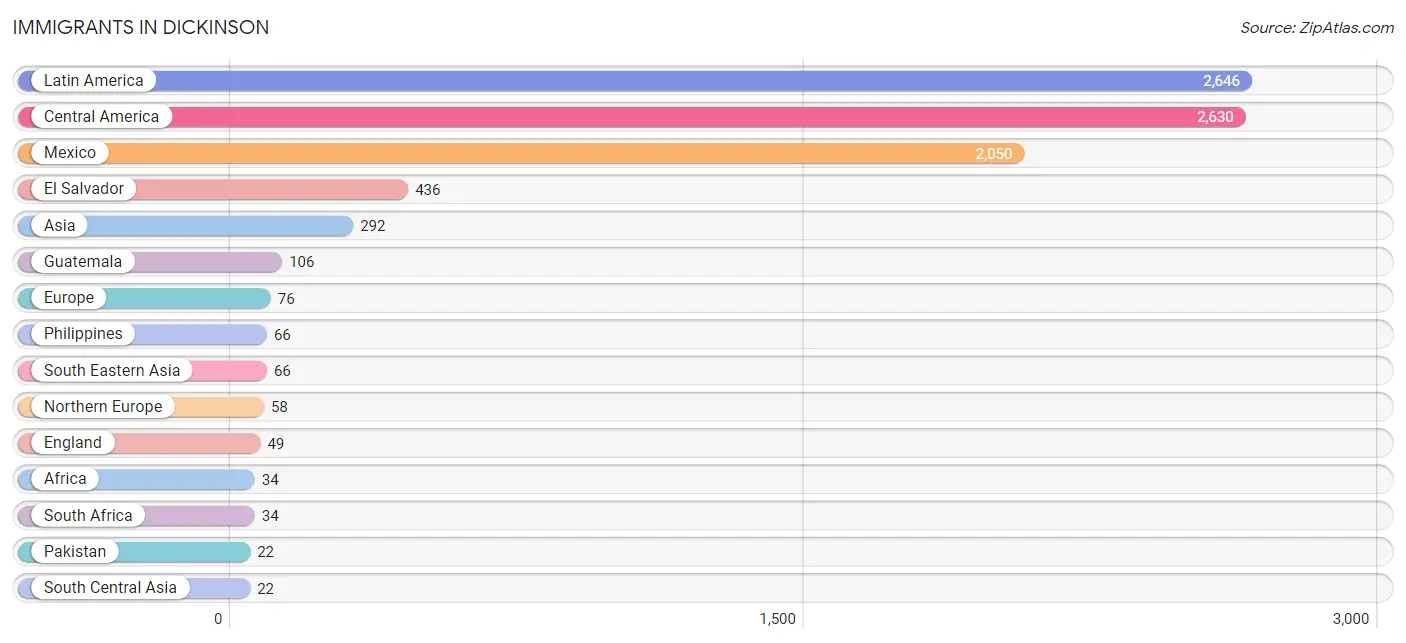
The most numerous immigrant groups reported in Dickinson came from Latin America (2,646 | 12.3%), Central America (2,630 | 12.2%), Mexico (2,050 | 9.6%), El Salvador (436 | 2.0%), and Asia (292 | 1.4%), together accounting for 37.5% of all Dickinson residents.
| Immigration Origin | # Population | % Population |
| Africa | 34 | 0.2% |
| Asia | 292 | 1.4% |
| Canada | 18 | 0.1% |
| Caribbean | 16 | 0.1% |
| Central America | 2,630 | 12.2% |
| Costa Rica | 19 | 0.1% |
| Dominican Republic | 16 | 0.1% |
| Eastern Asia | 16 | 0.1% |
| Eastern Europe | 13 | 0.1% |
| El Salvador | 436 | 2.0% |
| England | 49 | 0.2% |
| Europe | 76 | 0.4% |
| Germany | 5 | 0.0% |
| Guatemala | 106 | 0.5% |
| Honduras | 19 | 0.1% |
| Korea | 16 | 0.1% |
| Latin America | 2,646 | 12.3% |
| Mexico | 2,050 | 9.6% |
| Northern Europe | 58 | 0.3% |
| Pakistan | 22 | 0.1% |
| Philippines | 66 | 0.3% |
| Russia | 13 | 0.1% |
| South Africa | 34 | 0.2% |
| South Central Asia | 22 | 0.1% |
| South Eastern Asia | 66 | 0.3% |
| Western Europe | 5 | 0.0% | View All 26 Rows |
Sex and Age in Dickinson
Sex and Age in Dickinson
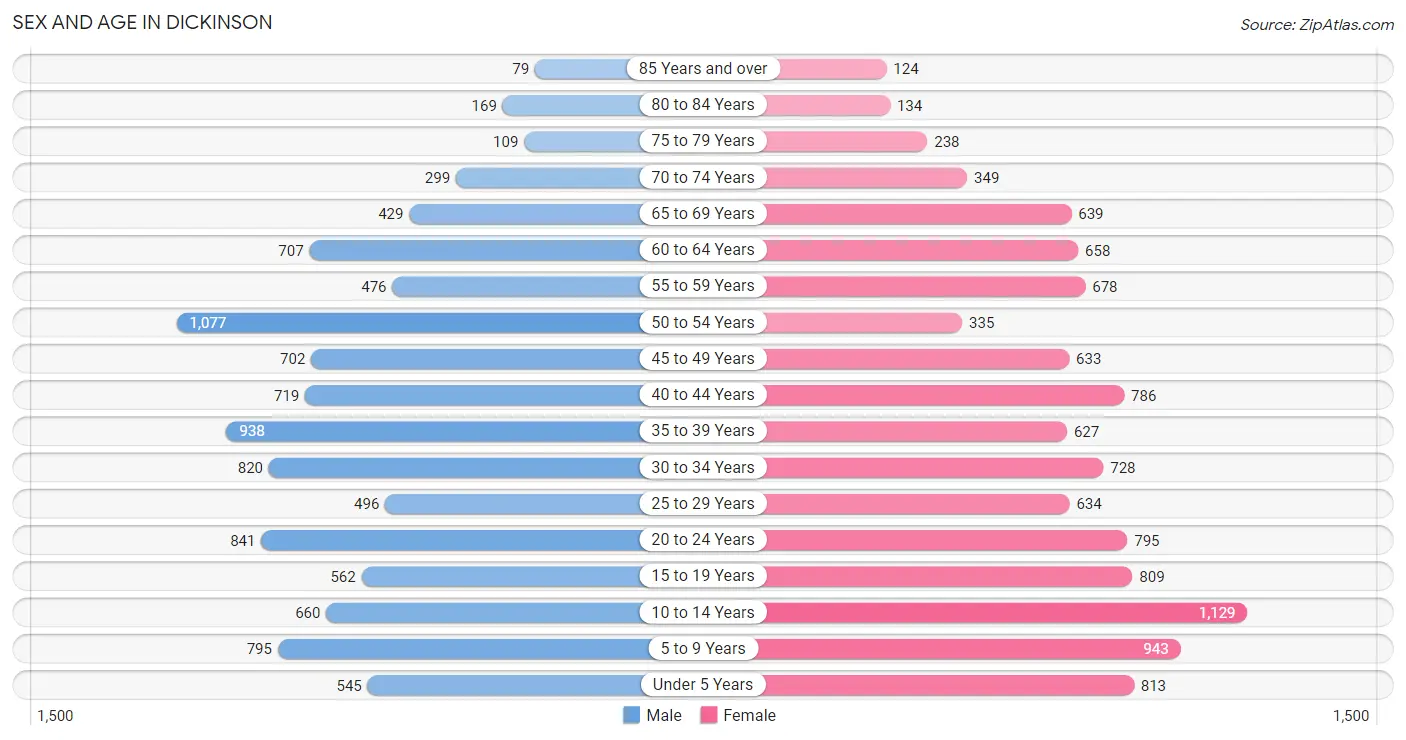
The most populous age groups in Dickinson are 50 to 54 Years (1,077 | 10.3%) for men and 10 to 14 Years (1,129 | 10.2%) for women.
| Age Bracket | Male | Female |
| Under 5 Years | 545 (5.2%) | 813 (7.4%) |
| 5 to 9 Years | 795 (7.6%) | 943 (8.5%) |
| 10 to 14 Years | 660 (6.3%) | 1,129 (10.2%) |
| 15 to 19 Years | 562 (5.4%) | 809 (7.3%) |
| 20 to 24 Years | 841 (8.1%) | 795 (7.2%) |
| 25 to 29 Years | 496 (4.8%) | 634 (5.7%) |
| 30 to 34 Years | 820 (7.9%) | 728 (6.6%) |
| 35 to 39 Years | 938 (9.0%) | 627 (5.7%) |
| 40 to 44 Years | 719 (6.9%) | 786 (7.1%) |
| 45 to 49 Years | 702 (6.7%) | 633 (5.7%) |
| 50 to 54 Years | 1,077 (10.3%) | 335 (3.0%) |
| 55 to 59 Years | 476 (4.6%) | 678 (6.1%) |
| 60 to 64 Years | 707 (6.8%) | 658 (5.9%) |
| 65 to 69 Years | 429 (4.1%) | 639 (5.8%) |
| 70 to 74 Years | 299 (2.9%) | 349 (3.2%) |
| 75 to 79 Years | 109 (1.1%) | 238 (2.1%) |
| 80 to 84 Years | 169 (1.6%) | 134 (1.2%) |
| 85 Years and over | 79 (0.8%) | 124 (1.1%) |
| Total | 10,423 (100.0%) | 11,052 (100.0%) |
Families and Households in Dickinson
Median Family Size in Dickinson
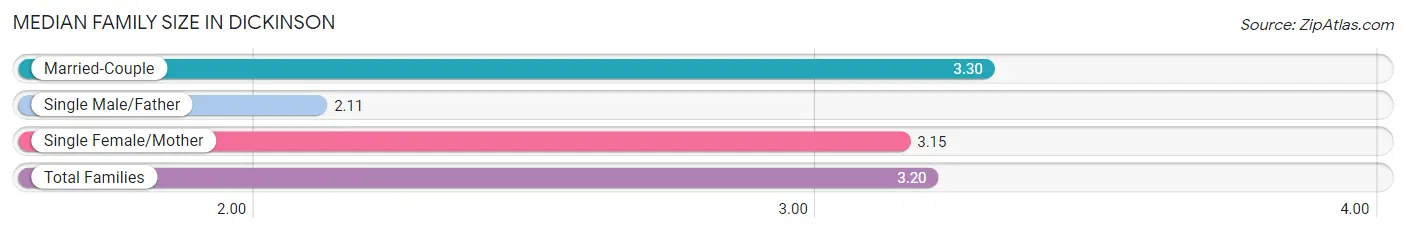
The median family size in Dickinson is 3.20 persons per family, with married-couple families (4,390 | 77.1%) accounting for the largest median family size of 3.3 persons per family. On the other hand, single male/father families (328 | 5.8%) represent the smallest median family size with 2.11 persons per family.
| Family Type | # Families | Family Size |
| Married-Couple | 4,390 (77.1%) | 3.30 |
| Single Male/Father | 328 (5.8%) | 2.11 |
| Single Female/Mother | 972 (17.1%) | 3.15 |
| Total Families | 5,690 (100.0%) | 3.20 |
Median Household Size in Dickinson
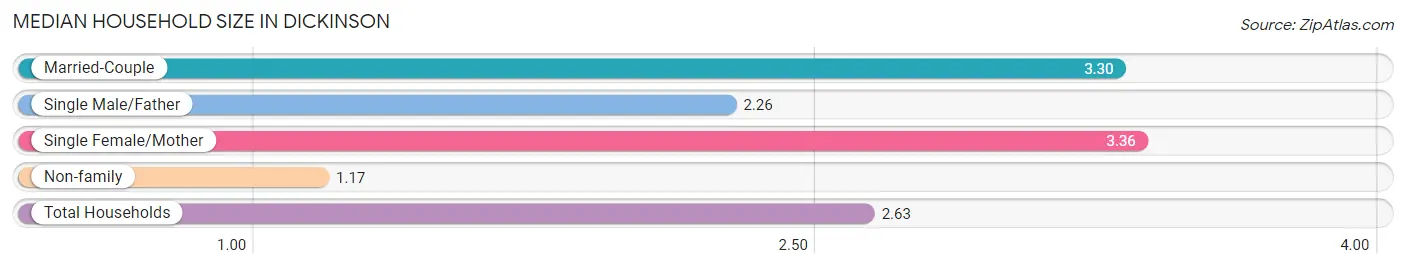
The median household size in Dickinson is 2.63 persons per household, with single female/mother households (972 | 12.0%) accounting for the largest median household size of 3.36 persons per household. non-family households (2,414 | 29.8%) represent the smallest median household size with 1.17 persons per household.
| Household Type | # Households | Household Size |
| Married-Couple | 4,390 (54.2%) | 3.30 |
| Single Male/Father | 328 (4.1%) | 2.26 |
| Single Female/Mother | 972 (12.0%) | 3.36 |
| Non-family | 2,414 (29.8%) | 1.17 |
| Total Households | 8,104 (100.0%) | 2.63 |
Household Size by Marriage Status in Dickinson
Out of a total of 8,104 households in Dickinson, 5,690 (70.2%) are family households, while 2,414 (29.8%) are nonfamily households. The most numerous type of family households are 2-person households, comprising 2,381, and the most common type of nonfamily households are 1-person households, comprising 2,043.
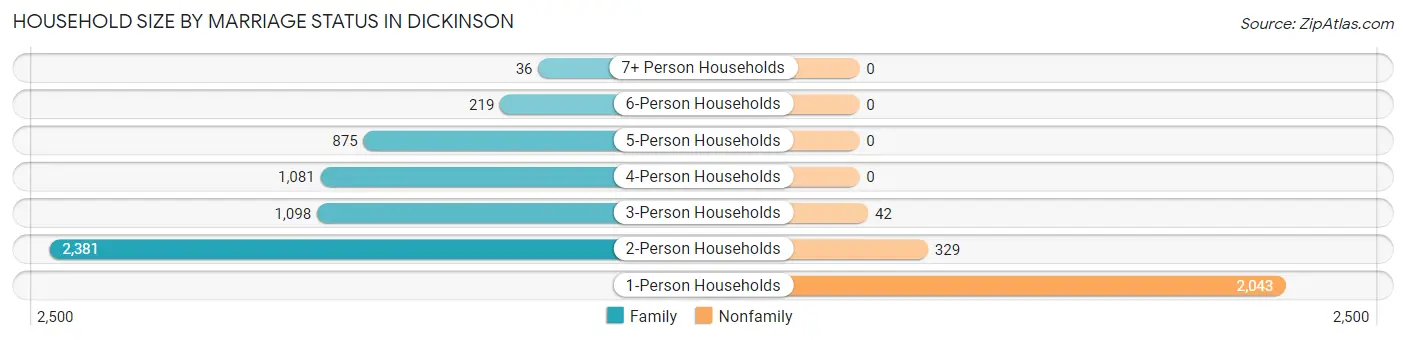
| Household Size | Family Households | Nonfamily Households |
| 1-Person Households | - | 2,043 (25.2%) |
| 2-Person Households | 2,381 (29.4%) | 329 (4.1%) |
| 3-Person Households | 1,098 (13.6%) | 42 (0.5%) |
| 4-Person Households | 1,081 (13.3%) | 0 (0.0%) |
| 5-Person Households | 875 (10.8%) | 0 (0.0%) |
| 6-Person Households | 219 (2.7%) | 0 (0.0%) |
| 7+ Person Households | 36 (0.4%) | 0 (0.0%) |
| Total | 5,690 (70.2%) | 2,414 (29.8%) |
Female Fertility in Dickinson
Fertility by Age in Dickinson
Average fertility rate in Dickinson is 75.0 births per 1,000 women. Women in the age bracket of 20 to 34 years have the highest fertility rate with 174.0 births per 1,000 women. Women in the age bracket of 20 to 34 years acount for 100.0% of all women with births.
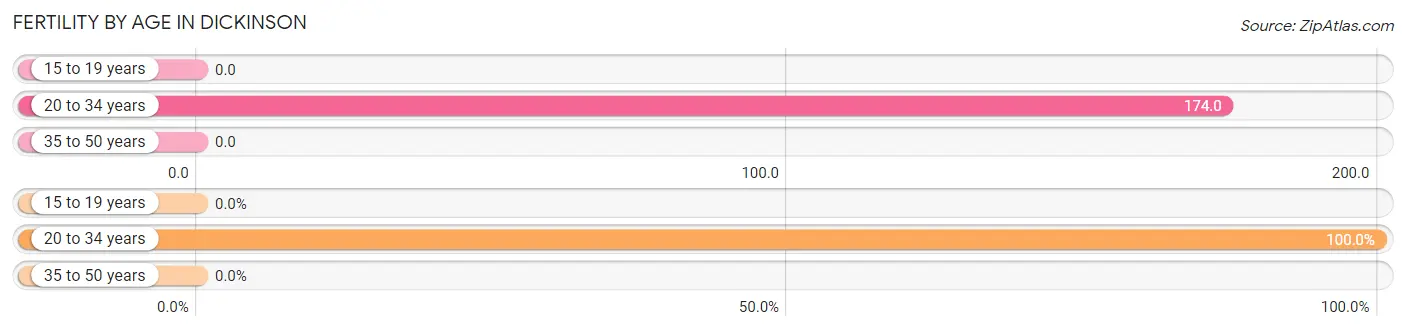
| Age Bracket | Women with Births | Births / 1,000 Women |
| 15 to 19 years | 0 (0.0%) | 0.0 |
| 20 to 34 years | 376 (100.0%) | 174.0 |
| 35 to 50 years | 0 (0.0%) | 0.0 |
| Total | 376 (100.0%) | 75.0 |
Fertility by Age by Marriage Status in Dickinson
56.4% of women with births (376) in Dickinson are married. The highest percentage of unmarried women with births falls into 20 to 34 years age bracket with 43.6% of them unmarried at the time of birth, while the lowest percentage of unmarried women with births belong to 20 to 34 years age bracket with 43.6% of them unmarried.
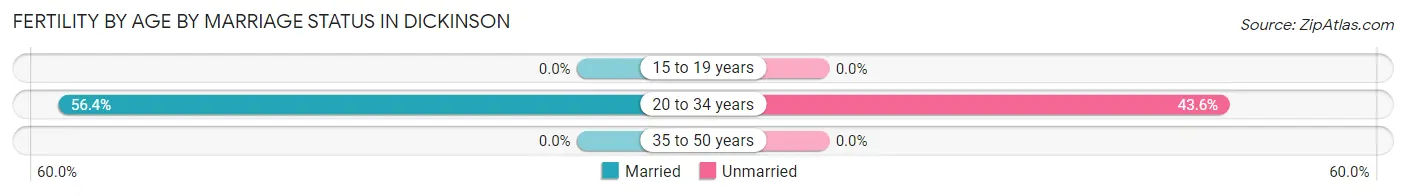
| Age Bracket | Married | Unmarried |
| 15 to 19 years | 0 (0.0%) | 0 (0.0%) |
| 20 to 34 years | 212 (56.4%) | 164 (43.6%) |
| 35 to 50 years | 0 (0.0%) | 0 (0.0%) |
| Total | 212 (56.4%) | 164 (43.6%) |
Fertility by Education in Dickinson
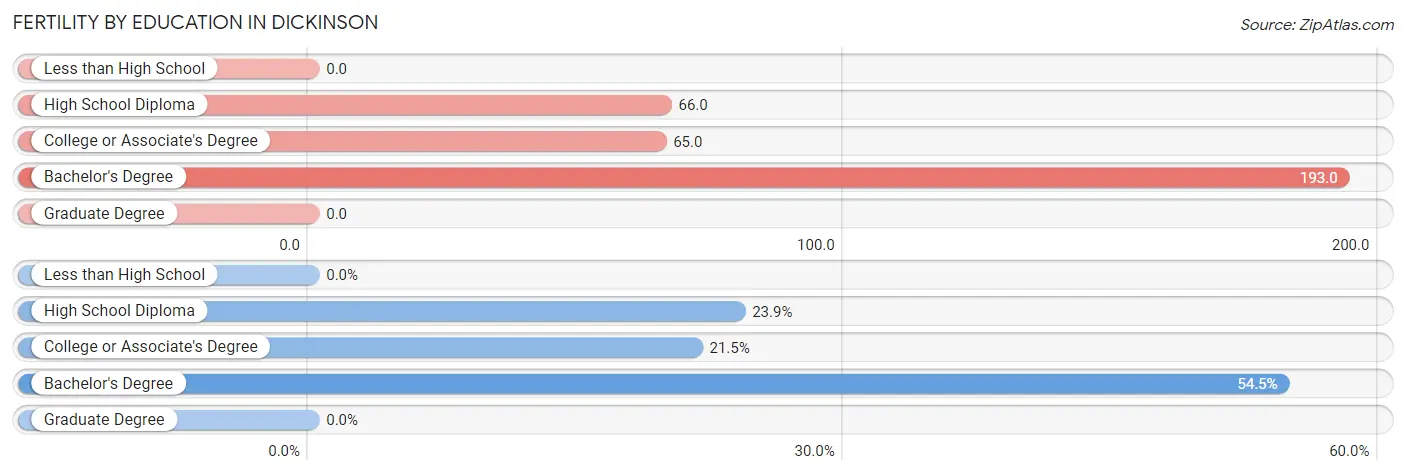
| Educational Attainment | Women with Births | Births / 1,000 Women |
| Less than High School | 0 (0.0%) | 0.0 |
| High School Diploma | 90 (23.9%) | 66.0 |
| College or Associate's Degree | 81 (21.5%) | 65.0 |
| Bachelor's Degree | 205 (54.5%) | 193.0 |
| Graduate Degree | 0 (0.0%) | 0.0 |
| Total | 376 (100.0%) | 75.0 |
Fertility by Education by Marriage Status in Dickinson
43.6% of women with births in Dickinson are unmarried. Women with the educational attainment of bachelor's degree are most likely to be married with 96.6% of them married at childbirth, while women with the educational attainment of high school diploma are least likely to be married with 100.0% of them unmarried at childbirth.
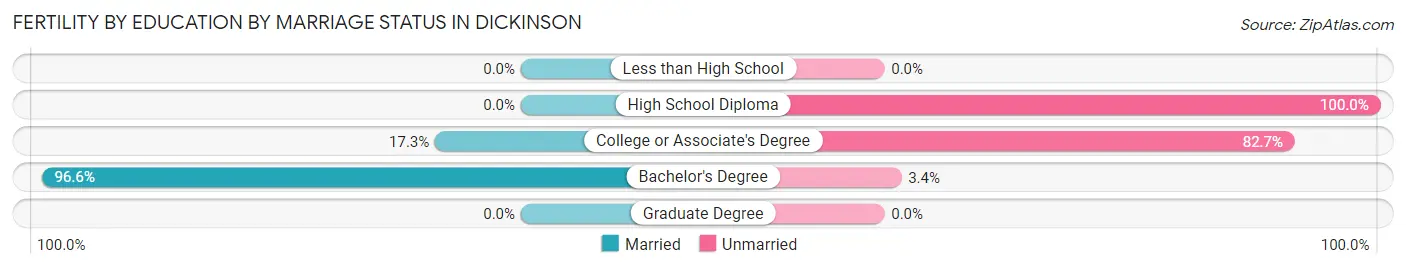
| Educational Attainment | Married | Unmarried |
| Less than High School | 0 (0.0%) | 0 (0.0%) |
| High School Diploma | 0 (0.0%) | 90 (100.0%) |
| College or Associate's Degree | 14 (17.3%) | 67 (82.7%) |
| Bachelor's Degree | 198 (96.6%) | 7 (3.4%) |
| Graduate Degree | 0 (0.0%) | 0 (0.0%) |
| Total | 212 (56.4%) | 164 (43.6%) |
Employment Characteristics in Dickinson
Employment by Class of Employer in Dickinson
Among the 10,312 employed individuals in Dickinson, private company employees (6,696 | 64.9%), local government employees (1,378 | 13.4%), and state government employees (616 | 6.0%) make up the most common classes of employment.
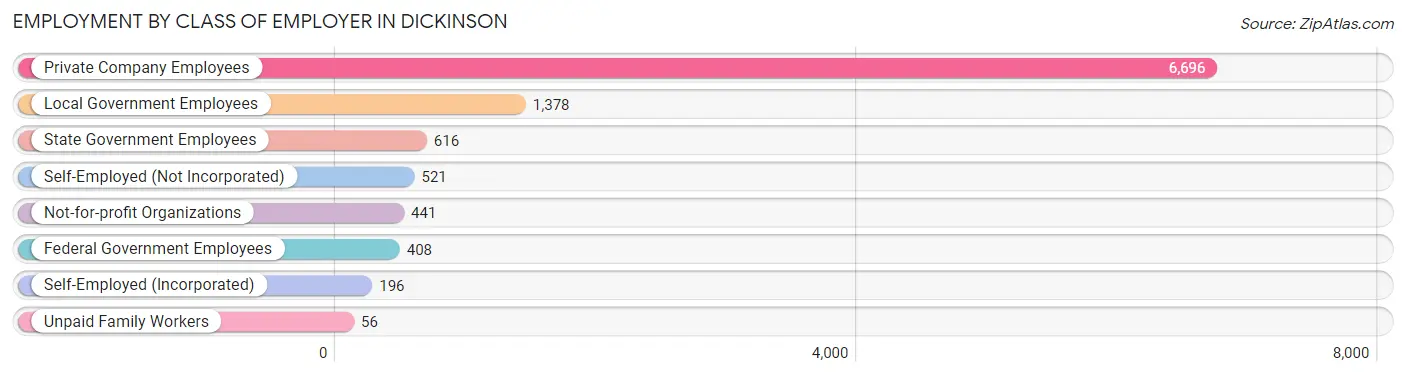
| Employer Class | # Employees | % Employees |
| Private Company Employees | 6,696 | 64.9% |
| Self-Employed (Incorporated) | 196 | 1.9% |
| Self-Employed (Not Incorporated) | 521 | 5.1% |
| Not-for-profit Organizations | 441 | 4.3% |
| Local Government Employees | 1,378 | 13.4% |
| State Government Employees | 616 | 6.0% |
| Federal Government Employees | 408 | 4.0% |
| Unpaid Family Workers | 56 | 0.5% |
| Total | 10,312 | 100.0% |
Employment Status by Age in Dickinson
According to the labor force statistics for Dickinson, out of the total population over 16 years of age (16,218), 67.6% or 10,963 individuals are in the labor force, with 4.4% or 482 of them unemployed. The age group with the highest labor force participation rate is 20 to 24 years, with 91.5% or 1,497 individuals in the labor force. Within the labor force, the 16 to 19 years age range has the highest percentage of unemployed individuals, with 17.8% or 75 of them being unemployed.
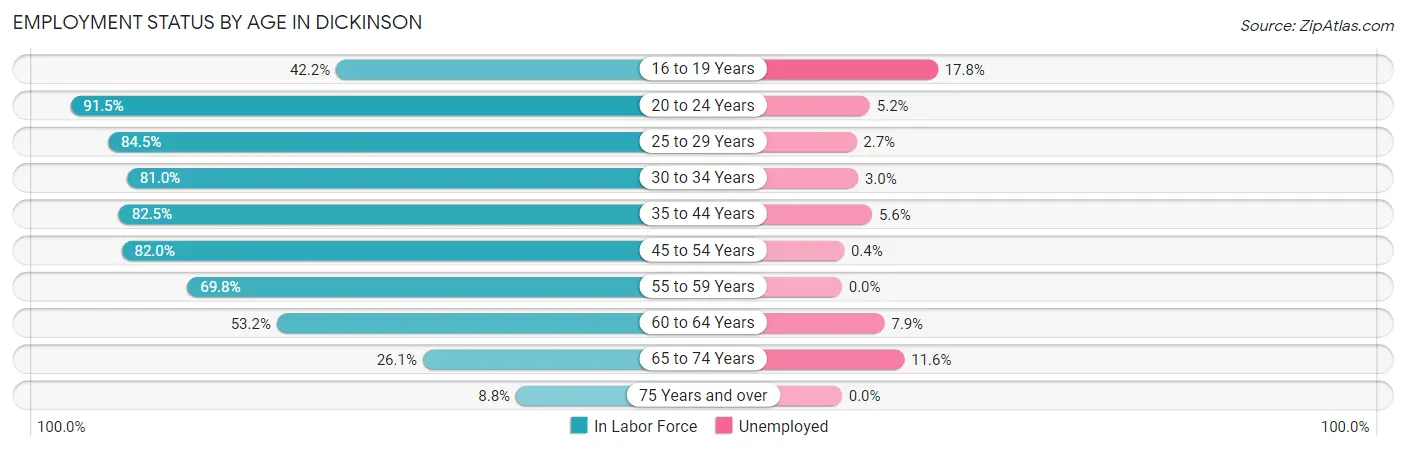
| Age Bracket | In Labor Force | Unemployed |
| 16 to 19 Years | 422 (42.2%) | 75 (17.8%) |
| 20 to 24 Years | 1,497 (91.5%) | 78 (5.2%) |
| 25 to 29 Years | 955 (84.5%) | 26 (2.7%) |
| 30 to 34 Years | 1,254 (81.0%) | 38 (3.0%) |
| 35 to 44 Years | 2,533 (82.5%) | 142 (5.6%) |
| 45 to 54 Years | 2,253 (82.0%) | 9 (0.4%) |
| 55 to 59 Years | 805 (69.8%) | 0 (0.0%) |
| 60 to 64 Years | 726 (53.2%) | 57 (7.9%) |
| 65 to 74 Years | 448 (26.1%) | 52 (11.6%) |
| 75 Years and over | 75 (8.8%) | 0 (0.0%) |
| Total | 10,963 (67.6%) | 482 (4.4%) |
Employment Status by Educational Attainment in Dickinson
According to labor force statistics for Dickinson, 77.4% of individuals (8,525) out of the total population between 25 and 64 years of age (11,014) are in the labor force, with 3.2% or 273 of them being unemployed. The group with the highest labor force participation rate are those with the educational attainment of bachelor's degree or higher, with 84.6% or 2,272 individuals in the labor force. Within the labor force, individuals with college / associate degree education have the highest percentage of unemployment, with 5.7% or 182 of them being unemployed.
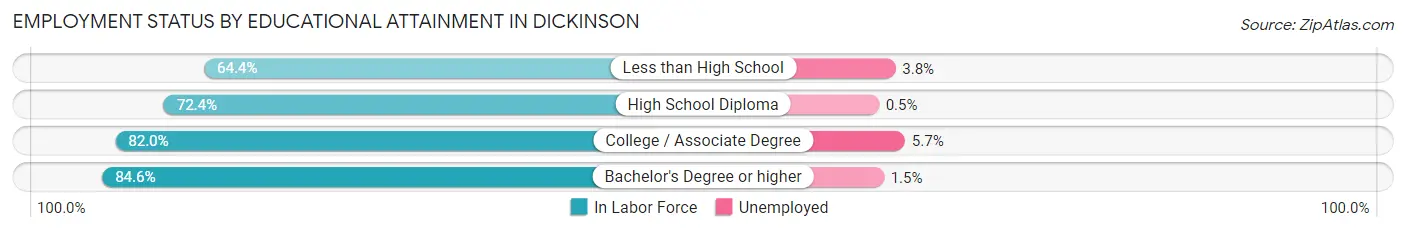
| Educational Attainment | In Labor Force | Unemployed |
| Less than High School | 1,211 (64.4%) | 71 (3.8%) |
| High School Diploma | 1,852 (72.4%) | 13 (0.5%) |
| College / Associate Degree | 3,190 (82.0%) | 222 (5.7%) |
| Bachelor's Degree or higher | 2,272 (84.6%) | 40 (1.5%) |
| Total | 8,525 (77.4%) | 352 (3.2%) |
Employment Occupations by Sex in Dickinson
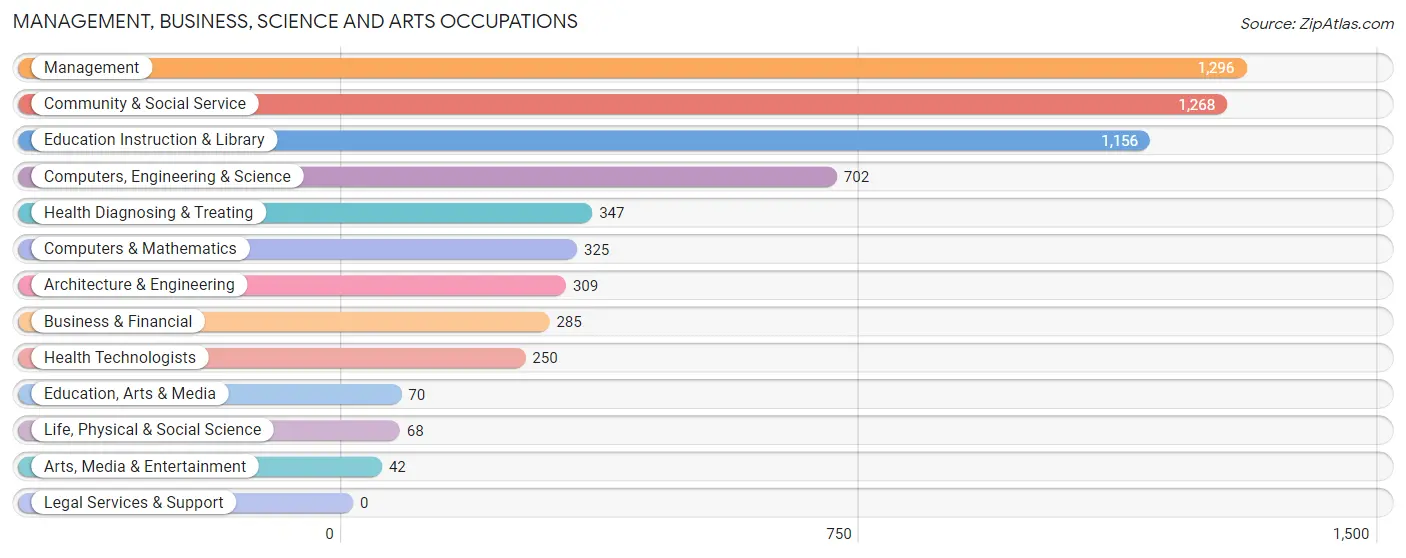
Management, Business, Science and Arts Occupations
The most common Management, Business, Science and Arts occupations in Dickinson are Management (1,296 | 12.4%), Community & Social Service (1,268 | 12.1%), Education Instruction & Library (1,156 | 11.1%), Computers, Engineering & Science (702 | 6.7%), and Health Diagnosing & Treating (347 | 3.3%).
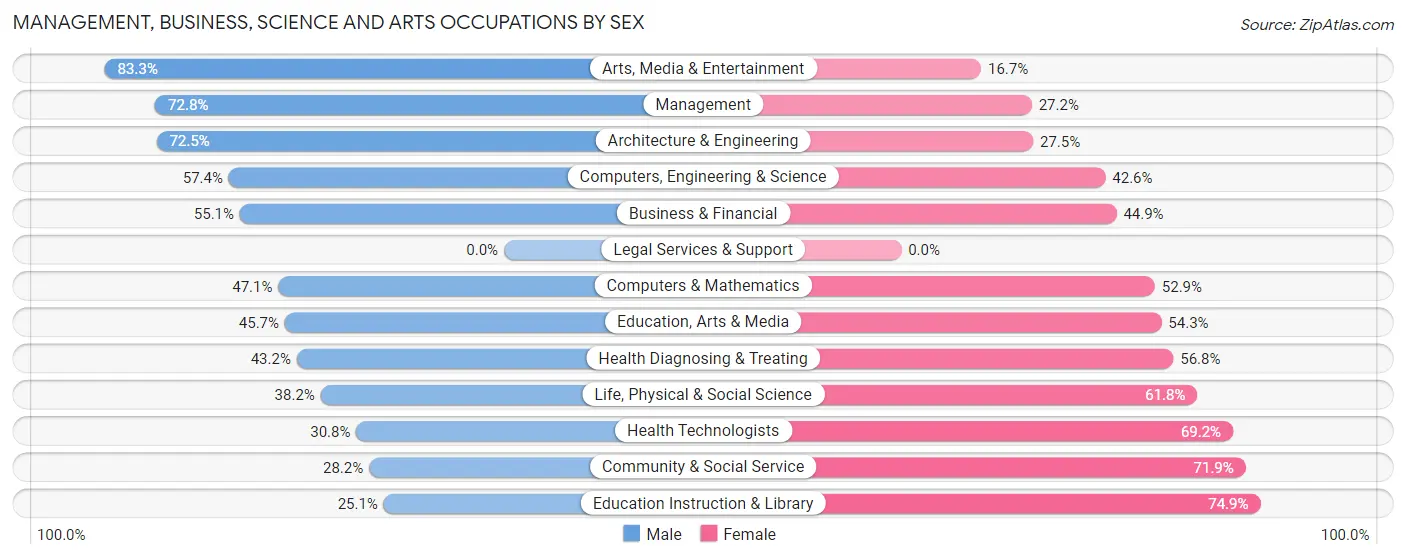
Management, Business, Science and Arts Occupations by Sex
Within the Management, Business, Science and Arts occupations in Dickinson, the most male-oriented occupations are Arts, Media & Entertainment (83.3%), Management (72.8%), and Architecture & Engineering (72.5%), while the most female-oriented occupations are Education Instruction & Library (74.9%), Community & Social Service (71.9%), and Health Technologists (69.2%).
| Occupation | Male | Female |
| Management | 943 (72.8%) | 353 (27.2%) |
| Business & Financial | 157 (55.1%) | 128 (44.9%) |
| Computers, Engineering & Science | 403 (57.4%) | 299 (42.6%) |
| Computers & Mathematics | 153 (47.1%) | 172 (52.9%) |
| Architecture & Engineering | 224 (72.5%) | 85 (27.5%) |
| Life, Physical & Social Science | 26 (38.2%) | 42 (61.8%) |
| Community & Social Service | 357 (28.1%) | 911 (71.9%) |
| Education, Arts & Media | 32 (45.7%) | 38 (54.3%) |
| Legal Services & Support | 0 (0.0%) | 0 (0.0%) |
| Education Instruction & Library | 290 (25.1%) | 866 (74.9%) |
| Arts, Media & Entertainment | 35 (83.3%) | 7 (16.7%) |
| Health Diagnosing & Treating | 150 (43.2%) | 197 (56.8%) |
| Health Technologists | 77 (30.8%) | 173 (69.2%) |
| Total (Category) | 2,010 (51.6%) | 1,888 (48.4%) |
| Total (Overall) | 6,202 (59.3%) | 4,253 (40.7%) |
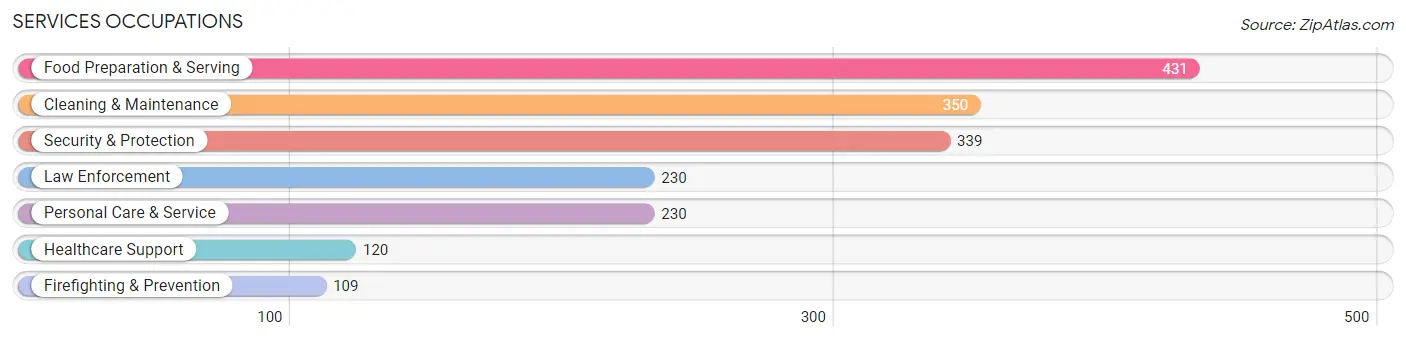
Services Occupations
The most common Services occupations in Dickinson are Food Preparation & Serving (431 | 4.1%), Cleaning & Maintenance (350 | 3.4%), Security & Protection (339 | 3.2%), Law Enforcement (230 | 2.2%), and Personal Care & Service (230 | 2.2%).
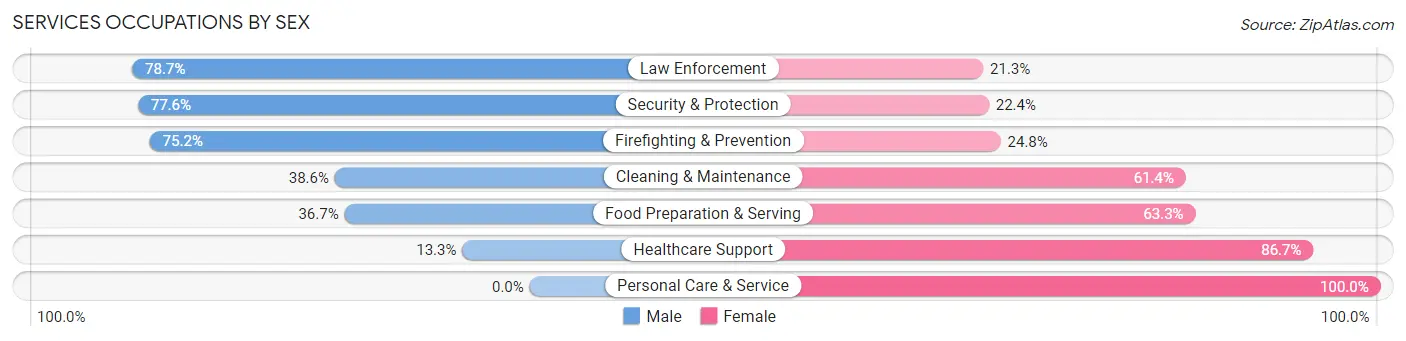
Services Occupations by Sex
Within the Services occupations in Dickinson, the most male-oriented occupations are Law Enforcement (78.7%), Security & Protection (77.6%), and Firefighting & Prevention (75.2%), while the most female-oriented occupations are Personal Care & Service (100.0%), Healthcare Support (86.7%), and Food Preparation & Serving (63.3%).
| Occupation | Male | Female |
| Healthcare Support | 16 (13.3%) | 104 (86.7%) |
| Security & Protection | 263 (77.6%) | 76 (22.4%) |
| Firefighting & Prevention | 82 (75.2%) | 27 (24.8%) |
| Law Enforcement | 181 (78.7%) | 49 (21.3%) |
| Food Preparation & Serving | 158 (36.7%) | 273 (63.3%) |
| Cleaning & Maintenance | 135 (38.6%) | 215 (61.4%) |
| Personal Care & Service | 0 (0.0%) | 230 (100.0%) |
| Total (Category) | 572 (38.9%) | 898 (61.1%) |
| Total (Overall) | 6,202 (59.3%) | 4,253 (40.7%) |
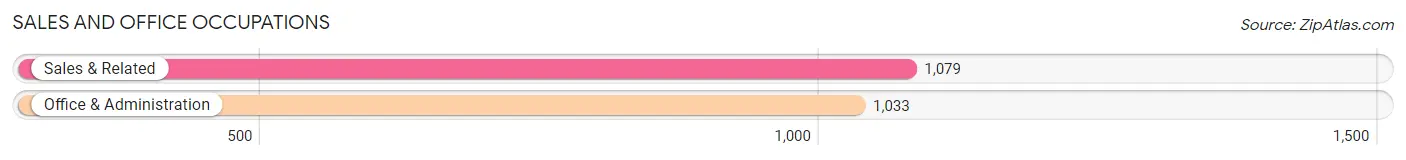
Sales and Office Occupations
The most common Sales and Office occupations in Dickinson are Sales & Related (1,079 | 10.3%), and Office & Administration (1,033 | 9.9%).
Sales and Office Occupations by Sex
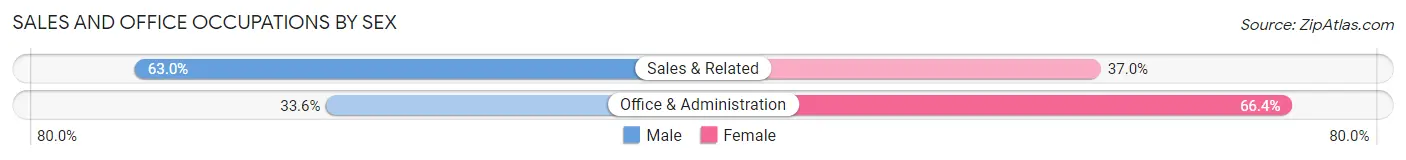
| Occupation | Male | Female |
| Sales & Related | 680 (63.0%) | 399 (37.0%) |
| Office & Administration | 347 (33.6%) | 686 (66.4%) |
| Total (Category) | 1,027 (48.6%) | 1,085 (51.4%) |
| Total (Overall) | 6,202 (59.3%) | 4,253 (40.7%) |
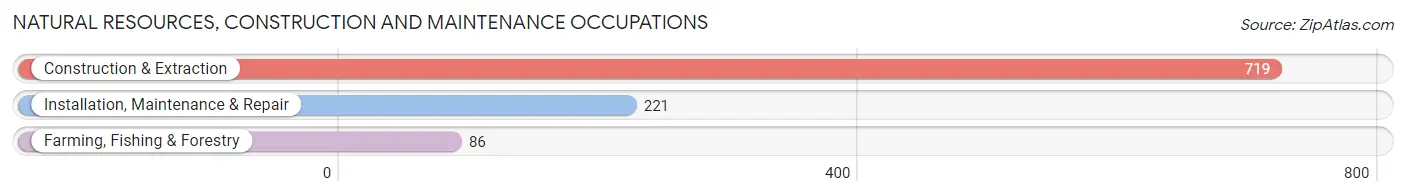
Natural Resources, Construction and Maintenance Occupations
The most common Natural Resources, Construction and Maintenance occupations in Dickinson are Construction & Extraction (719 | 6.9%), Installation, Maintenance & Repair (221 | 2.1%), and Farming, Fishing & Forestry (86 | 0.8%).
Natural Resources, Construction and Maintenance Occupations by Sex
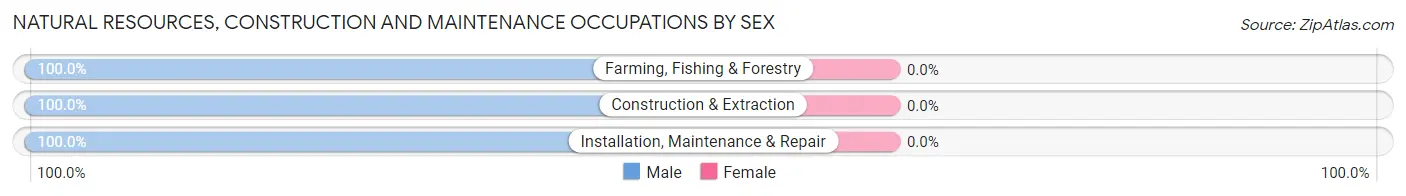
| Occupation | Male | Female |
| Farming, Fishing & Forestry | 86 (100.0%) | 0 (0.0%) |
| Construction & Extraction | 719 (100.0%) | 0 (0.0%) |
| Installation, Maintenance & Repair | 221 (100.0%) | 0 (0.0%) |
| Total (Category) | 1,026 (100.0%) | 0 (0.0%) |
| Total (Overall) | 6,202 (59.3%) | 4,253 (40.7%) |
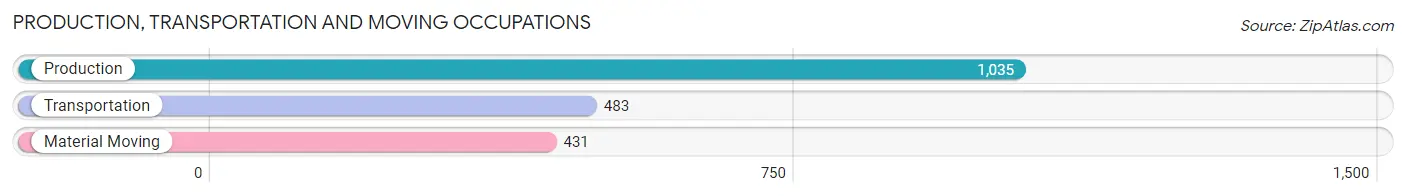
Production, Transportation and Moving Occupations
The most common Production, Transportation and Moving occupations in Dickinson are Production (1,035 | 9.9%), Transportation (483 | 4.6%), and Material Moving (431 | 4.1%).
Production, Transportation and Moving Occupations by Sex
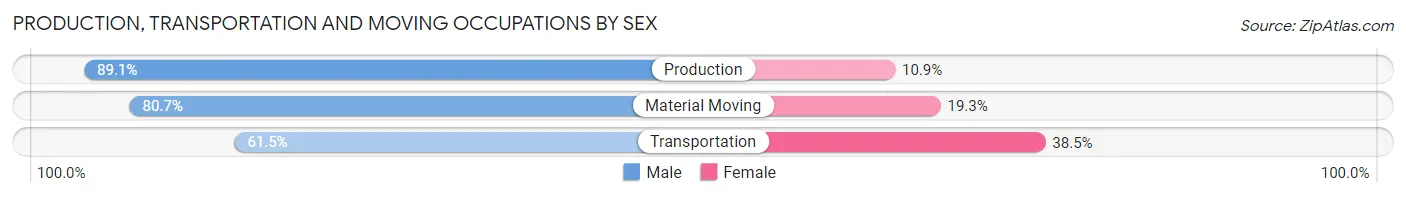
| Occupation | Male | Female |
| Production | 922 (89.1%) | 113 (10.9%) |
| Transportation | 297 (61.5%) | 186 (38.5%) |
| Material Moving | 348 (80.7%) | 83 (19.3%) |
| Total (Category) | 1,567 (80.4%) | 382 (19.6%) |
| Total (Overall) | 6,202 (59.3%) | 4,253 (40.7%) |
Employment Industries by Sex in Dickinson
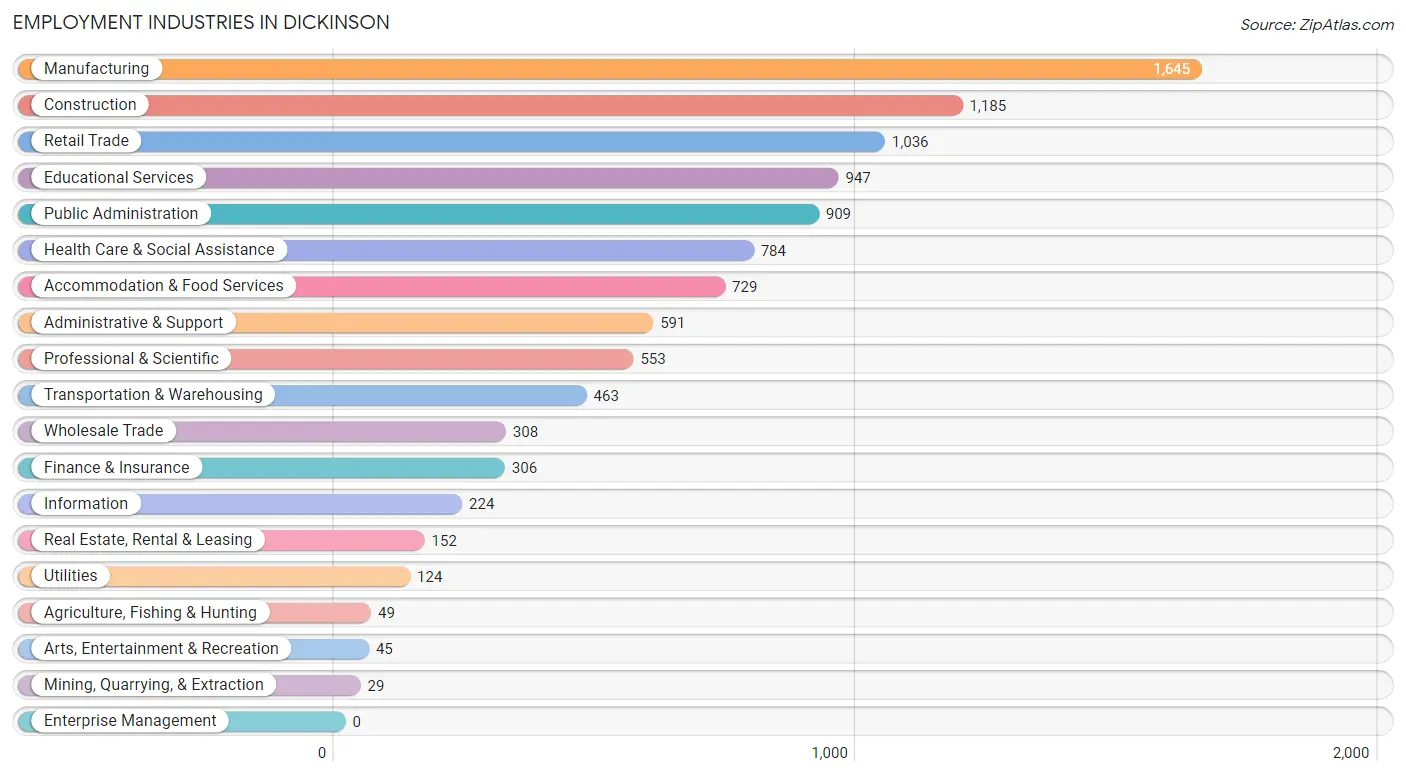
Employment Industries in Dickinson
The major employment industries in Dickinson include Manufacturing (1,645 | 15.7%), Construction (1,185 | 11.3%), Retail Trade (1,036 | 9.9%), Educational Services (947 | 9.1%), and Public Administration (909 | 8.7%).
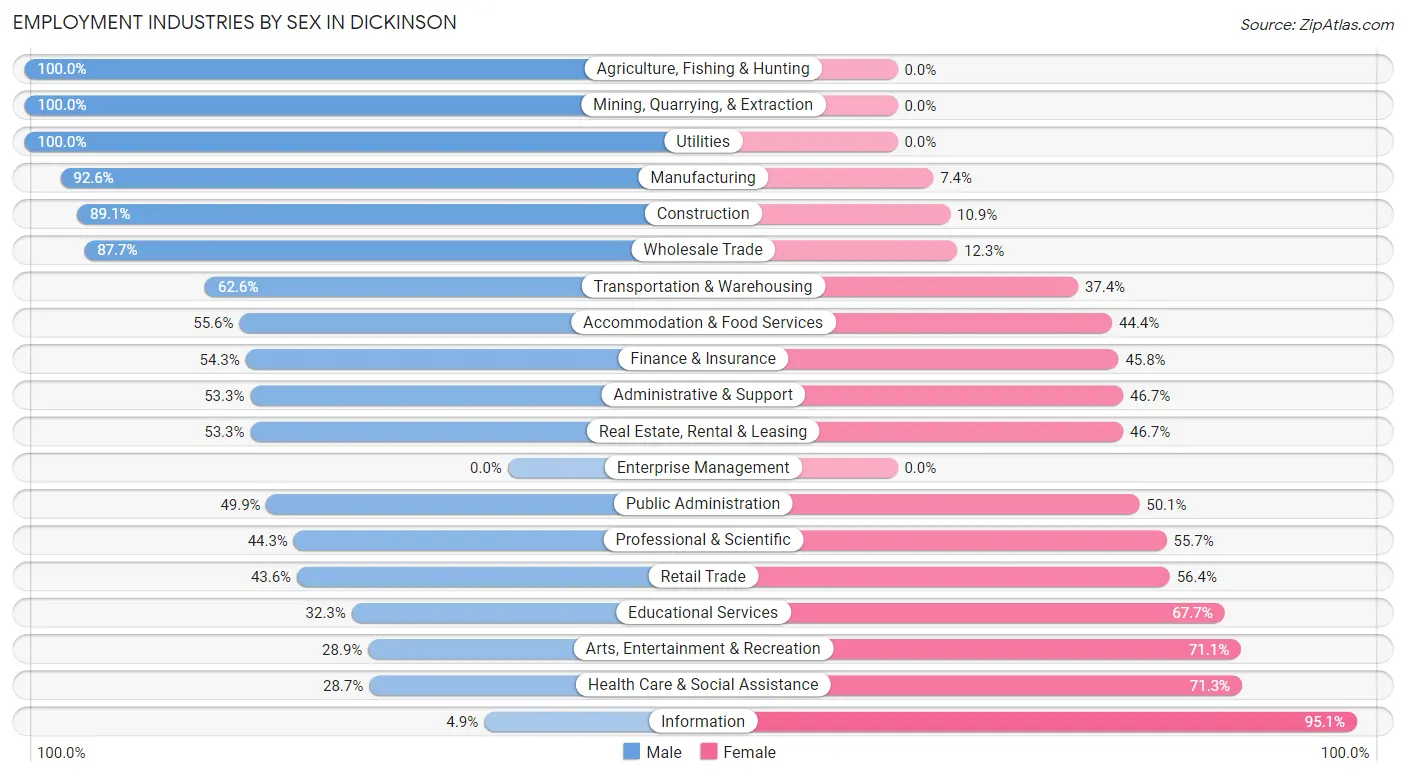
Employment Industries by Sex in Dickinson
The Dickinson industries that see more men than women are Agriculture, Fishing & Hunting (100.0%), Mining, Quarrying, & Extraction (100.0%), and Utilities (100.0%), whereas the industries that tend to have a higher number of women are Information (95.1%), Health Care & Social Assistance (71.3%), and Arts, Entertainment & Recreation (71.1%).
| Industry | Male | Female |
| Agriculture, Fishing & Hunting | 49 (100.0%) | 0 (0.0%) |
| Mining, Quarrying, & Extraction | 29 (100.0%) | 0 (0.0%) |
| Construction | 1,056 (89.1%) | 129 (10.9%) |
| Manufacturing | 1,523 (92.6%) | 122 (7.4%) |
| Wholesale Trade | 270 (87.7%) | 38 (12.3%) |
| Retail Trade | 452 (43.6%) | 584 (56.4%) |
| Transportation & Warehousing | 290 (62.6%) | 173 (37.4%) |
| Utilities | 124 (100.0%) | 0 (0.0%) |
| Information | 11 (4.9%) | 213 (95.1%) |
| Finance & Insurance | 166 (54.2%) | 140 (45.8%) |
| Real Estate, Rental & Leasing | 81 (53.3%) | 71 (46.7%) |
| Professional & Scientific | 245 (44.3%) | 308 (55.7%) |
| Enterprise Management | 0 (0.0%) | 0 (0.0%) |
| Administrative & Support | 315 (53.3%) | 276 (46.7%) |
| Educational Services | 306 (32.3%) | 641 (67.7%) |
| Health Care & Social Assistance | 225 (28.7%) | 559 (71.3%) |
| Arts, Entertainment & Recreation | 13 (28.9%) | 32 (71.1%) |
| Accommodation & Food Services | 405 (55.6%) | 324 (44.4%) |
| Public Administration | 454 (49.9%) | 455 (50.1%) |
| Total | 6,202 (59.3%) | 4,253 (40.7%) |
Education in Dickinson
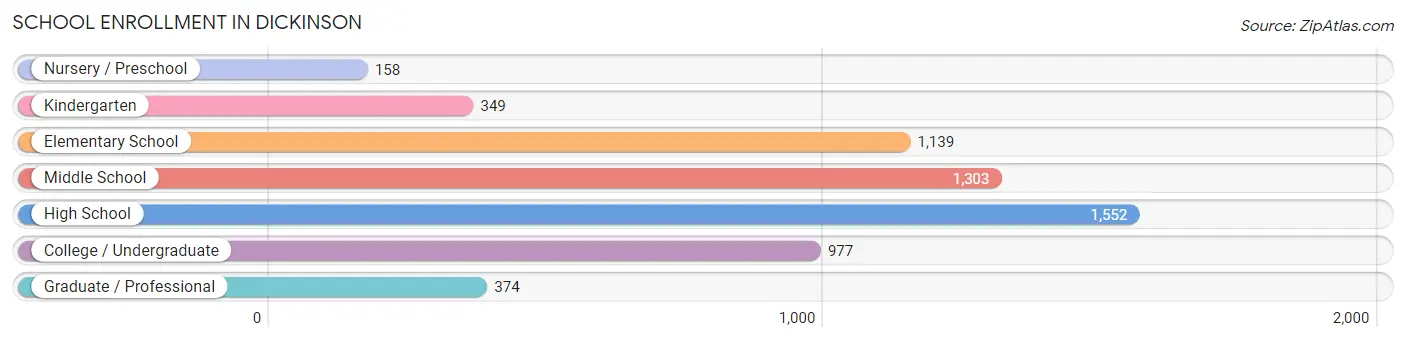
School Enrollment in Dickinson
The most common levels of schooling among the 5,852 students in Dickinson are high school (1,552 | 26.5%), middle school (1,303 | 22.3%), and elementary school (1,139 | 19.5%).
| School Level | # Students | % Students |
| Nursery / Preschool | 158 | 2.7% |
| Kindergarten | 349 | 6.0% |
| Elementary School | 1,139 | 19.5% |
| Middle School | 1,303 | 22.3% |
| High School | 1,552 | 26.5% |
| College / Undergraduate | 977 | 16.7% |
| Graduate / Professional | 374 | 6.4% |
| Total | 5,852 | 100.0% |
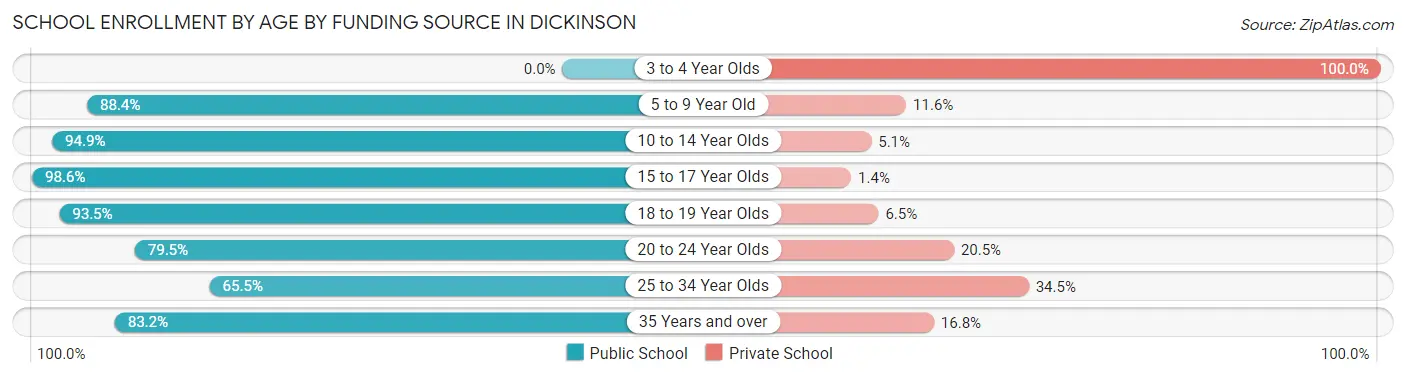
School Enrollment by Age by Funding Source in Dickinson
Out of a total of 5,852 students who are enrolled in schools in Dickinson, 626 (10.7%) attend a private institution, while the remaining 5,226 (89.3%) are enrolled in public schools. The age group of 3 to 4 year olds has the highest likelihood of being enrolled in private schools, with 18 (100.0% in the age bracket) enrolled. Conversely, the age group of 15 to 17 year olds has the lowest likelihood of being enrolled in a private school, with 924 (98.6% in the age bracket) attending a public institution.
| Age Bracket | Public School | Private School |
| 3 to 4 Year Olds | 0 (0.0%) | 18 (100.0%) |
| 5 to 9 Year Old | 1,397 (88.4%) | 184 (11.6%) |
| 10 to 14 Year Olds | 1,697 (94.9%) | 92 (5.1%) |
| 15 to 17 Year Olds | 924 (98.6%) | 13 (1.4%) |
| 18 to 19 Year Olds | 274 (93.5%) | 19 (6.5%) |
| 20 to 24 Year Olds | 499 (79.5%) | 129 (20.5%) |
| 25 to 34 Year Olds | 249 (65.5%) | 131 (34.5%) |
| 35 Years and over | 188 (83.2%) | 38 (16.8%) |
| Total | 5,226 (89.3%) | 626 (10.7%) |
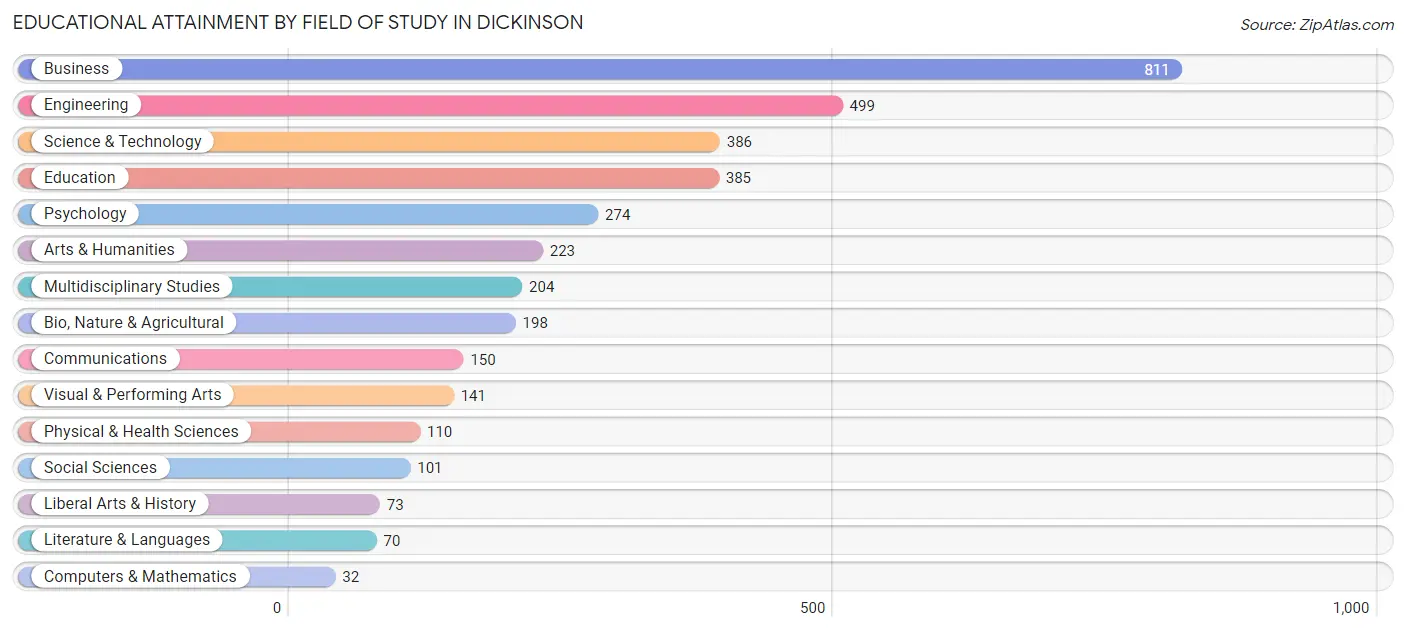
Educational Attainment by Field of Study in Dickinson
Business (811 | 22.2%), engineering (499 | 13.7%), science & technology (386 | 10.6%), education (385 | 10.5%), and psychology (274 | 7.5%) are the most common fields of study among 3,657 individuals in Dickinson who have obtained a bachelor's degree or higher.
| Field of Study | # Graduates | % Graduates |
| Computers & Mathematics | 32 | 0.9% |
| Bio, Nature & Agricultural | 198 | 5.4% |
| Physical & Health Sciences | 110 | 3.0% |
| Psychology | 274 | 7.5% |
| Social Sciences | 101 | 2.8% |
| Engineering | 499 | 13.7% |
| Multidisciplinary Studies | 204 | 5.6% |
| Science & Technology | 386 | 10.6% |
| Business | 811 | 22.2% |
| Education | 385 | 10.5% |
| Literature & Languages | 70 | 1.9% |
| Liberal Arts & History | 73 | 2.0% |
| Visual & Performing Arts | 141 | 3.9% |
| Communications | 150 | 4.1% |
| Arts & Humanities | 223 | 6.1% |
| Total | 3,657 | 100.0% |
Transportation & Commute in Dickinson
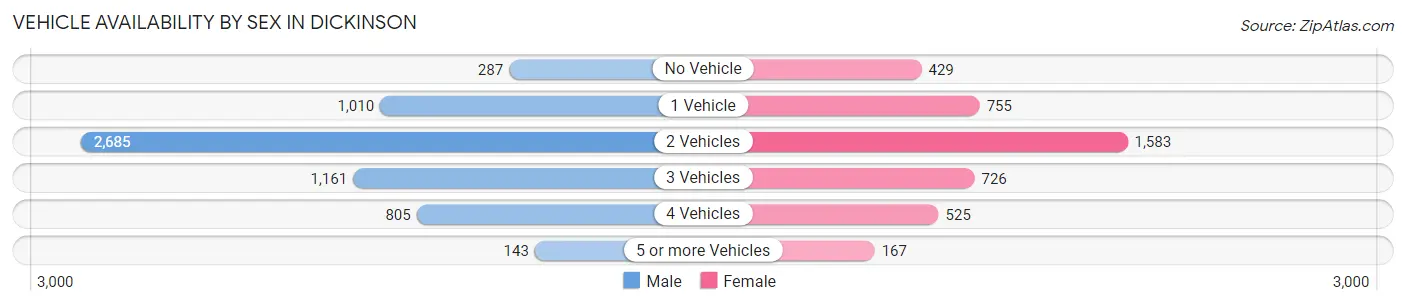
Vehicle Availability by Sex in Dickinson
The most prevalent vehicle ownership categories in Dickinson are males with 2 vehicles (2,685, accounting for 44.1%) and females with 2 vehicles (1,583, making up 64.2%).
| Vehicles Available | Male | Female |
| No Vehicle | 287 (4.7%) | 429 (10.2%) |
| 1 Vehicle | 1,010 (16.6%) | 755 (18.0%) |
| 2 Vehicles | 2,685 (44.1%) | 1,583 (37.8%) |
| 3 Vehicles | 1,161 (19.1%) | 726 (17.3%) |
| 4 Vehicles | 805 (13.2%) | 525 (12.5%) |
| 5 or more Vehicles | 143 (2.4%) | 167 (4.0%) |
| Total | 6,091 (100.0%) | 4,185 (100.0%) |
Commute Time in Dickinson
The most frequently occuring commute durations in Dickinson are 20 to 24 minutes (1,570 commuters, 16.6%), 15 to 19 minutes (1,418 commuters, 15.0%), and 30 to 34 minutes (1,259 commuters, 13.3%).
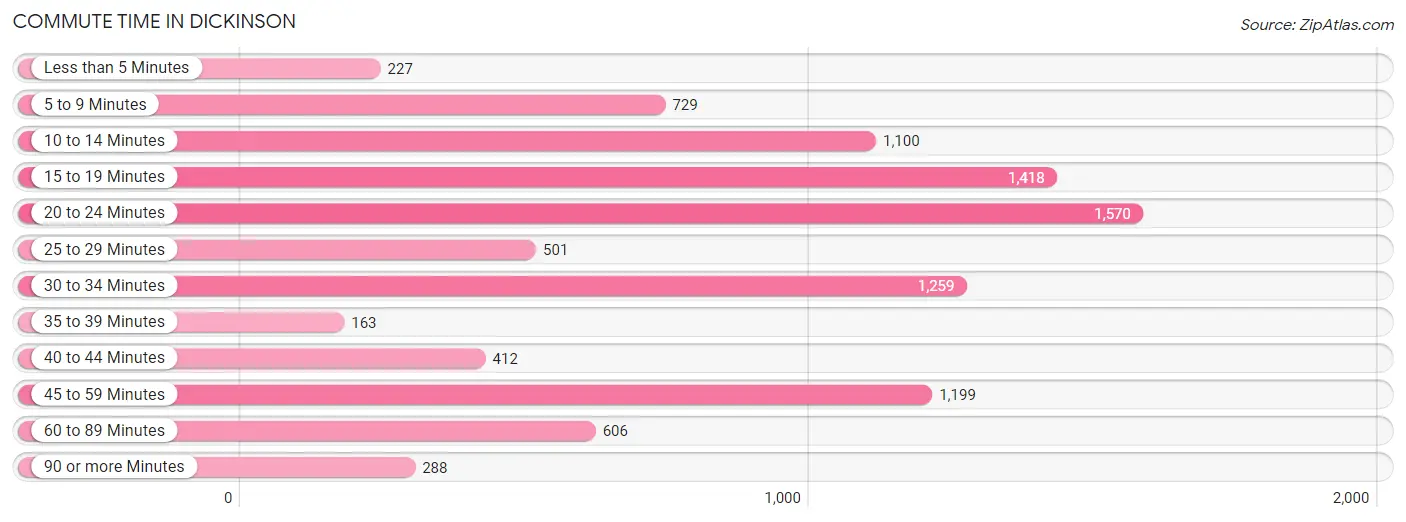
| Commute Time | # Commuters | % Commuters |
| Less than 5 Minutes | 227 | 2.4% |
| 5 to 9 Minutes | 729 | 7.7% |
| 10 to 14 Minutes | 1,100 | 11.6% |
| 15 to 19 Minutes | 1,418 | 15.0% |
| 20 to 24 Minutes | 1,570 | 16.6% |
| 25 to 29 Minutes | 501 | 5.3% |
| 30 to 34 Minutes | 1,259 | 13.3% |
| 35 to 39 Minutes | 163 | 1.7% |
| 40 to 44 Minutes | 412 | 4.3% |
| 45 to 59 Minutes | 1,199 | 12.7% |
| 60 to 89 Minutes | 606 | 6.4% |
| 90 or more Minutes | 288 | 3.0% |
Commute Time by Sex in Dickinson
The most common commute times in Dickinson are 20 to 24 minutes (1,070 commuters, 18.5%) for males and 15 to 19 minutes (844 commuters, 22.8%) for females.
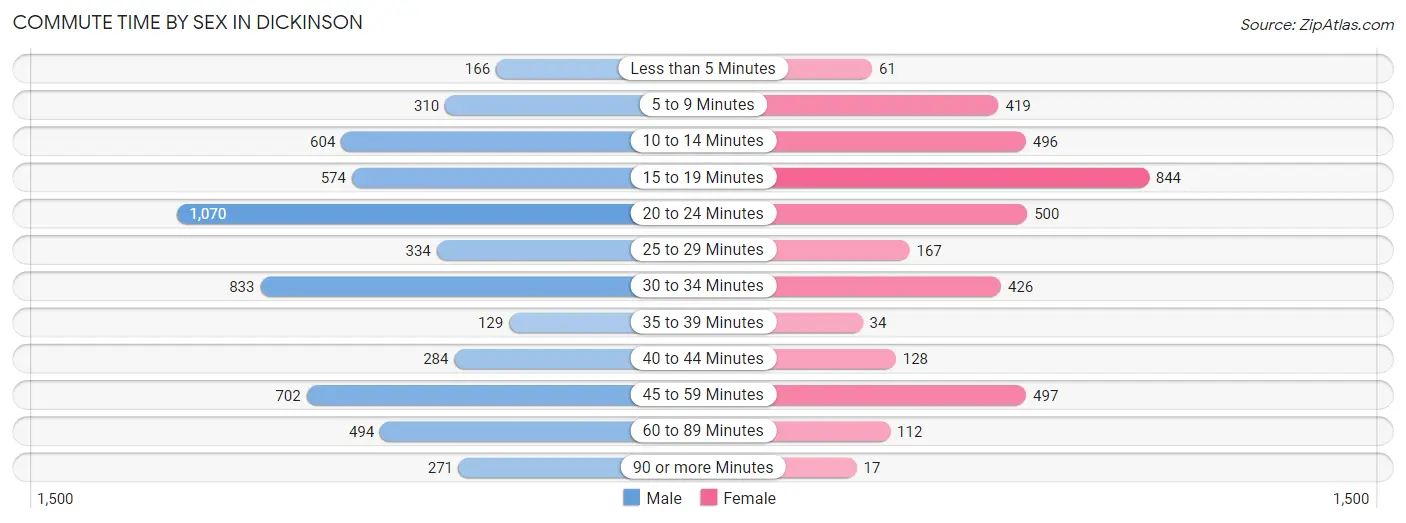
| Commute Time | Male | Female |
| Less than 5 Minutes | 166 (2.9%) | 61 (1.7%) |
| 5 to 9 Minutes | 310 (5.4%) | 419 (11.3%) |
| 10 to 14 Minutes | 604 (10.5%) | 496 (13.4%) |
| 15 to 19 Minutes | 574 (10.0%) | 844 (22.8%) |
| 20 to 24 Minutes | 1,070 (18.5%) | 500 (13.5%) |
| 25 to 29 Minutes | 334 (5.8%) | 167 (4.5%) |
| 30 to 34 Minutes | 833 (14.4%) | 426 (11.5%) |
| 35 to 39 Minutes | 129 (2.2%) | 34 (0.9%) |
| 40 to 44 Minutes | 284 (4.9%) | 128 (3.5%) |
| 45 to 59 Minutes | 702 (12.2%) | 497 (13.4%) |
| 60 to 89 Minutes | 494 (8.6%) | 112 (3.0%) |
| 90 or more Minutes | 271 (4.7%) | 17 (0.5%) |
Time of Departure to Work by Sex in Dickinson
The most frequent times of departure to work in Dickinson are 6:30 AM to 6:59 AM (852, 14.8%) for males and 7:00 AM to 7:29 AM (775, 20.9%) for females.
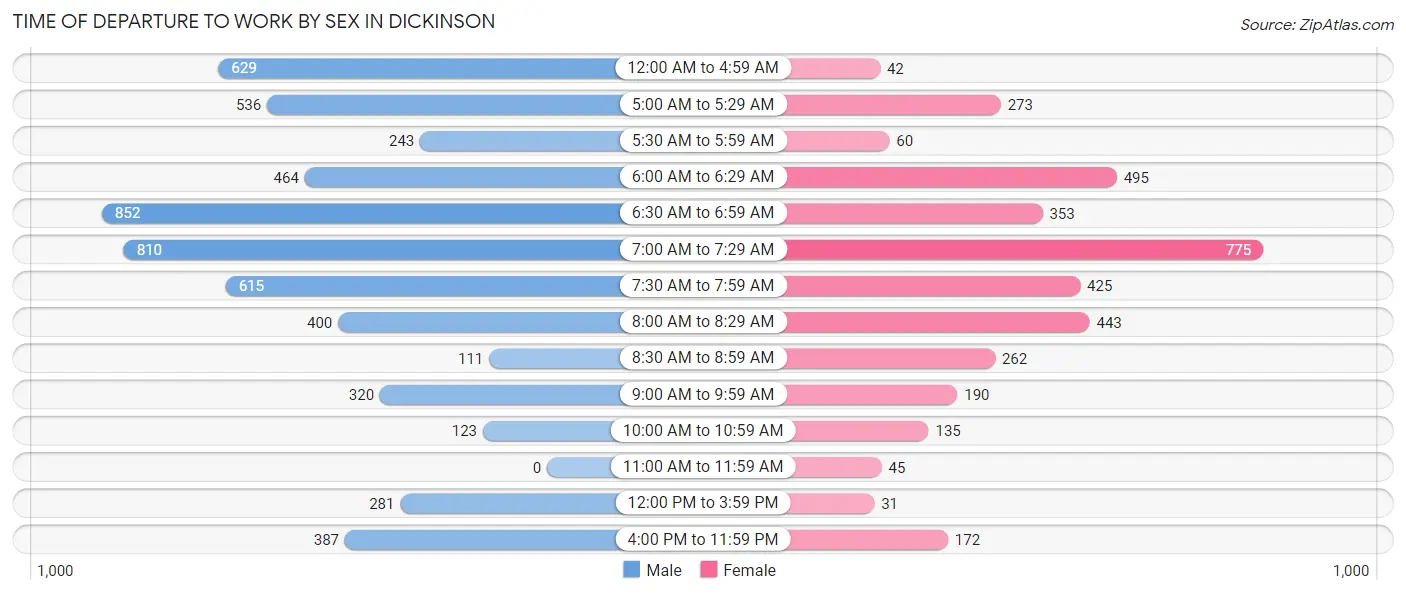
| Time of Departure | Male | Female |
| 12:00 AM to 4:59 AM | 629 (10.9%) | 42 (1.1%) |
| 5:00 AM to 5:29 AM | 536 (9.3%) | 273 (7.4%) |
| 5:30 AM to 5:59 AM | 243 (4.2%) | 60 (1.6%) |
| 6:00 AM to 6:29 AM | 464 (8.0%) | 495 (13.4%) |
| 6:30 AM to 6:59 AM | 852 (14.8%) | 353 (9.5%) |
| 7:00 AM to 7:29 AM | 810 (14.0%) | 775 (20.9%) |
| 7:30 AM to 7:59 AM | 615 (10.7%) | 425 (11.5%) |
| 8:00 AM to 8:29 AM | 400 (6.9%) | 443 (12.0%) |
| 8:30 AM to 8:59 AM | 111 (1.9%) | 262 (7.1%) |
| 9:00 AM to 9:59 AM | 320 (5.5%) | 190 (5.1%) |
| 10:00 AM to 10:59 AM | 123 (2.1%) | 135 (3.6%) |
| 11:00 AM to 11:59 AM | 0 (0.0%) | 45 (1.2%) |
| 12:00 PM to 3:59 PM | 281 (4.9%) | 31 (0.8%) |
| 4:00 PM to 11:59 PM | 387 (6.7%) | 172 (4.6%) |
| Total | 5,771 (100.0%) | 3,701 (100.0%) |
Housing Occupancy in Dickinson
Occupancy by Ownership in Dickinson
Of the total 8,104 dwellings in Dickinson, owner-occupied units account for 6,399 (79.0%), while renter-occupied units make up 1,705 (21.0%).
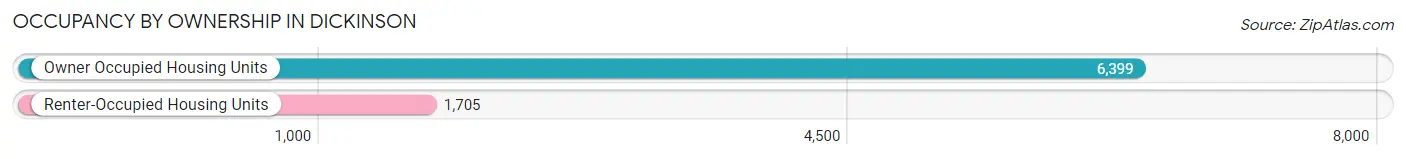
| Occupancy | # Housing Units | % Housing Units |
| Owner Occupied Housing Units | 6,399 | 79.0% |
| Renter-Occupied Housing Units | 1,705 | 21.0% |
| Total Occupied Housing Units | 8,104 | 100.0% |
Occupancy by Household Size in Dickinson
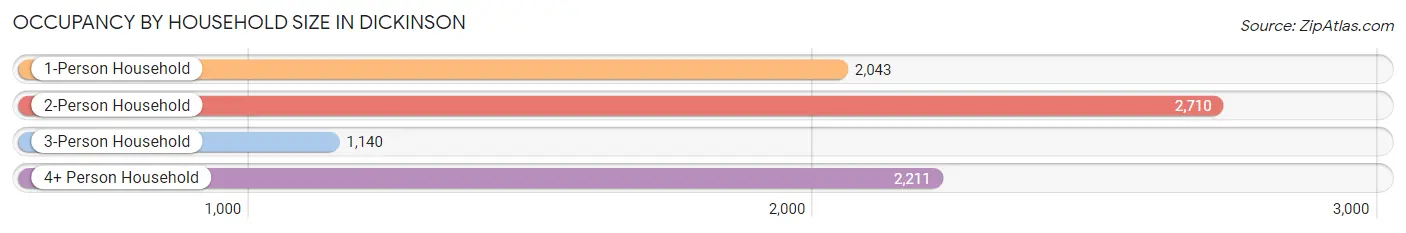
| Household Size | # Housing Units | % Housing Units |
| 1-Person Household | 2,043 | 25.2% |
| 2-Person Household | 2,710 | 33.4% |
| 3-Person Household | 1,140 | 14.1% |
| 4+ Person Household | 2,211 | 27.3% |
| Total Housing Units | 8,104 | 100.0% |
Occupancy by Ownership by Household Size in Dickinson
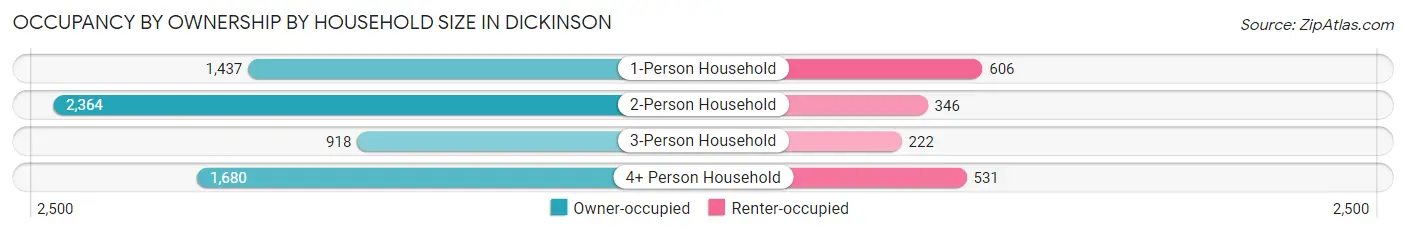
| Household Size | Owner-occupied | Renter-occupied |
| 1-Person Household | 1,437 (70.3%) | 606 (29.7%) |
| 2-Person Household | 2,364 (87.2%) | 346 (12.8%) |
| 3-Person Household | 918 (80.5%) | 222 (19.5%) |
| 4+ Person Household | 1,680 (76.0%) | 531 (24.0%) |
| Total Housing Units | 6,399 (79.0%) | 1,705 (21.0%) |
Occupancy by Educational Attainment in Dickinson
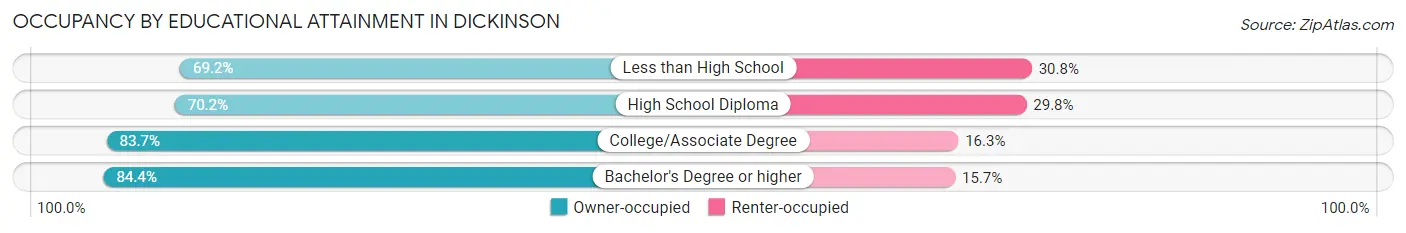
| Household Size | Owner-occupied | Renter-occupied |
| Less than High School | 704 (69.2%) | 314 (30.8%) |
| High School Diploma | 1,318 (70.2%) | 559 (29.8%) |
| College/Associate Degree | 2,259 (83.7%) | 439 (16.3%) |
| Bachelor's Degree or higher | 2,118 (84.4%) | 393 (15.7%) |
Occupancy by Age of Householder in Dickinson
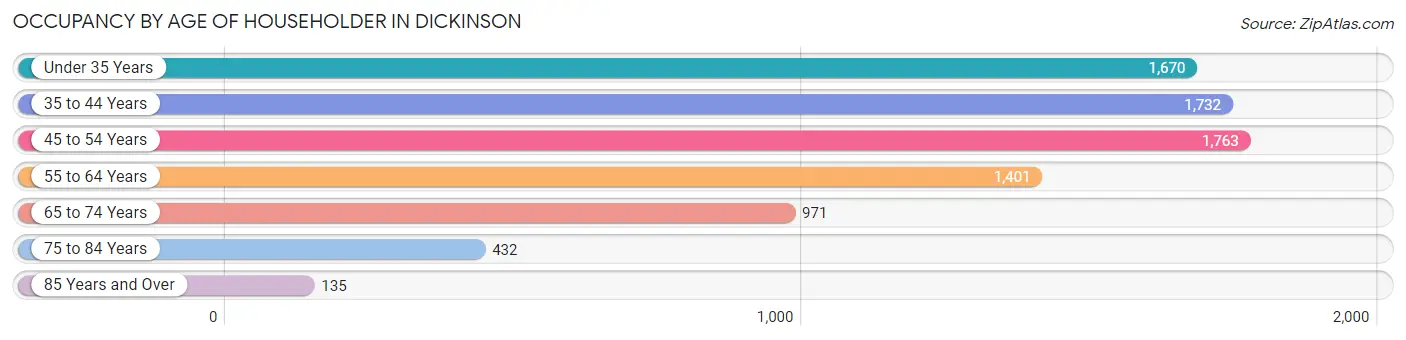
| Age Bracket | # Households | % Households |
| Under 35 Years | 1,670 | 20.6% |
| 35 to 44 Years | 1,732 | 21.4% |
| 45 to 54 Years | 1,763 | 21.7% |
| 55 to 64 Years | 1,401 | 17.3% |
| 65 to 74 Years | 971 | 12.0% |
| 75 to 84 Years | 432 | 5.3% |
| 85 Years and Over | 135 | 1.7% |
| Total | 8,104 | 100.0% |
Housing Finances in Dickinson
Median Income by Occupancy in Dickinson
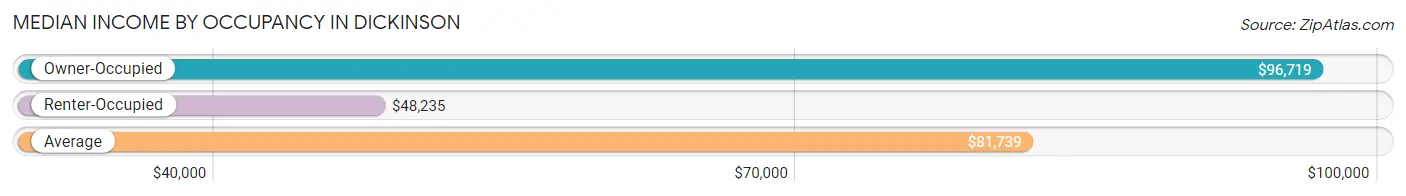
| Occupancy Type | # Households | Median Income |
| Owner-Occupied | 6,399 (79.0%) | $96,719 |
| Renter-Occupied | 1,705 (21.0%) | $48,235 |
| Average | 8,104 (100.0%) | $81,739 |
Occupancy by Householder Income Bracket in Dickinson
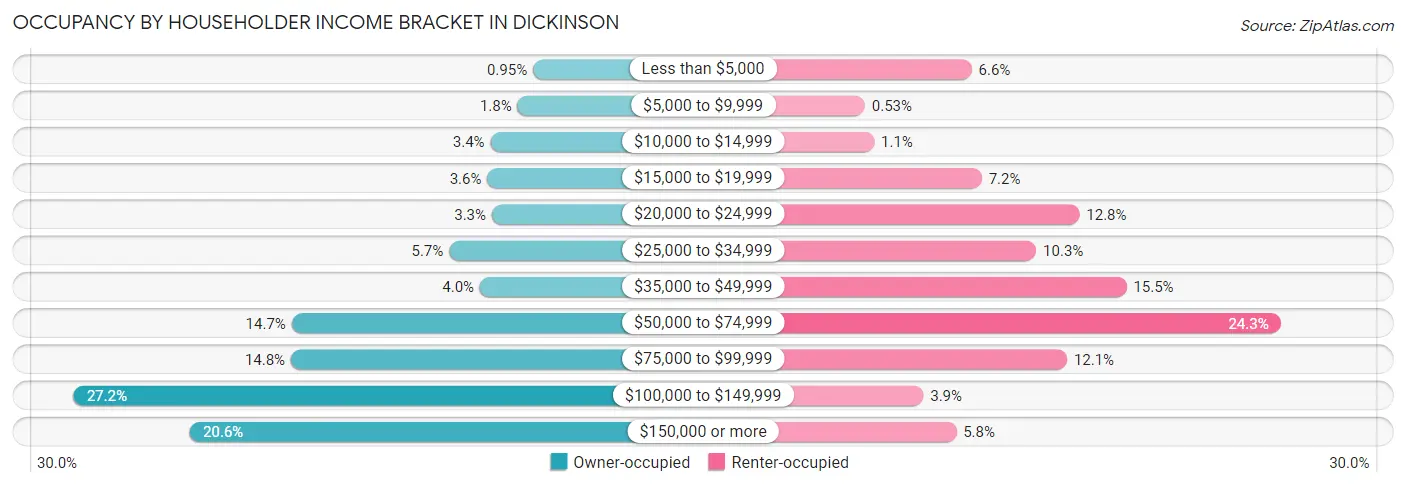
| Income Bracket | Owner-occupied | Renter-occupied |
| Less than $5,000 | 61 (0.9%) | 113 (6.6%) |
| $5,000 to $9,999 | 117 (1.8%) | 9 (0.5%) |
| $10,000 to $14,999 | 216 (3.4%) | 18 (1.1%) |
| $15,000 to $19,999 | 228 (3.6%) | 123 (7.2%) |
| $20,000 to $24,999 | 211 (3.3%) | 218 (12.8%) |
| $25,000 to $34,999 | 367 (5.7%) | 176 (10.3%) |
| $35,000 to $49,999 | 255 (4.0%) | 264 (15.5%) |
| $50,000 to $74,999 | 943 (14.7%) | 414 (24.3%) |
| $75,000 to $99,999 | 946 (14.8%) | 206 (12.1%) |
| $100,000 to $149,999 | 1,740 (27.2%) | 66 (3.9%) |
| $150,000 or more | 1,315 (20.5%) | 98 (5.8%) |
| Total | 6,399 (100.0%) | 1,705 (100.0%) |
Monthly Housing Cost Tiers in Dickinson
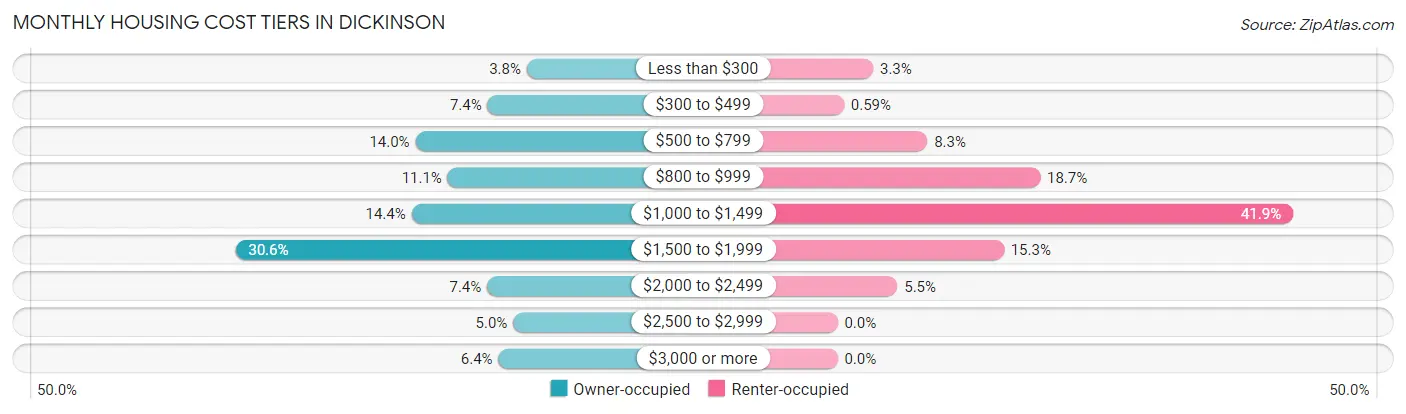
| Monthly Cost | Owner-occupied | Renter-occupied |
| Less than $300 | 241 (3.8%) | 56 (3.3%) |
| $300 to $499 | 472 (7.4%) | 10 (0.6%) |
| $500 to $799 | 897 (14.0%) | 141 (8.3%) |
| $800 to $999 | 707 (11.1%) | 318 (18.6%) |
| $1,000 to $1,499 | 920 (14.4%) | 715 (41.9%) |
| $1,500 to $1,999 | 1,958 (30.6%) | 261 (15.3%) |
| $2,000 to $2,499 | 475 (7.4%) | 94 (5.5%) |
| $2,500 to $2,999 | 321 (5.0%) | 0 (0.0%) |
| $3,000 or more | 408 (6.4%) | 0 (0.0%) |
| Total | 6,399 (100.0%) | 1,705 (100.0%) |
Physical Housing Characteristics in Dickinson
Housing Structures in Dickinson
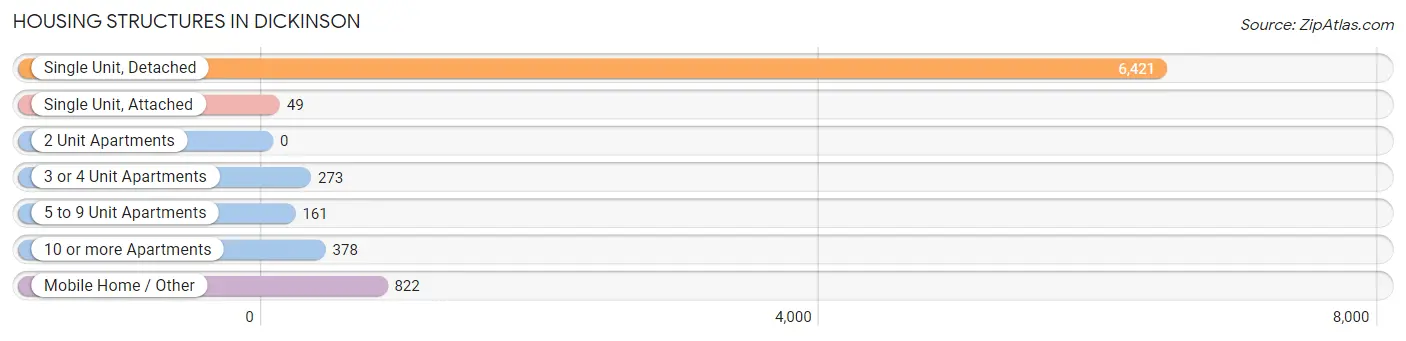
| Structure Type | # Housing Units | % Housing Units |
| Single Unit, Detached | 6,421 | 79.2% |
| Single Unit, Attached | 49 | 0.6% |
| 2 Unit Apartments | 0 | 0.0% |
| 3 or 4 Unit Apartments | 273 | 3.4% |
| 5 to 9 Unit Apartments | 161 | 2.0% |
| 10 or more Apartments | 378 | 4.7% |
| Mobile Home / Other | 822 | 10.1% |
| Total | 8,104 | 100.0% |
Housing Structures by Occupancy in Dickinson
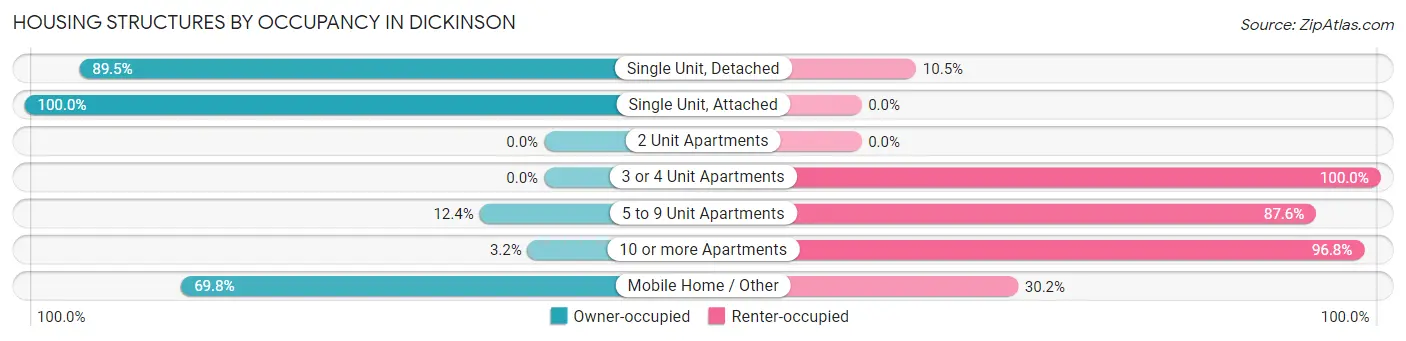
| Structure Type | Owner-occupied | Renter-occupied |
| Single Unit, Detached | 5,744 (89.5%) | 677 (10.5%) |
| Single Unit, Attached | 49 (100.0%) | 0 (0.0%) |
| 2 Unit Apartments | 0 (0.0%) | 0 (0.0%) |
| 3 or 4 Unit Apartments | 0 (0.0%) | 273 (100.0%) |
| 5 to 9 Unit Apartments | 20 (12.4%) | 141 (87.6%) |
| 10 or more Apartments | 12 (3.2%) | 366 (96.8%) |
| Mobile Home / Other | 574 (69.8%) | 248 (30.2%) |
| Total | 6,399 (79.0%) | 1,705 (21.0%) |
Housing Structures by Number of Rooms in Dickinson
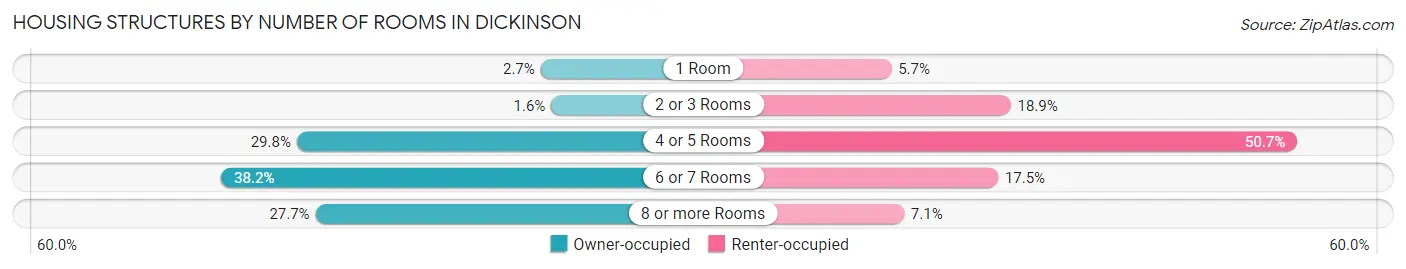
| Number of Rooms | Owner-occupied | Renter-occupied |
| 1 Room | 175 (2.7%) | 97 (5.7%) |
| 2 or 3 Rooms | 100 (1.6%) | 323 (18.9%) |
| 4 or 5 Rooms | 1,907 (29.8%) | 865 (50.7%) |
| 6 or 7 Rooms | 2,443 (38.2%) | 299 (17.5%) |
| 8 or more Rooms | 1,774 (27.7%) | 121 (7.1%) |
| Total | 6,399 (100.0%) | 1,705 (100.0%) |
Housing Structure by Heating Type in Dickinson
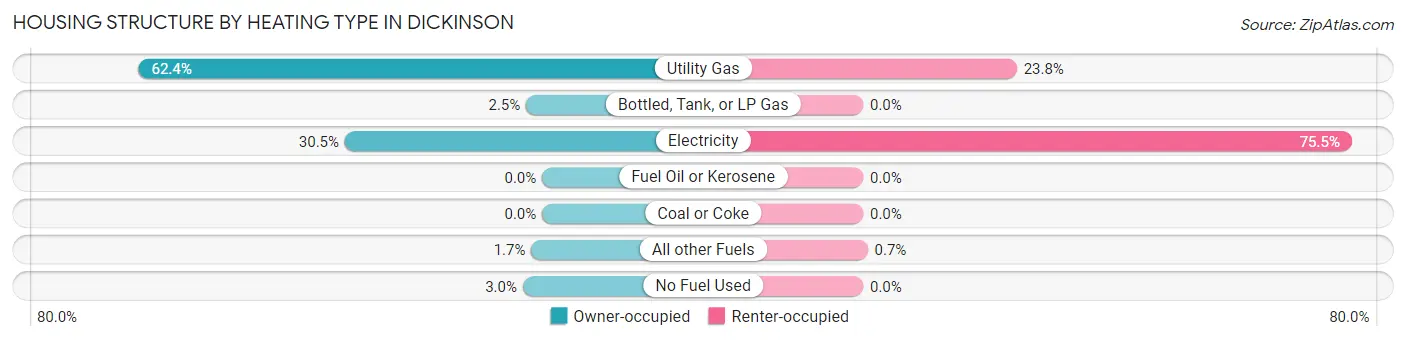
| Heating Type | Owner-occupied | Renter-occupied |
| Utility Gas | 3,992 (62.4%) | 405 (23.7%) |
| Bottled, Tank, or LP Gas | 158 (2.5%) | 0 (0.0%) |
| Electricity | 1,951 (30.5%) | 1,288 (75.5%) |
| Fuel Oil or Kerosene | 0 (0.0%) | 0 (0.0%) |
| Coal or Coke | 0 (0.0%) | 0 (0.0%) |
| All other Fuels | 107 (1.7%) | 12 (0.7%) |
| No Fuel Used | 191 (3.0%) | 0 (0.0%) |
| Total | 6,399 (100.0%) | 1,705 (100.0%) |
Household Vehicle Usage in Dickinson
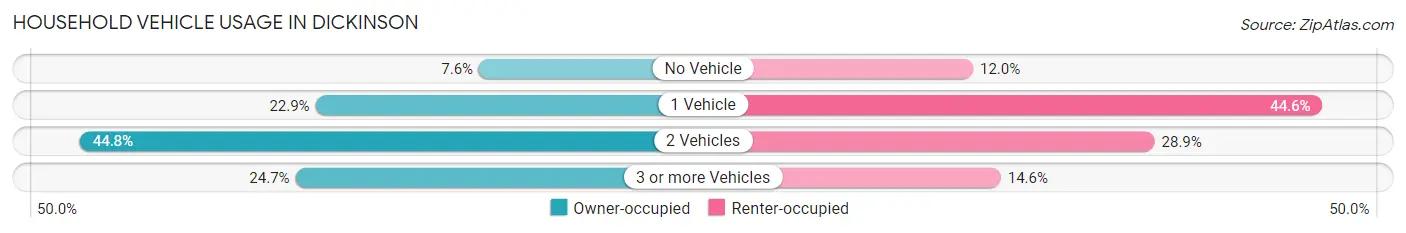
| Vehicles per Household | Owner-occupied | Renter-occupied |
| No Vehicle | 486 (7.6%) | 204 (12.0%) |
| 1 Vehicle | 1,462 (22.9%) | 760 (44.6%) |
| 2 Vehicles | 2,869 (44.8%) | 493 (28.9%) |
| 3 or more Vehicles | 1,582 (24.7%) | 248 (14.5%) |
| Total | 6,399 (100.0%) | 1,705 (100.0%) |
Real Estate & Mortgages in Dickinson
Real Estate and Mortgage Overview in Dickinson
| Characteristic | Without Mortgage | With Mortgage |
| Housing Units | 2,484 | 3,915 |
| Median Property Value | $195,000 | $225,900 |
| Median Household Income | $71,053 | $883 |
| Monthly Housing Costs | $639 | $408 |
| Real Estate Taxes | $2,657 | $137 |
Property Value by Mortgage Status in Dickinson
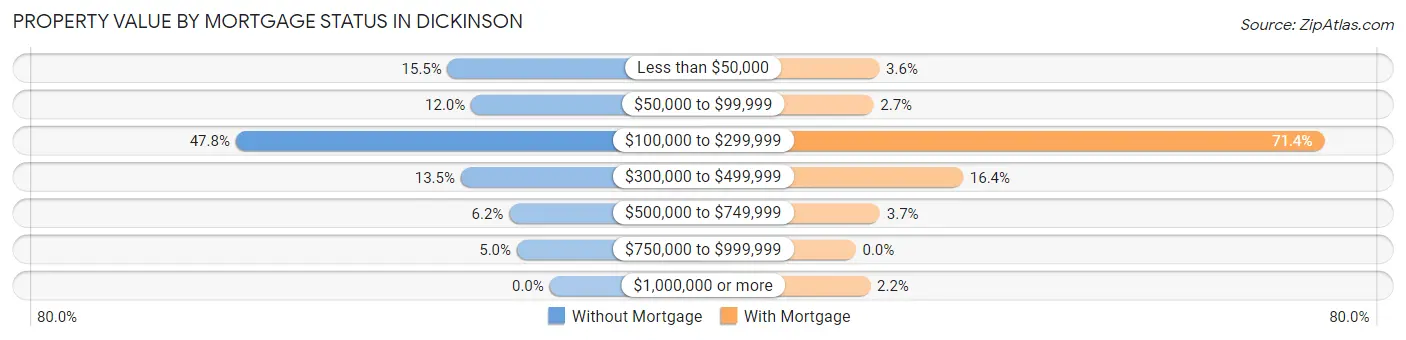
| Property Value | Without Mortgage | With Mortgage |
| Less than $50,000 | 386 (15.5%) | 141 (3.6%) |
| $50,000 to $99,999 | 297 (12.0%) | 106 (2.7%) |
| $100,000 to $299,999 | 1,188 (47.8%) | 2,796 (71.4%) |
| $300,000 to $499,999 | 336 (13.5%) | 640 (16.4%) |
| $500,000 to $749,999 | 153 (6.2%) | 145 (3.7%) |
| $750,000 to $999,999 | 124 (5.0%) | 0 (0.0%) |
| $1,000,000 or more | 0 (0.0%) | 87 (2.2%) |
| Total | 2,484 (100.0%) | 3,915 (100.0%) |
Household Income by Mortgage Status in Dickinson
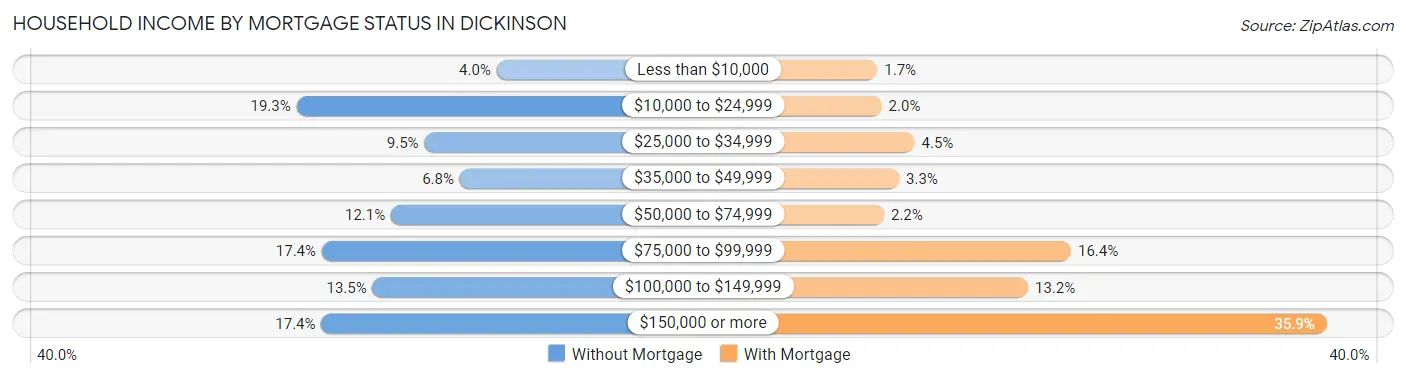
| Household Income | Without Mortgage | With Mortgage |
| Less than $10,000 | 100 (4.0%) | 65 (1.7%) |
| $10,000 to $24,999 | 479 (19.3%) | 78 (2.0%) |
| $25,000 to $34,999 | 237 (9.5%) | 176 (4.5%) |
| $35,000 to $49,999 | 170 (6.8%) | 130 (3.3%) |
| $50,000 to $74,999 | 300 (12.1%) | 85 (2.2%) |
| $75,000 to $99,999 | 431 (17.3%) | 643 (16.4%) |
| $100,000 to $149,999 | 335 (13.5%) | 515 (13.2%) |
| $150,000 or more | 432 (17.4%) | 1,405 (35.9%) |
| Total | 2,484 (100.0%) | 3,915 (100.0%) |
Property Value to Household Income Ratio in Dickinson
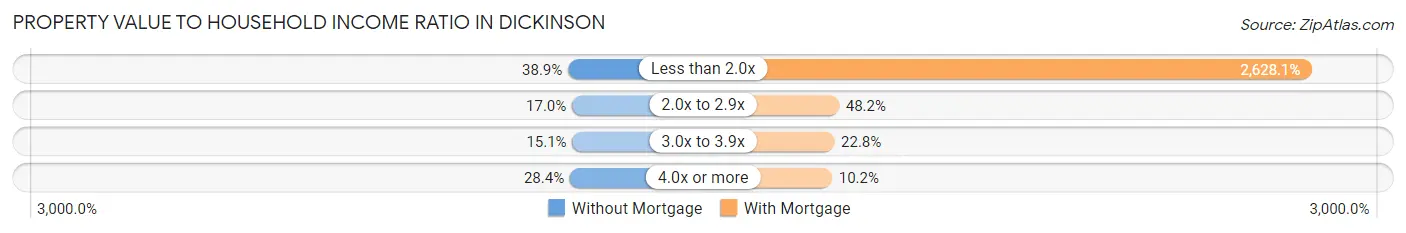
| Value-to-Income Ratio | Without Mortgage | With Mortgage |
| Less than 2.0x | 966 (38.9%) | 102,888 (2,628.0%) |
| 2.0x to 2.9x | 421 (17.0%) | 1,886 (48.2%) |
| 3.0x to 3.9x | 374 (15.1%) | 892 (22.8%) |
| 4.0x or more | 706 (28.4%) | 399 (10.2%) |
| Total | 2,484 (100.0%) | 3,915 (100.0%) |
Real Estate Taxes by Mortgage Status in Dickinson
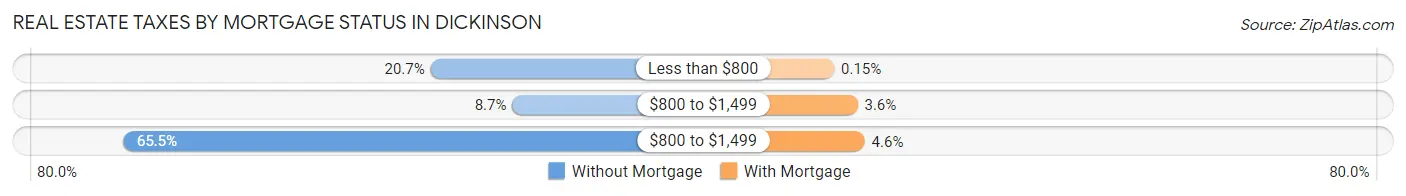
| Property Taxes | Without Mortgage | With Mortgage |
| Less than $800 | 514 (20.7%) | 6 (0.2%) |
| $800 to $1,499 | 217 (8.7%) | 140 (3.6%) |
| $800 to $1,499 | 1,627 (65.5%) | 181 (4.6%) |
| Total | 2,484 (100.0%) | 3,915 (100.0%) |
Health & Disability in Dickinson
Health Insurance Coverage by Age in Dickinson
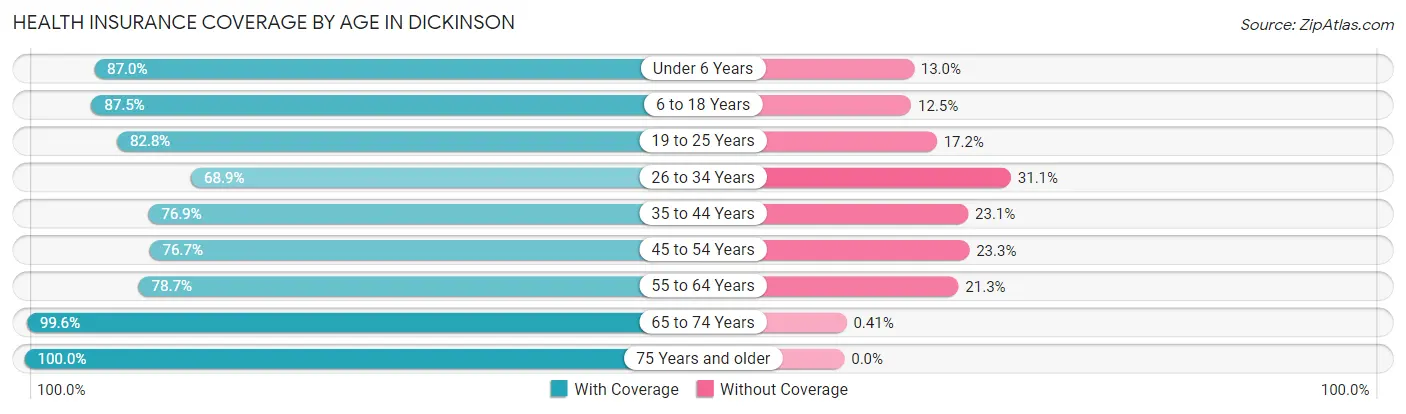
| Age Bracket | With Coverage | Without Coverage |
| Under 6 Years | 1,619 (87.0%) | 241 (13.0%) |
| 6 to 18 Years | 3,668 (87.5%) | 522 (12.5%) |
| 19 to 25 Years | 1,662 (82.8%) | 346 (17.2%) |
| 26 to 34 Years | 1,707 (68.9%) | 769 (31.1%) |
| 35 to 44 Years | 2,361 (76.9%) | 709 (23.1%) |
| 45 to 54 Years | 2,107 (76.7%) | 640 (23.3%) |
| 55 to 64 Years | 1,983 (78.7%) | 536 (21.3%) |
| 65 to 74 Years | 1,709 (99.6%) | 7 (0.4%) |
| 75 Years and older | 853 (100.0%) | 0 (0.0%) |
| Total | 17,669 (82.4%) | 3,770 (17.6%) |
Health Insurance Coverage by Citizenship Status in Dickinson
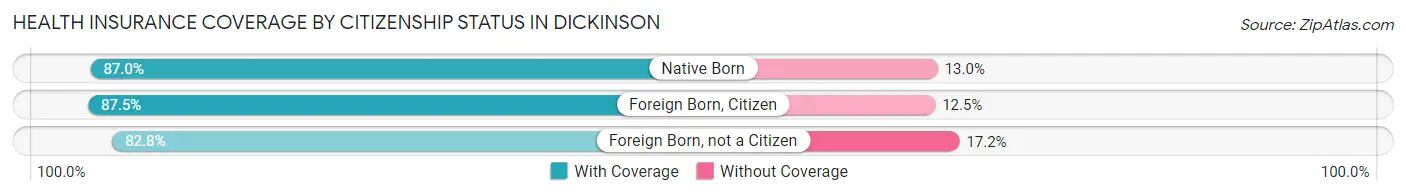
| Citizenship Status | With Coverage | Without Coverage |
| Native Born | 1,619 (87.0%) | 241 (13.0%) |
| Foreign Born, Citizen | 3,668 (87.5%) | 522 (12.5%) |
| Foreign Born, not a Citizen | 1,662 (82.8%) | 346 (17.2%) |
Health Insurance Coverage by Household Income in Dickinson
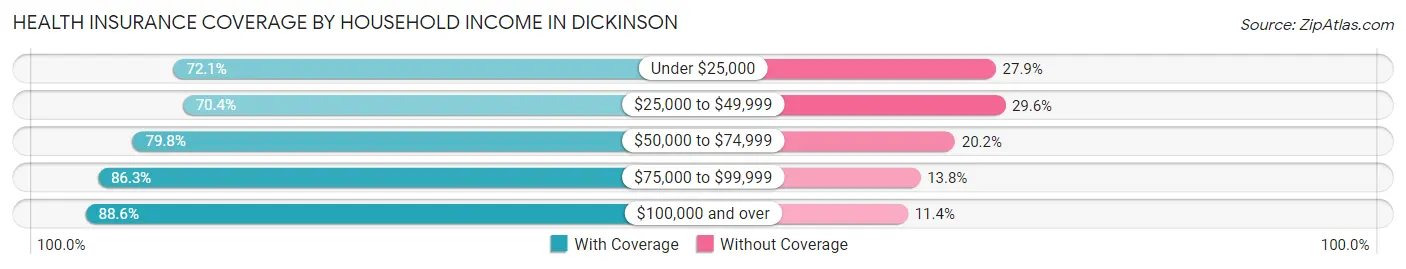
| Household Income | With Coverage | Without Coverage |
| Under $25,000 | 1,894 (72.1%) | 732 (27.9%) |
| $25,000 to $49,999 | 1,582 (70.4%) | 666 (29.6%) |
| $50,000 to $74,999 | 2,961 (79.8%) | 751 (20.2%) |
| $75,000 to $99,999 | 3,035 (86.3%) | 484 (13.8%) |
| $100,000 and over | 8,118 (88.6%) | 1,047 (11.4%) |
Public vs Private Health Insurance Coverage by Age in Dickinson
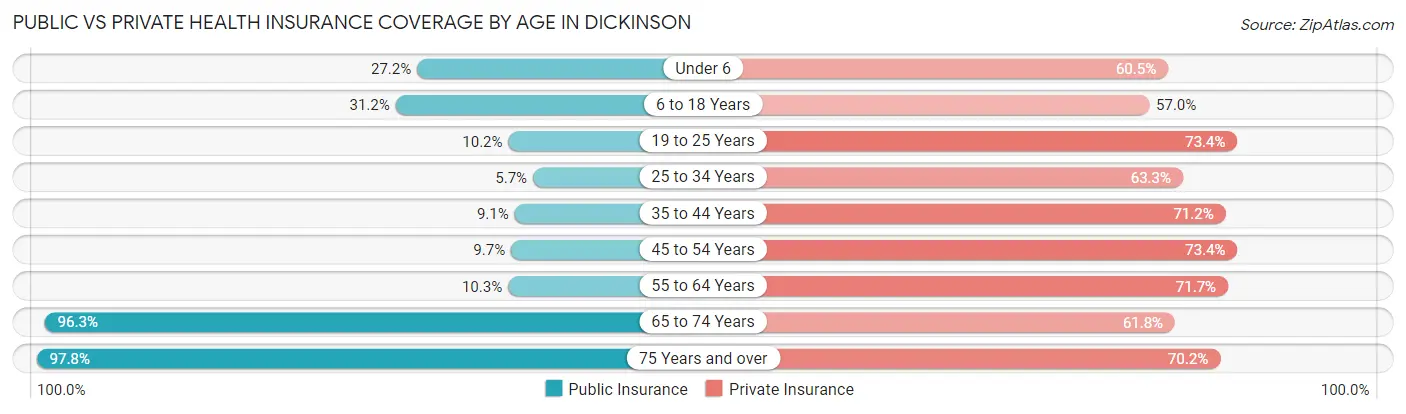
| Age Bracket | Public Insurance | Private Insurance |
| Under 6 | 505 (27.2%) | 1,126 (60.5%) |
| 6 to 18 Years | 1,305 (31.1%) | 2,390 (57.0%) |
| 19 to 25 Years | 205 (10.2%) | 1,474 (73.4%) |
| 25 to 34 Years | 140 (5.7%) | 1,567 (63.3%) |
| 35 to 44 Years | 278 (9.1%) | 2,186 (71.2%) |
| 45 to 54 Years | 267 (9.7%) | 2,017 (73.4%) |
| 55 to 64 Years | 259 (10.3%) | 1,805 (71.7%) |
| 65 to 74 Years | 1,652 (96.3%) | 1,061 (61.8%) |
| 75 Years and over | 834 (97.8%) | 599 (70.2%) |
| Total | 5,445 (25.4%) | 14,225 (66.3%) |
Disability Status by Sex by Age in Dickinson
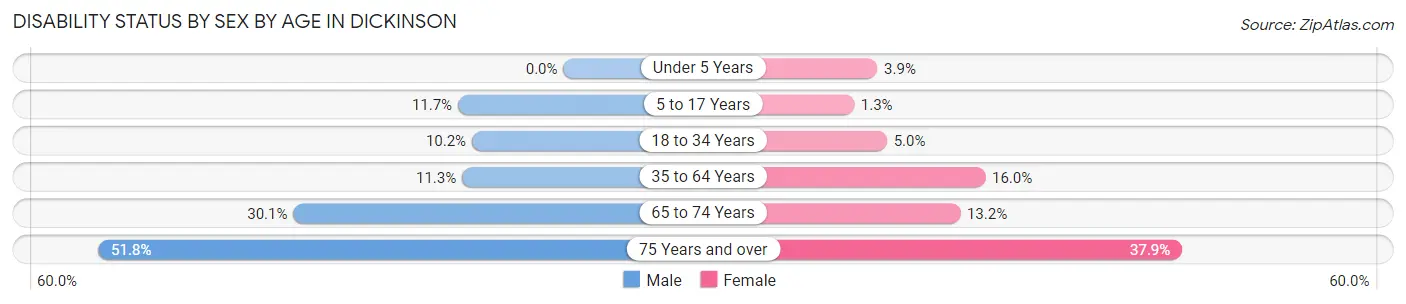
| Age Bracket | Male | Female |
| Under 5 Years | 0 (0.0%) | 32 (3.9%) |
| 5 to 17 Years | 220 (11.7%) | 35 (1.3%) |
| 18 to 34 Years | 233 (10.2%) | 120 (5.0%) |
| 35 to 64 Years | 521 (11.3%) | 593 (16.0%) |
| 65 to 74 Years | 219 (30.1%) | 130 (13.2%) |
| 75 Years and over | 185 (51.8%) | 188 (37.9%) |
Disability Class by Sex by Age in Dickinson
Disability Class: Hearing Difficulty
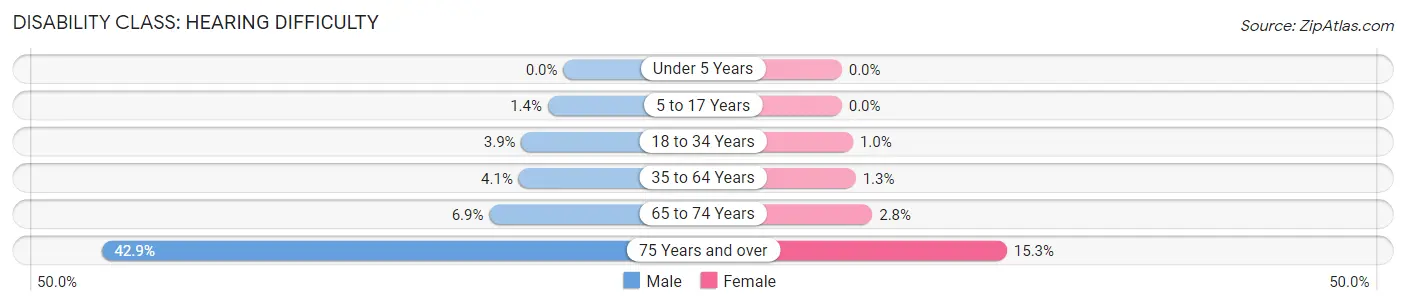
| Age Bracket | Male | Female |
| Under 5 Years | 0 (0.0%) | 0 (0.0%) |
| 5 to 17 Years | 27 (1.4%) | 0 (0.0%) |
| 18 to 34 Years | 89 (3.9%) | 25 (1.0%) |
| 35 to 64 Years | 191 (4.1%) | 48 (1.3%) |
| 65 to 74 Years | 50 (6.9%) | 28 (2.8%) |
| 75 Years and over | 153 (42.9%) | 76 (15.3%) |
Disability Class: Vision Difficulty
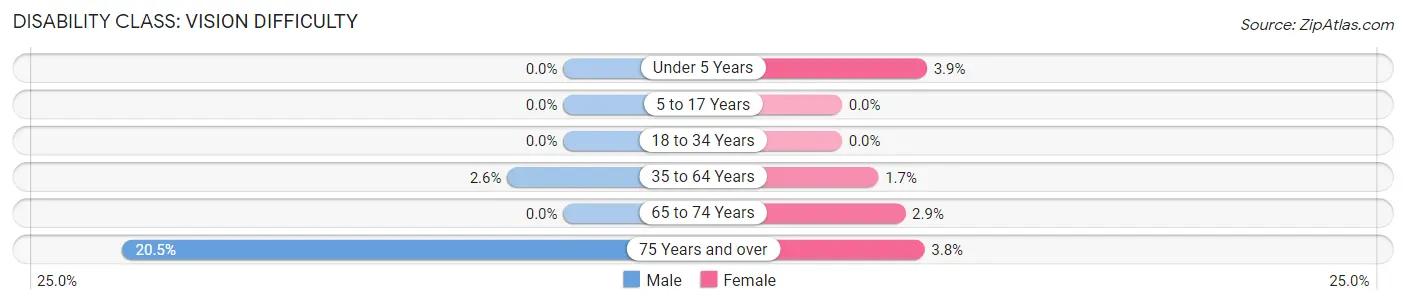
| Age Bracket | Male | Female |
| Under 5 Years | 0 (0.0%) | 32 (3.9%) |
| 5 to 17 Years | 0 (0.0%) | 0 (0.0%) |
| 18 to 34 Years | 0 (0.0%) | 0 (0.0%) |
| 35 to 64 Years | 120 (2.6%) | 63 (1.7%) |
| 65 to 74 Years | 0 (0.0%) | 29 (2.9%) |
| 75 Years and over | 73 (20.4%) | 19 (3.8%) |
Disability Class: Cognitive Difficulty
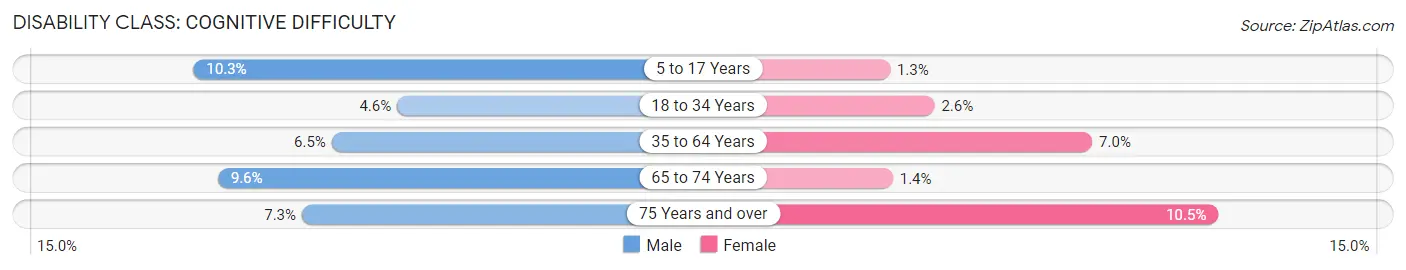
| Age Bracket | Male | Female |
| 5 to 17 Years | 193 (10.3%) | 35 (1.3%) |
| 18 to 34 Years | 106 (4.6%) | 62 (2.6%) |
| 35 to 64 Years | 298 (6.5%) | 259 (7.0%) |
| 65 to 74 Years | 70 (9.6%) | 14 (1.4%) |
| 75 Years and over | 26 (7.3%) | 52 (10.5%) |
Disability Class: Ambulatory Difficulty
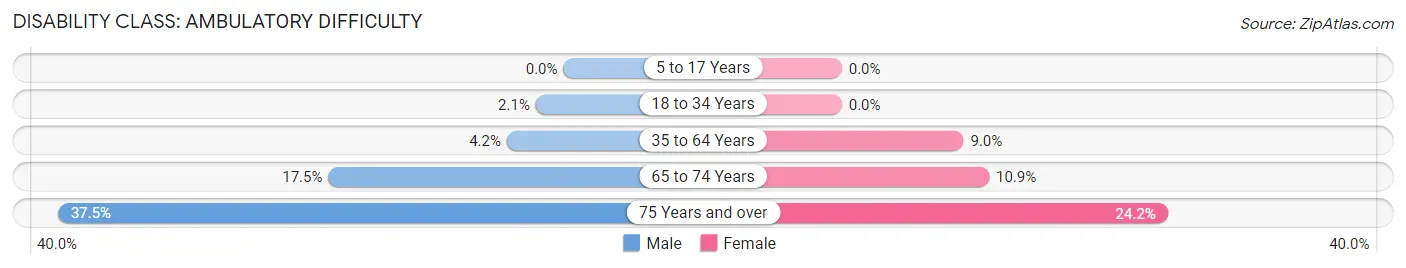
| Age Bracket | Male | Female |
| 5 to 17 Years | 0 (0.0%) | 0 (0.0%) |
| 18 to 34 Years | 47 (2.1%) | 0 (0.0%) |
| 35 to 64 Years | 194 (4.2%) | 336 (9.0%) |
| 65 to 74 Years | 127 (17.4%) | 108 (10.9%) |
| 75 Years and over | 134 (37.5%) | 120 (24.2%) |
Disability Class: Self-Care Difficulty
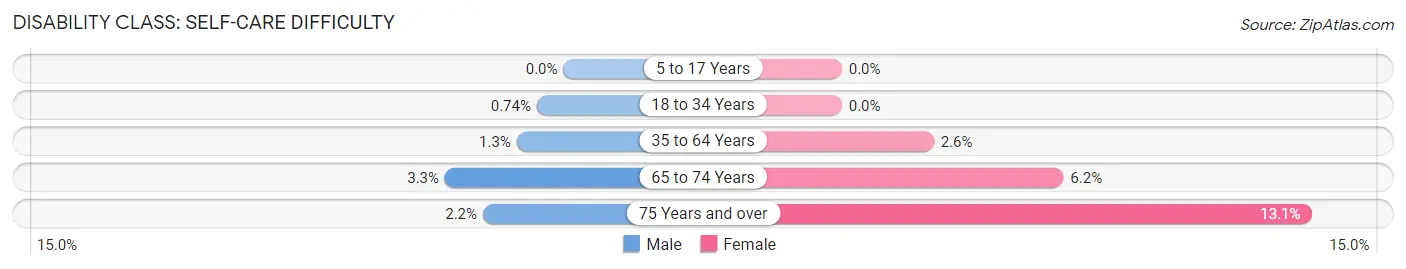
| Age Bracket | Male | Female |
| 5 to 17 Years | 0 (0.0%) | 0 (0.0%) |
| 18 to 34 Years | 17 (0.7%) | 0 (0.0%) |
| 35 to 64 Years | 60 (1.3%) | 95 (2.6%) |
| 65 to 74 Years | 24 (3.3%) | 61 (6.2%) |
| 75 Years and over | 8 (2.2%) | 65 (13.1%) |
Technology Access in Dickinson
Computing Device Access in Dickinson
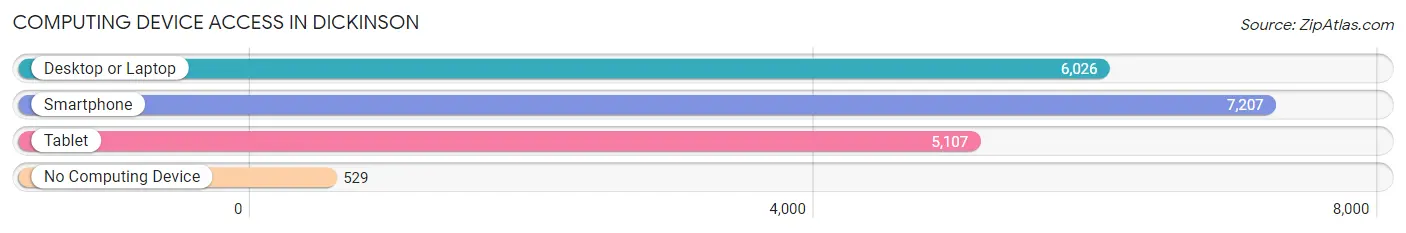
| Device Type | # Households | % Households |
| Desktop or Laptop | 6,026 | 74.4% |
| Smartphone | 7,207 | 88.9% |
| Tablet | 5,107 | 63.0% |
| No Computing Device | 529 | 6.5% |
| Total | 8,104 | 100.0% |
Internet Access in Dickinson
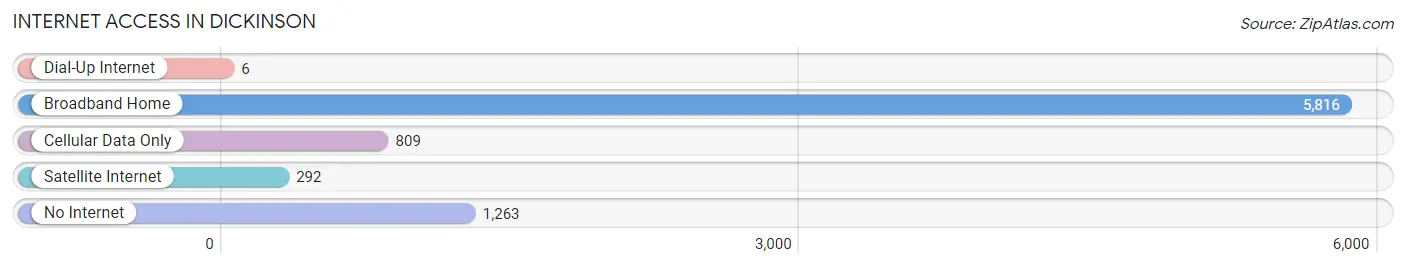
| Internet Type | # Households | % Households |
| Dial-Up Internet | 6 | 0.1% |
| Broadband Home | 5,816 | 71.8% |
| Cellular Data Only | 809 | 10.0% |
| Satellite Internet | 292 | 3.6% |
| No Internet | 1,263 | 15.6% |
| Total | 8,104 | 100.0% |
Dickinson Summary
Dickinson, Texas is a city located in Galveston County, Texas, United States. The city is located on the Gulf Coast, approximately 25 miles southeast of Houston. As of the 2010 census, the population of Dickinson was 18,680.
History
The area that is now Dickinson was originally inhabited by the Karankawa Indians. The first European settlers arrived in the area in the early 1800s. The city was founded in 1853 by John Dickinson, a former slave who had purchased his freedom. Dickinson was a successful businessman and rancher, and he established a large ranch in the area.
In 1873, Dickinson donated land to the Galveston, Houston and Henderson Railroad, which led to the development of the city. The city was incorporated in 1876 and was named after its founder.
Geography
Dickinson is located at 29°27'N 95°02'W (29.45, -95.03). According to the United States Census Bureau, the city has a total area of 8.3 square miles (21.5 km2), of which 8.2 square miles (21.3 km2) is land and 0.1 square miles (0.2 km2) is water.
Economy
Dickinson is a major industrial center in the region. The city is home to several large oil refineries, chemical plants, and other industrial facilities. The city is also home to several large retail stores, including Walmart, Target, and Home Depot.
The city is also home to several large employers, including the Dickinson Independent School District, the Dickinson Police Department, and the Dickinson Fire Department.
Demographics
As of the 2010 census, there were 18,680 people, 6,845 households, and 4,845 families residing in the city. The population density was 2,269.2 people per square mile (876.3/km2). There were 7,541 housing units at an average density of 917.2 per square mile (354.2/km2). The racial makeup of the city was 73.2% White, 11.3% African American, 0.7% Native American, 0.9% Asian, 0.1% Pacific Islander, 11.2% from other races, and 3.6% from two or more races. Hispanic or Latino of any race were 24.2% of the population.
The median income for a household in the city was $45,945, and the median income for a family was $54,945. Males had a median income of $41,945 versus $30,945 for females. The per capita income for the city was $20,945. About 11.2% of families and 14.3% of the population were below the poverty line, including 19.3% of those under age 18 and 8.3% of those age 65 or over.
Common Questions
What is Per Capita Income in Dickinson?
Per Capita income in Dickinson is $35,980.
What is the Median Family Income in Dickinson?
Median Family Income in Dickinson is $96,225.
What is the Median Household income in Dickinson?
Median Household Income in Dickinson is $81,739.
What is Income or Wage Gap in Dickinson?
Income or Wage Gap in Dickinson is 43.6%.
Women in Dickinson earn 56.4 cents for every dollar earned by a man.
What is Inequality or Gini Index in Dickinson?
Inequality or Gini Index in Dickinson is 0.41.
What is the Total Population of Dickinson?
Total Population of Dickinson is 21,475.
What is the Total Male Population of Dickinson?
Total Male Population of Dickinson is 10,423.
What is the Total Female Population of Dickinson?
Total Female Population of Dickinson is 11,052.
What is the Ratio of Males per 100 Females in Dickinson?
There are 94.31 Males per 100 Females in Dickinson.
What is the Ratio of Females per 100 Males in Dickinson?
There are 106.03 Females per 100 Males in Dickinson.
What is the Median Population Age in Dickinson?
Median Population Age in Dickinson is 35.8 Years.
What is the Average Family Size in Dickinson
Average Family Size in Dickinson is 3.2 People.
What is the Average Household Size in Dickinson
Average Household Size in Dickinson is 2.6 People.
How Large is the Labor Force in Dickinson?
There are 10,963 People in the Labor Forcein in Dickinson.
What is the Percentage of People in the Labor Force in Dickinson?
67.6% of People are in the Labor Force in Dickinson.
What is the Unemployment Rate in Dickinson?
Unemployment Rate in Dickinson is 4.4%.