Deweyville, TX Map & Demographics
Deweyville Map
Deweyville Overview
$24,442
PER CAPITA INCOME
$29,271
AVG HOUSEHOLD INCOME
64.2%
WAGE / INCOME GAP [ % ]
35.8¢/ $1
WAGE / INCOME GAP [ $ ]
0.45
INEQUALITY / GINI INDEX
517
TOTAL POPULATION
265
MALE POPULATION
252
FEMALE POPULATION
105.16
MALES / 100 FEMALES
95.09
FEMALES / 100 MALES
57.3
MEDIAN AGE
2.5
AVG FAMILY SIZE
2.2
AVG HOUSEHOLD SIZE
219
LABOR FORCE [ PEOPLE ]
49.7%
PERCENT IN LABOR FORCE
6.4%
UNEMPLOYMENT RATE
Deweyville Zip Codes
Deweyville Area Codes
Income in Deweyville
Income Overview in Deweyville
| Characteristic | Number | Measure |
| Per Capita Income | 517 | $24,442 |
| Median Family Income | 179 | $0 |
| Mean Family Income | 179 | $60,047 |
| Median Household Income | 230 | $29,271 |
| Mean Household Income | 230 | $54,187 |
| Income Deficit | 179 | $0 |
| Wage / Income Gap (%) | 517 | 64.22% |
| Wage / Income Gap ($) | 517 | 35.78¢ per $1 |
| Gini / Inequality Index | 517 | 0.45 |
Earnings by Sex in Deweyville
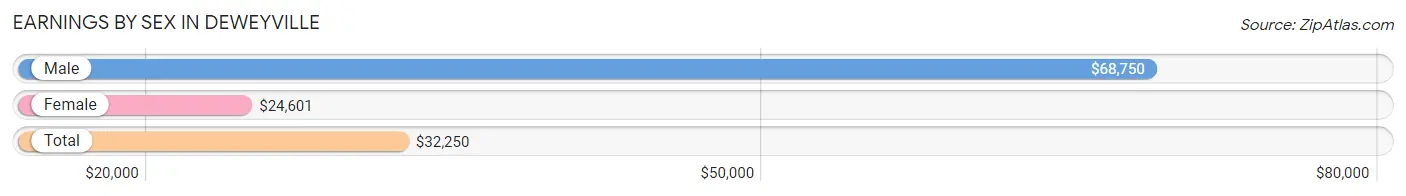
Average Earnings in Deweyville are $32,250, $68,750 for men and $24,601 for women, a difference of 64.2%.
| Sex | Number | Average Earnings |
| Male | 50 (24.4%) | $68,750 |
| Female | 155 (75.6%) | $24,601 |
| Total | 205 (100.0%) | $32,250 |
Earnings by Sex by Income Bracket in Deweyville
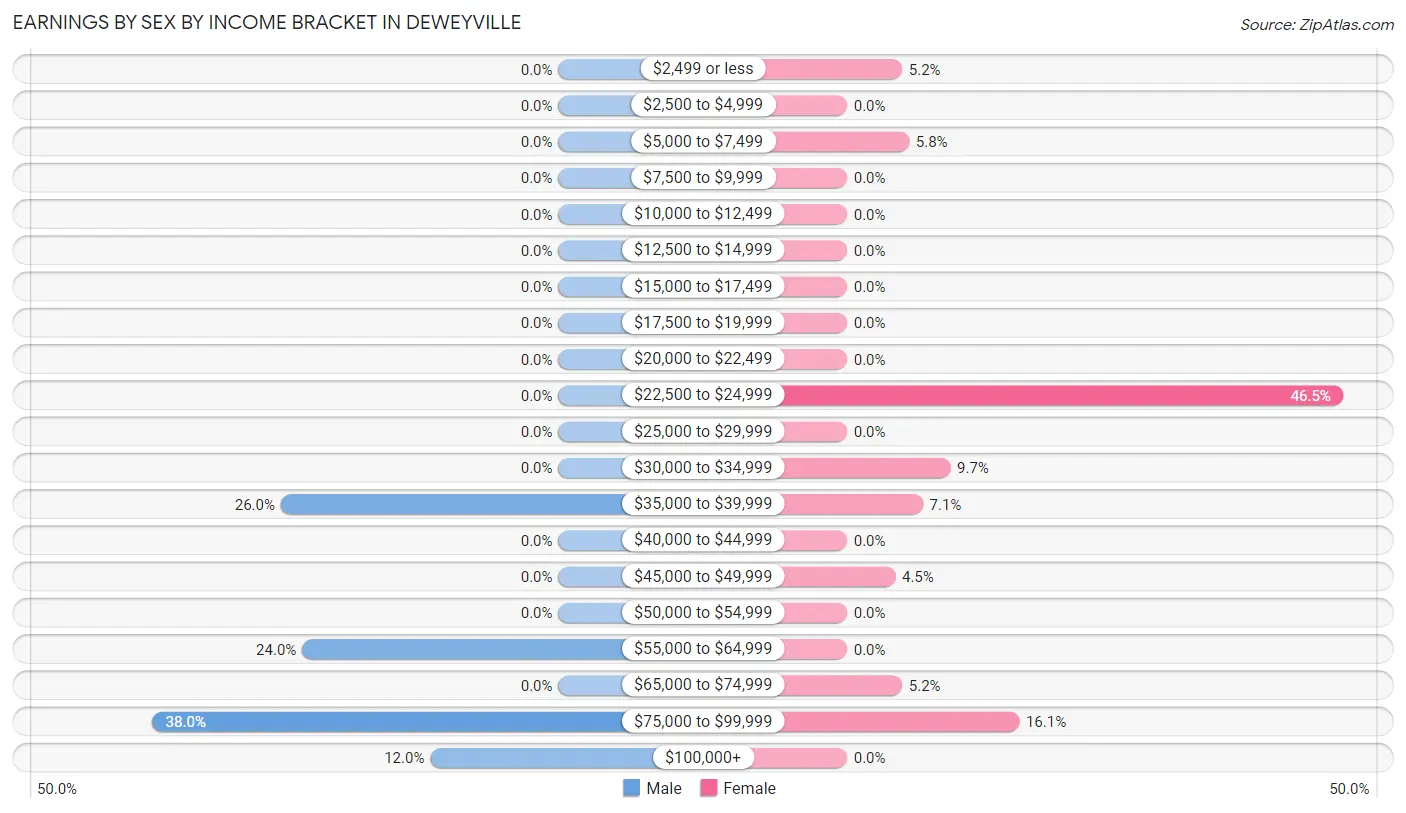
The most common earnings brackets in Deweyville are $75,000 to $99,999 for men (19 | 38.0%) and $22,500 to $24,999 for women (72 | 46.5%).
| Income | Male | Female |
| $2,499 or less | 0 (0.0%) | 8 (5.2%) |
| $2,500 to $4,999 | 0 (0.0%) | 0 (0.0%) |
| $5,000 to $7,499 | 0 (0.0%) | 9 (5.8%) |
| $7,500 to $9,999 | 0 (0.0%) | 0 (0.0%) |
| $10,000 to $12,499 | 0 (0.0%) | 0 (0.0%) |
| $12,500 to $14,999 | 0 (0.0%) | 0 (0.0%) |
| $15,000 to $17,499 | 0 (0.0%) | 0 (0.0%) |
| $17,500 to $19,999 | 0 (0.0%) | 0 (0.0%) |
| $20,000 to $22,499 | 0 (0.0%) | 0 (0.0%) |
| $22,500 to $24,999 | 0 (0.0%) | 72 (46.5%) |
| $25,000 to $29,999 | 0 (0.0%) | 0 (0.0%) |
| $30,000 to $34,999 | 0 (0.0%) | 15 (9.7%) |
| $35,000 to $39,999 | 13 (26.0%) | 11 (7.1%) |
| $40,000 to $44,999 | 0 (0.0%) | 0 (0.0%) |
| $45,000 to $49,999 | 0 (0.0%) | 7 (4.5%) |
| $50,000 to $54,999 | 0 (0.0%) | 0 (0.0%) |
| $55,000 to $64,999 | 12 (24.0%) | 0 (0.0%) |
| $65,000 to $74,999 | 0 (0.0%) | 8 (5.2%) |
| $75,000 to $99,999 | 19 (38.0%) | 25 (16.1%) |
| $100,000+ | 6 (12.0%) | 0 (0.0%) |
| Total | 50 (100.0%) | 155 (100.0%) |
Earnings by Sex by Educational Attainment in Deweyville
| Educational Attainment | Male Income | Female Income |
| Less than High School | - | - |
| High School Diploma | - | - |
| College or Associate's Degree | - | - |
| Bachelor's Degree | - | - |
| Graduate Degree | - | - |
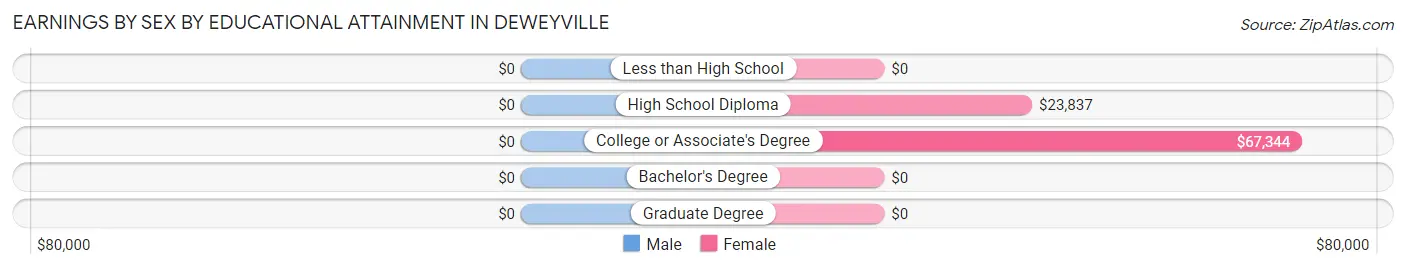
| Total | $68,750 | $24,601 |
Family Income in Deweyville
Family Income Brackets in Deweyville
According to the Deweyville family income data, there are 61 families falling into the $25,000 to $34,999 income range, which is the most common income bracket and makes up 34.1% of all families.
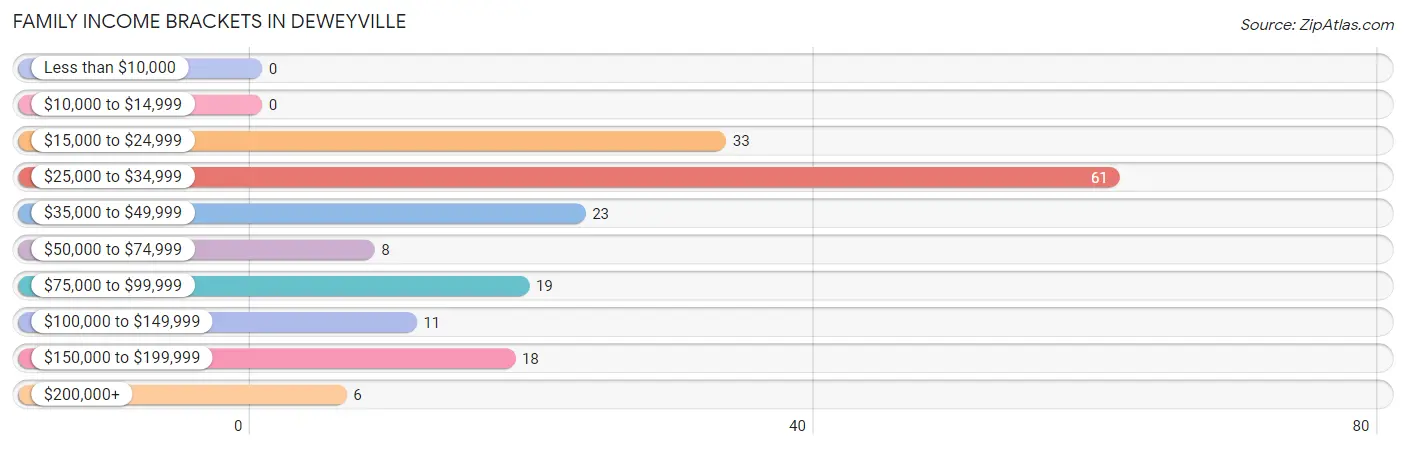
| Income Bracket | # Families | % Families |
| Less than $10,000 | 0 | 0.0% |
| $10,000 to $14,999 | 0 | 0.0% |
| $15,000 to $24,999 | 33 | 18.4% |
| $25,000 to $34,999 | 61 | 34.1% |
| $35,000 to $49,999 | 23 | 12.8% |
| $50,000 to $74,999 | 8 | 4.5% |
| $75,000 to $99,999 | 19 | 10.6% |
| $100,000 to $149,999 | 11 | 6.1% |
| $150,000 to $199,999 | 18 | 10.1% |
| $200,000+ | 6 | 3.4% |
Family Income by Famaliy Size in Deweyville
| Income Bracket | # Families | Median Income |
| 2-Person Families | 117 (65.4%) | $0 |
| 3-Person Families | 32 (17.9%) | $0 |
| 4-Person Families | 30 (16.8%) | $0 |
| 5-Person Families | 0 (0.0%) | $0 |
| 6-Person Families | 0 (0.0%) | $0 |
| 7+ Person Families | 0 (0.0%) | $0 |
| Total | 179 (100.0%) | $0 |
Family Income by Number of Earners in Deweyville
| Number of Earners | # Families | Median Income |
| No Earners | 45 (25.1%) | $0 |
| 1 Earner | 109 (60.9%) | $0 |
| 2 Earners | 25 (14.0%) | $0 |
| 3+ Earners | 0 (0.0%) | $0 |
| Total | 179 (100.0%) | $0 |
Household Income in Deweyville
Household Income Brackets in Deweyville
With 76 households falling in the category, the $25,000 to $34,999 income range is the most frequent in Deweyville, accounting for 33.0% of all households.
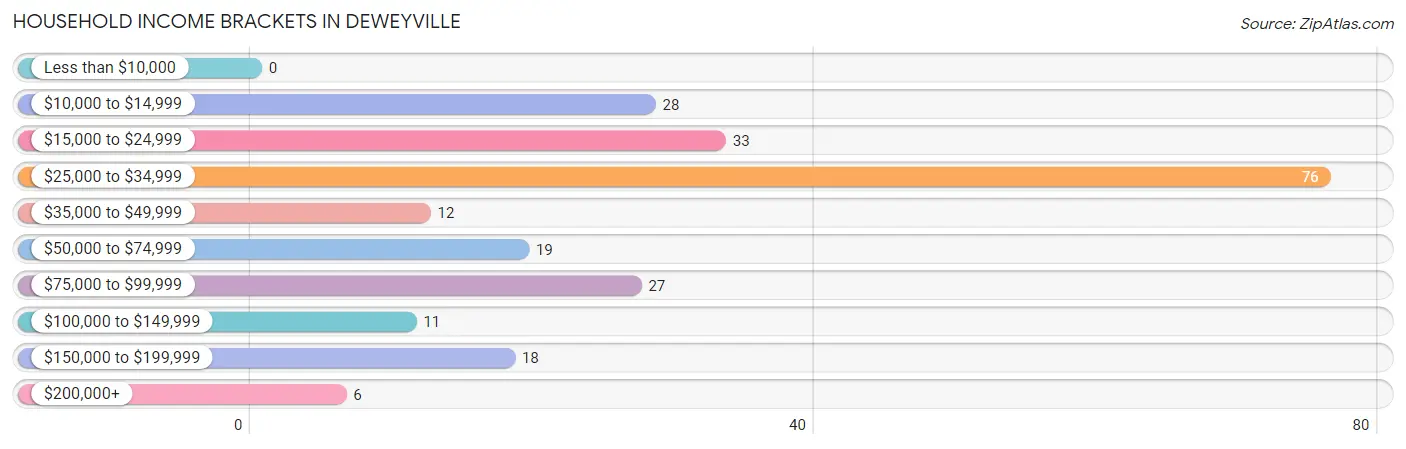
| Income Bracket | # Households | % Households |
| Less than $10,000 | 0 | 0.0% |
| $10,000 to $14,999 | 28 | 12.2% |
| $15,000 to $24,999 | 33 | 14.3% |
| $25,000 to $34,999 | 76 | 33.0% |
| $35,000 to $49,999 | 12 | 5.2% |
| $50,000 to $74,999 | 19 | 8.3% |
| $75,000 to $99,999 | 27 | 11.7% |
| $100,000 to $149,999 | 11 | 4.8% |
| $150,000 to $199,999 | 18 | 7.8% |
| $200,000+ | 6 | 2.6% |
Household Income by Householder Age in Deweyville
The median household income in Deweyville is $29,271, with the highest median household income of $80,197 found in the 25 to 44 years age bracket for the primary householder. A total of 73 households (31.7%) fall into this category.
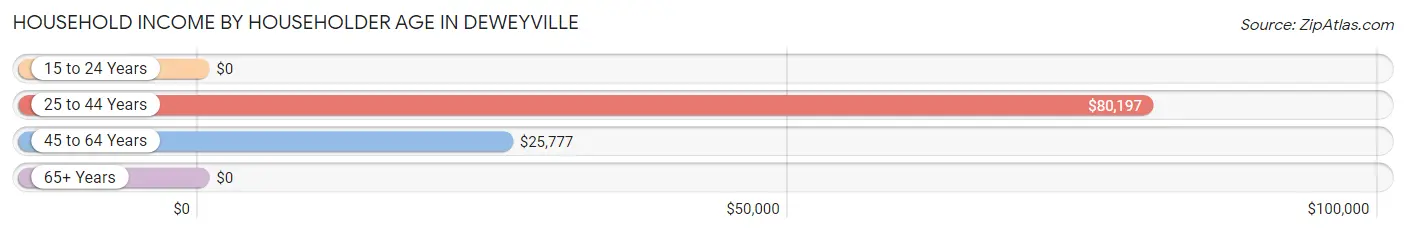
| Income Bracket | # Households | Median Income |
| 15 to 24 Years | 0 (0.0%) | $0 |
| 25 to 44 Years | 73 (31.7%) | $80,197 |
| 45 to 64 Years | 79 (34.4%) | $25,777 |
| 65+ Years | 78 (33.9%) | $0 |
| Total | 230 (100.0%) | $29,271 |
Poverty in Deweyville
Income Below Poverty by Sex and Age in Deweyville
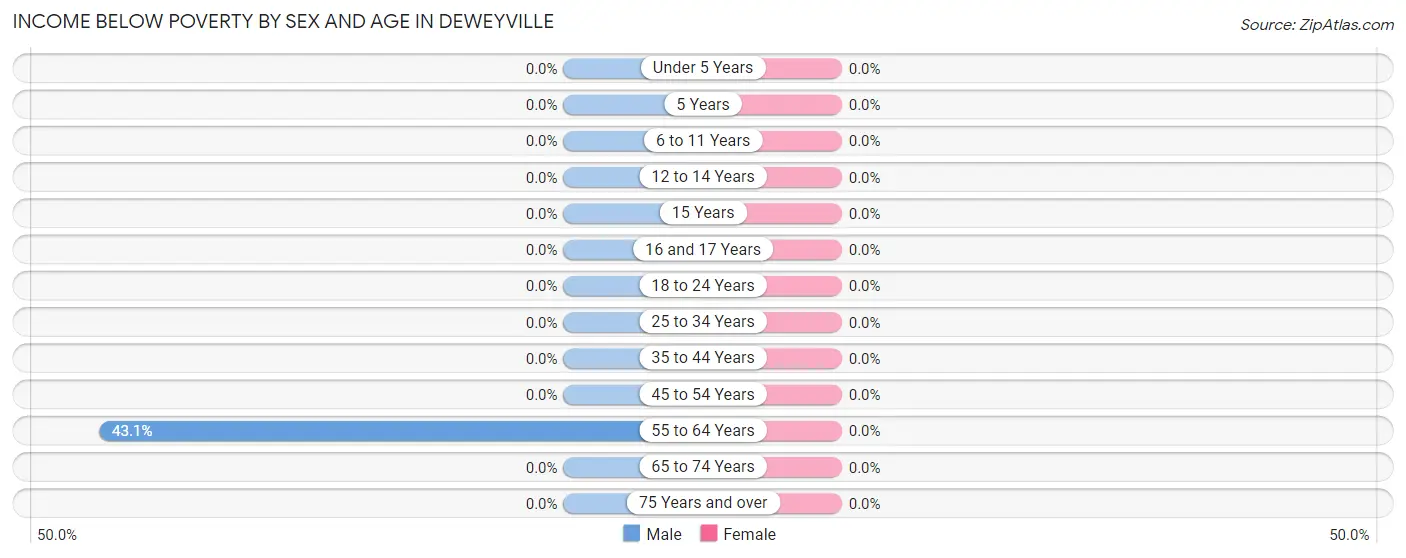
| Age Bracket | Male | Female |
| Under 5 Years | 0 (0.0%) | 0 (0.0%) |
| 5 Years | 0 (0.0%) | 0 (0.0%) |
| 6 to 11 Years | 0 (0.0%) | 0 (0.0%) |
| 12 to 14 Years | 0 (0.0%) | 0 (0.0%) |
| 15 Years | 0 (0.0%) | 0 (0.0%) |
| 16 and 17 Years | 0 (0.0%) | 0 (0.0%) |
| 18 to 24 Years | 0 (0.0%) | 0 (0.0%) |
| 25 to 34 Years | 0 (0.0%) | 0 (0.0%) |
| 35 to 44 Years | 0 (0.0%) | 0 (0.0%) |
| 45 to 54 Years | 0 (0.0%) | 0 (0.0%) |
| 55 to 64 Years | 28 (43.1%) | 0 (0.0%) |
| 65 to 74 Years | 0 (0.0%) | 0 (0.0%) |
| 75 Years and over | 0 (0.0%) | 0 (0.0%) |
| Total | 28 (10.6%) | 0 (0.0%) |
Income Above Poverty by Sex and Age in Deweyville
According to the poverty statistics in Deweyville, males aged under 5 years and females aged 6 to 11 years are the age groups that are most secure financially, with 100.0% of males and 100.0% of females in these age groups living above the poverty line.
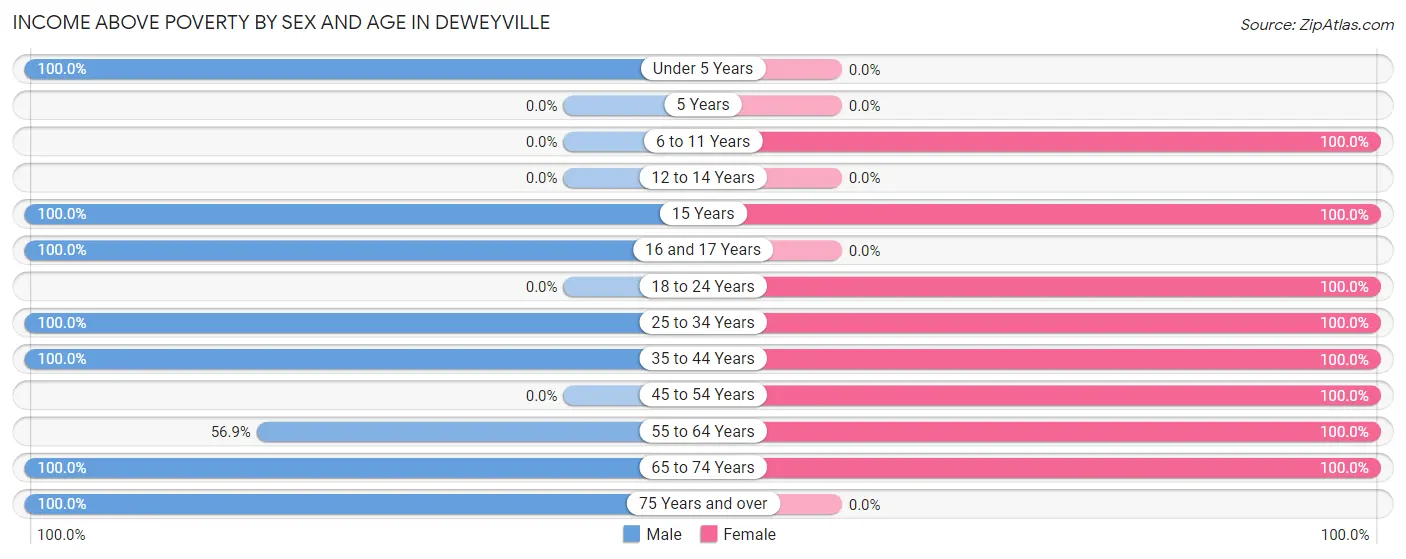
| Age Bracket | Male | Female |
| Under 5 Years | 10 (100.0%) | 0 (0.0%) |
| 5 Years | 0 (0.0%) | 0 (0.0%) |
| 6 to 11 Years | 0 (0.0%) | 16 (100.0%) |
| 12 to 14 Years | 0 (0.0%) | 0 (0.0%) |
| 15 Years | 34 (100.0%) | 16 (100.0%) |
| 16 and 17 Years | 23 (100.0%) | 0 (0.0%) |
| 18 to 24 Years | 0 (0.0%) | 14 (100.0%) |
| 25 to 34 Years | 19 (100.0%) | 11 (100.0%) |
| 35 to 44 Years | 13 (100.0%) | 65 (100.0%) |
| 45 to 54 Years | 0 (0.0%) | 8 (100.0%) |
| 55 to 64 Years | 37 (56.9%) | 53 (100.0%) |
| 65 to 74 Years | 50 (100.0%) | 69 (100.0%) |
| 75 Years and over | 51 (100.0%) | 0 (0.0%) |
| Total | 237 (89.4%) | 252 (100.0%) |
Income Below Poverty Among Married-Couple Families in Deweyville
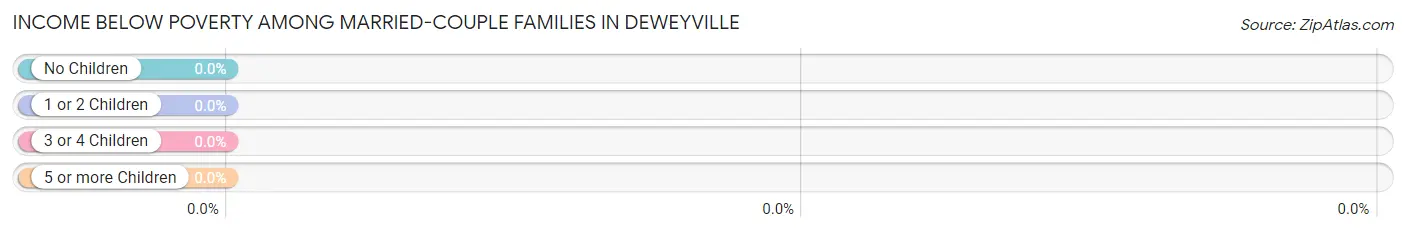
| Children | Above Poverty | Below Poverty |
| No Children | 125 (100.0%) | 0 (0.0%) |
| 1 or 2 Children | 19 (100.0%) | 0 (0.0%) |
| 3 or 4 Children | 0 (0.0%) | 0 (0.0%) |
| 5 or more Children | 0 (0.0%) | 0 (0.0%) |
| Total | 144 (100.0%) | 0 (0.0%) |
Income Below Poverty Among Single-Parent Households in Deweyville
| Children | Single Father | Single Mother |
| No Children | 0 (0.0%) | 0 (0.0%) |
| 1 or 2 Children | 0 (0.0%) | 0 (0.0%) |
| 3 or 4 Children | 0 (0.0%) | 0 (0.0%) |
| 5 or more Children | 0 (0.0%) | 0 (0.0%) |
| Total | 0 (0.0%) | 0 (0.0%) |
Income Below Poverty Among Married-Couple vs Single-Parent Households in Deweyville
| Children | Married-Couple Families | Single-Parent Households |
| No Children | 0 (0.0%) | 0 (0.0%) |
| 1 or 2 Children | 0 (0.0%) | 0 (0.0%) |
| 3 or 4 Children | 0 (0.0%) | 0 (0.0%) |
| 5 or more Children | 0 (0.0%) | 0 (0.0%) |
| Total | 0 (0.0%) | 0 (0.0%) |
Race in Deweyville
The most populous races in Deweyville are White / Caucasian (508 | 98.3%), and Native / Alaskan (9 | 1.7%).
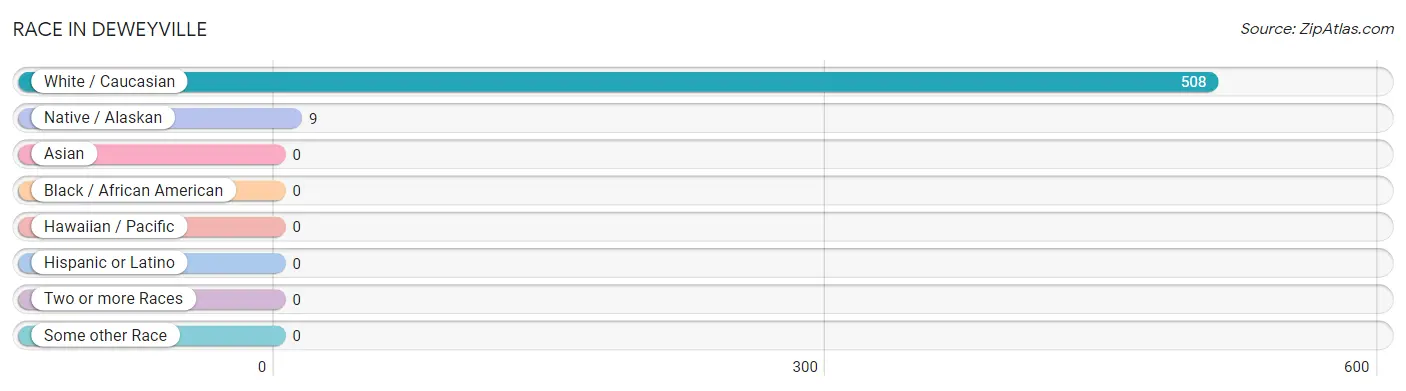
| Race | # Population | % Population |
| Asian | 0 | 0.0% |
| Black / African American | 0 | 0.0% |
| Hawaiian / Pacific | 0 | 0.0% |
| Hispanic or Latino | 0 | 0.0% |
| Native / Alaskan | 9 | 1.7% |
| White / Caucasian | 508 | 98.3% |
| Two or more Races | 0 | 0.0% |
| Some other Race | 0 | 0.0% |
| Total | 517 | 100.0% |
Ancestry in Deweyville
The most populous ancestries reported in Deweyville are American (475 | 91.9%), English (33 | 6.4%), and Navajo (9 | 1.7%), together accounting for 100.0% of all Deweyville residents.
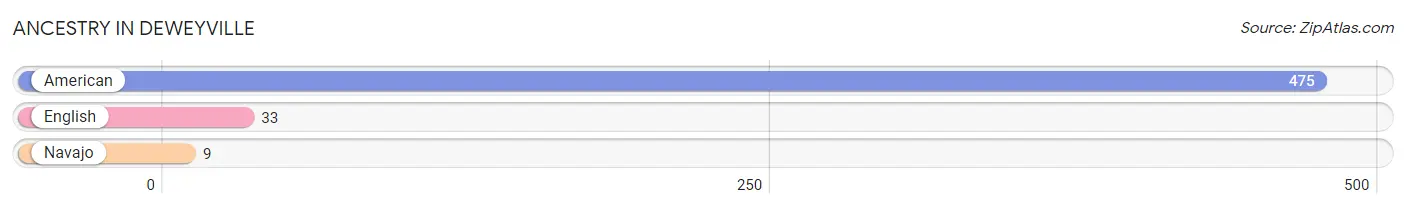
| Ancestry | # Population | % Population |
| American | 475 | 91.9% |
| English | 33 | 6.4% |
| Navajo | 9 | 1.7% | View All 3 Rows |
Immigrants in Deweyville

| Immigration Origin | # Population | % Population | View All 0 Rows |
Sex and Age in Deweyville
Sex and Age in Deweyville
The most populous age groups in Deweyville are 15 to 19 Years (57 | 21.5%) for men and 70 to 74 Years (55 | 21.8%) for women.
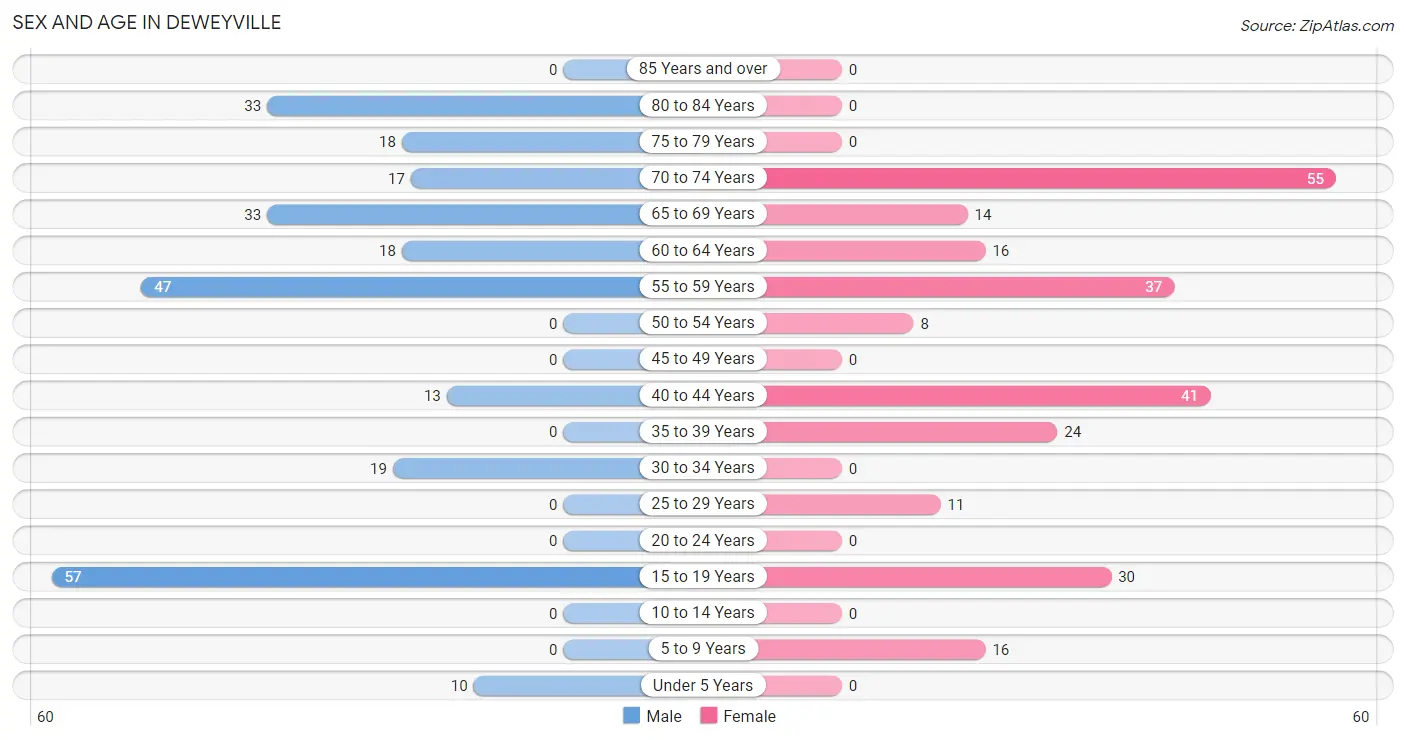
| Age Bracket | Male | Female |
| Under 5 Years | 10 (3.8%) | 0 (0.0%) |
| 5 to 9 Years | 0 (0.0%) | 16 (6.4%) |
| 10 to 14 Years | 0 (0.0%) | 0 (0.0%) |
| 15 to 19 Years | 57 (21.5%) | 30 (11.9%) |
| 20 to 24 Years | 0 (0.0%) | 0 (0.0%) |
| 25 to 29 Years | 0 (0.0%) | 11 (4.4%) |
| 30 to 34 Years | 19 (7.2%) | 0 (0.0%) |
| 35 to 39 Years | 0 (0.0%) | 24 (9.5%) |
| 40 to 44 Years | 13 (4.9%) | 41 (16.3%) |
| 45 to 49 Years | 0 (0.0%) | 0 (0.0%) |
| 50 to 54 Years | 0 (0.0%) | 8 (3.2%) |
| 55 to 59 Years | 47 (17.7%) | 37 (14.7%) |
| 60 to 64 Years | 18 (6.8%) | 16 (6.4%) |
| 65 to 69 Years | 33 (12.4%) | 14 (5.6%) |
| 70 to 74 Years | 17 (6.4%) | 55 (21.8%) |
| 75 to 79 Years | 18 (6.8%) | 0 (0.0%) |
| 80 to 84 Years | 33 (12.4%) | 0 (0.0%) |
| 85 Years and over | 0 (0.0%) | 0 (0.0%) |
| Total | 265 (100.0%) | 252 (100.0%) |
Families and Households in Deweyville
Median Family Size in Deweyville
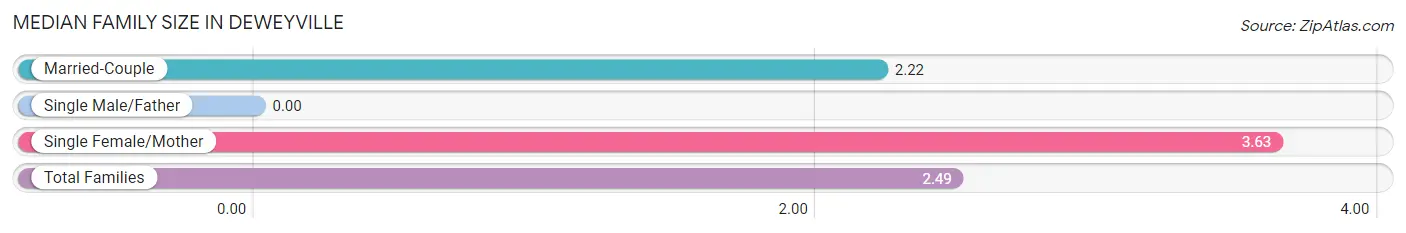
| Family Type | # Families | Family Size |
| Married-Couple | 144 (80.4%) | 2.22 |
| Single Male/Father | 0 (0.0%) | - |
| Single Female/Mother | 35 (19.6%) | 3.63 |
| Total Families | 179 (100.0%) | 2.49 |
Median Household Size in Deweyville
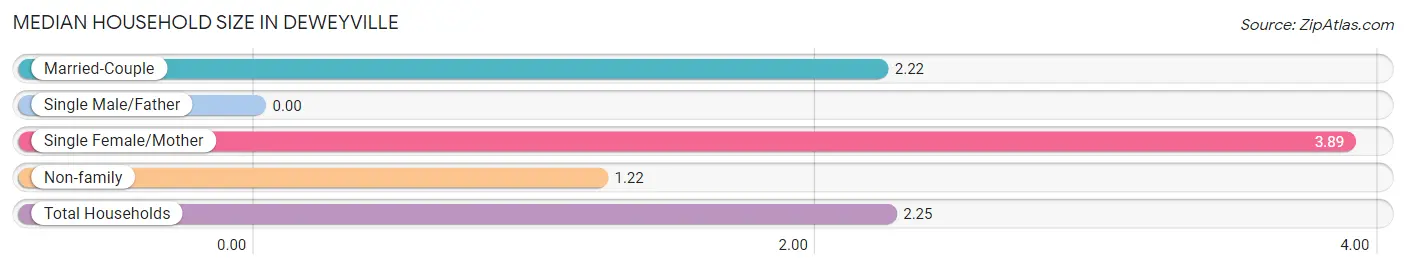
| Household Type | # Households | Household Size |
| Married-Couple | 144 (62.6%) | 2.22 |
| Single Male/Father | 0 (0.0%) | - |
| Single Female/Mother | 35 (15.2%) | 3.89 |
| Non-family | 51 (22.2%) | 1.22 |
| Total Households | 230 (100.0%) | 2.25 |
Household Size by Marriage Status in Deweyville
Out of a total of 230 households in Deweyville, 179 (77.8%) are family households, while 51 (22.2%) are nonfamily households. The most numerous type of family households are 2-person households, comprising 117, and the most common type of nonfamily households are 1-person households, comprising 43.
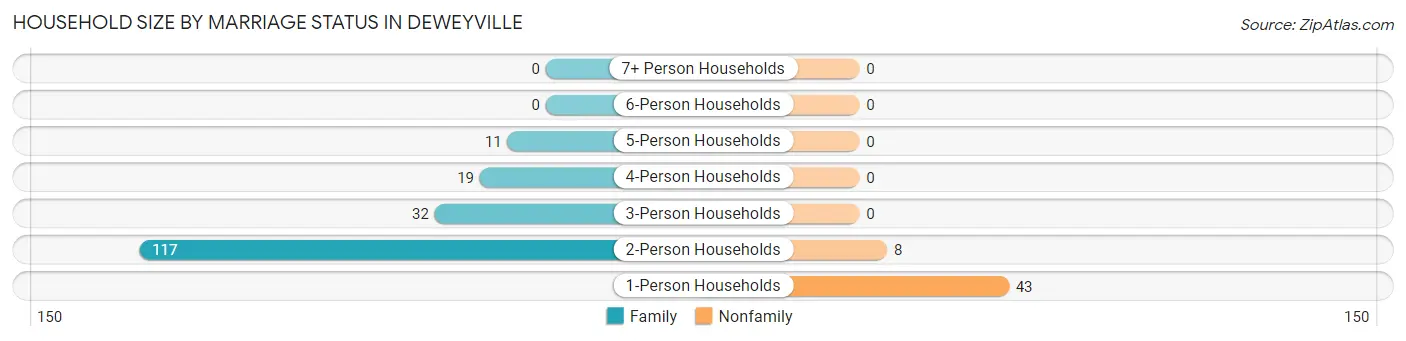
| Household Size | Family Households | Nonfamily Households |
| 1-Person Households | - | 43 (18.7%) |
| 2-Person Households | 117 (50.9%) | 8 (3.5%) |
| 3-Person Households | 32 (13.9%) | 0 (0.0%) |
| 4-Person Households | 19 (8.3%) | 0 (0.0%) |
| 5-Person Households | 11 (4.8%) | 0 (0.0%) |
| 6-Person Households | 0 (0.0%) | 0 (0.0%) |
| 7+ Person Households | 0 (0.0%) | 0 (0.0%) |
| Total | 179 (77.8%) | 51 (22.2%) |
Female Fertility in Deweyville
Fertility by Age in Deweyville
| Age Bracket | Women with Births | Births / 1,000 Women |
| 15 to 19 years | 0 (0.0%) | 0.0 |
| 20 to 34 years | 0 (0.0%) | 0.0 |
| 35 to 50 years | 0 (0.0%) | 0.0 |
| Total | 0 (0.0%) | 0.0 |
Fertility by Age by Marriage Status in Deweyville
| Age Bracket | Married | Unmarried |
| 15 to 19 years | 0 (0.0%) | 0 (0.0%) |
| 20 to 34 years | 0 (0.0%) | 0 (0.0%) |
| 35 to 50 years | 0 (0.0%) | 0 (0.0%) |
| Total | 0 (0.0%) | 0 (0.0%) |
Fertility by Education in Deweyville
| Educational Attainment | Women with Births | Births / 1,000 Women |
| Less than High School | 0 (0.0%) | 0.0 |
| High School Diploma | 0 (0.0%) | 0.0 |
| College or Associate's Degree | 0 (0.0%) | 0.0 |
| Bachelor's Degree | 0 (0.0%) | 0.0 |
| Graduate Degree | 0 (0.0%) | 0.0 |
| Total | 0 (0.0%) | 0.0 |
Fertility by Education by Marriage Status in Deweyville
| Educational Attainment | Married | Unmarried |
| Less than High School | 0 (0.0%) | 0 (0.0%) |
| High School Diploma | 0 (0.0%) | 0 (0.0%) |
| College or Associate's Degree | 0 (0.0%) | 0 (0.0%) |
| Bachelor's Degree | 0 (0.0%) | 0 (0.0%) |
| Graduate Degree | 0 (0.0%) | 0 (0.0%) |
| Total | 0 (0.0%) | 0 (0.0%) |
Employment Characteristics in Deweyville
Employment by Class of Employer in Deweyville
Among the 184 employed individuals in Deweyville, private company employees (88 | 47.8%), state government employees (45 | 24.5%), and not-for-profit organizations (24 | 13.0%) make up the most common classes of employment.
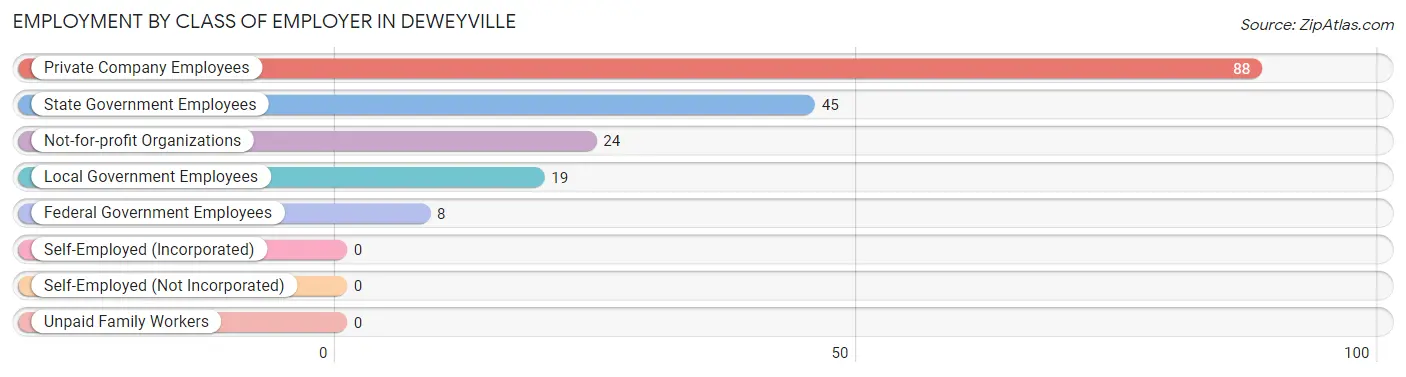
| Employer Class | # Employees | % Employees |
| Private Company Employees | 88 | 47.8% |
| Self-Employed (Incorporated) | 0 | 0.0% |
| Self-Employed (Not Incorporated) | 0 | 0.0% |
| Not-for-profit Organizations | 24 | 13.0% |
| Local Government Employees | 19 | 10.3% |
| State Government Employees | 45 | 24.5% |
| Federal Government Employees | 8 | 4.3% |
| Unpaid Family Workers | 0 | 0.0% |
| Total | 184 | 100.0% |
Employment Status by Age in Deweyville
According to the labor force statistics for Deweyville, out of the total population over 16 years of age (441), 49.7% or 219 individuals are in the labor force, with 6.4% or 14 of them unemployed. The age group with the highest labor force participation rate is 30 to 34 years, with 100.0% or 19 individuals in the labor force. Within the labor force, the 16 to 19 years age range has the highest percentage of unemployed individuals, with 100.0% or 14 of them being unemployed.
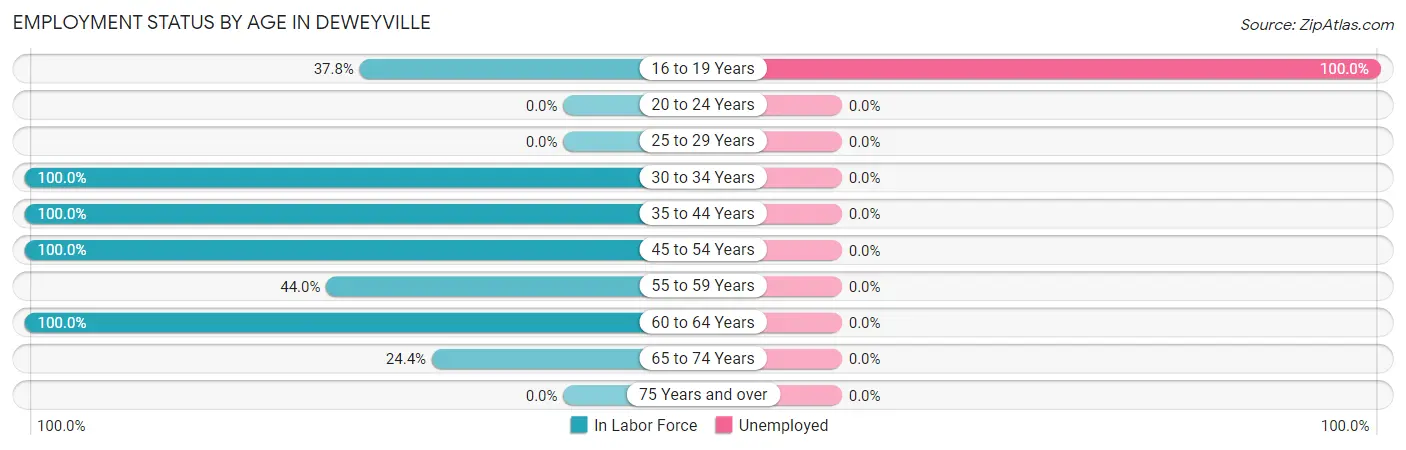
| Age Bracket | In Labor Force | Unemployed |
| 16 to 19 Years | 14 (37.8%) | 14 (100.0%) |
| 20 to 24 Years | 0 (0.0%) | 0 (0.0%) |
| 25 to 29 Years | 0 (0.0%) | 0 (0.0%) |
| 30 to 34 Years | 19 (100.0%) | 0 (0.0%) |
| 35 to 44 Years | 78 (100.0%) | 0 (0.0%) |
| 45 to 54 Years | 8 (100.0%) | 0 (0.0%) |
| 55 to 59 Years | 37 (44.0%) | 0 (0.0%) |
| 60 to 64 Years | 34 (100.0%) | 0 (0.0%) |
| 65 to 74 Years | 29 (24.4%) | 0 (0.0%) |
| 75 Years and over | 0 (0.0%) | 0 (0.0%) |
| Total | 219 (49.7%) | 14 (6.4%) |
Employment Status by Educational Attainment in Deweyville
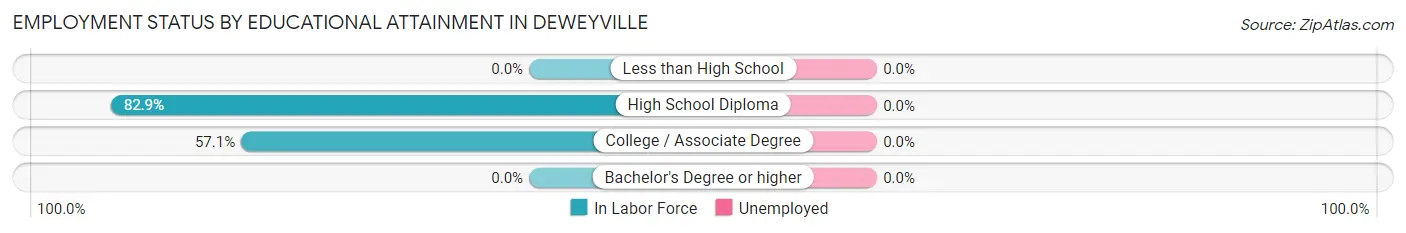
| Educational Attainment | In Labor Force | Unemployed |
| Less than High School | 0 (0.0%) | 0 (0.0%) |
| High School Diploma | 136 (82.9%) | 0 (0.0%) |
| College / Associate Degree | 40 (57.1%) | 0 (0.0%) |
| Bachelor's Degree or higher | 0 (0.0%) | 0 (0.0%) |
| Total | 176 (75.2%) | 0 (0.0%) |
Employment Occupations by Sex in Deweyville
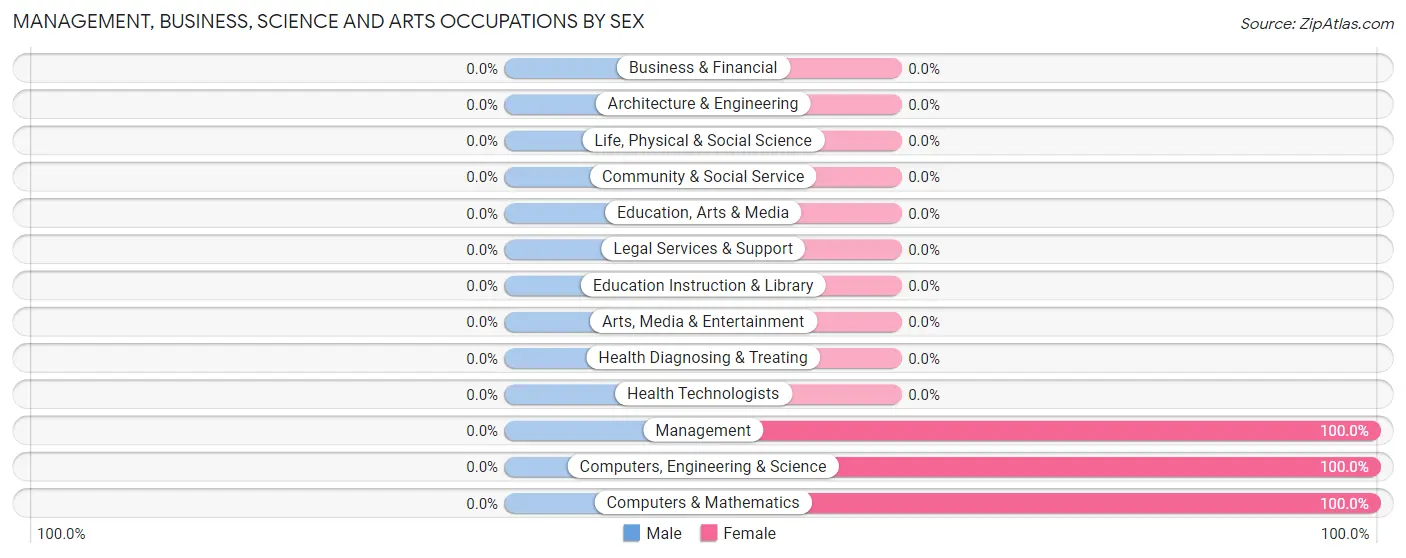
Management, Business, Science and Arts Occupations
The most common Management, Business, Science and Arts occupations in Deweyville are Computers, Engineering & Science (37 | 18.0%), Computers & Mathematics (37 | 18.0%), and Management (21 | 10.2%).
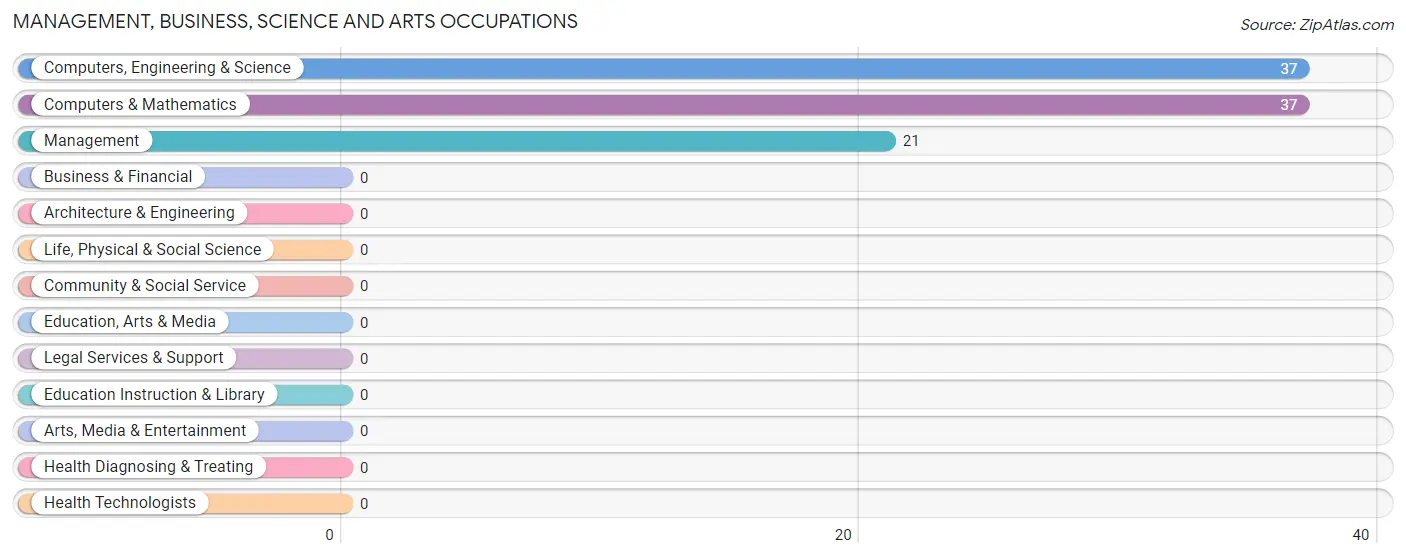
Management, Business, Science and Arts Occupations by Sex
| Occupation | Male | Female |
| Management | 0 (0.0%) | 21 (100.0%) |
| Business & Financial | 0 (0.0%) | 0 (0.0%) |
| Computers, Engineering & Science | 0 (0.0%) | 37 (100.0%) |
| Computers & Mathematics | 0 (0.0%) | 37 (100.0%) |
| Architecture & Engineering | 0 (0.0%) | 0 (0.0%) |
| Life, Physical & Social Science | 0 (0.0%) | 0 (0.0%) |
| Community & Social Service | 0 (0.0%) | 0 (0.0%) |
| Education, Arts & Media | 0 (0.0%) | 0 (0.0%) |
| Legal Services & Support | 0 (0.0%) | 0 (0.0%) |
| Education Instruction & Library | 0 (0.0%) | 0 (0.0%) |
| Arts, Media & Entertainment | 0 (0.0%) | 0 (0.0%) |
| Health Diagnosing & Treating | 0 (0.0%) | 0 (0.0%) |
| Health Technologists | 0 (0.0%) | 0 (0.0%) |
| Total (Category) | 0 (0.0%) | 58 (100.0%) |
| Total (Overall) | 50 (24.4%) | 155 (75.6%) |
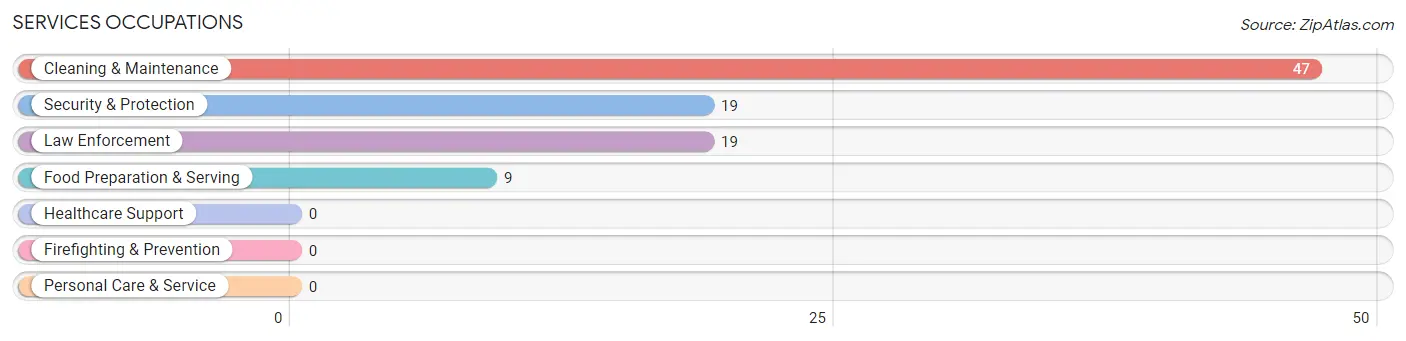
Services Occupations
The most common Services occupations in Deweyville are Cleaning & Maintenance (47 | 22.9%), Security & Protection (19 | 9.3%), Law Enforcement (19 | 9.3%), and Food Preparation & Serving (9 | 4.4%).
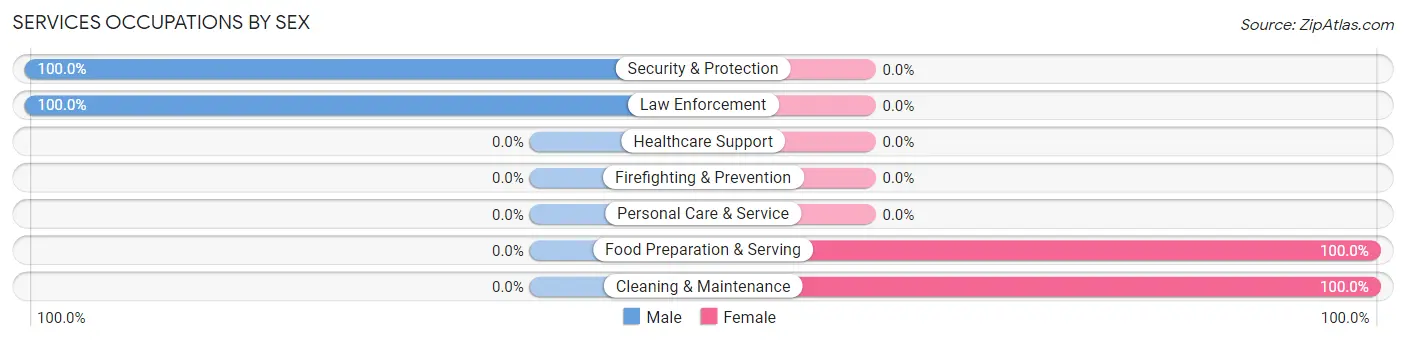
Services Occupations by Sex
Within the Services occupations in Deweyville, the most male-oriented occupations are Security & Protection (100.0%), and Law Enforcement (100.0%), while the most female-oriented occupations are Food Preparation & Serving (100.0%), and Cleaning & Maintenance (100.0%).
| Occupation | Male | Female |
| Healthcare Support | 0 (0.0%) | 0 (0.0%) |
| Security & Protection | 19 (100.0%) | 0 (0.0%) |
| Firefighting & Prevention | 0 (0.0%) | 0 (0.0%) |
| Law Enforcement | 19 (100.0%) | 0 (0.0%) |
| Food Preparation & Serving | 0 (0.0%) | 9 (100.0%) |
| Cleaning & Maintenance | 0 (0.0%) | 47 (100.0%) |
| Personal Care & Service | 0 (0.0%) | 0 (0.0%) |
| Total (Category) | 19 (25.3%) | 56 (74.7%) |
| Total (Overall) | 50 (24.4%) | 155 (75.6%) |
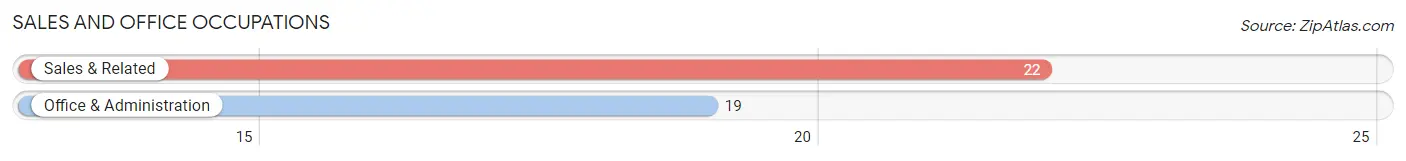
Sales and Office Occupations
The most common Sales and Office occupations in Deweyville are Sales & Related (22 | 10.7%), and Office & Administration (19 | 9.3%).
Sales and Office Occupations by Sex
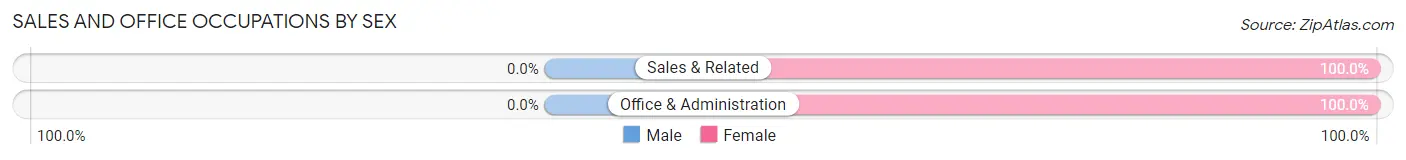
| Occupation | Male | Female |
| Sales & Related | 0 (0.0%) | 22 (100.0%) |
| Office & Administration | 0 (0.0%) | 19 (100.0%) |
| Total (Category) | 0 (0.0%) | 41 (100.0%) |
| Total (Overall) | 50 (24.4%) | 155 (75.6%) |
Natural Resources, Construction and Maintenance Occupations
The most common Natural Resources, Construction and Maintenance occupations in Deweyville are , and Installation, Maintenance & Repair (25 | 12.2%).
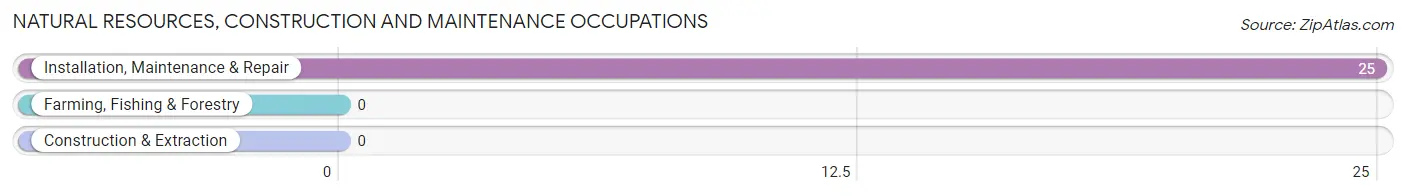
Natural Resources, Construction and Maintenance Occupations by Sex
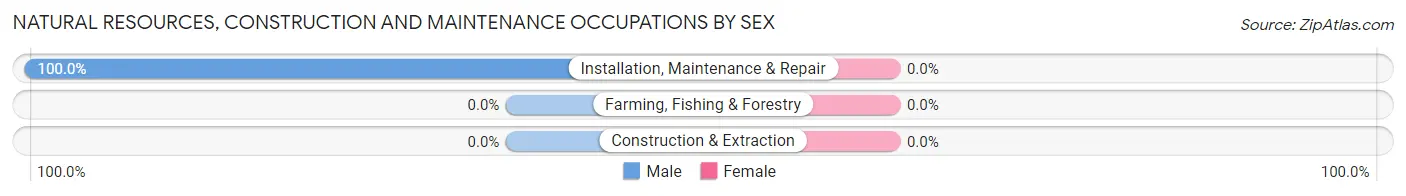
| Occupation | Male | Female |
| Farming, Fishing & Forestry | 0 (0.0%) | 0 (0.0%) |
| Construction & Extraction | 0 (0.0%) | 0 (0.0%) |
| Installation, Maintenance & Repair | 25 (100.0%) | 0 (0.0%) |
| Total (Category) | 25 (100.0%) | 0 (0.0%) |
| Total (Overall) | 50 (24.4%) | 155 (75.6%) |
Production, Transportation and Moving Occupations
The most common Production, Transportation and Moving occupations in Deweyville are , and Production (6 | 2.9%).
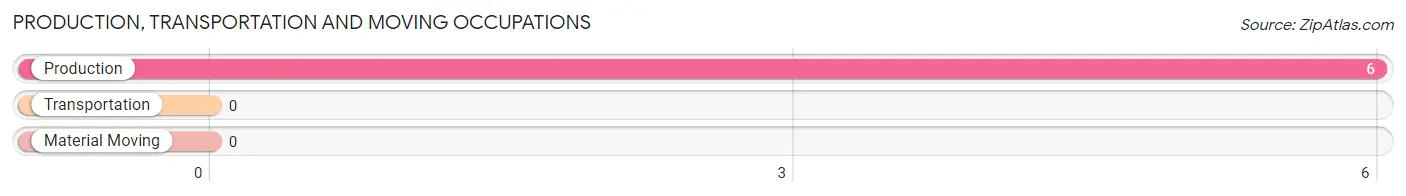
Production, Transportation and Moving Occupations by Sex
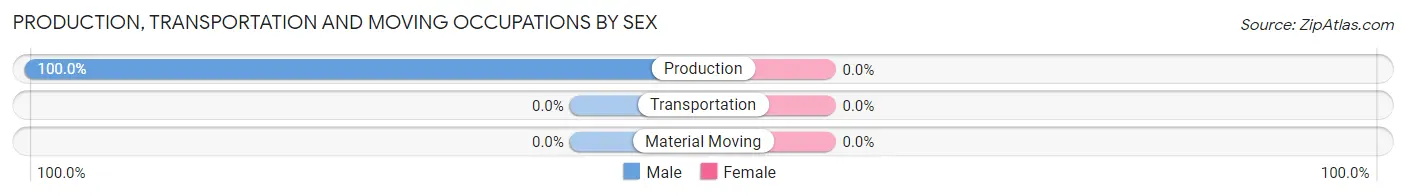
| Occupation | Male | Female |
| Production | 6 (100.0%) | 0 (0.0%) |
| Transportation | 0 (0.0%) | 0 (0.0%) |
| Material Moving | 0 (0.0%) | 0 (0.0%) |
| Total (Category) | 6 (100.0%) | 0 (0.0%) |
| Total (Overall) | 50 (24.4%) | 155 (75.6%) |
Employment Industries by Sex in Deweyville
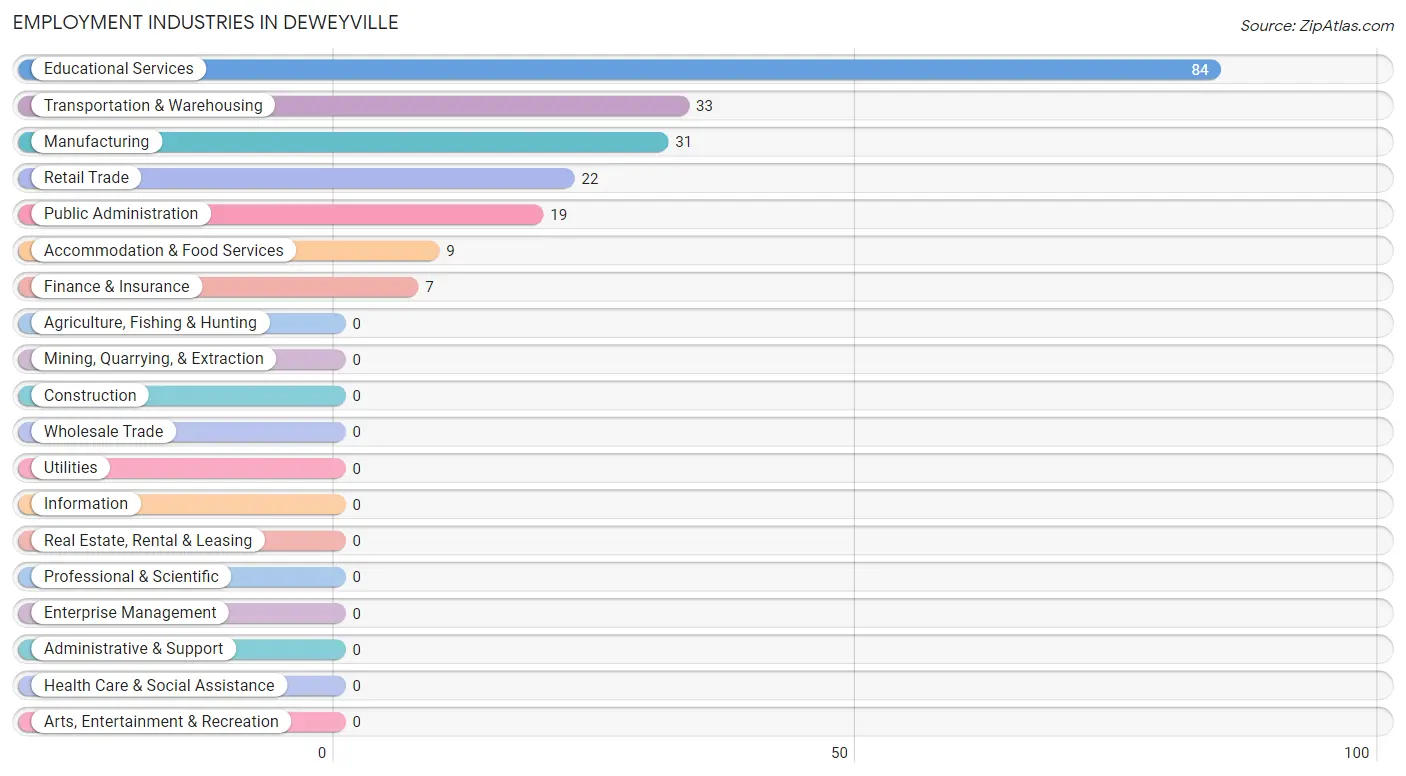
Employment Industries in Deweyville
The major employment industries in Deweyville include Educational Services (84 | 41.0%), Transportation & Warehousing (33 | 16.1%), Manufacturing (31 | 15.1%), Retail Trade (22 | 10.7%), and Public Administration (19 | 9.3%).
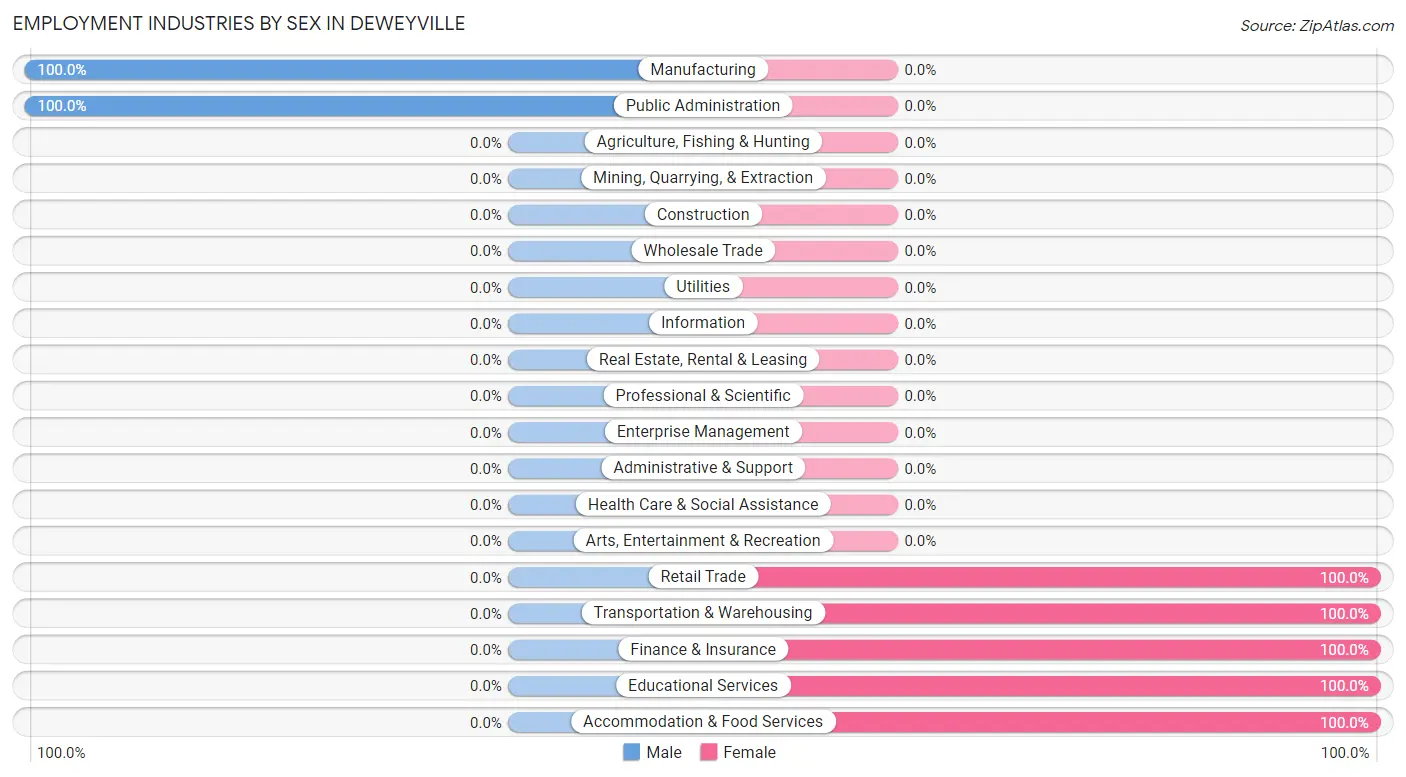
Employment Industries by Sex in Deweyville
The Deweyville industries that see more men than women are Manufacturing (100.0%), and Public Administration (100.0%), whereas the industries that tend to have a higher number of women are Retail Trade (100.0%), Transportation & Warehousing (100.0%), and Finance & Insurance (100.0%).
| Industry | Male | Female |
| Agriculture, Fishing & Hunting | 0 (0.0%) | 0 (0.0%) |
| Mining, Quarrying, & Extraction | 0 (0.0%) | 0 (0.0%) |
| Construction | 0 (0.0%) | 0 (0.0%) |
| Manufacturing | 31 (100.0%) | 0 (0.0%) |
| Wholesale Trade | 0 (0.0%) | 0 (0.0%) |
| Retail Trade | 0 (0.0%) | 22 (100.0%) |
| Transportation & Warehousing | 0 (0.0%) | 33 (100.0%) |
| Utilities | 0 (0.0%) | 0 (0.0%) |
| Information | 0 (0.0%) | 0 (0.0%) |
| Finance & Insurance | 0 (0.0%) | 7 (100.0%) |
| Real Estate, Rental & Leasing | 0 (0.0%) | 0 (0.0%) |
| Professional & Scientific | 0 (0.0%) | 0 (0.0%) |
| Enterprise Management | 0 (0.0%) | 0 (0.0%) |
| Administrative & Support | 0 (0.0%) | 0 (0.0%) |
| Educational Services | 0 (0.0%) | 84 (100.0%) |
| Health Care & Social Assistance | 0 (0.0%) | 0 (0.0%) |
| Arts, Entertainment & Recreation | 0 (0.0%) | 0 (0.0%) |
| Accommodation & Food Services | 0 (0.0%) | 9 (100.0%) |
| Public Administration | 19 (100.0%) | 0 (0.0%) |
| Total | 50 (24.4%) | 155 (75.6%) |
Education in Deweyville
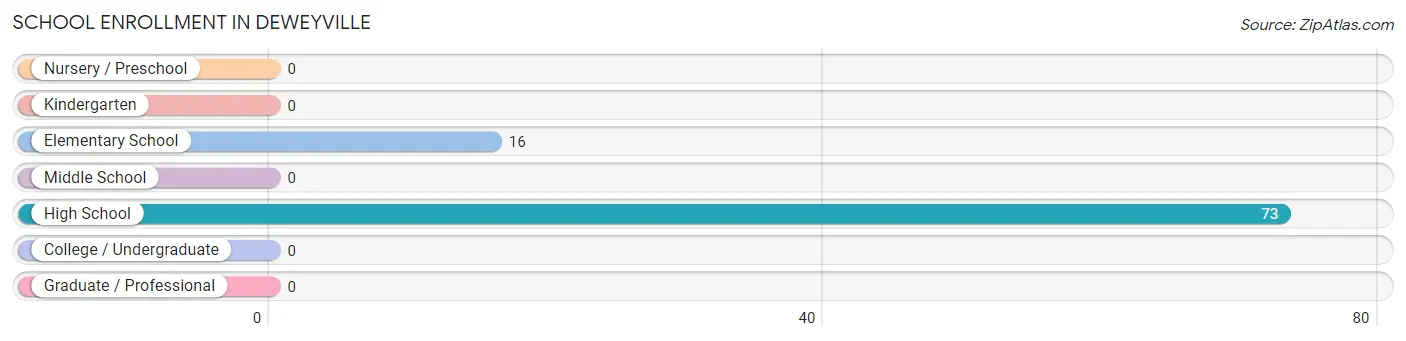
School Enrollment in Deweyville
The most common levels of schooling among the 89 students in Deweyville are high school (73 | 82.0%), and elementary school (16 | 18.0%).
| School Level | # Students | % Students |
| Nursery / Preschool | 0 | 0.0% |
| Kindergarten | 0 | 0.0% |
| Elementary School | 16 | 18.0% |
| Middle School | 0 | 0.0% |
| High School | 73 | 82.0% |
| College / Undergraduate | 0 | 0.0% |
| Graduate / Professional | 0 | 0.0% |
| Total | 89 | 100.0% |
School Enrollment by Age by Funding Source in Deweyville
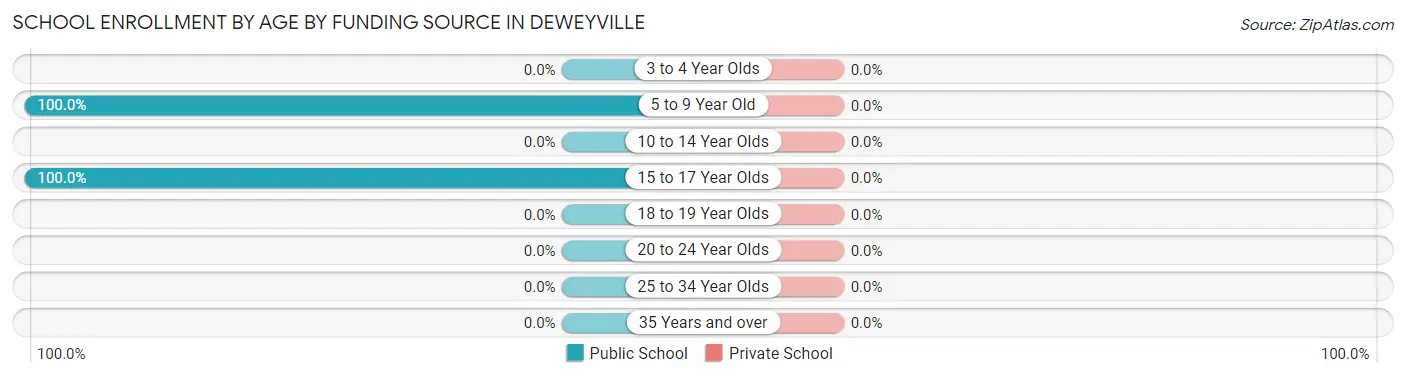
| Age Bracket | Public School | Private School |
| 3 to 4 Year Olds | 0 (0.0%) | 0 (0.0%) |
| 5 to 9 Year Old | 16 (100.0%) | 0 (0.0%) |
| 10 to 14 Year Olds | 0 (0.0%) | 0 (0.0%) |
| 15 to 17 Year Olds | 73 (100.0%) | 0 (0.0%) |
| 18 to 19 Year Olds | 0 (0.0%) | 0 (0.0%) |
| 20 to 24 Year Olds | 0 (0.0%) | 0 (0.0%) |
| 25 to 34 Year Olds | 0 (0.0%) | 0 (0.0%) |
| 35 Years and over | 0 (0.0%) | 0 (0.0%) |
| Total | 89 (100.0%) | 0 (0.0%) |
Educational Attainment by Field of Study in Deweyville
, and education (33 | 100.0%) are the most common fields of study among 33 individuals in Deweyville who have obtained a bachelor's degree or higher.
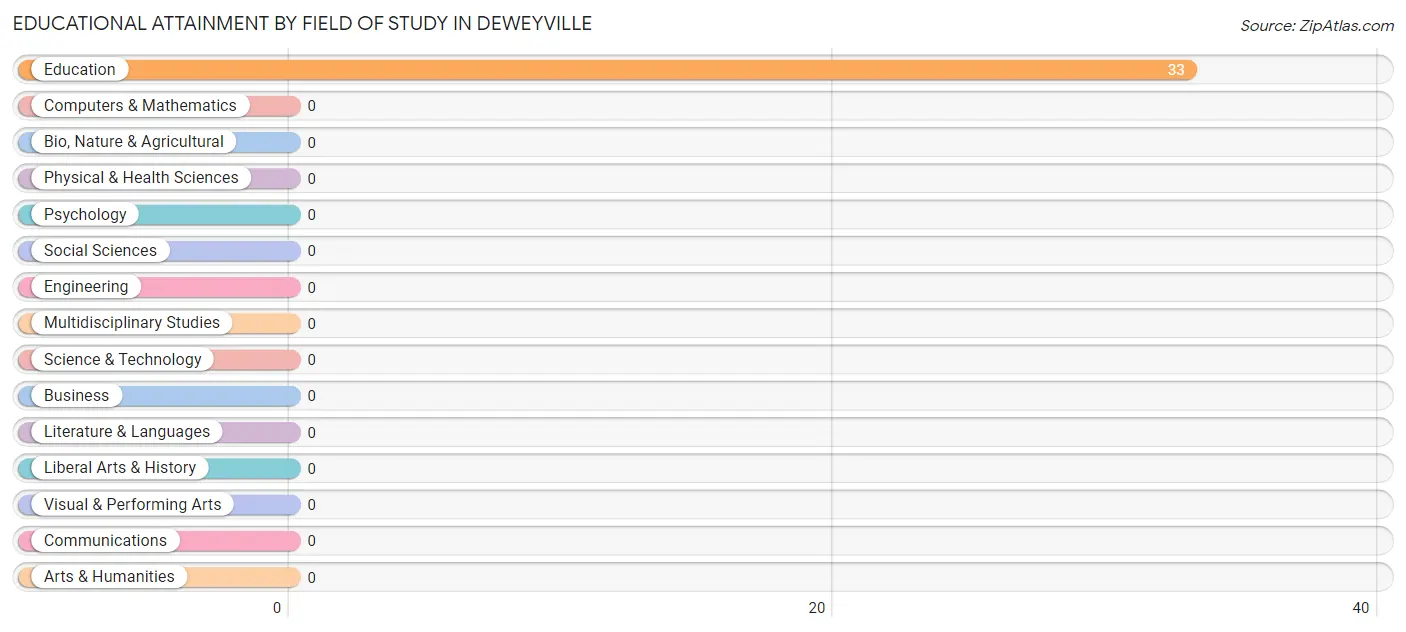
| Field of Study | # Graduates | % Graduates |
| Computers & Mathematics | 0 | 0.0% |
| Bio, Nature & Agricultural | 0 | 0.0% |
| Physical & Health Sciences | 0 | 0.0% |
| Psychology | 0 | 0.0% |
| Social Sciences | 0 | 0.0% |
| Engineering | 0 | 0.0% |
| Multidisciplinary Studies | 0 | 0.0% |
| Science & Technology | 0 | 0.0% |
| Business | 0 | 0.0% |
| Education | 33 | 100.0% |
| Literature & Languages | 0 | 0.0% |
| Liberal Arts & History | 0 | 0.0% |
| Visual & Performing Arts | 0 | 0.0% |
| Communications | 0 | 0.0% |
| Arts & Humanities | 0 | 0.0% |
| Total | 33 | 100.0% |
Transportation & Commute in Deweyville
Vehicle Availability by Sex in Deweyville
The most prevalent vehicle ownership categories in Deweyville are males with 2 vehicles (25, accounting for 56.8%) and females with 2 vehicles (96, making up 17.9%).
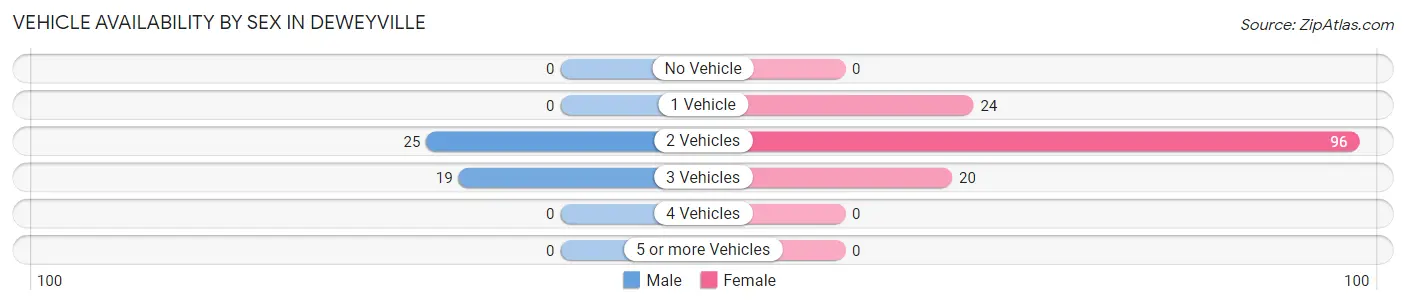
| Vehicles Available | Male | Female |
| No Vehicle | 0 (0.0%) | 0 (0.0%) |
| 1 Vehicle | 0 (0.0%) | 24 (17.1%) |
| 2 Vehicles | 25 (56.8%) | 96 (68.6%) |
| 3 Vehicles | 19 (43.2%) | 20 (14.3%) |
| 4 Vehicles | 0 (0.0%) | 0 (0.0%) |
| 5 or more Vehicles | 0 (0.0%) | 0 (0.0%) |
| Total | 44 (100.0%) | 140 (100.0%) |
Commute Time in Deweyville
The most frequently occuring commute durations in Deweyville are 30 to 34 minutes (45 commuters, 24.5%), 15 to 19 minutes (44 commuters, 23.9%), and 40 to 44 minutes (27 commuters, 14.7%).
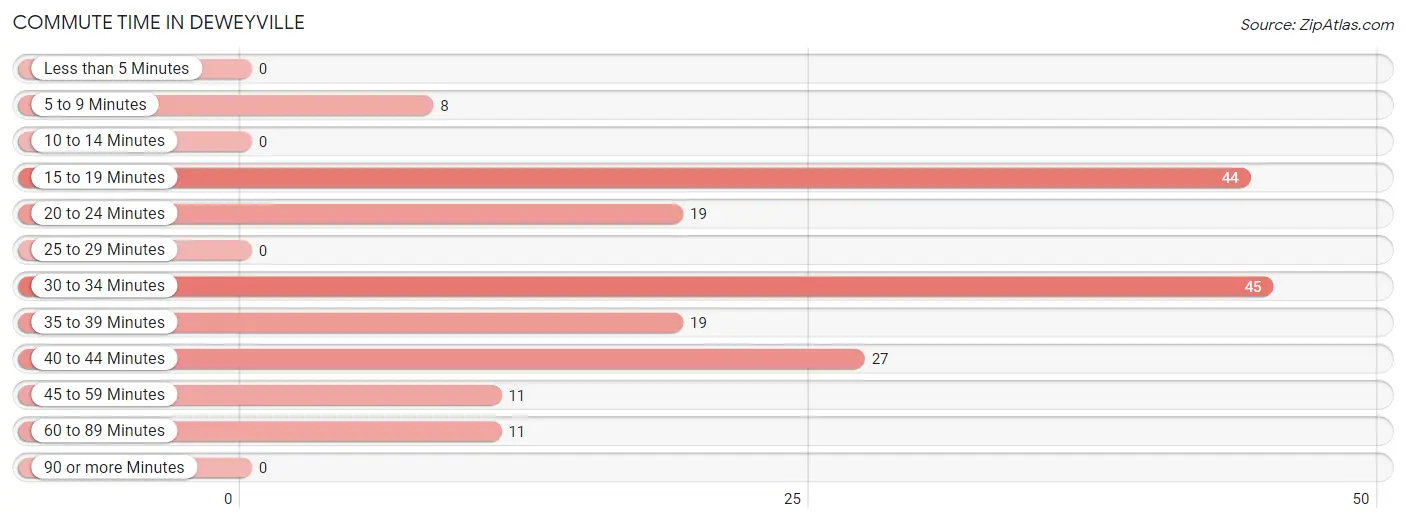
| Commute Time | # Commuters | % Commuters |
| Less than 5 Minutes | 0 | 0.0% |
| 5 to 9 Minutes | 8 | 4.3% |
| 10 to 14 Minutes | 0 | 0.0% |
| 15 to 19 Minutes | 44 | 23.9% |
| 20 to 24 Minutes | 19 | 10.3% |
| 25 to 29 Minutes | 0 | 0.0% |
| 30 to 34 Minutes | 45 | 24.5% |
| 35 to 39 Minutes | 19 | 10.3% |
| 40 to 44 Minutes | 27 | 14.7% |
| 45 to 59 Minutes | 11 | 6.0% |
| 60 to 89 Minutes | 11 | 6.0% |
| 90 or more Minutes | 0 | 0.0% |
Commute Time by Sex in Deweyville
The most common commute times in Deweyville are 35 to 39 minutes (19 commuters, 43.2%) for males and 15 to 19 minutes (44 commuters, 31.4%) for females.
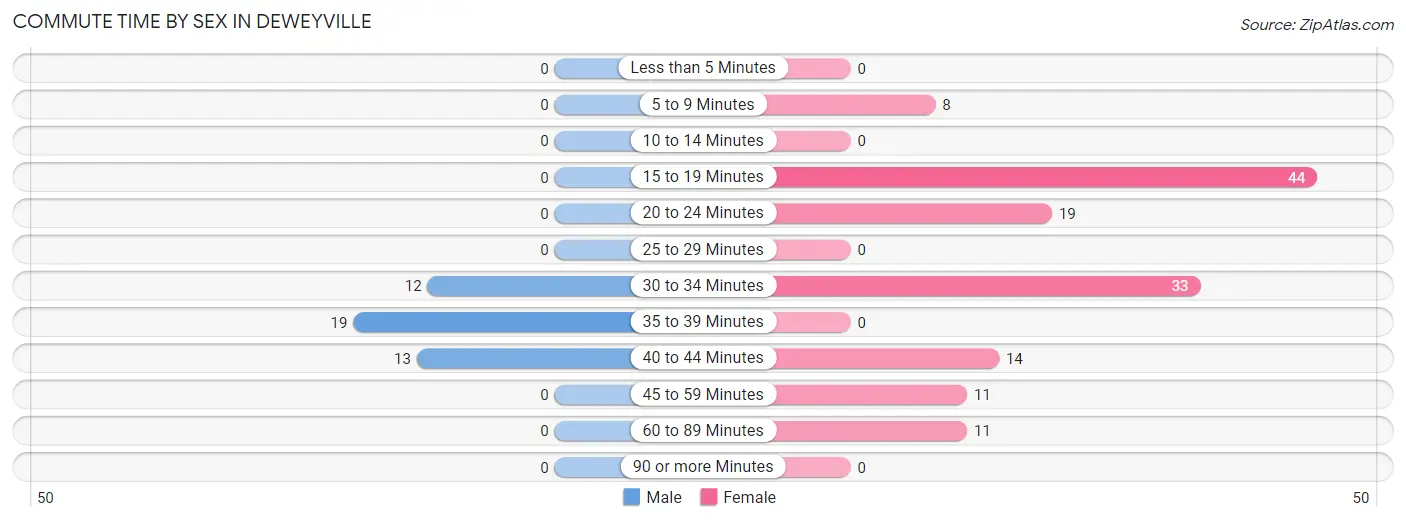
| Commute Time | Male | Female |
| Less than 5 Minutes | 0 (0.0%) | 0 (0.0%) |
| 5 to 9 Minutes | 0 (0.0%) | 8 (5.7%) |
| 10 to 14 Minutes | 0 (0.0%) | 0 (0.0%) |
| 15 to 19 Minutes | 0 (0.0%) | 44 (31.4%) |
| 20 to 24 Minutes | 0 (0.0%) | 19 (13.6%) |
| 25 to 29 Minutes | 0 (0.0%) | 0 (0.0%) |
| 30 to 34 Minutes | 12 (27.3%) | 33 (23.6%) |
| 35 to 39 Minutes | 19 (43.2%) | 0 (0.0%) |
| 40 to 44 Minutes | 13 (29.5%) | 14 (10.0%) |
| 45 to 59 Minutes | 0 (0.0%) | 11 (7.9%) |
| 60 to 89 Minutes | 0 (0.0%) | 11 (7.9%) |
| 90 or more Minutes | 0 (0.0%) | 0 (0.0%) |
Time of Departure to Work by Sex in Deweyville
The most frequent times of departure to work in Deweyville are 7:30 AM to 7:59 AM (19, 43.2%) for males and 7:30 AM to 7:59 AM (45, 32.1%) for females.
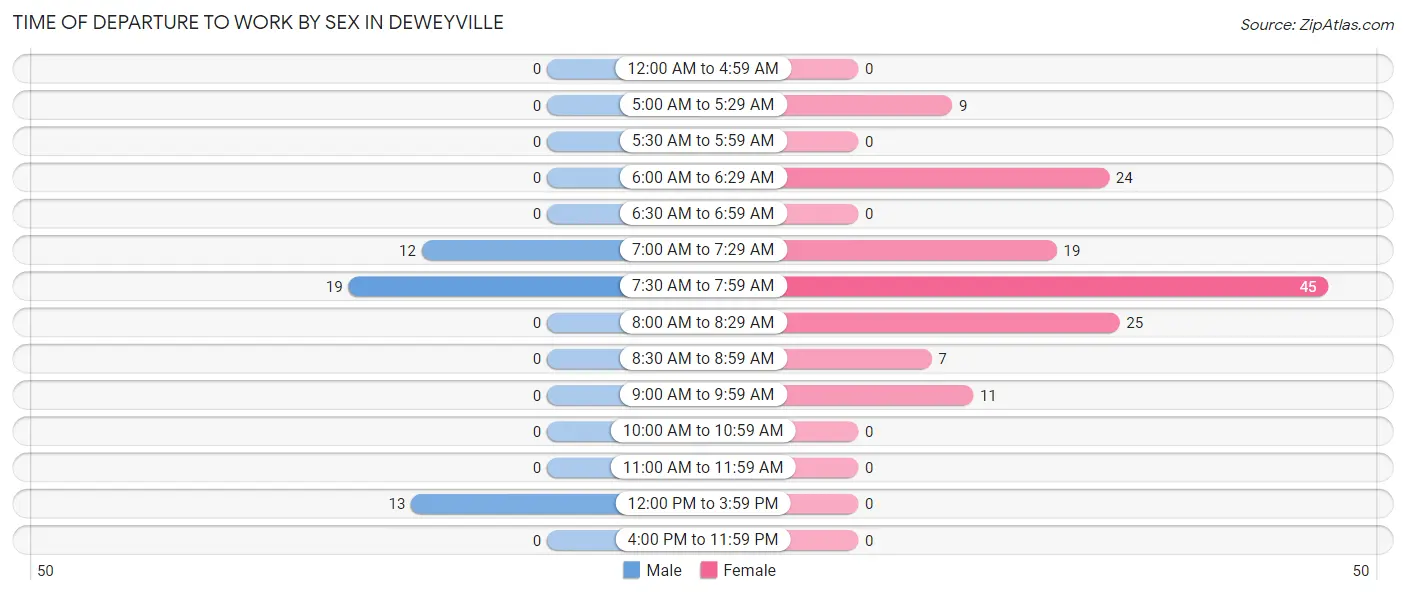
| Time of Departure | Male | Female |
| 12:00 AM to 4:59 AM | 0 (0.0%) | 0 (0.0%) |
| 5:00 AM to 5:29 AM | 0 (0.0%) | 9 (6.4%) |
| 5:30 AM to 5:59 AM | 0 (0.0%) | 0 (0.0%) |
| 6:00 AM to 6:29 AM | 0 (0.0%) | 24 (17.1%) |
| 6:30 AM to 6:59 AM | 0 (0.0%) | 0 (0.0%) |
| 7:00 AM to 7:29 AM | 12 (27.3%) | 19 (13.6%) |
| 7:30 AM to 7:59 AM | 19 (43.2%) | 45 (32.1%) |
| 8:00 AM to 8:29 AM | 0 (0.0%) | 25 (17.9%) |
| 8:30 AM to 8:59 AM | 0 (0.0%) | 7 (5.0%) |
| 9:00 AM to 9:59 AM | 0 (0.0%) | 11 (7.9%) |
| 10:00 AM to 10:59 AM | 0 (0.0%) | 0 (0.0%) |
| 11:00 AM to 11:59 AM | 0 (0.0%) | 0 (0.0%) |
| 12:00 PM to 3:59 PM | 13 (29.5%) | 0 (0.0%) |
| 4:00 PM to 11:59 PM | 0 (0.0%) | 0 (0.0%) |
| Total | 44 (100.0%) | 140 (100.0%) |
Housing Occupancy in Deweyville
Occupancy by Ownership in Deweyville
Of the total 230 dwellings in Deweyville, owner-occupied units account for 178 (77.4%), while renter-occupied units make up 52 (22.6%).
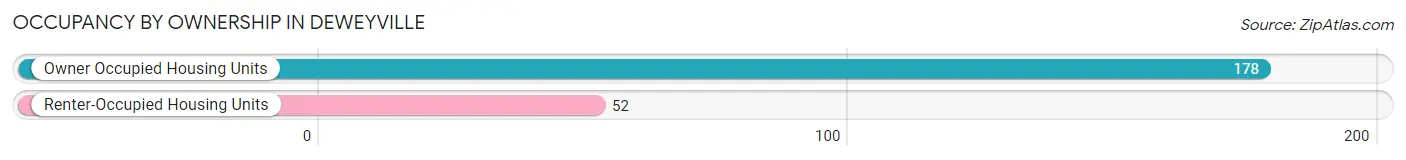
| Occupancy | # Housing Units | % Housing Units |
| Owner Occupied Housing Units | 178 | 77.4% |
| Renter-Occupied Housing Units | 52 | 22.6% |
| Total Occupied Housing Units | 230 | 100.0% |
Occupancy by Household Size in Deweyville
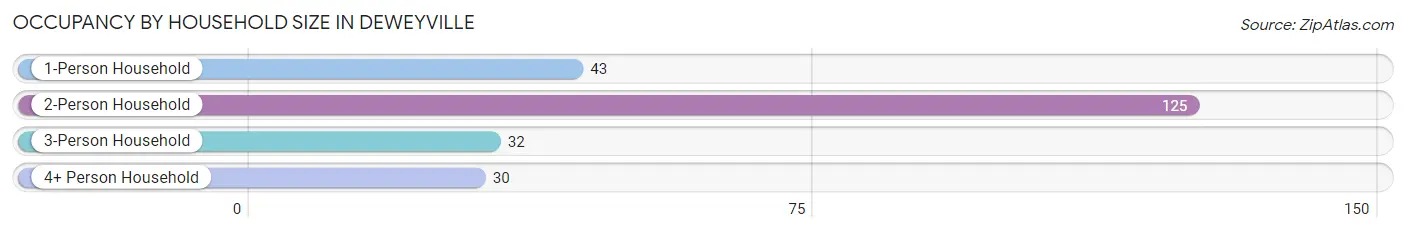
| Household Size | # Housing Units | % Housing Units |
| 1-Person Household | 43 | 18.7% |
| 2-Person Household | 125 | 54.3% |
| 3-Person Household | 32 | 13.9% |
| 4+ Person Household | 30 | 13.0% |
| Total Housing Units | 230 | 100.0% |
Occupancy by Ownership by Household Size in Deweyville
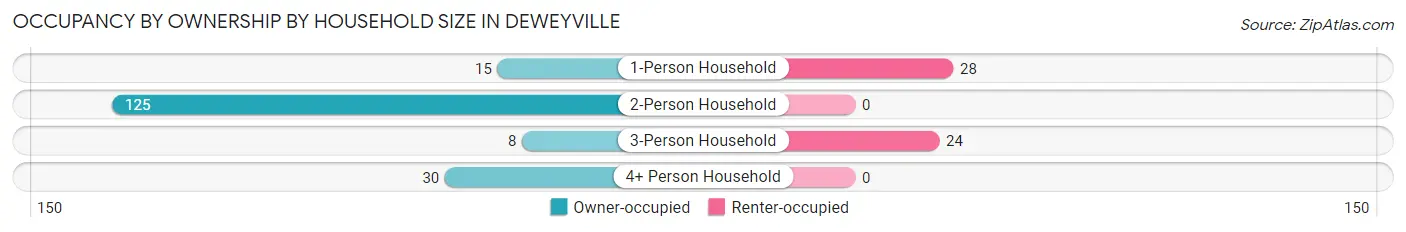
| Household Size | Owner-occupied | Renter-occupied |
| 1-Person Household | 15 (34.9%) | 28 (65.1%) |
| 2-Person Household | 125 (100.0%) | 0 (0.0%) |
| 3-Person Household | 8 (25.0%) | 24 (75.0%) |
| 4+ Person Household | 30 (100.0%) | 0 (0.0%) |
| Total Housing Units | 178 (77.4%) | 52 (22.6%) |
Occupancy by Educational Attainment in Deweyville
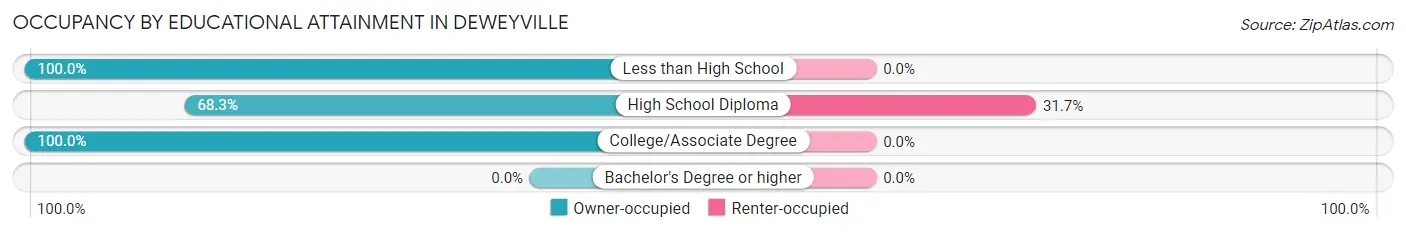
| Household Size | Owner-occupied | Renter-occupied |
| Less than High School | 33 (100.0%) | 0 (0.0%) |
| High School Diploma | 112 (68.3%) | 52 (31.7%) |
| College/Associate Degree | 33 (100.0%) | 0 (0.0%) |
| Bachelor's Degree or higher | 0 (0.0%) | 0 (0.0%) |
Occupancy by Age of Householder in Deweyville
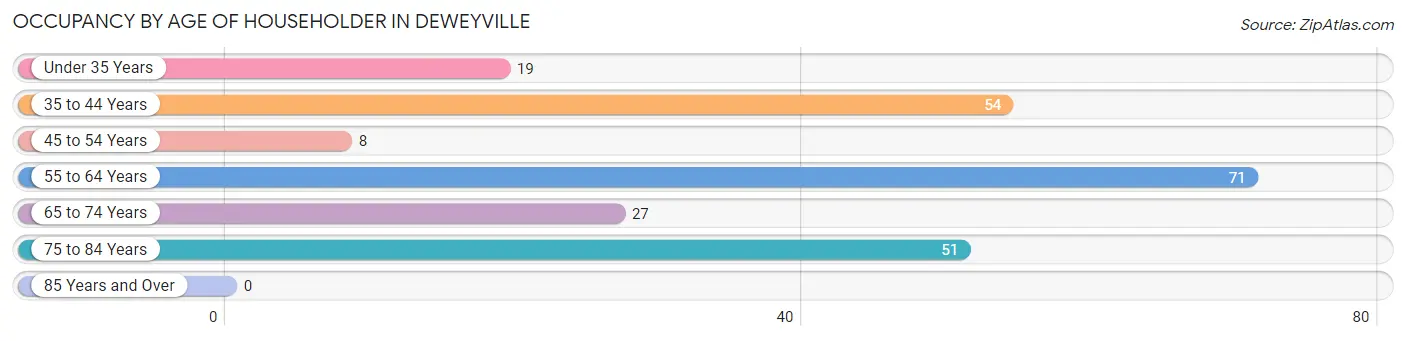
| Age Bracket | # Households | % Households |
| Under 35 Years | 19 | 8.3% |
| 35 to 44 Years | 54 | 23.5% |
| 45 to 54 Years | 8 | 3.5% |
| 55 to 64 Years | 71 | 30.9% |
| 65 to 74 Years | 27 | 11.7% |
| 75 to 84 Years | 51 | 22.2% |
| 85 Years and Over | 0 | 0.0% |
| Total | 230 | 100.0% |
Housing Finances in Deweyville
Median Income by Occupancy in Deweyville
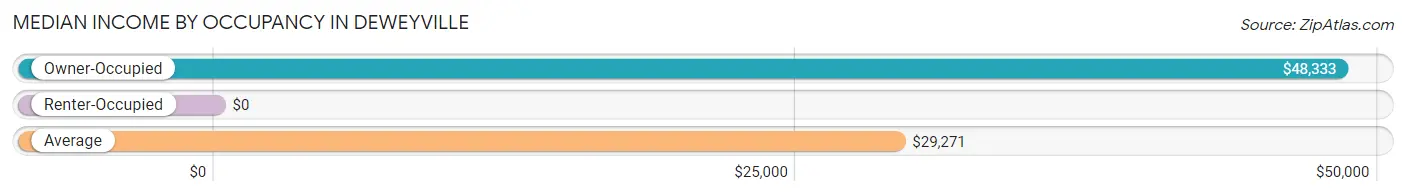
| Occupancy Type | # Households | Median Income |
| Owner-Occupied | 178 (77.4%) | $48,333 |
| Renter-Occupied | 52 (22.6%) | $0 |
| Average | 230 (100.0%) | $29,271 |
Occupancy by Householder Income Bracket in Deweyville
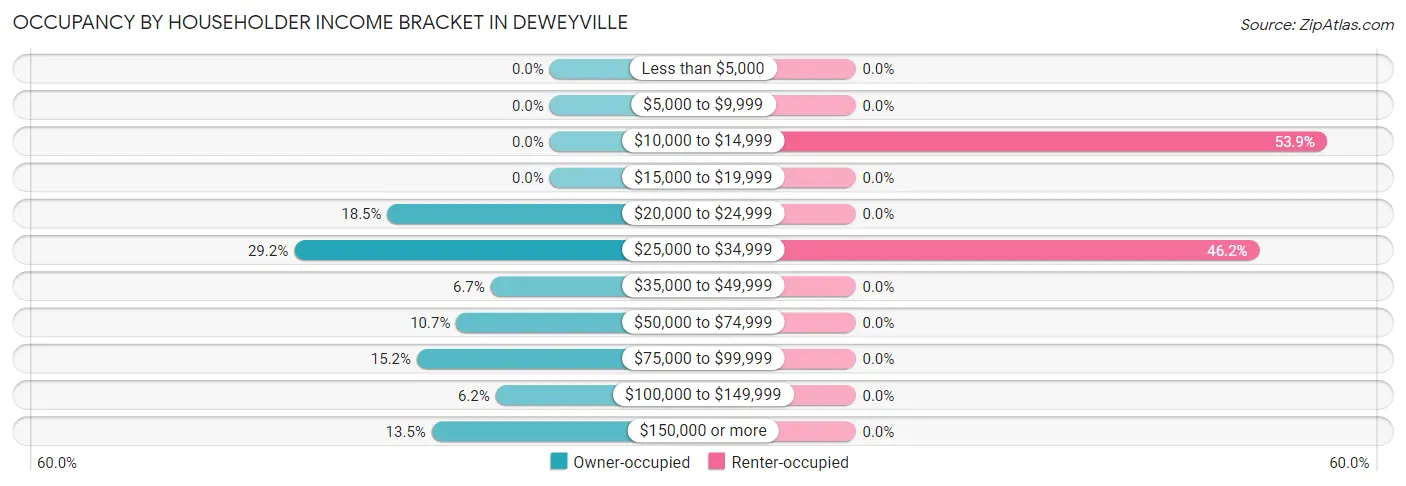
| Income Bracket | Owner-occupied | Renter-occupied |
| Less than $5,000 | 0 (0.0%) | 0 (0.0%) |
| $5,000 to $9,999 | 0 (0.0%) | 0 (0.0%) |
| $10,000 to $14,999 | 0 (0.0%) | 28 (53.8%) |
| $15,000 to $19,999 | 0 (0.0%) | 0 (0.0%) |
| $20,000 to $24,999 | 33 (18.5%) | 0 (0.0%) |
| $25,000 to $34,999 | 52 (29.2%) | 24 (46.2%) |
| $35,000 to $49,999 | 12 (6.7%) | 0 (0.0%) |
| $50,000 to $74,999 | 19 (10.7%) | 0 (0.0%) |
| $75,000 to $99,999 | 27 (15.2%) | 0 (0.0%) |
| $100,000 to $149,999 | 11 (6.2%) | 0 (0.0%) |
| $150,000 or more | 24 (13.5%) | 0 (0.0%) |
| Total | 178 (100.0%) | 52 (100.0%) |
Monthly Housing Cost Tiers in Deweyville
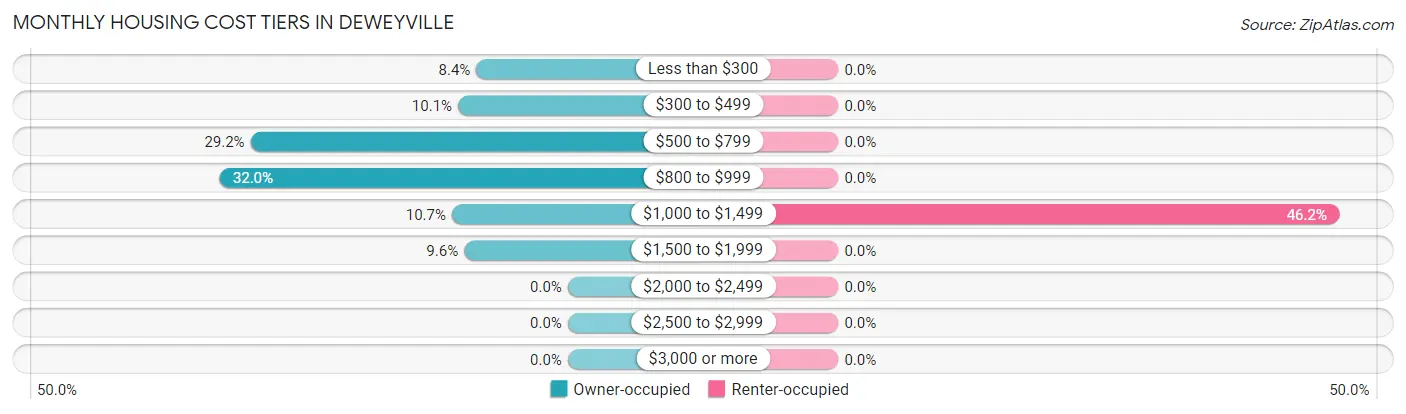
| Monthly Cost | Owner-occupied | Renter-occupied |
| Less than $300 | 15 (8.4%) | 0 (0.0%) |
| $300 to $499 | 18 (10.1%) | 0 (0.0%) |
| $500 to $799 | 52 (29.2%) | 0 (0.0%) |
| $800 to $999 | 57 (32.0%) | 0 (0.0%) |
| $1,000 to $1,499 | 19 (10.7%) | 24 (46.2%) |
| $1,500 to $1,999 | 17 (9.6%) | 0 (0.0%) |
| $2,000 to $2,499 | 0 (0.0%) | 0 (0.0%) |
| $2,500 to $2,999 | 0 (0.0%) | 0 (0.0%) |
| $3,000 or more | 0 (0.0%) | 0 (0.0%) |
| Total | 178 (100.0%) | 52 (100.0%) |
Physical Housing Characteristics in Deweyville
Housing Structures in Deweyville
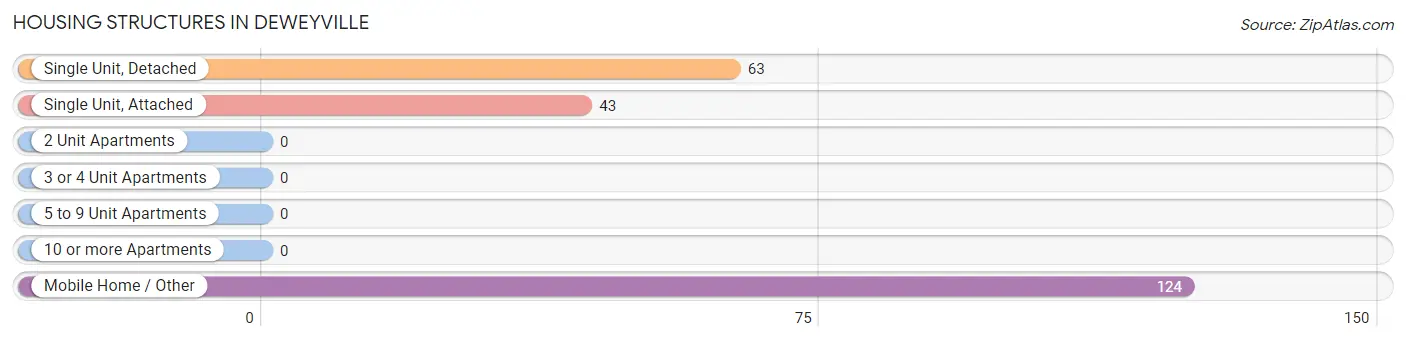
| Structure Type | # Housing Units | % Housing Units |
| Single Unit, Detached | 63 | 27.4% |
| Single Unit, Attached | 43 | 18.7% |
| 2 Unit Apartments | 0 | 0.0% |
| 3 or 4 Unit Apartments | 0 | 0.0% |
| 5 to 9 Unit Apartments | 0 | 0.0% |
| 10 or more Apartments | 0 | 0.0% |
| Mobile Home / Other | 124 | 53.9% |
| Total | 230 | 100.0% |
Housing Structures by Occupancy in Deweyville
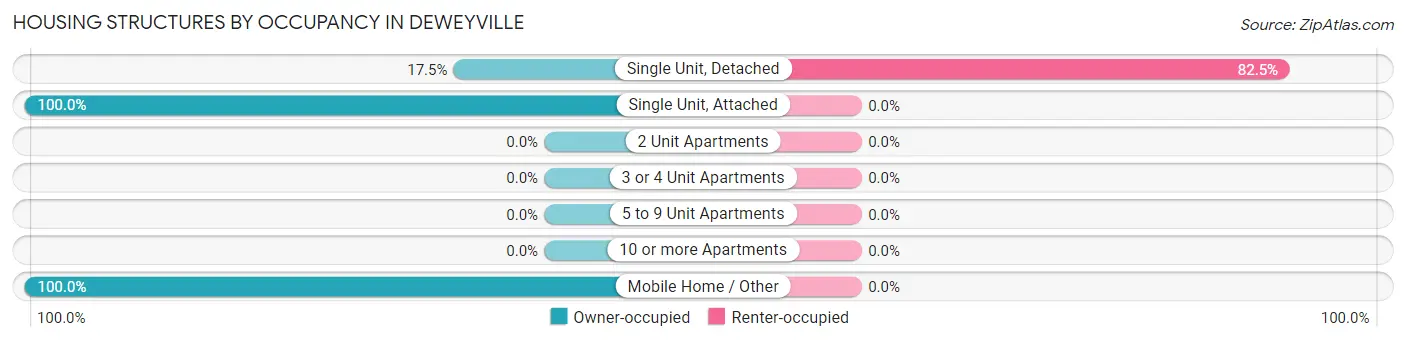
| Structure Type | Owner-occupied | Renter-occupied |
| Single Unit, Detached | 11 (17.5%) | 52 (82.5%) |
| Single Unit, Attached | 43 (100.0%) | 0 (0.0%) |
| 2 Unit Apartments | 0 (0.0%) | 0 (0.0%) |
| 3 or 4 Unit Apartments | 0 (0.0%) | 0 (0.0%) |
| 5 to 9 Unit Apartments | 0 (0.0%) | 0 (0.0%) |
| 10 or more Apartments | 0 (0.0%) | 0 (0.0%) |
| Mobile Home / Other | 124 (100.0%) | 0 (0.0%) |
| Total | 178 (77.4%) | 52 (22.6%) |
Housing Structures by Number of Rooms in Deweyville
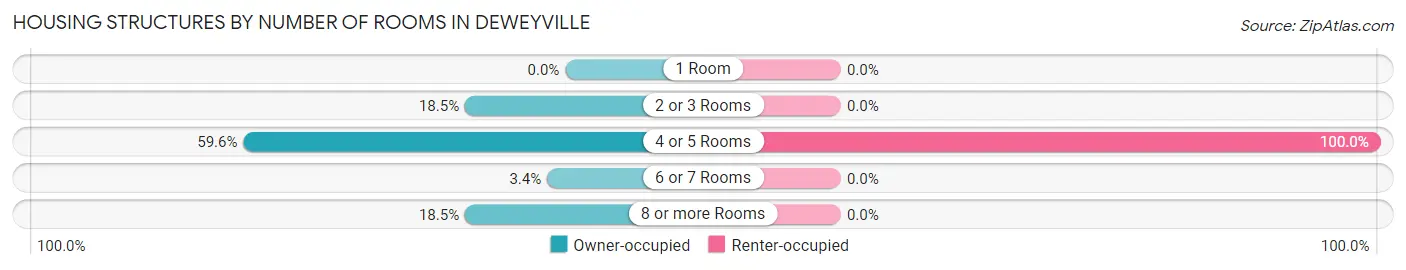
| Number of Rooms | Owner-occupied | Renter-occupied |
| 1 Room | 0 (0.0%) | 0 (0.0%) |
| 2 or 3 Rooms | 33 (18.5%) | 0 (0.0%) |
| 4 or 5 Rooms | 106 (59.6%) | 52 (100.0%) |
| 6 or 7 Rooms | 6 (3.4%) | 0 (0.0%) |
| 8 or more Rooms | 33 (18.5%) | 0 (0.0%) |
| Total | 178 (100.0%) | 52 (100.0%) |
Housing Structure by Heating Type in Deweyville
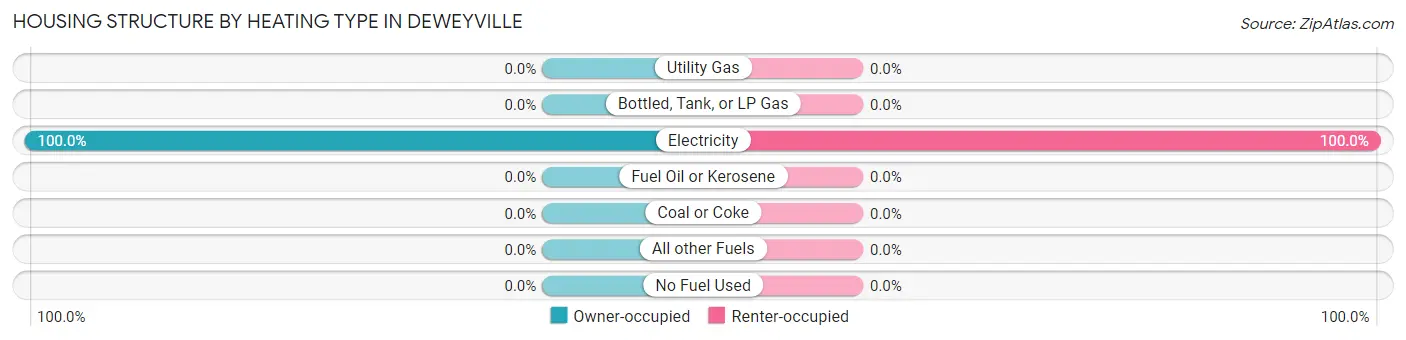
| Heating Type | Owner-occupied | Renter-occupied |
| Utility Gas | 0 (0.0%) | 0 (0.0%) |
| Bottled, Tank, or LP Gas | 0 (0.0%) | 0 (0.0%) |
| Electricity | 178 (100.0%) | 52 (100.0%) |
| Fuel Oil or Kerosene | 0 (0.0%) | 0 (0.0%) |
| Coal or Coke | 0 (0.0%) | 0 (0.0%) |
| All other Fuels | 0 (0.0%) | 0 (0.0%) |
| No Fuel Used | 0 (0.0%) | 0 (0.0%) |
| Total | 178 (100.0%) | 52 (100.0%) |
Household Vehicle Usage in Deweyville
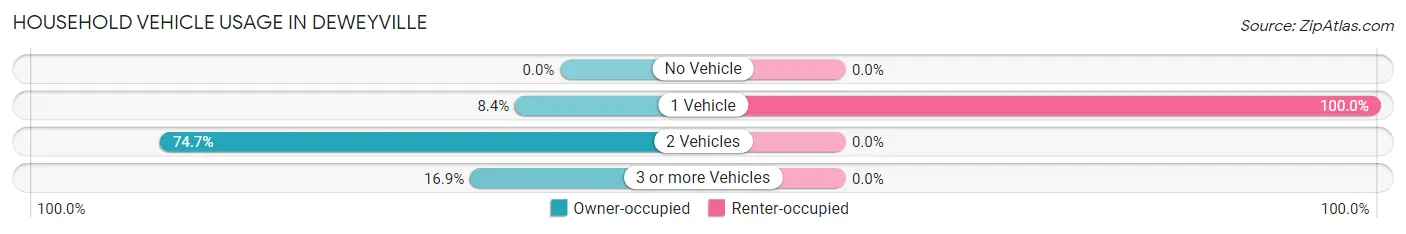
| Vehicles per Household | Owner-occupied | Renter-occupied |
| No Vehicle | 0 (0.0%) | 0 (0.0%) |
| 1 Vehicle | 15 (8.4%) | 52 (100.0%) |
| 2 Vehicles | 133 (74.7%) | 0 (0.0%) |
| 3 or more Vehicles | 30 (16.9%) | 0 (0.0%) |
| Total | 178 (100.0%) | 52 (100.0%) |
Real Estate & Mortgages in Deweyville
Real Estate and Mortgage Overview in Deweyville
| Characteristic | Without Mortgage | With Mortgage |
| Housing Units | 78 | 100 |
| Median Property Value | - | - |
| Median Household Income | - | - |
| Monthly Housing Costs | - | - |
| Real Estate Taxes | - | - |
Property Value by Mortgage Status in Deweyville
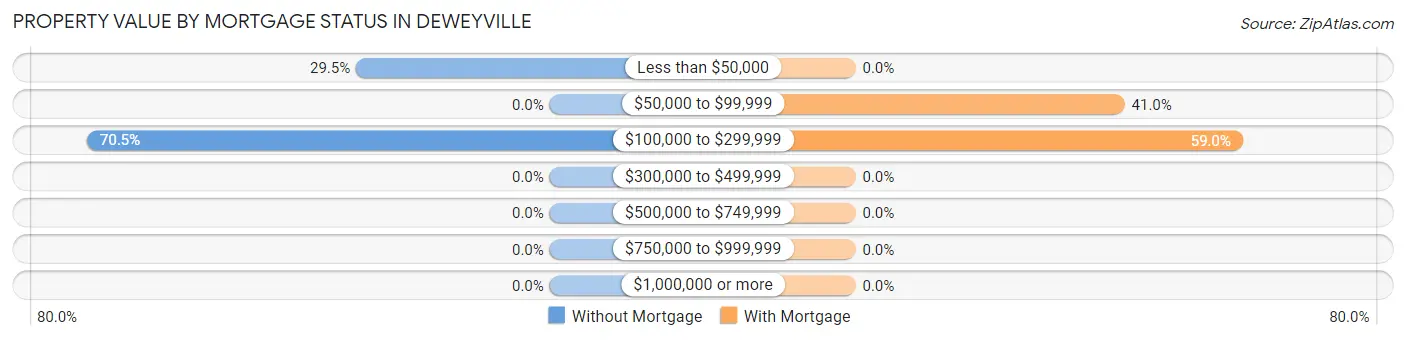
| Property Value | Without Mortgage | With Mortgage |
| Less than $50,000 | 23 (29.5%) | 0 (0.0%) |
| $50,000 to $99,999 | 0 (0.0%) | 41 (41.0%) |
| $100,000 to $299,999 | 55 (70.5%) | 59 (59.0%) |
| $300,000 to $499,999 | 0 (0.0%) | 0 (0.0%) |
| $500,000 to $749,999 | 0 (0.0%) | 0 (0.0%) |
| $750,000 to $999,999 | 0 (0.0%) | 0 (0.0%) |
| $1,000,000 or more | 0 (0.0%) | 0 (0.0%) |
| Total | 78 (100.0%) | 100 (100.0%) |
Household Income by Mortgage Status in Deweyville
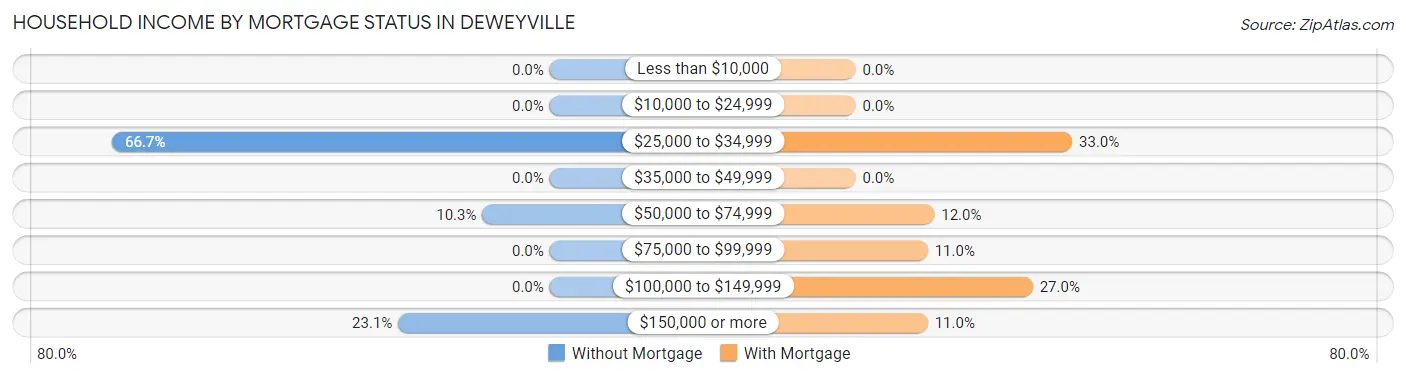
| Household Income | Without Mortgage | With Mortgage |
| Less than $10,000 | 0 (0.0%) | 0 (0.0%) |
| $10,000 to $24,999 | 0 (0.0%) | 0 (0.0%) |
| $25,000 to $34,999 | 52 (66.7%) | 33 (33.0%) |
| $35,000 to $49,999 | 0 (0.0%) | 0 (0.0%) |
| $50,000 to $74,999 | 8 (10.3%) | 12 (12.0%) |
| $75,000 to $99,999 | 0 (0.0%) | 11 (11.0%) |
| $100,000 to $149,999 | 0 (0.0%) | 27 (27.0%) |
| $150,000 or more | 18 (23.1%) | 11 (11.0%) |
| Total | 78 (100.0%) | 100 (100.0%) |
Property Value to Household Income Ratio in Deweyville
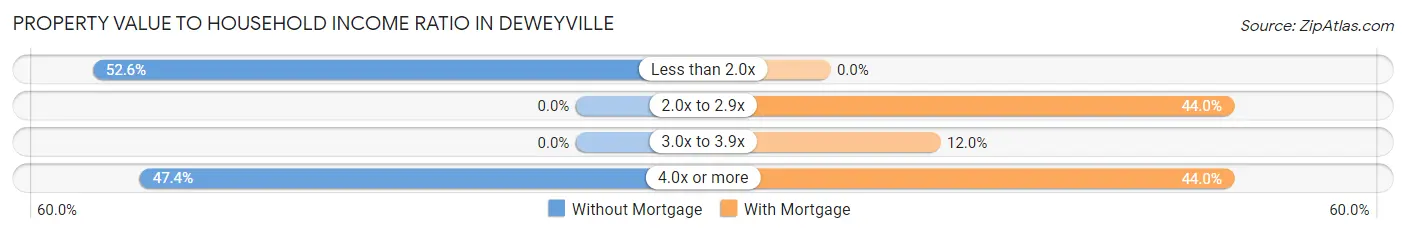
| Value-to-Income Ratio | Without Mortgage | With Mortgage |
| Less than 2.0x | 41 (52.6%) | 0 (0.0%) |
| 2.0x to 2.9x | 0 (0.0%) | 44 (44.0%) |
| 3.0x to 3.9x | 0 (0.0%) | 12 (12.0%) |
| 4.0x or more | 37 (47.4%) | 44 (44.0%) |
| Total | 78 (100.0%) | 100 (100.0%) |
Real Estate Taxes by Mortgage Status in Deweyville
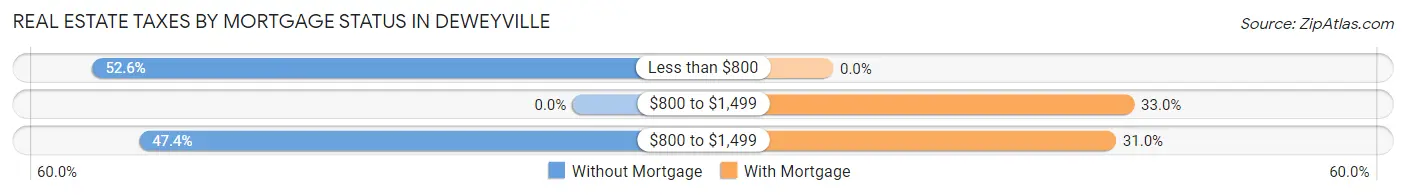
| Property Taxes | Without Mortgage | With Mortgage |
| Less than $800 | 41 (52.6%) | 0 (0.0%) |
| $800 to $1,499 | 0 (0.0%) | 33 (33.0%) |
| $800 to $1,499 | 37 (47.4%) | 31 (31.0%) |
| Total | 78 (100.0%) | 100 (100.0%) |
Health & Disability in Deweyville
Health Insurance Coverage by Age in Deweyville
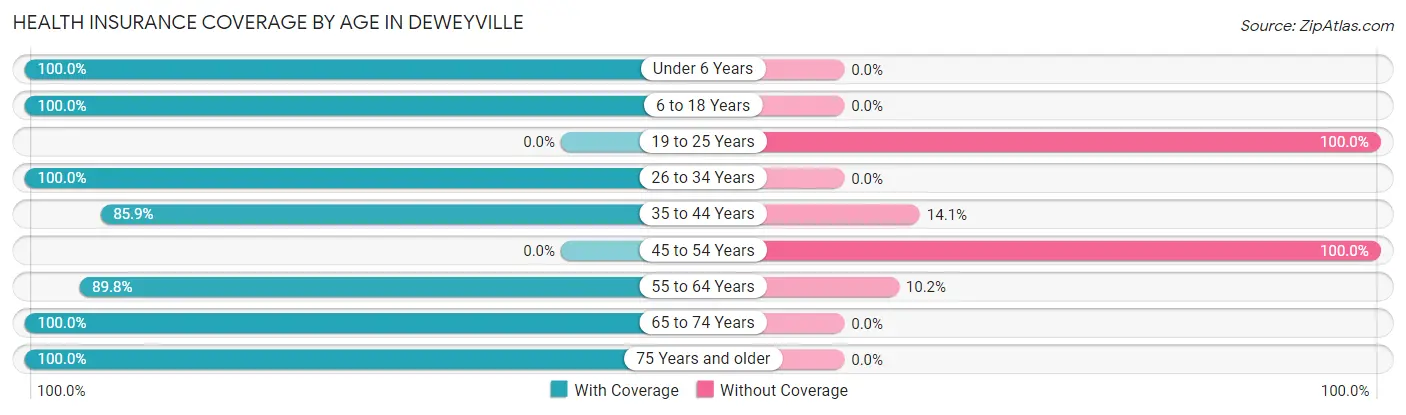
| Age Bracket | With Coverage | Without Coverage |
| Under 6 Years | 10 (100.0%) | 0 (0.0%) |
| 6 to 18 Years | 89 (100.0%) | 0 (0.0%) |
| 19 to 25 Years | 0 (0.0%) | 14 (100.0%) |
| 26 to 34 Years | 30 (100.0%) | 0 (0.0%) |
| 35 to 44 Years | 67 (85.9%) | 11 (14.1%) |
| 45 to 54 Years | 0 (0.0%) | 8 (100.0%) |
| 55 to 64 Years | 106 (89.8%) | 12 (10.2%) |
| 65 to 74 Years | 119 (100.0%) | 0 (0.0%) |
| 75 Years and older | 51 (100.0%) | 0 (0.0%) |
| Total | 472 (91.3%) | 45 (8.7%) |
Health Insurance Coverage by Citizenship Status in Deweyville
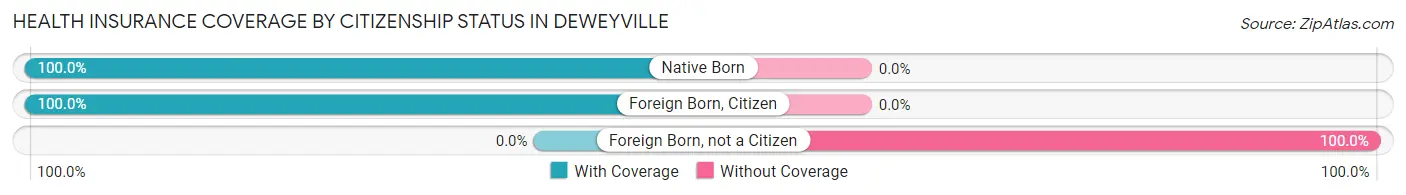
| Citizenship Status | With Coverage | Without Coverage |
| Native Born | 10 (100.0%) | 0 (0.0%) |
| Foreign Born, Citizen | 89 (100.0%) | 0 (0.0%) |
| Foreign Born, not a Citizen | 0 (0.0%) | 14 (100.0%) |
Health Insurance Coverage by Household Income in Deweyville
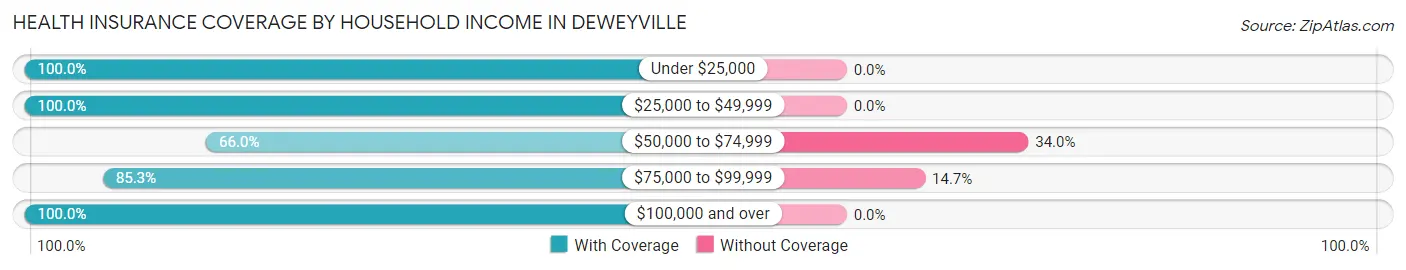
| Household Income | With Coverage | Without Coverage |
| Under $25,000 | 89 (100.0%) | 0 (0.0%) |
| $25,000 to $49,999 | 184 (100.0%) | 0 (0.0%) |
| $50,000 to $74,999 | 66 (66.0%) | 34 (34.0%) |
| $75,000 to $99,999 | 64 (85.3%) | 11 (14.7%) |
| $100,000 and over | 69 (100.0%) | 0 (0.0%) |
Public vs Private Health Insurance Coverage by Age in Deweyville
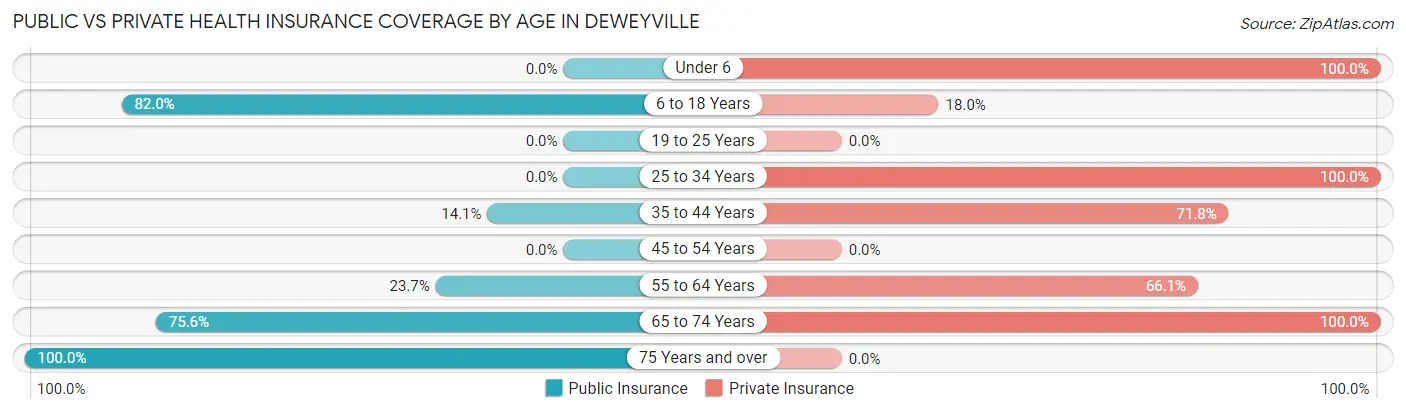
| Age Bracket | Public Insurance | Private Insurance |
| Under 6 | 0 (0.0%) | 10 (100.0%) |
| 6 to 18 Years | 73 (82.0%) | 16 (18.0%) |
| 19 to 25 Years | 0 (0.0%) | 0 (0.0%) |
| 25 to 34 Years | 0 (0.0%) | 30 (100.0%) |
| 35 to 44 Years | 11 (14.1%) | 56 (71.8%) |
| 45 to 54 Years | 0 (0.0%) | 0 (0.0%) |
| 55 to 64 Years | 28 (23.7%) | 78 (66.1%) |
| 65 to 74 Years | 90 (75.6%) | 119 (100.0%) |
| 75 Years and over | 51 (100.0%) | 0 (0.0%) |
| Total | 253 (48.9%) | 309 (59.8%) |
Disability Status by Sex by Age in Deweyville
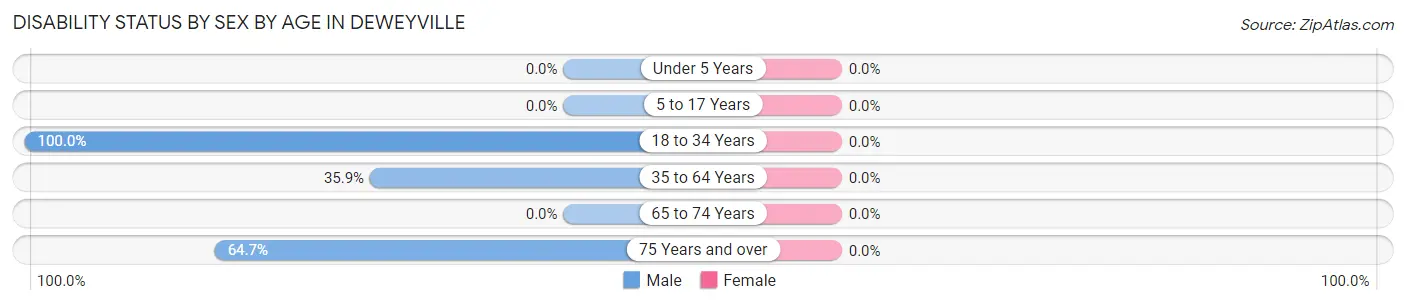
| Age Bracket | Male | Female |
| Under 5 Years | 0 (0.0%) | 0 (0.0%) |
| 5 to 17 Years | 0 (0.0%) | 0 (0.0%) |
| 18 to 34 Years | 19 (100.0%) | 0 (0.0%) |
| 35 to 64 Years | 28 (35.9%) | 0 (0.0%) |
| 65 to 74 Years | 0 (0.0%) | 0 (0.0%) |
| 75 Years and over | 33 (64.7%) | 0 (0.0%) |
Disability Class by Sex by Age in Deweyville
Disability Class: Hearing Difficulty

| Age Bracket | Male | Female |
| Under 5 Years | 0 (0.0%) | 0 (0.0%) |
| 5 to 17 Years | 0 (0.0%) | 0 (0.0%) |
| 18 to 34 Years | 19 (100.0%) | 0 (0.0%) |
| 35 to 64 Years | 0 (0.0%) | 0 (0.0%) |
| 65 to 74 Years | 0 (0.0%) | 0 (0.0%) |
| 75 Years and over | 0 (0.0%) | 0 (0.0%) |
Disability Class: Vision Difficulty
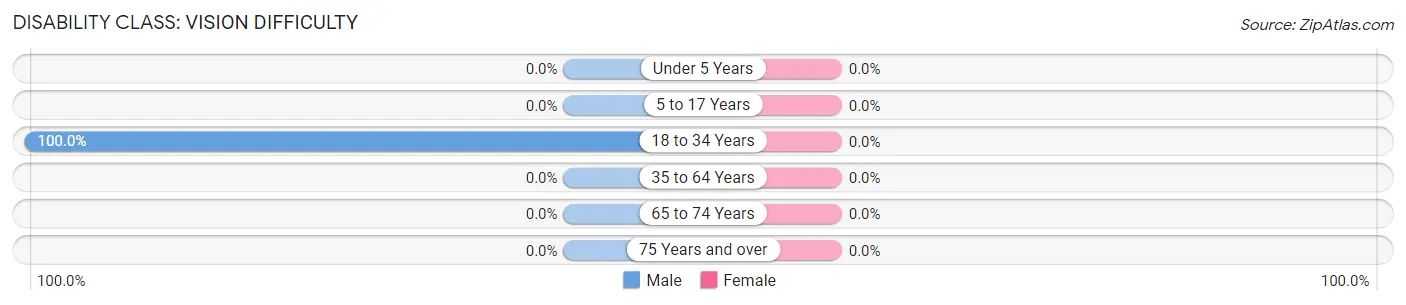
| Age Bracket | Male | Female |
| Under 5 Years | 0 (0.0%) | 0 (0.0%) |
| 5 to 17 Years | 0 (0.0%) | 0 (0.0%) |
| 18 to 34 Years | 19 (100.0%) | 0 (0.0%) |
| 35 to 64 Years | 0 (0.0%) | 0 (0.0%) |
| 65 to 74 Years | 0 (0.0%) | 0 (0.0%) |
| 75 Years and over | 0 (0.0%) | 0 (0.0%) |
Disability Class: Cognitive Difficulty
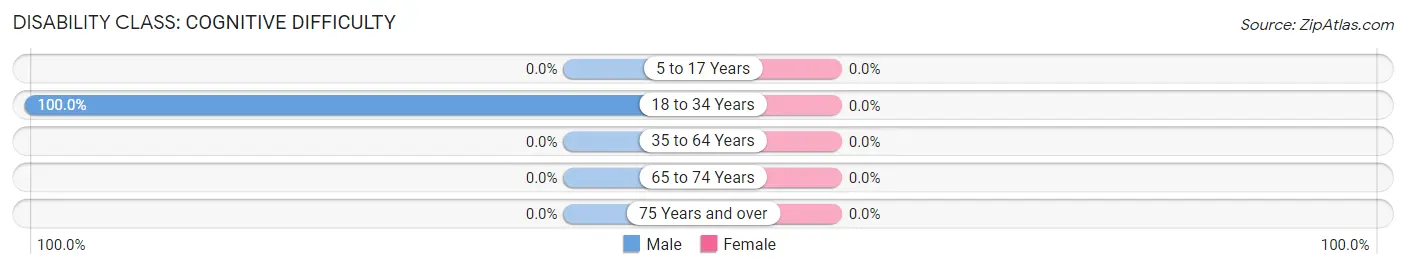
| Age Bracket | Male | Female |
| 5 to 17 Years | 0 (0.0%) | 0 (0.0%) |
| 18 to 34 Years | 19 (100.0%) | 0 (0.0%) |
| 35 to 64 Years | 0 (0.0%) | 0 (0.0%) |
| 65 to 74 Years | 0 (0.0%) | 0 (0.0%) |
| 75 Years and over | 0 (0.0%) | 0 (0.0%) |
Disability Class: Ambulatory Difficulty
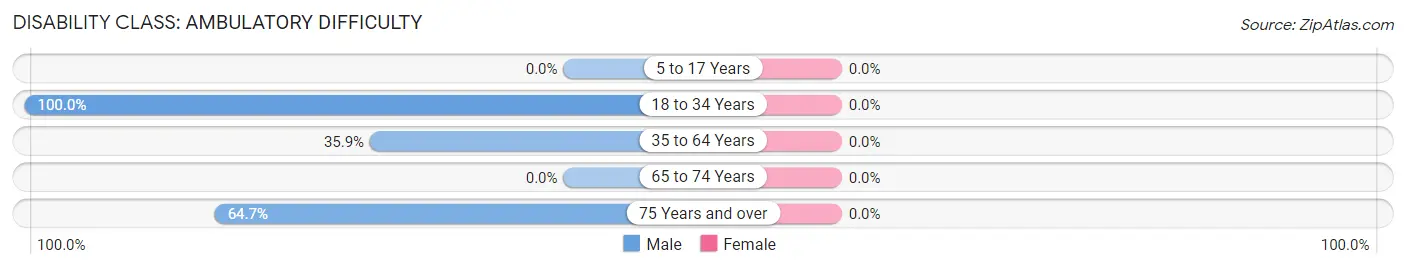
| Age Bracket | Male | Female |
| 5 to 17 Years | 0 (0.0%) | 0 (0.0%) |
| 18 to 34 Years | 19 (100.0%) | 0 (0.0%) |
| 35 to 64 Years | 28 (35.9%) | 0 (0.0%) |
| 65 to 74 Years | 0 (0.0%) | 0 (0.0%) |
| 75 Years and over | 33 (64.7%) | 0 (0.0%) |
Disability Class: Self-Care Difficulty
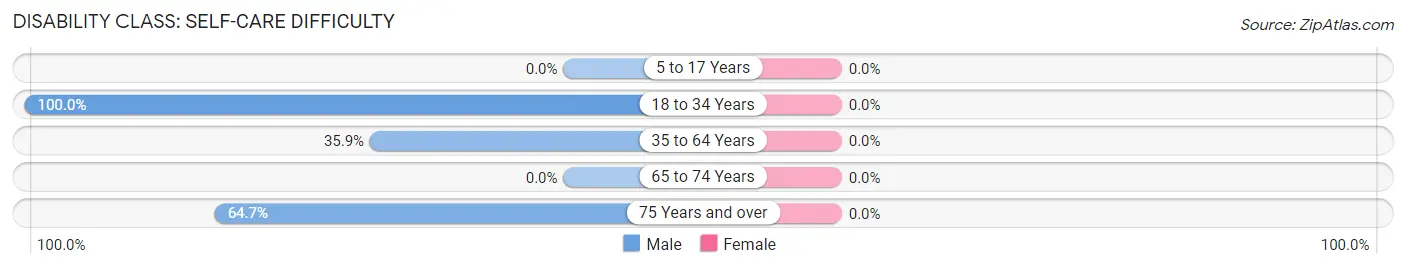
| Age Bracket | Male | Female |
| 5 to 17 Years | 0 (0.0%) | 0 (0.0%) |
| 18 to 34 Years | 19 (100.0%) | 0 (0.0%) |
| 35 to 64 Years | 28 (35.9%) | 0 (0.0%) |
| 65 to 74 Years | 0 (0.0%) | 0 (0.0%) |
| 75 Years and over | 33 (64.7%) | 0 (0.0%) |
Technology Access in Deweyville
Computing Device Access in Deweyville
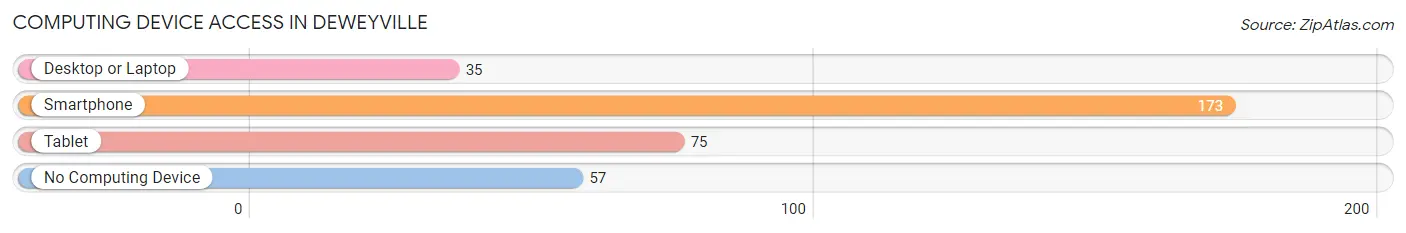
| Device Type | # Households | % Households |
| Desktop or Laptop | 35 | 15.2% |
| Smartphone | 173 | 75.2% |
| Tablet | 75 | 32.6% |
| No Computing Device | 57 | 24.8% |
| Total | 230 | 100.0% |
Internet Access in Deweyville
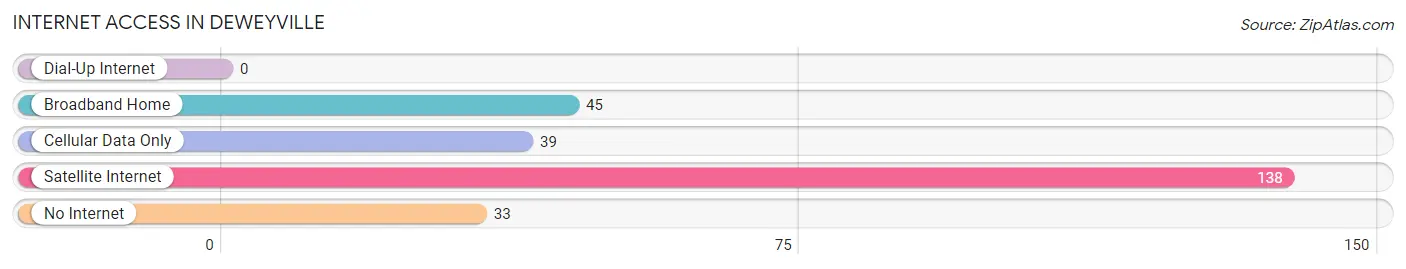
| Internet Type | # Households | % Households |
| Dial-Up Internet | 0 | 0.0% |
| Broadband Home | 45 | 19.6% |
| Cellular Data Only | 39 | 17.0% |
| Satellite Internet | 138 | 60.0% |
| No Internet | 33 | 14.3% |
| Total | 230 | 100.0% |
Deweyville Summary
Deweyville, Texas is a small unincorporated community located in Newton County, Texas. It is situated on the banks of the Sabine River, approximately 10 miles north of the Louisiana border. The population of Deweyville was estimated to be 1,092 in 2019.
History
Deweyville was founded in 1883 by William Dewey, a former Confederate soldier. He named the town after himself and established a post office in 1884. The town was originally located on the east side of the Sabine River, but was moved to the west side in 1891 due to flooding.
In the early 1900s, Deweyville was a thriving community with a population of over 500 people. The town had a cotton gin, a sawmill, a gristmill, a blacksmith shop, a general store, and a hotel. The town also had a school, churches, and a Masonic lodge.
In the 1920s, the town began to decline due to the Great Depression and the boll weevil infestation. The population decreased to around 200 people by the 1940s.
Geography
Deweyville is located in the southeastern corner of Newton County, Texas. It is situated on the west bank of the Sabine River, approximately 10 miles north of the Louisiana border. The town is surrounded by pine and hardwood forests, and is located near the Big Thicket National Preserve.
The climate in Deweyville is humid subtropical, with hot summers and mild winters. The average annual temperature is 68°F (20°C), and the average annual precipitation is 48 inches (122 cm).
Economy
The economy of Deweyville is largely based on agriculture and timber. The town is home to several farms and ranches, as well as a sawmill and a lumber yard. The town also has a few small businesses, including a convenience store, a gas station, and a restaurant.
Demographics
As of 2019, the population of Deweyville was estimated to be 1,092. The racial makeup of the town was 94.2% White, 2.7% African American, 0.7% Native American, 0.3% Asian, and 2.1% from other races. The median household income was $37,500, and the median home value was $90,000.
Conclusion
Deweyville, Texas is a small unincorporated community located in Newton County, Texas. It was founded in 1883 by William Dewey, a former Confederate soldier. The town is situated on the banks of the Sabine River, approximately 10 miles north of the Louisiana border. The economy of Deweyville is largely based on agriculture and timber, and the population was estimated to be 1,092 in 2019.
Common Questions
What is Per Capita Income in Deweyville?
Per Capita income in Deweyville is $24,442.
What is the Median Household income in Deweyville?
Median Household Income in Deweyville is $29,271.
What is Income or Wage Gap in Deweyville?
Income or Wage Gap in Deweyville is 64.2%.
Women in Deweyville earn 35.8 cents for every dollar earned by a man.
What is Inequality or Gini Index in Deweyville?
Inequality or Gini Index in Deweyville is 0.45.
What is the Total Population of Deweyville?
Total Population of Deweyville is 517.
What is the Total Male Population of Deweyville?
Total Male Population of Deweyville is 265.
What is the Total Female Population of Deweyville?
Total Female Population of Deweyville is 252.
What is the Ratio of Males per 100 Females in Deweyville?
There are 105.16 Males per 100 Females in Deweyville.
What is the Ratio of Females per 100 Males in Deweyville?
There are 95.09 Females per 100 Males in Deweyville.
What is the Median Population Age in Deweyville?
Median Population Age in Deweyville is 57.3 Years.
What is the Average Family Size in Deweyville
Average Family Size in Deweyville is 2.5 People.
What is the Average Household Size in Deweyville
Average Household Size in Deweyville is 2.2 People.
How Large is the Labor Force in Deweyville?
There are 219 People in the Labor Forcein in Deweyville.
What is the Percentage of People in the Labor Force in Deweyville?
49.7% of People are in the Labor Force in Deweyville.
What is the Unemployment Rate in Deweyville?
Unemployment Rate in Deweyville is 6.4%.