Crosby, TX Map & Demographics
Crosby Map
Crosby Overview
$30,930
PER CAPITA INCOME
$48,355
AVG FAMILY INCOME
$38,750
AVG HOUSEHOLD INCOME
43.2%
WAGE / INCOME GAP [ % ]
56.8¢/ $1
WAGE / INCOME GAP [ $ ]
0.47
INEQUALITY / GINI INDEX
2,064
TOTAL POPULATION
1,167
MALE POPULATION
897
FEMALE POPULATION
130.10
MALES / 100 FEMALES
76.86
FEMALES / 100 MALES
38.4
MEDIAN AGE
2.9
AVG FAMILY SIZE
2.1
AVG HOUSEHOLD SIZE
1,124
LABOR FORCE [ PEOPLE ]
65.6%
PERCENT IN LABOR FORCE
3.3%
UNEMPLOYMENT RATE
Crosby Zip Codes
Income in Crosby
Income Overview in Crosby
Per Capita Income in Crosby is $30,930, while median incomes of families and households are $48,355 and $38,750 respectively.
| Characteristic | Number | Measure |
| Per Capita Income | 2,064 | $30,930 |
| Median Family Income | 491 | $48,355 |
| Mean Family Income | 491 | $75,867 |
| Median Household Income | 994 | $38,750 |
| Mean Household Income | 994 | $64,065 |
| Income Deficit | 491 | $0 |
| Wage / Income Gap (%) | 2,064 | 43.18% |
| Wage / Income Gap ($) | 2,064 | 56.82¢ per $1 |
| Gini / Inequality Index | 2,064 | 0.47 |
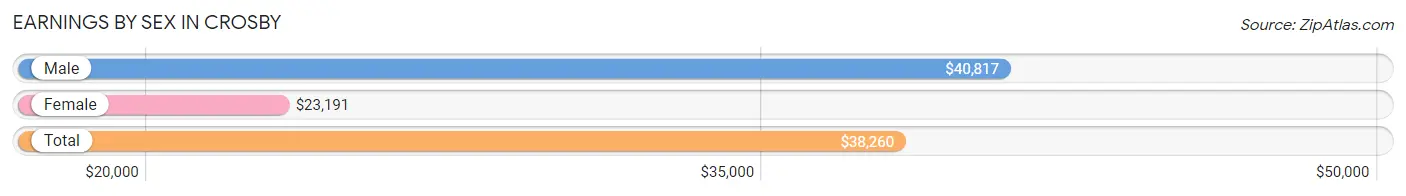
Earnings by Sex in Crosby
Average Earnings in Crosby are $38,260, $40,817 for men and $23,191 for women, a difference of 43.2%.
| Sex | Number | Average Earnings |
| Male | 778 (67.1%) | $40,817 |
| Female | 381 (32.9%) | $23,191 |
| Total | 1,159 (100.0%) | $38,260 |
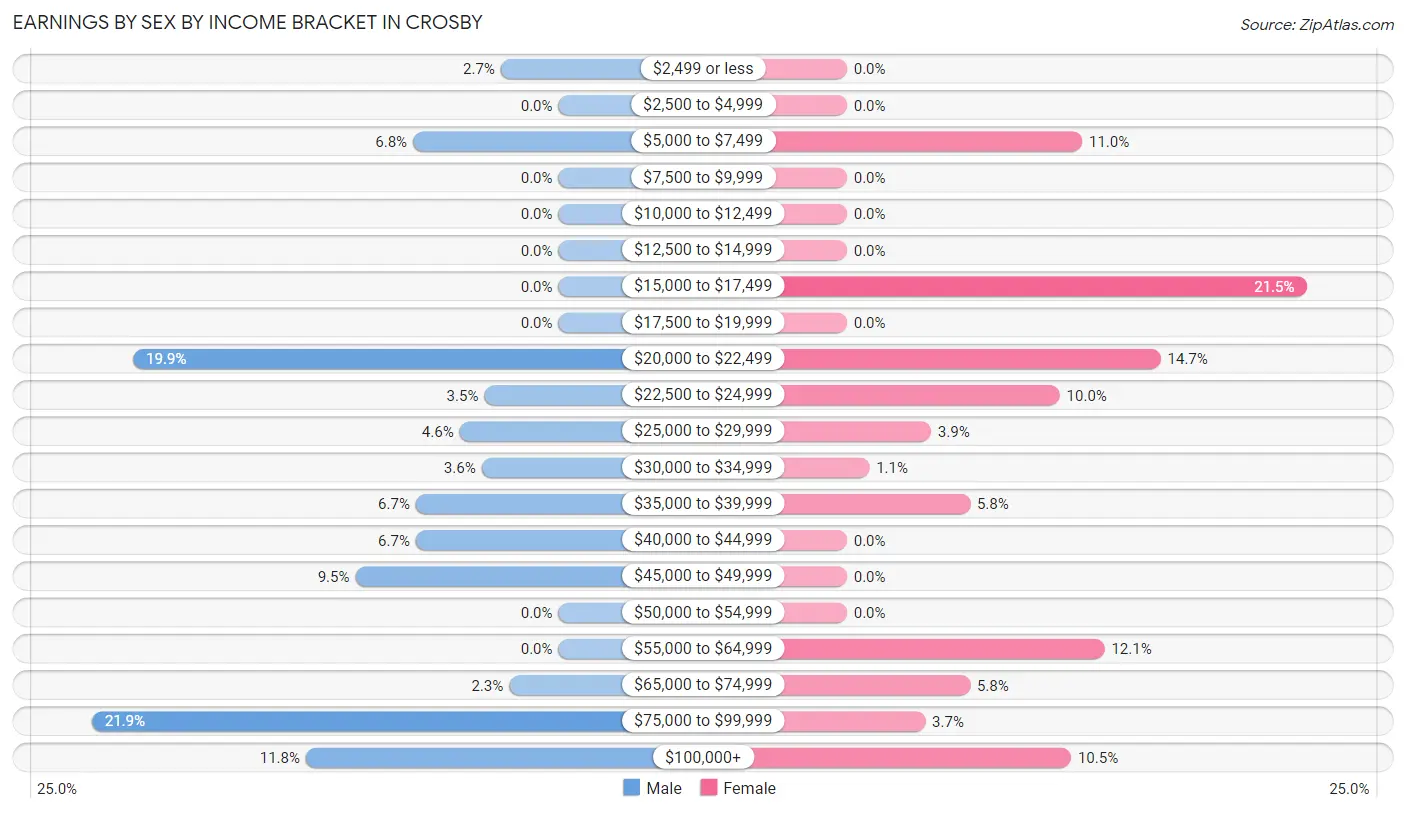
Earnings by Sex by Income Bracket in Crosby
The most common earnings brackets in Crosby are $75,000 to $99,999 for men (170 | 21.8%) and $15,000 to $17,499 for women (82 | 21.5%).
| Income | Male | Female |
| $2,499 or less | 21 (2.7%) | 0 (0.0%) |
| $2,500 to $4,999 | 0 (0.0%) | 0 (0.0%) |
| $5,000 to $7,499 | 53 (6.8%) | 42 (11.0%) |
| $7,500 to $9,999 | 0 (0.0%) | 0 (0.0%) |
| $10,000 to $12,499 | 0 (0.0%) | 0 (0.0%) |
| $12,500 to $14,999 | 0 (0.0%) | 0 (0.0%) |
| $15,000 to $17,499 | 0 (0.0%) | 82 (21.5%) |
| $17,500 to $19,999 | 0 (0.0%) | 0 (0.0%) |
| $20,000 to $22,499 | 155 (19.9%) | 56 (14.7%) |
| $22,500 to $24,999 | 27 (3.5%) | 38 (10.0%) |
| $25,000 to $29,999 | 36 (4.6%) | 15 (3.9%) |
| $30,000 to $34,999 | 28 (3.6%) | 4 (1.1%) |
| $35,000 to $39,999 | 52 (6.7%) | 22 (5.8%) |
| $40,000 to $44,999 | 52 (6.7%) | 0 (0.0%) |
| $45,000 to $49,999 | 74 (9.5%) | 0 (0.0%) |
| $50,000 to $54,999 | 0 (0.0%) | 0 (0.0%) |
| $55,000 to $64,999 | 0 (0.0%) | 46 (12.1%) |
| $65,000 to $74,999 | 18 (2.3%) | 22 (5.8%) |
| $75,000 to $99,999 | 170 (21.8%) | 14 (3.7%) |
| $100,000+ | 92 (11.8%) | 40 (10.5%) |
| Total | 778 (100.0%) | 381 (100.0%) |
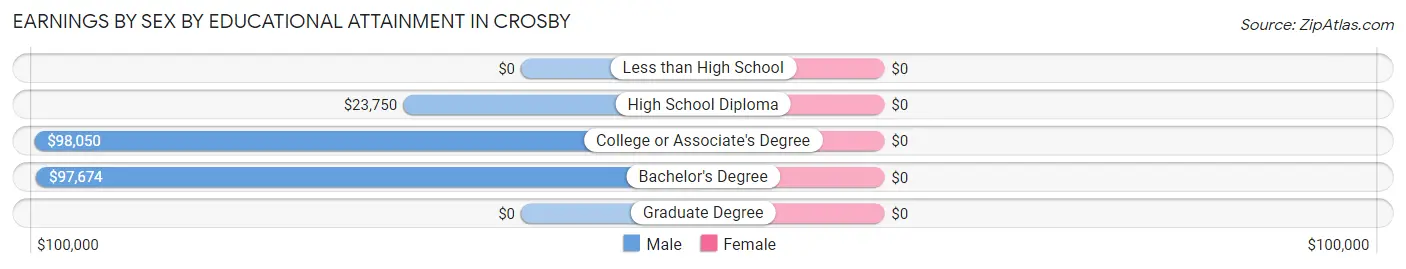
Earnings by Sex by Educational Attainment in Crosby
| Educational Attainment | Male Income | Female Income |
| Less than High School | - | - |
| High School Diploma | $23,750 | $0 |
| College or Associate's Degree | $98,050 | $0 |
| Bachelor's Degree | $97,674 | $0 |
| Graduate Degree | - | - |
| Total | $40,565 | $23,191 |
Family Income in Crosby
Family Income Brackets in Crosby
According to the Crosby family income data, there are 98 families falling into the $100,000 to $149,999 income range, which is the most common income bracket and makes up 20.0% of all families.
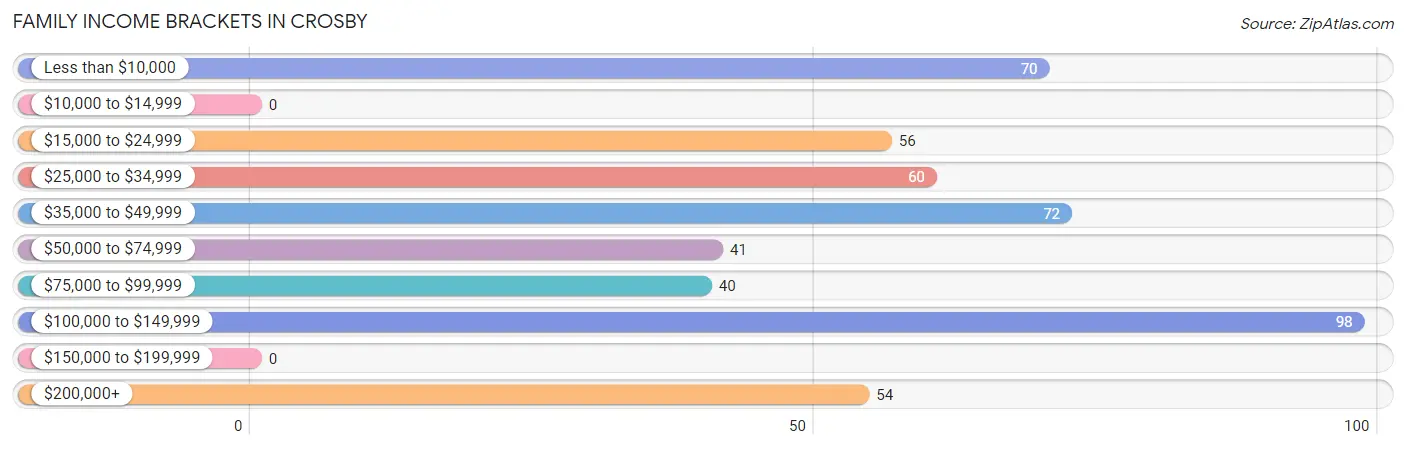
| Income Bracket | # Families | % Families |
| Less than $10,000 | 70 | 14.3% |
| $10,000 to $14,999 | 0 | 0.0% |
| $15,000 to $24,999 | 56 | 11.4% |
| $25,000 to $34,999 | 60 | 12.2% |
| $35,000 to $49,999 | 72 | 14.7% |
| $50,000 to $74,999 | 41 | 8.4% |
| $75,000 to $99,999 | 40 | 8.1% |
| $100,000 to $149,999 | 98 | 20.0% |
| $150,000 to $199,999 | 0 | 0.0% |
| $200,000+ | 54 | 11.0% |
Family Income by Famaliy Size in Crosby
2-person families (257 | 52.3%) account for the highest median family income in Crosby with $40,685 per family, while 2-person families (257 | 52.3%) have the highest median income of $20,342 per family member.
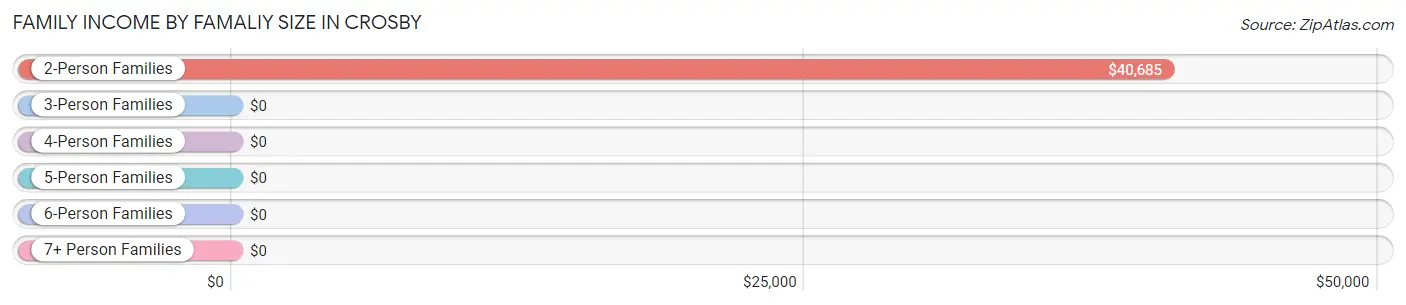
| Income Bracket | # Families | Median Income |
| 2-Person Families | 257 (52.3%) | $40,685 |
| 3-Person Families | 92 (18.7%) | $0 |
| 4-Person Families | 112 (22.8%) | $0 |
| 5-Person Families | 30 (6.1%) | $0 |
| 6-Person Families | 0 (0.0%) | $0 |
| 7+ Person Families | 0 (0.0%) | $0 |
| Total | 491 (100.0%) | $48,355 |
Family Income by Number of Earners in Crosby
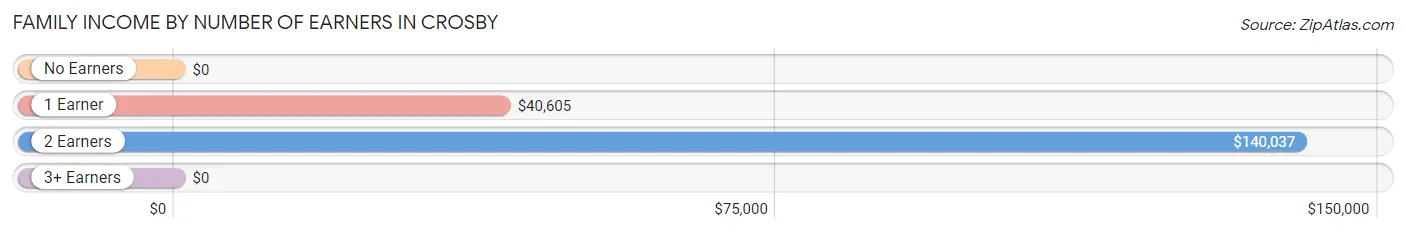
| Number of Earners | # Families | Median Income |
| No Earners | 84 (17.1%) | $0 |
| 1 Earner | 205 (41.7%) | $40,605 |
| 2 Earners | 175 (35.6%) | $140,037 |
| 3+ Earners | 27 (5.5%) | $0 |
| Total | 491 (100.0%) | $48,355 |
Household Income in Crosby
Household Income Brackets in Crosby
With 224 households falling in the category, the $15,000 to $24,999 income range is the most frequent in Crosby, accounting for 22.5% of all households.
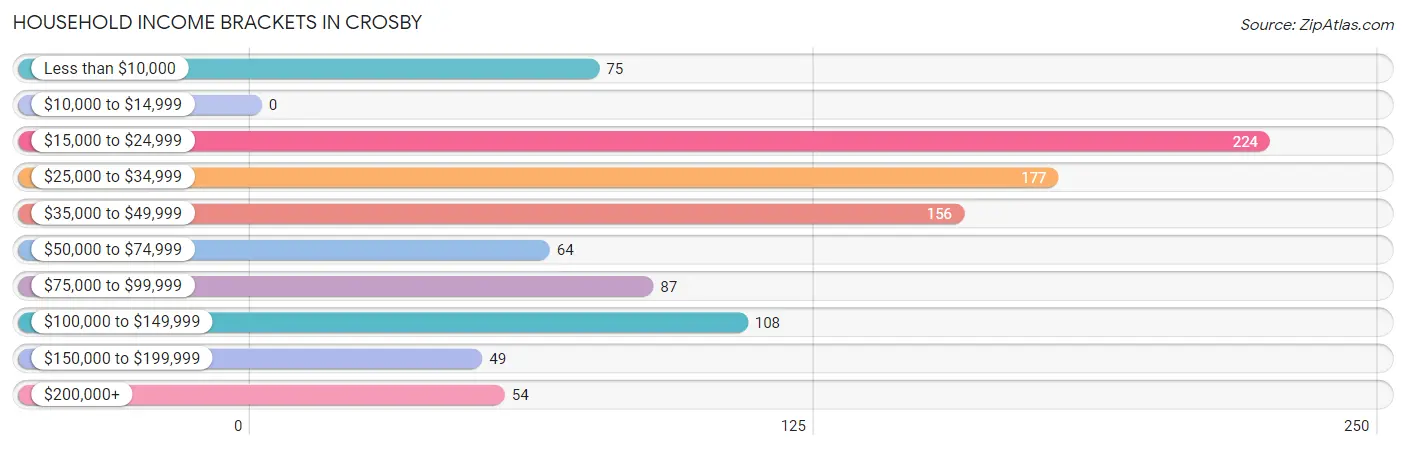
| Income Bracket | # Households | % Households |
| Less than $10,000 | 75 | 7.5% |
| $10,000 to $14,999 | 0 | 0.0% |
| $15,000 to $24,999 | 224 | 22.5% |
| $25,000 to $34,999 | 177 | 17.8% |
| $35,000 to $49,999 | 156 | 15.7% |
| $50,000 to $74,999 | 64 | 6.4% |
| $75,000 to $99,999 | 87 | 8.8% |
| $100,000 to $149,999 | 108 | 10.9% |
| $150,000 to $199,999 | 49 | 4.9% |
| $200,000+ | 54 | 5.4% |
Household Income by Householder Age in Crosby
The median household income in Crosby is $38,750, with the highest median household income of $95,741 found in the 45 to 64 years age bracket for the primary householder. A total of 334 households (33.6%) fall into this category. Meanwhile, the 15 to 24 years age bracket for the primary householder has the lowest median household income of $0, with 39 households (3.9%) in this group.
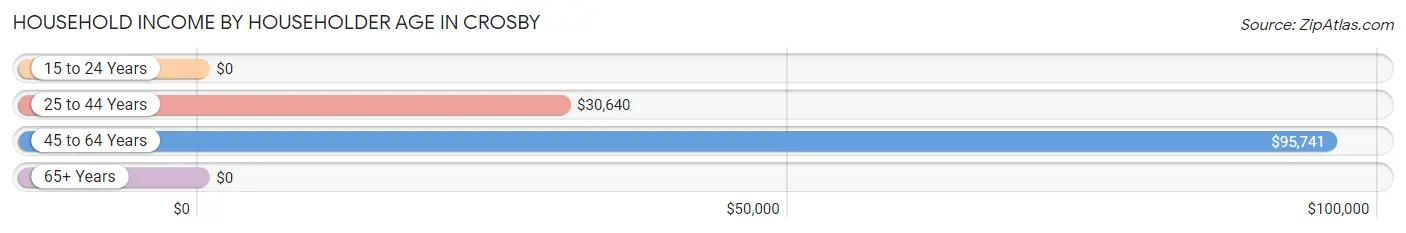
| Income Bracket | # Households | Median Income |
| 15 to 24 Years | 39 (3.9%) | $0 |
| 25 to 44 Years | 460 (46.3%) | $30,640 |
| 45 to 64 Years | 334 (33.6%) | $95,741 |
| 65+ Years | 161 (16.2%) | $0 |
| Total | 994 (100.0%) | $38,750 |
Poverty in Crosby
Income Below Poverty by Sex and Age in Crosby
With 16.7% poverty level for males and 33.7% for females among the residents of Crosby, 16 and 17 year old males and 18 to 24 year old females are the most vulnerable to poverty, with 21 males (100.0%) and 70 females (100.0%) in their respective age groups living below the poverty level.
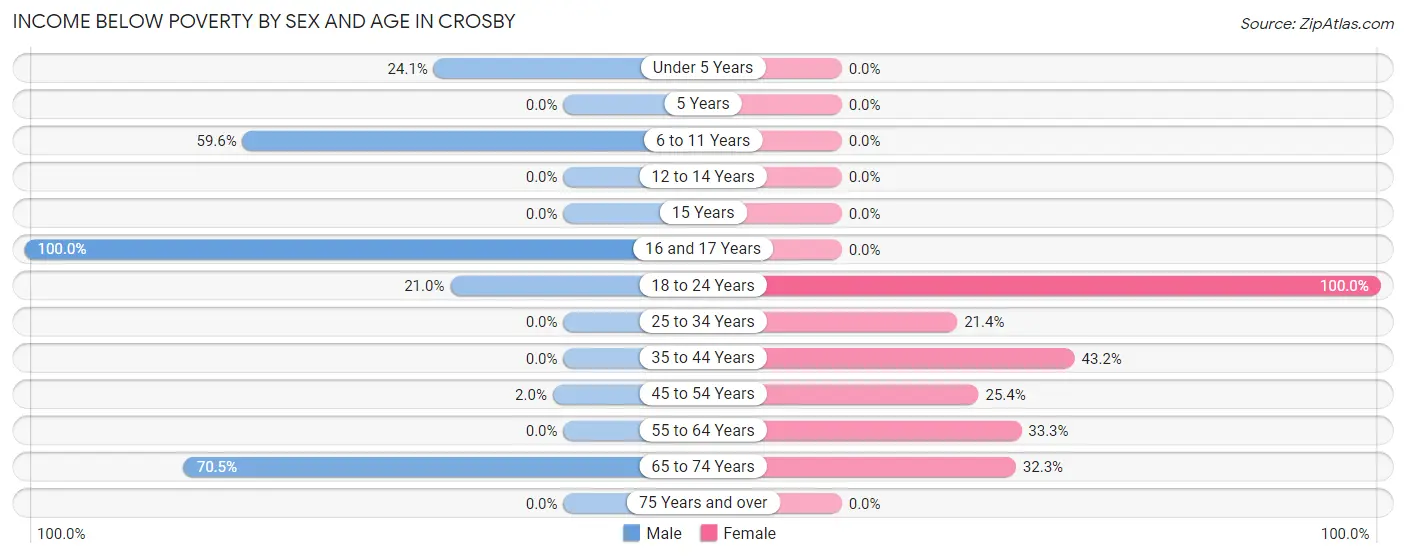
| Age Bracket | Male | Female |
| Under 5 Years | 13 (24.1%) | 0 (0.0%) |
| 5 Years | 0 (0.0%) | 0 (0.0%) |
| 6 to 11 Years | 106 (59.6%) | 0 (0.0%) |
| 12 to 14 Years | 0 (0.0%) | 0 (0.0%) |
| 15 Years | 0 (0.0%) | 0 (0.0%) |
| 16 and 17 Years | 21 (100.0%) | 0 (0.0%) |
| 18 to 24 Years | 21 (21.0%) | 70 (100.0%) |
| 25 to 34 Years | 0 (0.0%) | 12 (21.4%) |
| 35 to 44 Years | 0 (0.0%) | 86 (43.2%) |
| 45 to 54 Years | 3 (2.0%) | 50 (25.4%) |
| 55 to 64 Years | 0 (0.0%) | 31 (33.3%) |
| 65 to 74 Years | 31 (70.5%) | 53 (32.3%) |
| 75 Years and over | 0 (0.0%) | 0 (0.0%) |
| Total | 195 (16.7%) | 302 (33.7%) |
Income Above Poverty by Sex and Age in Crosby
According to the poverty statistics in Crosby, males aged 12 to 14 years and females aged under 5 years are the age groups that are most secure financially, with 100.0% of males and 100.0% of females in these age groups living above the poverty line.
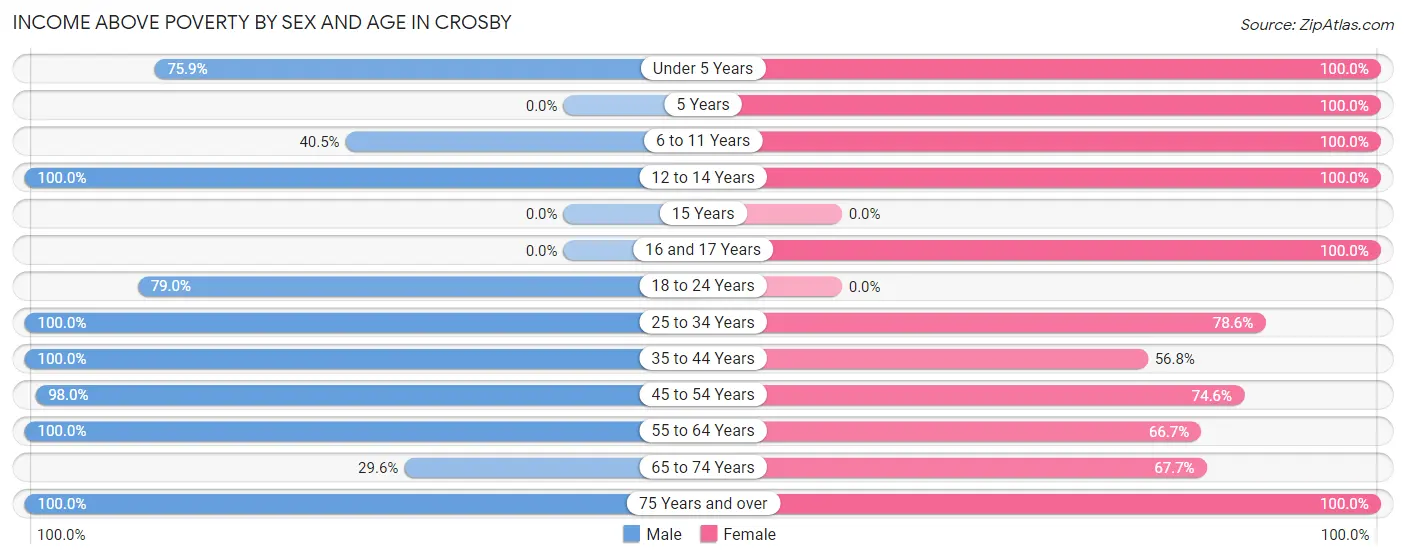
| Age Bracket | Male | Female |
| Under 5 Years | 41 (75.9%) | 28 (100.0%) |
| 5 Years | 0 (0.0%) | 14 (100.0%) |
| 6 to 11 Years | 72 (40.5%) | 3 (100.0%) |
| 12 to 14 Years | 38 (100.0%) | 35 (100.0%) |
| 15 Years | 0 (0.0%) | 0 (0.0%) |
| 16 and 17 Years | 0 (0.0%) | 24 (100.0%) |
| 18 to 24 Years | 79 (79.0%) | 0 (0.0%) |
| 25 to 34 Years | 135 (100.0%) | 44 (78.6%) |
| 35 to 44 Years | 314 (100.0%) | 113 (56.8%) |
| 45 to 54 Years | 149 (98.0%) | 147 (74.6%) |
| 55 to 64 Years | 121 (100.0%) | 62 (66.7%) |
| 65 to 74 Years | 13 (29.5%) | 111 (67.7%) |
| 75 Years and over | 10 (100.0%) | 14 (100.0%) |
| Total | 972 (83.3%) | 595 (66.3%) |
Income Below Poverty Among Married-Couple Families in Crosby
The poverty statistics for married-couple families in Crosby show that 6.3% or 18 of the total 287 families live below the poverty line. Families with no children have the highest poverty rate of 9.0%, comprising of 18 families. On the other hand, families with 1 or 2 children have the lowest poverty rate of 0.0%, which includes 0 families.
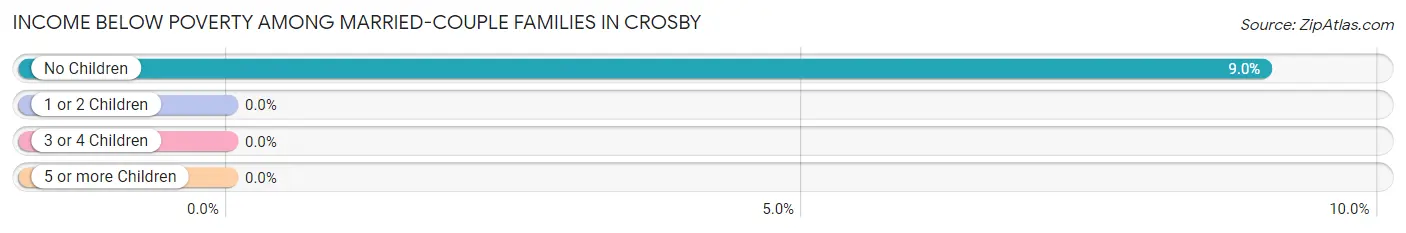
| Children | Above Poverty | Below Poverty |
| No Children | 182 (91.0%) | 18 (9.0%) |
| 1 or 2 Children | 72 (100.0%) | 0 (0.0%) |
| 3 or 4 Children | 15 (100.0%) | 0 (0.0%) |
| 5 or more Children | 0 (0.0%) | 0 (0.0%) |
| Total | 269 (93.7%) | 18 (6.3%) |
Income Below Poverty Among Single-Parent Households in Crosby
According to the poverty data in Crosby, 30.8% or 16 single-father households and 63.2% or 96 single-mother households are living below the poverty line. Among single-father households, those with 1 or 2 children have the highest poverty rate, with 16 households (100.0%) experiencing poverty. Likewise, among single-mother households, those with 3 or 4 children have the highest poverty rate, with 4 households (100.0%) falling below the poverty line.
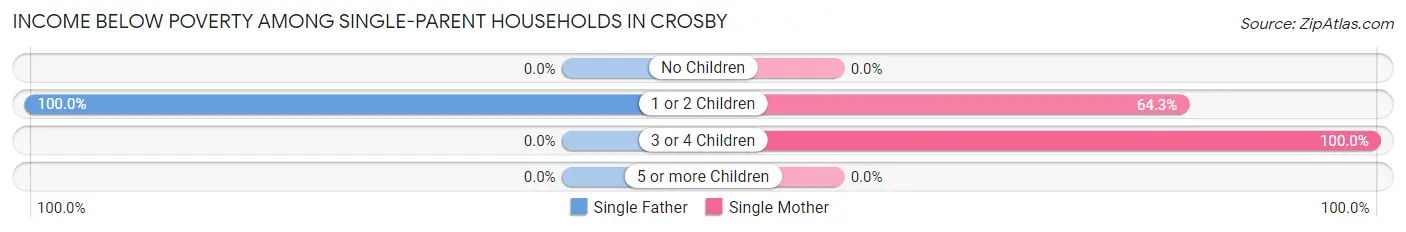
| Children | Single Father | Single Mother |
| No Children | 0 (0.0%) | 0 (0.0%) |
| 1 or 2 Children | 16 (100.0%) | 92 (64.3%) |
| 3 or 4 Children | 0 (0.0%) | 4 (100.0%) |
| 5 or more Children | 0 (0.0%) | 0 (0.0%) |
| Total | 16 (30.8%) | 96 (63.2%) |
Income Below Poverty Among Married-Couple vs Single-Parent Households in Crosby
The poverty data for Crosby shows that 18 of the married-couple family households (6.3%) and 112 of the single-parent households (54.9%) are living below the poverty level. Within the married-couple family households, those with no children have the highest poverty rate, with 18 households (9.0%) falling below the poverty line. Among the single-parent households, those with 3 or 4 children have the highest poverty rate, with 4 household (100.0%) living below poverty.
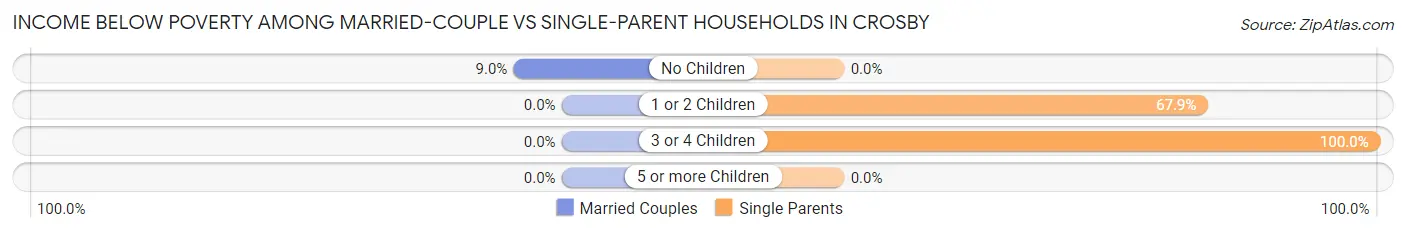
| Children | Married-Couple Families | Single-Parent Households |
| No Children | 18 (9.0%) | 0 (0.0%) |
| 1 or 2 Children | 0 (0.0%) | 108 (67.9%) |
| 3 or 4 Children | 0 (0.0%) | 4 (100.0%) |
| 5 or more Children | 0 (0.0%) | 0 (0.0%) |
| Total | 18 (6.3%) | 112 (54.9%) |
Race in Crosby
The most populous races in Crosby are White / Caucasian (1,405 | 68.1%), Hispanic or Latino (592 | 28.7%), and Black / African American (214 | 10.4%).
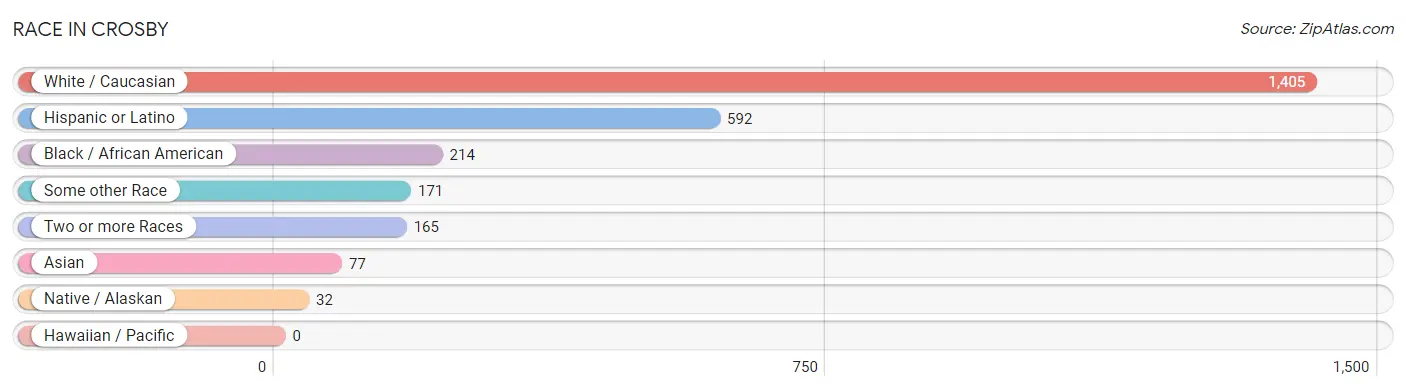
| Race | # Population | % Population |
| Asian | 77 | 3.7% |
| Black / African American | 214 | 10.4% |
| Hawaiian / Pacific | 0 | 0.0% |
| Hispanic or Latino | 592 | 28.7% |
| Native / Alaskan | 32 | 1.5% |
| White / Caucasian | 1,405 | 68.1% |
| Two or more Races | 165 | 8.0% |
| Some other Race | 171 | 8.3% |
| Total | 2,064 | 100.0% |
Ancestry in Crosby
The most populous ancestries reported in Crosby are Mexican (419 | 20.3%), American (147 | 7.1%), German (132 | 6.4%), African (129 | 6.2%), and Subsaharan African (129 | 6.2%), together accounting for 46.3% of all Crosby residents.
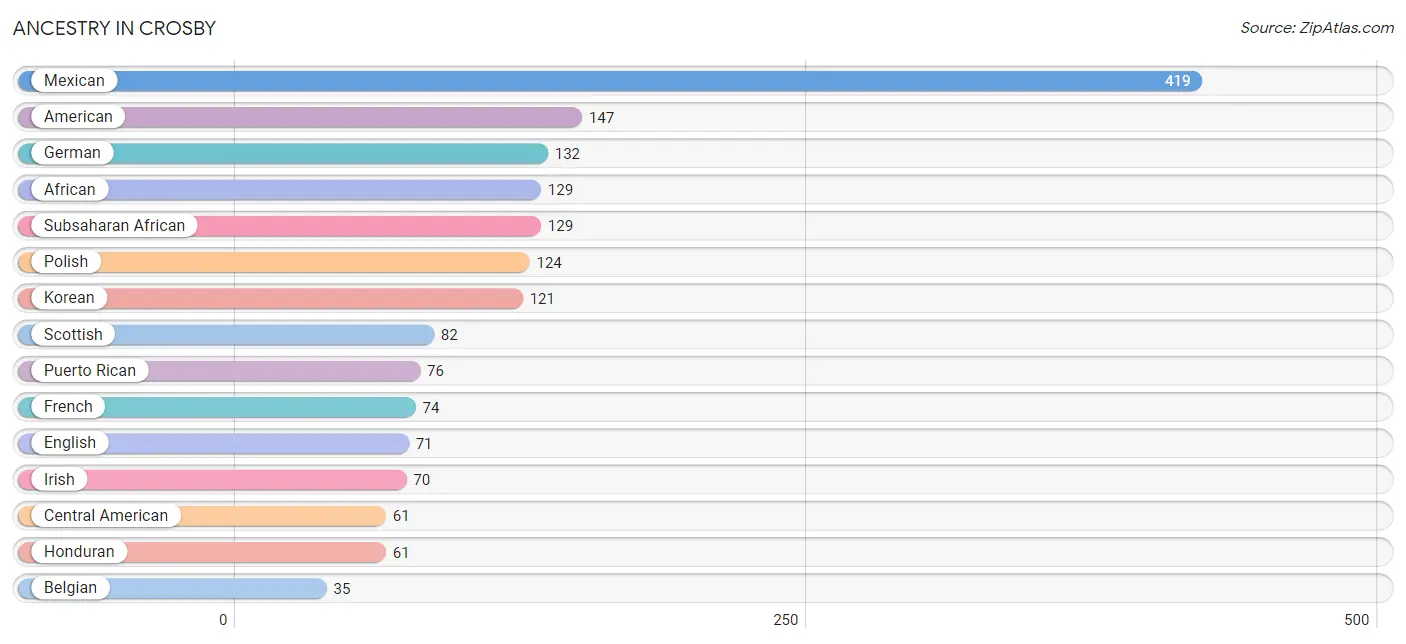
| Ancestry | # Population | % Population |
| African | 129 | 6.2% |
| American | 147 | 7.1% |
| Belgian | 35 | 1.7% |
| Central American | 61 | 3.0% |
| Czech | 10 | 0.5% |
| English | 71 | 3.4% |
| French | 74 | 3.6% |
| German | 132 | 6.4% |
| Honduran | 61 | 3.0% |
| Hungarian | 28 | 1.4% |
| Irish | 70 | 3.4% |
| Italian | 18 | 0.9% |
| Korean | 121 | 5.9% |
| Mexican | 419 | 20.3% |
| Polish | 124 | 6.0% |
| Puerto Rican | 76 | 3.7% |
| Scotch-Irish | 3 | 0.2% |
| Scottish | 82 | 4.0% |
| Subsaharan African | 129 | 6.2% |
| Thai | 32 | 1.5% | View All 20 Rows |
Immigrants in Crosby
The most numerous immigrant groups reported in Crosby came from Central America (134 | 6.5%), Latin America (134 | 6.5%), Mexico (134 | 6.5%), Asia (34 | 1.7%), and India (32 | 1.5%), together accounting for 22.7% of all Crosby residents.
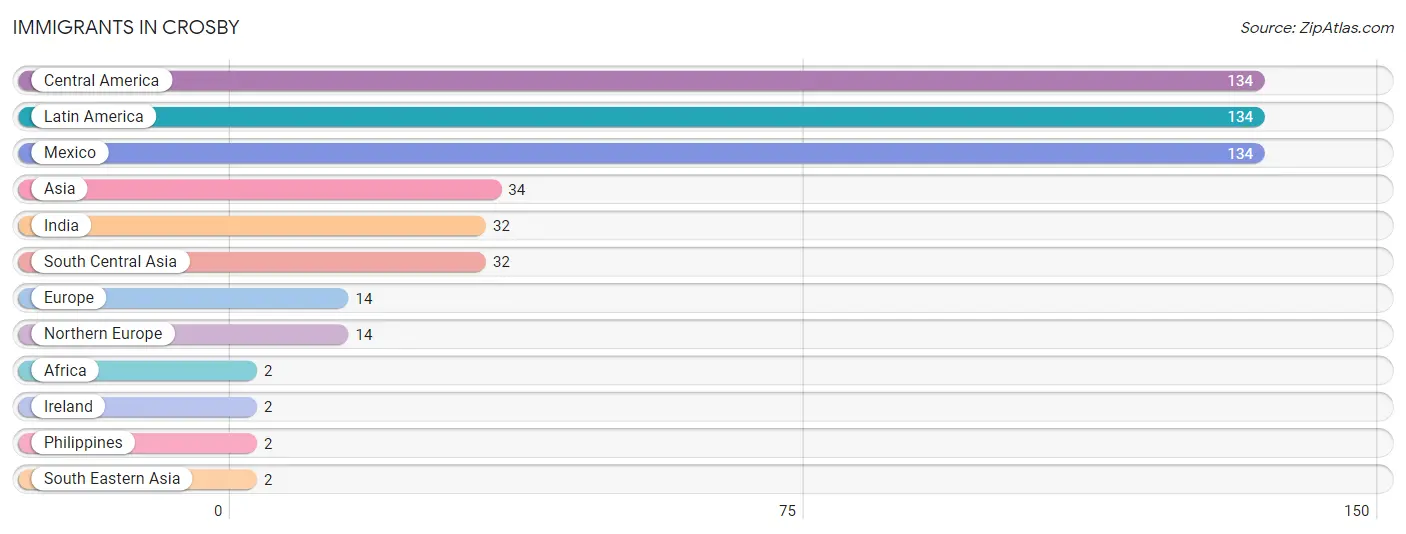
| Immigration Origin | # Population | % Population |
| Africa | 2 | 0.1% |
| Asia | 34 | 1.7% |
| Central America | 134 | 6.5% |
| Europe | 14 | 0.7% |
| India | 32 | 1.5% |
| Ireland | 2 | 0.1% |
| Latin America | 134 | 6.5% |
| Mexico | 134 | 6.5% |
| Northern Europe | 14 | 0.7% |
| Philippines | 2 | 0.1% |
| South Central Asia | 32 | 1.5% |
| South Eastern Asia | 2 | 0.1% | View All 12 Rows |
Sex and Age in Crosby
Sex and Age in Crosby
The most populous age groups in Crosby are 35 to 39 Years (248 | 21.2%) for men and 45 to 49 Years (165 | 18.4%) for women.
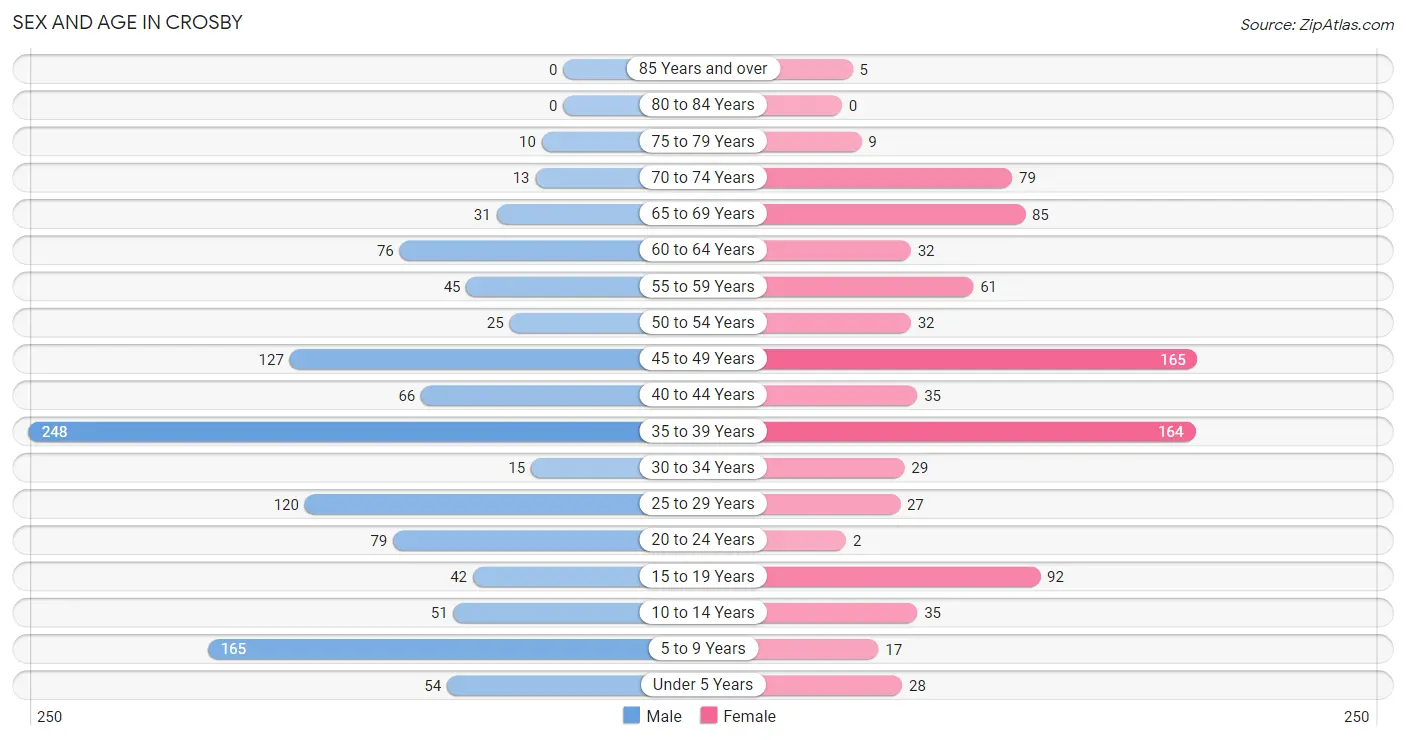
| Age Bracket | Male | Female |
| Under 5 Years | 54 (4.6%) | 28 (3.1%) |
| 5 to 9 Years | 165 (14.1%) | 17 (1.9%) |
| 10 to 14 Years | 51 (4.4%) | 35 (3.9%) |
| 15 to 19 Years | 42 (3.6%) | 92 (10.3%) |
| 20 to 24 Years | 79 (6.8%) | 2 (0.2%) |
| 25 to 29 Years | 120 (10.3%) | 27 (3.0%) |
| 30 to 34 Years | 15 (1.3%) | 29 (3.2%) |
| 35 to 39 Years | 248 (21.2%) | 164 (18.3%) |
| 40 to 44 Years | 66 (5.7%) | 35 (3.9%) |
| 45 to 49 Years | 127 (10.9%) | 165 (18.4%) |
| 50 to 54 Years | 25 (2.1%) | 32 (3.6%) |
| 55 to 59 Years | 45 (3.9%) | 61 (6.8%) |
| 60 to 64 Years | 76 (6.5%) | 32 (3.6%) |
| 65 to 69 Years | 31 (2.7%) | 85 (9.5%) |
| 70 to 74 Years | 13 (1.1%) | 79 (8.8%) |
| 75 to 79 Years | 10 (0.9%) | 9 (1.0%) |
| 80 to 84 Years | 0 (0.0%) | 0 (0.0%) |
| 85 Years and over | 0 (0.0%) | 5 (0.6%) |
| Total | 1,167 (100.0%) | 897 (100.0%) |
Families and Households in Crosby
Median Family Size in Crosby
The median family size in Crosby is 2.92 persons per family, with single female/mother families (152 | 31.0%) accounting for the largest median family size of 3.03 persons per family. On the other hand, single male/father families (52 | 10.6%) represent the smallest median family size with 2.79 persons per family.
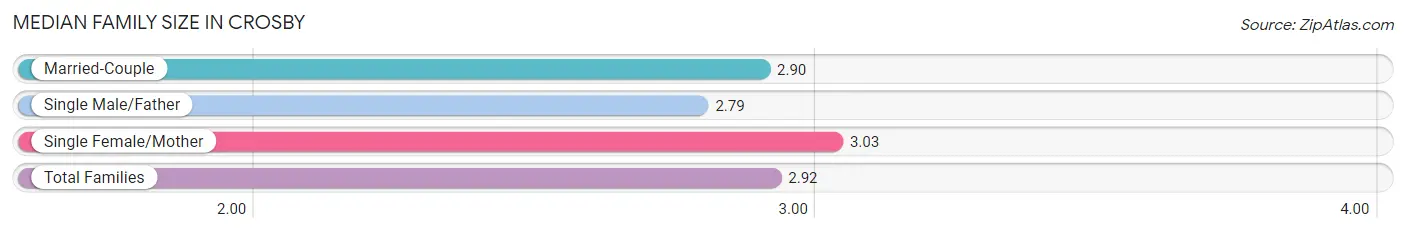
| Family Type | # Families | Family Size |
| Married-Couple | 287 (58.5%) | 2.90 |
| Single Male/Father | 52 (10.6%) | 2.79 |
| Single Female/Mother | 152 (31.0%) | 3.03 |
| Total Families | 491 (100.0%) | 2.92 |
Median Household Size in Crosby
The median household size in Crosby is 2.07 persons per household, with single female/mother households (152 | 15.3%) accounting for the largest median household size of 3.21 persons per household. non-family households (503 | 50.6%) represent the smallest median household size with 1.17 persons per household.
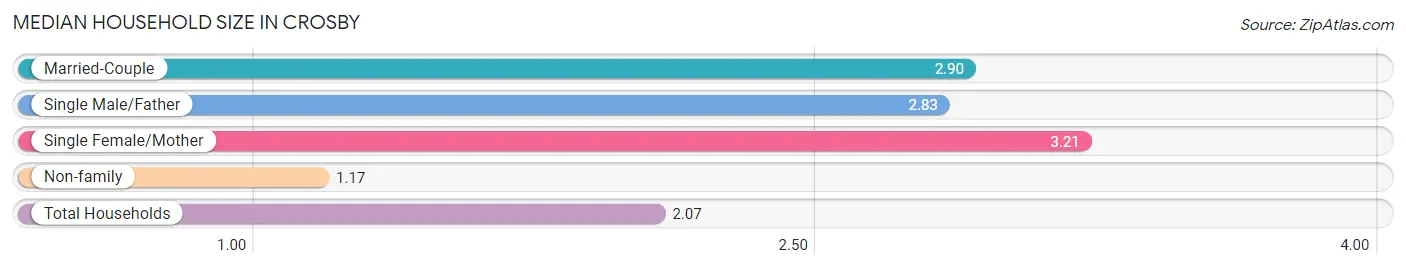
| Household Type | # Households | Household Size |
| Married-Couple | 287 (28.9%) | 2.90 |
| Single Male/Father | 52 (5.2%) | 2.83 |
| Single Female/Mother | 152 (15.3%) | 3.21 |
| Non-family | 503 (50.6%) | 1.17 |
| Total Households | 994 (100.0%) | 2.07 |
Household Size by Marriage Status in Crosby
Out of a total of 994 households in Crosby, 491 (49.4%) are family households, while 503 (50.6%) are nonfamily households. The most numerous type of family households are 2-person households, comprising 226, and the most common type of nonfamily households are 1-person households, comprising 414.
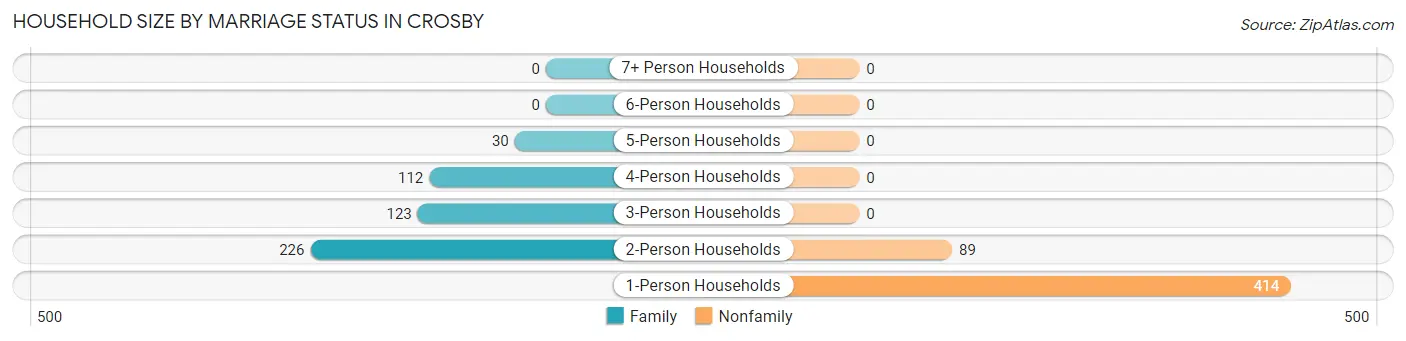
| Household Size | Family Households | Nonfamily Households |
| 1-Person Households | - | 414 (41.6%) |
| 2-Person Households | 226 (22.7%) | 89 (8.9%) |
| 3-Person Households | 123 (12.4%) | 0 (0.0%) |
| 4-Person Households | 112 (11.3%) | 0 (0.0%) |
| 5-Person Households | 30 (3.0%) | 0 (0.0%) |
| 6-Person Households | 0 (0.0%) | 0 (0.0%) |
| 7+ Person Households | 0 (0.0%) | 0 (0.0%) |
| Total | 491 (49.4%) | 503 (50.6%) |
Female Fertility in Crosby
Fertility by Age in Crosby
Average fertility rate in Crosby is 39.0 births per 1,000 women. Women in the age bracket of 20 to 34 years have the highest fertility rate with 207.0 births per 1,000 women. Women in the age bracket of 20 to 34 years acount for 60.0% of all women with births.
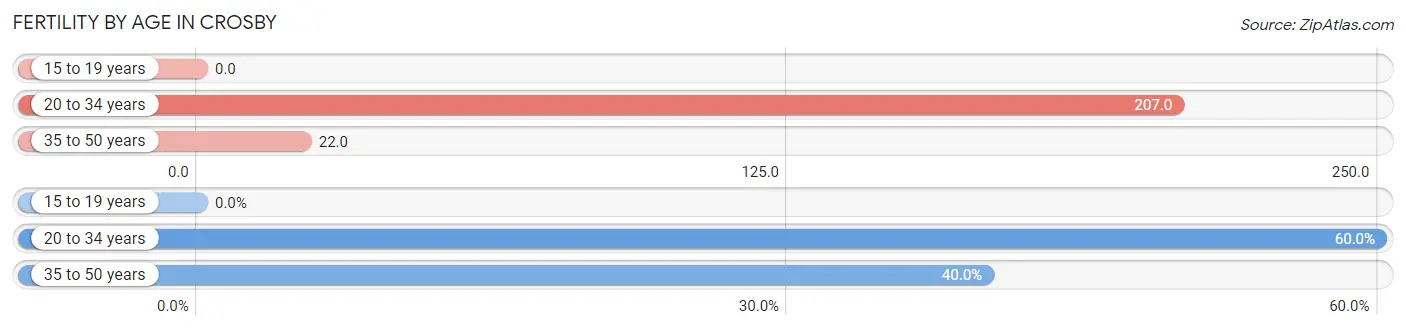
| Age Bracket | Women with Births | Births / 1,000 Women |
| 15 to 19 years | 0 (0.0%) | 0.0 |
| 20 to 34 years | 12 (60.0%) | 207.0 |
| 35 to 50 years | 8 (40.0%) | 22.0 |
| Total | 20 (100.0%) | 39.0 |
Fertility by Age by Marriage Status in Crosby
80.0% of women with births (20) in Crosby are married. The highest percentage of unmarried women with births falls into 20 to 34 years age bracket with 33.3% of them unmarried at the time of birth, while the lowest percentage of unmarried women with births belong to 35 to 50 years age bracket with 0.0% of them unmarried.
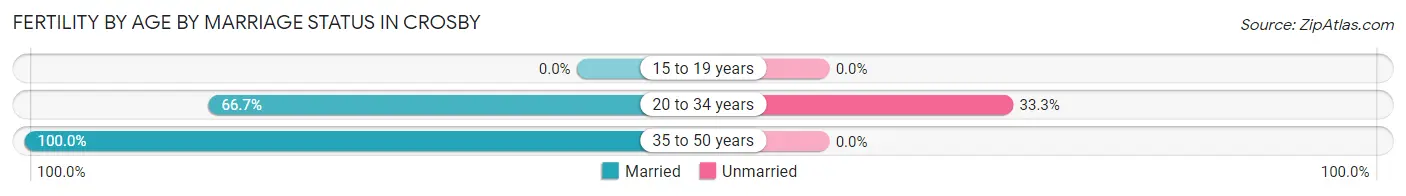
| Age Bracket | Married | Unmarried |
| 15 to 19 years | 0 (0.0%) | 0 (0.0%) |
| 20 to 34 years | 8 (66.7%) | 4 (33.3%) |
| 35 to 50 years | 8 (100.0%) | 0 (0.0%) |
| Total | 16 (80.0%) | 4 (20.0%) |
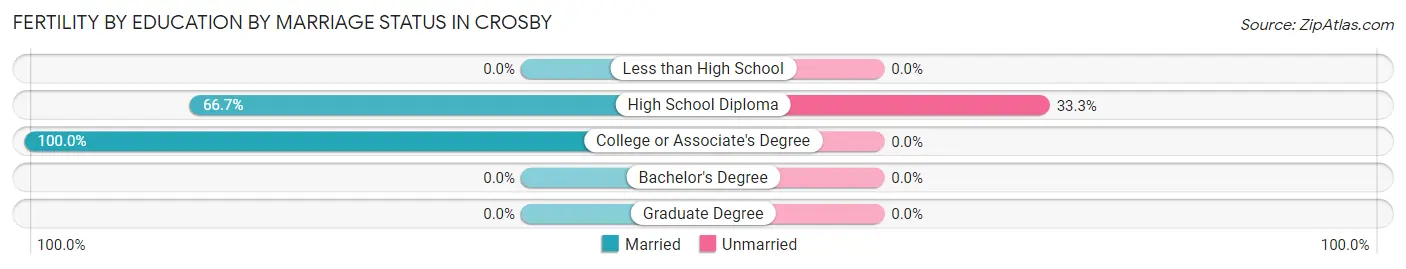
Fertility by Education in Crosby
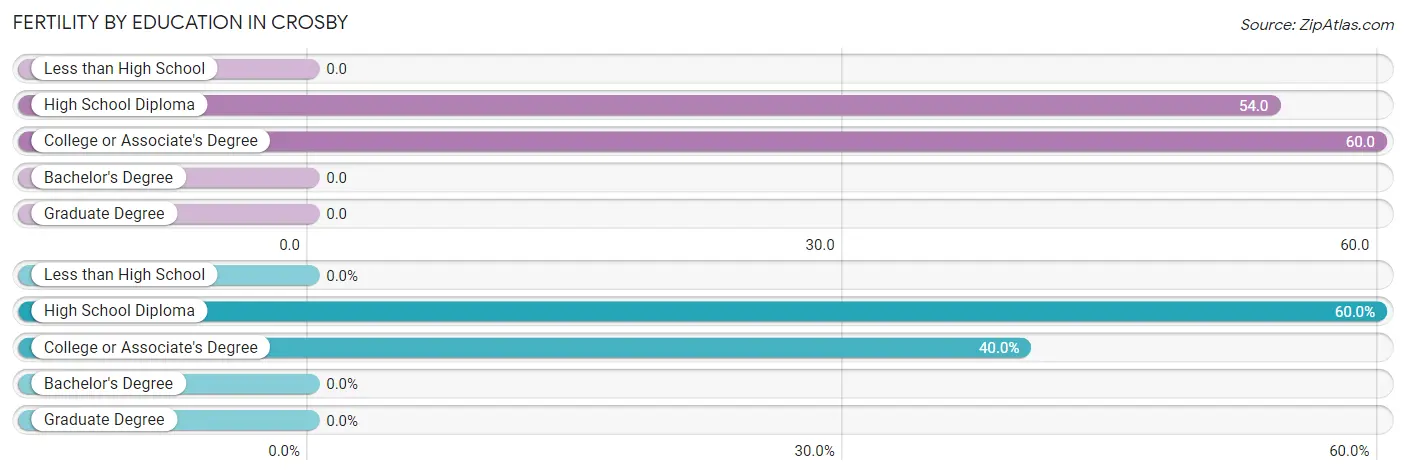
| Educational Attainment | Women with Births | Births / 1,000 Women |
| Less than High School | 0 (0.0%) | 0.0 |
| High School Diploma | 12 (60.0%) | 54.0 |
| College or Associate's Degree | 8 (40.0%) | 60.0 |
| Bachelor's Degree | 0 (0.0%) | 0.0 |
| Graduate Degree | 0 (0.0%) | 0.0 |
| Total | 20 (100.0%) | 39.0 |
Fertility by Education by Marriage Status in Crosby
20.0% of women with births in Crosby are unmarried. Women with the educational attainment of college or associate's degree are most likely to be married with 100.0% of them married at childbirth, while women with the educational attainment of high school diploma are least likely to be married with 33.3% of them unmarried at childbirth.
| Educational Attainment | Married | Unmarried |
| Less than High School | 0 (0.0%) | 0 (0.0%) |
| High School Diploma | 8 (66.7%) | 4 (33.3%) |
| College or Associate's Degree | 8 (100.0%) | 0 (0.0%) |
| Bachelor's Degree | 0 (0.0%) | 0 (0.0%) |
| Graduate Degree | 0 (0.0%) | 0 (0.0%) |
| Total | 16 (80.0%) | 4 (20.0%) |
Employment Characteristics in Crosby
Employment by Class of Employer in Crosby
Among the 1,087 employed individuals in Crosby, private company employees (837 | 77.0%), local government employees (75 | 6.9%), and self-employed (not incorporated) (70 | 6.4%) make up the most common classes of employment.
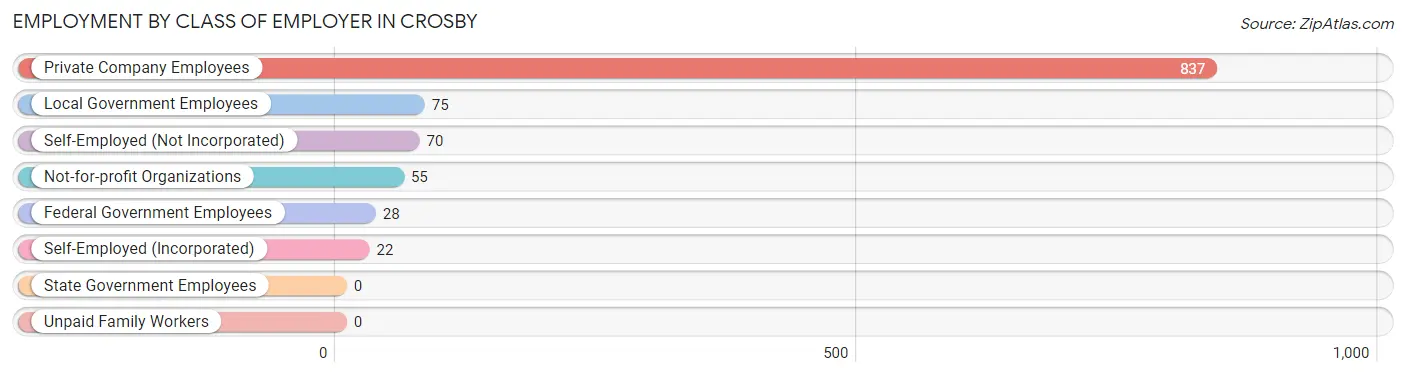
| Employer Class | # Employees | % Employees |
| Private Company Employees | 837 | 77.0% |
| Self-Employed (Incorporated) | 22 | 2.0% |
| Self-Employed (Not Incorporated) | 70 | 6.4% |
| Not-for-profit Organizations | 55 | 5.1% |
| Local Government Employees | 75 | 6.9% |
| State Government Employees | 0 | 0.0% |
| Federal Government Employees | 28 | 2.6% |
| Unpaid Family Workers | 0 | 0.0% |
| Total | 1,087 | 100.0% |
Employment Status by Age in Crosby
According to the labor force statistics for Crosby, out of the total population over 16 years of age (1,714), 65.6% or 1,124 individuals are in the labor force, with 3.3% or 37 of them unemployed. The age group with the highest labor force participation rate is 20 to 24 years, with 97.5% or 79 individuals in the labor force. Within the labor force, the 16 to 19 years age range has the highest percentage of unemployed individuals, with 100.0% or 21 of them being unemployed.
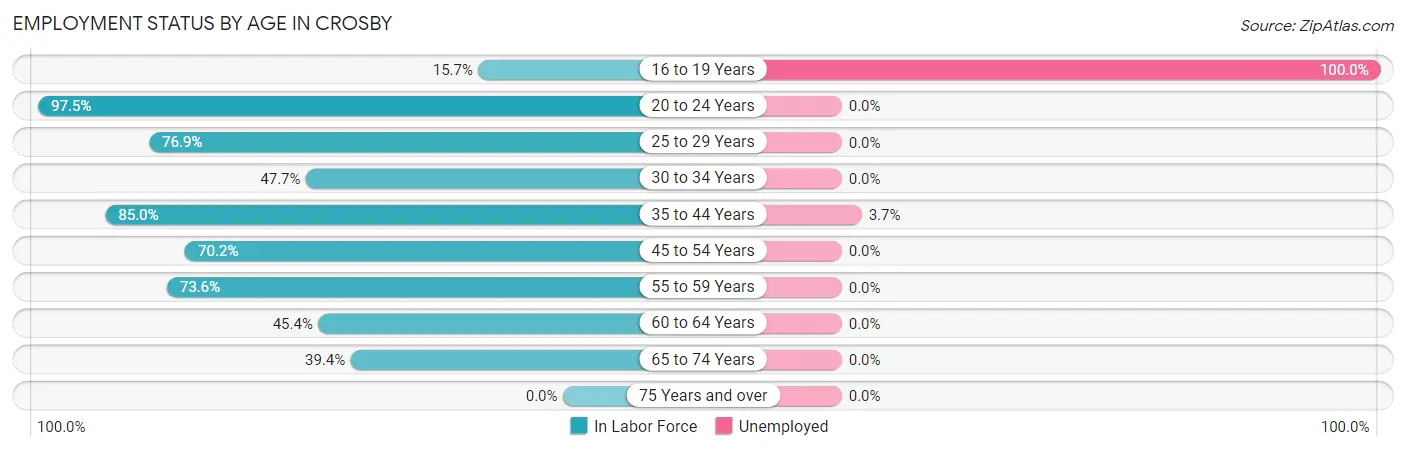
| Age Bracket | In Labor Force | Unemployed |
| 16 to 19 Years | 21 (15.7%) | 21 (100.0%) |
| 20 to 24 Years | 79 (97.5%) | 0 (0.0%) |
| 25 to 29 Years | 113 (76.9%) | 0 (0.0%) |
| 30 to 34 Years | 21 (47.7%) | 0 (0.0%) |
| 35 to 44 Years | 436 (85.0%) | 16 (3.7%) |
| 45 to 54 Years | 245 (70.2%) | 0 (0.0%) |
| 55 to 59 Years | 78 (73.6%) | 0 (0.0%) |
| 60 to 64 Years | 49 (45.4%) | 0 (0.0%) |
| 65 to 74 Years | 82 (39.4%) | 0 (0.0%) |
| 75 Years and over | 0 (0.0%) | 0 (0.0%) |
| Total | 1,124 (65.6%) | 37 (3.3%) |
Employment Status by Educational Attainment in Crosby
According to labor force statistics for Crosby, 74.3% of individuals (941) out of the total population between 25 and 64 years of age (1,267) are in the labor force, with 1.7% or 16 of them being unemployed. The group with the highest labor force participation rate are those with the educational attainment of bachelor's degree or higher, with 93.3% or 209 individuals in the labor force. Within the labor force, individuals with less than high school education have the highest percentage of unemployment, with 23.3% or 14 of them being unemployed.
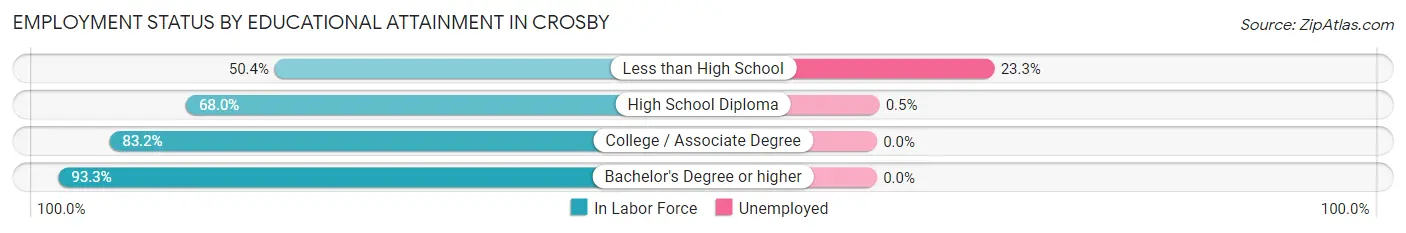
| Educational Attainment | In Labor Force | Unemployed |
| Less than High School | 60 (50.4%) | 28 (23.3%) |
| High School Diploma | 430 (68.0%) | 3 (0.5%) |
| College / Associate Degree | 243 (83.2%) | 0 (0.0%) |
| Bachelor's Degree or higher | 209 (93.3%) | 0 (0.0%) |
| Total | 941 (74.3%) | 22 (1.7%) |
Employment Occupations by Sex in Crosby
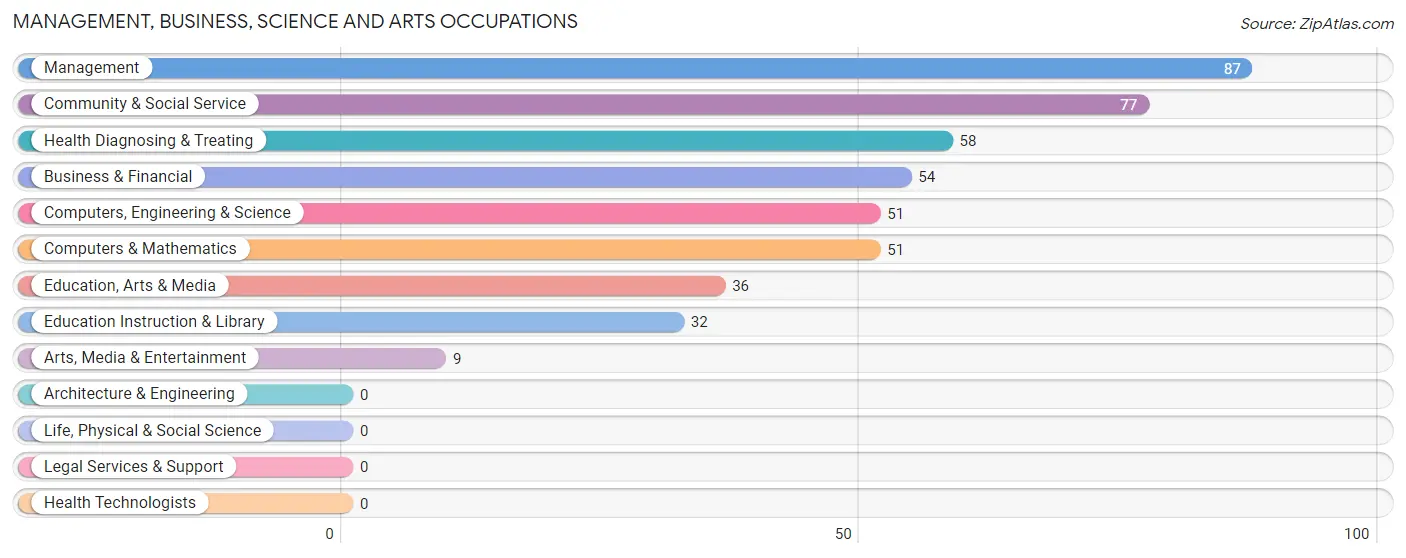
Management, Business, Science and Arts Occupations
The most common Management, Business, Science and Arts occupations in Crosby are Management (87 | 8.0%), Community & Social Service (77 | 7.1%), Health Diagnosing & Treating (58 | 5.3%), Business & Financial (54 | 5.0%), and Computers, Engineering & Science (51 | 4.7%).
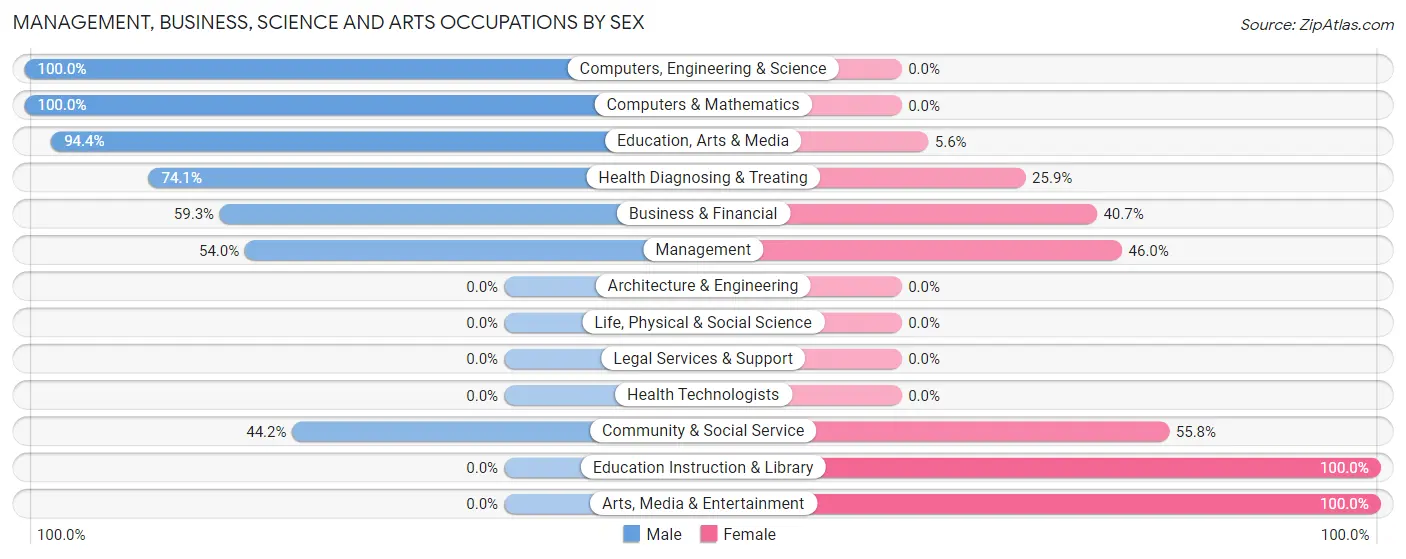
Management, Business, Science and Arts Occupations by Sex
Within the Management, Business, Science and Arts occupations in Crosby, the most male-oriented occupations are Computers, Engineering & Science (100.0%), Computers & Mathematics (100.0%), and Education, Arts & Media (94.4%), while the most female-oriented occupations are Education Instruction & Library (100.0%), Arts, Media & Entertainment (100.0%), and Community & Social Service (55.8%).
| Occupation | Male | Female |
| Management | 47 (54.0%) | 40 (46.0%) |
| Business & Financial | 32 (59.3%) | 22 (40.7%) |
| Computers, Engineering & Science | 51 (100.0%) | 0 (0.0%) |
| Computers & Mathematics | 51 (100.0%) | 0 (0.0%) |
| Architecture & Engineering | 0 (0.0%) | 0 (0.0%) |
| Life, Physical & Social Science | 0 (0.0%) | 0 (0.0%) |
| Community & Social Service | 34 (44.2%) | 43 (55.8%) |
| Education, Arts & Media | 34 (94.4%) | 2 (5.6%) |
| Legal Services & Support | 0 (0.0%) | 0 (0.0%) |
| Education Instruction & Library | 0 (0.0%) | 32 (100.0%) |
| Arts, Media & Entertainment | 0 (0.0%) | 9 (100.0%) |
| Health Diagnosing & Treating | 43 (74.1%) | 15 (25.9%) |
| Health Technologists | 0 (0.0%) | 0 (0.0%) |
| Total (Category) | 207 (63.3%) | 120 (36.7%) |
| Total (Overall) | 723 (66.5%) | 364 (33.5%) |
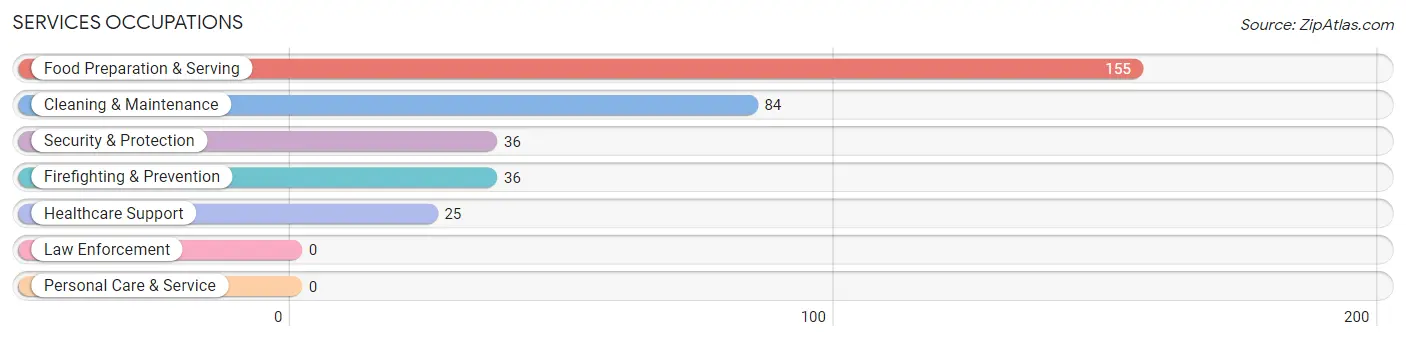
Services Occupations
The most common Services occupations in Crosby are Food Preparation & Serving (155 | 14.3%), Cleaning & Maintenance (84 | 7.7%), Security & Protection (36 | 3.3%), Firefighting & Prevention (36 | 3.3%), and Healthcare Support (25 | 2.3%).
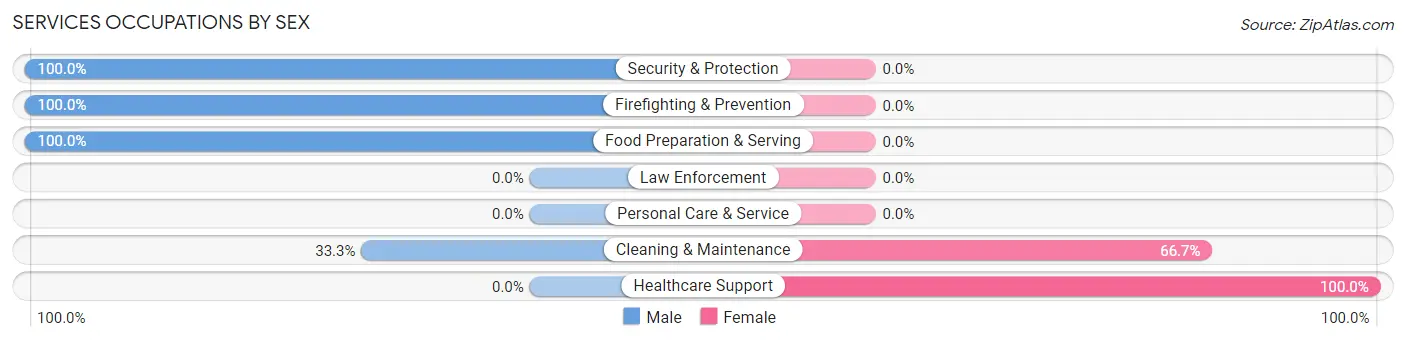
Services Occupations by Sex
Within the Services occupations in Crosby, the most male-oriented occupations are Security & Protection (100.0%), Firefighting & Prevention (100.0%), and Food Preparation & Serving (100.0%), while the most female-oriented occupations are Healthcare Support (100.0%), and Cleaning & Maintenance (66.7%).
| Occupation | Male | Female |
| Healthcare Support | 0 (0.0%) | 25 (100.0%) |
| Security & Protection | 36 (100.0%) | 0 (0.0%) |
| Firefighting & Prevention | 36 (100.0%) | 0 (0.0%) |
| Law Enforcement | 0 (0.0%) | 0 (0.0%) |
| Food Preparation & Serving | 155 (100.0%) | 0 (0.0%) |
| Cleaning & Maintenance | 28 (33.3%) | 56 (66.7%) |
| Personal Care & Service | 0 (0.0%) | 0 (0.0%) |
| Total (Category) | 219 (73.0%) | 81 (27.0%) |
| Total (Overall) | 723 (66.5%) | 364 (33.5%) |
Sales and Office Occupations
The most common Sales and Office occupations in Crosby are Office & Administration (94 | 8.6%), and Sales & Related (8 | 0.7%).
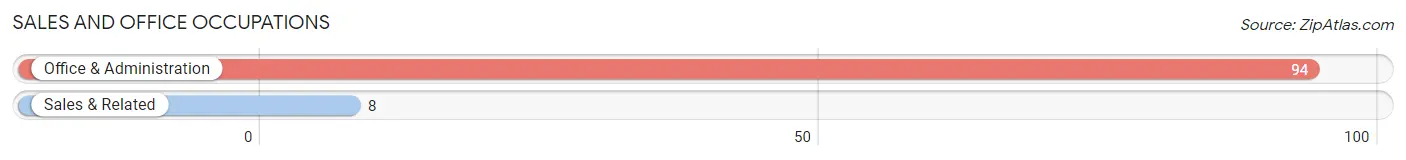
Sales and Office Occupations by Sex
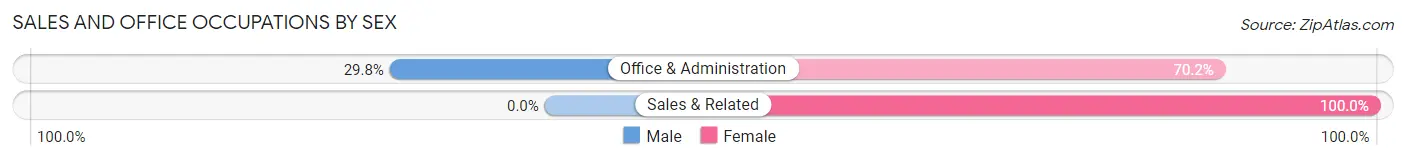
| Occupation | Male | Female |
| Sales & Related | 0 (0.0%) | 8 (100.0%) |
| Office & Administration | 28 (29.8%) | 66 (70.2%) |
| Total (Category) | 28 (27.5%) | 74 (72.6%) |
| Total (Overall) | 723 (66.5%) | 364 (33.5%) |
Natural Resources, Construction and Maintenance Occupations
The most common Natural Resources, Construction and Maintenance occupations in Crosby are Construction & Extraction (153 | 14.1%), and Installation, Maintenance & Repair (69 | 6.4%).
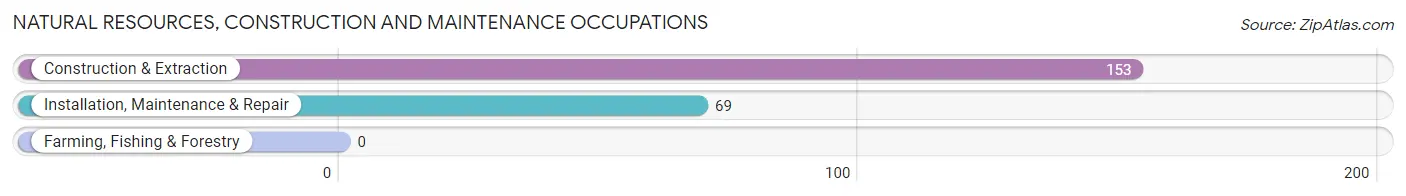
Natural Resources, Construction and Maintenance Occupations by Sex
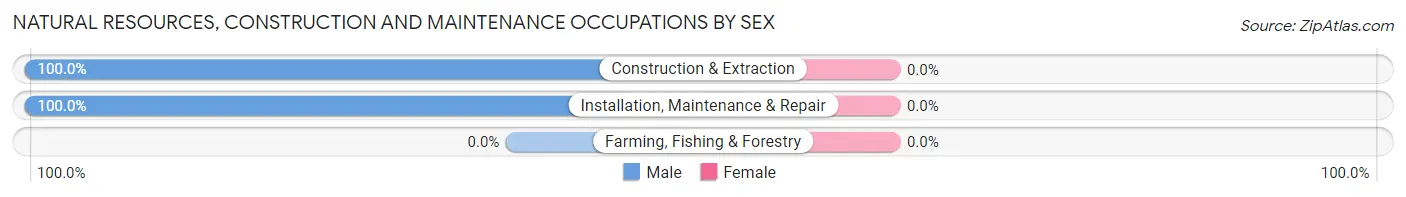
| Occupation | Male | Female |
| Farming, Fishing & Forestry | 0 (0.0%) | 0 (0.0%) |
| Construction & Extraction | 153 (100.0%) | 0 (0.0%) |
| Installation, Maintenance & Repair | 69 (100.0%) | 0 (0.0%) |
| Total (Category) | 222 (100.0%) | 0 (0.0%) |
| Total (Overall) | 723 (66.5%) | 364 (33.5%) |
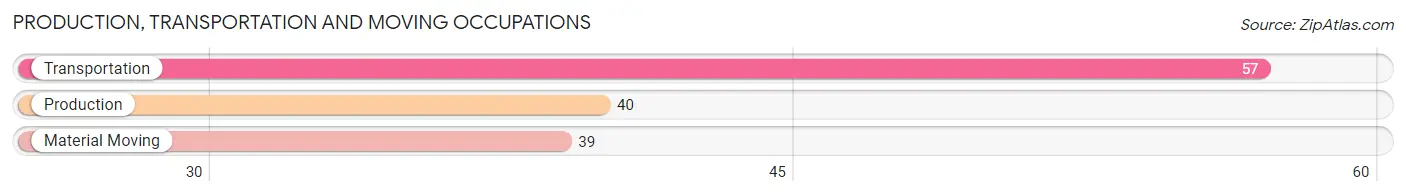
Production, Transportation and Moving Occupations
The most common Production, Transportation and Moving occupations in Crosby are Transportation (57 | 5.2%), Production (40 | 3.7%), and Material Moving (39 | 3.6%).
Production, Transportation and Moving Occupations by Sex
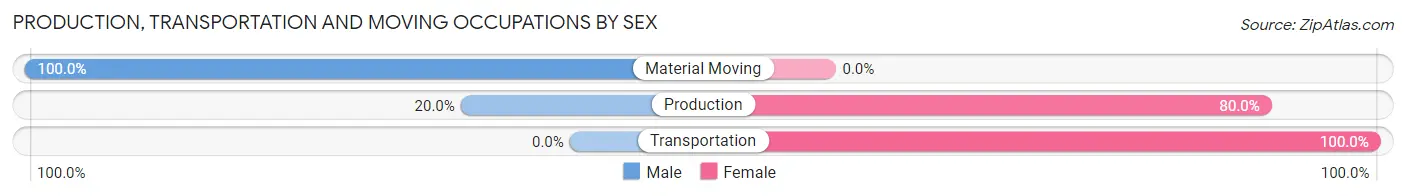
| Occupation | Male | Female |
| Production | 8 (20.0%) | 32 (80.0%) |
| Transportation | 0 (0.0%) | 57 (100.0%) |
| Material Moving | 39 (100.0%) | 0 (0.0%) |
| Total (Category) | 47 (34.6%) | 89 (65.4%) |
| Total (Overall) | 723 (66.5%) | 364 (33.5%) |
Employment Industries by Sex in Crosby
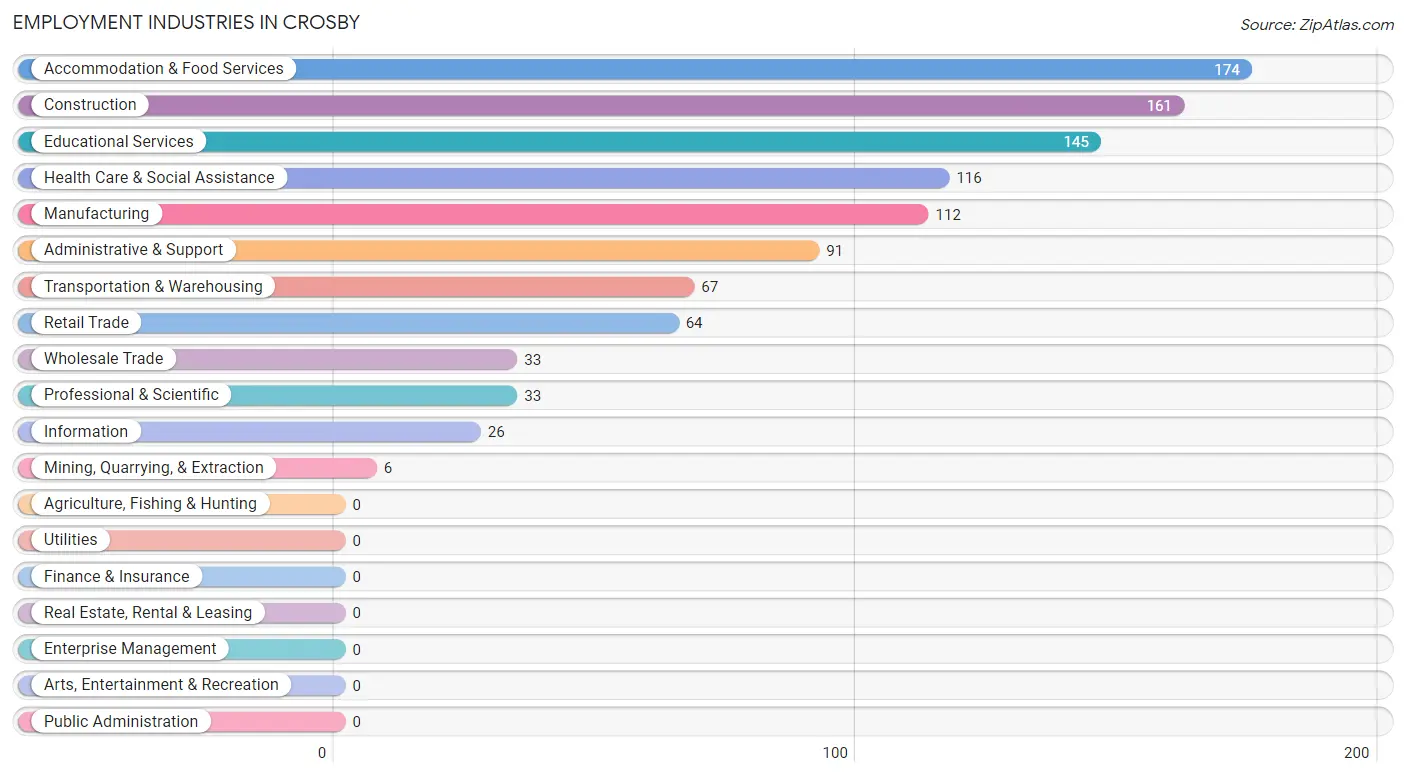
Employment Industries in Crosby
The major employment industries in Crosby include Accommodation & Food Services (174 | 16.0%), Construction (161 | 14.8%), Educational Services (145 | 13.3%), Health Care & Social Assistance (116 | 10.7%), and Manufacturing (112 | 10.3%).
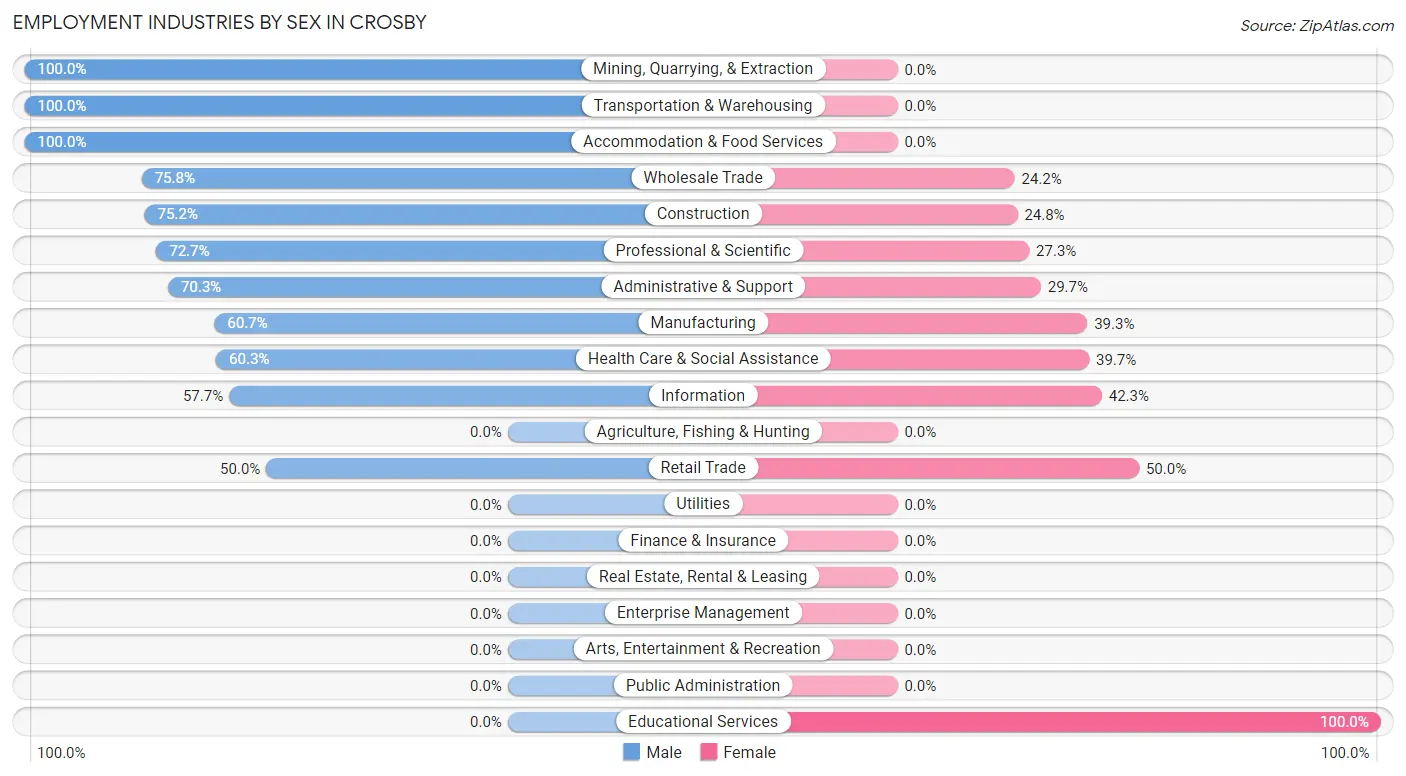
Employment Industries by Sex in Crosby
The Crosby industries that see more men than women are Mining, Quarrying, & Extraction (100.0%), Transportation & Warehousing (100.0%), and Accommodation & Food Services (100.0%), whereas the industries that tend to have a higher number of women are Educational Services (100.0%), Retail Trade (50.0%), and Information (42.3%).
| Industry | Male | Female |
| Agriculture, Fishing & Hunting | 0 (0.0%) | 0 (0.0%) |
| Mining, Quarrying, & Extraction | 6 (100.0%) | 0 (0.0%) |
| Construction | 121 (75.2%) | 40 (24.8%) |
| Manufacturing | 68 (60.7%) | 44 (39.3%) |
| Wholesale Trade | 25 (75.8%) | 8 (24.2%) |
| Retail Trade | 32 (50.0%) | 32 (50.0%) |
| Transportation & Warehousing | 67 (100.0%) | 0 (0.0%) |
| Utilities | 0 (0.0%) | 0 (0.0%) |
| Information | 15 (57.7%) | 11 (42.3%) |
| Finance & Insurance | 0 (0.0%) | 0 (0.0%) |
| Real Estate, Rental & Leasing | 0 (0.0%) | 0 (0.0%) |
| Professional & Scientific | 24 (72.7%) | 9 (27.3%) |
| Enterprise Management | 0 (0.0%) | 0 (0.0%) |
| Administrative & Support | 64 (70.3%) | 27 (29.7%) |
| Educational Services | 0 (0.0%) | 145 (100.0%) |
| Health Care & Social Assistance | 70 (60.3%) | 46 (39.7%) |
| Arts, Entertainment & Recreation | 0 (0.0%) | 0 (0.0%) |
| Accommodation & Food Services | 174 (100.0%) | 0 (0.0%) |
| Public Administration | 0 (0.0%) | 0 (0.0%) |
| Total | 723 (66.5%) | 364 (33.5%) |
Education in Crosby
School Enrollment in Crosby
The most common levels of schooling among the 393 students in Crosby are elementary school (168 | 42.7%), high school (151 | 38.4%), and middle school (48 | 12.2%).
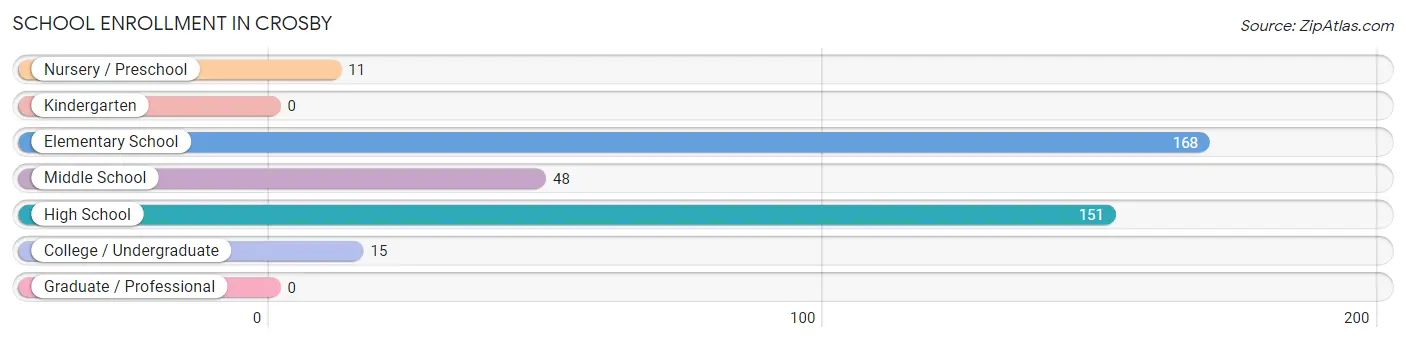
| School Level | # Students | % Students |
| Nursery / Preschool | 11 | 2.8% |
| Kindergarten | 0 | 0.0% |
| Elementary School | 168 | 42.7% |
| Middle School | 48 | 12.2% |
| High School | 151 | 38.4% |
| College / Undergraduate | 15 | 3.8% |
| Graduate / Professional | 0 | 0.0% |
| Total | 393 | 100.0% |
School Enrollment by Age by Funding Source in Crosby
Out of a total of 393 students who are enrolled in schools in Crosby, 42 (10.7%) attend a private institution, while the remaining 351 (89.3%) are enrolled in public schools. The age group of 3 to 4 year olds has the highest likelihood of being enrolled in private schools, with 6 (54.5% in the age bracket) enrolled. Conversely, the age group of 10 to 14 year olds has the lowest likelihood of being enrolled in a private school, with 86 (100.0% in the age bracket) attending a public institution.
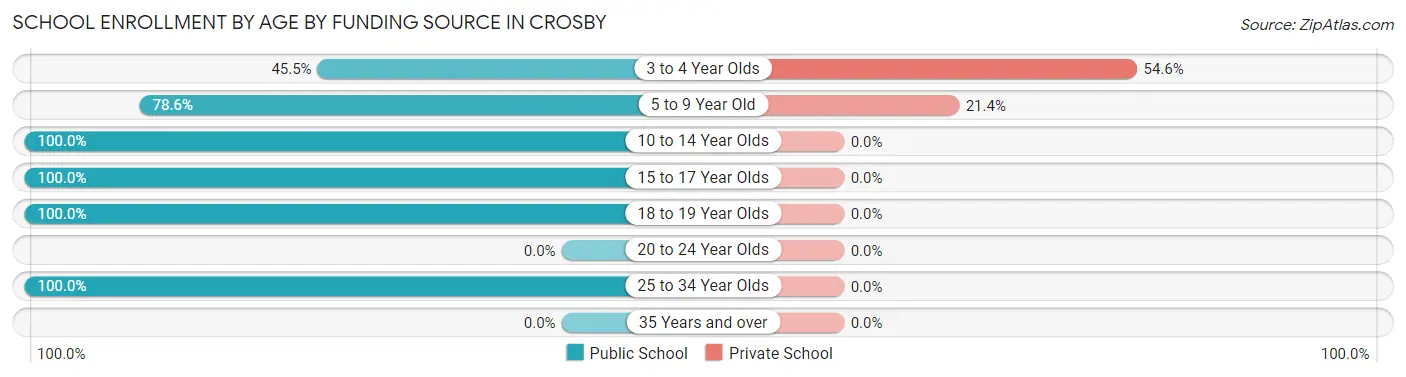
| Age Bracket | Public School | Private School |
| 3 to 4 Year Olds | 5 (45.5%) | 6 (54.5%) |
| 5 to 9 Year Old | 132 (78.6%) | 36 (21.4%) |
| 10 to 14 Year Olds | 86 (100.0%) | 0 (0.0%) |
| 15 to 17 Year Olds | 45 (100.0%) | 0 (0.0%) |
| 18 to 19 Year Olds | 68 (100.0%) | 0 (0.0%) |
| 20 to 24 Year Olds | 0 (0.0%) | 0 (0.0%) |
| 25 to 34 Year Olds | 15 (100.0%) | 0 (0.0%) |
| 35 Years and over | 0 (0.0%) | 0 (0.0%) |
| Total | 351 (89.3%) | 42 (10.7%) |
Educational Attainment by Field of Study in Crosby
Business (122 | 51.0%), education (34 | 14.2%), science & technology (27 | 11.3%), computers & mathematics (24 | 10.0%), and physical & health sciences (15 | 6.3%) are the most common fields of study among 239 individuals in Crosby who have obtained a bachelor's degree or higher.
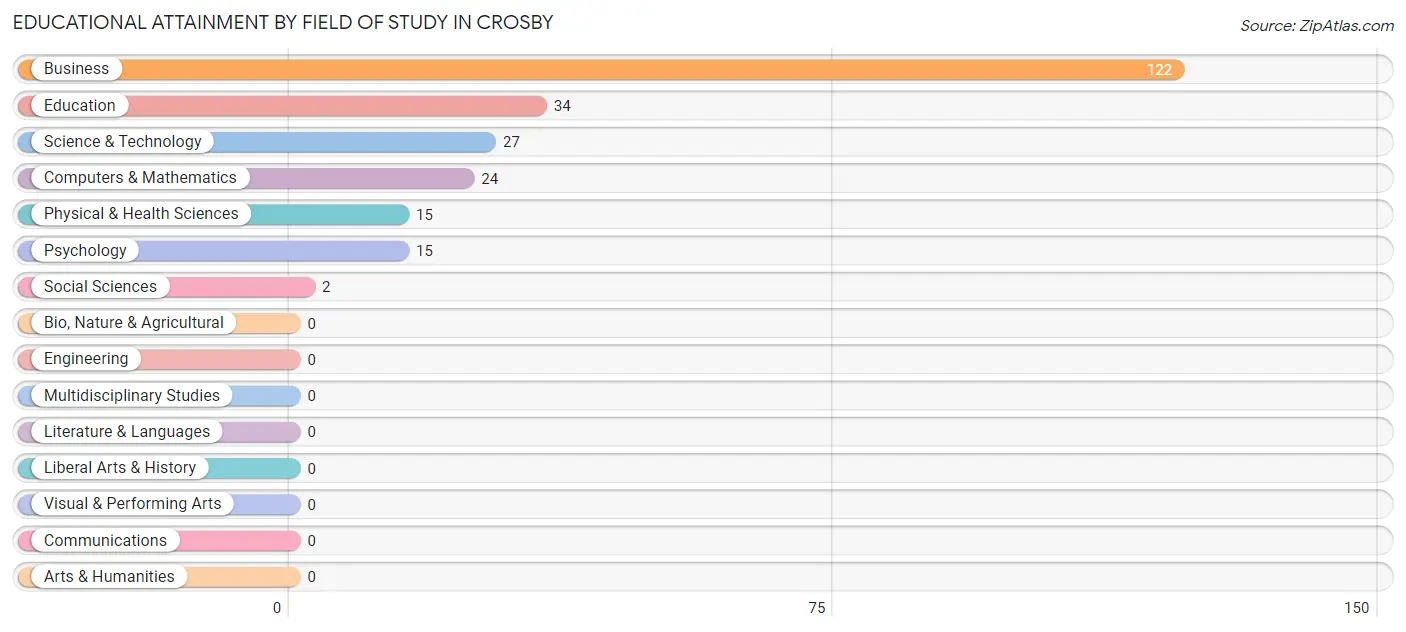
| Field of Study | # Graduates | % Graduates |
| Computers & Mathematics | 24 | 10.0% |
| Bio, Nature & Agricultural | 0 | 0.0% |
| Physical & Health Sciences | 15 | 6.3% |
| Psychology | 15 | 6.3% |
| Social Sciences | 2 | 0.8% |
| Engineering | 0 | 0.0% |
| Multidisciplinary Studies | 0 | 0.0% |
| Science & Technology | 27 | 11.3% |
| Business | 122 | 51.0% |
| Education | 34 | 14.2% |
| Literature & Languages | 0 | 0.0% |
| Liberal Arts & History | 0 | 0.0% |
| Visual & Performing Arts | 0 | 0.0% |
| Communications | 0 | 0.0% |
| Arts & Humanities | 0 | 0.0% |
| Total | 239 | 100.0% |
Transportation & Commute in Crosby
Vehicle Availability by Sex in Crosby
The most prevalent vehicle ownership categories in Crosby are males with no vehicle (223, accounting for 30.8%) and females with no vehicle (0, making up 61.6%).

| Vehicles Available | Male | Female |
| No Vehicle | 223 (30.8%) | 0 (0.0%) |
| 1 Vehicle | 148 (20.5%) | 116 (32.0%) |
| 2 Vehicles | 220 (30.4%) | 169 (46.7%) |
| 3 Vehicles | 99 (13.7%) | 73 (20.2%) |
| 4 Vehicles | 0 (0.0%) | 4 (1.1%) |
| 5 or more Vehicles | 33 (4.6%) | 0 (0.0%) |
| Total | 723 (100.0%) | 362 (100.0%) |
Commute Time in Crosby
The most frequently occuring commute durations in Crosby are 30 to 34 minutes (322 commuters, 30.4%), 10 to 14 minutes (105 commuters, 9.9%), and 20 to 24 minutes (99 commuters, 9.3%).
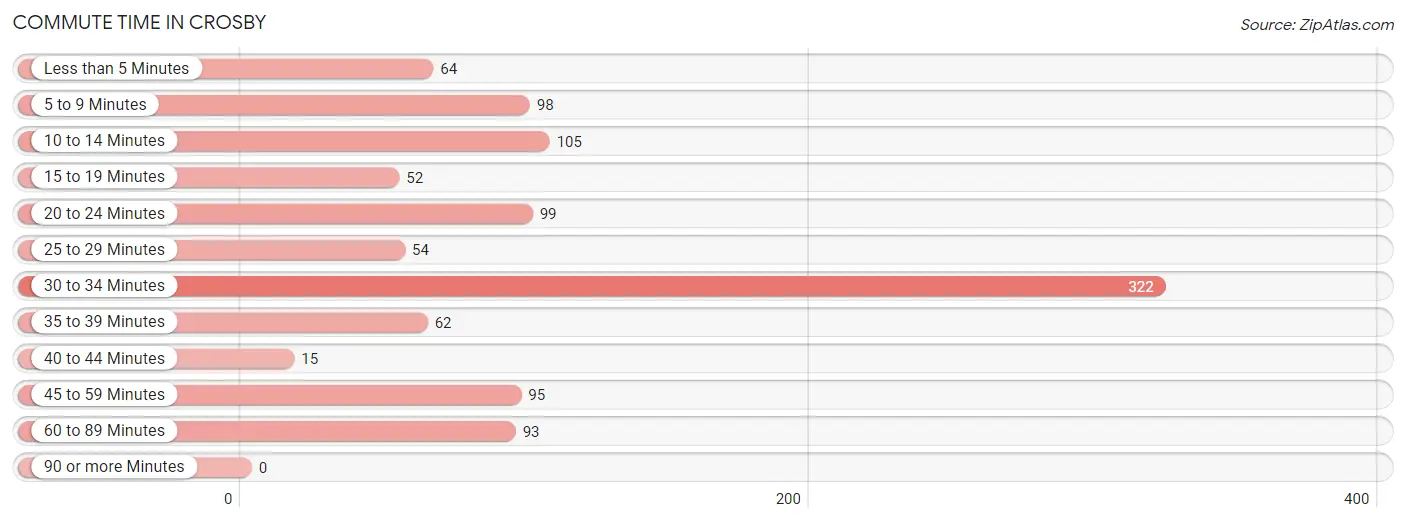
| Commute Time | # Commuters | % Commuters |
| Less than 5 Minutes | 64 | 6.0% |
| 5 to 9 Minutes | 98 | 9.2% |
| 10 to 14 Minutes | 105 | 9.9% |
| 15 to 19 Minutes | 52 | 4.9% |
| 20 to 24 Minutes | 99 | 9.3% |
| 25 to 29 Minutes | 54 | 5.1% |
| 30 to 34 Minutes | 322 | 30.4% |
| 35 to 39 Minutes | 62 | 5.9% |
| 40 to 44 Minutes | 15 | 1.4% |
| 45 to 59 Minutes | 95 | 9.0% |
| 60 to 89 Minutes | 93 | 8.8% |
| 90 or more Minutes | 0 | 0.0% |
Commute Time by Sex in Crosby
The most common commute times in Crosby are 30 to 34 minutes (257 commuters, 36.8%) for males and 10 to 14 minutes (84 commuters, 23.3%) for females.
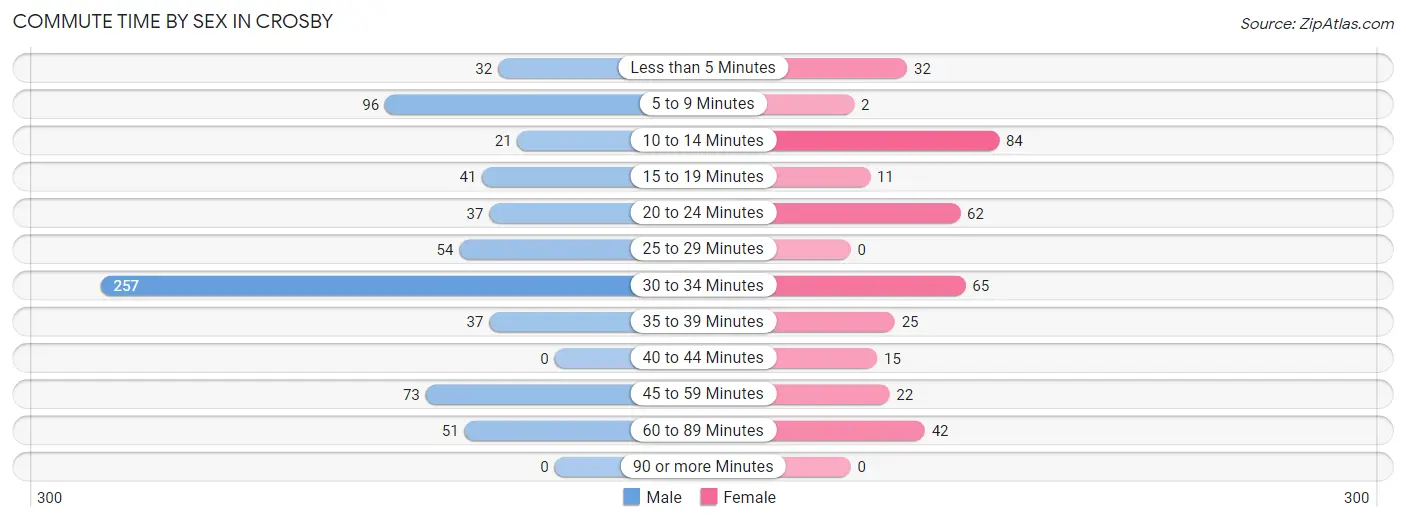
| Commute Time | Male | Female |
| Less than 5 Minutes | 32 (4.6%) | 32 (8.9%) |
| 5 to 9 Minutes | 96 (13.7%) | 2 (0.6%) |
| 10 to 14 Minutes | 21 (3.0%) | 84 (23.3%) |
| 15 to 19 Minutes | 41 (5.9%) | 11 (3.1%) |
| 20 to 24 Minutes | 37 (5.3%) | 62 (17.2%) |
| 25 to 29 Minutes | 54 (7.7%) | 0 (0.0%) |
| 30 to 34 Minutes | 257 (36.8%) | 65 (18.1%) |
| 35 to 39 Minutes | 37 (5.3%) | 25 (6.9%) |
| 40 to 44 Minutes | 0 (0.0%) | 15 (4.2%) |
| 45 to 59 Minutes | 73 (10.4%) | 22 (6.1%) |
| 60 to 89 Minutes | 51 (7.3%) | 42 (11.7%) |
| 90 or more Minutes | 0 (0.0%) | 0 (0.0%) |
Time of Departure to Work by Sex in Crosby
The most frequent times of departure to work in Crosby are 5:00 AM to 5:29 AM (240, 34.3%) for males and 6:00 AM to 6:29 AM (126, 35.0%) for females.
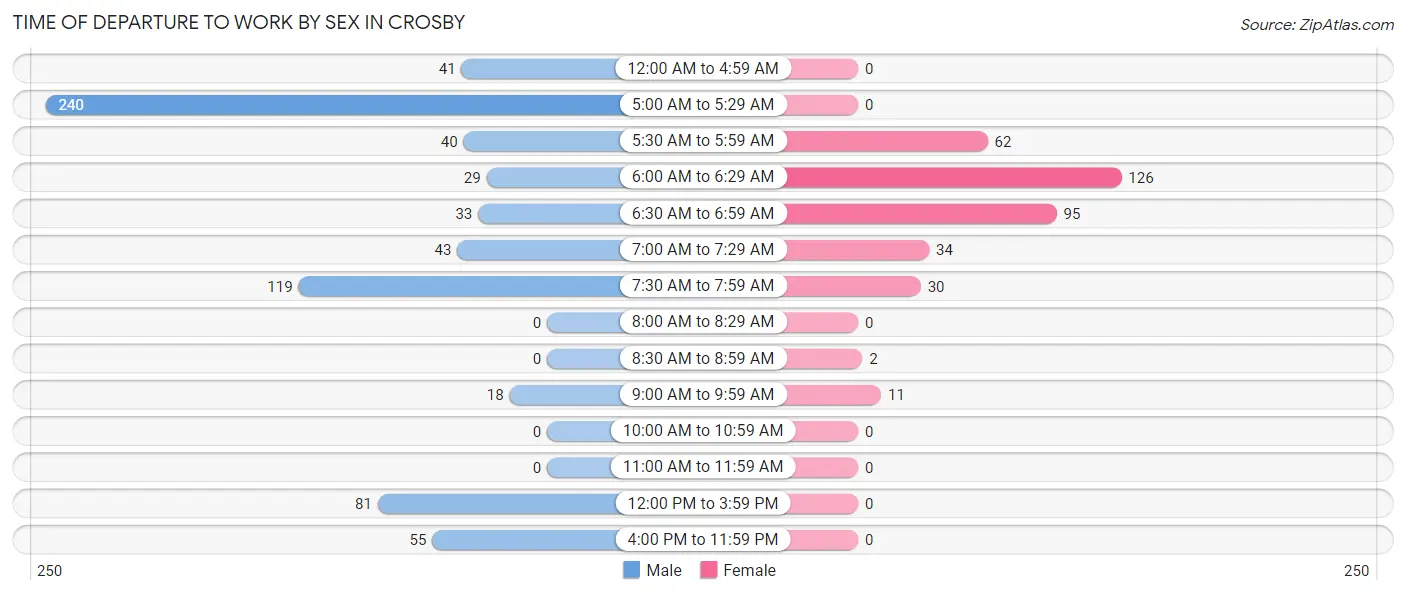
| Time of Departure | Male | Female |
| 12:00 AM to 4:59 AM | 41 (5.9%) | 0 (0.0%) |
| 5:00 AM to 5:29 AM | 240 (34.3%) | 0 (0.0%) |
| 5:30 AM to 5:59 AM | 40 (5.7%) | 62 (17.2%) |
| 6:00 AM to 6:29 AM | 29 (4.2%) | 126 (35.0%) |
| 6:30 AM to 6:59 AM | 33 (4.7%) | 95 (26.4%) |
| 7:00 AM to 7:29 AM | 43 (6.1%) | 34 (9.4%) |
| 7:30 AM to 7:59 AM | 119 (17.0%) | 30 (8.3%) |
| 8:00 AM to 8:29 AM | 0 (0.0%) | 0 (0.0%) |
| 8:30 AM to 8:59 AM | 0 (0.0%) | 2 (0.6%) |
| 9:00 AM to 9:59 AM | 18 (2.6%) | 11 (3.1%) |
| 10:00 AM to 10:59 AM | 0 (0.0%) | 0 (0.0%) |
| 11:00 AM to 11:59 AM | 0 (0.0%) | 0 (0.0%) |
| 12:00 PM to 3:59 PM | 81 (11.6%) | 0 (0.0%) |
| 4:00 PM to 11:59 PM | 55 (7.9%) | 0 (0.0%) |
| Total | 699 (100.0%) | 360 (100.0%) |
Housing Occupancy in Crosby
Occupancy by Ownership in Crosby
Of the total 994 dwellings in Crosby, owner-occupied units account for 587 (59.1%), while renter-occupied units make up 407 (40.9%).
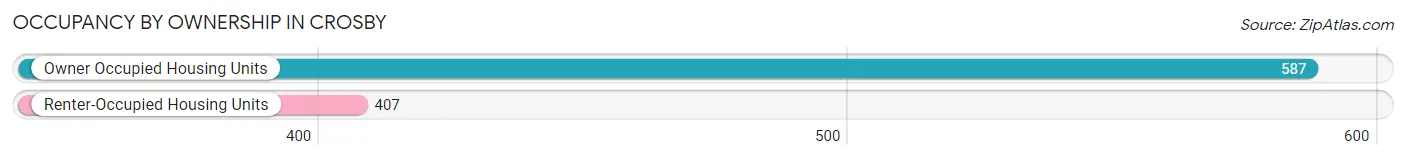
| Occupancy | # Housing Units | % Housing Units |
| Owner Occupied Housing Units | 587 | 59.1% |
| Renter-Occupied Housing Units | 407 | 40.9% |
| Total Occupied Housing Units | 994 | 100.0% |
Occupancy by Household Size in Crosby
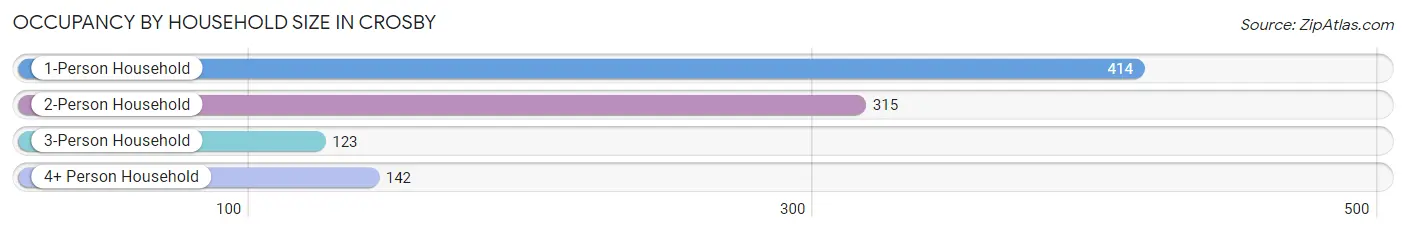
| Household Size | # Housing Units | % Housing Units |
| 1-Person Household | 414 | 41.6% |
| 2-Person Household | 315 | 31.7% |
| 3-Person Household | 123 | 12.4% |
| 4+ Person Household | 142 | 14.3% |
| Total Housing Units | 994 | 100.0% |
Occupancy by Ownership by Household Size in Crosby
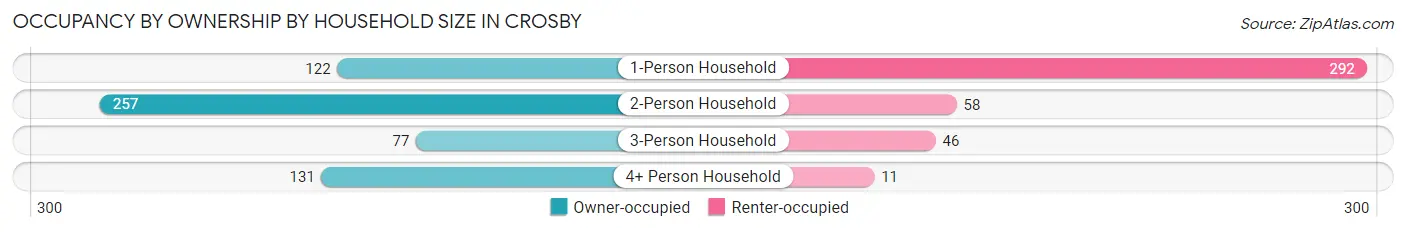
| Household Size | Owner-occupied | Renter-occupied |
| 1-Person Household | 122 (29.5%) | 292 (70.5%) |
| 2-Person Household | 257 (81.6%) | 58 (18.4%) |
| 3-Person Household | 77 (62.6%) | 46 (37.4%) |
| 4+ Person Household | 131 (92.2%) | 11 (7.7%) |
| Total Housing Units | 587 (59.1%) | 407 (40.9%) |
Occupancy by Educational Attainment in Crosby
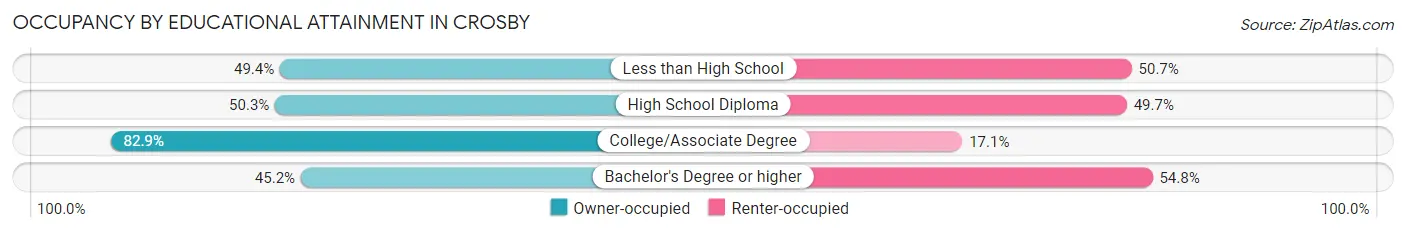
| Household Size | Owner-occupied | Renter-occupied |
| Less than High School | 38 (49.3%) | 39 (50.6%) |
| High School Diploma | 235 (50.3%) | 232 (49.7%) |
| College/Associate Degree | 243 (82.9%) | 50 (17.1%) |
| Bachelor's Degree or higher | 71 (45.2%) | 86 (54.8%) |
Occupancy by Age of Householder in Crosby
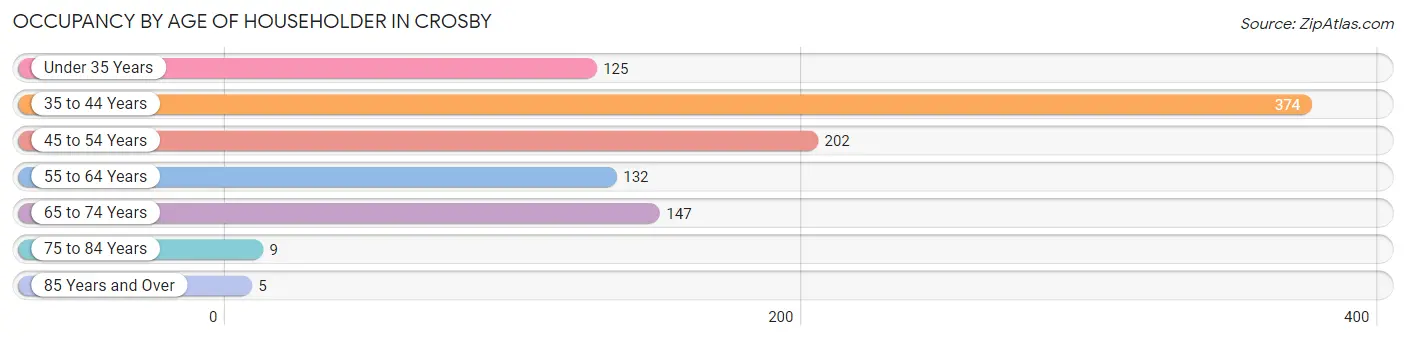
| Age Bracket | # Households | % Households |
| Under 35 Years | 125 | 12.6% |
| 35 to 44 Years | 374 | 37.6% |
| 45 to 54 Years | 202 | 20.3% |
| 55 to 64 Years | 132 | 13.3% |
| 65 to 74 Years | 147 | 14.8% |
| 75 to 84 Years | 9 | 0.9% |
| 85 Years and Over | 5 | 0.5% |
| Total | 994 | 100.0% |
Housing Finances in Crosby
Median Income by Occupancy in Crosby
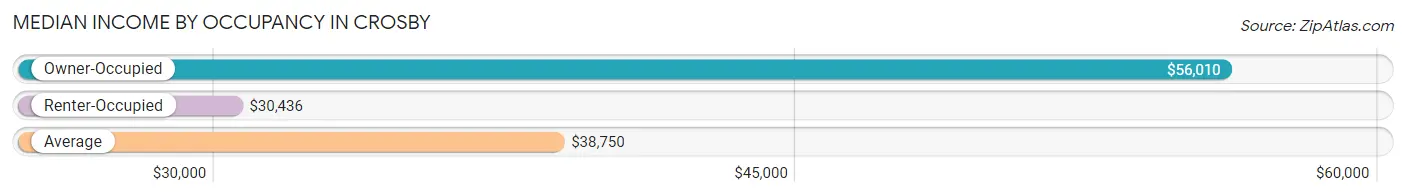
| Occupancy Type | # Households | Median Income |
| Owner-Occupied | 587 (59.1%) | $56,010 |
| Renter-Occupied | 407 (40.9%) | $30,436 |
| Average | 994 (100.0%) | $38,750 |
Occupancy by Householder Income Bracket in Crosby
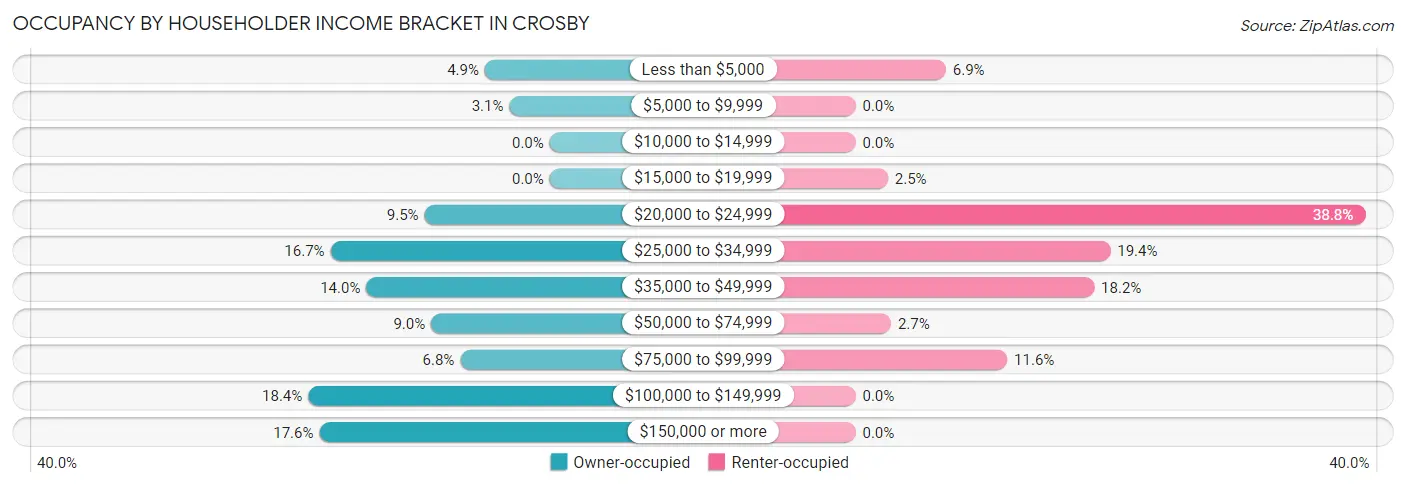
| Income Bracket | Owner-occupied | Renter-occupied |
| Less than $5,000 | 29 (4.9%) | 28 (6.9%) |
| $5,000 to $9,999 | 18 (3.1%) | 0 (0.0%) |
| $10,000 to $14,999 | 0 (0.0%) | 0 (0.0%) |
| $15,000 to $19,999 | 0 (0.0%) | 10 (2.5%) |
| $20,000 to $24,999 | 56 (9.5%) | 158 (38.8%) |
| $25,000 to $34,999 | 98 (16.7%) | 79 (19.4%) |
| $35,000 to $49,999 | 82 (14.0%) | 74 (18.2%) |
| $50,000 to $74,999 | 53 (9.0%) | 11 (2.7%) |
| $75,000 to $99,999 | 40 (6.8%) | 47 (11.6%) |
| $100,000 to $149,999 | 108 (18.4%) | 0 (0.0%) |
| $150,000 or more | 103 (17.5%) | 0 (0.0%) |
| Total | 587 (100.0%) | 407 (100.0%) |
Monthly Housing Cost Tiers in Crosby
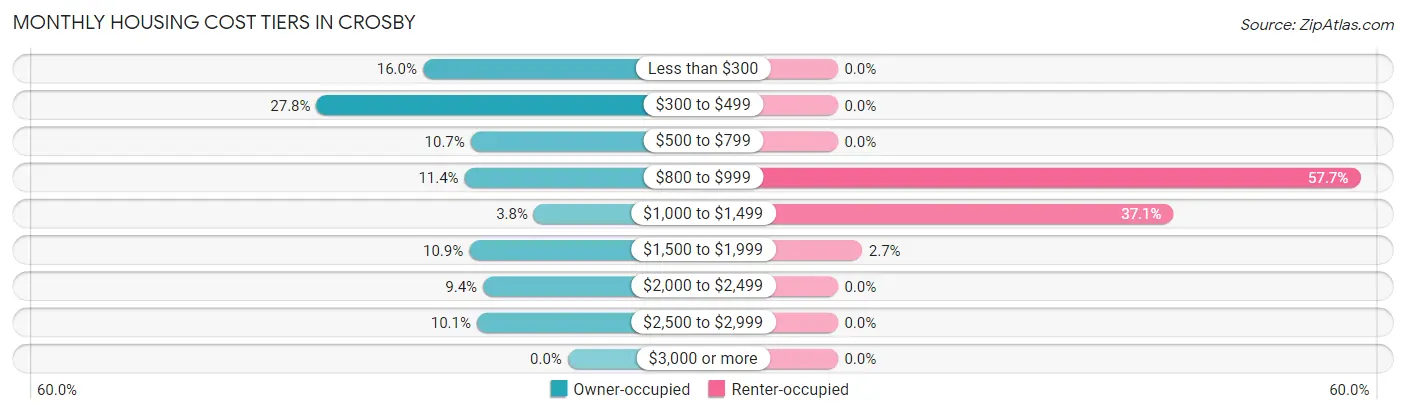
| Monthly Cost | Owner-occupied | Renter-occupied |
| Less than $300 | 94 (16.0%) | 0 (0.0%) |
| $300 to $499 | 163 (27.8%) | 0 (0.0%) |
| $500 to $799 | 63 (10.7%) | 0 (0.0%) |
| $800 to $999 | 67 (11.4%) | 235 (57.7%) |
| $1,000 to $1,499 | 22 (3.7%) | 151 (37.1%) |
| $1,500 to $1,999 | 64 (10.9%) | 11 (2.7%) |
| $2,000 to $2,499 | 55 (9.4%) | 0 (0.0%) |
| $2,500 to $2,999 | 59 (10.1%) | 0 (0.0%) |
| $3,000 or more | 0 (0.0%) | 0 (0.0%) |
| Total | 587 (100.0%) | 407 (100.0%) |
Physical Housing Characteristics in Crosby
Housing Structures in Crosby
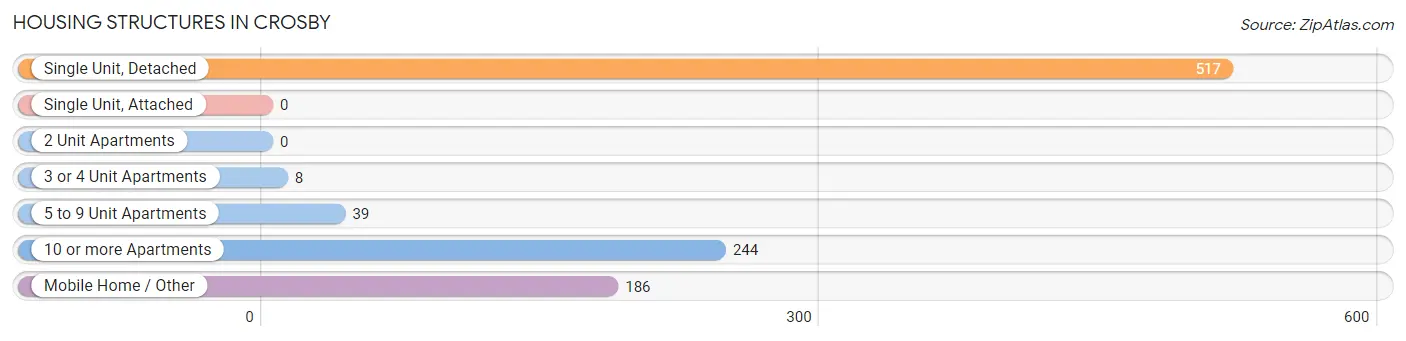
| Structure Type | # Housing Units | % Housing Units |
| Single Unit, Detached | 517 | 52.0% |
| Single Unit, Attached | 0 | 0.0% |
| 2 Unit Apartments | 0 | 0.0% |
| 3 or 4 Unit Apartments | 8 | 0.8% |
| 5 to 9 Unit Apartments | 39 | 3.9% |
| 10 or more Apartments | 244 | 24.5% |
| Mobile Home / Other | 186 | 18.7% |
| Total | 994 | 100.0% |
Housing Structures by Occupancy in Crosby
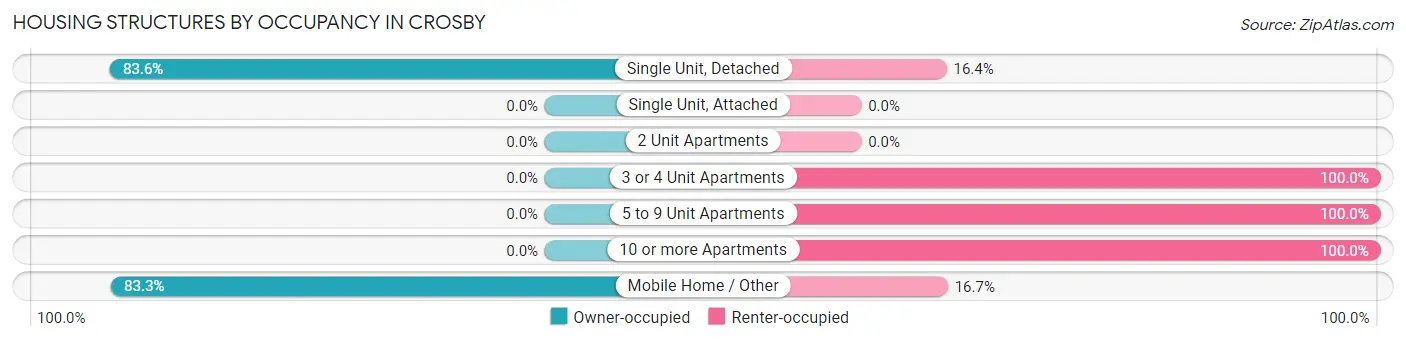
| Structure Type | Owner-occupied | Renter-occupied |
| Single Unit, Detached | 432 (83.6%) | 85 (16.4%) |
| Single Unit, Attached | 0 (0.0%) | 0 (0.0%) |
| 2 Unit Apartments | 0 (0.0%) | 0 (0.0%) |
| 3 or 4 Unit Apartments | 0 (0.0%) | 8 (100.0%) |
| 5 to 9 Unit Apartments | 0 (0.0%) | 39 (100.0%) |
| 10 or more Apartments | 0 (0.0%) | 244 (100.0%) |
| Mobile Home / Other | 155 (83.3%) | 31 (16.7%) |
| Total | 587 (59.1%) | 407 (40.9%) |
Housing Structures by Number of Rooms in Crosby
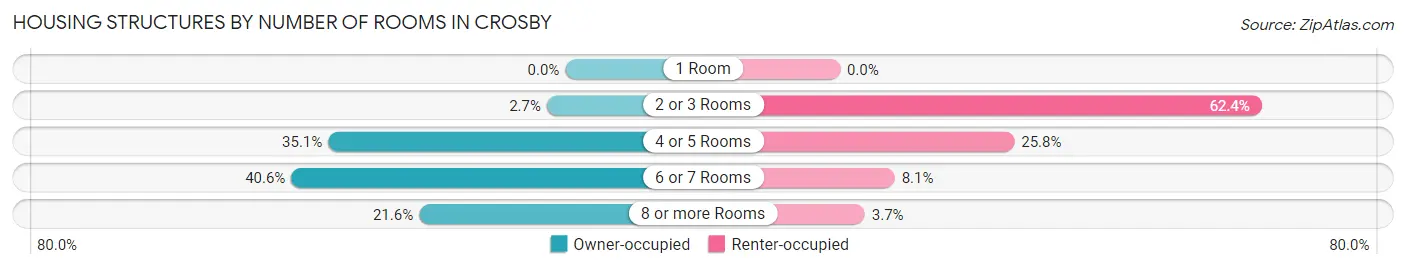
| Number of Rooms | Owner-occupied | Renter-occupied |
| 1 Room | 0 (0.0%) | 0 (0.0%) |
| 2 or 3 Rooms | 16 (2.7%) | 254 (62.4%) |
| 4 or 5 Rooms | 206 (35.1%) | 105 (25.8%) |
| 6 or 7 Rooms | 238 (40.6%) | 33 (8.1%) |
| 8 or more Rooms | 127 (21.6%) | 15 (3.7%) |
| Total | 587 (100.0%) | 407 (100.0%) |
Housing Structure by Heating Type in Crosby
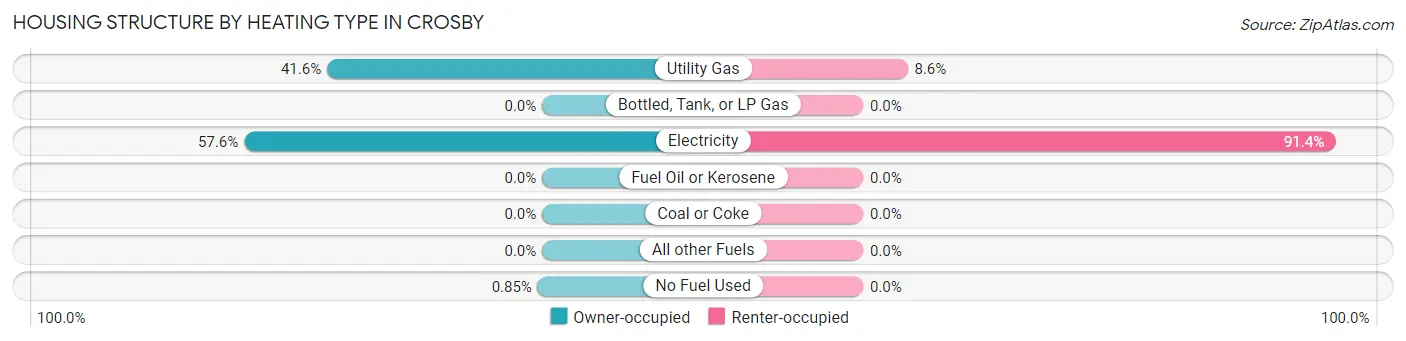
| Heating Type | Owner-occupied | Renter-occupied |
| Utility Gas | 244 (41.6%) | 35 (8.6%) |
| Bottled, Tank, or LP Gas | 0 (0.0%) | 0 (0.0%) |
| Electricity | 338 (57.6%) | 372 (91.4%) |
| Fuel Oil or Kerosene | 0 (0.0%) | 0 (0.0%) |
| Coal or Coke | 0 (0.0%) | 0 (0.0%) |
| All other Fuels | 0 (0.0%) | 0 (0.0%) |
| No Fuel Used | 5 (0.9%) | 0 (0.0%) |
| Total | 587 (100.0%) | 407 (100.0%) |
Household Vehicle Usage in Crosby
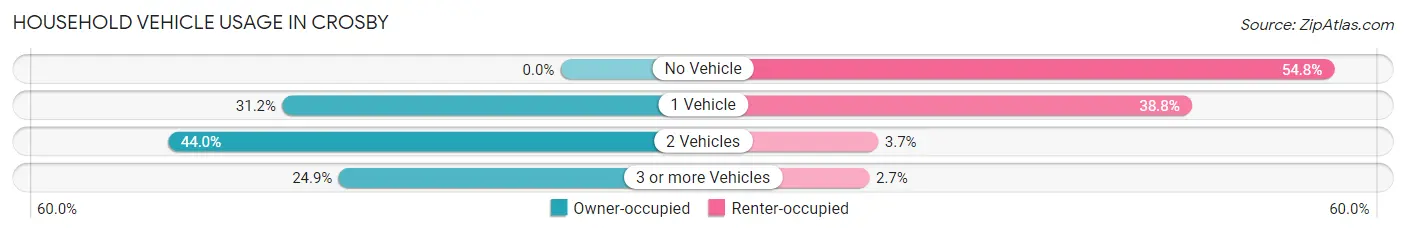
| Vehicles per Household | Owner-occupied | Renter-occupied |
| No Vehicle | 0 (0.0%) | 223 (54.8%) |
| 1 Vehicle | 183 (31.2%) | 158 (38.8%) |
| 2 Vehicles | 258 (44.0%) | 15 (3.7%) |
| 3 or more Vehicles | 146 (24.9%) | 11 (2.7%) |
| Total | 587 (100.0%) | 407 (100.0%) |
Real Estate & Mortgages in Crosby
Real Estate and Mortgage Overview in Crosby
| Characteristic | Without Mortgage | With Mortgage |
| Housing Units | 387 | 200 |
| Median Property Value | - | - |
| Median Household Income | - | - |
| Monthly Housing Costs | $408 | $0 |
| Real Estate Taxes | $1,205 | $0 |
Property Value by Mortgage Status in Crosby
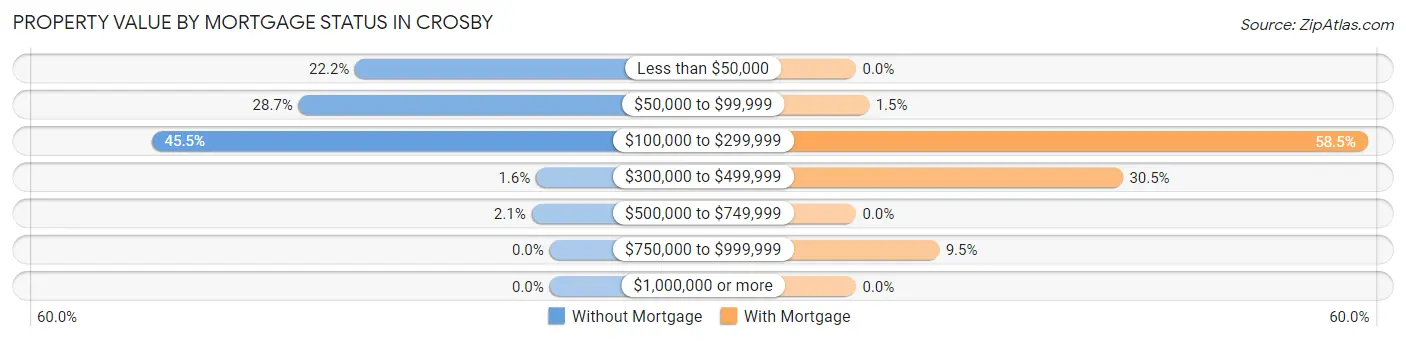
| Property Value | Without Mortgage | With Mortgage |
| Less than $50,000 | 86 (22.2%) | 0 (0.0%) |
| $50,000 to $99,999 | 111 (28.7%) | 3 (1.5%) |
| $100,000 to $299,999 | 176 (45.5%) | 117 (58.5%) |
| $300,000 to $499,999 | 6 (1.5%) | 61 (30.5%) |
| $500,000 to $749,999 | 8 (2.1%) | 0 (0.0%) |
| $750,000 to $999,999 | 0 (0.0%) | 19 (9.5%) |
| $1,000,000 or more | 0 (0.0%) | 0 (0.0%) |
| Total | 387 (100.0%) | 200 (100.0%) |
Household Income by Mortgage Status in Crosby
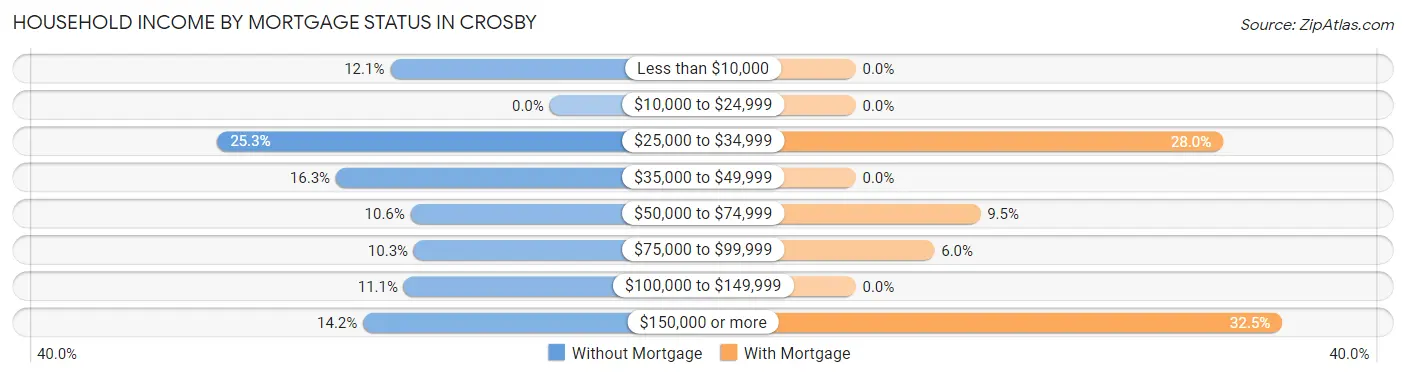
| Household Income | Without Mortgage | With Mortgage |
| Less than $10,000 | 47 (12.1%) | 0 (0.0%) |
| $10,000 to $24,999 | 0 (0.0%) | 0 (0.0%) |
| $25,000 to $34,999 | 98 (25.3%) | 56 (28.0%) |
| $35,000 to $49,999 | 63 (16.3%) | 0 (0.0%) |
| $50,000 to $74,999 | 41 (10.6%) | 19 (9.5%) |
| $75,000 to $99,999 | 40 (10.3%) | 12 (6.0%) |
| $100,000 to $149,999 | 43 (11.1%) | 0 (0.0%) |
| $150,000 or more | 55 (14.2%) | 65 (32.5%) |
| Total | 387 (100.0%) | 200 (100.0%) |
Property Value to Household Income Ratio in Crosby
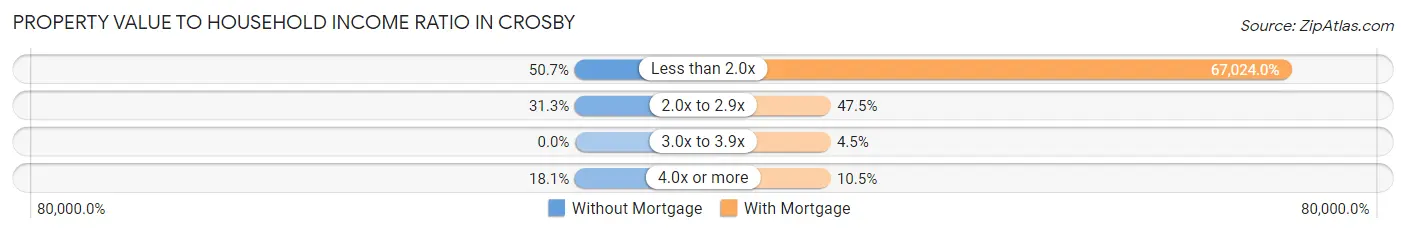
| Value-to-Income Ratio | Without Mortgage | With Mortgage |
| Less than 2.0x | 196 (50.6%) | 134,048 (67,024.0%) |
| 2.0x to 2.9x | 121 (31.3%) | 95 (47.5%) |
| 3.0x to 3.9x | 0 (0.0%) | 9 (4.5%) |
| 4.0x or more | 70 (18.1%) | 21 (10.5%) |
| Total | 387 (100.0%) | 200 (100.0%) |
Real Estate Taxes by Mortgage Status in Crosby
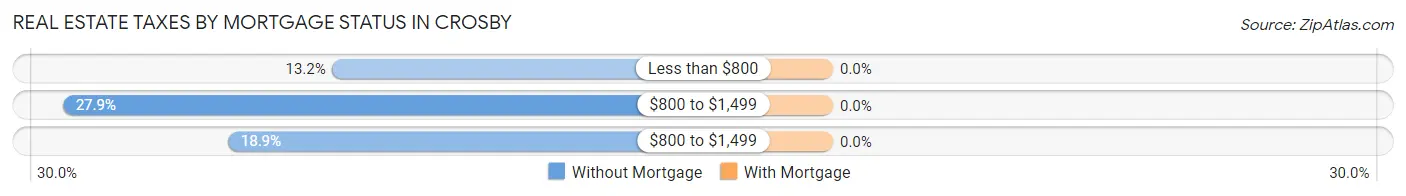
| Property Taxes | Without Mortgage | With Mortgage |
| Less than $800 | 51 (13.2%) | 0 (0.0%) |
| $800 to $1,499 | 108 (27.9%) | 0 (0.0%) |
| $800 to $1,499 | 73 (18.9%) | 0 (0.0%) |
| Total | 387 (100.0%) | 200 (100.0%) |
Health & Disability in Crosby
Health Insurance Coverage by Age in Crosby
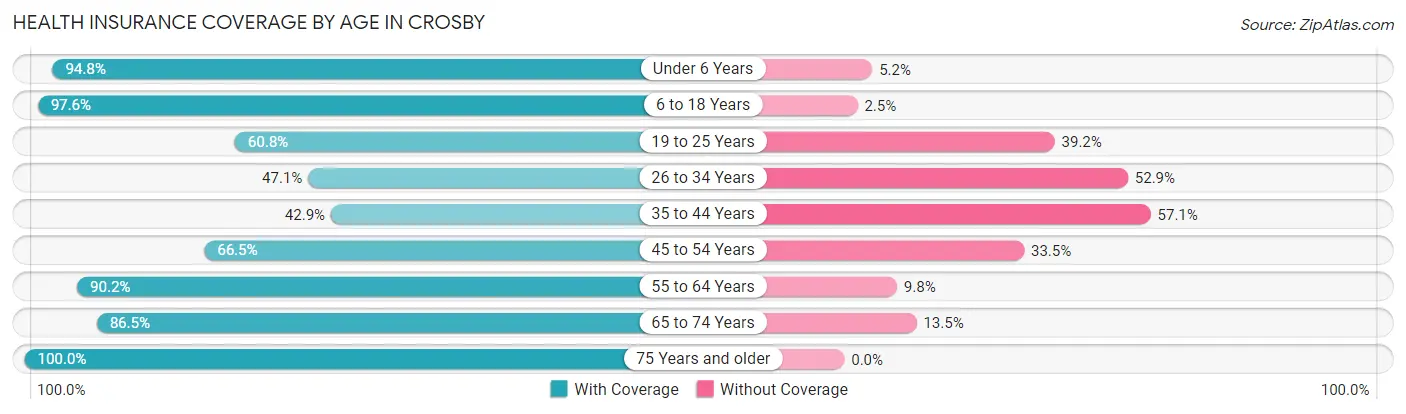
| Age Bracket | With Coverage | Without Coverage |
| Under 6 Years | 91 (94.8%) | 5 (5.2%) |
| 6 to 18 Years | 358 (97.6%) | 9 (2.5%) |
| 19 to 25 Years | 62 (60.8%) | 40 (39.2%) |
| 26 to 34 Years | 90 (47.1%) | 101 (52.9%) |
| 35 to 44 Years | 220 (42.9%) | 293 (57.1%) |
| 45 to 54 Years | 232 (66.5%) | 117 (33.5%) |
| 55 to 64 Years | 193 (90.2%) | 21 (9.8%) |
| 65 to 74 Years | 180 (86.5%) | 28 (13.5%) |
| 75 Years and older | 24 (100.0%) | 0 (0.0%) |
| Total | 1,450 (70.3%) | 614 (29.7%) |
Health Insurance Coverage by Citizenship Status in Crosby
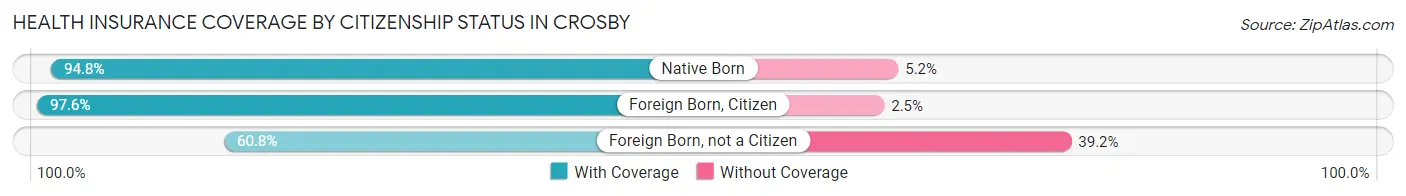
| Citizenship Status | With Coverage | Without Coverage |
| Native Born | 91 (94.8%) | 5 (5.2%) |
| Foreign Born, Citizen | 358 (97.6%) | 9 (2.5%) |
| Foreign Born, not a Citizen | 62 (60.8%) | 40 (39.2%) |
Health Insurance Coverage by Household Income in Crosby
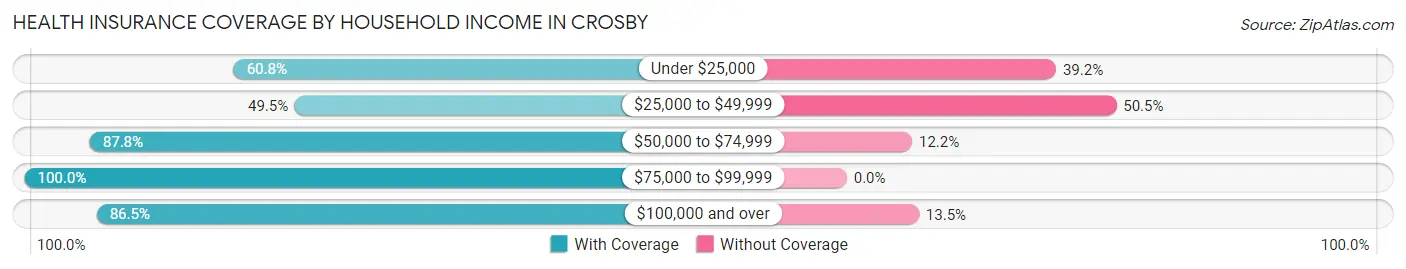
| Household Income | With Coverage | Without Coverage |
| Under $25,000 | 315 (60.8%) | 203 (39.2%) |
| $25,000 to $49,999 | 305 (49.5%) | 311 (50.5%) |
| $50,000 to $74,999 | 165 (87.8%) | 23 (12.2%) |
| $75,000 to $99,999 | 178 (100.0%) | 0 (0.0%) |
| $100,000 and over | 480 (86.5%) | 75 (13.5%) |
Public vs Private Health Insurance Coverage by Age in Crosby
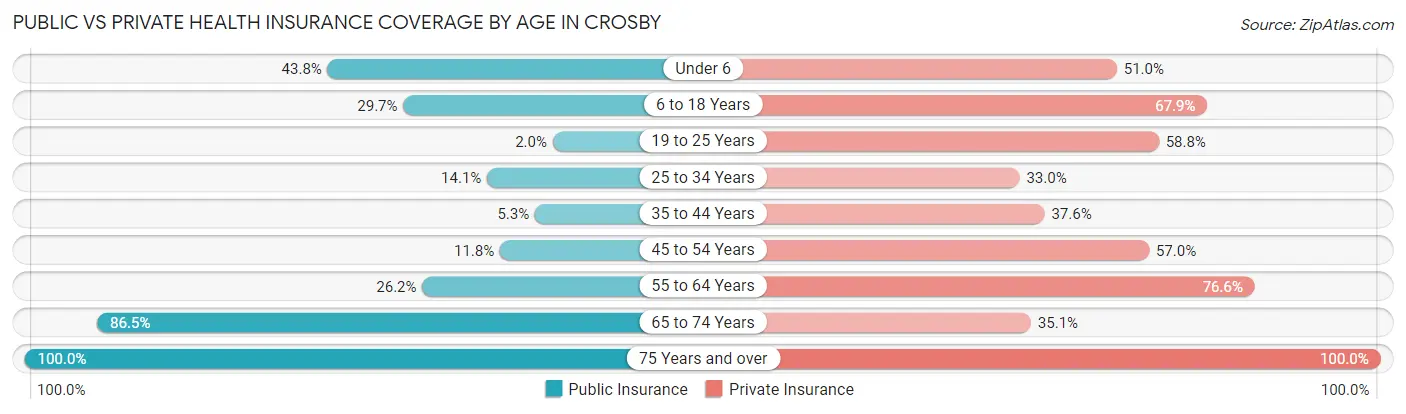
| Age Bracket | Public Insurance | Private Insurance |
| Under 6 | 42 (43.8%) | 49 (51.0%) |
| 6 to 18 Years | 109 (29.7%) | 249 (67.8%) |
| 19 to 25 Years | 2 (2.0%) | 60 (58.8%) |
| 25 to 34 Years | 27 (14.1%) | 63 (33.0%) |
| 35 to 44 Years | 27 (5.3%) | 193 (37.6%) |
| 45 to 54 Years | 41 (11.7%) | 199 (57.0%) |
| 55 to 64 Years | 56 (26.2%) | 164 (76.6%) |
| 65 to 74 Years | 180 (86.5%) | 73 (35.1%) |
| 75 Years and over | 24 (100.0%) | 24 (100.0%) |
| Total | 508 (24.6%) | 1,074 (52.0%) |
Disability Status by Sex by Age in Crosby
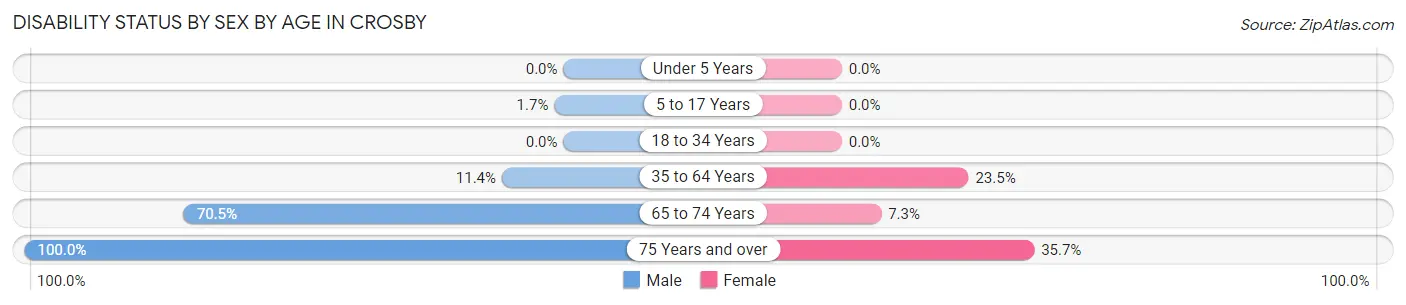
| Age Bracket | Male | Female |
| Under 5 Years | 0 (0.0%) | 0 (0.0%) |
| 5 to 17 Years | 4 (1.7%) | 0 (0.0%) |
| 18 to 34 Years | 0 (0.0%) | 0 (0.0%) |
| 35 to 64 Years | 67 (11.4%) | 115 (23.5%) |
| 65 to 74 Years | 31 (70.5%) | 12 (7.3%) |
| 75 Years and over | 10 (100.0%) | 5 (35.7%) |
Disability Class by Sex by Age in Crosby
Disability Class: Hearing Difficulty
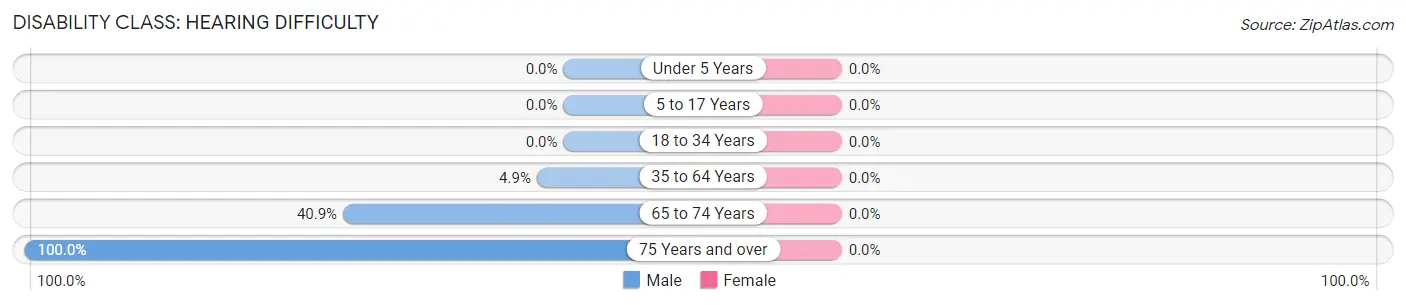
| Age Bracket | Male | Female |
| Under 5 Years | 0 (0.0%) | 0 (0.0%) |
| 5 to 17 Years | 0 (0.0%) | 0 (0.0%) |
| 18 to 34 Years | 0 (0.0%) | 0 (0.0%) |
| 35 to 64 Years | 29 (4.9%) | 0 (0.0%) |
| 65 to 74 Years | 18 (40.9%) | 0 (0.0%) |
| 75 Years and over | 10 (100.0%) | 0 (0.0%) |
Disability Class: Vision Difficulty
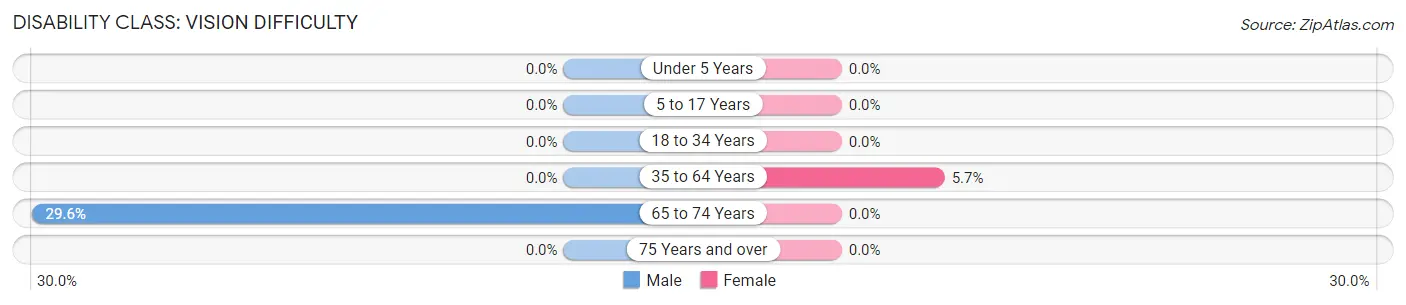
| Age Bracket | Male | Female |
| Under 5 Years | 0 (0.0%) | 0 (0.0%) |
| 5 to 17 Years | 0 (0.0%) | 0 (0.0%) |
| 18 to 34 Years | 0 (0.0%) | 0 (0.0%) |
| 35 to 64 Years | 0 (0.0%) | 28 (5.7%) |
| 65 to 74 Years | 13 (29.5%) | 0 (0.0%) |
| 75 Years and over | 0 (0.0%) | 0 (0.0%) |
Disability Class: Cognitive Difficulty
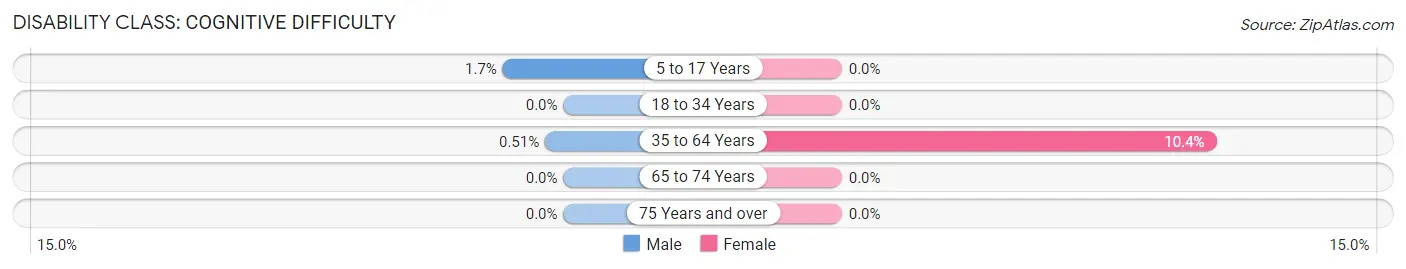
| Age Bracket | Male | Female |
| 5 to 17 Years | 4 (1.7%) | 0 (0.0%) |
| 18 to 34 Years | 0 (0.0%) | 0 (0.0%) |
| 35 to 64 Years | 3 (0.5%) | 51 (10.4%) |
| 65 to 74 Years | 0 (0.0%) | 0 (0.0%) |
| 75 Years and over | 0 (0.0%) | 0 (0.0%) |
Disability Class: Ambulatory Difficulty
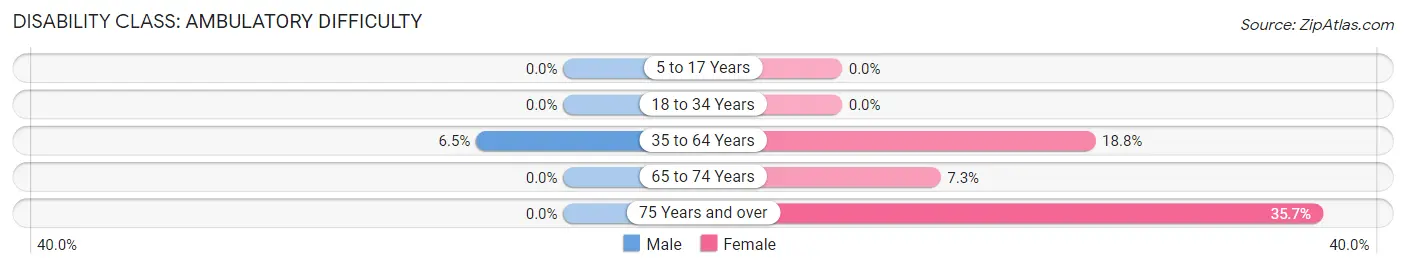
| Age Bracket | Male | Female |
| 5 to 17 Years | 0 (0.0%) | 0 (0.0%) |
| 18 to 34 Years | 0 (0.0%) | 0 (0.0%) |
| 35 to 64 Years | 38 (6.5%) | 92 (18.8%) |
| 65 to 74 Years | 0 (0.0%) | 12 (7.3%) |
| 75 Years and over | 0 (0.0%) | 5 (35.7%) |
Disability Class: Self-Care Difficulty
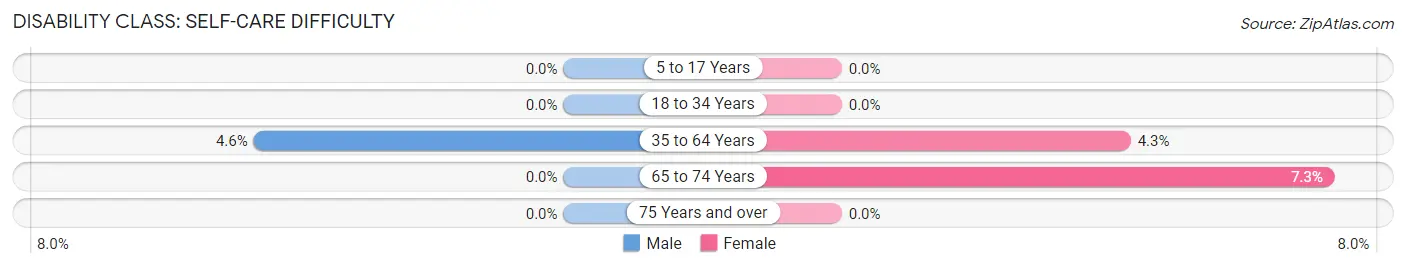
| Age Bracket | Male | Female |
| 5 to 17 Years | 0 (0.0%) | 0 (0.0%) |
| 18 to 34 Years | 0 (0.0%) | 0 (0.0%) |
| 35 to 64 Years | 27 (4.6%) | 21 (4.3%) |
| 65 to 74 Years | 0 (0.0%) | 12 (7.3%) |
| 75 Years and over | 0 (0.0%) | 0 (0.0%) |
Technology Access in Crosby
Computing Device Access in Crosby
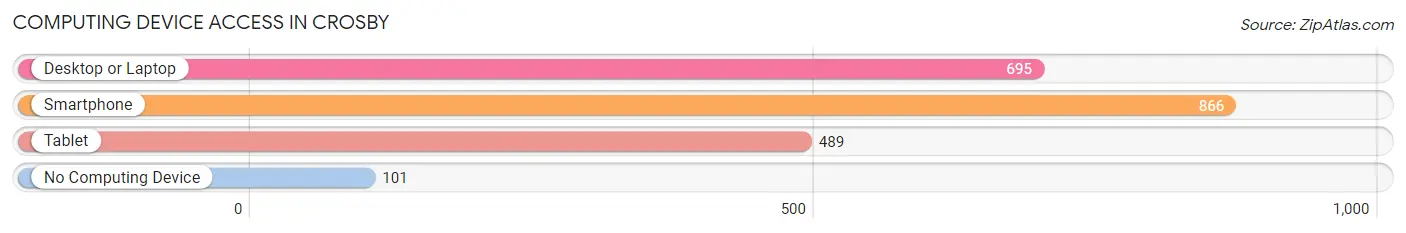
| Device Type | # Households | % Households |
| Desktop or Laptop | 695 | 69.9% |
| Smartphone | 866 | 87.1% |
| Tablet | 489 | 49.2% |
| No Computing Device | 101 | 10.2% |
| Total | 994 | 100.0% |
Internet Access in Crosby
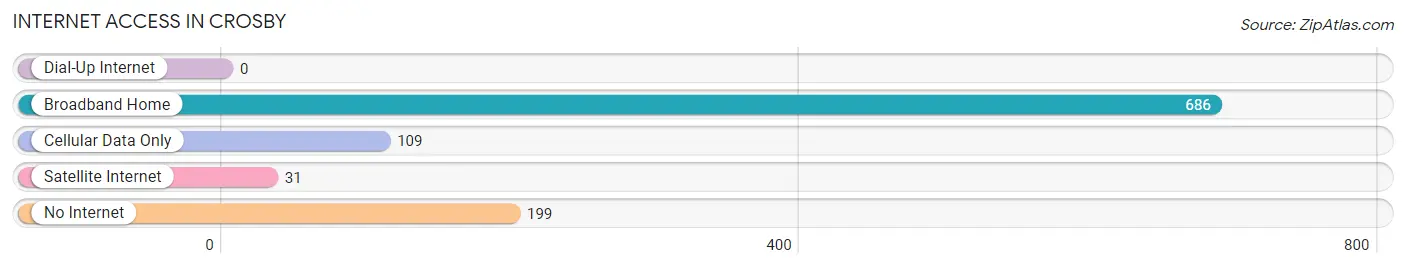
| Internet Type | # Households | % Households |
| Dial-Up Internet | 0 | 0.0% |
| Broadband Home | 686 | 69.0% |
| Cellular Data Only | 109 | 11.0% |
| Satellite Internet | 31 | 3.1% |
| No Internet | 199 | 20.0% |
| Total | 994 | 100.0% |
Crosby Summary
Crosby, Texas is a small town located in Harris County, Texas, United States. It is situated approximately 25 miles northeast of Houston and is part of the Houston–The Woodlands–Sugar Land metropolitan area. The town was founded in 1879 and was named after Stephen Crosby, a local landowner. As of the 2010 census, the population of Crosby was 1,769.
History
The area that is now Crosby was originally inhabited by the Karankawa Indians. The first settlers in the area were Stephen Crosby and his family, who arrived in 1879. Crosby purchased land from the Houston and Great Northern Railroad and established a post office in 1881. The town was officially incorporated in 1887.
In the early 1900s, Crosby was a thriving agricultural community, with cotton, corn, and sugar cane being the main crops. The town also had a sawmill, a gristmill, and a cotton gin. In the 1920s, the town began to experience a population boom, as oil was discovered in the area. This led to the establishment of several oil refineries in the area, which provided jobs for many of the town’s residents.
Geography
Crosby is located at 29°59'25"N 95°7'25"W (29.990278, -95.123611). It is situated approximately 25 miles northeast of Houston and is part of the Houston–The Woodlands–Sugar Land metropolitan area. The town has a total area of 2.2 square miles, all of which is land.
Economy
Crosby’s economy is largely based on the oil and gas industry. The town is home to several oil refineries, including the Crosby Refinery, which is owned by Valero Energy Corporation. The town is also home to several manufacturing companies, including Crosby Manufacturing, which produces industrial valves and fittings.
Demographics
As of the 2010 census, the population of Crosby was 1,769. The racial makeup of the town was 79.2% White, 11.2% African American, 0.3% Native American, 0.7% Asian, 0.1% Pacific Islander, 6.2% from other races, and 2.3% from two or more races. Hispanic or Latino of any race were 18.2% of the population.
The median income for a household in the town was $45,938, and the median income for a family was $51,250. Males had a median income of $41,250 versus $30,000 for females. The per capita income for the town was $20,945. About 11.2% of families and 13.2% of the population were below the poverty line, including 17.2% of those under age 18 and 8.2% of those age 65 or over.
Common Questions
What is Per Capita Income in Crosby?
Per Capita income in Crosby is $30,930.
What is the Median Family Income in Crosby?
Median Family Income in Crosby is $48,355.
What is the Median Household income in Crosby?
Median Household Income in Crosby is $38,750.
What is Income or Wage Gap in Crosby?
Income or Wage Gap in Crosby is 43.2%.
Women in Crosby earn 56.8 cents for every dollar earned by a man.
What is Inequality or Gini Index in Crosby?
Inequality or Gini Index in Crosby is 0.47.
What is the Total Population of Crosby?
Total Population of Crosby is 2,064.
What is the Total Male Population of Crosby?
Total Male Population of Crosby is 1,167.
What is the Total Female Population of Crosby?
Total Female Population of Crosby is 897.
What is the Ratio of Males per 100 Females in Crosby?
There are 130.10 Males per 100 Females in Crosby.
What is the Ratio of Females per 100 Males in Crosby?
There are 76.86 Females per 100 Males in Crosby.
What is the Median Population Age in Crosby?
Median Population Age in Crosby is 38.4 Years.
What is the Average Family Size in Crosby
Average Family Size in Crosby is 2.9 People.
What is the Average Household Size in Crosby
Average Household Size in Crosby is 2.1 People.
How Large is the Labor Force in Crosby?
There are 1,124 People in the Labor Forcein in Crosby.
What is the Percentage of People in the Labor Force in Crosby?
65.6% of People are in the Labor Force in Crosby.
What is the Unemployment Rate in Crosby?
Unemployment Rate in Crosby is 3.3%.