Zip Codes with the Highest Percentage of Population Employed in Community & Social Service in North Richland Hills, TX
RELATED REPORTS & OPTIONS
Community & Social Service
North Richland Hills
Compare Zip Codes
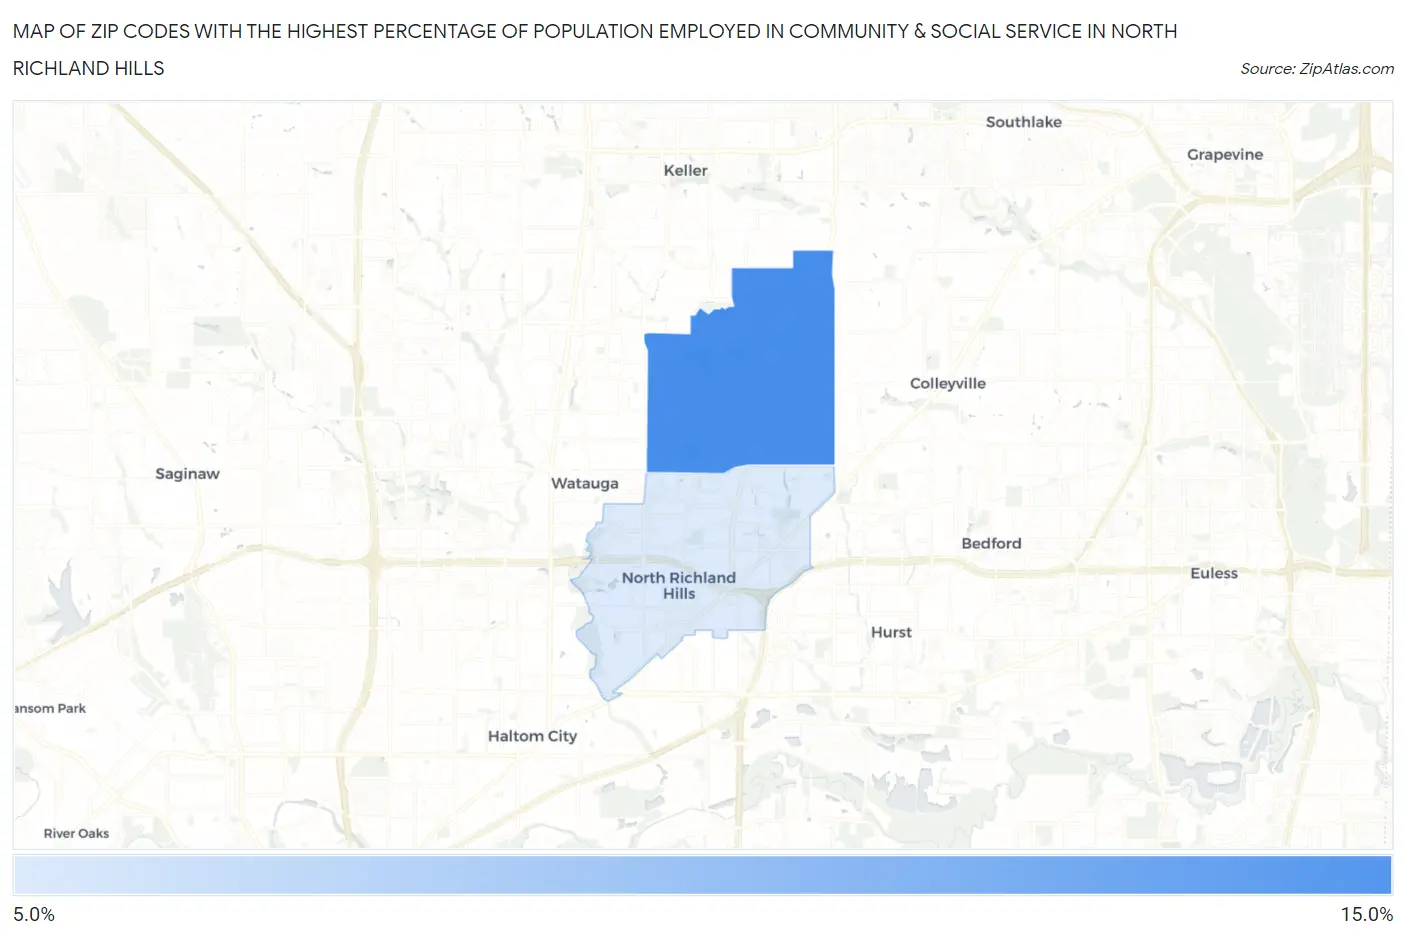
Map of Zip Codes with the Highest Percentage of Population Employed in Community & Social Service in North Richland Hills
9.5%
12.0%
Zip Codes with the Highest Percentage of Population Employed in Community & Social Service in North Richland Hills, TX
| Zip Code | % Employed | vs State | vs National | |
| 1. | 76182 | 12.0% | 10.5%(+1.50)#518 | 11.2%(+0.794)#9,353 |
| 2. | 76180 | 9.5% | 10.5%(-1.00)#917 | 11.2%(-1.71)#15,411 |
1
Common Questions
What are the Top Zip Codes with the Highest Percentage of Population Employed in Community & Social Service in North Richland Hills, TX?
Top Zip Codes with the Highest Percentage of Population Employed in Community & Social Service in North Richland Hills, TX are:
What zip code has the Highest Percentage of Population Employed in Community & Social Service in North Richland Hills, TX?
76182 has the Highest Percentage of Population Employed in Community & Social Service in North Richland Hills, TX with 12.0%.
What is the Percentage of Population Employed in Community & Social Service in North Richland Hills, TX?
Percentage of Population Employed in Community & Social Service in North Richland Hills is 10.7%.
What is the Percentage of Population Employed in Community & Social Service in Texas?
Percentage of Population Employed in Community & Social Service in Texas is 10.5%.
What is the Percentage of Population Employed in Community & Social Service in the United States?
Percentage of Population Employed in Community & Social Service in the United States is 11.2%.