Childress, TX Map & Demographics
Childress Map
Childress Overview
$25,762
PER CAPITA INCOME
$52,339
AVG FAMILY INCOME
$55,500
AVG HOUSEHOLD INCOME
34.0%
WAGE / INCOME GAP [ % ]
66.0¢/ $1
WAGE / INCOME GAP [ $ ]
0.47
INEQUALITY / GINI INDEX
5,786
TOTAL POPULATION
3,817
MALE POPULATION
1,969
FEMALE POPULATION
193.85
MALES / 100 FEMALES
51.59
FEMALES / 100 MALES
32.3
MEDIAN AGE
3.2
AVG FAMILY SIZE
3.0
AVG HOUSEHOLD SIZE
2,577
LABOR FORCE [ PEOPLE ]
53.4%
PERCENT IN LABOR FORCE
9.9%
UNEMPLOYMENT RATE
Childress Zip Codes
Childress Area Codes
Income in Childress
Income Overview in Childress
Per Capita Income in Childress is $25,762, while median incomes of families and households are $52,339 and $55,500 respectively.
| Characteristic | Number | Measure |
| Per Capita Income | 5,786 | $25,762 |
| Median Family Income | 1,050 | $52,339 |
| Mean Family Income | 1,050 | $68,530 |
| Median Household Income | 1,464 | $55,500 |
| Mean Household Income | 1,464 | $74,344 |
| Income Deficit | 1,050 | $0 |
| Wage / Income Gap (%) | 5,786 | 33.98% |
| Wage / Income Gap ($) | 5,786 | 66.02¢ per $1 |
| Gini / Inequality Index | 5,786 | 0.47 |
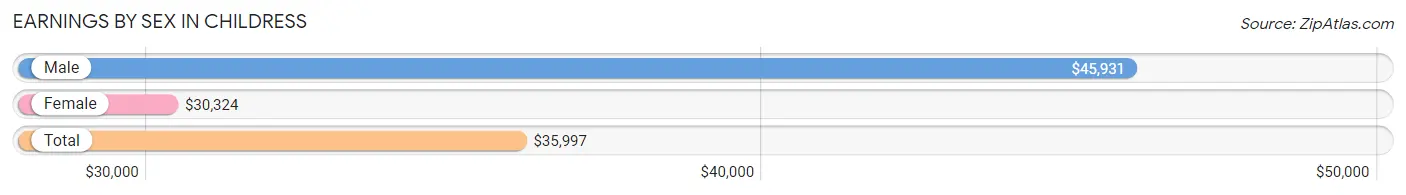
Earnings by Sex in Childress
Average Earnings in Childress are $35,997, $45,931 for men and $30,324 for women, a difference of 34.0%.
| Sex | Number | Average Earnings |
| Male | 1,683 (63.2%) | $45,931 |
| Female | 978 (36.7%) | $30,324 |
| Total | 2,661 (100.0%) | $35,997 |
Earnings by Sex by Income Bracket in Childress
The most common earnings brackets in Childress are $75,000 to $99,999 for men (507 | 30.1%) and $30,000 to $34,999 for women (229 | 23.4%).
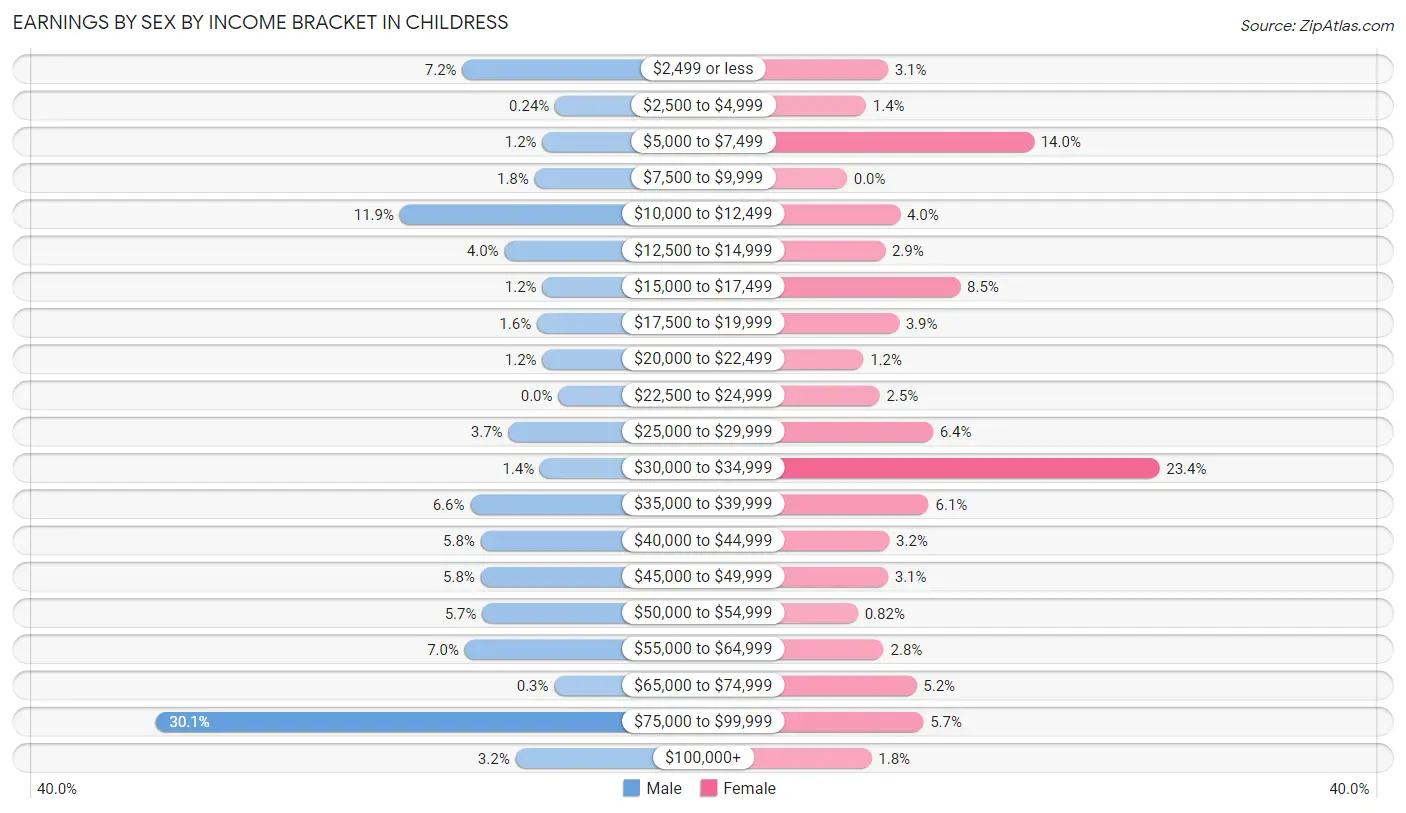
| Income | Male | Female |
| $2,499 or less | 121 (7.2%) | 30 (3.1%) |
| $2,500 to $4,999 | 4 (0.2%) | 14 (1.4%) |
| $5,000 to $7,499 | 20 (1.2%) | 137 (14.0%) |
| $7,500 to $9,999 | 30 (1.8%) | 0 (0.0%) |
| $10,000 to $12,499 | 200 (11.9%) | 39 (4.0%) |
| $12,500 to $14,999 | 68 (4.0%) | 28 (2.9%) |
| $15,000 to $17,499 | 20 (1.2%) | 83 (8.5%) |
| $17,500 to $19,999 | 27 (1.6%) | 38 (3.9%) |
| $20,000 to $22,499 | 20 (1.2%) | 12 (1.2%) |
| $22,500 to $24,999 | 0 (0.0%) | 24 (2.5%) |
| $25,000 to $29,999 | 63 (3.7%) | 63 (6.4%) |
| $30,000 to $34,999 | 23 (1.4%) | 229 (23.4%) |
| $35,000 to $39,999 | 111 (6.6%) | 60 (6.1%) |
| $40,000 to $44,999 | 98 (5.8%) | 31 (3.2%) |
| $45,000 to $49,999 | 98 (5.8%) | 30 (3.1%) |
| $50,000 to $54,999 | 96 (5.7%) | 8 (0.8%) |
| $55,000 to $64,999 | 118 (7.0%) | 27 (2.8%) |
| $65,000 to $74,999 | 5 (0.3%) | 51 (5.2%) |
| $75,000 to $99,999 | 507 (30.1%) | 56 (5.7%) |
| $100,000+ | 54 (3.2%) | 18 (1.8%) |
| Total | 1,683 (100.0%) | 978 (100.0%) |
Earnings by Sex by Educational Attainment in Childress
Average earnings in Childress are $50,556 for men and $30,239 for women, a difference of 40.2%. Men with an educational attainment of high school diploma enjoy the highest average annual earnings of $81,487, while those with college or associate's degree education earn the least with $38,194. Women with an educational attainment of bachelor's degree earn the most with the average annual earnings of $70,196, while those with high school diploma education have the smallest earnings of $16,304.
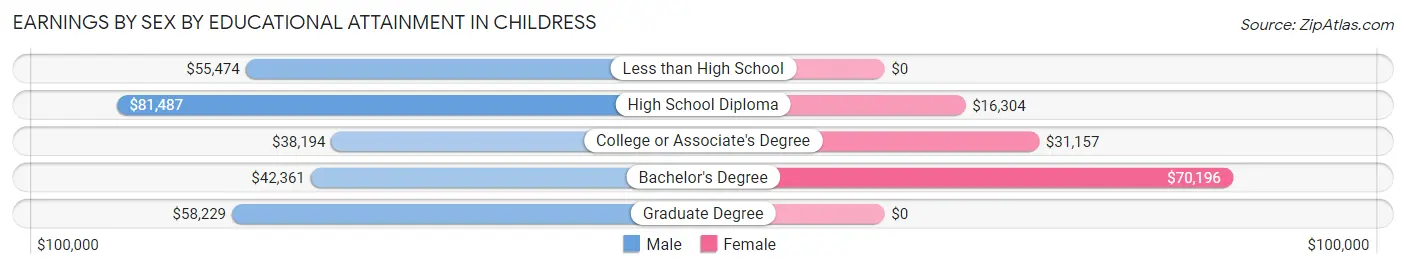
| Educational Attainment | Male Income | Female Income |
| Less than High School | $55,474 | $0 |
| High School Diploma | $81,487 | $16,304 |
| College or Associate's Degree | $38,194 | $31,157 |
| Bachelor's Degree | $42,361 | $70,196 |
| Graduate Degree | $58,229 | $0 |
| Total | $50,556 | $30,239 |
Family Income in Childress
Family Income Brackets in Childress
According to the Childress family income data, there are 216 families falling into the $50,000 to $74,999 income range, which is the most common income bracket and makes up 20.6% of all families.
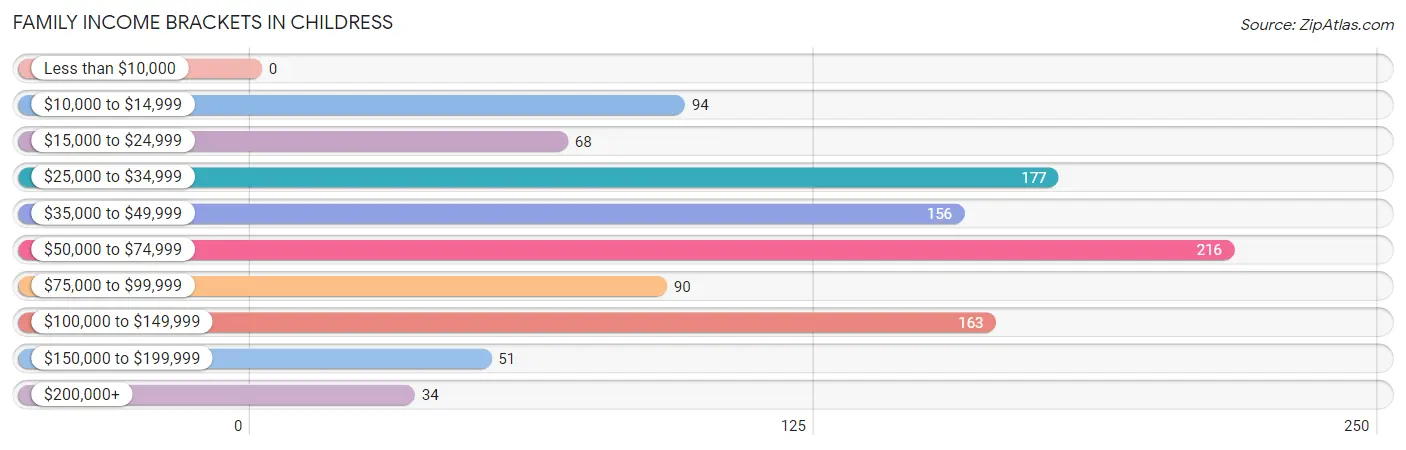
| Income Bracket | # Families | % Families |
| Less than $10,000 | 0 | 0.0% |
| $10,000 to $14,999 | 94 | 9.0% |
| $15,000 to $24,999 | 68 | 6.5% |
| $25,000 to $34,999 | 177 | 16.9% |
| $35,000 to $49,999 | 156 | 14.9% |
| $50,000 to $74,999 | 216 | 20.6% |
| $75,000 to $99,999 | 90 | 8.6% |
| $100,000 to $149,999 | 163 | 15.5% |
| $150,000 to $199,999 | 51 | 4.9% |
| $200,000+ | 34 | 3.2% |
Family Income by Famaliy Size in Childress
2-person families (526 | 50.1%) account for the highest median family income in Childress with $71,071 per family, while 2-person families (526 | 50.1%) have the highest median income of $35,536 per family member.
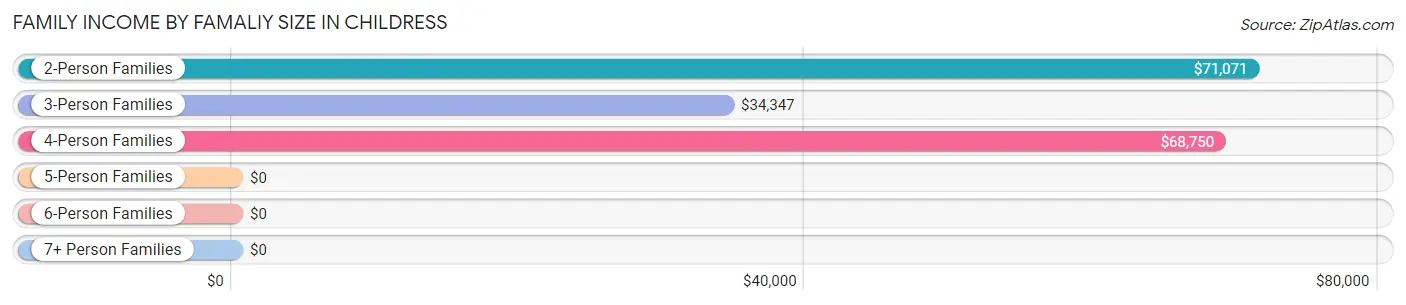
| Income Bracket | # Families | Median Income |
| 2-Person Families | 526 (50.1%) | $71,071 |
| 3-Person Families | 285 (27.1%) | $34,347 |
| 4-Person Families | 152 (14.5%) | $68,750 |
| 5-Person Families | 53 (5.1%) | $0 |
| 6-Person Families | 27 (2.6%) | $0 |
| 7+ Person Families | 7 (0.7%) | $0 |
| Total | 1,050 (100.0%) | $52,339 |
Family Income by Number of Earners in Childress
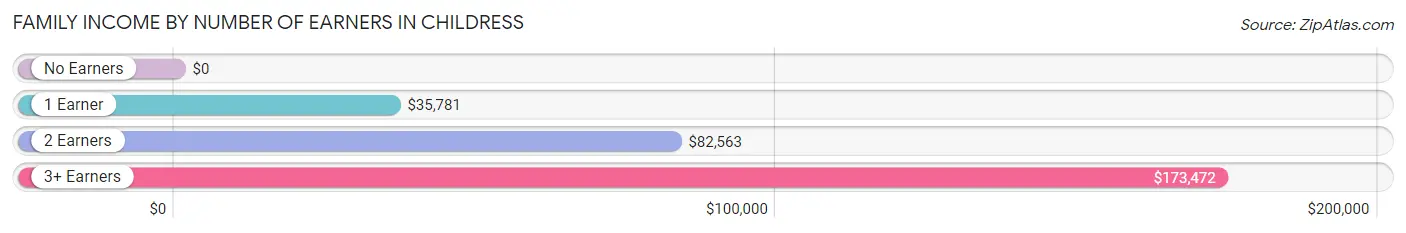
| Number of Earners | # Families | Median Income |
| No Earners | 74 (7.0%) | $0 |
| 1 Earner | 556 (52.9%) | $35,781 |
| 2 Earners | 359 (34.2%) | $82,563 |
| 3+ Earners | 61 (5.8%) | $173,472 |
| Total | 1,050 (100.0%) | $52,339 |
Household Income in Childress
Household Income Brackets in Childress
With 255 households falling in the category, the $100,000 to $149,999 income range is the most frequent in Childress, accounting for 17.4% of all households. In contrast, only 56 households (3.8%) fall into the $200,000+ income bracket, making it the least populous group.
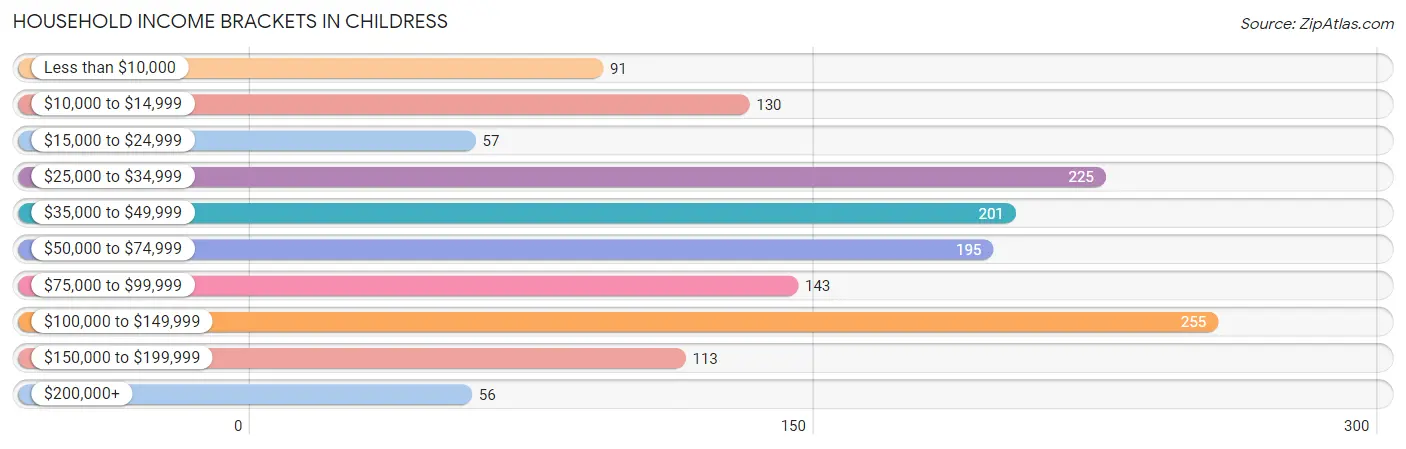
| Income Bracket | # Households | % Households |
| Less than $10,000 | 91 | 6.2% |
| $10,000 to $14,999 | 130 | 8.9% |
| $15,000 to $24,999 | 57 | 3.9% |
| $25,000 to $34,999 | 225 | 15.4% |
| $35,000 to $49,999 | 201 | 13.7% |
| $50,000 to $74,999 | 195 | 13.3% |
| $75,000 to $99,999 | 143 | 9.8% |
| $100,000 to $149,999 | 255 | 17.4% |
| $150,000 to $199,999 | 113 | 7.7% |
| $200,000+ | 56 | 3.8% |
Household Income by Householder Age in Childress
The median household income in Childress is $55,500, with the highest median household income of $58,625 found in the 25 to 44 years age bracket for the primary householder. A total of 508 households (34.7%) fall into this category. Meanwhile, the 15 to 24 years age bracket for the primary householder has the lowest median household income of $0, with 33 households (2.2%) in this group.
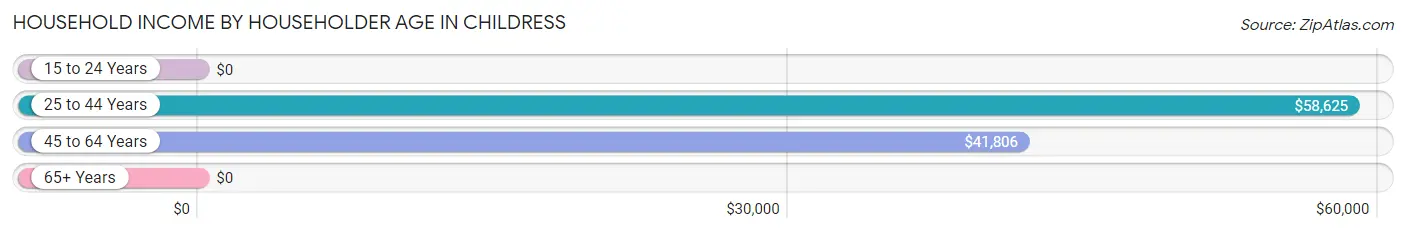
| Income Bracket | # Households | Median Income |
| 15 to 24 Years | 33 (2.2%) | $0 |
| 25 to 44 Years | 508 (34.7%) | $58,625 |
| 45 to 64 Years | 445 (30.4%) | $41,806 |
| 65+ Years | 478 (32.7%) | $0 |
| Total | 1,464 (100.0%) | $55,500 |
Poverty in Childress
Income Below Poverty by Sex and Age in Childress
With 15.1% poverty level for males and 13.2% for females among the residents of Childress, 75 year old and over males and 35 to 44 year old females are the most vulnerable to poverty, with 60 males (58.8%) and 130 females (30.0%) in their respective age groups living below the poverty level.
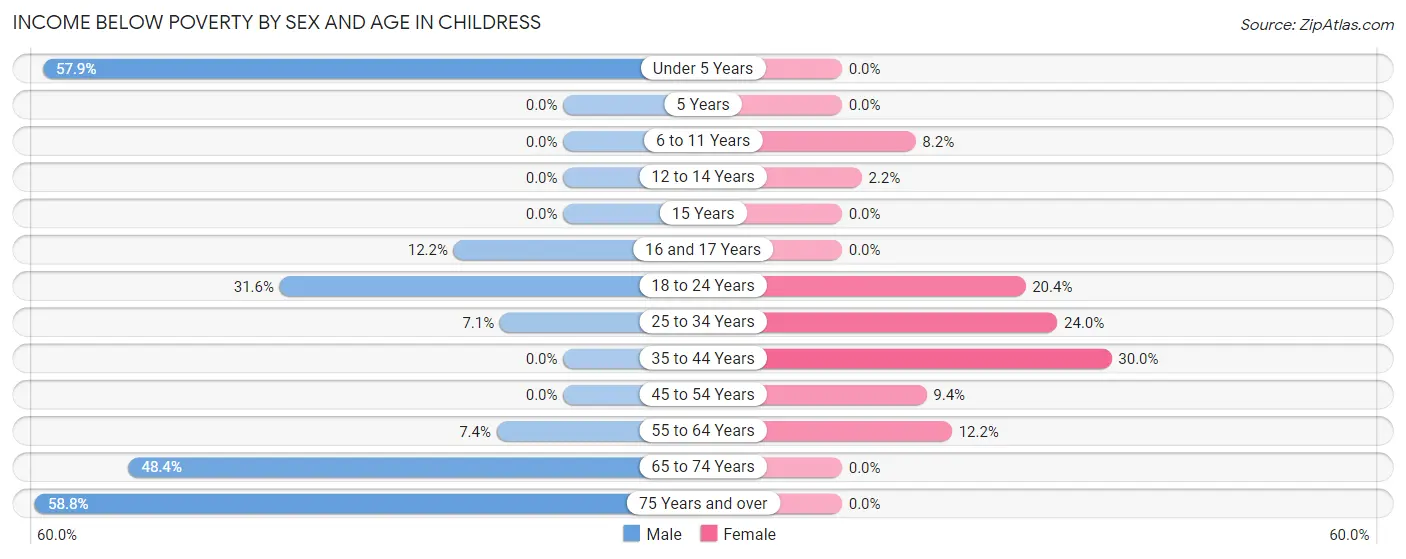
| Age Bracket | Male | Female |
| Under 5 Years | 62 (57.9%) | 0 (0.0%) |
| 5 Years | 0 (0.0%) | 0 (0.0%) |
| 6 to 11 Years | 0 (0.0%) | 26 (8.2%) |
| 12 to 14 Years | 0 (0.0%) | 2 (2.2%) |
| 15 Years | 0 (0.0%) | 0 (0.0%) |
| 16 and 17 Years | 10 (12.2%) | 0 (0.0%) |
| 18 to 24 Years | 48 (31.6%) | 19 (20.4%) |
| 25 to 34 Years | 64 (7.0%) | 41 (24.0%) |
| 35 to 44 Years | 0 (0.0%) | 130 (30.0%) |
| 45 to 54 Years | 0 (0.0%) | 21 (9.4%) |
| 55 to 64 Years | 16 (7.4%) | 12 (12.2%) |
| 65 to 74 Years | 107 (48.4%) | 0 (0.0%) |
| 75 Years and over | 60 (58.8%) | 0 (0.0%) |
| Total | 367 (15.1%) | 251 (13.2%) |
Income Above Poverty by Sex and Age in Childress
According to the poverty statistics in Childress, males aged 5 years and females aged under 5 years are the age groups that are most secure financially, with 100.0% of males and 100.0% of females in these age groups living above the poverty line.
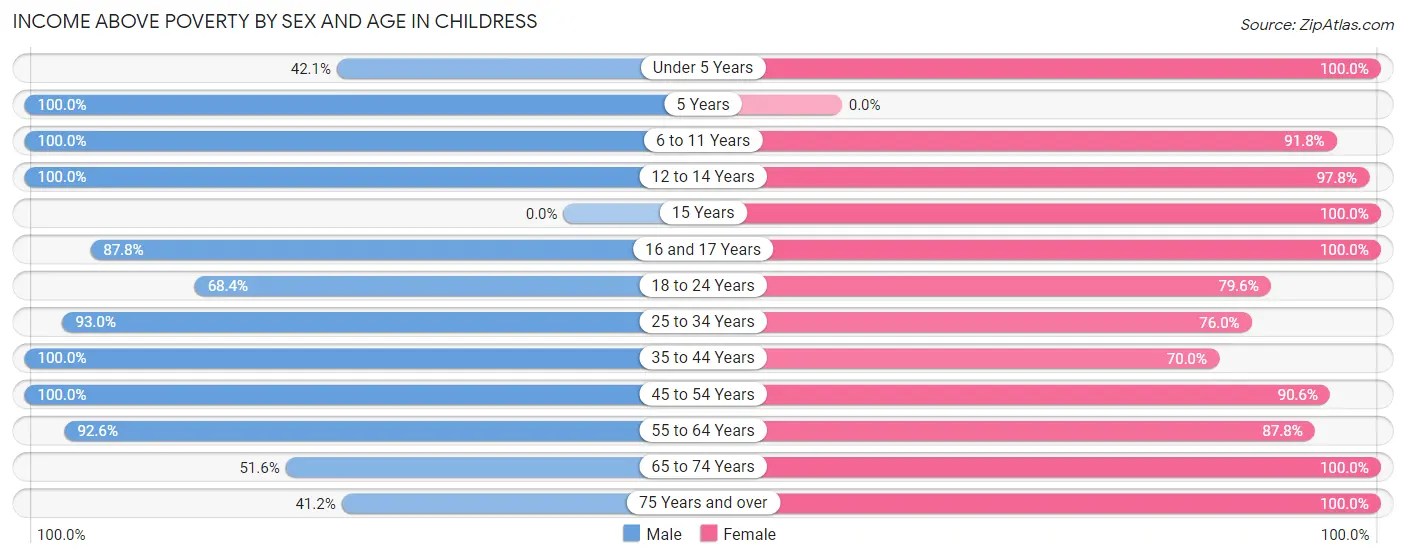
| Age Bracket | Male | Female |
| Under 5 Years | 45 (42.1%) | 134 (100.0%) |
| 5 Years | 14 (100.0%) | 0 (0.0%) |
| 6 to 11 Years | 206 (100.0%) | 291 (91.8%) |
| 12 to 14 Years | 55 (100.0%) | 89 (97.8%) |
| 15 Years | 0 (0.0%) | 36 (100.0%) |
| 16 and 17 Years | 72 (87.8%) | 15 (100.0%) |
| 18 to 24 Years | 104 (68.4%) | 74 (79.6%) |
| 25 to 34 Years | 844 (92.9%) | 130 (76.0%) |
| 35 to 44 Years | 195 (100.0%) | 303 (70.0%) |
| 45 to 54 Years | 173 (100.0%) | 202 (90.6%) |
| 55 to 64 Years | 200 (92.6%) | 86 (87.8%) |
| 65 to 74 Years | 114 (51.6%) | 214 (100.0%) |
| 75 Years and over | 42 (41.2%) | 80 (100.0%) |
| Total | 2,064 (84.9%) | 1,654 (86.8%) |
Income Below Poverty Among Married-Couple Families in Childress
The poverty statistics for married-couple families in Childress show that 6.3% or 37 of the total 589 families live below the poverty line. Families with 1 or 2 children have the highest poverty rate of 22.2%, comprising of 37 families. On the other hand, families with no children have the lowest poverty rate of 0.0%, which includes 0 families.
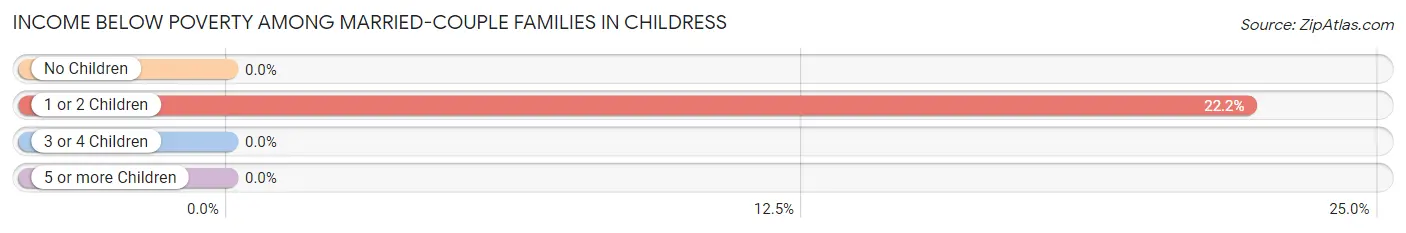
| Children | Above Poverty | Below Poverty |
| No Children | 380 (100.0%) | 0 (0.0%) |
| 1 or 2 Children | 130 (77.8%) | 37 (22.2%) |
| 3 or 4 Children | 42 (100.0%) | 0 (0.0%) |
| 5 or more Children | 0 (0.0%) | 0 (0.0%) |
| Total | 552 (93.7%) | 37 (6.3%) |
Income Below Poverty Among Single-Parent Households in Childress
According to the poverty data in Childress, 32.9% or 74 single-father households and 26.3% or 62 single-mother households are living below the poverty line. Among single-father households, those with no children have the highest poverty rate, with 74 households (100.0%) experiencing poverty. Likewise, among single-mother households, those with no children have the highest poverty rate, with 21 households (35.6%) falling below the poverty line.
| Children | Single Father | Single Mother |
| No Children | 74 (100.0%) | 21 (35.6%) |
| 1 or 2 Children | 0 (0.0%) | 41 (32.8%) |
| 3 or 4 Children | 0 (0.0%) | 0 (0.0%) |
| 5 or more Children | 0 (0.0%) | 0 (0.0%) |
| Total | 74 (32.9%) | 62 (26.3%) |
Income Below Poverty Among Married-Couple vs Single-Parent Households in Childress
The poverty data for Childress shows that 37 of the married-couple family households (6.3%) and 136 of the single-parent households (29.5%) are living below the poverty level. Within the married-couple family households, those with 1 or 2 children have the highest poverty rate, with 37 households (22.2%) falling below the poverty line. Among the single-parent households, those with no children have the highest poverty rate, with 95 household (71.4%) living below poverty.
| Children | Married-Couple Families | Single-Parent Households |
| No Children | 0 (0.0%) | 95 (71.4%) |
| 1 or 2 Children | 37 (22.2%) | 41 (19.7%) |
| 3 or 4 Children | 0 (0.0%) | 0 (0.0%) |
| 5 or more Children | 0 (0.0%) | 0 (0.0%) |
| Total | 37 (6.3%) | 136 (29.5%) |
Race in Childress
The most populous races in Childress are White / Caucasian (3,899 | 67.4%), Hispanic or Latino (2,496 | 43.1%), and Two or more Races (1,050 | 18.1%).
| Race | # Population | % Population |
| Asian | 6 | 0.1% |
| Black / African American | 449 | 7.8% |
| Hawaiian / Pacific | 0 | 0.0% |
| Hispanic or Latino | 2,496 | 43.1% |
| Native / Alaskan | 8 | 0.1% |
| White / Caucasian | 3,899 | 67.4% |
| Two or more Races | 1,050 | 18.1% |
| Some other Race | 374 | 6.5% |
| Total | 5,786 | 100.0% |
Ancestry in Childress
The most populous ancestries reported in Childress are Mexican (2,258 | 39.0%), German (504 | 8.7%), English (448 | 7.7%), American (316 | 5.5%), and European (240 | 4.2%), together accounting for 65.1% of all Childress residents.
| Ancestry | # Population | % Population |
| African | 17 | 0.3% |
| American | 316 | 5.5% |
| Apache | 4 | 0.1% |
| Arab | 4 | 0.1% |
| Argentinean | 27 | 0.5% |
| Belgian | 7 | 0.1% |
| Blackfeet | 4 | 0.1% |
| British | 4 | 0.1% |
| Burmese | 6 | 0.1% |
| Central American | 9 | 0.2% |
| Cherokee | 10 | 0.2% |
| Choctaw | 2 | 0.0% |
| Dutch | 29 | 0.5% |
| English | 448 | 7.7% |
| European | 240 | 4.2% |
| French | 54 | 0.9% |
| German | 504 | 8.7% |
| Haitian | 3 | 0.1% |
| Irish | 230 | 4.0% |
| Italian | 7 | 0.1% |
| Kiowa | 8 | 0.1% |
| Lebanese | 4 | 0.1% |
| Mexican | 2,258 | 39.0% |
| Norwegian | 4 | 0.1% |
| Polish | 20 | 0.4% |
| Puerto Rican | 2 | 0.0% |
| Salvadoran | 9 | 0.2% |
| Scotch-Irish | 30 | 0.5% |
| Scottish | 72 | 1.2% |
| South American | 27 | 0.5% |
| Subsaharan African | 17 | 0.3% |
| Swedish | 13 | 0.2% | View All 32 Rows |
Immigrants in Childress
The most numerous immigrant groups reported in Childress came from Latin America (583 | 10.1%), Central America (567 | 9.8%), Mexico (537 | 9.3%), Honduras (21 | 0.4%), and Caribbean (16 | 0.3%), together accounting for 29.8% of all Childress residents.
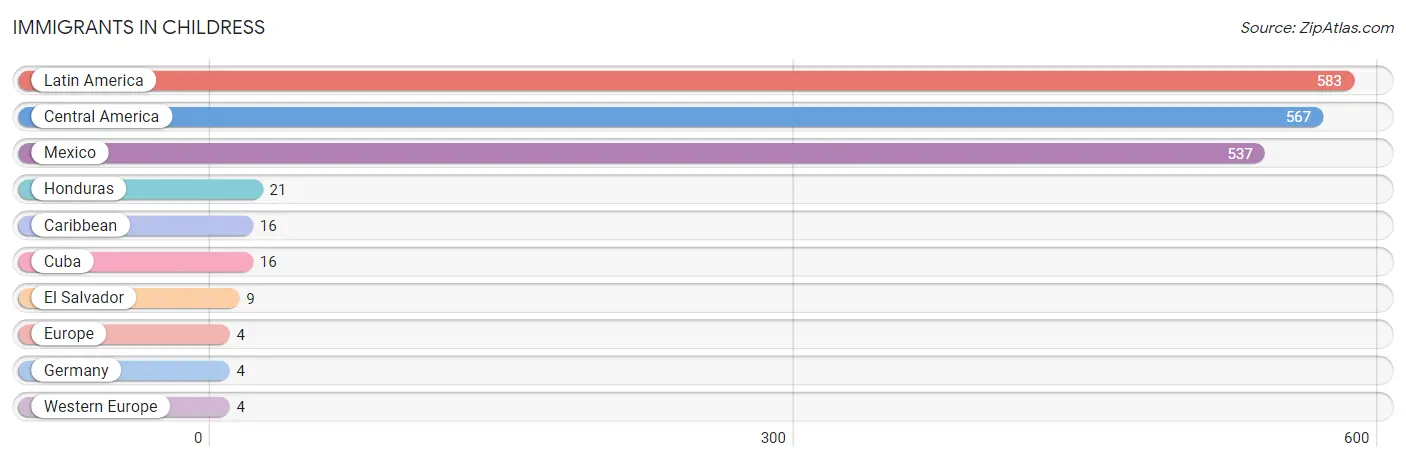
| Immigration Origin | # Population | % Population |
| Caribbean | 16 | 0.3% |
| Central America | 567 | 9.8% |
| Cuba | 16 | 0.3% |
| El Salvador | 9 | 0.2% |
| Europe | 4 | 0.1% |
| Germany | 4 | 0.1% |
| Honduras | 21 | 0.4% |
| Latin America | 583 | 10.1% |
| Mexico | 537 | 9.3% |
| Western Europe | 4 | 0.1% | View All 10 Rows |
Sex and Age in Childress
Sex and Age in Childress
The most populous age groups in Childress are 25 to 29 Years (814 | 21.3%) for men and 40 to 44 Years (282 | 14.3%) for women.
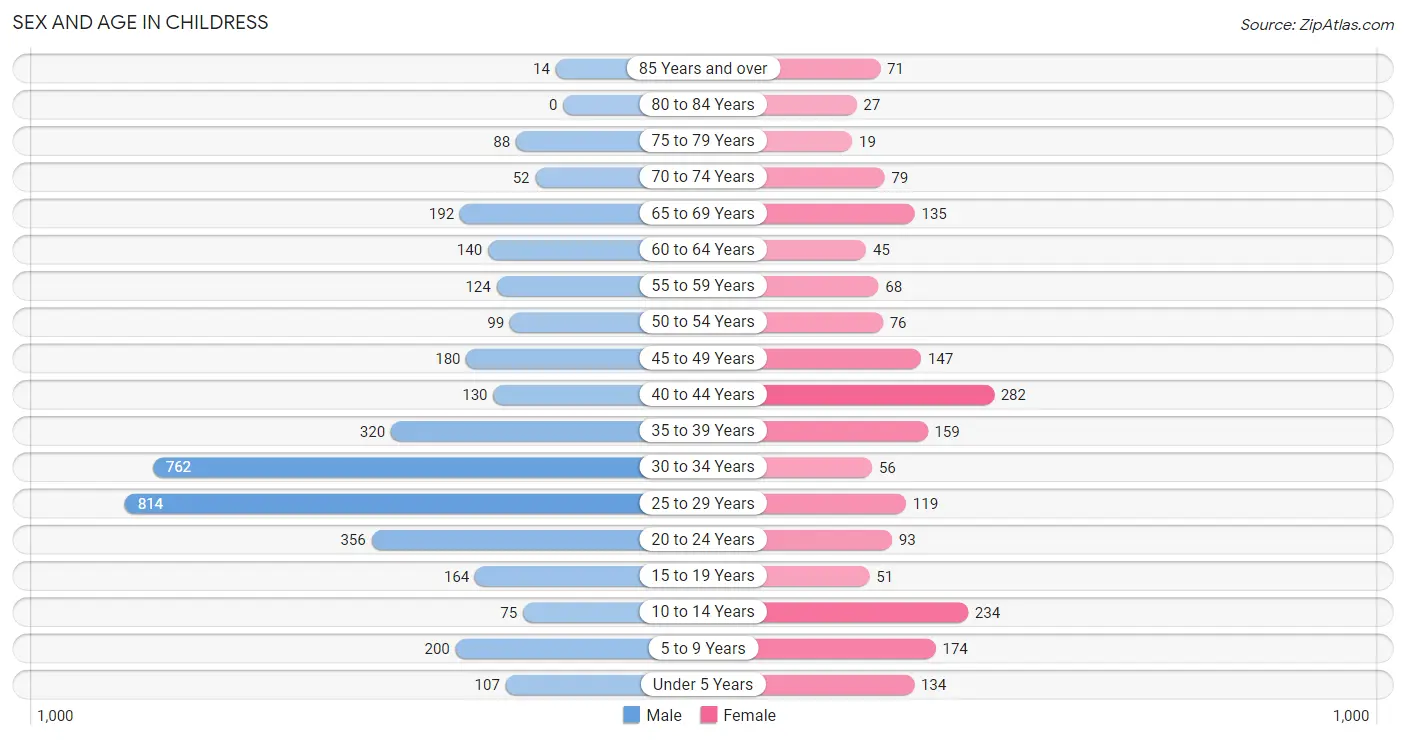
| Age Bracket | Male | Female |
| Under 5 Years | 107 (2.8%) | 134 (6.8%) |
| 5 to 9 Years | 200 (5.2%) | 174 (8.8%) |
| 10 to 14 Years | 75 (2.0%) | 234 (11.9%) |
| 15 to 19 Years | 164 (4.3%) | 51 (2.6%) |
| 20 to 24 Years | 356 (9.3%) | 93 (4.7%) |
| 25 to 29 Years | 814 (21.3%) | 119 (6.0%) |
| 30 to 34 Years | 762 (20.0%) | 56 (2.8%) |
| 35 to 39 Years | 320 (8.4%) | 159 (8.1%) |
| 40 to 44 Years | 130 (3.4%) | 282 (14.3%) |
| 45 to 49 Years | 180 (4.7%) | 147 (7.5%) |
| 50 to 54 Years | 99 (2.6%) | 76 (3.9%) |
| 55 to 59 Years | 124 (3.3%) | 68 (3.5%) |
| 60 to 64 Years | 140 (3.7%) | 45 (2.3%) |
| 65 to 69 Years | 192 (5.0%) | 135 (6.9%) |
| 70 to 74 Years | 52 (1.4%) | 79 (4.0%) |
| 75 to 79 Years | 88 (2.3%) | 19 (1.0%) |
| 80 to 84 Years | 0 (0.0%) | 27 (1.4%) |
| 85 Years and over | 14 (0.4%) | 71 (3.6%) |
| Total | 3,817 (100.0%) | 1,969 (100.0%) |
Families and Households in Childress
Median Family Size in Childress
The median family size in Childress is 3.17 persons per family, with single female/mother families (236 | 22.5%) accounting for the largest median family size of 3.57 persons per family. On the other hand, single male/father families (225 | 21.4%) represent the smallest median family size with 2.75 persons per family.
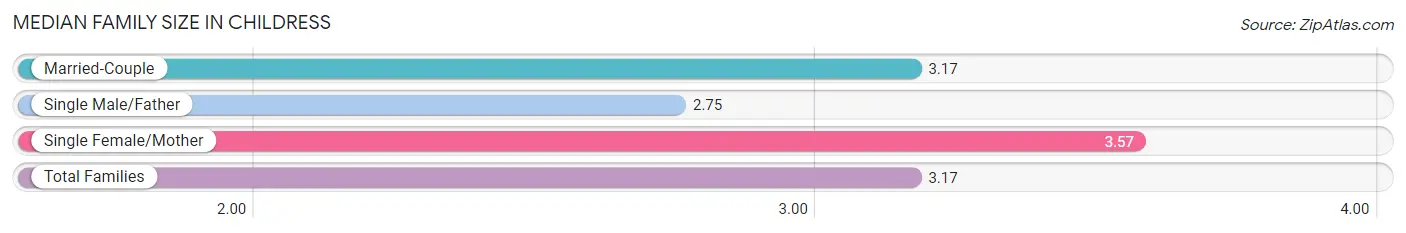
| Family Type | # Families | Family Size |
| Married-Couple | 589 (56.1%) | 3.17 |
| Single Male/Father | 225 (21.4%) | 2.75 |
| Single Female/Mother | 236 (22.5%) | 3.57 |
| Total Families | 1,050 (100.0%) | 3.17 |
Median Household Size in Childress
The median household size in Childress is 2.96 persons per household, with single female/mother households (236 | 16.1%) accounting for the largest median household size of 5.36 persons per household. non-family households (414 | 28.3%) represent the smallest median household size with 1.39 persons per household.
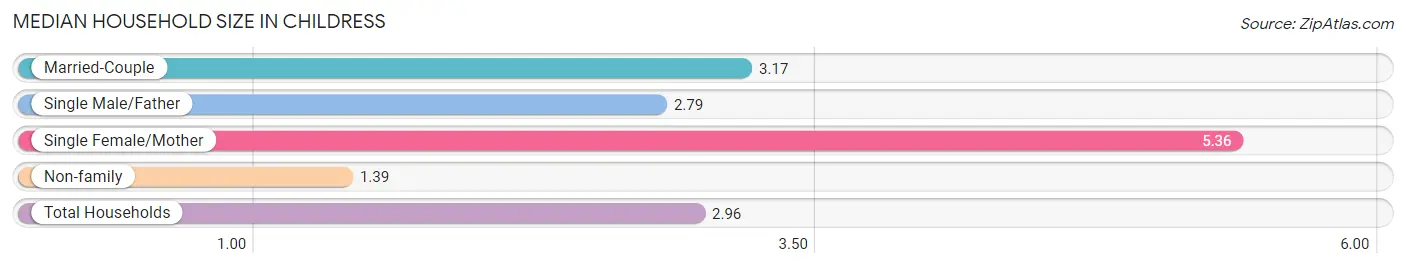
| Household Type | # Households | Household Size |
| Married-Couple | 589 (40.2%) | 3.17 |
| Single Male/Father | 225 (15.4%) | 2.79 |
| Single Female/Mother | 236 (16.1%) | 5.36 |
| Non-family | 414 (28.3%) | 1.39 |
| Total Households | 1,464 (100.0%) | 2.96 |
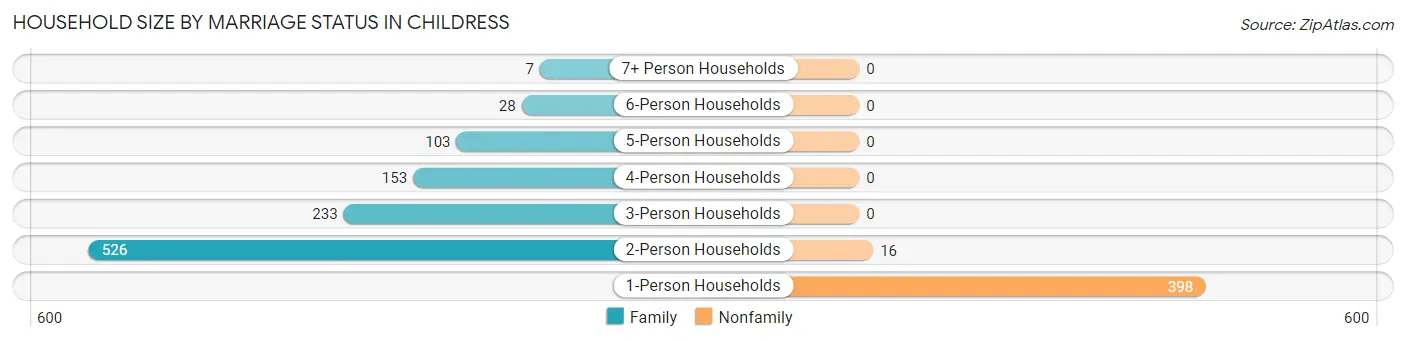
Household Size by Marriage Status in Childress
Out of a total of 1,464 households in Childress, 1,050 (71.7%) are family households, while 414 (28.3%) are nonfamily households. The most numerous type of family households are 2-person households, comprising 526, and the most common type of nonfamily households are 1-person households, comprising 398.
| Household Size | Family Households | Nonfamily Households |
| 1-Person Households | - | 398 (27.2%) |
| 2-Person Households | 526 (35.9%) | 16 (1.1%) |
| 3-Person Households | 233 (15.9%) | 0 (0.0%) |
| 4-Person Households | 153 (10.4%) | 0 (0.0%) |
| 5-Person Households | 103 (7.0%) | 0 (0.0%) |
| 6-Person Households | 28 (1.9%) | 0 (0.0%) |
| 7+ Person Households | 7 (0.5%) | 0 (0.0%) |
| Total | 1,050 (71.7%) | 414 (28.3%) |
Female Fertility in Childress
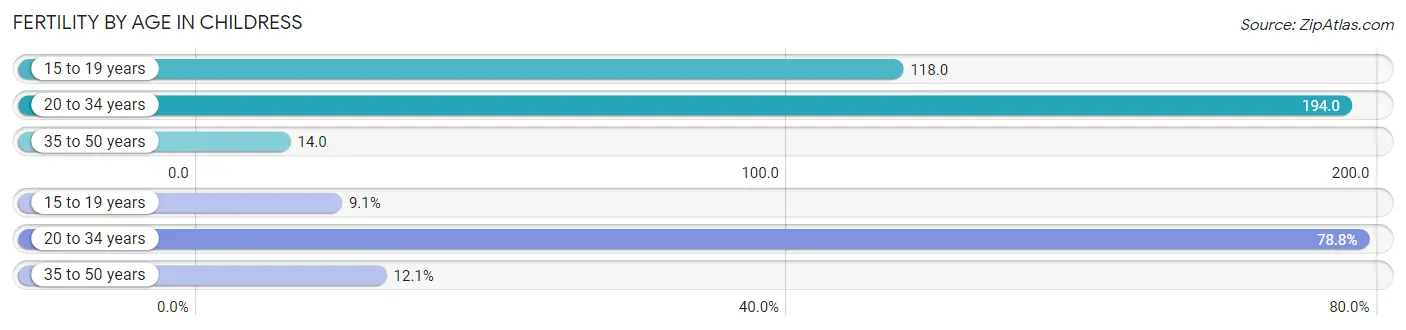
Fertility by Age in Childress
Average fertility rate in Childress is 72.0 births per 1,000 women. Women in the age bracket of 20 to 34 years have the highest fertility rate with 194.0 births per 1,000 women. Women in the age bracket of 20 to 34 years acount for 78.8% of all women with births.
| Age Bracket | Women with Births | Births / 1,000 Women |
| 15 to 19 years | 6 (9.1%) | 118.0 |
| 20 to 34 years | 52 (78.8%) | 194.0 |
| 35 to 50 years | 8 (12.1%) | 14.0 |
| Total | 66 (100.0%) | 72.0 |
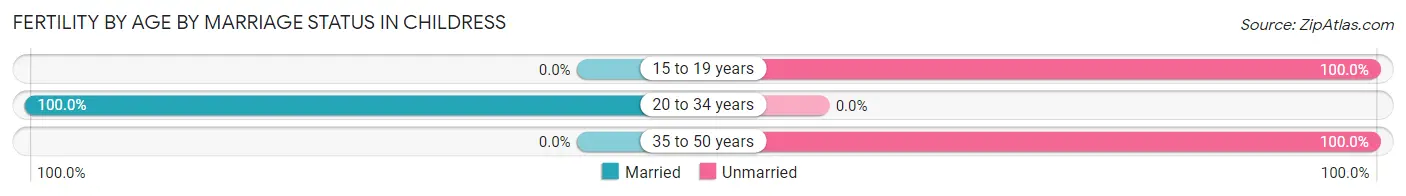
Fertility by Age by Marriage Status in Childress
78.8% of women with births (66) in Childress are married. The highest percentage of unmarried women with births falls into 15 to 19 years age bracket with 100.0% of them unmarried at the time of birth, while the lowest percentage of unmarried women with births belong to 20 to 34 years age bracket with 0.0% of them unmarried.
| Age Bracket | Married | Unmarried |
| 15 to 19 years | 0 (0.0%) | 6 (100.0%) |
| 20 to 34 years | 52 (100.0%) | 0 (0.0%) |
| 35 to 50 years | 0 (0.0%) | 8 (100.0%) |
| Total | 52 (78.8%) | 14 (21.2%) |
Fertility by Education in Childress
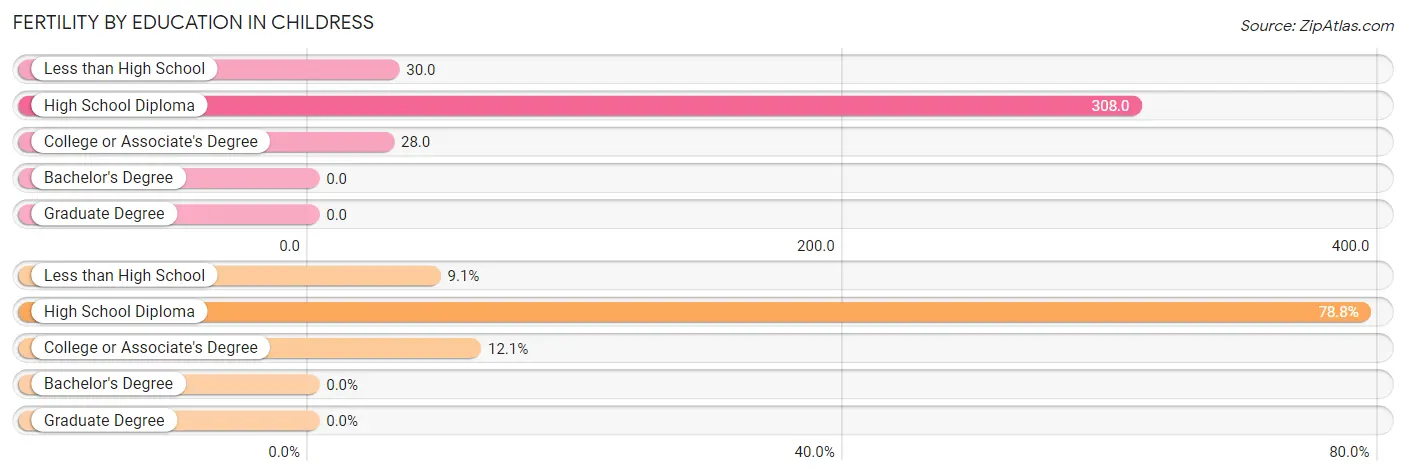
| Educational Attainment | Women with Births | Births / 1,000 Women |
| Less than High School | 6 (9.1%) | 30.0 |
| High School Diploma | 52 (78.8%) | 308.0 |
| College or Associate's Degree | 8 (12.1%) | 28.0 |
| Bachelor's Degree | 0 (0.0%) | 0.0 |
| Graduate Degree | 0 (0.0%) | 0.0 |
| Total | 66 (100.0%) | 72.0 |
Fertility by Education by Marriage Status in Childress
21.2% of women with births in Childress are unmarried. Women with the educational attainment of high school diploma are most likely to be married with 100.0% of them married at childbirth, while women with the educational attainment of less than high school are least likely to be married with 100.0% of them unmarried at childbirth.
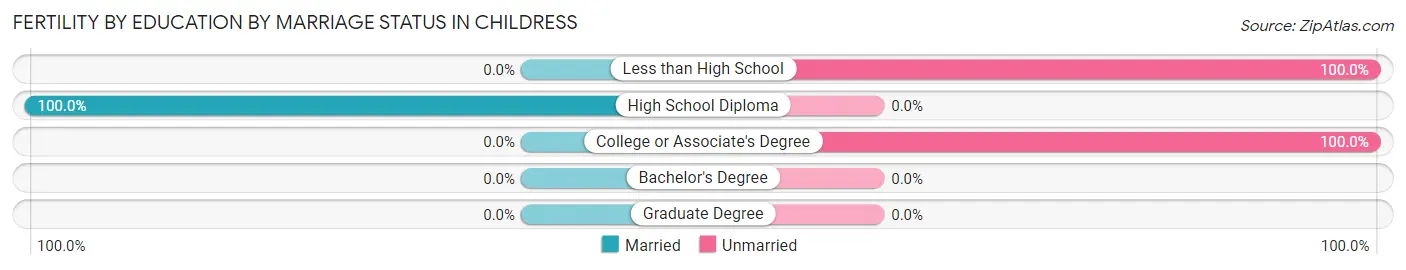
| Educational Attainment | Married | Unmarried |
| Less than High School | 0 (0.0%) | 6 (100.0%) |
| High School Diploma | 52 (100.0%) | 0 (0.0%) |
| College or Associate's Degree | 0 (0.0%) | 8 (100.0%) |
| Bachelor's Degree | 0 (0.0%) | 0 (0.0%) |
| Graduate Degree | 0 (0.0%) | 0 (0.0%) |
| Total | 52 (78.8%) | 14 (21.2%) |
Employment Characteristics in Childress
Employment by Class of Employer in Childress
Among the 2,310 employed individuals in Childress, private company employees (1,395 | 60.4%), local government employees (341 | 14.8%), and self-employed (not incorporated) (202 | 8.7%) make up the most common classes of employment.
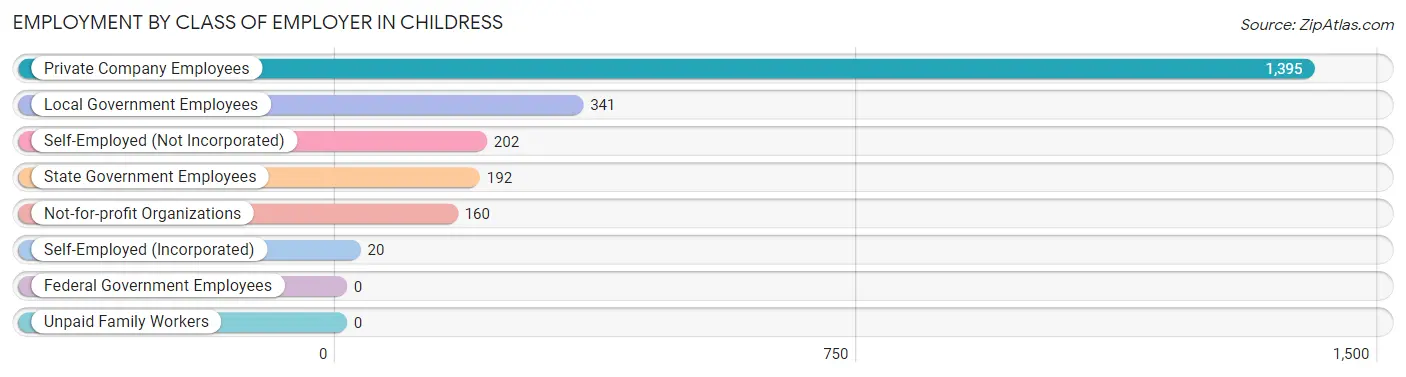
| Employer Class | # Employees | % Employees |
| Private Company Employees | 1,395 | 60.4% |
| Self-Employed (Incorporated) | 20 | 0.9% |
| Self-Employed (Not Incorporated) | 202 | 8.7% |
| Not-for-profit Organizations | 160 | 6.9% |
| Local Government Employees | 341 | 14.8% |
| State Government Employees | 192 | 8.3% |
| Federal Government Employees | 0 | 0.0% |
| Unpaid Family Workers | 0 | 0.0% |
| Total | 2,310 | 100.0% |
Employment Status by Age in Childress
According to the labor force statistics for Childress, out of the total population over 16 years of age (4,826), 53.4% or 2,577 individuals are in the labor force, with 9.9% or 255 of them unemployed. The age group with the highest labor force participation rate is 16 to 19 years, with 84.9% or 152 individuals in the labor force. Within the labor force, the 20 to 24 years age range has the highest percentage of unemployed individuals, with 53.3% or 48 of them being unemployed.
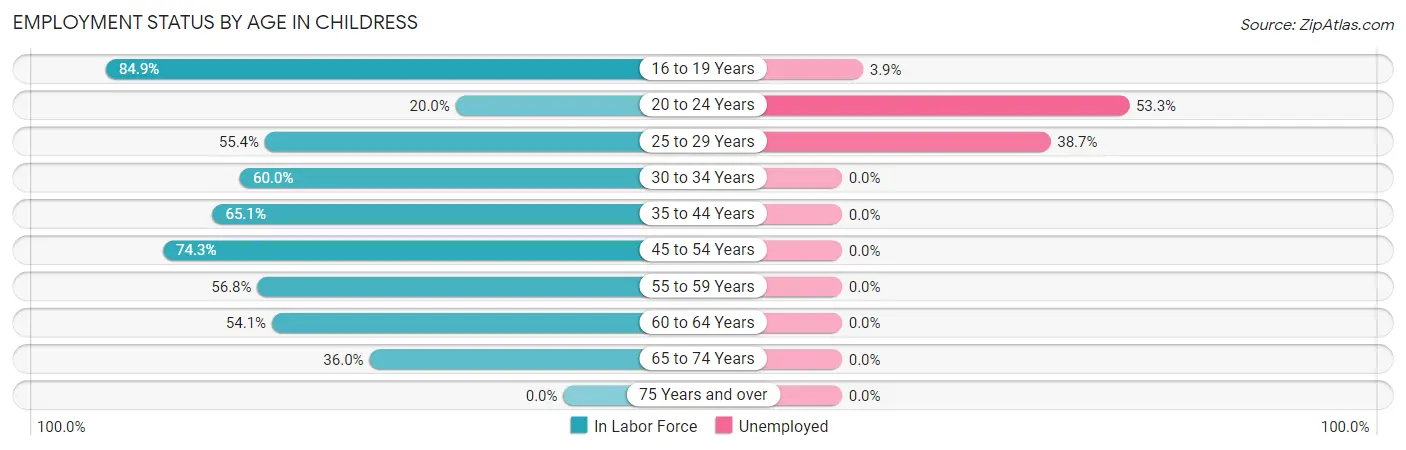
| Age Bracket | In Labor Force | Unemployed |
| 16 to 19 Years | 152 (84.9%) | 6 (3.9%) |
| 20 to 24 Years | 90 (20.0%) | 48 (53.3%) |
| 25 to 29 Years | 517 (55.4%) | 200 (38.7%) |
| 30 to 34 Years | 491 (60.0%) | 0 (0.0%) |
| 35 to 44 Years | 580 (65.1%) | 0 (0.0%) |
| 45 to 54 Years | 373 (74.3%) | 0 (0.0%) |
| 55 to 59 Years | 109 (56.8%) | 0 (0.0%) |
| 60 to 64 Years | 100 (54.1%) | 0 (0.0%) |
| 65 to 74 Years | 165 (36.0%) | 0 (0.0%) |
| 75 Years and over | 0 (0.0%) | 0 (0.0%) |
| Total | 2,577 (53.4%) | 255 (9.9%) |
Employment Status by Educational Attainment in Childress
According to labor force statistics for Childress, 61.6% of individuals (2,169) out of the total population between 25 and 64 years of age (3,521) are in the labor force, with 9.2% or 200 of them being unemployed. The group with the highest labor force participation rate are those with the educational attainment of bachelor's degree or higher, with 75.4% or 300 individuals in the labor force. Within the labor force, individuals with high school diploma education have the highest percentage of unemployment, with 22.1% or 200 of them being unemployed.
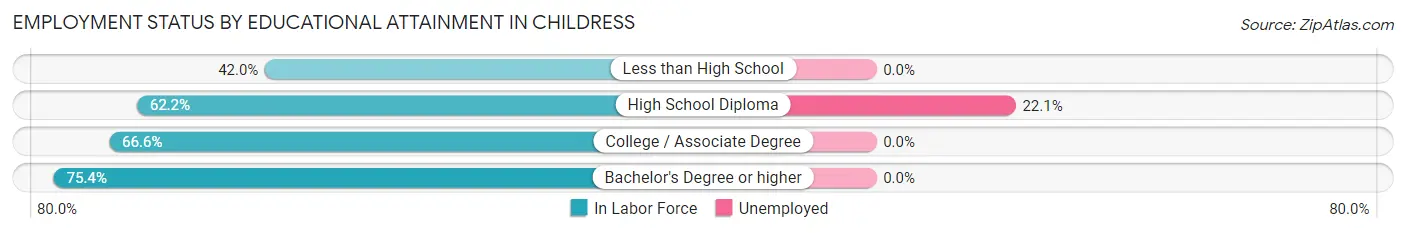
| Educational Attainment | In Labor Force | Unemployed |
| Less than High School | 251 (42.0%) | 0 (0.0%) |
| High School Diploma | 904 (62.2%) | 321 (22.1%) |
| College / Associate Degree | 714 (66.6%) | 0 (0.0%) |
| Bachelor's Degree or higher | 300 (75.4%) | 0 (0.0%) |
| Total | 2,169 (61.6%) | 324 (9.2%) |
Employment Occupations by Sex in Childress
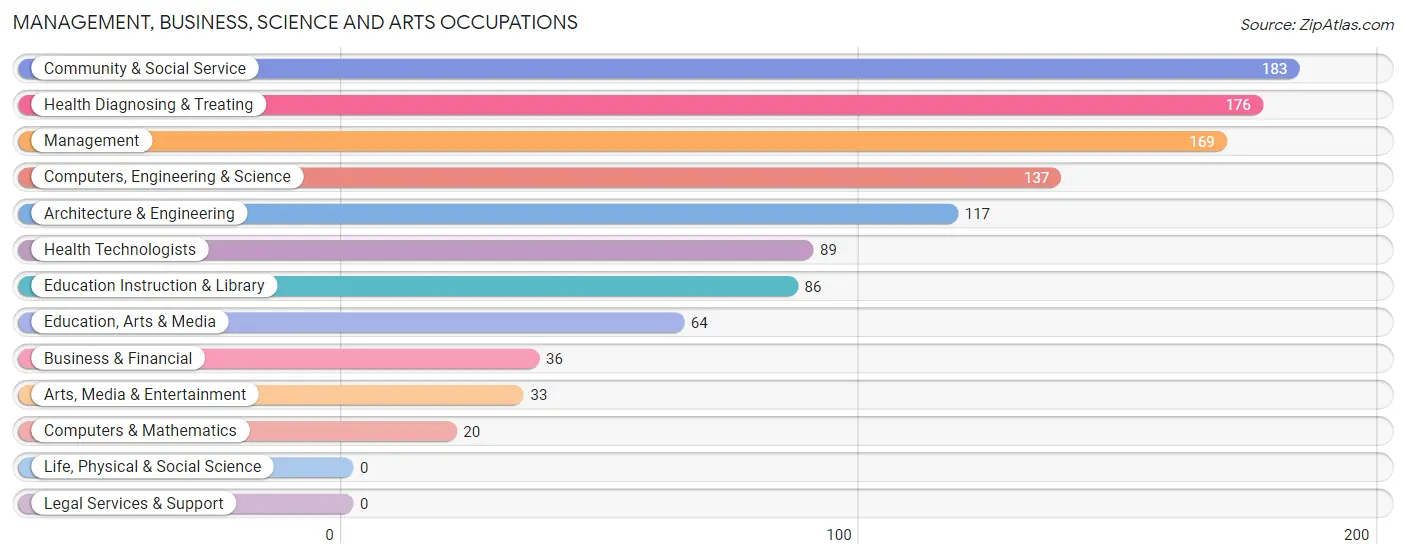
Management, Business, Science and Arts Occupations
The most common Management, Business, Science and Arts occupations in Childress are Community & Social Service (183 | 7.9%), Health Diagnosing & Treating (176 | 7.6%), Management (169 | 7.3%), Computers, Engineering & Science (137 | 5.9%), and Architecture & Engineering (117 | 5.0%).
Management, Business, Science and Arts Occupations by Sex
Within the Management, Business, Science and Arts occupations in Childress, the most male-oriented occupations are Business & Financial (100.0%), Computers, Engineering & Science (100.0%), and Computers & Mathematics (100.0%), while the most female-oriented occupations are Education Instruction & Library (100.0%), Community & Social Service (90.2%), and Health Technologists (86.5%).
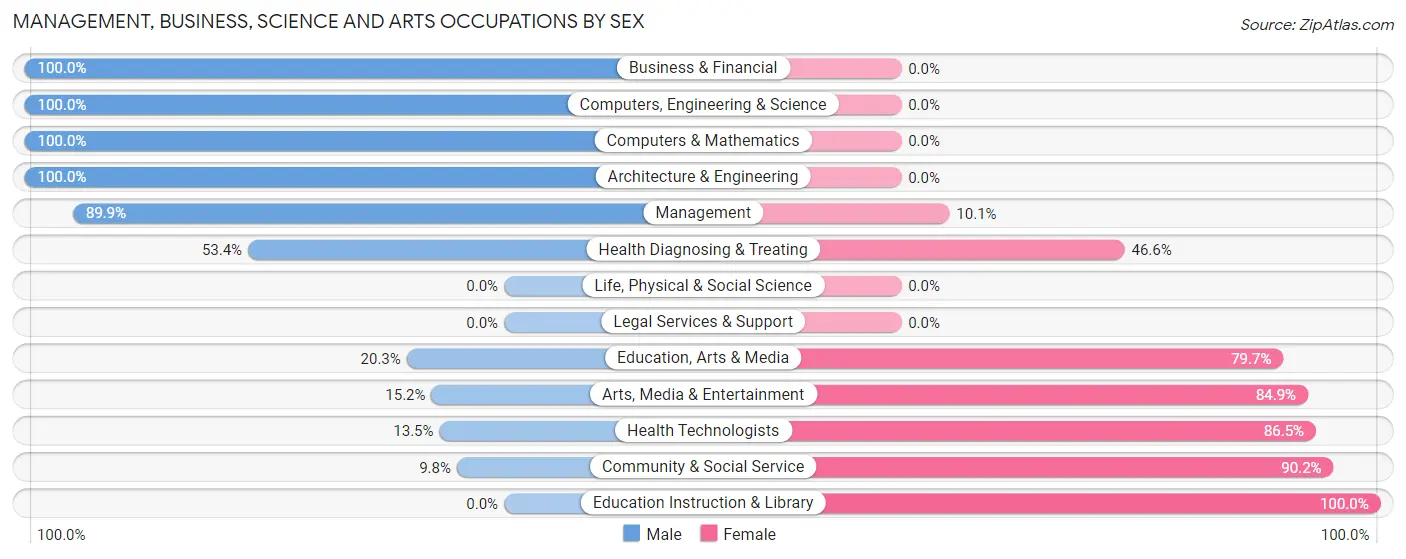
| Occupation | Male | Female |
| Management | 152 (89.9%) | 17 (10.1%) |
| Business & Financial | 36 (100.0%) | 0 (0.0%) |
| Computers, Engineering & Science | 137 (100.0%) | 0 (0.0%) |
| Computers & Mathematics | 20 (100.0%) | 0 (0.0%) |
| Architecture & Engineering | 117 (100.0%) | 0 (0.0%) |
| Life, Physical & Social Science | 0 (0.0%) | 0 (0.0%) |
| Community & Social Service | 18 (9.8%) | 165 (90.2%) |
| Education, Arts & Media | 13 (20.3%) | 51 (79.7%) |
| Legal Services & Support | 0 (0.0%) | 0 (0.0%) |
| Education Instruction & Library | 0 (0.0%) | 86 (100.0%) |
| Arts, Media & Entertainment | 5 (15.1%) | 28 (84.9%) |
| Health Diagnosing & Treating | 94 (53.4%) | 82 (46.6%) |
| Health Technologists | 12 (13.5%) | 77 (86.5%) |
| Total (Category) | 437 (62.3%) | 264 (37.7%) |
| Total (Overall) | 1,404 (60.4%) | 919 (39.6%) |
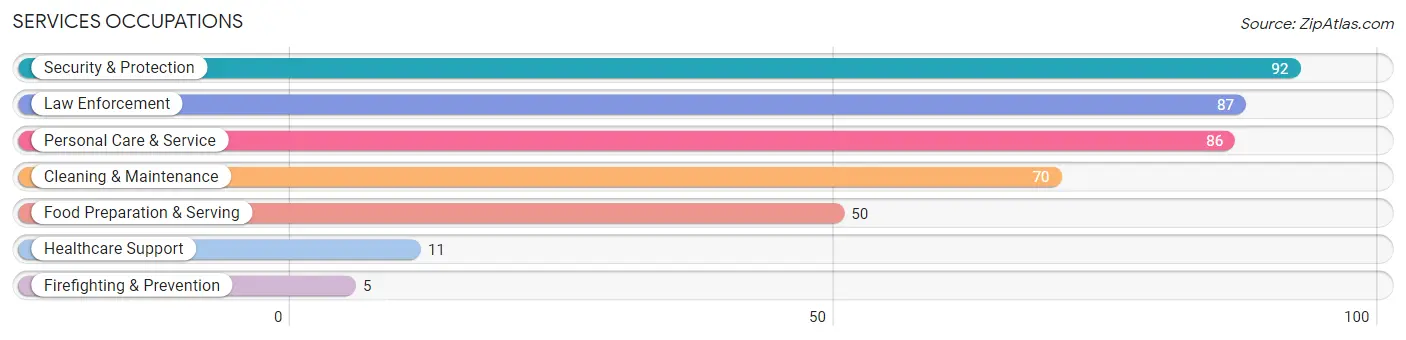
Services Occupations
The most common Services occupations in Childress are Security & Protection (92 | 4.0%), Law Enforcement (87 | 3.7%), Personal Care & Service (86 | 3.7%), Cleaning & Maintenance (70 | 3.0%), and Food Preparation & Serving (50 | 2.1%).
Services Occupations by Sex
Within the Services occupations in Childress, the most male-oriented occupations are Security & Protection (100.0%), Firefighting & Prevention (100.0%), and Law Enforcement (100.0%), while the most female-oriented occupations are Healthcare Support (100.0%), Cleaning & Maintenance (100.0%), and Personal Care & Service (100.0%).
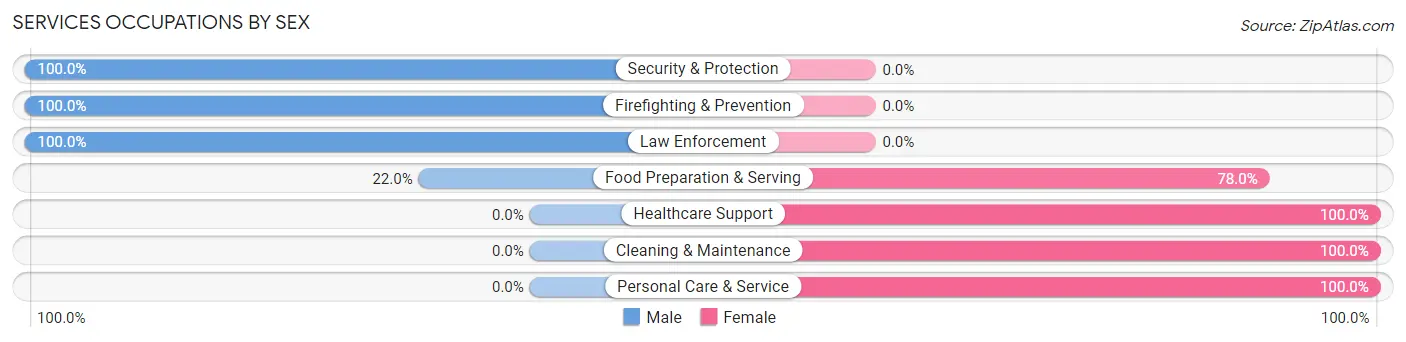
| Occupation | Male | Female |
| Healthcare Support | 0 (0.0%) | 11 (100.0%) |
| Security & Protection | 92 (100.0%) | 0 (0.0%) |
| Firefighting & Prevention | 5 (100.0%) | 0 (0.0%) |
| Law Enforcement | 87 (100.0%) | 0 (0.0%) |
| Food Preparation & Serving | 11 (22.0%) | 39 (78.0%) |
| Cleaning & Maintenance | 0 (0.0%) | 70 (100.0%) |
| Personal Care & Service | 0 (0.0%) | 86 (100.0%) |
| Total (Category) | 103 (33.3%) | 206 (66.7%) |
| Total (Overall) | 1,404 (60.4%) | 919 (39.6%) |
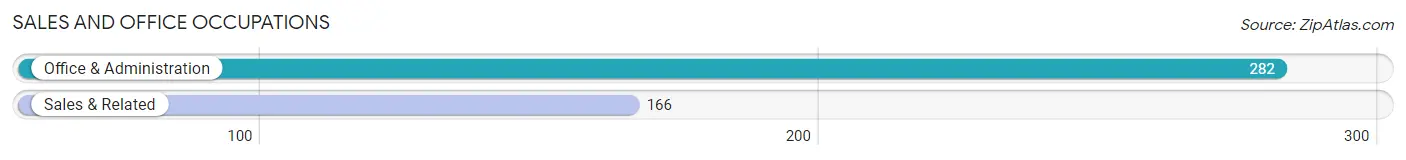
Sales and Office Occupations
The most common Sales and Office occupations in Childress are Office & Administration (282 | 12.1%), and Sales & Related (166 | 7.1%).
Sales and Office Occupations by Sex
| Occupation | Male | Female |
| Sales & Related | 69 (41.6%) | 97 (58.4%) |
| Office & Administration | 35 (12.4%) | 247 (87.6%) |
| Total (Category) | 104 (23.2%) | 344 (76.8%) |
| Total (Overall) | 1,404 (60.4%) | 919 (39.6%) |
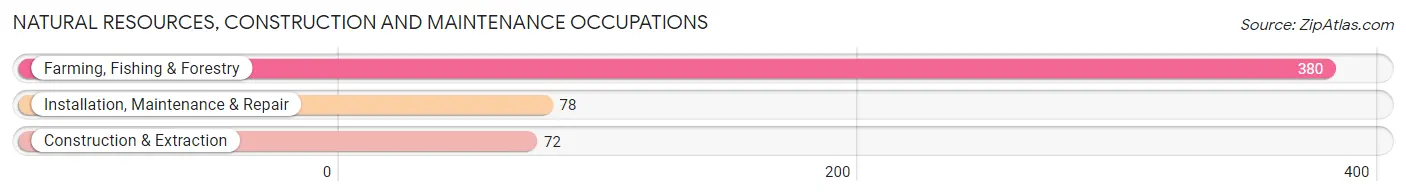
Natural Resources, Construction and Maintenance Occupations
The most common Natural Resources, Construction and Maintenance occupations in Childress are Farming, Fishing & Forestry (380 | 16.4%), Installation, Maintenance & Repair (78 | 3.4%), and Construction & Extraction (72 | 3.1%).
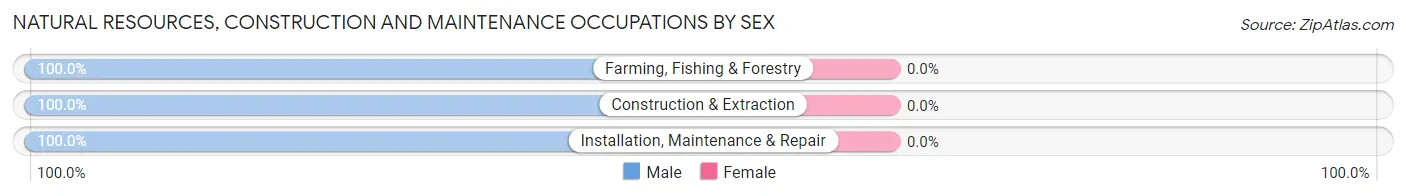
Natural Resources, Construction and Maintenance Occupations by Sex
| Occupation | Male | Female |
| Farming, Fishing & Forestry | 380 (100.0%) | 0 (0.0%) |
| Construction & Extraction | 72 (100.0%) | 0 (0.0%) |
| Installation, Maintenance & Repair | 78 (100.0%) | 0 (0.0%) |
| Total (Category) | 530 (100.0%) | 0 (0.0%) |
| Total (Overall) | 1,404 (60.4%) | 919 (39.6%) |
Production, Transportation and Moving Occupations
The most common Production, Transportation and Moving occupations in Childress are Material Moving (160 | 6.9%), Production (140 | 6.0%), and Transportation (35 | 1.5%).
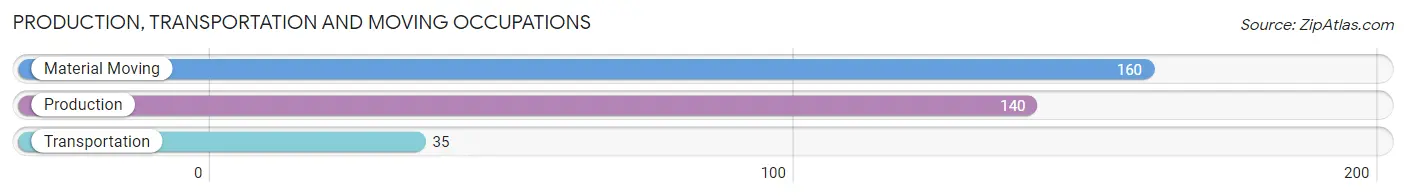
Production, Transportation and Moving Occupations by Sex
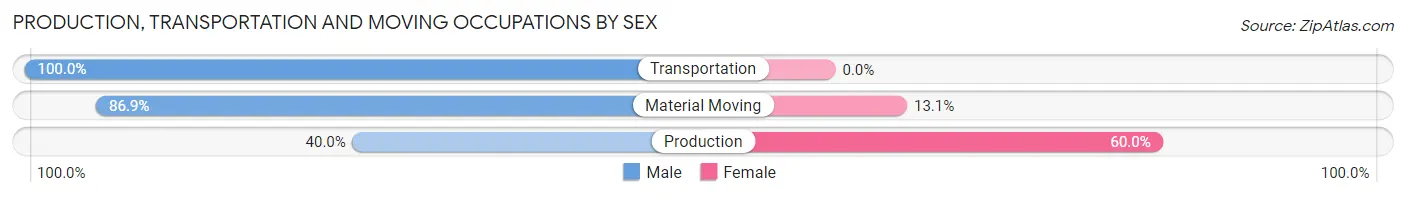
| Occupation | Male | Female |
| Production | 56 (40.0%) | 84 (60.0%) |
| Transportation | 35 (100.0%) | 0 (0.0%) |
| Material Moving | 139 (86.9%) | 21 (13.1%) |
| Total (Category) | 230 (68.7%) | 105 (31.3%) |
| Total (Overall) | 1,404 (60.4%) | 919 (39.6%) |
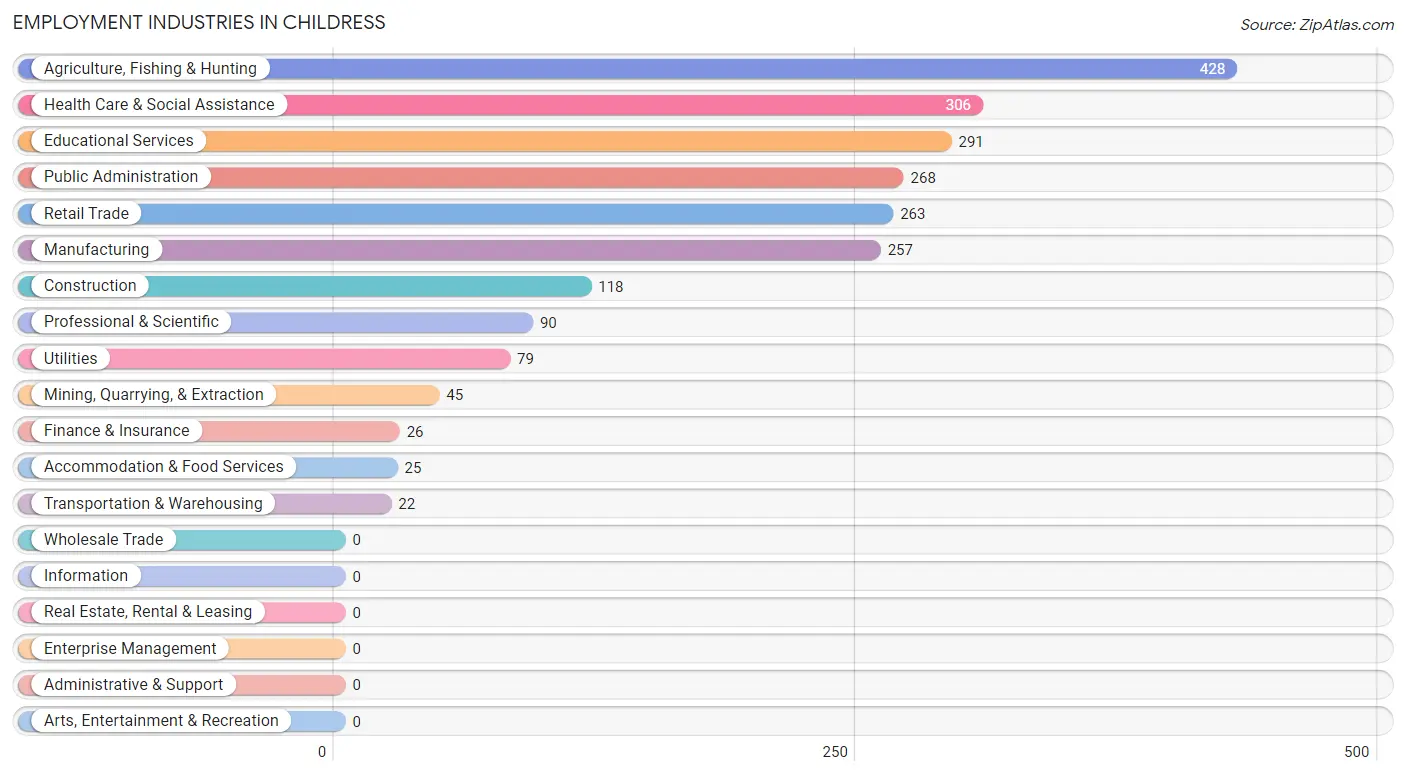
Employment Industries by Sex in Childress
Employment Industries in Childress
The major employment industries in Childress include Agriculture, Fishing & Hunting (428 | 18.4%), Health Care & Social Assistance (306 | 13.2%), Educational Services (291 | 12.5%), Public Administration (268 | 11.5%), and Retail Trade (263 | 11.3%).
Employment Industries by Sex in Childress
The Childress industries that see more men than women are Agriculture, Fishing & Hunting (100.0%), Mining, Quarrying, & Extraction (100.0%), and Construction (100.0%), whereas the industries that tend to have a higher number of women are Educational Services (98.3%), Retail Trade (60.8%), and Health Care & Social Assistance (59.8%).
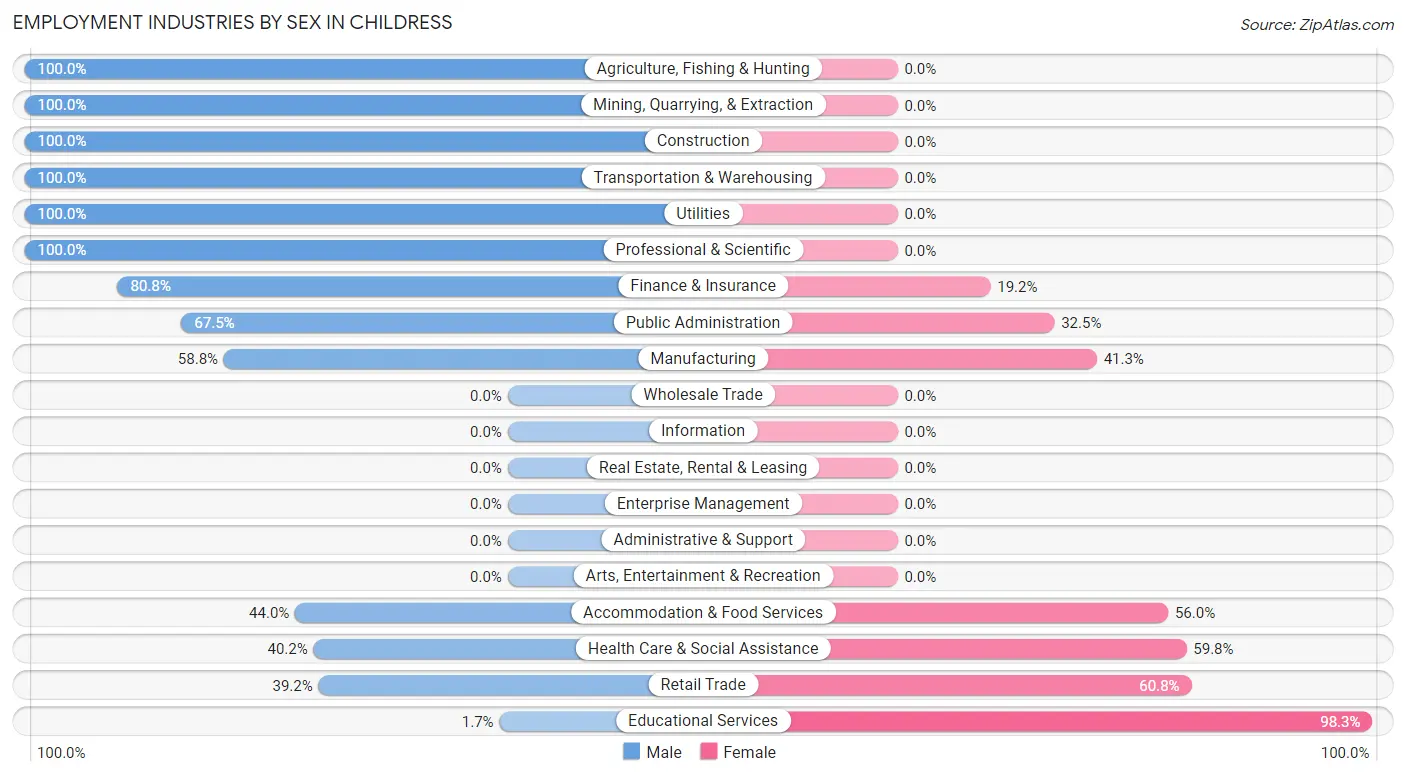
| Industry | Male | Female |
| Agriculture, Fishing & Hunting | 428 (100.0%) | 0 (0.0%) |
| Mining, Quarrying, & Extraction | 45 (100.0%) | 0 (0.0%) |
| Construction | 118 (100.0%) | 0 (0.0%) |
| Manufacturing | 151 (58.8%) | 106 (41.2%) |
| Wholesale Trade | 0 (0.0%) | 0 (0.0%) |
| Retail Trade | 103 (39.2%) | 160 (60.8%) |
| Transportation & Warehousing | 22 (100.0%) | 0 (0.0%) |
| Utilities | 79 (100.0%) | 0 (0.0%) |
| Information | 0 (0.0%) | 0 (0.0%) |
| Finance & Insurance | 21 (80.8%) | 5 (19.2%) |
| Real Estate, Rental & Leasing | 0 (0.0%) | 0 (0.0%) |
| Professional & Scientific | 90 (100.0%) | 0 (0.0%) |
| Enterprise Management | 0 (0.0%) | 0 (0.0%) |
| Administrative & Support | 0 (0.0%) | 0 (0.0%) |
| Educational Services | 5 (1.7%) | 286 (98.3%) |
| Health Care & Social Assistance | 123 (40.2%) | 183 (59.8%) |
| Arts, Entertainment & Recreation | 0 (0.0%) | 0 (0.0%) |
| Accommodation & Food Services | 11 (44.0%) | 14 (56.0%) |
| Public Administration | 181 (67.5%) | 87 (32.5%) |
| Total | 1,404 (60.4%) | 919 (39.6%) |
Education in Childress
School Enrollment in Childress
The most common levels of schooling among the 786 students in Childress are high school (261 | 33.2%), elementary school (232 | 29.5%), and middle school (183 | 23.3%).
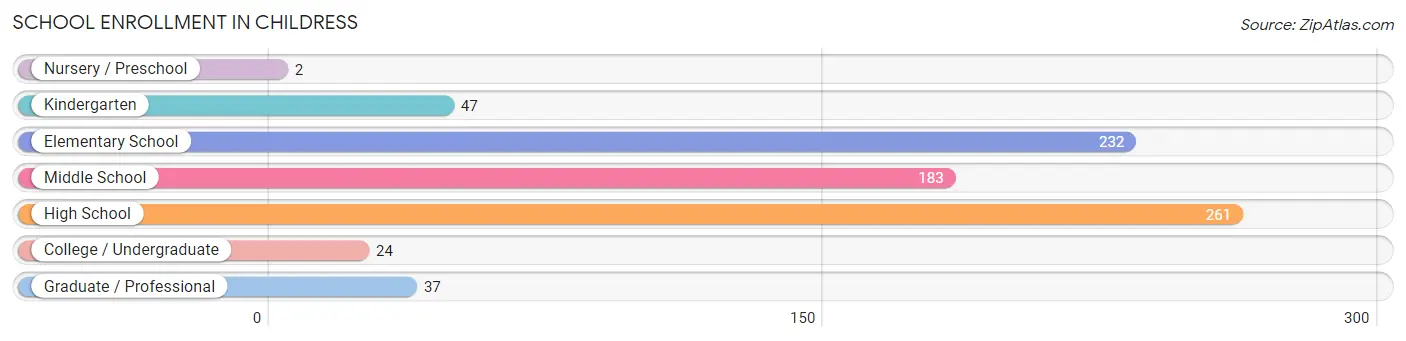
| School Level | # Students | % Students |
| Nursery / Preschool | 2 | 0.3% |
| Kindergarten | 47 | 6.0% |
| Elementary School | 232 | 29.5% |
| Middle School | 183 | 23.3% |
| High School | 261 | 33.2% |
| College / Undergraduate | 24 | 3.0% |
| Graduate / Professional | 37 | 4.7% |
| Total | 786 | 100.0% |
School Enrollment by Age by Funding Source in Childress
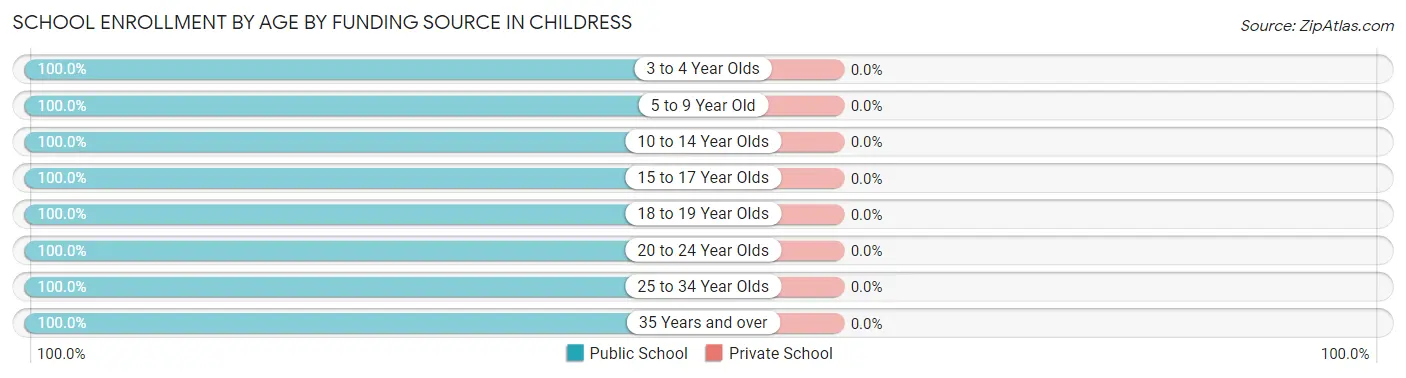
| Age Bracket | Public School | Private School |
| 3 to 4 Year Olds | 2 (100.0%) | 0 (0.0%) |
| 5 to 9 Year Old | 259 (100.0%) | 0 (0.0%) |
| 10 to 14 Year Olds | 236 (100.0%) | 0 (0.0%) |
| 15 to 17 Year Olds | 122 (100.0%) | 0 (0.0%) |
| 18 to 19 Year Olds | 82 (100.0%) | 0 (0.0%) |
| 20 to 24 Year Olds | 9 (100.0%) | 0 (0.0%) |
| 25 to 34 Year Olds | 21 (100.0%) | 0 (0.0%) |
| 35 Years and over | 55 (100.0%) | 0 (0.0%) |
| Total | 786 (100.0%) | 0 (0.0%) |
Educational Attainment by Field of Study in Childress
Education (148 | 28.2%), business (134 | 25.6%), science & technology (60 | 11.5%), arts & humanities (56 | 10.7%), and engineering (45 | 8.6%) are the most common fields of study among 524 individuals in Childress who have obtained a bachelor's degree or higher.
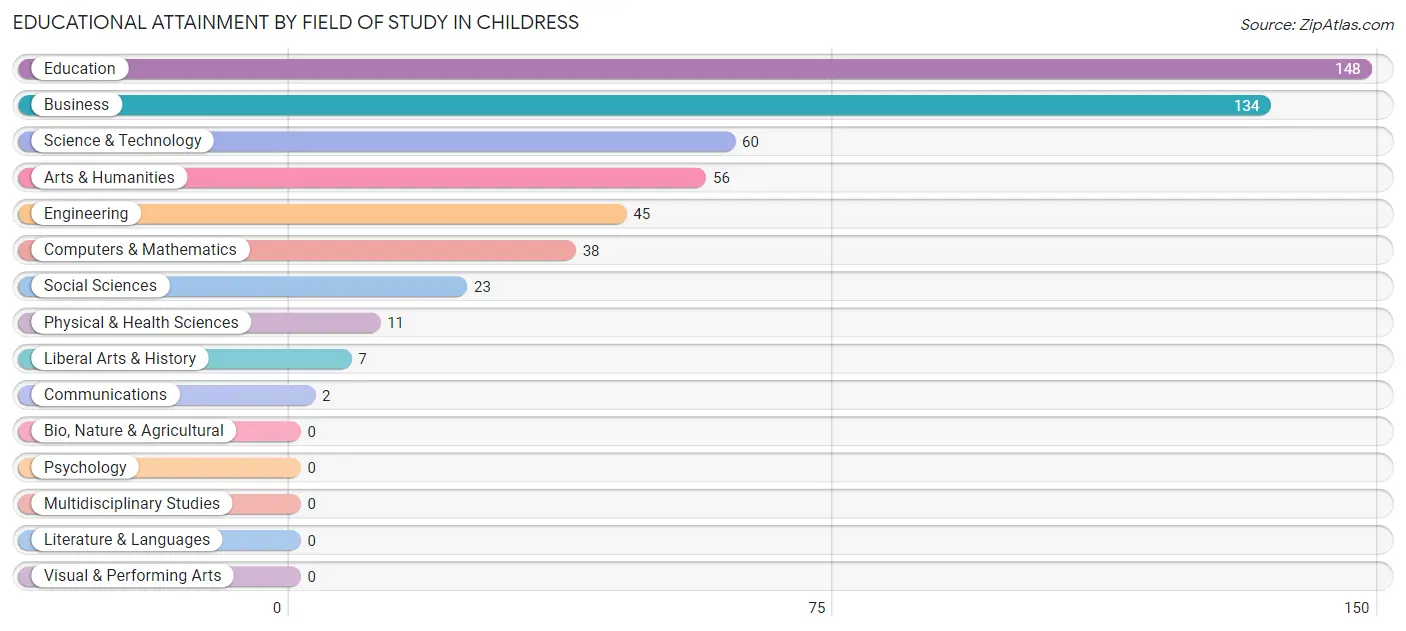
| Field of Study | # Graduates | % Graduates |
| Computers & Mathematics | 38 | 7.2% |
| Bio, Nature & Agricultural | 0 | 0.0% |
| Physical & Health Sciences | 11 | 2.1% |
| Psychology | 0 | 0.0% |
| Social Sciences | 23 | 4.4% |
| Engineering | 45 | 8.6% |
| Multidisciplinary Studies | 0 | 0.0% |
| Science & Technology | 60 | 11.5% |
| Business | 134 | 25.6% |
| Education | 148 | 28.2% |
| Literature & Languages | 0 | 0.0% |
| Liberal Arts & History | 7 | 1.3% |
| Visual & Performing Arts | 0 | 0.0% |
| Communications | 2 | 0.4% |
| Arts & Humanities | 56 | 10.7% |
| Total | 524 | 100.0% |
Transportation & Commute in Childress
Vehicle Availability by Sex in Childress
The most prevalent vehicle ownership categories in Childress are males with 2 vehicles (670, accounting for 47.9%) and females with 2 vehicles (296, making up 73.6%).
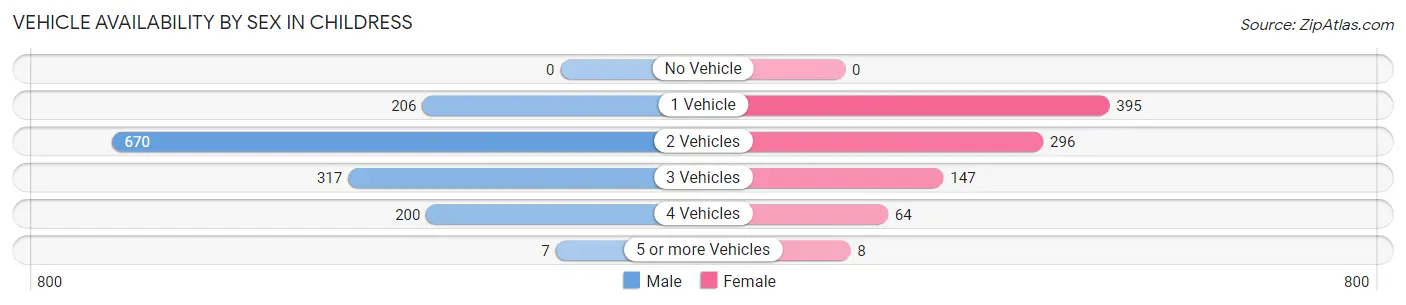
| Vehicles Available | Male | Female |
| No Vehicle | 0 (0.0%) | 0 (0.0%) |
| 1 Vehicle | 206 (14.7%) | 395 (43.4%) |
| 2 Vehicles | 670 (47.9%) | 296 (32.5%) |
| 3 Vehicles | 317 (22.6%) | 147 (16.2%) |
| 4 Vehicles | 200 (14.3%) | 64 (7.0%) |
| 5 or more Vehicles | 7 (0.5%) | 8 (0.9%) |
| Total | 1,400 (100.0%) | 910 (100.0%) |
Commute Time in Childress
The most frequently occuring commute durations in Childress are 5 to 9 minutes (734 commuters, 32.0%), less than 5 minutes (506 commuters, 22.1%), and 30 to 34 minutes (503 commuters, 21.9%).
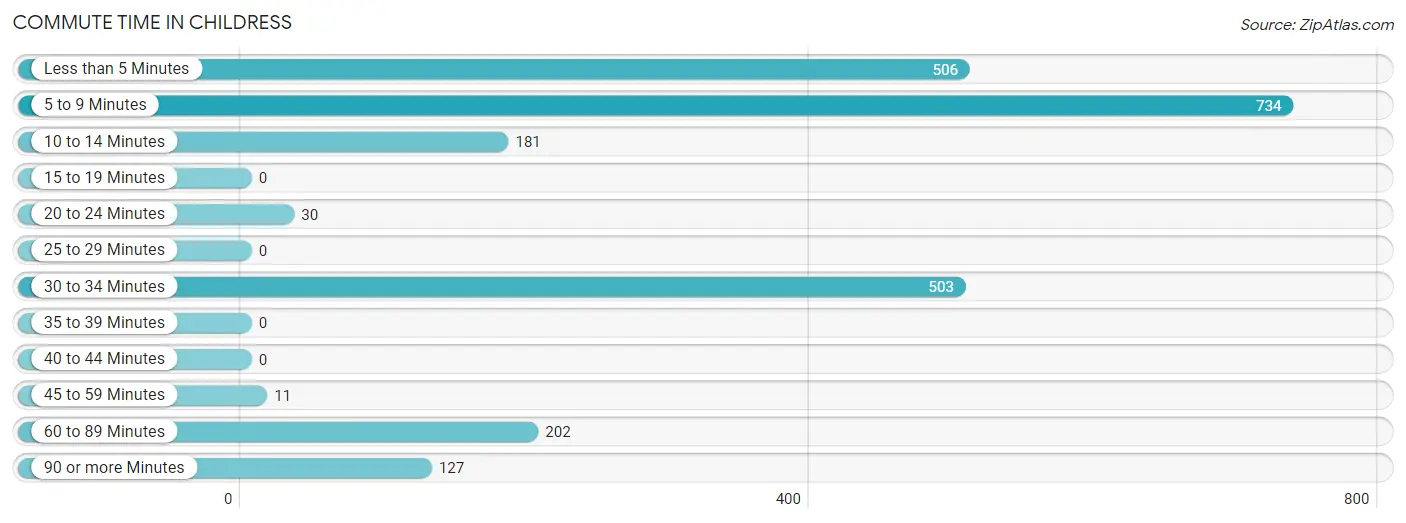
| Commute Time | # Commuters | % Commuters |
| Less than 5 Minutes | 506 | 22.1% |
| 5 to 9 Minutes | 734 | 32.0% |
| 10 to 14 Minutes | 181 | 7.9% |
| 15 to 19 Minutes | 0 | 0.0% |
| 20 to 24 Minutes | 30 | 1.3% |
| 25 to 29 Minutes | 0 | 0.0% |
| 30 to 34 Minutes | 503 | 21.9% |
| 35 to 39 Minutes | 0 | 0.0% |
| 40 to 44 Minutes | 0 | 0.0% |
| 45 to 59 Minutes | 11 | 0.5% |
| 60 to 89 Minutes | 202 | 8.8% |
| 90 or more Minutes | 127 | 5.5% |
Commute Time by Sex in Childress
The most common commute times in Childress are 30 to 34 minutes (484 commuters, 35.0%) for males and 5 to 9 minutes (377 commuters, 41.4%) for females.
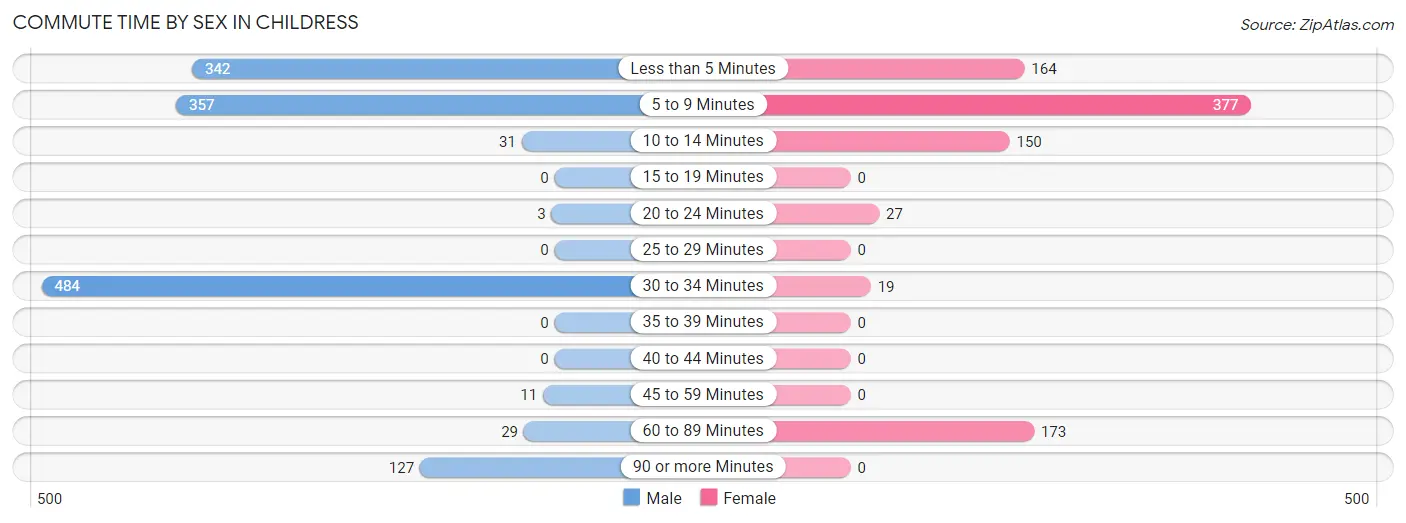
| Commute Time | Male | Female |
| Less than 5 Minutes | 342 (24.7%) | 164 (18.0%) |
| 5 to 9 Minutes | 357 (25.8%) | 377 (41.4%) |
| 10 to 14 Minutes | 31 (2.2%) | 150 (16.5%) |
| 15 to 19 Minutes | 0 (0.0%) | 0 (0.0%) |
| 20 to 24 Minutes | 3 (0.2%) | 27 (3.0%) |
| 25 to 29 Minutes | 0 (0.0%) | 0 (0.0%) |
| 30 to 34 Minutes | 484 (35.0%) | 19 (2.1%) |
| 35 to 39 Minutes | 0 (0.0%) | 0 (0.0%) |
| 40 to 44 Minutes | 0 (0.0%) | 0 (0.0%) |
| 45 to 59 Minutes | 11 (0.8%) | 0 (0.0%) |
| 60 to 89 Minutes | 29 (2.1%) | 173 (19.0%) |
| 90 or more Minutes | 127 (9.2%) | 0 (0.0%) |
Time of Departure to Work by Sex in Childress
The most frequent times of departure to work in Childress are 7:00 AM to 7:29 AM (392, 28.3%) for males and 6:30 AM to 6:59 AM (221, 24.3%) for females.
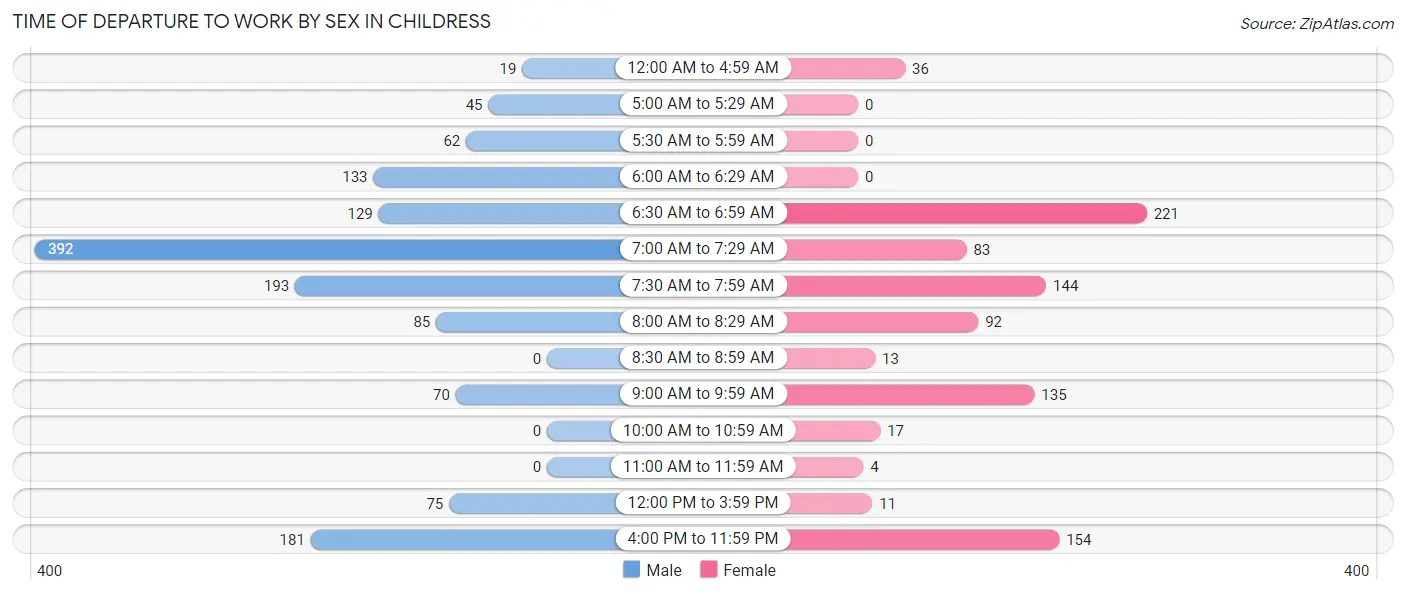
| Time of Departure | Male | Female |
| 12:00 AM to 4:59 AM | 19 (1.4%) | 36 (4.0%) |
| 5:00 AM to 5:29 AM | 45 (3.3%) | 0 (0.0%) |
| 5:30 AM to 5:59 AM | 62 (4.5%) | 0 (0.0%) |
| 6:00 AM to 6:29 AM | 133 (9.6%) | 0 (0.0%) |
| 6:30 AM to 6:59 AM | 129 (9.3%) | 221 (24.3%) |
| 7:00 AM to 7:29 AM | 392 (28.3%) | 83 (9.1%) |
| 7:30 AM to 7:59 AM | 193 (14.0%) | 144 (15.8%) |
| 8:00 AM to 8:29 AM | 85 (6.1%) | 92 (10.1%) |
| 8:30 AM to 8:59 AM | 0 (0.0%) | 13 (1.4%) |
| 9:00 AM to 9:59 AM | 70 (5.1%) | 135 (14.8%) |
| 10:00 AM to 10:59 AM | 0 (0.0%) | 17 (1.9%) |
| 11:00 AM to 11:59 AM | 0 (0.0%) | 4 (0.4%) |
| 12:00 PM to 3:59 PM | 75 (5.4%) | 11 (1.2%) |
| 4:00 PM to 11:59 PM | 181 (13.1%) | 154 (16.9%) |
| Total | 1,384 (100.0%) | 910 (100.0%) |
Housing Occupancy in Childress
Occupancy by Ownership in Childress
Of the total 1,464 dwellings in Childress, owner-occupied units account for 923 (63.0%), while renter-occupied units make up 541 (36.9%).
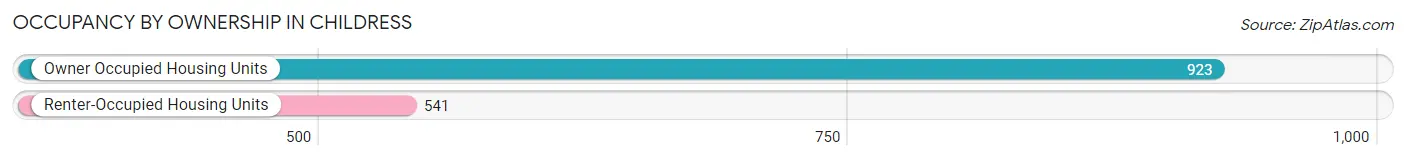
| Occupancy | # Housing Units | % Housing Units |
| Owner Occupied Housing Units | 923 | 63.0% |
| Renter-Occupied Housing Units | 541 | 36.9% |
| Total Occupied Housing Units | 1,464 | 100.0% |
Occupancy by Household Size in Childress
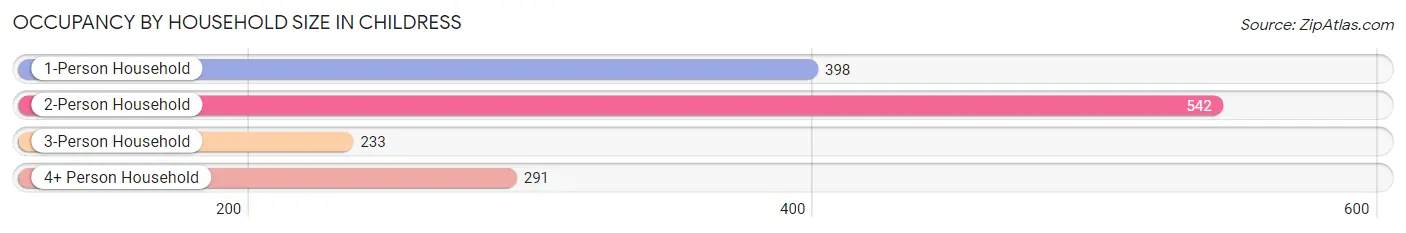
| Household Size | # Housing Units | % Housing Units |
| 1-Person Household | 398 | 27.2% |
| 2-Person Household | 542 | 37.0% |
| 3-Person Household | 233 | 15.9% |
| 4+ Person Household | 291 | 19.9% |
| Total Housing Units | 1,464 | 100.0% |
Occupancy by Ownership by Household Size in Childress
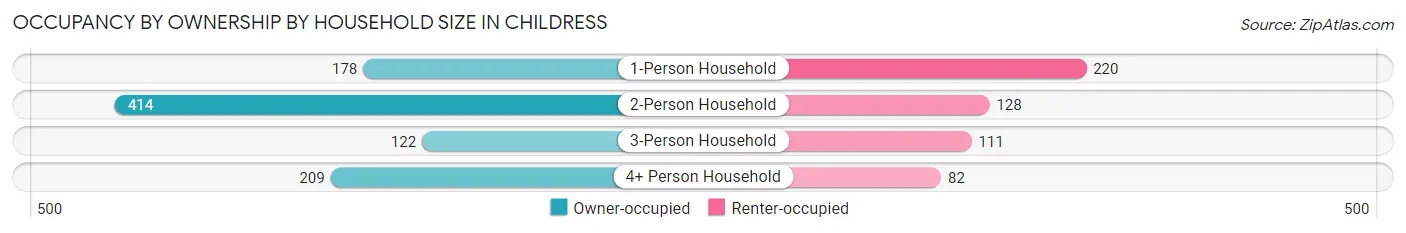
| Household Size | Owner-occupied | Renter-occupied |
| 1-Person Household | 178 (44.7%) | 220 (55.3%) |
| 2-Person Household | 414 (76.4%) | 128 (23.6%) |
| 3-Person Household | 122 (52.4%) | 111 (47.6%) |
| 4+ Person Household | 209 (71.8%) | 82 (28.2%) |
| Total Housing Units | 923 (63.0%) | 541 (36.9%) |
Occupancy by Educational Attainment in Childress
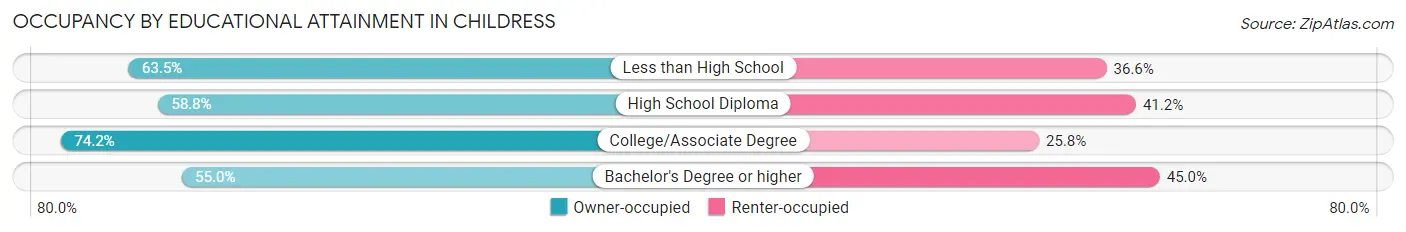
| Household Size | Owner-occupied | Renter-occupied |
| Less than High School | 184 (63.4%) | 106 (36.5%) |
| High School Diploma | 204 (58.8%) | 143 (41.2%) |
| College/Associate Degree | 310 (74.2%) | 108 (25.8%) |
| Bachelor's Degree or higher | 225 (55.0%) | 184 (45.0%) |
Occupancy by Age of Householder in Childress
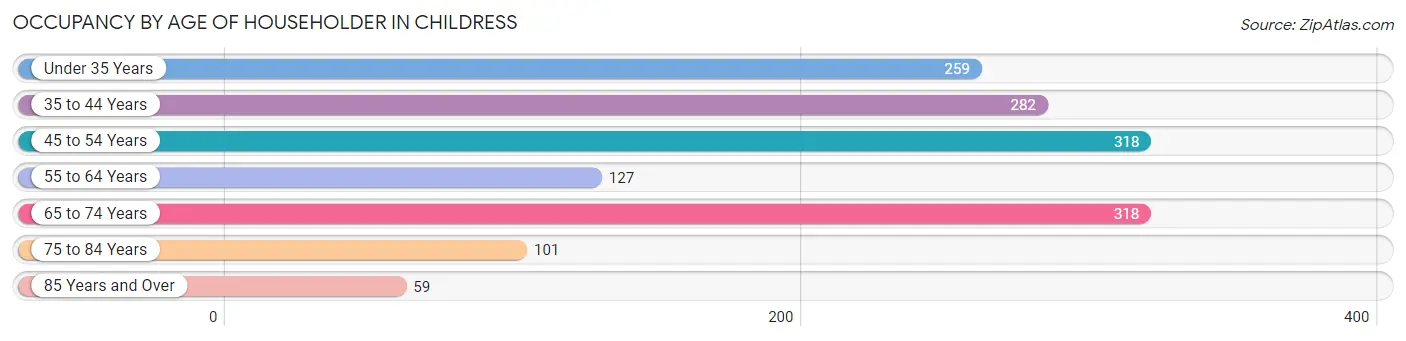
| Age Bracket | # Households | % Households |
| Under 35 Years | 259 | 17.7% |
| 35 to 44 Years | 282 | 19.3% |
| 45 to 54 Years | 318 | 21.7% |
| 55 to 64 Years | 127 | 8.7% |
| 65 to 74 Years | 318 | 21.7% |
| 75 to 84 Years | 101 | 6.9% |
| 85 Years and Over | 59 | 4.0% |
| Total | 1,464 | 100.0% |
Housing Finances in Childress
Median Income by Occupancy in Childress
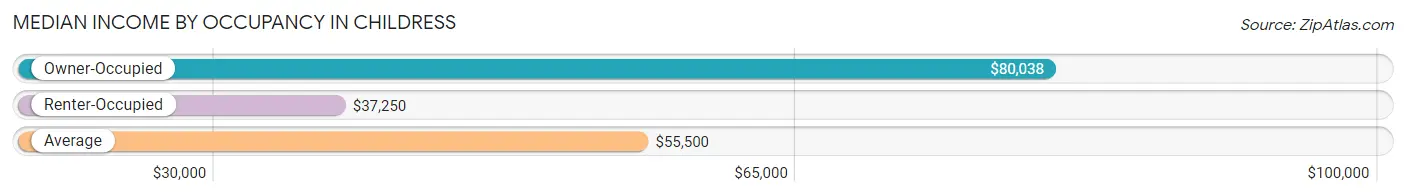
| Occupancy Type | # Households | Median Income |
| Owner-Occupied | 923 (63.0%) | $80,038 |
| Renter-Occupied | 541 (36.9%) | $37,250 |
| Average | 1,464 (100.0%) | $55,500 |
Occupancy by Householder Income Bracket in Childress
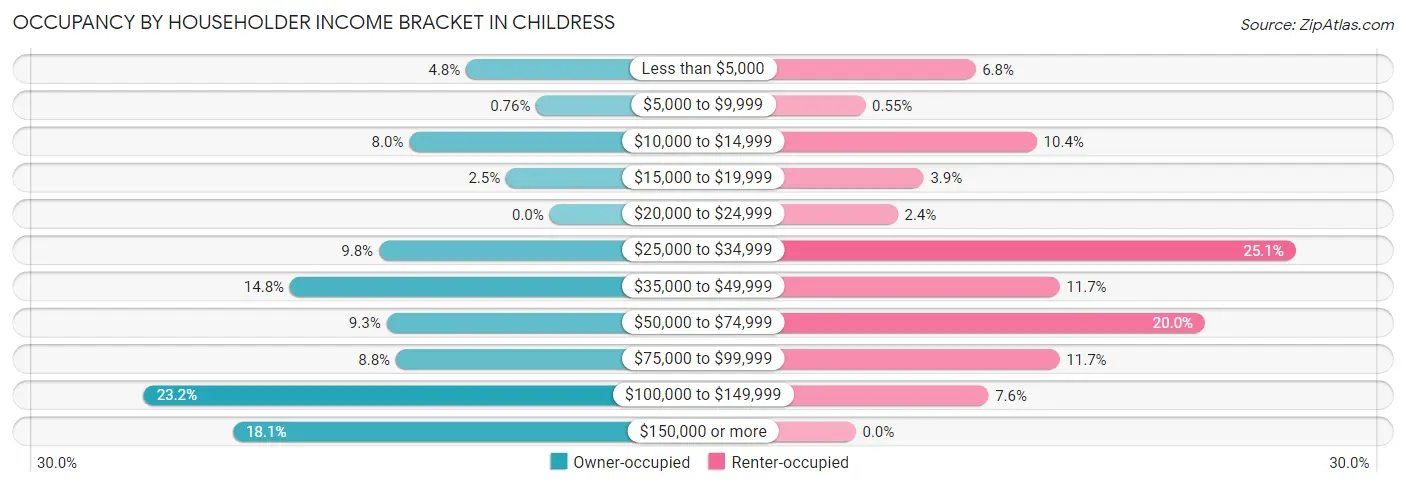
| Income Bracket | Owner-occupied | Renter-occupied |
| Less than $5,000 | 44 (4.8%) | 37 (6.8%) |
| $5,000 to $9,999 | 7 (0.8%) | 3 (0.5%) |
| $10,000 to $14,999 | 74 (8.0%) | 56 (10.3%) |
| $15,000 to $19,999 | 23 (2.5%) | 21 (3.9%) |
| $20,000 to $24,999 | 0 (0.0%) | 13 (2.4%) |
| $25,000 to $34,999 | 90 (9.8%) | 136 (25.1%) |
| $35,000 to $49,999 | 137 (14.8%) | 63 (11.7%) |
| $50,000 to $74,999 | 86 (9.3%) | 108 (20.0%) |
| $75,000 to $99,999 | 81 (8.8%) | 63 (11.7%) |
| $100,000 to $149,999 | 214 (23.2%) | 41 (7.6%) |
| $150,000 or more | 167 (18.1%) | 0 (0.0%) |
| Total | 923 (100.0%) | 541 (100.0%) |
Monthly Housing Cost Tiers in Childress
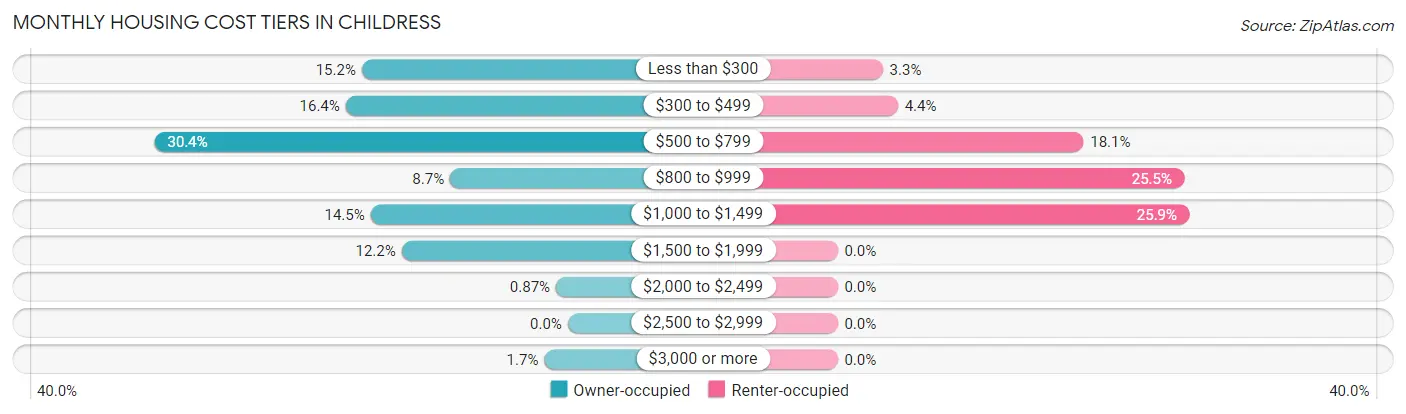
| Monthly Cost | Owner-occupied | Renter-occupied |
| Less than $300 | 140 (15.2%) | 18 (3.3%) |
| $300 to $499 | 151 (16.4%) | 24 (4.4%) |
| $500 to $799 | 281 (30.4%) | 98 (18.1%) |
| $800 to $999 | 80 (8.7%) | 138 (25.5%) |
| $1,000 to $1,499 | 134 (14.5%) | 140 (25.9%) |
| $1,500 to $1,999 | 113 (12.2%) | 0 (0.0%) |
| $2,000 to $2,499 | 8 (0.9%) | 0 (0.0%) |
| $2,500 to $2,999 | 0 (0.0%) | 0 (0.0%) |
| $3,000 or more | 16 (1.7%) | 0 (0.0%) |
| Total | 923 (100.0%) | 541 (100.0%) |
Physical Housing Characteristics in Childress
Housing Structures in Childress
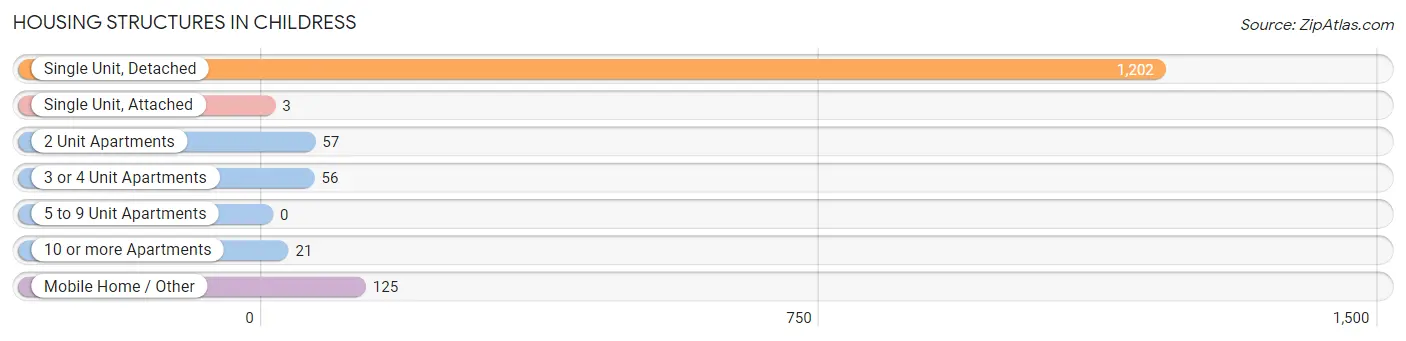
| Structure Type | # Housing Units | % Housing Units |
| Single Unit, Detached | 1,202 | 82.1% |
| Single Unit, Attached | 3 | 0.2% |
| 2 Unit Apartments | 57 | 3.9% |
| 3 or 4 Unit Apartments | 56 | 3.8% |
| 5 to 9 Unit Apartments | 0 | 0.0% |
| 10 or more Apartments | 21 | 1.4% |
| Mobile Home / Other | 125 | 8.5% |
| Total | 1,464 | 100.0% |
Housing Structures by Occupancy in Childress
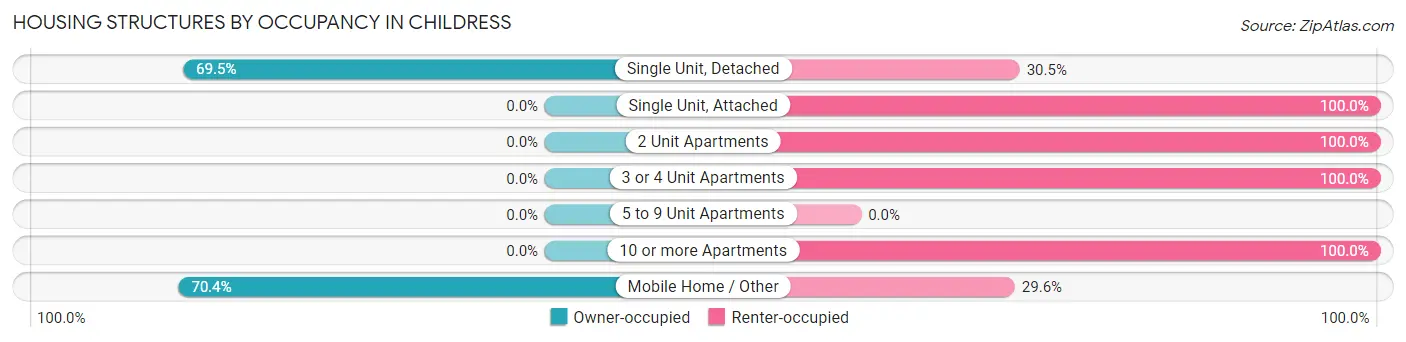
| Structure Type | Owner-occupied | Renter-occupied |
| Single Unit, Detached | 835 (69.5%) | 367 (30.5%) |
| Single Unit, Attached | 0 (0.0%) | 3 (100.0%) |
| 2 Unit Apartments | 0 (0.0%) | 57 (100.0%) |
| 3 or 4 Unit Apartments | 0 (0.0%) | 56 (100.0%) |
| 5 to 9 Unit Apartments | 0 (0.0%) | 0 (0.0%) |
| 10 or more Apartments | 0 (0.0%) | 21 (100.0%) |
| Mobile Home / Other | 88 (70.4%) | 37 (29.6%) |
| Total | 923 (63.0%) | 541 (36.9%) |
Housing Structures by Number of Rooms in Childress
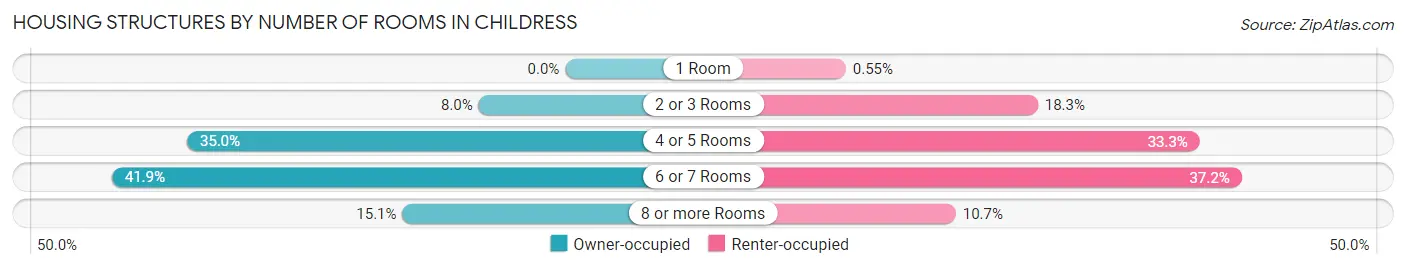
| Number of Rooms | Owner-occupied | Renter-occupied |
| 1 Room | 0 (0.0%) | 3 (0.5%) |
| 2 or 3 Rooms | 74 (8.0%) | 99 (18.3%) |
| 4 or 5 Rooms | 323 (35.0%) | 180 (33.3%) |
| 6 or 7 Rooms | 387 (41.9%) | 201 (37.1%) |
| 8 or more Rooms | 139 (15.1%) | 58 (10.7%) |
| Total | 923 (100.0%) | 541 (100.0%) |
Housing Structure by Heating Type in Childress
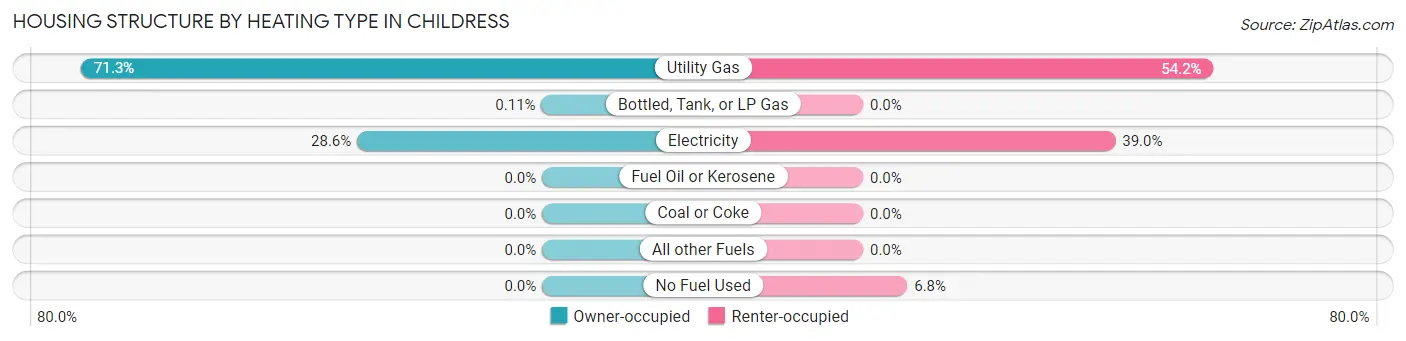
| Heating Type | Owner-occupied | Renter-occupied |
| Utility Gas | 658 (71.3%) | 293 (54.2%) |
| Bottled, Tank, or LP Gas | 1 (0.1%) | 0 (0.0%) |
| Electricity | 264 (28.6%) | 211 (39.0%) |
| Fuel Oil or Kerosene | 0 (0.0%) | 0 (0.0%) |
| Coal or Coke | 0 (0.0%) | 0 (0.0%) |
| All other Fuels | 0 (0.0%) | 0 (0.0%) |
| No Fuel Used | 0 (0.0%) | 37 (6.8%) |
| Total | 923 (100.0%) | 541 (100.0%) |
Household Vehicle Usage in Childress
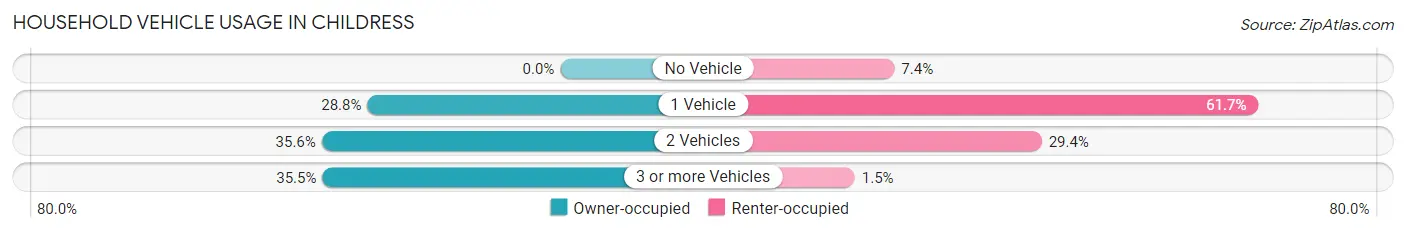
| Vehicles per Household | Owner-occupied | Renter-occupied |
| No Vehicle | 0 (0.0%) | 40 (7.4%) |
| 1 Vehicle | 266 (28.8%) | 334 (61.7%) |
| 2 Vehicles | 329 (35.6%) | 159 (29.4%) |
| 3 or more Vehicles | 328 (35.5%) | 8 (1.5%) |
| Total | 923 (100.0%) | 541 (100.0%) |
Real Estate & Mortgages in Childress
Real Estate and Mortgage Overview in Childress
| Characteristic | Without Mortgage | With Mortgage |
| Housing Units | 595 | 328 |
| Median Property Value | $78,500 | $135,400 |
| Median Household Income | $72,532 | $58 |
| Monthly Housing Costs | $503 | $16 |
| Real Estate Taxes | $1,474 | $0 |
Property Value by Mortgage Status in Childress
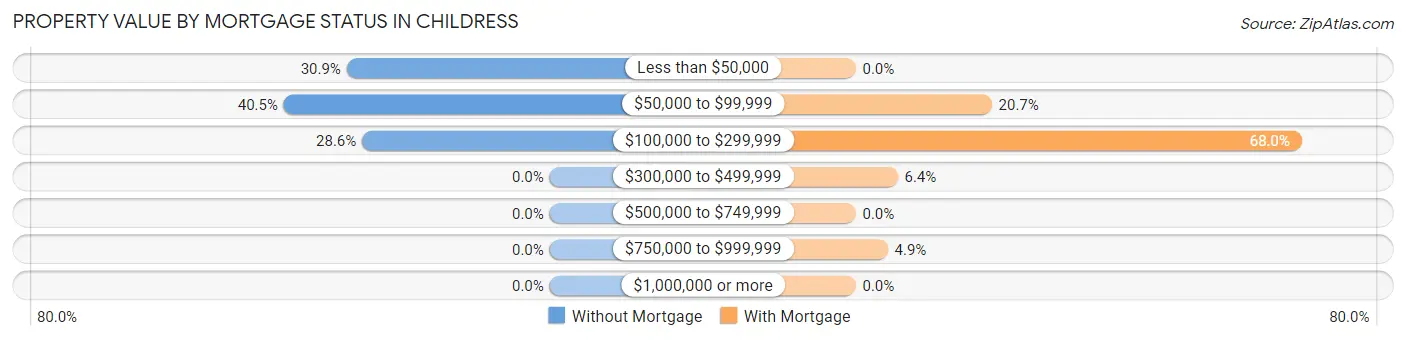
| Property Value | Without Mortgage | With Mortgage |
| Less than $50,000 | 184 (30.9%) | 0 (0.0%) |
| $50,000 to $99,999 | 241 (40.5%) | 68 (20.7%) |
| $100,000 to $299,999 | 170 (28.6%) | 223 (68.0%) |
| $300,000 to $499,999 | 0 (0.0%) | 21 (6.4%) |
| $500,000 to $749,999 | 0 (0.0%) | 0 (0.0%) |
| $750,000 to $999,999 | 0 (0.0%) | 16 (4.9%) |
| $1,000,000 or more | 0 (0.0%) | 0 (0.0%) |
| Total | 595 (100.0%) | 328 (100.0%) |
Household Income by Mortgage Status in Childress
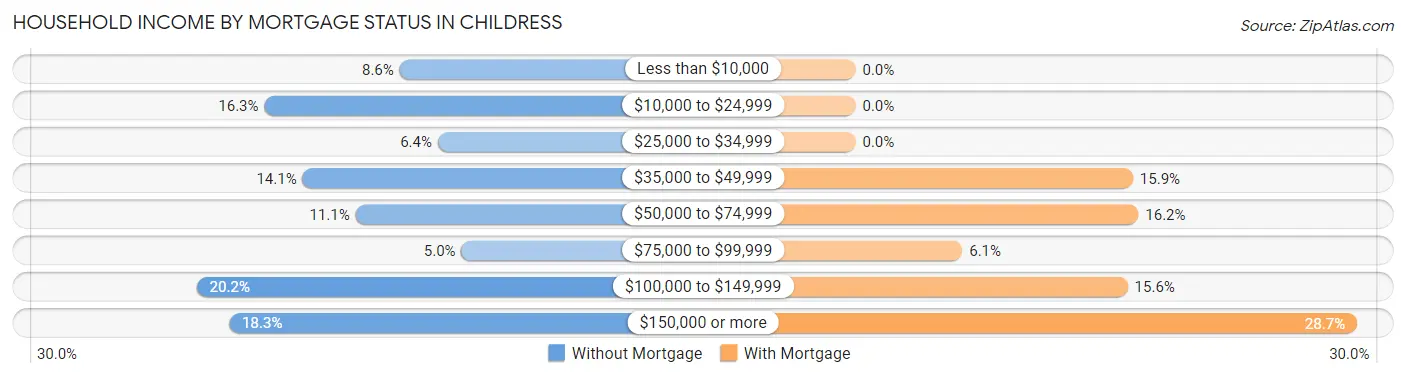
| Household Income | Without Mortgage | With Mortgage |
| Less than $10,000 | 51 (8.6%) | 0 (0.0%) |
| $10,000 to $24,999 | 97 (16.3%) | 0 (0.0%) |
| $25,000 to $34,999 | 38 (6.4%) | 0 (0.0%) |
| $35,000 to $49,999 | 84 (14.1%) | 52 (15.9%) |
| $50,000 to $74,999 | 66 (11.1%) | 53 (16.2%) |
| $75,000 to $99,999 | 30 (5.0%) | 20 (6.1%) |
| $100,000 to $149,999 | 120 (20.2%) | 51 (15.5%) |
| $150,000 or more | 109 (18.3%) | 94 (28.7%) |
| Total | 595 (100.0%) | 328 (100.0%) |
Property Value to Household Income Ratio in Childress
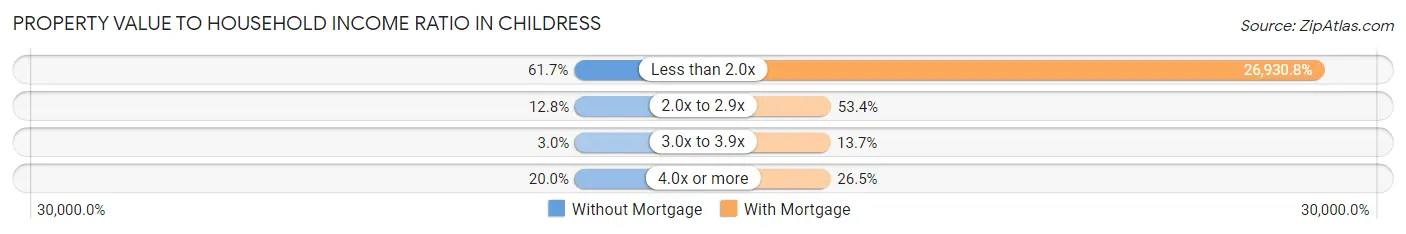
| Value-to-Income Ratio | Without Mortgage | With Mortgage |
| Less than 2.0x | 367 (61.7%) | 88,333 (26,930.8%) |
| 2.0x to 2.9x | 76 (12.8%) | 175 (53.3%) |
| 3.0x to 3.9x | 18 (3.0%) | 45 (13.7%) |
| 4.0x or more | 119 (20.0%) | 87 (26.5%) |
| Total | 595 (100.0%) | 328 (100.0%) |
Real Estate Taxes by Mortgage Status in Childress
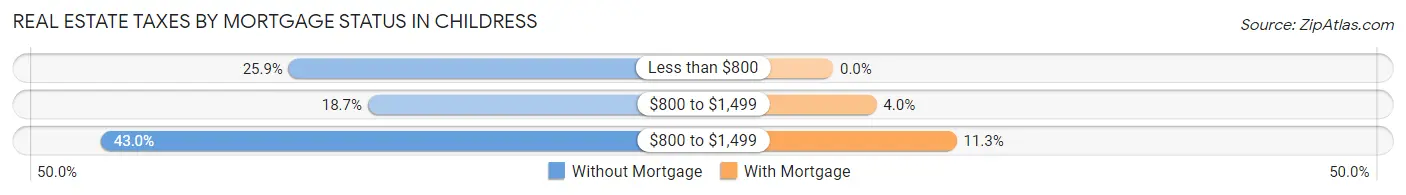
| Property Taxes | Without Mortgage | With Mortgage |
| Less than $800 | 154 (25.9%) | 0 (0.0%) |
| $800 to $1,499 | 111 (18.7%) | 13 (4.0%) |
| $800 to $1,499 | 256 (43.0%) | 37 (11.3%) |
| Total | 595 (100.0%) | 328 (100.0%) |
Health & Disability in Childress
Health Insurance Coverage by Age in Childress
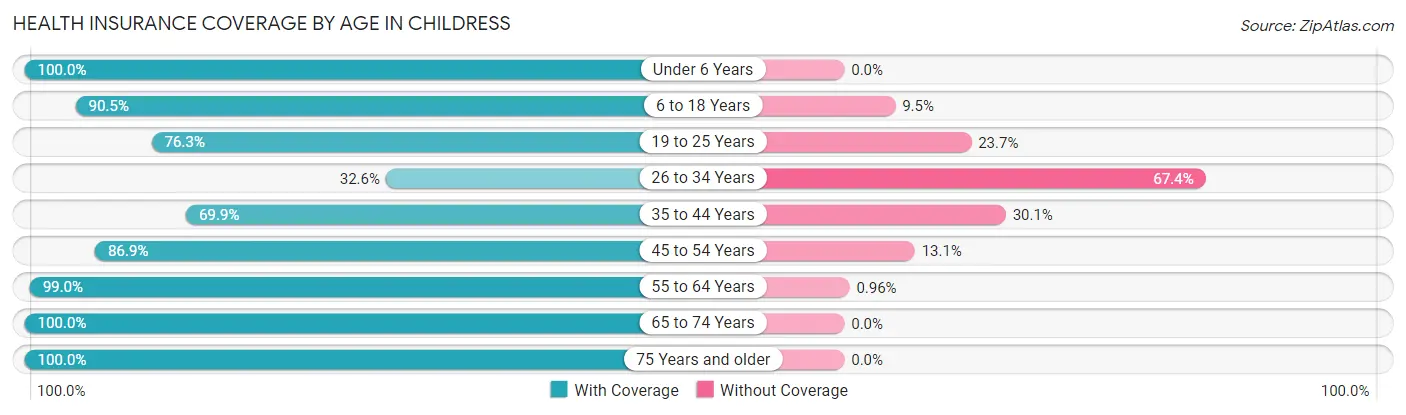
| Age Bracket | With Coverage | Without Coverage |
| Under 6 Years | 255 (100.0%) | 0 (0.0%) |
| 6 to 18 Years | 800 (90.5%) | 84 (9.5%) |
| 19 to 25 Years | 216 (76.3%) | 67 (23.7%) |
| 26 to 34 Years | 313 (32.6%) | 646 (67.4%) |
| 35 to 44 Years | 439 (69.9%) | 189 (30.1%) |
| 45 to 54 Years | 344 (86.9%) | 52 (13.1%) |
| 55 to 64 Years | 311 (99.0%) | 3 (1.0%) |
| 65 to 74 Years | 435 (100.0%) | 0 (0.0%) |
| 75 Years and older | 182 (100.0%) | 0 (0.0%) |
| Total | 3,295 (76.0%) | 1,041 (24.0%) |
Health Insurance Coverage by Citizenship Status in Childress
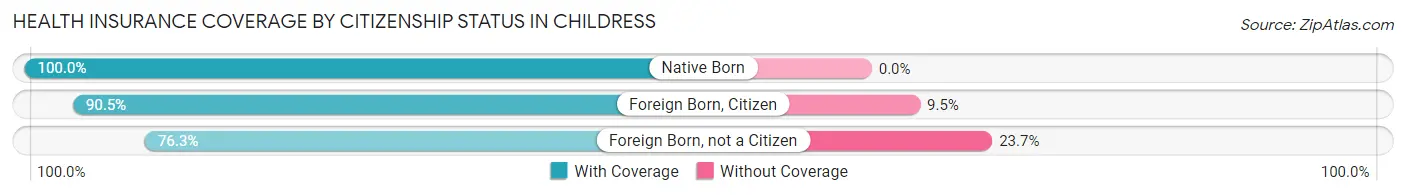
| Citizenship Status | With Coverage | Without Coverage |
| Native Born | 255 (100.0%) | 0 (0.0%) |
| Foreign Born, Citizen | 800 (90.5%) | 84 (9.5%) |
| Foreign Born, not a Citizen | 216 (76.3%) | 67 (23.7%) |
Health Insurance Coverage by Household Income in Childress
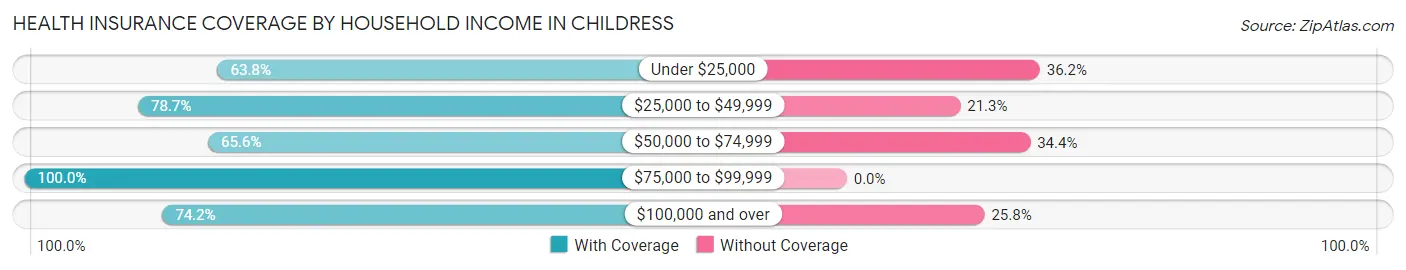
| Household Income | With Coverage | Without Coverage |
| Under $25,000 | 286 (63.8%) | 162 (36.2%) |
| $25,000 to $49,999 | 1,015 (78.7%) | 274 (21.3%) |
| $50,000 to $74,999 | 275 (65.6%) | 144 (34.4%) |
| $75,000 to $99,999 | 393 (100.0%) | 0 (0.0%) |
| $100,000 and over | 1,326 (74.2%) | 461 (25.8%) |
Public vs Private Health Insurance Coverage by Age in Childress
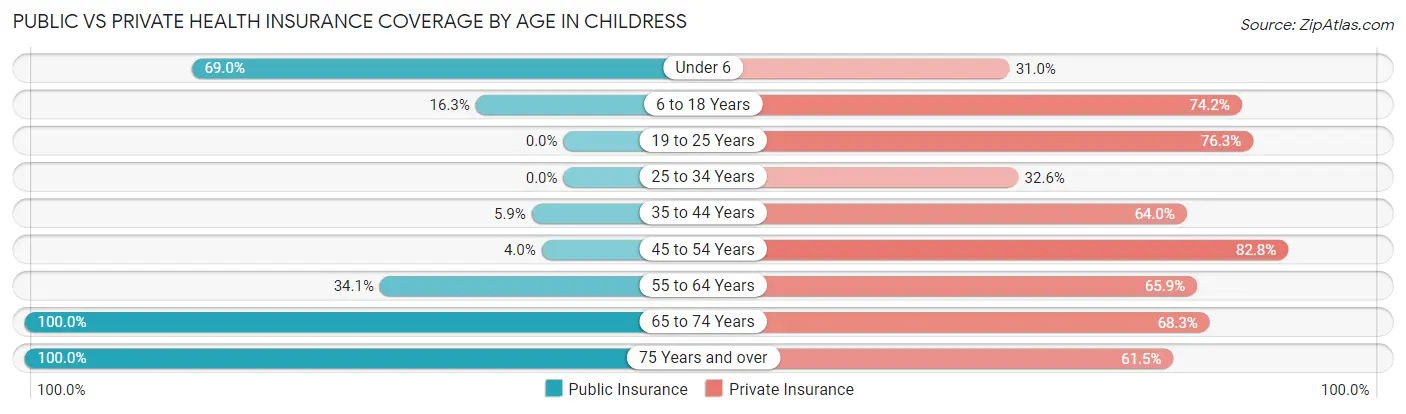
| Age Bracket | Public Insurance | Private Insurance |
| Under 6 | 176 (69.0%) | 79 (31.0%) |
| 6 to 18 Years | 144 (16.3%) | 656 (74.2%) |
| 19 to 25 Years | 0 (0.0%) | 216 (76.3%) |
| 25 to 34 Years | 0 (0.0%) | 313 (32.6%) |
| 35 to 44 Years | 37 (5.9%) | 402 (64.0%) |
| 45 to 54 Years | 16 (4.0%) | 328 (82.8%) |
| 55 to 64 Years | 107 (34.1%) | 207 (65.9%) |
| 65 to 74 Years | 435 (100.0%) | 297 (68.3%) |
| 75 Years and over | 182 (100.0%) | 112 (61.5%) |
| Total | 1,097 (25.3%) | 2,610 (60.2%) |
Disability Status by Sex by Age in Childress
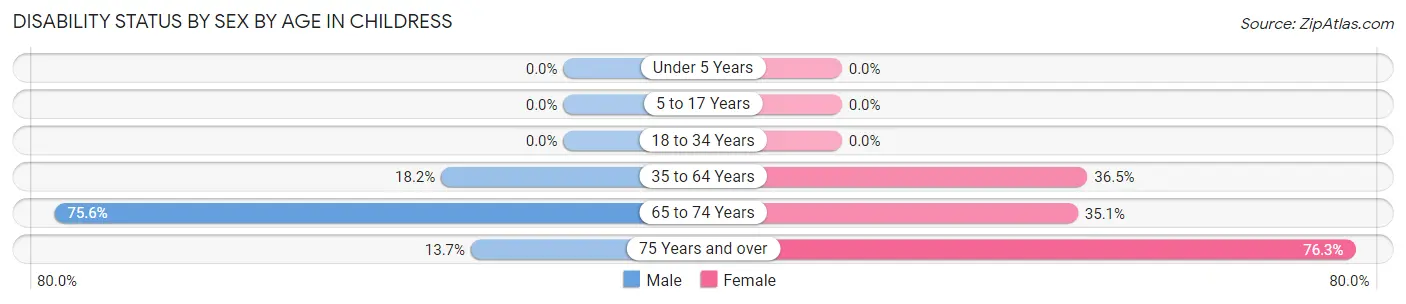
| Age Bracket | Male | Female |
| Under 5 Years | 0 (0.0%) | 0 (0.0%) |
| 5 to 17 Years | 0 (0.0%) | 0 (0.0%) |
| 18 to 34 Years | 0 (0.0%) | 0 (0.0%) |
| 35 to 64 Years | 106 (18.1%) | 275 (36.5%) |
| 65 to 74 Years | 167 (75.6%) | 75 (35.0%) |
| 75 Years and over | 14 (13.7%) | 61 (76.2%) |
Disability Class by Sex by Age in Childress
Disability Class: Hearing Difficulty
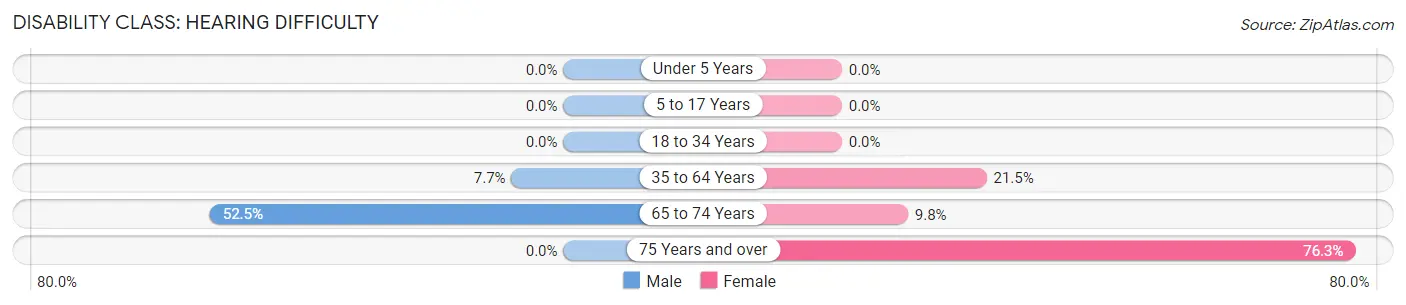
| Age Bracket | Male | Female |
| Under 5 Years | 0 (0.0%) | 0 (0.0%) |
| 5 to 17 Years | 0 (0.0%) | 0 (0.0%) |
| 18 to 34 Years | 0 (0.0%) | 0 (0.0%) |
| 35 to 64 Years | 45 (7.7%) | 162 (21.5%) |
| 65 to 74 Years | 116 (52.5%) | 21 (9.8%) |
| 75 Years and over | 0 (0.0%) | 61 (76.2%) |
Disability Class: Vision Difficulty
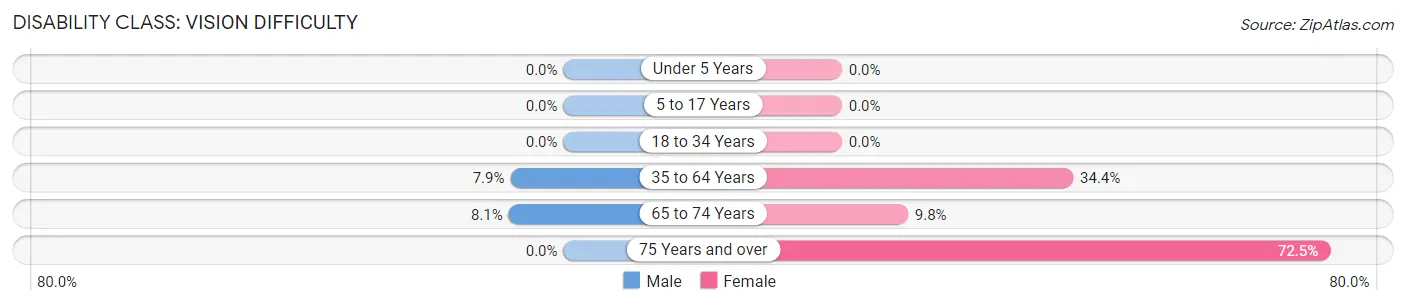
| Age Bracket | Male | Female |
| Under 5 Years | 0 (0.0%) | 0 (0.0%) |
| 5 to 17 Years | 0 (0.0%) | 0 (0.0%) |
| 18 to 34 Years | 0 (0.0%) | 0 (0.0%) |
| 35 to 64 Years | 46 (7.9%) | 259 (34.4%) |
| 65 to 74 Years | 18 (8.1%) | 21 (9.8%) |
| 75 Years and over | 0 (0.0%) | 58 (72.5%) |
Disability Class: Cognitive Difficulty
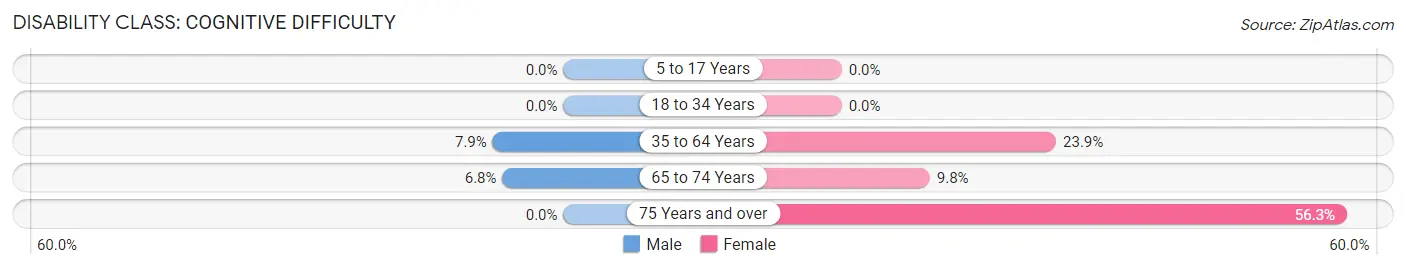
| Age Bracket | Male | Female |
| 5 to 17 Years | 0 (0.0%) | 0 (0.0%) |
| 18 to 34 Years | 0 (0.0%) | 0 (0.0%) |
| 35 to 64 Years | 46 (7.9%) | 180 (23.9%) |
| 65 to 74 Years | 15 (6.8%) | 21 (9.8%) |
| 75 Years and over | 0 (0.0%) | 45 (56.2%) |
Disability Class: Ambulatory Difficulty
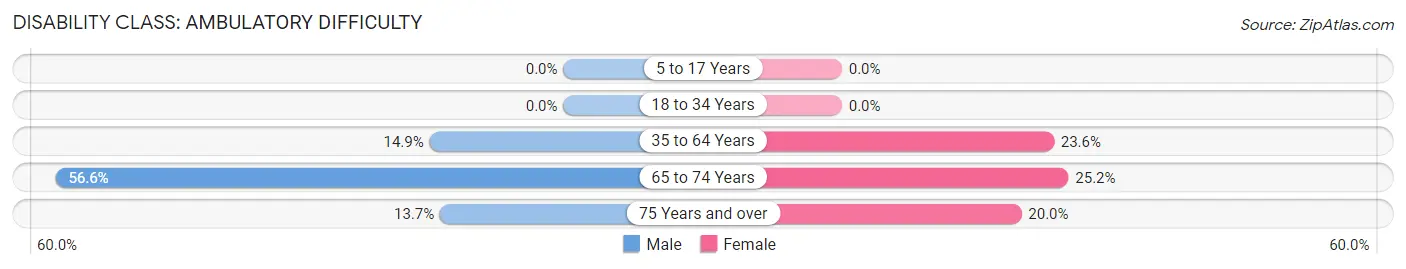
| Age Bracket | Male | Female |
| 5 to 17 Years | 0 (0.0%) | 0 (0.0%) |
| 18 to 34 Years | 0 (0.0%) | 0 (0.0%) |
| 35 to 64 Years | 87 (14.9%) | 178 (23.6%) |
| 65 to 74 Years | 125 (56.6%) | 54 (25.2%) |
| 75 Years and over | 14 (13.7%) | 16 (20.0%) |
Disability Class: Self-Care Difficulty
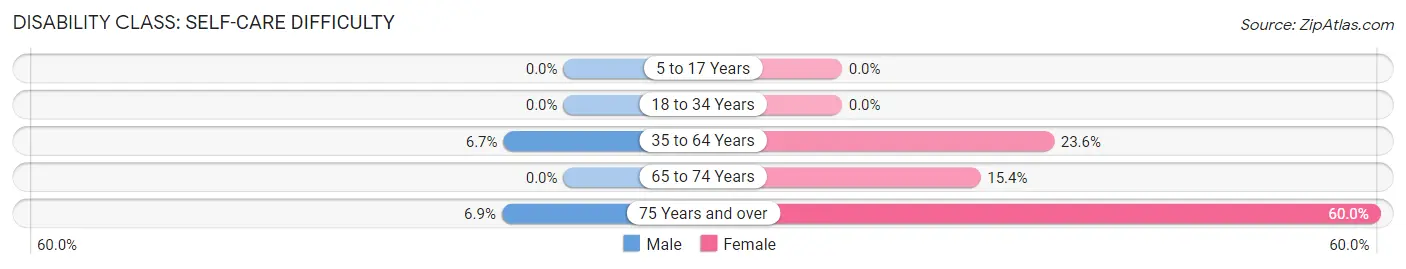
| Age Bracket | Male | Female |
| 5 to 17 Years | 0 (0.0%) | 0 (0.0%) |
| 18 to 34 Years | 0 (0.0%) | 0 (0.0%) |
| 35 to 64 Years | 39 (6.7%) | 178 (23.6%) |
| 65 to 74 Years | 0 (0.0%) | 33 (15.4%) |
| 75 Years and over | 7 (6.9%) | 48 (60.0%) |
Technology Access in Childress
Computing Device Access in Childress
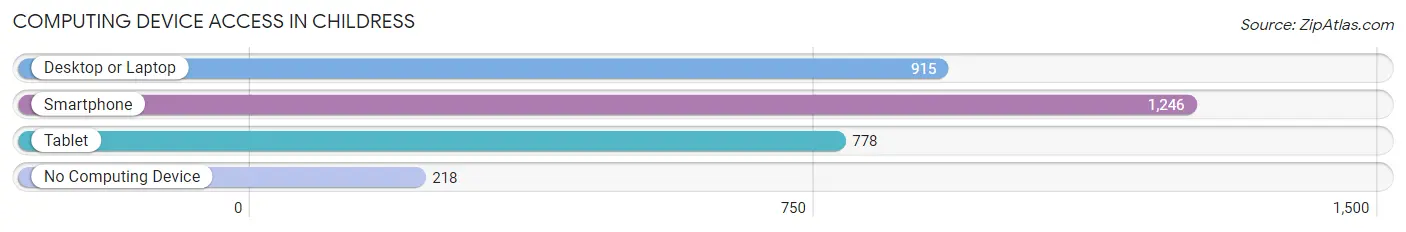
| Device Type | # Households | % Households |
| Desktop or Laptop | 915 | 62.5% |
| Smartphone | 1,246 | 85.1% |
| Tablet | 778 | 53.1% |
| No Computing Device | 218 | 14.9% |
| Total | 1,464 | 100.0% |
Internet Access in Childress
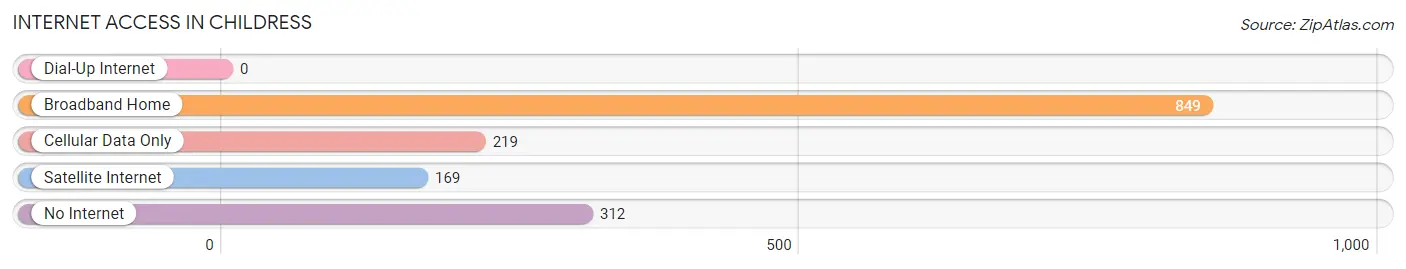
| Internet Type | # Households | % Households |
| Dial-Up Internet | 0 | 0.0% |
| Broadband Home | 849 | 58.0% |
| Cellular Data Only | 219 | 15.0% |
| Satellite Internet | 169 | 11.5% |
| No Internet | 312 | 21.3% |
| Total | 1,464 | 100.0% |
Childress Summary
Childress, Texas is a small city located in the northern part of the state, in Childress County. It is the county seat of Childress County and is situated at the intersection of U.S. Highways 83 and 62. The city has a population of 6,905 as of the 2010 census, and is the largest city in the county.
History
Childress was founded in 1887 by a group of settlers from the nearby town of Henrietta, Texas. The town was named after George Campbell Childress, a signer of the Texas Declaration of Independence. The town was officially incorporated in 1890, and the first post office was established in 1891.
In the early 1900s, Childress was a thriving agricultural center, with cotton, corn, and wheat being the main crops. The town also had a number of businesses, including a bank, a hotel, a newspaper, and a number of stores.
In the 1920s, the town began to experience a period of growth, with the construction of a new courthouse, a new school, and a number of new businesses. The town also became a center for oil and gas production, and the population began to grow rapidly.
In the 1950s, the town experienced a period of decline, as the oil and gas industry began to decline. The population began to decline as well, and the town began to experience a period of stagnation.
In the late 1970s, the town began to experience a period of revitalization, with the construction of a new hospital, a new library, and a number of new businesses. The population began to grow again, and the town began to experience a period of growth.
Geography
Childress is located in the northern part of Texas, in Childress County. It is situated at the intersection of U.S. Highways 83 and 62. The city has a total area of 4.2 square miles, all of which is land.
The city is located in the High Plains region of Texas, and is characterized by flat terrain and rolling hills. The climate is semi-arid, with hot summers and mild winters. The average annual precipitation is 19.5 inches.
Economy
The economy of Childress is largely based on agriculture and oil and gas production. The city is home to a number of agricultural businesses, including cotton gins, grain elevators, and feed mills. The city is also home to a number of oil and gas companies, including Chevron, ExxonMobil, and ConocoPhillips.
The city is also home to a number of manufacturing businesses, including a plastics plant, a furniture factory, and a metal fabrication plant. The city is also home to a number of retail businesses, including a number of restaurants, grocery stores, and clothing stores.
Demographics
As of the 2010 census, the population of Childress was 6,905. The racial makeup of the city was 79.2% White, 15.3% Hispanic or Latino, 2.2% African American, 0.7% Native American, 0.3% Asian, and 2.5% from other races.
The median household income in Childress was $31,944, and the median family income was $37,917. The per capita income in the city was $17,845. About 17.2% of the population was below the poverty line.
Common Questions
What is Per Capita Income in Childress?
Per Capita income in Childress is $25,762.
What is the Median Family Income in Childress?
Median Family Income in Childress is $52,339.
What is the Median Household income in Childress?
Median Household Income in Childress is $55,500.
What is Income or Wage Gap in Childress?
Income or Wage Gap in Childress is 34.0%.
Women in Childress earn 66.0 cents for every dollar earned by a man.
What is Inequality or Gini Index in Childress?
Inequality or Gini Index in Childress is 0.47.
What is the Total Population of Childress?
Total Population of Childress is 5,786.
What is the Total Male Population of Childress?
Total Male Population of Childress is 3,817.
What is the Total Female Population of Childress?
Total Female Population of Childress is 1,969.
What is the Ratio of Males per 100 Females in Childress?
There are 193.85 Males per 100 Females in Childress.
What is the Ratio of Females per 100 Males in Childress?
There are 51.59 Females per 100 Males in Childress.
What is the Median Population Age in Childress?
Median Population Age in Childress is 32.3 Years.
What is the Average Family Size in Childress
Average Family Size in Childress is 3.2 People.
What is the Average Household Size in Childress
Average Household Size in Childress is 3.0 People.
How Large is the Labor Force in Childress?
There are 2,577 People in the Labor Forcein in Childress.
What is the Percentage of People in the Labor Force in Childress?
53.4% of People are in the Labor Force in Childress.
What is the Unemployment Rate in Childress?
Unemployment Rate in Childress is 9.9%.