Chandler, TX Map & Demographics
Chandler Map
Chandler Overview
$43,858
PER CAPITA INCOME
$89,760
AVG FAMILY INCOME
$53,814
AVG HOUSEHOLD INCOME
34.5%
WAGE / INCOME GAP [ % ]
65.5¢/ $1
WAGE / INCOME GAP [ $ ]
0.55
INEQUALITY / GINI INDEX
3,308
TOTAL POPULATION
1,650
MALE POPULATION
1,658
FEMALE POPULATION
99.52
MALES / 100 FEMALES
100.48
FEMALES / 100 MALES
50.0
MEDIAN AGE
3.1
AVG FAMILY SIZE
2.3
AVG HOUSEHOLD SIZE
1,596
LABOR FORCE [ PEOPLE ]
56.6%
PERCENT IN LABOR FORCE
5.1%
UNEMPLOYMENT RATE
Chandler Zip Codes
Income in Chandler
Income Overview in Chandler
Per Capita Income in Chandler is $43,858, while median incomes of families and households are $89,760 and $53,814 respectively.
| Characteristic | Number | Measure |
| Per Capita Income | 3,308 | $43,858 |
| Median Family Income | 868 | $89,760 |
| Mean Family Income | 868 | $140,399 |
| Median Household Income | 1,408 | $53,814 |
| Mean Household Income | 1,408 | $98,803 |
| Income Deficit | 868 | $0 |
| Wage / Income Gap (%) | 3,308 | 34.46% |
| Wage / Income Gap ($) | 3,308 | 65.54¢ per $1 |
| Gini / Inequality Index | 3,308 | 0.55 |
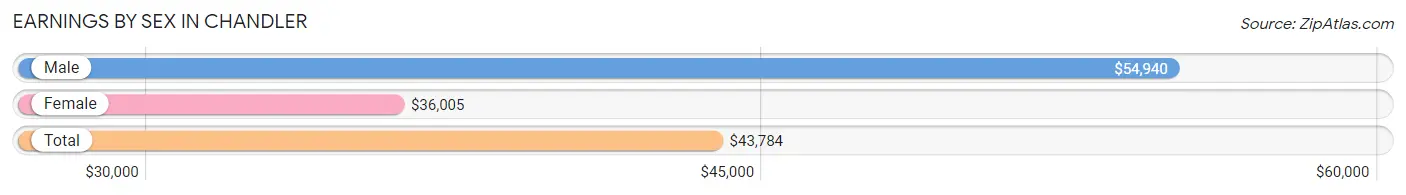
Earnings by Sex in Chandler
Average Earnings in Chandler are $43,784, $54,940 for men and $36,005 for women, a difference of 34.5%.
| Sex | Number | Average Earnings |
| Male | 932 (56.9%) | $54,940 |
| Female | 706 (43.1%) | $36,005 |
| Total | 1,638 (100.0%) | $43,784 |
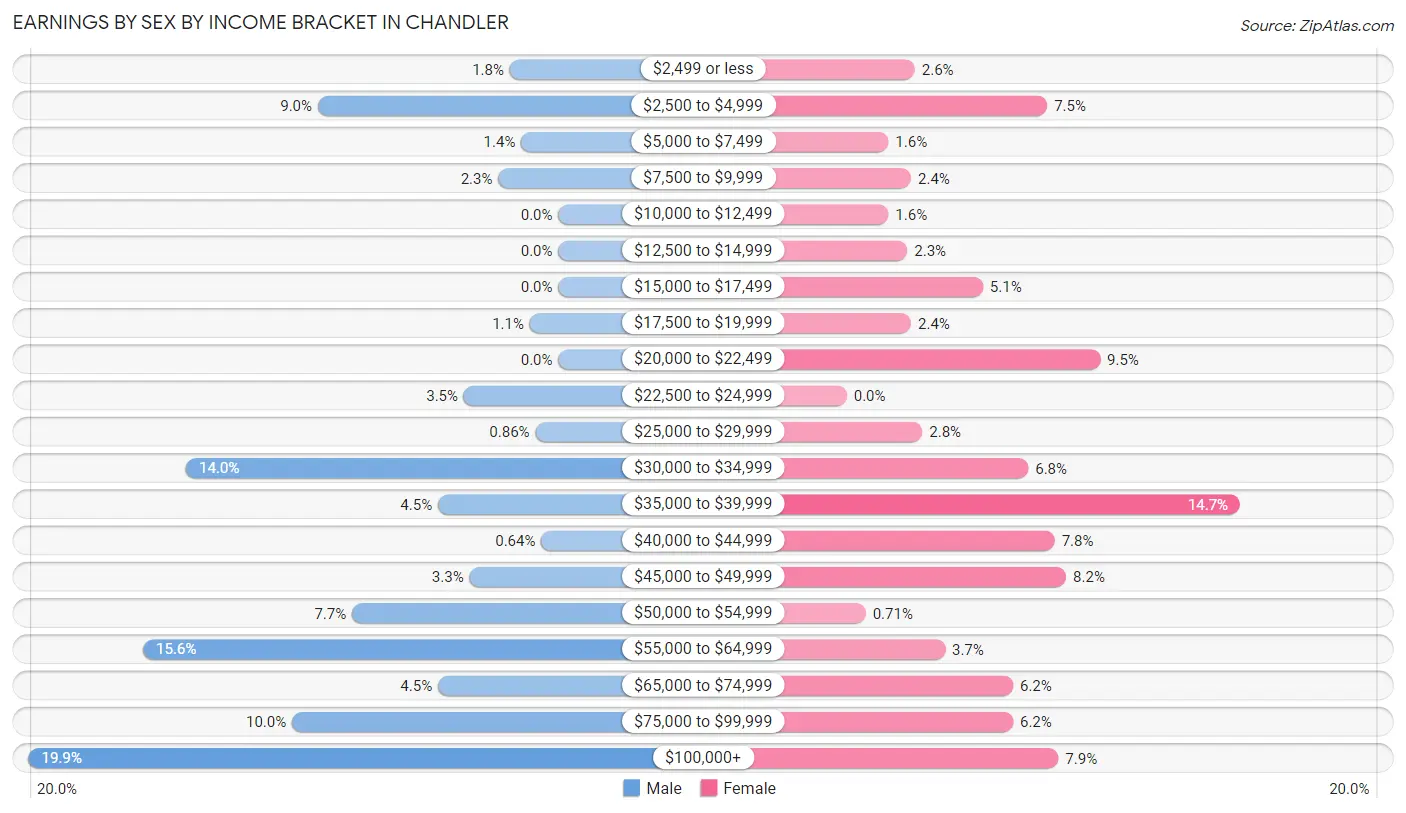
Earnings by Sex by Income Bracket in Chandler
The most common earnings brackets in Chandler are $100,000+ for men (185 | 19.9%) and $35,000 to $39,999 for women (104 | 14.7%).
| Income | Male | Female |
| $2,499 or less | 17 (1.8%) | 18 (2.5%) |
| $2,500 to $4,999 | 84 (9.0%) | 53 (7.5%) |
| $5,000 to $7,499 | 13 (1.4%) | 11 (1.6%) |
| $7,500 to $9,999 | 21 (2.2%) | 17 (2.4%) |
| $10,000 to $12,499 | 0 (0.0%) | 11 (1.6%) |
| $12,500 to $14,999 | 0 (0.0%) | 16 (2.3%) |
| $15,000 to $17,499 | 0 (0.0%) | 36 (5.1%) |
| $17,500 to $19,999 | 10 (1.1%) | 17 (2.4%) |
| $20,000 to $22,499 | 0 (0.0%) | 67 (9.5%) |
| $22,500 to $24,999 | 33 (3.5%) | 0 (0.0%) |
| $25,000 to $29,999 | 8 (0.9%) | 20 (2.8%) |
| $30,000 to $34,999 | 130 (14.0%) | 48 (6.8%) |
| $35,000 to $39,999 | 42 (4.5%) | 104 (14.7%) |
| $40,000 to $44,999 | 6 (0.6%) | 55 (7.8%) |
| $45,000 to $49,999 | 31 (3.3%) | 58 (8.2%) |
| $50,000 to $54,999 | 72 (7.7%) | 5 (0.7%) |
| $55,000 to $64,999 | 145 (15.6%) | 26 (3.7%) |
| $65,000 to $74,999 | 42 (4.5%) | 44 (6.2%) |
| $75,000 to $99,999 | 93 (10.0%) | 44 (6.2%) |
| $100,000+ | 185 (19.9%) | 56 (7.9%) |
| Total | 932 (100.0%) | 706 (100.0%) |
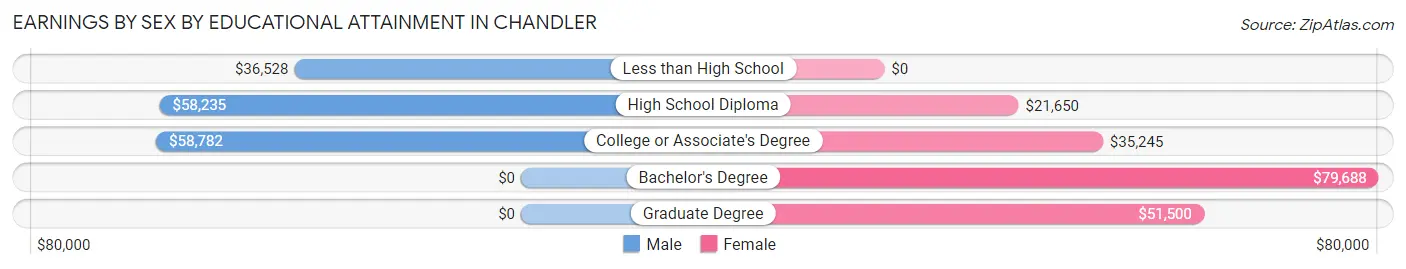
Earnings by Sex by Educational Attainment in Chandler
Average earnings in Chandler are $57,637 for men and $36,946 for women, a difference of 35.9%. Men with an educational attainment of college or associate's degree enjoy the highest average annual earnings of $58,782, while those with less than high school education earn the least with $36,528. Women with an educational attainment of bachelor's degree earn the most with the average annual earnings of $79,688, while those with high school diploma education have the smallest earnings of $21,650.
| Educational Attainment | Male Income | Female Income |
| Less than High School | $36,528 | $0 |
| High School Diploma | $58,235 | $21,650 |
| College or Associate's Degree | $58,782 | $35,245 |
| Bachelor's Degree | - | - |
| Graduate Degree | - | - |
| Total | $57,637 | $36,946 |
Family Income in Chandler
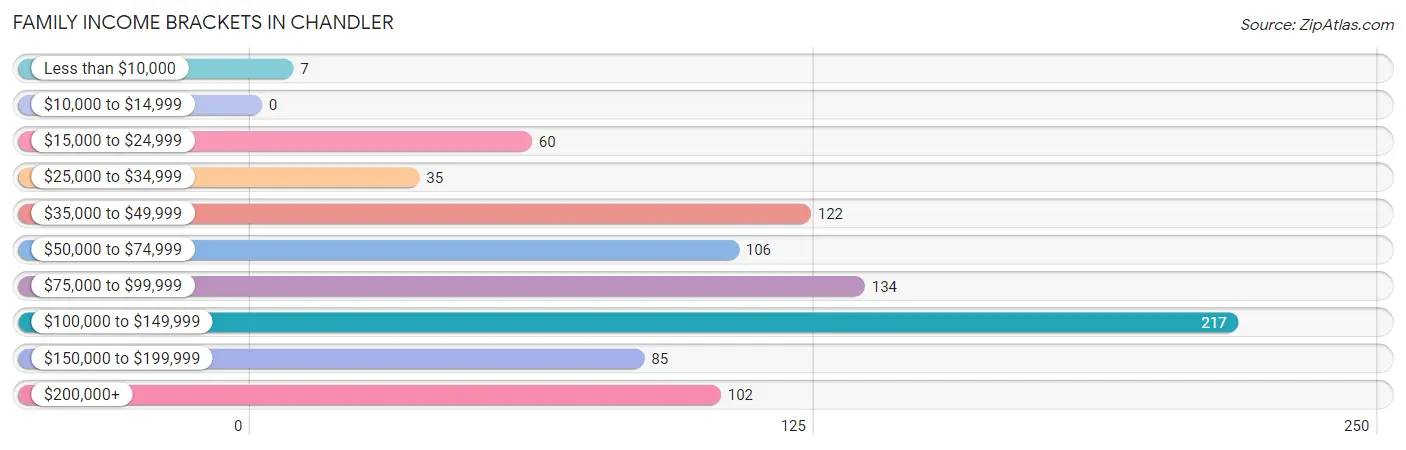
Family Income Brackets in Chandler
According to the Chandler family income data, there are 217 families falling into the $100,000 to $149,999 income range, which is the most common income bracket and makes up 25.0% of all families.
| Income Bracket | # Families | % Families |
| Less than $10,000 | 7 | 0.8% |
| $10,000 to $14,999 | 0 | 0.0% |
| $15,000 to $24,999 | 60 | 6.9% |
| $25,000 to $34,999 | 35 | 4.0% |
| $35,000 to $49,999 | 122 | 14.1% |
| $50,000 to $74,999 | 106 | 12.2% |
| $75,000 to $99,999 | 134 | 15.4% |
| $100,000 to $149,999 | 217 | 25.0% |
| $150,000 to $199,999 | 85 | 9.8% |
| $200,000+ | 102 | 11.8% |
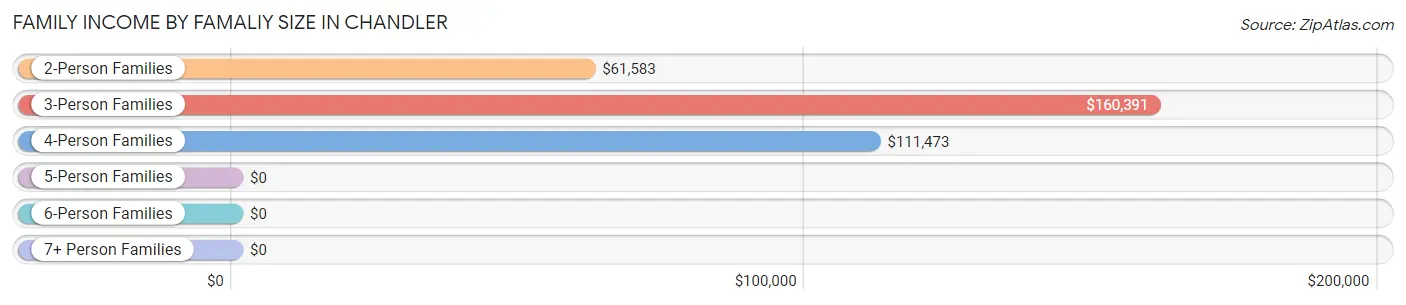
Family Income by Famaliy Size in Chandler
3-person families (225 | 25.9%) account for the highest median family income in Chandler with $160,391 per family, while 3-person families (225 | 25.9%) have the highest median income of $53,464 per family member.
| Income Bracket | # Families | Median Income |
| 2-Person Families | 420 (48.4%) | $61,583 |
| 3-Person Families | 225 (25.9%) | $160,391 |
| 4-Person Families | 215 (24.8%) | $111,473 |
| 5-Person Families | 2 (0.2%) | $0 |
| 6-Person Families | 0 (0.0%) | $0 |
| 7+ Person Families | 6 (0.7%) | $0 |
| Total | 868 (100.0%) | $89,760 |
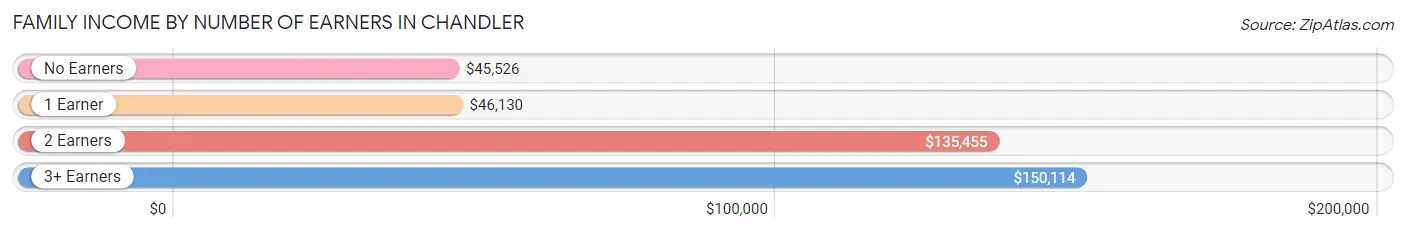
Family Income by Number of Earners in Chandler
The median family income in Chandler is $89,760, with families comprising 3+ earners (67) having the highest median family income of $150,114, while families with no earners (140) have the lowest median family income of $45,526, accounting for 7.7% and 16.1% of families, respectively.
| Number of Earners | # Families | Median Income |
| No Earners | 140 (16.1%) | $45,526 |
| 1 Earner | 199 (22.9%) | $46,130 |
| 2 Earners | 462 (53.2%) | $135,455 |
| 3+ Earners | 67 (7.7%) | $150,114 |
| Total | 868 (100.0%) | $89,760 |
Household Income in Chandler
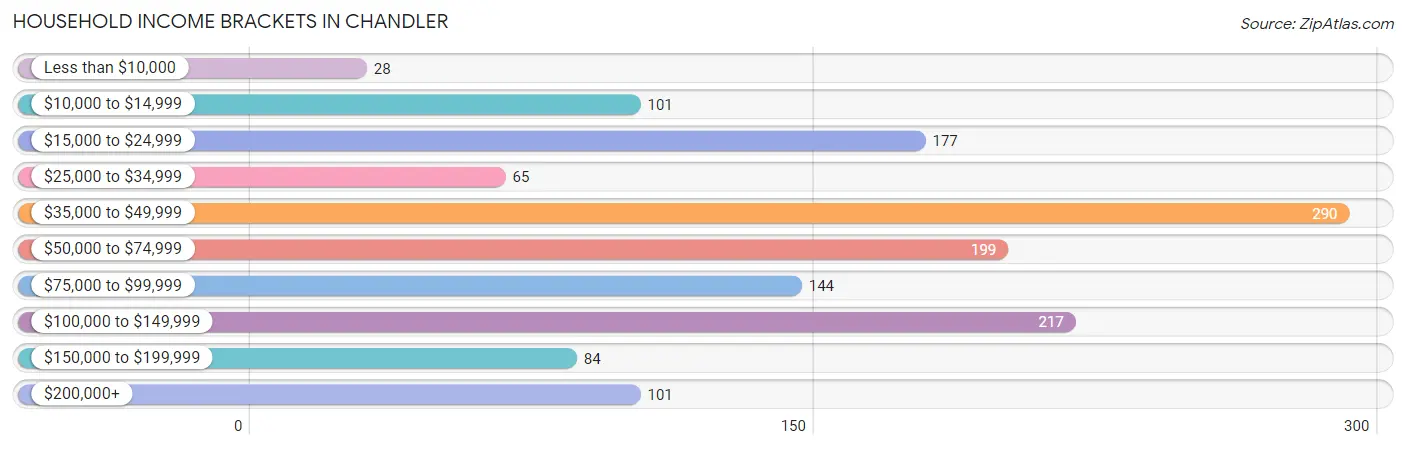
Household Income Brackets in Chandler
With 290 households falling in the category, the $35,000 to $49,999 income range is the most frequent in Chandler, accounting for 20.6% of all households. In contrast, only 28 households (2.0%) fall into the less than $10,000 income bracket, making it the least populous group.
| Income Bracket | # Households | % Households |
| Less than $10,000 | 28 | 2.0% |
| $10,000 to $14,999 | 101 | 7.2% |
| $15,000 to $24,999 | 177 | 12.6% |
| $25,000 to $34,999 | 65 | 4.6% |
| $35,000 to $49,999 | 290 | 20.6% |
| $50,000 to $74,999 | 199 | 14.1% |
| $75,000 to $99,999 | 144 | 10.2% |
| $100,000 to $149,999 | 217 | 15.4% |
| $150,000 to $199,999 | 84 | 6.0% |
| $200,000+ | 101 | 7.2% |
Household Income by Householder Age in Chandler
The median household income in Chandler is $53,814, with the highest median household income of $120,833 found in the 45 to 64 years age bracket for the primary householder. A total of 382 households (27.1%) fall into this category. Meanwhile, the 15 to 24 years age bracket for the primary householder has the lowest median household income of $0, with 42 households (3.0%) in this group.
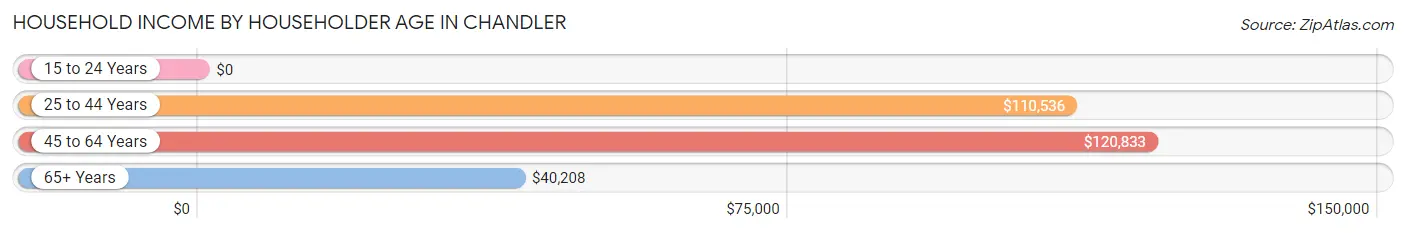
| Income Bracket | # Households | Median Income |
| 15 to 24 Years | 42 (3.0%) | $0 |
| 25 to 44 Years | 302 (21.4%) | $110,536 |
| 45 to 64 Years | 382 (27.1%) | $120,833 |
| 65+ Years | 682 (48.4%) | $40,208 |
| Total | 1,408 (100.0%) | $53,814 |
Poverty in Chandler
Income Below Poverty by Sex and Age in Chandler
With 3.2% poverty level for males and 6.3% for females among the residents of Chandler, 55 to 64 year old males and 12 to 14 year old females are the most vulnerable to poverty, with 44 males (24.7%) and 12 females (60.0%) in their respective age groups living below the poverty level.
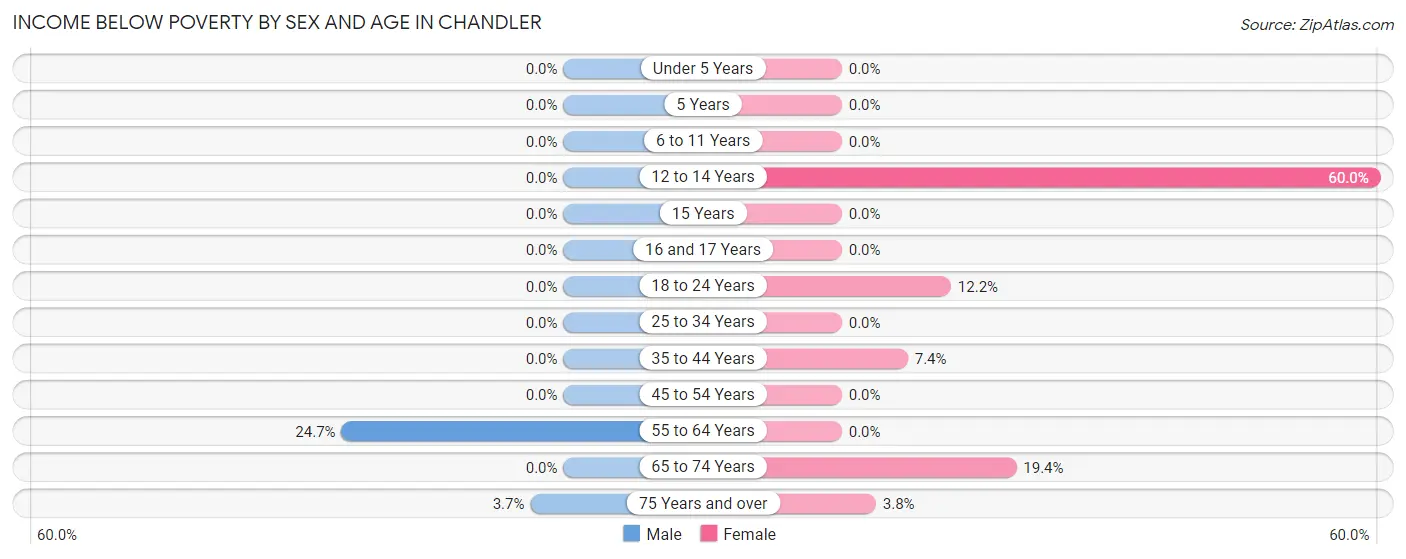
| Age Bracket | Male | Female |
| Under 5 Years | 0 (0.0%) | 0 (0.0%) |
| 5 Years | 0 (0.0%) | 0 (0.0%) |
| 6 to 11 Years | 0 (0.0%) | 0 (0.0%) |
| 12 to 14 Years | 0 (0.0%) | 12 (60.0%) |
| 15 Years | 0 (0.0%) | 0 (0.0%) |
| 16 and 17 Years | 0 (0.0%) | 0 (0.0%) |
| 18 to 24 Years | 0 (0.0%) | 13 (12.1%) |
| 25 to 34 Years | 0 (0.0%) | 0 (0.0%) |
| 35 to 44 Years | 0 (0.0%) | 10 (7.3%) |
| 45 to 54 Years | 0 (0.0%) | 0 (0.0%) |
| 55 to 64 Years | 44 (24.7%) | 0 (0.0%) |
| 65 to 74 Years | 0 (0.0%) | 49 (19.4%) |
| 75 Years and over | 7 (3.7%) | 17 (3.8%) |
| Total | 51 (3.2%) | 101 (6.3%) |
Income Above Poverty by Sex and Age in Chandler
According to the poverty statistics in Chandler, males aged under 5 years and females aged under 5 years are the age groups that are most secure financially, with 100.0% of males and 100.0% of females in these age groups living above the poverty line.
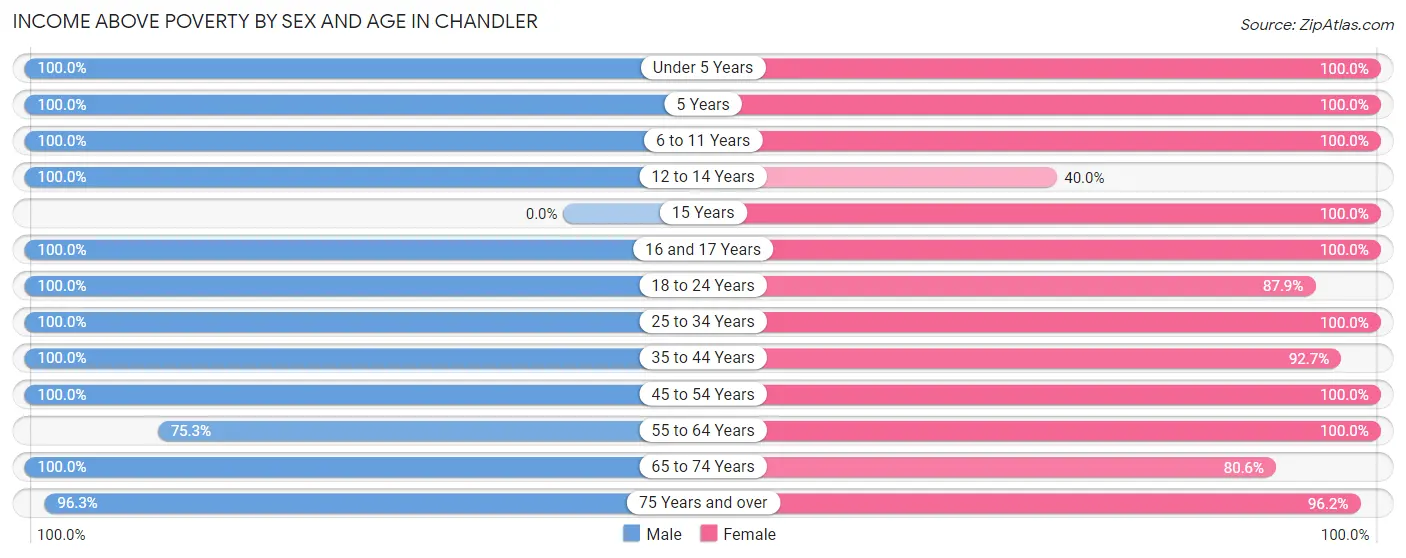
| Age Bracket | Male | Female |
| Under 5 Years | 82 (100.0%) | 31 (100.0%) |
| 5 Years | 89 (100.0%) | 8 (100.0%) |
| 6 to 11 Years | 71 (100.0%) | 39 (100.0%) |
| 12 to 14 Years | 119 (100.0%) | 8 (40.0%) |
| 15 Years | 0 (0.0%) | 29 (100.0%) |
| 16 and 17 Years | 41 (100.0%) | 27 (100.0%) |
| 18 to 24 Years | 189 (100.0%) | 94 (87.8%) |
| 25 to 34 Years | 199 (100.0%) | 185 (100.0%) |
| 35 to 44 Years | 134 (100.0%) | 126 (92.6%) |
| 45 to 54 Years | 166 (100.0%) | 203 (100.0%) |
| 55 to 64 Years | 134 (75.3%) | 126 (100.0%) |
| 65 to 74 Years | 158 (100.0%) | 203 (80.6%) |
| 75 Years and over | 183 (96.3%) | 432 (96.2%) |
| Total | 1,565 (96.8%) | 1,511 (93.7%) |
Income Below Poverty Among Married-Couple Families in Chandler
The poverty statistics for married-couple families in Chandler show that 2.5% or 18 of the total 721 families live below the poverty line. Families with 1 or 2 children have the highest poverty rate of 4.2%, comprising of 11 families. On the other hand, families with 5 or more children have the lowest poverty rate of 0.0%, which includes 0 families.
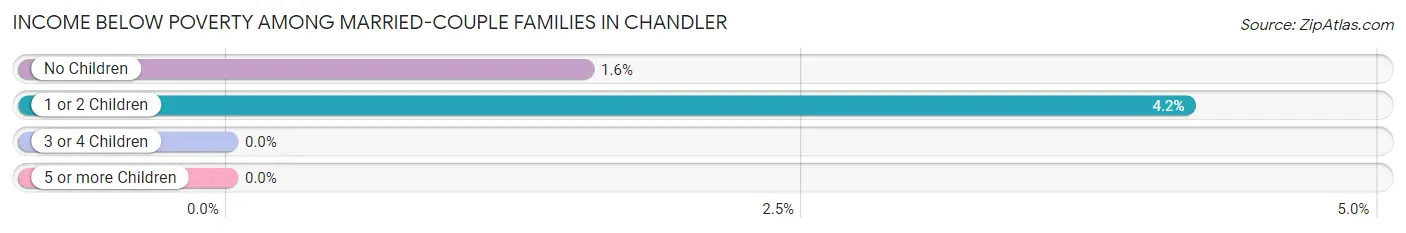
| Children | Above Poverty | Below Poverty |
| No Children | 444 (98.5%) | 7 (1.5%) |
| 1 or 2 Children | 253 (95.8%) | 11 (4.2%) |
| 3 or 4 Children | 0 (0.0%) | 0 (0.0%) |
| 5 or more Children | 6 (100.0%) | 0 (0.0%) |
| Total | 703 (97.5%) | 18 (2.5%) |
Income Below Poverty Among Single-Parent Households in Chandler
| Children | Single Father | Single Mother |
| No Children | 0 (0.0%) | 0 (0.0%) |
| 1 or 2 Children | 0 (0.0%) | 0 (0.0%) |
| 3 or 4 Children | 0 (0.0%) | 0 (0.0%) |
| 5 or more Children | 0 (0.0%) | 0 (0.0%) |
| Total | 0 (0.0%) | 0 (0.0%) |
Income Below Poverty Among Married-Couple vs Single-Parent Households in Chandler
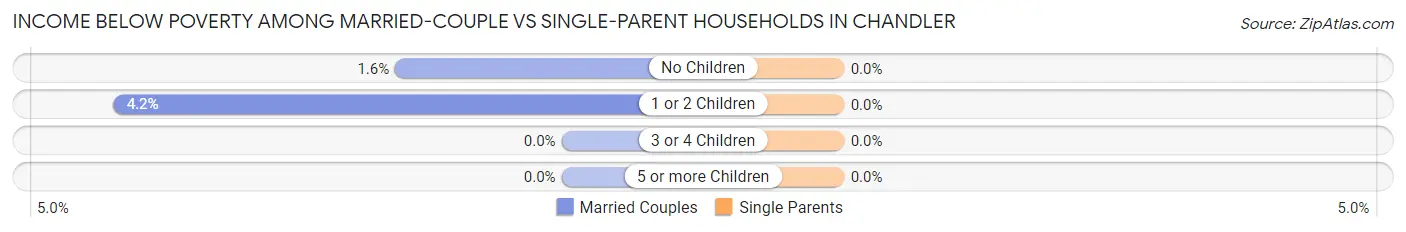
| Children | Married-Couple Families | Single-Parent Households |
| No Children | 7 (1.5%) | 0 (0.0%) |
| 1 or 2 Children | 11 (4.2%) | 0 (0.0%) |
| 3 or 4 Children | 0 (0.0%) | 0 (0.0%) |
| 5 or more Children | 0 (0.0%) | 0 (0.0%) |
| Total | 18 (2.5%) | 0 (0.0%) |
Race in Chandler
The most populous races in Chandler are White / Caucasian (2,952 | 89.2%), Hispanic or Latino (271 | 8.2%), and Black / African American (173 | 5.2%).
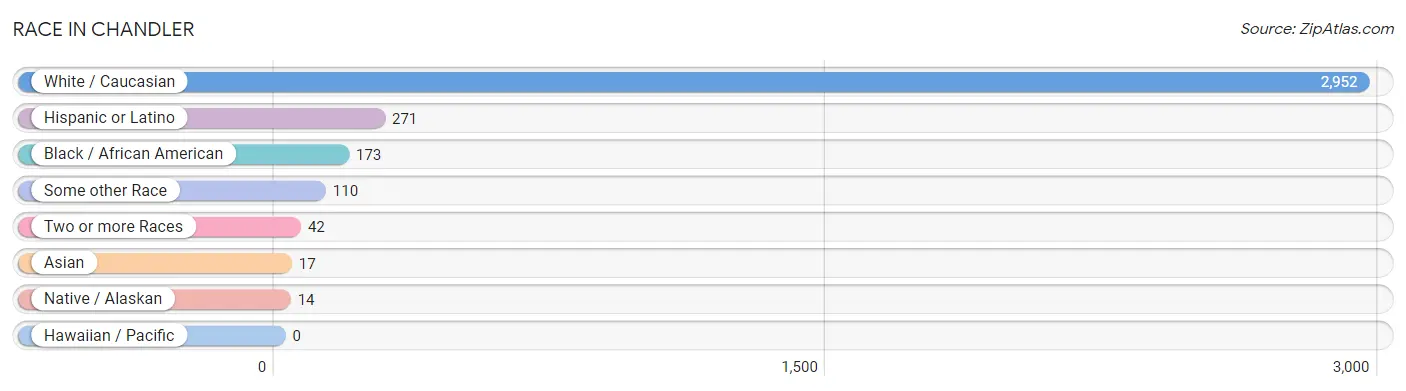
| Race | # Population | % Population |
| Asian | 17 | 0.5% |
| Black / African American | 173 | 5.2% |
| Hawaiian / Pacific | 0 | 0.0% |
| Hispanic or Latino | 271 | 8.2% |
| Native / Alaskan | 14 | 0.4% |
| White / Caucasian | 2,952 | 89.2% |
| Two or more Races | 42 | 1.3% |
| Some other Race | 110 | 3.3% |
| Total | 3,308 | 100.0% |
Ancestry in Chandler
The most populous ancestries reported in Chandler are German (459 | 13.9%), Irish (451 | 13.6%), American (402 | 12.1%), English (360 | 10.9%), and Mexican (215 | 6.5%), together accounting for 57.0% of all Chandler residents.
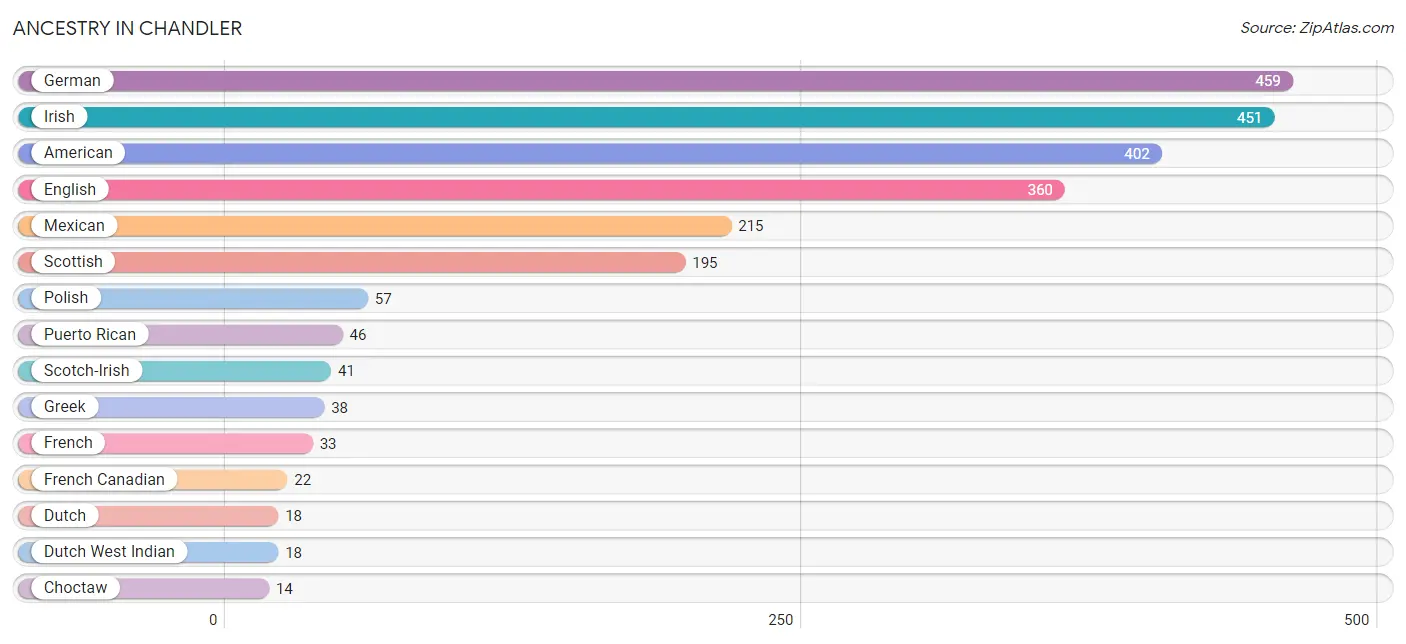
| Ancestry | # Population | % Population |
| American | 402 | 12.1% |
| British | 3 | 0.1% |
| Choctaw | 14 | 0.4% |
| Dutch | 18 | 0.5% |
| Dutch West Indian | 18 | 0.5% |
| English | 360 | 10.9% |
| European | 12 | 0.4% |
| French | 33 | 1.0% |
| French Canadian | 22 | 0.7% |
| German | 459 | 13.9% |
| Greek | 38 | 1.1% |
| Indian (Asian) | 6 | 0.2% |
| Irish | 451 | 13.6% |
| Mexican | 215 | 6.5% |
| Peruvian | 10 | 0.3% |
| Polish | 57 | 1.7% |
| Puerto Rican | 46 | 1.4% |
| Scotch-Irish | 41 | 1.2% |
| Scottish | 195 | 5.9% |
| South American | 10 | 0.3% |
| Sri Lankan | 11 | 0.3% |
| Welsh | 4 | 0.1% | View All 22 Rows |
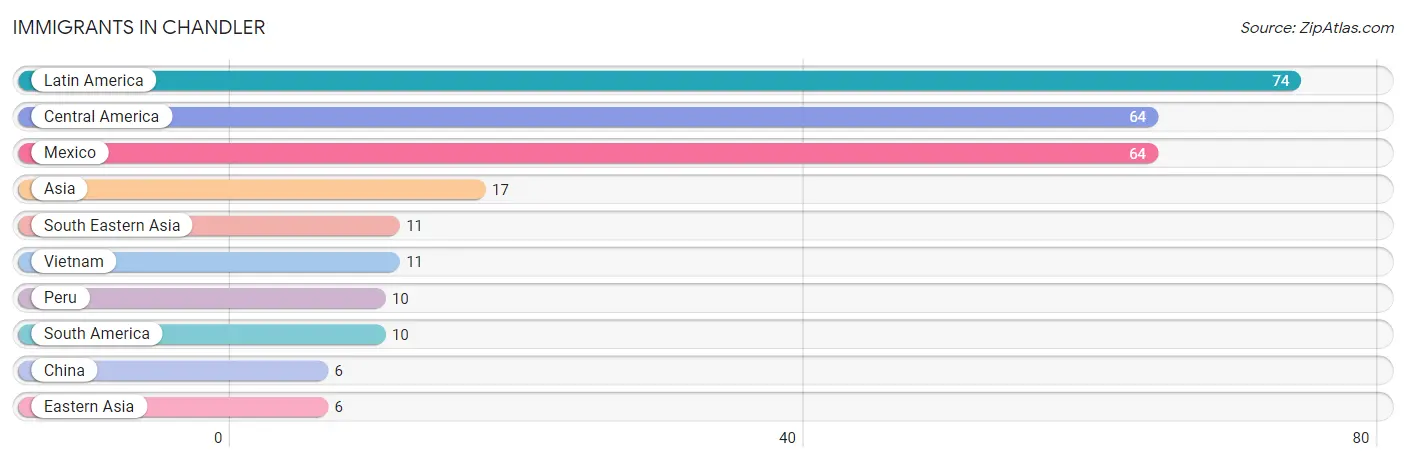
Immigrants in Chandler
The most numerous immigrant groups reported in Chandler came from Latin America (74 | 2.2%), Central America (64 | 1.9%), Mexico (64 | 1.9%), Asia (17 | 0.5%), and South Eastern Asia (11 | 0.3%), together accounting for 6.9% of all Chandler residents.
| Immigration Origin | # Population | % Population |
| Asia | 17 | 0.5% |
| Central America | 64 | 1.9% |
| China | 6 | 0.2% |
| Eastern Asia | 6 | 0.2% |
| Latin America | 74 | 2.2% |
| Mexico | 64 | 1.9% |
| Peru | 10 | 0.3% |
| South America | 10 | 0.3% |
| South Eastern Asia | 11 | 0.3% |
| Vietnam | 11 | 0.3% | View All 10 Rows |
Sex and Age in Chandler
Sex and Age in Chandler
The most populous age groups in Chandler are 10 to 14 Years (144 | 8.7%) for men and 85 Years and over (164 | 9.9%) for women.
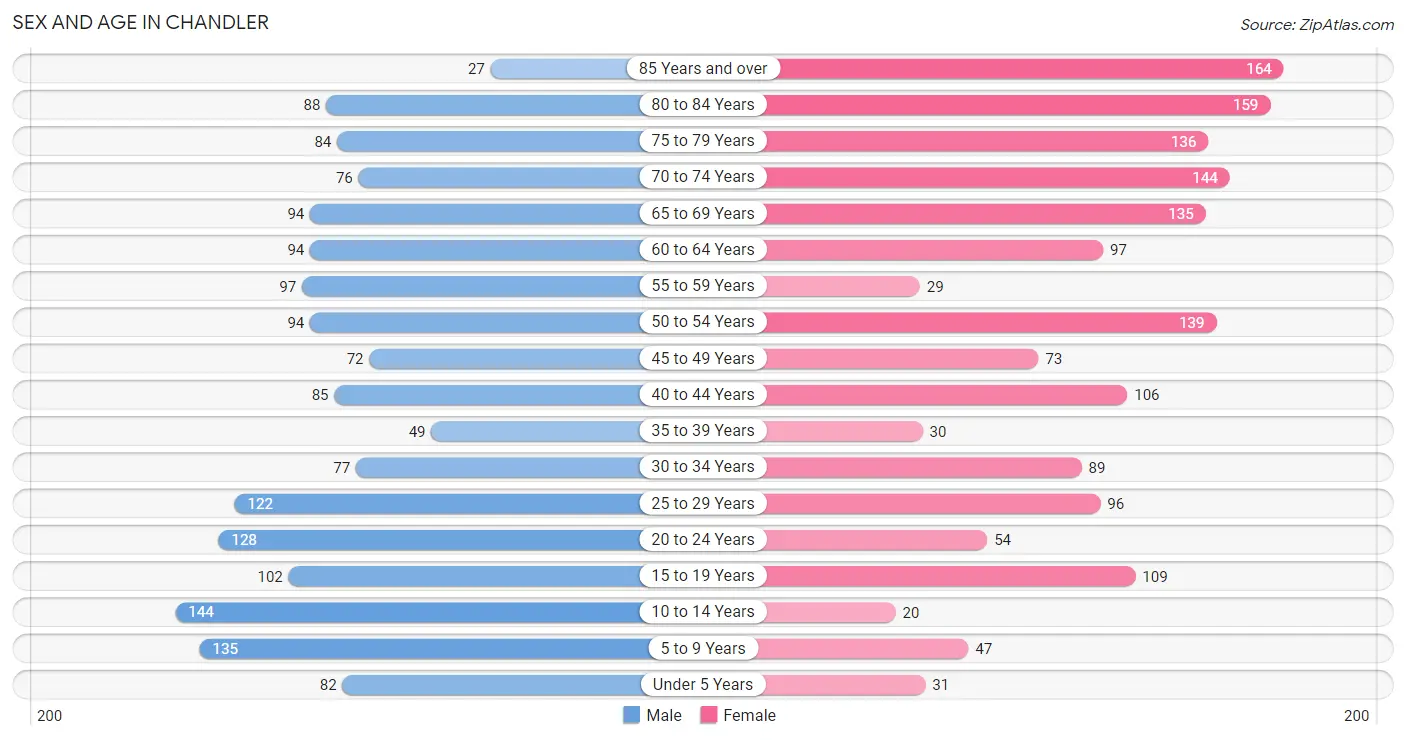
| Age Bracket | Male | Female |
| Under 5 Years | 82 (5.0%) | 31 (1.9%) |
| 5 to 9 Years | 135 (8.2%) | 47 (2.8%) |
| 10 to 14 Years | 144 (8.7%) | 20 (1.2%) |
| 15 to 19 Years | 102 (6.2%) | 109 (6.6%) |
| 20 to 24 Years | 128 (7.8%) | 54 (3.3%) |
| 25 to 29 Years | 122 (7.4%) | 96 (5.8%) |
| 30 to 34 Years | 77 (4.7%) | 89 (5.4%) |
| 35 to 39 Years | 49 (3.0%) | 30 (1.8%) |
| 40 to 44 Years | 85 (5.1%) | 106 (6.4%) |
| 45 to 49 Years | 72 (4.4%) | 73 (4.4%) |
| 50 to 54 Years | 94 (5.7%) | 139 (8.4%) |
| 55 to 59 Years | 97 (5.9%) | 29 (1.8%) |
| 60 to 64 Years | 94 (5.7%) | 97 (5.9%) |
| 65 to 69 Years | 94 (5.7%) | 135 (8.1%) |
| 70 to 74 Years | 76 (4.6%) | 144 (8.7%) |
| 75 to 79 Years | 84 (5.1%) | 136 (8.2%) |
| 80 to 84 Years | 88 (5.3%) | 159 (9.6%) |
| 85 Years and over | 27 (1.6%) | 164 (9.9%) |
| Total | 1,650 (100.0%) | 1,658 (100.0%) |
Families and Households in Chandler
Median Family Size in Chandler
The median family size in Chandler is 3.09 persons per family, with single male/father families (93 | 10.7%) accounting for the largest median family size of 3.46 persons per family. On the other hand, single female/mother families (54 | 6.2%) represent the smallest median family size with 2.30 persons per family.
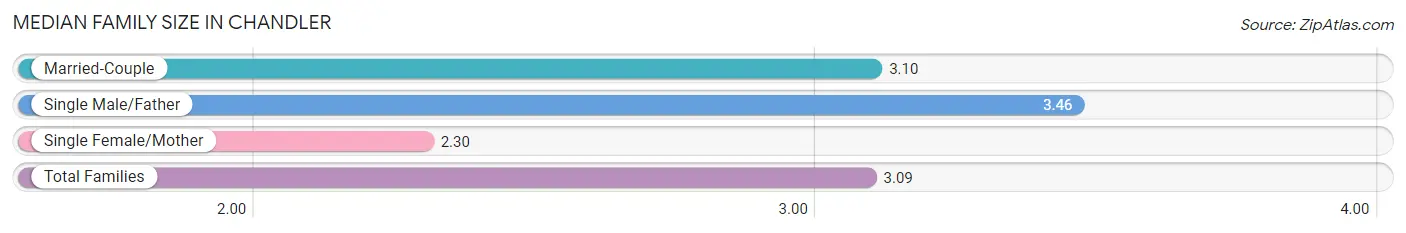
| Family Type | # Families | Family Size |
| Married-Couple | 721 (83.1%) | 3.10 |
| Single Male/Father | 93 (10.7%) | 3.46 |
| Single Female/Mother | 54 (6.2%) | 2.30 |
| Total Families | 868 (100.0%) | 3.09 |
Median Household Size in Chandler
The median household size in Chandler is 2.29 persons per household, with single male/father households (93 | 6.6%) accounting for the largest median household size of 3.46 persons per household. non-family households (540 | 38.4%) represent the smallest median household size with 1.01 persons per household.
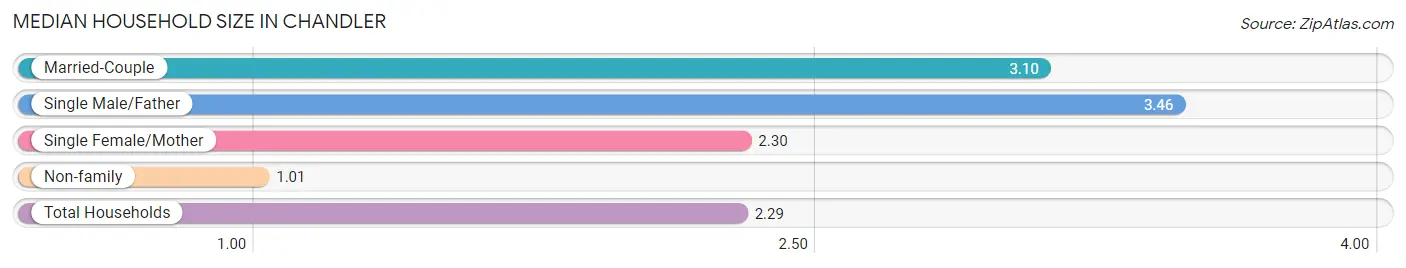
| Household Type | # Households | Household Size |
| Married-Couple | 721 (51.2%) | 3.10 |
| Single Male/Father | 93 (6.6%) | 3.46 |
| Single Female/Mother | 54 (3.8%) | 2.30 |
| Non-family | 540 (38.4%) | 1.01 |
| Total Households | 1,408 (100.0%) | 2.29 |
Household Size by Marriage Status in Chandler
Out of a total of 1,408 households in Chandler, 868 (61.7%) are family households, while 540 (38.4%) are nonfamily households. The most numerous type of family households are 2-person households, comprising 420, and the most common type of nonfamily households are 1-person households, comprising 536.
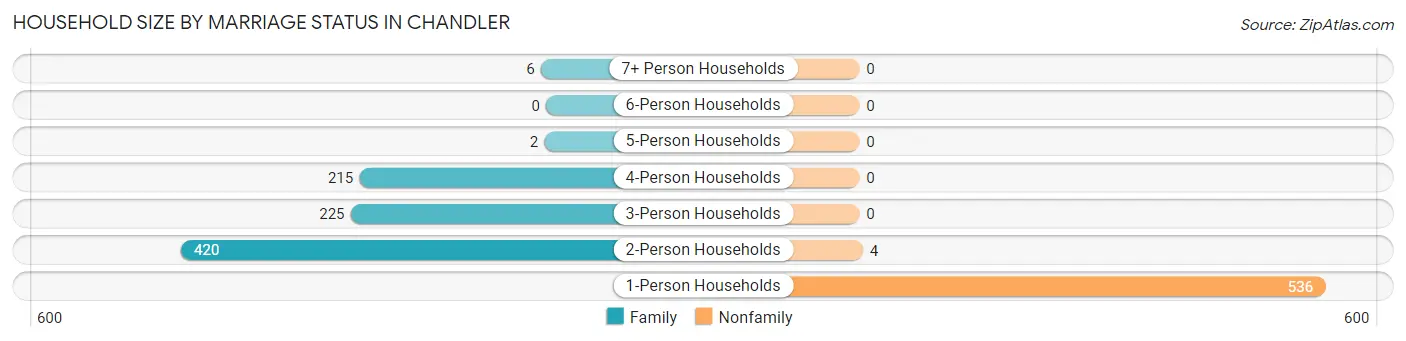
| Household Size | Family Households | Nonfamily Households |
| 1-Person Households | - | 536 (38.1%) |
| 2-Person Households | 420 (29.8%) | 4 (0.3%) |
| 3-Person Households | 225 (16.0%) | 0 (0.0%) |
| 4-Person Households | 215 (15.3%) | 0 (0.0%) |
| 5-Person Households | 2 (0.1%) | 0 (0.0%) |
| 6-Person Households | 0 (0.0%) | 0 (0.0%) |
| 7+ Person Households | 6 (0.4%) | 0 (0.0%) |
| Total | 868 (61.7%) | 540 (38.4%) |
Female Fertility in Chandler
Fertility by Age in Chandler
Average fertility rate in Chandler is 47.0 births per 1,000 women. Women in the age bracket of 20 to 34 years have the highest fertility rate with 92.0 births per 1,000 women. Women in the age bracket of 20 to 34 years acount for 75.9% of all women with births.
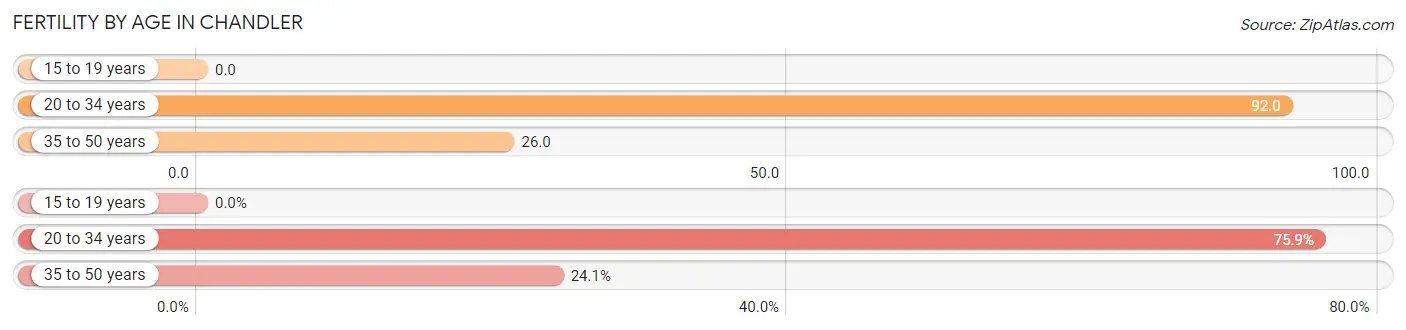
| Age Bracket | Women with Births | Births / 1,000 Women |
| 15 to 19 years | 0 (0.0%) | 0.0 |
| 20 to 34 years | 22 (75.9%) | 92.0 |
| 35 to 50 years | 7 (24.1%) | 26.0 |
| Total | 29 (100.0%) | 47.0 |
Fertility by Age by Marriage Status in Chandler
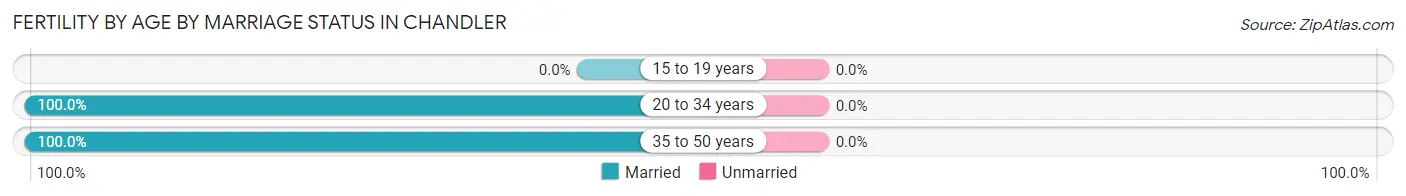
| Age Bracket | Married | Unmarried |
| 15 to 19 years | 0 (0.0%) | 0 (0.0%) |
| 20 to 34 years | 22 (100.0%) | 0 (0.0%) |
| 35 to 50 years | 7 (100.0%) | 0 (0.0%) |
| Total | 29 (100.0%) | 0 (0.0%) |
Fertility by Education in Chandler
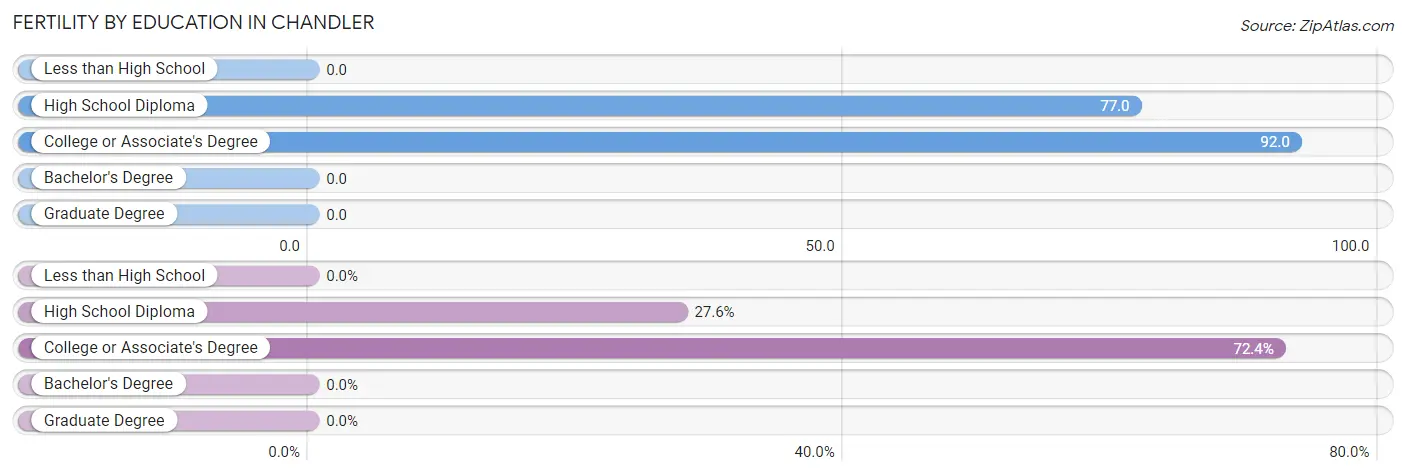
| Educational Attainment | Women with Births | Births / 1,000 Women |
| Less than High School | 0 (0.0%) | 0.0 |
| High School Diploma | 8 (27.6%) | 77.0 |
| College or Associate's Degree | 21 (72.4%) | 92.0 |
| Bachelor's Degree | 0 (0.0%) | 0.0 |
| Graduate Degree | 0 (0.0%) | 0.0 |
| Total | 29 (100.0%) | 47.0 |
Fertility by Education by Marriage Status in Chandler
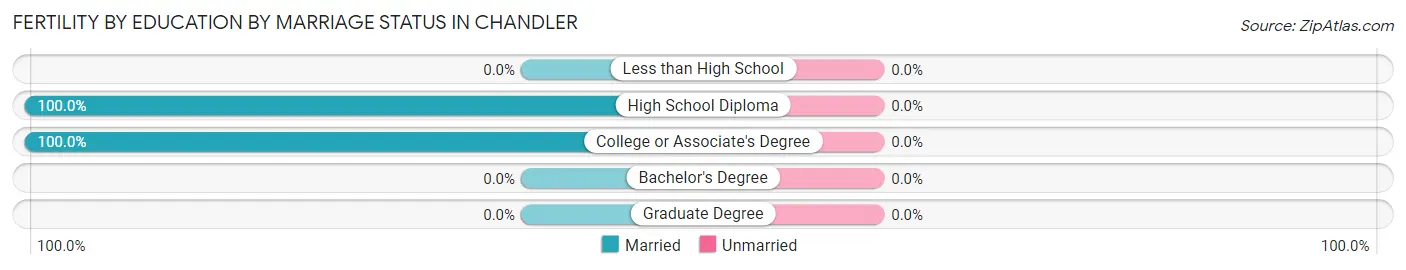
| Educational Attainment | Married | Unmarried |
| Less than High School | 0 (0.0%) | 0 (0.0%) |
| High School Diploma | 8 (100.0%) | 0 (0.0%) |
| College or Associate's Degree | 21 (100.0%) | 0 (0.0%) |
| Bachelor's Degree | 0 (0.0%) | 0 (0.0%) |
| Graduate Degree | 0 (0.0%) | 0 (0.0%) |
| Total | 29 (100.0%) | 0 (0.0%) |
Employment Characteristics in Chandler
Employment by Class of Employer in Chandler
Among the 1,457 employed individuals in Chandler, private company employees (771 | 52.9%), local government employees (208 | 14.3%), and not-for-profit organizations (154 | 10.6%) make up the most common classes of employment.
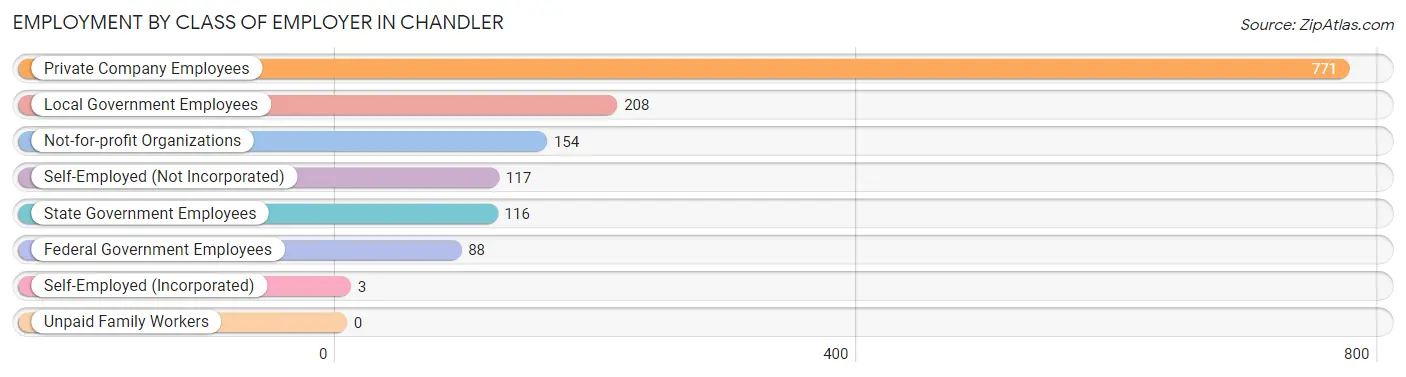
| Employer Class | # Employees | % Employees |
| Private Company Employees | 771 | 52.9% |
| Self-Employed (Incorporated) | 3 | 0.2% |
| Self-Employed (Not Incorporated) | 117 | 8.0% |
| Not-for-profit Organizations | 154 | 10.6% |
| Local Government Employees | 208 | 14.3% |
| State Government Employees | 116 | 8.0% |
| Federal Government Employees | 88 | 6.0% |
| Unpaid Family Workers | 0 | 0.0% |
| Total | 1,457 | 100.0% |
Employment Status by Age in Chandler
According to the labor force statistics for Chandler, out of the total population over 16 years of age (2,820), 56.6% or 1,596 individuals are in the labor force, with 5.1% or 81 of them unemployed. The age group with the highest labor force participation rate is 25 to 29 years, with 100.0% or 218 individuals in the labor force. Within the labor force, the 16 to 19 years age range has the highest percentage of unemployed individuals, with 41.0% or 25 of them being unemployed.
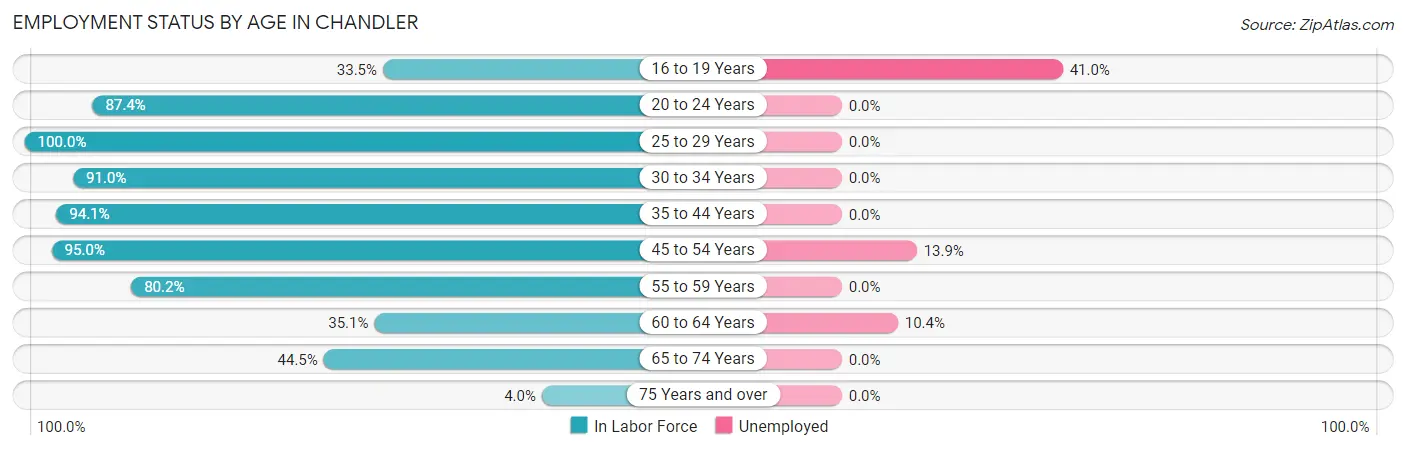
| Age Bracket | In Labor Force | Unemployed |
| 16 to 19 Years | 61 (33.5%) | 25 (41.0%) |
| 20 to 24 Years | 159 (87.4%) | 0 (0.0%) |
| 25 to 29 Years | 218 (100.0%) | 0 (0.0%) |
| 30 to 34 Years | 151 (91.0%) | 0 (0.0%) |
| 35 to 44 Years | 254 (94.1%) | 0 (0.0%) |
| 45 to 54 Years | 359 (95.0%) | 50 (13.9%) |
| 55 to 59 Years | 101 (80.2%) | 0 (0.0%) |
| 60 to 64 Years | 67 (35.1%) | 7 (10.4%) |
| 65 to 74 Years | 200 (44.5%) | 0 (0.0%) |
| 75 Years and over | 26 (4.0%) | 0 (0.0%) |
| Total | 1,596 (56.6%) | 81 (5.1%) |
Employment Status by Educational Attainment in Chandler
According to labor force statistics for Chandler, 85.2% of individuals (1,149) out of the total population between 25 and 64 years of age (1,349) are in the labor force, with 5.0% or 57 of them being unemployed. The group with the highest labor force participation rate are those with the educational attainment of bachelor's degree or higher, with 90.3% or 251 individuals in the labor force. Within the labor force, individuals with college / associate degree education have the highest percentage of unemployment, with 8.8% or 57 of them being unemployed.
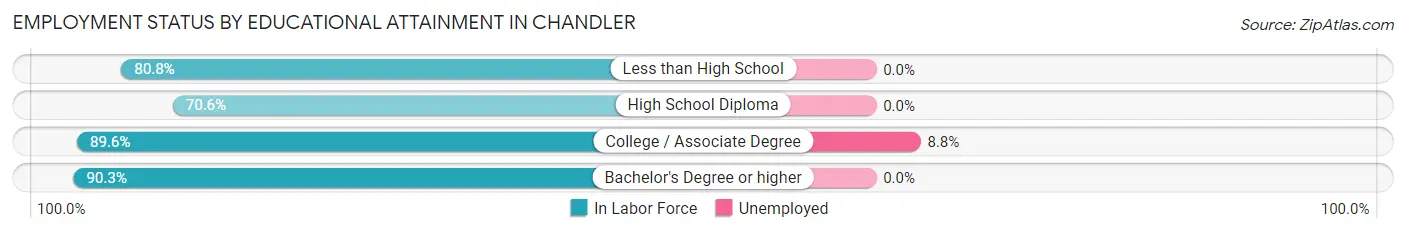
| Educational Attainment | In Labor Force | Unemployed |
| Less than High School | 42 (80.8%) | 0 (0.0%) |
| High School Diploma | 209 (70.6%) | 0 (0.0%) |
| College / Associate Degree | 648 (89.6%) | 64 (8.8%) |
| Bachelor's Degree or higher | 251 (90.3%) | 0 (0.0%) |
| Total | 1,149 (85.2%) | 67 (5.0%) |
Employment Occupations by Sex in Chandler
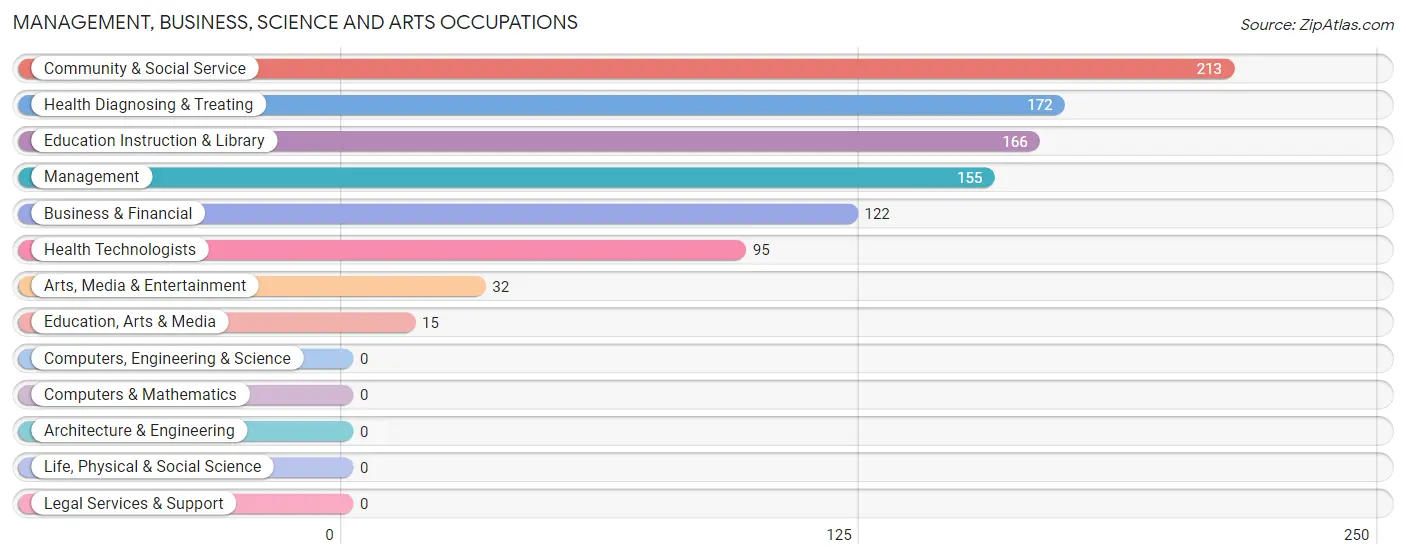
Management, Business, Science and Arts Occupations
The most common Management, Business, Science and Arts occupations in Chandler are Community & Social Service (213 | 14.1%), Health Diagnosing & Treating (172 | 11.4%), Education Instruction & Library (166 | 11.0%), Management (155 | 10.2%), and Business & Financial (122 | 8.1%).
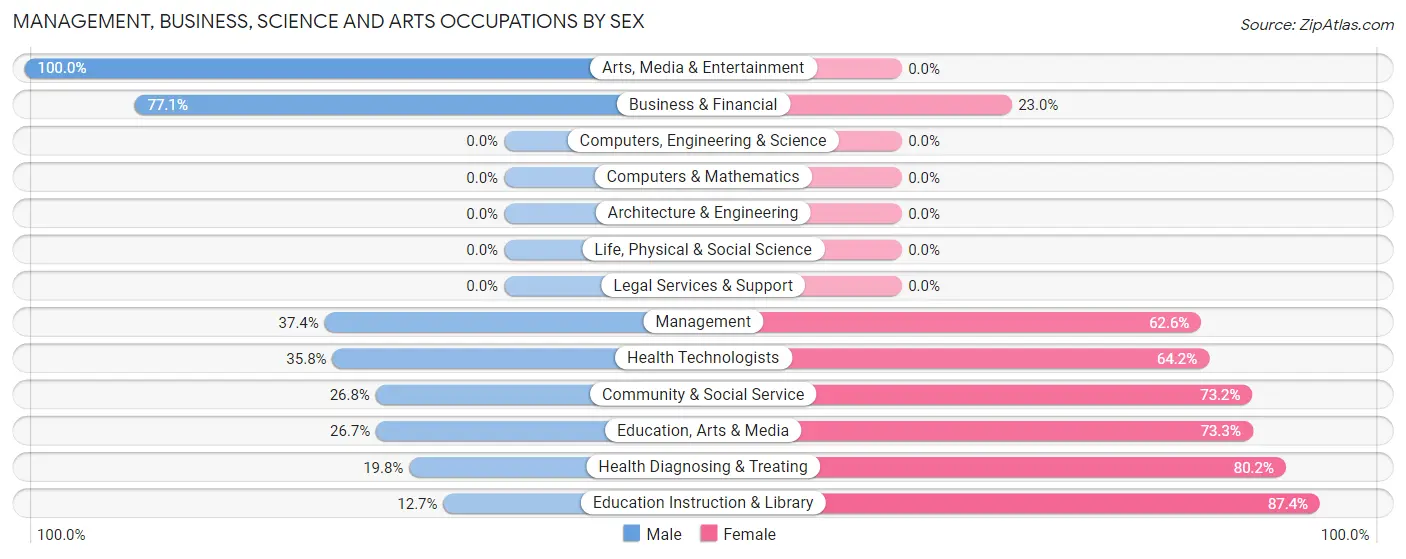
Management, Business, Science and Arts Occupations by Sex
Within the Management, Business, Science and Arts occupations in Chandler, the most male-oriented occupations are Arts, Media & Entertainment (100.0%), Business & Financial (77.0%), and Management (37.4%), while the most female-oriented occupations are Education Instruction & Library (87.4%), Health Diagnosing & Treating (80.2%), and Education, Arts & Media (73.3%).
| Occupation | Male | Female |
| Management | 58 (37.4%) | 97 (62.6%) |
| Business & Financial | 94 (77.0%) | 28 (23.0%) |
| Computers, Engineering & Science | 0 (0.0%) | 0 (0.0%) |
| Computers & Mathematics | 0 (0.0%) | 0 (0.0%) |
| Architecture & Engineering | 0 (0.0%) | 0 (0.0%) |
| Life, Physical & Social Science | 0 (0.0%) | 0 (0.0%) |
| Community & Social Service | 57 (26.8%) | 156 (73.2%) |
| Education, Arts & Media | 4 (26.7%) | 11 (73.3%) |
| Legal Services & Support | 0 (0.0%) | 0 (0.0%) |
| Education Instruction & Library | 21 (12.7%) | 145 (87.4%) |
| Arts, Media & Entertainment | 32 (100.0%) | 0 (0.0%) |
| Health Diagnosing & Treating | 34 (19.8%) | 138 (80.2%) |
| Health Technologists | 34 (35.8%) | 61 (64.2%) |
| Total (Category) | 243 (36.7%) | 419 (63.3%) |
| Total (Overall) | 858 (56.7%) | 656 (43.3%) |
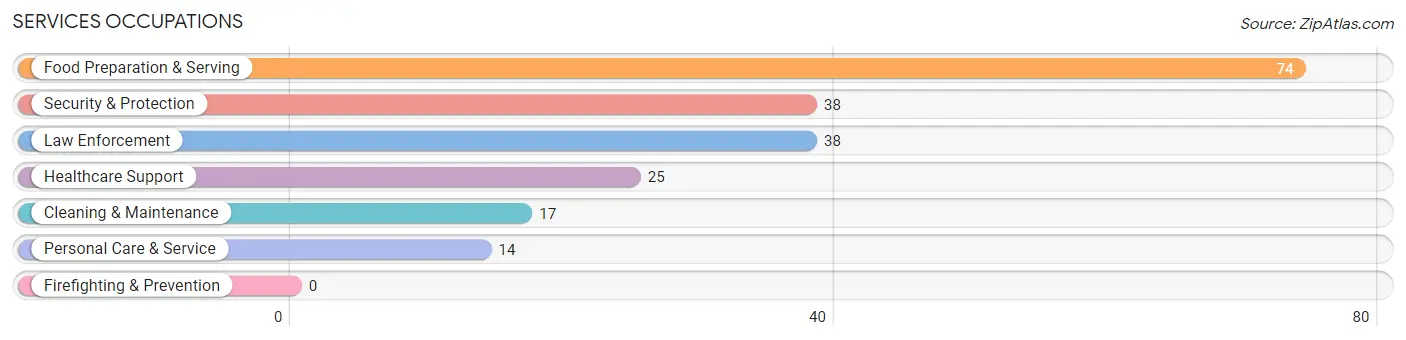
Services Occupations
The most common Services occupations in Chandler are Food Preparation & Serving (74 | 4.9%), Security & Protection (38 | 2.5%), Law Enforcement (38 | 2.5%), Healthcare Support (25 | 1.7%), and Cleaning & Maintenance (17 | 1.1%).
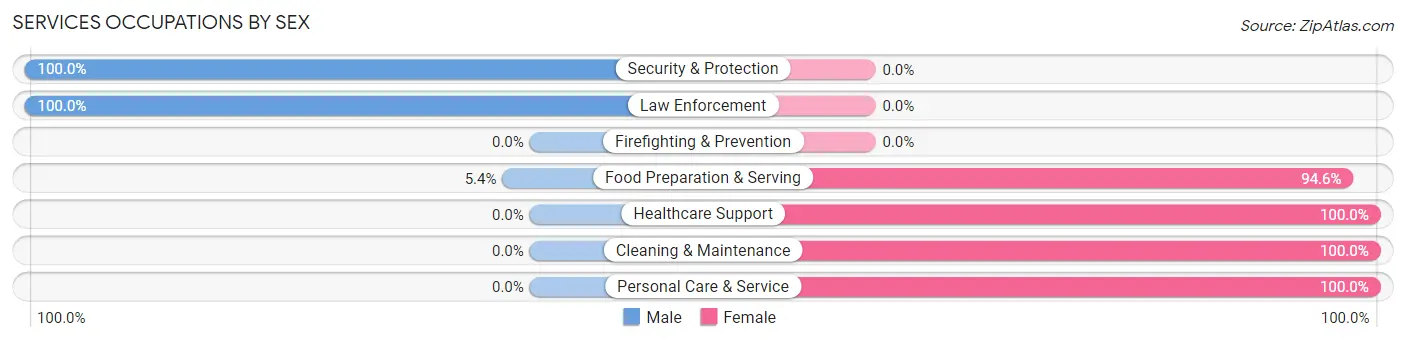
Services Occupations by Sex
Within the Services occupations in Chandler, the most male-oriented occupations are Security & Protection (100.0%), Law Enforcement (100.0%), and Food Preparation & Serving (5.4%), while the most female-oriented occupations are Healthcare Support (100.0%), Cleaning & Maintenance (100.0%), and Personal Care & Service (100.0%).
| Occupation | Male | Female |
| Healthcare Support | 0 (0.0%) | 25 (100.0%) |
| Security & Protection | 38 (100.0%) | 0 (0.0%) |
| Firefighting & Prevention | 0 (0.0%) | 0 (0.0%) |
| Law Enforcement | 38 (100.0%) | 0 (0.0%) |
| Food Preparation & Serving | 4 (5.4%) | 70 (94.6%) |
| Cleaning & Maintenance | 0 (0.0%) | 17 (100.0%) |
| Personal Care & Service | 0 (0.0%) | 14 (100.0%) |
| Total (Category) | 42 (25.0%) | 126 (75.0%) |
| Total (Overall) | 858 (56.7%) | 656 (43.3%) |
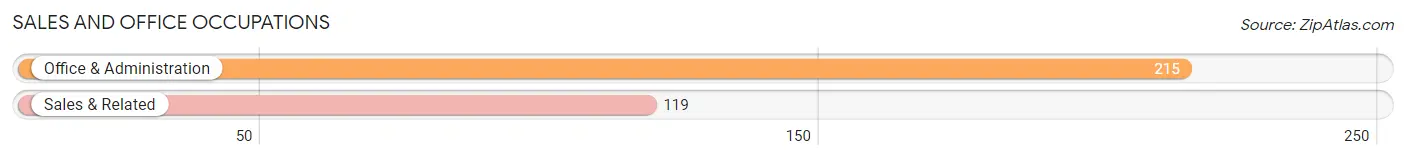
Sales and Office Occupations
The most common Sales and Office occupations in Chandler are Office & Administration (215 | 14.2%), and Sales & Related (119 | 7.9%).
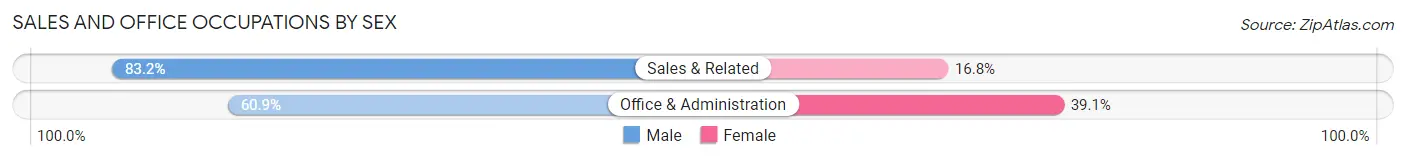
Sales and Office Occupations by Sex
| Occupation | Male | Female |
| Sales & Related | 99 (83.2%) | 20 (16.8%) |
| Office & Administration | 131 (60.9%) | 84 (39.1%) |
| Total (Category) | 230 (68.9%) | 104 (31.1%) |
| Total (Overall) | 858 (56.7%) | 656 (43.3%) |
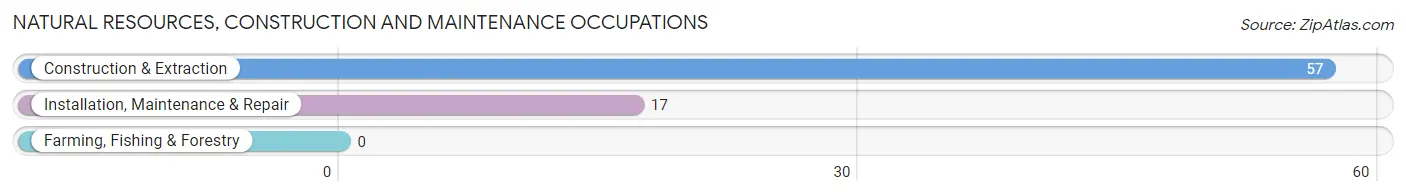
Natural Resources, Construction and Maintenance Occupations
The most common Natural Resources, Construction and Maintenance occupations in Chandler are Construction & Extraction (57 | 3.8%), and Installation, Maintenance & Repair (17 | 1.1%).
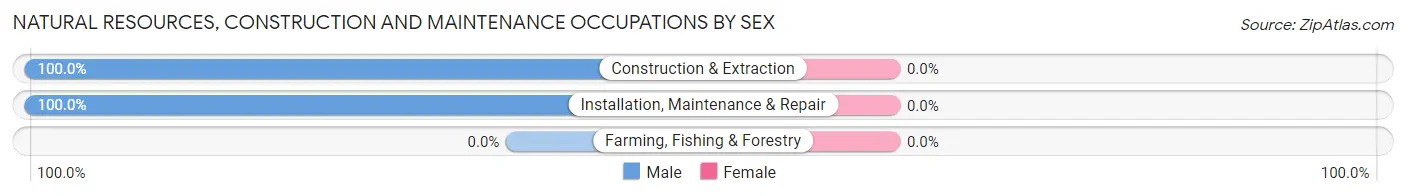
Natural Resources, Construction and Maintenance Occupations by Sex
| Occupation | Male | Female |
| Farming, Fishing & Forestry | 0 (0.0%) | 0 (0.0%) |
| Construction & Extraction | 57 (100.0%) | 0 (0.0%) |
| Installation, Maintenance & Repair | 17 (100.0%) | 0 (0.0%) |
| Total (Category) | 74 (100.0%) | 0 (0.0%) |
| Total (Overall) | 858 (56.7%) | 656 (43.3%) |
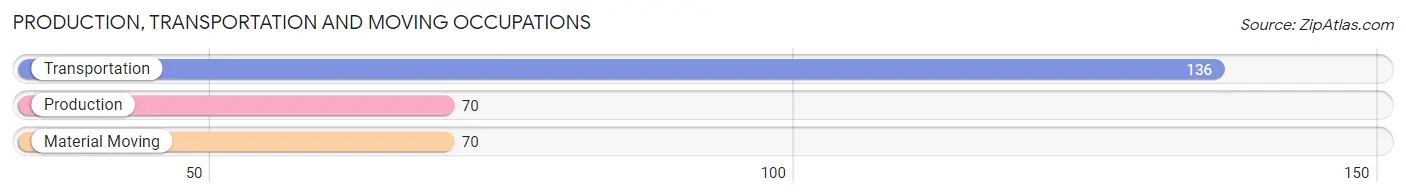
Production, Transportation and Moving Occupations
The most common Production, Transportation and Moving occupations in Chandler are Transportation (136 | 9.0%), Production (70 | 4.6%), and Material Moving (70 | 4.6%).
Production, Transportation and Moving Occupations by Sex
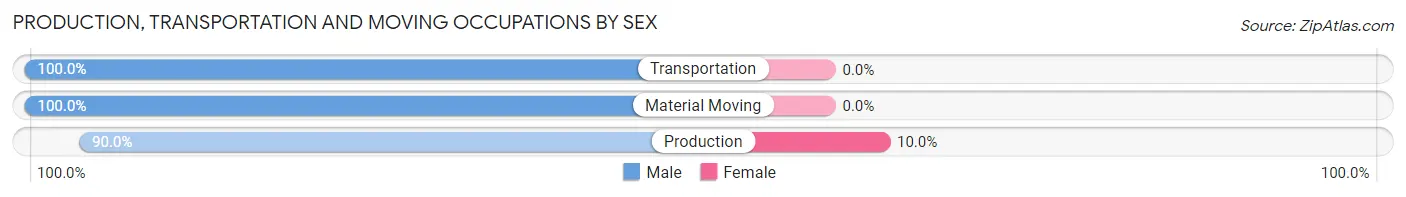
| Occupation | Male | Female |
| Production | 63 (90.0%) | 7 (10.0%) |
| Transportation | 136 (100.0%) | 0 (0.0%) |
| Material Moving | 70 (100.0%) | 0 (0.0%) |
| Total (Category) | 269 (97.5%) | 7 (2.5%) |
| Total (Overall) | 858 (56.7%) | 656 (43.3%) |
Employment Industries by Sex in Chandler
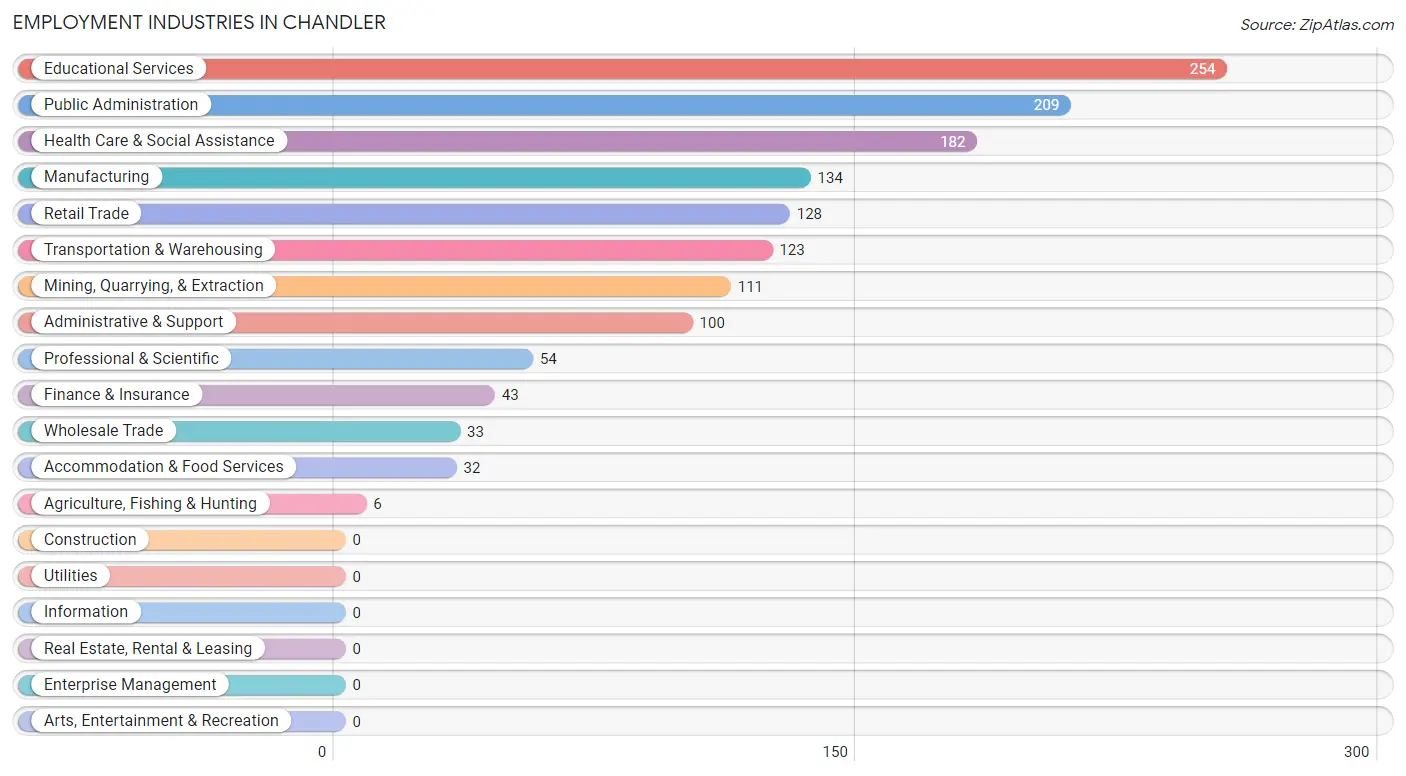
Employment Industries in Chandler
The major employment industries in Chandler include Educational Services (254 | 16.8%), Public Administration (209 | 13.8%), Health Care & Social Assistance (182 | 12.0%), Manufacturing (134 | 8.8%), and Retail Trade (128 | 8.5%).
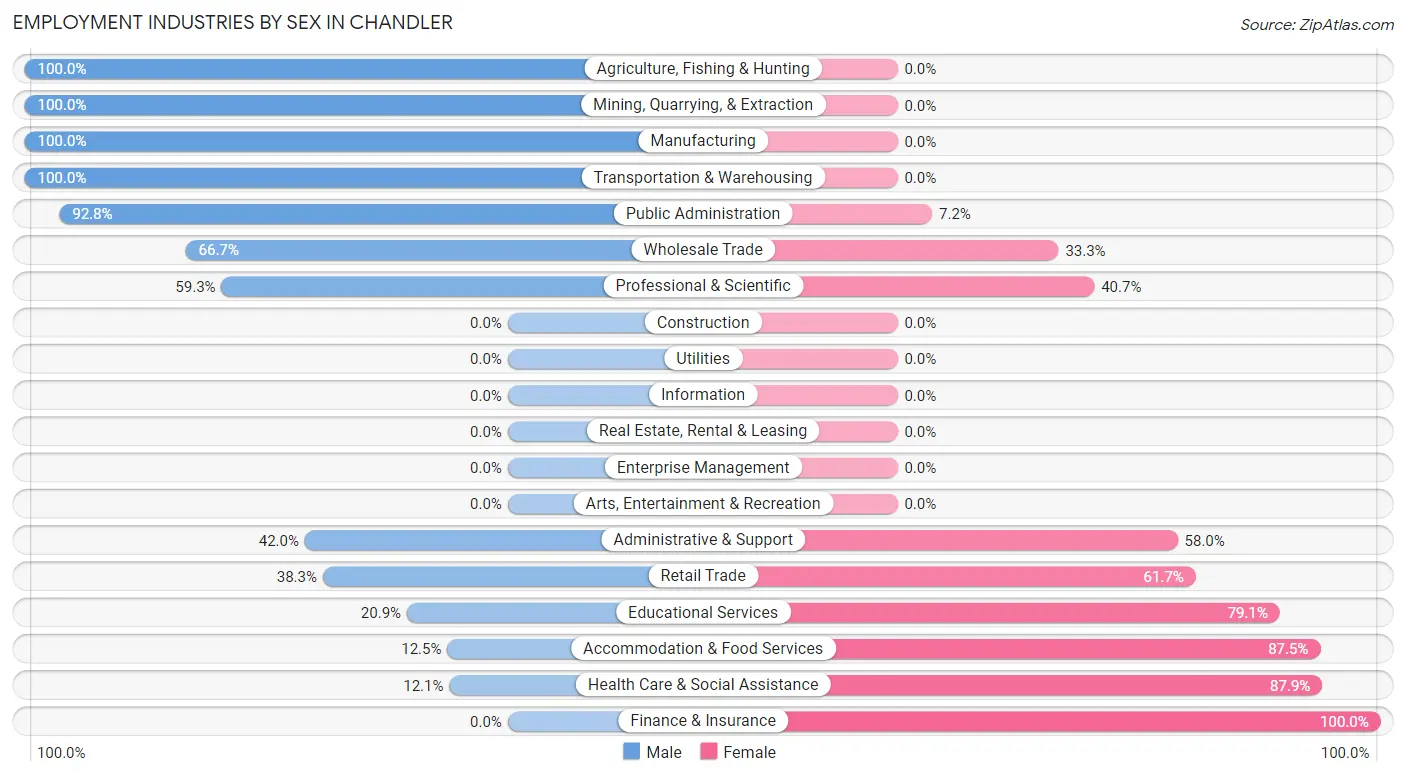
Employment Industries by Sex in Chandler
The Chandler industries that see more men than women are Agriculture, Fishing & Hunting (100.0%), Mining, Quarrying, & Extraction (100.0%), and Manufacturing (100.0%), whereas the industries that tend to have a higher number of women are Finance & Insurance (100.0%), Health Care & Social Assistance (87.9%), and Accommodation & Food Services (87.5%).
| Industry | Male | Female |
| Agriculture, Fishing & Hunting | 6 (100.0%) | 0 (0.0%) |
| Mining, Quarrying, & Extraction | 111 (100.0%) | 0 (0.0%) |
| Construction | 0 (0.0%) | 0 (0.0%) |
| Manufacturing | 134 (100.0%) | 0 (0.0%) |
| Wholesale Trade | 22 (66.7%) | 11 (33.3%) |
| Retail Trade | 49 (38.3%) | 79 (61.7%) |
| Transportation & Warehousing | 123 (100.0%) | 0 (0.0%) |
| Utilities | 0 (0.0%) | 0 (0.0%) |
| Information | 0 (0.0%) | 0 (0.0%) |
| Finance & Insurance | 0 (0.0%) | 43 (100.0%) |
| Real Estate, Rental & Leasing | 0 (0.0%) | 0 (0.0%) |
| Professional & Scientific | 32 (59.3%) | 22 (40.7%) |
| Enterprise Management | 0 (0.0%) | 0 (0.0%) |
| Administrative & Support | 42 (42.0%) | 58 (58.0%) |
| Educational Services | 53 (20.9%) | 201 (79.1%) |
| Health Care & Social Assistance | 22 (12.1%) | 160 (87.9%) |
| Arts, Entertainment & Recreation | 0 (0.0%) | 0 (0.0%) |
| Accommodation & Food Services | 4 (12.5%) | 28 (87.5%) |
| Public Administration | 194 (92.8%) | 15 (7.2%) |
| Total | 858 (56.7%) | 656 (43.3%) |
Education in Chandler
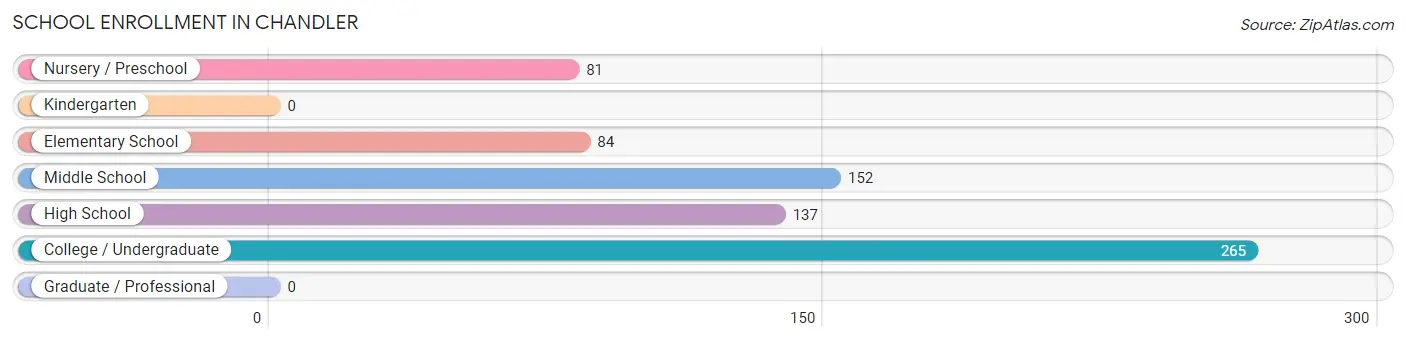
School Enrollment in Chandler
The most common levels of schooling among the 719 students in Chandler are college / undergraduate (265 | 36.9%), middle school (152 | 21.1%), and high school (137 | 19.1%).
| School Level | # Students | % Students |
| Nursery / Preschool | 81 | 11.3% |
| Kindergarten | 0 | 0.0% |
| Elementary School | 84 | 11.7% |
| Middle School | 152 | 21.1% |
| High School | 137 | 19.1% |
| College / Undergraduate | 265 | 36.9% |
| Graduate / Professional | 0 | 0.0% |
| Total | 719 | 100.0% |
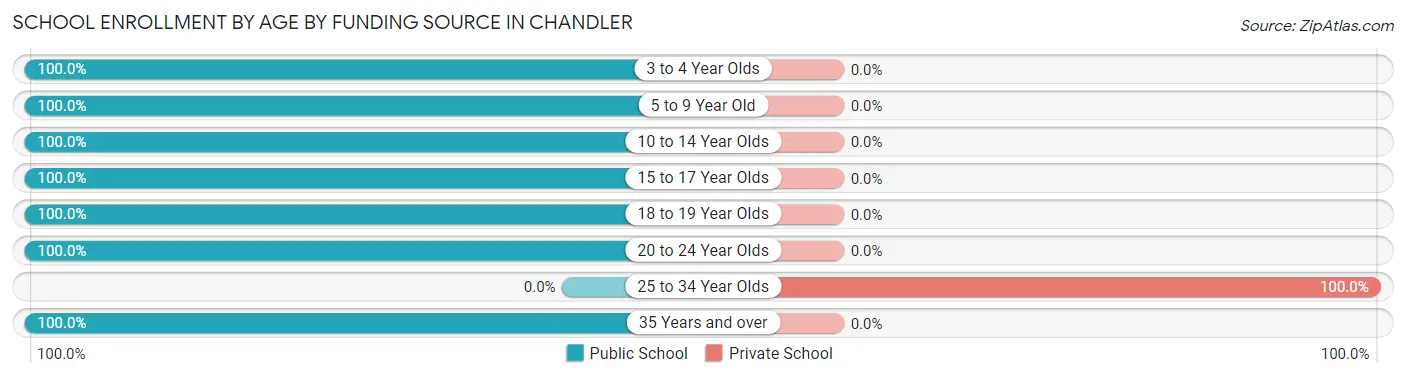
School Enrollment by Age by Funding Source in Chandler
Out of a total of 719 students who are enrolled in schools in Chandler, 26 (3.6%) attend a private institution, while the remaining 693 (96.4%) are enrolled in public schools. The age group of 25 to 34 year olds has the highest likelihood of being enrolled in private schools, with 26 (100.0% in the age bracket) enrolled. Conversely, the age group of 3 to 4 year olds has the lowest likelihood of being enrolled in a private school, with 15 (100.0% in the age bracket) attending a public institution.
| Age Bracket | Public School | Private School |
| 3 to 4 Year Olds | 15 (100.0%) | 0 (0.0%) |
| 5 to 9 Year Old | 138 (100.0%) | 0 (0.0%) |
| 10 to 14 Year Olds | 164 (100.0%) | 0 (0.0%) |
| 15 to 17 Year Olds | 97 (100.0%) | 0 (0.0%) |
| 18 to 19 Year Olds | 101 (100.0%) | 0 (0.0%) |
| 20 to 24 Year Olds | 78 (100.0%) | 0 (0.0%) |
| 25 to 34 Year Olds | 0 (0.0%) | 26 (100.0%) |
| 35 Years and over | 100 (100.0%) | 0 (0.0%) |
| Total | 693 (96.4%) | 26 (3.6%) |
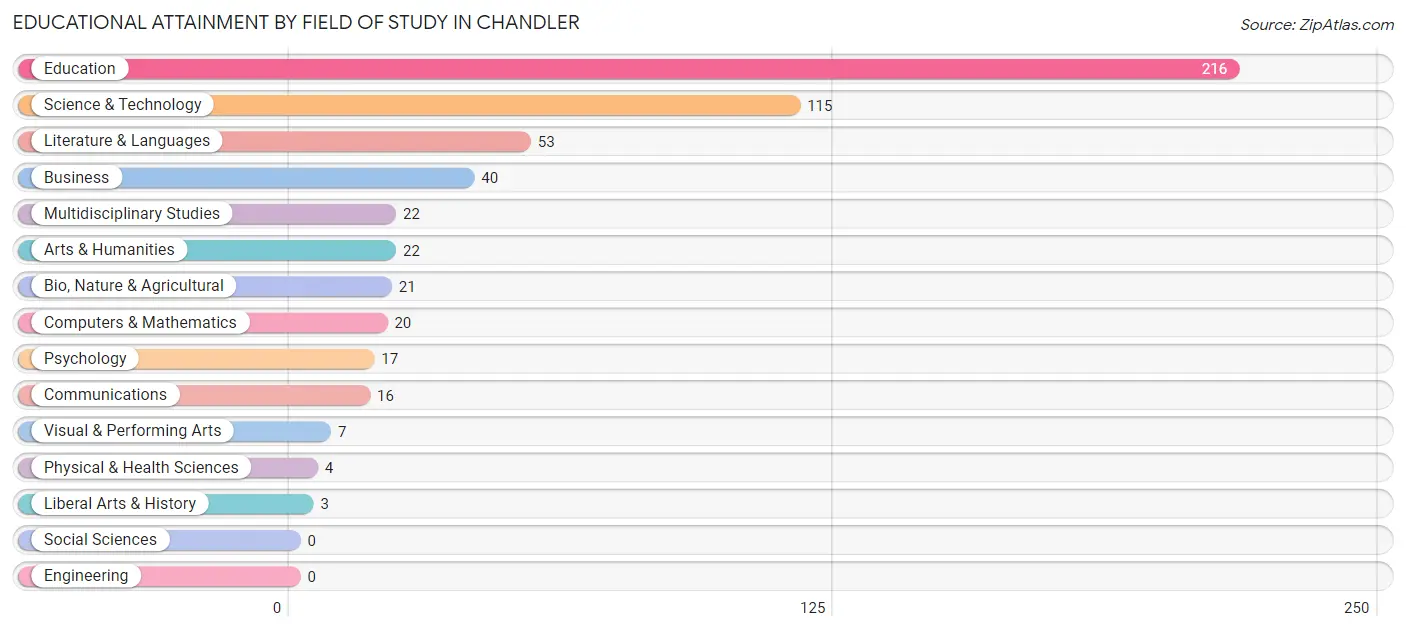
Educational Attainment by Field of Study in Chandler
Education (216 | 38.9%), science & technology (115 | 20.7%), literature & languages (53 | 9.5%), business (40 | 7.2%), and multidisciplinary studies (22 | 4.0%) are the most common fields of study among 556 individuals in Chandler who have obtained a bachelor's degree or higher.
| Field of Study | # Graduates | % Graduates |
| Computers & Mathematics | 20 | 3.6% |
| Bio, Nature & Agricultural | 21 | 3.8% |
| Physical & Health Sciences | 4 | 0.7% |
| Psychology | 17 | 3.1% |
| Social Sciences | 0 | 0.0% |
| Engineering | 0 | 0.0% |
| Multidisciplinary Studies | 22 | 4.0% |
| Science & Technology | 115 | 20.7% |
| Business | 40 | 7.2% |
| Education | 216 | 38.9% |
| Literature & Languages | 53 | 9.5% |
| Liberal Arts & History | 3 | 0.5% |
| Visual & Performing Arts | 7 | 1.3% |
| Communications | 16 | 2.9% |
| Arts & Humanities | 22 | 4.0% |
| Total | 556 | 100.0% |
Transportation & Commute in Chandler
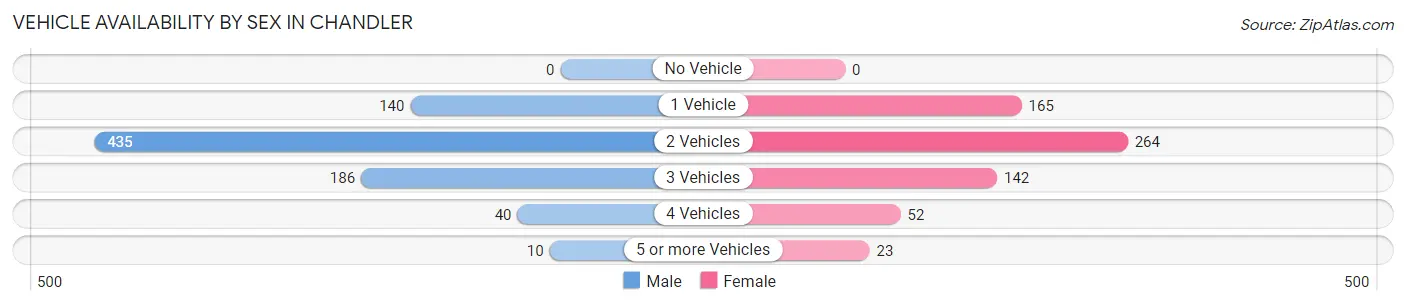
Vehicle Availability by Sex in Chandler
The most prevalent vehicle ownership categories in Chandler are males with 2 vehicles (435, accounting for 53.6%) and females with 2 vehicles (264, making up 67.3%).
| Vehicles Available | Male | Female |
| No Vehicle | 0 (0.0%) | 0 (0.0%) |
| 1 Vehicle | 140 (17.3%) | 165 (25.5%) |
| 2 Vehicles | 435 (53.6%) | 264 (40.9%) |
| 3 Vehicles | 186 (22.9%) | 142 (22.0%) |
| 4 Vehicles | 40 (4.9%) | 52 (8.1%) |
| 5 or more Vehicles | 10 (1.2%) | 23 (3.6%) |
| Total | 811 (100.0%) | 646 (100.0%) |
Commute Time in Chandler
The most frequently occuring commute durations in Chandler are 20 to 24 minutes (392 commuters, 28.6%), 30 to 34 minutes (284 commuters, 20.8%), and 10 to 14 minutes (192 commuters, 14.0%).
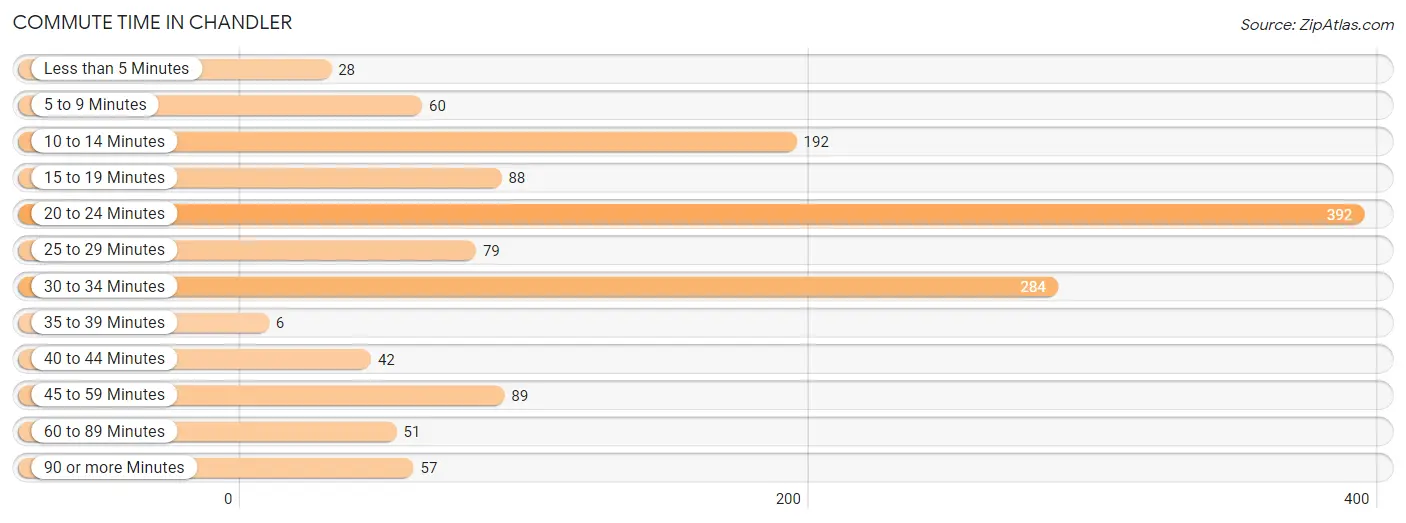
| Commute Time | # Commuters | % Commuters |
| Less than 5 Minutes | 28 | 2.1% |
| 5 to 9 Minutes | 60 | 4.4% |
| 10 to 14 Minutes | 192 | 14.0% |
| 15 to 19 Minutes | 88 | 6.4% |
| 20 to 24 Minutes | 392 | 28.6% |
| 25 to 29 Minutes | 79 | 5.8% |
| 30 to 34 Minutes | 284 | 20.8% |
| 35 to 39 Minutes | 6 | 0.4% |
| 40 to 44 Minutes | 42 | 3.1% |
| 45 to 59 Minutes | 89 | 6.5% |
| 60 to 89 Minutes | 51 | 3.7% |
| 90 or more Minutes | 57 | 4.2% |
Commute Time by Sex in Chandler
The most common commute times in Chandler are 20 to 24 minutes (251 commuters, 33.9%) for males and 30 to 34 minutes (195 commuters, 31.0%) for females.
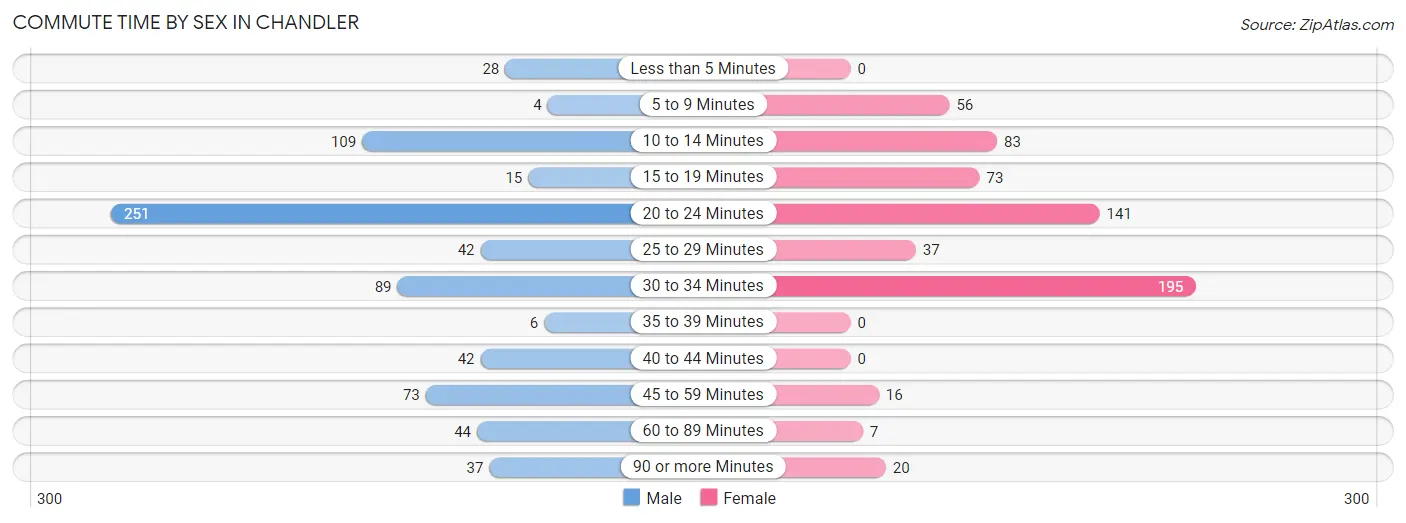
| Commute Time | Male | Female |
| Less than 5 Minutes | 28 (3.8%) | 0 (0.0%) |
| 5 to 9 Minutes | 4 (0.5%) | 56 (8.9%) |
| 10 to 14 Minutes | 109 (14.7%) | 83 (13.2%) |
| 15 to 19 Minutes | 15 (2.0%) | 73 (11.6%) |
| 20 to 24 Minutes | 251 (33.9%) | 141 (22.5%) |
| 25 to 29 Minutes | 42 (5.7%) | 37 (5.9%) |
| 30 to 34 Minutes | 89 (12.0%) | 195 (31.0%) |
| 35 to 39 Minutes | 6 (0.8%) | 0 (0.0%) |
| 40 to 44 Minutes | 42 (5.7%) | 0 (0.0%) |
| 45 to 59 Minutes | 73 (9.9%) | 16 (2.5%) |
| 60 to 89 Minutes | 44 (5.9%) | 7 (1.1%) |
| 90 or more Minutes | 37 (5.0%) | 20 (3.2%) |
Time of Departure to Work by Sex in Chandler
The most frequent times of departure to work in Chandler are 7:00 AM to 7:29 AM (148, 20.0%) for males and 8:00 AM to 8:29 AM (155, 24.7%) for females.
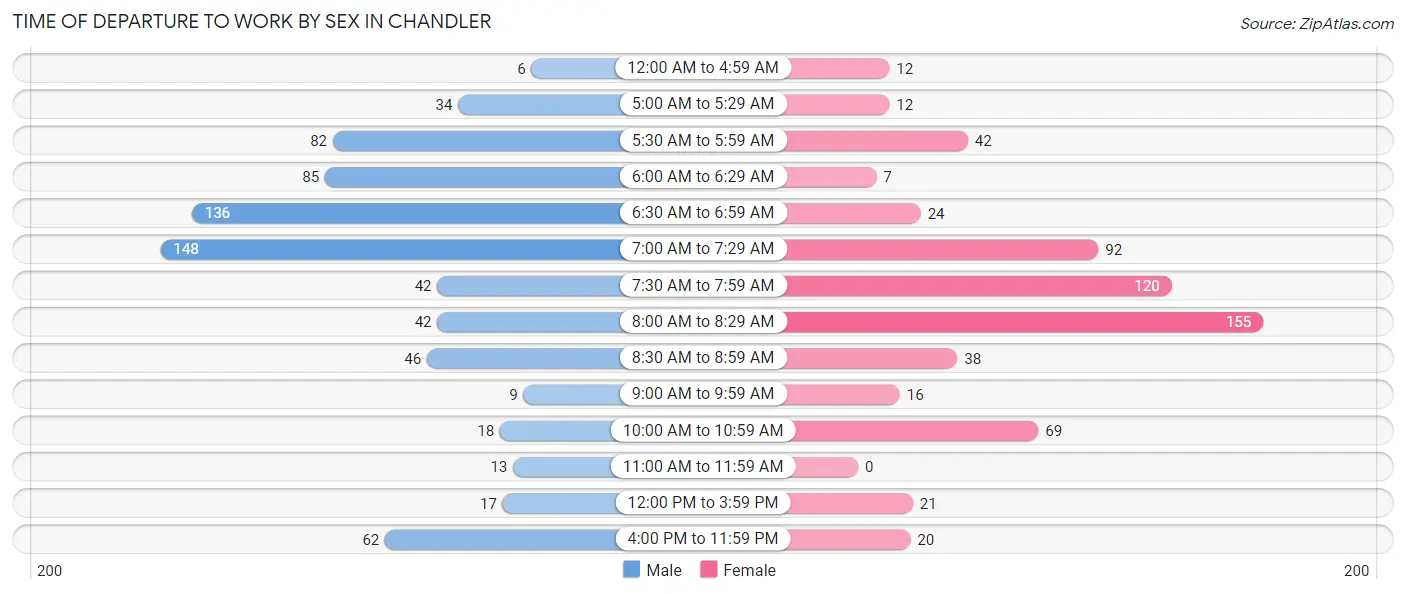
| Time of Departure | Male | Female |
| 12:00 AM to 4:59 AM | 6 (0.8%) | 12 (1.9%) |
| 5:00 AM to 5:29 AM | 34 (4.6%) | 12 (1.9%) |
| 5:30 AM to 5:59 AM | 82 (11.1%) | 42 (6.7%) |
| 6:00 AM to 6:29 AM | 85 (11.5%) | 7 (1.1%) |
| 6:30 AM to 6:59 AM | 136 (18.4%) | 24 (3.8%) |
| 7:00 AM to 7:29 AM | 148 (20.0%) | 92 (14.6%) |
| 7:30 AM to 7:59 AM | 42 (5.7%) | 120 (19.1%) |
| 8:00 AM to 8:29 AM | 42 (5.7%) | 155 (24.7%) |
| 8:30 AM to 8:59 AM | 46 (6.2%) | 38 (6.0%) |
| 9:00 AM to 9:59 AM | 9 (1.2%) | 16 (2.5%) |
| 10:00 AM to 10:59 AM | 18 (2.4%) | 69 (11.0%) |
| 11:00 AM to 11:59 AM | 13 (1.8%) | 0 (0.0%) |
| 12:00 PM to 3:59 PM | 17 (2.3%) | 21 (3.3%) |
| 4:00 PM to 11:59 PM | 62 (8.4%) | 20 (3.2%) |
| Total | 740 (100.0%) | 628 (100.0%) |
Housing Occupancy in Chandler
Occupancy by Ownership in Chandler
Of the total 1,408 dwellings in Chandler, owner-occupied units account for 1,000 (71.0%), while renter-occupied units make up 408 (29.0%).
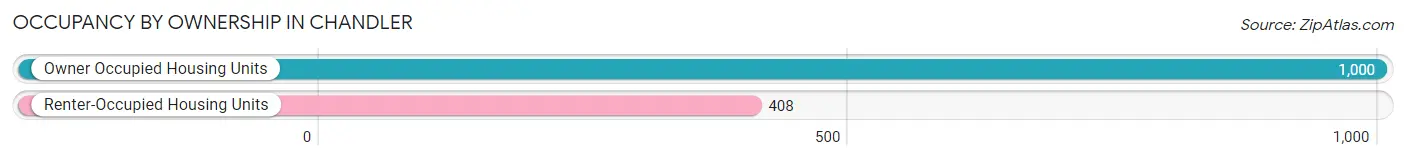
| Occupancy | # Housing Units | % Housing Units |
| Owner Occupied Housing Units | 1,000 | 71.0% |
| Renter-Occupied Housing Units | 408 | 29.0% |
| Total Occupied Housing Units | 1,408 | 100.0% |
Occupancy by Household Size in Chandler
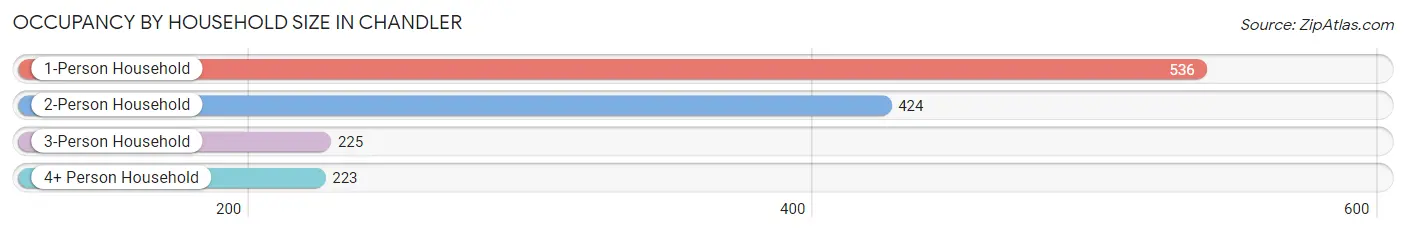
| Household Size | # Housing Units | % Housing Units |
| 1-Person Household | 536 | 38.1% |
| 2-Person Household | 424 | 30.1% |
| 3-Person Household | 225 | 16.0% |
| 4+ Person Household | 223 | 15.8% |
| Total Housing Units | 1,408 | 100.0% |
Occupancy by Ownership by Household Size in Chandler
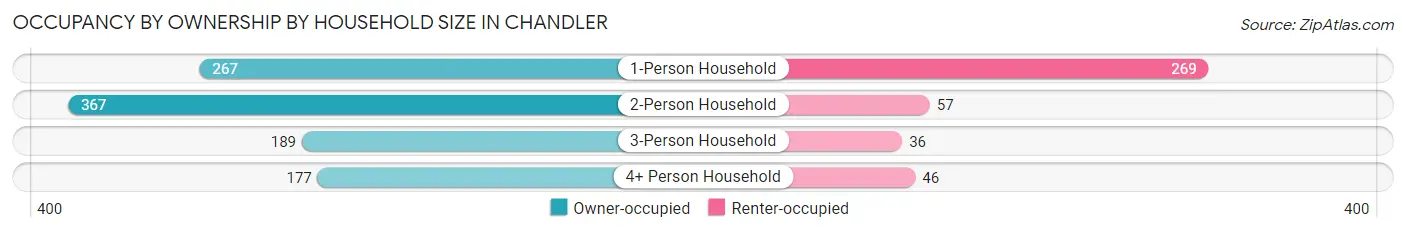
| Household Size | Owner-occupied | Renter-occupied |
| 1-Person Household | 267 (49.8%) | 269 (50.2%) |
| 2-Person Household | 367 (86.6%) | 57 (13.4%) |
| 3-Person Household | 189 (84.0%) | 36 (16.0%) |
| 4+ Person Household | 177 (79.4%) | 46 (20.6%) |
| Total Housing Units | 1,000 (71.0%) | 408 (29.0%) |
Occupancy by Educational Attainment in Chandler
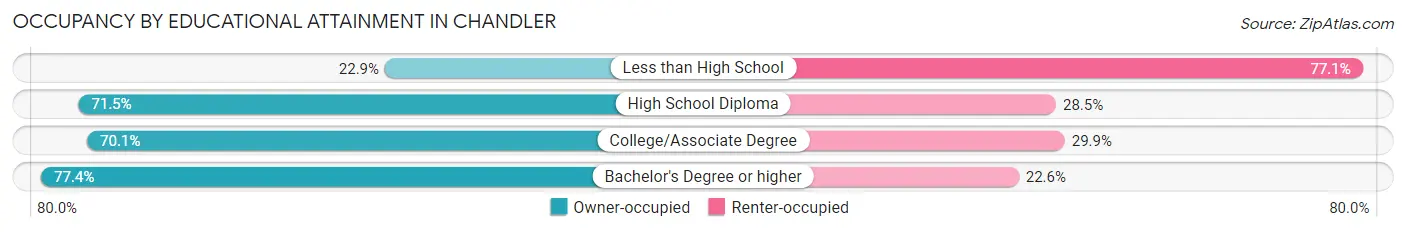
| Household Size | Owner-occupied | Renter-occupied |
| Less than High School | 8 (22.9%) | 27 (77.1%) |
| High School Diploma | 273 (71.5%) | 109 (28.5%) |
| College/Associate Degree | 459 (70.1%) | 196 (29.9%) |
| Bachelor's Degree or higher | 260 (77.4%) | 76 (22.6%) |
Occupancy by Age of Householder in Chandler
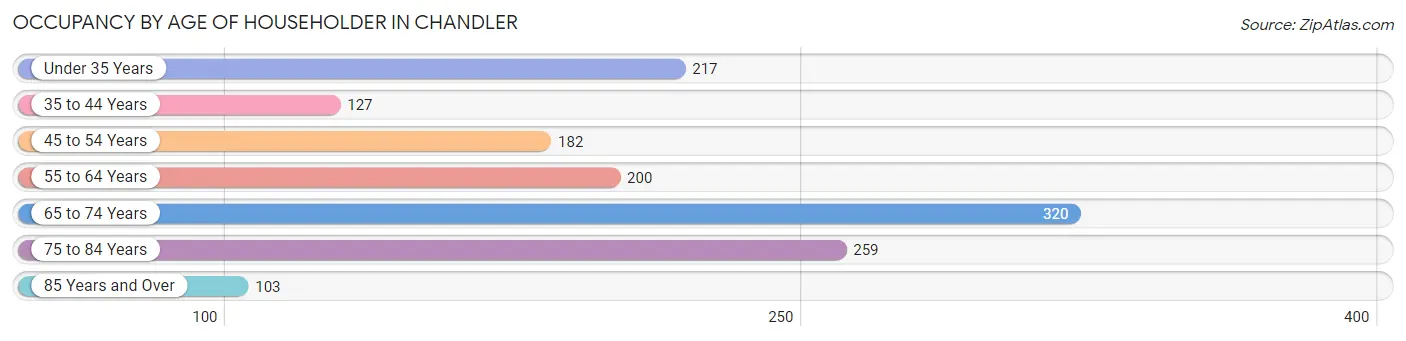
| Age Bracket | # Households | % Households |
| Under 35 Years | 217 | 15.4% |
| 35 to 44 Years | 127 | 9.0% |
| 45 to 54 Years | 182 | 12.9% |
| 55 to 64 Years | 200 | 14.2% |
| 65 to 74 Years | 320 | 22.7% |
| 75 to 84 Years | 259 | 18.4% |
| 85 Years and Over | 103 | 7.3% |
| Total | 1,408 | 100.0% |
Housing Finances in Chandler
Median Income by Occupancy in Chandler
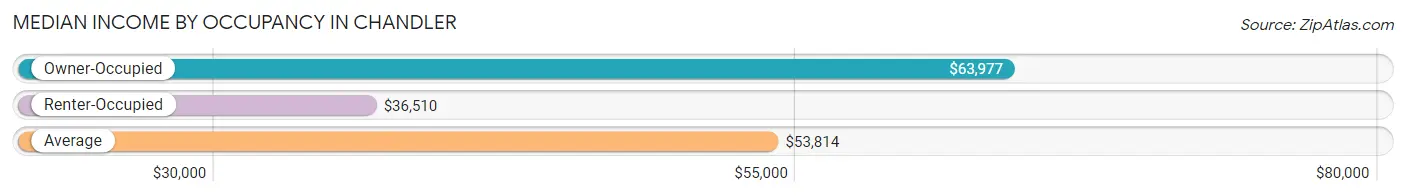
| Occupancy Type | # Households | Median Income |
| Owner-Occupied | 1,000 (71.0%) | $63,977 |
| Renter-Occupied | 408 (29.0%) | $36,510 |
| Average | 1,408 (100.0%) | $53,814 |
Occupancy by Householder Income Bracket in Chandler
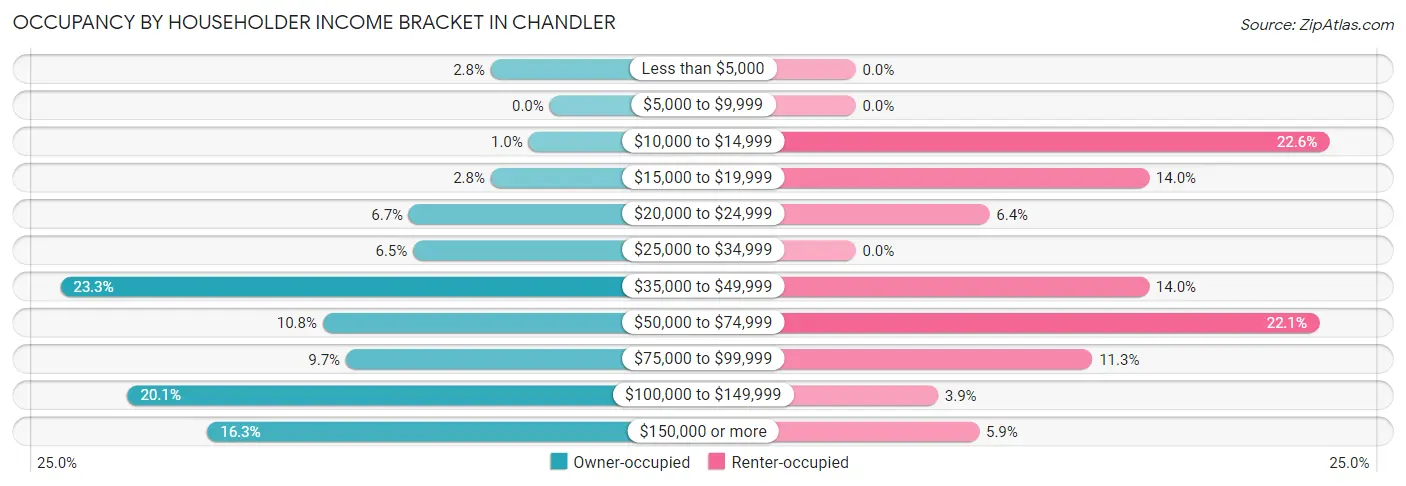
| Income Bracket | Owner-occupied | Renter-occupied |
| Less than $5,000 | 28 (2.8%) | 0 (0.0%) |
| $5,000 to $9,999 | 0 (0.0%) | 0 (0.0%) |
| $10,000 to $14,999 | 10 (1.0%) | 92 (22.6%) |
| $15,000 to $19,999 | 28 (2.8%) | 57 (14.0%) |
| $20,000 to $24,999 | 67 (6.7%) | 26 (6.4%) |
| $25,000 to $34,999 | 65 (6.5%) | 0 (0.0%) |
| $35,000 to $49,999 | 233 (23.3%) | 57 (14.0%) |
| $50,000 to $74,999 | 108 (10.8%) | 90 (22.1%) |
| $75,000 to $99,999 | 97 (9.7%) | 46 (11.3%) |
| $100,000 to $149,999 | 201 (20.1%) | 16 (3.9%) |
| $150,000 or more | 163 (16.3%) | 24 (5.9%) |
| Total | 1,000 (100.0%) | 408 (100.0%) |
Monthly Housing Cost Tiers in Chandler
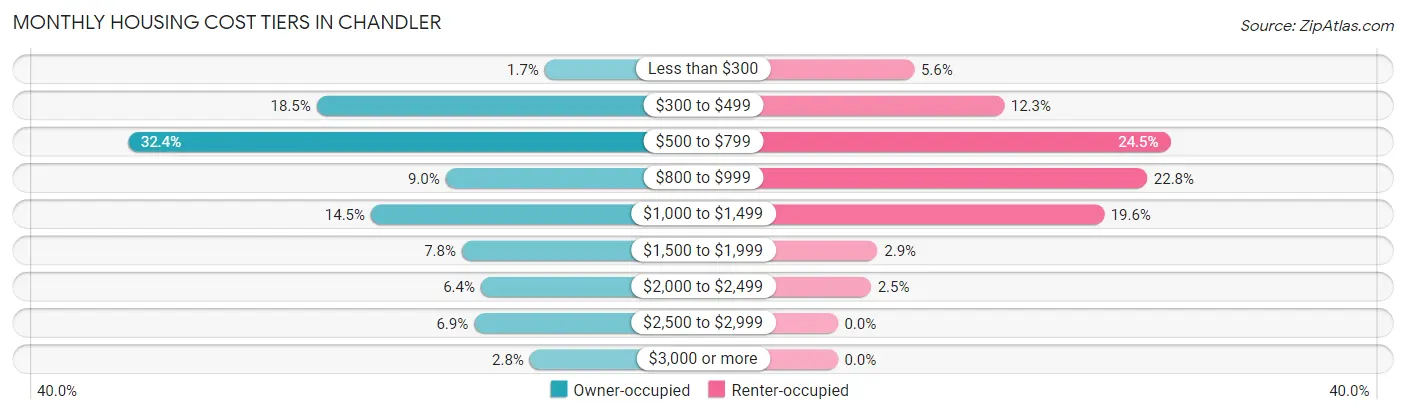
| Monthly Cost | Owner-occupied | Renter-occupied |
| Less than $300 | 17 (1.7%) | 23 (5.6%) |
| $300 to $499 | 185 (18.5%) | 50 (12.2%) |
| $500 to $799 | 324 (32.4%) | 100 (24.5%) |
| $800 to $999 | 90 (9.0%) | 93 (22.8%) |
| $1,000 to $1,499 | 145 (14.5%) | 80 (19.6%) |
| $1,500 to $1,999 | 78 (7.8%) | 12 (2.9%) |
| $2,000 to $2,499 | 64 (6.4%) | 10 (2.5%) |
| $2,500 to $2,999 | 69 (6.9%) | 0 (0.0%) |
| $3,000 or more | 28 (2.8%) | 0 (0.0%) |
| Total | 1,000 (100.0%) | 408 (100.0%) |
Physical Housing Characteristics in Chandler
Housing Structures in Chandler
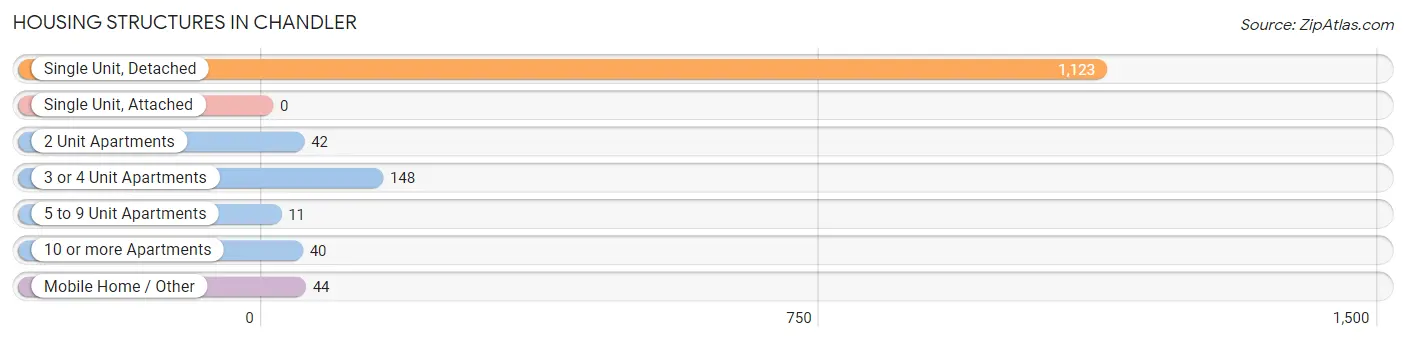
| Structure Type | # Housing Units | % Housing Units |
| Single Unit, Detached | 1,123 | 79.8% |
| Single Unit, Attached | 0 | 0.0% |
| 2 Unit Apartments | 42 | 3.0% |
| 3 or 4 Unit Apartments | 148 | 10.5% |
| 5 to 9 Unit Apartments | 11 | 0.8% |
| 10 or more Apartments | 40 | 2.8% |
| Mobile Home / Other | 44 | 3.1% |
| Total | 1,408 | 100.0% |
Housing Structures by Occupancy in Chandler
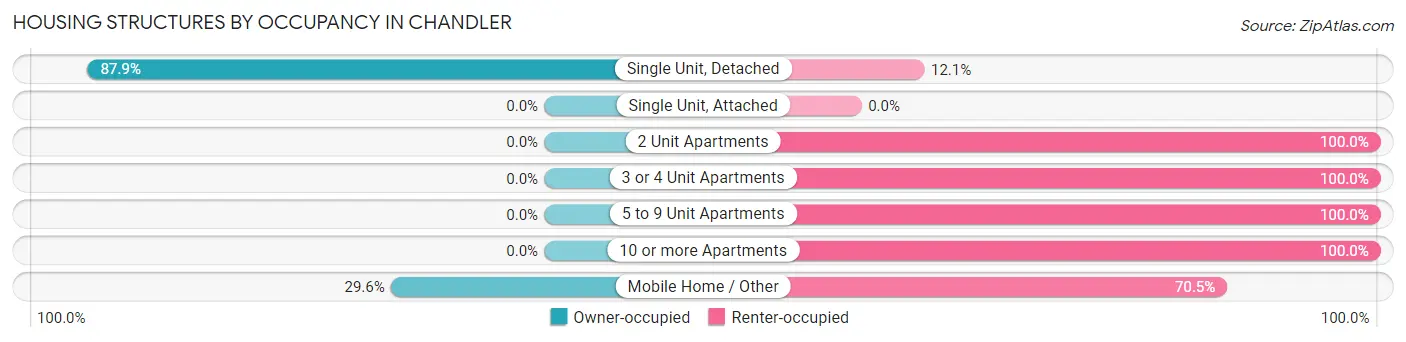
| Structure Type | Owner-occupied | Renter-occupied |
| Single Unit, Detached | 987 (87.9%) | 136 (12.1%) |
| Single Unit, Attached | 0 (0.0%) | 0 (0.0%) |
| 2 Unit Apartments | 0 (0.0%) | 42 (100.0%) |
| 3 or 4 Unit Apartments | 0 (0.0%) | 148 (100.0%) |
| 5 to 9 Unit Apartments | 0 (0.0%) | 11 (100.0%) |
| 10 or more Apartments | 0 (0.0%) | 40 (100.0%) |
| Mobile Home / Other | 13 (29.5%) | 31 (70.5%) |
| Total | 1,000 (71.0%) | 408 (29.0%) |
Housing Structures by Number of Rooms in Chandler
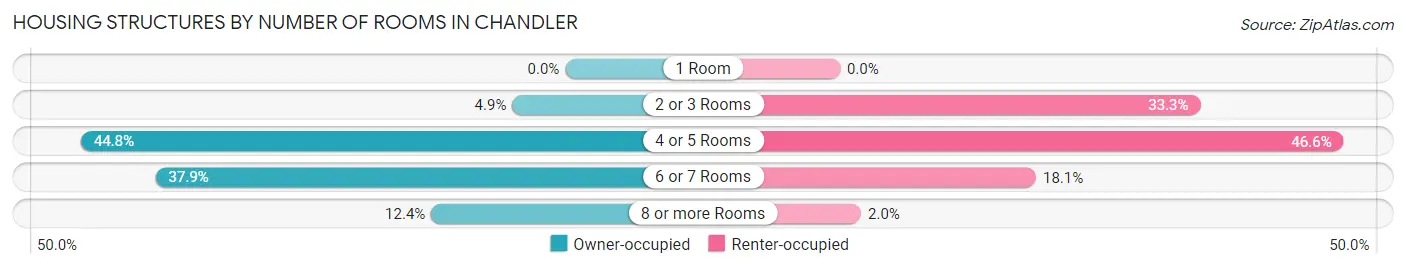
| Number of Rooms | Owner-occupied | Renter-occupied |
| 1 Room | 0 (0.0%) | 0 (0.0%) |
| 2 or 3 Rooms | 49 (4.9%) | 136 (33.3%) |
| 4 or 5 Rooms | 448 (44.8%) | 190 (46.6%) |
| 6 or 7 Rooms | 379 (37.9%) | 74 (18.1%) |
| 8 or more Rooms | 124 (12.4%) | 8 (2.0%) |
| Total | 1,000 (100.0%) | 408 (100.0%) |
Housing Structure by Heating Type in Chandler
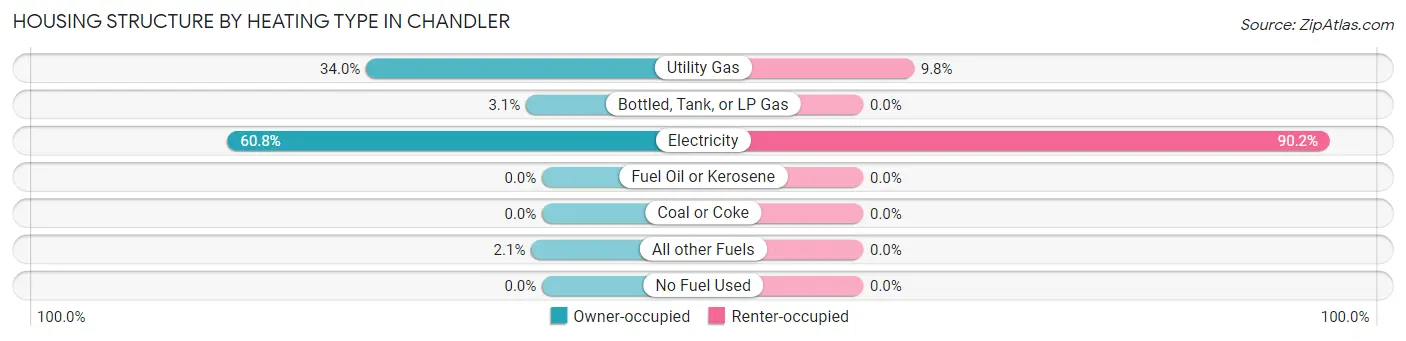
| Heating Type | Owner-occupied | Renter-occupied |
| Utility Gas | 340 (34.0%) | 40 (9.8%) |
| Bottled, Tank, or LP Gas | 31 (3.1%) | 0 (0.0%) |
| Electricity | 608 (60.8%) | 368 (90.2%) |
| Fuel Oil or Kerosene | 0 (0.0%) | 0 (0.0%) |
| Coal or Coke | 0 (0.0%) | 0 (0.0%) |
| All other Fuels | 21 (2.1%) | 0 (0.0%) |
| No Fuel Used | 0 (0.0%) | 0 (0.0%) |
| Total | 1,000 (100.0%) | 408 (100.0%) |
Household Vehicle Usage in Chandler
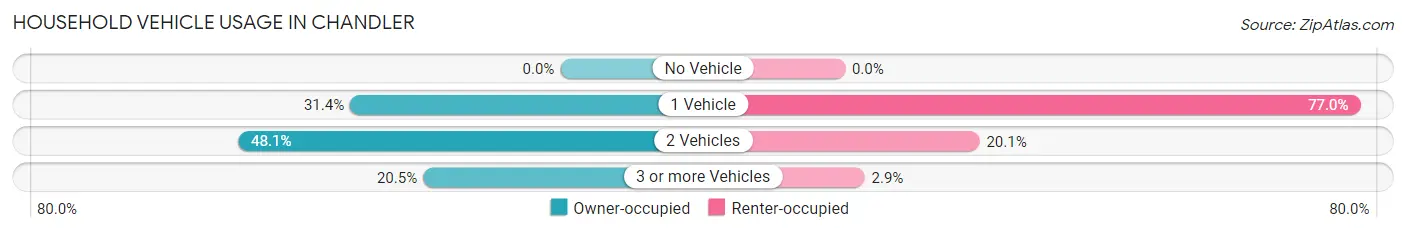
| Vehicles per Household | Owner-occupied | Renter-occupied |
| No Vehicle | 0 (0.0%) | 0 (0.0%) |
| 1 Vehicle | 314 (31.4%) | 314 (77.0%) |
| 2 Vehicles | 481 (48.1%) | 82 (20.1%) |
| 3 or more Vehicles | 205 (20.5%) | 12 (2.9%) |
| Total | 1,000 (100.0%) | 408 (100.0%) |
Real Estate & Mortgages in Chandler
Real Estate and Mortgage Overview in Chandler
| Characteristic | Without Mortgage | With Mortgage |
| Housing Units | 584 | 416 |
| Median Property Value | $179,400 | $234,400 |
| Median Household Income | $45,806 | $138 |
| Monthly Housing Costs | $615 | $28 |
| Real Estate Taxes | $1,837 | $0 |
Property Value by Mortgage Status in Chandler
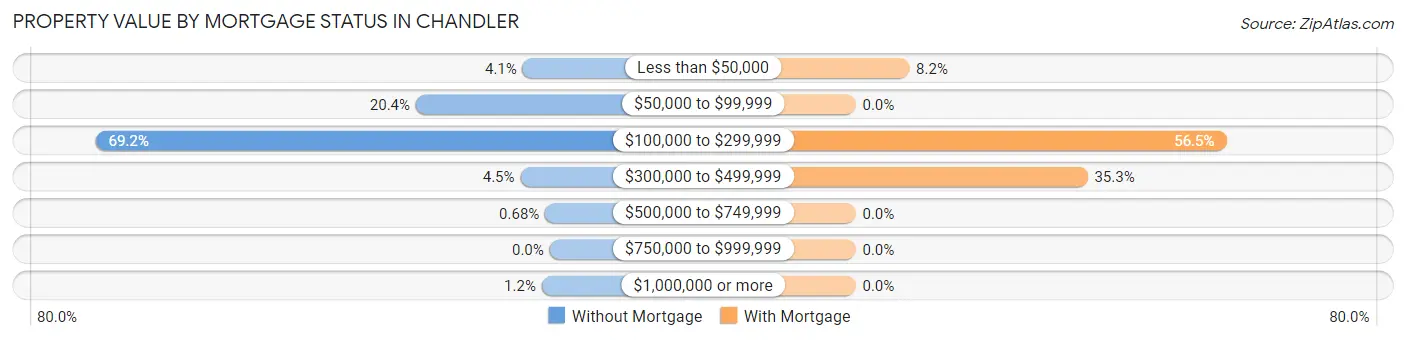
| Property Value | Without Mortgage | With Mortgage |
| Less than $50,000 | 24 (4.1%) | 34 (8.2%) |
| $50,000 to $99,999 | 119 (20.4%) | 0 (0.0%) |
| $100,000 to $299,999 | 404 (69.2%) | 235 (56.5%) |
| $300,000 to $499,999 | 26 (4.4%) | 147 (35.3%) |
| $500,000 to $749,999 | 4 (0.7%) | 0 (0.0%) |
| $750,000 to $999,999 | 0 (0.0%) | 0 (0.0%) |
| $1,000,000 or more | 7 (1.2%) | 0 (0.0%) |
| Total | 584 (100.0%) | 416 (100.0%) |
Household Income by Mortgage Status in Chandler
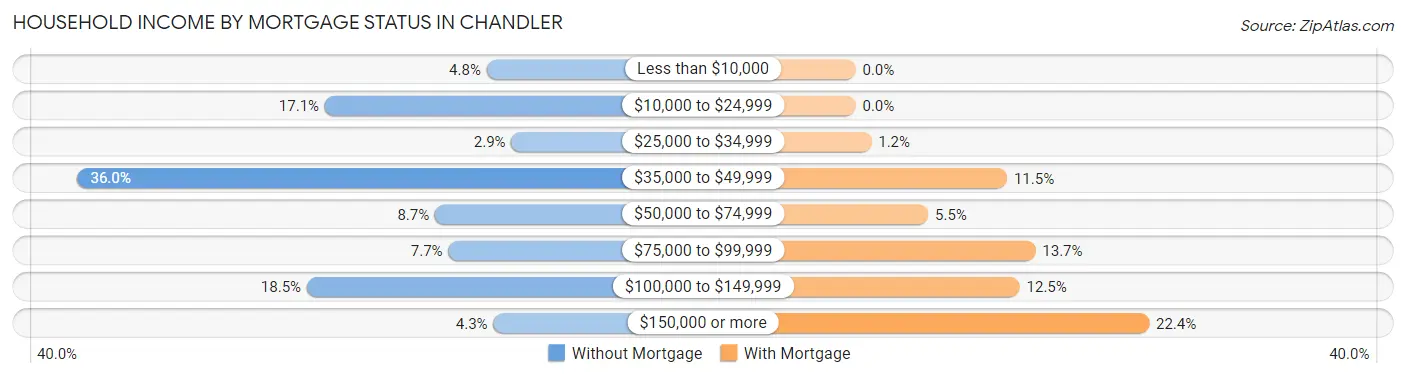
| Household Income | Without Mortgage | With Mortgage |
| Less than $10,000 | 28 (4.8%) | 0 (0.0%) |
| $10,000 to $24,999 | 100 (17.1%) | 0 (0.0%) |
| $25,000 to $34,999 | 17 (2.9%) | 5 (1.2%) |
| $35,000 to $49,999 | 210 (36.0%) | 48 (11.5%) |
| $50,000 to $74,999 | 51 (8.7%) | 23 (5.5%) |
| $75,000 to $99,999 | 45 (7.7%) | 57 (13.7%) |
| $100,000 to $149,999 | 108 (18.5%) | 52 (12.5%) |
| $150,000 or more | 25 (4.3%) | 93 (22.4%) |
| Total | 584 (100.0%) | 416 (100.0%) |
Property Value to Household Income Ratio in Chandler
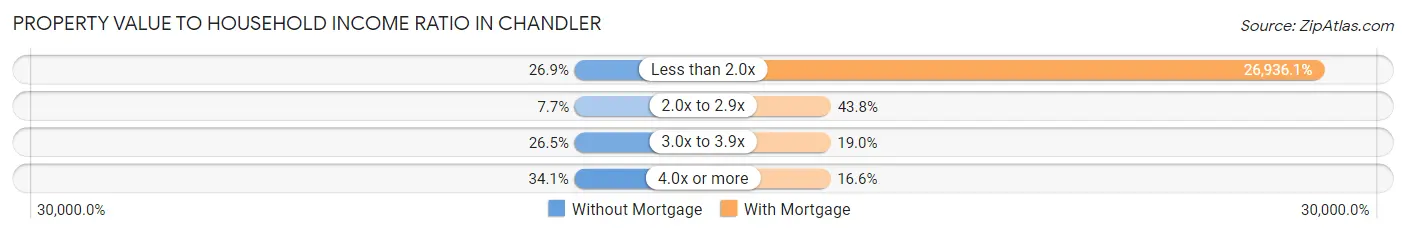
| Value-to-Income Ratio | Without Mortgage | With Mortgage |
| Less than 2.0x | 157 (26.9%) | 112,054 (26,936.1%) |
| 2.0x to 2.9x | 45 (7.7%) | 182 (43.8%) |
| 3.0x to 3.9x | 155 (26.5%) | 79 (19.0%) |
| 4.0x or more | 199 (34.1%) | 69 (16.6%) |
| Total | 584 (100.0%) | 416 (100.0%) |
Real Estate Taxes by Mortgage Status in Chandler
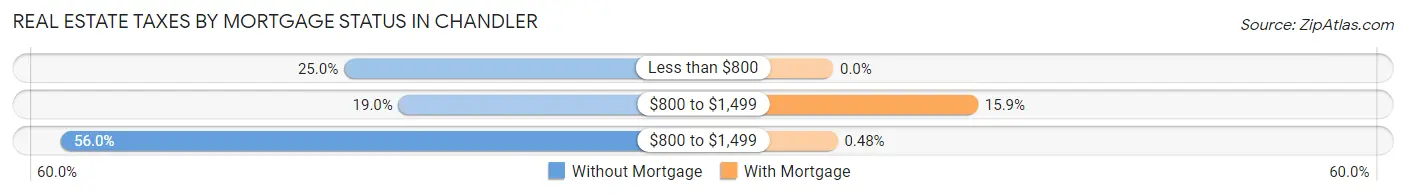
| Property Taxes | Without Mortgage | With Mortgage |
| Less than $800 | 146 (25.0%) | 0 (0.0%) |
| $800 to $1,499 | 111 (19.0%) | 66 (15.9%) |
| $800 to $1,499 | 327 (56.0%) | 2 (0.5%) |
| Total | 584 (100.0%) | 416 (100.0%) |
Health & Disability in Chandler
Health Insurance Coverage by Age in Chandler
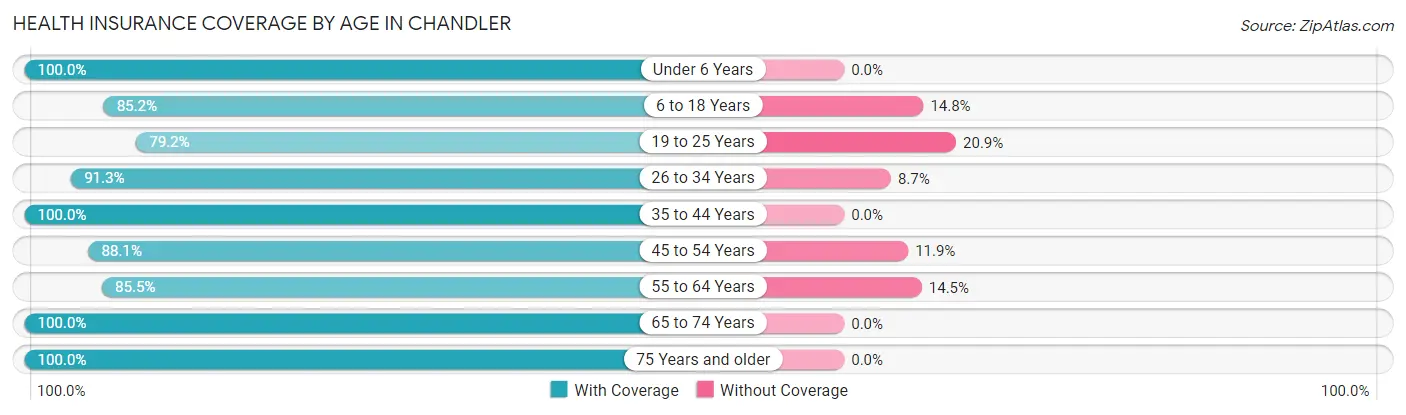
| Age Bracket | With Coverage | Without Coverage |
| Under 6 Years | 210 (100.0%) | 0 (0.0%) |
| 6 to 18 Years | 358 (85.2%) | 62 (14.8%) |
| 19 to 25 Years | 243 (79.1%) | 64 (20.8%) |
| 26 to 34 Years | 273 (91.3%) | 26 (8.7%) |
| 35 to 44 Years | 270 (100.0%) | 0 (0.0%) |
| 45 to 54 Years | 325 (88.1%) | 44 (11.9%) |
| 55 to 64 Years | 260 (85.5%) | 44 (14.5%) |
| 65 to 74 Years | 410 (100.0%) | 0 (0.0%) |
| 75 Years and older | 639 (100.0%) | 0 (0.0%) |
| Total | 2,988 (92.6%) | 240 (7.4%) |
Health Insurance Coverage by Citizenship Status in Chandler
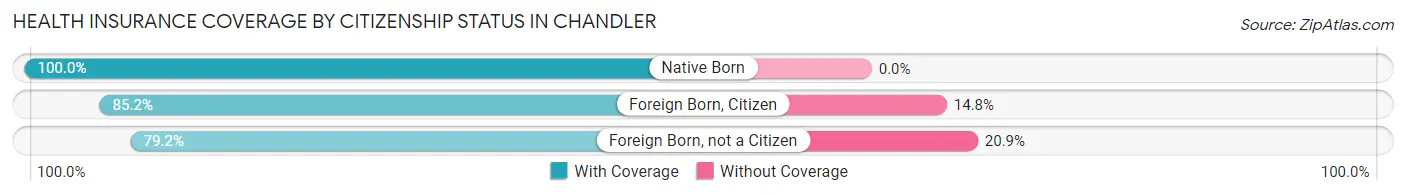
| Citizenship Status | With Coverage | Without Coverage |
| Native Born | 210 (100.0%) | 0 (0.0%) |
| Foreign Born, Citizen | 358 (85.2%) | 62 (14.8%) |
| Foreign Born, not a Citizen | 243 (79.1%) | 64 (20.8%) |
Health Insurance Coverage by Household Income in Chandler
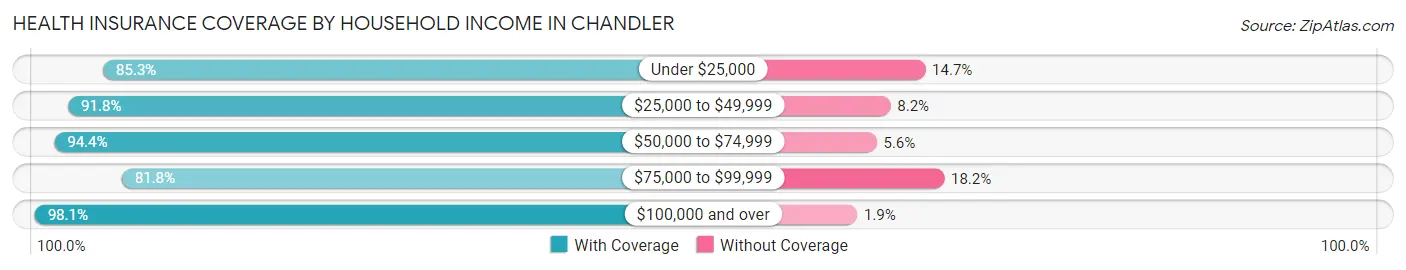
| Household Income | With Coverage | Without Coverage |
| Under $25,000 | 343 (85.3%) | 59 (14.7%) |
| $25,000 to $49,999 | 540 (91.8%) | 48 (8.2%) |
| $50,000 to $74,999 | 390 (94.4%) | 23 (5.6%) |
| $75,000 to $99,999 | 377 (81.8%) | 84 (18.2%) |
| $100,000 and over | 1,338 (98.1%) | 26 (1.9%) |
Public vs Private Health Insurance Coverage by Age in Chandler
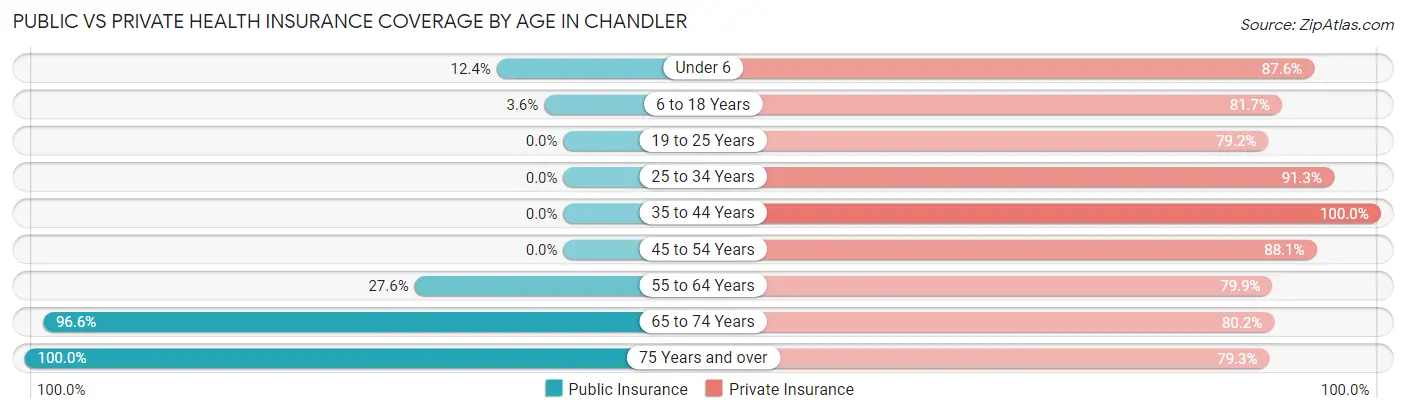
| Age Bracket | Public Insurance | Private Insurance |
| Under 6 | 26 (12.4%) | 184 (87.6%) |
| 6 to 18 Years | 15 (3.6%) | 343 (81.7%) |
| 19 to 25 Years | 0 (0.0%) | 243 (79.1%) |
| 25 to 34 Years | 0 (0.0%) | 273 (91.3%) |
| 35 to 44 Years | 0 (0.0%) | 270 (100.0%) |
| 45 to 54 Years | 0 (0.0%) | 325 (88.1%) |
| 55 to 64 Years | 84 (27.6%) | 243 (79.9%) |
| 65 to 74 Years | 396 (96.6%) | 329 (80.2%) |
| 75 Years and over | 639 (100.0%) | 507 (79.3%) |
| Total | 1,160 (35.9%) | 2,717 (84.2%) |
Disability Status by Sex by Age in Chandler
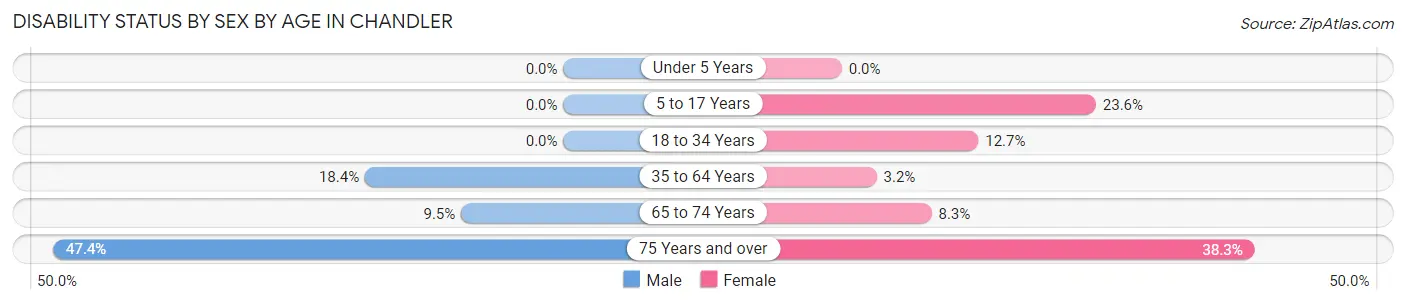
| Age Bracket | Male | Female |
| Under 5 Years | 0 (0.0%) | 0 (0.0%) |
| 5 to 17 Years | 0 (0.0%) | 29 (23.6%) |
| 18 to 34 Years | 0 (0.0%) | 37 (12.7%) |
| 35 to 64 Years | 88 (18.4%) | 15 (3.2%) |
| 65 to 74 Years | 15 (9.5%) | 21 (8.3%) |
| 75 Years and over | 90 (47.4%) | 172 (38.3%) |
Disability Class by Sex by Age in Chandler
Disability Class: Hearing Difficulty
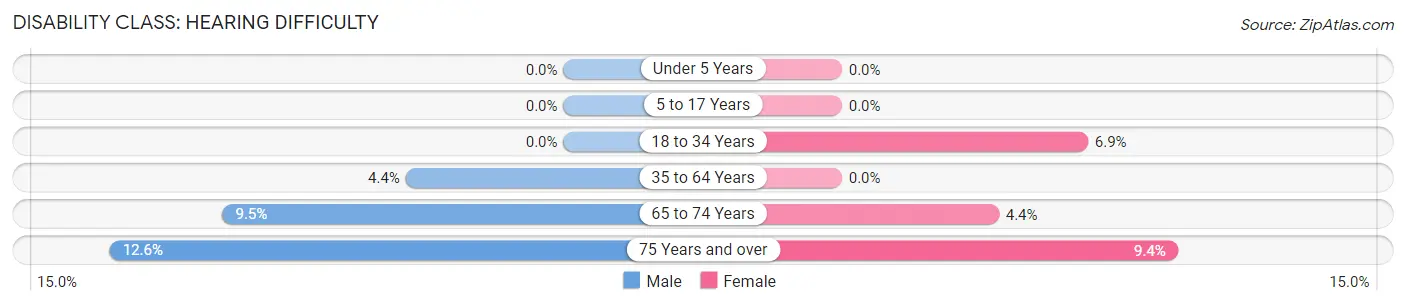
| Age Bracket | Male | Female |
| Under 5 Years | 0 (0.0%) | 0 (0.0%) |
| 5 to 17 Years | 0 (0.0%) | 0 (0.0%) |
| 18 to 34 Years | 0 (0.0%) | 20 (6.9%) |
| 35 to 64 Years | 21 (4.4%) | 0 (0.0%) |
| 65 to 74 Years | 15 (9.5%) | 11 (4.4%) |
| 75 Years and over | 24 (12.6%) | 42 (9.3%) |
Disability Class: Vision Difficulty
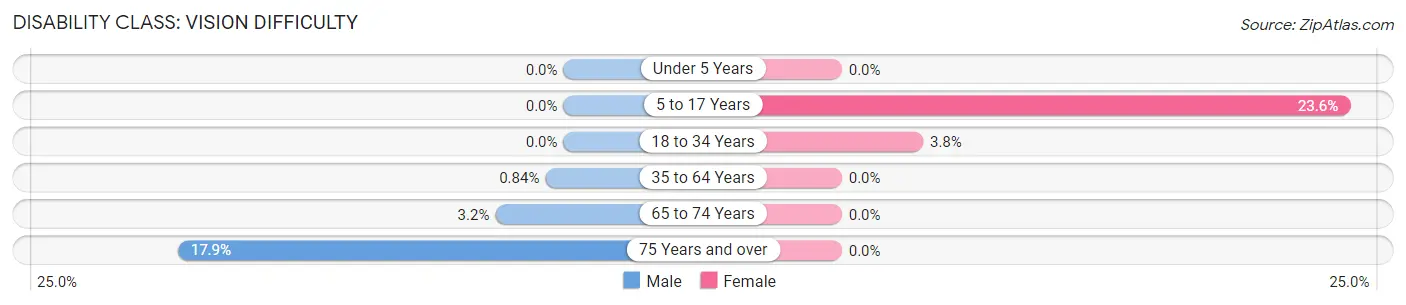
| Age Bracket | Male | Female |
| Under 5 Years | 0 (0.0%) | 0 (0.0%) |
| 5 to 17 Years | 0 (0.0%) | 29 (23.6%) |
| 18 to 34 Years | 0 (0.0%) | 11 (3.8%) |
| 35 to 64 Years | 4 (0.8%) | 0 (0.0%) |
| 65 to 74 Years | 5 (3.2%) | 0 (0.0%) |
| 75 Years and over | 34 (17.9%) | 0 (0.0%) |
Disability Class: Cognitive Difficulty
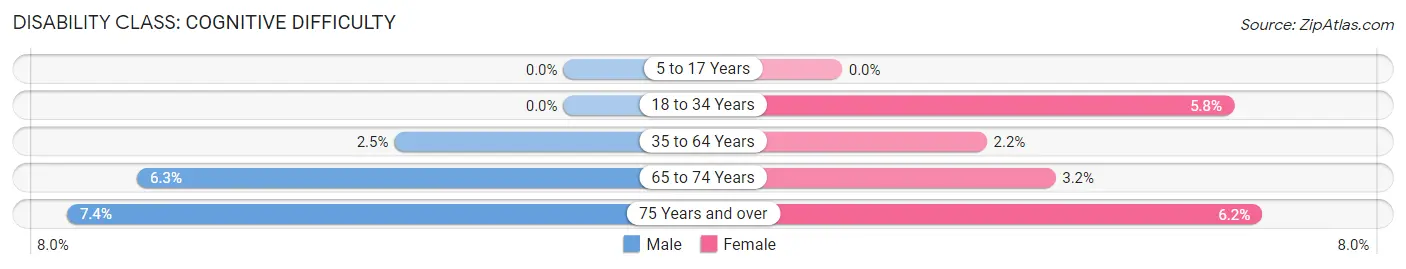
| Age Bracket | Male | Female |
| 5 to 17 Years | 0 (0.0%) | 0 (0.0%) |
| 18 to 34 Years | 0 (0.0%) | 17 (5.8%) |
| 35 to 64 Years | 12 (2.5%) | 10 (2.1%) |
| 65 to 74 Years | 10 (6.3%) | 8 (3.2%) |
| 75 Years and over | 14 (7.4%) | 28 (6.2%) |
Disability Class: Ambulatory Difficulty
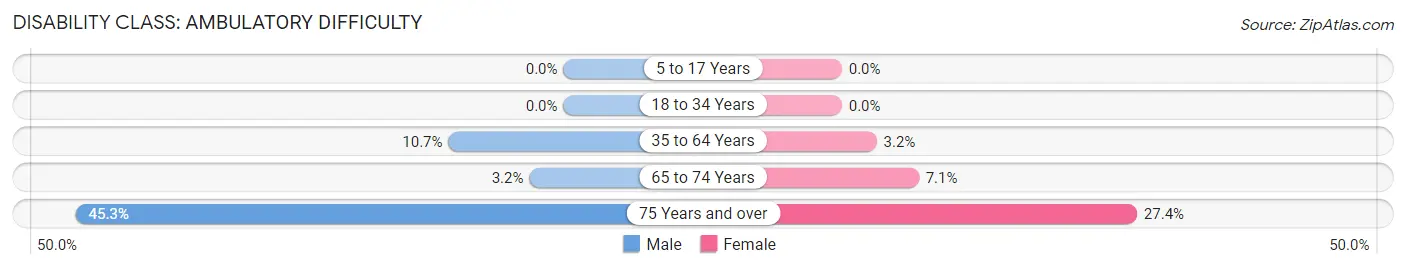
| Age Bracket | Male | Female |
| 5 to 17 Years | 0 (0.0%) | 0 (0.0%) |
| 18 to 34 Years | 0 (0.0%) | 0 (0.0%) |
| 35 to 64 Years | 51 (10.7%) | 15 (3.2%) |
| 65 to 74 Years | 5 (3.2%) | 18 (7.1%) |
| 75 Years and over | 86 (45.3%) | 123 (27.4%) |
Disability Class: Self-Care Difficulty
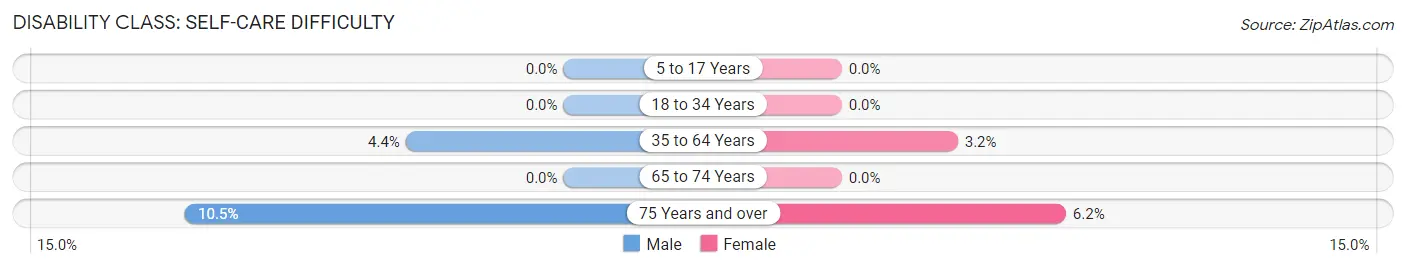
| Age Bracket | Male | Female |
| 5 to 17 Years | 0 (0.0%) | 0 (0.0%) |
| 18 to 34 Years | 0 (0.0%) | 0 (0.0%) |
| 35 to 64 Years | 21 (4.4%) | 15 (3.2%) |
| 65 to 74 Years | 0 (0.0%) | 0 (0.0%) |
| 75 Years and over | 20 (10.5%) | 28 (6.2%) |
Technology Access in Chandler
Computing Device Access in Chandler
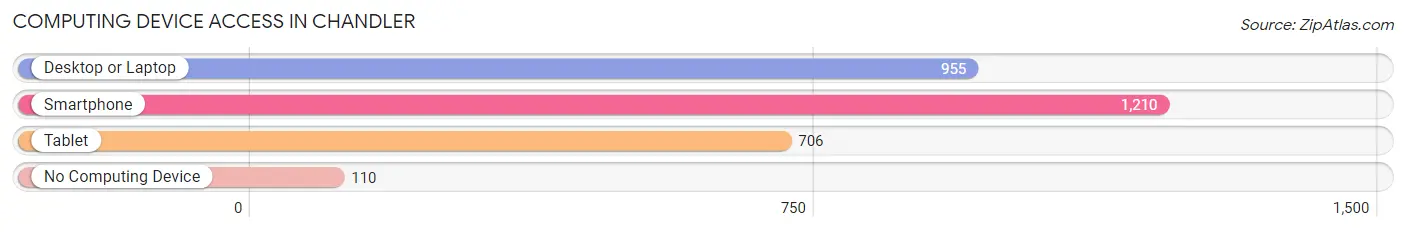
| Device Type | # Households | % Households |
| Desktop or Laptop | 955 | 67.8% |
| Smartphone | 1,210 | 85.9% |
| Tablet | 706 | 50.1% |
| No Computing Device | 110 | 7.8% |
| Total | 1,408 | 100.0% |
Internet Access in Chandler
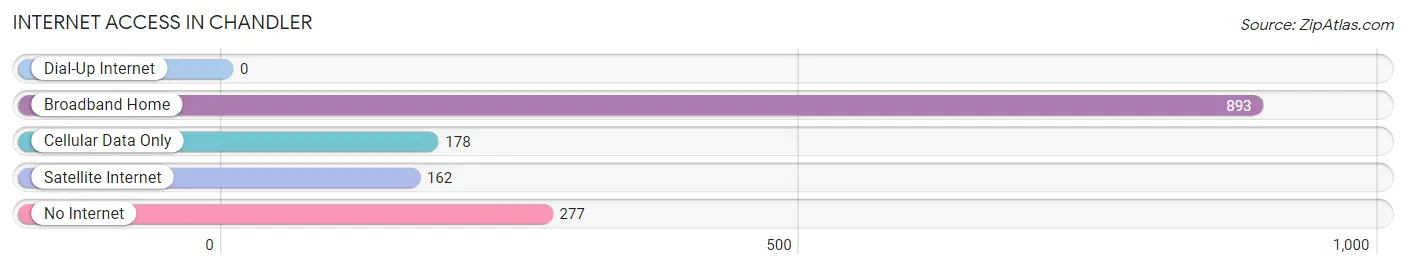
| Internet Type | # Households | % Households |
| Dial-Up Internet | 0 | 0.0% |
| Broadband Home | 893 | 63.4% |
| Cellular Data Only | 178 | 12.6% |
| Satellite Internet | 162 | 11.5% |
| No Internet | 277 | 19.7% |
| Total | 1,408 | 100.0% |
Chandler Summary
Chandler, Texas is a small town located in Henderson County, Texas. It is situated about 100 miles east of Dallas and is part of the Tyler-Longview metropolitan area. The town was founded in 1881 and has a population of approximately 2,000 people.
History
Chandler was founded in 1881 by a group of settlers from Tennessee. The town was named after a local rancher, John Chandler, who owned a large amount of land in the area. The town was originally a farming community, but it soon became a center for the timber industry. The town was incorporated in 1885 and the first post office was established in 1887.
In the early 1900s, Chandler began to experience a period of growth and development. The town was connected to the railroad in 1906, which allowed for the transportation of goods and services to and from the town. This helped to spur economic growth and development in the area.
In the 1920s, Chandler experienced a period of decline due to the Great Depression. However, the town was able to recover and experienced a period of growth in the 1950s and 1960s. During this time, the town was able to attract new businesses and industries, which helped to create jobs and boost the local economy.
Geography
Chandler is located in Henderson County, Texas. The town is situated about 100 miles east of Dallas and is part of the Tyler-Longview metropolitan area. The town is located in the East Texas Piney Woods region and is surrounded by rolling hills and forests. The town is situated on the banks of the Neches River and is home to several lakes, including Lake Palestine and Lake Tyler.
Economy
Chandler’s economy is largely based on agriculture and timber. The town is home to several farms and ranches, which produce a variety of crops, including cotton, corn, soybeans, and wheat. The town is also home to several timber companies, which harvest and process timber for use in construction and other industries.
In addition to agriculture and timber, Chandler is also home to several manufacturing companies. These companies produce a variety of products, including furniture, clothing, and electronics. The town is also home to several retail stores, restaurants, and other businesses.
Demographics
As of the 2010 census, Chandler had a population of 2,000 people. The town is predominantly white, with about 85% of the population identifying as white. The remaining 15% of the population is made up of African Americans, Hispanics, and other races. The median household income in Chandler is $37,000, and the median home value is $90,000. The town has a low unemployment rate of 4.2%.
Common Questions
What is Per Capita Income in Chandler?
Per Capita income in Chandler is $43,858.
What is the Median Family Income in Chandler?
Median Family Income in Chandler is $89,760.
What is the Median Household income in Chandler?
Median Household Income in Chandler is $53,814.
What is Income or Wage Gap in Chandler?
Income or Wage Gap in Chandler is 34.5%.
Women in Chandler earn 65.5 cents for every dollar earned by a man.
What is Inequality or Gini Index in Chandler?
Inequality or Gini Index in Chandler is 0.55.
What is the Total Population of Chandler?
Total Population of Chandler is 3,308.
What is the Total Male Population of Chandler?
Total Male Population of Chandler is 1,650.
What is the Total Female Population of Chandler?
Total Female Population of Chandler is 1,658.
What is the Ratio of Males per 100 Females in Chandler?
There are 99.52 Males per 100 Females in Chandler.
What is the Ratio of Females per 100 Males in Chandler?
There are 100.48 Females per 100 Males in Chandler.
What is the Median Population Age in Chandler?
Median Population Age in Chandler is 50.0 Years.
What is the Average Family Size in Chandler
Average Family Size in Chandler is 3.1 People.
What is the Average Household Size in Chandler
Average Household Size in Chandler is 2.3 People.
How Large is the Labor Force in Chandler?
There are 1,596 People in the Labor Forcein in Chandler.
What is the Percentage of People in the Labor Force in Chandler?
56.6% of People are in the Labor Force in Chandler.
What is the Unemployment Rate in Chandler?
Unemployment Rate in Chandler is 5.1%.