Castroville, TX Map & Demographics
Castroville Map
Castroville Overview
$33,706
PER CAPITA INCOME
$79,224
AVG FAMILY INCOME
$72,805
AVG HOUSEHOLD INCOME
10.3%
WAGE / INCOME GAP [ % ]
89.7¢/ $1
WAGE / INCOME GAP [ $ ]
0.39
INEQUALITY / GINI INDEX
2,994
TOTAL POPULATION
1,319
MALE POPULATION
1,675
FEMALE POPULATION
78.75
MALES / 100 FEMALES
126.99
FEMALES / 100 MALES
45.6
MEDIAN AGE
2.9
AVG FAMILY SIZE
2.6
AVG HOUSEHOLD SIZE
1,381
LABOR FORCE [ PEOPLE ]
57.6%
PERCENT IN LABOR FORCE
2.4%
UNEMPLOYMENT RATE
Castroville Zip Codes
Castroville Area Codes
Income in Castroville
Income Overview in Castroville
Per Capita Income in Castroville is $33,706, while median incomes of families and households are $79,224 and $72,805 respectively.
| Characteristic | Number | Measure |
| Per Capita Income | 2,994 | $33,706 |
| Median Family Income | 906 | $79,224 |
| Mean Family Income | 906 | $92,909 |
| Median Household Income | 1,128 | $72,805 |
| Mean Household Income | 1,128 | $87,054 |
| Income Deficit | 906 | $0 |
| Wage / Income Gap (%) | 2,994 | 10.29% |
| Wage / Income Gap ($) | 2,994 | 89.71¢ per $1 |
| Gini / Inequality Index | 2,994 | 0.39 |
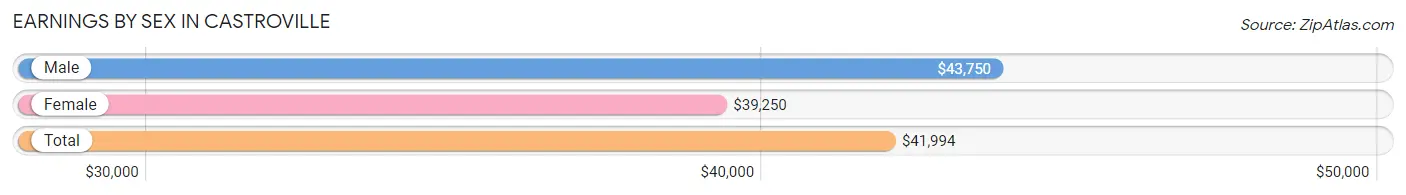
Earnings by Sex in Castroville
Average Earnings in Castroville are $41,994, $43,750 for men and $39,250 for women, a difference of 10.3%.
| Sex | Number | Average Earnings |
| Male | 773 (52.9%) | $43,750 |
| Female | 689 (47.1%) | $39,250 |
| Total | 1,462 (100.0%) | $41,994 |
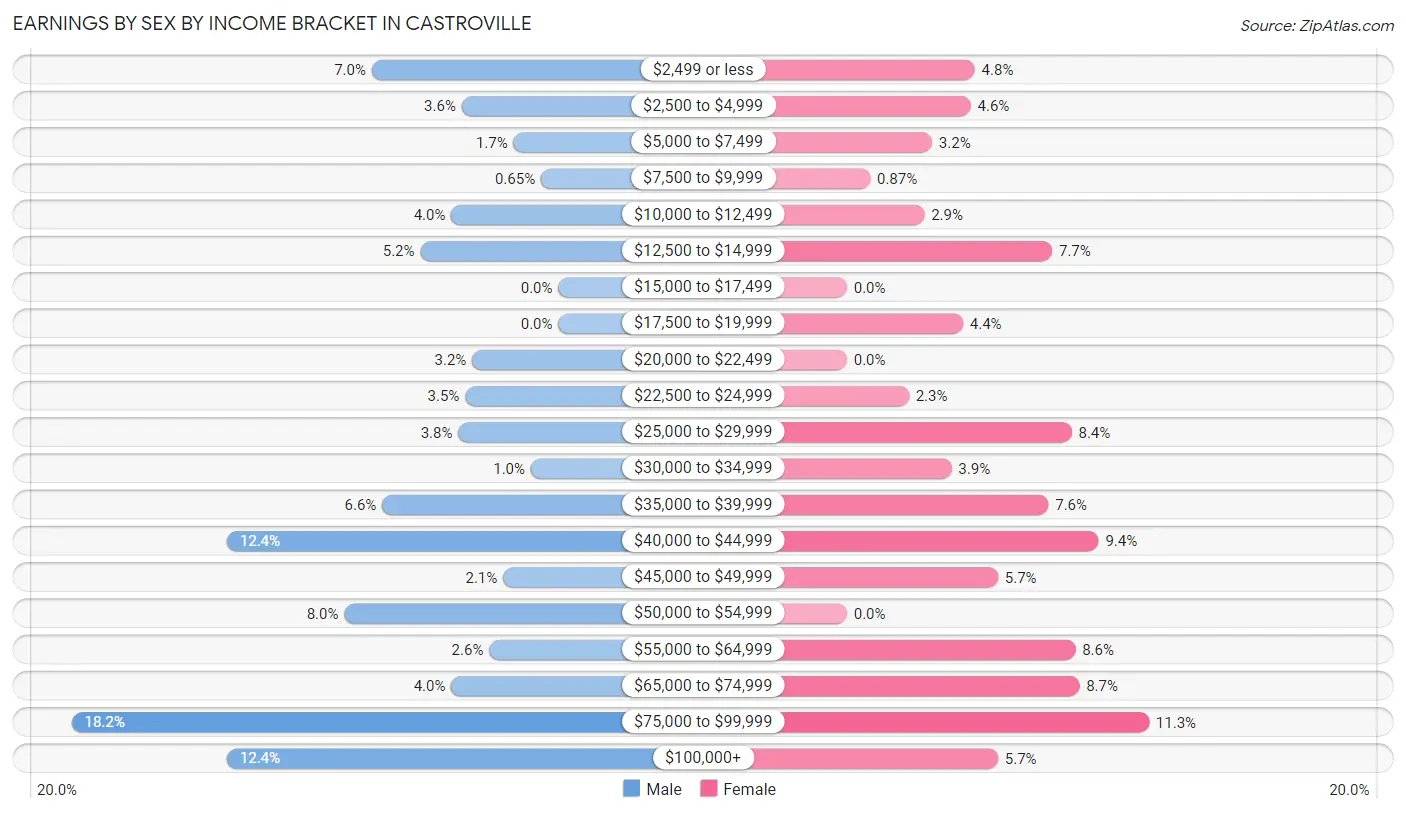
Earnings by Sex by Income Bracket in Castroville
The most common earnings brackets in Castroville are $75,000 to $99,999 for men (141 | 18.2%) and $75,000 to $99,999 for women (78 | 11.3%).
| Income | Male | Female |
| $2,499 or less | 54 (7.0%) | 33 (4.8%) |
| $2,500 to $4,999 | 28 (3.6%) | 32 (4.6%) |
| $5,000 to $7,499 | 13 (1.7%) | 22 (3.2%) |
| $7,500 to $9,999 | 5 (0.6%) | 6 (0.9%) |
| $10,000 to $12,499 | 31 (4.0%) | 20 (2.9%) |
| $12,500 to $14,999 | 40 (5.2%) | 53 (7.7%) |
| $15,000 to $17,499 | 0 (0.0%) | 0 (0.0%) |
| $17,500 to $19,999 | 0 (0.0%) | 30 (4.3%) |
| $20,000 to $22,499 | 25 (3.2%) | 0 (0.0%) |
| $22,500 to $24,999 | 27 (3.5%) | 16 (2.3%) |
| $25,000 to $29,999 | 29 (3.7%) | 58 (8.4%) |
| $30,000 to $34,999 | 8 (1.0%) | 27 (3.9%) |
| $35,000 to $39,999 | 51 (6.6%) | 52 (7.5%) |
| $40,000 to $44,999 | 96 (12.4%) | 65 (9.4%) |
| $45,000 to $49,999 | 16 (2.1%) | 39 (5.7%) |
| $50,000 to $54,999 | 62 (8.0%) | 0 (0.0%) |
| $55,000 to $64,999 | 20 (2.6%) | 59 (8.6%) |
| $65,000 to $74,999 | 31 (4.0%) | 60 (8.7%) |
| $75,000 to $99,999 | 141 (18.2%) | 78 (11.3%) |
| $100,000+ | 96 (12.4%) | 39 (5.7%) |
| Total | 773 (100.0%) | 689 (100.0%) |
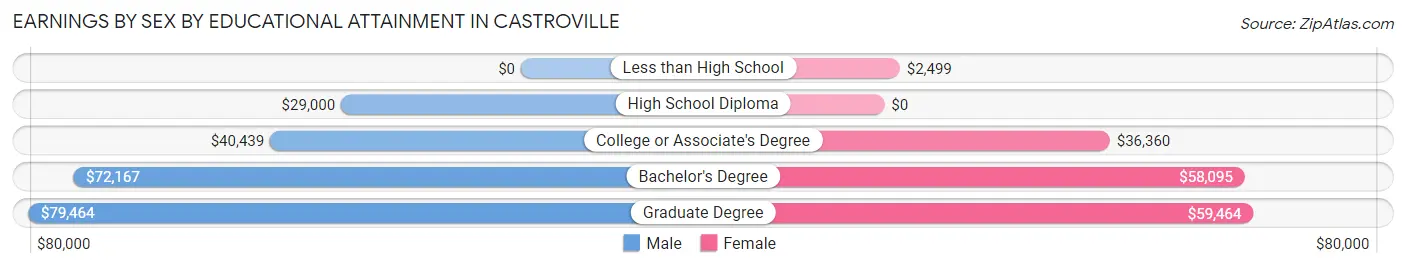
Earnings by Sex by Educational Attainment in Castroville
Average earnings in Castroville are $42,477 for men and $43,629 for women, a difference of 2.6%. Men with an educational attainment of graduate degree enjoy the highest average annual earnings of $79,464, while those with high school diploma education earn the least with $29,000. Women with an educational attainment of graduate degree earn the most with the average annual earnings of $59,464, while those with less than high school education have the smallest earnings of $2,499.
| Educational Attainment | Male Income | Female Income |
| Less than High School | - | - |
| High School Diploma | $29,000 | $0 |
| College or Associate's Degree | $40,439 | $36,360 |
| Bachelor's Degree | $72,167 | $58,095 |
| Graduate Degree | $79,464 | $59,464 |
| Total | $42,477 | $43,629 |
Family Income in Castroville
Family Income Brackets in Castroville
According to the Castroville family income data, there are 232 families falling into the $100,000 to $149,999 income range, which is the most common income bracket and makes up 25.6% of all families. Conversely, the $200,000+ income bracket is the least frequent group with only 28 families (3.1%) belonging to this category.
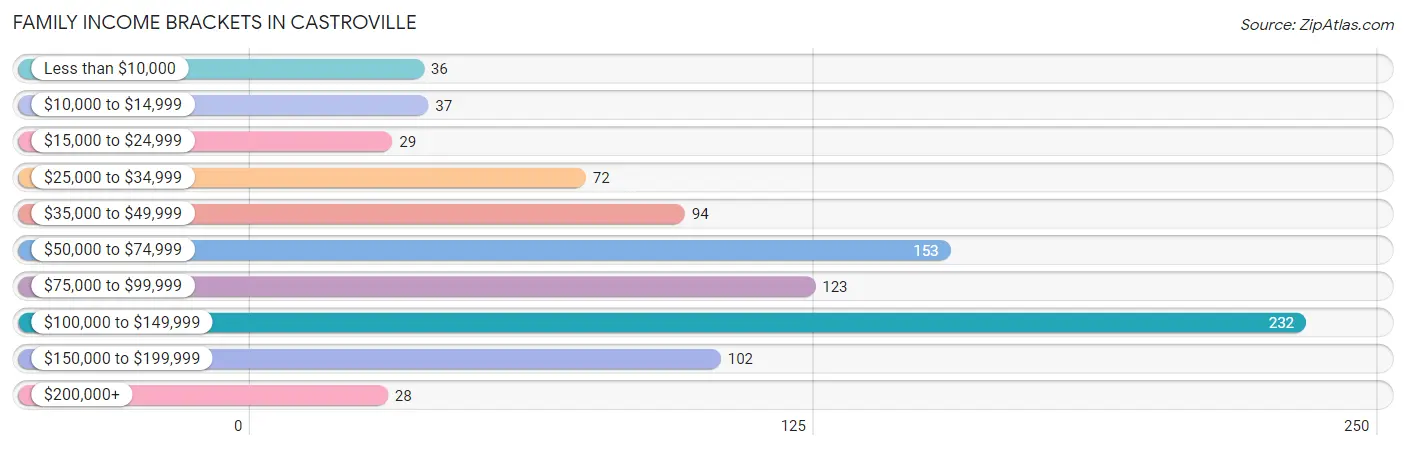
| Income Bracket | # Families | % Families |
| Less than $10,000 | 36 | 4.0% |
| $10,000 to $14,999 | 37 | 4.1% |
| $15,000 to $24,999 | 29 | 3.2% |
| $25,000 to $34,999 | 72 | 7.9% |
| $35,000 to $49,999 | 94 | 10.4% |
| $50,000 to $74,999 | 153 | 16.9% |
| $75,000 to $99,999 | 123 | 13.6% |
| $100,000 to $149,999 | 232 | 25.6% |
| $150,000 to $199,999 | 102 | 11.3% |
| $200,000+ | 28 | 3.1% |
Family Income by Famaliy Size in Castroville
4-person families (123 | 13.6%) account for the highest median family income in Castroville with $139,844 per family, while 2-person families (532 | 58.7%) have the highest median income of $36,433 per family member.
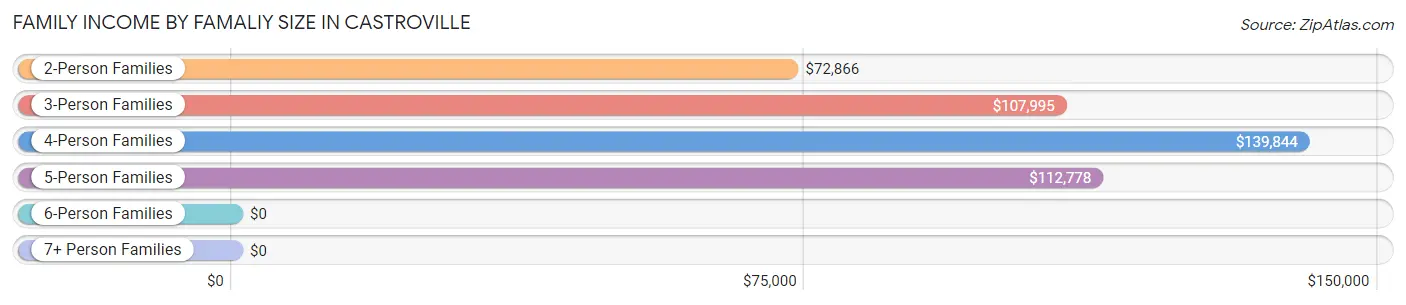
| Income Bracket | # Families | Median Income |
| 2-Person Families | 532 (58.7%) | $72,866 |
| 3-Person Families | 185 (20.4%) | $107,995 |
| 4-Person Families | 123 (13.6%) | $139,844 |
| 5-Person Families | 44 (4.9%) | $112,778 |
| 6-Person Families | 12 (1.3%) | $0 |
| 7+ Person Families | 10 (1.1%) | $0 |
| Total | 906 (100.0%) | $79,224 |
Family Income by Number of Earners in Castroville
The median family income in Castroville is $79,224, with families comprising 3+ earners (52) having the highest median family income of $185,403, while families with no earners (188) have the lowest median family income of $34,079, accounting for 5.7% and 20.7% of families, respectively.
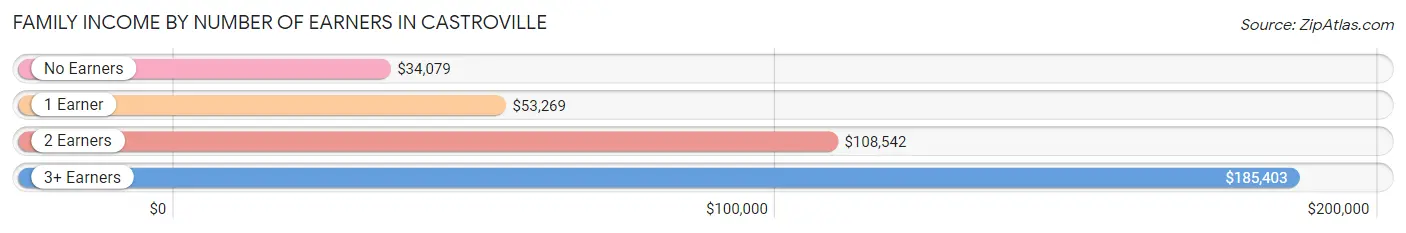
| Number of Earners | # Families | Median Income |
| No Earners | 188 (20.7%) | $34,079 |
| 1 Earner | 228 (25.2%) | $53,269 |
| 2 Earners | 438 (48.3%) | $108,542 |
| 3+ Earners | 52 (5.7%) | $185,403 |
| Total | 906 (100.0%) | $79,224 |
Household Income in Castroville
Household Income Brackets in Castroville
With 250 households falling in the category, the $100,000 to $149,999 income range is the most frequent in Castroville, accounting for 22.2% of all households. In contrast, only 24 households (2.1%) fall into the $10,000 to $14,999 income bracket, making it the least populous group.
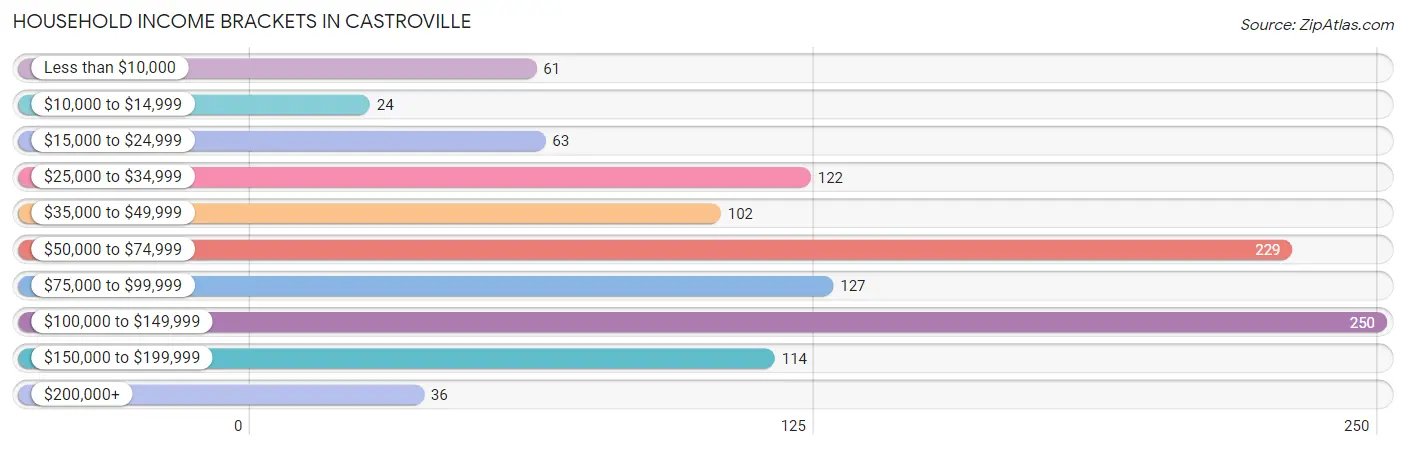
| Income Bracket | # Households | % Households |
| Less than $10,000 | 61 | 5.4% |
| $10,000 to $14,999 | 24 | 2.1% |
| $15,000 to $24,999 | 63 | 5.6% |
| $25,000 to $34,999 | 122 | 10.8% |
| $35,000 to $49,999 | 102 | 9.0% |
| $50,000 to $74,999 | 229 | 20.3% |
| $75,000 to $99,999 | 127 | 11.3% |
| $100,000 to $149,999 | 250 | 22.2% |
| $150,000 to $199,999 | 114 | 10.1% |
| $200,000+ | 36 | 3.2% |
Household Income by Householder Age in Castroville
The median household income in Castroville is $72,805, with the highest median household income of $109,073 found in the 45 to 64 years age bracket for the primary householder. A total of 459 households (40.7%) fall into this category. Meanwhile, the 15 to 24 years age bracket for the primary householder has the lowest median household income of $0, with 54 households (4.8%) in this group.
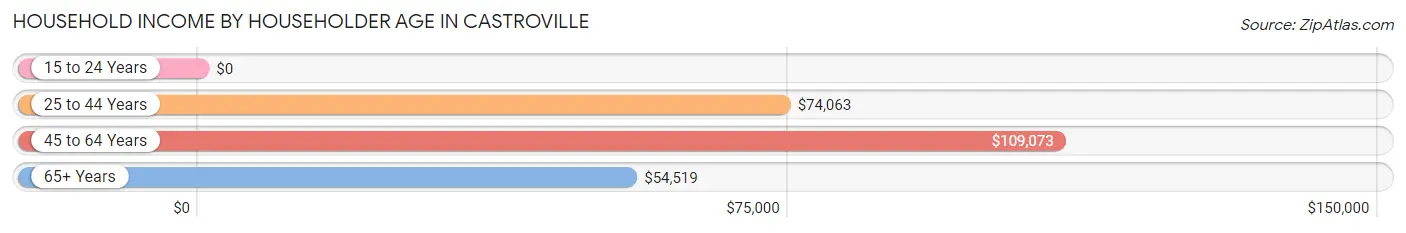
| Income Bracket | # Households | Median Income |
| 15 to 24 Years | 54 (4.8%) | $0 |
| 25 to 44 Years | 252 (22.3%) | $74,063 |
| 45 to 64 Years | 459 (40.7%) | $109,073 |
| 65+ Years | 363 (32.2%) | $54,519 |
| Total | 1,128 (100.0%) | $72,805 |
Poverty in Castroville
Income Below Poverty by Sex and Age in Castroville
With 10.1% poverty level for males and 13.4% for females among the residents of Castroville, 5 year old males and 12 to 14 year old females are the most vulnerable to poverty, with 21 males (100.0%) and 23 females (36.5%) in their respective age groups living below the poverty level.
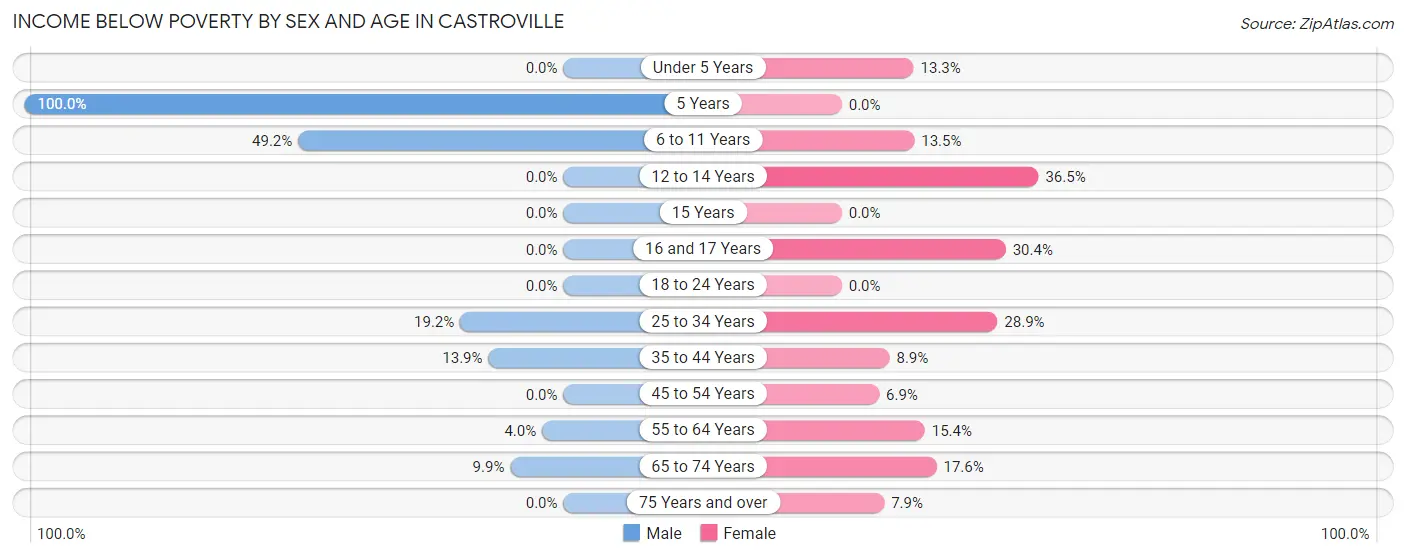
| Age Bracket | Male | Female |
| Under 5 Years | 0 (0.0%) | 18 (13.3%) |
| 5 Years | 21 (100.0%) | 0 (0.0%) |
| 6 to 11 Years | 32 (49.2%) | 14 (13.5%) |
| 12 to 14 Years | 0 (0.0%) | 23 (36.5%) |
| 15 Years | 0 (0.0%) | 0 (0.0%) |
| 16 and 17 Years | 0 (0.0%) | 7 (30.4%) |
| 18 to 24 Years | 0 (0.0%) | 0 (0.0%) |
| 25 to 34 Years | 41 (19.2%) | 54 (28.9%) |
| 35 to 44 Years | 11 (13.9%) | 7 (8.9%) |
| 45 to 54 Years | 0 (0.0%) | 19 (6.9%) |
| 55 to 64 Years | 9 (4.0%) | 43 (15.4%) |
| 65 to 74 Years | 14 (9.9%) | 16 (17.6%) |
| 75 Years and over | 0 (0.0%) | 17 (7.9%) |
| Total | 128 (10.1%) | 218 (13.4%) |
Income Above Poverty by Sex and Age in Castroville
According to the poverty statistics in Castroville, males aged under 5 years and females aged 5 years are the age groups that are most secure financially, with 100.0% of males and 100.0% of females in these age groups living above the poverty line.
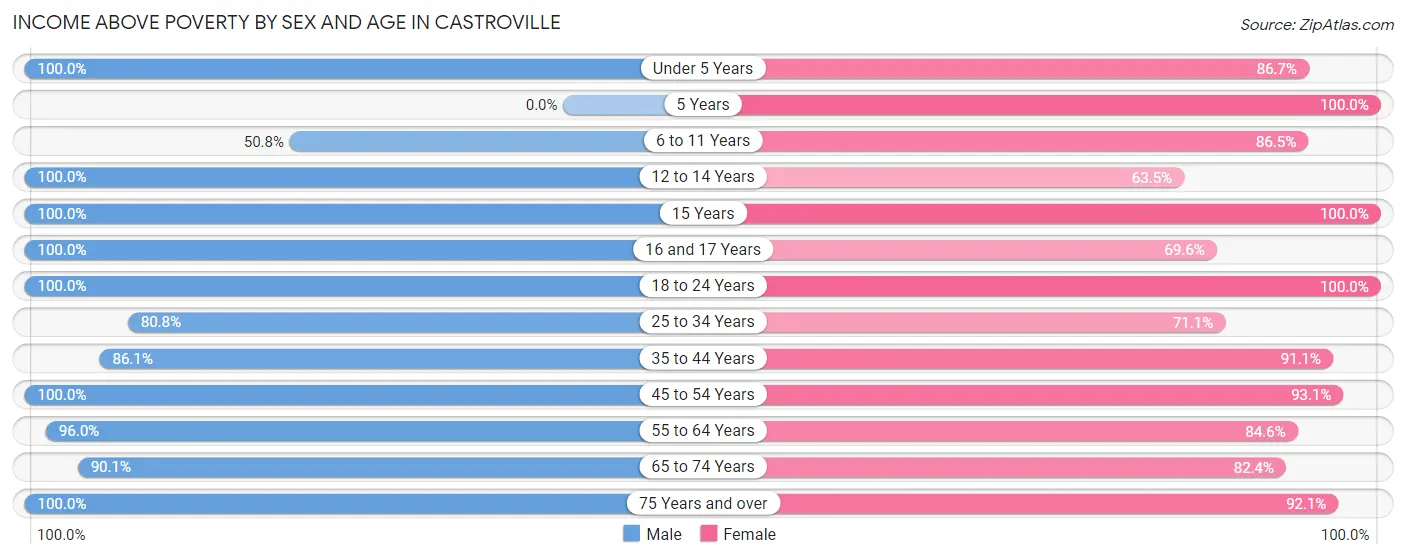
| Age Bracket | Male | Female |
| Under 5 Years | 122 (100.0%) | 117 (86.7%) |
| 5 Years | 0 (0.0%) | 40 (100.0%) |
| 6 to 11 Years | 33 (50.8%) | 90 (86.5%) |
| 12 to 14 Years | 28 (100.0%) | 40 (63.5%) |
| 15 Years | 11 (100.0%) | 8 (100.0%) |
| 16 and 17 Years | 48 (100.0%) | 16 (69.6%) |
| 18 to 24 Years | 114 (100.0%) | 123 (100.0%) |
| 25 to 34 Years | 173 (80.8%) | 133 (71.1%) |
| 35 to 44 Years | 68 (86.1%) | 72 (91.1%) |
| 45 to 54 Years | 128 (100.0%) | 255 (93.1%) |
| 55 to 64 Years | 218 (96.0%) | 236 (84.6%) |
| 65 to 74 Years | 128 (90.1%) | 75 (82.4%) |
| 75 Years and over | 75 (100.0%) | 199 (92.1%) |
| Total | 1,146 (89.9%) | 1,404 (86.6%) |
Income Below Poverty Among Married-Couple Families in Castroville
The poverty statistics for married-couple families in Castroville show that 5.5% or 36 of the total 659 families live below the poverty line. Families with 1 or 2 children have the highest poverty rate of 13.2%, comprising of 28 families. On the other hand, families with 3 or 4 children have the lowest poverty rate of 0.0%, which includes 0 families.
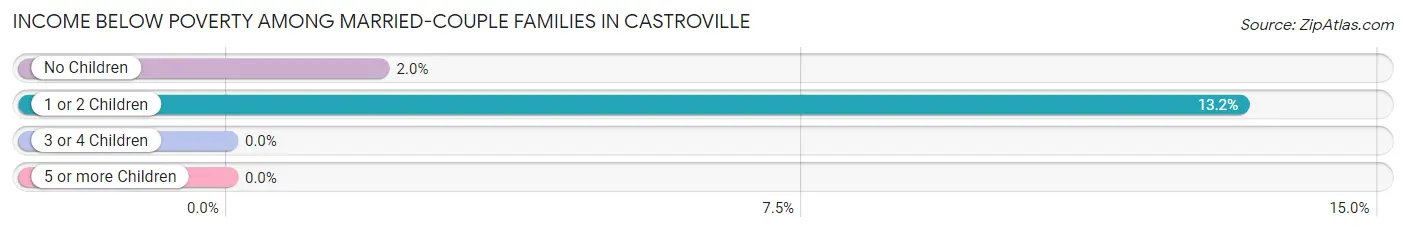
| Children | Above Poverty | Below Poverty |
| No Children | 396 (98.0%) | 8 (2.0%) |
| 1 or 2 Children | 184 (86.8%) | 28 (13.2%) |
| 3 or 4 Children | 43 (100.0%) | 0 (0.0%) |
| 5 or more Children | 0 (0.0%) | 0 (0.0%) |
| Total | 623 (94.5%) | 36 (5.5%) |
Income Below Poverty Among Single-Parent Households in Castroville
According to the poverty data in Castroville, 29.5% or 13 single-father households and 26.1% or 53 single-mother households are living below the poverty line. Among single-father households, those with 1 or 2 children have the highest poverty rate, with 13 households (46.4%) experiencing poverty. Likewise, among single-mother households, those with 3 or 4 children have the highest poverty rate, with 13 households (54.2%) falling below the poverty line.
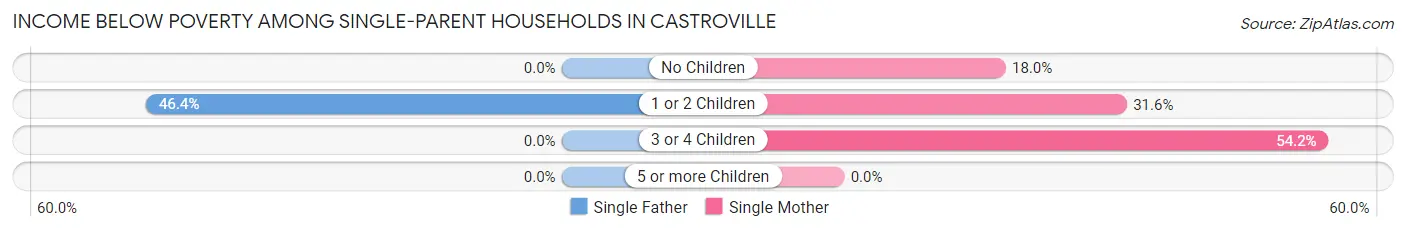
| Children | Single Father | Single Mother |
| No Children | 0 (0.0%) | 22 (18.0%) |
| 1 or 2 Children | 13 (46.4%) | 18 (31.6%) |
| 3 or 4 Children | 0 (0.0%) | 13 (54.2%) |
| 5 or more Children | 0 (0.0%) | 0 (0.0%) |
| Total | 13 (29.5%) | 53 (26.1%) |
Income Below Poverty Among Married-Couple vs Single-Parent Households in Castroville
The poverty data for Castroville shows that 36 of the married-couple family households (5.5%) and 66 of the single-parent households (26.7%) are living below the poverty level. Within the married-couple family households, those with 1 or 2 children have the highest poverty rate, with 28 households (13.2%) falling below the poverty line. Among the single-parent households, those with 3 or 4 children have the highest poverty rate, with 13 household (38.2%) living below poverty.
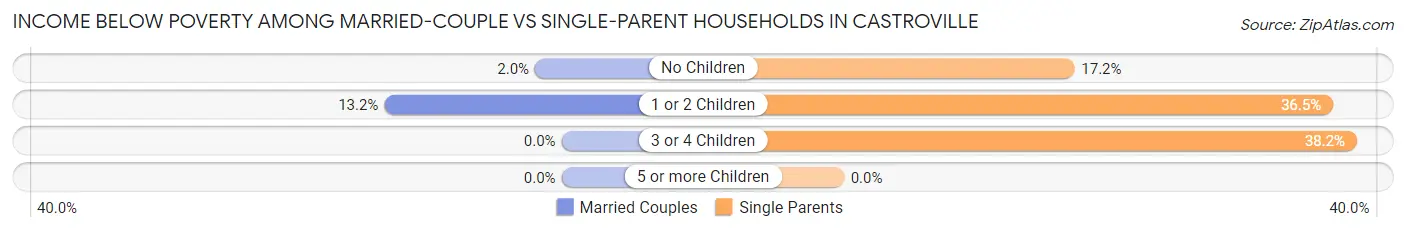
| Children | Married-Couple Families | Single-Parent Households |
| No Children | 8 (2.0%) | 22 (17.2%) |
| 1 or 2 Children | 28 (13.2%) | 31 (36.5%) |
| 3 or 4 Children | 0 (0.0%) | 13 (38.2%) |
| 5 or more Children | 0 (0.0%) | 0 (0.0%) |
| Total | 36 (5.5%) | 66 (26.7%) |
Race in Castroville
The most populous races in Castroville are White / Caucasian (2,166 | 72.3%), Hispanic or Latino (1,460 | 48.8%), and Two or more Races (589 | 19.7%).
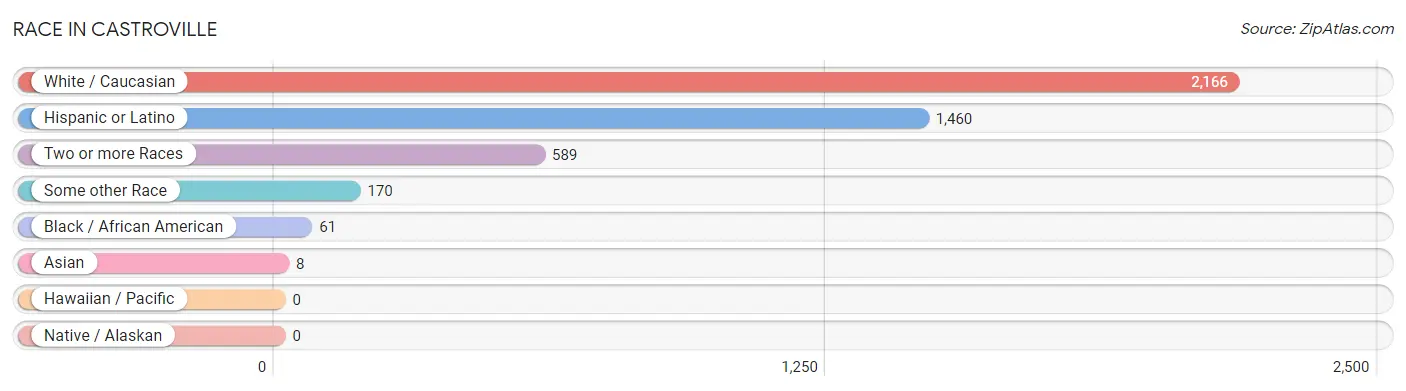
| Race | # Population | % Population |
| Asian | 8 | 0.3% |
| Black / African American | 61 | 2.0% |
| Hawaiian / Pacific | 0 | 0.0% |
| Hispanic or Latino | 1,460 | 48.8% |
| Native / Alaskan | 0 | 0.0% |
| White / Caucasian | 2,166 | 72.3% |
| Two or more Races | 589 | 19.7% |
| Some other Race | 170 | 5.7% |
| Total | 2,994 | 100.0% |
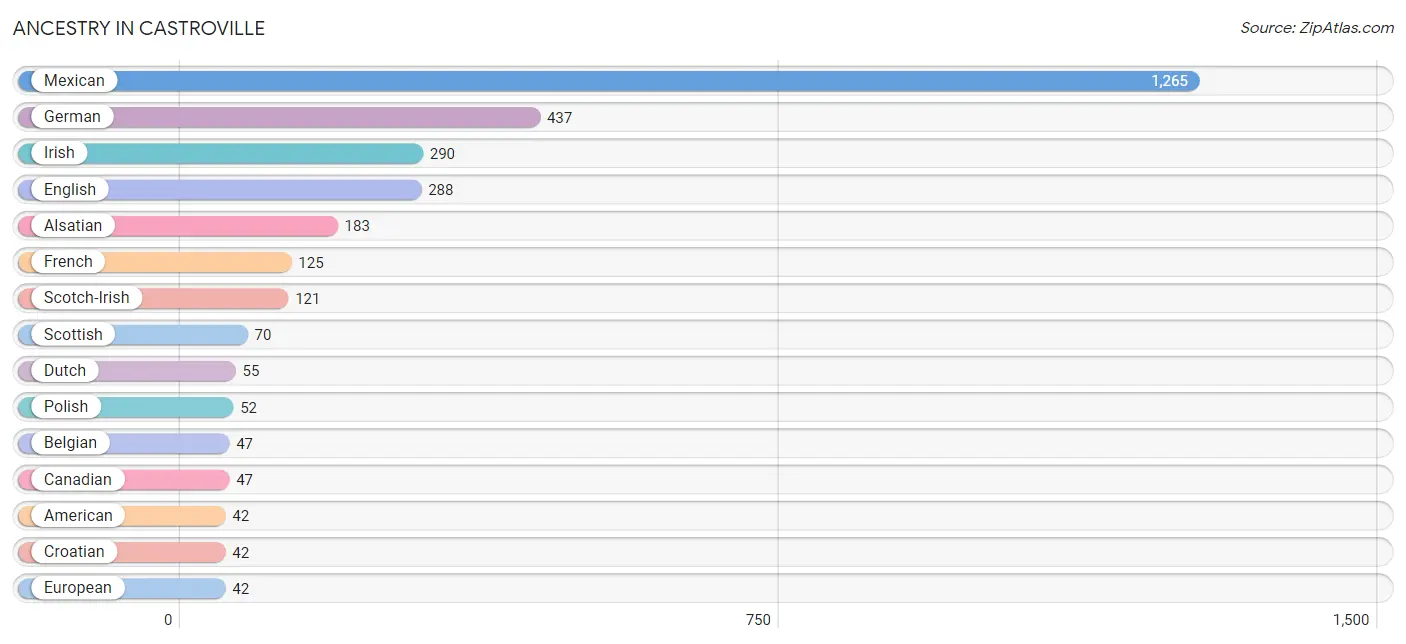
Ancestry in Castroville
The most populous ancestries reported in Castroville are Mexican (1,265 | 42.2%), German (437 | 14.6%), Irish (290 | 9.7%), English (288 | 9.6%), and Alsatian (183 | 6.1%), together accounting for 82.3% of all Castroville residents.
| Ancestry | # Population | % Population |
| Alsatian | 183 | 6.1% |
| American | 42 | 1.4% |
| Arab | 4 | 0.1% |
| Basque | 3 | 0.1% |
| Belgian | 47 | 1.6% |
| Bhutanese | 8 | 0.3% |
| British | 9 | 0.3% |
| Canadian | 47 | 1.6% |
| Celtic | 8 | 0.3% |
| Central American | 25 | 0.8% |
| Cherokee | 18 | 0.6% |
| Chickasaw | 6 | 0.2% |
| Chippewa | 3 | 0.1% |
| Colombian | 24 | 0.8% |
| Croatian | 42 | 1.4% |
| Cuban | 28 | 0.9% |
| Dutch | 55 | 1.8% |
| English | 288 | 9.6% |
| European | 42 | 1.4% |
| French | 125 | 4.2% |
| French Canadian | 9 | 0.3% |
| German | 437 | 14.6% |
| Honduran | 3 | 0.1% |
| Indian (Asian) | 20 | 0.7% |
| Irish | 290 | 9.7% |
| Italian | 25 | 0.8% |
| Korean | 20 | 0.7% |
| Lebanese | 4 | 0.1% |
| Mexican | 1,265 | 42.2% |
| Native Hawaiian | 20 | 0.7% |
| Nigerian | 4 | 0.1% |
| Northern European | 3 | 0.1% |
| Norwegian | 6 | 0.2% |
| Panamanian | 22 | 0.7% |
| Polish | 52 | 1.7% |
| Portuguese | 21 | 0.7% |
| Puerto Rican | 34 | 1.1% |
| Russian | 5 | 0.2% |
| Scotch-Irish | 121 | 4.0% |
| Scottish | 70 | 2.3% |
| Slovene | 3 | 0.1% |
| South American | 24 | 0.8% |
| Sri Lankan | 20 | 0.7% |
| Subsaharan African | 4 | 0.1% |
| Swedish | 32 | 1.1% |
| Swiss | 7 | 0.2% |
| Thai | 20 | 0.7% |
| Ukrainian | 7 | 0.2% |
| Welsh | 15 | 0.5% | View All 49 Rows |
Immigrants in Castroville
The most numerous immigrant groups reported in Castroville came from Central America (25 | 0.8%), Latin America (25 | 0.8%), Mexico (25 | 0.8%), Asia (8 | 0.3%), and Eastern Asia (8 | 0.3%), together accounting for 3.1% of all Castroville residents.
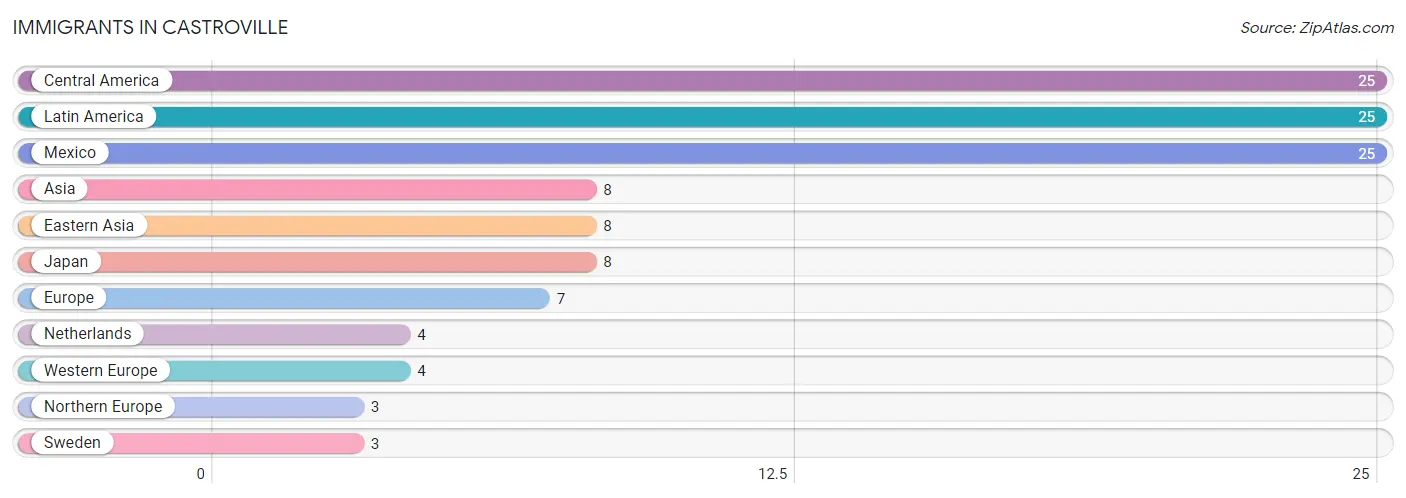
| Immigration Origin | # Population | % Population |
| Asia | 8 | 0.3% |
| Central America | 25 | 0.8% |
| Eastern Asia | 8 | 0.3% |
| Europe | 7 | 0.2% |
| Japan | 8 | 0.3% |
| Latin America | 25 | 0.8% |
| Mexico | 25 | 0.8% |
| Netherlands | 4 | 0.1% |
| Northern Europe | 3 | 0.1% |
| Sweden | 3 | 0.1% |
| Western Europe | 4 | 0.1% | View All 11 Rows |
Sex and Age in Castroville
Sex and Age in Castroville
The most populous age groups in Castroville are 55 to 59 Years (143 | 10.8%) for men and 50 to 54 Years (195 | 11.6%) for women.
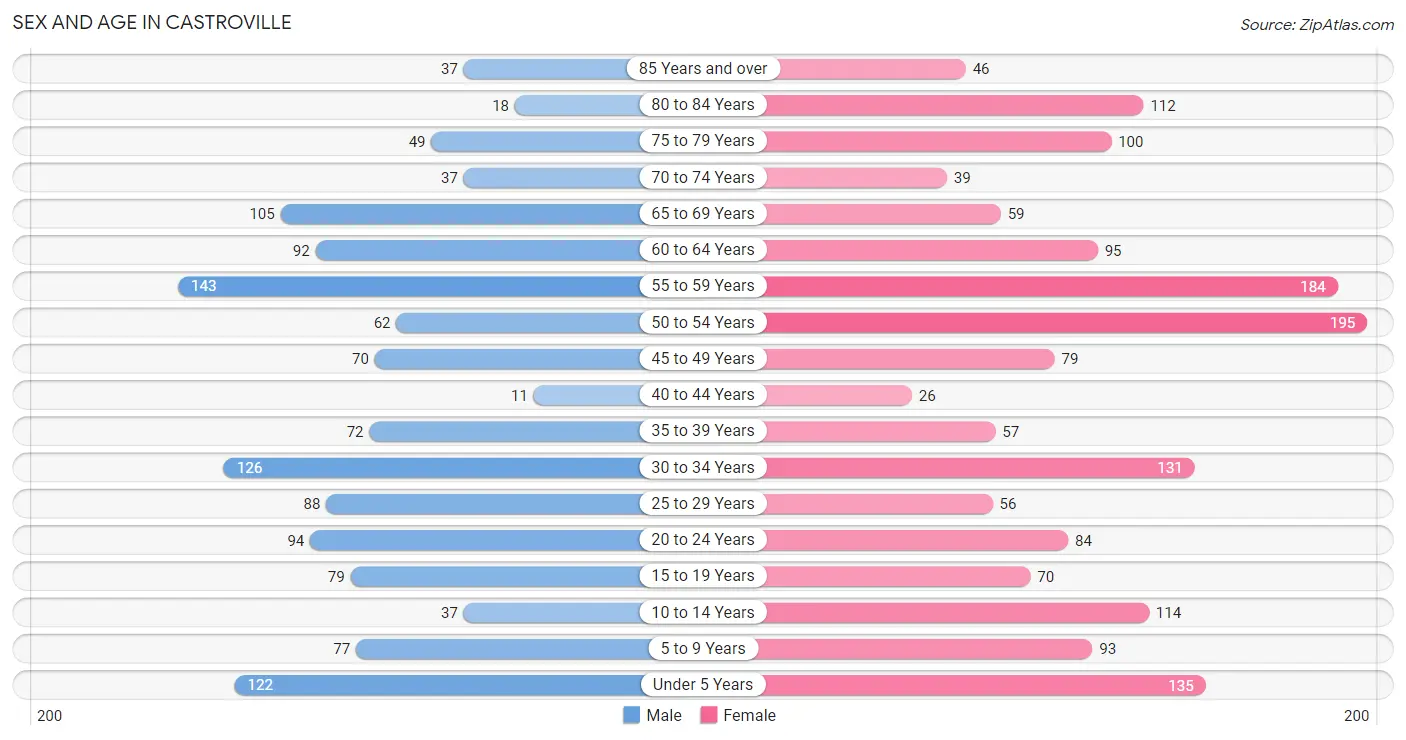
| Age Bracket | Male | Female |
| Under 5 Years | 122 (9.2%) | 135 (8.1%) |
| 5 to 9 Years | 77 (5.8%) | 93 (5.6%) |
| 10 to 14 Years | 37 (2.8%) | 114 (6.8%) |
| 15 to 19 Years | 79 (6.0%) | 70 (4.2%) |
| 20 to 24 Years | 94 (7.1%) | 84 (5.0%) |
| 25 to 29 Years | 88 (6.7%) | 56 (3.3%) |
| 30 to 34 Years | 126 (9.6%) | 131 (7.8%) |
| 35 to 39 Years | 72 (5.5%) | 57 (3.4%) |
| 40 to 44 Years | 11 (0.8%) | 26 (1.5%) |
| 45 to 49 Years | 70 (5.3%) | 79 (4.7%) |
| 50 to 54 Years | 62 (4.7%) | 195 (11.6%) |
| 55 to 59 Years | 143 (10.8%) | 184 (11.0%) |
| 60 to 64 Years | 92 (7.0%) | 95 (5.7%) |
| 65 to 69 Years | 105 (8.0%) | 59 (3.5%) |
| 70 to 74 Years | 37 (2.8%) | 39 (2.3%) |
| 75 to 79 Years | 49 (3.7%) | 100 (6.0%) |
| 80 to 84 Years | 18 (1.4%) | 112 (6.7%) |
| 85 Years and over | 37 (2.8%) | 46 (2.8%) |
| Total | 1,319 (100.0%) | 1,675 (100.0%) |
Families and Households in Castroville
Median Family Size in Castroville
The median family size in Castroville is 2.87 persons per family, with single male/father families (44 | 4.9%) accounting for the largest median family size of 5.2 persons per family. On the other hand, single female/mother families (203 | 22.4%) represent the smallest median family size with 2.63 persons per family.
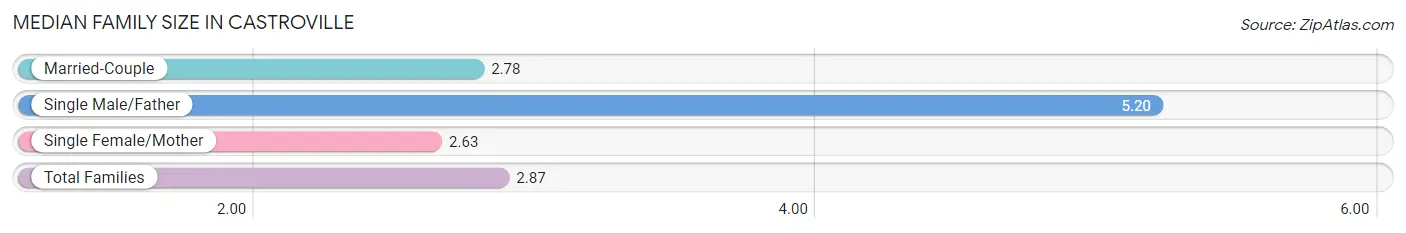
| Family Type | # Families | Family Size |
| Married-Couple | 659 (72.7%) | 2.78 |
| Single Male/Father | 44 (4.9%) | 5.20 |
| Single Female/Mother | 203 (22.4%) | 2.63 |
| Total Families | 906 (100.0%) | 2.87 |
Median Household Size in Castroville
The median household size in Castroville is 2.56 persons per household, with single male/father households (44 | 3.9%) accounting for the largest median household size of 5.8 persons per household. non-family households (222 | 19.7%) represent the smallest median household size with 1.09 persons per household.
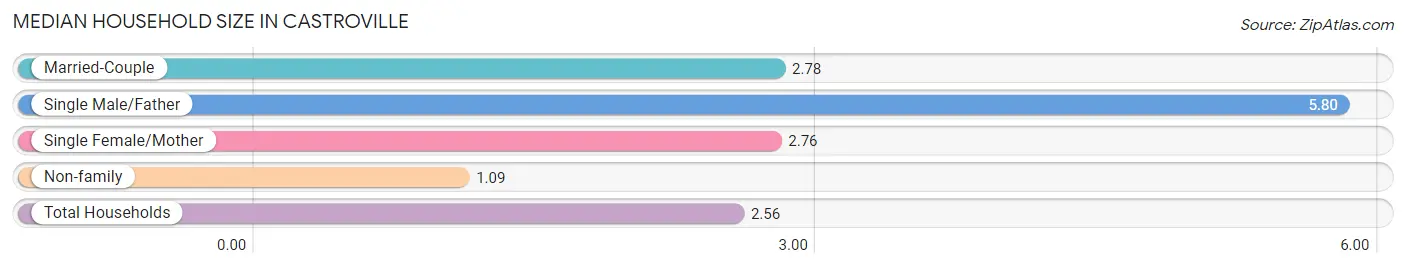
| Household Type | # Households | Household Size |
| Married-Couple | 659 (58.4%) | 2.78 |
| Single Male/Father | 44 (3.9%) | 5.80 |
| Single Female/Mother | 203 (18.0%) | 2.76 |
| Non-family | 222 (19.7%) | 1.09 |
| Total Households | 1,128 (100.0%) | 2.56 |
Household Size by Marriage Status in Castroville
Out of a total of 1,128 households in Castroville, 906 (80.3%) are family households, while 222 (19.7%) are nonfamily households. The most numerous type of family households are 2-person households, comprising 526, and the most common type of nonfamily households are 1-person households, comprising 209.
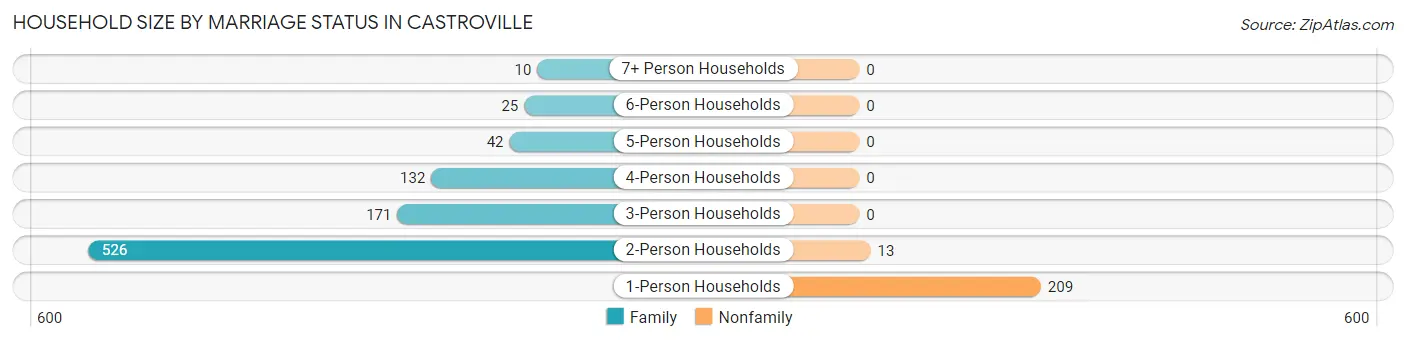
| Household Size | Family Households | Nonfamily Households |
| 1-Person Households | - | 209 (18.5%) |
| 2-Person Households | 526 (46.6%) | 13 (1.1%) |
| 3-Person Households | 171 (15.2%) | 0 (0.0%) |
| 4-Person Households | 132 (11.7%) | 0 (0.0%) |
| 5-Person Households | 42 (3.7%) | 0 (0.0%) |
| 6-Person Households | 25 (2.2%) | 0 (0.0%) |
| 7+ Person Households | 10 (0.9%) | 0 (0.0%) |
| Total | 906 (80.3%) | 222 (19.7%) |
Female Fertility in Castroville
Fertility by Age in Castroville
Average fertility rate in Castroville is 114.0 births per 1,000 women. Women in the age bracket of 35 to 50 years have the highest fertility rate with 151.0 births per 1,000 women. Women in the age bracket of 20 to 34 years acount for 53.3% of all women with births.
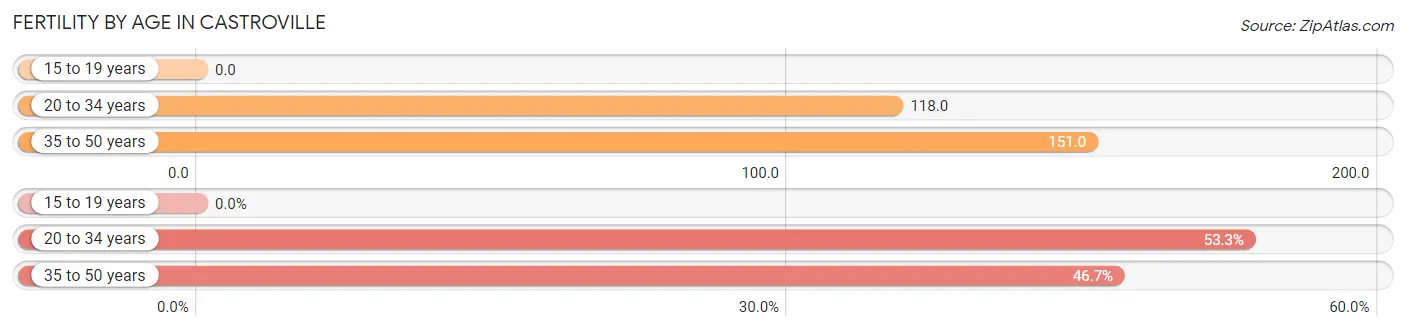
| Age Bracket | Women with Births | Births / 1,000 Women |
| 15 to 19 years | 0 (0.0%) | 0.0 |
| 20 to 34 years | 32 (53.3%) | 118.0 |
| 35 to 50 years | 28 (46.7%) | 151.0 |
| Total | 60 (100.0%) | 114.0 |
Fertility by Age by Marriage Status in Castroville
88.3% of women with births (60) in Castroville are married. The highest percentage of unmarried women with births falls into 35 to 50 years age bracket with 25.0% of them unmarried at the time of birth, while the lowest percentage of unmarried women with births belong to 20 to 34 years age bracket with 0.0% of them unmarried.
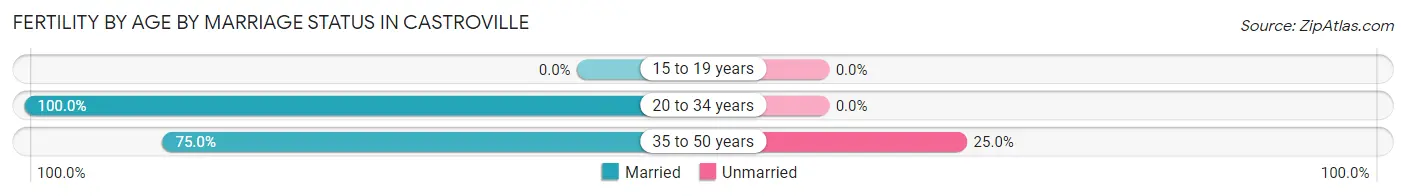
| Age Bracket | Married | Unmarried |
| 15 to 19 years | 0 (0.0%) | 0 (0.0%) |
| 20 to 34 years | 32 (100.0%) | 0 (0.0%) |
| 35 to 50 years | 21 (75.0%) | 7 (25.0%) |
| Total | 53 (88.3%) | 7 (11.7%) |
Fertility by Education in Castroville
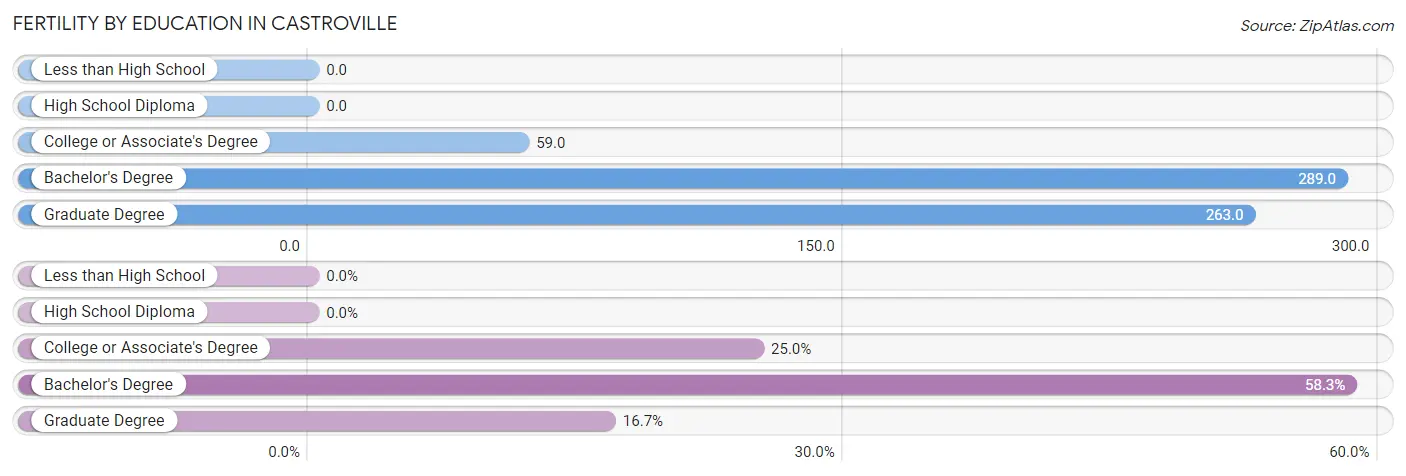
| Educational Attainment | Women with Births | Births / 1,000 Women |
| Less than High School | 0 (0.0%) | 0.0 |
| High School Diploma | 0 (0.0%) | 0.0 |
| College or Associate's Degree | 15 (25.0%) | 59.0 |
| Bachelor's Degree | 35 (58.3%) | 289.0 |
| Graduate Degree | 10 (16.7%) | 263.0 |
| Total | 60 (100.0%) | 114.0 |
Fertility by Education by Marriage Status in Castroville
11.7% of women with births in Castroville are unmarried. Women with the educational attainment of college or associate's degree are most likely to be married with 100.0% of them married at childbirth, while women with the educational attainment of bachelor's degree are least likely to be married with 20.0% of them unmarried at childbirth.
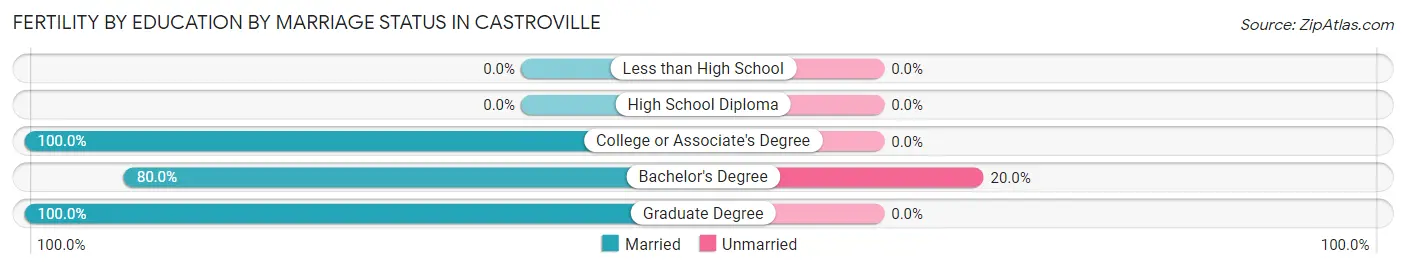
| Educational Attainment | Married | Unmarried |
| Less than High School | 0 (0.0%) | 0 (0.0%) |
| High School Diploma | 0 (0.0%) | 0 (0.0%) |
| College or Associate's Degree | 15 (100.0%) | 0 (0.0%) |
| Bachelor's Degree | 28 (80.0%) | 7 (20.0%) |
| Graduate Degree | 10 (100.0%) | 0 (0.0%) |
| Total | 53 (88.3%) | 7 (11.7%) |
Employment Characteristics in Castroville
Employment by Class of Employer in Castroville
Among the 1,297 employed individuals in Castroville, private company employees (813 | 62.7%), local government employees (151 | 11.6%), and not-for-profit organizations (113 | 8.7%) make up the most common classes of employment.
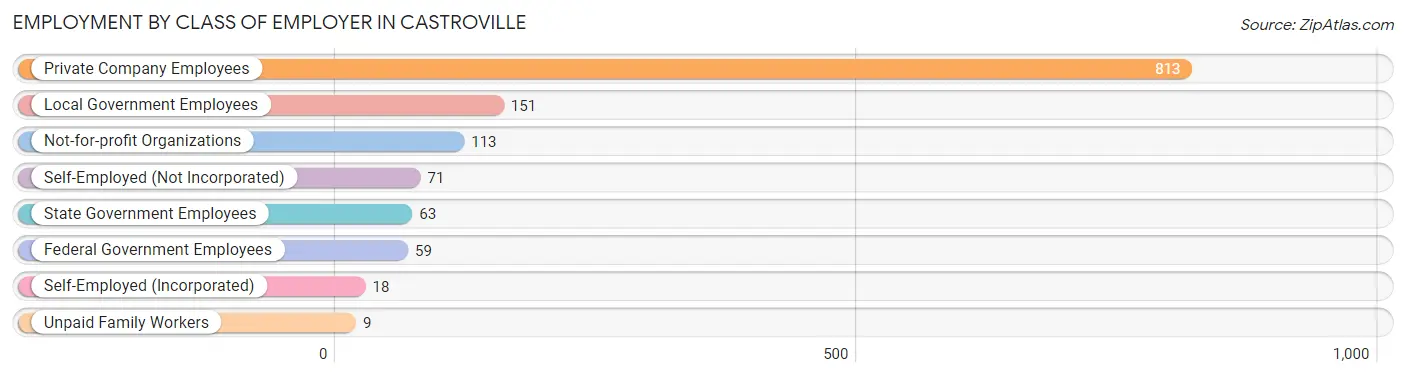
| Employer Class | # Employees | % Employees |
| Private Company Employees | 813 | 62.7% |
| Self-Employed (Incorporated) | 18 | 1.4% |
| Self-Employed (Not Incorporated) | 71 | 5.5% |
| Not-for-profit Organizations | 113 | 8.7% |
| Local Government Employees | 151 | 11.6% |
| State Government Employees | 63 | 4.9% |
| Federal Government Employees | 59 | 4.5% |
| Unpaid Family Workers | 9 | 0.7% |
| Total | 1,297 | 100.0% |
Employment Status by Age in Castroville
According to the labor force statistics for Castroville, out of the total population over 16 years of age (2,397), 57.6% or 1,381 individuals are in the labor force, with 2.4% or 33 of them unemployed. The age group with the highest labor force participation rate is 35 to 44 years, with 91.0% or 151 individuals in the labor force. Within the labor force, the 30 to 34 years age range has the highest percentage of unemployed individuals, with 11.6% or 26 of them being unemployed.
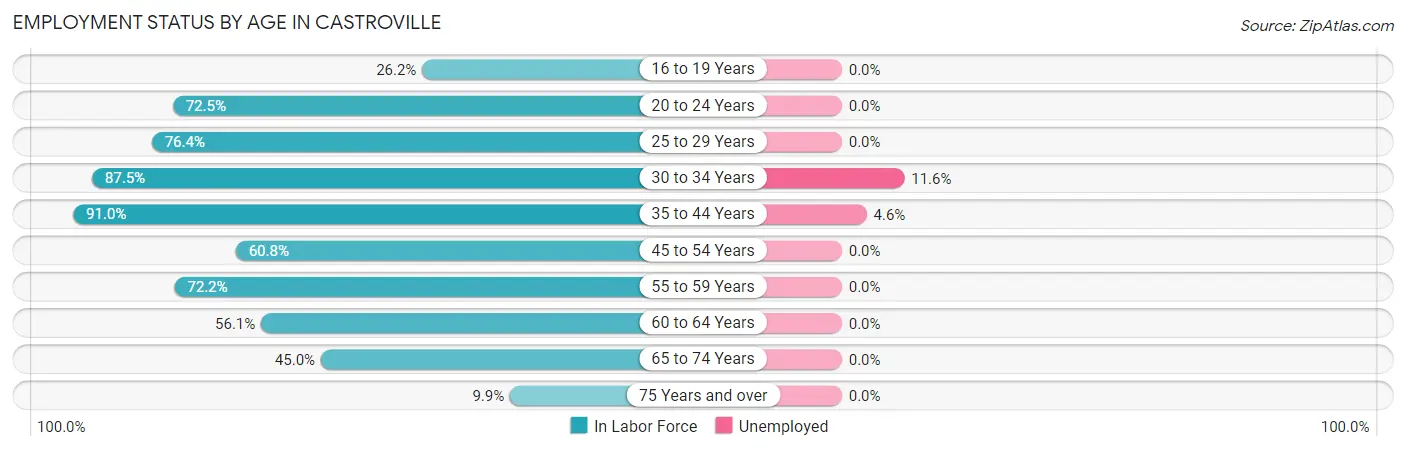
| Age Bracket | In Labor Force | Unemployed |
| 16 to 19 Years | 34 (26.2%) | 0 (0.0%) |
| 20 to 24 Years | 129 (72.5%) | 0 (0.0%) |
| 25 to 29 Years | 110 (76.4%) | 0 (0.0%) |
| 30 to 34 Years | 225 (87.5%) | 26 (11.6%) |
| 35 to 44 Years | 151 (91.0%) | 7 (4.6%) |
| 45 to 54 Years | 247 (60.8%) | 0 (0.0%) |
| 55 to 59 Years | 236 (72.2%) | 0 (0.0%) |
| 60 to 64 Years | 105 (56.1%) | 0 (0.0%) |
| 65 to 74 Years | 108 (45.0%) | 0 (0.0%) |
| 75 Years and over | 36 (9.9%) | 0 (0.0%) |
| Total | 1,381 (57.6%) | 33 (2.4%) |
Employment Status by Educational Attainment in Castroville
According to labor force statistics for Castroville, 72.2% of individuals (1,074) out of the total population between 25 and 64 years of age (1,487) are in the labor force, with 3.1% or 33 of them being unemployed. The group with the highest labor force participation rate are those with the educational attainment of bachelor's degree or higher, with 77.8% or 371 individuals in the labor force. Within the labor force, individuals with college / associate degree education have the highest percentage of unemployment, with 5.6% or 26 of them being unemployed.
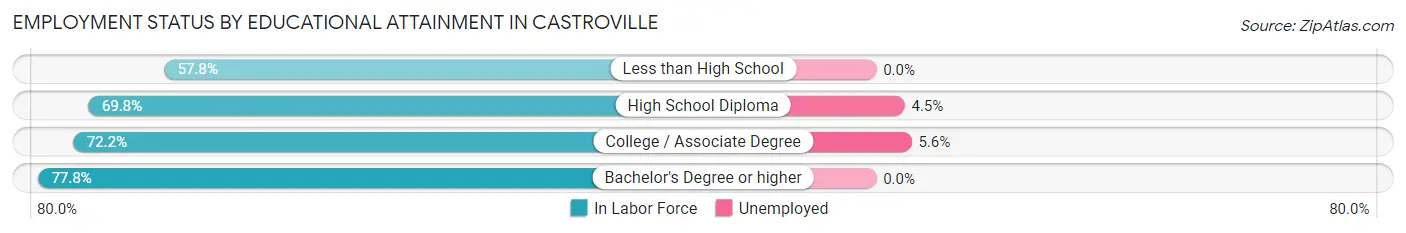
| Educational Attainment | In Labor Force | Unemployed |
| Less than High School | 85 (57.8%) | 0 (0.0%) |
| High School Diploma | 155 (69.8%) | 10 (4.5%) |
| College / Associate Degree | 463 (72.2%) | 36 (5.6%) |
| Bachelor's Degree or higher | 371 (77.8%) | 0 (0.0%) |
| Total | 1,074 (72.2%) | 46 (3.1%) |
Employment Occupations by Sex in Castroville
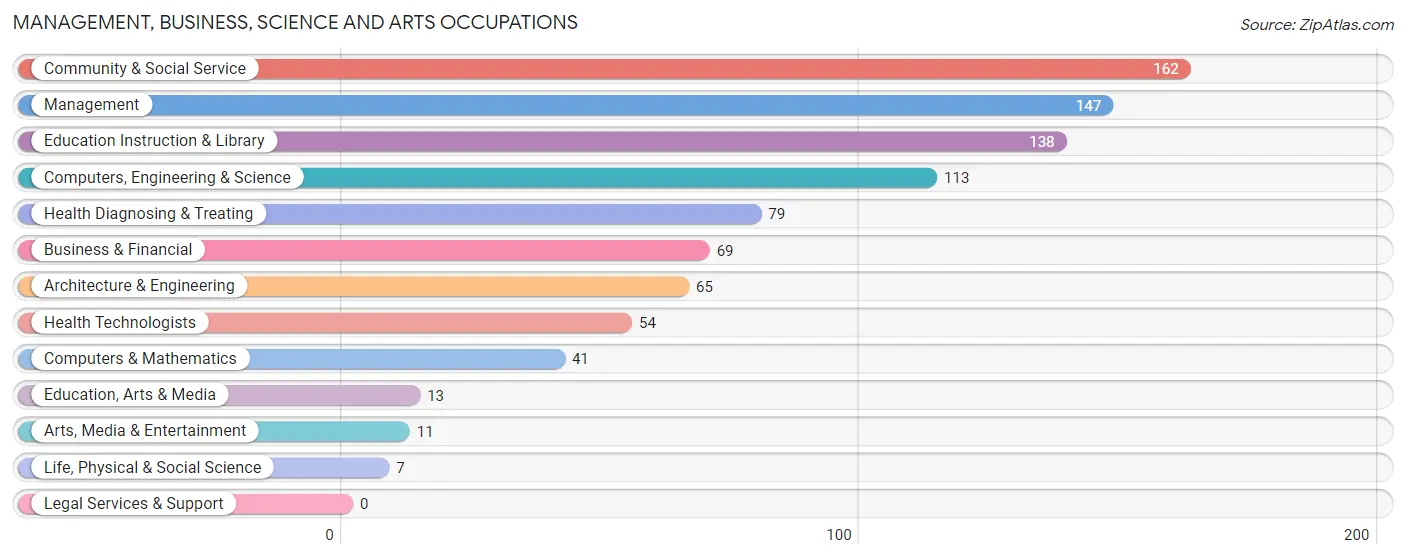
Management, Business, Science and Arts Occupations
The most common Management, Business, Science and Arts occupations in Castroville are Community & Social Service (162 | 12.1%), Management (147 | 11.0%), Education Instruction & Library (138 | 10.3%), Computers, Engineering & Science (113 | 8.4%), and Health Diagnosing & Treating (79 | 5.9%).
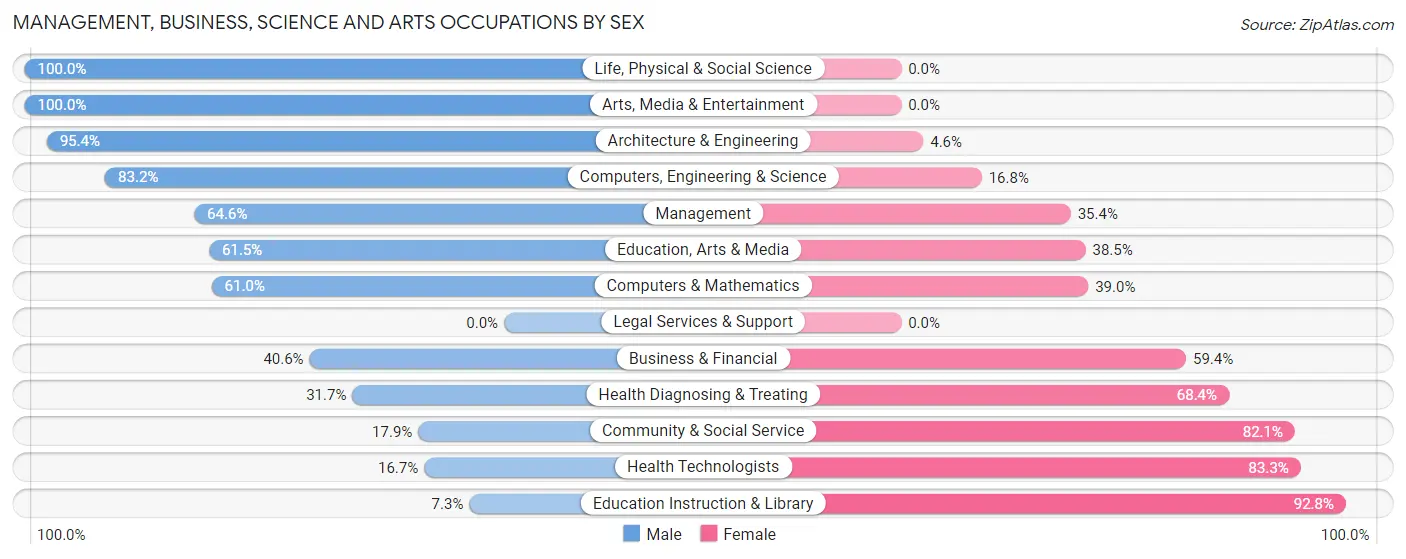
Management, Business, Science and Arts Occupations by Sex
Within the Management, Business, Science and Arts occupations in Castroville, the most male-oriented occupations are Life, Physical & Social Science (100.0%), Arts, Media & Entertainment (100.0%), and Architecture & Engineering (95.4%), while the most female-oriented occupations are Education Instruction & Library (92.7%), Health Technologists (83.3%), and Community & Social Service (82.1%).
| Occupation | Male | Female |
| Management | 95 (64.6%) | 52 (35.4%) |
| Business & Financial | 28 (40.6%) | 41 (59.4%) |
| Computers, Engineering & Science | 94 (83.2%) | 19 (16.8%) |
| Computers & Mathematics | 25 (61.0%) | 16 (39.0%) |
| Architecture & Engineering | 62 (95.4%) | 3 (4.6%) |
| Life, Physical & Social Science | 7 (100.0%) | 0 (0.0%) |
| Community & Social Service | 29 (17.9%) | 133 (82.1%) |
| Education, Arts & Media | 8 (61.5%) | 5 (38.5%) |
| Legal Services & Support | 0 (0.0%) | 0 (0.0%) |
| Education Instruction & Library | 10 (7.2%) | 128 (92.7%) |
| Arts, Media & Entertainment | 11 (100.0%) | 0 (0.0%) |
| Health Diagnosing & Treating | 25 (31.7%) | 54 (68.3%) |
| Health Technologists | 9 (16.7%) | 45 (83.3%) |
| Total (Category) | 271 (47.5%) | 299 (52.5%) |
| Total (Overall) | 708 (52.7%) | 635 (47.3%) |
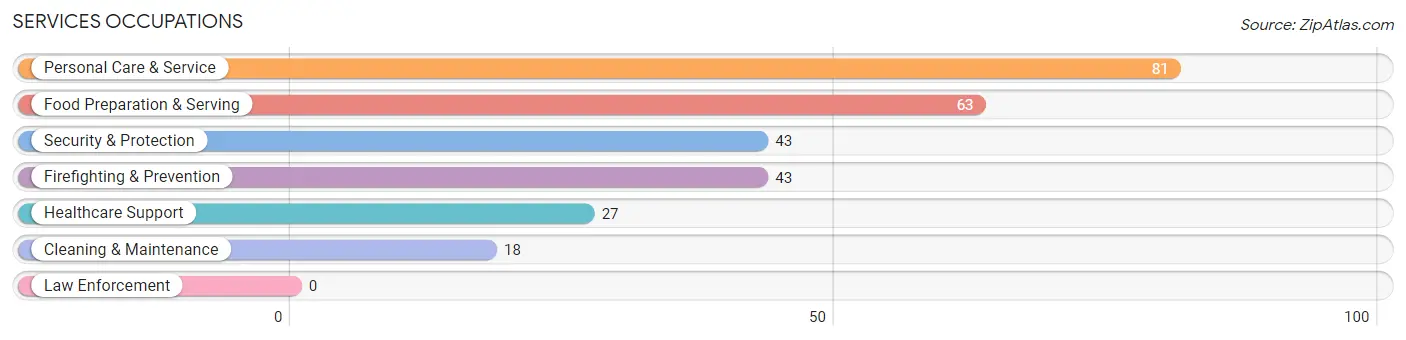
Services Occupations
The most common Services occupations in Castroville are Personal Care & Service (81 | 6.0%), Food Preparation & Serving (63 | 4.7%), Security & Protection (43 | 3.2%), Firefighting & Prevention (43 | 3.2%), and Healthcare Support (27 | 2.0%).
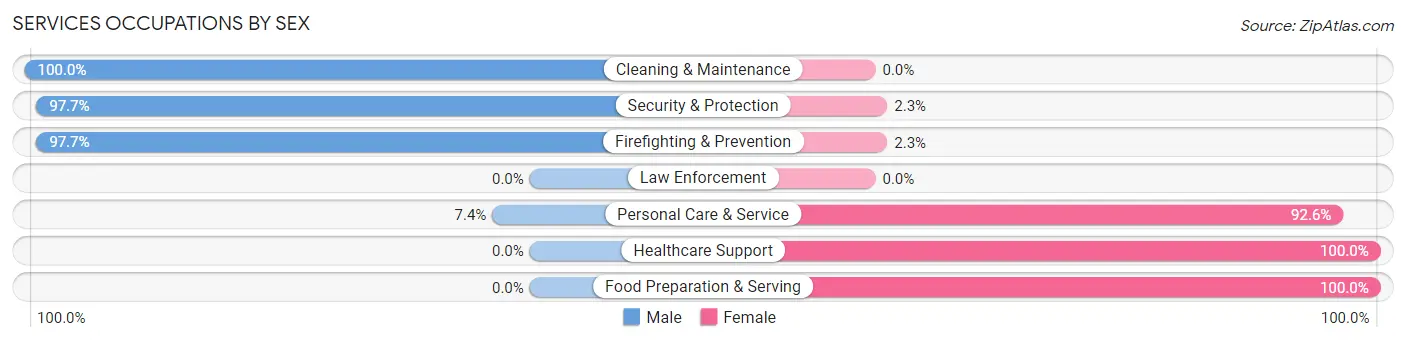
Services Occupations by Sex
Within the Services occupations in Castroville, the most male-oriented occupations are Cleaning & Maintenance (100.0%), Security & Protection (97.7%), and Firefighting & Prevention (97.7%), while the most female-oriented occupations are Healthcare Support (100.0%), Food Preparation & Serving (100.0%), and Personal Care & Service (92.6%).
| Occupation | Male | Female |
| Healthcare Support | 0 (0.0%) | 27 (100.0%) |
| Security & Protection | 42 (97.7%) | 1 (2.3%) |
| Firefighting & Prevention | 42 (97.7%) | 1 (2.3%) |
| Law Enforcement | 0 (0.0%) | 0 (0.0%) |
| Food Preparation & Serving | 0 (0.0%) | 63 (100.0%) |
| Cleaning & Maintenance | 18 (100.0%) | 0 (0.0%) |
| Personal Care & Service | 6 (7.4%) | 75 (92.6%) |
| Total (Category) | 66 (28.4%) | 166 (71.6%) |
| Total (Overall) | 708 (52.7%) | 635 (47.3%) |
Sales and Office Occupations
The most common Sales and Office occupations in Castroville are Office & Administration (150 | 11.2%), and Sales & Related (133 | 9.9%).

Sales and Office Occupations by Sex

| Occupation | Male | Female |
| Sales & Related | 83 (62.4%) | 50 (37.6%) |
| Office & Administration | 60 (40.0%) | 90 (60.0%) |
| Total (Category) | 143 (50.5%) | 140 (49.5%) |
| Total (Overall) | 708 (52.7%) | 635 (47.3%) |
Natural Resources, Construction and Maintenance Occupations
The most common Natural Resources, Construction and Maintenance occupations in Castroville are Construction & Extraction (98 | 7.3%), and Installation, Maintenance & Repair (56 | 4.2%).

Natural Resources, Construction and Maintenance Occupations by Sex

| Occupation | Male | Female |
| Farming, Fishing & Forestry | 0 (0.0%) | 0 (0.0%) |
| Construction & Extraction | 98 (100.0%) | 0 (0.0%) |
| Installation, Maintenance & Repair | 56 (100.0%) | 0 (0.0%) |
| Total (Category) | 154 (100.0%) | 0 (0.0%) |
| Total (Overall) | 708 (52.7%) | 635 (47.3%) |
Production, Transportation and Moving Occupations
The most common Production, Transportation and Moving occupations in Castroville are Material Moving (48 | 3.6%), Production (31 | 2.3%), and Transportation (25 | 1.9%).
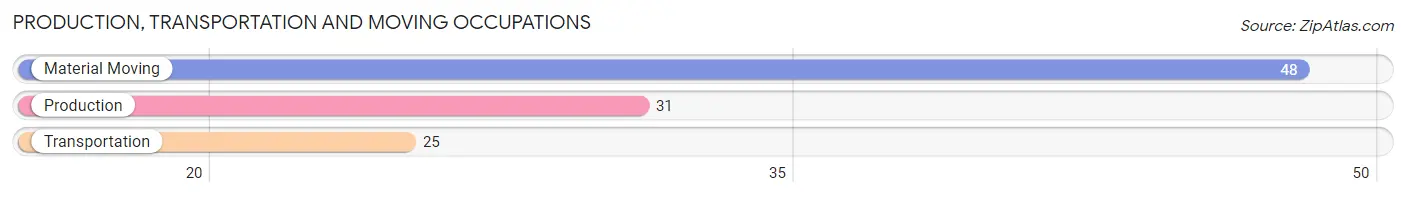
Production, Transportation and Moving Occupations by Sex

| Occupation | Male | Female |
| Production | 6 (19.4%) | 25 (80.6%) |
| Transportation | 20 (80.0%) | 5 (20.0%) |
| Material Moving | 48 (100.0%) | 0 (0.0%) |
| Total (Category) | 74 (71.2%) | 30 (28.8%) |
| Total (Overall) | 708 (52.7%) | 635 (47.3%) |
Employment Industries by Sex in Castroville
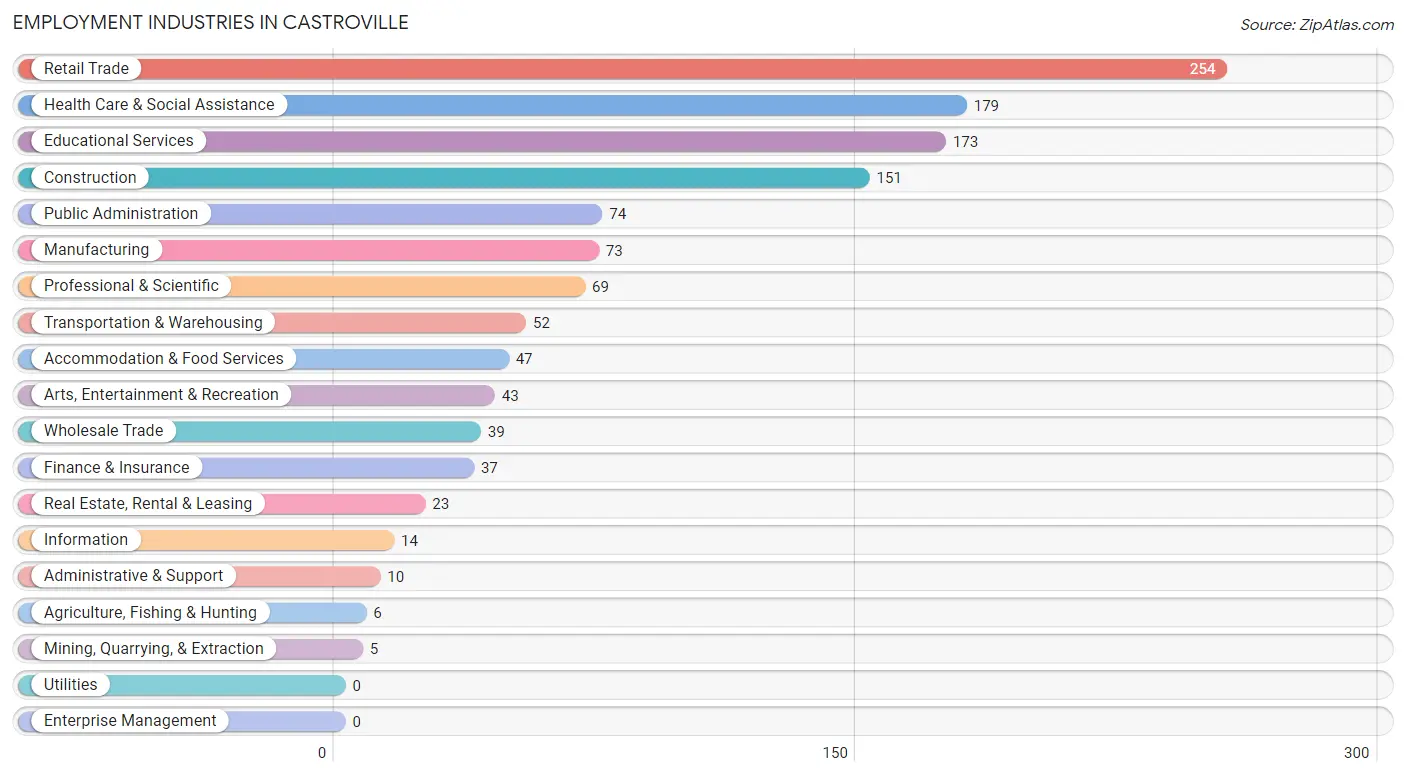
Employment Industries in Castroville
The major employment industries in Castroville include Retail Trade (254 | 18.9%), Health Care & Social Assistance (179 | 13.3%), Educational Services (173 | 12.9%), Construction (151 | 11.2%), and Public Administration (74 | 5.5%).
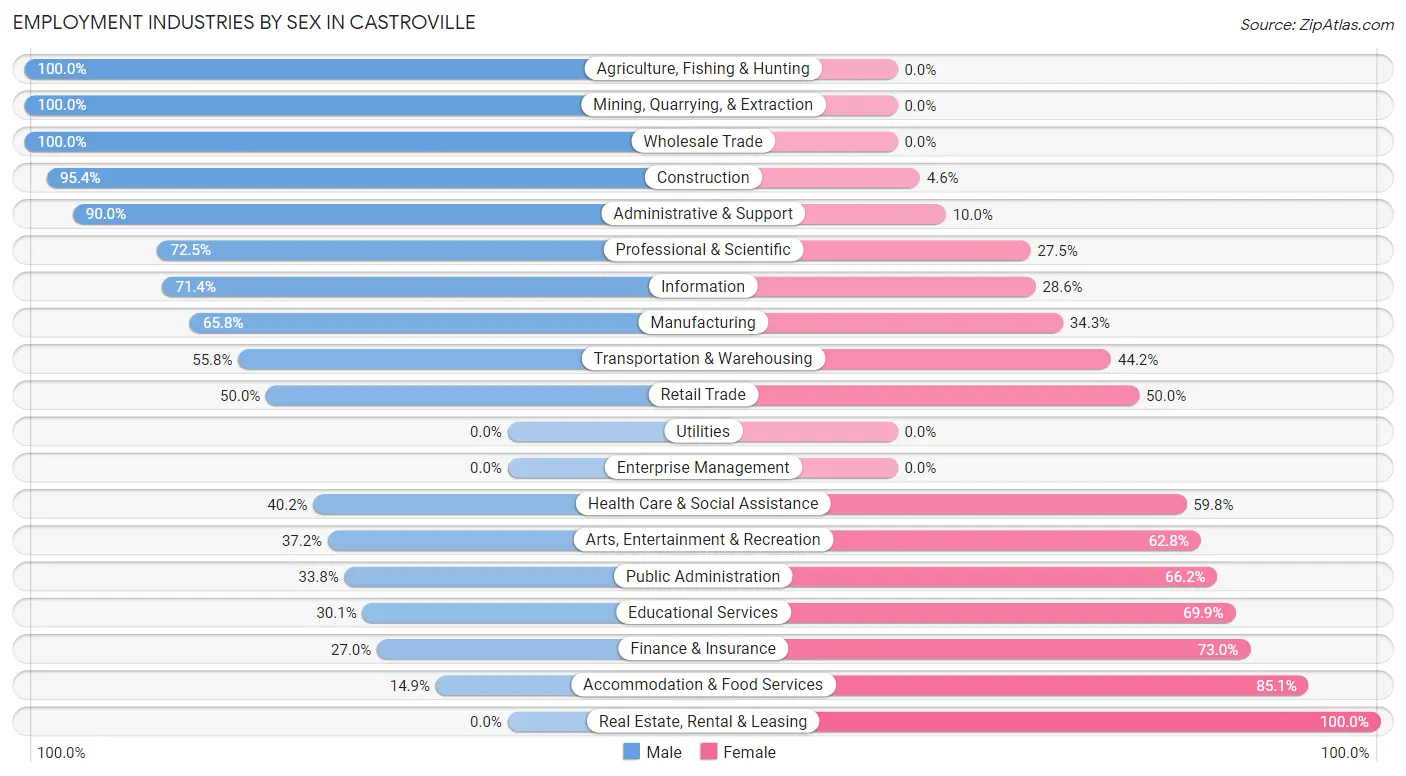
Employment Industries by Sex in Castroville
The Castroville industries that see more men than women are Agriculture, Fishing & Hunting (100.0%), Mining, Quarrying, & Extraction (100.0%), and Wholesale Trade (100.0%), whereas the industries that tend to have a higher number of women are Real Estate, Rental & Leasing (100.0%), Accommodation & Food Services (85.1%), and Finance & Insurance (73.0%).
| Industry | Male | Female |
| Agriculture, Fishing & Hunting | 6 (100.0%) | 0 (0.0%) |
| Mining, Quarrying, & Extraction | 5 (100.0%) | 0 (0.0%) |
| Construction | 144 (95.4%) | 7 (4.6%) |
| Manufacturing | 48 (65.7%) | 25 (34.3%) |
| Wholesale Trade | 39 (100.0%) | 0 (0.0%) |
| Retail Trade | 127 (50.0%) | 127 (50.0%) |
| Transportation & Warehousing | 29 (55.8%) | 23 (44.2%) |
| Utilities | 0 (0.0%) | 0 (0.0%) |
| Information | 10 (71.4%) | 4 (28.6%) |
| Finance & Insurance | 10 (27.0%) | 27 (73.0%) |
| Real Estate, Rental & Leasing | 0 (0.0%) | 23 (100.0%) |
| Professional & Scientific | 50 (72.5%) | 19 (27.5%) |
| Enterprise Management | 0 (0.0%) | 0 (0.0%) |
| Administrative & Support | 9 (90.0%) | 1 (10.0%) |
| Educational Services | 52 (30.1%) | 121 (69.9%) |
| Health Care & Social Assistance | 72 (40.2%) | 107 (59.8%) |
| Arts, Entertainment & Recreation | 16 (37.2%) | 27 (62.8%) |
| Accommodation & Food Services | 7 (14.9%) | 40 (85.1%) |
| Public Administration | 25 (33.8%) | 49 (66.2%) |
| Total | 708 (52.7%) | 635 (47.3%) |
Education in Castroville
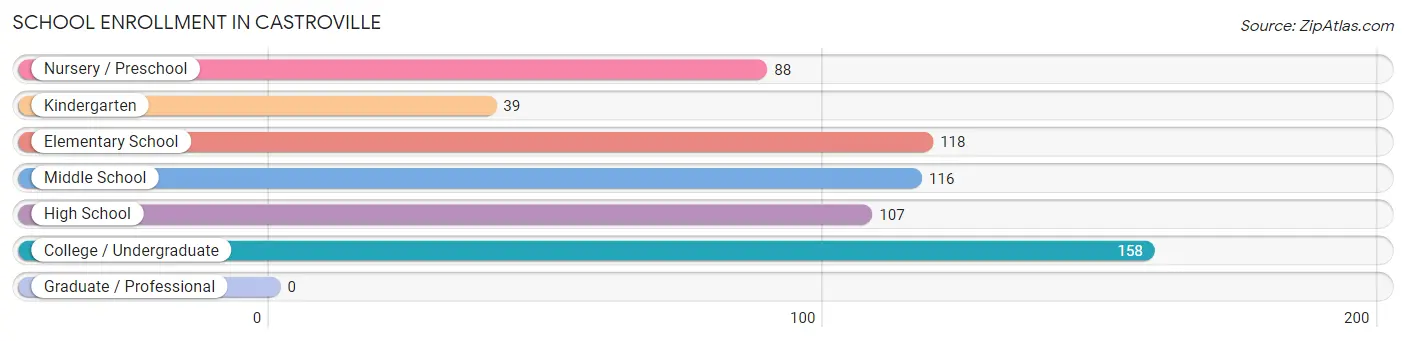
School Enrollment in Castroville
The most common levels of schooling among the 626 students in Castroville are college / undergraduate (158 | 25.2%), elementary school (118 | 18.9%), and middle school (116 | 18.5%).
| School Level | # Students | % Students |
| Nursery / Preschool | 88 | 14.1% |
| Kindergarten | 39 | 6.2% |
| Elementary School | 118 | 18.9% |
| Middle School | 116 | 18.5% |
| High School | 107 | 17.1% |
| College / Undergraduate | 158 | 25.2% |
| Graduate / Professional | 0 | 0.0% |
| Total | 626 | 100.0% |
School Enrollment by Age by Funding Source in Castroville
Out of a total of 626 students who are enrolled in schools in Castroville, 104 (16.6%) attend a private institution, while the remaining 522 (83.4%) are enrolled in public schools. The age group of 3 to 4 year olds has the highest likelihood of being enrolled in private schools, with 46 (88.5% in the age bracket) enrolled. Conversely, the age group of 15 to 17 year olds has the lowest likelihood of being enrolled in a private school, with 90 (100.0% in the age bracket) attending a public institution.
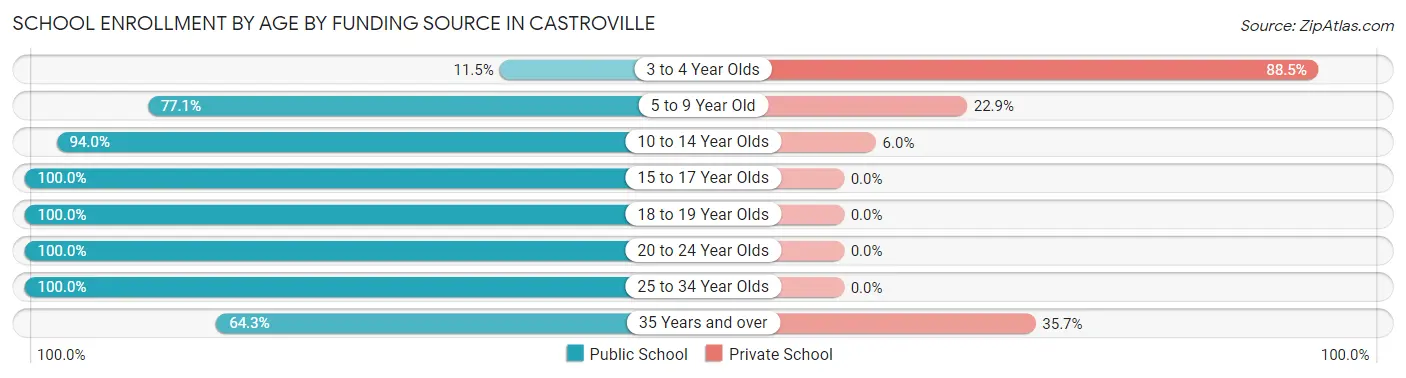
| Age Bracket | Public School | Private School |
| 3 to 4 Year Olds | 6 (11.5%) | 46 (88.5%) |
| 5 to 9 Year Old | 131 (77.1%) | 39 (22.9%) |
| 10 to 14 Year Olds | 142 (94.0%) | 9 (6.0%) |
| 15 to 17 Year Olds | 90 (100.0%) | 0 (0.0%) |
| 18 to 19 Year Olds | 39 (100.0%) | 0 (0.0%) |
| 20 to 24 Year Olds | 76 (100.0%) | 0 (0.0%) |
| 25 to 34 Year Olds | 20 (100.0%) | 0 (0.0%) |
| 35 Years and over | 18 (64.3%) | 10 (35.7%) |
| Total | 522 (83.4%) | 104 (16.6%) |
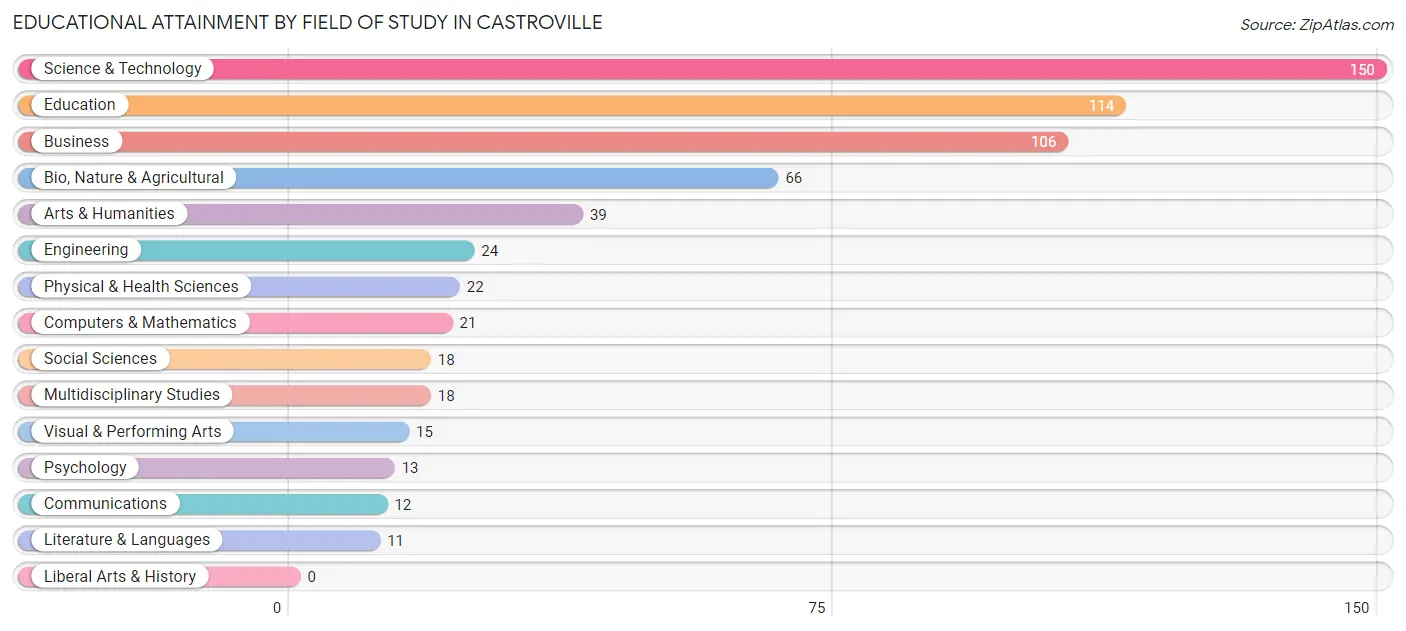
Educational Attainment by Field of Study in Castroville
Science & technology (150 | 23.8%), education (114 | 18.1%), business (106 | 16.9%), bio, nature & agricultural (66 | 10.5%), and arts & humanities (39 | 6.2%) are the most common fields of study among 629 individuals in Castroville who have obtained a bachelor's degree or higher.
| Field of Study | # Graduates | % Graduates |
| Computers & Mathematics | 21 | 3.3% |
| Bio, Nature & Agricultural | 66 | 10.5% |
| Physical & Health Sciences | 22 | 3.5% |
| Psychology | 13 | 2.1% |
| Social Sciences | 18 | 2.9% |
| Engineering | 24 | 3.8% |
| Multidisciplinary Studies | 18 | 2.9% |
| Science & Technology | 150 | 23.8% |
| Business | 106 | 16.9% |
| Education | 114 | 18.1% |
| Literature & Languages | 11 | 1.8% |
| Liberal Arts & History | 0 | 0.0% |
| Visual & Performing Arts | 15 | 2.4% |
| Communications | 12 | 1.9% |
| Arts & Humanities | 39 | 6.2% |
| Total | 629 | 100.0% |
Transportation & Commute in Castroville
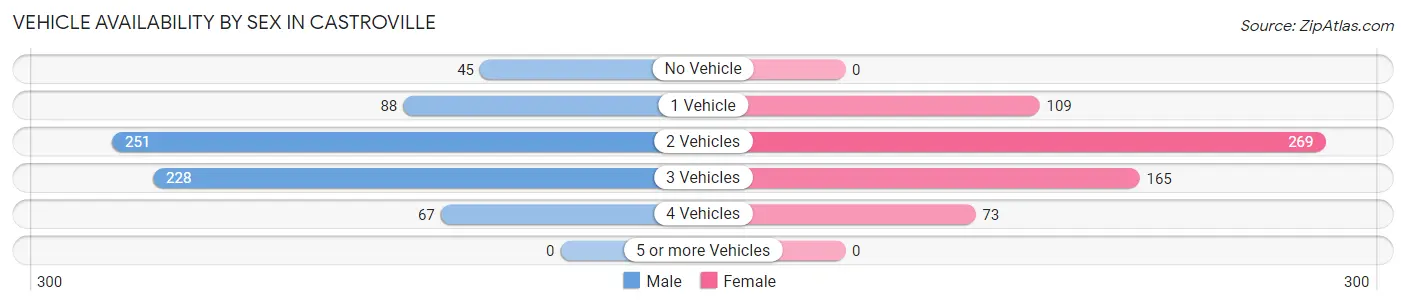
Vehicle Availability by Sex in Castroville
The most prevalent vehicle ownership categories in Castroville are males with 2 vehicles (251, accounting for 37.0%) and females with 2 vehicles (269, making up 40.7%).
| Vehicles Available | Male | Female |
| No Vehicle | 45 (6.6%) | 0 (0.0%) |
| 1 Vehicle | 88 (13.0%) | 109 (17.7%) |
| 2 Vehicles | 251 (37.0%) | 269 (43.7%) |
| 3 Vehicles | 228 (33.6%) | 165 (26.8%) |
| 4 Vehicles | 67 (9.9%) | 73 (11.8%) |
| 5 or more Vehicles | 0 (0.0%) | 0 (0.0%) |
| Total | 679 (100.0%) | 616 (100.0%) |
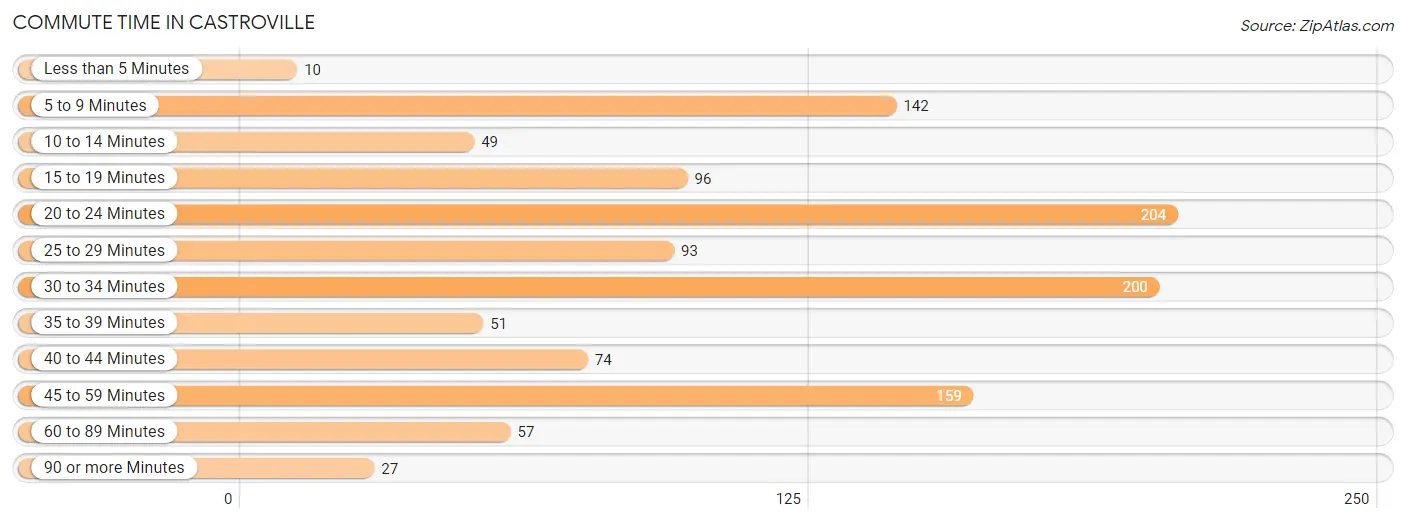
Commute Time in Castroville
The most frequently occuring commute durations in Castroville are 20 to 24 minutes (204 commuters, 17.6%), 30 to 34 minutes (200 commuters, 17.2%), and 45 to 59 minutes (159 commuters, 13.7%).
| Commute Time | # Commuters | % Commuters |
| Less than 5 Minutes | 10 | 0.9% |
| 5 to 9 Minutes | 142 | 12.2% |
| 10 to 14 Minutes | 49 | 4.2% |
| 15 to 19 Minutes | 96 | 8.3% |
| 20 to 24 Minutes | 204 | 17.6% |
| 25 to 29 Minutes | 93 | 8.0% |
| 30 to 34 Minutes | 200 | 17.2% |
| 35 to 39 Minutes | 51 | 4.4% |
| 40 to 44 Minutes | 74 | 6.4% |
| 45 to 59 Minutes | 159 | 13.7% |
| 60 to 89 Minutes | 57 | 4.9% |
| 90 or more Minutes | 27 | 2.3% |
Commute Time by Sex in Castroville
The most common commute times in Castroville are 30 to 34 minutes (139 commuters, 23.4%) for males and 20 to 24 minutes (126 commuters, 22.2%) for females.
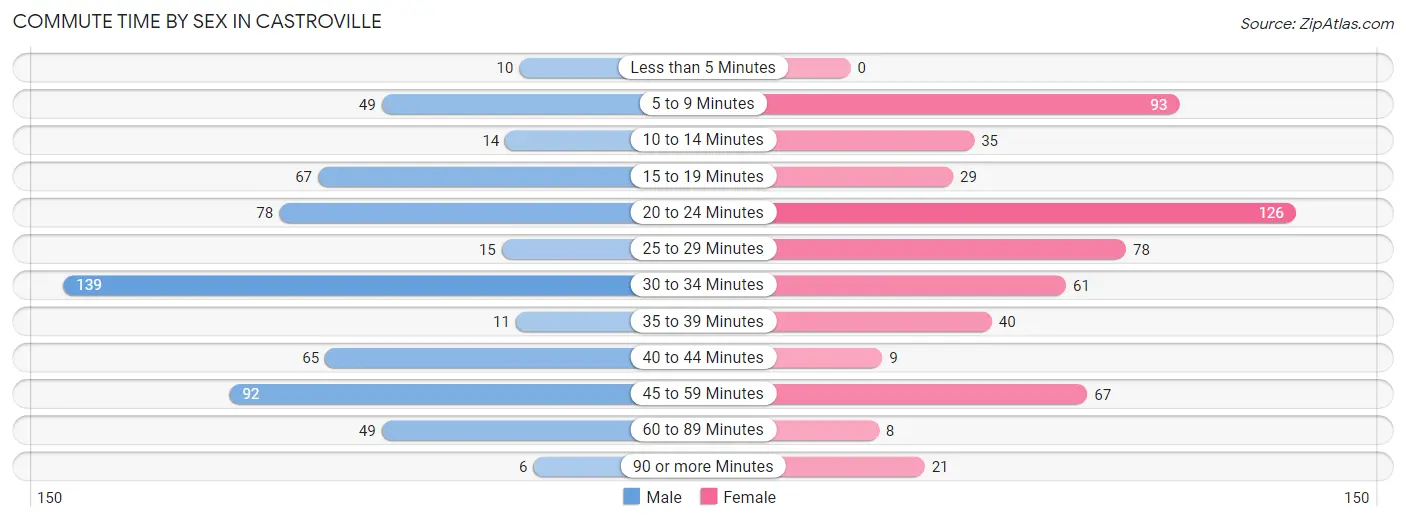
| Commute Time | Male | Female |
| Less than 5 Minutes | 10 (1.7%) | 0 (0.0%) |
| 5 to 9 Minutes | 49 (8.2%) | 93 (16.4%) |
| 10 to 14 Minutes | 14 (2.4%) | 35 (6.2%) |
| 15 to 19 Minutes | 67 (11.3%) | 29 (5.1%) |
| 20 to 24 Minutes | 78 (13.1%) | 126 (22.2%) |
| 25 to 29 Minutes | 15 (2.5%) | 78 (13.8%) |
| 30 to 34 Minutes | 139 (23.4%) | 61 (10.8%) |
| 35 to 39 Minutes | 11 (1.8%) | 40 (7.0%) |
| 40 to 44 Minutes | 65 (10.9%) | 9 (1.6%) |
| 45 to 59 Minutes | 92 (15.5%) | 67 (11.8%) |
| 60 to 89 Minutes | 49 (8.2%) | 8 (1.4%) |
| 90 or more Minutes | 6 (1.0%) | 21 (3.7%) |
Time of Departure to Work by Sex in Castroville
The most frequent times of departure to work in Castroville are 7:00 AM to 7:29 AM (110, 18.5%) for males and 7:00 AM to 7:29 AM (122, 21.5%) for females.
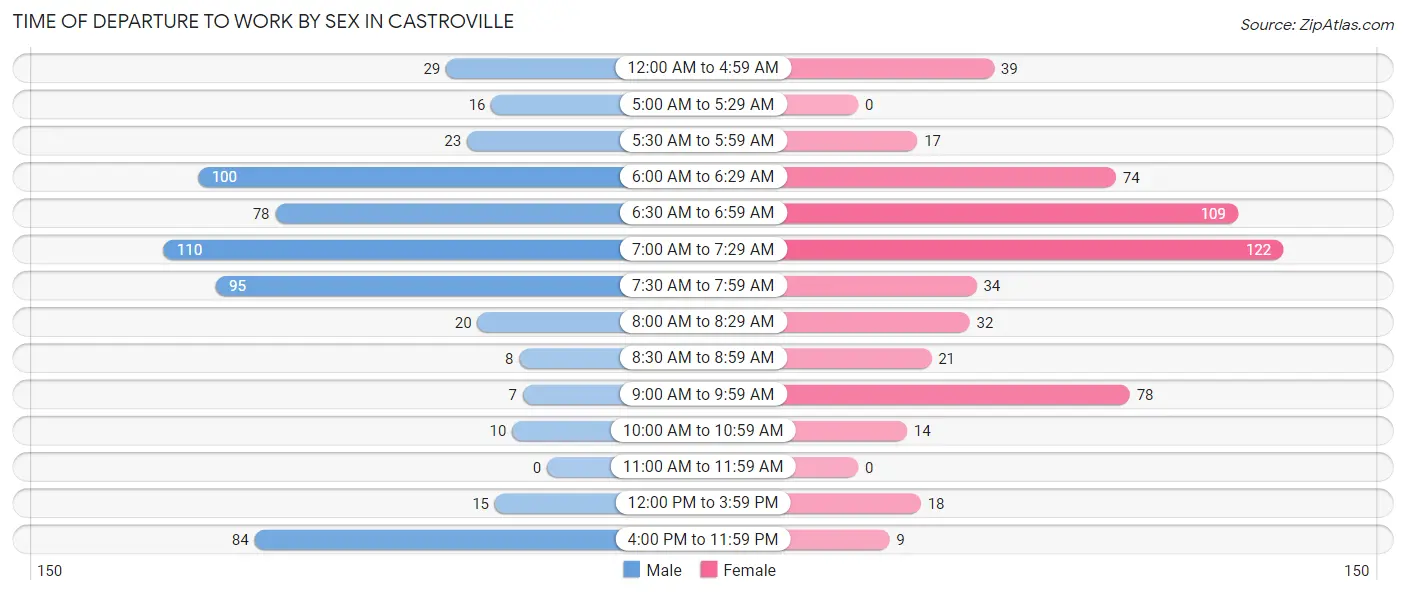
| Time of Departure | Male | Female |
| 12:00 AM to 4:59 AM | 29 (4.9%) | 39 (6.9%) |
| 5:00 AM to 5:29 AM | 16 (2.7%) | 0 (0.0%) |
| 5:30 AM to 5:59 AM | 23 (3.9%) | 17 (3.0%) |
| 6:00 AM to 6:29 AM | 100 (16.8%) | 74 (13.1%) |
| 6:30 AM to 6:59 AM | 78 (13.1%) | 109 (19.2%) |
| 7:00 AM to 7:29 AM | 110 (18.5%) | 122 (21.5%) |
| 7:30 AM to 7:59 AM | 95 (16.0%) | 34 (6.0%) |
| 8:00 AM to 8:29 AM | 20 (3.4%) | 32 (5.6%) |
| 8:30 AM to 8:59 AM | 8 (1.3%) | 21 (3.7%) |
| 9:00 AM to 9:59 AM | 7 (1.2%) | 78 (13.8%) |
| 10:00 AM to 10:59 AM | 10 (1.7%) | 14 (2.5%) |
| 11:00 AM to 11:59 AM | 0 (0.0%) | 0 (0.0%) |
| 12:00 PM to 3:59 PM | 15 (2.5%) | 18 (3.2%) |
| 4:00 PM to 11:59 PM | 84 (14.1%) | 9 (1.6%) |
| Total | 595 (100.0%) | 567 (100.0%) |
Housing Occupancy in Castroville
Occupancy by Ownership in Castroville
Of the total 1,128 dwellings in Castroville, owner-occupied units account for 783 (69.4%), while renter-occupied units make up 345 (30.6%).
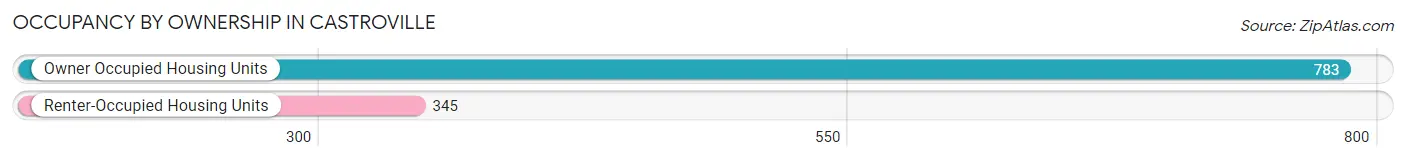
| Occupancy | # Housing Units | % Housing Units |
| Owner Occupied Housing Units | 783 | 69.4% |
| Renter-Occupied Housing Units | 345 | 30.6% |
| Total Occupied Housing Units | 1,128 | 100.0% |
Occupancy by Household Size in Castroville
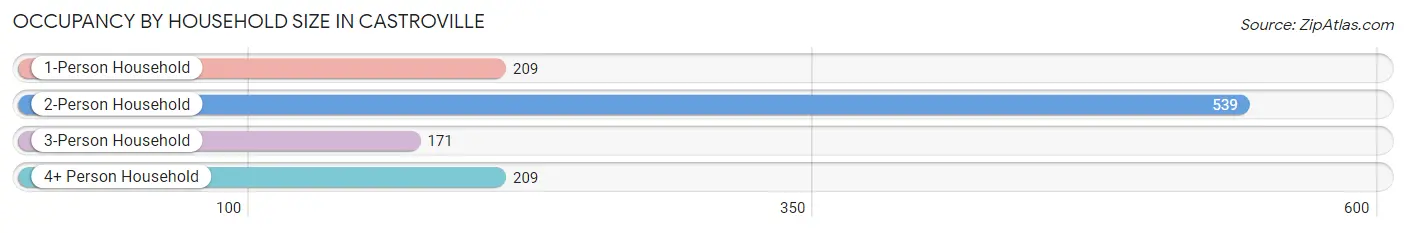
| Household Size | # Housing Units | % Housing Units |
| 1-Person Household | 209 | 18.5% |
| 2-Person Household | 539 | 47.8% |
| 3-Person Household | 171 | 15.2% |
| 4+ Person Household | 209 | 18.5% |
| Total Housing Units | 1,128 | 100.0% |
Occupancy by Ownership by Household Size in Castroville
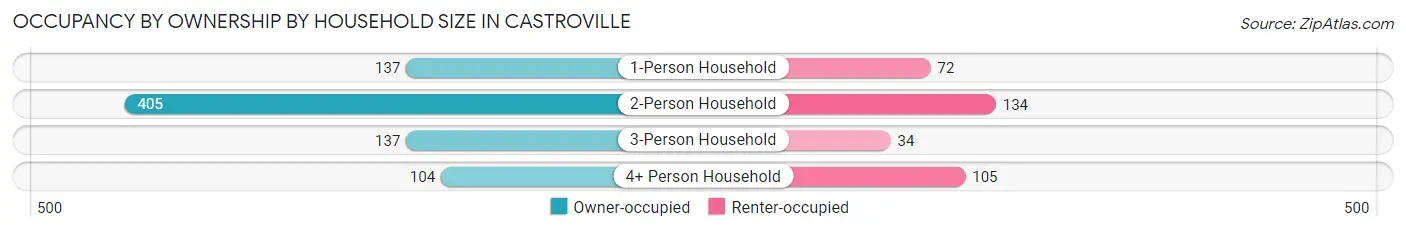
| Household Size | Owner-occupied | Renter-occupied |
| 1-Person Household | 137 (65.5%) | 72 (34.4%) |
| 2-Person Household | 405 (75.1%) | 134 (24.9%) |
| 3-Person Household | 137 (80.1%) | 34 (19.9%) |
| 4+ Person Household | 104 (49.8%) | 105 (50.2%) |
| Total Housing Units | 783 (69.4%) | 345 (30.6%) |
Occupancy by Educational Attainment in Castroville
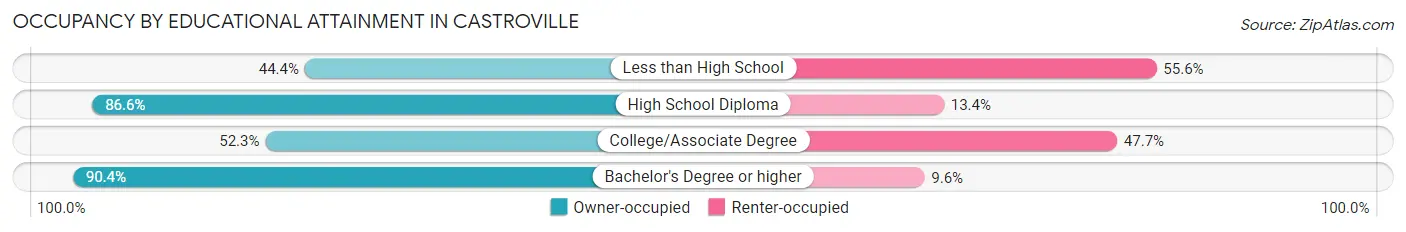
| Household Size | Owner-occupied | Renter-occupied |
| Less than High School | 44 (44.4%) | 55 (55.6%) |
| High School Diploma | 155 (86.6%) | 24 (13.4%) |
| College/Associate Degree | 253 (52.3%) | 231 (47.7%) |
| Bachelor's Degree or higher | 331 (90.4%) | 35 (9.6%) |
Occupancy by Age of Householder in Castroville
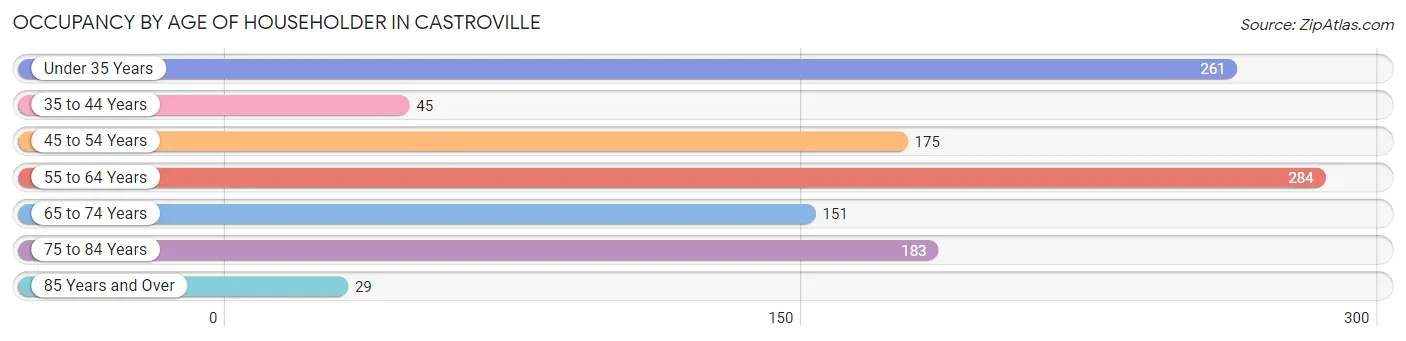
| Age Bracket | # Households | % Households |
| Under 35 Years | 261 | 23.1% |
| 35 to 44 Years | 45 | 4.0% |
| 45 to 54 Years | 175 | 15.5% |
| 55 to 64 Years | 284 | 25.2% |
| 65 to 74 Years | 151 | 13.4% |
| 75 to 84 Years | 183 | 16.2% |
| 85 Years and Over | 29 | 2.6% |
| Total | 1,128 | 100.0% |
Housing Finances in Castroville
Median Income by Occupancy in Castroville
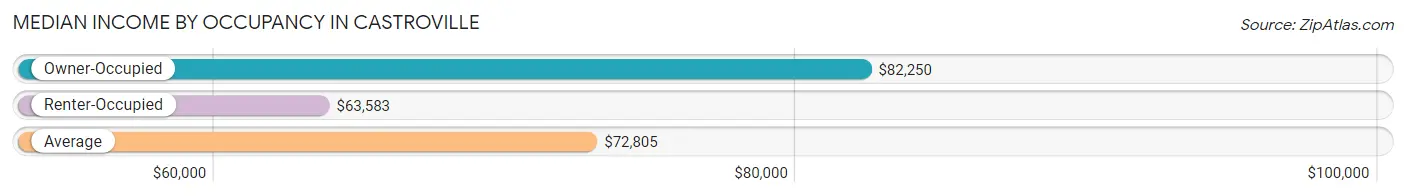
| Occupancy Type | # Households | Median Income |
| Owner-Occupied | 783 (69.4%) | $82,250 |
| Renter-Occupied | 345 (30.6%) | $63,583 |
| Average | 1,128 (100.0%) | $72,805 |
Occupancy by Householder Income Bracket in Castroville
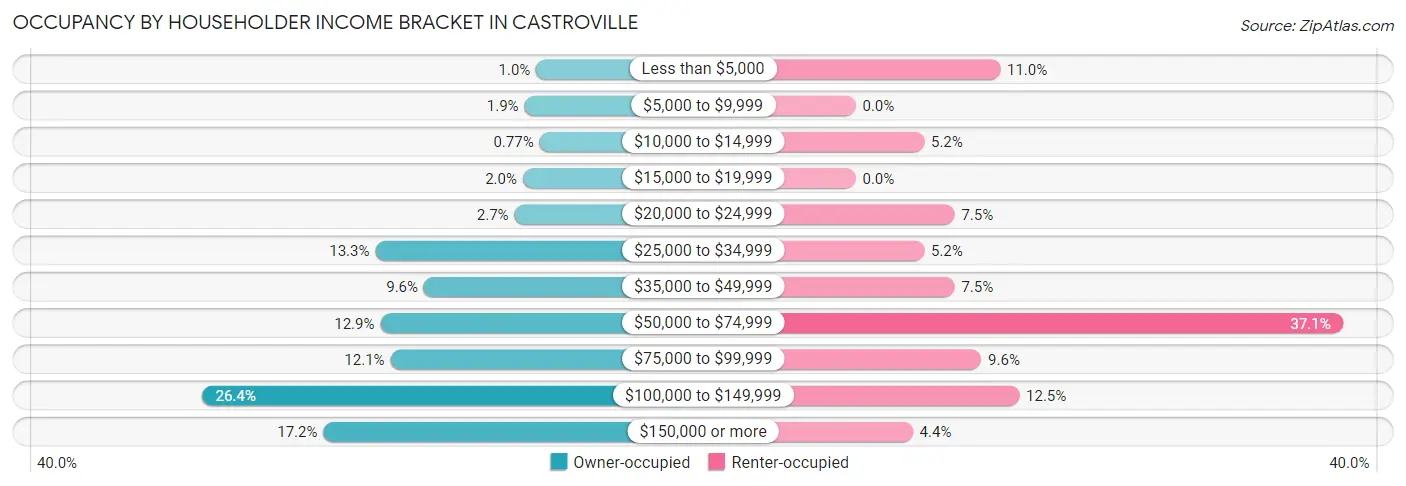
| Income Bracket | Owner-occupied | Renter-occupied |
| Less than $5,000 | 8 (1.0%) | 38 (11.0%) |
| $5,000 to $9,999 | 15 (1.9%) | 0 (0.0%) |
| $10,000 to $14,999 | 6 (0.8%) | 18 (5.2%) |
| $15,000 to $19,999 | 16 (2.0%) | 0 (0.0%) |
| $20,000 to $24,999 | 21 (2.7%) | 26 (7.5%) |
| $25,000 to $34,999 | 104 (13.3%) | 18 (5.2%) |
| $35,000 to $49,999 | 75 (9.6%) | 26 (7.5%) |
| $50,000 to $74,999 | 101 (12.9%) | 128 (37.1%) |
| $75,000 to $99,999 | 95 (12.1%) | 33 (9.6%) |
| $100,000 to $149,999 | 207 (26.4%) | 43 (12.5%) |
| $150,000 or more | 135 (17.2%) | 15 (4.3%) |
| Total | 783 (100.0%) | 345 (100.0%) |
Monthly Housing Cost Tiers in Castroville
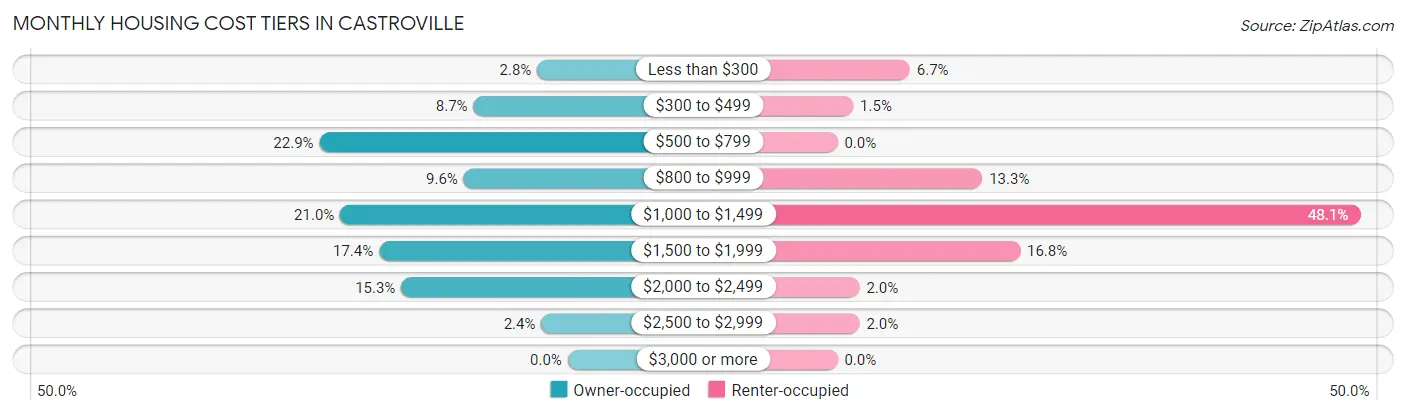
| Monthly Cost | Owner-occupied | Renter-occupied |
| Less than $300 | 22 (2.8%) | 23 (6.7%) |
| $300 to $499 | 68 (8.7%) | 5 (1.5%) |
| $500 to $799 | 179 (22.9%) | 0 (0.0%) |
| $800 to $999 | 75 (9.6%) | 46 (13.3%) |
| $1,000 to $1,499 | 164 (20.9%) | 166 (48.1%) |
| $1,500 to $1,999 | 136 (17.4%) | 58 (16.8%) |
| $2,000 to $2,499 | 120 (15.3%) | 7 (2.0%) |
| $2,500 to $2,999 | 19 (2.4%) | 7 (2.0%) |
| $3,000 or more | 0 (0.0%) | 0 (0.0%) |
| Total | 783 (100.0%) | 345 (100.0%) |
Physical Housing Characteristics in Castroville
Housing Structures in Castroville
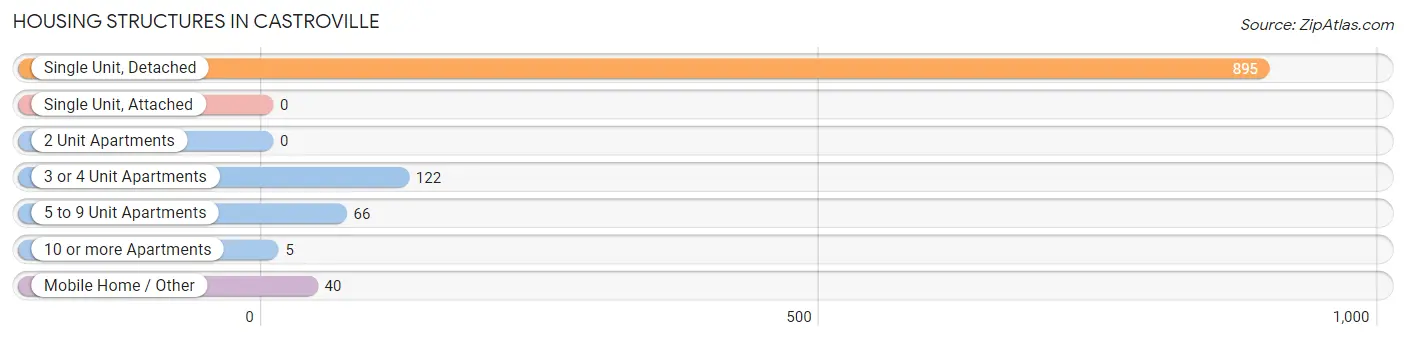
| Structure Type | # Housing Units | % Housing Units |
| Single Unit, Detached | 895 | 79.3% |
| Single Unit, Attached | 0 | 0.0% |
| 2 Unit Apartments | 0 | 0.0% |
| 3 or 4 Unit Apartments | 122 | 10.8% |
| 5 to 9 Unit Apartments | 66 | 5.9% |
| 10 or more Apartments | 5 | 0.4% |
| Mobile Home / Other | 40 | 3.5% |
| Total | 1,128 | 100.0% |
Housing Structures by Occupancy in Castroville
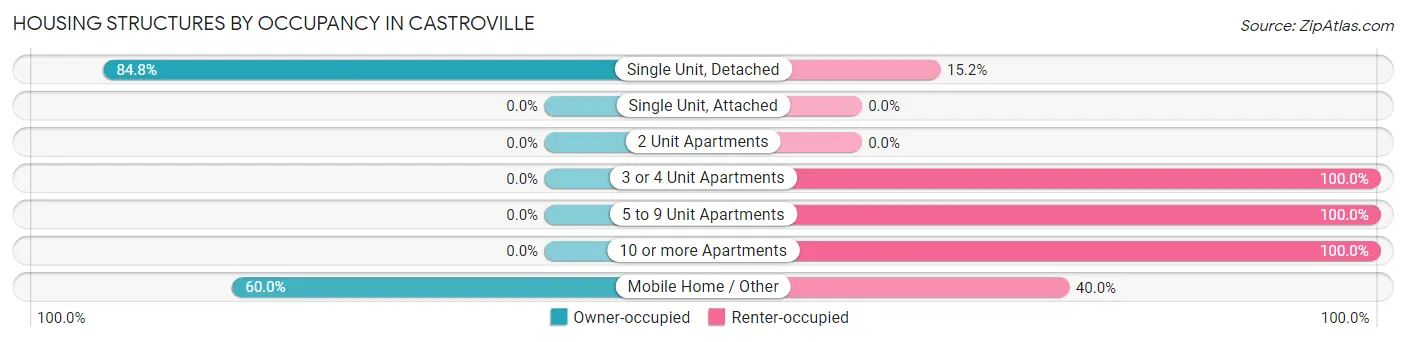
| Structure Type | Owner-occupied | Renter-occupied |
| Single Unit, Detached | 759 (84.8%) | 136 (15.2%) |
| Single Unit, Attached | 0 (0.0%) | 0 (0.0%) |
| 2 Unit Apartments | 0 (0.0%) | 0 (0.0%) |
| 3 or 4 Unit Apartments | 0 (0.0%) | 122 (100.0%) |
| 5 to 9 Unit Apartments | 0 (0.0%) | 66 (100.0%) |
| 10 or more Apartments | 0 (0.0%) | 5 (100.0%) |
| Mobile Home / Other | 24 (60.0%) | 16 (40.0%) |
| Total | 783 (69.4%) | 345 (30.6%) |
Housing Structures by Number of Rooms in Castroville
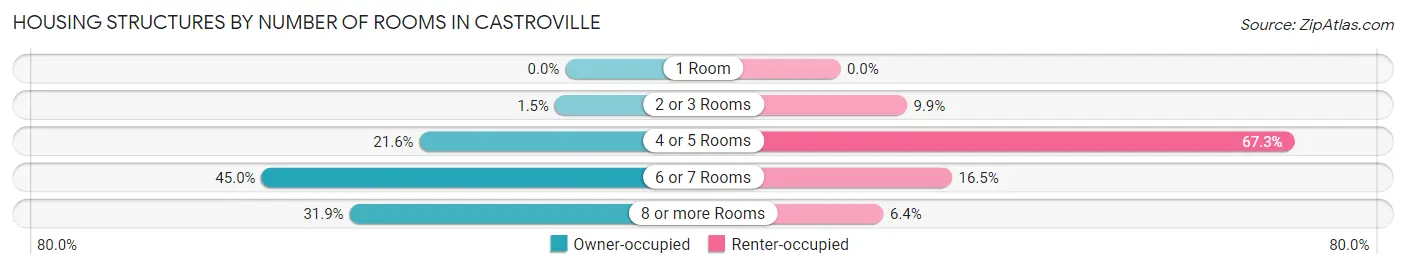
| Number of Rooms | Owner-occupied | Renter-occupied |
| 1 Room | 0 (0.0%) | 0 (0.0%) |
| 2 or 3 Rooms | 12 (1.5%) | 34 (9.9%) |
| 4 or 5 Rooms | 169 (21.6%) | 232 (67.2%) |
| 6 or 7 Rooms | 352 (45.0%) | 57 (16.5%) |
| 8 or more Rooms | 250 (31.9%) | 22 (6.4%) |
| Total | 783 (100.0%) | 345 (100.0%) |
Housing Structure by Heating Type in Castroville
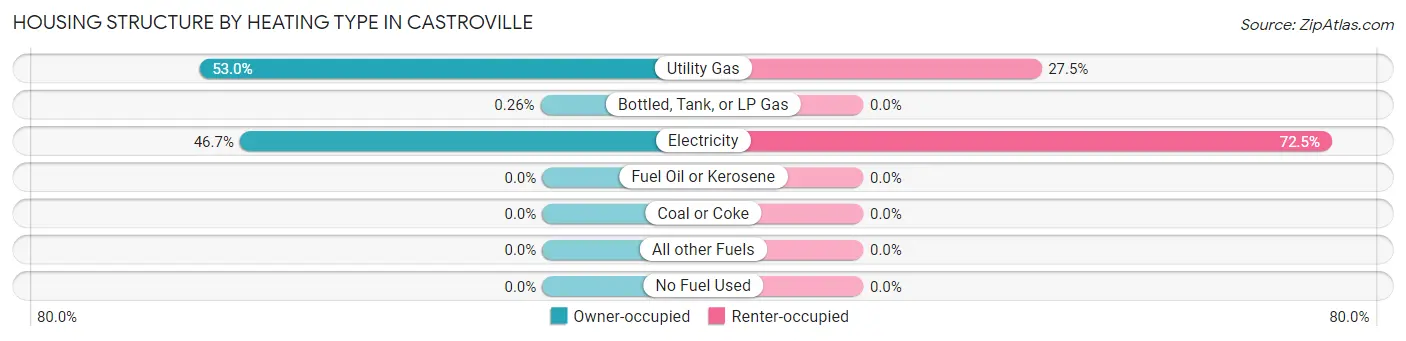
| Heating Type | Owner-occupied | Renter-occupied |
| Utility Gas | 415 (53.0%) | 95 (27.5%) |
| Bottled, Tank, or LP Gas | 2 (0.3%) | 0 (0.0%) |
| Electricity | 366 (46.7%) | 250 (72.5%) |
| Fuel Oil or Kerosene | 0 (0.0%) | 0 (0.0%) |
| Coal or Coke | 0 (0.0%) | 0 (0.0%) |
| All other Fuels | 0 (0.0%) | 0 (0.0%) |
| No Fuel Used | 0 (0.0%) | 0 (0.0%) |
| Total | 783 (100.0%) | 345 (100.0%) |
Household Vehicle Usage in Castroville
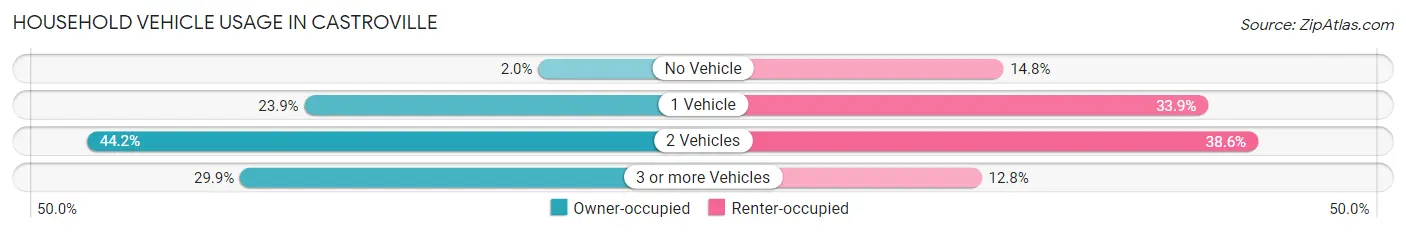
| Vehicles per Household | Owner-occupied | Renter-occupied |
| No Vehicle | 16 (2.0%) | 51 (14.8%) |
| 1 Vehicle | 187 (23.9%) | 117 (33.9%) |
| 2 Vehicles | 346 (44.2%) | 133 (38.6%) |
| 3 or more Vehicles | 234 (29.9%) | 44 (12.8%) |
| Total | 783 (100.0%) | 345 (100.0%) |
Real Estate & Mortgages in Castroville
Real Estate and Mortgage Overview in Castroville
| Characteristic | Without Mortgage | With Mortgage |
| Housing Units | 398 | 385 |
| Median Property Value | $243,300 | $272,000 |
| Median Household Income | $66,176 | $103 |
| Monthly Housing Costs | $677 | $0 |
| Real Estate Taxes | $3,544 | $1 |
Property Value by Mortgage Status in Castroville
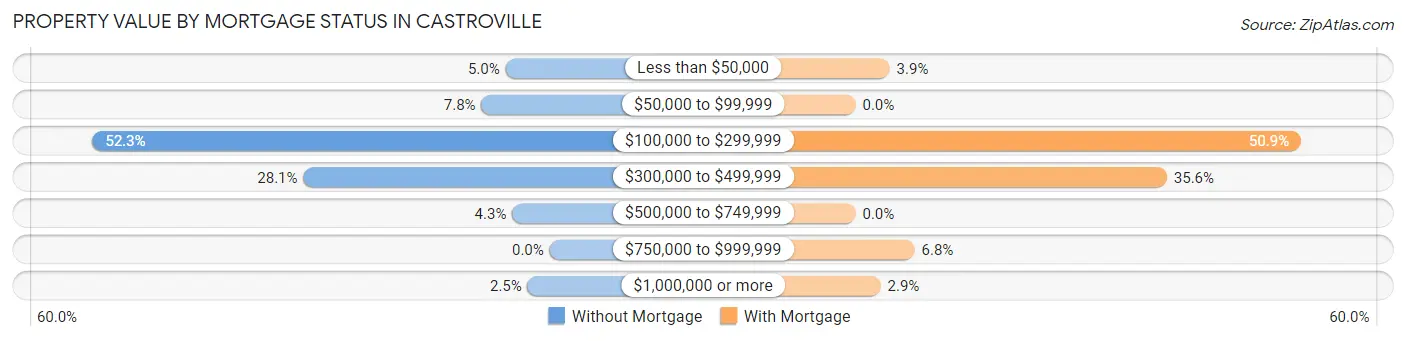
| Property Value | Without Mortgage | With Mortgage |
| Less than $50,000 | 20 (5.0%) | 15 (3.9%) |
| $50,000 to $99,999 | 31 (7.8%) | 0 (0.0%) |
| $100,000 to $299,999 | 208 (52.3%) | 196 (50.9%) |
| $300,000 to $499,999 | 112 (28.1%) | 137 (35.6%) |
| $500,000 to $749,999 | 17 (4.3%) | 0 (0.0%) |
| $750,000 to $999,999 | 0 (0.0%) | 26 (6.8%) |
| $1,000,000 or more | 10 (2.5%) | 11 (2.9%) |
| Total | 398 (100.0%) | 385 (100.0%) |
Household Income by Mortgage Status in Castroville
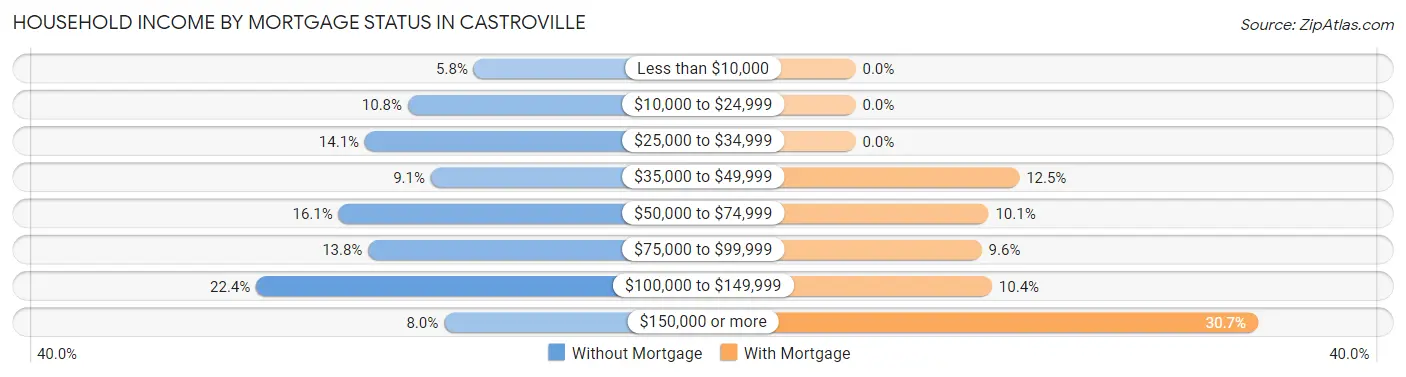
| Household Income | Without Mortgage | With Mortgage |
| Less than $10,000 | 23 (5.8%) | 0 (0.0%) |
| $10,000 to $24,999 | 43 (10.8%) | 0 (0.0%) |
| $25,000 to $34,999 | 56 (14.1%) | 0 (0.0%) |
| $35,000 to $49,999 | 36 (9.0%) | 48 (12.5%) |
| $50,000 to $74,999 | 64 (16.1%) | 39 (10.1%) |
| $75,000 to $99,999 | 55 (13.8%) | 37 (9.6%) |
| $100,000 to $149,999 | 89 (22.4%) | 40 (10.4%) |
| $150,000 or more | 32 (8.0%) | 118 (30.6%) |
| Total | 398 (100.0%) | 385 (100.0%) |
Property Value to Household Income Ratio in Castroville
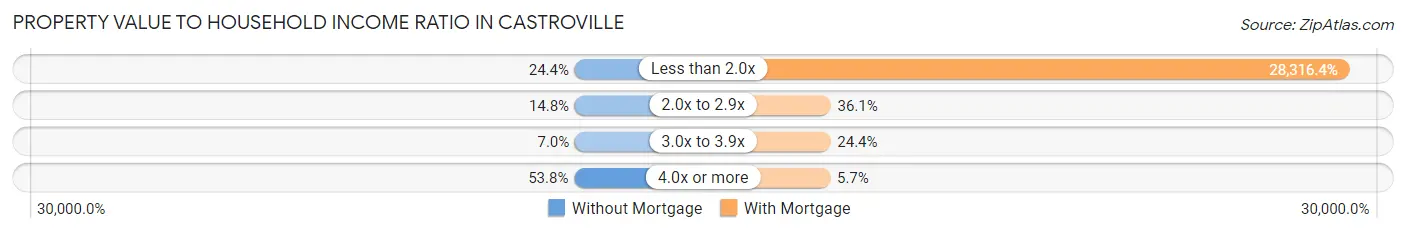
| Value-to-Income Ratio | Without Mortgage | With Mortgage |
| Less than 2.0x | 97 (24.4%) | 109,018 (28,316.4%) |
| 2.0x to 2.9x | 59 (14.8%) | 139 (36.1%) |
| 3.0x to 3.9x | 28 (7.0%) | 94 (24.4%) |
| 4.0x or more | 214 (53.8%) | 22 (5.7%) |
| Total | 398 (100.0%) | 385 (100.0%) |
Real Estate Taxes by Mortgage Status in Castroville

| Property Taxes | Without Mortgage | With Mortgage |
| Less than $800 | 22 (5.5%) | 0 (0.0%) |
| $800 to $1,499 | 48 (12.1%) | 0 (0.0%) |
| $800 to $1,499 | 301 (75.6%) | 24 (6.2%) |
| Total | 398 (100.0%) | 385 (100.0%) |
Health & Disability in Castroville
Health Insurance Coverage by Age in Castroville
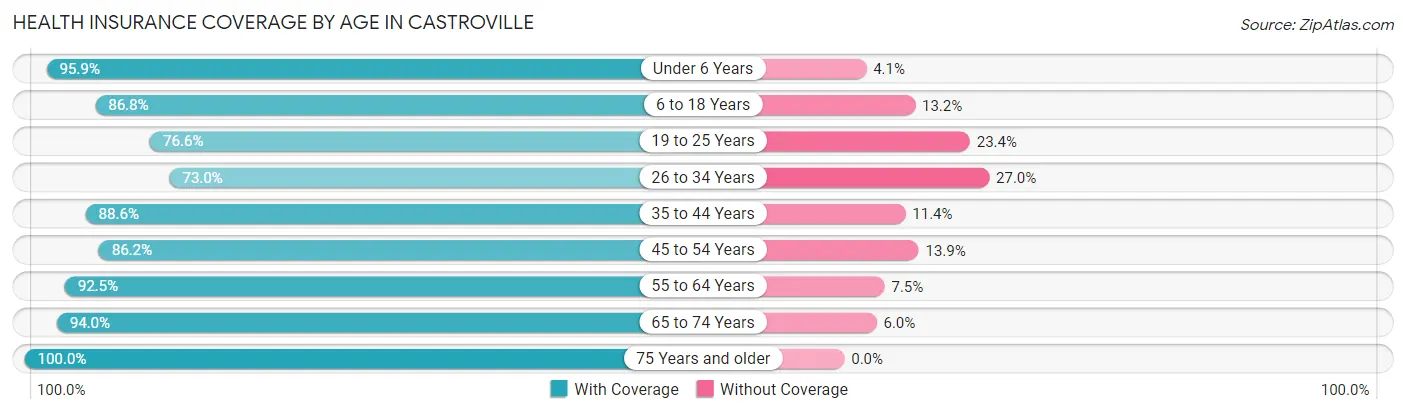
| Age Bracket | With Coverage | Without Coverage |
| Under 6 Years | 305 (95.9%) | 13 (4.1%) |
| 6 to 18 Years | 329 (86.8%) | 50 (13.2%) |
| 19 to 25 Years | 180 (76.6%) | 55 (23.4%) |
| 26 to 34 Years | 273 (73.0%) | 101 (27.0%) |
| 35 to 44 Years | 140 (88.6%) | 18 (11.4%) |
| 45 to 54 Years | 342 (86.2%) | 55 (13.9%) |
| 55 to 64 Years | 468 (92.5%) | 38 (7.5%) |
| 65 to 74 Years | 219 (94.0%) | 14 (6.0%) |
| 75 Years and older | 291 (100.0%) | 0 (0.0%) |
| Total | 2,547 (88.1%) | 344 (11.9%) |
Health Insurance Coverage by Citizenship Status in Castroville

| Citizenship Status | With Coverage | Without Coverage |
| Native Born | 305 (95.9%) | 13 (4.1%) |
| Foreign Born, Citizen | 329 (86.8%) | 50 (13.2%) |
| Foreign Born, not a Citizen | 180 (76.6%) | 55 (23.4%) |
Health Insurance Coverage by Household Income in Castroville
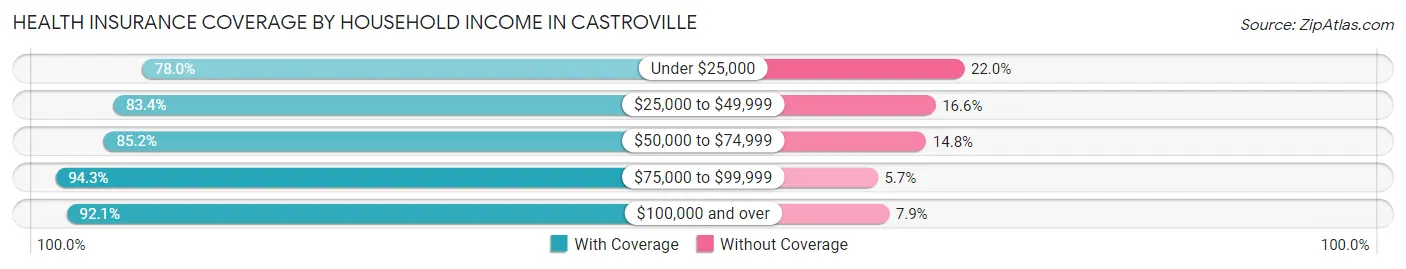
| Household Income | With Coverage | Without Coverage |
| Under $25,000 | 270 (78.0%) | 76 (22.0%) |
| $25,000 to $49,999 | 433 (83.4%) | 86 (16.6%) |
| $50,000 to $74,999 | 385 (85.2%) | 67 (14.8%) |
| $75,000 to $99,999 | 378 (94.3%) | 23 (5.7%) |
| $100,000 and over | 1,076 (92.1%) | 92 (7.9%) |
Public vs Private Health Insurance Coverage by Age in Castroville
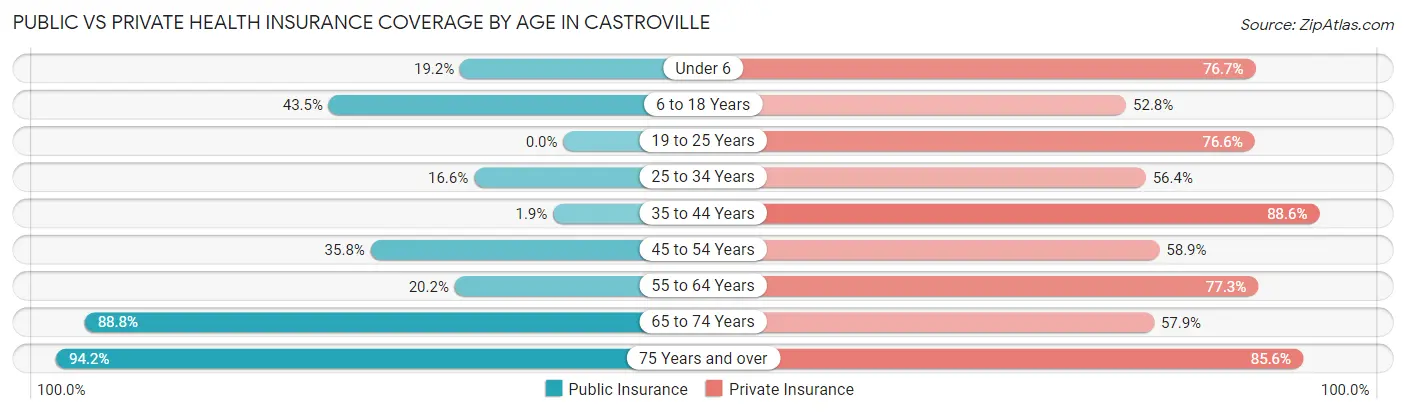
| Age Bracket | Public Insurance | Private Insurance |
| Under 6 | 61 (19.2%) | 244 (76.7%) |
| 6 to 18 Years | 165 (43.5%) | 200 (52.8%) |
| 19 to 25 Years | 0 (0.0%) | 180 (76.6%) |
| 25 to 34 Years | 62 (16.6%) | 211 (56.4%) |
| 35 to 44 Years | 3 (1.9%) | 140 (88.6%) |
| 45 to 54 Years | 142 (35.8%) | 234 (58.9%) |
| 55 to 64 Years | 102 (20.2%) | 391 (77.3%) |
| 65 to 74 Years | 207 (88.8%) | 135 (57.9%) |
| 75 Years and over | 274 (94.2%) | 249 (85.6%) |
| Total | 1,016 (35.1%) | 1,984 (68.6%) |
Disability Status by Sex by Age in Castroville
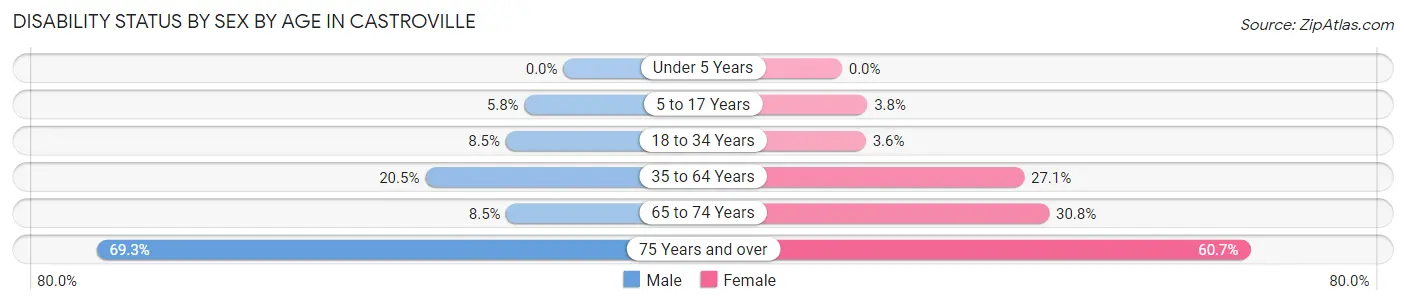
| Age Bracket | Male | Female |
| Under 5 Years | 0 (0.0%) | 0 (0.0%) |
| 5 to 17 Years | 10 (5.8%) | 9 (3.8%) |
| 18 to 34 Years | 28 (8.5%) | 11 (3.5%) |
| 35 to 64 Years | 88 (20.5%) | 171 (27.1%) |
| 65 to 74 Years | 12 (8.5%) | 28 (30.8%) |
| 75 Years and over | 52 (69.3%) | 131 (60.7%) |
Disability Class by Sex by Age in Castroville
Disability Class: Hearing Difficulty
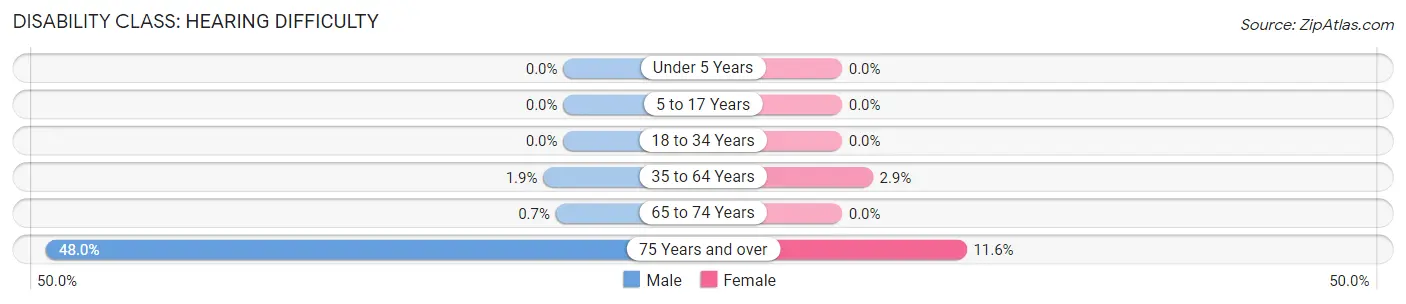
| Age Bracket | Male | Female |
| Under 5 Years | 0 (0.0%) | 0 (0.0%) |
| 5 to 17 Years | 0 (0.0%) | 0 (0.0%) |
| 18 to 34 Years | 0 (0.0%) | 0 (0.0%) |
| 35 to 64 Years | 8 (1.9%) | 18 (2.9%) |
| 65 to 74 Years | 1 (0.7%) | 0 (0.0%) |
| 75 Years and over | 36 (48.0%) | 25 (11.6%) |
Disability Class: Vision Difficulty
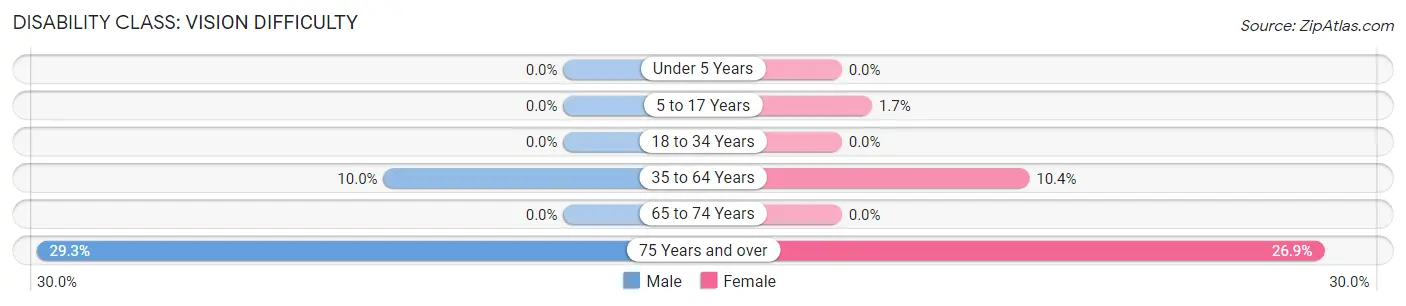
| Age Bracket | Male | Female |
| Under 5 Years | 0 (0.0%) | 0 (0.0%) |
| 5 to 17 Years | 0 (0.0%) | 4 (1.7%) |
| 18 to 34 Years | 0 (0.0%) | 0 (0.0%) |
| 35 to 64 Years | 43 (10.0%) | 66 (10.4%) |
| 65 to 74 Years | 0 (0.0%) | 0 (0.0%) |
| 75 Years and over | 22 (29.3%) | 58 (26.9%) |
Disability Class: Cognitive Difficulty
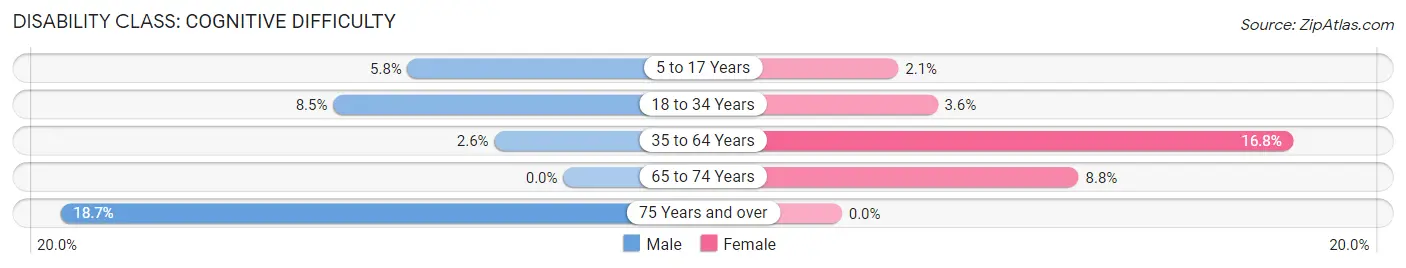
| Age Bracket | Male | Female |
| 5 to 17 Years | 10 (5.8%) | 5 (2.1%) |
| 18 to 34 Years | 28 (8.5%) | 11 (3.5%) |
| 35 to 64 Years | 11 (2.6%) | 106 (16.8%) |
| 65 to 74 Years | 0 (0.0%) | 8 (8.8%) |
| 75 Years and over | 14 (18.7%) | 0 (0.0%) |
Disability Class: Ambulatory Difficulty
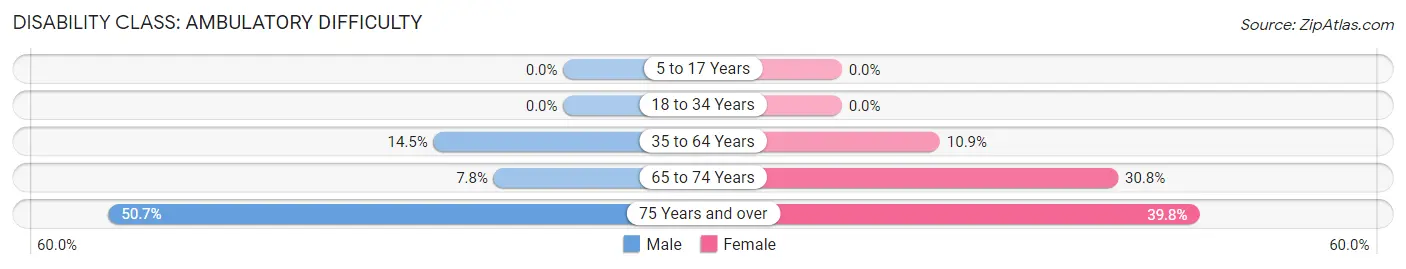
| Age Bracket | Male | Female |
| 5 to 17 Years | 0 (0.0%) | 0 (0.0%) |
| 18 to 34 Years | 0 (0.0%) | 0 (0.0%) |
| 35 to 64 Years | 62 (14.4%) | 69 (10.9%) |
| 65 to 74 Years | 11 (7.7%) | 28 (30.8%) |
| 75 Years and over | 38 (50.7%) | 86 (39.8%) |
Disability Class: Self-Care Difficulty
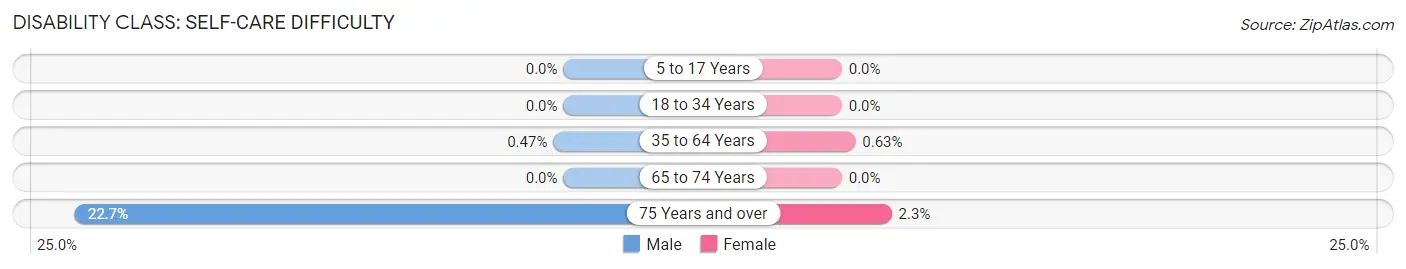
| Age Bracket | Male | Female |
| 5 to 17 Years | 0 (0.0%) | 0 (0.0%) |
| 18 to 34 Years | 0 (0.0%) | 0 (0.0%) |
| 35 to 64 Years | 2 (0.5%) | 4 (0.6%) |
| 65 to 74 Years | 0 (0.0%) | 0 (0.0%) |
| 75 Years and over | 17 (22.7%) | 5 (2.3%) |
Technology Access in Castroville
Computing Device Access in Castroville
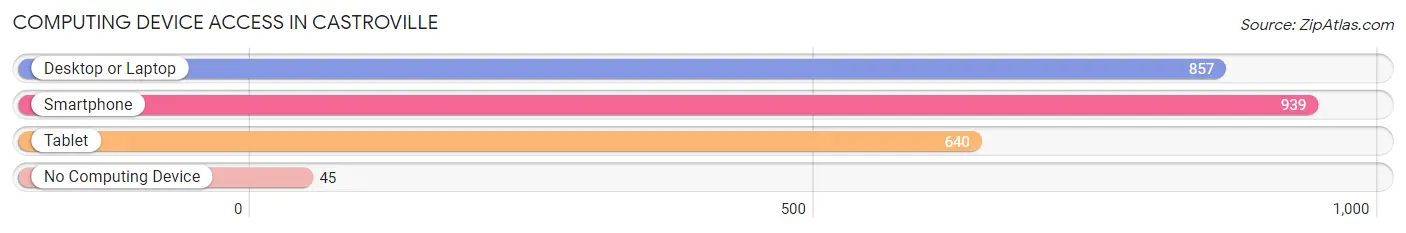
| Device Type | # Households | % Households |
| Desktop or Laptop | 857 | 76.0% |
| Smartphone | 939 | 83.2% |
| Tablet | 640 | 56.7% |
| No Computing Device | 45 | 4.0% |
| Total | 1,128 | 100.0% |
Internet Access in Castroville
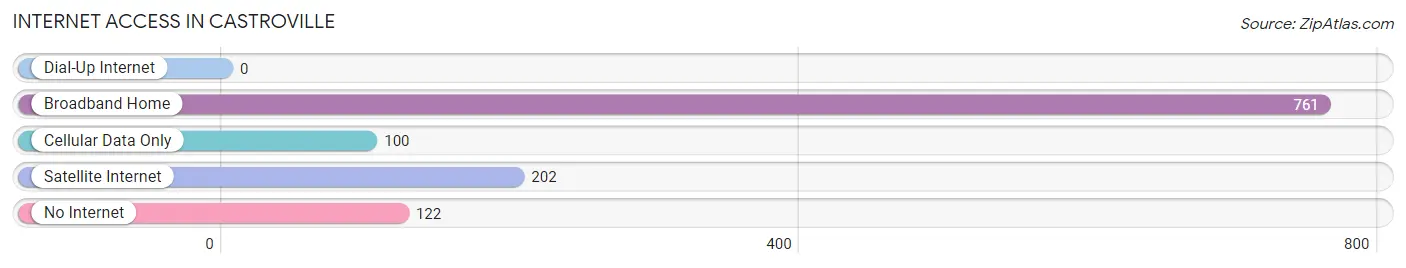
| Internet Type | # Households | % Households |
| Dial-Up Internet | 0 | 0.0% |
| Broadband Home | 761 | 67.5% |
| Cellular Data Only | 100 | 8.9% |
| Satellite Internet | 202 | 17.9% |
| No Internet | 122 | 10.8% |
| Total | 1,128 | 100.0% |
Castroville Summary
Castroville, Texas is a small town located in Medina County, Texas, United States. It is situated about 20 miles west of San Antonio and is part of the San Antonio–New Braunfels Metropolitan Statistical Area. The town was founded in 1844 by Henri Castro, a Jewish empresario from Alsace, France, who was granted land by the Republic of Texas to settle German and Alsatian immigrants. The town was named after him and is the oldest town in Medina County.
History
Castroville was founded in 1844 by Henri Castro, a Jewish empresario from Alsace, France. He was granted land by the Republic of Texas to settle German and Alsatian immigrants. The town was named after him and is the oldest town in Medina County. Castroville was the first capital of the Republic of the Rio Grande, a short-lived republic that existed from 1839 to 1842. The town was also the site of the Battle of Medina, the largest battle ever fought on Texas soil, in 1813.
In the late 19th century, the town was a popular tourist destination, with many visitors coming to see the historic buildings and the nearby Medina River. The town was also home to a number of businesses, including a hotel, a general store, a blacksmith shop, and a saloon.
Geography
Castroville is located in Medina County, Texas, about 20 miles west of San Antonio. It is situated at the intersection of U.S. Route 90 and State Highway 173. The town is surrounded by rolling hills and is located near the Medina River. The climate is semi-arid, with hot summers and mild winters.
Economy
The economy of Castroville is largely based on agriculture and tourism. The town is home to a number of farms, ranches, and wineries, and is a popular destination for bird watching and other outdoor activities. The town is also home to a number of businesses, including restaurants, shops, and hotels.
Demographics
As of the 2010 census, the population of Castroville was 2,680. The racial makeup of the town was 81.3% White, 0.7% African American, 0.3% Native American, 0.3% Asian, 0.1% Pacific Islander, 15.2% from other races, and 2.4% from two or more races. Hispanic or Latino of any race were 44.2% of the population.
The median household income in Castroville was $41,944, and the median family income was $48,958. The per capita income for the town was $19,945. About 15.2% of families and 18.2% of the population were below the poverty line, including 25.2% of those under age 18 and 11.2% of those age 65 or over.
Common Questions
What is Per Capita Income in Castroville?
Per Capita income in Castroville is $33,706.
What is the Median Family Income in Castroville?
Median Family Income in Castroville is $79,224.
What is the Median Household income in Castroville?
Median Household Income in Castroville is $72,805.
What is Income or Wage Gap in Castroville?
Income or Wage Gap in Castroville is 10.3%.
Women in Castroville earn 89.7 cents for every dollar earned by a man.
What is Inequality or Gini Index in Castroville?
Inequality or Gini Index in Castroville is 0.39.
What is the Total Population of Castroville?
Total Population of Castroville is 2,994.
What is the Total Male Population of Castroville?
Total Male Population of Castroville is 1,319.
What is the Total Female Population of Castroville?
Total Female Population of Castroville is 1,675.
What is the Ratio of Males per 100 Females in Castroville?
There are 78.75 Males per 100 Females in Castroville.
What is the Ratio of Females per 100 Males in Castroville?
There are 126.99 Females per 100 Males in Castroville.
What is the Median Population Age in Castroville?
Median Population Age in Castroville is 45.6 Years.
What is the Average Family Size in Castroville
Average Family Size in Castroville is 2.9 People.
What is the Average Household Size in Castroville
Average Household Size in Castroville is 2.6 People.
How Large is the Labor Force in Castroville?
There are 1,381 People in the Labor Forcein in Castroville.
What is the Percentage of People in the Labor Force in Castroville?
57.6% of People are in the Labor Force in Castroville.
What is the Unemployment Rate in Castroville?
Unemployment Rate in Castroville is 2.4%.