Carthage, TX Map & Demographics
Carthage Map
Carthage Overview
$33,110
PER CAPITA INCOME
$80,432
AVG FAMILY INCOME
$42,788
AVG HOUSEHOLD INCOME
25.8%
WAGE / INCOME GAP [ % ]
74.2¢/ $1
WAGE / INCOME GAP [ $ ]
$16,890
FAMILY INCOME DEFICIT
0.56
INEQUALITY / GINI INDEX
6,549
TOTAL POPULATION
3,167
MALE POPULATION
3,382
FEMALE POPULATION
93.64
MALES / 100 FEMALES
106.79
FEMALES / 100 MALES
36.4
MEDIAN AGE
3.2
AVG FAMILY SIZE
2.4
AVG HOUSEHOLD SIZE
2,773
LABOR FORCE [ PEOPLE ]
54.3%
PERCENT IN LABOR FORCE
0.8%
UNEMPLOYMENT RATE
Carthage Zip Codes
Income in Carthage
Income Overview in Carthage
Per Capita Income in Carthage is $33,110, while median incomes of families and households are $80,432 and $42,788 respectively.
| Characteristic | Number | Measure |
| Per Capita Income | 6,549 | $33,110 |
| Median Family Income | 1,524 | $80,432 |
| Mean Family Income | 1,524 | $97,933 |
| Median Household Income | 2,511 | $42,788 |
| Mean Household Income | 2,511 | $87,103 |
| Income Deficit | 1,524 | $16,890 |
| Wage / Income Gap (%) | 6,549 | 25.81% |
| Wage / Income Gap ($) | 6,549 | 74.19¢ per $1 |
| Gini / Inequality Index | 6,549 | 0.56 |
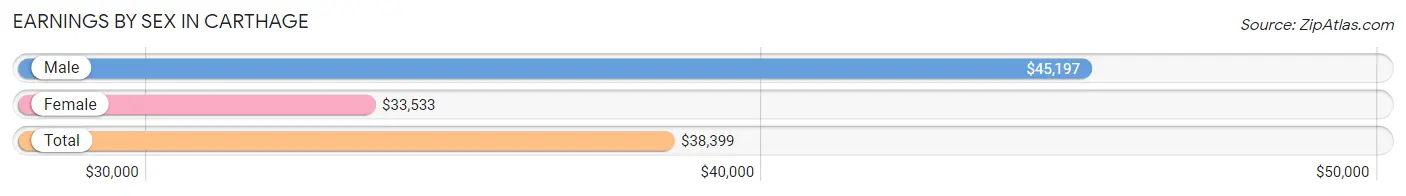
Earnings by Sex in Carthage
Average Earnings in Carthage are $38,399, $45,197 for men and $33,533 for women, a difference of 25.8%.
| Sex | Number | Average Earnings |
| Male | 1,410 (47.0%) | $45,197 |
| Female | 1,587 (52.9%) | $33,533 |
| Total | 2,997 (100.0%) | $38,399 |
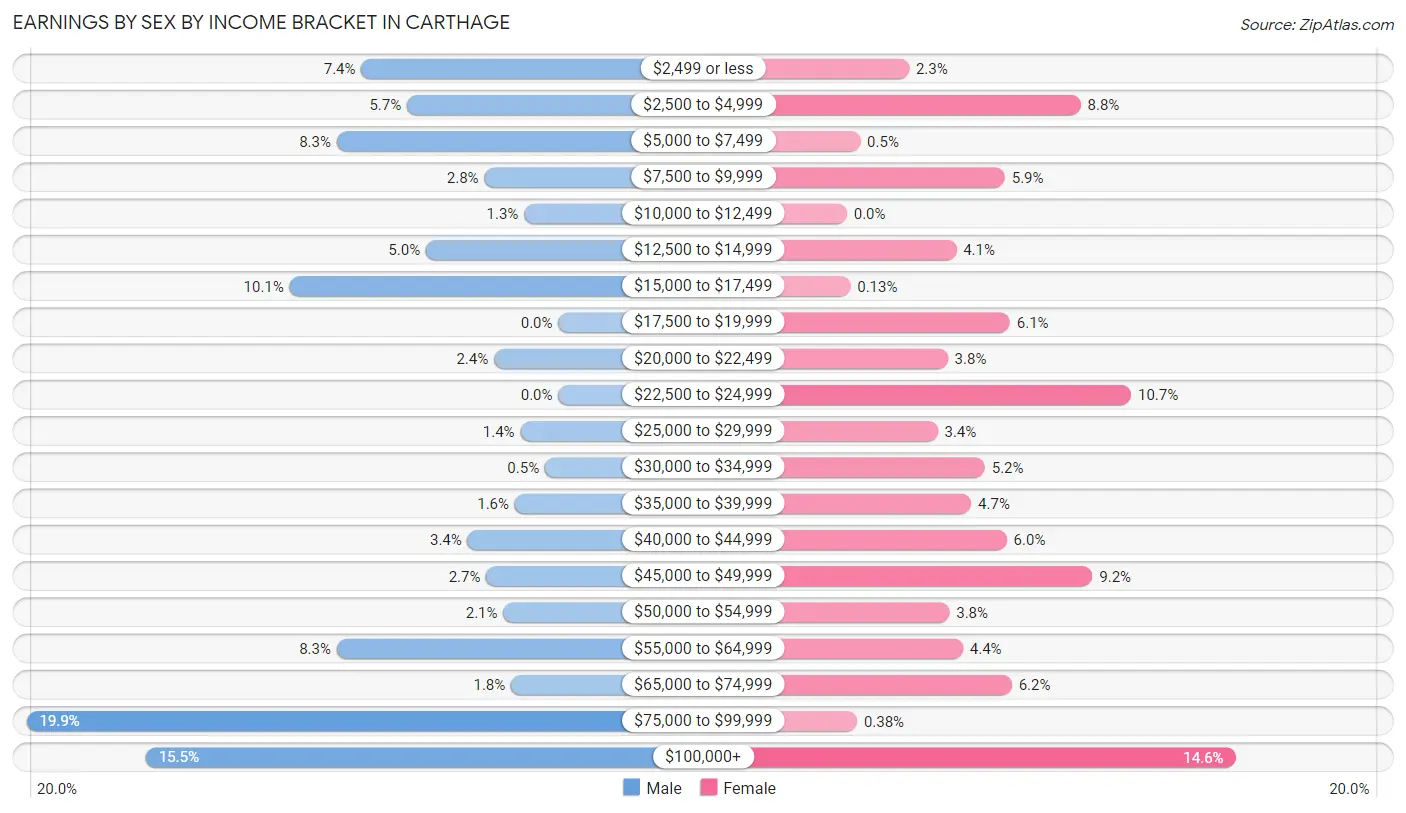
Earnings by Sex by Income Bracket in Carthage
The most common earnings brackets in Carthage are $75,000 to $99,999 for men (281 | 19.9%) and $100,000+ for women (231 | 14.6%).
| Income | Male | Female |
| $2,499 or less | 104 (7.4%) | 37 (2.3%) |
| $2,500 to $4,999 | 80 (5.7%) | 139 (8.8%) |
| $5,000 to $7,499 | 117 (8.3%) | 8 (0.5%) |
| $7,500 to $9,999 | 39 (2.8%) | 94 (5.9%) |
| $10,000 to $12,499 | 18 (1.3%) | 0 (0.0%) |
| $12,500 to $14,999 | 70 (5.0%) | 65 (4.1%) |
| $15,000 to $17,499 | 142 (10.1%) | 2 (0.1%) |
| $17,500 to $19,999 | 0 (0.0%) | 97 (6.1%) |
| $20,000 to $22,499 | 34 (2.4%) | 60 (3.8%) |
| $22,500 to $24,999 | 0 (0.0%) | 169 (10.6%) |
| $25,000 to $29,999 | 20 (1.4%) | 54 (3.4%) |
| $30,000 to $34,999 | 7 (0.5%) | 82 (5.2%) |
| $35,000 to $39,999 | 23 (1.6%) | 74 (4.7%) |
| $40,000 to $44,999 | 48 (3.4%) | 95 (6.0%) |
| $45,000 to $49,999 | 38 (2.7%) | 146 (9.2%) |
| $50,000 to $54,999 | 29 (2.1%) | 61 (3.8%) |
| $55,000 to $64,999 | 117 (8.3%) | 69 (4.3%) |
| $65,000 to $74,999 | 25 (1.8%) | 98 (6.2%) |
| $75,000 to $99,999 | 281 (19.9%) | 6 (0.4%) |
| $100,000+ | 218 (15.5%) | 231 (14.6%) |
| Total | 1,410 (100.0%) | 1,587 (100.0%) |
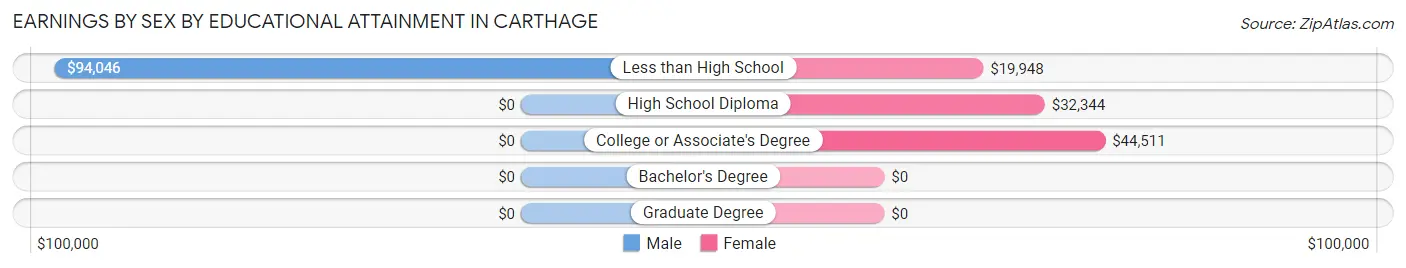
Earnings by Sex by Educational Attainment in Carthage
Average earnings in Carthage are $62,148 for men and $41,875 for women, a difference of 32.6%. Men with an educational attainment of less than high school enjoy the highest average annual earnings of $94,046, while those with less than high school education earn the least with $94,046. Women with an educational attainment of college or associate's degree earn the most with the average annual earnings of $44,511, while those with less than high school education have the smallest earnings of $19,948.
| Educational Attainment | Male Income | Female Income |
| Less than High School | $94,046 | $19,948 |
| High School Diploma | - | - |
| College or Associate's Degree | - | - |
| Bachelor's Degree | - | - |
| Graduate Degree | - | - |
| Total | $62,148 | $41,875 |
Family Income in Carthage
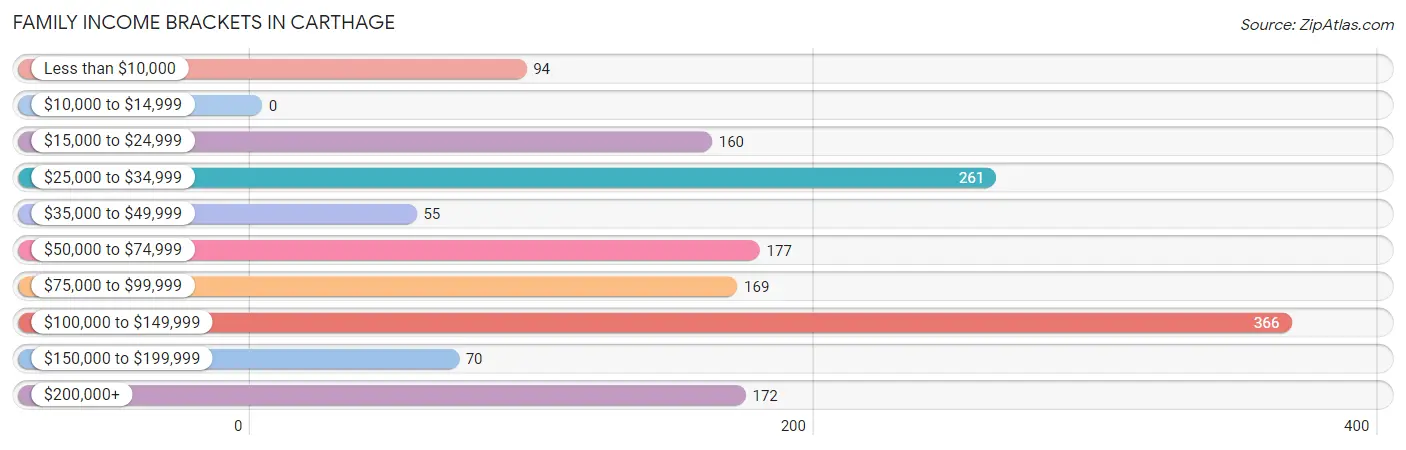
Family Income Brackets in Carthage
According to the Carthage family income data, there are 366 families falling into the $100,000 to $149,999 income range, which is the most common income bracket and makes up 24.0% of all families.
| Income Bracket | # Families | % Families |
| Less than $10,000 | 94 | 6.2% |
| $10,000 to $14,999 | 0 | 0.0% |
| $15,000 to $24,999 | 160 | 10.5% |
| $25,000 to $34,999 | 261 | 17.1% |
| $35,000 to $49,999 | 55 | 3.6% |
| $50,000 to $74,999 | 177 | 11.6% |
| $75,000 to $99,999 | 169 | 11.1% |
| $100,000 to $149,999 | 366 | 24.0% |
| $150,000 to $199,999 | 70 | 4.6% |
| $200,000+ | 172 | 11.3% |
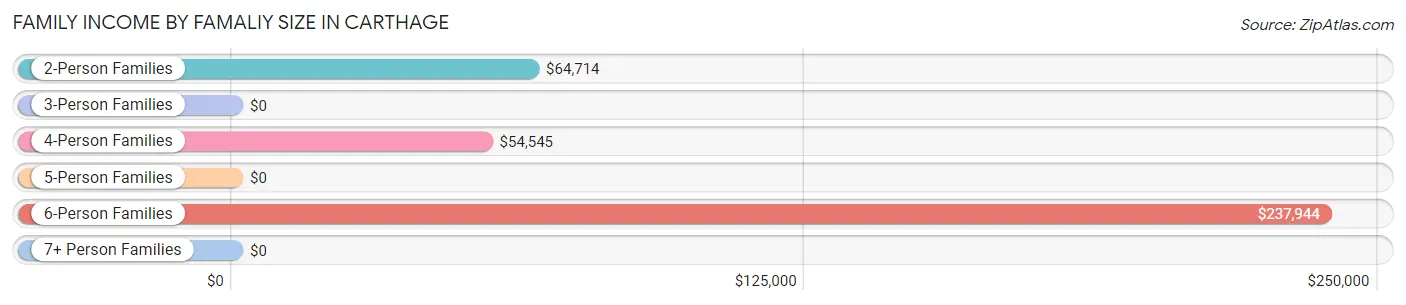
Family Income by Famaliy Size in Carthage
6-person families (153 | 10.0%) account for the highest median family income in Carthage with $237,944 per family, while 6-person families (153 | 10.0%) have the highest median income of $39,657 per family member.
| Income Bracket | # Families | Median Income |
| 2-Person Families | 786 (51.6%) | $64,714 |
| 3-Person Families | 161 (10.6%) | $0 |
| 4-Person Families | 308 (20.2%) | $54,545 |
| 5-Person Families | 116 (7.6%) | $0 |
| 6-Person Families | 153 (10.0%) | $237,944 |
| 7+ Person Families | 0 (0.0%) | $0 |
| Total | 1,524 (100.0%) | $80,432 |
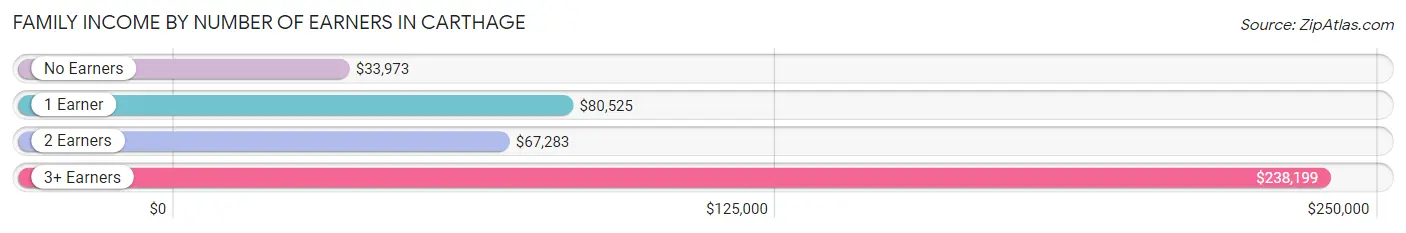
Family Income by Number of Earners in Carthage
The median family income in Carthage is $80,432, with families comprising 3+ earners (234) having the highest median family income of $238,199, while families with no earners (272) have the lowest median family income of $33,973, accounting for 15.3% and 17.8% of families, respectively.
| Number of Earners | # Families | Median Income |
| No Earners | 272 (17.8%) | $33,973 |
| 1 Earner | 620 (40.7%) | $80,525 |
| 2 Earners | 398 (26.1%) | $67,283 |
| 3+ Earners | 234 (15.3%) | $238,199 |
| Total | 1,524 (100.0%) | $80,432 |
Household Income in Carthage
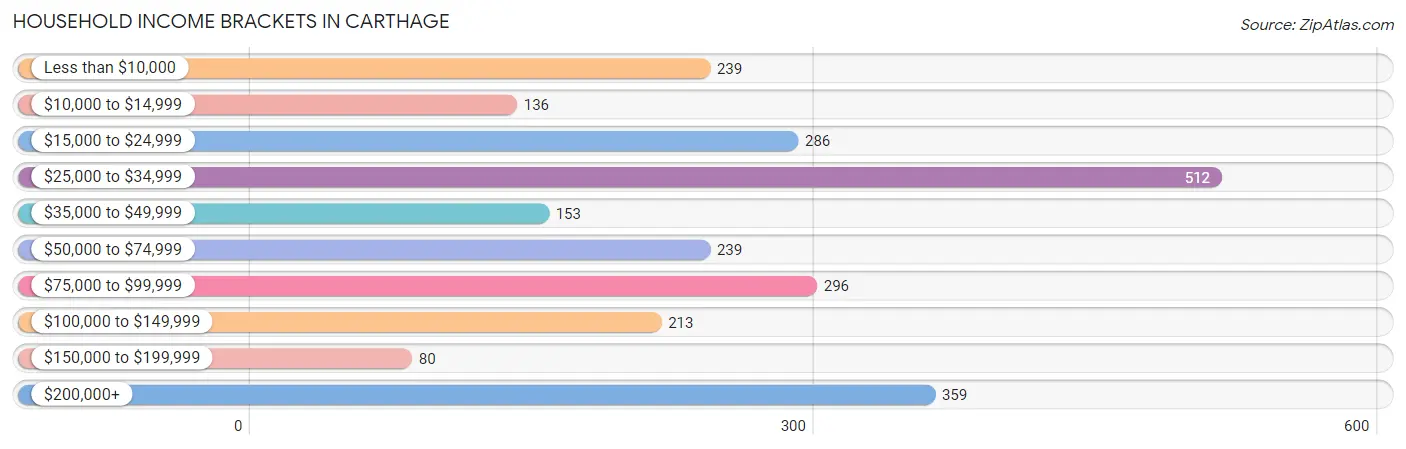
Household Income Brackets in Carthage
With 512 households falling in the category, the $25,000 to $34,999 income range is the most frequent in Carthage, accounting for 20.4% of all households. In contrast, only 80 households (3.2%) fall into the $150,000 to $199,999 income bracket, making it the least populous group.
| Income Bracket | # Households | % Households |
| Less than $10,000 | 239 | 9.5% |
| $10,000 to $14,999 | 136 | 5.4% |
| $15,000 to $24,999 | 286 | 11.4% |
| $25,000 to $34,999 | 512 | 20.4% |
| $35,000 to $49,999 | 153 | 6.1% |
| $50,000 to $74,999 | 239 | 9.5% |
| $75,000 to $99,999 | 296 | 11.8% |
| $100,000 to $149,999 | 213 | 8.5% |
| $150,000 to $199,999 | 80 | 3.2% |
| $200,000+ | 359 | 14.3% |
Household Income by Householder Age in Carthage
The median household income in Carthage is $42,788, with the highest median household income of $63,580 found in the 25 to 44 years age bracket for the primary householder. A total of 619 households (24.6%) fall into this category. Meanwhile, the 45 to 64 years age bracket for the primary householder has the lowest median household income of $0, with 1,156 households (46.0%) in this group.
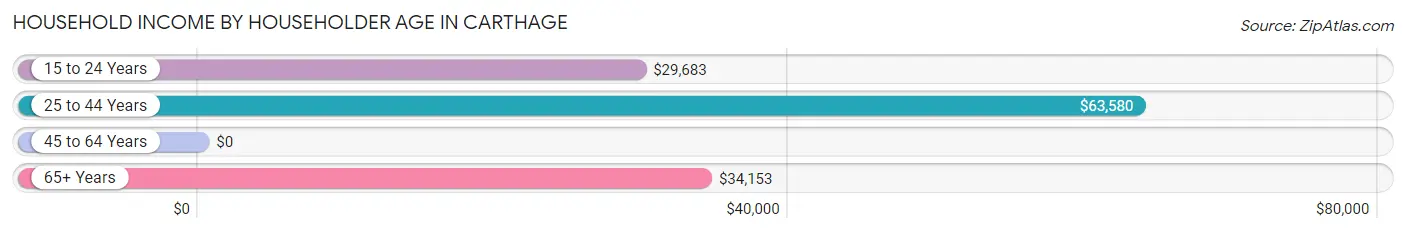
| Income Bracket | # Households | Median Income |
| 15 to 24 Years | 110 (4.4%) | $29,683 |
| 25 to 44 Years | 619 (24.6%) | $63,580 |
| 45 to 64 Years | 1,156 (46.0%) | $0 |
| 65+ Years | 626 (24.9%) | $34,153 |
| Total | 2,511 (100.0%) | $42,788 |
Poverty in Carthage
Income Below Poverty by Sex and Age in Carthage
With 15.0% poverty level for males and 24.9% for females among the residents of Carthage, 5 year old males and 12 to 14 year old females are the most vulnerable to poverty, with 50 males (44.6%) and 50 females (80.6%) in their respective age groups living below the poverty level.
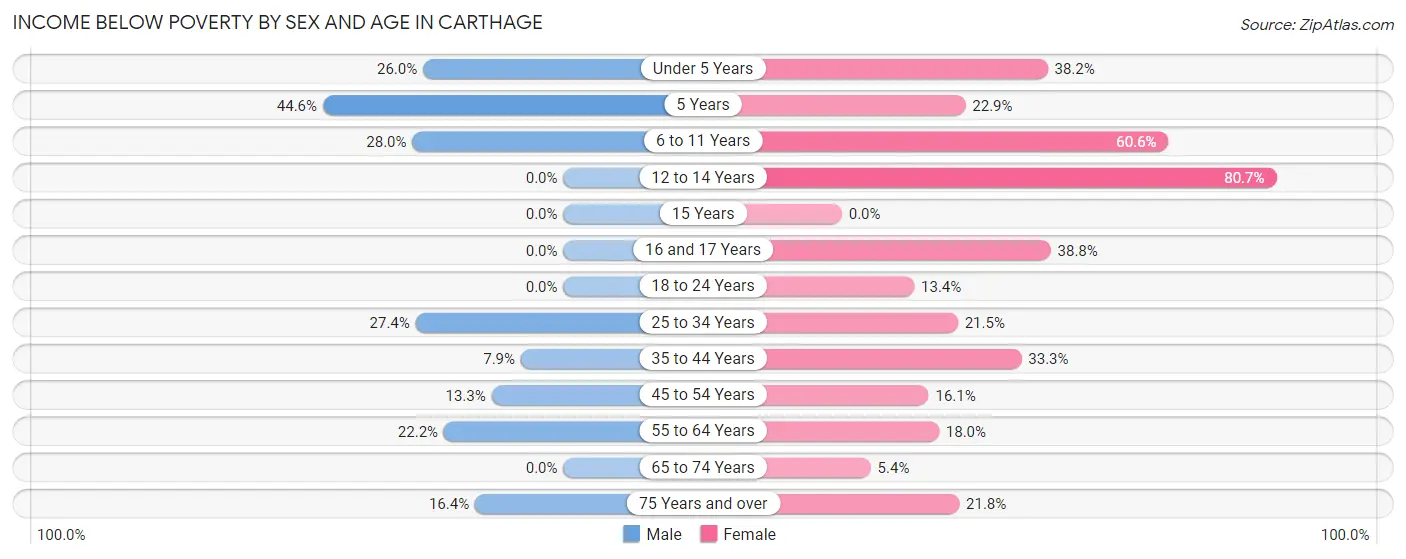
| Age Bracket | Male | Female |
| Under 5 Years | 69 (26.0%) | 76 (38.2%) |
| 5 Years | 50 (44.6%) | 25 (22.9%) |
| 6 to 11 Years | 51 (28.0%) | 137 (60.6%) |
| 12 to 14 Years | 0 (0.0%) | 50 (80.6%) |
| 15 Years | 0 (0.0%) | 0 (0.0%) |
| 16 and 17 Years | 0 (0.0%) | 50 (38.8%) |
| 18 to 24 Years | 0 (0.0%) | 42 (13.4%) |
| 25 to 34 Years | 68 (27.4%) | 85 (21.5%) |
| 35 to 44 Years | 27 (7.9%) | 81 (33.3%) |
| 45 to 54 Years | 49 (13.3%) | 63 (16.1%) |
| 55 to 64 Years | 104 (22.2%) | 93 (18.0%) |
| 65 to 74 Years | 0 (0.0%) | 14 (5.4%) |
| 75 Years and over | 31 (16.4%) | 59 (21.8%) |
| Total | 449 (15.0%) | 775 (24.9%) |
Income Above Poverty by Sex and Age in Carthage
According to the poverty statistics in Carthage, males aged 12 to 14 years and females aged 65 to 74 years are the age groups that are most secure financially, with 100.0% of males and 94.6% of females in these age groups living above the poverty line.
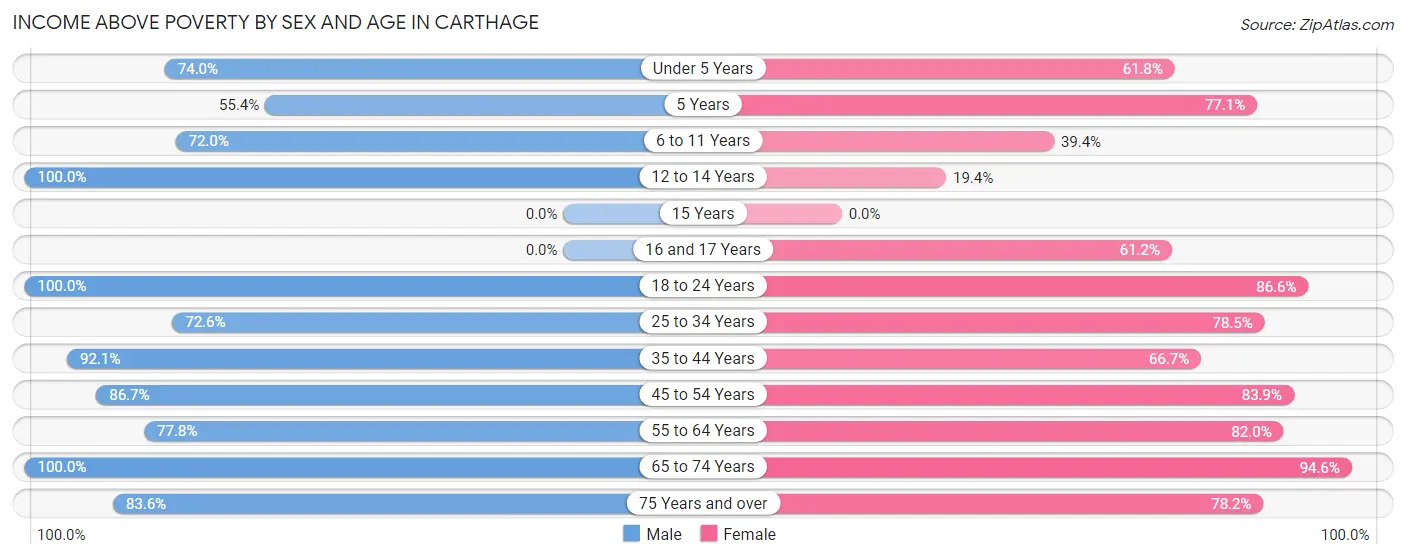
| Age Bracket | Male | Female |
| Under 5 Years | 196 (74.0%) | 123 (61.8%) |
| 5 Years | 62 (55.4%) | 84 (77.1%) |
| 6 to 11 Years | 131 (72.0%) | 89 (39.4%) |
| 12 to 14 Years | 244 (100.0%) | 12 (19.4%) |
| 15 Years | 0 (0.0%) | 0 (0.0%) |
| 16 and 17 Years | 0 (0.0%) | 79 (61.2%) |
| 18 to 24 Years | 342 (100.0%) | 271 (86.6%) |
| 25 to 34 Years | 180 (72.6%) | 310 (78.5%) |
| 35 to 44 Years | 315 (92.1%) | 162 (66.7%) |
| 45 to 54 Years | 319 (86.7%) | 328 (83.9%) |
| 55 to 64 Years | 365 (77.8%) | 423 (82.0%) |
| 65 to 74 Years | 235 (100.0%) | 247 (94.6%) |
| 75 Years and over | 158 (83.6%) | 212 (78.2%) |
| Total | 2,547 (85.0%) | 2,340 (75.1%) |
Income Below Poverty Among Married-Couple Families in Carthage
The poverty statistics for married-couple families in Carthage show that 7.3% or 77 of the total 1,058 families live below the poverty line. Families with 3 or 4 children have the highest poverty rate of 21.3%, comprising of 46 families. On the other hand, families with no children have the lowest poverty rate of 2.1%, which includes 13 families.
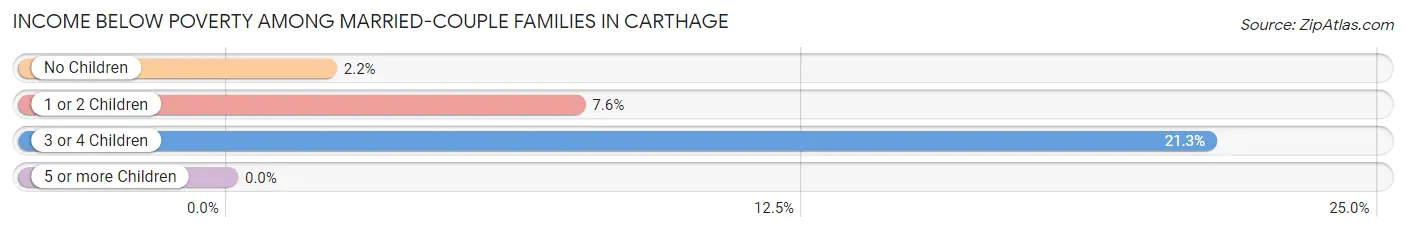
| Children | Above Poverty | Below Poverty |
| No Children | 591 (97.9%) | 13 (2.1%) |
| 1 or 2 Children | 220 (92.4%) | 18 (7.6%) |
| 3 or 4 Children | 170 (78.7%) | 46 (21.3%) |
| 5 or more Children | 0 (0.0%) | 0 (0.0%) |
| Total | 981 (92.7%) | 77 (7.3%) |
Income Below Poverty Among Single-Parent Households in Carthage
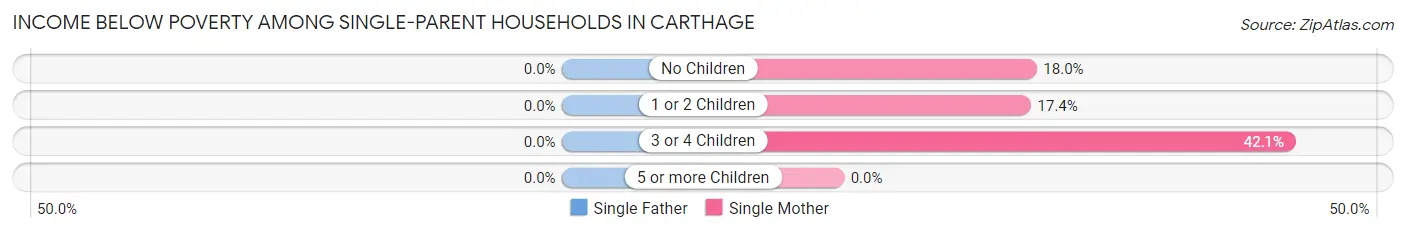
| Children | Single Father | Single Mother |
| No Children | 0 (0.0%) | 14 (17.9%) |
| 1 or 2 Children | 0 (0.0%) | 51 (17.4%) |
| 3 or 4 Children | 0 (0.0%) | 40 (42.1%) |
| 5 or more Children | 0 (0.0%) | 0 (0.0%) |
| Total | 0 (0.0%) | 105 (22.5%) |
Income Below Poverty Among Married-Couple vs Single-Parent Households in Carthage
The poverty data for Carthage shows that 77 of the married-couple family households (7.3%) and 105 of the single-parent households (22.5%) are living below the poverty level. Within the married-couple family households, those with 3 or 4 children have the highest poverty rate, with 46 households (21.3%) falling below the poverty line. Among the single-parent households, those with 3 or 4 children have the highest poverty rate, with 40 household (42.1%) living below poverty.
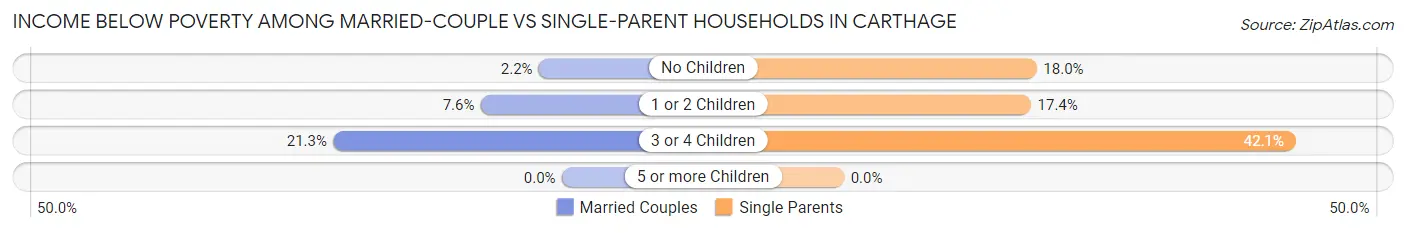
| Children | Married-Couple Families | Single-Parent Households |
| No Children | 13 (2.1%) | 14 (17.9%) |
| 1 or 2 Children | 18 (7.6%) | 51 (17.4%) |
| 3 or 4 Children | 46 (21.3%) | 40 (42.1%) |
| 5 or more Children | 0 (0.0%) | 0 (0.0%) |
| Total | 77 (7.3%) | 105 (22.5%) |
Race in Carthage
The most populous races in Carthage are White / Caucasian (4,820 | 73.6%), Hispanic or Latino (1,100 | 16.8%), and Black / African American (786 | 12.0%).
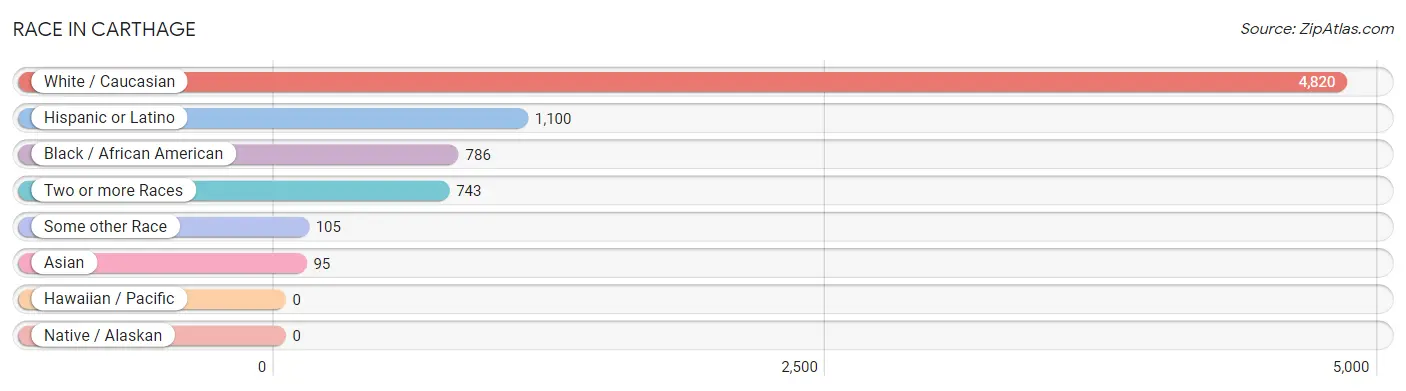
| Race | # Population | % Population |
| Asian | 95 | 1.5% |
| Black / African American | 786 | 12.0% |
| Hawaiian / Pacific | 0 | 0.0% |
| Hispanic or Latino | 1,100 | 16.8% |
| Native / Alaskan | 0 | 0.0% |
| White / Caucasian | 4,820 | 73.6% |
| Two or more Races | 743 | 11.4% |
| Some other Race | 105 | 1.6% |
| Total | 6,549 | 100.0% |
Ancestry in Carthage
The most populous ancestries reported in Carthage are German (989 | 15.1%), Mexican (955 | 14.6%), Irish (944 | 14.4%), American (781 | 11.9%), and French (495 | 7.6%), together accounting for 63.6% of all Carthage residents.
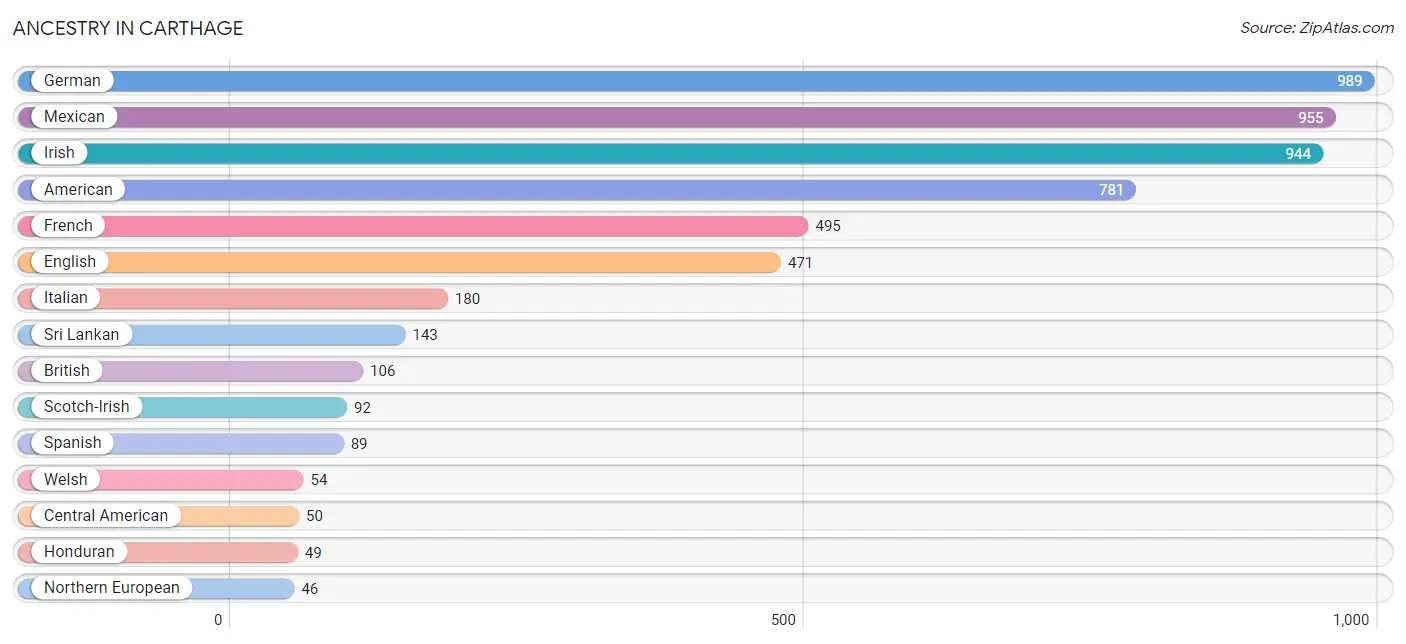
| Ancestry | # Population | % Population |
| African | 3 | 0.1% |
| American | 781 | 11.9% |
| Brazilian | 5 | 0.1% |
| British | 106 | 1.6% |
| Central American | 50 | 0.8% |
| Cherokee | 12 | 0.2% |
| Dutch | 3 | 0.1% |
| Ecuadorian | 4 | 0.1% |
| English | 471 | 7.2% |
| European | 8 | 0.1% |
| French | 495 | 7.6% |
| French Canadian | 12 | 0.2% |
| German | 989 | 15.1% |
| Honduran | 49 | 0.7% |
| Indian (Asian) | 3 | 0.1% |
| Irish | 944 | 14.4% |
| Italian | 180 | 2.8% |
| Japanese | 33 | 0.5% |
| Korean | 34 | 0.5% |
| Mexican | 955 | 14.6% |
| Nigerian | 5 | 0.1% |
| Northern European | 46 | 0.7% |
| Norwegian | 5 | 0.1% |
| Salvadoran | 1 | 0.0% |
| Scotch-Irish | 92 | 1.4% |
| Scottish | 42 | 0.6% |
| Senegalese | 9 | 0.1% |
| South American | 4 | 0.1% |
| Spanish | 89 | 1.4% |
| Sri Lankan | 143 | 2.2% |
| Subsaharan African | 17 | 0.3% |
| Thai | 10 | 0.2% |
| Welsh | 54 | 0.8% | View All 33 Rows |
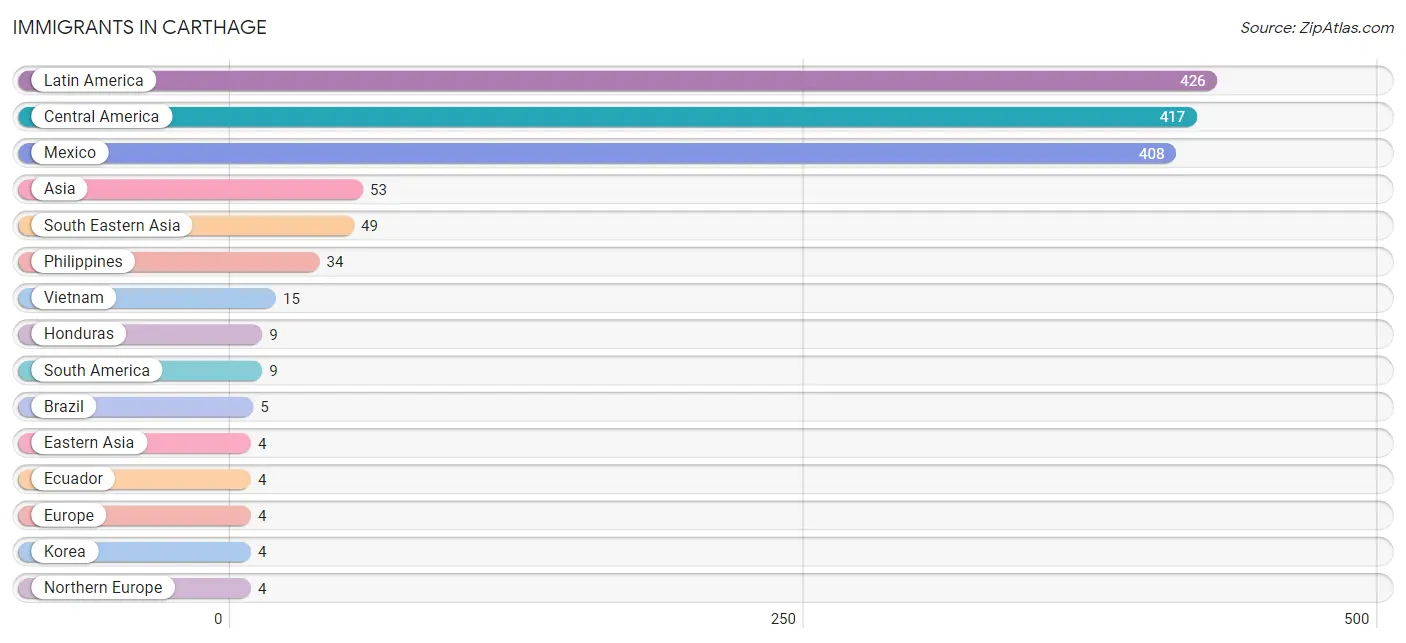
Immigrants in Carthage
The most numerous immigrant groups reported in Carthage came from Latin America (426 | 6.5%), Central America (417 | 6.4%), Mexico (408 | 6.2%), Asia (53 | 0.8%), and South Eastern Asia (49 | 0.7%), together accounting for 20.7% of all Carthage residents.
| Immigration Origin | # Population | % Population |
| Asia | 53 | 0.8% |
| Brazil | 5 | 0.1% |
| Central America | 417 | 6.4% |
| Eastern Asia | 4 | 0.1% |
| Ecuador | 4 | 0.1% |
| Europe | 4 | 0.1% |
| Honduras | 9 | 0.1% |
| Korea | 4 | 0.1% |
| Latin America | 426 | 6.5% |
| Mexico | 408 | 6.2% |
| Northern Europe | 4 | 0.1% |
| Philippines | 34 | 0.5% |
| Scotland | 4 | 0.1% |
| South America | 9 | 0.1% |
| South Eastern Asia | 49 | 0.7% |
| Vietnam | 15 | 0.2% | View All 16 Rows |
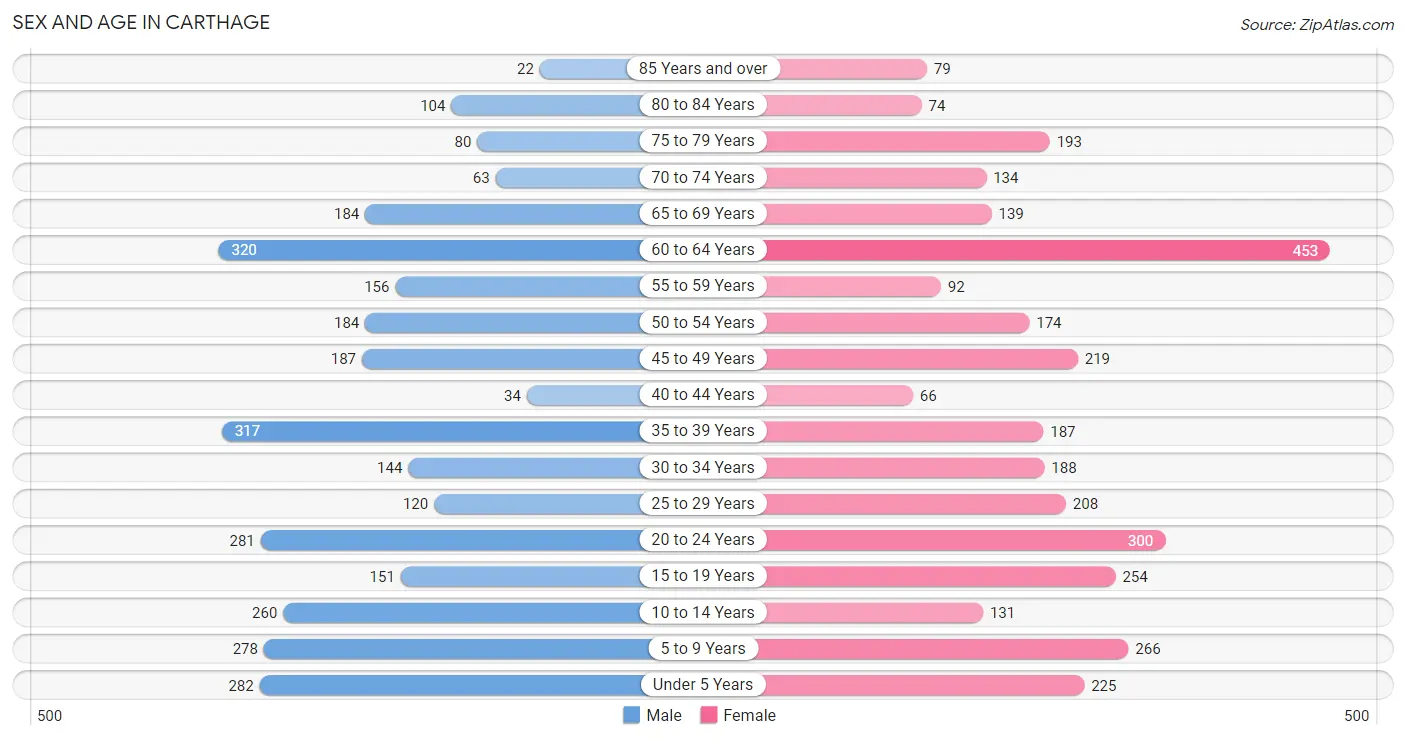
Sex and Age in Carthage
Sex and Age in Carthage
The most populous age groups in Carthage are 60 to 64 Years (320 | 10.1%) for men and 60 to 64 Years (453 | 13.4%) for women.
| Age Bracket | Male | Female |
| Under 5 Years | 282 (8.9%) | 225 (6.7%) |
| 5 to 9 Years | 278 (8.8%) | 266 (7.9%) |
| 10 to 14 Years | 260 (8.2%) | 131 (3.9%) |
| 15 to 19 Years | 151 (4.8%) | 254 (7.5%) |
| 20 to 24 Years | 281 (8.9%) | 300 (8.9%) |
| 25 to 29 Years | 120 (3.8%) | 208 (6.1%) |
| 30 to 34 Years | 144 (4.5%) | 188 (5.6%) |
| 35 to 39 Years | 317 (10.0%) | 187 (5.5%) |
| 40 to 44 Years | 34 (1.1%) | 66 (1.9%) |
| 45 to 49 Years | 187 (5.9%) | 219 (6.5%) |
| 50 to 54 Years | 184 (5.8%) | 174 (5.1%) |
| 55 to 59 Years | 156 (4.9%) | 92 (2.7%) |
| 60 to 64 Years | 320 (10.1%) | 453 (13.4%) |
| 65 to 69 Years | 184 (5.8%) | 139 (4.1%) |
| 70 to 74 Years | 63 (2.0%) | 134 (4.0%) |
| 75 to 79 Years | 80 (2.5%) | 193 (5.7%) |
| 80 to 84 Years | 104 (3.3%) | 74 (2.2%) |
| 85 Years and over | 22 (0.7%) | 79 (2.3%) |
| Total | 3,167 (100.0%) | 3,382 (100.0%) |
Families and Households in Carthage
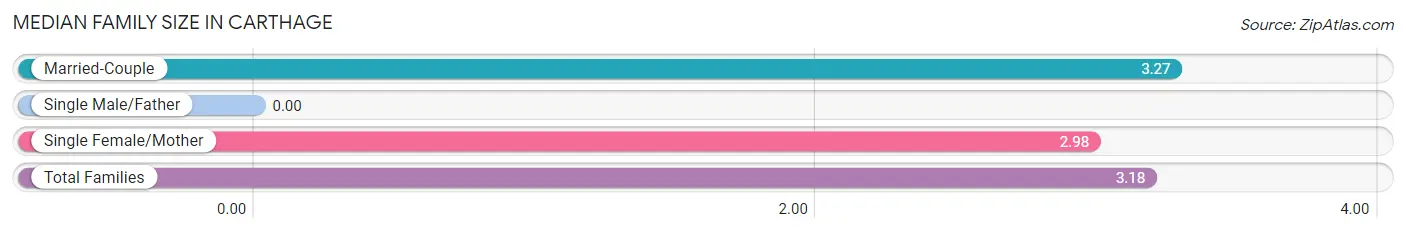
Median Family Size in Carthage
| Family Type | # Families | Family Size |
| Married-Couple | 1,058 (69.4%) | 3.27 |
| Single Male/Father | 0 (0.0%) | - |
| Single Female/Mother | 466 (30.6%) | 2.98 |
| Total Families | 1,524 (100.0%) | 3.18 |
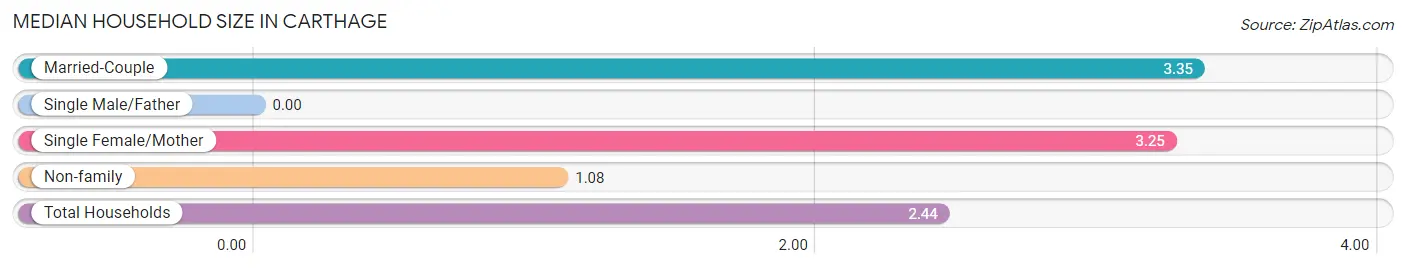
Median Household Size in Carthage
| Household Type | # Households | Household Size |
| Married-Couple | 1,058 (42.1%) | 3.35 |
| Single Male/Father | 0 (0.0%) | - |
| Single Female/Mother | 466 (18.6%) | 3.25 |
| Non-family | 987 (39.3%) | 1.08 |
| Total Households | 2,511 (100.0%) | 2.44 |
Household Size by Marriage Status in Carthage
Out of a total of 2,511 households in Carthage, 1,524 (60.7%) are family households, while 987 (39.3%) are nonfamily households. The most numerous type of family households are 2-person households, comprising 609, and the most common type of nonfamily households are 1-person households, comprising 889.
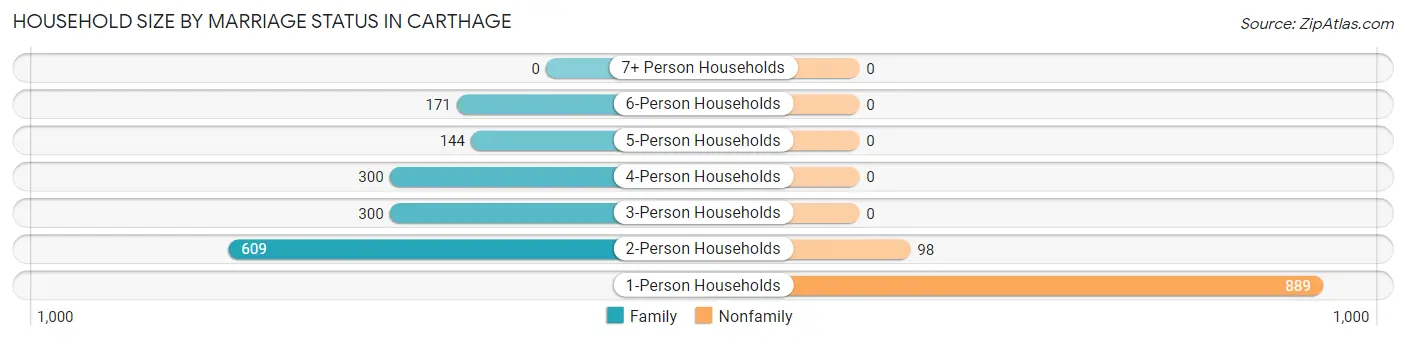
| Household Size | Family Households | Nonfamily Households |
| 1-Person Households | - | 889 (35.4%) |
| 2-Person Households | 609 (24.2%) | 98 (3.9%) |
| 3-Person Households | 300 (11.9%) | 0 (0.0%) |
| 4-Person Households | 300 (11.9%) | 0 (0.0%) |
| 5-Person Households | 144 (5.7%) | 0 (0.0%) |
| 6-Person Households | 171 (6.8%) | 0 (0.0%) |
| 7+ Person Households | 0 (0.0%) | 0 (0.0%) |
| Total | 1,524 (60.7%) | 987 (39.3%) |
Female Fertility in Carthage
Fertility by Age in Carthage
Average fertility rate in Carthage is 120.0 births per 1,000 women. Women in the age bracket of 20 to 34 years have the highest fertility rate with 253.0 births per 1,000 women. Women in the age bracket of 20 to 34 years acount for 100.0% of all women with births.
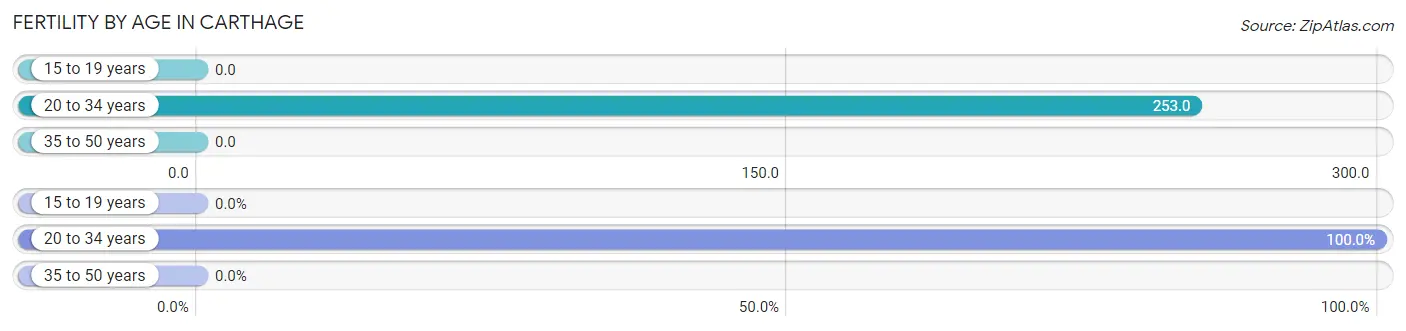
| Age Bracket | Women with Births | Births / 1,000 Women |
| 15 to 19 years | 0 (0.0%) | 0.0 |
| 20 to 34 years | 176 (100.0%) | 253.0 |
| 35 to 50 years | 0 (0.0%) | 0.0 |
| Total | 176 (100.0%) | 120.0 |
Fertility by Age by Marriage Status in Carthage
68.8% of women with births (176) in Carthage are married. The highest percentage of unmarried women with births falls into 20 to 34 years age bracket with 31.2% of them unmarried at the time of birth, while the lowest percentage of unmarried women with births belong to 20 to 34 years age bracket with 31.2% of them unmarried.
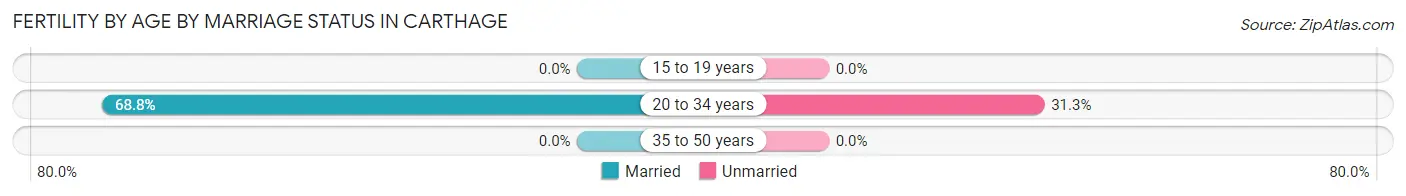
| Age Bracket | Married | Unmarried |
| 15 to 19 years | 0 (0.0%) | 0 (0.0%) |
| 20 to 34 years | 121 (68.8%) | 55 (31.2%) |
| 35 to 50 years | 0 (0.0%) | 0 (0.0%) |
| Total | 121 (68.8%) | 55 (31.2%) |
Fertility by Education in Carthage
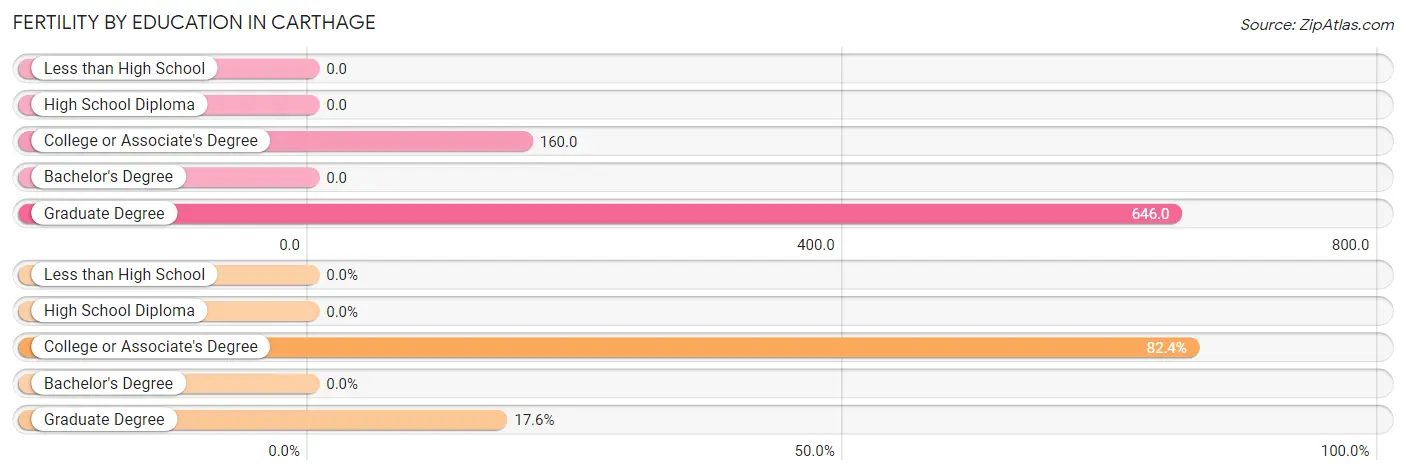
| Educational Attainment | Women with Births | Births / 1,000 Women |
| Less than High School | 0 (0.0%) | 0.0 |
| High School Diploma | 0 (0.0%) | 0.0 |
| College or Associate's Degree | 145 (82.4%) | 160.0 |
| Bachelor's Degree | 0 (0.0%) | 0.0 |
| Graduate Degree | 31 (17.6%) | 646.0 |
| Total | 176 (100.0%) | 120.0 |
Fertility by Education by Marriage Status in Carthage
31.2% of women with births in Carthage are unmarried. Women with the educational attainment of graduate degree are most likely to be married with 100.0% of them married at childbirth, while women with the educational attainment of college or associate's degree are least likely to be married with 37.9% of them unmarried at childbirth.
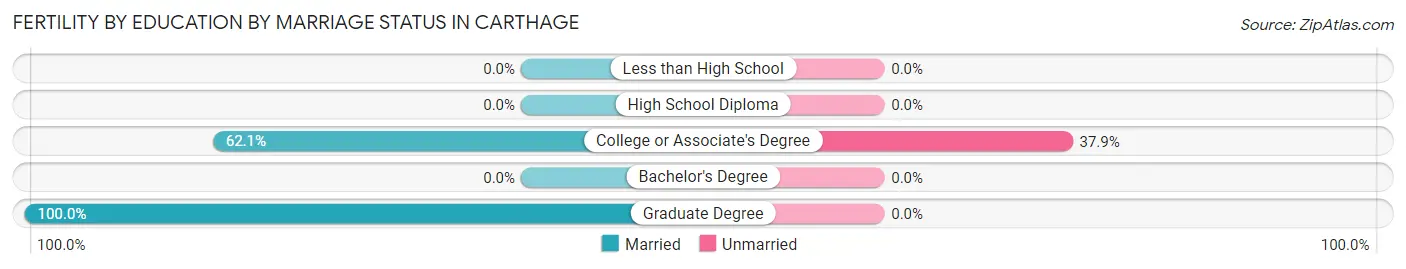
| Educational Attainment | Married | Unmarried |
| Less than High School | 0 (0.0%) | 0 (0.0%) |
| High School Diploma | 0 (0.0%) | 0 (0.0%) |
| College or Associate's Degree | 90 (62.1%) | 55 (37.9%) |
| Bachelor's Degree | 0 (0.0%) | 0 (0.0%) |
| Graduate Degree | 31 (100.0%) | 0 (0.0%) |
| Total | 121 (68.8%) | 55 (31.2%) |
Employment Characteristics in Carthage
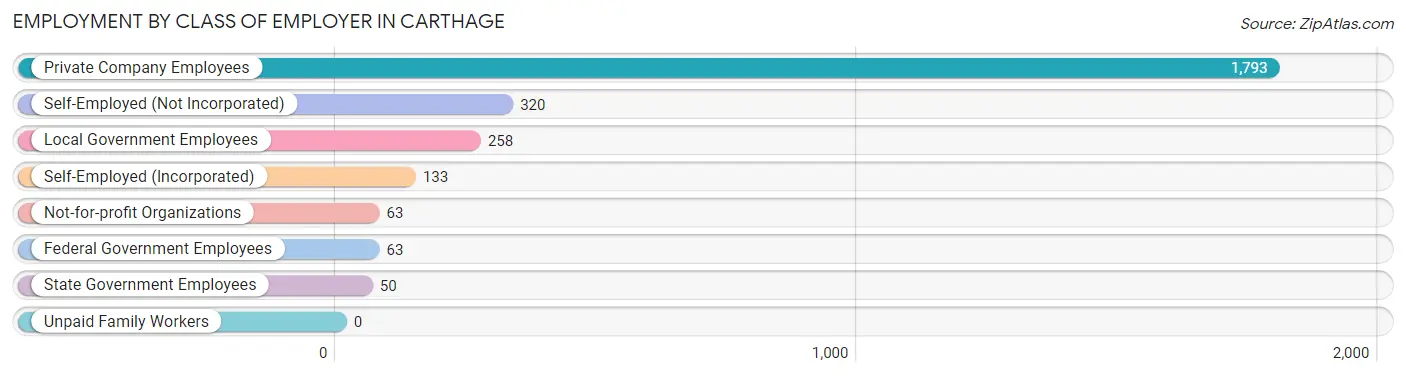
Employment by Class of Employer in Carthage
Among the 2,680 employed individuals in Carthage, private company employees (1,793 | 66.9%), self-employed (not incorporated) (320 | 11.9%), and local government employees (258 | 9.6%) make up the most common classes of employment.
| Employer Class | # Employees | % Employees |
| Private Company Employees | 1,793 | 66.9% |
| Self-Employed (Incorporated) | 133 | 5.0% |
| Self-Employed (Not Incorporated) | 320 | 11.9% |
| Not-for-profit Organizations | 63 | 2.4% |
| Local Government Employees | 258 | 9.6% |
| State Government Employees | 50 | 1.9% |
| Federal Government Employees | 63 | 2.4% |
| Unpaid Family Workers | 0 | 0.0% |
| Total | 2,680 | 100.0% |
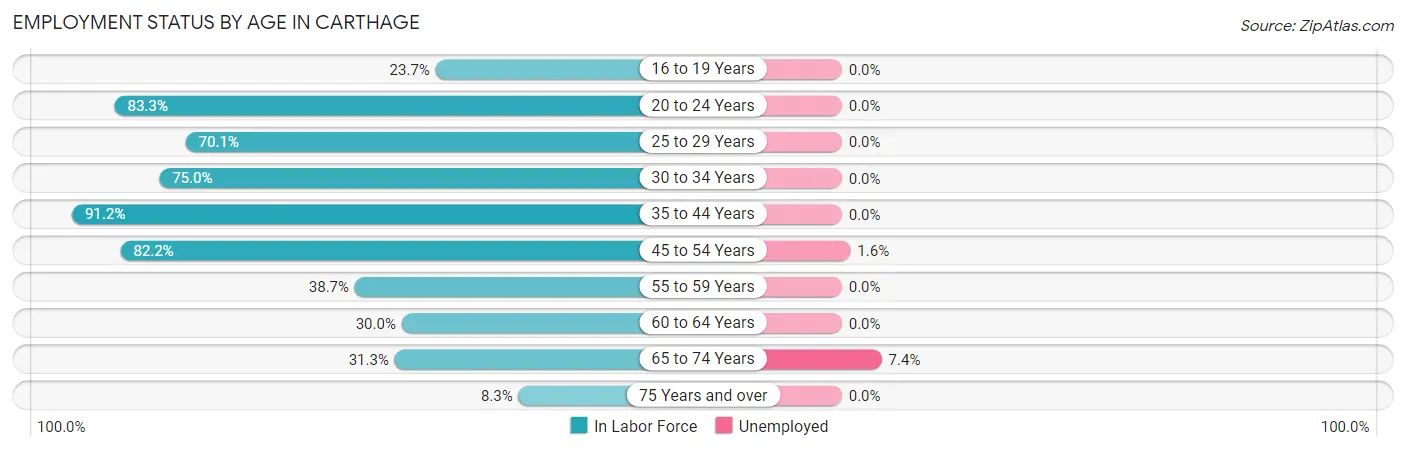
Employment Status by Age in Carthage
According to the labor force statistics for Carthage, out of the total population over 16 years of age (5,107), 54.3% or 2,773 individuals are in the labor force, with 0.8% or 22 of them unemployed. The age group with the highest labor force participation rate is 35 to 44 years, with 91.2% or 551 individuals in the labor force. Within the labor force, the 65 to 74 years age range has the highest percentage of unemployed individuals, with 7.4% or 12 of them being unemployed.
| Age Bracket | In Labor Force | Unemployed |
| 16 to 19 Years | 96 (23.7%) | 0 (0.0%) |
| 20 to 24 Years | 484 (83.3%) | 0 (0.0%) |
| 25 to 29 Years | 230 (70.1%) | 0 (0.0%) |
| 30 to 34 Years | 249 (75.0%) | 0 (0.0%) |
| 35 to 44 Years | 551 (91.2%) | 0 (0.0%) |
| 45 to 54 Years | 628 (82.2%) | 10 (1.6%) |
| 55 to 59 Years | 96 (38.7%) | 0 (0.0%) |
| 60 to 64 Years | 232 (30.0%) | 0 (0.0%) |
| 65 to 74 Years | 163 (31.3%) | 12 (7.4%) |
| 75 Years and over | 46 (8.3%) | 0 (0.0%) |
| Total | 2,773 (54.3%) | 22 (0.8%) |
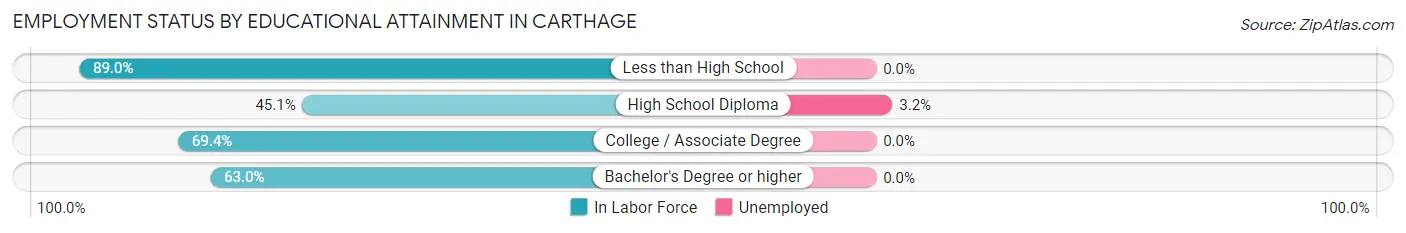
Employment Status by Educational Attainment in Carthage
According to labor force statistics for Carthage, 65.1% of individuals (1,985) out of the total population between 25 and 64 years of age (3,049) are in the labor force, with 0.5% or 10 of them being unemployed. The group with the highest labor force participation rate are those with the educational attainment of less than high school, with 89.0% or 314 individuals in the labor force. Within the labor force, individuals with high school diploma education have the highest percentage of unemployment, with 3.2% or 10 of them being unemployed.
| Educational Attainment | In Labor Force | Unemployed |
| Less than High School | 314 (89.0%) | 0 (0.0%) |
| High School Diploma | 312 (45.1%) | 22 (3.2%) |
| College / Associate Degree | 1,067 (69.4%) | 0 (0.0%) |
| Bachelor's Degree or higher | 294 (63.0%) | 0 (0.0%) |
| Total | 1,985 (65.1%) | 15 (0.5%) |
Employment Occupations by Sex in Carthage
Management, Business, Science and Arts Occupations
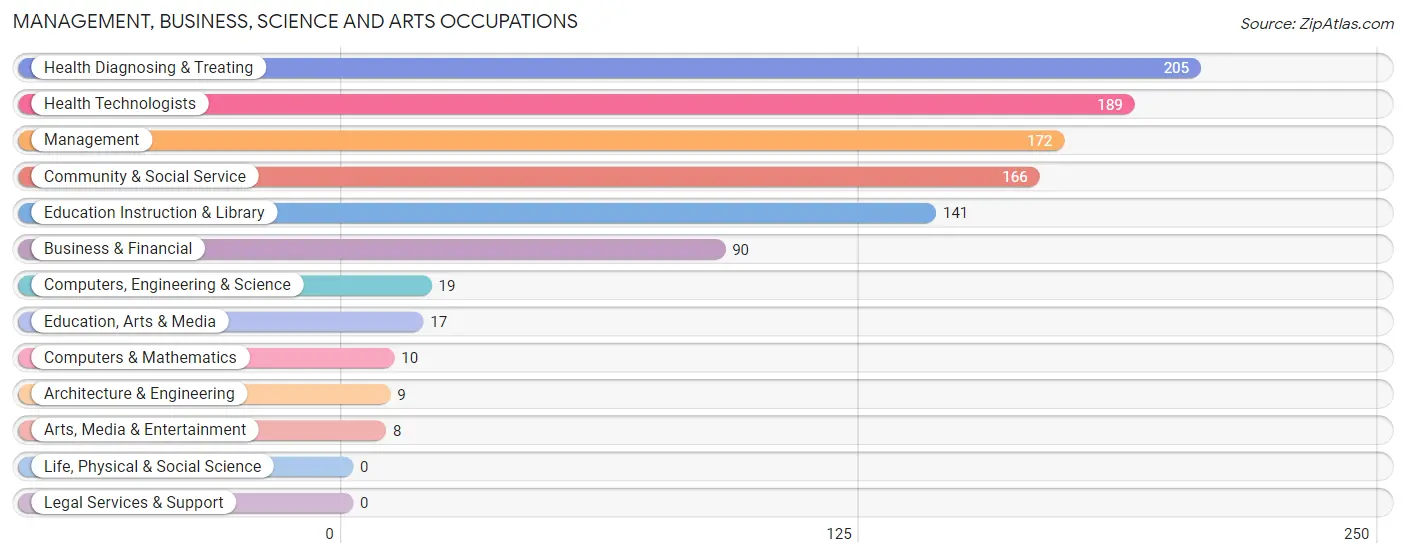
The most common Management, Business, Science and Arts occupations in Carthage are Health Diagnosing & Treating (205 | 7.4%), Health Technologists (189 | 6.9%), Management (172 | 6.2%), Community & Social Service (166 | 6.0%), and Education Instruction & Library (141 | 5.1%).
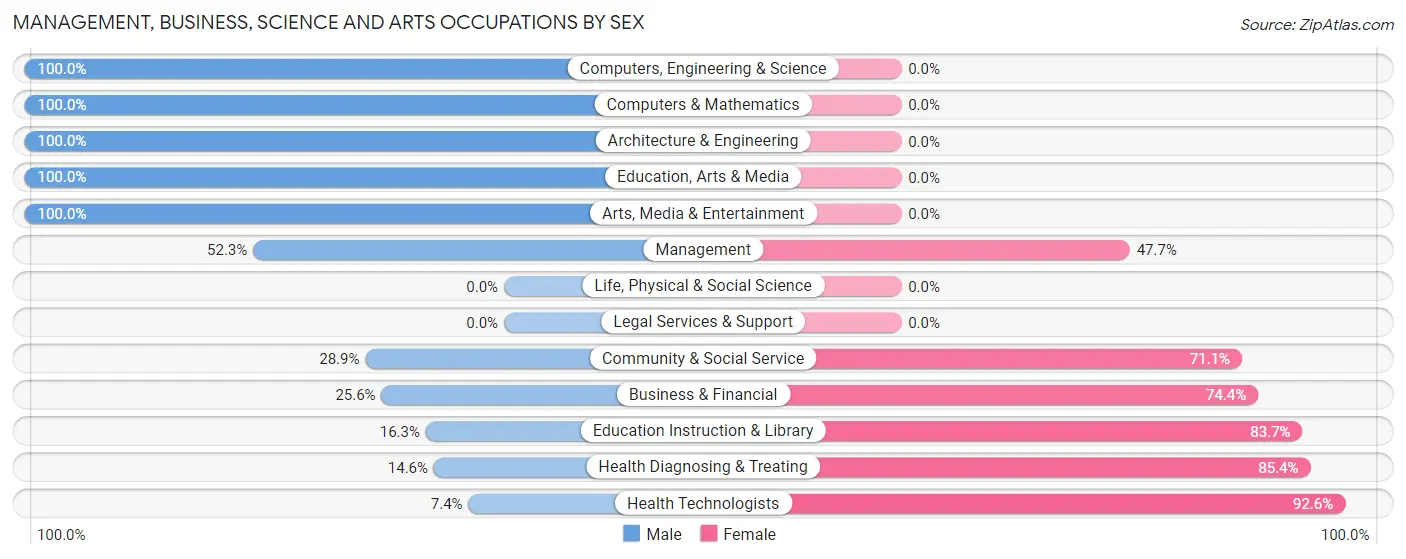
Management, Business, Science and Arts Occupations by Sex
Within the Management, Business, Science and Arts occupations in Carthage, the most male-oriented occupations are Computers, Engineering & Science (100.0%), Computers & Mathematics (100.0%), and Architecture & Engineering (100.0%), while the most female-oriented occupations are Health Technologists (92.6%), Health Diagnosing & Treating (85.4%), and Education Instruction & Library (83.7%).
| Occupation | Male | Female |
| Management | 90 (52.3%) | 82 (47.7%) |
| Business & Financial | 23 (25.6%) | 67 (74.4%) |
| Computers, Engineering & Science | 19 (100.0%) | 0 (0.0%) |
| Computers & Mathematics | 10 (100.0%) | 0 (0.0%) |
| Architecture & Engineering | 9 (100.0%) | 0 (0.0%) |
| Life, Physical & Social Science | 0 (0.0%) | 0 (0.0%) |
| Community & Social Service | 48 (28.9%) | 118 (71.1%) |
| Education, Arts & Media | 17 (100.0%) | 0 (0.0%) |
| Legal Services & Support | 0 (0.0%) | 0 (0.0%) |
| Education Instruction & Library | 23 (16.3%) | 118 (83.7%) |
| Arts, Media & Entertainment | 8 (100.0%) | 0 (0.0%) |
| Health Diagnosing & Treating | 30 (14.6%) | 175 (85.4%) |
| Health Technologists | 14 (7.4%) | 175 (92.6%) |
| Total (Category) | 210 (32.2%) | 442 (67.8%) |
| Total (Overall) | 1,263 (45.9%) | 1,490 (54.1%) |
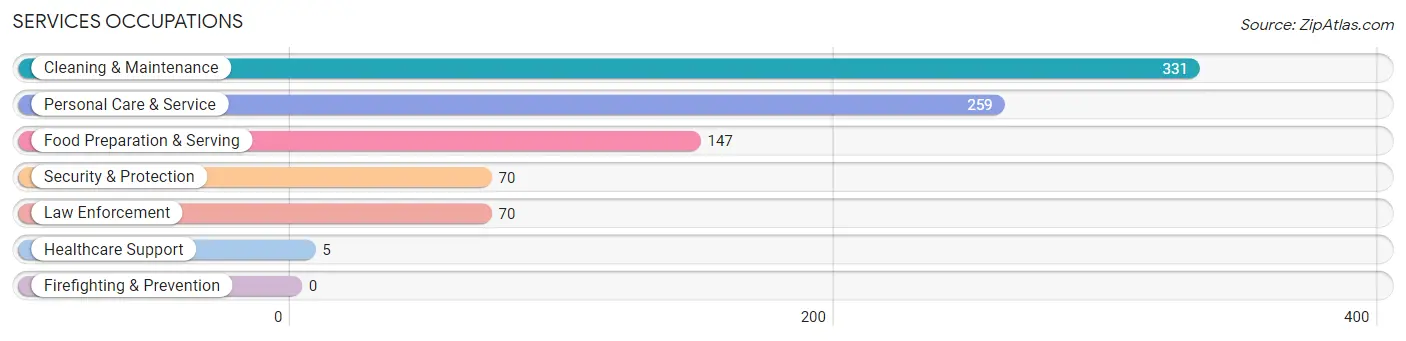
Services Occupations
The most common Services occupations in Carthage are Cleaning & Maintenance (331 | 12.0%), Personal Care & Service (259 | 9.4%), Food Preparation & Serving (147 | 5.3%), Security & Protection (70 | 2.5%), and Law Enforcement (70 | 2.5%).
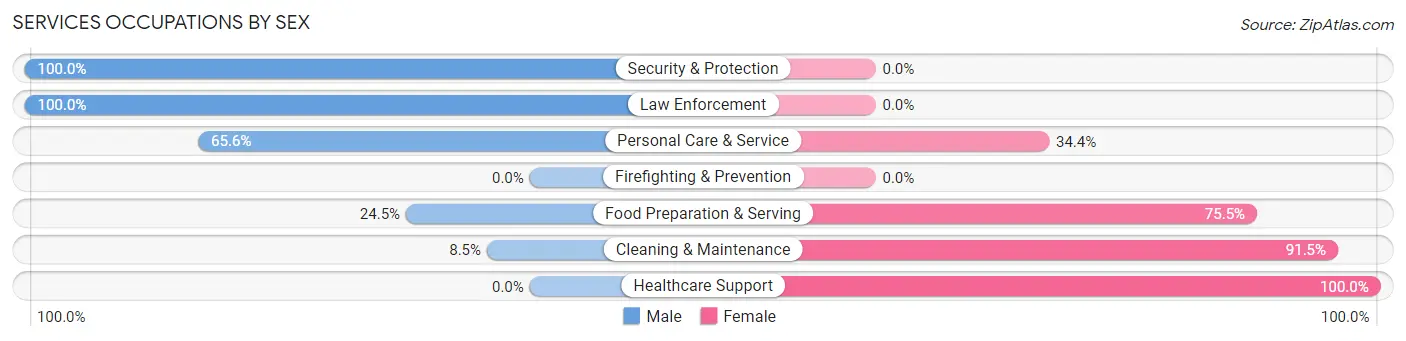
Services Occupations by Sex
Within the Services occupations in Carthage, the most male-oriented occupations are Security & Protection (100.0%), Law Enforcement (100.0%), and Personal Care & Service (65.6%), while the most female-oriented occupations are Healthcare Support (100.0%), Cleaning & Maintenance (91.5%), and Food Preparation & Serving (75.5%).
| Occupation | Male | Female |
| Healthcare Support | 0 (0.0%) | 5 (100.0%) |
| Security & Protection | 70 (100.0%) | 0 (0.0%) |
| Firefighting & Prevention | 0 (0.0%) | 0 (0.0%) |
| Law Enforcement | 70 (100.0%) | 0 (0.0%) |
| Food Preparation & Serving | 36 (24.5%) | 111 (75.5%) |
| Cleaning & Maintenance | 28 (8.5%) | 303 (91.5%) |
| Personal Care & Service | 170 (65.6%) | 89 (34.4%) |
| Total (Category) | 304 (37.4%) | 508 (62.6%) |
| Total (Overall) | 1,263 (45.9%) | 1,490 (54.1%) |
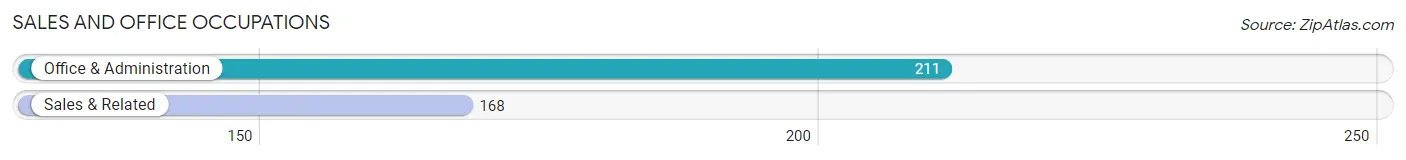
Sales and Office Occupations
The most common Sales and Office occupations in Carthage are Office & Administration (211 | 7.7%), and Sales & Related (168 | 6.1%).
Sales and Office Occupations by Sex
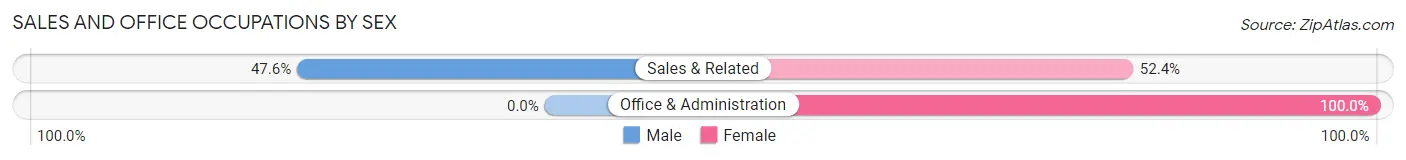
| Occupation | Male | Female |
| Sales & Related | 80 (47.6%) | 88 (52.4%) |
| Office & Administration | 0 (0.0%) | 211 (100.0%) |
| Total (Category) | 80 (21.1%) | 299 (78.9%) |
| Total (Overall) | 1,263 (45.9%) | 1,490 (54.1%) |
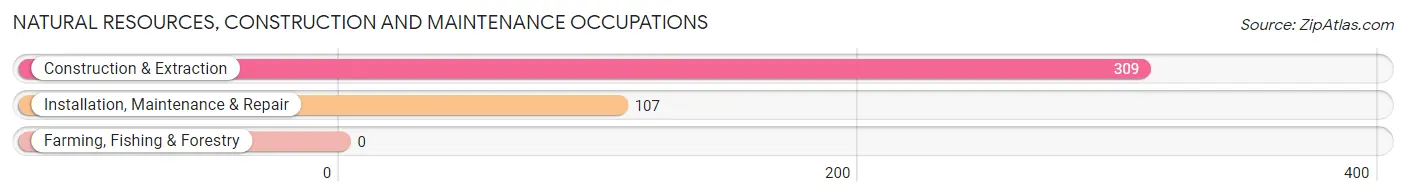
Natural Resources, Construction and Maintenance Occupations
The most common Natural Resources, Construction and Maintenance occupations in Carthage are Construction & Extraction (309 | 11.2%), and Installation, Maintenance & Repair (107 | 3.9%).
Natural Resources, Construction and Maintenance Occupations by Sex
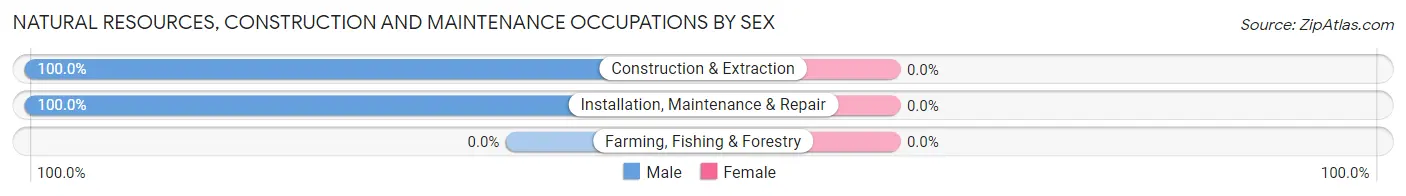
| Occupation | Male | Female |
| Farming, Fishing & Forestry | 0 (0.0%) | 0 (0.0%) |
| Construction & Extraction | 309 (100.0%) | 0 (0.0%) |
| Installation, Maintenance & Repair | 107 (100.0%) | 0 (0.0%) |
| Total (Category) | 416 (100.0%) | 0 (0.0%) |
| Total (Overall) | 1,263 (45.9%) | 1,490 (54.1%) |
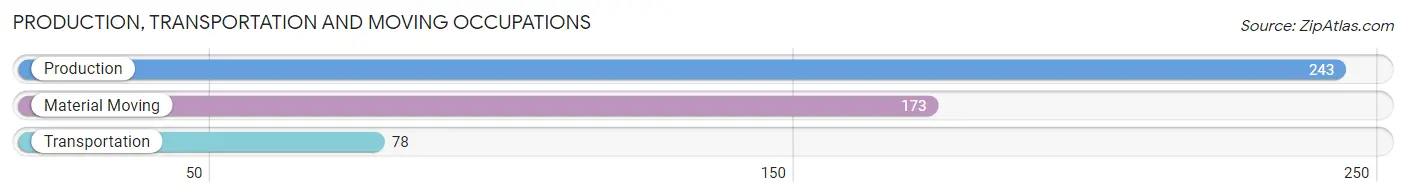
Production, Transportation and Moving Occupations
The most common Production, Transportation and Moving occupations in Carthage are Production (243 | 8.8%), Material Moving (173 | 6.3%), and Transportation (78 | 2.8%).
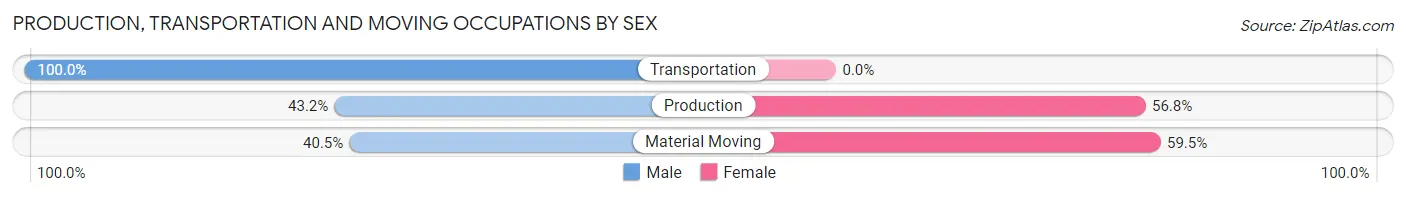
Production, Transportation and Moving Occupations by Sex
| Occupation | Male | Female |
| Production | 105 (43.2%) | 138 (56.8%) |
| Transportation | 78 (100.0%) | 0 (0.0%) |
| Material Moving | 70 (40.5%) | 103 (59.5%) |
| Total (Category) | 253 (51.2%) | 241 (48.8%) |
| Total (Overall) | 1,263 (45.9%) | 1,490 (54.1%) |
Employment Industries by Sex in Carthage
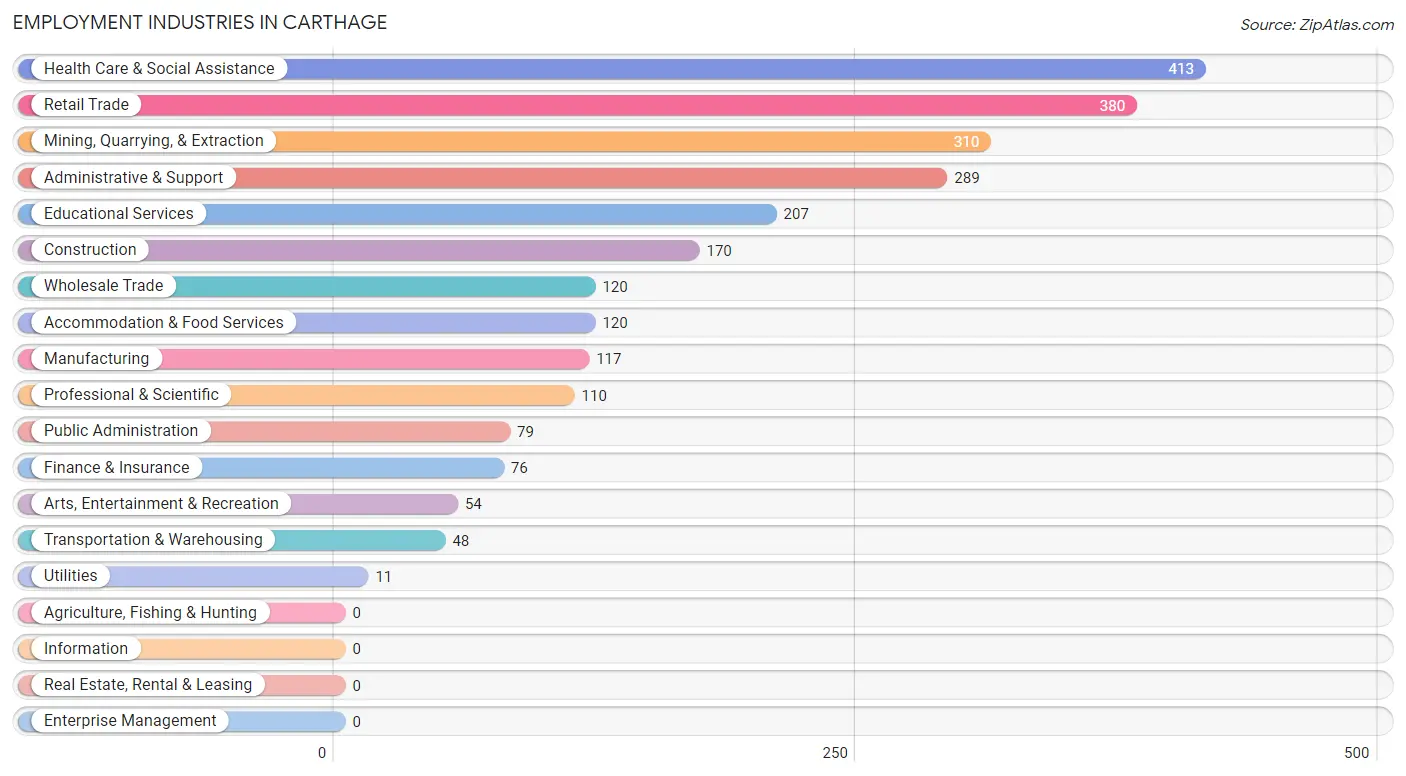
Employment Industries in Carthage
The major employment industries in Carthage include Health Care & Social Assistance (413 | 15.0%), Retail Trade (380 | 13.8%), Mining, Quarrying, & Extraction (310 | 11.3%), Administrative & Support (289 | 10.5%), and Educational Services (207 | 7.5%).
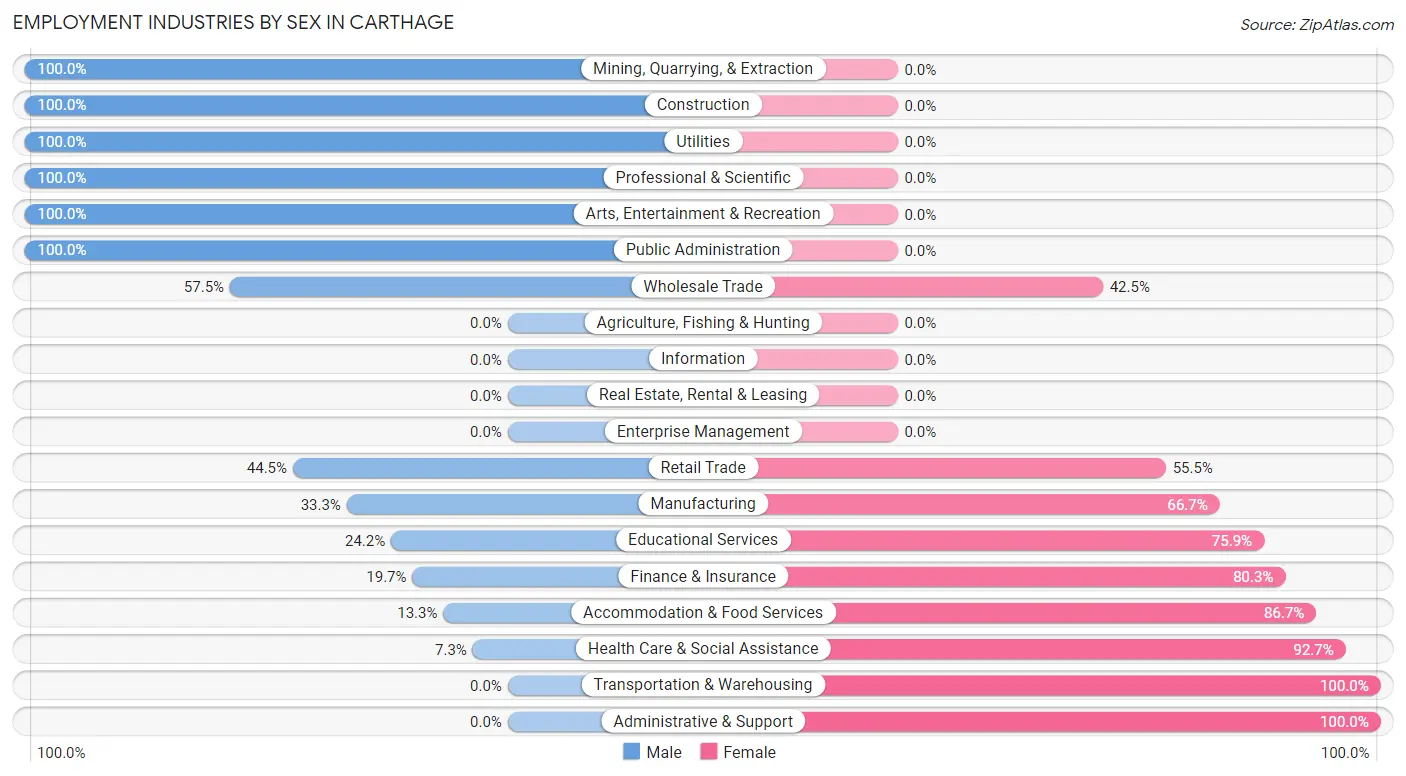
Employment Industries by Sex in Carthage
The Carthage industries that see more men than women are Mining, Quarrying, & Extraction (100.0%), Construction (100.0%), and Utilities (100.0%), whereas the industries that tend to have a higher number of women are Transportation & Warehousing (100.0%), Administrative & Support (100.0%), and Health Care & Social Assistance (92.7%).
| Industry | Male | Female |
| Agriculture, Fishing & Hunting | 0 (0.0%) | 0 (0.0%) |
| Mining, Quarrying, & Extraction | 310 (100.0%) | 0 (0.0%) |
| Construction | 170 (100.0%) | 0 (0.0%) |
| Manufacturing | 39 (33.3%) | 78 (66.7%) |
| Wholesale Trade | 69 (57.5%) | 51 (42.5%) |
| Retail Trade | 169 (44.5%) | 211 (55.5%) |
| Transportation & Warehousing | 0 (0.0%) | 48 (100.0%) |
| Utilities | 11 (100.0%) | 0 (0.0%) |
| Information | 0 (0.0%) | 0 (0.0%) |
| Finance & Insurance | 15 (19.7%) | 61 (80.3%) |
| Real Estate, Rental & Leasing | 0 (0.0%) | 0 (0.0%) |
| Professional & Scientific | 110 (100.0%) | 0 (0.0%) |
| Enterprise Management | 0 (0.0%) | 0 (0.0%) |
| Administrative & Support | 0 (0.0%) | 289 (100.0%) |
| Educational Services | 50 (24.1%) | 157 (75.8%) |
| Health Care & Social Assistance | 30 (7.3%) | 383 (92.7%) |
| Arts, Entertainment & Recreation | 54 (100.0%) | 0 (0.0%) |
| Accommodation & Food Services | 16 (13.3%) | 104 (86.7%) |
| Public Administration | 79 (100.0%) | 0 (0.0%) |
| Total | 1,263 (45.9%) | 1,490 (54.1%) |
Education in Carthage
School Enrollment in Carthage
The most common levels of schooling among the 1,578 students in Carthage are middle school (409 | 25.9%), college / undergraduate (367 | 23.3%), and elementary school (281 | 17.8%).
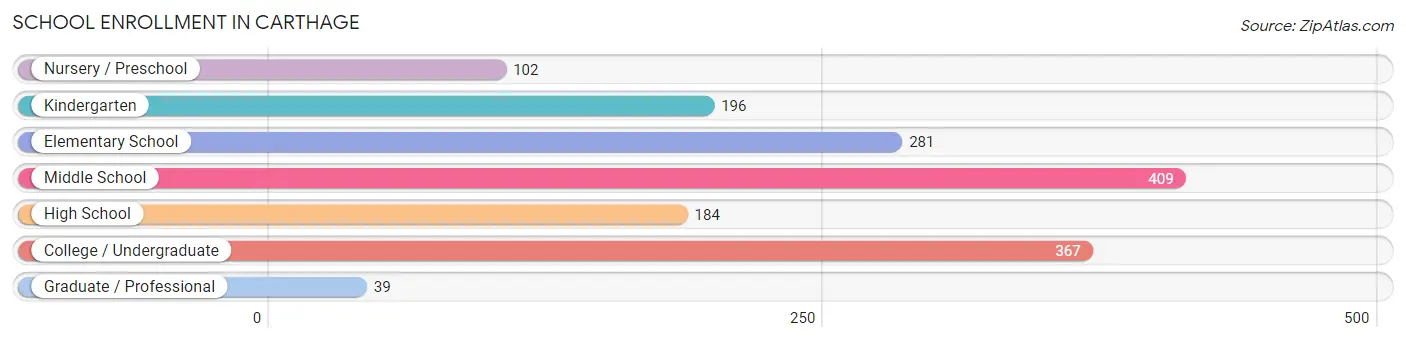
| School Level | # Students | % Students |
| Nursery / Preschool | 102 | 6.5% |
| Kindergarten | 196 | 12.4% |
| Elementary School | 281 | 17.8% |
| Middle School | 409 | 25.9% |
| High School | 184 | 11.7% |
| College / Undergraduate | 367 | 23.3% |
| Graduate / Professional | 39 | 2.5% |
| Total | 1,578 | 100.0% |
School Enrollment by Age by Funding Source in Carthage
Out of a total of 1,578 students who are enrolled in schools in Carthage, 194 (12.3%) attend a private institution, while the remaining 1,384 (87.7%) are enrolled in public schools. The age group of 25 to 34 year olds has the highest likelihood of being enrolled in private schools, with 46 (90.2% in the age bracket) enrolled. Conversely, the age group of 3 to 4 year olds has the lowest likelihood of being enrolled in a private school, with 54 (100.0% in the age bracket) attending a public institution.

| Age Bracket | Public School | Private School |
| 3 to 4 Year Olds | 54 (100.0%) | 0 (0.0%) |
| 5 to 9 Year Old | 434 (83.6%) | 85 (16.4%) |
| 10 to 14 Year Olds | 363 (95.3%) | 18 (4.7%) |
| 15 to 17 Year Olds | 131 (98.5%) | 2 (1.5%) |
| 18 to 19 Year Olds | 209 (91.3%) | 20 (8.7%) |
| 20 to 24 Year Olds | 133 (85.3%) | 23 (14.7%) |
| 25 to 34 Year Olds | 5 (9.8%) | 46 (90.2%) |
| 35 Years and over | 55 (100.0%) | 0 (0.0%) |
| Total | 1,384 (87.7%) | 194 (12.3%) |
Educational Attainment by Field of Study in Carthage
Science & technology (209 | 34.8%), business (135 | 22.5%), education (107 | 17.8%), engineering (62 | 10.3%), and bio, nature & agricultural (31 | 5.2%) are the most common fields of study among 600 individuals in Carthage who have obtained a bachelor's degree or higher.
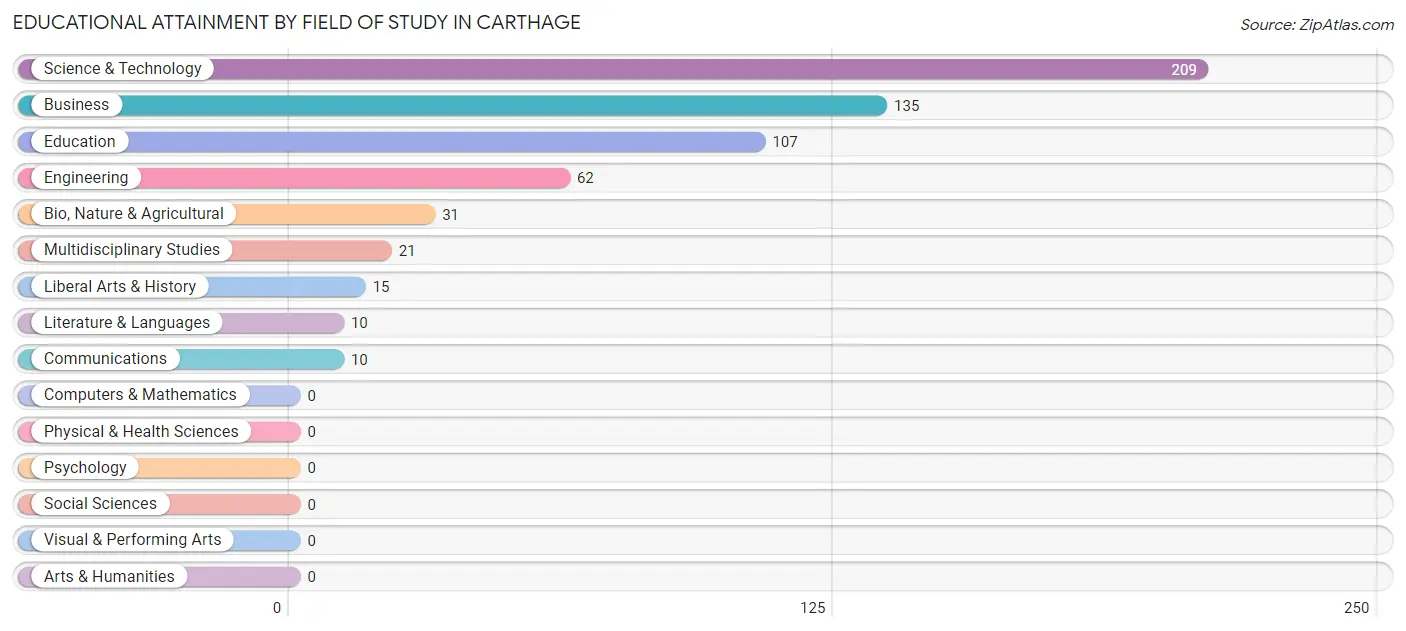
| Field of Study | # Graduates | % Graduates |
| Computers & Mathematics | 0 | 0.0% |
| Bio, Nature & Agricultural | 31 | 5.2% |
| Physical & Health Sciences | 0 | 0.0% |
| Psychology | 0 | 0.0% |
| Social Sciences | 0 | 0.0% |
| Engineering | 62 | 10.3% |
| Multidisciplinary Studies | 21 | 3.5% |
| Science & Technology | 209 | 34.8% |
| Business | 135 | 22.5% |
| Education | 107 | 17.8% |
| Literature & Languages | 10 | 1.7% |
| Liberal Arts & History | 15 | 2.5% |
| Visual & Performing Arts | 0 | 0.0% |
| Communications | 10 | 1.7% |
| Arts & Humanities | 0 | 0.0% |
| Total | 600 | 100.0% |
Transportation & Commute in Carthage
Vehicle Availability by Sex in Carthage
The most prevalent vehicle ownership categories in Carthage are males with 2 vehicles (644, accounting for 53.8%) and females with 2 vehicles (780, making up 46.2%).
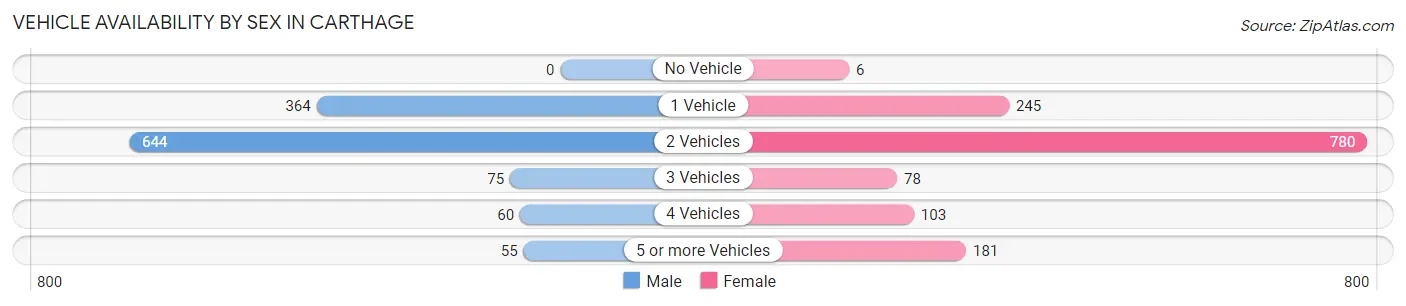
| Vehicles Available | Male | Female |
| No Vehicle | 0 (0.0%) | 6 (0.4%) |
| 1 Vehicle | 364 (30.4%) | 245 (17.6%) |
| 2 Vehicles | 644 (53.8%) | 780 (56.0%) |
| 3 Vehicles | 75 (6.3%) | 78 (5.6%) |
| 4 Vehicles | 60 (5.0%) | 103 (7.4%) |
| 5 or more Vehicles | 55 (4.6%) | 181 (13.0%) |
| Total | 1,198 (100.0%) | 1,393 (100.0%) |
Commute Time in Carthage
The most frequently occuring commute durations in Carthage are 5 to 9 minutes (1,037 commuters, 40.1%), 10 to 14 minutes (437 commuters, 16.9%), and less than 5 minutes (242 commuters, 9.3%).
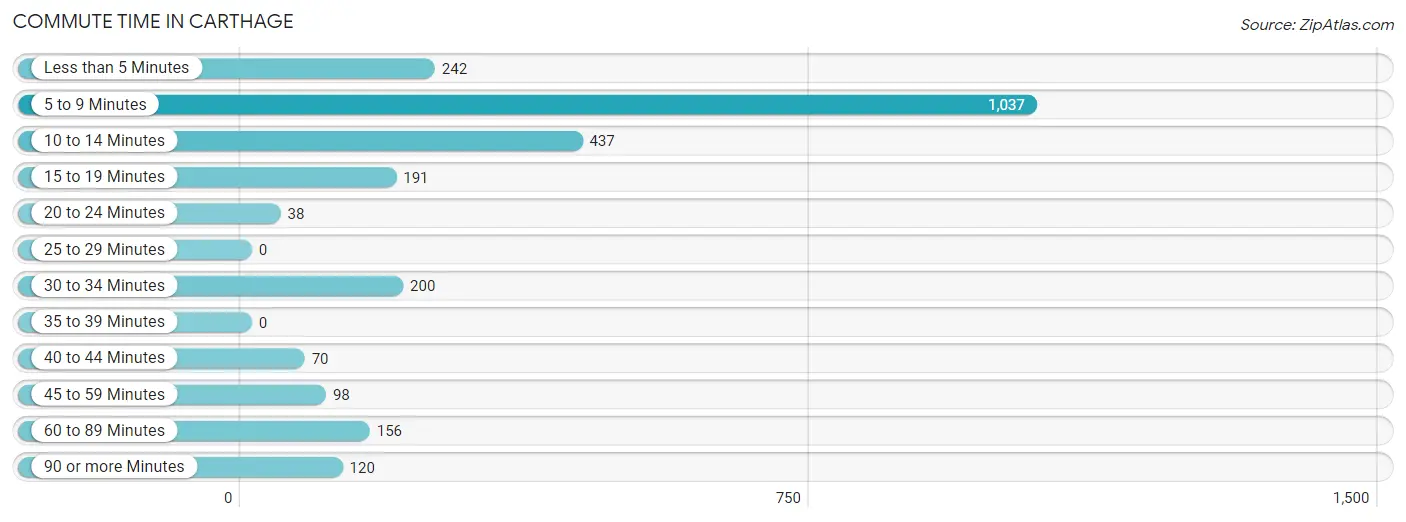
| Commute Time | # Commuters | % Commuters |
| Less than 5 Minutes | 242 | 9.3% |
| 5 to 9 Minutes | 1,037 | 40.1% |
| 10 to 14 Minutes | 437 | 16.9% |
| 15 to 19 Minutes | 191 | 7.4% |
| 20 to 24 Minutes | 38 | 1.5% |
| 25 to 29 Minutes | 0 | 0.0% |
| 30 to 34 Minutes | 200 | 7.7% |
| 35 to 39 Minutes | 0 | 0.0% |
| 40 to 44 Minutes | 70 | 2.7% |
| 45 to 59 Minutes | 98 | 3.8% |
| 60 to 89 Minutes | 156 | 6.0% |
| 90 or more Minutes | 120 | 4.6% |
Commute Time by Sex in Carthage
The most common commute times in Carthage are 5 to 9 minutes (446 commuters, 39.3%) for males and 5 to 9 minutes (591 commuters, 40.7%) for females.
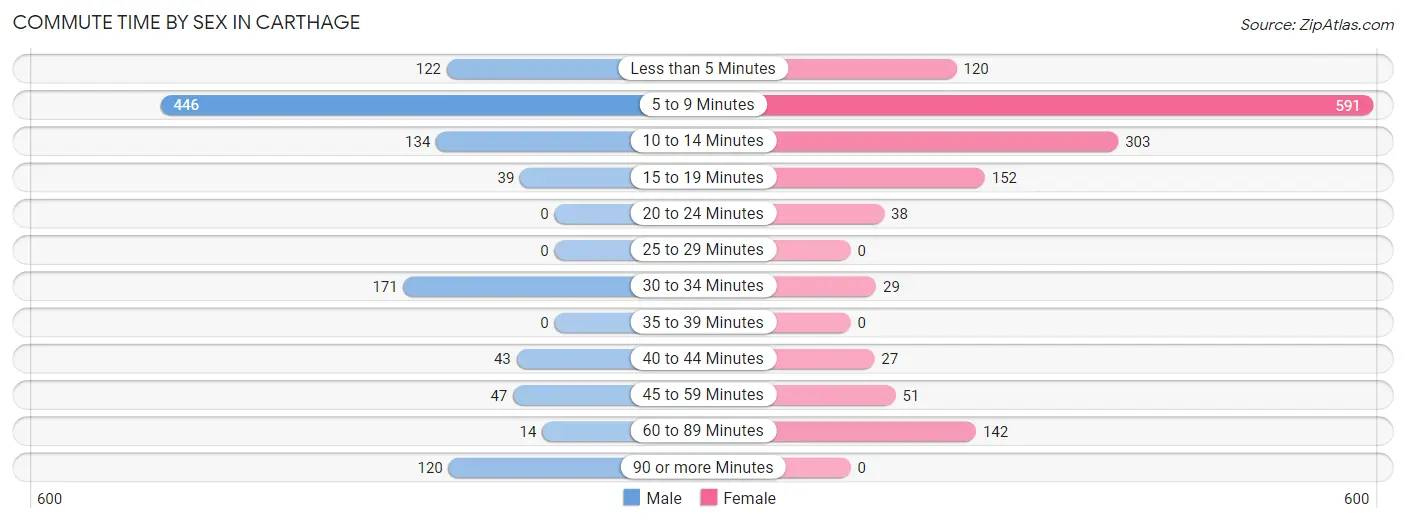
| Commute Time | Male | Female |
| Less than 5 Minutes | 122 (10.7%) | 120 (8.3%) |
| 5 to 9 Minutes | 446 (39.3%) | 591 (40.7%) |
| 10 to 14 Minutes | 134 (11.8%) | 303 (20.8%) |
| 15 to 19 Minutes | 39 (3.4%) | 152 (10.5%) |
| 20 to 24 Minutes | 0 (0.0%) | 38 (2.6%) |
| 25 to 29 Minutes | 0 (0.0%) | 0 (0.0%) |
| 30 to 34 Minutes | 171 (15.0%) | 29 (2.0%) |
| 35 to 39 Minutes | 0 (0.0%) | 0 (0.0%) |
| 40 to 44 Minutes | 43 (3.8%) | 27 (1.9%) |
| 45 to 59 Minutes | 47 (4.1%) | 51 (3.5%) |
| 60 to 89 Minutes | 14 (1.2%) | 142 (9.8%) |
| 90 or more Minutes | 120 (10.6%) | 0 (0.0%) |
Time of Departure to Work by Sex in Carthage
The most frequent times of departure to work in Carthage are 6:00 AM to 6:29 AM (243, 21.4%) for males and 7:00 AM to 7:29 AM (437, 30.1%) for females.
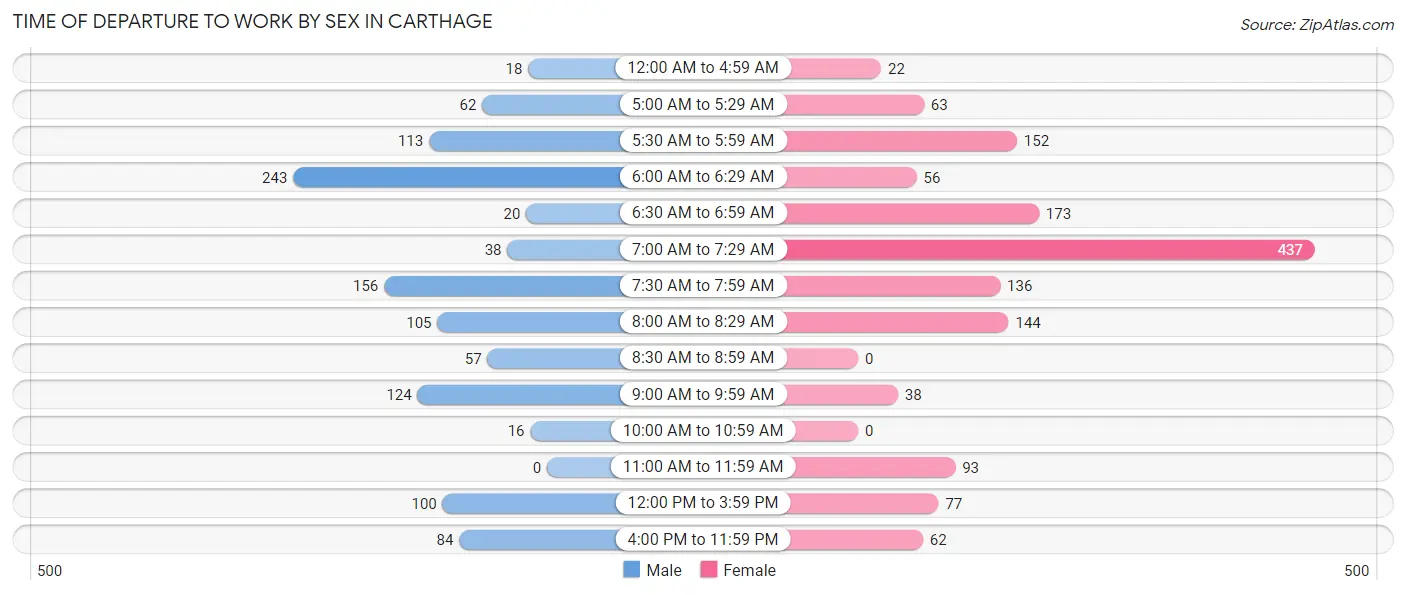
| Time of Departure | Male | Female |
| 12:00 AM to 4:59 AM | 18 (1.6%) | 22 (1.5%) |
| 5:00 AM to 5:29 AM | 62 (5.5%) | 63 (4.3%) |
| 5:30 AM to 5:59 AM | 113 (10.0%) | 152 (10.5%) |
| 6:00 AM to 6:29 AM | 243 (21.4%) | 56 (3.8%) |
| 6:30 AM to 6:59 AM | 20 (1.8%) | 173 (11.9%) |
| 7:00 AM to 7:29 AM | 38 (3.4%) | 437 (30.1%) |
| 7:30 AM to 7:59 AM | 156 (13.7%) | 136 (9.4%) |
| 8:00 AM to 8:29 AM | 105 (9.2%) | 144 (9.9%) |
| 8:30 AM to 8:59 AM | 57 (5.0%) | 0 (0.0%) |
| 9:00 AM to 9:59 AM | 124 (10.9%) | 38 (2.6%) |
| 10:00 AM to 10:59 AM | 16 (1.4%) | 0 (0.0%) |
| 11:00 AM to 11:59 AM | 0 (0.0%) | 93 (6.4%) |
| 12:00 PM to 3:59 PM | 100 (8.8%) | 77 (5.3%) |
| 4:00 PM to 11:59 PM | 84 (7.4%) | 62 (4.3%) |
| Total | 1,136 (100.0%) | 1,453 (100.0%) |
Housing Occupancy in Carthage
Occupancy by Ownership in Carthage
Of the total 2,511 dwellings in Carthage, owner-occupied units account for 1,684 (67.1%), while renter-occupied units make up 827 (32.9%).
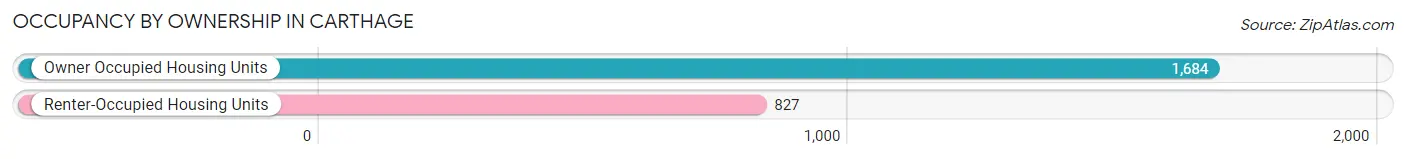
| Occupancy | # Housing Units | % Housing Units |
| Owner Occupied Housing Units | 1,684 | 67.1% |
| Renter-Occupied Housing Units | 827 | 32.9% |
| Total Occupied Housing Units | 2,511 | 100.0% |
Occupancy by Household Size in Carthage
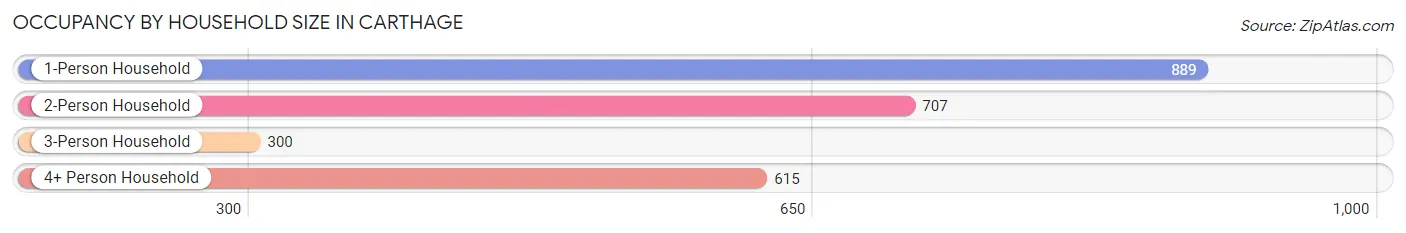
| Household Size | # Housing Units | % Housing Units |
| 1-Person Household | 889 | 35.4% |
| 2-Person Household | 707 | 28.2% |
| 3-Person Household | 300 | 11.9% |
| 4+ Person Household | 615 | 24.5% |
| Total Housing Units | 2,511 | 100.0% |
Occupancy by Ownership by Household Size in Carthage
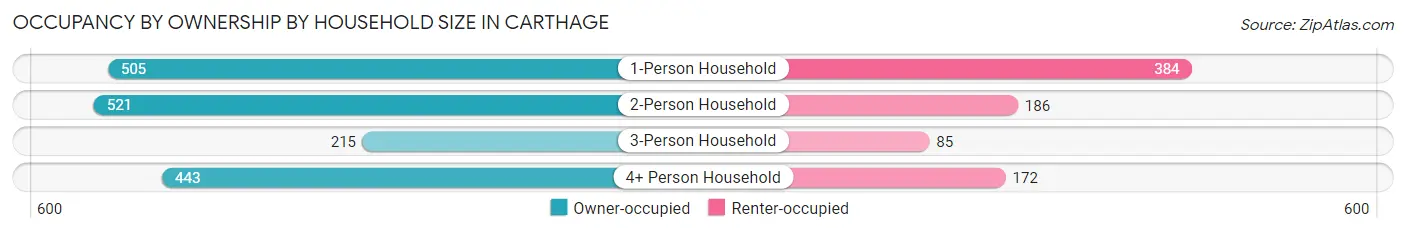
| Household Size | Owner-occupied | Renter-occupied |
| 1-Person Household | 505 (56.8%) | 384 (43.2%) |
| 2-Person Household | 521 (73.7%) | 186 (26.3%) |
| 3-Person Household | 215 (71.7%) | 85 (28.3%) |
| 4+ Person Household | 443 (72.0%) | 172 (28.0%) |
| Total Housing Units | 1,684 (67.1%) | 827 (32.9%) |
Occupancy by Educational Attainment in Carthage
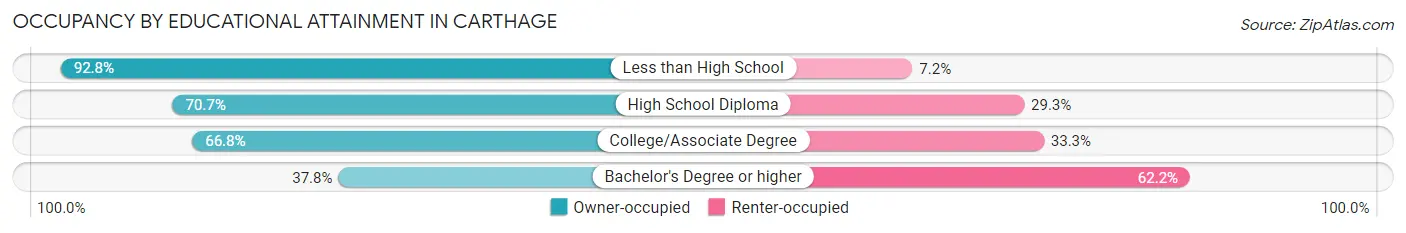
| Household Size | Owner-occupied | Renter-occupied |
| Less than High School | 388 (92.8%) | 30 (7.2%) |
| High School Diploma | 359 (70.7%) | 149 (29.3%) |
| College/Associate Degree | 779 (66.7%) | 388 (33.3%) |
| Bachelor's Degree or higher | 158 (37.8%) | 260 (62.2%) |
Occupancy by Age of Householder in Carthage
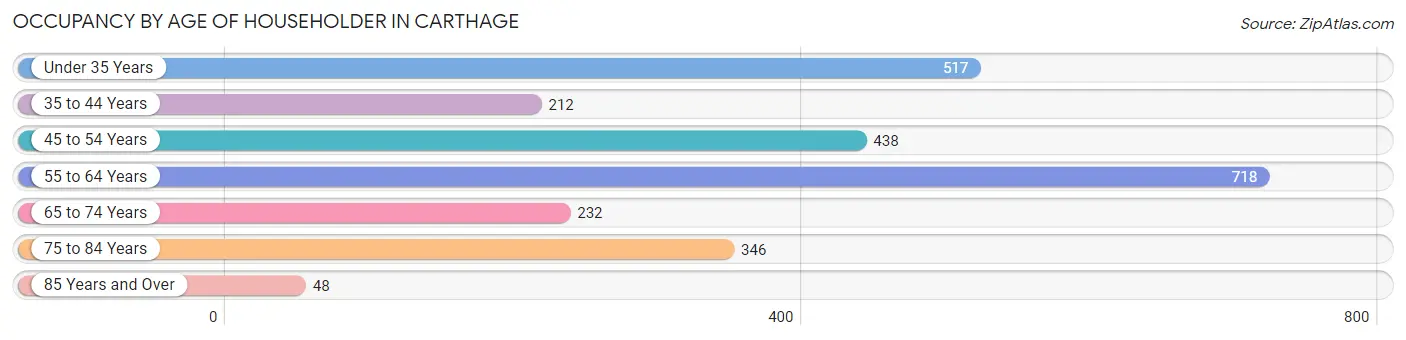
| Age Bracket | # Households | % Households |
| Under 35 Years | 517 | 20.6% |
| 35 to 44 Years | 212 | 8.4% |
| 45 to 54 Years | 438 | 17.4% |
| 55 to 64 Years | 718 | 28.6% |
| 65 to 74 Years | 232 | 9.2% |
| 75 to 84 Years | 346 | 13.8% |
| 85 Years and Over | 48 | 1.9% |
| Total | 2,511 | 100.0% |
Housing Finances in Carthage
Median Income by Occupancy in Carthage
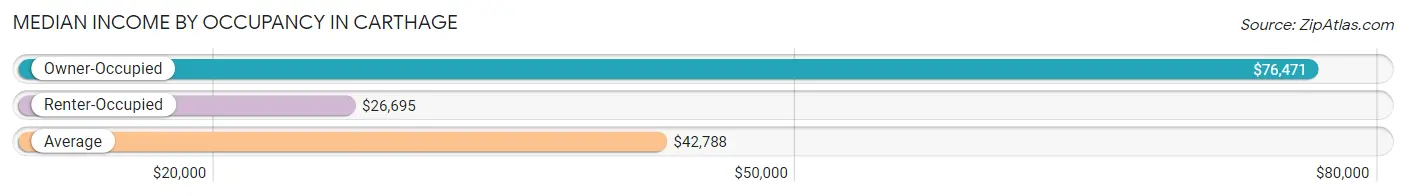
| Occupancy Type | # Households | Median Income |
| Owner-Occupied | 1,684 (67.1%) | $76,471 |
| Renter-Occupied | 827 (32.9%) | $26,695 |
| Average | 2,511 (100.0%) | $42,788 |
Occupancy by Householder Income Bracket in Carthage
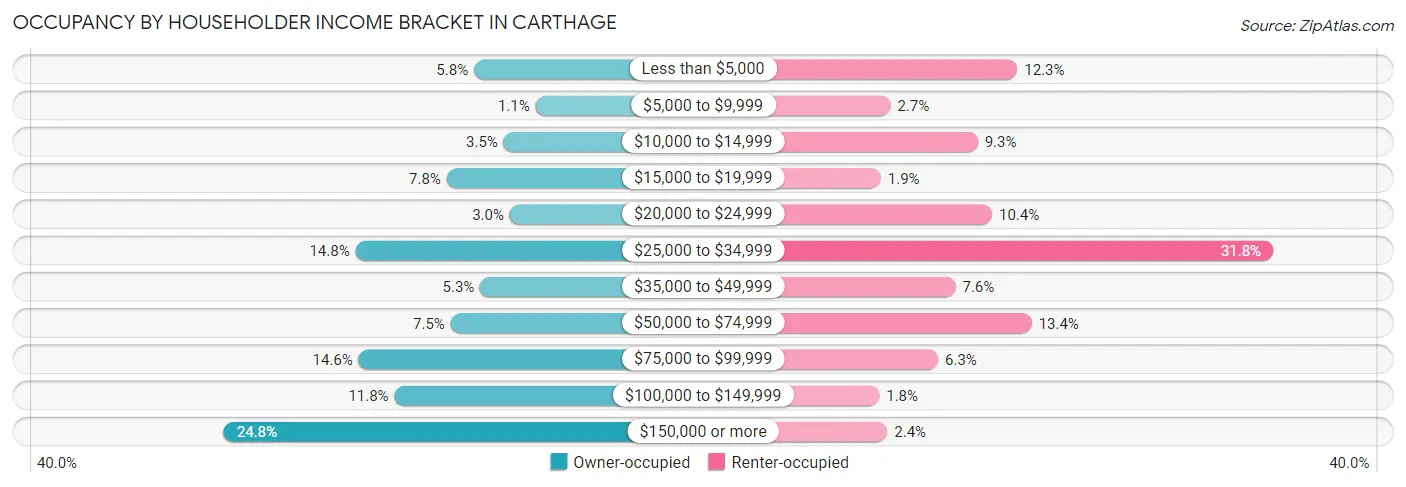
| Income Bracket | Owner-occupied | Renter-occupied |
| Less than $5,000 | 97 (5.8%) | 102 (12.3%) |
| $5,000 to $9,999 | 18 (1.1%) | 22 (2.7%) |
| $10,000 to $14,999 | 59 (3.5%) | 77 (9.3%) |
| $15,000 to $19,999 | 132 (7.8%) | 16 (1.9%) |
| $20,000 to $24,999 | 51 (3.0%) | 86 (10.4%) |
| $25,000 to $34,999 | 249 (14.8%) | 263 (31.8%) |
| $35,000 to $49,999 | 89 (5.3%) | 63 (7.6%) |
| $50,000 to $74,999 | 127 (7.5%) | 111 (13.4%) |
| $75,000 to $99,999 | 245 (14.5%) | 52 (6.3%) |
| $100,000 to $149,999 | 199 (11.8%) | 15 (1.8%) |
| $150,000 or more | 418 (24.8%) | 20 (2.4%) |
| Total | 1,684 (100.0%) | 827 (100.0%) |
Monthly Housing Cost Tiers in Carthage
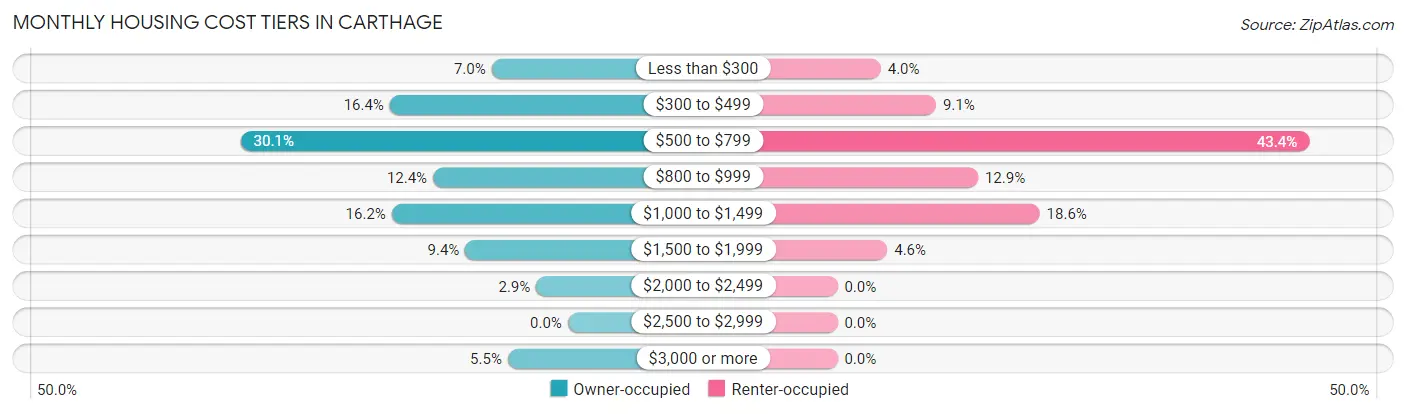
| Monthly Cost | Owner-occupied | Renter-occupied |
| Less than $300 | 118 (7.0%) | 33 (4.0%) |
| $300 to $499 | 276 (16.4%) | 75 (9.1%) |
| $500 to $799 | 507 (30.1%) | 359 (43.4%) |
| $800 to $999 | 209 (12.4%) | 107 (12.9%) |
| $1,000 to $1,499 | 273 (16.2%) | 154 (18.6%) |
| $1,500 to $1,999 | 159 (9.4%) | 38 (4.6%) |
| $2,000 to $2,499 | 49 (2.9%) | 0 (0.0%) |
| $2,500 to $2,999 | 0 (0.0%) | 0 (0.0%) |
| $3,000 or more | 93 (5.5%) | 0 (0.0%) |
| Total | 1,684 (100.0%) | 827 (100.0%) |
Physical Housing Characteristics in Carthage
Housing Structures in Carthage
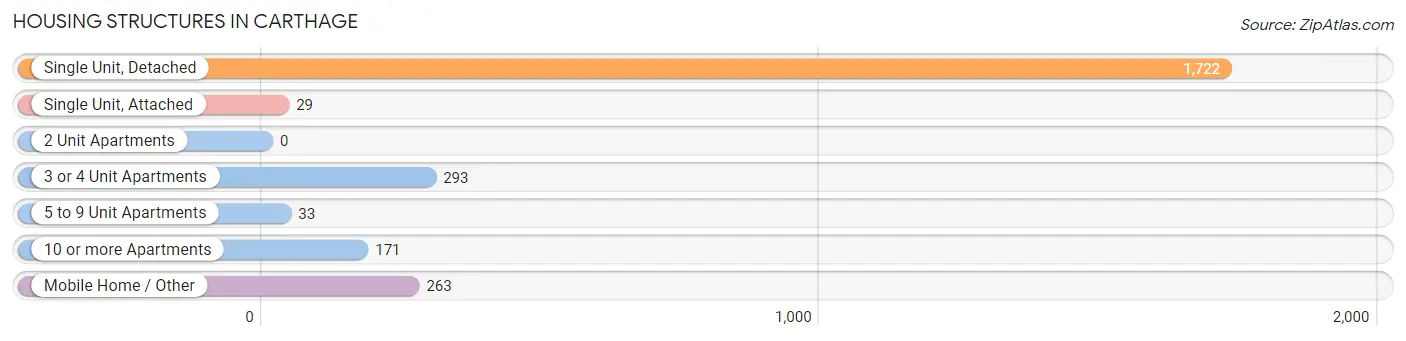
| Structure Type | # Housing Units | % Housing Units |
| Single Unit, Detached | 1,722 | 68.6% |
| Single Unit, Attached | 29 | 1.1% |
| 2 Unit Apartments | 0 | 0.0% |
| 3 or 4 Unit Apartments | 293 | 11.7% |
| 5 to 9 Unit Apartments | 33 | 1.3% |
| 10 or more Apartments | 171 | 6.8% |
| Mobile Home / Other | 263 | 10.5% |
| Total | 2,511 | 100.0% |
Housing Structures by Occupancy in Carthage
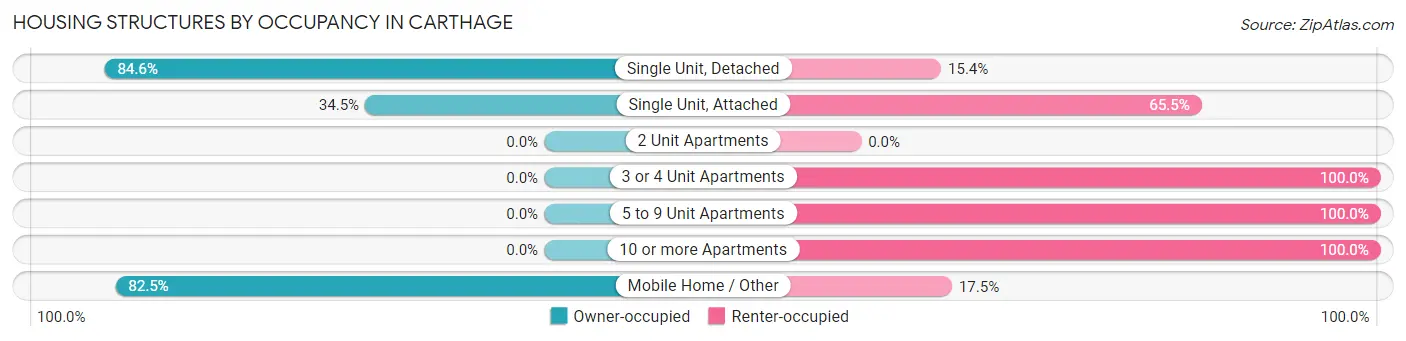
| Structure Type | Owner-occupied | Renter-occupied |
| Single Unit, Detached | 1,457 (84.6%) | 265 (15.4%) |
| Single Unit, Attached | 10 (34.5%) | 19 (65.5%) |
| 2 Unit Apartments | 0 (0.0%) | 0 (0.0%) |
| 3 or 4 Unit Apartments | 0 (0.0%) | 293 (100.0%) |
| 5 to 9 Unit Apartments | 0 (0.0%) | 33 (100.0%) |
| 10 or more Apartments | 0 (0.0%) | 171 (100.0%) |
| Mobile Home / Other | 217 (82.5%) | 46 (17.5%) |
| Total | 1,684 (67.1%) | 827 (32.9%) |
Housing Structures by Number of Rooms in Carthage
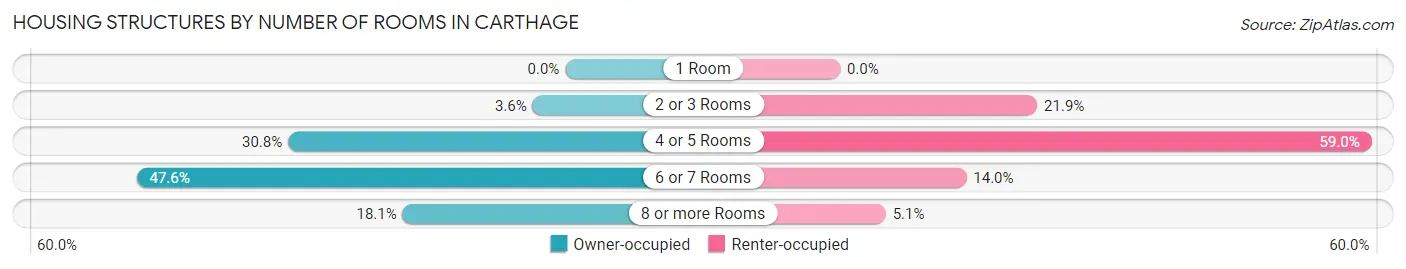
| Number of Rooms | Owner-occupied | Renter-occupied |
| 1 Room | 0 (0.0%) | 0 (0.0%) |
| 2 or 3 Rooms | 61 (3.6%) | 181 (21.9%) |
| 4 or 5 Rooms | 518 (30.8%) | 488 (59.0%) |
| 6 or 7 Rooms | 801 (47.6%) | 116 (14.0%) |
| 8 or more Rooms | 304 (18.0%) | 42 (5.1%) |
| Total | 1,684 (100.0%) | 827 (100.0%) |
Housing Structure by Heating Type in Carthage
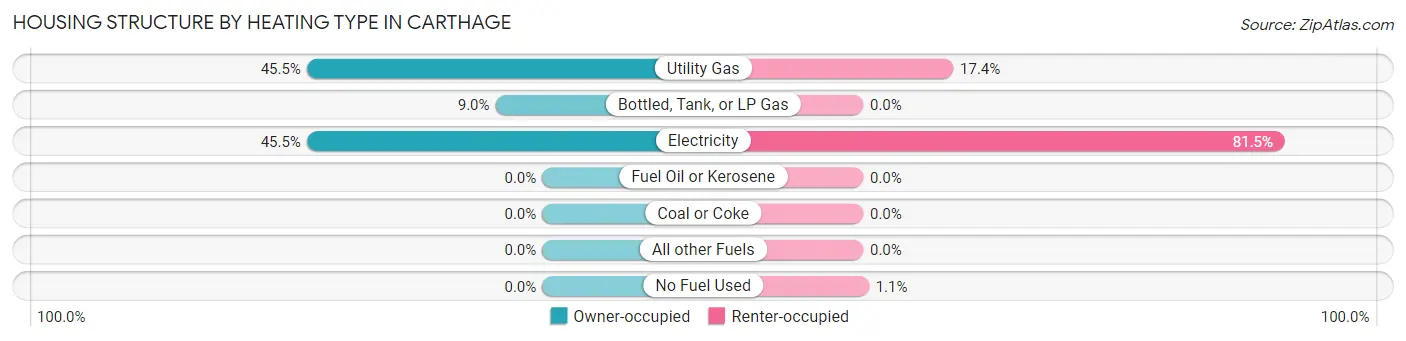
| Heating Type | Owner-occupied | Renter-occupied |
| Utility Gas | 766 (45.5%) | 144 (17.4%) |
| Bottled, Tank, or LP Gas | 152 (9.0%) | 0 (0.0%) |
| Electricity | 766 (45.5%) | 674 (81.5%) |
| Fuel Oil or Kerosene | 0 (0.0%) | 0 (0.0%) |
| Coal or Coke | 0 (0.0%) | 0 (0.0%) |
| All other Fuels | 0 (0.0%) | 0 (0.0%) |
| No Fuel Used | 0 (0.0%) | 9 (1.1%) |
| Total | 1,684 (100.0%) | 827 (100.0%) |
Household Vehicle Usage in Carthage
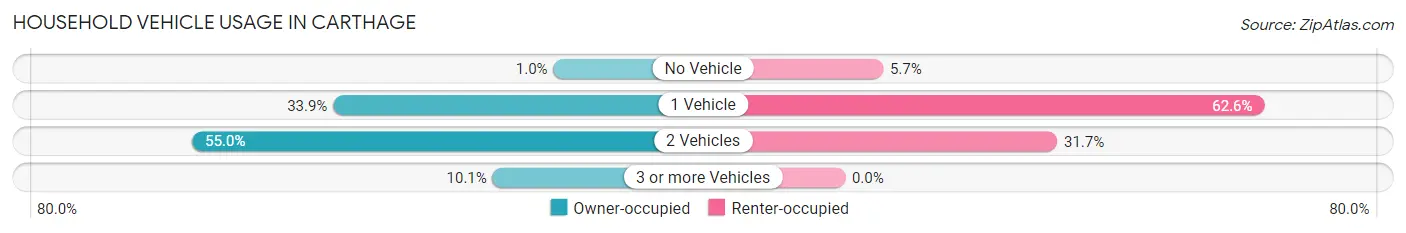
| Vehicles per Household | Owner-occupied | Renter-occupied |
| No Vehicle | 17 (1.0%) | 47 (5.7%) |
| 1 Vehicle | 571 (33.9%) | 518 (62.6%) |
| 2 Vehicles | 926 (55.0%) | 262 (31.7%) |
| 3 or more Vehicles | 170 (10.1%) | 0 (0.0%) |
| Total | 1,684 (100.0%) | 827 (100.0%) |
Real Estate & Mortgages in Carthage
Real Estate and Mortgage Overview in Carthage
| Characteristic | Without Mortgage | With Mortgage |
| Housing Units | 951 | 733 |
| Median Property Value | $118,500 | $184,200 |
| Median Household Income | $34,387 | $393 |
| Monthly Housing Costs | $525 | $93 |
| Real Estate Taxes | $1,185 | $0 |
Property Value by Mortgage Status in Carthage
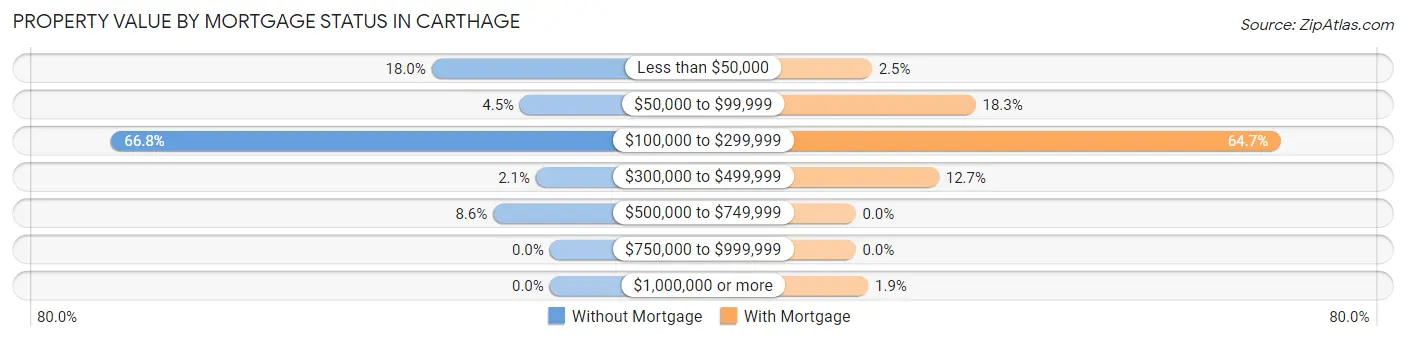
| Property Value | Without Mortgage | With Mortgage |
| Less than $50,000 | 171 (18.0%) | 18 (2.5%) |
| $50,000 to $99,999 | 43 (4.5%) | 134 (18.3%) |
| $100,000 to $299,999 | 635 (66.8%) | 474 (64.7%) |
| $300,000 to $499,999 | 20 (2.1%) | 93 (12.7%) |
| $500,000 to $749,999 | 82 (8.6%) | 0 (0.0%) |
| $750,000 to $999,999 | 0 (0.0%) | 0 (0.0%) |
| $1,000,000 or more | 0 (0.0%) | 14 (1.9%) |
| Total | 951 (100.0%) | 733 (100.0%) |
Household Income by Mortgage Status in Carthage
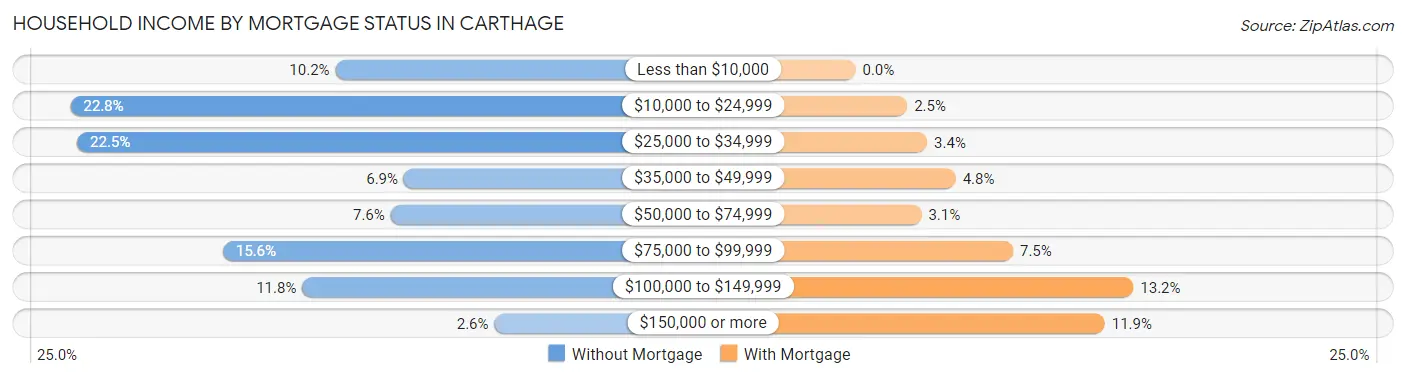
| Household Income | Without Mortgage | With Mortgage |
| Less than $10,000 | 97 (10.2%) | 0 (0.0%) |
| $10,000 to $24,999 | 217 (22.8%) | 18 (2.5%) |
| $25,000 to $34,999 | 214 (22.5%) | 25 (3.4%) |
| $35,000 to $49,999 | 66 (6.9%) | 35 (4.8%) |
| $50,000 to $74,999 | 72 (7.6%) | 23 (3.1%) |
| $75,000 to $99,999 | 148 (15.6%) | 55 (7.5%) |
| $100,000 to $149,999 | 112 (11.8%) | 97 (13.2%) |
| $150,000 or more | 25 (2.6%) | 87 (11.9%) |
| Total | 951 (100.0%) | 733 (100.0%) |
Property Value to Household Income Ratio in Carthage
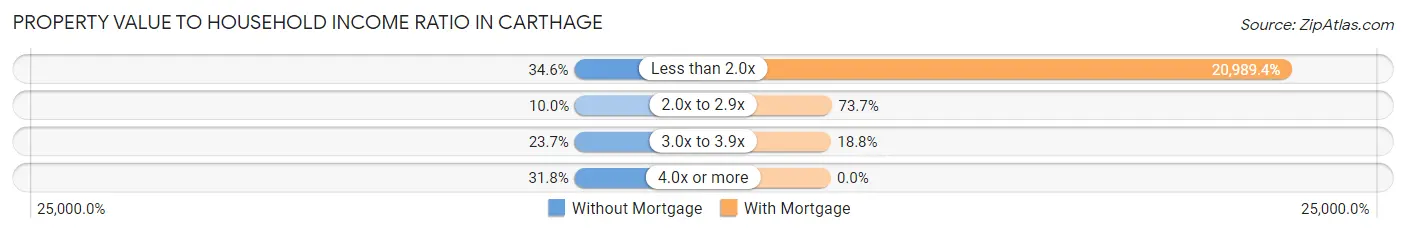
| Value-to-Income Ratio | Without Mortgage | With Mortgage |
| Less than 2.0x | 329 (34.6%) | 153,852 (20,989.4%) |
| 2.0x to 2.9x | 95 (10.0%) | 540 (73.7%) |
| 3.0x to 3.9x | 225 (23.7%) | 138 (18.8%) |
| 4.0x or more | 302 (31.8%) | 0 (0.0%) |
| Total | 951 (100.0%) | 733 (100.0%) |
Real Estate Taxes by Mortgage Status in Carthage
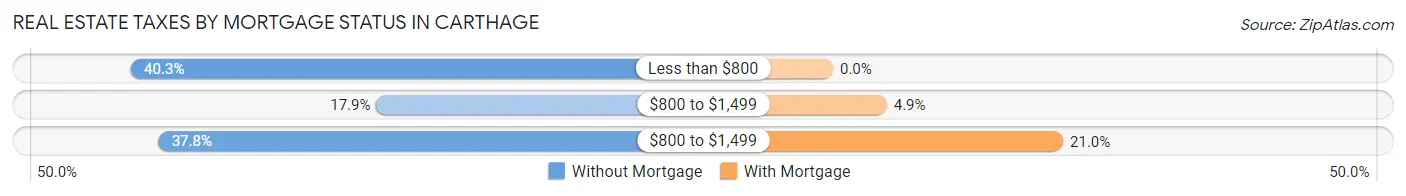
| Property Taxes | Without Mortgage | With Mortgage |
| Less than $800 | 383 (40.3%) | 0 (0.0%) |
| $800 to $1,499 | 170 (17.9%) | 36 (4.9%) |
| $800 to $1,499 | 359 (37.8%) | 154 (21.0%) |
| Total | 951 (100.0%) | 733 (100.0%) |
Health & Disability in Carthage
Health Insurance Coverage by Age in Carthage
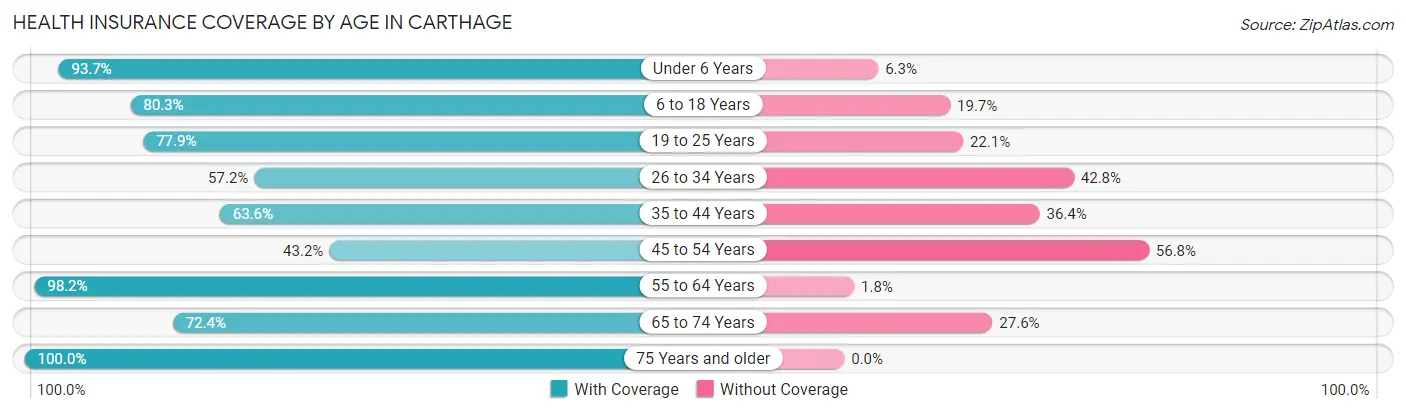
| Age Bracket | With Coverage | Without Coverage |
| Under 6 Years | 682 (93.7%) | 46 (6.3%) |
| 6 to 18 Years | 822 (80.3%) | 202 (19.7%) |
| 19 to 25 Years | 542 (77.9%) | 154 (22.1%) |
| 26 to 34 Years | 350 (57.2%) | 262 (42.8%) |
| 35 to 44 Years | 372 (63.6%) | 213 (36.4%) |
| 45 to 54 Years | 328 (43.2%) | 431 (56.8%) |
| 55 to 64 Years | 967 (98.2%) | 18 (1.8%) |
| 65 to 74 Years | 359 (72.4%) | 137 (27.6%) |
| 75 Years and older | 460 (100.0%) | 0 (0.0%) |
| Total | 4,882 (76.9%) | 1,463 (23.1%) |
Health Insurance Coverage by Citizenship Status in Carthage
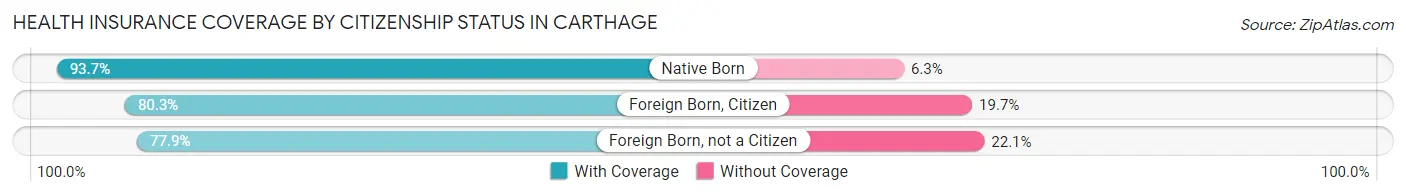
| Citizenship Status | With Coverage | Without Coverage |
| Native Born | 682 (93.7%) | 46 (6.3%) |
| Foreign Born, Citizen | 822 (80.3%) | 202 (19.7%) |
| Foreign Born, not a Citizen | 542 (77.9%) | 154 (22.1%) |
Health Insurance Coverage by Household Income in Carthage
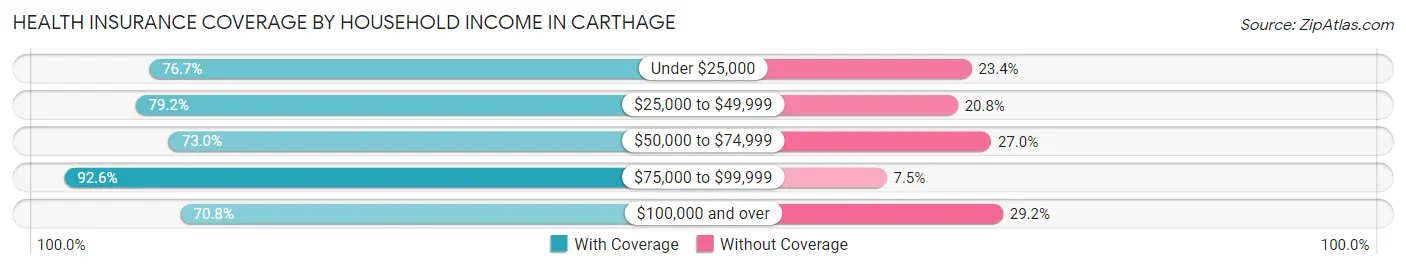
| Household Income | With Coverage | Without Coverage |
| Under $25,000 | 1,057 (76.6%) | 322 (23.4%) |
| $25,000 to $49,999 | 835 (79.2%) | 219 (20.8%) |
| $50,000 to $74,999 | 443 (73.0%) | 164 (27.0%) |
| $75,000 to $99,999 | 708 (92.5%) | 57 (7.4%) |
| $100,000 and over | 1,644 (70.8%) | 679 (29.2%) |
Public vs Private Health Insurance Coverage by Age in Carthage
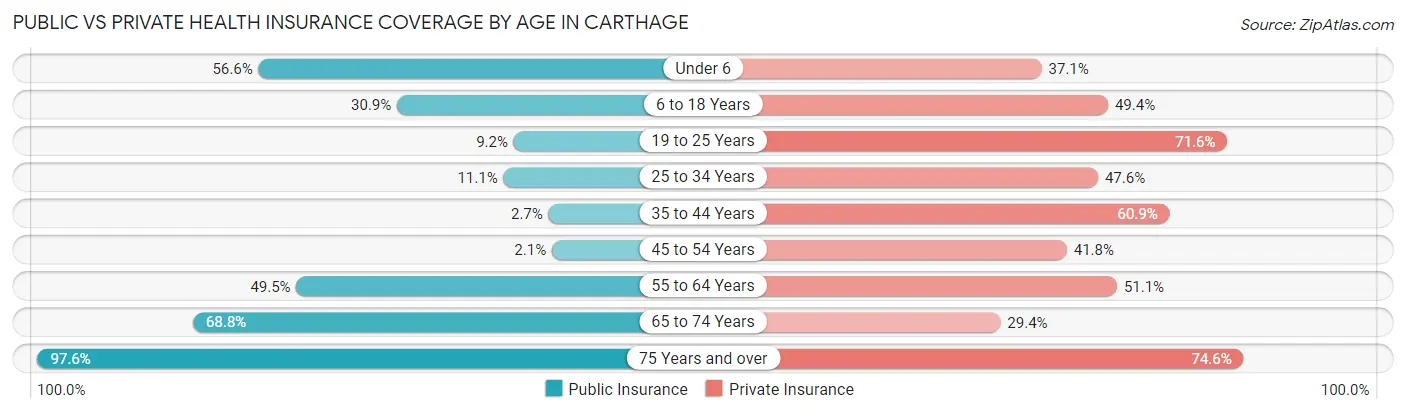
| Age Bracket | Public Insurance | Private Insurance |
| Under 6 | 412 (56.6%) | 270 (37.1%) |
| 6 to 18 Years | 316 (30.9%) | 506 (49.4%) |
| 19 to 25 Years | 64 (9.2%) | 498 (71.6%) |
| 25 to 34 Years | 68 (11.1%) | 291 (47.5%) |
| 35 to 44 Years | 16 (2.7%) | 356 (60.9%) |
| 45 to 54 Years | 16 (2.1%) | 317 (41.8%) |
| 55 to 64 Years | 488 (49.5%) | 503 (51.1%) |
| 65 to 74 Years | 341 (68.8%) | 146 (29.4%) |
| 75 Years and over | 449 (97.6%) | 343 (74.6%) |
| Total | 2,170 (34.2%) | 3,230 (50.9%) |
Disability Status by Sex by Age in Carthage
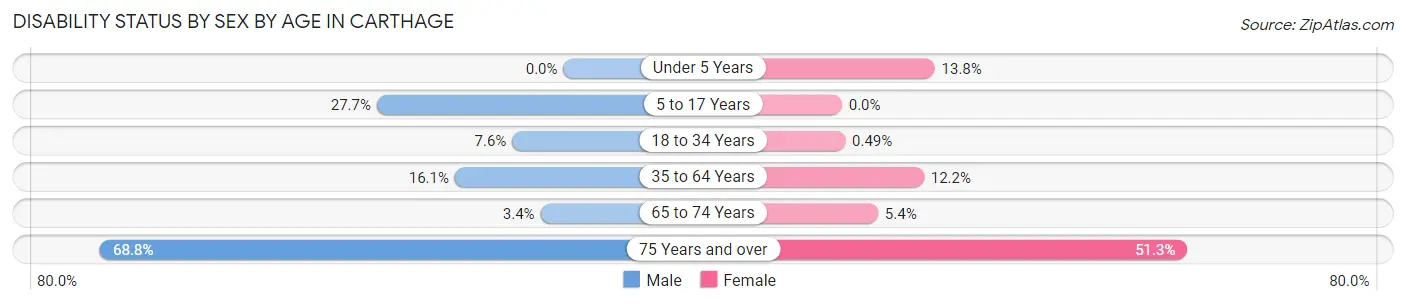
| Age Bracket | Male | Female |
| Under 5 Years | 0 (0.0%) | 31 (13.8%) |
| 5 to 17 Years | 149 (27.7%) | 0 (0.0%) |
| 18 to 34 Years | 51 (7.6%) | 4 (0.5%) |
| 35 to 64 Years | 190 (16.1%) | 140 (12.2%) |
| 65 to 74 Years | 8 (3.4%) | 14 (5.4%) |
| 75 Years and over | 130 (68.8%) | 139 (51.3%) |
Disability Class by Sex by Age in Carthage
Disability Class: Hearing Difficulty
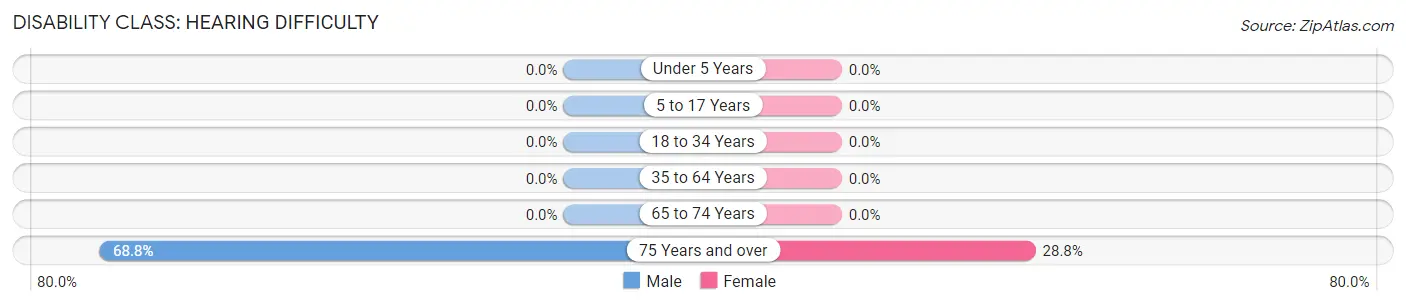
| Age Bracket | Male | Female |
| Under 5 Years | 0 (0.0%) | 0 (0.0%) |
| 5 to 17 Years | 0 (0.0%) | 0 (0.0%) |
| 18 to 34 Years | 0 (0.0%) | 0 (0.0%) |
| 35 to 64 Years | 0 (0.0%) | 0 (0.0%) |
| 65 to 74 Years | 0 (0.0%) | 0 (0.0%) |
| 75 Years and over | 130 (68.8%) | 78 (28.8%) |
Disability Class: Vision Difficulty
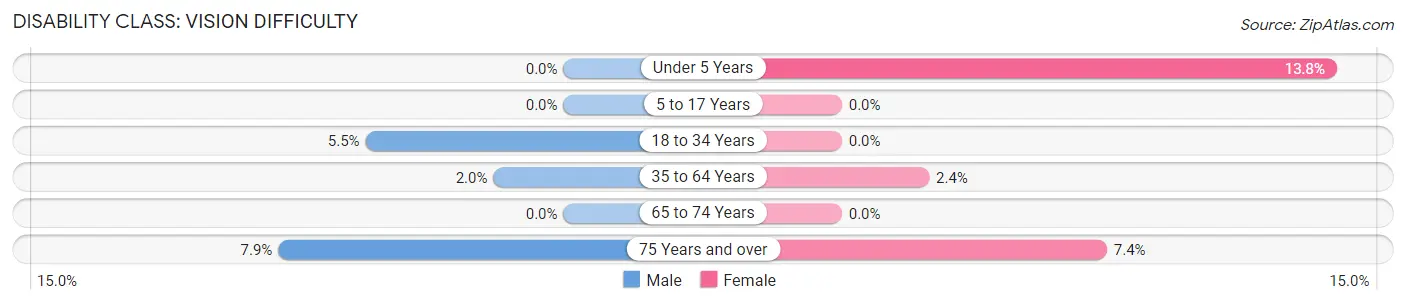
| Age Bracket | Male | Female |
| Under 5 Years | 0 (0.0%) | 31 (13.8%) |
| 5 to 17 Years | 0 (0.0%) | 0 (0.0%) |
| 18 to 34 Years | 37 (5.5%) | 0 (0.0%) |
| 35 to 64 Years | 23 (1.9%) | 28 (2.4%) |
| 65 to 74 Years | 0 (0.0%) | 0 (0.0%) |
| 75 Years and over | 15 (7.9%) | 20 (7.4%) |
Disability Class: Cognitive Difficulty
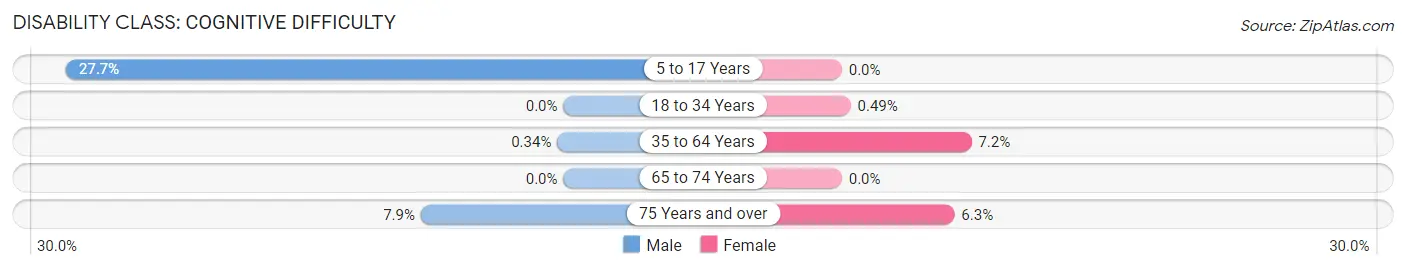
| Age Bracket | Male | Female |
| 5 to 17 Years | 149 (27.7%) | 0 (0.0%) |
| 18 to 34 Years | 0 (0.0%) | 4 (0.5%) |
| 35 to 64 Years | 4 (0.3%) | 83 (7.2%) |
| 65 to 74 Years | 0 (0.0%) | 0 (0.0%) |
| 75 Years and over | 15 (7.9%) | 17 (6.3%) |
Disability Class: Ambulatory Difficulty
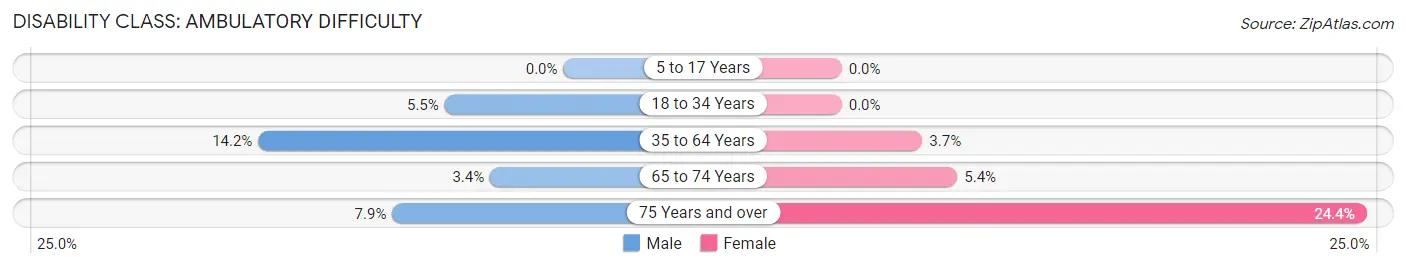
| Age Bracket | Male | Female |
| 5 to 17 Years | 0 (0.0%) | 0 (0.0%) |
| 18 to 34 Years | 37 (5.5%) | 0 (0.0%) |
| 35 to 64 Years | 167 (14.2%) | 43 (3.7%) |
| 65 to 74 Years | 8 (3.4%) | 14 (5.4%) |
| 75 Years and over | 15 (7.9%) | 66 (24.3%) |
Disability Class: Self-Care Difficulty
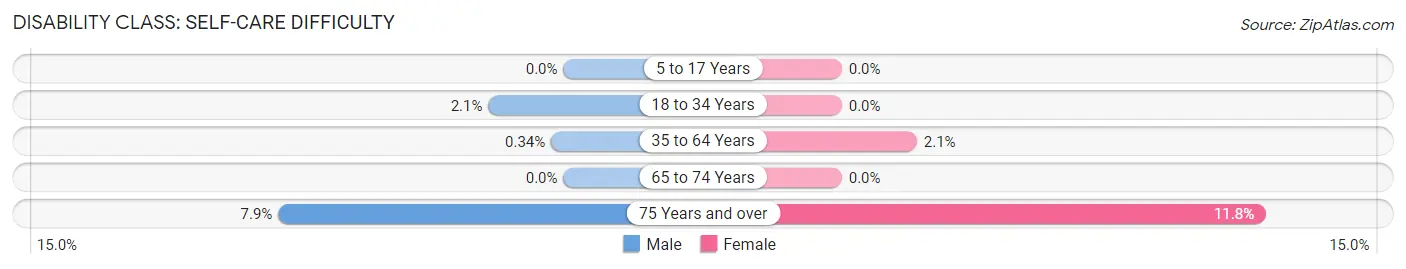
| Age Bracket | Male | Female |
| 5 to 17 Years | 0 (0.0%) | 0 (0.0%) |
| 18 to 34 Years | 14 (2.1%) | 0 (0.0%) |
| 35 to 64 Years | 4 (0.3%) | 24 (2.1%) |
| 65 to 74 Years | 0 (0.0%) | 0 (0.0%) |
| 75 Years and over | 15 (7.9%) | 32 (11.8%) |
Technology Access in Carthage
Computing Device Access in Carthage
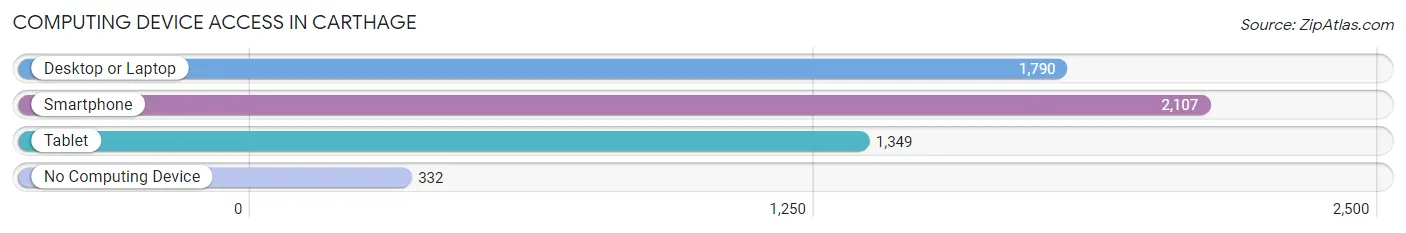
| Device Type | # Households | % Households |
| Desktop or Laptop | 1,790 | 71.3% |
| Smartphone | 2,107 | 83.9% |
| Tablet | 1,349 | 53.7% |
| No Computing Device | 332 | 13.2% |
| Total | 2,511 | 100.0% |
Internet Access in Carthage
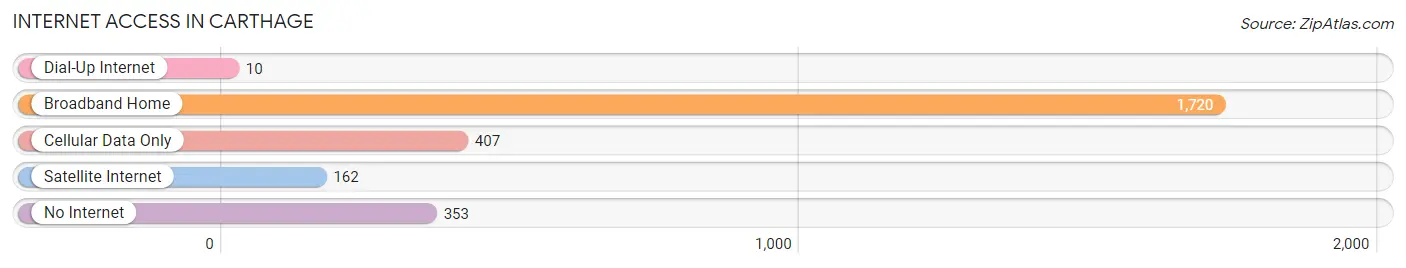
| Internet Type | # Households | % Households |
| Dial-Up Internet | 10 | 0.4% |
| Broadband Home | 1,720 | 68.5% |
| Cellular Data Only | 407 | 16.2% |
| Satellite Internet | 162 | 6.5% |
| No Internet | 353 | 14.1% |
| Total | 2,511 | 100.0% |
Carthage Summary
Carthage, Texas is a small town located in the eastern part of the state, about 150 miles east of Dallas. It is the county seat of Panola County and is part of the Longview-Marshall Metropolitan Statistical Area. The town was founded in 1848 and has a population of 6,779 as of the 2010 census.
History
Carthage was founded in 1848 by a group of settlers from the nearby town of Marshall. The town was named after the ancient city of Carthage in Tunisia, which was destroyed by the Romans in 146 BC. The settlers chose the name because they wanted to create a new city that would be as great as the ancient one.
The town was officially incorporated in 1852 and quickly became a center of commerce and industry. The first railroad line was built in 1872, connecting Carthage to Marshall and other nearby towns. This allowed the town to become a major shipping hub for the region.
In the late 19th century, the town was a major center for the timber industry. The town was also home to several large cotton plantations. The town was also home to several large sawmills and other industries.
In the early 20th century, the town experienced a period of growth and prosperity. The population increased from 1,500 in 1900 to over 5,000 by 1930. The town was also home to several large businesses, including a cotton gin, a brick factory, and a lumber mill.
Geography
Carthage is located in the eastern part of Texas, about 150 miles east of Dallas. It is situated in the Piney Woods region of the state, which is characterized by rolling hills and dense forests. The town is located on the banks of the Sabine River, which forms the border between Texas and Louisiana.
The town has a total area of 4.2 square miles, all of which is land. The climate is humid subtropical, with hot summers and mild winters. The average annual temperature is 68 degrees Fahrenheit.
Economy
The economy of Carthage is largely based on agriculture and manufacturing. The town is home to several large farms, which produce cotton, soybeans, and other crops. The town is also home to several large manufacturing plants, which produce a variety of products, including furniture, clothing, and paper products.
The town is also home to several large retail stores, including Walmart, Lowe’s, and Home Depot. The town is also home to several restaurants, hotels, and other businesses.
Demographics
As of the 2010 census, the population of Carthage was 6,779. The racial makeup of the town was 79.3% White, 17.2% African American, 0.7% Native American, 0.3% Asian, 0.1% Pacific Islander, and 2.4% from other races. Hispanic or Latino of any race were 5.2% of the population.
The median household income in the town was $35,945, and the median family income was $41,945. The per capita income in the town was $17,945. About 17.2% of the population was below the poverty line.
Carthage is a small town with a rich history and a diverse economy. The town is home to several large farms and manufacturing plants, as well as several retail stores and restaurants. The town has a population of 6,779 as of the 2010 census, and the median household income is $35,945.
Common Questions
What is Per Capita Income in Carthage?
Per Capita income in Carthage is $33,110.
What is the Median Family Income in Carthage?
Median Family Income in Carthage is $80,432.
What is the Median Household income in Carthage?
Median Household Income in Carthage is $42,788.
What is Income or Wage Gap in Carthage?
Income or Wage Gap in Carthage is 25.8%.
Women in Carthage earn 74.2 cents for every dollar earned by a man.
What is Family Income Deficit in Carthage?
Family Income Deficit in Carthage is $16,890.
Families that are below poverty line in Carthage earn $16,890 less on average than the poverty threshold level.
What is Inequality or Gini Index in Carthage?
Inequality or Gini Index in Carthage is 0.56.
What is the Total Population of Carthage?
Total Population of Carthage is 6,549.
What is the Total Male Population of Carthage?
Total Male Population of Carthage is 3,167.
What is the Total Female Population of Carthage?
Total Female Population of Carthage is 3,382.
What is the Ratio of Males per 100 Females in Carthage?
There are 93.64 Males per 100 Females in Carthage.
What is the Ratio of Females per 100 Males in Carthage?
There are 106.79 Females per 100 Males in Carthage.
What is the Median Population Age in Carthage?
Median Population Age in Carthage is 36.4 Years.
What is the Average Family Size in Carthage
Average Family Size in Carthage is 3.2 People.
What is the Average Household Size in Carthage
Average Household Size in Carthage is 2.4 People.
How Large is the Labor Force in Carthage?
There are 2,773 People in the Labor Forcein in Carthage.
What is the Percentage of People in the Labor Force in Carthage?
54.3% of People are in the Labor Force in Carthage.
What is the Unemployment Rate in Carthage?
Unemployment Rate in Carthage is 0.8%.