Canyon Lake, TX Map & Demographics
Canyon Lake Map
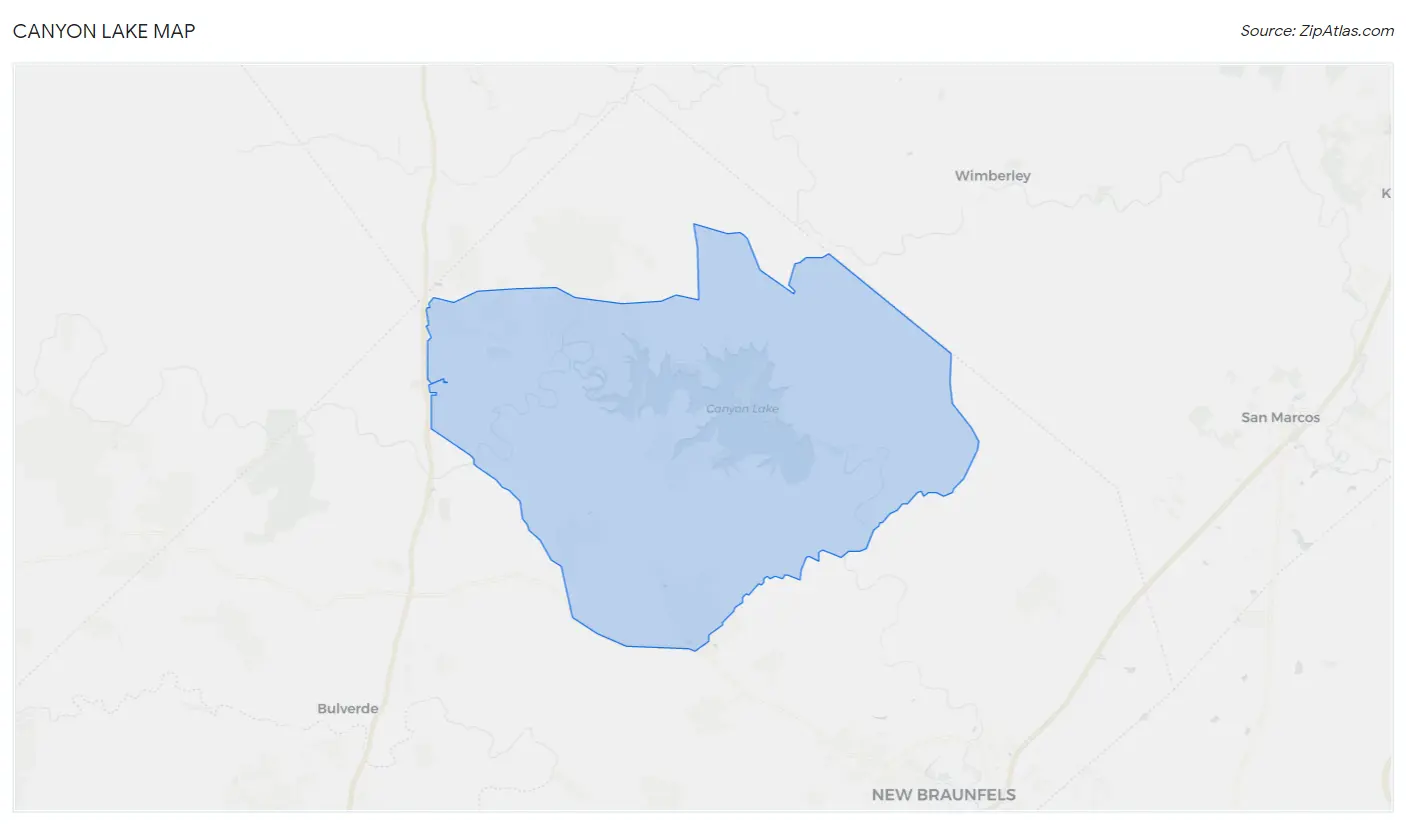
Canyon Lake Overview
$44,594
PER CAPITA INCOME
$98,425
AVG FAMILY INCOME
$90,758
AVG HOUSEHOLD INCOME
37.1%
WAGE / INCOME GAP [ % ]
62.9¢/ $1
WAGE / INCOME GAP [ $ ]
0.44
INEQUALITY / GINI INDEX
32,035
TOTAL POPULATION
16,074
MALE POPULATION
15,961
FEMALE POPULATION
100.71
MALES / 100 FEMALES
99.30
FEMALES / 100 MALES
47.1
MEDIAN AGE
3.0
AVG FAMILY SIZE
2.5
AVG HOUSEHOLD SIZE
14,241
LABOR FORCE [ PEOPLE ]
54.4%
PERCENT IN LABOR FORCE
3.0%
UNEMPLOYMENT RATE
Canyon Lake Zip Codes
Canyon Lake Area Codes
Income in Canyon Lake
Income Overview in Canyon Lake
Per Capita Income in Canyon Lake is $44,594, while median incomes of families and households are $98,425 and $90,758 respectively.
| Characteristic | Number | Measure |
| Per Capita Income | 32,035 | $44,594 |
| Median Family Income | 9,355 | $98,425 |
| Mean Family Income | 9,355 | $129,699 |
| Median Household Income | 12,589 | $90,758 |
| Mean Household Income | 12,589 | $112,736 |
| Income Deficit | 9,355 | $0 |
| Wage / Income Gap (%) | 32,035 | 37.09% |
| Wage / Income Gap ($) | 32,035 | 62.91¢ per $1 |
| Gini / Inequality Index | 32,035 | 0.44 |
Earnings by Sex in Canyon Lake
Average Earnings in Canyon Lake are $44,984, $54,560 for men and $34,324 for women, a difference of 37.1%.
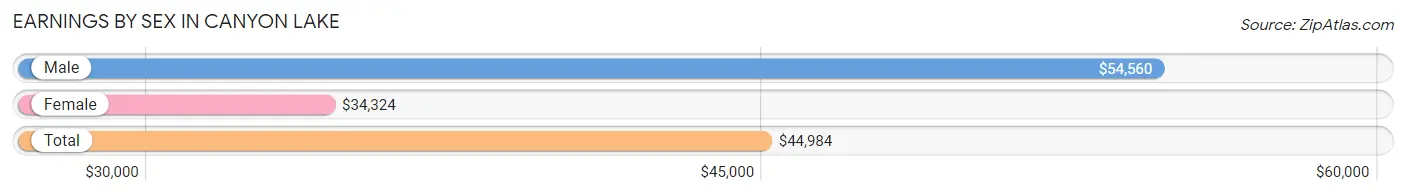
| Sex | Number | Average Earnings |
| Male | 8,551 (55.5%) | $54,560 |
| Female | 6,852 (44.5%) | $34,324 |
| Total | 15,403 (100.0%) | $44,984 |
Earnings by Sex by Income Bracket in Canyon Lake
The most common earnings brackets in Canyon Lake are $100,000+ for men (2,015 | 23.6%) and $100,000+ for women (712 | 10.4%).
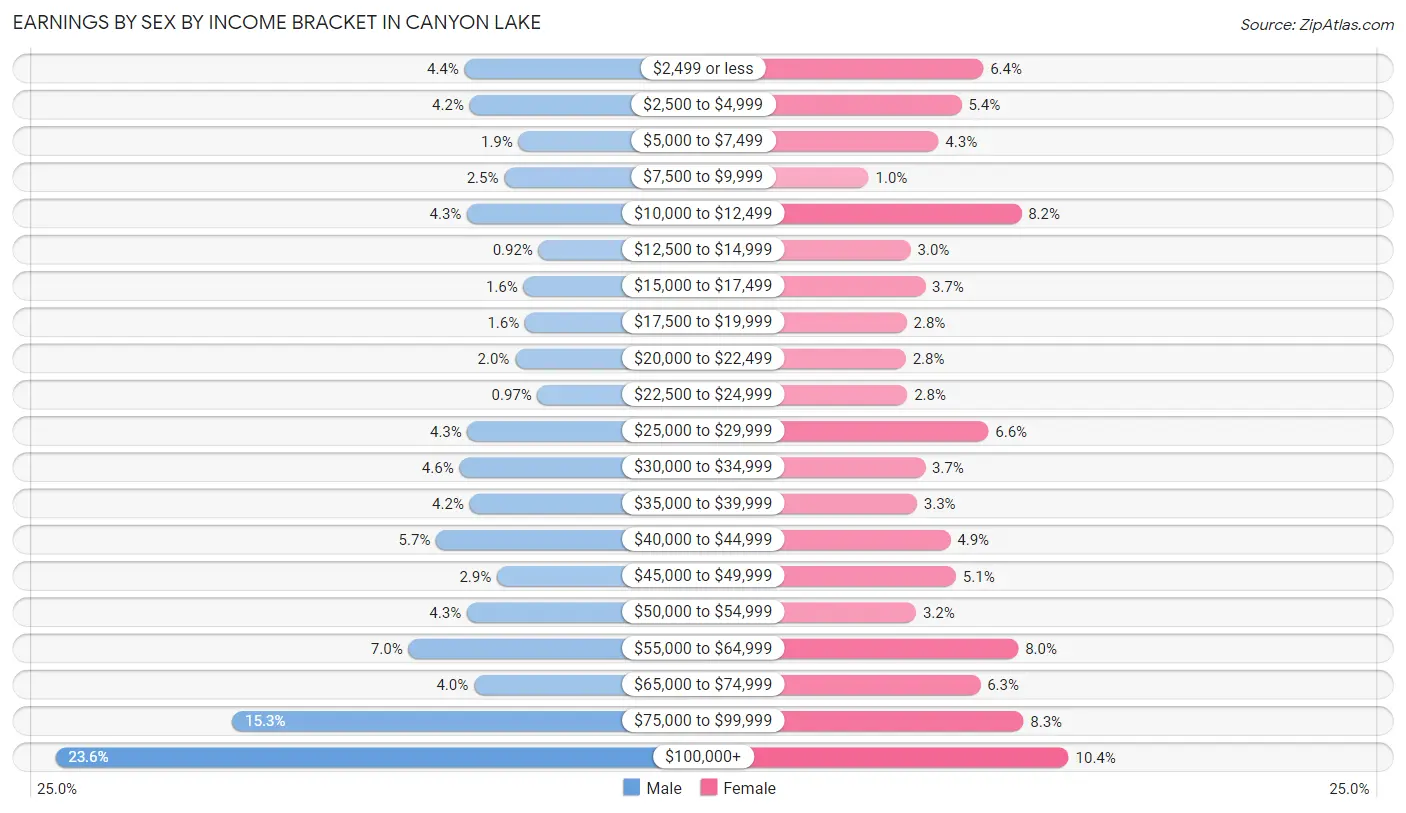
| Income | Male | Female |
| $2,499 or less | 375 (4.4%) | 438 (6.4%) |
| $2,500 to $4,999 | 355 (4.2%) | 368 (5.4%) |
| $5,000 to $7,499 | 159 (1.9%) | 294 (4.3%) |
| $7,500 to $9,999 | 216 (2.5%) | 70 (1.0%) |
| $10,000 to $12,499 | 365 (4.3%) | 560 (8.2%) |
| $12,500 to $14,999 | 79 (0.9%) | 205 (3.0%) |
| $15,000 to $17,499 | 139 (1.6%) | 251 (3.7%) |
| $17,500 to $19,999 | 133 (1.6%) | 192 (2.8%) |
| $20,000 to $22,499 | 173 (2.0%) | 189 (2.8%) |
| $22,500 to $24,999 | 83 (1.0%) | 194 (2.8%) |
| $25,000 to $29,999 | 363 (4.3%) | 454 (6.6%) |
| $30,000 to $34,999 | 396 (4.6%) | 251 (3.7%) |
| $35,000 to $39,999 | 355 (4.2%) | 225 (3.3%) |
| $40,000 to $44,999 | 489 (5.7%) | 332 (4.9%) |
| $45,000 to $49,999 | 245 (2.9%) | 350 (5.1%) |
| $50,000 to $54,999 | 366 (4.3%) | 222 (3.2%) |
| $55,000 to $64,999 | 600 (7.0%) | 550 (8.0%) |
| $65,000 to $74,999 | 338 (4.0%) | 428 (6.2%) |
| $75,000 to $99,999 | 1,307 (15.3%) | 567 (8.3%) |
| $100,000+ | 2,015 (23.6%) | 712 (10.4%) |
| Total | 8,551 (100.0%) | 6,852 (100.0%) |
Earnings by Sex by Educational Attainment in Canyon Lake
Average earnings in Canyon Lake are $62,044 for men and $40,863 for women, a difference of 34.1%. Men with an educational attainment of bachelor's degree enjoy the highest average annual earnings of $89,783, while those with less than high school education earn the least with $39,671. Women with an educational attainment of graduate degree earn the most with the average annual earnings of $67,845, while those with high school diploma education have the smallest earnings of $14,968.
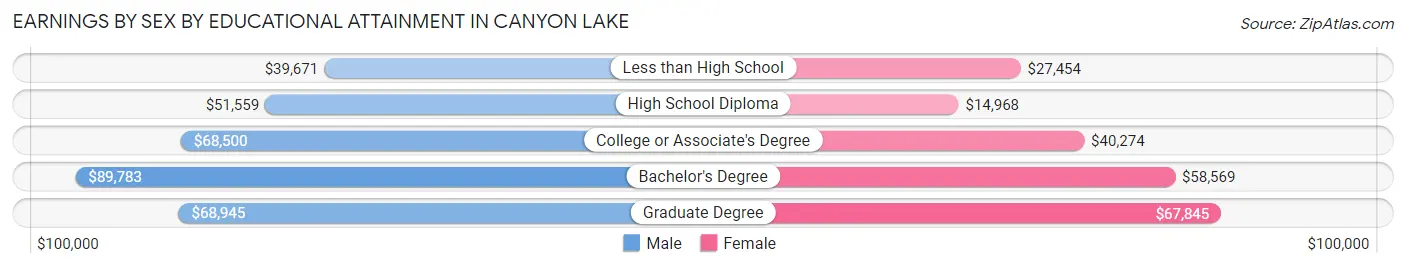
| Educational Attainment | Male Income | Female Income |
| Less than High School | $39,671 | $27,454 |
| High School Diploma | $51,559 | $14,968 |
| College or Associate's Degree | $68,500 | $40,274 |
| Bachelor's Degree | $89,783 | $58,569 |
| Graduate Degree | $68,945 | $67,845 |
| Total | $62,044 | $40,863 |
Family Income in Canyon Lake
Family Income Brackets in Canyon Lake
According to the Canyon Lake family income data, there are 1,862 families falling into the $200,000+ income range, which is the most common income bracket and makes up 19.9% of all families. Conversely, the $10,000 to $14,999 income bracket is the least frequent group with only 84 families (0.9%) belonging to this category.
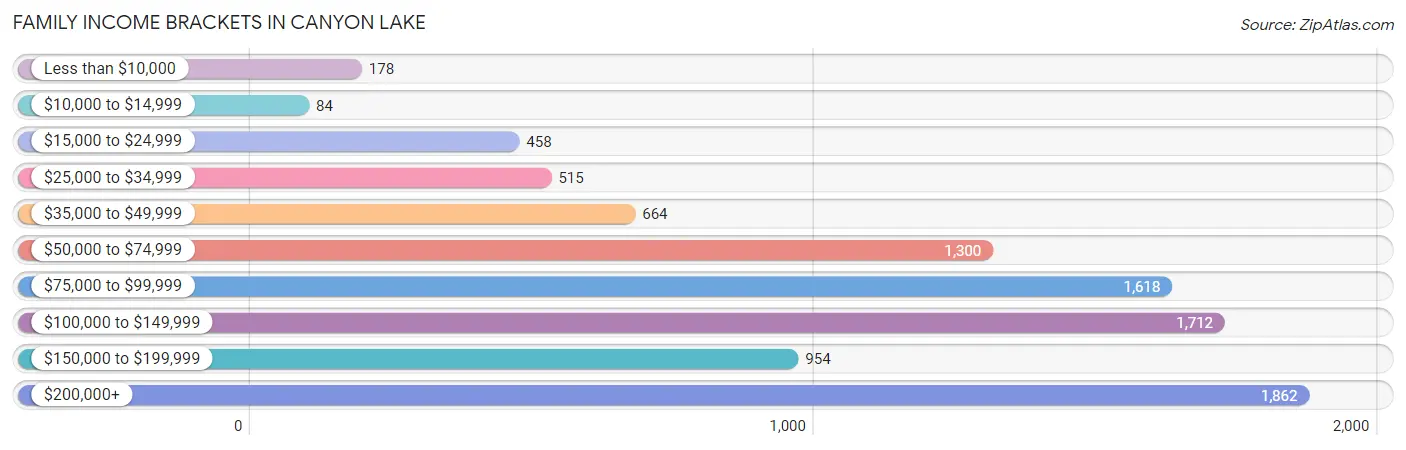
| Income Bracket | # Families | % Families |
| Less than $10,000 | 178 | 1.9% |
| $10,000 to $14,999 | 84 | 0.9% |
| $15,000 to $24,999 | 458 | 4.9% |
| $25,000 to $34,999 | 515 | 5.5% |
| $35,000 to $49,999 | 664 | 7.1% |
| $50,000 to $74,999 | 1,300 | 13.9% |
| $75,000 to $99,999 | 1,618 | 17.3% |
| $100,000 to $149,999 | 1,712 | 18.3% |
| $150,000 to $199,999 | 954 | 10.2% |
| $200,000+ | 1,862 | 19.9% |
Family Income by Famaliy Size in Canyon Lake
7+ person families (128 | 1.4%) account for the highest median family income in Canyon Lake with $115,577 per family, while 2-person families (5,430 | 58.0%) have the highest median income of $48,960 per family member.
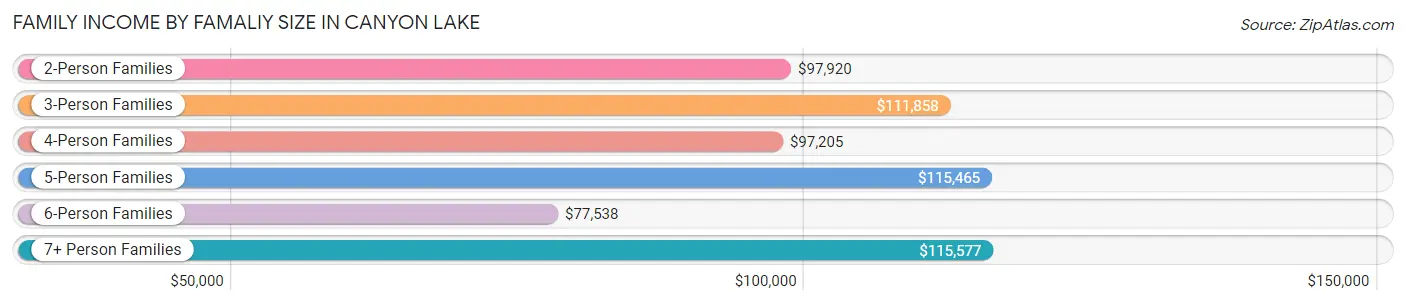
| Income Bracket | # Families | Median Income |
| 2-Person Families | 5,430 (58.0%) | $97,920 |
| 3-Person Families | 1,369 (14.6%) | $111,858 |
| 4-Person Families | 1,723 (18.4%) | $97,205 |
| 5-Person Families | 500 (5.3%) | $115,465 |
| 6-Person Families | 205 (2.2%) | $77,538 |
| 7+ Person Families | 128 (1.4%) | $115,577 |
| Total | 9,355 (100.0%) | $98,425 |
Family Income by Number of Earners in Canyon Lake
The median family income in Canyon Lake is $98,425, with families comprising 3+ earners (837) having the highest median family income of $153,542, while families with no earners (2,131) have the lowest median family income of $73,422, accounting for 8.9% and 22.8% of families, respectively.
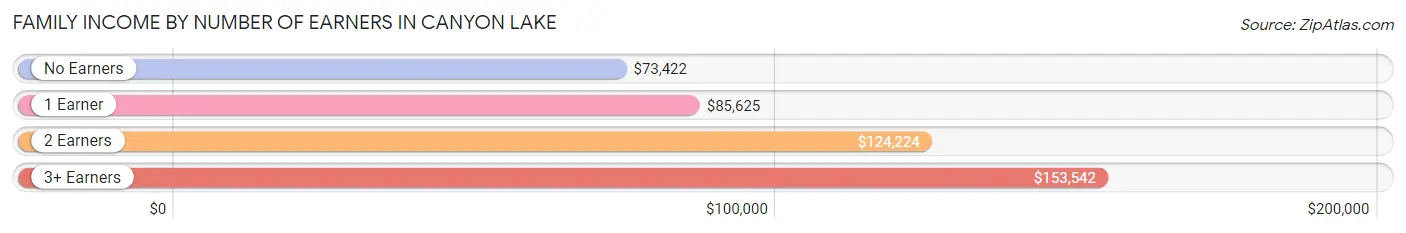
| Number of Earners | # Families | Median Income |
| No Earners | 2,131 (22.8%) | $73,422 |
| 1 Earner | 2,819 (30.1%) | $85,625 |
| 2 Earners | 3,568 (38.1%) | $124,224 |
| 3+ Earners | 837 (8.9%) | $153,542 |
| Total | 9,355 (100.0%) | $98,425 |
Household Income in Canyon Lake
Household Income Brackets in Canyon Lake
With 2,165 households falling in the category, the $100,000 to $149,999 income range is the most frequent in Canyon Lake, accounting for 17.2% of all households. In contrast, only 264 households (2.1%) fall into the $10,000 to $14,999 income bracket, making it the least populous group.
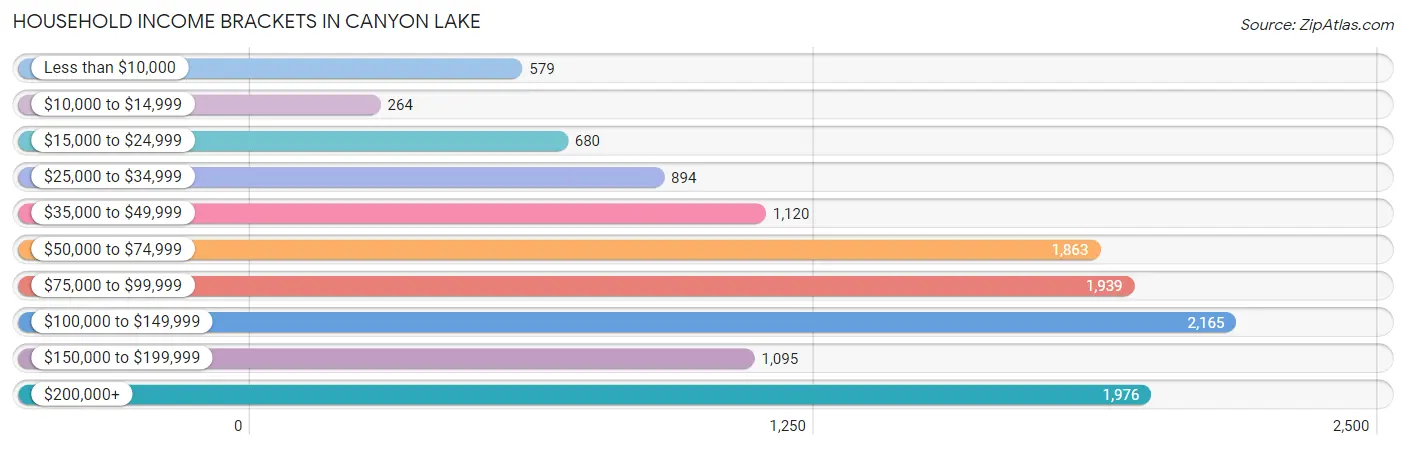
| Income Bracket | # Households | % Households |
| Less than $10,000 | 579 | 4.6% |
| $10,000 to $14,999 | 264 | 2.1% |
| $15,000 to $24,999 | 680 | 5.4% |
| $25,000 to $34,999 | 894 | 7.1% |
| $35,000 to $49,999 | 1,120 | 8.9% |
| $50,000 to $74,999 | 1,863 | 14.8% |
| $75,000 to $99,999 | 1,939 | 15.4% |
| $100,000 to $149,999 | 2,165 | 17.2% |
| $150,000 to $199,999 | 1,095 | 8.7% |
| $200,000+ | 1,976 | 15.7% |
Household Income by Householder Age in Canyon Lake
The median household income in Canyon Lake is $90,758, with the highest median household income of $102,713 found in the 45 to 64 years age bracket for the primary householder. A total of 5,113 households (40.6%) fall into this category. Meanwhile, the 15 to 24 years age bracket for the primary householder has the lowest median household income of $0, with 295 households (2.3%) in this group.
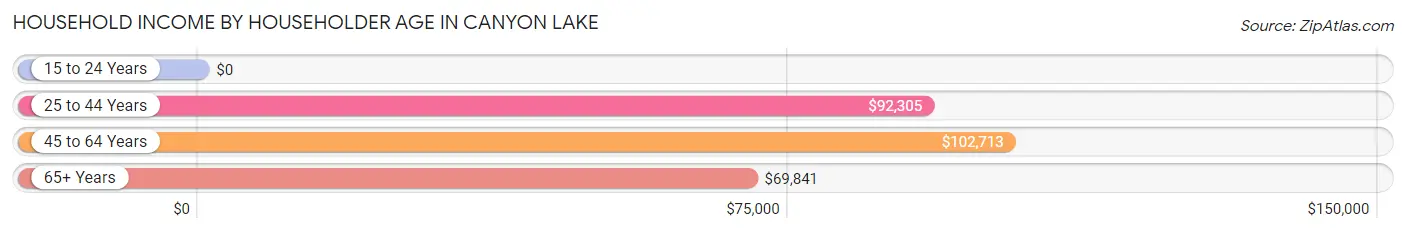
| Income Bracket | # Households | Median Income |
| 15 to 24 Years | 295 (2.3%) | $0 |
| 25 to 44 Years | 3,096 (24.6%) | $92,305 |
| 45 to 64 Years | 5,113 (40.6%) | $102,713 |
| 65+ Years | 4,085 (32.5%) | $69,841 |
| Total | 12,589 (100.0%) | $90,758 |
Poverty in Canyon Lake
Income Below Poverty by Sex and Age in Canyon Lake
With 5.9% poverty level for males and 8.9% for females among the residents of Canyon Lake, 5 year old males and 18 to 24 year old females are the most vulnerable to poverty, with 53 males (35.3%) and 148 females (22.7%) in their respective age groups living below the poverty level.
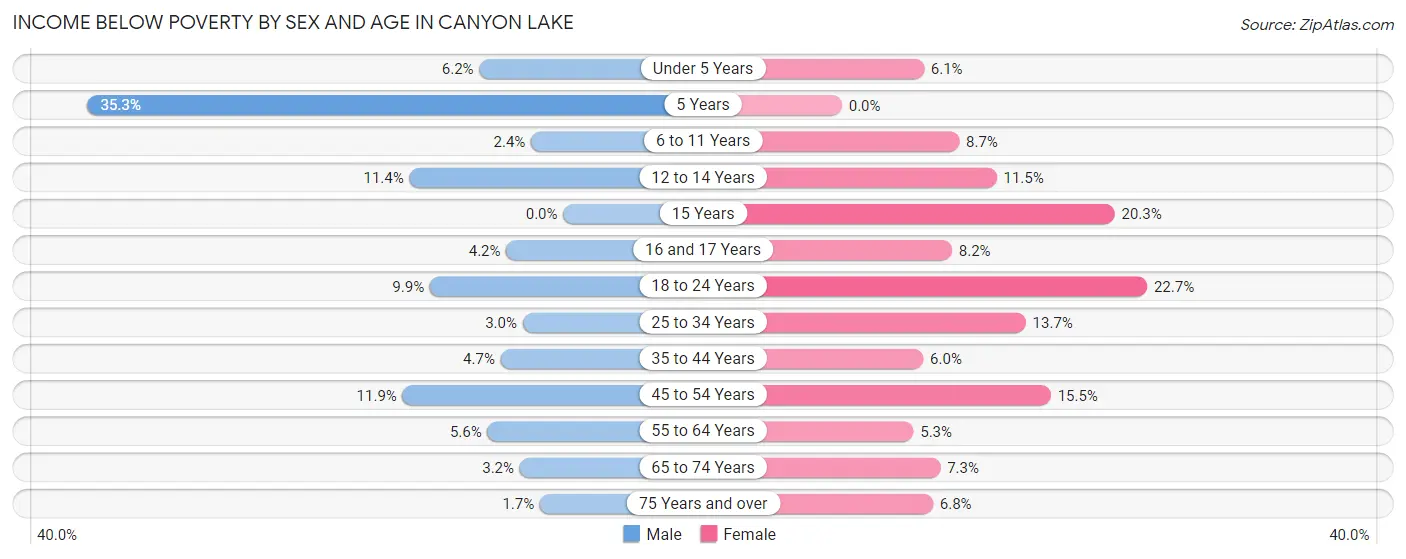
| Age Bracket | Male | Female |
| Under 5 Years | 58 (6.2%) | 55 (6.1%) |
| 5 Years | 53 (35.3%) | 0 (0.0%) |
| 6 to 11 Years | 28 (2.4%) | 86 (8.7%) |
| 12 to 14 Years | 54 (11.4%) | 71 (11.5%) |
| 15 Years | 0 (0.0%) | 32 (20.3%) |
| 16 and 17 Years | 24 (4.2%) | 29 (8.2%) |
| 18 to 24 Years | 86 (9.9%) | 148 (22.7%) |
| 25 to 34 Years | 48 (3.0%) | 187 (13.7%) |
| 35 to 44 Years | 85 (4.6%) | 139 (6.0%) |
| 45 to 54 Years | 248 (11.9%) | 241 (15.5%) |
| 55 to 64 Years | 158 (5.6%) | 160 (5.3%) |
| 65 to 74 Years | 76 (3.2%) | 181 (7.3%) |
| 75 Years and over | 20 (1.7%) | 81 (6.8%) |
| Total | 938 (5.9%) | 1,410 (8.9%) |
Income Above Poverty by Sex and Age in Canyon Lake
According to the poverty statistics in Canyon Lake, males aged 15 years and females aged 5 years are the age groups that are most secure financially, with 100.0% of males and 100.0% of females in these age groups living above the poverty line.
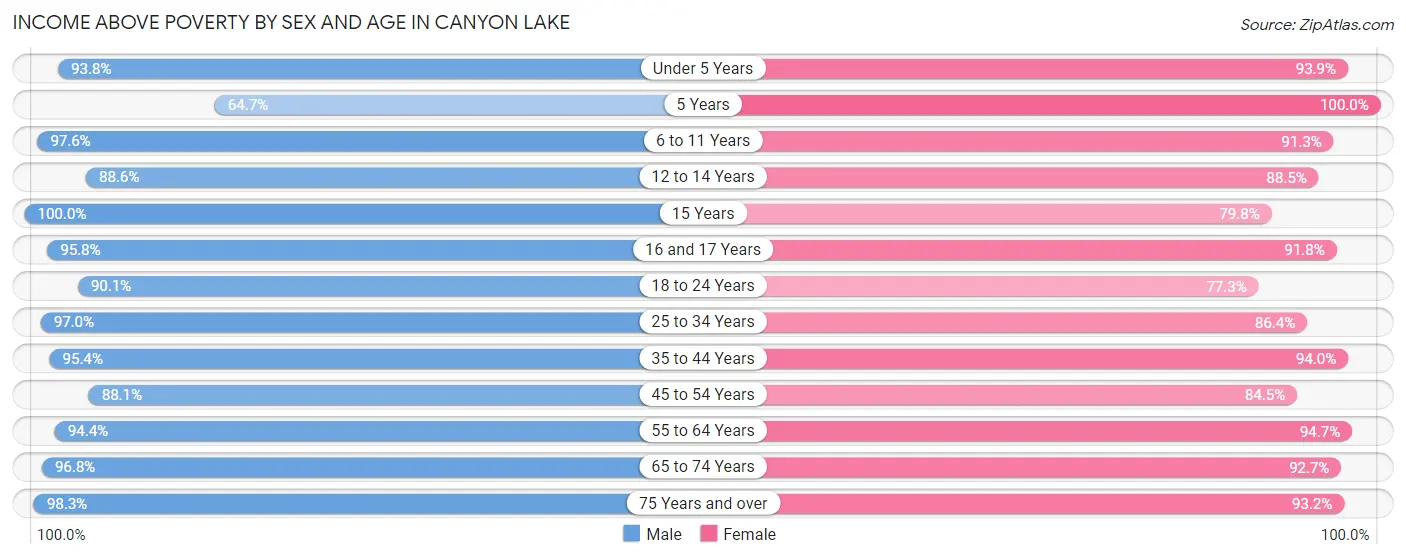
| Age Bracket | Male | Female |
| Under 5 Years | 873 (93.8%) | 848 (93.9%) |
| 5 Years | 97 (64.7%) | 232 (100.0%) |
| 6 to 11 Years | 1,143 (97.6%) | 901 (91.3%) |
| 12 to 14 Years | 419 (88.6%) | 547 (88.5%) |
| 15 Years | 45 (100.0%) | 126 (79.7%) |
| 16 and 17 Years | 543 (95.8%) | 326 (91.8%) |
| 18 to 24 Years | 783 (90.1%) | 505 (77.3%) |
| 25 to 34 Years | 1,546 (97.0%) | 1,183 (86.4%) |
| 35 to 44 Years | 1,743 (95.4%) | 2,163 (94.0%) |
| 45 to 54 Years | 1,830 (88.1%) | 1,313 (84.5%) |
| 55 to 64 Years | 2,647 (94.4%) | 2,855 (94.7%) |
| 65 to 74 Years | 2,278 (96.8%) | 2,294 (92.7%) |
| 75 Years and over | 1,139 (98.3%) | 1,117 (93.2%) |
| Total | 15,086 (94.2%) | 14,410 (91.1%) |
Income Below Poverty Among Married-Couple Families in Canyon Lake
The poverty statistics for married-couple families in Canyon Lake show that 2.7% or 221 of the total 8,094 families live below the poverty line. Families with 3 or 4 children have the highest poverty rate of 5.1%, comprising of 22 families. On the other hand, families with 5 or more children have the lowest poverty rate of 0.0%, which includes 0 families.
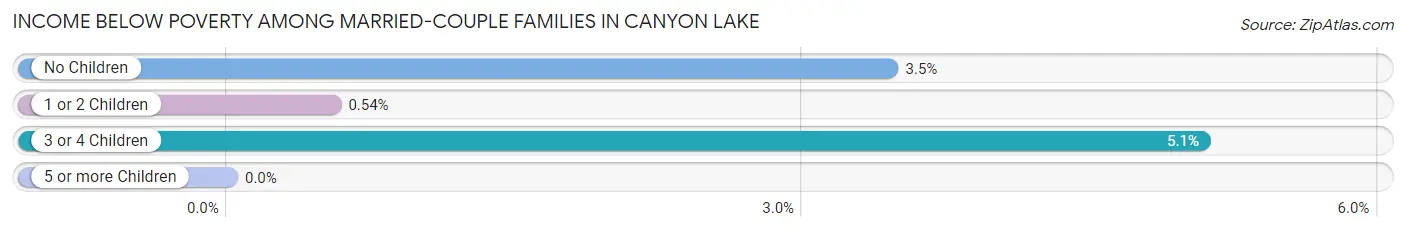
| Children | Above Poverty | Below Poverty |
| No Children | 5,238 (96.6%) | 187 (3.5%) |
| 1 or 2 Children | 2,190 (99.5%) | 12 (0.5%) |
| 3 or 4 Children | 411 (94.9%) | 22 (5.1%) |
| 5 or more Children | 34 (100.0%) | 0 (0.0%) |
| Total | 7,873 (97.3%) | 221 (2.7%) |
Income Below Poverty Among Single-Parent Households in Canyon Lake
According to the poverty data in Canyon Lake, 2.7% or 17 single-father households and 34.2% or 213 single-mother households are living below the poverty line. Among single-father households, those with 1 or 2 children have the highest poverty rate, with 17 households (4.8%) experiencing poverty. Likewise, among single-mother households, those with 5 or more children have the highest poverty rate, with 28 households (100.0%) falling below the poverty line.
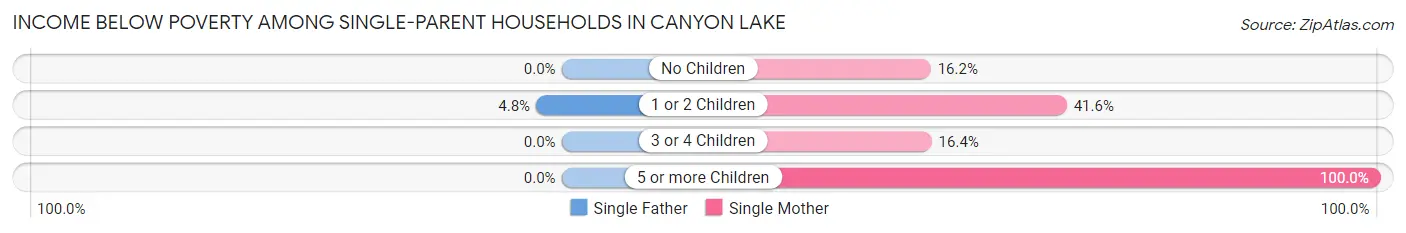
| Children | Single Father | Single Mother |
| No Children | 0 (0.0%) | 30 (16.2%) |
| 1 or 2 Children | 17 (4.8%) | 145 (41.5%) |
| 3 or 4 Children | 0 (0.0%) | 10 (16.4%) |
| 5 or more Children | 0 (0.0%) | 28 (100.0%) |
| Total | 17 (2.7%) | 213 (34.2%) |
Income Below Poverty Among Married-Couple vs Single-Parent Households in Canyon Lake
The poverty data for Canyon Lake shows that 221 of the married-couple family households (2.7%) and 230 of the single-parent households (18.2%) are living below the poverty level. Within the married-couple family households, those with 3 or 4 children have the highest poverty rate, with 22 households (5.1%) falling below the poverty line. Among the single-parent households, those with 5 or more children have the highest poverty rate, with 28 household (100.0%) living below poverty.
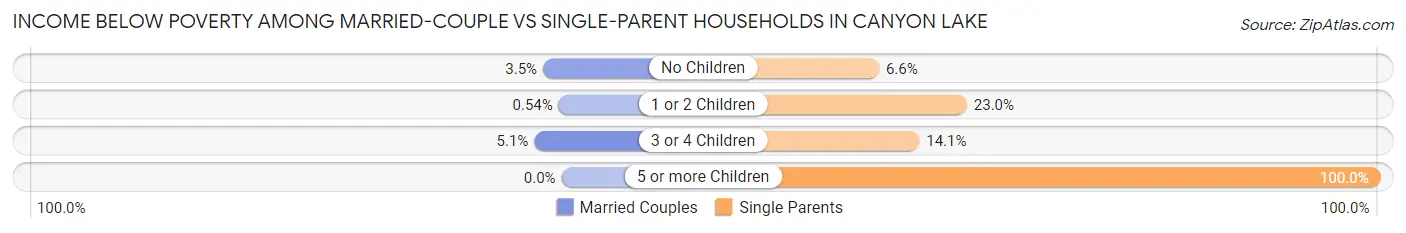
| Children | Married-Couple Families | Single-Parent Households |
| No Children | 187 (3.5%) | 30 (6.6%) |
| 1 or 2 Children | 12 (0.5%) | 162 (23.0%) |
| 3 or 4 Children | 22 (5.1%) | 10 (14.1%) |
| 5 or more Children | 0 (0.0%) | 28 (100.0%) |
| Total | 221 (2.7%) | 230 (18.2%) |
Race in Canyon Lake
The most populous races in Canyon Lake are White / Caucasian (26,367 | 82.3%), Hispanic or Latino (6,865 | 21.4%), and Two or more Races (2,828 | 8.8%).
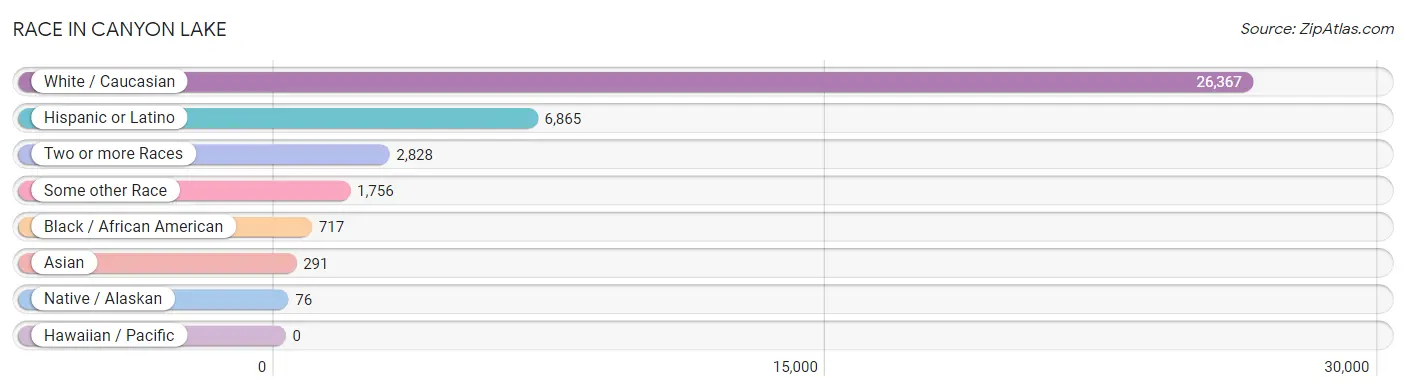
| Race | # Population | % Population |
| Asian | 291 | 0.9% |
| Black / African American | 717 | 2.2% |
| Hawaiian / Pacific | 0 | 0.0% |
| Hispanic or Latino | 6,865 | 21.4% |
| Native / Alaskan | 76 | 0.2% |
| White / Caucasian | 26,367 | 82.3% |
| Two or more Races | 2,828 | 8.8% |
| Some other Race | 1,756 | 5.5% |
| Total | 32,035 | 100.0% |
Ancestry in Canyon Lake
The most populous ancestries reported in Canyon Lake are German (5,632 | 17.6%), Mexican (5,491 | 17.1%), English (4,974 | 15.5%), Irish (2,988 | 9.3%), and American (2,672 | 8.3%), together accounting for 67.9% of all Canyon Lake residents.
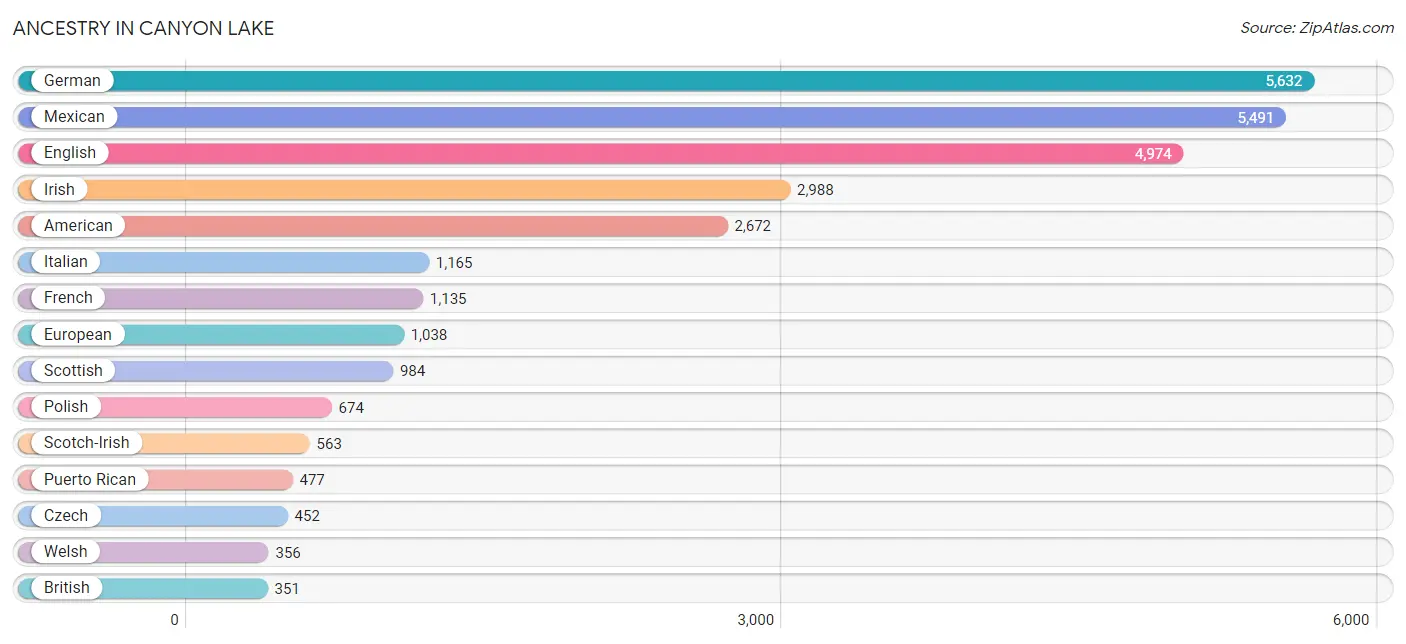
| Ancestry | # Population | % Population |
| Albanian | 19 | 0.1% |
| American | 2,672 | 8.3% |
| Apache | 25 | 0.1% |
| Arab | 79 | 0.3% |
| Argentinean | 16 | 0.1% |
| Austrian | 115 | 0.4% |
| Bhutanese | 40 | 0.1% |
| Blackfeet | 16 | 0.1% |
| Brazilian | 51 | 0.2% |
| British | 351 | 1.1% |
| Cajun | 32 | 0.1% |
| Canadian | 72 | 0.2% |
| Central American | 129 | 0.4% |
| Cherokee | 287 | 0.9% |
| Chickasaw | 16 | 0.1% |
| Chilean | 141 | 0.4% |
| Colombian | 6 | 0.0% |
| Comanche | 13 | 0.0% |
| Costa Rican | 24 | 0.1% |
| Croatian | 17 | 0.1% |
| Cuban | 87 | 0.3% |
| Czech | 452 | 1.4% |
| Czechoslovakian | 173 | 0.5% |
| Danish | 35 | 0.1% |
| Dutch | 251 | 0.8% |
| Eastern European | 193 | 0.6% |
| Ecuadorian | 10 | 0.0% |
| English | 4,974 | 15.5% |
| Ethiopian | 111 | 0.4% |
| European | 1,038 | 3.2% |
| French | 1,135 | 3.5% |
| French Canadian | 17 | 0.1% |
| German | 5,632 | 17.6% |
| Greek | 71 | 0.2% |
| Guatemalan | 35 | 0.1% |
| Haitian | 2 | 0.0% |
| Honduran | 53 | 0.2% |
| Hungarian | 71 | 0.2% |
| Indian (Asian) | 72 | 0.2% |
| Iranian | 13 | 0.0% |
| Irish | 2,988 | 9.3% |
| Italian | 1,165 | 3.6% |
| Jamaican | 18 | 0.1% |
| Korean | 87 | 0.3% |
| Latvian | 18 | 0.1% |
| Lebanese | 31 | 0.1% |
| Lithuanian | 43 | 0.1% |
| Mexican | 5,491 | 17.1% |
| Mongolian | 15 | 0.1% |
| Native Hawaiian | 33 | 0.1% |
| Nigerian | 13 | 0.0% |
| Northern European | 51 | 0.2% |
| Norwegian | 252 | 0.8% |
| Pakistani | 325 | 1.0% |
| Polish | 674 | 2.1% |
| Portuguese | 28 | 0.1% |
| Puerto Rican | 477 | 1.5% |
| Romanian | 10 | 0.0% |
| Russian | 216 | 0.7% |
| Salvadoran | 17 | 0.1% |
| Scandinavian | 65 | 0.2% |
| Scotch-Irish | 563 | 1.8% |
| Scottish | 984 | 3.1% |
| Serbian | 20 | 0.1% |
| Slovak | 7 | 0.0% |
| Slovene | 72 | 0.2% |
| South American | 173 | 0.5% |
| South American Indian | 77 | 0.2% |
| Spaniard | 63 | 0.2% |
| Spanish | 122 | 0.4% |
| Spanish American | 10 | 0.0% |
| Sri Lankan | 19 | 0.1% |
| Subsaharan African | 165 | 0.5% |
| Swedish | 275 | 0.9% |
| Swiss | 69 | 0.2% |
| Syrian | 48 | 0.2% |
| Thai | 79 | 0.3% |
| Trinidadian and Tobagonian | 35 | 0.1% |
| Ukrainian | 35 | 0.1% |
| Welsh | 356 | 1.1% | View All 80 Rows |
Immigrants in Canyon Lake
The most numerous immigrant groups reported in Canyon Lake came from Latin America (881 | 2.8%), Central America (706 | 2.2%), Mexico (608 | 1.9%), Europe (392 | 1.2%), and Northern Europe (222 | 0.7%), together accounting for 8.8% of all Canyon Lake residents.
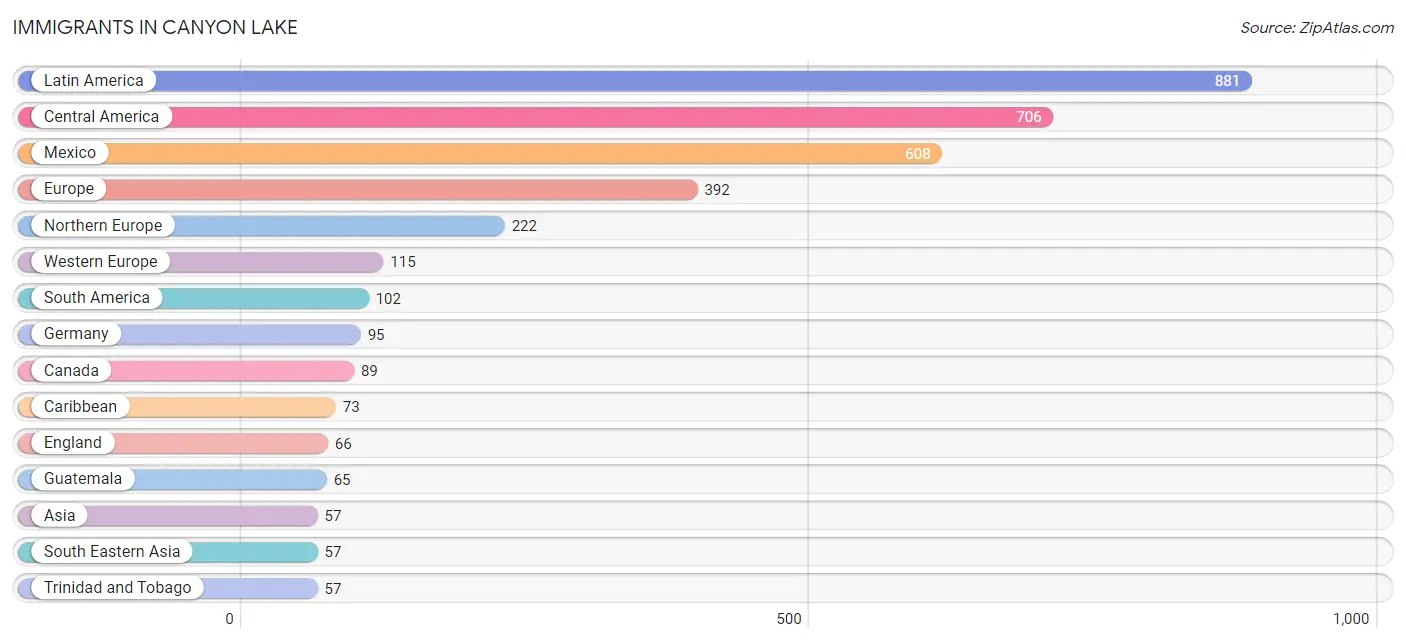
| Immigration Origin | # Population | % Population |
| Albania | 19 | 0.1% |
| Argentina | 16 | 0.1% |
| Asia | 57 | 0.2% |
| Austria | 20 | 0.1% |
| Brazil | 51 | 0.2% |
| Canada | 89 | 0.3% |
| Caribbean | 73 | 0.2% |
| Central America | 706 | 2.2% |
| Chile | 29 | 0.1% |
| Colombia | 6 | 0.0% |
| Cuba | 16 | 0.1% |
| Eastern Europe | 55 | 0.2% |
| El Salvador | 17 | 0.1% |
| England | 66 | 0.2% |
| Europe | 392 | 1.2% |
| Germany | 95 | 0.3% |
| Guatemala | 65 | 0.2% |
| Honduras | 16 | 0.1% |
| Latin America | 881 | 2.8% |
| Malaysia | 15 | 0.1% |
| Mexico | 608 | 1.9% |
| Northern Europe | 222 | 0.7% |
| Philippines | 42 | 0.1% |
| Poland | 36 | 0.1% |
| Scotland | 11 | 0.0% |
| South America | 102 | 0.3% |
| South Eastern Asia | 57 | 0.2% |
| Trinidad and Tobago | 57 | 0.2% |
| Western Europe | 115 | 0.4% | View All 29 Rows |
Sex and Age in Canyon Lake
Sex and Age in Canyon Lake
The most populous age groups in Canyon Lake are 60 to 64 Years (1,713 | 10.7%) for men and 60 to 64 Years (1,681 | 10.5%) for women.
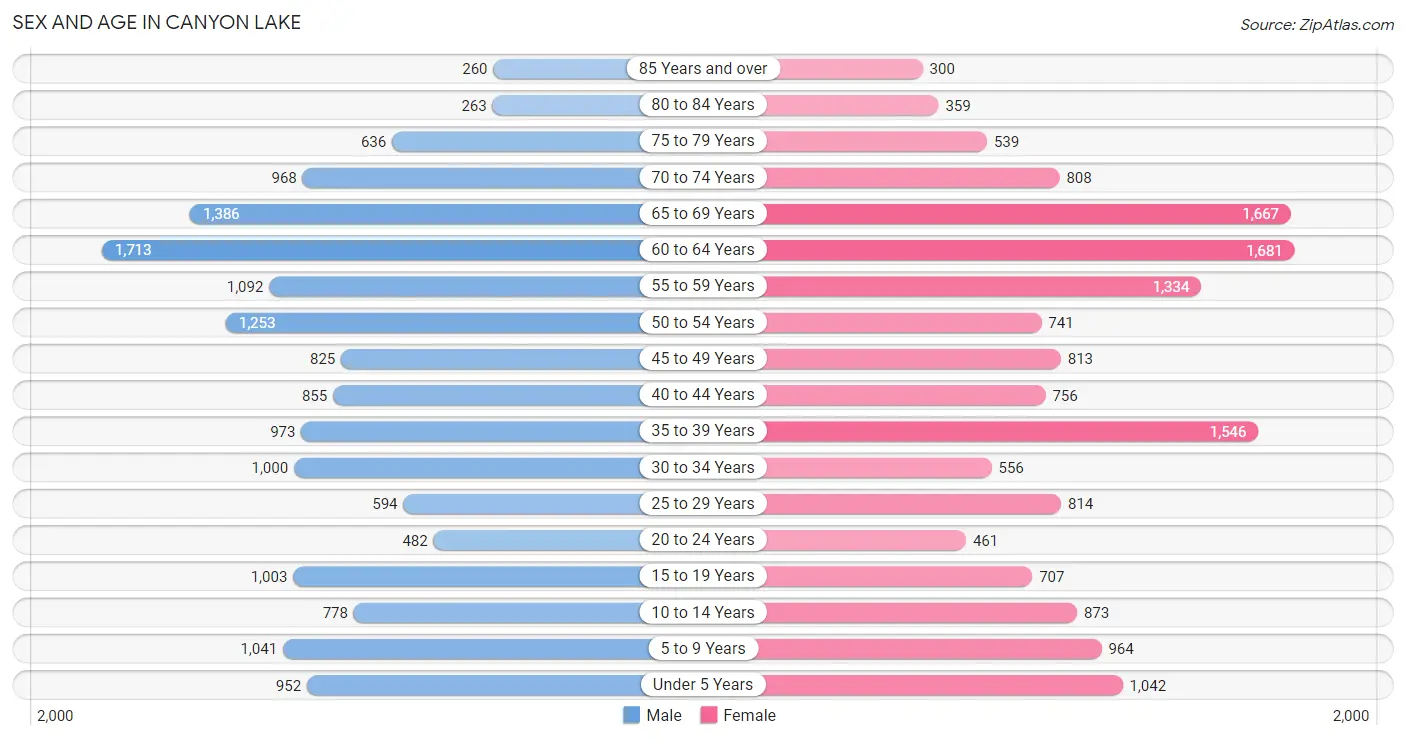
| Age Bracket | Male | Female |
| Under 5 Years | 952 (5.9%) | 1,042 (6.5%) |
| 5 to 9 Years | 1,041 (6.5%) | 964 (6.0%) |
| 10 to 14 Years | 778 (4.8%) | 873 (5.5%) |
| 15 to 19 Years | 1,003 (6.2%) | 707 (4.4%) |
| 20 to 24 Years | 482 (3.0%) | 461 (2.9%) |
| 25 to 29 Years | 594 (3.7%) | 814 (5.1%) |
| 30 to 34 Years | 1,000 (6.2%) | 556 (3.5%) |
| 35 to 39 Years | 973 (6.0%) | 1,546 (9.7%) |
| 40 to 44 Years | 855 (5.3%) | 756 (4.7%) |
| 45 to 49 Years | 825 (5.1%) | 813 (5.1%) |
| 50 to 54 Years | 1,253 (7.8%) | 741 (4.6%) |
| 55 to 59 Years | 1,092 (6.8%) | 1,334 (8.4%) |
| 60 to 64 Years | 1,713 (10.7%) | 1,681 (10.5%) |
| 65 to 69 Years | 1,386 (8.6%) | 1,667 (10.4%) |
| 70 to 74 Years | 968 (6.0%) | 808 (5.1%) |
| 75 to 79 Years | 636 (4.0%) | 539 (3.4%) |
| 80 to 84 Years | 263 (1.6%) | 359 (2.2%) |
| 85 Years and over | 260 (1.6%) | 300 (1.9%) |
| Total | 16,074 (100.0%) | 15,961 (100.0%) |
Families and Households in Canyon Lake
Median Family Size in Canyon Lake
The median family size in Canyon Lake is 2.95 persons per family, with single female/mother families (623 | 6.7%) accounting for the largest median family size of 3.64 persons per family. On the other hand, single male/father families (638 | 6.8%) represent the smallest median family size with 2.71 persons per family.
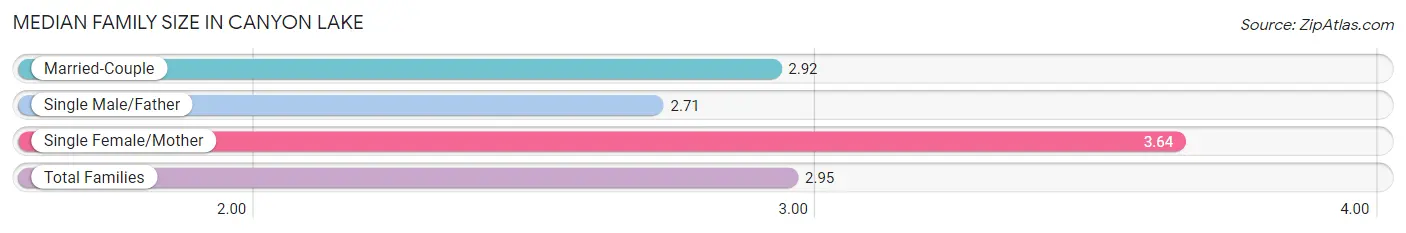
| Family Type | # Families | Family Size |
| Married-Couple | 8,094 (86.5%) | 2.92 |
| Single Male/Father | 638 (6.8%) | 2.71 |
| Single Female/Mother | 623 (6.7%) | 3.64 |
| Total Families | 9,355 (100.0%) | 2.95 |
Median Household Size in Canyon Lake
The median household size in Canyon Lake is 2.54 persons per household, with single female/mother households (623 | 5.0%) accounting for the largest median household size of 3.97 persons per household. non-family households (3,234 | 25.7%) represent the smallest median household size with 1.19 persons per household.
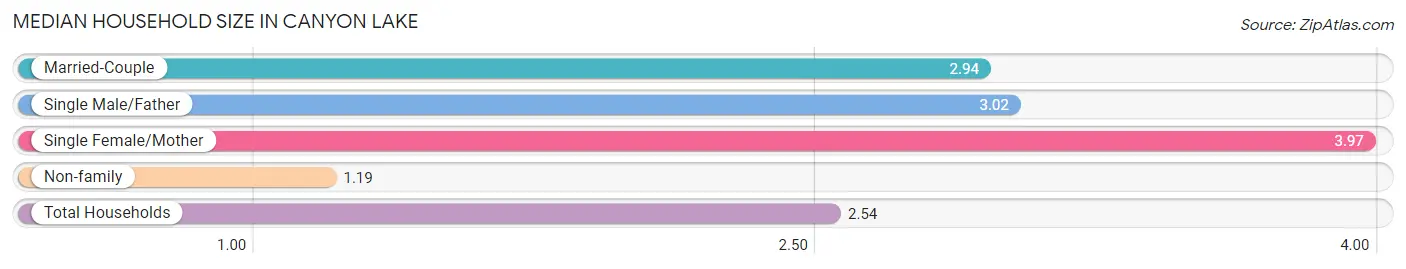
| Household Type | # Households | Household Size |
| Married-Couple | 8,094 (64.3%) | 2.94 |
| Single Male/Father | 638 (5.1%) | 3.02 |
| Single Female/Mother | 623 (5.0%) | 3.97 |
| Non-family | 3,234 (25.7%) | 1.19 |
| Total Households | 12,589 (100.0%) | 2.54 |
Household Size by Marriage Status in Canyon Lake
Out of a total of 12,589 households in Canyon Lake, 9,355 (74.3%) are family households, while 3,234 (25.7%) are nonfamily households. The most numerous type of family households are 2-person households, comprising 5,167, and the most common type of nonfamily households are 1-person households, comprising 2,796.
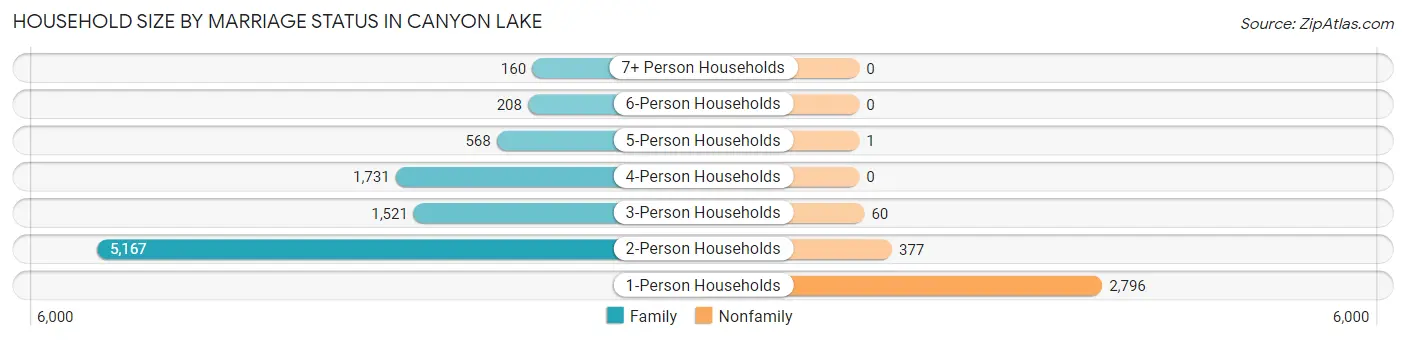
| Household Size | Family Households | Nonfamily Households |
| 1-Person Households | - | 2,796 (22.2%) |
| 2-Person Households | 5,167 (41.0%) | 377 (3.0%) |
| 3-Person Households | 1,521 (12.1%) | 60 (0.5%) |
| 4-Person Households | 1,731 (13.8%) | 0 (0.0%) |
| 5-Person Households | 568 (4.5%) | 1 (0.0%) |
| 6-Person Households | 208 (1.7%) | 0 (0.0%) |
| 7+ Person Households | 160 (1.3%) | 0 (0.0%) |
| Total | 9,355 (74.3%) | 3,234 (25.7%) |
Female Fertility in Canyon Lake
Fertility by Age in Canyon Lake
Average fertility rate in Canyon Lake is 109.0 births per 1,000 women. Women in the age bracket of 20 to 34 years have the highest fertility rate with 190.0 births per 1,000 women. Women in the age bracket of 20 to 34 years acount for 55.7% of all women with births.
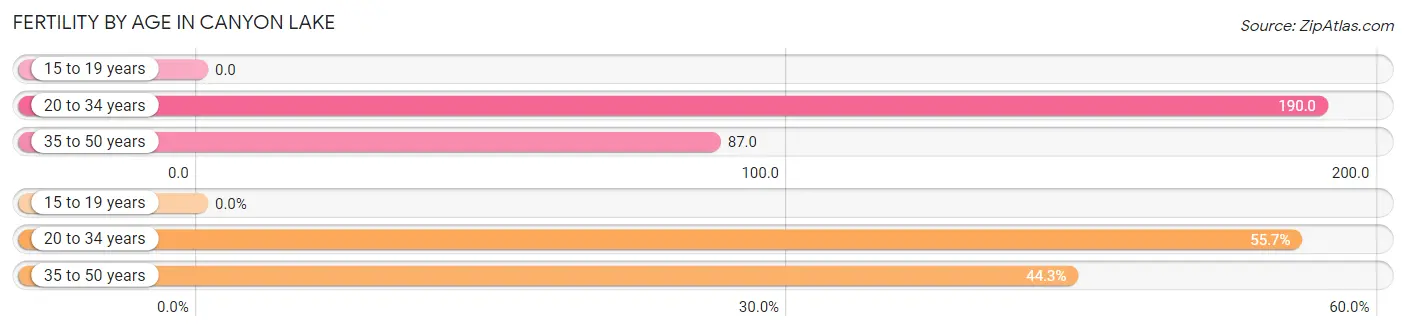
| Age Bracket | Women with Births | Births / 1,000 Women |
| 15 to 19 years | 0 (0.0%) | 0.0 |
| 20 to 34 years | 347 (55.7%) | 190.0 |
| 35 to 50 years | 276 (44.3%) | 87.0 |
| Total | 623 (100.0%) | 109.0 |
Fertility by Age by Marriage Status in Canyon Lake
85.4% of women with births (623) in Canyon Lake are married. The highest percentage of unmarried women with births falls into 20 to 34 years age bracket with 26.2% of them unmarried at the time of birth, while the lowest percentage of unmarried women with births belong to 35 to 50 years age bracket with 0.0% of them unmarried.
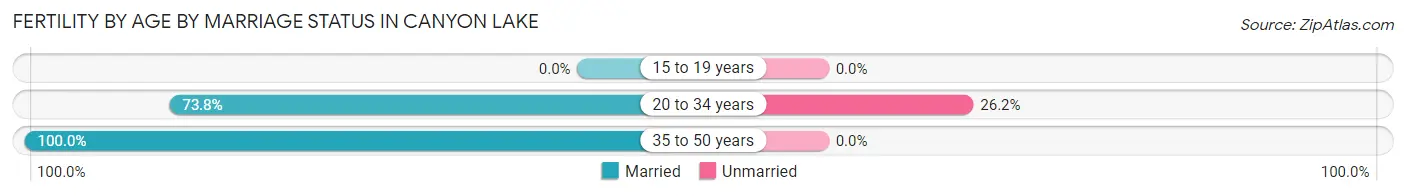
| Age Bracket | Married | Unmarried |
| 15 to 19 years | 0 (0.0%) | 0 (0.0%) |
| 20 to 34 years | 256 (73.8%) | 91 (26.2%) |
| 35 to 50 years | 276 (100.0%) | 0 (0.0%) |
| Total | 532 (85.4%) | 91 (14.6%) |
Fertility by Education in Canyon Lake
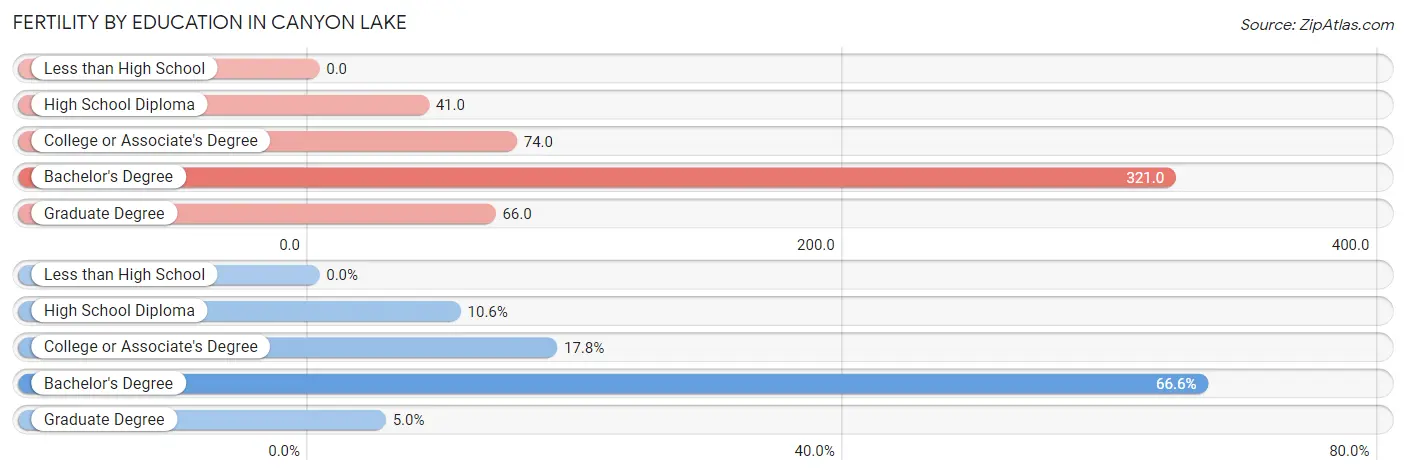
| Educational Attainment | Women with Births | Births / 1,000 Women |
| Less than High School | 0 (0.0%) | 0.0 |
| High School Diploma | 66 (10.6%) | 41.0 |
| College or Associate's Degree | 111 (17.8%) | 74.0 |
| Bachelor's Degree | 415 (66.6%) | 321.0 |
| Graduate Degree | 31 (5.0%) | 66.0 |
| Total | 623 (100.0%) | 109.0 |
Fertility by Education by Marriage Status in Canyon Lake
14.6% of women with births in Canyon Lake are unmarried. Women with the educational attainment of bachelor's degree are most likely to be married with 100.0% of them married at childbirth, while women with the educational attainment of high school diploma are least likely to be married with 80.3% of them unmarried at childbirth.
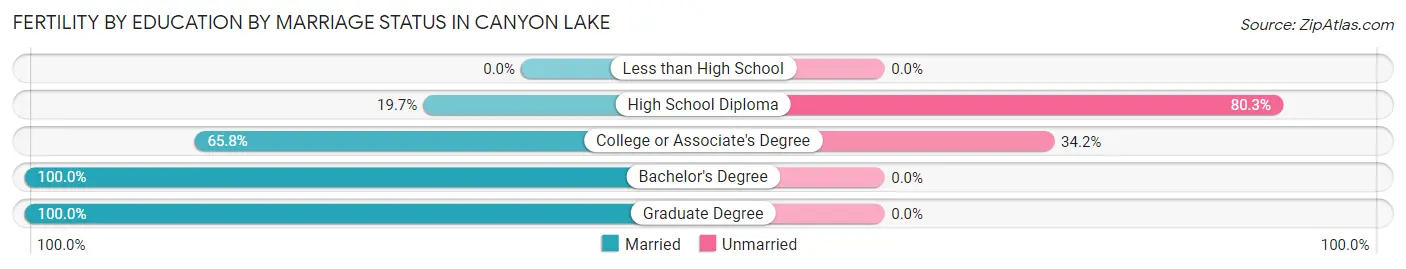
| Educational Attainment | Married | Unmarried |
| Less than High School | 0 (0.0%) | 0 (0.0%) |
| High School Diploma | 13 (19.7%) | 53 (80.3%) |
| College or Associate's Degree | 73 (65.8%) | 38 (34.2%) |
| Bachelor's Degree | 415 (100.0%) | 0 (0.0%) |
| Graduate Degree | 31 (100.0%) | 0 (0.0%) |
| Total | 532 (85.4%) | 91 (14.6%) |
Employment Characteristics in Canyon Lake
Employment by Class of Employer in Canyon Lake
Among the 13,239 employed individuals in Canyon Lake, private company employees (8,623 | 65.1%), self-employed (not incorporated) (1,255 | 9.5%), and self-employed (incorporated) (957 | 7.2%) make up the most common classes of employment.
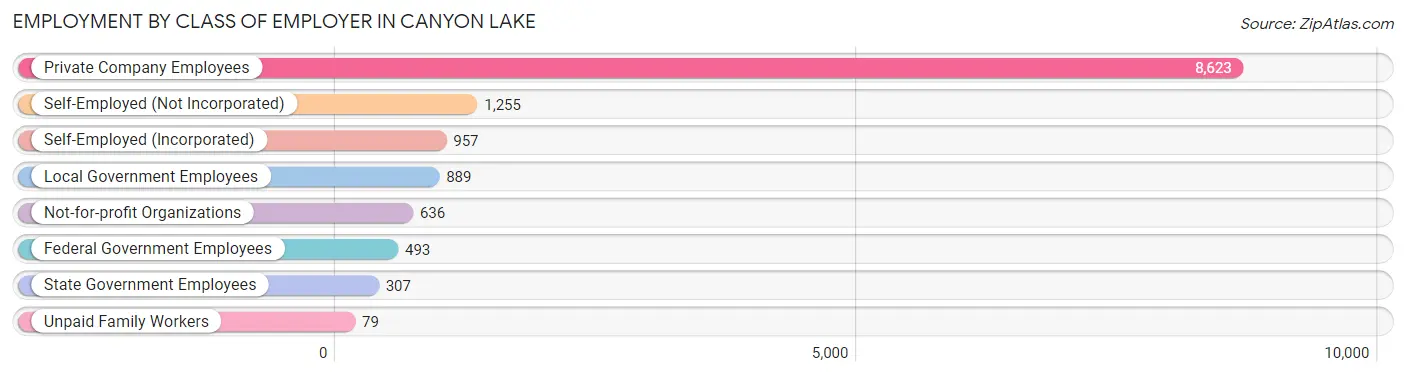
| Employer Class | # Employees | % Employees |
| Private Company Employees | 8,623 | 65.1% |
| Self-Employed (Incorporated) | 957 | 7.2% |
| Self-Employed (Not Incorporated) | 1,255 | 9.5% |
| Not-for-profit Organizations | 636 | 4.8% |
| Local Government Employees | 889 | 6.7% |
| State Government Employees | 307 | 2.3% |
| Federal Government Employees | 493 | 3.7% |
| Unpaid Family Workers | 79 | 0.6% |
| Total | 13,239 | 100.0% |
Employment Status by Age in Canyon Lake
According to the labor force statistics for Canyon Lake, out of the total population over 16 years of age (26,179), 54.4% or 14,241 individuals are in the labor force, with 3.0% or 427 of them unemployed. The age group with the highest labor force participation rate is 20 to 24 years, with 89.4% or 843 individuals in the labor force. Within the labor force, the 75 years and over age range has the highest percentage of unemployed individuals, with 31.7% or 13 of them being unemployed.
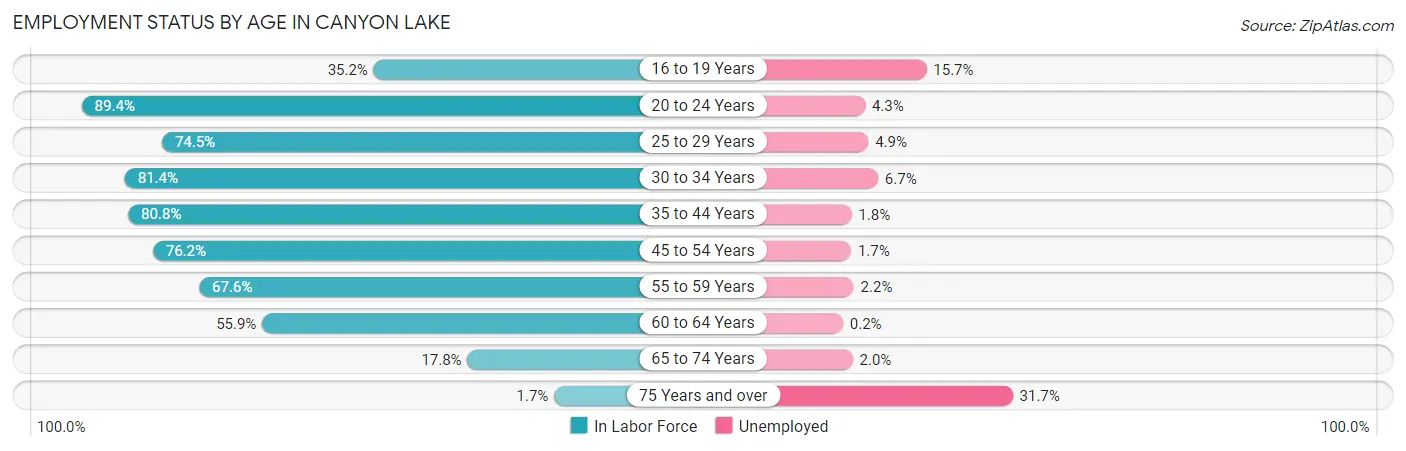
| Age Bracket | In Labor Force | Unemployed |
| 16 to 19 Years | 529 (35.2%) | 83 (15.7%) |
| 20 to 24 Years | 843 (89.4%) | 36 (4.3%) |
| 25 to 29 Years | 1,049 (74.5%) | 51 (4.9%) |
| 30 to 34 Years | 1,267 (81.4%) | 85 (6.7%) |
| 35 to 44 Years | 3,337 (80.8%) | 60 (1.8%) |
| 45 to 54 Years | 2,768 (76.2%) | 47 (1.7%) |
| 55 to 59 Years | 1,640 (67.6%) | 36 (2.2%) |
| 60 to 64 Years | 1,897 (55.9%) | 4 (0.2%) |
| 65 to 74 Years | 860 (17.8%) | 17 (2.0%) |
| 75 Years and over | 40 (1.7%) | 13 (31.7%) |
| Total | 14,241 (54.4%) | 427 (3.0%) |
Employment Status by Educational Attainment in Canyon Lake
According to labor force statistics for Canyon Lake, 72.3% of individuals (11,963) out of the total population between 25 and 64 years of age (16,546) are in the labor force, with 2.4% or 287 of them being unemployed. The group with the highest labor force participation rate are those with the educational attainment of bachelor's degree or higher, with 77.0% or 3,890 individuals in the labor force. Within the labor force, individuals with bachelor's degree or higher education have the highest percentage of unemployment, with 2.8% or 109 of them being unemployed.
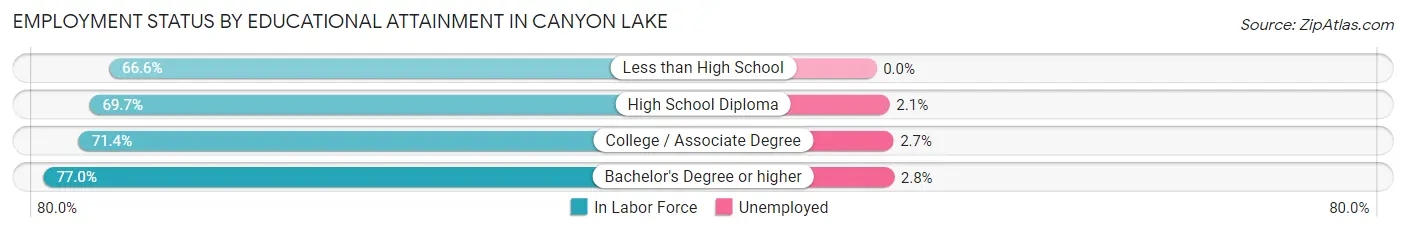
| Educational Attainment | In Labor Force | Unemployed |
| Less than High School | 842 (66.6%) | 0 (0.0%) |
| High School Diploma | 3,268 (69.7%) | 98 (2.1%) |
| College / Associate Degree | 3,956 (71.4%) | 150 (2.7%) |
| Bachelor's Degree or higher | 3,890 (77.0%) | 141 (2.8%) |
| Total | 11,963 (72.3%) | 397 (2.4%) |
Employment Occupations by Sex in Canyon Lake
Management, Business, Science and Arts Occupations
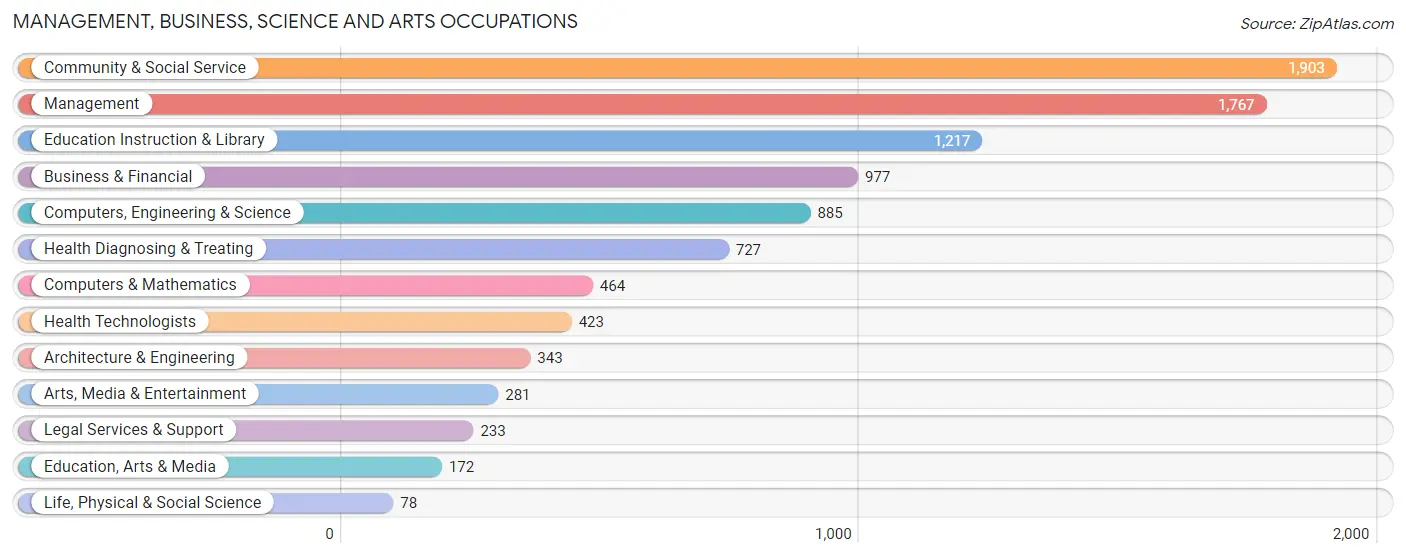
The most common Management, Business, Science and Arts occupations in Canyon Lake are Community & Social Service (1,903 | 13.9%), Management (1,767 | 12.9%), Education Instruction & Library (1,217 | 8.9%), Business & Financial (977 | 7.1%), and Computers, Engineering & Science (885 | 6.4%).
Management, Business, Science and Arts Occupations by Sex
Within the Management, Business, Science and Arts occupations in Canyon Lake, the most male-oriented occupations are Architecture & Engineering (75.5%), Computers, Engineering & Science (69.0%), and Computers & Mathematics (69.0%), while the most female-oriented occupations are Education Instruction & Library (85.5%), Health Technologists (79.2%), and Education, Arts & Media (75.0%).
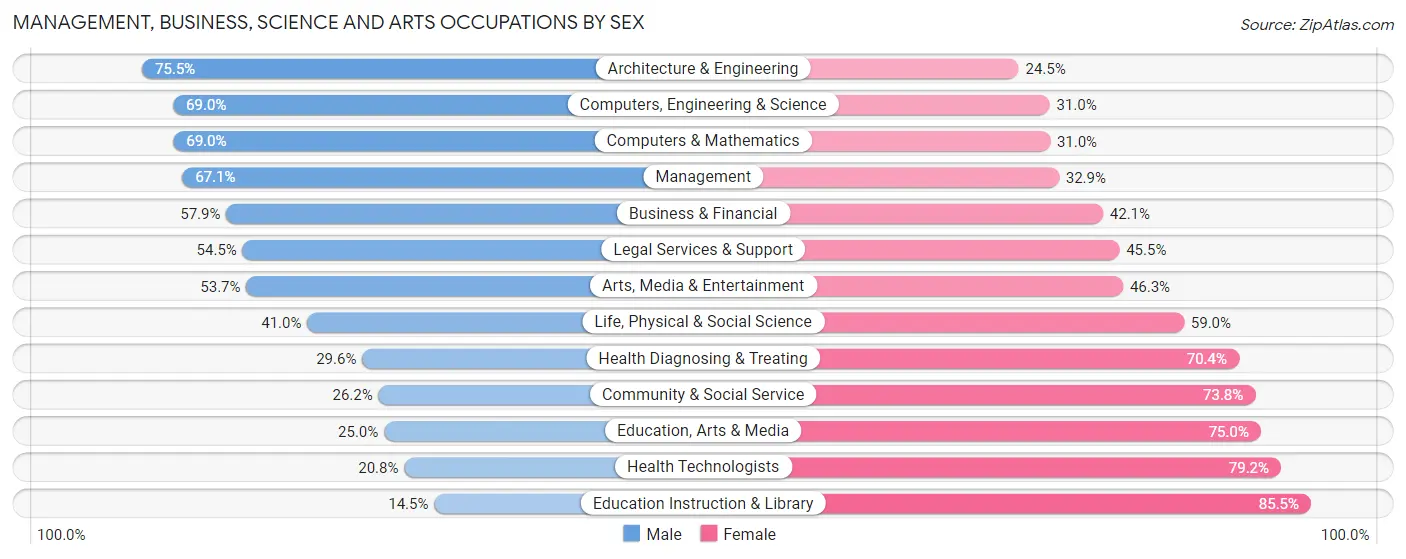
| Occupation | Male | Female |
| Management | 1,186 (67.1%) | 581 (32.9%) |
| Business & Financial | 566 (57.9%) | 411 (42.1%) |
| Computers, Engineering & Science | 611 (69.0%) | 274 (31.0%) |
| Computers & Mathematics | 320 (69.0%) | 144 (31.0%) |
| Architecture & Engineering | 259 (75.5%) | 84 (24.5%) |
| Life, Physical & Social Science | 32 (41.0%) | 46 (59.0%) |
| Community & Social Service | 498 (26.2%) | 1,405 (73.8%) |
| Education, Arts & Media | 43 (25.0%) | 129 (75.0%) |
| Legal Services & Support | 127 (54.5%) | 106 (45.5%) |
| Education Instruction & Library | 177 (14.5%) | 1,040 (85.5%) |
| Arts, Media & Entertainment | 151 (53.7%) | 130 (46.3%) |
| Health Diagnosing & Treating | 215 (29.6%) | 512 (70.4%) |
| Health Technologists | 88 (20.8%) | 335 (79.2%) |
| Total (Category) | 3,076 (49.1%) | 3,183 (50.8%) |
| Total (Overall) | 7,606 (55.4%) | 6,128 (44.6%) |
Services Occupations
The most common Services occupations in Canyon Lake are Food Preparation & Serving (560 | 4.1%), Healthcare Support (390 | 2.8%), Cleaning & Maintenance (349 | 2.5%), Personal Care & Service (249 | 1.8%), and Security & Protection (142 | 1.0%).

Services Occupations by Sex
Within the Services occupations in Canyon Lake, the most male-oriented occupations are Firefighting & Prevention (86.3%), Security & Protection (77.5%), and Law Enforcement (72.5%), while the most female-oriented occupations are Personal Care & Service (86.4%), Healthcare Support (82.8%), and Food Preparation & Serving (42.1%).
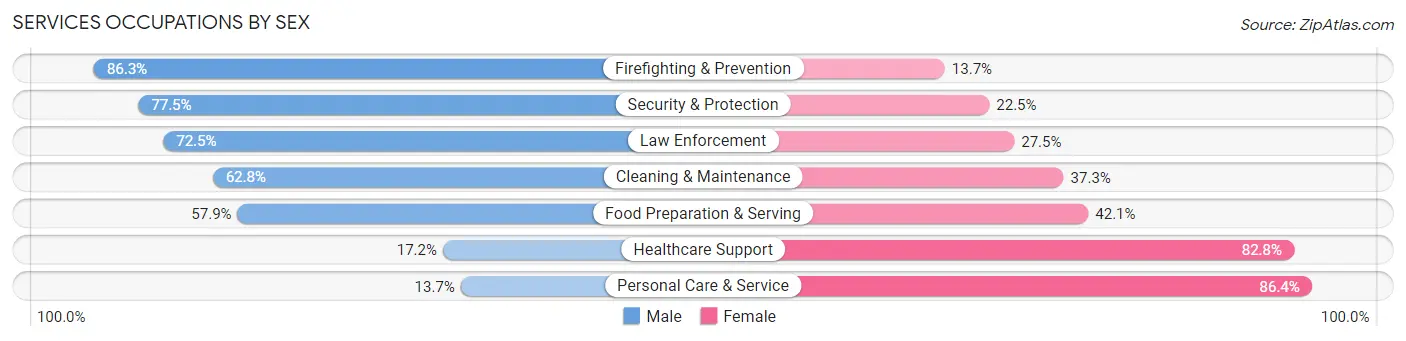
| Occupation | Male | Female |
| Healthcare Support | 67 (17.2%) | 323 (82.8%) |
| Security & Protection | 110 (77.5%) | 32 (22.5%) |
| Firefighting & Prevention | 44 (86.3%) | 7 (13.7%) |
| Law Enforcement | 66 (72.5%) | 25 (27.5%) |
| Food Preparation & Serving | 324 (57.9%) | 236 (42.1%) |
| Cleaning & Maintenance | 219 (62.7%) | 130 (37.2%) |
| Personal Care & Service | 34 (13.7%) | 215 (86.4%) |
| Total (Category) | 754 (44.6%) | 936 (55.4%) |
| Total (Overall) | 7,606 (55.4%) | 6,128 (44.6%) |
Sales and Office Occupations
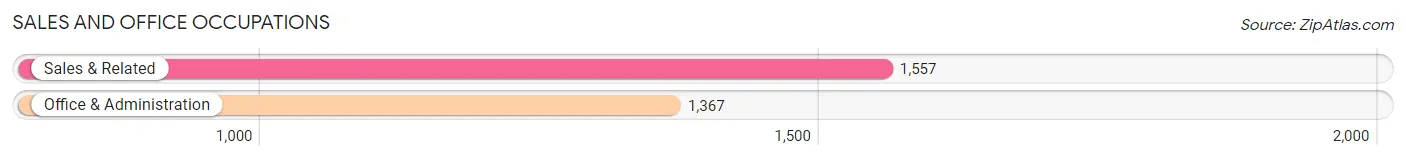
The most common Sales and Office occupations in Canyon Lake are Sales & Related (1,557 | 11.3%), and Office & Administration (1,367 | 10.0%).
Sales and Office Occupations by Sex
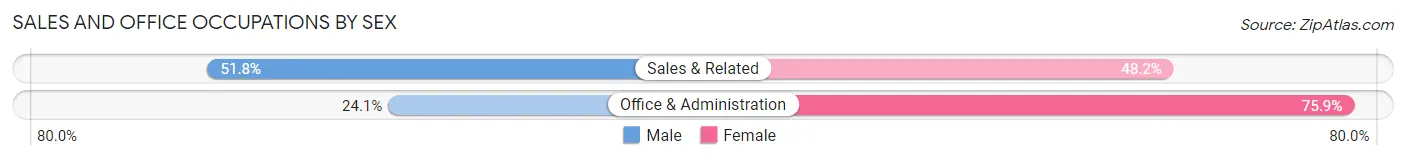
| Occupation | Male | Female |
| Sales & Related | 807 (51.8%) | 750 (48.2%) |
| Office & Administration | 329 (24.1%) | 1,038 (75.9%) |
| Total (Category) | 1,136 (38.9%) | 1,788 (61.2%) |
| Total (Overall) | 7,606 (55.4%) | 6,128 (44.6%) |
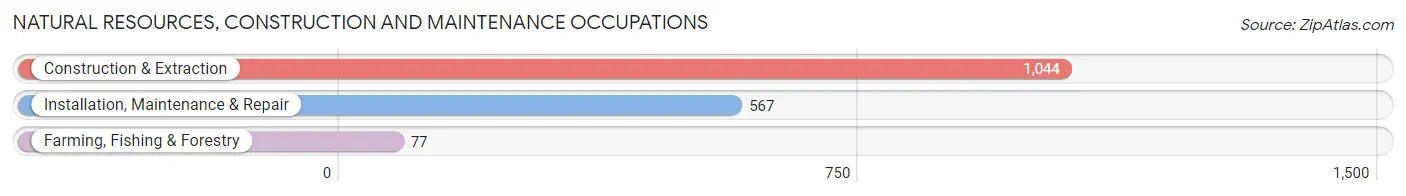
Natural Resources, Construction and Maintenance Occupations
The most common Natural Resources, Construction and Maintenance occupations in Canyon Lake are Construction & Extraction (1,044 | 7.6%), Installation, Maintenance & Repair (567 | 4.1%), and Farming, Fishing & Forestry (77 | 0.6%).
Natural Resources, Construction and Maintenance Occupations by Sex
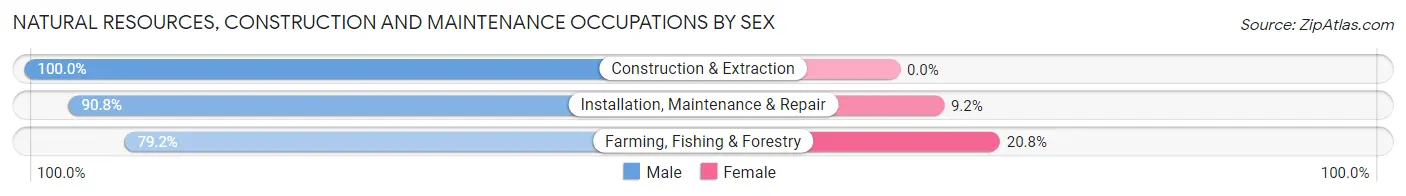
| Occupation | Male | Female |
| Farming, Fishing & Forestry | 61 (79.2%) | 16 (20.8%) |
| Construction & Extraction | 1,044 (100.0%) | 0 (0.0%) |
| Installation, Maintenance & Repair | 515 (90.8%) | 52 (9.2%) |
| Total (Category) | 1,620 (96.0%) | 68 (4.0%) |
| Total (Overall) | 7,606 (55.4%) | 6,128 (44.6%) |
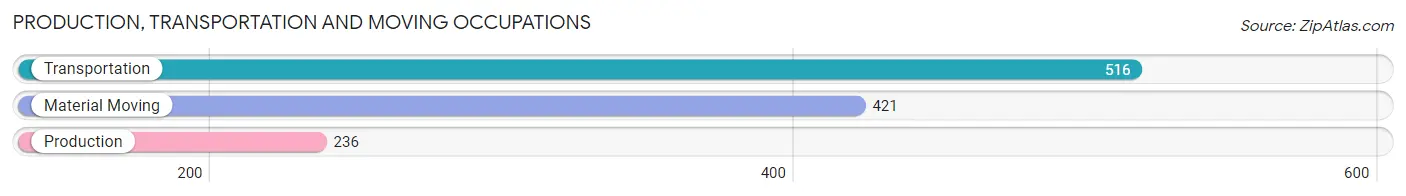
Production, Transportation and Moving Occupations
The most common Production, Transportation and Moving occupations in Canyon Lake are Transportation (516 | 3.8%), Material Moving (421 | 3.1%), and Production (236 | 1.7%).
Production, Transportation and Moving Occupations by Sex
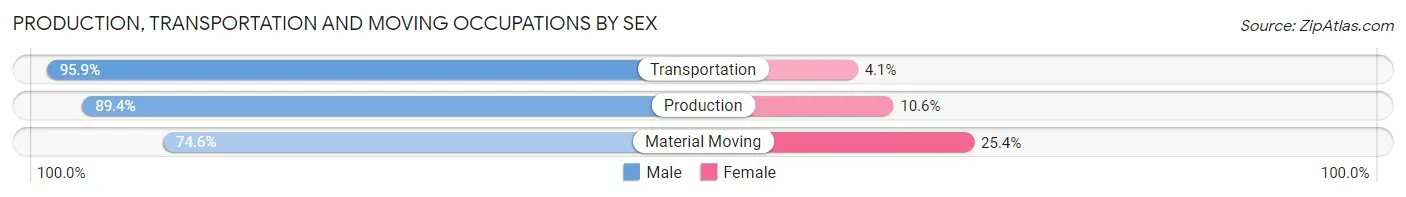
| Occupation | Male | Female |
| Production | 211 (89.4%) | 25 (10.6%) |
| Transportation | 495 (95.9%) | 21 (4.1%) |
| Material Moving | 314 (74.6%) | 107 (25.4%) |
| Total (Category) | 1,020 (87.0%) | 153 (13.0%) |
| Total (Overall) | 7,606 (55.4%) | 6,128 (44.6%) |
Employment Industries by Sex in Canyon Lake
Employment Industries in Canyon Lake
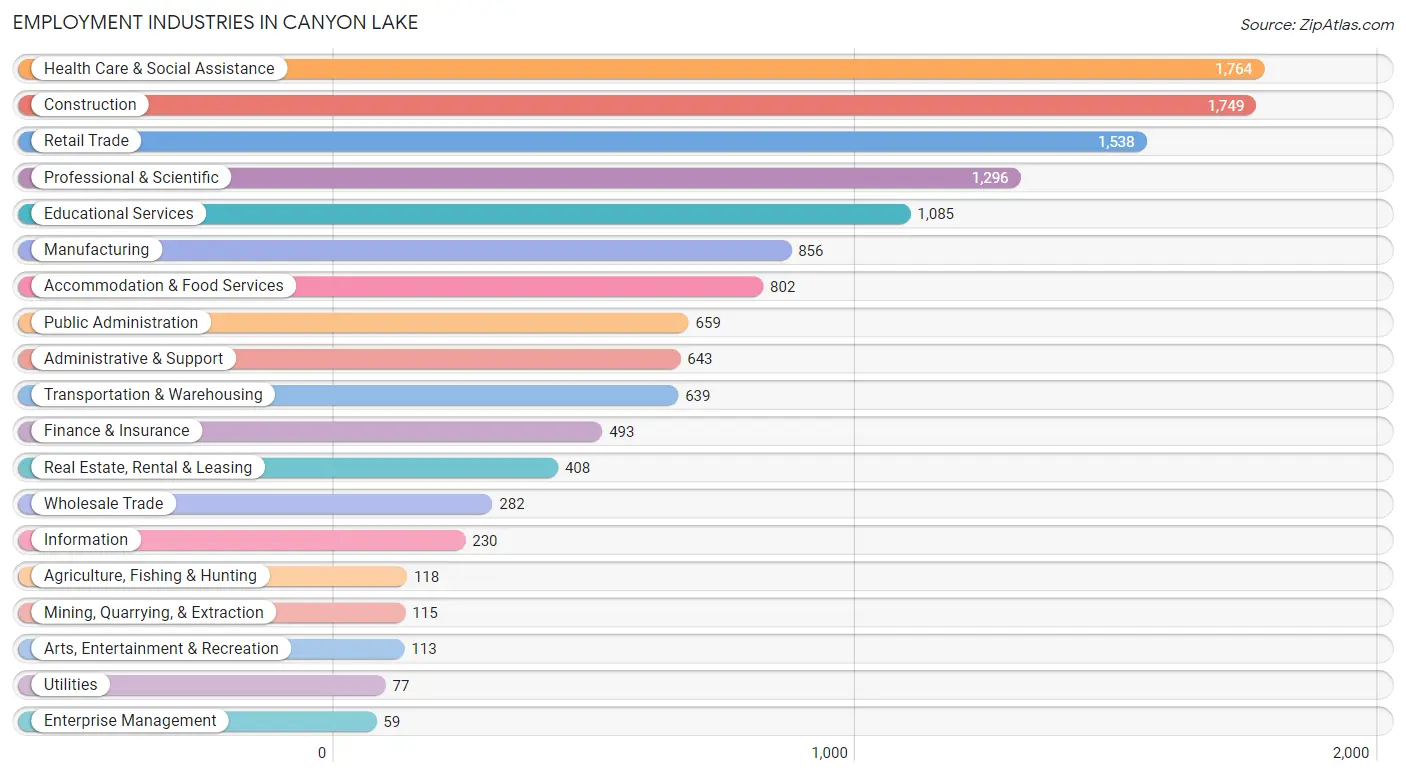
The major employment industries in Canyon Lake include Health Care & Social Assistance (1,764 | 12.8%), Construction (1,749 | 12.7%), Retail Trade (1,538 | 11.2%), Professional & Scientific (1,296 | 9.4%), and Educational Services (1,085 | 7.9%).
Employment Industries by Sex in Canyon Lake
The Canyon Lake industries that see more men than women are Utilities (100.0%), Mining, Quarrying, & Extraction (91.3%), and Construction (90.0%), whereas the industries that tend to have a higher number of women are Arts, Entertainment & Recreation (89.4%), Health Care & Social Assistance (79.5%), and Educational Services (78.4%).
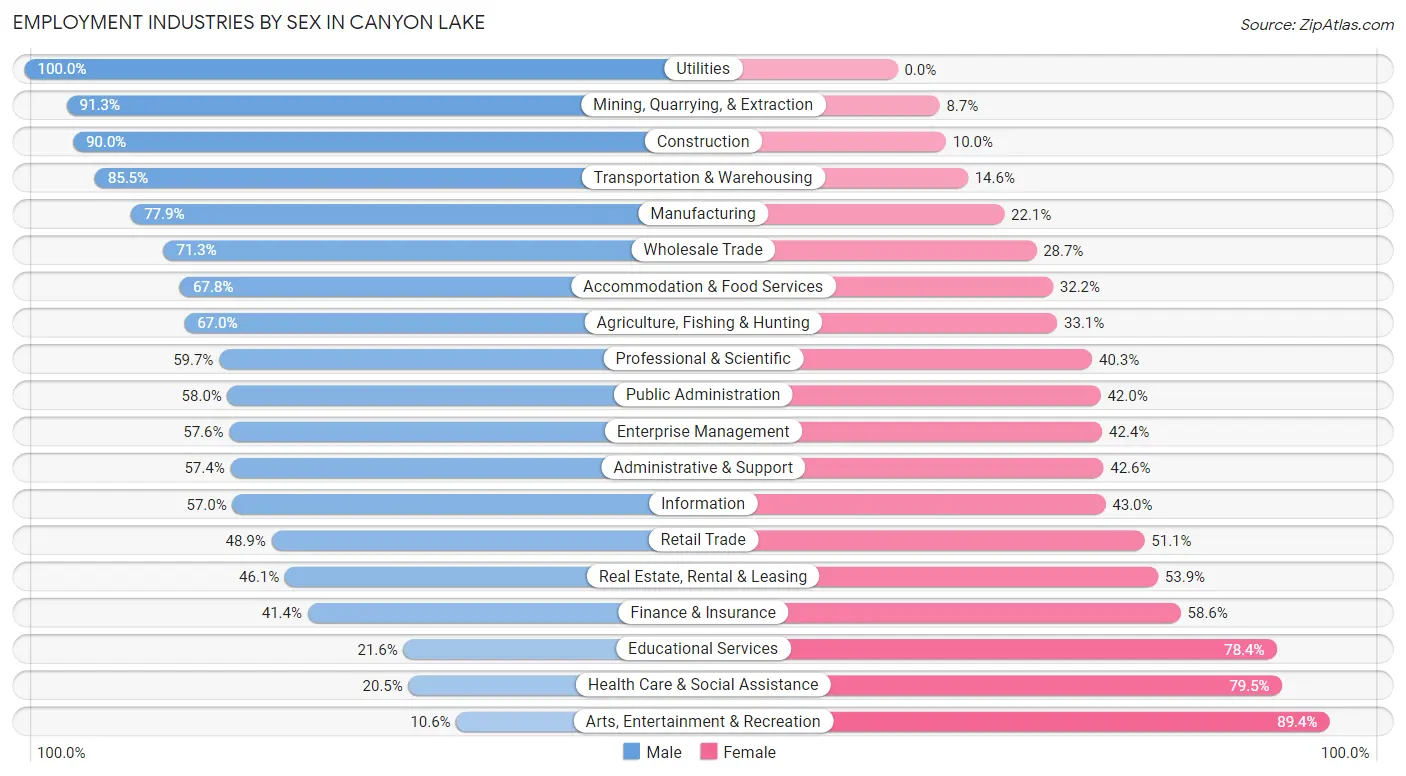
| Industry | Male | Female |
| Agriculture, Fishing & Hunting | 79 (66.9%) | 39 (33.1%) |
| Mining, Quarrying, & Extraction | 105 (91.3%) | 10 (8.7%) |
| Construction | 1,574 (90.0%) | 175 (10.0%) |
| Manufacturing | 667 (77.9%) | 189 (22.1%) |
| Wholesale Trade | 201 (71.3%) | 81 (28.7%) |
| Retail Trade | 752 (48.9%) | 786 (51.1%) |
| Transportation & Warehousing | 546 (85.5%) | 93 (14.5%) |
| Utilities | 77 (100.0%) | 0 (0.0%) |
| Information | 131 (57.0%) | 99 (43.0%) |
| Finance & Insurance | 204 (41.4%) | 289 (58.6%) |
| Real Estate, Rental & Leasing | 188 (46.1%) | 220 (53.9%) |
| Professional & Scientific | 774 (59.7%) | 522 (40.3%) |
| Enterprise Management | 34 (57.6%) | 25 (42.4%) |
| Administrative & Support | 369 (57.4%) | 274 (42.6%) |
| Educational Services | 234 (21.6%) | 851 (78.4%) |
| Health Care & Social Assistance | 362 (20.5%) | 1,402 (79.5%) |
| Arts, Entertainment & Recreation | 12 (10.6%) | 101 (89.4%) |
| Accommodation & Food Services | 544 (67.8%) | 258 (32.2%) |
| Public Administration | 382 (58.0%) | 277 (42.0%) |
| Total | 7,606 (55.4%) | 6,128 (44.6%) |
Education in Canyon Lake
School Enrollment in Canyon Lake
The most common levels of schooling among the 6,249 students in Canyon Lake are elementary school (1,624 | 26.0%), high school (1,418 | 22.7%), and middle school (1,308 | 20.9%).
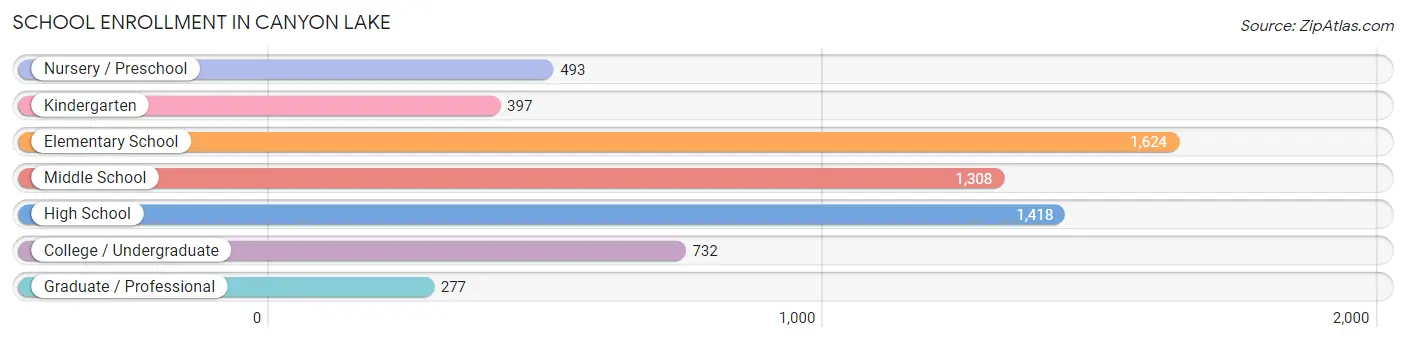
| School Level | # Students | % Students |
| Nursery / Preschool | 493 | 7.9% |
| Kindergarten | 397 | 6.4% |
| Elementary School | 1,624 | 26.0% |
| Middle School | 1,308 | 20.9% |
| High School | 1,418 | 22.7% |
| College / Undergraduate | 732 | 11.7% |
| Graduate / Professional | 277 | 4.4% |
| Total | 6,249 | 100.0% |
School Enrollment by Age by Funding Source in Canyon Lake
Out of a total of 6,249 students who are enrolled in schools in Canyon Lake, 1,244 (19.9%) attend a private institution, while the remaining 5,005 (80.1%) are enrolled in public schools. The age group of 3 to 4 year olds has the highest likelihood of being enrolled in private schools, with 181 (49.3% in the age bracket) enrolled. Conversely, the age group of 20 to 24 year olds has the lowest likelihood of being enrolled in a private school, with 272 (100.0% in the age bracket) attending a public institution.
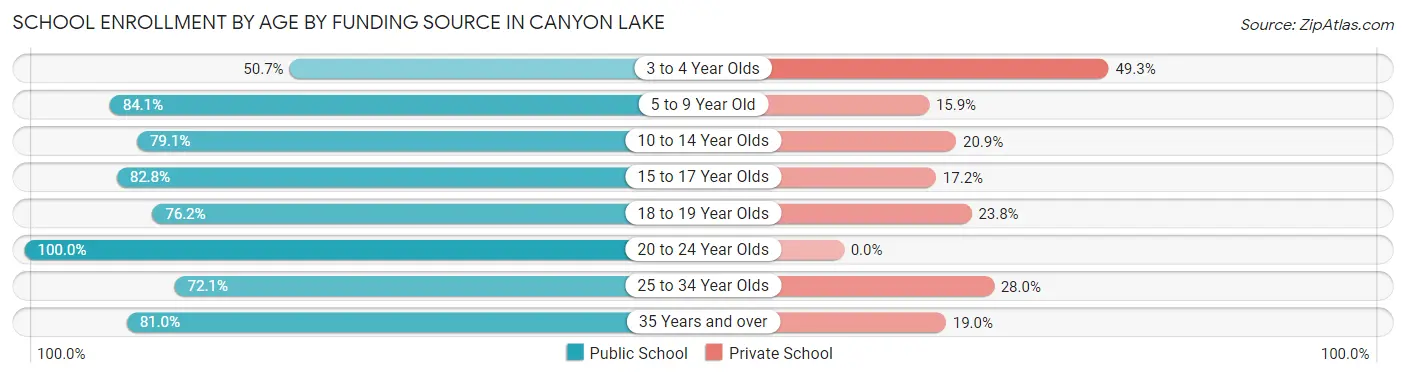
| Age Bracket | Public School | Private School |
| 3 to 4 Year Olds | 186 (50.7%) | 181 (49.3%) |
| 5 to 9 Year Old | 1,653 (84.1%) | 312 (15.9%) |
| 10 to 14 Year Olds | 1,246 (79.1%) | 330 (20.9%) |
| 15 to 17 Year Olds | 863 (82.8%) | 179 (17.2%) |
| 18 to 19 Year Olds | 253 (76.2%) | 79 (23.8%) |
| 20 to 24 Year Olds | 272 (100.0%) | 0 (0.0%) |
| 25 to 34 Year Olds | 232 (72.1%) | 90 (28.0%) |
| 35 Years and over | 302 (81.0%) | 71 (19.0%) |
| Total | 5,005 (80.1%) | 1,244 (19.9%) |
Educational Attainment by Field of Study in Canyon Lake
Business (2,063 | 24.7%), education (1,006 | 12.1%), engineering (846 | 10.2%), science & technology (802 | 9.6%), and literature & languages (482 | 5.8%) are the most common fields of study among 8,337 individuals in Canyon Lake who have obtained a bachelor's degree or higher.
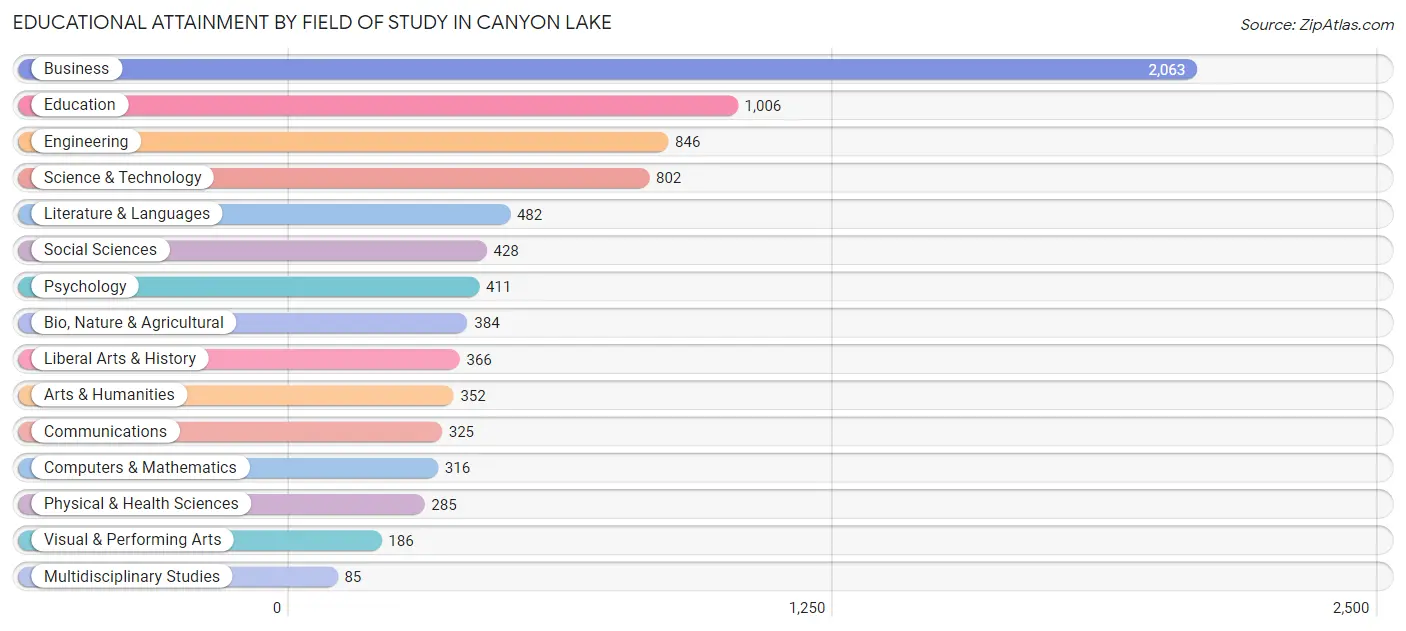
| Field of Study | # Graduates | % Graduates |
| Computers & Mathematics | 316 | 3.8% |
| Bio, Nature & Agricultural | 384 | 4.6% |
| Physical & Health Sciences | 285 | 3.4% |
| Psychology | 411 | 4.9% |
| Social Sciences | 428 | 5.1% |
| Engineering | 846 | 10.2% |
| Multidisciplinary Studies | 85 | 1.0% |
| Science & Technology | 802 | 9.6% |
| Business | 2,063 | 24.7% |
| Education | 1,006 | 12.1% |
| Literature & Languages | 482 | 5.8% |
| Liberal Arts & History | 366 | 4.4% |
| Visual & Performing Arts | 186 | 2.2% |
| Communications | 325 | 3.9% |
| Arts & Humanities | 352 | 4.2% |
| Total | 8,337 | 100.0% |
Transportation & Commute in Canyon Lake
Vehicle Availability by Sex in Canyon Lake
The most prevalent vehicle ownership categories in Canyon Lake are males with 2 vehicles (3,261, accounting for 42.9%) and females with 2 vehicles (2,376, making up 57.9%).
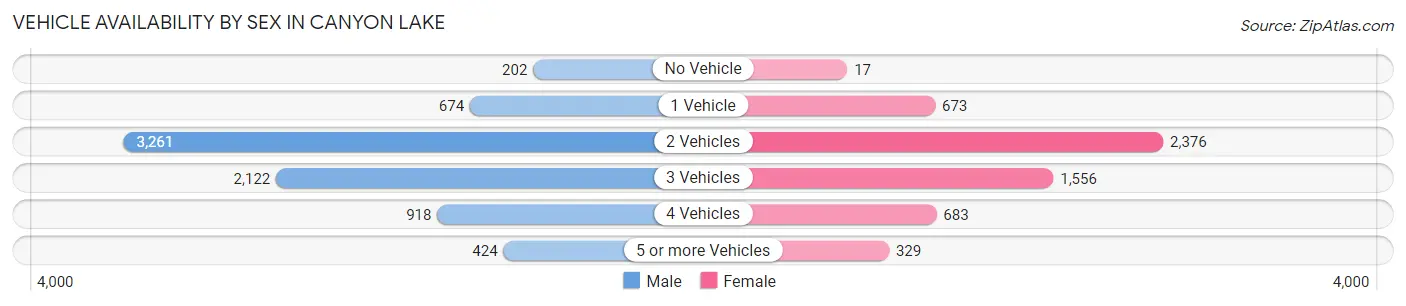
| Vehicles Available | Male | Female |
| No Vehicle | 202 (2.7%) | 17 (0.3%) |
| 1 Vehicle | 674 (8.9%) | 673 (11.9%) |
| 2 Vehicles | 3,261 (42.9%) | 2,376 (42.2%) |
| 3 Vehicles | 2,122 (27.9%) | 1,556 (27.6%) |
| 4 Vehicles | 918 (12.1%) | 683 (12.1%) |
| 5 or more Vehicles | 424 (5.6%) | 329 (5.8%) |
| Total | 7,601 (100.0%) | 5,634 (100.0%) |
Commute Time in Canyon Lake
The most frequently occuring commute durations in Canyon Lake are 45 to 59 minutes (2,129 commuters, 19.6%), 60 to 89 minutes (1,677 commuters, 15.4%), and 30 to 34 minutes (1,630 commuters, 15.0%).
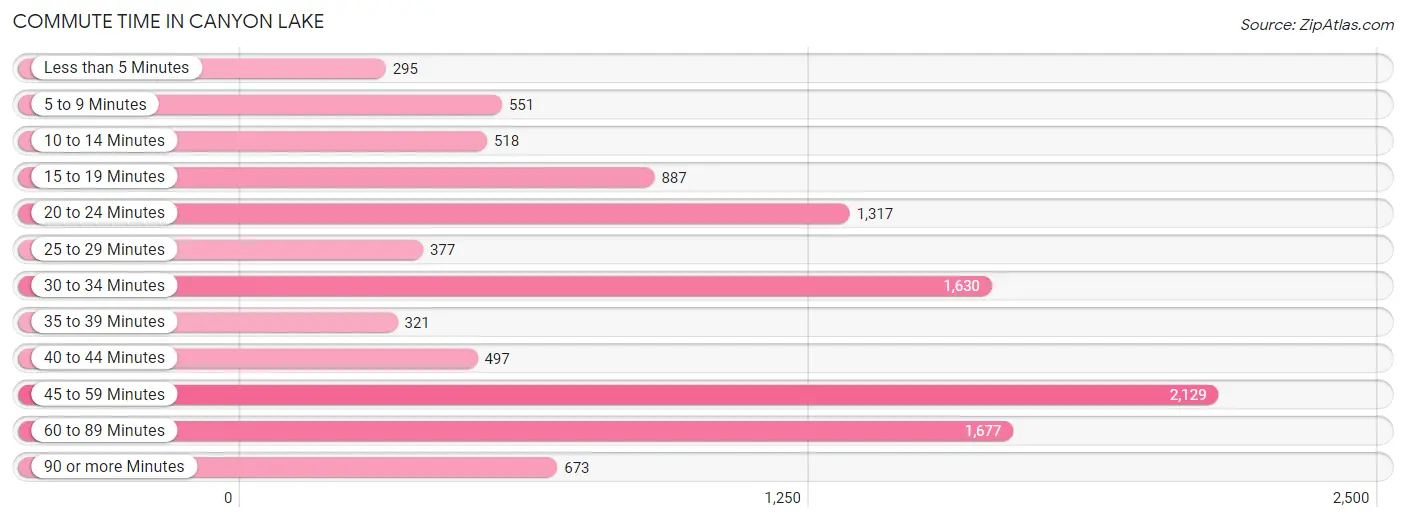
| Commute Time | # Commuters | % Commuters |
| Less than 5 Minutes | 295 | 2.7% |
| 5 to 9 Minutes | 551 | 5.1% |
| 10 to 14 Minutes | 518 | 4.8% |
| 15 to 19 Minutes | 887 | 8.2% |
| 20 to 24 Minutes | 1,317 | 12.1% |
| 25 to 29 Minutes | 377 | 3.5% |
| 30 to 34 Minutes | 1,630 | 15.0% |
| 35 to 39 Minutes | 321 | 2.9% |
| 40 to 44 Minutes | 497 | 4.6% |
| 45 to 59 Minutes | 2,129 | 19.6% |
| 60 to 89 Minutes | 1,677 | 15.4% |
| 90 or more Minutes | 673 | 6.2% |
Commute Time by Sex in Canyon Lake
The most common commute times in Canyon Lake are 45 to 59 minutes (1,408 commuters, 22.1%) for males and 60 to 89 minutes (777 commuters, 17.3%) for females.
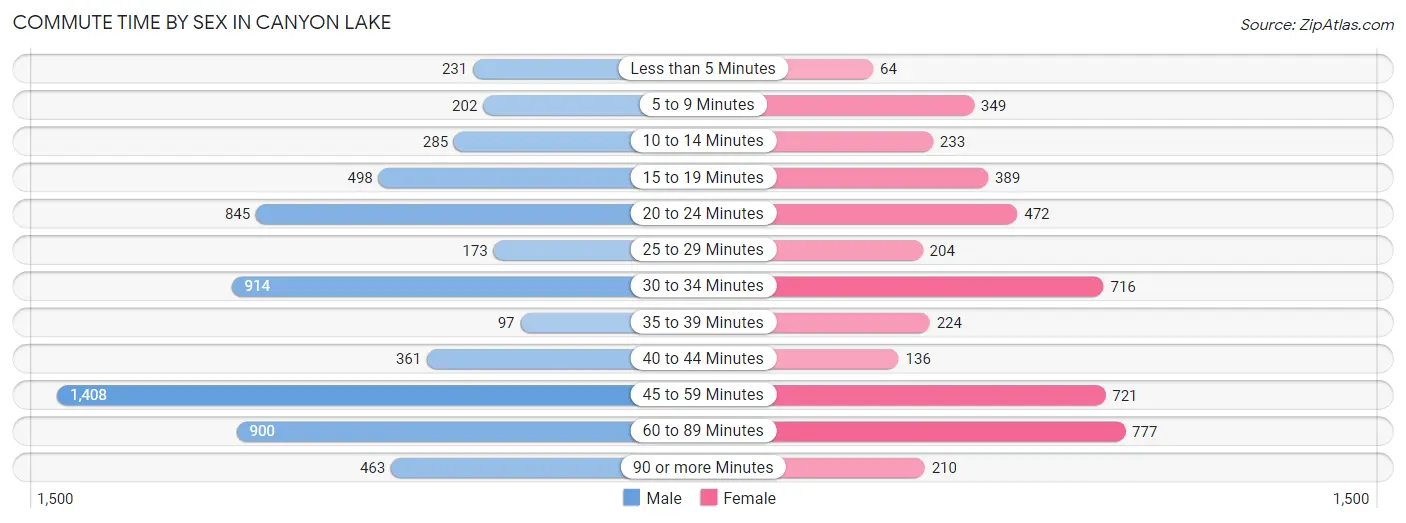
| Commute Time | Male | Female |
| Less than 5 Minutes | 231 (3.6%) | 64 (1.4%) |
| 5 to 9 Minutes | 202 (3.2%) | 349 (7.8%) |
| 10 to 14 Minutes | 285 (4.5%) | 233 (5.2%) |
| 15 to 19 Minutes | 498 (7.8%) | 389 (8.6%) |
| 20 to 24 Minutes | 845 (13.3%) | 472 (10.5%) |
| 25 to 29 Minutes | 173 (2.7%) | 204 (4.5%) |
| 30 to 34 Minutes | 914 (14.3%) | 716 (15.9%) |
| 35 to 39 Minutes | 97 (1.5%) | 224 (5.0%) |
| 40 to 44 Minutes | 361 (5.7%) | 136 (3.0%) |
| 45 to 59 Minutes | 1,408 (22.1%) | 721 (16.0%) |
| 60 to 89 Minutes | 900 (14.1%) | 777 (17.3%) |
| 90 or more Minutes | 463 (7.3%) | 210 (4.7%) |
Time of Departure to Work by Sex in Canyon Lake
The most frequent times of departure to work in Canyon Lake are 7:00 AM to 7:29 AM (1,162, 18.2%) for males and 7:00 AM to 7:29 AM (847, 18.8%) for females.
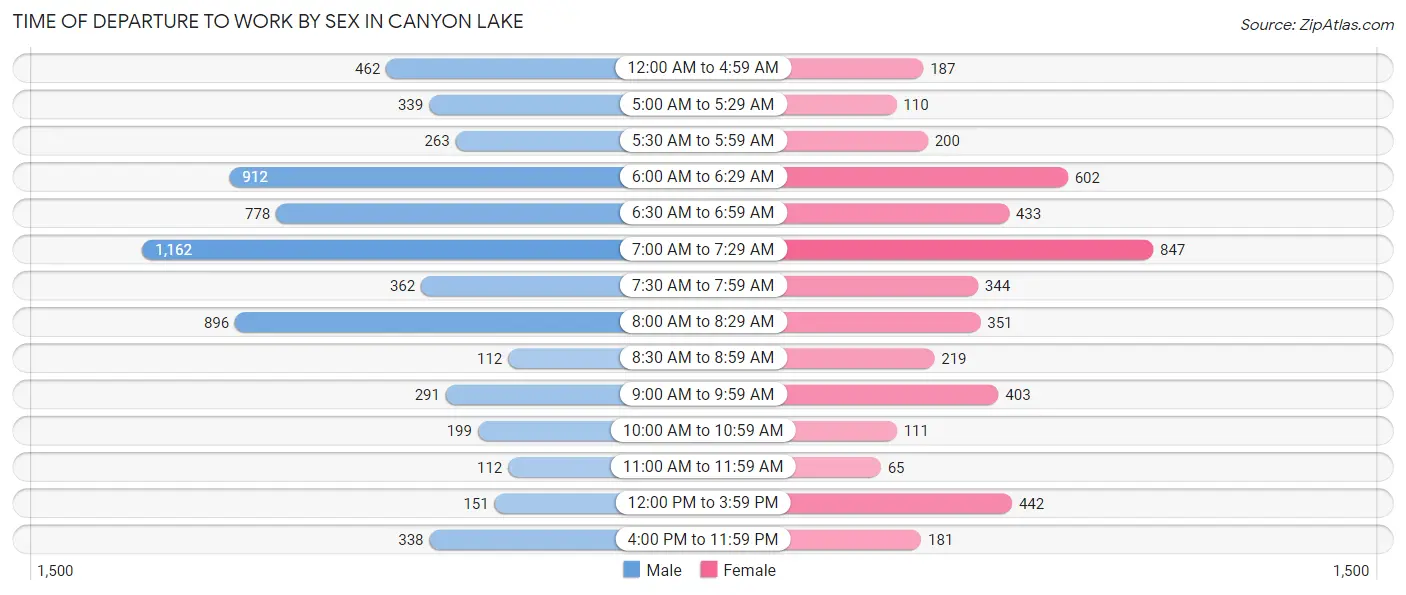
| Time of Departure | Male | Female |
| 12:00 AM to 4:59 AM | 462 (7.2%) | 187 (4.2%) |
| 5:00 AM to 5:29 AM | 339 (5.3%) | 110 (2.5%) |
| 5:30 AM to 5:59 AM | 263 (4.1%) | 200 (4.4%) |
| 6:00 AM to 6:29 AM | 912 (14.3%) | 602 (13.4%) |
| 6:30 AM to 6:59 AM | 778 (12.2%) | 433 (9.6%) |
| 7:00 AM to 7:29 AM | 1,162 (18.2%) | 847 (18.8%) |
| 7:30 AM to 7:59 AM | 362 (5.7%) | 344 (7.6%) |
| 8:00 AM to 8:29 AM | 896 (14.1%) | 351 (7.8%) |
| 8:30 AM to 8:59 AM | 112 (1.8%) | 219 (4.9%) |
| 9:00 AM to 9:59 AM | 291 (4.6%) | 403 (9.0%) |
| 10:00 AM to 10:59 AM | 199 (3.1%) | 111 (2.5%) |
| 11:00 AM to 11:59 AM | 112 (1.8%) | 65 (1.5%) |
| 12:00 PM to 3:59 PM | 151 (2.4%) | 442 (9.8%) |
| 4:00 PM to 11:59 PM | 338 (5.3%) | 181 (4.0%) |
| Total | 6,377 (100.0%) | 4,495 (100.0%) |
Housing Occupancy in Canyon Lake
Occupancy by Ownership in Canyon Lake
Of the total 12,589 dwellings in Canyon Lake, owner-occupied units account for 10,904 (86.6%), while renter-occupied units make up 1,685 (13.4%).
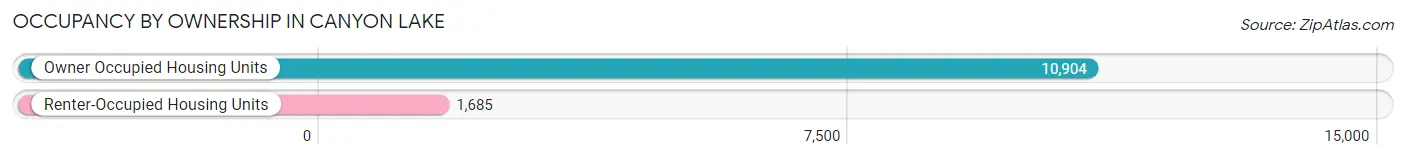
| Occupancy | # Housing Units | % Housing Units |
| Owner Occupied Housing Units | 10,904 | 86.6% |
| Renter-Occupied Housing Units | 1,685 | 13.4% |
| Total Occupied Housing Units | 12,589 | 100.0% |
Occupancy by Household Size in Canyon Lake
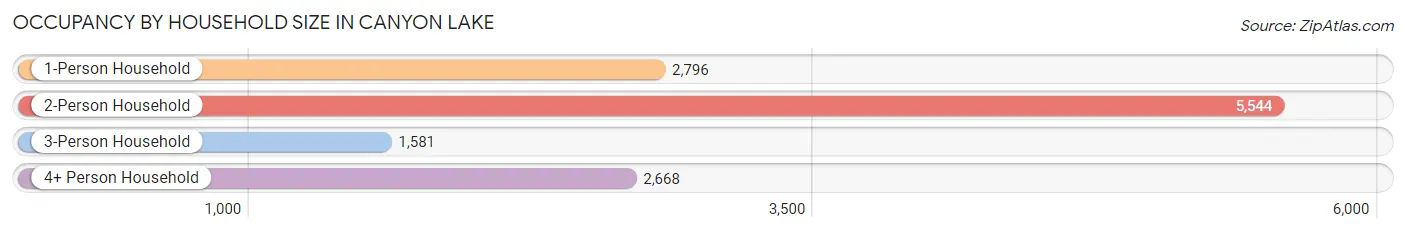
| Household Size | # Housing Units | % Housing Units |
| 1-Person Household | 2,796 | 22.2% |
| 2-Person Household | 5,544 | 44.0% |
| 3-Person Household | 1,581 | 12.6% |
| 4+ Person Household | 2,668 | 21.2% |
| Total Housing Units | 12,589 | 100.0% |
Occupancy by Ownership by Household Size in Canyon Lake
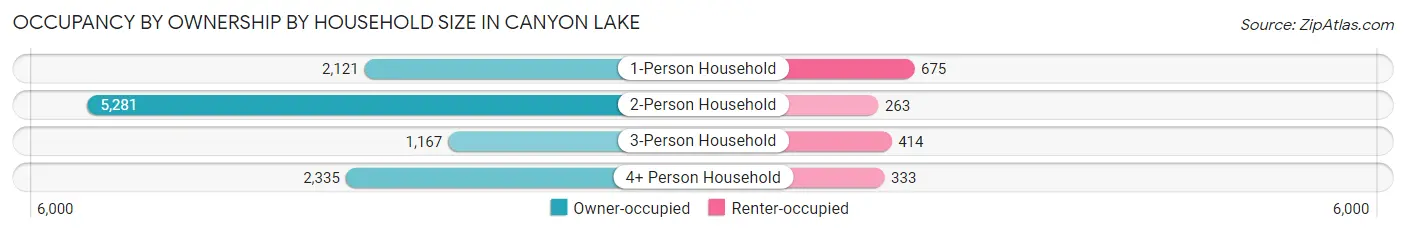
| Household Size | Owner-occupied | Renter-occupied |
| 1-Person Household | 2,121 (75.9%) | 675 (24.1%) |
| 2-Person Household | 5,281 (95.3%) | 263 (4.7%) |
| 3-Person Household | 1,167 (73.8%) | 414 (26.2%) |
| 4+ Person Household | 2,335 (87.5%) | 333 (12.5%) |
| Total Housing Units | 10,904 (86.6%) | 1,685 (13.4%) |
Occupancy by Educational Attainment in Canyon Lake
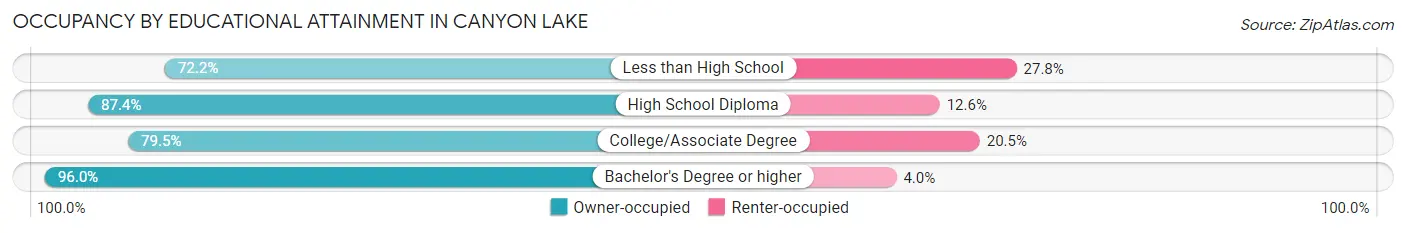
| Household Size | Owner-occupied | Renter-occupied |
| Less than High School | 477 (72.2%) | 184 (27.8%) |
| High School Diploma | 2,609 (87.4%) | 376 (12.6%) |
| College/Associate Degree | 3,678 (79.5%) | 951 (20.5%) |
| Bachelor's Degree or higher | 4,140 (96.0%) | 174 (4.0%) |
Occupancy by Age of Householder in Canyon Lake
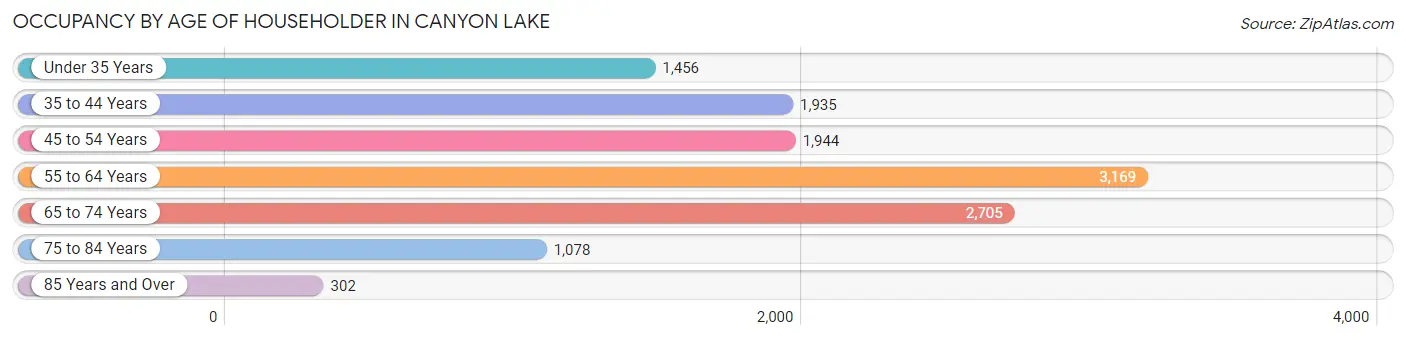
| Age Bracket | # Households | % Households |
| Under 35 Years | 1,456 | 11.6% |
| 35 to 44 Years | 1,935 | 15.4% |
| 45 to 54 Years | 1,944 | 15.4% |
| 55 to 64 Years | 3,169 | 25.2% |
| 65 to 74 Years | 2,705 | 21.5% |
| 75 to 84 Years | 1,078 | 8.6% |
| 85 Years and Over | 302 | 2.4% |
| Total | 12,589 | 100.0% |
Housing Finances in Canyon Lake
Median Income by Occupancy in Canyon Lake
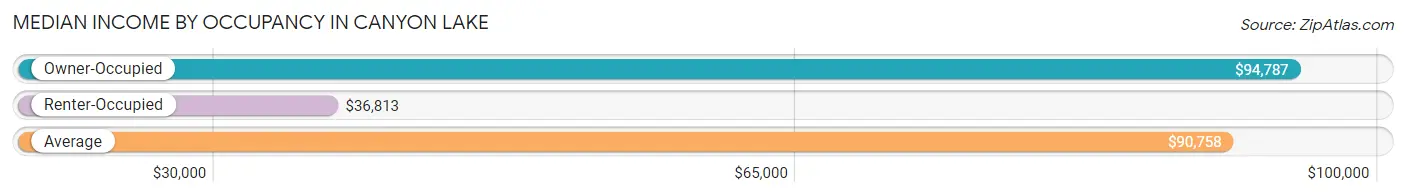
| Occupancy Type | # Households | Median Income |
| Owner-Occupied | 10,904 (86.6%) | $94,787 |
| Renter-Occupied | 1,685 (13.4%) | $36,813 |
| Average | 12,589 (100.0%) | $90,758 |
Occupancy by Householder Income Bracket in Canyon Lake
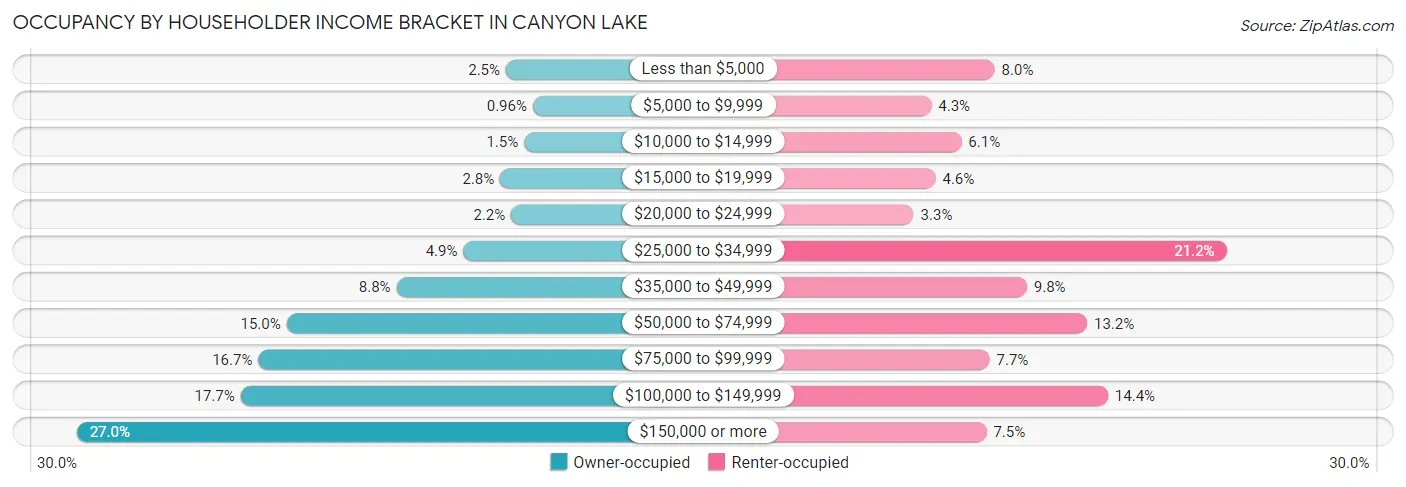
| Income Bracket | Owner-occupied | Renter-occupied |
| Less than $5,000 | 273 (2.5%) | 134 (8.0%) |
| $5,000 to $9,999 | 105 (1.0%) | 73 (4.3%) |
| $10,000 to $14,999 | 159 (1.5%) | 102 (6.0%) |
| $15,000 to $19,999 | 309 (2.8%) | 77 (4.6%) |
| $20,000 to $24,999 | 240 (2.2%) | 56 (3.3%) |
| $25,000 to $34,999 | 538 (4.9%) | 357 (21.2%) |
| $35,000 to $49,999 | 954 (8.7%) | 165 (9.8%) |
| $50,000 to $74,999 | 1,639 (15.0%) | 223 (13.2%) |
| $75,000 to $99,999 | 1,815 (16.7%) | 129 (7.7%) |
| $100,000 to $149,999 | 1,926 (17.7%) | 243 (14.4%) |
| $150,000 or more | 2,946 (27.0%) | 126 (7.5%) |
| Total | 10,904 (100.0%) | 1,685 (100.0%) |
Monthly Housing Cost Tiers in Canyon Lake
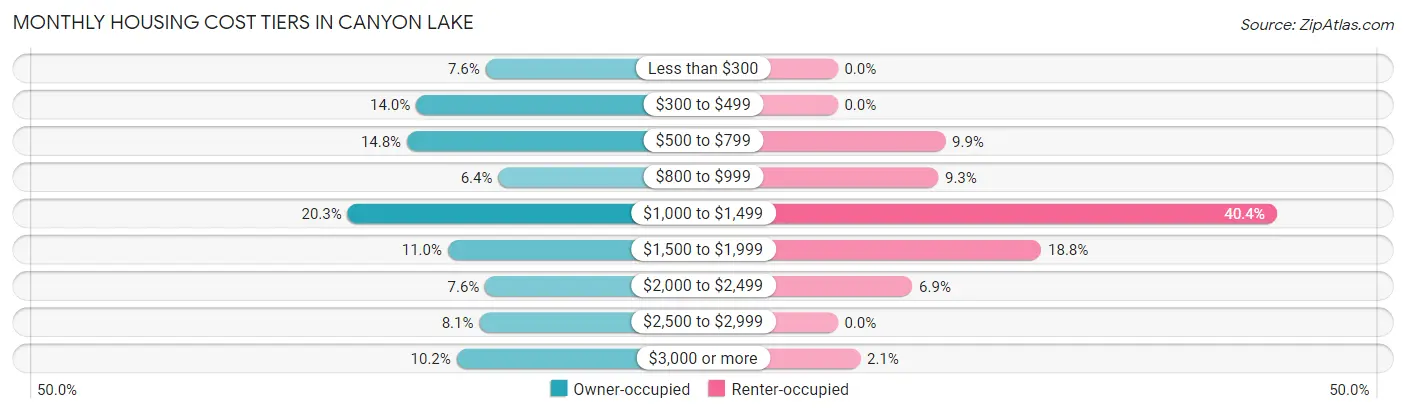
| Monthly Cost | Owner-occupied | Renter-occupied |
| Less than $300 | 824 (7.6%) | 0 (0.0%) |
| $300 to $499 | 1,522 (14.0%) | 0 (0.0%) |
| $500 to $799 | 1,614 (14.8%) | 167 (9.9%) |
| $800 to $999 | 697 (6.4%) | 156 (9.3%) |
| $1,000 to $1,499 | 2,210 (20.3%) | 681 (40.4%) |
| $1,500 to $1,999 | 1,204 (11.0%) | 316 (18.8%) |
| $2,000 to $2,499 | 829 (7.6%) | 116 (6.9%) |
| $2,500 to $2,999 | 888 (8.1%) | 0 (0.0%) |
| $3,000 or more | 1,116 (10.2%) | 35 (2.1%) |
| Total | 10,904 (100.0%) | 1,685 (100.0%) |
Physical Housing Characteristics in Canyon Lake
Housing Structures in Canyon Lake
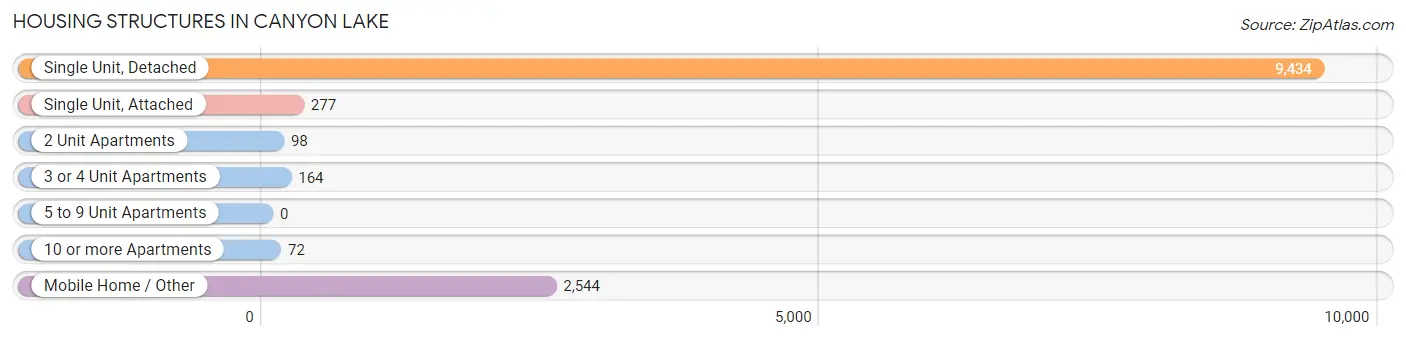
| Structure Type | # Housing Units | % Housing Units |
| Single Unit, Detached | 9,434 | 74.9% |
| Single Unit, Attached | 277 | 2.2% |
| 2 Unit Apartments | 98 | 0.8% |
| 3 or 4 Unit Apartments | 164 | 1.3% |
| 5 to 9 Unit Apartments | 0 | 0.0% |
| 10 or more Apartments | 72 | 0.6% |
| Mobile Home / Other | 2,544 | 20.2% |
| Total | 12,589 | 100.0% |
Housing Structures by Occupancy in Canyon Lake
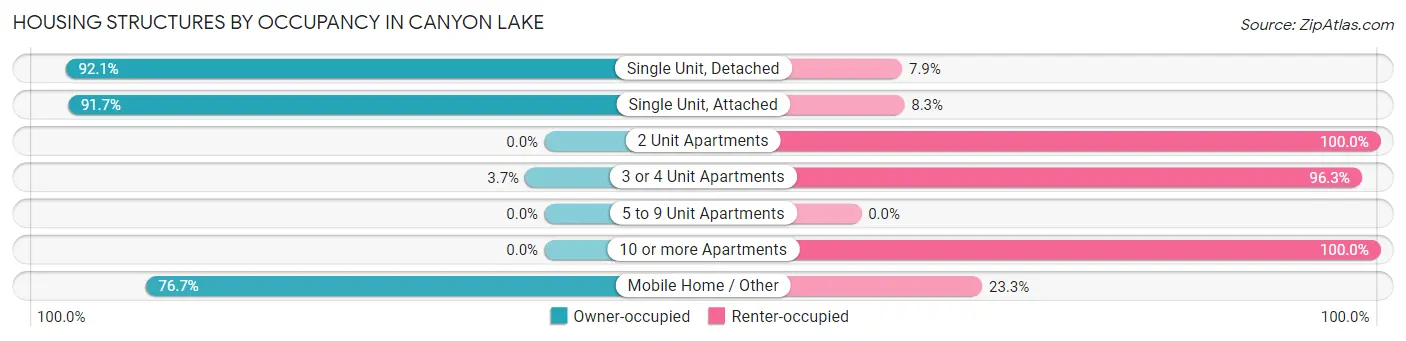
| Structure Type | Owner-occupied | Renter-occupied |
| Single Unit, Detached | 8,692 (92.1%) | 742 (7.9%) |
| Single Unit, Attached | 254 (91.7%) | 23 (8.3%) |
| 2 Unit Apartments | 0 (0.0%) | 98 (100.0%) |
| 3 or 4 Unit Apartments | 6 (3.7%) | 158 (96.3%) |
| 5 to 9 Unit Apartments | 0 (0.0%) | 0 (0.0%) |
| 10 or more Apartments | 0 (0.0%) | 72 (100.0%) |
| Mobile Home / Other | 1,952 (76.7%) | 592 (23.3%) |
| Total | 10,904 (86.6%) | 1,685 (13.4%) |
Housing Structures by Number of Rooms in Canyon Lake
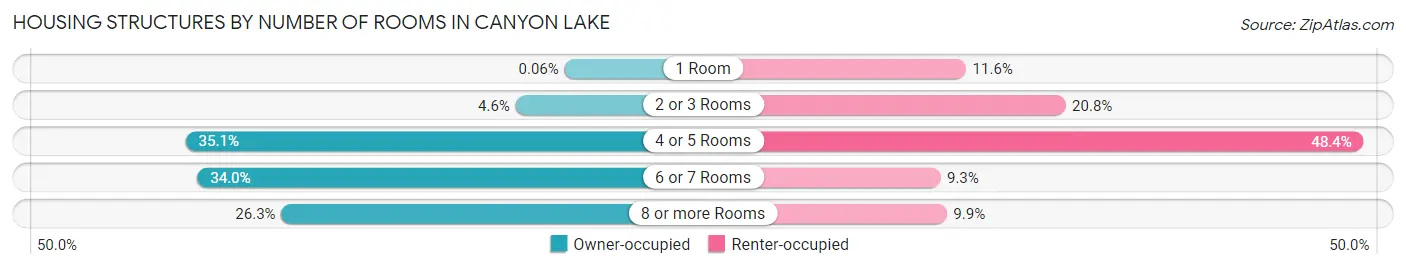
| Number of Rooms | Owner-occupied | Renter-occupied |
| 1 Room | 6 (0.1%) | 196 (11.6%) |
| 2 or 3 Rooms | 499 (4.6%) | 351 (20.8%) |
| 4 or 5 Rooms | 3,827 (35.1%) | 816 (48.4%) |
| 6 or 7 Rooms | 3,710 (34.0%) | 156 (9.3%) |
| 8 or more Rooms | 2,862 (26.3%) | 166 (9.9%) |
| Total | 10,904 (100.0%) | 1,685 (100.0%) |
Housing Structure by Heating Type in Canyon Lake
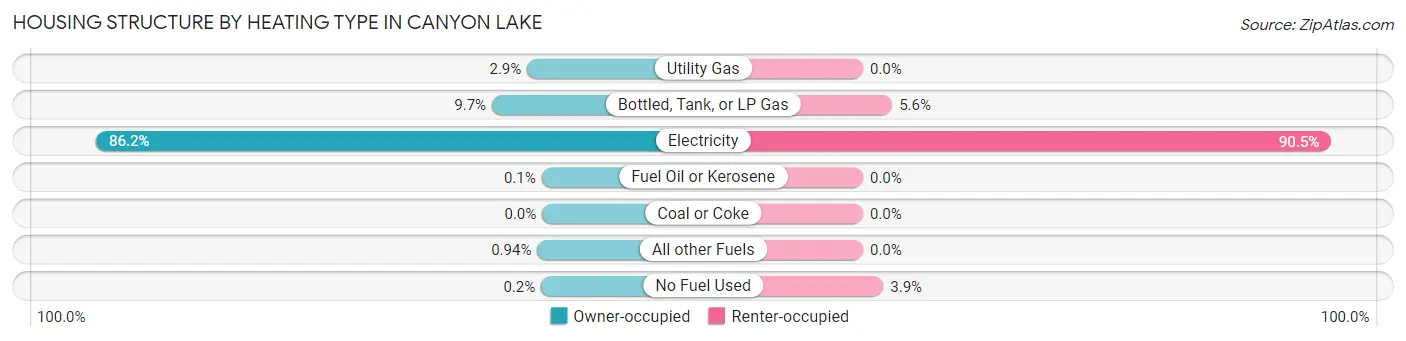
| Heating Type | Owner-occupied | Renter-occupied |
| Utility Gas | 316 (2.9%) | 0 (0.0%) |
| Bottled, Tank, or LP Gas | 1,057 (9.7%) | 95 (5.6%) |
| Electricity | 9,396 (86.2%) | 1,524 (90.4%) |
| Fuel Oil or Kerosene | 11 (0.1%) | 0 (0.0%) |
| Coal or Coke | 0 (0.0%) | 0 (0.0%) |
| All other Fuels | 102 (0.9%) | 0 (0.0%) |
| No Fuel Used | 22 (0.2%) | 66 (3.9%) |
| Total | 10,904 (100.0%) | 1,685 (100.0%) |
Household Vehicle Usage in Canyon Lake
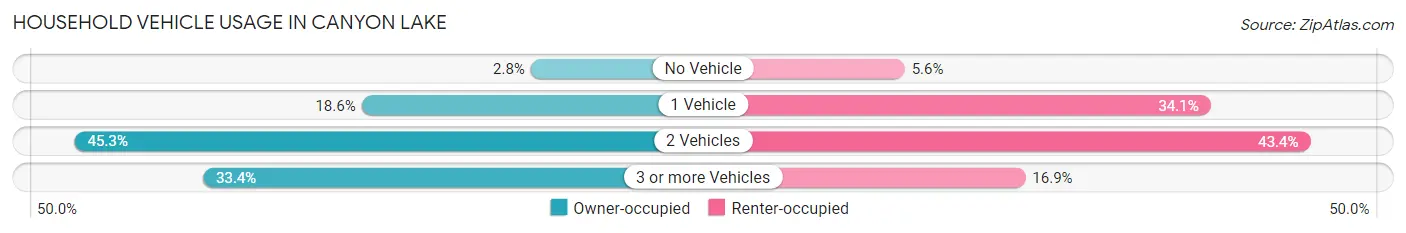
| Vehicles per Household | Owner-occupied | Renter-occupied |
| No Vehicle | 301 (2.8%) | 94 (5.6%) |
| 1 Vehicle | 2,023 (18.5%) | 575 (34.1%) |
| 2 Vehicles | 4,944 (45.3%) | 732 (43.4%) |
| 3 or more Vehicles | 3,636 (33.4%) | 284 (16.9%) |
| Total | 10,904 (100.0%) | 1,685 (100.0%) |
Real Estate & Mortgages in Canyon Lake
Real Estate and Mortgage Overview in Canyon Lake
| Characteristic | Without Mortgage | With Mortgage |
| Housing Units | 5,112 | 5,792 |
| Median Property Value | $263,900 | $395,000 |
| Median Household Income | $75,430 | $1,805 |
| Monthly Housing Costs | $536 | $1,074 |
| Real Estate Taxes | $2,455 | $270 |
Property Value by Mortgage Status in Canyon Lake
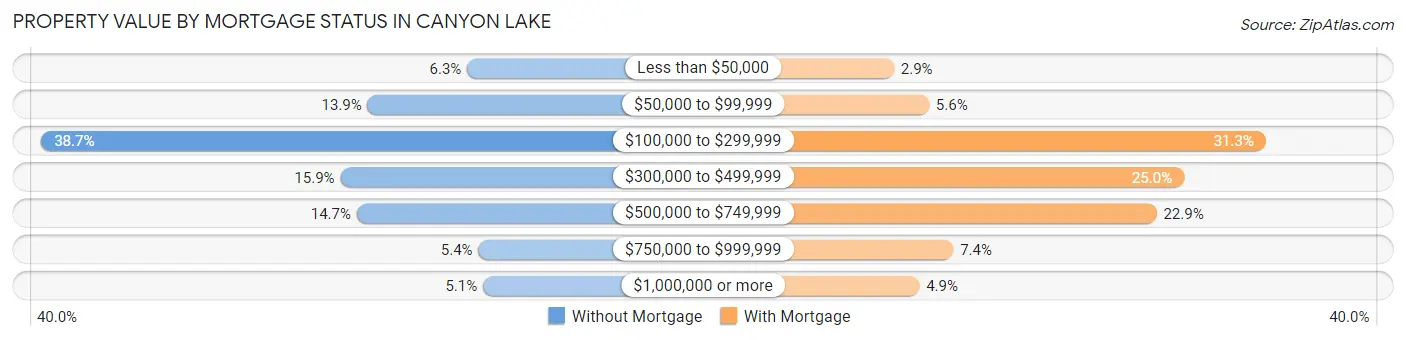
| Property Value | Without Mortgage | With Mortgage |
| Less than $50,000 | 321 (6.3%) | 169 (2.9%) |
| $50,000 to $99,999 | 709 (13.9%) | 324 (5.6%) |
| $100,000 to $299,999 | 1,980 (38.7%) | 1,810 (31.2%) |
| $300,000 to $499,999 | 815 (15.9%) | 1,449 (25.0%) |
| $500,000 to $749,999 | 751 (14.7%) | 1,328 (22.9%) |
| $750,000 to $999,999 | 277 (5.4%) | 431 (7.4%) |
| $1,000,000 or more | 259 (5.1%) | 281 (4.9%) |
| Total | 5,112 (100.0%) | 5,792 (100.0%) |
Household Income by Mortgage Status in Canyon Lake
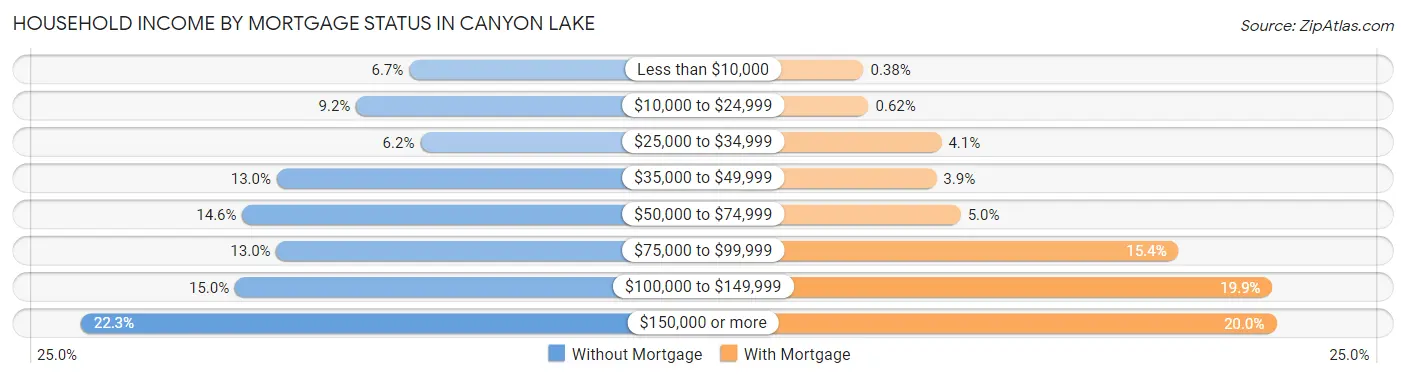
| Household Income | Without Mortgage | With Mortgage |
| Less than $10,000 | 342 (6.7%) | 22 (0.4%) |
| $10,000 to $24,999 | 471 (9.2%) | 36 (0.6%) |
| $25,000 to $34,999 | 315 (6.2%) | 237 (4.1%) |
| $35,000 to $49,999 | 664 (13.0%) | 223 (3.8%) |
| $50,000 to $74,999 | 748 (14.6%) | 290 (5.0%) |
| $75,000 to $99,999 | 665 (13.0%) | 891 (15.4%) |
| $100,000 to $149,999 | 766 (15.0%) | 1,150 (19.9%) |
| $150,000 or more | 1,141 (22.3%) | 1,160 (20.0%) |
| Total | 5,112 (100.0%) | 5,792 (100.0%) |
Property Value to Household Income Ratio in Canyon Lake
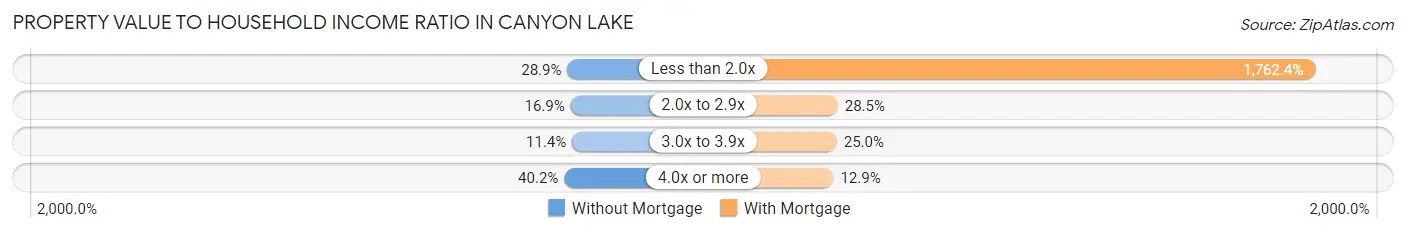
| Value-to-Income Ratio | Without Mortgage | With Mortgage |
| Less than 2.0x | 1,479 (28.9%) | 102,078 (1,762.4%) |
| 2.0x to 2.9x | 866 (16.9%) | 1,648 (28.4%) |
| 3.0x to 3.9x | 580 (11.4%) | 1,446 (25.0%) |
| 4.0x or more | 2,054 (40.2%) | 748 (12.9%) |
| Total | 5,112 (100.0%) | 5,792 (100.0%) |
Real Estate Taxes by Mortgage Status in Canyon Lake
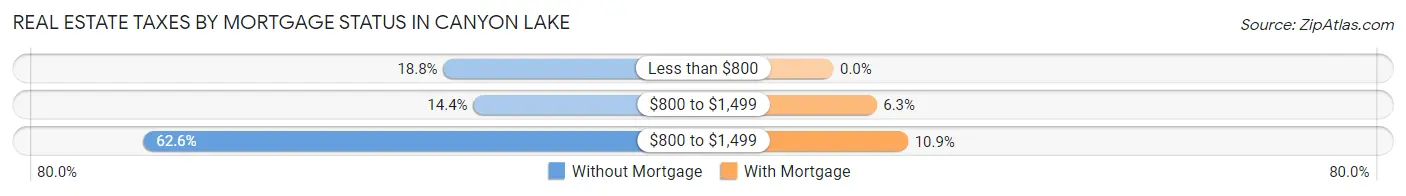
| Property Taxes | Without Mortgage | With Mortgage |
| Less than $800 | 961 (18.8%) | 0 (0.0%) |
| $800 to $1,499 | 737 (14.4%) | 366 (6.3%) |
| $800 to $1,499 | 3,202 (62.6%) | 632 (10.9%) |
| Total | 5,112 (100.0%) | 5,792 (100.0%) |
Health & Disability in Canyon Lake
Health Insurance Coverage by Age in Canyon Lake
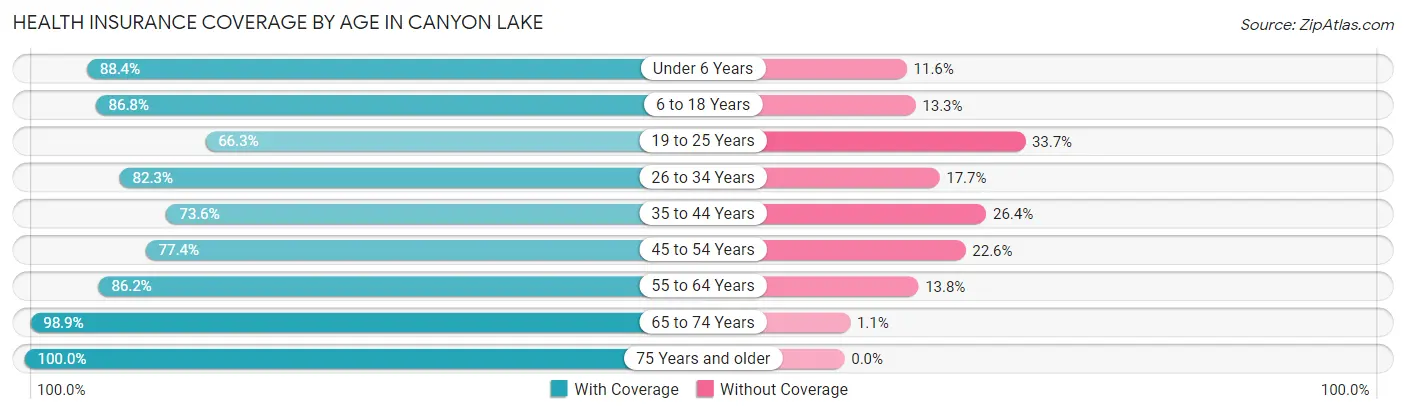
| Age Bracket | With Coverage | Without Coverage |
| Under 6 Years | 2,100 (88.4%) | 276 (11.6%) |
| 6 to 18 Years | 4,093 (86.8%) | 625 (13.3%) |
| 19 to 25 Years | 880 (66.3%) | 447 (33.7%) |
| 26 to 34 Years | 2,298 (82.3%) | 495 (17.7%) |
| 35 to 44 Years | 3,038 (73.6%) | 1,092 (26.4%) |
| 45 to 54 Years | 2,795 (77.4%) | 815 (22.6%) |
| 55 to 64 Years | 5,018 (86.2%) | 802 (13.8%) |
| 65 to 74 Years | 4,778 (98.9%) | 51 (1.1%) |
| 75 Years and older | 2,357 (100.0%) | 0 (0.0%) |
| Total | 27,357 (85.6%) | 4,603 (14.4%) |
Health Insurance Coverage by Citizenship Status in Canyon Lake
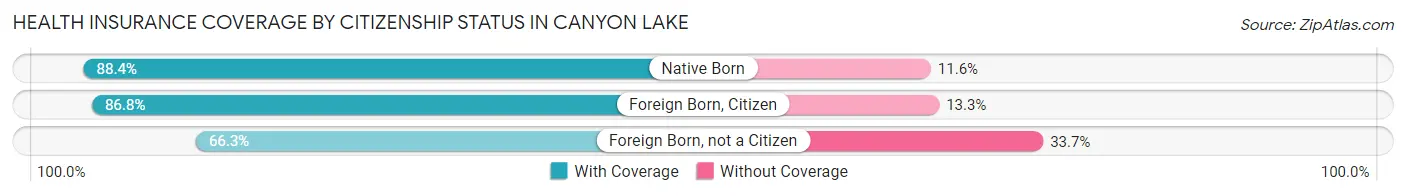
| Citizenship Status | With Coverage | Without Coverage |
| Native Born | 2,100 (88.4%) | 276 (11.6%) |
| Foreign Born, Citizen | 4,093 (86.8%) | 625 (13.3%) |
| Foreign Born, not a Citizen | 880 (66.3%) | 447 (33.7%) |
Health Insurance Coverage by Household Income in Canyon Lake
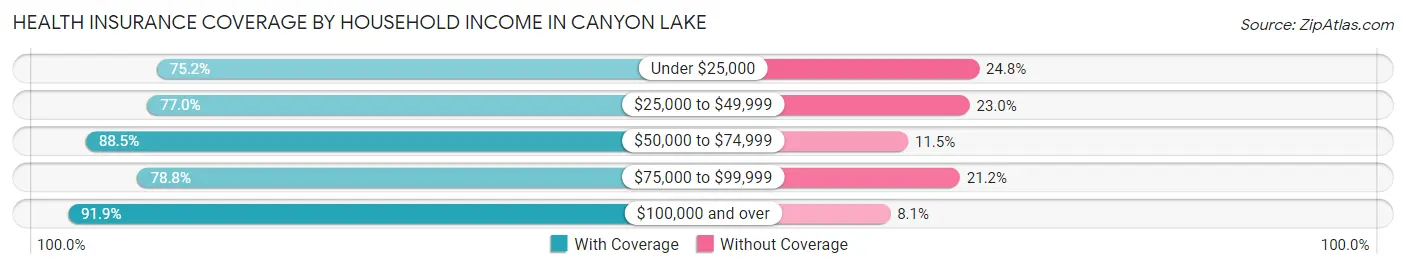
| Household Income | With Coverage | Without Coverage |
| Under $25,000 | 2,081 (75.2%) | 686 (24.8%) |
| $25,000 to $49,999 | 3,170 (77.0%) | 947 (23.0%) |
| $50,000 to $74,999 | 3,828 (88.5%) | 496 (11.5%) |
| $75,000 to $99,999 | 4,730 (78.8%) | 1,271 (21.2%) |
| $100,000 and over | 13,541 (91.9%) | 1,200 (8.1%) |
Public vs Private Health Insurance Coverage by Age in Canyon Lake
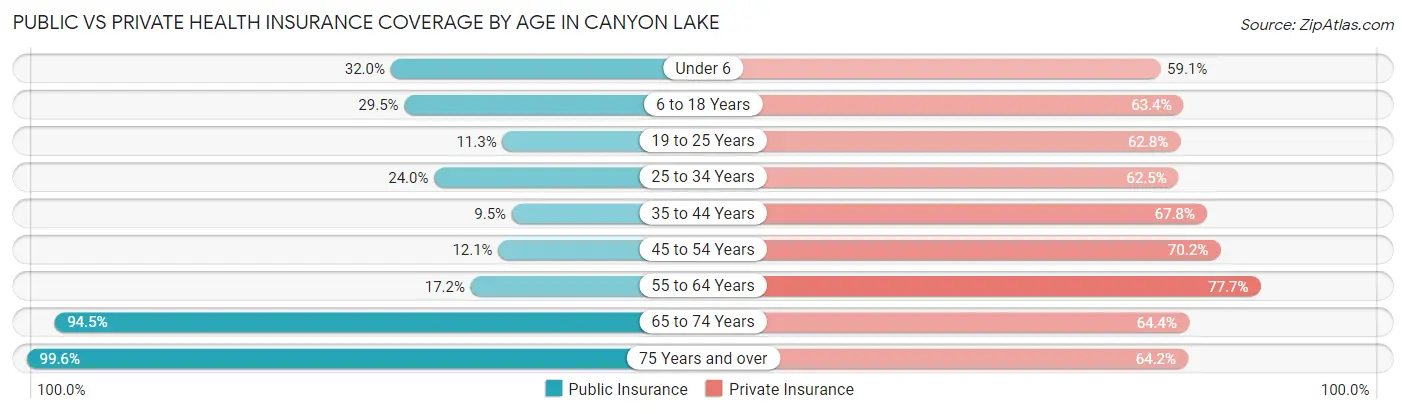
| Age Bracket | Public Insurance | Private Insurance |
| Under 6 | 761 (32.0%) | 1,404 (59.1%) |
| 6 to 18 Years | 1,392 (29.5%) | 2,992 (63.4%) |
| 19 to 25 Years | 150 (11.3%) | 833 (62.8%) |
| 25 to 34 Years | 669 (23.9%) | 1,746 (62.5%) |
| 35 to 44 Years | 394 (9.5%) | 2,798 (67.7%) |
| 45 to 54 Years | 435 (12.0%) | 2,535 (70.2%) |
| 55 to 64 Years | 1,000 (17.2%) | 4,521 (77.7%) |
| 65 to 74 Years | 4,563 (94.5%) | 3,110 (64.4%) |
| 75 Years and over | 2,348 (99.6%) | 1,514 (64.2%) |
| Total | 11,712 (36.6%) | 21,453 (67.1%) |
Disability Status by Sex by Age in Canyon Lake
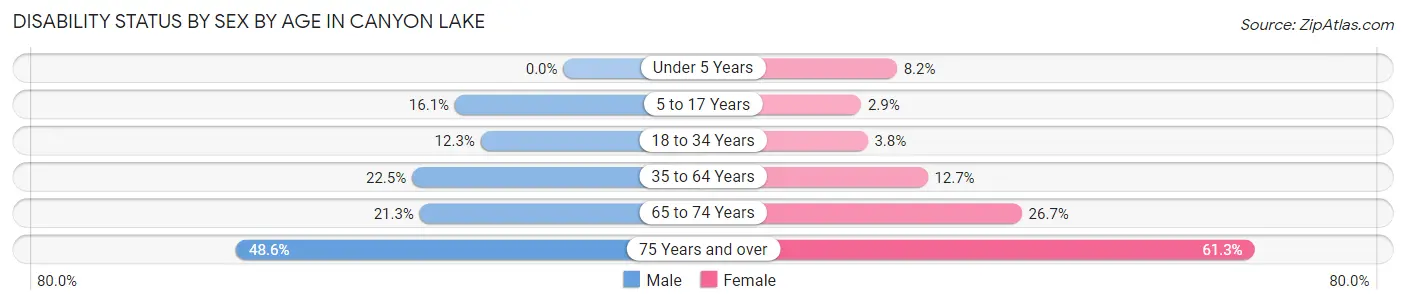
| Age Bracket | Male | Female |
| Under 5 Years | 0 (0.0%) | 85 (8.2%) |
| 5 to 17 Years | 391 (16.1%) | 67 (2.9%) |
| 18 to 34 Years | 297 (12.3%) | 77 (3.8%) |
| 35 to 64 Years | 1,503 (22.5%) | 874 (12.7%) |
| 65 to 74 Years | 502 (21.3%) | 661 (26.7%) |
| 75 Years and over | 563 (48.6%) | 734 (61.3%) |
Disability Class by Sex by Age in Canyon Lake
Disability Class: Hearing Difficulty
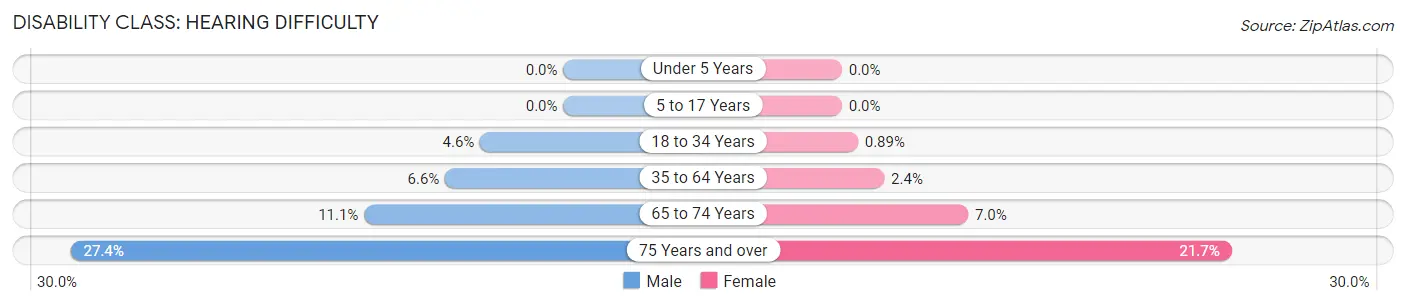
| Age Bracket | Male | Female |
| Under 5 Years | 0 (0.0%) | 0 (0.0%) |
| 5 to 17 Years | 0 (0.0%) | 0 (0.0%) |
| 18 to 34 Years | 112 (4.6%) | 18 (0.9%) |
| 35 to 64 Years | 440 (6.6%) | 162 (2.4%) |
| 65 to 74 Years | 261 (11.1%) | 174 (7.0%) |
| 75 Years and over | 318 (27.4%) | 260 (21.7%) |
Disability Class: Vision Difficulty
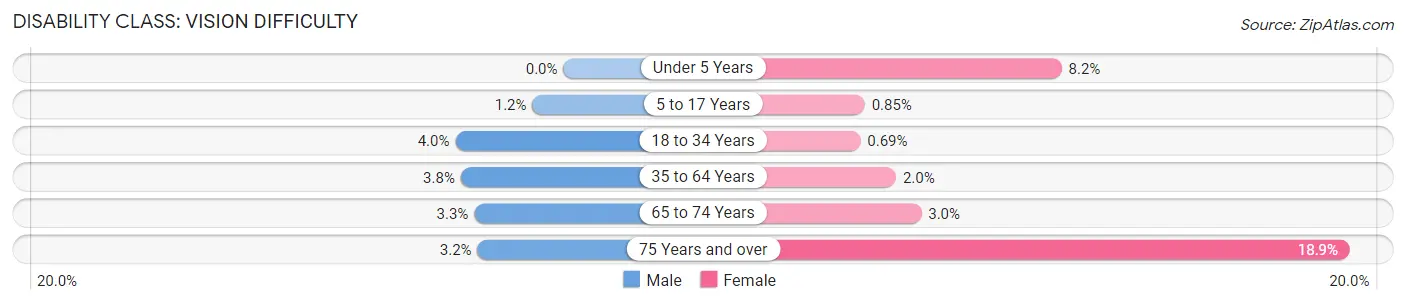
| Age Bracket | Male | Female |
| Under 5 Years | 0 (0.0%) | 85 (8.2%) |
| 5 to 17 Years | 28 (1.1%) | 20 (0.9%) |
| 18 to 34 Years | 97 (4.0%) | 14 (0.7%) |
| 35 to 64 Years | 255 (3.8%) | 138 (2.0%) |
| 65 to 74 Years | 78 (3.3%) | 73 (2.9%) |
| 75 Years and over | 37 (3.2%) | 226 (18.9%) |
Disability Class: Cognitive Difficulty
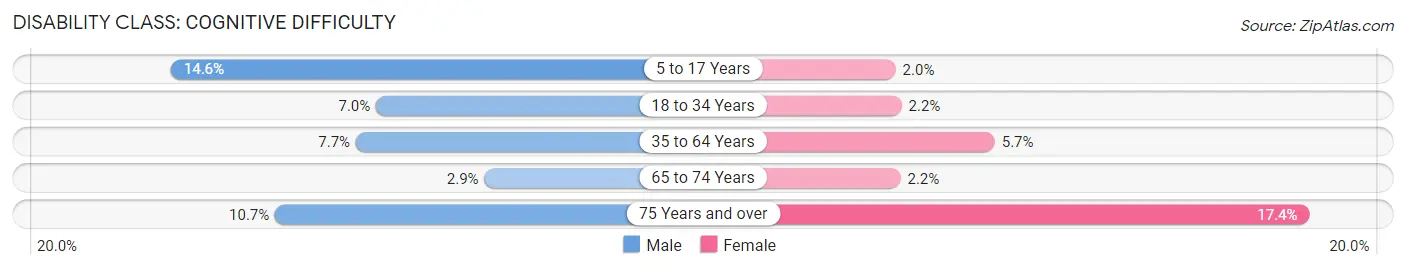
| Age Bracket | Male | Female |
| 5 to 17 Years | 354 (14.6%) | 47 (2.0%) |
| 18 to 34 Years | 168 (7.0%) | 45 (2.2%) |
| 35 to 64 Years | 515 (7.7%) | 390 (5.7%) |
| 65 to 74 Years | 69 (2.9%) | 54 (2.2%) |
| 75 Years and over | 124 (10.7%) | 208 (17.4%) |
Disability Class: Ambulatory Difficulty
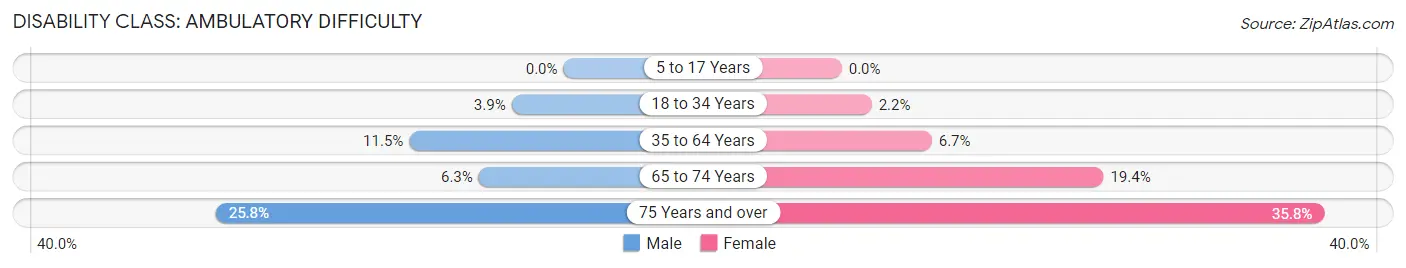
| Age Bracket | Male | Female |
| 5 to 17 Years | 0 (0.0%) | 0 (0.0%) |
| 18 to 34 Years | 93 (3.8%) | 45 (2.2%) |
| 35 to 64 Years | 766 (11.5%) | 459 (6.7%) |
| 65 to 74 Years | 148 (6.3%) | 481 (19.4%) |
| 75 Years and over | 299 (25.8%) | 429 (35.8%) |
Disability Class: Self-Care Difficulty
| Age Bracket | Male | Female |
| 5 to 17 Years | 0 (0.0%) | 0 (0.0%) |
| 18 to 34 Years | 52 (2.1%) | 45 (2.2%) |
| 35 to 64 Years | 283 (4.2%) | 123 (1.8%) |
| 65 to 74 Years | 11 (0.5%) | 51 (2.1%) |
| 75 Years and over | 184 (15.9%) | 159 (13.3%) |
Technology Access in Canyon Lake
Computing Device Access in Canyon Lake
| Device Type | # Households | % Households |
| Desktop or Laptop | 10,628 | 84.4% |
| Smartphone | 11,760 | 93.4% |
| Tablet | 8,225 | 65.3% |
| No Computing Device | 370 | 2.9% |
| Total | 12,589 | 100.0% |
Internet Access in Canyon Lake
| Internet Type | # Households | % Households |
| Dial-Up Internet | 0 | 0.0% |
| Broadband Home | 10,161 | 80.7% |
| Cellular Data Only | 1,043 | 8.3% |
| Satellite Internet | 841 | 6.7% |
| No Internet | 940 | 7.5% |
| Total | 12,589 | 100.0% |
Canyon Lake Summary
Canyon Lake is a city located in Comal County, Texas, United States. It is situated on the northern edge of the Edwards Plateau, about 30 miles (48 km) northwest of San Antonio and about 15 miles (24 km) west of New Braunfels. The city is part of the San Antonio–New Braunfels Metropolitan Statistical Area. As of the 2010 census, the population of Canyon Lake was 21,262.
History
The area that is now Canyon Lake was originally inhabited by the Tonkawa and Comanche Native American tribes. The first European settlers arrived in the area in the early 1800s. The area was part of the Fisher-Miller Land Grant, which was given to German immigrants in 1842. The area was known as Sattler until the 1950s, when it was renamed Canyon Lake.
The city was officially incorporated in 1959, and the Canyon Lake Dam was completed in 1964. The dam was built to provide flood control and water supply for the area. The lake created by the dam is now a popular recreational area.
Geography
Canyon Lake is located at 29°54'N 98°17'W (29.9000, -98.2833). It is situated on the northern edge of the Edwards Plateau, about 30 miles (48 km) northwest of San Antonio and about 15 miles (24 km) west of New Braunfels. The city has a total area of 8.3 square miles (21.5 km2), of which 8.2 square miles (21.3 km2) is land and 0.1 square miles (0.2 km2) is water.
Economy
Canyon Lake is a popular tourist destination, and the city's economy is largely based on tourism. The city is home to several resorts, campgrounds, and marinas, as well as a variety of restaurants and shops. The city also has a number of manufacturing and industrial businesses.
Demographics
As of the 2010 census, there were 21,262 people, 8,845 households, and 6,541 families residing in the city. The population density was 2,586.2 people per square mile (998.7/km2). There were 9,845 housing units at an average density of 1,196.2 per square mile (461.7/km2). The racial makeup of the city was 90.2% White, 0.7% African American, 0.7% Native American, 0.7% Asian, 0.1% Pacific Islander, 6.2% from other races, and 1.5% from two or more races. Hispanic or Latino of any race were 20.2% of the population.
There were 8,845 households, out of which 28.2% had children under the age of 18 living with them, 58.2% were married couples living together, 9.7% had a female householder with no husband present, and 28.2% were non-families. 22.7% of all households were made up of individuals, and 8.2% had someone living alone who was 65 years of age or older. The average household size was 2.41 and the average family size was 2.83.
In the city, the population was spread out, with 22.2% under the age of 18, 6.7% from 18 to 24, 25.2% from 25 to 44, 30.2% from 45 to 64, and 15.7% who were 65 years of age or older. The median age was 42 years. For every 100 females, there were 97.2 males. For every 100 females age 18 and over, there were 94.3 males.
The median income for a household in the city was $50,945, and the median income for a family was $58,945. Males had a median income of $41,945 versus $30,945 for females. The per capita income for the city was $25,945. About 5.2% of families and 7.2% of the population were below the poverty line, including 9.2% of those under age 18 and 5.2% of those age 65 or over.
Common Questions
What is Per Capita Income in Canyon Lake?
Per Capita income in Canyon Lake is $44,594.
What is the Median Family Income in Canyon Lake?
Median Family Income in Canyon Lake is $98,425.
What is the Median Household income in Canyon Lake?
Median Household Income in Canyon Lake is $90,758.
What is Income or Wage Gap in Canyon Lake?
Income or Wage Gap in Canyon Lake is 37.1%.
Women in Canyon Lake earn 62.9 cents for every dollar earned by a man.
What is Inequality or Gini Index in Canyon Lake?
Inequality or Gini Index in Canyon Lake is 0.44.
What is the Total Population of Canyon Lake?
Total Population of Canyon Lake is 32,035.
What is the Total Male Population of Canyon Lake?
Total Male Population of Canyon Lake is 16,074.
What is the Total Female Population of Canyon Lake?
Total Female Population of Canyon Lake is 15,961.
What is the Ratio of Males per 100 Females in Canyon Lake?
There are 100.71 Males per 100 Females in Canyon Lake.
What is the Ratio of Females per 100 Males in Canyon Lake?
There are 99.30 Females per 100 Males in Canyon Lake.
What is the Median Population Age in Canyon Lake?
Median Population Age in Canyon Lake is 47.1 Years.
What is the Average Family Size in Canyon Lake
Average Family Size in Canyon Lake is 3.0 People.
What is the Average Household Size in Canyon Lake
Average Household Size in Canyon Lake is 2.5 People.
How Large is the Labor Force in Canyon Lake?
There are 14,241 People in the Labor Forcein in Canyon Lake.
What is the Percentage of People in the Labor Force in Canyon Lake?
54.4% of People are in the Labor Force in Canyon Lake.
What is the Unemployment Rate in Canyon Lake?
Unemployment Rate in Canyon Lake is 3.0%.