Canton, TX Map & Demographics
Canton Map
Canton Overview
$30,175
PER CAPITA INCOME
$71,500
AVG FAMILY INCOME
$52,500
AVG HOUSEHOLD INCOME
24.3%
WAGE / INCOME GAP [ % ]
75.7¢/ $1
WAGE / INCOME GAP [ $ ]
0.47
INEQUALITY / GINI INDEX
4,279
TOTAL POPULATION
2,343
MALE POPULATION
1,936
FEMALE POPULATION
121.02
MALES / 100 FEMALES
82.63
FEMALES / 100 MALES
40.3
MEDIAN AGE
3.0
AVG FAMILY SIZE
2.2
AVG HOUSEHOLD SIZE
1,743
LABOR FORCE [ PEOPLE ]
50.8%
PERCENT IN LABOR FORCE
2.6%
UNEMPLOYMENT RATE
Canton Zip Codes
Income in Canton
Income Overview in Canton
Per Capita Income in Canton is $30,175, while median incomes of families and households are $71,500 and $52,500 respectively.
| Characteristic | Number | Measure |
| Per Capita Income | 4,279 | $30,175 |
| Median Family Income | 976 | $71,500 |
| Mean Family Income | 976 | $95,689 |
| Median Household Income | 1,826 | $52,500 |
| Mean Household Income | 1,826 | $68,437 |
| Income Deficit | 976 | $0 |
| Wage / Income Gap (%) | 4,279 | 24.29% |
| Wage / Income Gap ($) | 4,279 | 75.71¢ per $1 |
| Gini / Inequality Index | 4,279 | 0.47 |
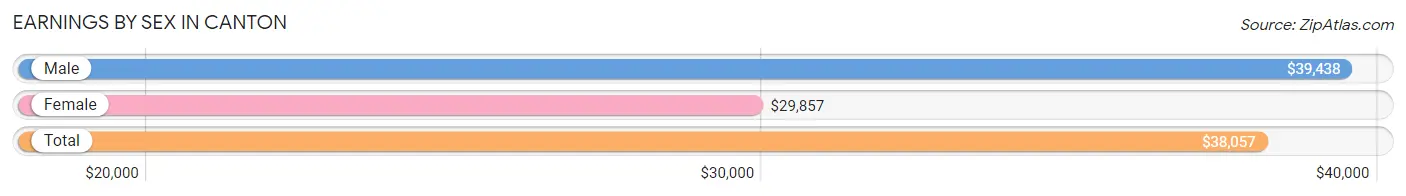
Earnings by Sex in Canton
Average Earnings in Canton are $38,057, $39,438 for men and $29,857 for women, a difference of 24.3%.
| Sex | Number | Average Earnings |
| Male | 1,124 (56.3%) | $39,438 |
| Female | 873 (43.7%) | $29,857 |
| Total | 1,997 (100.0%) | $38,057 |
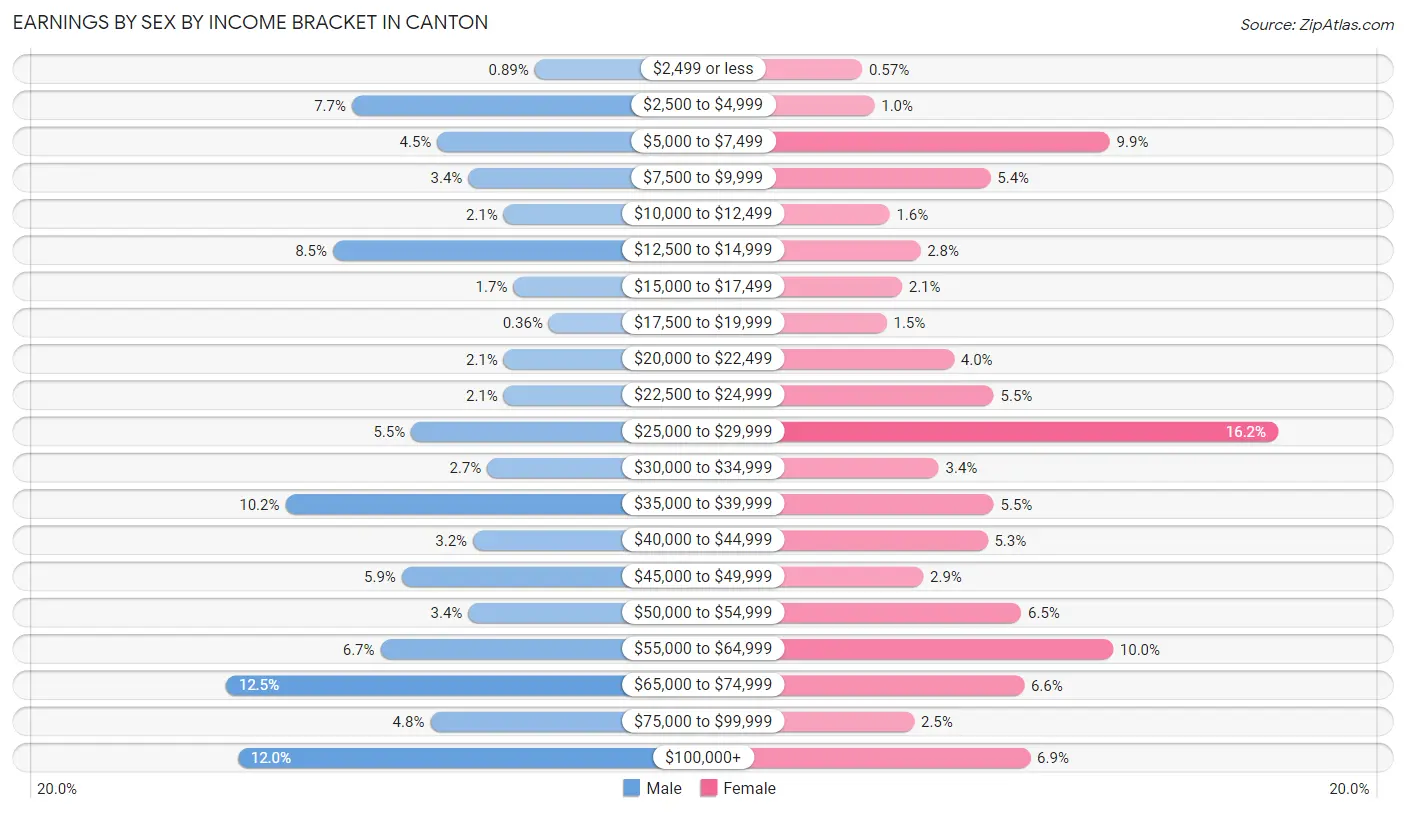
Earnings by Sex by Income Bracket in Canton
The most common earnings brackets in Canton are $65,000 to $74,999 for men (140 | 12.5%) and $25,000 to $29,999 for women (141 | 16.2%).
| Income | Male | Female |
| $2,499 or less | 10 (0.9%) | 5 (0.6%) |
| $2,500 to $4,999 | 87 (7.7%) | 9 (1.0%) |
| $5,000 to $7,499 | 51 (4.5%) | 86 (9.9%) |
| $7,500 to $9,999 | 38 (3.4%) | 47 (5.4%) |
| $10,000 to $12,499 | 23 (2.1%) | 14 (1.6%) |
| $12,500 to $14,999 | 95 (8.5%) | 24 (2.8%) |
| $15,000 to $17,499 | 19 (1.7%) | 18 (2.1%) |
| $17,500 to $19,999 | 4 (0.4%) | 13 (1.5%) |
| $20,000 to $22,499 | 23 (2.1%) | 35 (4.0%) |
| $22,500 to $24,999 | 23 (2.1%) | 48 (5.5%) |
| $25,000 to $29,999 | 62 (5.5%) | 141 (16.2%) |
| $30,000 to $34,999 | 30 (2.7%) | 30 (3.4%) |
| $35,000 to $39,999 | 115 (10.2%) | 48 (5.5%) |
| $40,000 to $44,999 | 36 (3.2%) | 46 (5.3%) |
| $45,000 to $49,999 | 66 (5.9%) | 25 (2.9%) |
| $50,000 to $54,999 | 38 (3.4%) | 57 (6.5%) |
| $55,000 to $64,999 | 75 (6.7%) | 87 (10.0%) |
| $65,000 to $74,999 | 140 (12.5%) | 58 (6.6%) |
| $75,000 to $99,999 | 54 (4.8%) | 22 (2.5%) |
| $100,000+ | 135 (12.0%) | 60 (6.9%) |
| Total | 1,124 (100.0%) | 873 (100.0%) |
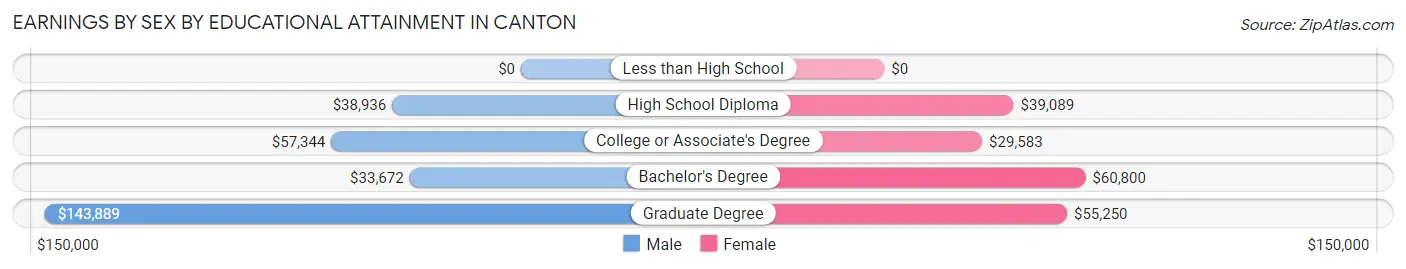
Earnings by Sex by Educational Attainment in Canton
Average earnings in Canton are $46,758 for men and $39,349 for women, a difference of 15.9%. Men with an educational attainment of graduate degree enjoy the highest average annual earnings of $143,889, while those with bachelor's degree education earn the least with $33,672. Women with an educational attainment of bachelor's degree earn the most with the average annual earnings of $60,800, while those with college or associate's degree education have the smallest earnings of $29,583.
| Educational Attainment | Male Income | Female Income |
| Less than High School | - | - |
| High School Diploma | $38,936 | $39,089 |
| College or Associate's Degree | $57,344 | $29,583 |
| Bachelor's Degree | $33,672 | $60,800 |
| Graduate Degree | $143,889 | $55,250 |
| Total | $46,758 | $39,349 |
Family Income in Canton
Family Income Brackets in Canton
According to the Canton family income data, there are 227 families falling into the $50,000 to $74,999 income range, which is the most common income bracket and makes up 23.3% of all families.
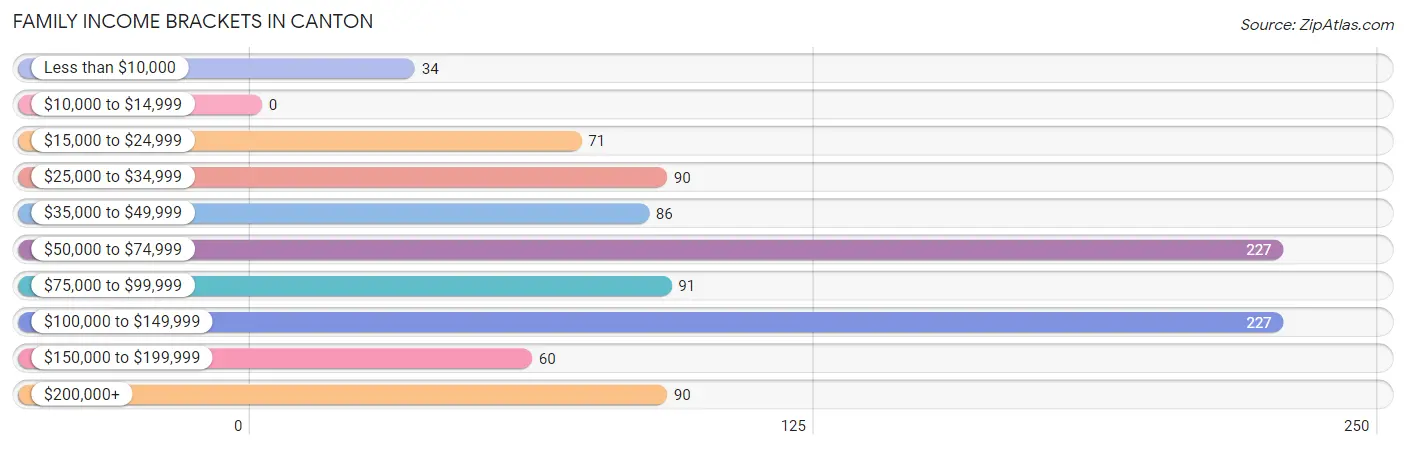
| Income Bracket | # Families | % Families |
| Less than $10,000 | 34 | 3.5% |
| $10,000 to $14,999 | 0 | 0.0% |
| $15,000 to $24,999 | 71 | 7.3% |
| $25,000 to $34,999 | 90 | 9.2% |
| $35,000 to $49,999 | 86 | 8.8% |
| $50,000 to $74,999 | 227 | 23.3% |
| $75,000 to $99,999 | 91 | 9.3% |
| $100,000 to $149,999 | 227 | 23.3% |
| $150,000 to $199,999 | 60 | 6.1% |
| $200,000+ | 90 | 9.2% |
Family Income by Famaliy Size in Canton
4-person families (195 | 20.0%) account for the highest median family income in Canton with $91,625 per family, while 2-person families (489 | 50.1%) have the highest median income of $28,730 per family member.
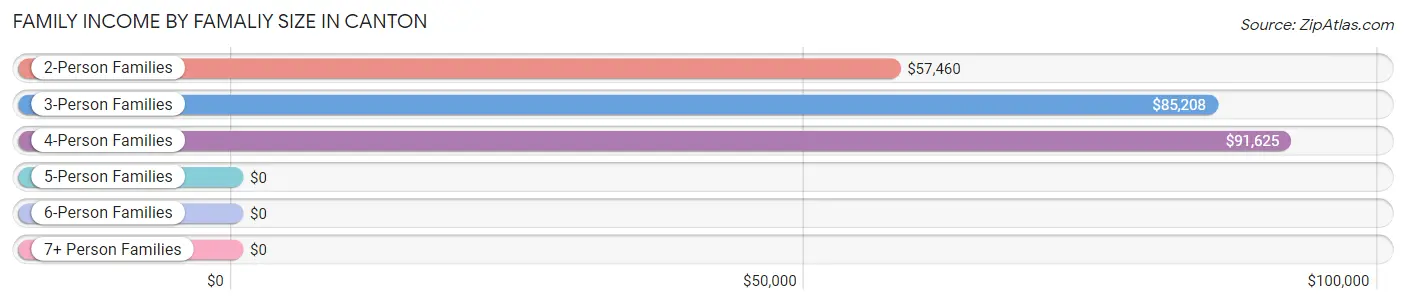
| Income Bracket | # Families | Median Income |
| 2-Person Families | 489 (50.1%) | $57,460 |
| 3-Person Families | 211 (21.6%) | $85,208 |
| 4-Person Families | 195 (20.0%) | $91,625 |
| 5-Person Families | 36 (3.7%) | $0 |
| 6-Person Families | 11 (1.1%) | $0 |
| 7+ Person Families | 34 (3.5%) | $0 |
| Total | 976 (100.0%) | $71,500 |
Family Income by Number of Earners in Canton
The median family income in Canton is $71,500, with families comprising 3+ earners (108) having the highest median family income of $250,001, while families with no earners (178) have the lowest median family income of $49,063, accounting for 11.1% and 18.2% of families, respectively.
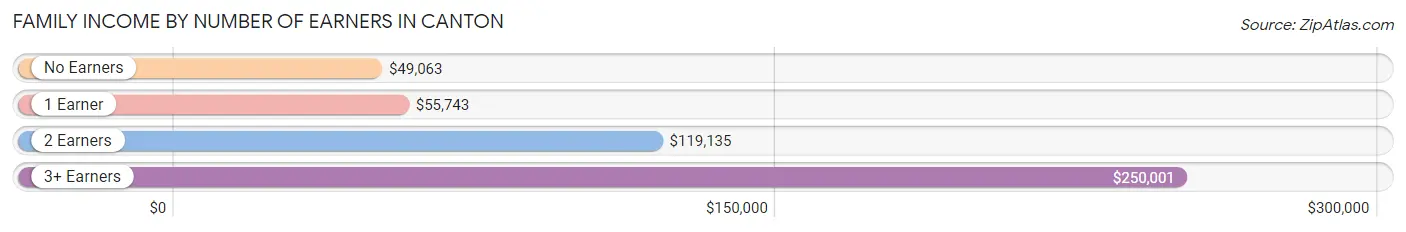
| Number of Earners | # Families | Median Income |
| No Earners | 178 (18.2%) | $49,063 |
| 1 Earner | 377 (38.6%) | $55,743 |
| 2 Earners | 313 (32.1%) | $119,135 |
| 3+ Earners | 108 (11.1%) | $250,001 |
| Total | 976 (100.0%) | $71,500 |
Household Income in Canton
Household Income Brackets in Canton
With 369 households falling in the category, the $50,000 to $74,999 income range is the most frequent in Canton, accounting for 20.2% of all households. In contrast, only 60 households (3.3%) fall into the $150,000 to $199,999 income bracket, making it the least populous group.
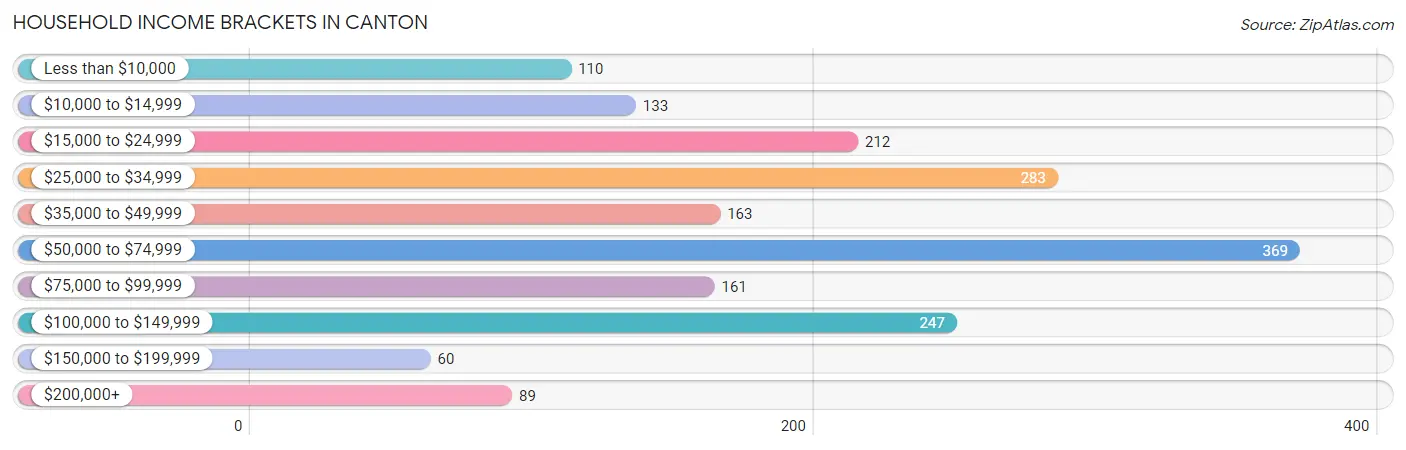
| Income Bracket | # Households | % Households |
| Less than $10,000 | 110 | 6.0% |
| $10,000 to $14,999 | 133 | 7.3% |
| $15,000 to $24,999 | 212 | 11.6% |
| $25,000 to $34,999 | 283 | 15.5% |
| $35,000 to $49,999 | 163 | 8.9% |
| $50,000 to $74,999 | 369 | 20.2% |
| $75,000 to $99,999 | 161 | 8.8% |
| $100,000 to $149,999 | 247 | 13.5% |
| $150,000 to $199,999 | 60 | 3.3% |
| $200,000+ | 89 | 4.9% |
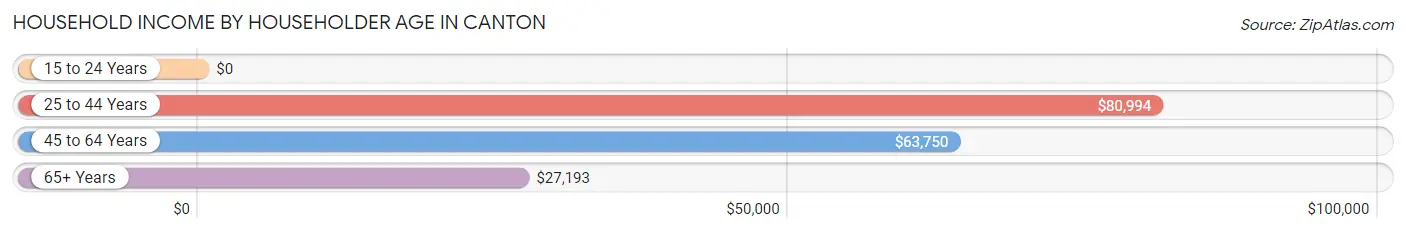
Household Income by Householder Age in Canton
The median household income in Canton is $52,500, with the highest median household income of $80,994 found in the 25 to 44 years age bracket for the primary householder. A total of 545 households (29.8%) fall into this category. Meanwhile, the 15 to 24 years age bracket for the primary householder has the lowest median household income of $0, with 108 households (5.9%) in this group.
| Income Bracket | # Households | Median Income |
| 15 to 24 Years | 108 (5.9%) | $0 |
| 25 to 44 Years | 545 (29.8%) | $80,994 |
| 45 to 64 Years | 570 (31.2%) | $63,750 |
| 65+ Years | 603 (33.0%) | $27,193 |
| Total | 1,826 (100.0%) | $52,500 |
Poverty in Canton
Income Below Poverty by Sex and Age in Canton
With 16.3% poverty level for males and 10.0% for females among the residents of Canton, 55 to 64 year old males and 16 and 17 year old females are the most vulnerable to poverty, with 159 males (43.8%) and 15 females (100.0%) in their respective age groups living below the poverty level.
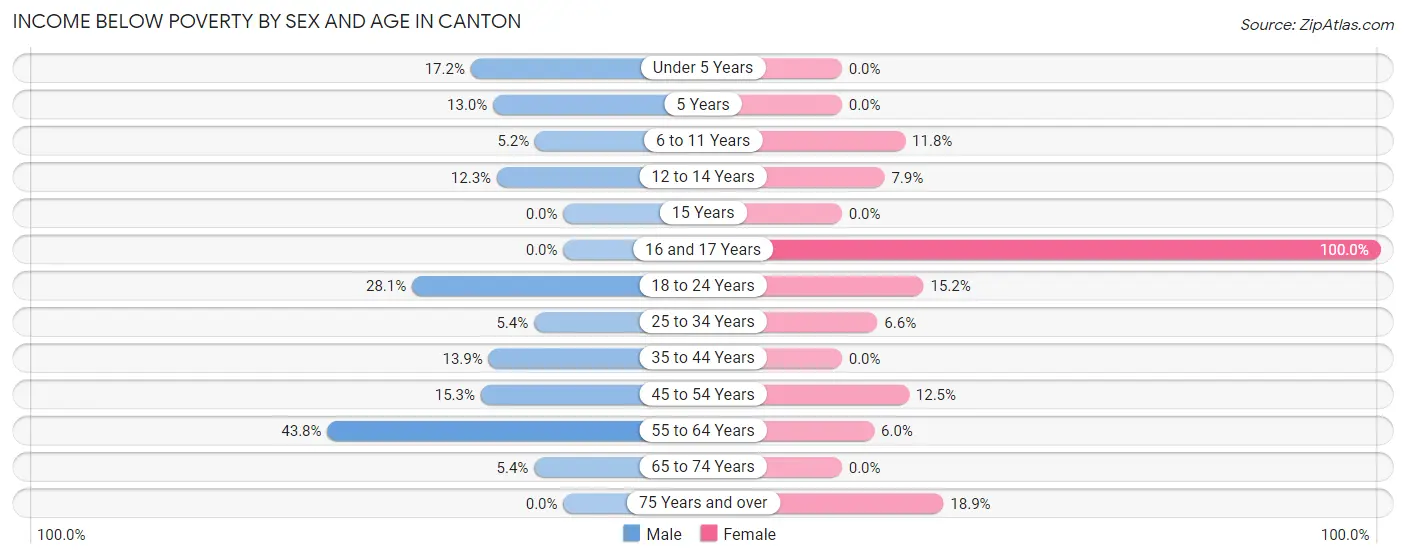
| Age Bracket | Male | Female |
| Under 5 Years | 33 (17.2%) | 0 (0.0%) |
| 5 Years | 9 (13.0%) | 0 (0.0%) |
| 6 to 11 Years | 10 (5.2%) | 8 (11.8%) |
| 12 to 14 Years | 9 (12.3%) | 8 (7.9%) |
| 15 Years | 0 (0.0%) | 0 (0.0%) |
| 16 and 17 Years | 0 (0.0%) | 15 (100.0%) |
| 18 to 24 Years | 50 (28.1%) | 27 (15.2%) |
| 25 to 34 Years | 19 (5.4%) | 15 (6.6%) |
| 35 to 44 Years | 30 (13.9%) | 0 (0.0%) |
| 45 to 54 Years | 21 (15.3%) | 32 (12.4%) |
| 55 to 64 Years | 159 (43.8%) | 12 (6.0%) |
| 65 to 74 Years | 10 (5.4%) | 0 (0.0%) |
| 75 Years and over | 0 (0.0%) | 66 (18.9%) |
| Total | 350 (16.3%) | 183 (10.0%) |
Income Above Poverty by Sex and Age in Canton
According to the poverty statistics in Canton, males aged 15 years and females aged under 5 years are the age groups that are most secure financially, with 100.0% of males and 100.0% of females in these age groups living above the poverty line.
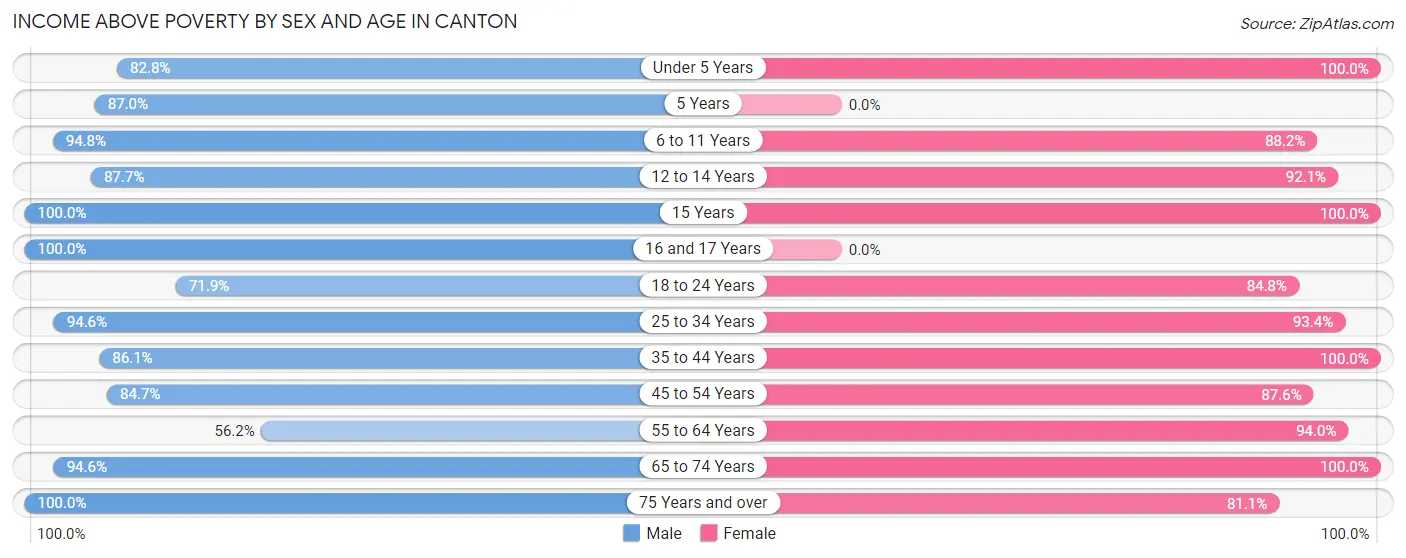
| Age Bracket | Male | Female |
| Under 5 Years | 159 (82.8%) | 111 (100.0%) |
| 5 Years | 60 (87.0%) | 0 (0.0%) |
| 6 to 11 Years | 181 (94.8%) | 60 (88.2%) |
| 12 to 14 Years | 64 (87.7%) | 93 (92.1%) |
| 15 Years | 12 (100.0%) | 16 (100.0%) |
| 16 and 17 Years | 40 (100.0%) | 0 (0.0%) |
| 18 to 24 Years | 128 (71.9%) | 151 (84.8%) |
| 25 to 34 Years | 330 (94.6%) | 212 (93.4%) |
| 35 to 44 Years | 186 (86.1%) | 206 (100.0%) |
| 45 to 54 Years | 116 (84.7%) | 225 (87.5%) |
| 55 to 64 Years | 204 (56.2%) | 188 (94.0%) |
| 65 to 74 Years | 175 (94.6%) | 105 (100.0%) |
| 75 Years and over | 147 (100.0%) | 284 (81.1%) |
| Total | 1,802 (83.7%) | 1,651 (90.0%) |
Income Below Poverty Among Married-Couple Families in Canton
The poverty statistics for married-couple families in Canton show that 4.9% or 35 of the total 718 families live below the poverty line. Families with no children have the highest poverty rate of 8.6%, comprising of 35 families. On the other hand, families with 1 or 2 children have the lowest poverty rate of 0.0%, which includes 0 families.
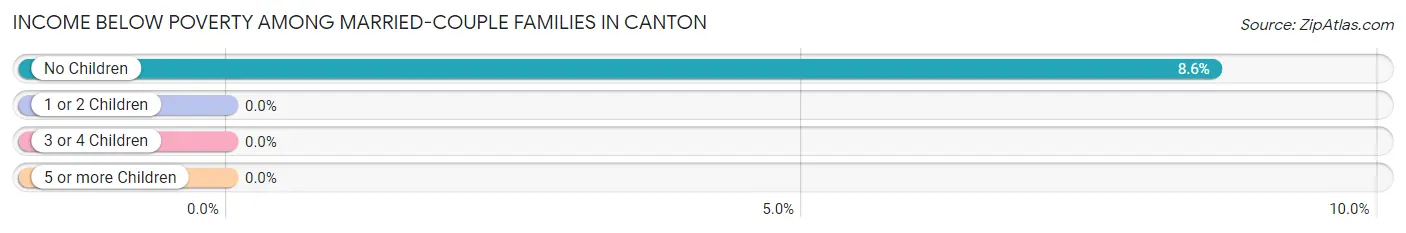
| Children | Above Poverty | Below Poverty |
| No Children | 374 (91.4%) | 35 (8.6%) |
| 1 or 2 Children | 257 (100.0%) | 0 (0.0%) |
| 3 or 4 Children | 32 (100.0%) | 0 (0.0%) |
| 5 or more Children | 20 (100.0%) | 0 (0.0%) |
| Total | 683 (95.1%) | 35 (4.9%) |
Income Below Poverty Among Single-Parent Households in Canton
According to the poverty data in Canton, 14.9% or 11 single-father households and 17.9% or 33 single-mother households are living below the poverty line. Among single-father households, those with 5 or more children have the highest poverty rate, with 11 households (100.0%) experiencing poverty. Likewise, among single-mother households, those with 3 or 4 children have the highest poverty rate, with 13 households (100.0%) falling below the poverty line.
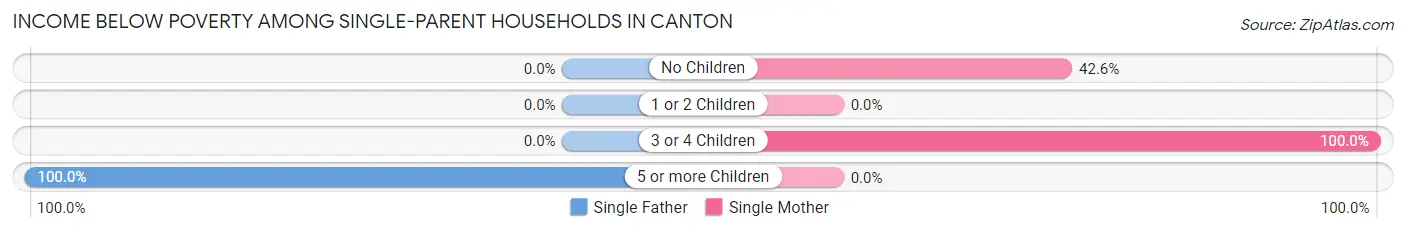
| Children | Single Father | Single Mother |
| No Children | 0 (0.0%) | 20 (42.5%) |
| 1 or 2 Children | 0 (0.0%) | 0 (0.0%) |
| 3 or 4 Children | 0 (0.0%) | 13 (100.0%) |
| 5 or more Children | 11 (100.0%) | 0 (0.0%) |
| Total | 11 (14.9%) | 33 (17.9%) |
Income Below Poverty Among Married-Couple vs Single-Parent Households in Canton
The poverty data for Canton shows that 35 of the married-couple family households (4.9%) and 44 of the single-parent households (17.1%) are living below the poverty level. Within the married-couple family households, those with no children have the highest poverty rate, with 35 households (8.6%) falling below the poverty line. Among the single-parent households, those with 3 or 4 children have the highest poverty rate, with 13 household (100.0%) living below poverty.
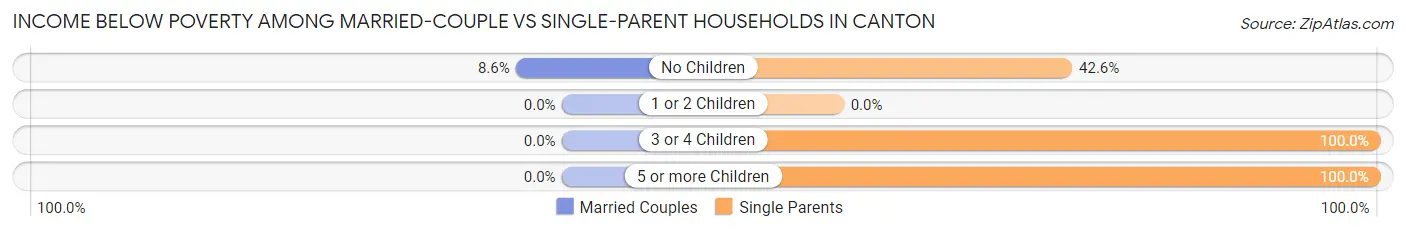
| Children | Married-Couple Families | Single-Parent Households |
| No Children | 35 (8.6%) | 20 (42.5%) |
| 1 or 2 Children | 0 (0.0%) | 0 (0.0%) |
| 3 or 4 Children | 0 (0.0%) | 13 (100.0%) |
| 5 or more Children | 0 (0.0%) | 11 (100.0%) |
| Total | 35 (4.9%) | 44 (17.1%) |
Race in Canton
The most populous races in Canton are White / Caucasian (4,054 | 94.7%), Hispanic or Latino (120 | 2.8%), and Black / African American (119 | 2.8%).
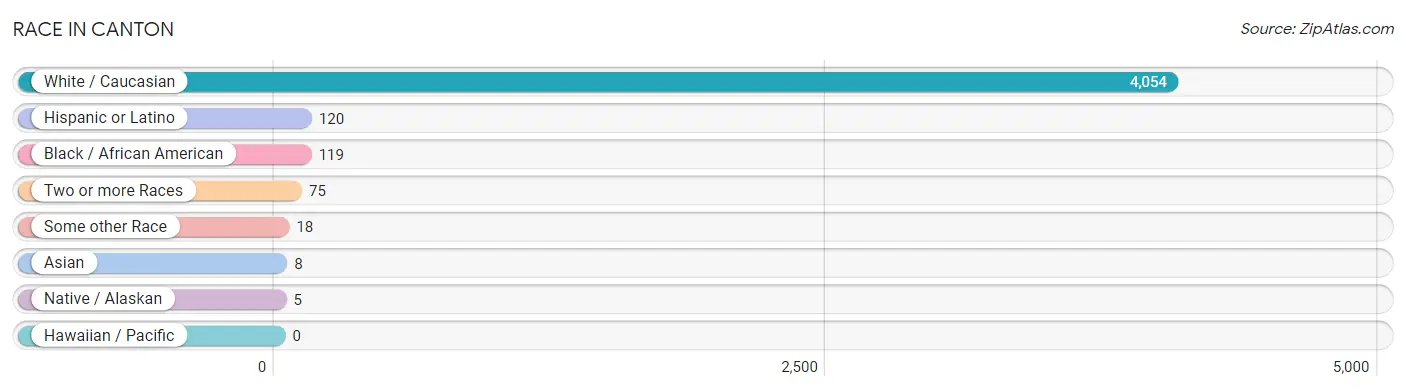
| Race | # Population | % Population |
| Asian | 8 | 0.2% |
| Black / African American | 119 | 2.8% |
| Hawaiian / Pacific | 0 | 0.0% |
| Hispanic or Latino | 120 | 2.8% |
| Native / Alaskan | 5 | 0.1% |
| White / Caucasian | 4,054 | 94.7% |
| Two or more Races | 75 | 1.8% |
| Some other Race | 18 | 0.4% |
| Total | 4,279 | 100.0% |
Ancestry in Canton
The most populous ancestries reported in Canton are American (938 | 21.9%), Irish (439 | 10.3%), English (319 | 7.5%), German (222 | 5.2%), and French (175 | 4.1%), together accounting for 48.9% of all Canton residents.
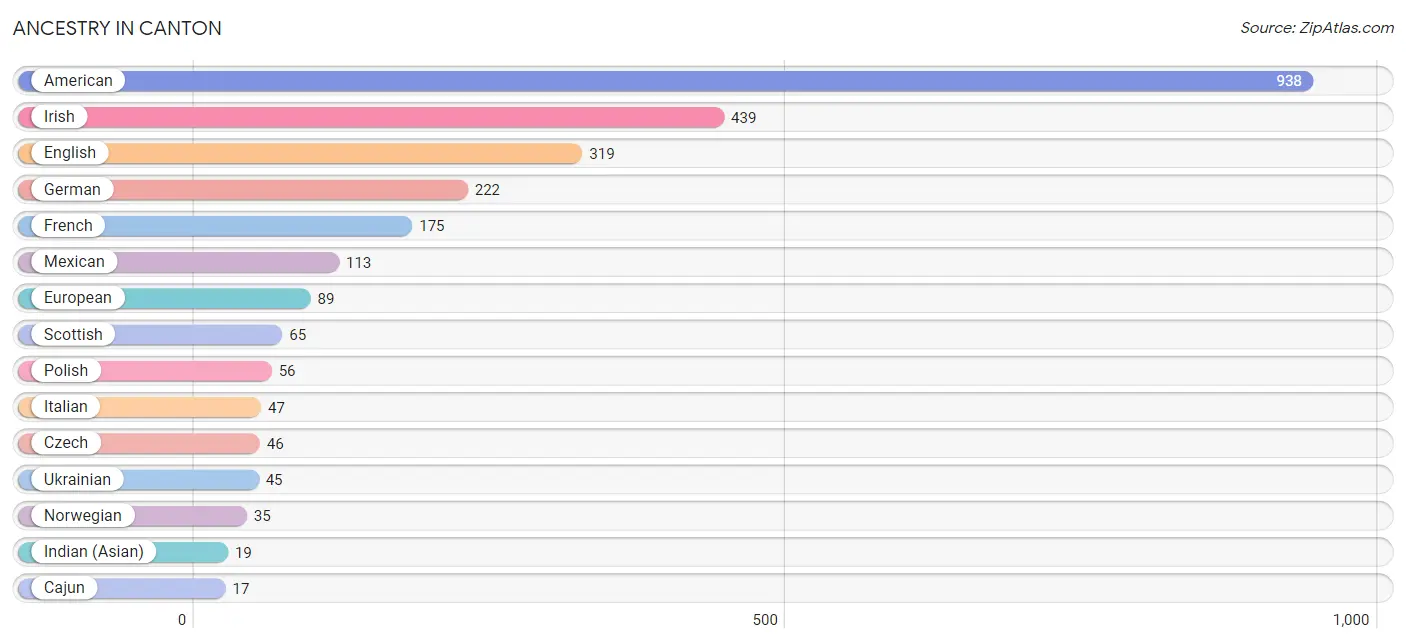
| Ancestry | # Population | % Population |
| African | 8 | 0.2% |
| American | 938 | 21.9% |
| Cajun | 17 | 0.4% |
| Central American | 7 | 0.2% |
| Cherokee | 11 | 0.3% |
| Choctaw | 5 | 0.1% |
| Czech | 46 | 1.1% |
| Dutch West Indian | 5 | 0.1% |
| Eastern European | 8 | 0.2% |
| English | 319 | 7.5% |
| European | 89 | 2.1% |
| French | 175 | 4.1% |
| French Canadian | 15 | 0.4% |
| German | 222 | 5.2% |
| Indian (Asian) | 19 | 0.4% |
| Irish | 439 | 10.3% |
| Italian | 47 | 1.1% |
| Korean | 13 | 0.3% |
| Mexican | 113 | 2.6% |
| Nicaraguan | 7 | 0.2% |
| Northern European | 9 | 0.2% |
| Norwegian | 35 | 0.8% |
| Polish | 56 | 1.3% |
| Russian | 16 | 0.4% |
| Scandinavian | 7 | 0.2% |
| Scotch-Irish | 10 | 0.2% |
| Scottish | 65 | 1.5% |
| Subsaharan African | 8 | 0.2% |
| Ukrainian | 45 | 1.1% | View All 29 Rows |
Immigrants in Canton
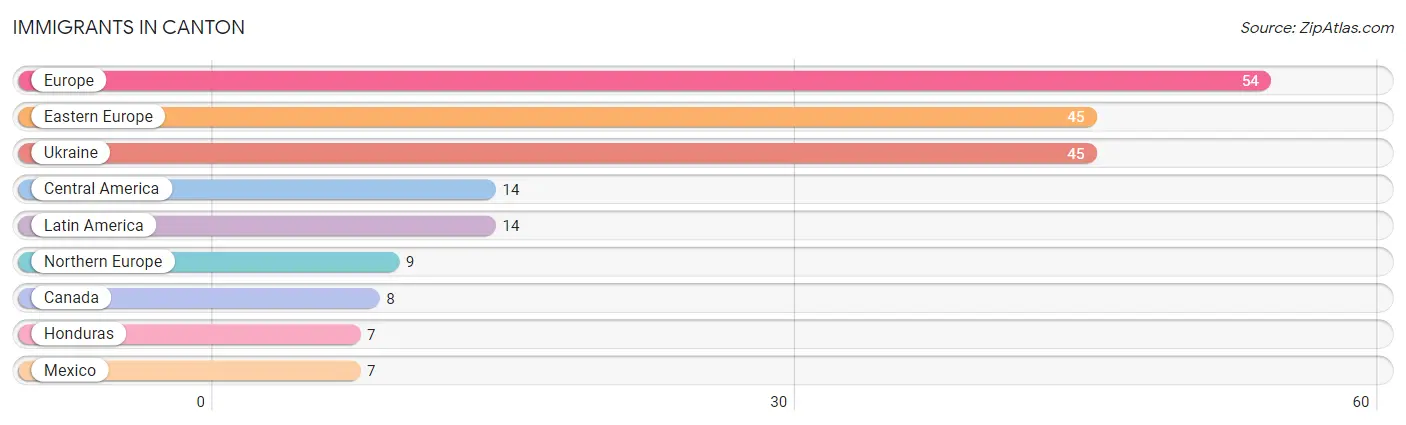
The most numerous immigrant groups reported in Canton came from Europe (54 | 1.3%), Eastern Europe (45 | 1.1%), Ukraine (45 | 1.1%), Central America (14 | 0.3%), and Latin America (14 | 0.3%), together accounting for 4.0% of all Canton residents.
| Immigration Origin | # Population | % Population |
| Canada | 8 | 0.2% |
| Central America | 14 | 0.3% |
| Eastern Europe | 45 | 1.1% |
| Europe | 54 | 1.3% |
| Honduras | 7 | 0.2% |
| Latin America | 14 | 0.3% |
| Mexico | 7 | 0.2% |
| Northern Europe | 9 | 0.2% |
| Ukraine | 45 | 1.1% | View All 9 Rows |
Sex and Age in Canton
Sex and Age in Canton
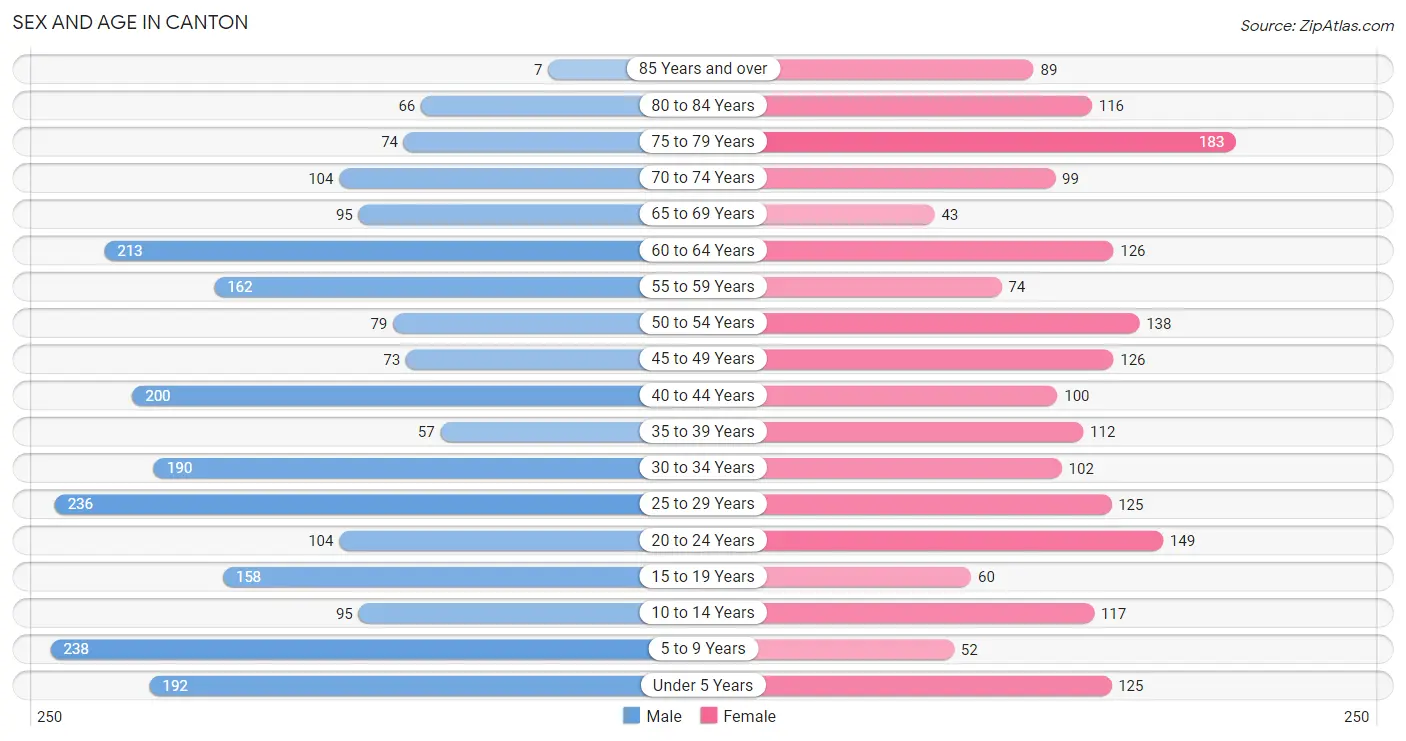
The most populous age groups in Canton are 5 to 9 Years (238 | 10.2%) for men and 75 to 79 Years (183 | 9.5%) for women.
| Age Bracket | Male | Female |
| Under 5 Years | 192 (8.2%) | 125 (6.5%) |
| 5 to 9 Years | 238 (10.2%) | 52 (2.7%) |
| 10 to 14 Years | 95 (4.1%) | 117 (6.0%) |
| 15 to 19 Years | 158 (6.7%) | 60 (3.1%) |
| 20 to 24 Years | 104 (4.4%) | 149 (7.7%) |
| 25 to 29 Years | 236 (10.1%) | 125 (6.5%) |
| 30 to 34 Years | 190 (8.1%) | 102 (5.3%) |
| 35 to 39 Years | 57 (2.4%) | 112 (5.8%) |
| 40 to 44 Years | 200 (8.5%) | 100 (5.2%) |
| 45 to 49 Years | 73 (3.1%) | 126 (6.5%) |
| 50 to 54 Years | 79 (3.4%) | 138 (7.1%) |
| 55 to 59 Years | 162 (6.9%) | 74 (3.8%) |
| 60 to 64 Years | 213 (9.1%) | 126 (6.5%) |
| 65 to 69 Years | 95 (4.1%) | 43 (2.2%) |
| 70 to 74 Years | 104 (4.4%) | 99 (5.1%) |
| 75 to 79 Years | 74 (3.2%) | 183 (9.5%) |
| 80 to 84 Years | 66 (2.8%) | 116 (6.0%) |
| 85 Years and over | 7 (0.3%) | 89 (4.6%) |
| Total | 2,343 (100.0%) | 1,936 (100.0%) |
Families and Households in Canton
Median Family Size in Canton
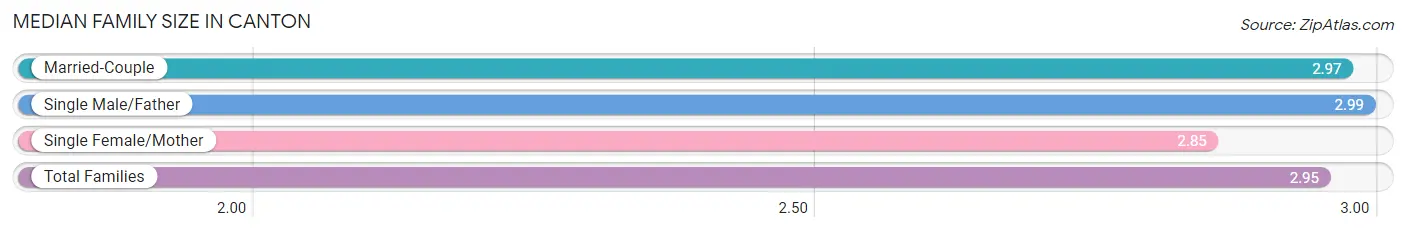
The median family size in Canton is 2.95 persons per family, with single male/father families (74 | 7.6%) accounting for the largest median family size of 2.99 persons per family. On the other hand, single female/mother families (184 | 18.9%) represent the smallest median family size with 2.85 persons per family.
| Family Type | # Families | Family Size |
| Married-Couple | 718 (73.6%) | 2.97 |
| Single Male/Father | 74 (7.6%) | 2.99 |
| Single Female/Mother | 184 (18.9%) | 2.85 |
| Total Families | 976 (100.0%) | 2.95 |
Median Household Size in Canton
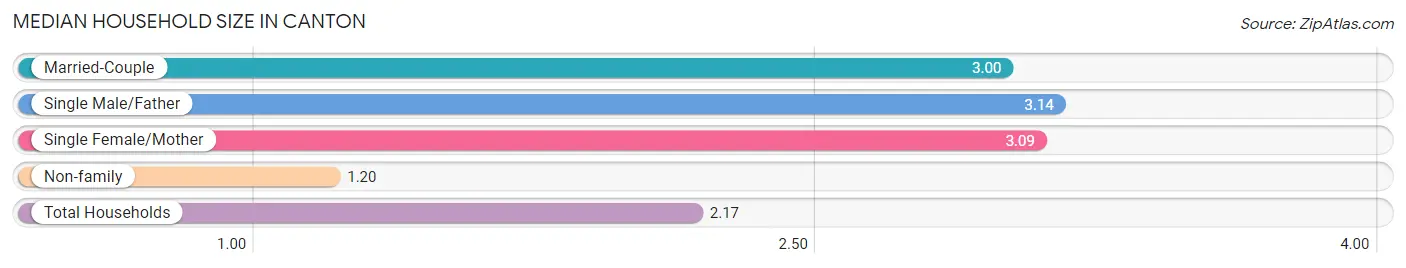
The median household size in Canton is 2.17 persons per household, with single male/father households (74 | 4.1%) accounting for the largest median household size of 3.14 persons per household. non-family households (850 | 46.6%) represent the smallest median household size with 1.20 persons per household.
| Household Type | # Households | Household Size |
| Married-Couple | 718 (39.3%) | 3.00 |
| Single Male/Father | 74 (4.1%) | 3.14 |
| Single Female/Mother | 184 (10.1%) | 3.09 |
| Non-family | 850 (46.6%) | 1.20 |
| Total Households | 1,826 (100.0%) | 2.17 |
Household Size by Marriage Status in Canton
Out of a total of 1,826 households in Canton, 976 (53.4%) are family households, while 850 (46.6%) are nonfamily households. The most numerous type of family households are 2-person households, comprising 479, and the most common type of nonfamily households are 1-person households, comprising 716.
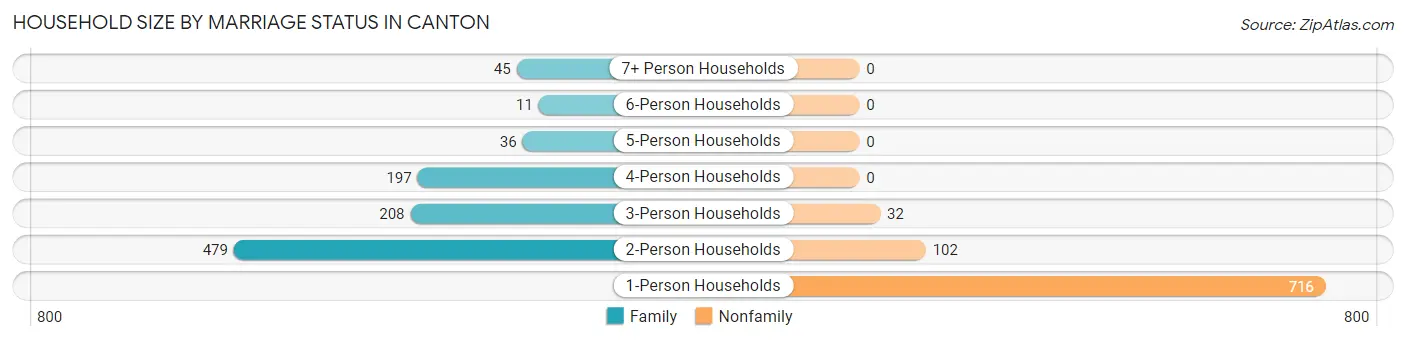
| Household Size | Family Households | Nonfamily Households |
| 1-Person Households | - | 716 (39.2%) |
| 2-Person Households | 479 (26.2%) | 102 (5.6%) |
| 3-Person Households | 208 (11.4%) | 32 (1.8%) |
| 4-Person Households | 197 (10.8%) | 0 (0.0%) |
| 5-Person Households | 36 (2.0%) | 0 (0.0%) |
| 6-Person Households | 11 (0.6%) | 0 (0.0%) |
| 7+ Person Households | 45 (2.5%) | 0 (0.0%) |
| Total | 976 (53.4%) | 850 (46.6%) |
Female Fertility in Canton
Fertility by Age in Canton
Average fertility rate in Canton is 93.0 births per 1,000 women. Women in the age bracket of 20 to 34 years have the highest fertility rate with 170.0 births per 1,000 women. Women in the age bracket of 20 to 34 years acount for 84.2% of all women with births.
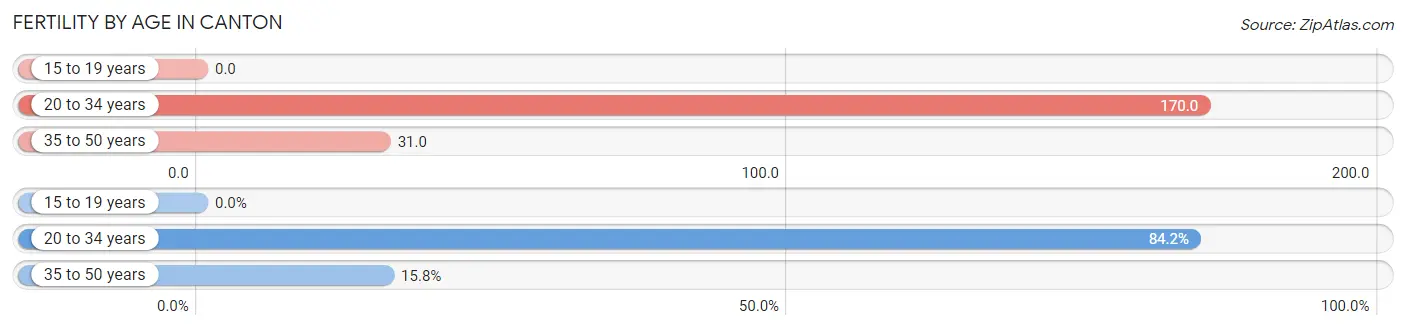
| Age Bracket | Women with Births | Births / 1,000 Women |
| 15 to 19 years | 0 (0.0%) | 0.0 |
| 20 to 34 years | 64 (84.2%) | 170.0 |
| 35 to 50 years | 12 (15.8%) | 31.0 |
| Total | 76 (100.0%) | 93.0 |
Fertility by Age by Marriage Status in Canton
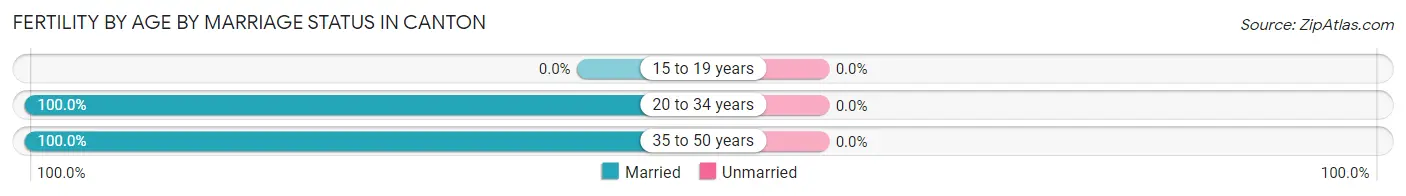
| Age Bracket | Married | Unmarried |
| 15 to 19 years | 0 (0.0%) | 0 (0.0%) |
| 20 to 34 years | 64 (100.0%) | 0 (0.0%) |
| 35 to 50 years | 12 (100.0%) | 0 (0.0%) |
| Total | 76 (100.0%) | 0 (0.0%) |
Fertility by Education in Canton
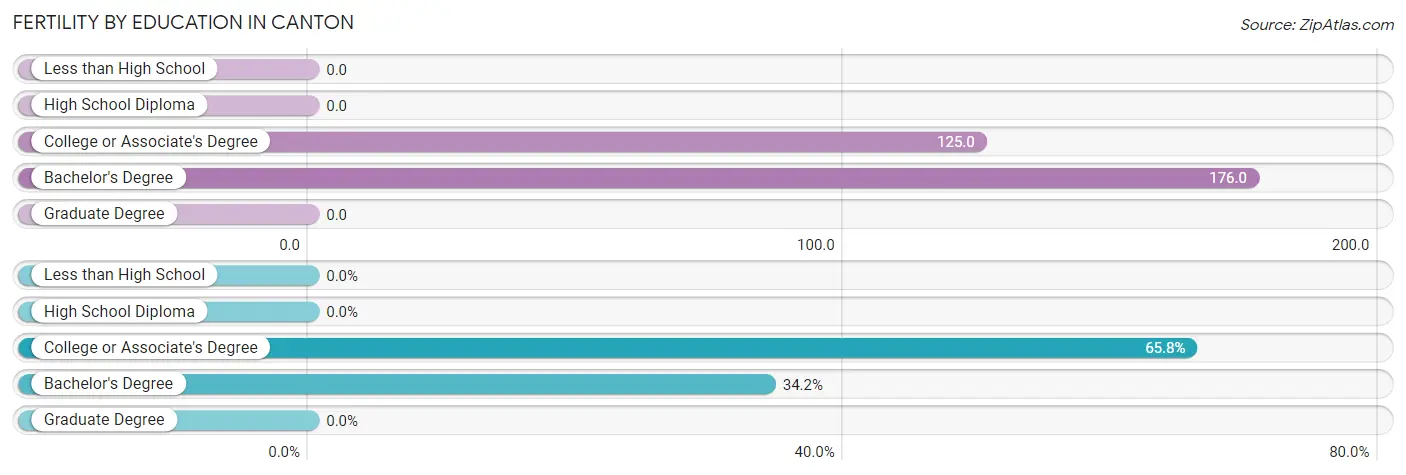
| Educational Attainment | Women with Births | Births / 1,000 Women |
| Less than High School | 0 (0.0%) | 0.0 |
| High School Diploma | 0 (0.0%) | 0.0 |
| College or Associate's Degree | 50 (65.8%) | 125.0 |
| Bachelor's Degree | 26 (34.2%) | 176.0 |
| Graduate Degree | 0 (0.0%) | 0.0 |
| Total | 76 (100.0%) | 93.0 |
Fertility by Education by Marriage Status in Canton
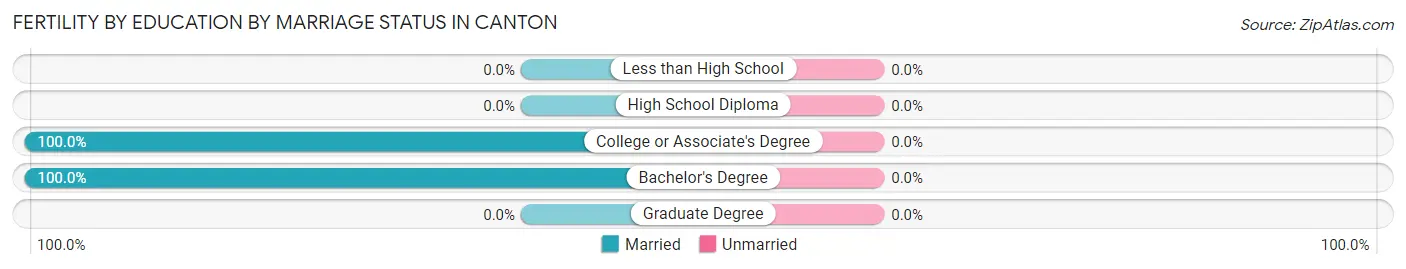
| Educational Attainment | Married | Unmarried |
| Less than High School | 0 (0.0%) | 0 (0.0%) |
| High School Diploma | 0 (0.0%) | 0 (0.0%) |
| College or Associate's Degree | 50 (100.0%) | 0 (0.0%) |
| Bachelor's Degree | 26 (100.0%) | 0 (0.0%) |
| Graduate Degree | 0 (0.0%) | 0 (0.0%) |
| Total | 76 (100.0%) | 0 (0.0%) |
Employment Characteristics in Canton
Employment by Class of Employer in Canton
Among the 1,604 employed individuals in Canton, private company employees (1,153 | 71.9%), local government employees (142 | 8.8%), and self-employed (not incorporated) (136 | 8.5%) make up the most common classes of employment.
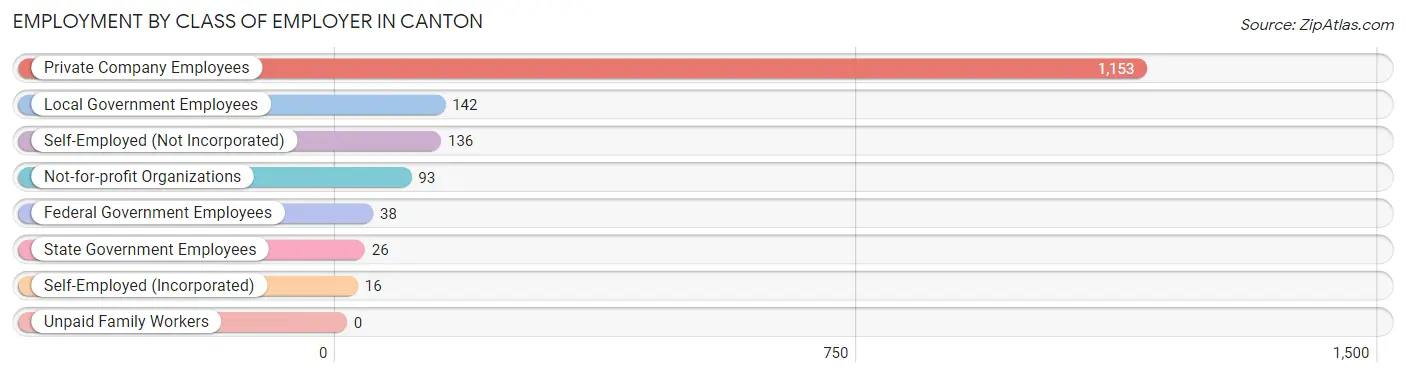
| Employer Class | # Employees | % Employees |
| Private Company Employees | 1,153 | 71.9% |
| Self-Employed (Incorporated) | 16 | 1.0% |
| Self-Employed (Not Incorporated) | 136 | 8.5% |
| Not-for-profit Organizations | 93 | 5.8% |
| Local Government Employees | 142 | 8.8% |
| State Government Employees | 26 | 1.6% |
| Federal Government Employees | 38 | 2.4% |
| Unpaid Family Workers | 0 | 0.0% |
| Total | 1,604 | 100.0% |
Employment Status by Age in Canton
According to the labor force statistics for Canton, out of the total population over 16 years of age (3,432), 50.8% or 1,743 individuals are in the labor force, with 2.6% or 45 of them unemployed. The age group with the highest labor force participation rate is 35 to 44 years, with 80.8% or 379 individuals in the labor force. Within the labor force, the 55 to 59 years age range has the highest percentage of unemployed individuals, with 15.2% or 17 of them being unemployed.
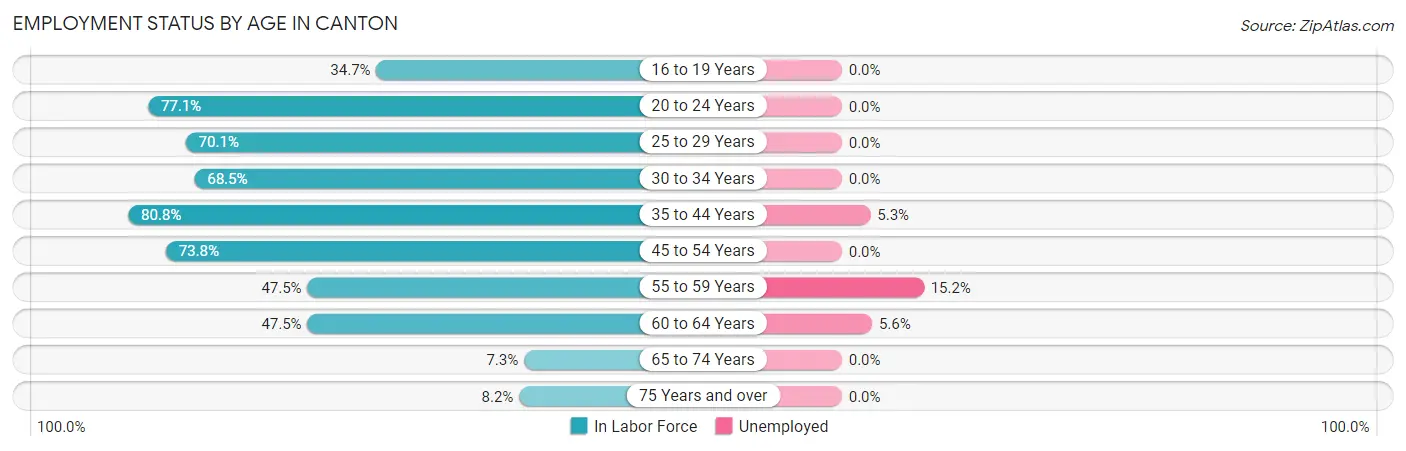
| Age Bracket | In Labor Force | Unemployed |
| 16 to 19 Years | 66 (34.7%) | 0 (0.0%) |
| 20 to 24 Years | 195 (77.1%) | 0 (0.0%) |
| 25 to 29 Years | 253 (70.1%) | 0 (0.0%) |
| 30 to 34 Years | 200 (68.5%) | 0 (0.0%) |
| 35 to 44 Years | 379 (80.8%) | 20 (5.3%) |
| 45 to 54 Years | 307 (73.8%) | 0 (0.0%) |
| 55 to 59 Years | 112 (47.5%) | 17 (15.2%) |
| 60 to 64 Years | 161 (47.5%) | 9 (5.6%) |
| 65 to 74 Years | 25 (7.3%) | 0 (0.0%) |
| 75 Years and over | 44 (8.2%) | 0 (0.0%) |
| Total | 1,743 (50.8%) | 45 (2.6%) |
Employment Status by Educational Attainment in Canton
According to labor force statistics for Canton, 66.8% of individuals (1,411) out of the total population between 25 and 64 years of age (2,113) are in the labor force, with 3.3% or 47 of them being unemployed. The group with the highest labor force participation rate are those with the educational attainment of college / associate degree, with 79.8% or 712 individuals in the labor force. Within the labor force, individuals with college / associate degree education have the highest percentage of unemployment, with 3.9% or 28 of them being unemployed.
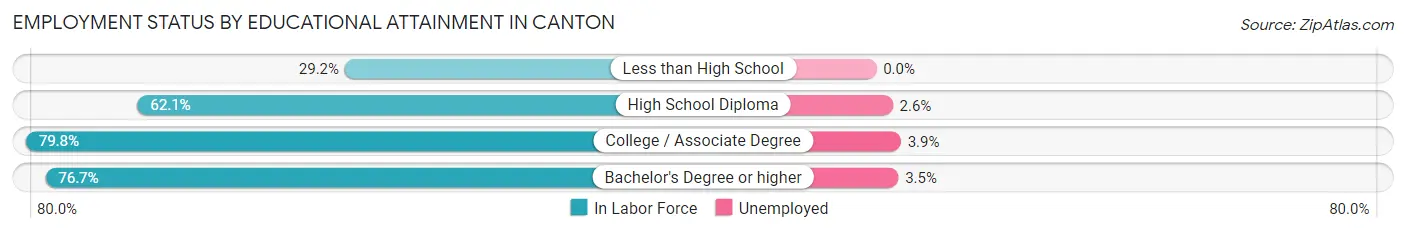
| Educational Attainment | In Labor Force | Unemployed |
| Less than High School | 95 (29.2%) | 0 (0.0%) |
| High School Diploma | 351 (62.1%) | 15 (2.6%) |
| College / Associate Degree | 712 (79.8%) | 35 (3.9%) |
| Bachelor's Degree or higher | 254 (76.7%) | 12 (3.5%) |
| Total | 1,411 (66.8%) | 70 (3.3%) |
Employment Occupations by Sex in Canton
Management, Business, Science and Arts Occupations
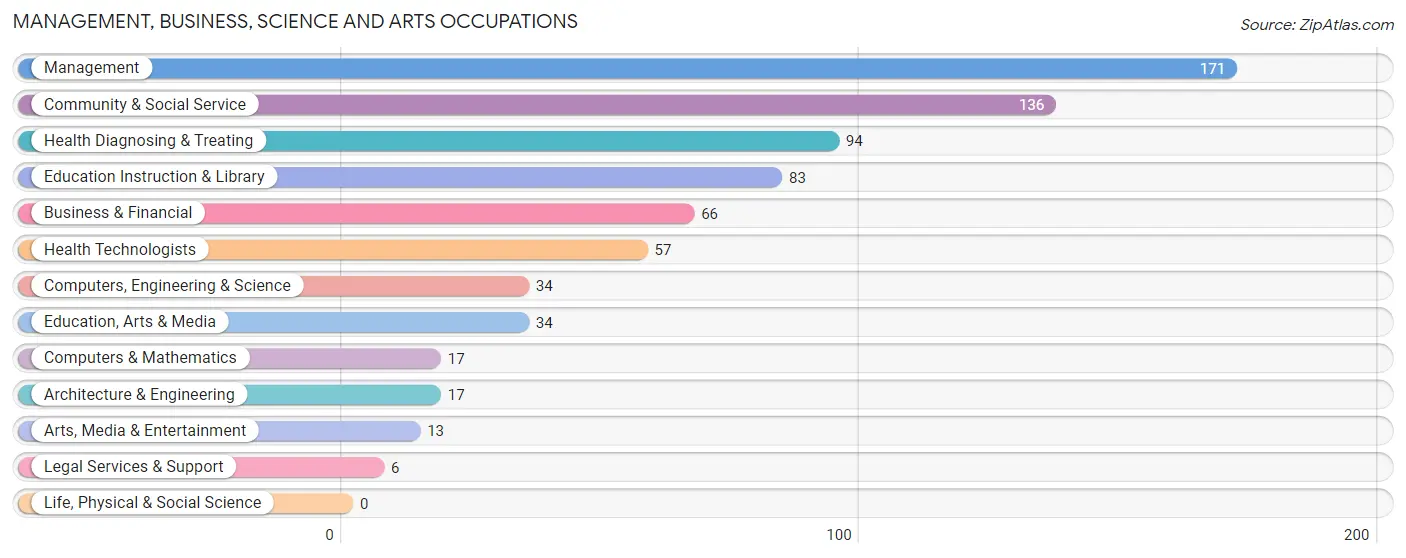
The most common Management, Business, Science and Arts occupations in Canton are Management (171 | 10.1%), Community & Social Service (136 | 8.0%), Health Diagnosing & Treating (94 | 5.5%), Education Instruction & Library (83 | 4.9%), and Business & Financial (66 | 3.9%).
Management, Business, Science and Arts Occupations by Sex
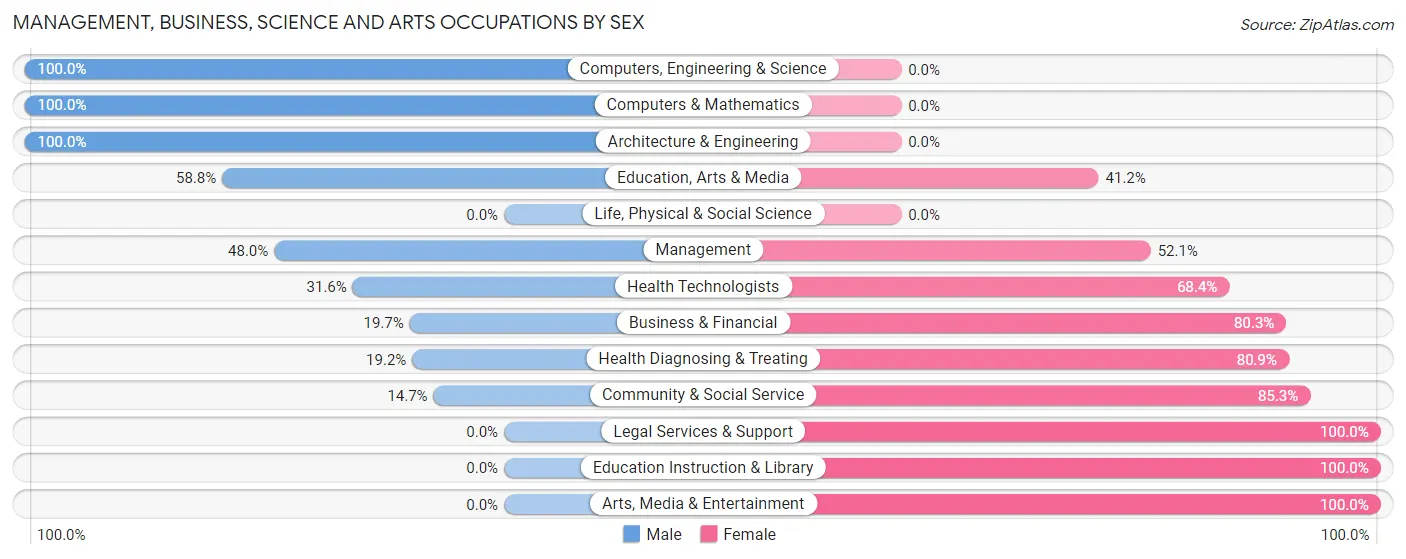
Within the Management, Business, Science and Arts occupations in Canton, the most male-oriented occupations are Computers, Engineering & Science (100.0%), Computers & Mathematics (100.0%), and Architecture & Engineering (100.0%), while the most female-oriented occupations are Legal Services & Support (100.0%), Education Instruction & Library (100.0%), and Arts, Media & Entertainment (100.0%).
| Occupation | Male | Female |
| Management | 82 (47.9%) | 89 (52.0%) |
| Business & Financial | 13 (19.7%) | 53 (80.3%) |
| Computers, Engineering & Science | 34 (100.0%) | 0 (0.0%) |
| Computers & Mathematics | 17 (100.0%) | 0 (0.0%) |
| Architecture & Engineering | 17 (100.0%) | 0 (0.0%) |
| Life, Physical & Social Science | 0 (0.0%) | 0 (0.0%) |
| Community & Social Service | 20 (14.7%) | 116 (85.3%) |
| Education, Arts & Media | 20 (58.8%) | 14 (41.2%) |
| Legal Services & Support | 0 (0.0%) | 6 (100.0%) |
| Education Instruction & Library | 0 (0.0%) | 83 (100.0%) |
| Arts, Media & Entertainment | 0 (0.0%) | 13 (100.0%) |
| Health Diagnosing & Treating | 18 (19.2%) | 76 (80.8%) |
| Health Technologists | 18 (31.6%) | 39 (68.4%) |
| Total (Category) | 167 (33.3%) | 334 (66.7%) |
| Total (Overall) | 867 (51.1%) | 829 (48.9%) |
Services Occupations
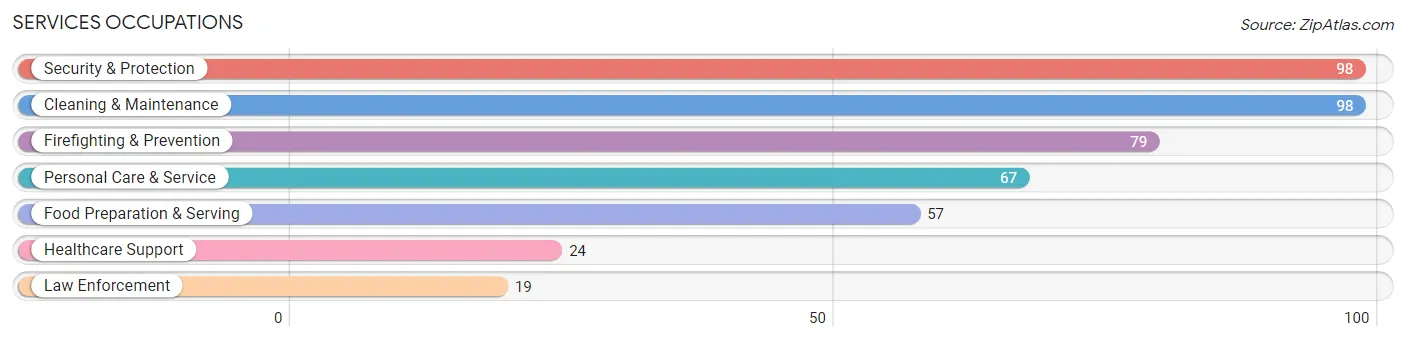
The most common Services occupations in Canton are Security & Protection (98 | 5.8%), Cleaning & Maintenance (98 | 5.8%), Firefighting & Prevention (79 | 4.7%), Personal Care & Service (67 | 4.0%), and Food Preparation & Serving (57 | 3.4%).
Services Occupations by Sex
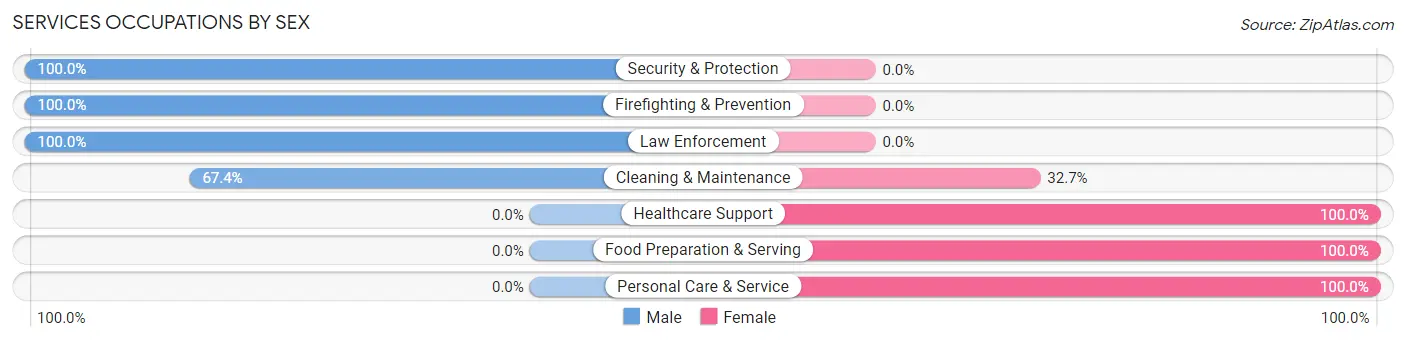
Within the Services occupations in Canton, the most male-oriented occupations are Security & Protection (100.0%), Firefighting & Prevention (100.0%), and Law Enforcement (100.0%), while the most female-oriented occupations are Healthcare Support (100.0%), Food Preparation & Serving (100.0%), and Personal Care & Service (100.0%).
| Occupation | Male | Female |
| Healthcare Support | 0 (0.0%) | 24 (100.0%) |
| Security & Protection | 98 (100.0%) | 0 (0.0%) |
| Firefighting & Prevention | 79 (100.0%) | 0 (0.0%) |
| Law Enforcement | 19 (100.0%) | 0 (0.0%) |
| Food Preparation & Serving | 0 (0.0%) | 57 (100.0%) |
| Cleaning & Maintenance | 66 (67.3%) | 32 (32.7%) |
| Personal Care & Service | 0 (0.0%) | 67 (100.0%) |
| Total (Category) | 164 (47.7%) | 180 (52.3%) |
| Total (Overall) | 867 (51.1%) | 829 (48.9%) |
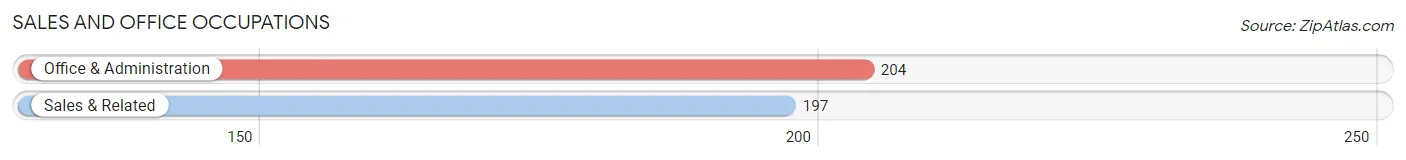
Sales and Office Occupations
The most common Sales and Office occupations in Canton are Office & Administration (204 | 12.0%), and Sales & Related (197 | 11.6%).
Sales and Office Occupations by Sex
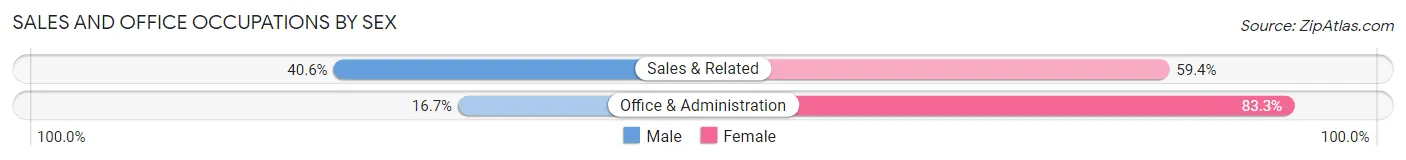
| Occupation | Male | Female |
| Sales & Related | 80 (40.6%) | 117 (59.4%) |
| Office & Administration | 34 (16.7%) | 170 (83.3%) |
| Total (Category) | 114 (28.4%) | 287 (71.6%) |
| Total (Overall) | 867 (51.1%) | 829 (48.9%) |
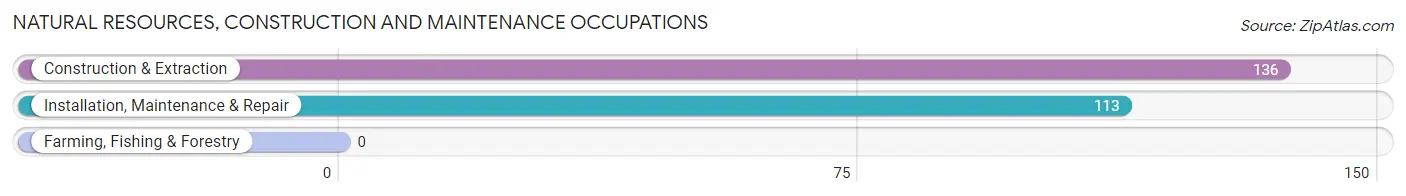
Natural Resources, Construction and Maintenance Occupations
The most common Natural Resources, Construction and Maintenance occupations in Canton are Construction & Extraction (136 | 8.0%), and Installation, Maintenance & Repair (113 | 6.7%).
Natural Resources, Construction and Maintenance Occupations by Sex
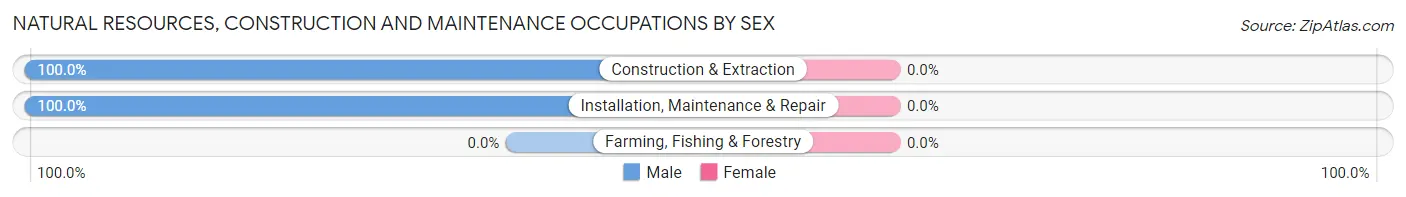
| Occupation | Male | Female |
| Farming, Fishing & Forestry | 0 (0.0%) | 0 (0.0%) |
| Construction & Extraction | 136 (100.0%) | 0 (0.0%) |
| Installation, Maintenance & Repair | 113 (100.0%) | 0 (0.0%) |
| Total (Category) | 249 (100.0%) | 0 (0.0%) |
| Total (Overall) | 867 (51.1%) | 829 (48.9%) |
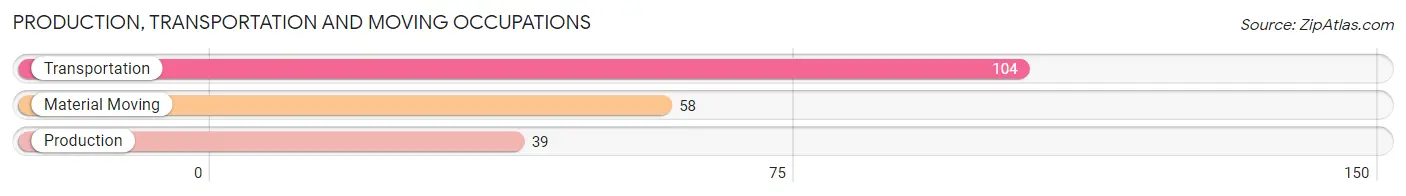
Production, Transportation and Moving Occupations
The most common Production, Transportation and Moving occupations in Canton are Transportation (104 | 6.1%), Material Moving (58 | 3.4%), and Production (39 | 2.3%).
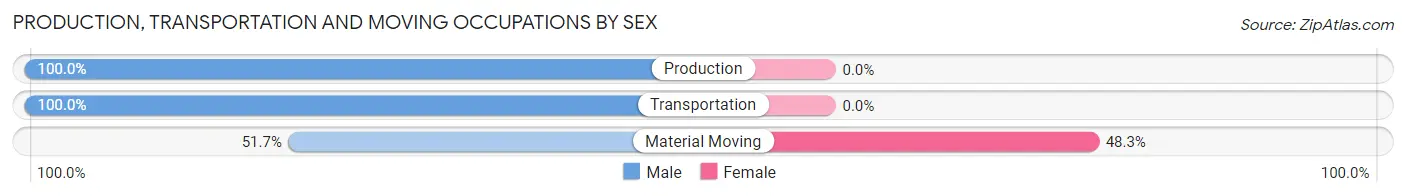
Production, Transportation and Moving Occupations by Sex
| Occupation | Male | Female |
| Production | 39 (100.0%) | 0 (0.0%) |
| Transportation | 104 (100.0%) | 0 (0.0%) |
| Material Moving | 30 (51.7%) | 28 (48.3%) |
| Total (Category) | 173 (86.1%) | 28 (13.9%) |
| Total (Overall) | 867 (51.1%) | 829 (48.9%) |
Employment Industries by Sex in Canton
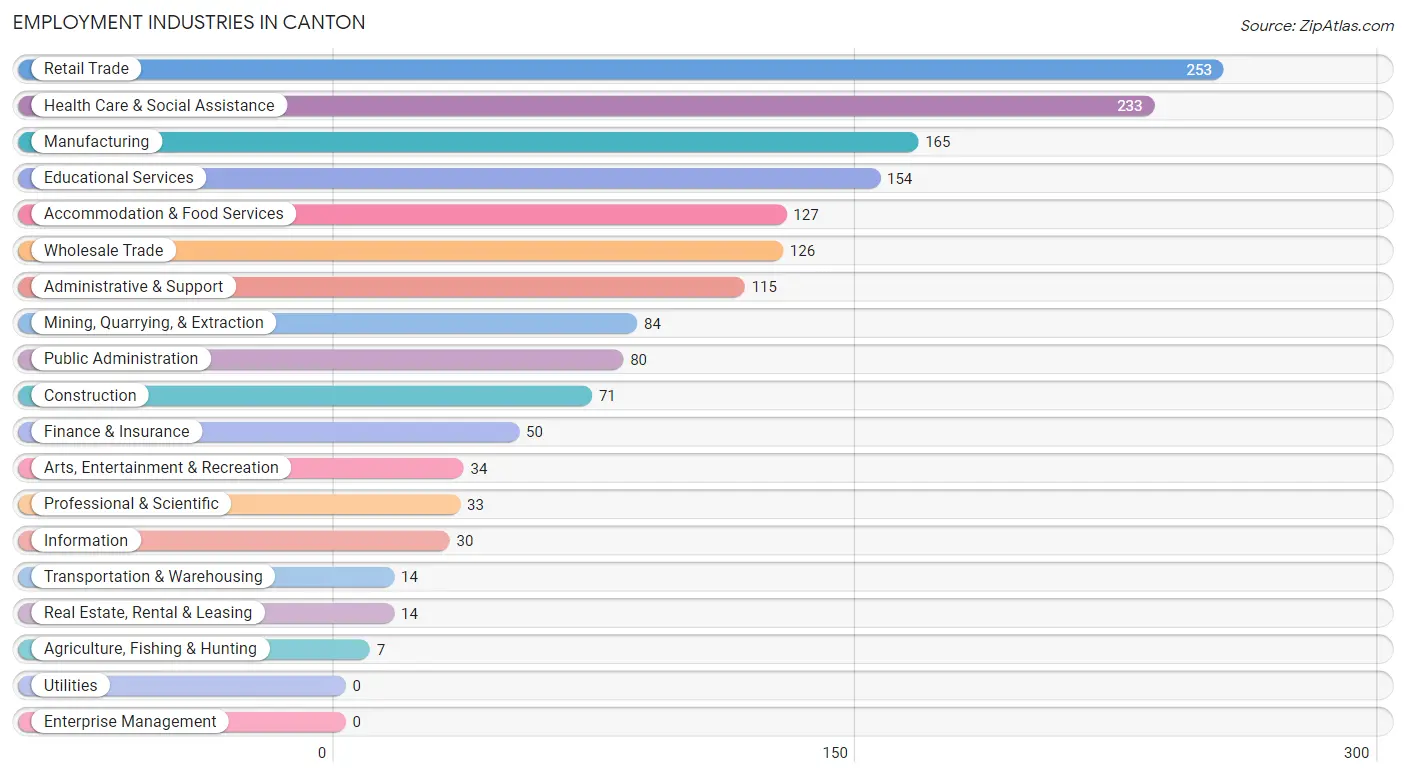
Employment Industries in Canton
The major employment industries in Canton include Retail Trade (253 | 14.9%), Health Care & Social Assistance (233 | 13.7%), Manufacturing (165 | 9.7%), Educational Services (154 | 9.1%), and Accommodation & Food Services (127 | 7.5%).
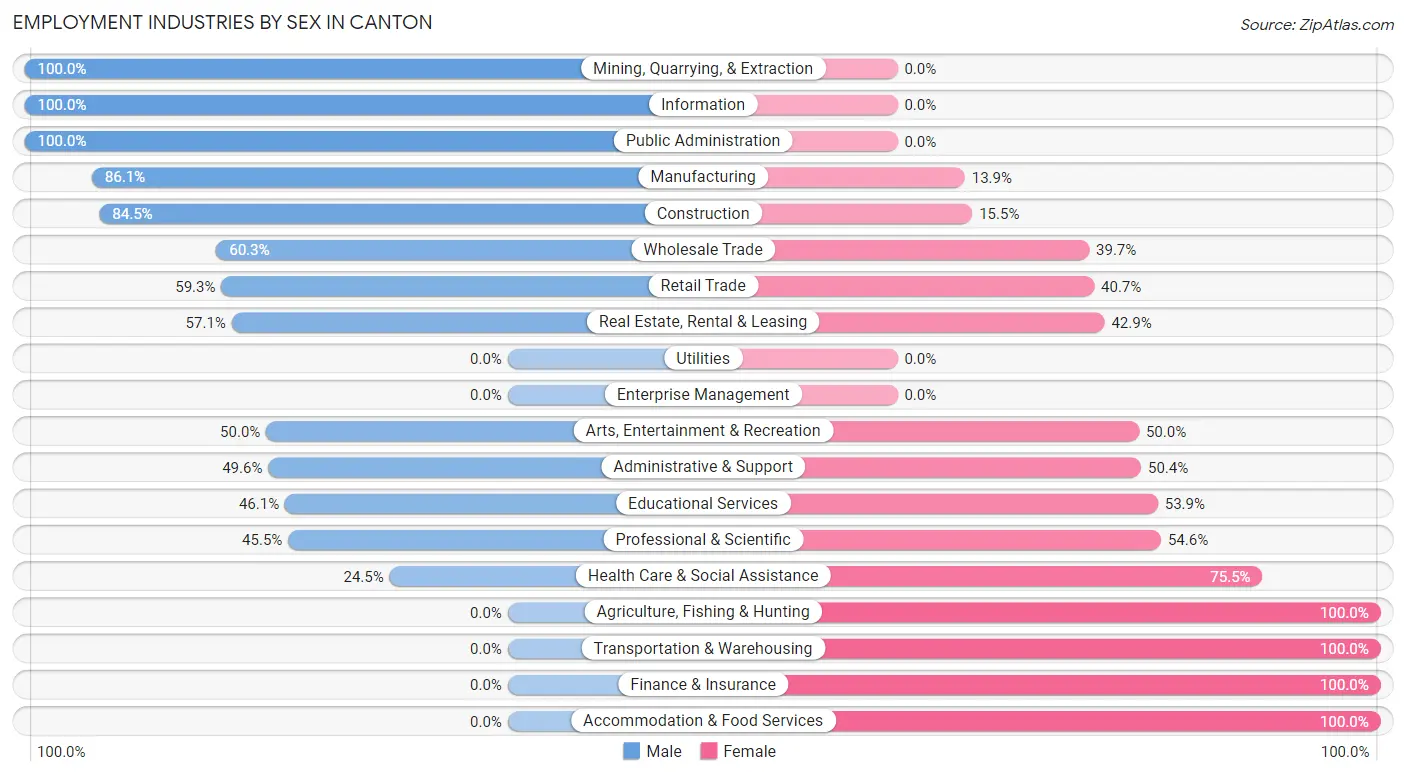
Employment Industries by Sex in Canton
The Canton industries that see more men than women are Mining, Quarrying, & Extraction (100.0%), Information (100.0%), and Public Administration (100.0%), whereas the industries that tend to have a higher number of women are Agriculture, Fishing & Hunting (100.0%), Transportation & Warehousing (100.0%), and Finance & Insurance (100.0%).
| Industry | Male | Female |
| Agriculture, Fishing & Hunting | 0 (0.0%) | 7 (100.0%) |
| Mining, Quarrying, & Extraction | 84 (100.0%) | 0 (0.0%) |
| Construction | 60 (84.5%) | 11 (15.5%) |
| Manufacturing | 142 (86.1%) | 23 (13.9%) |
| Wholesale Trade | 76 (60.3%) | 50 (39.7%) |
| Retail Trade | 150 (59.3%) | 103 (40.7%) |
| Transportation & Warehousing | 0 (0.0%) | 14 (100.0%) |
| Utilities | 0 (0.0%) | 0 (0.0%) |
| Information | 30 (100.0%) | 0 (0.0%) |
| Finance & Insurance | 0 (0.0%) | 50 (100.0%) |
| Real Estate, Rental & Leasing | 8 (57.1%) | 6 (42.9%) |
| Professional & Scientific | 15 (45.5%) | 18 (54.5%) |
| Enterprise Management | 0 (0.0%) | 0 (0.0%) |
| Administrative & Support | 57 (49.6%) | 58 (50.4%) |
| Educational Services | 71 (46.1%) | 83 (53.9%) |
| Health Care & Social Assistance | 57 (24.5%) | 176 (75.5%) |
| Arts, Entertainment & Recreation | 17 (50.0%) | 17 (50.0%) |
| Accommodation & Food Services | 0 (0.0%) | 127 (100.0%) |
| Public Administration | 80 (100.0%) | 0 (0.0%) |
| Total | 867 (51.1%) | 829 (48.9%) |
Education in Canton
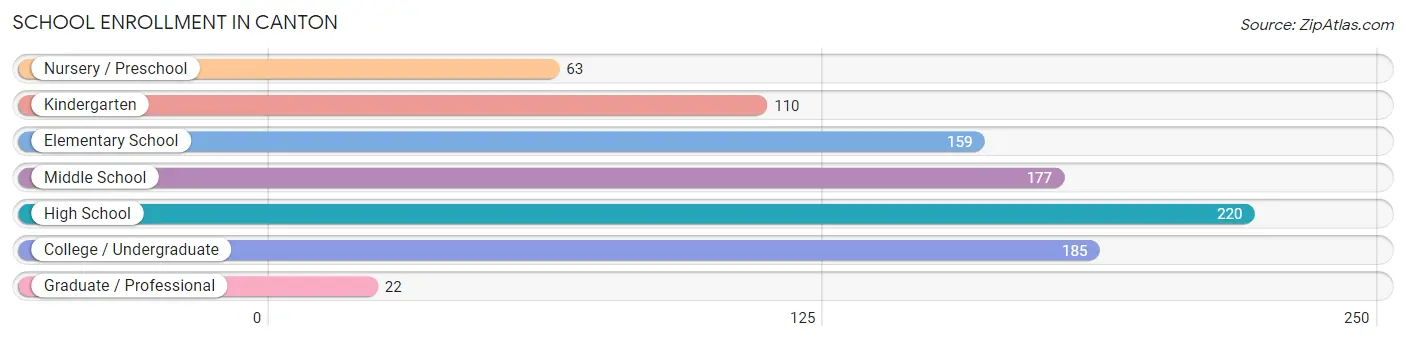
School Enrollment in Canton
The most common levels of schooling among the 936 students in Canton are high school (220 | 23.5%), college / undergraduate (185 | 19.8%), and middle school (177 | 18.9%).
| School Level | # Students | % Students |
| Nursery / Preschool | 63 | 6.7% |
| Kindergarten | 110 | 11.7% |
| Elementary School | 159 | 17.0% |
| Middle School | 177 | 18.9% |
| High School | 220 | 23.5% |
| College / Undergraduate | 185 | 19.8% |
| Graduate / Professional | 22 | 2.4% |
| Total | 936 | 100.0% |
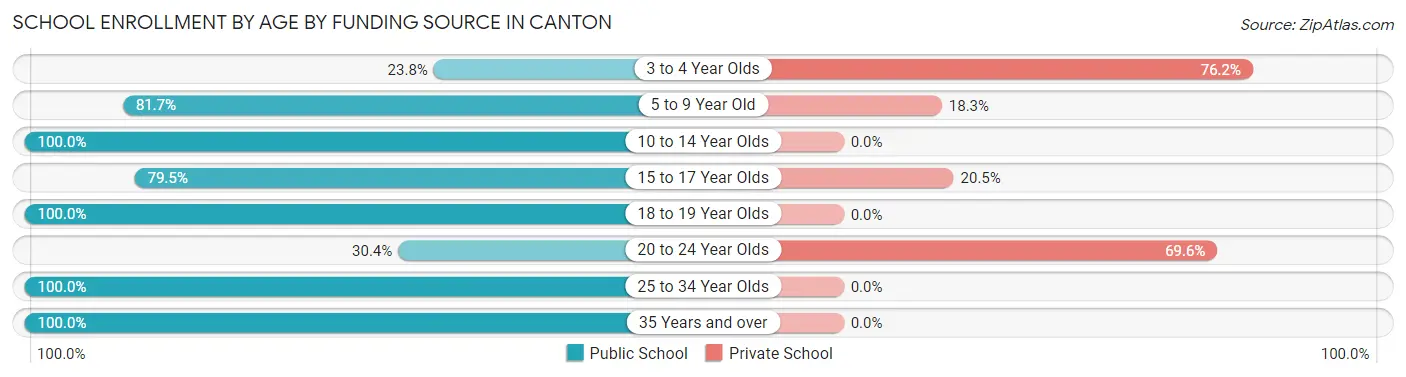
School Enrollment by Age by Funding Source in Canton
Out of a total of 936 students who are enrolled in schools in Canton, 176 (18.8%) attend a private institution, while the remaining 760 (81.2%) are enrolled in public schools. The age group of 3 to 4 year olds has the highest likelihood of being enrolled in private schools, with 48 (76.2% in the age bracket) enrolled. Conversely, the age group of 10 to 14 year olds has the lowest likelihood of being enrolled in a private school, with 212 (100.0% in the age bracket) attending a public institution.
| Age Bracket | Public School | Private School |
| 3 to 4 Year Olds | 15 (23.8%) | 48 (76.2%) |
| 5 to 9 Year Old | 210 (81.7%) | 47 (18.3%) |
| 10 to 14 Year Olds | 212 (100.0%) | 0 (0.0%) |
| 15 to 17 Year Olds | 66 (79.5%) | 17 (20.5%) |
| 18 to 19 Year Olds | 128 (100.0%) | 0 (0.0%) |
| 20 to 24 Year Olds | 28 (30.4%) | 64 (69.6%) |
| 25 to 34 Year Olds | 79 (100.0%) | 0 (0.0%) |
| 35 Years and over | 22 (100.0%) | 0 (0.0%) |
| Total | 760 (81.2%) | 176 (18.8%) |
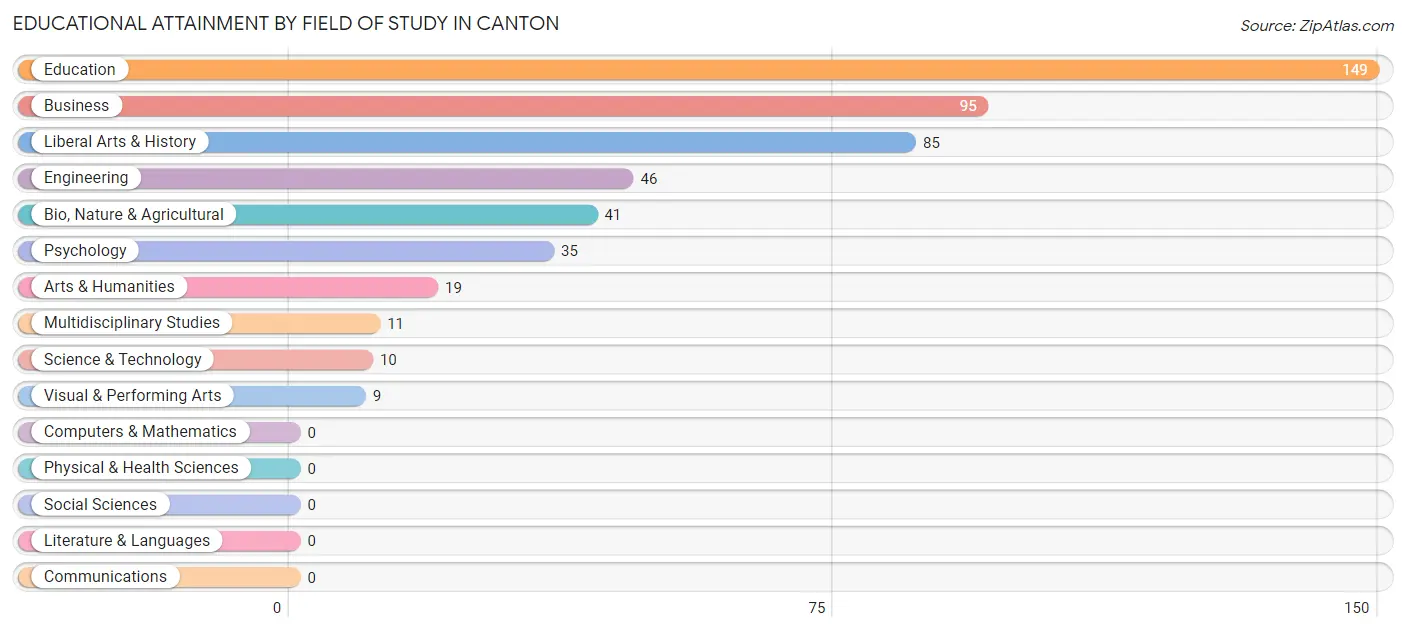
Educational Attainment by Field of Study in Canton
Education (149 | 29.8%), business (95 | 19.0%), liberal arts & history (85 | 17.0%), engineering (46 | 9.2%), and bio, nature & agricultural (41 | 8.2%) are the most common fields of study among 500 individuals in Canton who have obtained a bachelor's degree or higher.
| Field of Study | # Graduates | % Graduates |
| Computers & Mathematics | 0 | 0.0% |
| Bio, Nature & Agricultural | 41 | 8.2% |
| Physical & Health Sciences | 0 | 0.0% |
| Psychology | 35 | 7.0% |
| Social Sciences | 0 | 0.0% |
| Engineering | 46 | 9.2% |
| Multidisciplinary Studies | 11 | 2.2% |
| Science & Technology | 10 | 2.0% |
| Business | 95 | 19.0% |
| Education | 149 | 29.8% |
| Literature & Languages | 0 | 0.0% |
| Liberal Arts & History | 85 | 17.0% |
| Visual & Performing Arts | 9 | 1.8% |
| Communications | 0 | 0.0% |
| Arts & Humanities | 19 | 3.8% |
| Total | 500 | 100.0% |
Transportation & Commute in Canton
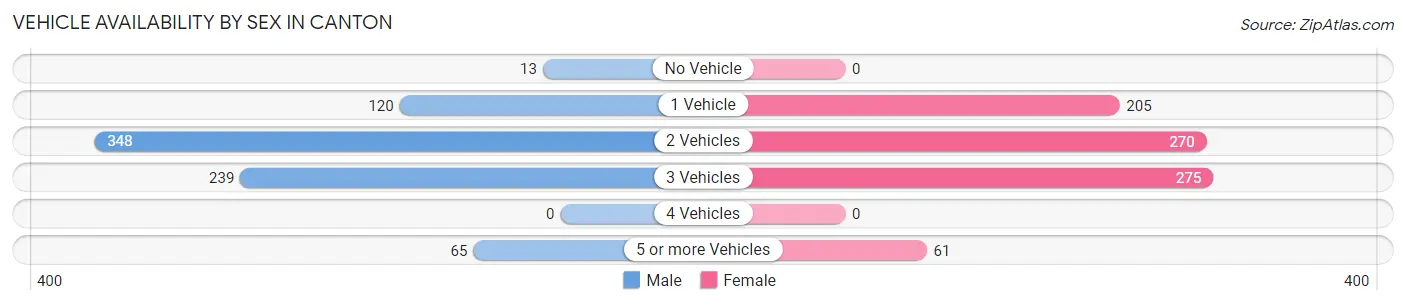
Vehicle Availability by Sex in Canton
The most prevalent vehicle ownership categories in Canton are males with 2 vehicles (348, accounting for 44.3%) and females with 2 vehicles (270, making up 42.9%).
| Vehicles Available | Male | Female |
| No Vehicle | 13 (1.7%) | 0 (0.0%) |
| 1 Vehicle | 120 (15.3%) | 205 (25.3%) |
| 2 Vehicles | 348 (44.3%) | 270 (33.3%) |
| 3 Vehicles | 239 (30.4%) | 275 (33.9%) |
| 4 Vehicles | 0 (0.0%) | 0 (0.0%) |
| 5 or more Vehicles | 65 (8.3%) | 61 (7.5%) |
| Total | 785 (100.0%) | 811 (100.0%) |
Commute Time in Canton
The most frequently occuring commute durations in Canton are 30 to 34 minutes (302 commuters, 20.3%), 60 to 89 minutes (232 commuters, 15.6%), and 15 to 19 minutes (145 commuters, 9.8%).
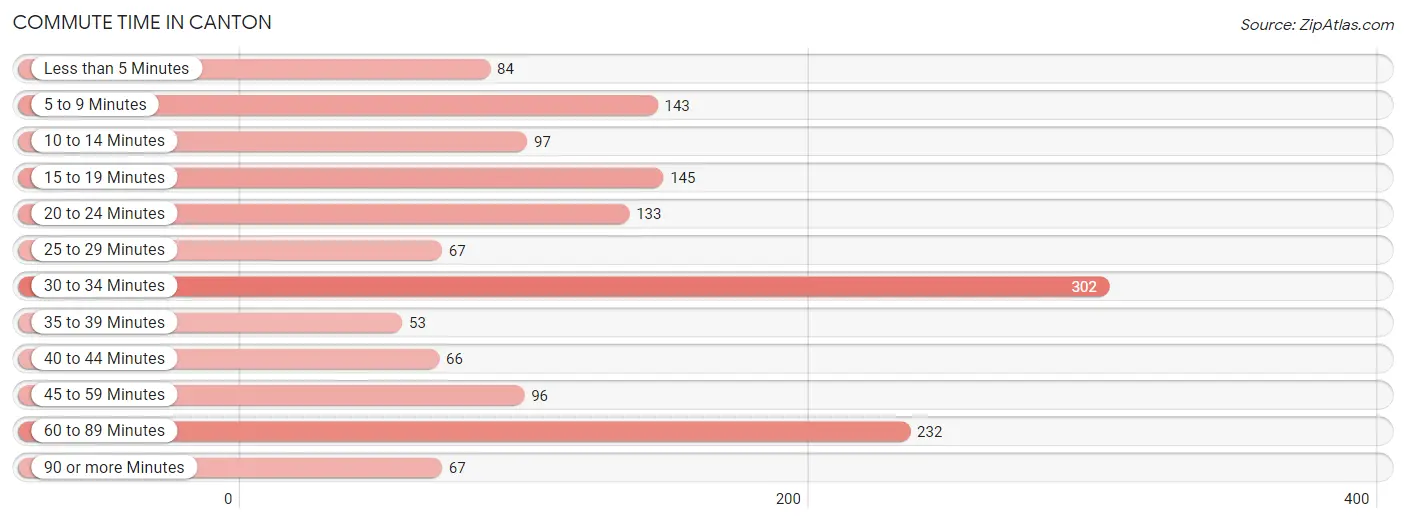
| Commute Time | # Commuters | % Commuters |
| Less than 5 Minutes | 84 | 5.7% |
| 5 to 9 Minutes | 143 | 9.6% |
| 10 to 14 Minutes | 97 | 6.5% |
| 15 to 19 Minutes | 145 | 9.8% |
| 20 to 24 Minutes | 133 | 9.0% |
| 25 to 29 Minutes | 67 | 4.5% |
| 30 to 34 Minutes | 302 | 20.3% |
| 35 to 39 Minutes | 53 | 3.6% |
| 40 to 44 Minutes | 66 | 4.4% |
| 45 to 59 Minutes | 96 | 6.5% |
| 60 to 89 Minutes | 232 | 15.6% |
| 90 or more Minutes | 67 | 4.5% |
Commute Time by Sex in Canton
The most common commute times in Canton are 30 to 34 minutes (203 commuters, 26.0%) for males and 15 to 19 minutes (119 commuters, 16.9%) for females.
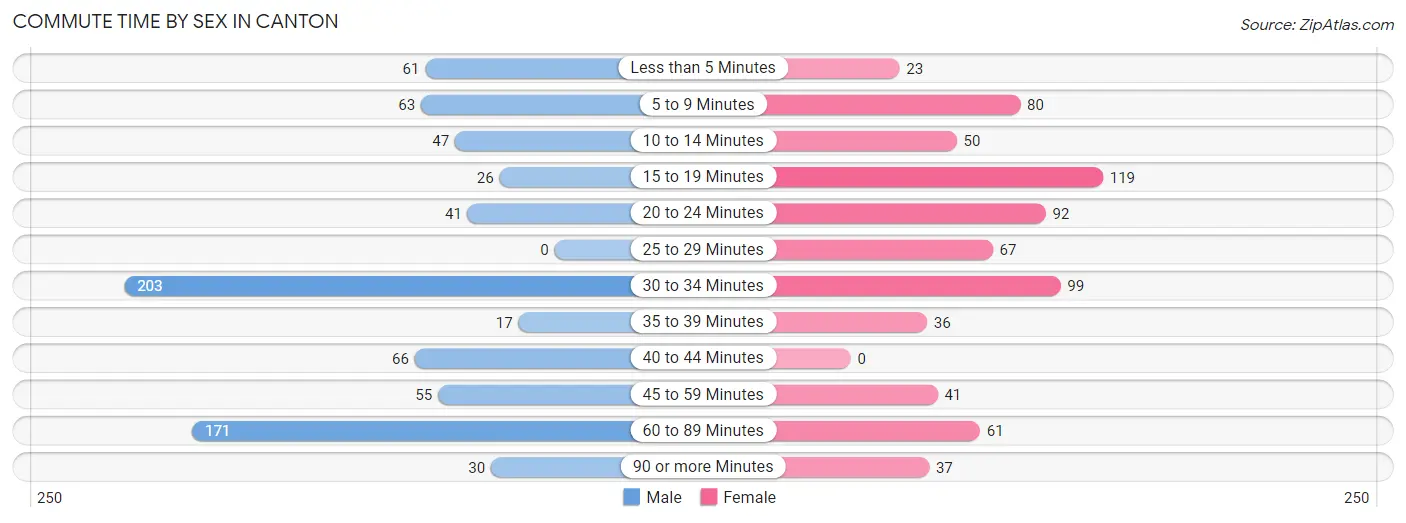
| Commute Time | Male | Female |
| Less than 5 Minutes | 61 (7.8%) | 23 (3.3%) |
| 5 to 9 Minutes | 63 (8.1%) | 80 (11.4%) |
| 10 to 14 Minutes | 47 (6.0%) | 50 (7.1%) |
| 15 to 19 Minutes | 26 (3.3%) | 119 (16.9%) |
| 20 to 24 Minutes | 41 (5.3%) | 92 (13.1%) |
| 25 to 29 Minutes | 0 (0.0%) | 67 (9.5%) |
| 30 to 34 Minutes | 203 (26.0%) | 99 (14.0%) |
| 35 to 39 Minutes | 17 (2.2%) | 36 (5.1%) |
| 40 to 44 Minutes | 66 (8.5%) | 0 (0.0%) |
| 45 to 59 Minutes | 55 (7.0%) | 41 (5.8%) |
| 60 to 89 Minutes | 171 (21.9%) | 61 (8.6%) |
| 90 or more Minutes | 30 (3.8%) | 37 (5.2%) |
Time of Departure to Work by Sex in Canton
The most frequent times of departure to work in Canton are 12:00 AM to 4:59 AM (212, 27.2%) for males and 7:30 AM to 7:59 AM (157, 22.3%) for females.
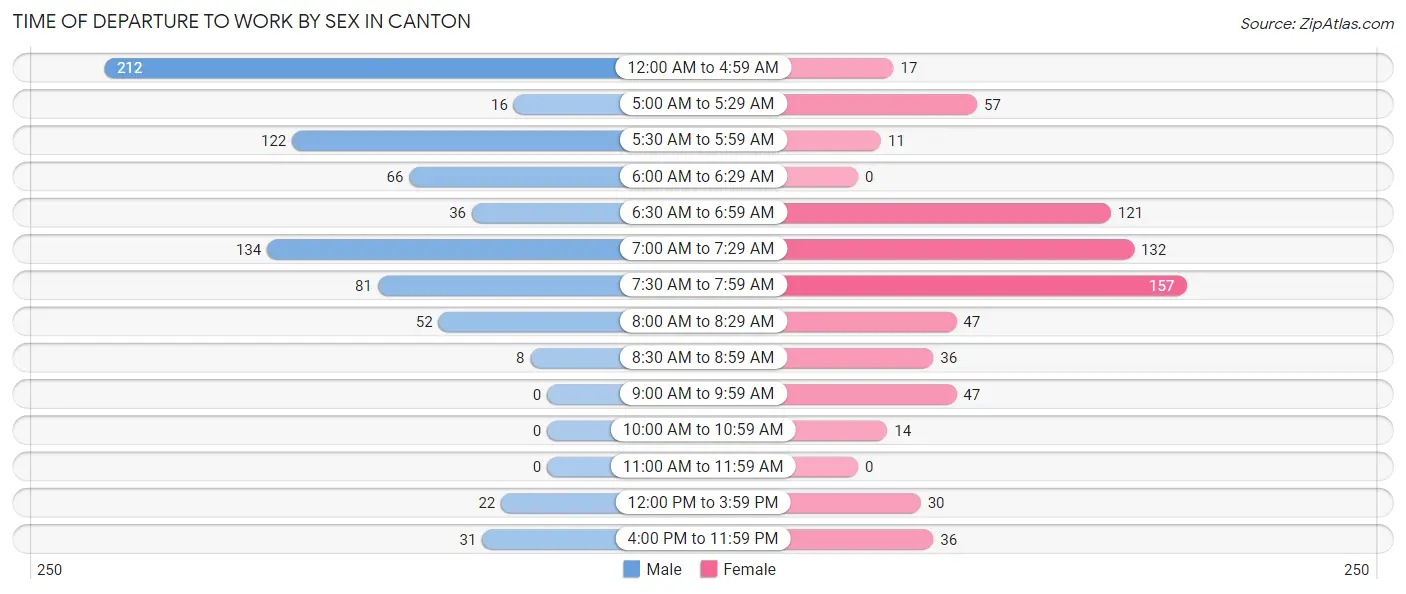
| Time of Departure | Male | Female |
| 12:00 AM to 4:59 AM | 212 (27.2%) | 17 (2.4%) |
| 5:00 AM to 5:29 AM | 16 (2.1%) | 57 (8.1%) |
| 5:30 AM to 5:59 AM | 122 (15.6%) | 11 (1.6%) |
| 6:00 AM to 6:29 AM | 66 (8.5%) | 0 (0.0%) |
| 6:30 AM to 6:59 AM | 36 (4.6%) | 121 (17.2%) |
| 7:00 AM to 7:29 AM | 134 (17.2%) | 132 (18.7%) |
| 7:30 AM to 7:59 AM | 81 (10.4%) | 157 (22.3%) |
| 8:00 AM to 8:29 AM | 52 (6.7%) | 47 (6.7%) |
| 8:30 AM to 8:59 AM | 8 (1.0%) | 36 (5.1%) |
| 9:00 AM to 9:59 AM | 0 (0.0%) | 47 (6.7%) |
| 10:00 AM to 10:59 AM | 0 (0.0%) | 14 (2.0%) |
| 11:00 AM to 11:59 AM | 0 (0.0%) | 0 (0.0%) |
| 12:00 PM to 3:59 PM | 22 (2.8%) | 30 (4.3%) |
| 4:00 PM to 11:59 PM | 31 (4.0%) | 36 (5.1%) |
| Total | 780 (100.0%) | 705 (100.0%) |
Housing Occupancy in Canton
Occupancy by Ownership in Canton
Of the total 1,826 dwellings in Canton, owner-occupied units account for 1,158 (63.4%), while renter-occupied units make up 668 (36.6%).
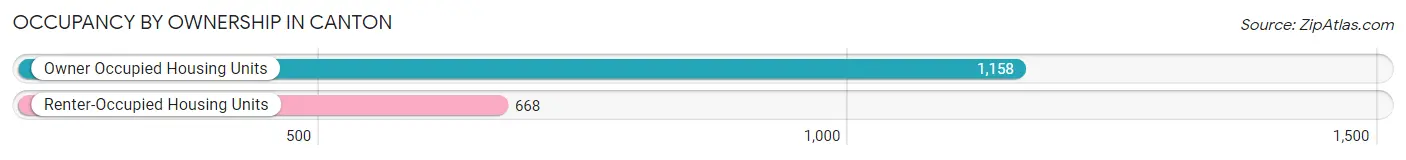
| Occupancy | # Housing Units | % Housing Units |
| Owner Occupied Housing Units | 1,158 | 63.4% |
| Renter-Occupied Housing Units | 668 | 36.6% |
| Total Occupied Housing Units | 1,826 | 100.0% |
Occupancy by Household Size in Canton
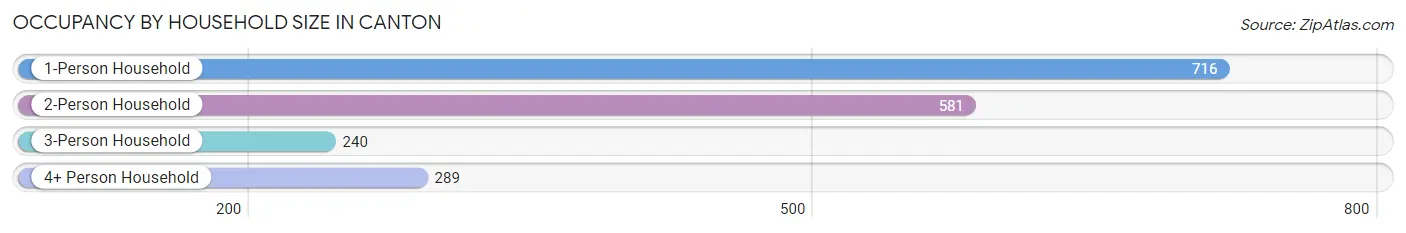
| Household Size | # Housing Units | % Housing Units |
| 1-Person Household | 716 | 39.2% |
| 2-Person Household | 581 | 31.8% |
| 3-Person Household | 240 | 13.1% |
| 4+ Person Household | 289 | 15.8% |
| Total Housing Units | 1,826 | 100.0% |
Occupancy by Ownership by Household Size in Canton
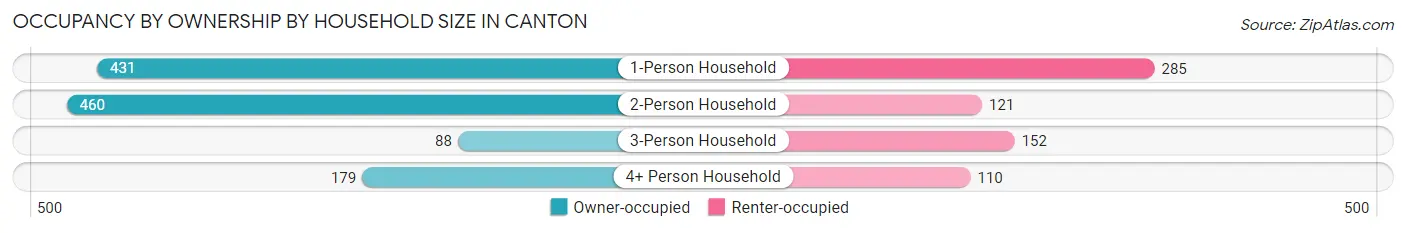
| Household Size | Owner-occupied | Renter-occupied |
| 1-Person Household | 431 (60.2%) | 285 (39.8%) |
| 2-Person Household | 460 (79.2%) | 121 (20.8%) |
| 3-Person Household | 88 (36.7%) | 152 (63.3%) |
| 4+ Person Household | 179 (61.9%) | 110 (38.1%) |
| Total Housing Units | 1,158 (63.4%) | 668 (36.6%) |
Occupancy by Educational Attainment in Canton
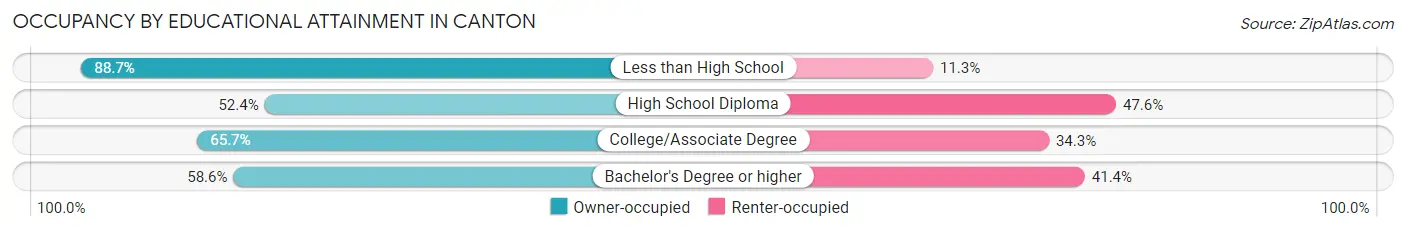
| Household Size | Owner-occupied | Renter-occupied |
| Less than High School | 189 (88.7%) | 24 (11.3%) |
| High School Diploma | 279 (52.4%) | 253 (47.6%) |
| College/Associate Degree | 520 (65.7%) | 271 (34.3%) |
| Bachelor's Degree or higher | 170 (58.6%) | 120 (41.4%) |
Occupancy by Age of Householder in Canton
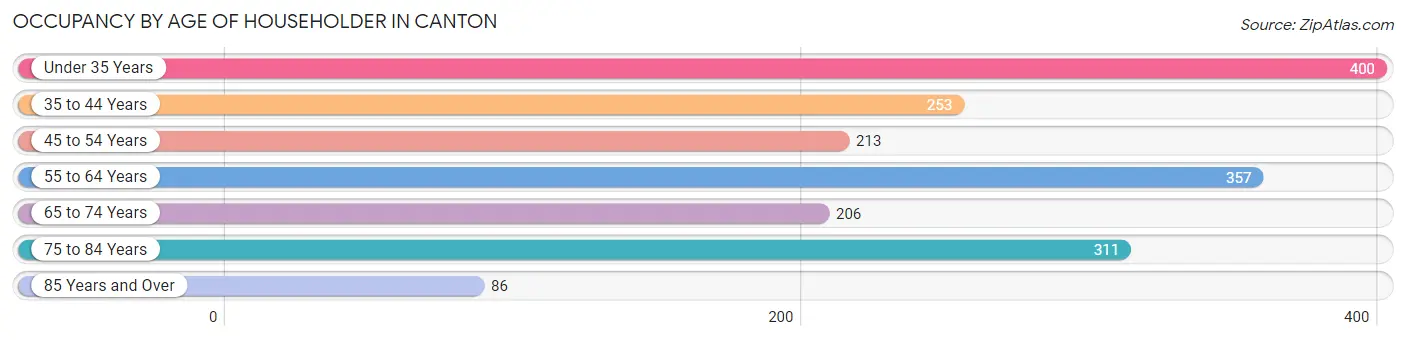
| Age Bracket | # Households | % Households |
| Under 35 Years | 400 | 21.9% |
| 35 to 44 Years | 253 | 13.9% |
| 45 to 54 Years | 213 | 11.7% |
| 55 to 64 Years | 357 | 19.6% |
| 65 to 74 Years | 206 | 11.3% |
| 75 to 84 Years | 311 | 17.0% |
| 85 Years and Over | 86 | 4.7% |
| Total | 1,826 | 100.0% |
Housing Finances in Canton
Median Income by Occupancy in Canton
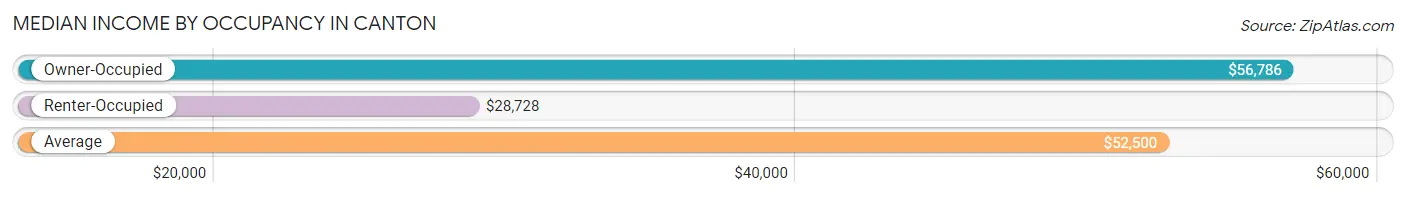
| Occupancy Type | # Households | Median Income |
| Owner-Occupied | 1,158 (63.4%) | $56,786 |
| Renter-Occupied | 668 (36.6%) | $28,728 |
| Average | 1,826 (100.0%) | $52,500 |
Occupancy by Householder Income Bracket in Canton
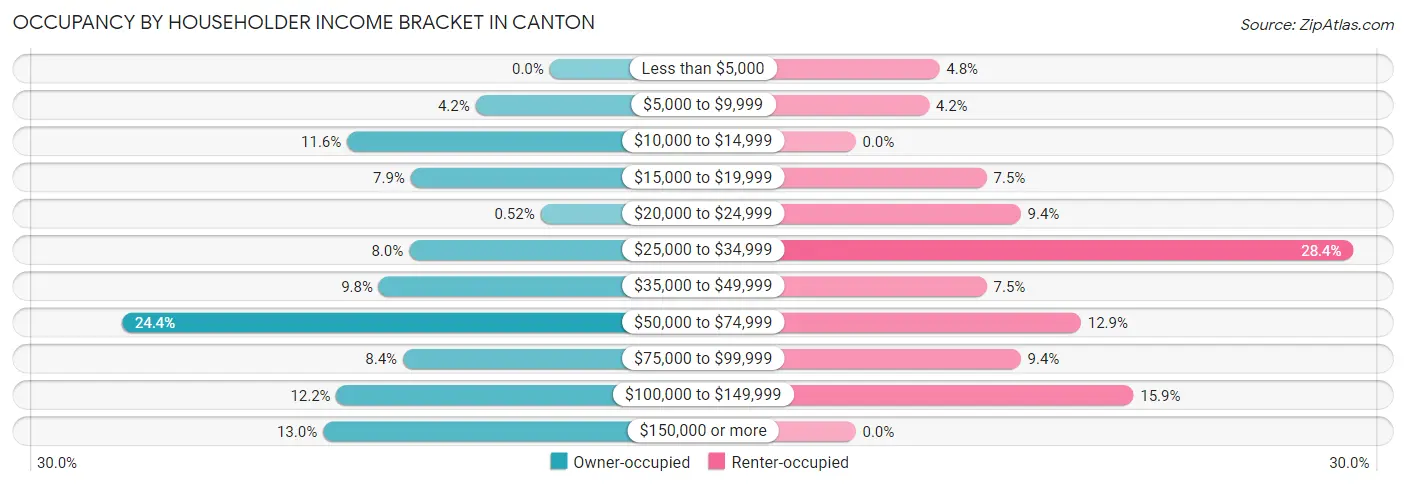
| Income Bracket | Owner-occupied | Renter-occupied |
| Less than $5,000 | 0 (0.0%) | 32 (4.8%) |
| $5,000 to $9,999 | 49 (4.2%) | 28 (4.2%) |
| $10,000 to $14,999 | 134 (11.6%) | 0 (0.0%) |
| $15,000 to $19,999 | 92 (7.9%) | 50 (7.5%) |
| $20,000 to $24,999 | 6 (0.5%) | 63 (9.4%) |
| $25,000 to $34,999 | 93 (8.0%) | 190 (28.4%) |
| $35,000 to $49,999 | 113 (9.8%) | 50 (7.5%) |
| $50,000 to $74,999 | 283 (24.4%) | 86 (12.9%) |
| $75,000 to $99,999 | 97 (8.4%) | 63 (9.4%) |
| $100,000 to $149,999 | 141 (12.2%) | 106 (15.9%) |
| $150,000 or more | 150 (13.0%) | 0 (0.0%) |
| Total | 1,158 (100.0%) | 668 (100.0%) |
Monthly Housing Cost Tiers in Canton

| Monthly Cost | Owner-occupied | Renter-occupied |
| Less than $300 | 130 (11.2%) | 0 (0.0%) |
| $300 to $499 | 153 (13.2%) | 64 (9.6%) |
| $500 to $799 | 294 (25.4%) | 176 (26.4%) |
| $800 to $999 | 127 (11.0%) | 108 (16.2%) |
| $1,000 to $1,499 | 190 (16.4%) | 223 (33.4%) |
| $1,500 to $1,999 | 174 (15.0%) | 71 (10.6%) |
| $2,000 to $2,499 | 51 (4.4%) | 0 (0.0%) |
| $2,500 to $2,999 | 26 (2.2%) | 0 (0.0%) |
| $3,000 or more | 13 (1.1%) | 10 (1.5%) |
| Total | 1,158 (100.0%) | 668 (100.0%) |
Physical Housing Characteristics in Canton
Housing Structures in Canton
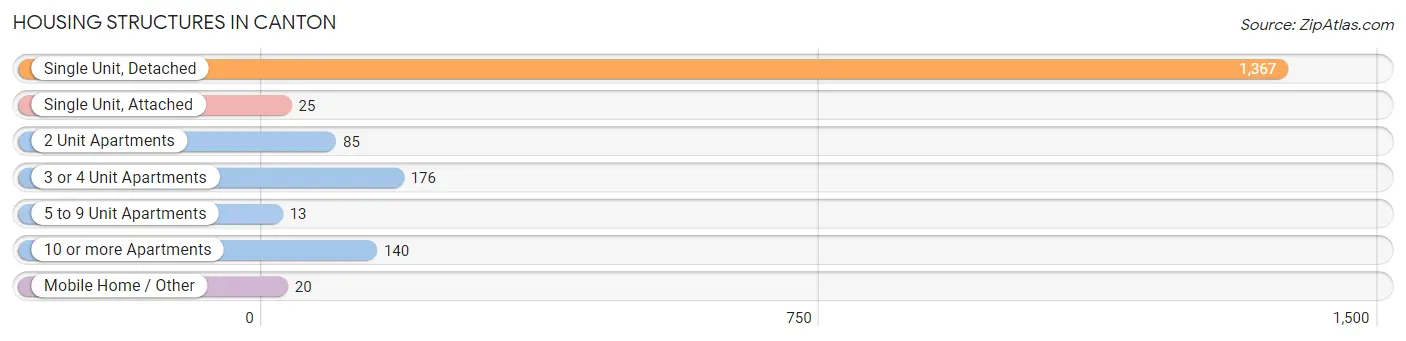
| Structure Type | # Housing Units | % Housing Units |
| Single Unit, Detached | 1,367 | 74.9% |
| Single Unit, Attached | 25 | 1.4% |
| 2 Unit Apartments | 85 | 4.6% |
| 3 or 4 Unit Apartments | 176 | 9.6% |
| 5 to 9 Unit Apartments | 13 | 0.7% |
| 10 or more Apartments | 140 | 7.7% |
| Mobile Home / Other | 20 | 1.1% |
| Total | 1,826 | 100.0% |
Housing Structures by Occupancy in Canton
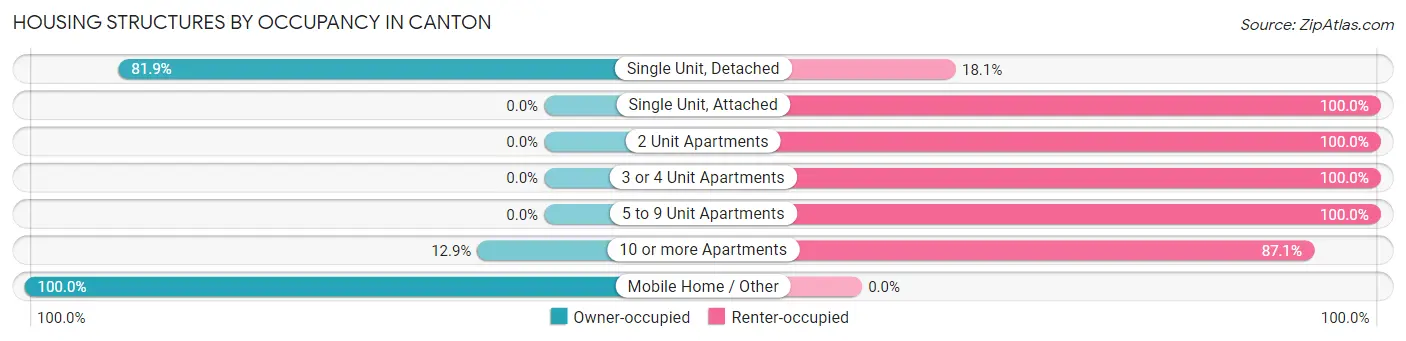
| Structure Type | Owner-occupied | Renter-occupied |
| Single Unit, Detached | 1,120 (81.9%) | 247 (18.1%) |
| Single Unit, Attached | 0 (0.0%) | 25 (100.0%) |
| 2 Unit Apartments | 0 (0.0%) | 85 (100.0%) |
| 3 or 4 Unit Apartments | 0 (0.0%) | 176 (100.0%) |
| 5 to 9 Unit Apartments | 0 (0.0%) | 13 (100.0%) |
| 10 or more Apartments | 18 (12.9%) | 122 (87.1%) |
| Mobile Home / Other | 20 (100.0%) | 0 (0.0%) |
| Total | 1,158 (63.4%) | 668 (36.6%) |
Housing Structures by Number of Rooms in Canton
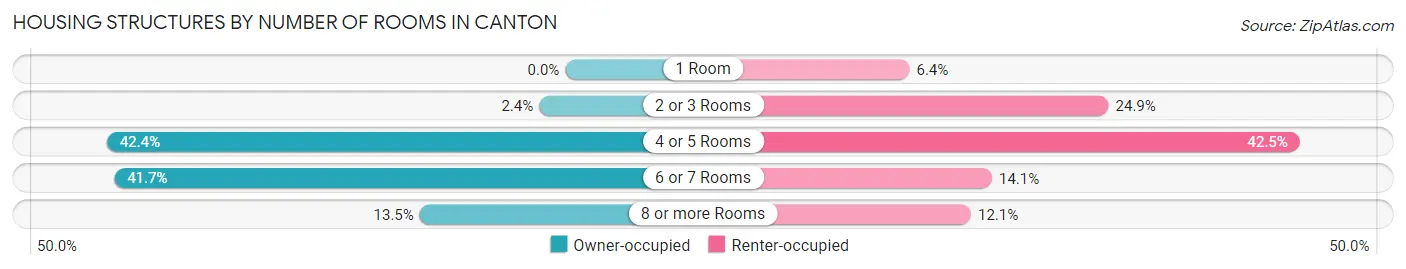
| Number of Rooms | Owner-occupied | Renter-occupied |
| 1 Room | 0 (0.0%) | 43 (6.4%) |
| 2 or 3 Rooms | 28 (2.4%) | 166 (24.8%) |
| 4 or 5 Rooms | 491 (42.4%) | 284 (42.5%) |
| 6 or 7 Rooms | 483 (41.7%) | 94 (14.1%) |
| 8 or more Rooms | 156 (13.5%) | 81 (12.1%) |
| Total | 1,158 (100.0%) | 668 (100.0%) |
Housing Structure by Heating Type in Canton
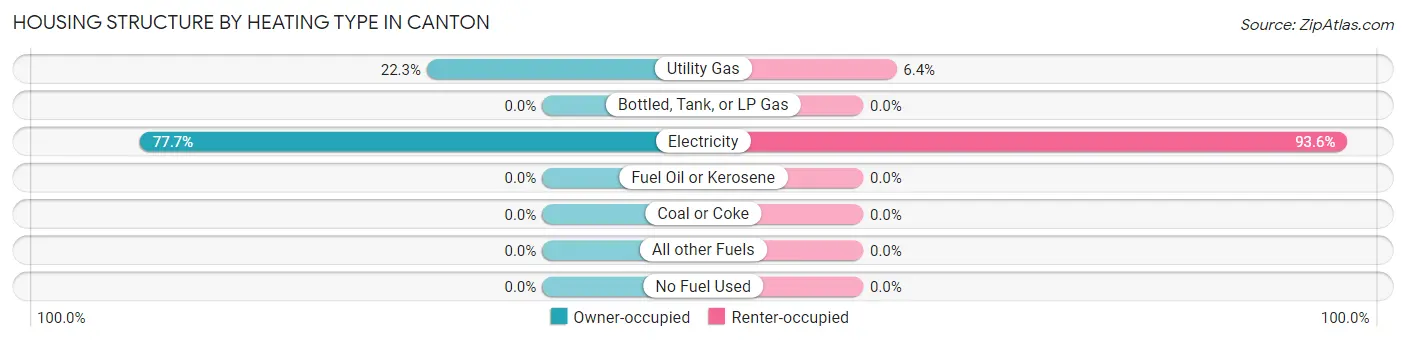
| Heating Type | Owner-occupied | Renter-occupied |
| Utility Gas | 258 (22.3%) | 43 (6.4%) |
| Bottled, Tank, or LP Gas | 0 (0.0%) | 0 (0.0%) |
| Electricity | 900 (77.7%) | 625 (93.6%) |
| Fuel Oil or Kerosene | 0 (0.0%) | 0 (0.0%) |
| Coal or Coke | 0 (0.0%) | 0 (0.0%) |
| All other Fuels | 0 (0.0%) | 0 (0.0%) |
| No Fuel Used | 0 (0.0%) | 0 (0.0%) |
| Total | 1,158 (100.0%) | 668 (100.0%) |
Household Vehicle Usage in Canton
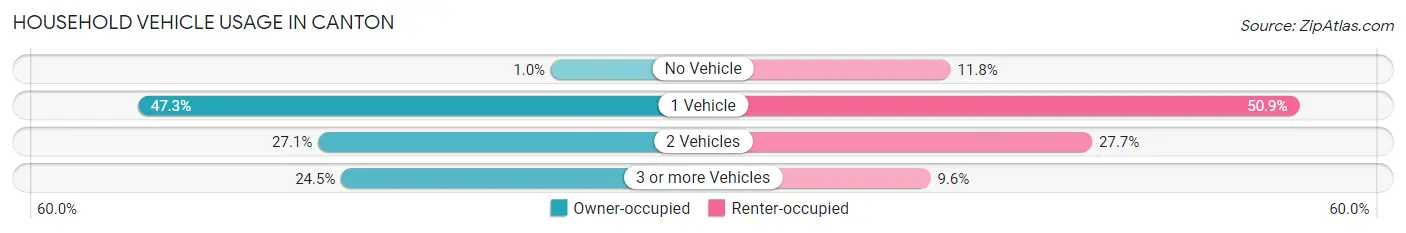
| Vehicles per Household | Owner-occupied | Renter-occupied |
| No Vehicle | 12 (1.0%) | 79 (11.8%) |
| 1 Vehicle | 548 (47.3%) | 340 (50.9%) |
| 2 Vehicles | 314 (27.1%) | 185 (27.7%) |
| 3 or more Vehicles | 284 (24.5%) | 64 (9.6%) |
| Total | 1,158 (100.0%) | 668 (100.0%) |
Real Estate & Mortgages in Canton
Real Estate and Mortgage Overview in Canton
| Characteristic | Without Mortgage | With Mortgage |
| Housing Units | 576 | 582 |
| Median Property Value | $124,800 | $177,300 |
| Median Household Income | $42,857 | $61 |
| Monthly Housing Costs | $505 | $13 |
| Real Estate Taxes | $1,373 | $84 |
Property Value by Mortgage Status in Canton
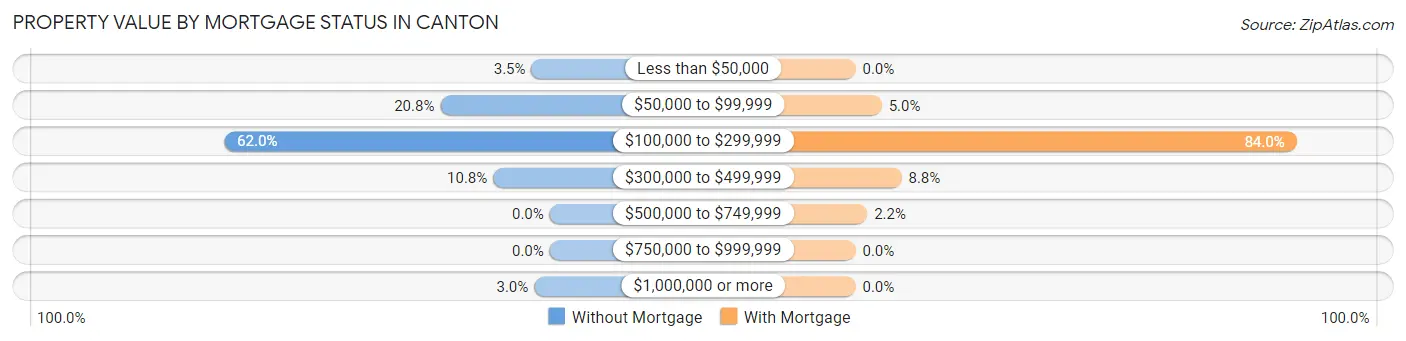
| Property Value | Without Mortgage | With Mortgage |
| Less than $50,000 | 20 (3.5%) | 0 (0.0%) |
| $50,000 to $99,999 | 120 (20.8%) | 29 (5.0%) |
| $100,000 to $299,999 | 357 (62.0%) | 489 (84.0%) |
| $300,000 to $499,999 | 62 (10.8%) | 51 (8.8%) |
| $500,000 to $749,999 | 0 (0.0%) | 13 (2.2%) |
| $750,000 to $999,999 | 0 (0.0%) | 0 (0.0%) |
| $1,000,000 or more | 17 (2.9%) | 0 (0.0%) |
| Total | 576 (100.0%) | 582 (100.0%) |
Household Income by Mortgage Status in Canton
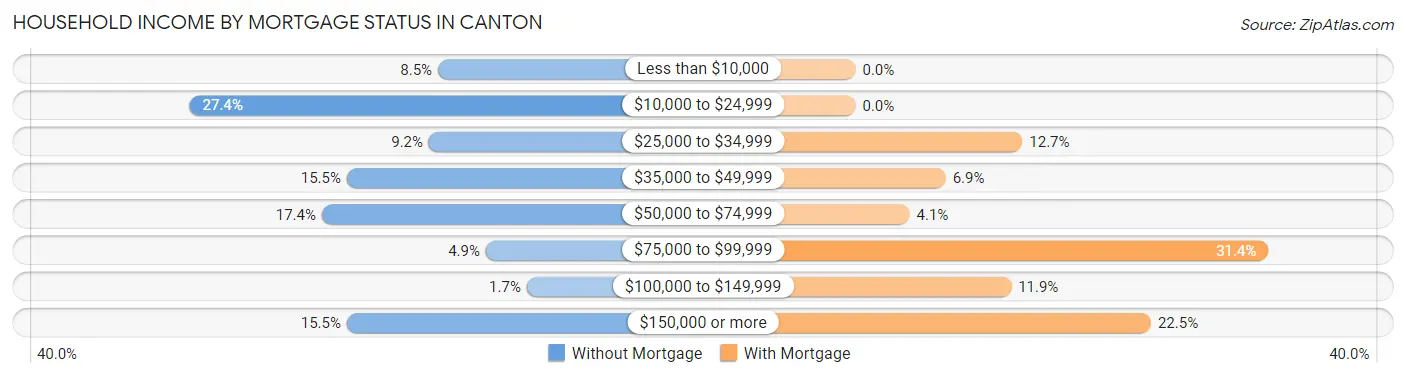
| Household Income | Without Mortgage | With Mortgage |
| Less than $10,000 | 49 (8.5%) | 0 (0.0%) |
| $10,000 to $24,999 | 158 (27.4%) | 0 (0.0%) |
| $25,000 to $34,999 | 53 (9.2%) | 74 (12.7%) |
| $35,000 to $49,999 | 89 (15.4%) | 40 (6.9%) |
| $50,000 to $74,999 | 100 (17.4%) | 24 (4.1%) |
| $75,000 to $99,999 | 28 (4.9%) | 183 (31.4%) |
| $100,000 to $149,999 | 10 (1.7%) | 69 (11.9%) |
| $150,000 or more | 89 (15.4%) | 131 (22.5%) |
| Total | 576 (100.0%) | 582 (100.0%) |
Property Value to Household Income Ratio in Canton
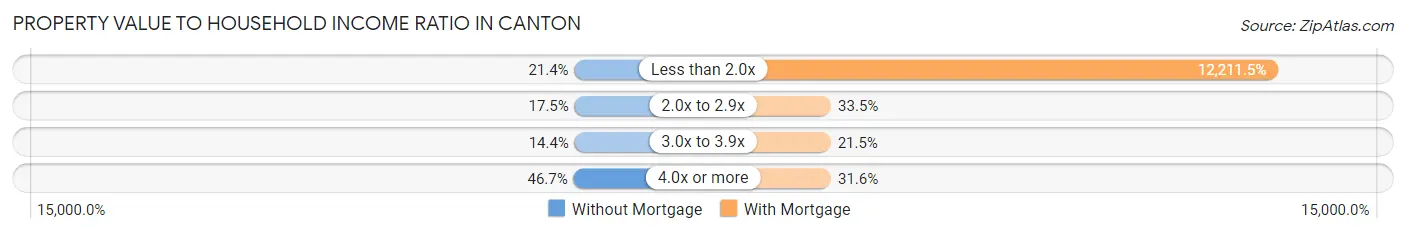
| Value-to-Income Ratio | Without Mortgage | With Mortgage |
| Less than 2.0x | 123 (21.3%) | 71,071 (12,211.5%) |
| 2.0x to 2.9x | 101 (17.5%) | 195 (33.5%) |
| 3.0x to 3.9x | 83 (14.4%) | 125 (21.5%) |
| 4.0x or more | 269 (46.7%) | 184 (31.6%) |
| Total | 576 (100.0%) | 582 (100.0%) |
Real Estate Taxes by Mortgage Status in Canton
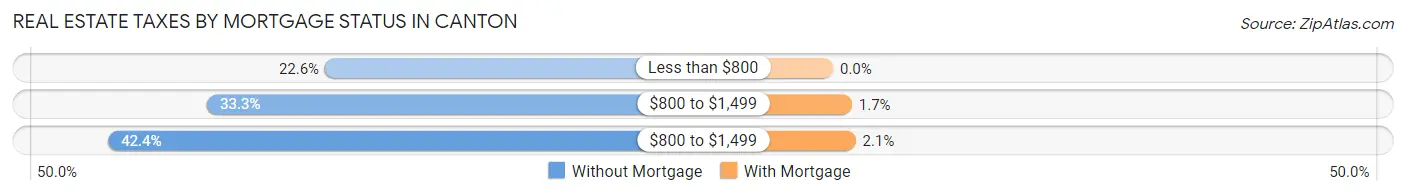
| Property Taxes | Without Mortgage | With Mortgage |
| Less than $800 | 130 (22.6%) | 0 (0.0%) |
| $800 to $1,499 | 192 (33.3%) | 10 (1.7%) |
| $800 to $1,499 | 244 (42.4%) | 12 (2.1%) |
| Total | 576 (100.0%) | 582 (100.0%) |
Health & Disability in Canton
Health Insurance Coverage by Age in Canton
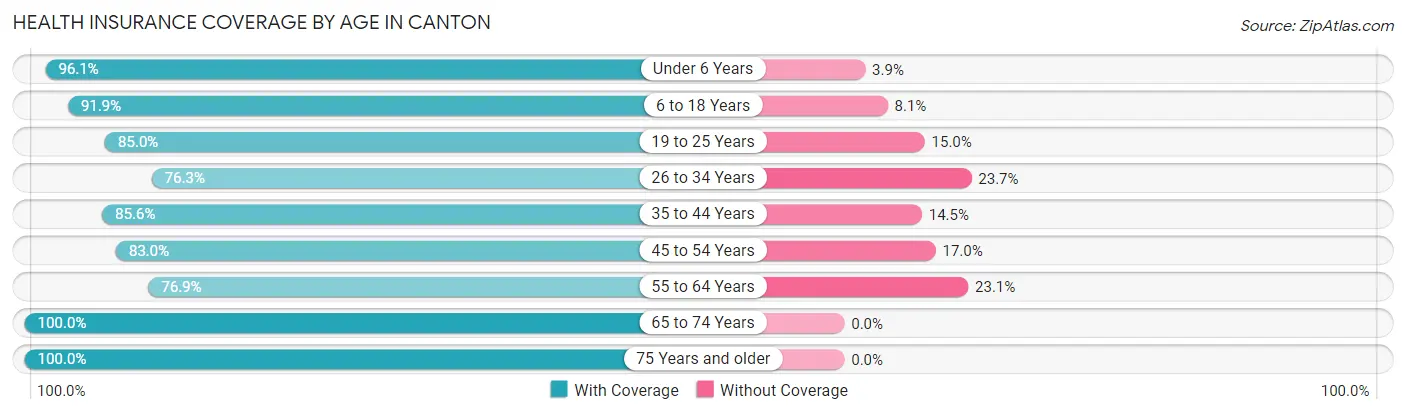
| Age Bracket | With Coverage | Without Coverage |
| Under 6 Years | 371 (96.1%) | 15 (3.9%) |
| 6 to 18 Years | 592 (91.9%) | 52 (8.1%) |
| 19 to 25 Years | 278 (85.0%) | 49 (15.0%) |
| 26 to 34 Years | 364 (76.3%) | 113 (23.7%) |
| 35 to 44 Years | 361 (85.6%) | 61 (14.4%) |
| 45 to 54 Years | 327 (83.0%) | 67 (17.0%) |
| 55 to 64 Years | 433 (76.9%) | 130 (23.1%) |
| 65 to 74 Years | 290 (100.0%) | 0 (0.0%) |
| 75 Years and older | 497 (100.0%) | 0 (0.0%) |
| Total | 3,513 (87.8%) | 487 (12.2%) |
Health Insurance Coverage by Citizenship Status in Canton
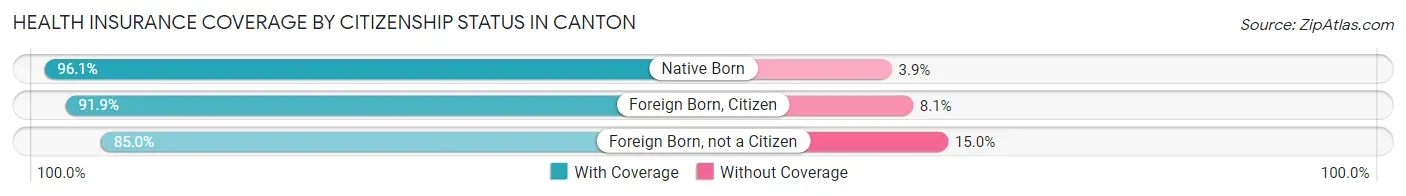
| Citizenship Status | With Coverage | Without Coverage |
| Native Born | 371 (96.1%) | 15 (3.9%) |
| Foreign Born, Citizen | 592 (91.9%) | 52 (8.1%) |
| Foreign Born, not a Citizen | 278 (85.0%) | 49 (15.0%) |
Health Insurance Coverage by Household Income in Canton
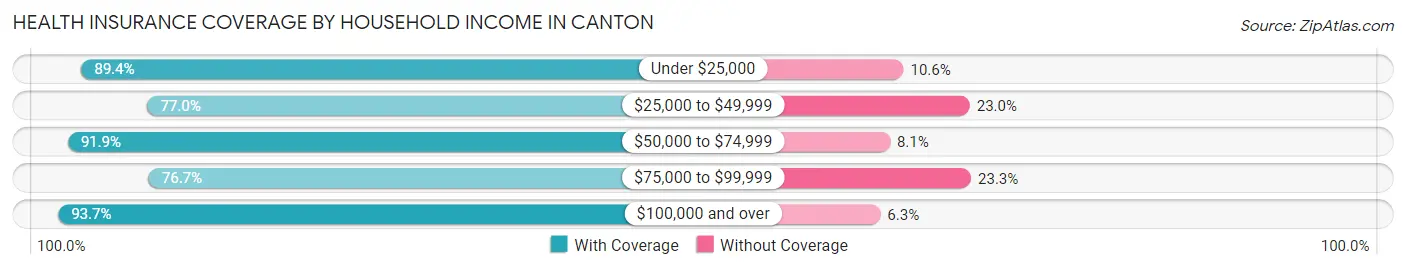
| Household Income | With Coverage | Without Coverage |
| Under $25,000 | 538 (89.4%) | 64 (10.6%) |
| $25,000 to $49,999 | 531 (77.0%) | 159 (23.0%) |
| $50,000 to $74,999 | 831 (91.9%) | 73 (8.1%) |
| $75,000 to $99,999 | 303 (76.7%) | 92 (23.3%) |
| $100,000 and over | 1,293 (93.7%) | 87 (6.3%) |
Public vs Private Health Insurance Coverage by Age in Canton
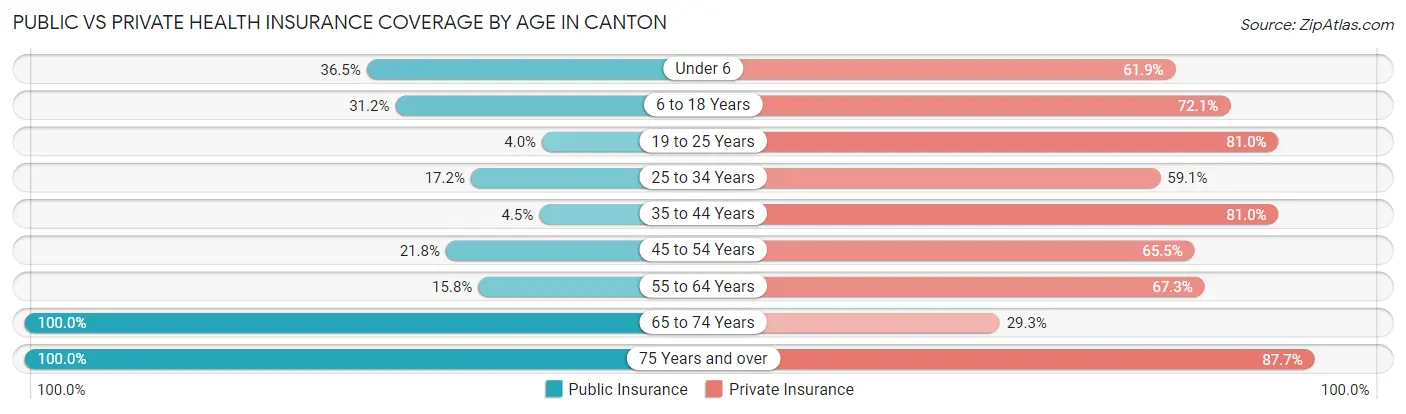
| Age Bracket | Public Insurance | Private Insurance |
| Under 6 | 141 (36.5%) | 239 (61.9%) |
| 6 to 18 Years | 201 (31.2%) | 464 (72.1%) |
| 19 to 25 Years | 13 (4.0%) | 265 (81.0%) |
| 25 to 34 Years | 82 (17.2%) | 282 (59.1%) |
| 35 to 44 Years | 19 (4.5%) | 342 (81.0%) |
| 45 to 54 Years | 86 (21.8%) | 258 (65.5%) |
| 55 to 64 Years | 89 (15.8%) | 379 (67.3%) |
| 65 to 74 Years | 290 (100.0%) | 85 (29.3%) |
| 75 Years and over | 497 (100.0%) | 436 (87.7%) |
| Total | 1,418 (35.4%) | 2,750 (68.8%) |
Disability Status by Sex by Age in Canton
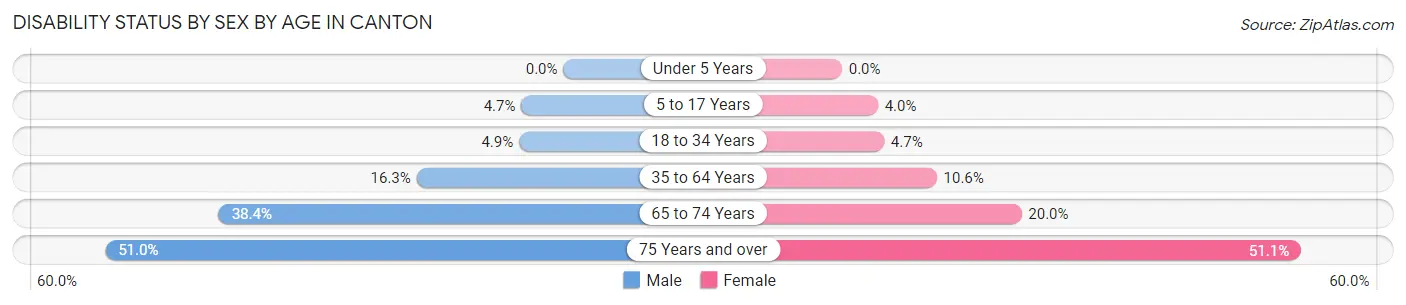
| Age Bracket | Male | Female |
| Under 5 Years | 0 (0.0%) | 0 (0.0%) |
| 5 to 17 Years | 18 (4.7%) | 8 (4.0%) |
| 18 to 34 Years | 26 (4.9%) | 19 (4.7%) |
| 35 to 64 Years | 117 (16.3%) | 70 (10.6%) |
| 65 to 74 Years | 71 (38.4%) | 21 (20.0%) |
| 75 Years and over | 75 (51.0%) | 179 (51.1%) |
Disability Class by Sex by Age in Canton
Disability Class: Hearing Difficulty
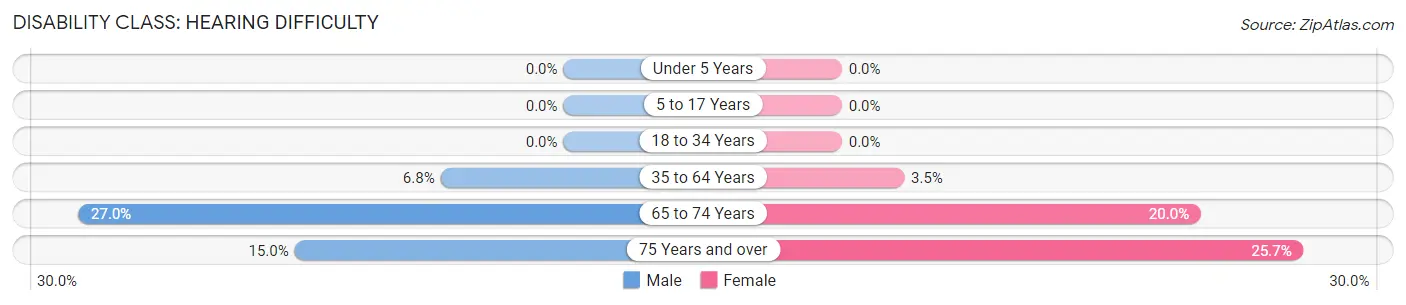
| Age Bracket | Male | Female |
| Under 5 Years | 0 (0.0%) | 0 (0.0%) |
| 5 to 17 Years | 0 (0.0%) | 0 (0.0%) |
| 18 to 34 Years | 0 (0.0%) | 0 (0.0%) |
| 35 to 64 Years | 49 (6.8%) | 23 (3.5%) |
| 65 to 74 Years | 50 (27.0%) | 21 (20.0%) |
| 75 Years and over | 22 (15.0%) | 90 (25.7%) |
Disability Class: Vision Difficulty
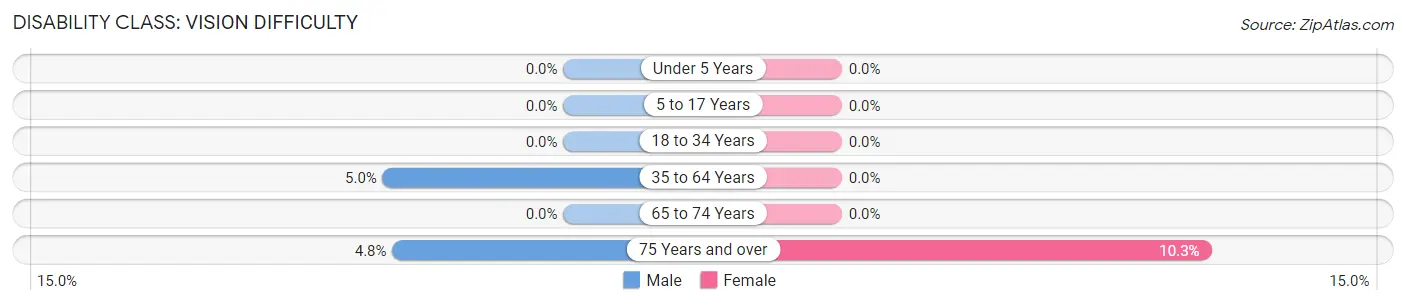
| Age Bracket | Male | Female |
| Under 5 Years | 0 (0.0%) | 0 (0.0%) |
| 5 to 17 Years | 0 (0.0%) | 0 (0.0%) |
| 18 to 34 Years | 0 (0.0%) | 0 (0.0%) |
| 35 to 64 Years | 36 (5.0%) | 0 (0.0%) |
| 65 to 74 Years | 0 (0.0%) | 0 (0.0%) |
| 75 Years and over | 7 (4.8%) | 36 (10.3%) |
Disability Class: Cognitive Difficulty
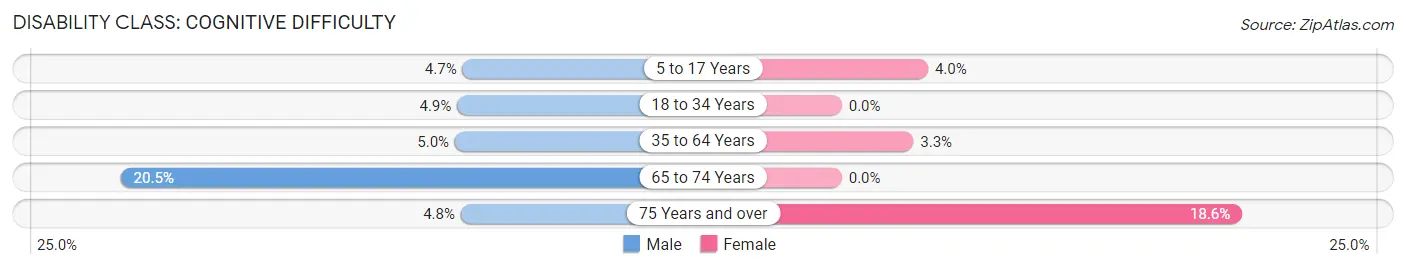
| Age Bracket | Male | Female |
| 5 to 17 Years | 18 (4.7%) | 8 (4.0%) |
| 18 to 34 Years | 26 (4.9%) | 0 (0.0%) |
| 35 to 64 Years | 36 (5.0%) | 22 (3.3%) |
| 65 to 74 Years | 38 (20.5%) | 0 (0.0%) |
| 75 Years and over | 7 (4.8%) | 65 (18.6%) |
Disability Class: Ambulatory Difficulty
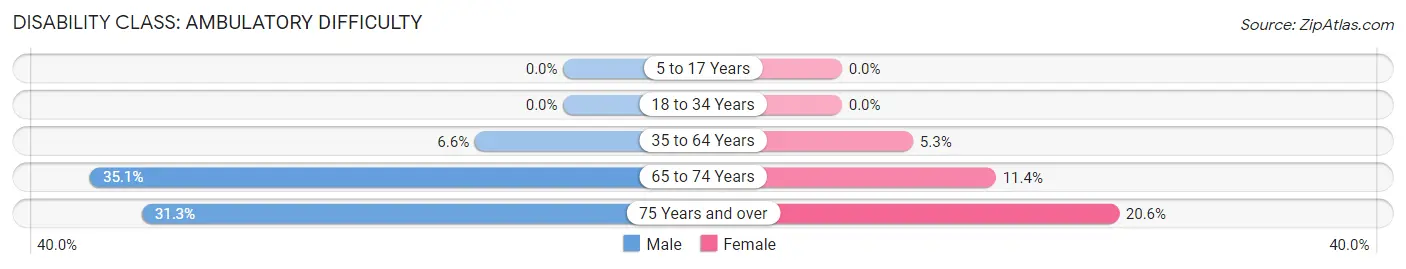
| Age Bracket | Male | Female |
| 5 to 17 Years | 0 (0.0%) | 0 (0.0%) |
| 18 to 34 Years | 0 (0.0%) | 0 (0.0%) |
| 35 to 64 Years | 47 (6.6%) | 35 (5.3%) |
| 65 to 74 Years | 65 (35.1%) | 12 (11.4%) |
| 75 Years and over | 46 (31.3%) | 72 (20.6%) |
Disability Class: Self-Care Difficulty
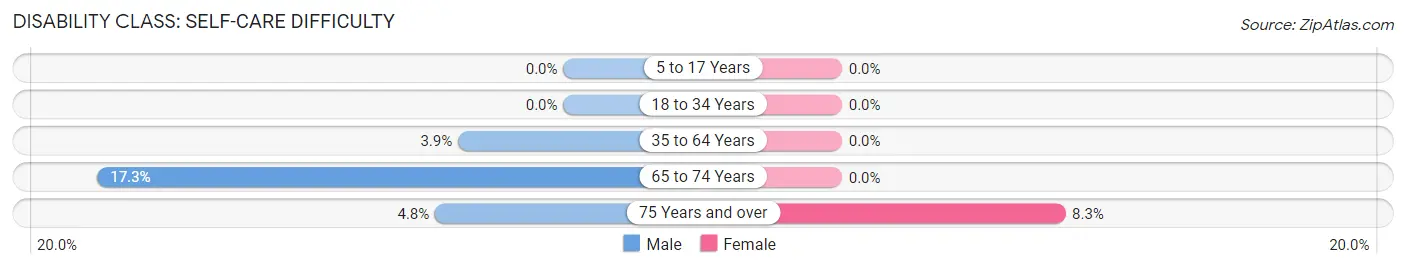
| Age Bracket | Male | Female |
| 5 to 17 Years | 0 (0.0%) | 0 (0.0%) |
| 18 to 34 Years | 0 (0.0%) | 0 (0.0%) |
| 35 to 64 Years | 28 (3.9%) | 0 (0.0%) |
| 65 to 74 Years | 32 (17.3%) | 0 (0.0%) |
| 75 Years and over | 7 (4.8%) | 29 (8.3%) |
Technology Access in Canton
Computing Device Access in Canton
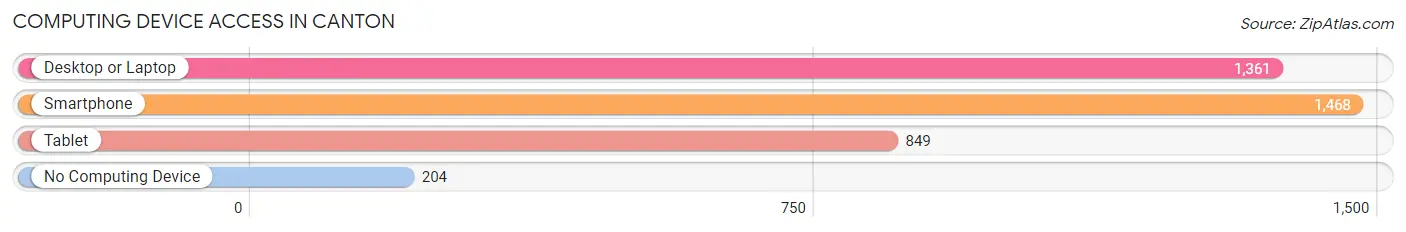
| Device Type | # Households | % Households |
| Desktop or Laptop | 1,361 | 74.5% |
| Smartphone | 1,468 | 80.4% |
| Tablet | 849 | 46.5% |
| No Computing Device | 204 | 11.2% |
| Total | 1,826 | 100.0% |
Internet Access in Canton
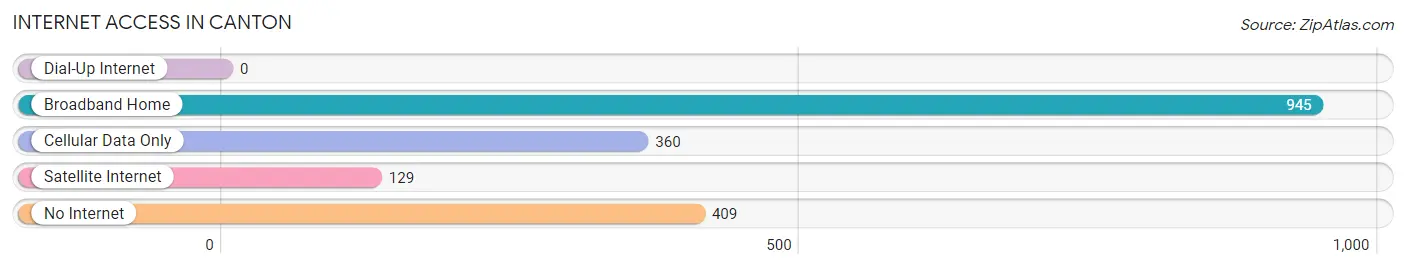
| Internet Type | # Households | % Households |
| Dial-Up Internet | 0 | 0.0% |
| Broadband Home | 945 | 51.7% |
| Cellular Data Only | 360 | 19.7% |
| Satellite Internet | 129 | 7.1% |
| No Internet | 409 | 22.4% |
| Total | 1,826 | 100.0% |
Canton Summary
Canton, Texas is a small town located in Van Zandt County, Texas, United States. It is situated approximately 60 miles east of Dallas and is part of the Tyler-Longview metropolitan area. The town was founded in 1848 and has a population of approximately 3,000 people.
History
Canton was founded in 1848 by a group of settlers from Canton, Mississippi. The town was named after the original Canton, Mississippi, which was named after the city of Canton in China. The town was originally a trading post and was known as Canton Station. In 1854, the town was officially incorporated and the name was changed to Canton.
The town grew rapidly in the late 19th century and early 20th century due to the railroad and the cotton industry. The town was also home to several large cotton gins and a cottonseed oil mill. The town was also home to several churches, schools, and businesses.
In the late 20th century, the town began to decline due to the decline of the cotton industry. The town was also affected by the Great Depression and World War II. However, the town has seen a resurgence in recent years due to the growth of the Dallas-Fort Worth Metroplex.
Geography
Canton is located in Van Zandt County, Texas, United States. It is situated approximately 60 miles east of Dallas and is part of the Tyler-Longview metropolitan area. The town is situated on the banks of the Sabine River and is surrounded by rolling hills and forests. The town has a total area of 4.2 square miles and a population of approximately 3,000 people.
Economy
Canton’s economy is largely based on agriculture and tourism. The town is home to several farms and ranches, as well as several tourist attractions. The town is also home to several small businesses, including restaurants, shops, and services.
Demographics
As of the 2010 census, the population of Canton was 3,000. The racial makeup of the town was 94.3% White, 0.7% African American, 0.3% Native American, 0.3% Asian, 0.1% Pacific Islander, 2.7% from other races, and 1.9% from two or more races. Hispanic or Latino of any race were 5.3% of the population.
The median income for a household in the town was $37,500 and the median income for a family was $45,000. The per capita income for the town was $18,000. About 11.3% of families and 14.3% of the population were below the poverty line, including 18.3% of those under age 18 and 8.3% of those age 65 or over.
Conclusion
Canton, Texas is a small town located in Van Zandt County, Texas, United States. It is situated approximately 60 miles east of Dallas and is part of the Tyler-Longview metropolitan area. The town was founded in 1848 and has a population of approximately 3,000 people. The town’s economy is largely based on agriculture and tourism, and the town is home to several small businesses, including restaurants, shops, and services. The racial makeup of the town is 94.3% White, 0.7% African American, 0.3% Native American, 0.3% Asian, 0.1% Pacific Islander, 2.7% from other races, and 1.9% from two or more races. The median income for a household in the town was $37,500 and the median income for a family was $45,000.
Common Questions
What is Per Capita Income in Canton?
Per Capita income in Canton is $30,175.
What is the Median Family Income in Canton?
Median Family Income in Canton is $71,500.
What is the Median Household income in Canton?
Median Household Income in Canton is $52,500.
What is Income or Wage Gap in Canton?
Income or Wage Gap in Canton is 24.3%.
Women in Canton earn 75.7 cents for every dollar earned by a man.
What is Inequality or Gini Index in Canton?
Inequality or Gini Index in Canton is 0.47.
What is the Total Population of Canton?
Total Population of Canton is 4,279.
What is the Total Male Population of Canton?
Total Male Population of Canton is 2,343.
What is the Total Female Population of Canton?
Total Female Population of Canton is 1,936.
What is the Ratio of Males per 100 Females in Canton?
There are 121.02 Males per 100 Females in Canton.
What is the Ratio of Females per 100 Males in Canton?
There are 82.63 Females per 100 Males in Canton.
What is the Median Population Age in Canton?
Median Population Age in Canton is 40.3 Years.
What is the Average Family Size in Canton
Average Family Size in Canton is 3.0 People.
What is the Average Household Size in Canton
Average Household Size in Canton is 2.2 People.
How Large is the Labor Force in Canton?
There are 1,743 People in the Labor Forcein in Canton.
What is the Percentage of People in the Labor Force in Canton?
50.8% of People are in the Labor Force in Canton.
What is the Unemployment Rate in Canton?
Unemployment Rate in Canton is 2.6%.