Camp Wood, TX Map & Demographics
Camp Wood Map
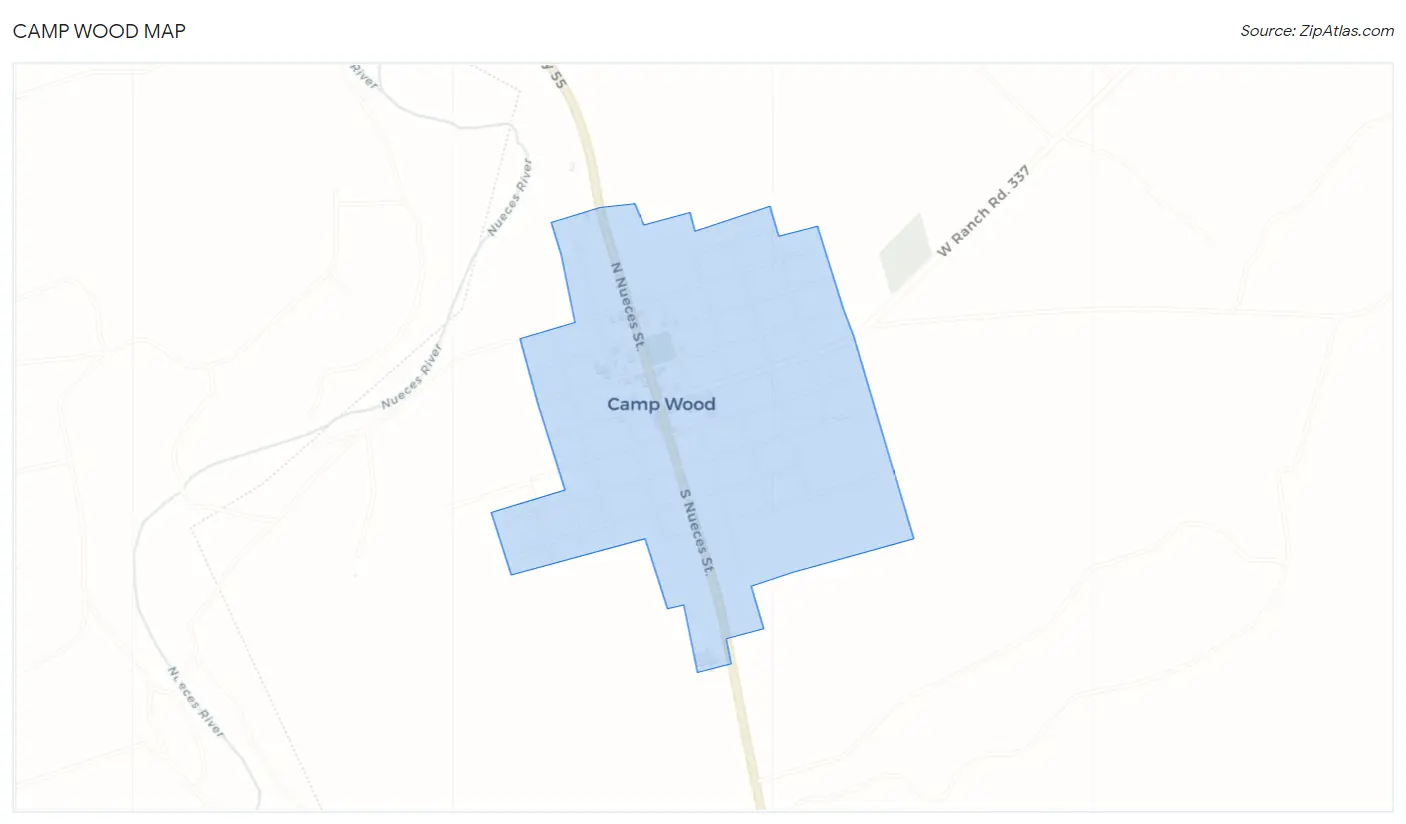
Camp Wood Overview
$11,936
PER CAPITA INCOME
$43,424
AVG FAMILY INCOME
$37,083
AVG HOUSEHOLD INCOME
0.39
INEQUALITY / GINI INDEX
970
TOTAL POPULATION
470
MALE POPULATION
500
FEMALE POPULATION
94.00
MALES / 100 FEMALES
106.38
FEMALES / 100 MALES
40.7
MEDIAN AGE
5.3
AVG FAMILY SIZE
4.7
AVG HOUSEHOLD SIZE
225
LABOR FORCE [ PEOPLE ]
29.8%
PERCENT IN LABOR FORCE
Camp Wood Zip Codes
Camp Wood Area Codes
Income in Camp Wood
Income Overview in Camp Wood
Per Capita Income in Camp Wood is $11,936, while median incomes of families and households are $43,424 and $37,083 respectively.
| Characteristic | Number | Measure |
| Per Capita Income | 970 | $11,936 |
| Median Family Income | 155 | $43,424 |
| Mean Family Income | 155 | $51,383 |
| Median Household Income | 190 | $37,083 |
| Mean Household Income | 190 | $45,990 |
| Income Deficit | 155 | $0 |
| Wage / Income Gap (%) | 970 | 0.00% |
| Wage / Income Gap ($) | 970 | 100.00¢ per $1 |
| Gini / Inequality Index | 970 | 0.39 |
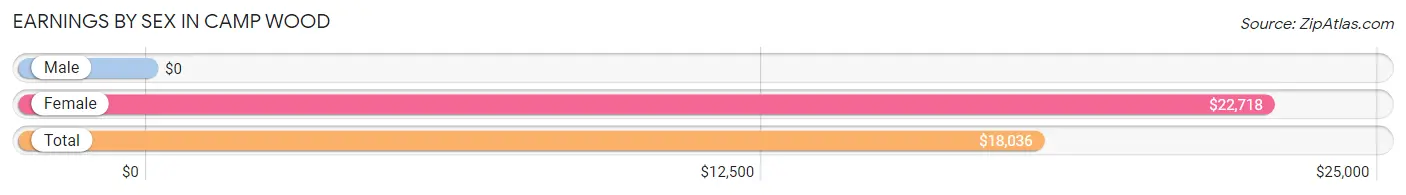
Earnings by Sex in Camp Wood
| Sex | Number | Average Earnings |
| Male | 135 (39.5%) | $0 |
| Female | 207 (60.5%) | $22,718 |
| Total | 342 (100.0%) | $18,036 |
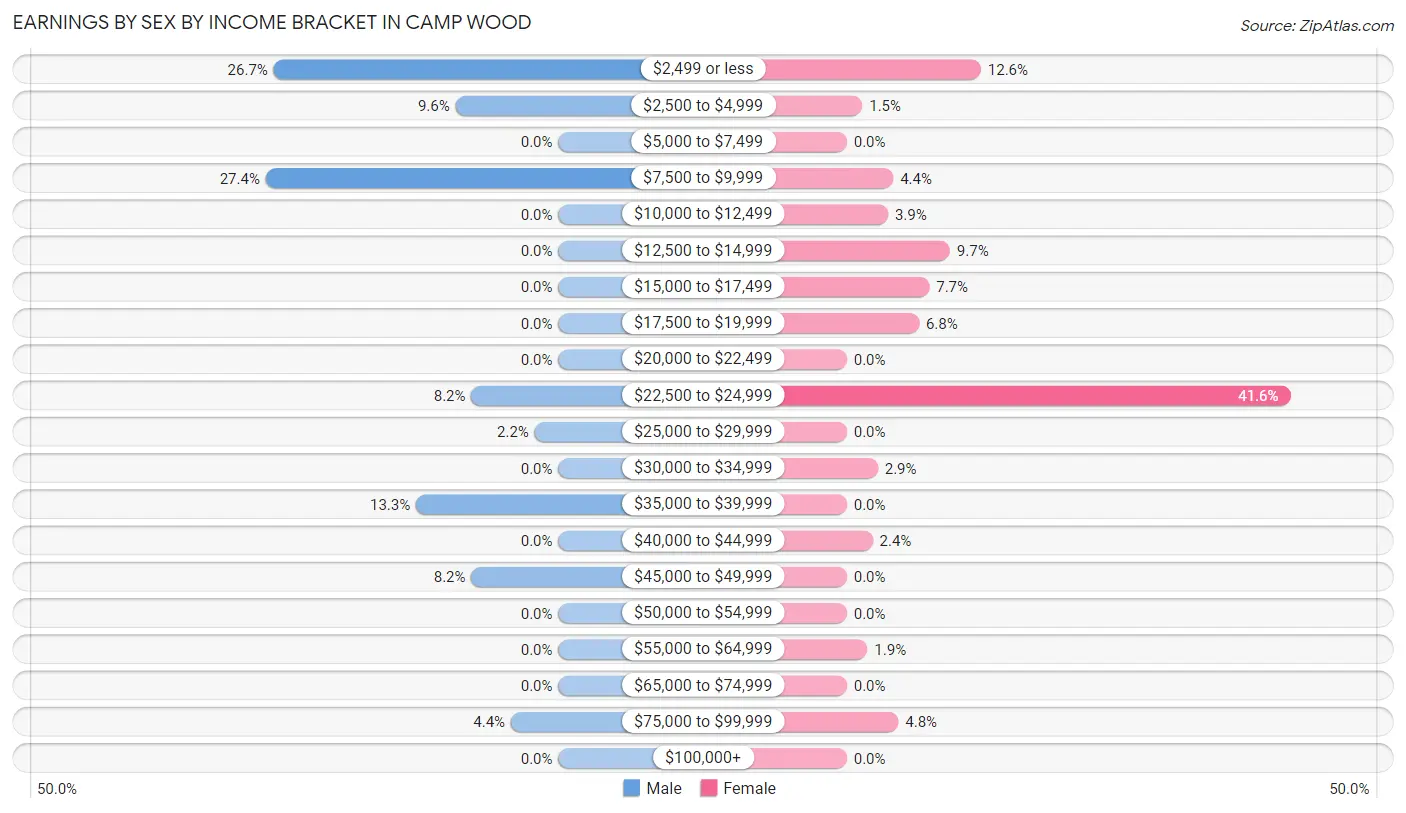
Earnings by Sex by Income Bracket in Camp Wood
The most common earnings brackets in Camp Wood are $7,500 to $9,999 for men (37 | 27.4%) and $22,500 to $24,999 for women (86 | 41.5%).
| Income | Male | Female |
| $2,499 or less | 36 (26.7%) | 26 (12.6%) |
| $2,500 to $4,999 | 13 (9.6%) | 3 (1.5%) |
| $5,000 to $7,499 | 0 (0.0%) | 0 (0.0%) |
| $7,500 to $9,999 | 37 (27.4%) | 9 (4.3%) |
| $10,000 to $12,499 | 0 (0.0%) | 8 (3.9%) |
| $12,500 to $14,999 | 0 (0.0%) | 20 (9.7%) |
| $15,000 to $17,499 | 0 (0.0%) | 16 (7.7%) |
| $17,500 to $19,999 | 0 (0.0%) | 14 (6.8%) |
| $20,000 to $22,499 | 0 (0.0%) | 0 (0.0%) |
| $22,500 to $24,999 | 11 (8.2%) | 86 (41.5%) |
| $25,000 to $29,999 | 3 (2.2%) | 0 (0.0%) |
| $30,000 to $34,999 | 0 (0.0%) | 6 (2.9%) |
| $35,000 to $39,999 | 18 (13.3%) | 0 (0.0%) |
| $40,000 to $44,999 | 0 (0.0%) | 5 (2.4%) |
| $45,000 to $49,999 | 11 (8.2%) | 0 (0.0%) |
| $50,000 to $54,999 | 0 (0.0%) | 0 (0.0%) |
| $55,000 to $64,999 | 0 (0.0%) | 4 (1.9%) |
| $65,000 to $74,999 | 0 (0.0%) | 0 (0.0%) |
| $75,000 to $99,999 | 6 (4.4%) | 10 (4.8%) |
| $100,000+ | 0 (0.0%) | 0 (0.0%) |
| Total | 135 (100.0%) | 207 (100.0%) |
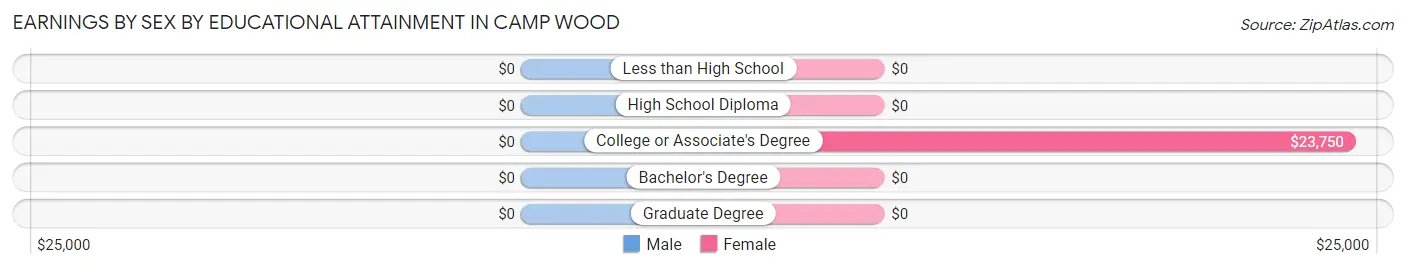
Earnings by Sex by Educational Attainment in Camp Wood
| Educational Attainment | Male Income | Female Income |
| Less than High School | - | - |
| High School Diploma | - | - |
| College or Associate's Degree | - | - |
| Bachelor's Degree | - | - |
| Graduate Degree | - | - |
| Total | - | - |
Family Income in Camp Wood
Family Income Brackets in Camp Wood
According to the Camp Wood family income data, there are 48 families falling into the $35,000 to $49,999 income range, which is the most common income bracket and makes up 31.0% of all families.
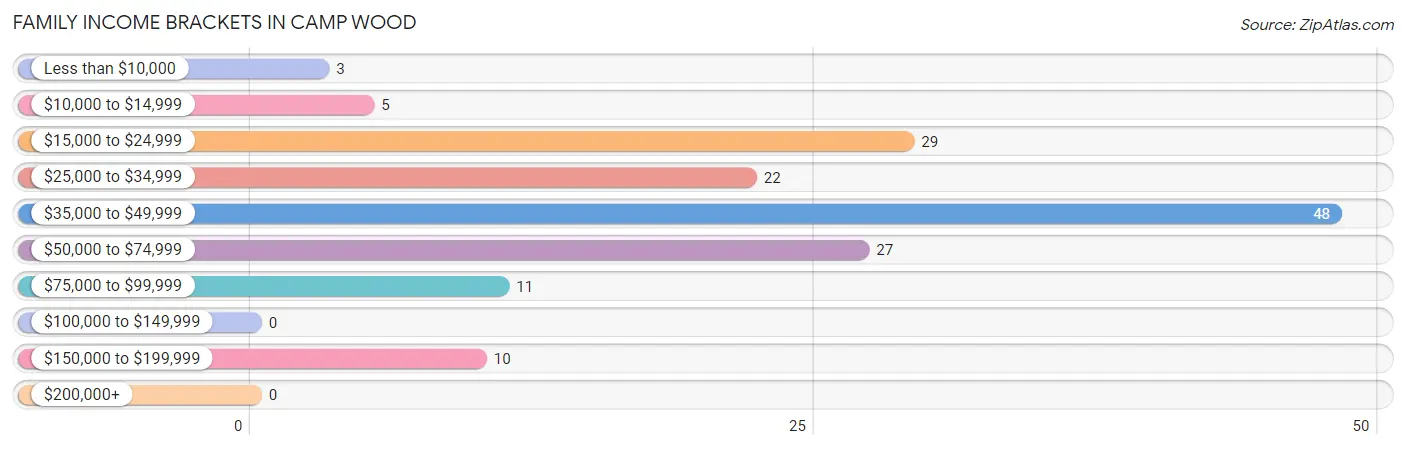
| Income Bracket | # Families | % Families |
| Less than $10,000 | 3 | 1.9% |
| $10,000 to $14,999 | 5 | 3.2% |
| $15,000 to $24,999 | 29 | 18.7% |
| $25,000 to $34,999 | 22 | 14.2% |
| $35,000 to $49,999 | 48 | 31.0% |
| $50,000 to $74,999 | 27 | 17.4% |
| $75,000 to $99,999 | 11 | 7.1% |
| $100,000 to $149,999 | 0 | 0.0% |
| $150,000 to $199,999 | 10 | 6.5% |
| $200,000+ | 0 | 0.0% |
Family Income by Famaliy Size in Camp Wood
3-person families (42 | 27.1%) account for the highest median family income in Camp Wood with $45,833 per family, while 2-person families (72 | 46.5%) have the highest median income of $15,454 per family member.
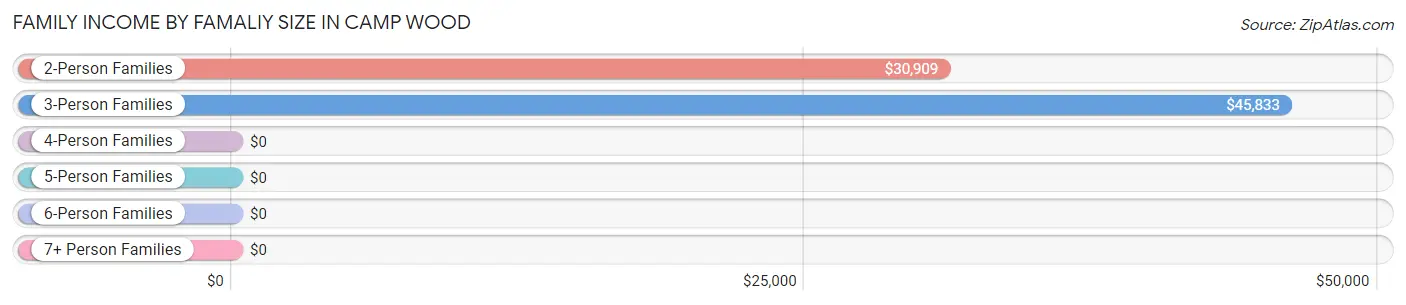
| Income Bracket | # Families | Median Income |
| 2-Person Families | 72 (46.5%) | $30,909 |
| 3-Person Families | 42 (27.1%) | $45,833 |
| 4-Person Families | 22 (14.2%) | $0 |
| 5-Person Families | 0 (0.0%) | $0 |
| 6-Person Families | 9 (5.8%) | $0 |
| 7+ Person Families | 10 (6.5%) | $0 |
| Total | 155 (100.0%) | $43,424 |
Family Income by Number of Earners in Camp Wood
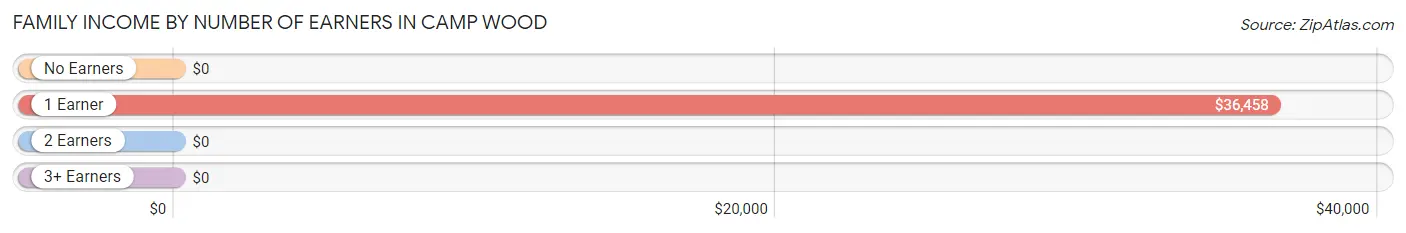
| Number of Earners | # Families | Median Income |
| No Earners | 30 (19.4%) | $0 |
| 1 Earner | 63 (40.6%) | $36,458 |
| 2 Earners | 47 (30.3%) | $0 |
| 3+ Earners | 15 (9.7%) | $0 |
| Total | 155 (100.0%) | $43,424 |
Household Income in Camp Wood
Household Income Brackets in Camp Wood
With 48 households falling in the category, the $35,000 to $49,999 income range is the most frequent in Camp Wood, accounting for 25.3% of all households.
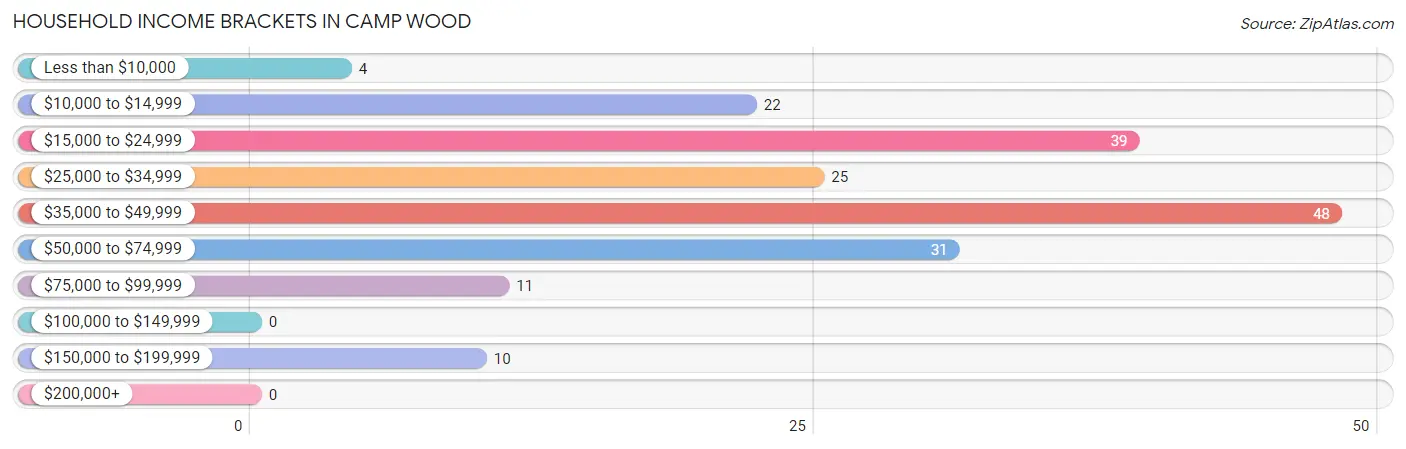
| Income Bracket | # Households | % Households |
| Less than $10,000 | 4 | 2.1% |
| $10,000 to $14,999 | 22 | 11.6% |
| $15,000 to $24,999 | 39 | 20.5% |
| $25,000 to $34,999 | 25 | 13.2% |
| $35,000 to $49,999 | 48 | 25.3% |
| $50,000 to $74,999 | 31 | 16.3% |
| $75,000 to $99,999 | 11 | 5.8% |
| $100,000 to $149,999 | 0 | 0.0% |
| $150,000 to $199,999 | 10 | 5.3% |
| $200,000+ | 0 | 0.0% |
Household Income by Householder Age in Camp Wood
The median household income in Camp Wood is $37,083, with the highest median household income of $42,981 found in the 45 to 64 years age bracket for the primary householder. A total of 83 households (43.7%) fall into this category. Meanwhile, the 15 to 24 years age bracket for the primary householder has the lowest median household income of $0, with 7 households (3.7%) in this group.
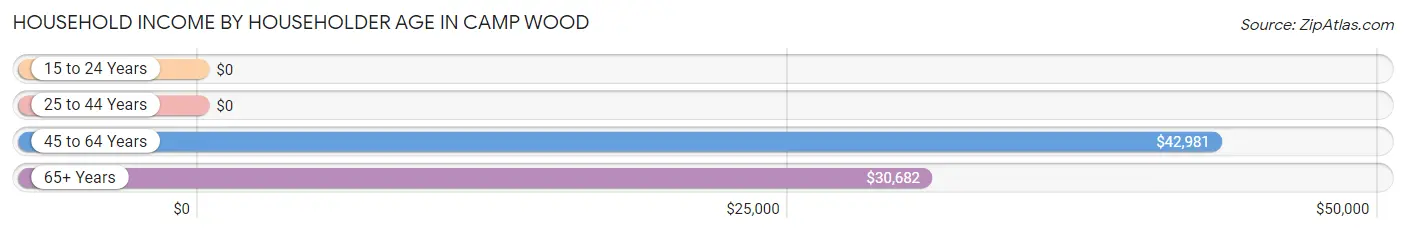
| Income Bracket | # Households | Median Income |
| 15 to 24 Years | 7 (3.7%) | $0 |
| 25 to 44 Years | 26 (13.7%) | $0 |
| 45 to 64 Years | 83 (43.7%) | $42,981 |
| 65+ Years | 74 (39.0%) | $30,682 |
| Total | 190 (100.0%) | $37,083 |
Poverty in Camp Wood
Income Below Poverty by Sex and Age in Camp Wood
With 31.6% poverty level for males and 44.0% for females among the residents of Camp Wood, 16 and 17 year old males and under 5 year old females are the most vulnerable to poverty, with 26 males (100.0%) and 17 females (100.0%) in their respective age groups living below the poverty level.
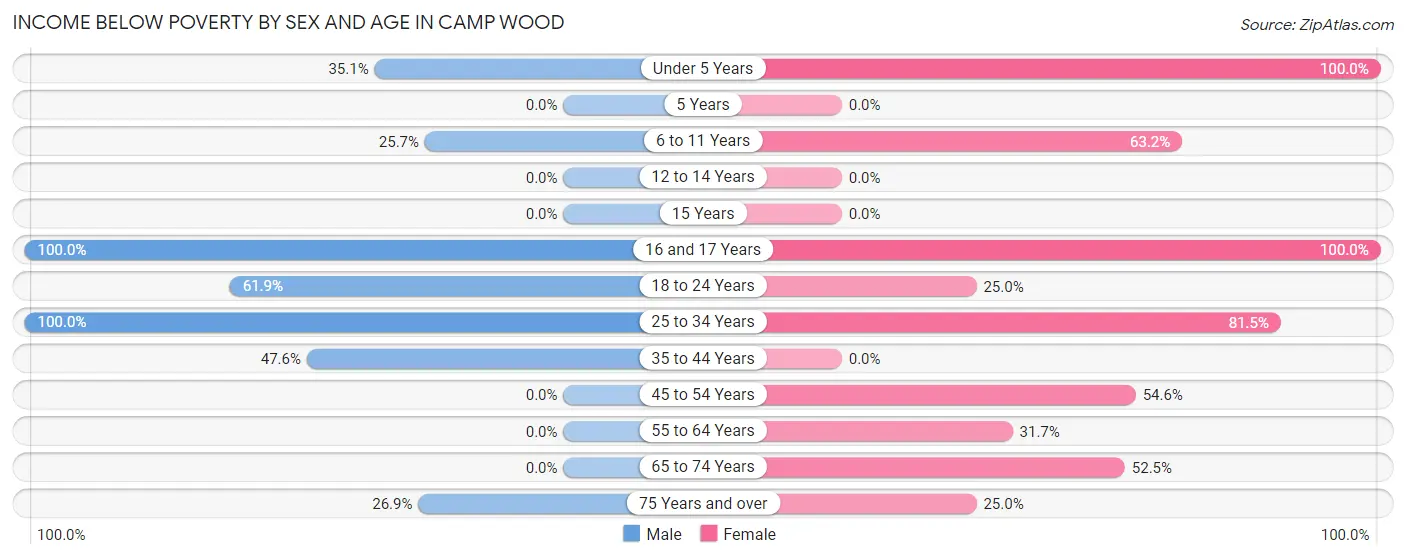
| Age Bracket | Male | Female |
| Under 5 Years | 27 (35.1%) | 17 (100.0%) |
| 5 Years | 0 (0.0%) | 0 (0.0%) |
| 6 to 11 Years | 9 (25.7%) | 12 (63.2%) |
| 12 to 14 Years | 0 (0.0%) | 0 (0.0%) |
| 15 Years | 0 (0.0%) | 0 (0.0%) |
| 16 and 17 Years | 26 (100.0%) | 26 (100.0%) |
| 18 to 24 Years | 26 (61.9%) | 15 (25.0%) |
| 25 to 34 Years | 23 (100.0%) | 22 (81.5%) |
| 35 to 44 Years | 10 (47.6%) | 0 (0.0%) |
| 45 to 54 Years | 0 (0.0%) | 66 (54.5%) |
| 55 to 64 Years | 0 (0.0%) | 13 (31.7%) |
| 65 to 74 Years | 0 (0.0%) | 31 (52.5%) |
| 75 Years and over | 7 (26.9%) | 9 (25.0%) |
| Total | 128 (31.6%) | 211 (44.0%) |
Income Above Poverty by Sex and Age in Camp Wood
According to the poverty statistics in Camp Wood, males aged 12 to 14 years and females aged 35 to 44 years are the age groups that are most secure financially, with 100.0% of males and 100.0% of females in these age groups living above the poverty line.
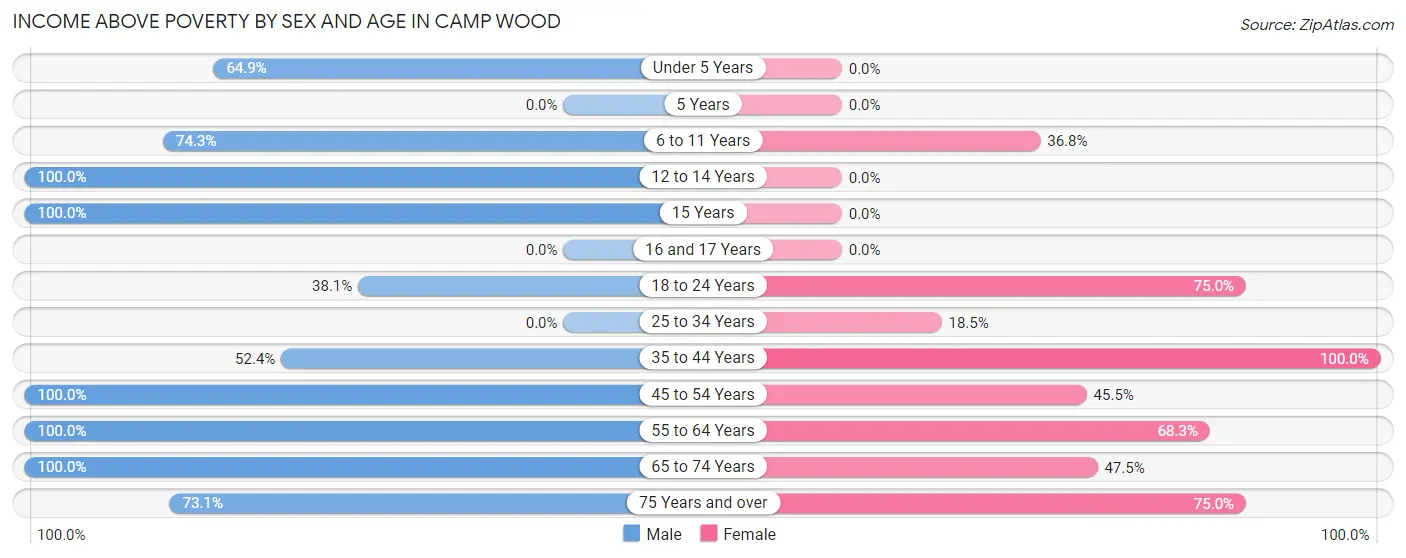
| Age Bracket | Male | Female |
| Under 5 Years | 50 (64.9%) | 0 (0.0%) |
| 5 Years | 0 (0.0%) | 0 (0.0%) |
| 6 to 11 Years | 26 (74.3%) | 7 (36.8%) |
| 12 to 14 Years | 45 (100.0%) | 0 (0.0%) |
| 15 Years | 21 (100.0%) | 0 (0.0%) |
| 16 and 17 Years | 0 (0.0%) | 0 (0.0%) |
| 18 to 24 Years | 16 (38.1%) | 45 (75.0%) |
| 25 to 34 Years | 0 (0.0%) | 5 (18.5%) |
| 35 to 44 Years | 11 (52.4%) | 74 (100.0%) |
| 45 to 54 Years | 23 (100.0%) | 55 (45.5%) |
| 55 to 64 Years | 55 (100.0%) | 28 (68.3%) |
| 65 to 74 Years | 11 (100.0%) | 28 (47.5%) |
| 75 Years and over | 19 (73.1%) | 27 (75.0%) |
| Total | 277 (68.4%) | 269 (56.0%) |
Income Below Poverty Among Married-Couple Families in Camp Wood
The poverty statistics for married-couple families in Camp Wood show that 4.8% or 5 of the total 104 families live below the poverty line. Families with 1 or 2 children have the highest poverty rate of 15.1%, comprising of 5 families. On the other hand, families with no children have the lowest poverty rate of 0.0%, which includes 0 families.
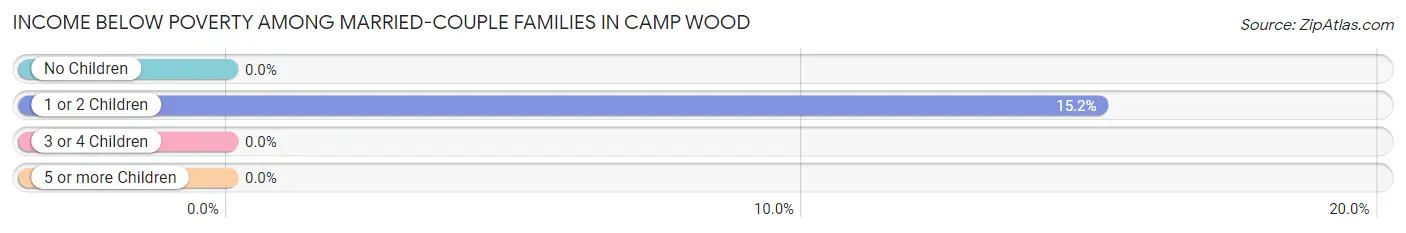
| Children | Above Poverty | Below Poverty |
| No Children | 61 (100.0%) | 0 (0.0%) |
| 1 or 2 Children | 28 (84.9%) | 5 (15.1%) |
| 3 or 4 Children | 0 (0.0%) | 0 (0.0%) |
| 5 or more Children | 10 (100.0%) | 0 (0.0%) |
| Total | 99 (95.2%) | 5 (4.8%) |
Income Below Poverty Among Single-Parent Households in Camp Wood
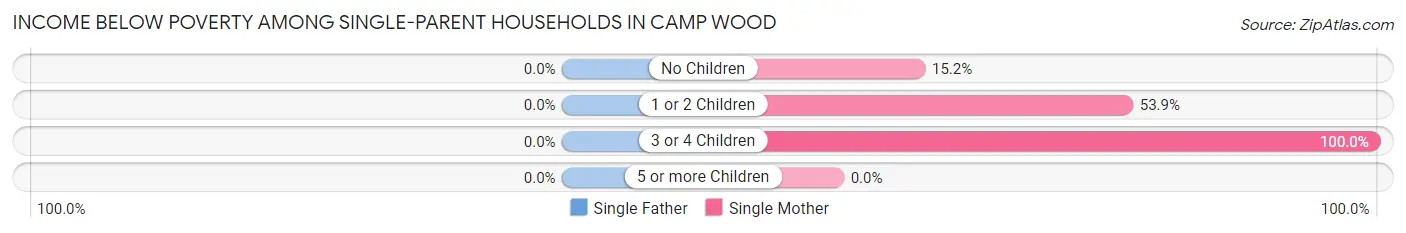
| Children | Single Father | Single Mother |
| No Children | 0 (0.0%) | 5 (15.1%) |
| 1 or 2 Children | 0 (0.0%) | 7 (53.8%) |
| 3 or 4 Children | 0 (0.0%) | 5 (100.0%) |
| 5 or more Children | 0 (0.0%) | 0 (0.0%) |
| Total | 0 (0.0%) | 17 (33.3%) |
Income Below Poverty Among Married-Couple vs Single-Parent Households in Camp Wood
The poverty data for Camp Wood shows that 5 of the married-couple family households (4.8%) and 17 of the single-parent households (33.3%) are living below the poverty level. Within the married-couple family households, those with 1 or 2 children have the highest poverty rate, with 5 households (15.1%) falling below the poverty line. Among the single-parent households, those with 3 or 4 children have the highest poverty rate, with 5 household (100.0%) living below poverty.
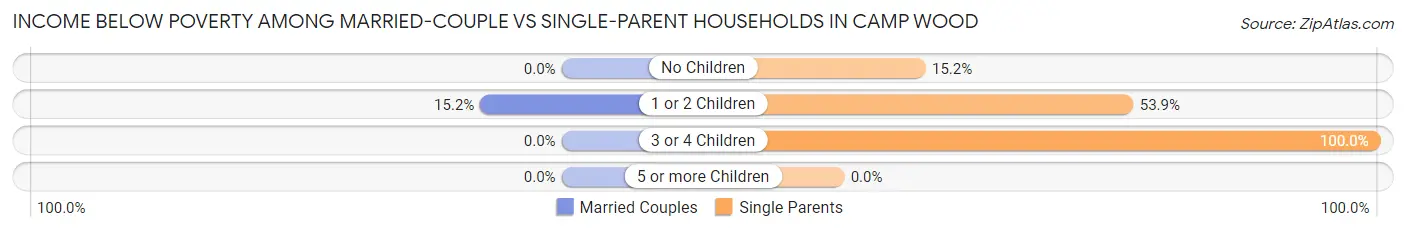
| Children | Married-Couple Families | Single-Parent Households |
| No Children | 0 (0.0%) | 5 (15.1%) |
| 1 or 2 Children | 5 (15.1%) | 7 (53.8%) |
| 3 or 4 Children | 0 (0.0%) | 5 (100.0%) |
| 5 or more Children | 0 (0.0%) | 0 (0.0%) |
| Total | 5 (4.8%) | 17 (33.3%) |
Race in Camp Wood
The most populous races in Camp Wood are White / Caucasian (960 | 99.0%), Hispanic or Latino (370 | 38.1%), and Two or more Races (7 | 0.7%).
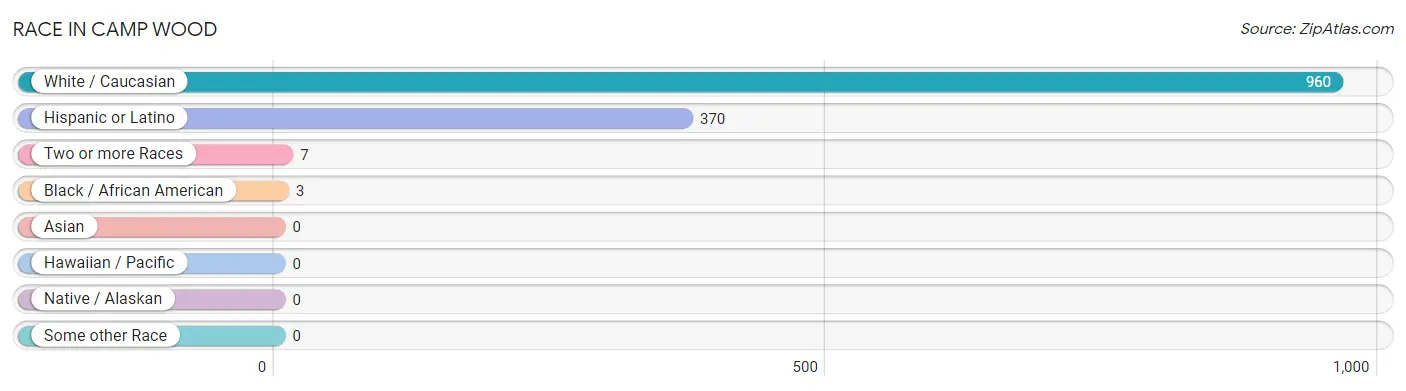
| Race | # Population | % Population |
| Asian | 0 | 0.0% |
| Black / African American | 3 | 0.3% |
| Hawaiian / Pacific | 0 | 0.0% |
| Hispanic or Latino | 370 | 38.1% |
| Native / Alaskan | 0 | 0.0% |
| White / Caucasian | 960 | 99.0% |
| Two or more Races | 7 | 0.7% |
| Some other Race | 0 | 0.0% |
| Total | 970 | 100.0% |
Ancestry in Camp Wood
The most populous ancestries reported in Camp Wood are Mexican (367 | 37.8%), German (273 | 28.1%), Greek (124 | 12.8%), Irish (59 | 6.1%), and Polish (33 | 3.4%), together accounting for 88.2% of all Camp Wood residents.
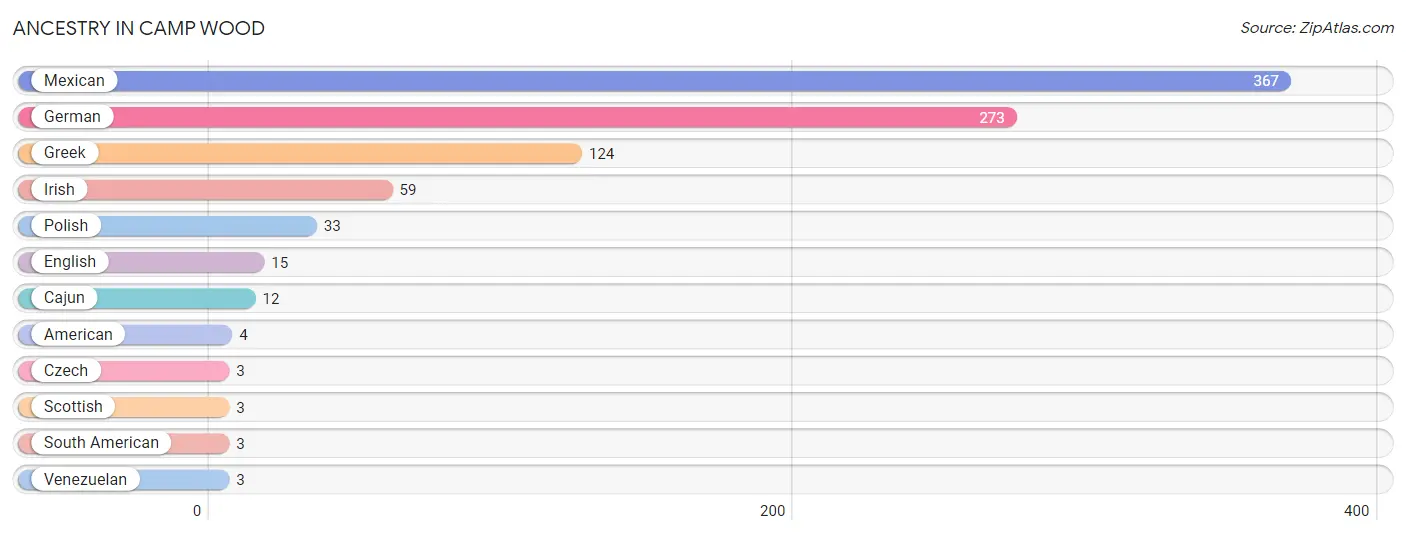
| Ancestry | # Population | % Population |
| American | 4 | 0.4% |
| Cajun | 12 | 1.2% |
| Czech | 3 | 0.3% |
| English | 15 | 1.5% |
| German | 273 | 28.1% |
| Greek | 124 | 12.8% |
| Irish | 59 | 6.1% |
| Mexican | 367 | 37.8% |
| Polish | 33 | 3.4% |
| Scottish | 3 | 0.3% |
| South American | 3 | 0.3% |
| Venezuelan | 3 | 0.3% | View All 12 Rows |
Immigrants in Camp Wood
The most numerous immigrant groups reported in Camp Wood came from Latin America (7 | 0.7%), Central America (4 | 0.4%), Mexico (4 | 0.4%), South America (3 | 0.3%), and Venezuela (3 | 0.3%), together accounting for 2.2% of all Camp Wood residents.
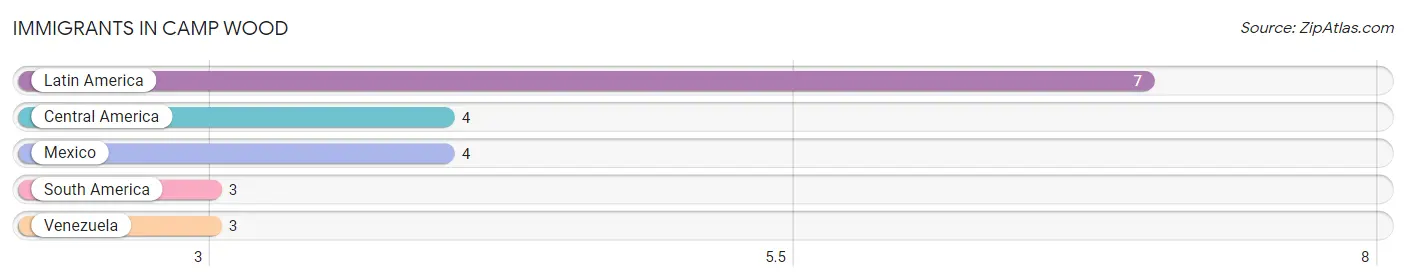
| Immigration Origin | # Population | % Population |
| Central America | 4 | 0.4% |
| Latin America | 7 | 0.7% |
| Mexico | 4 | 0.4% |
| South America | 3 | 0.3% |
| Venezuela | 3 | 0.3% | View All 5 Rows |
Sex and Age in Camp Wood
Sex and Age in Camp Wood
The most populous age groups in Camp Wood are Under 5 Years (77 | 16.4%) for men and 45 to 49 Years (92 | 18.4%) for women.
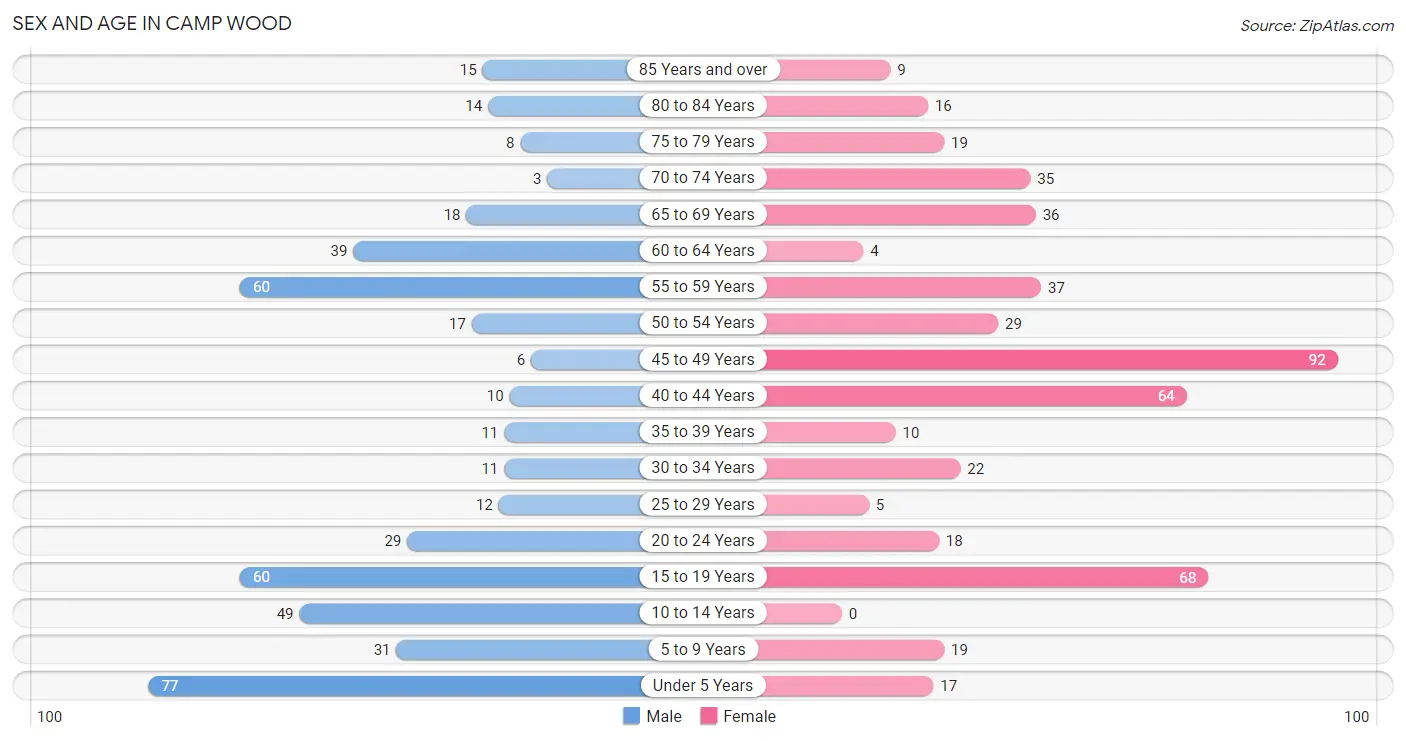
| Age Bracket | Male | Female |
| Under 5 Years | 77 (16.4%) | 17 (3.4%) |
| 5 to 9 Years | 31 (6.6%) | 19 (3.8%) |
| 10 to 14 Years | 49 (10.4%) | 0 (0.0%) |
| 15 to 19 Years | 60 (12.8%) | 68 (13.6%) |
| 20 to 24 Years | 29 (6.2%) | 18 (3.6%) |
| 25 to 29 Years | 12 (2.5%) | 5 (1.0%) |
| 30 to 34 Years | 11 (2.3%) | 22 (4.4%) |
| 35 to 39 Years | 11 (2.3%) | 10 (2.0%) |
| 40 to 44 Years | 10 (2.1%) | 64 (12.8%) |
| 45 to 49 Years | 6 (1.3%) | 92 (18.4%) |
| 50 to 54 Years | 17 (3.6%) | 29 (5.8%) |
| 55 to 59 Years | 60 (12.8%) | 37 (7.4%) |
| 60 to 64 Years | 39 (8.3%) | 4 (0.8%) |
| 65 to 69 Years | 18 (3.8%) | 36 (7.2%) |
| 70 to 74 Years | 3 (0.6%) | 35 (7.0%) |
| 75 to 79 Years | 8 (1.7%) | 19 (3.8%) |
| 80 to 84 Years | 14 (3.0%) | 16 (3.2%) |
| 85 Years and over | 15 (3.2%) | 9 (1.8%) |
| Total | 470 (100.0%) | 500 (100.0%) |
Families and Households in Camp Wood
Median Family Size in Camp Wood
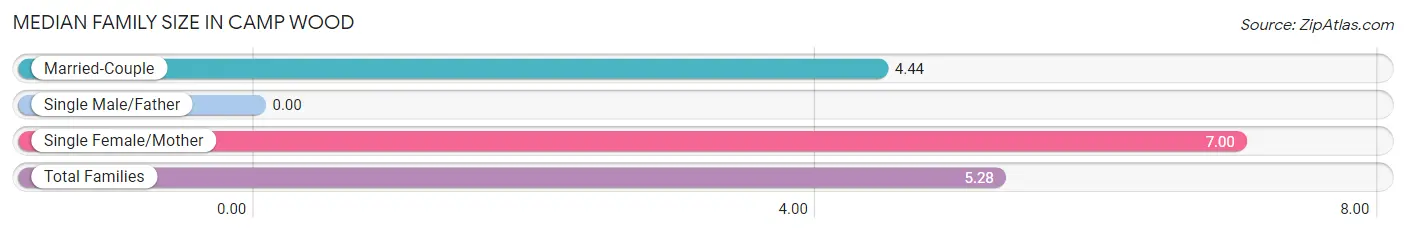
| Family Type | # Families | Family Size |
| Married-Couple | 104 (67.1%) | 4.44 |
| Single Male/Father | 0 (0.0%) | - |
| Single Female/Mother | 51 (32.9%) | 7.00 |
| Total Families | 155 (100.0%) | 5.28 |
Median Household Size in Camp Wood
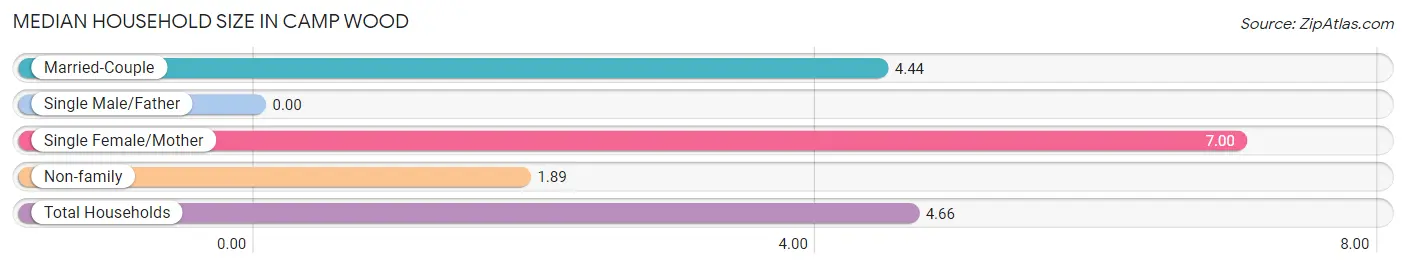
| Household Type | # Households | Household Size |
| Married-Couple | 104 (54.7%) | 4.44 |
| Single Male/Father | 0 (0.0%) | - |
| Single Female/Mother | 51 (26.8%) | 7.00 |
| Non-family | 35 (18.4%) | 1.89 |
| Total Households | 190 (100.0%) | 4.66 |
Household Size by Marriage Status in Camp Wood
Out of a total of 190 households in Camp Wood, 155 (81.6%) are family households, while 35 (18.4%) are nonfamily households. The most numerous type of family households are 2-person households, comprising 72, and the most common type of nonfamily households are 1-person households, comprising 28.
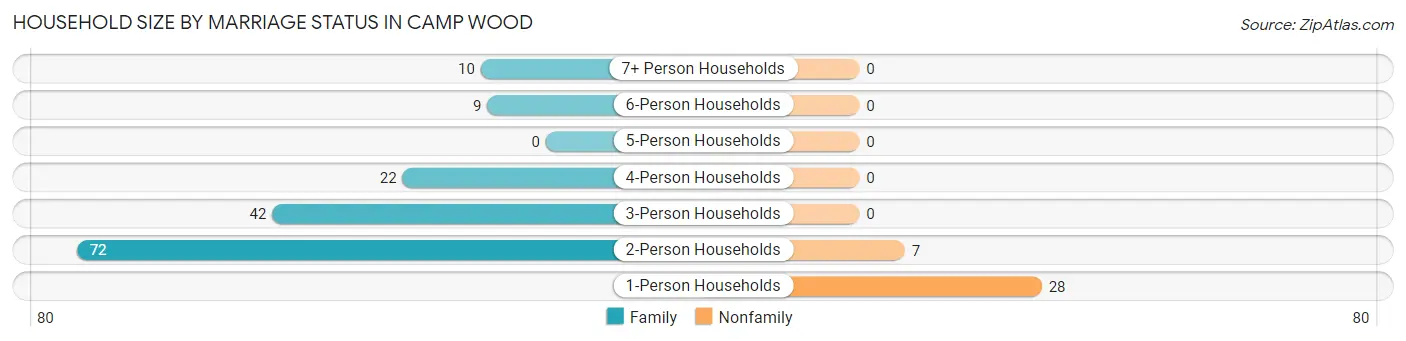
| Household Size | Family Households | Nonfamily Households |
| 1-Person Households | - | 28 (14.7%) |
| 2-Person Households | 72 (37.9%) | 7 (3.7%) |
| 3-Person Households | 42 (22.1%) | 0 (0.0%) |
| 4-Person Households | 22 (11.6%) | 0 (0.0%) |
| 5-Person Households | 0 (0.0%) | 0 (0.0%) |
| 6-Person Households | 9 (4.7%) | 0 (0.0%) |
| 7+ Person Households | 10 (5.3%) | 0 (0.0%) |
| Total | 155 (81.6%) | 35 (18.4%) |
Female Fertility in Camp Wood
Fertility by Age in Camp Wood
Average fertility rate in Camp Wood is 60.0 births per 1,000 women. Women in the age bracket of 20 to 34 years have the highest fertility rate with 378.0 births per 1,000 women. Women in the age bracket of 20 to 34 years acount for 100.0% of all women with births.
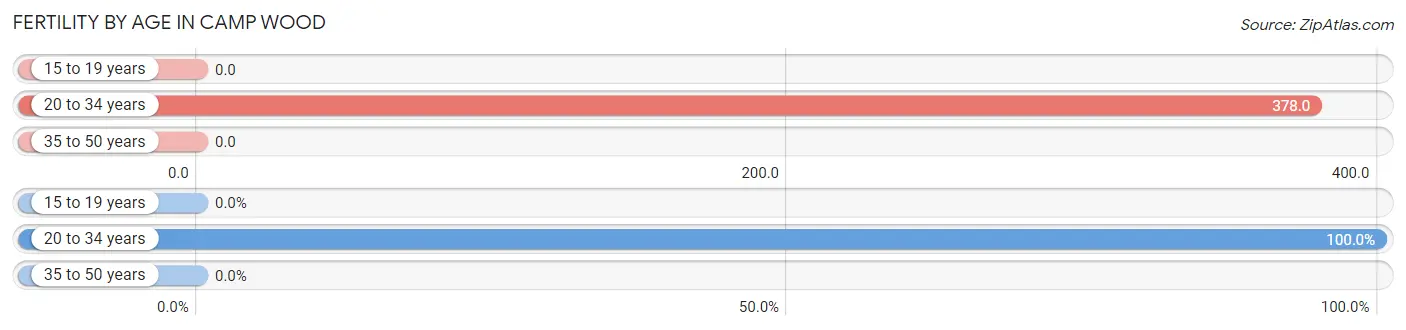
| Age Bracket | Women with Births | Births / 1,000 Women |
| 15 to 19 years | 0 (0.0%) | 0.0 |
| 20 to 34 years | 17 (100.0%) | 378.0 |
| 35 to 50 years | 0 (0.0%) | 0.0 |
| Total | 17 (100.0%) | 60.0 |
Fertility by Age by Marriage Status in Camp Wood
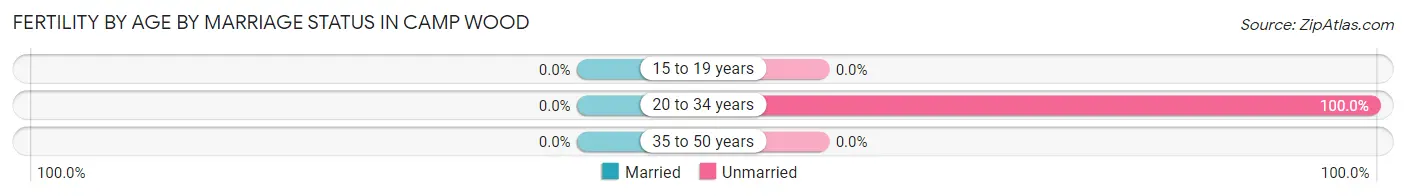
| Age Bracket | Married | Unmarried |
| 15 to 19 years | 0 (0.0%) | 0 (0.0%) |
| 20 to 34 years | 0 (0.0%) | 17 (100.0%) |
| 35 to 50 years | 0 (0.0%) | 0 (0.0%) |
| Total | 0 (0.0%) | 17 (100.0%) |
Fertility by Education in Camp Wood
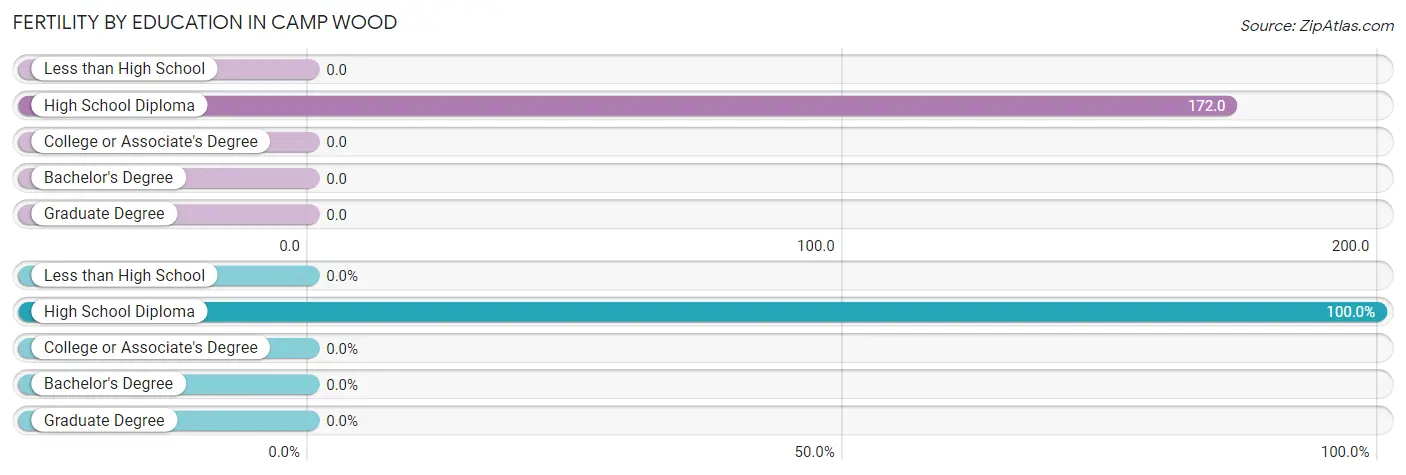
| Educational Attainment | Women with Births | Births / 1,000 Women |
| Less than High School | 0 (0.0%) | 0.0 |
| High School Diploma | 17 (100.0%) | 172.0 |
| College or Associate's Degree | 0 (0.0%) | 0.0 |
| Bachelor's Degree | 0 (0.0%) | 0.0 |
| Graduate Degree | 0 (0.0%) | 0.0 |
| Total | 17 (100.0%) | 60.0 |
Fertility by Education by Marriage Status in Camp Wood
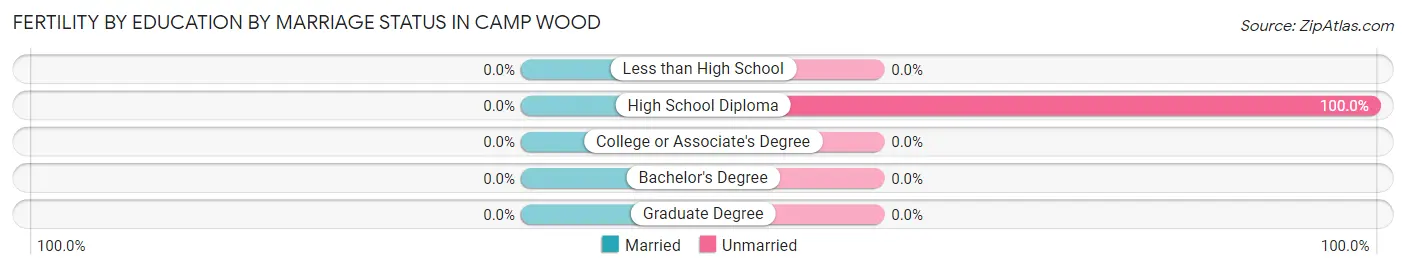
| Educational Attainment | Married | Unmarried |
| Less than High School | 0 (0.0%) | 0 (0.0%) |
| High School Diploma | 0 (0.0%) | 17 (100.0%) |
| College or Associate's Degree | 0 (0.0%) | 0 (0.0%) |
| Bachelor's Degree | 0 (0.0%) | 0 (0.0%) |
| Graduate Degree | 0 (0.0%) | 0 (0.0%) |
| Total | 0 (0.0%) | 17 (100.0%) |
Employment Characteristics in Camp Wood
Employment by Class of Employer in Camp Wood
Among the 210 employed individuals in Camp Wood, private company employees (115 | 54.8%), self-employed (not incorporated) (54 | 25.7%), and state government employees (36 | 17.1%) make up the most common classes of employment.
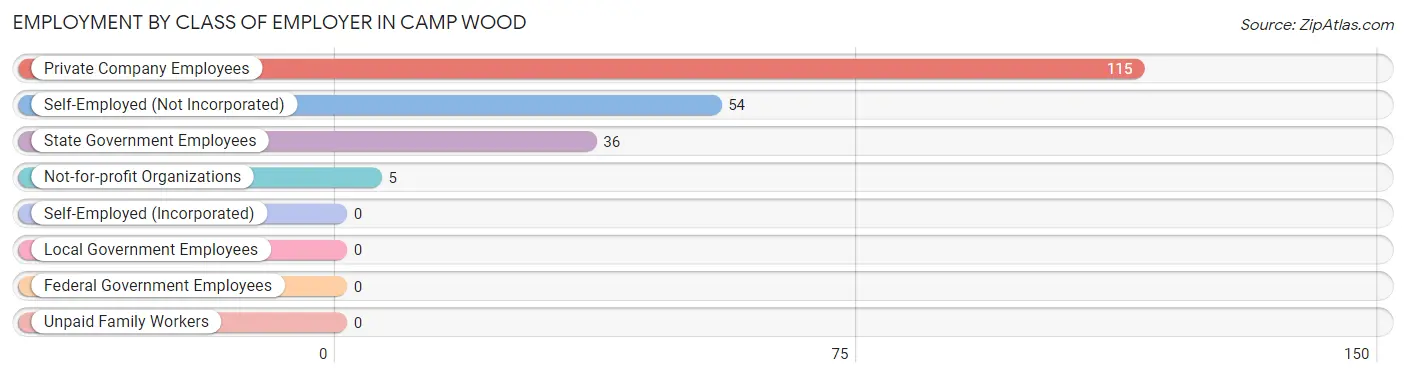
| Employer Class | # Employees | % Employees |
| Private Company Employees | 115 | 54.8% |
| Self-Employed (Incorporated) | 0 | 0.0% |
| Self-Employed (Not Incorporated) | 54 | 25.7% |
| Not-for-profit Organizations | 5 | 2.4% |
| Local Government Employees | 0 | 0.0% |
| State Government Employees | 36 | 17.1% |
| Federal Government Employees | 0 | 0.0% |
| Unpaid Family Workers | 0 | 0.0% |
| Total | 210 | 100.0% |
Employment Status by Age in Camp Wood
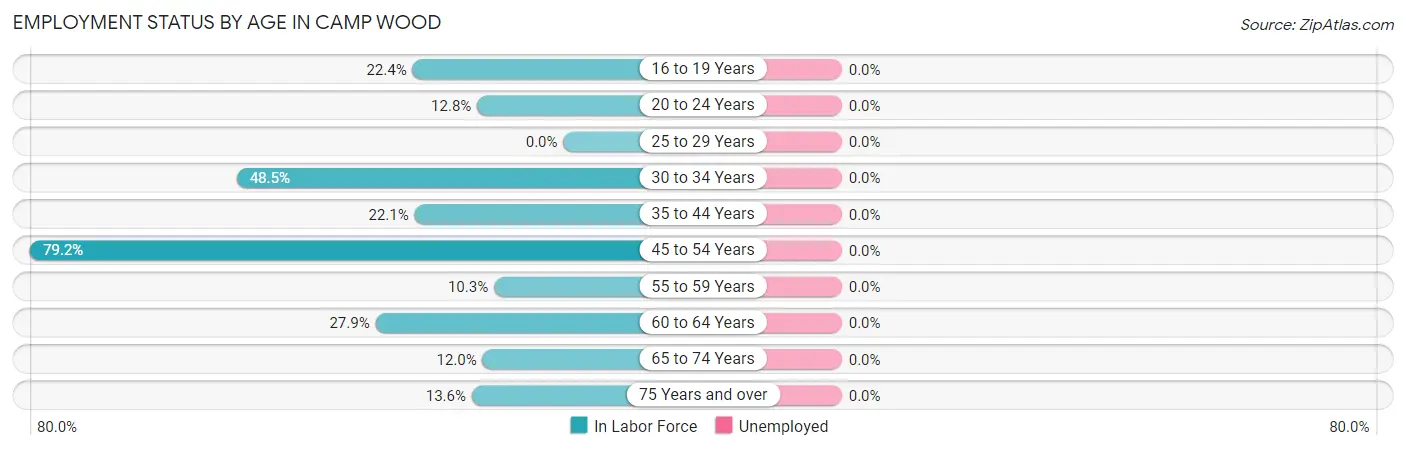
| Age Bracket | In Labor Force | Unemployed |
| 16 to 19 Years | 24 (22.4%) | 0 (0.0%) |
| 20 to 24 Years | 6 (12.8%) | 0 (0.0%) |
| 25 to 29 Years | 0 (0.0%) | 0 (0.0%) |
| 30 to 34 Years | 16 (48.5%) | 0 (0.0%) |
| 35 to 44 Years | 21 (22.1%) | 0 (0.0%) |
| 45 to 54 Years | 114 (79.2%) | 0 (0.0%) |
| 55 to 59 Years | 10 (10.3%) | 0 (0.0%) |
| 60 to 64 Years | 12 (27.9%) | 0 (0.0%) |
| 65 to 74 Years | 11 (12.0%) | 0 (0.0%) |
| 75 Years and over | 11 (13.6%) | 0 (0.0%) |
| Total | 225 (29.8%) | 0 (0.0%) |
Employment Status by Educational Attainment in Camp Wood
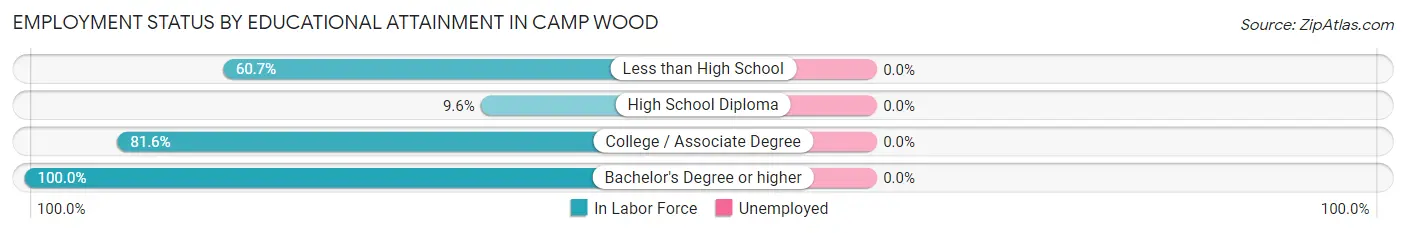
| Educational Attainment | In Labor Force | Unemployed |
| Less than High School | 17 (60.7%) | 0 (0.0%) |
| High School Diploma | 23 (9.6%) | 0 (0.0%) |
| College / Associate Degree | 129 (81.6%) | 0 (0.0%) |
| Bachelor's Degree or higher | 4 (100.0%) | 0 (0.0%) |
| Total | 173 (40.3%) | 0 (0.0%) |
Employment Occupations by Sex in Camp Wood
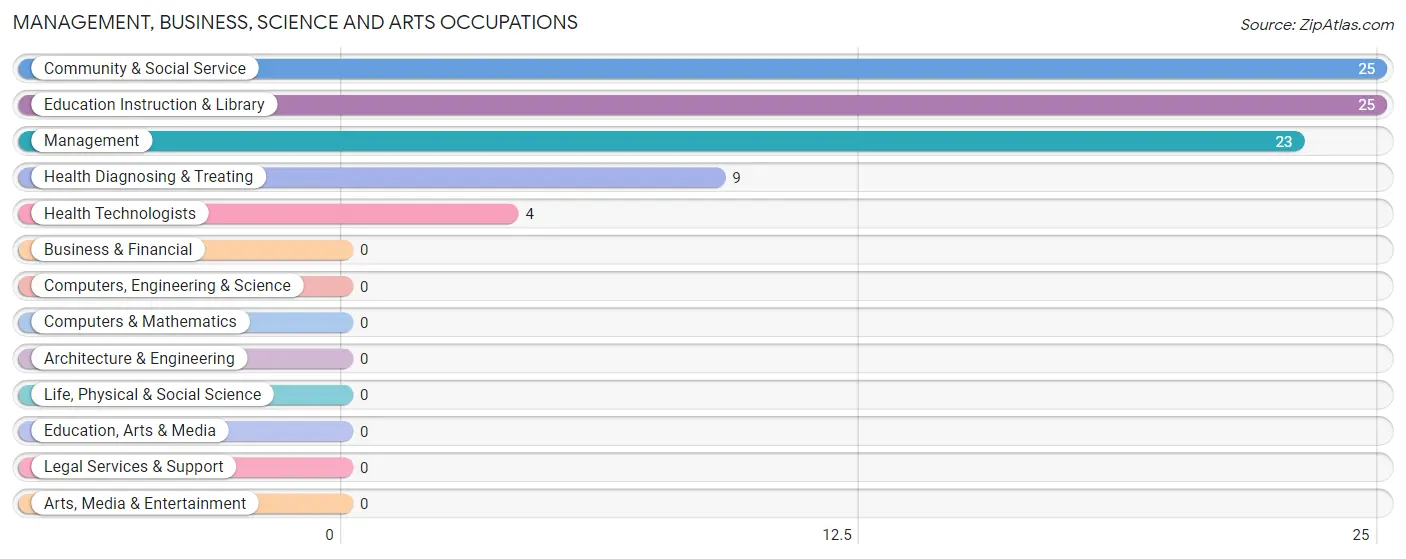
Management, Business, Science and Arts Occupations
The most common Management, Business, Science and Arts occupations in Camp Wood are Community & Social Service (25 | 11.1%), Education Instruction & Library (25 | 11.1%), Management (23 | 10.2%), Health Diagnosing & Treating (9 | 4.0%), and Health Technologists (4 | 1.8%).
Management, Business, Science and Arts Occupations by Sex
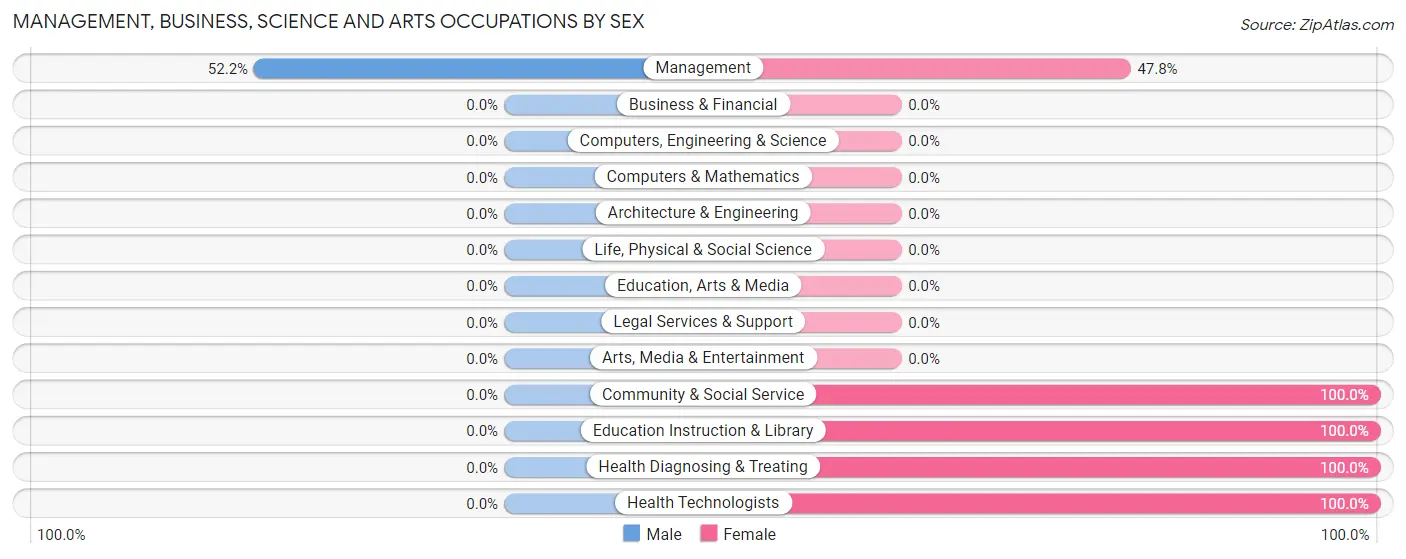
| Occupation | Male | Female |
| Management | 12 (52.2%) | 11 (47.8%) |
| Business & Financial | 0 (0.0%) | 0 (0.0%) |
| Computers, Engineering & Science | 0 (0.0%) | 0 (0.0%) |
| Computers & Mathematics | 0 (0.0%) | 0 (0.0%) |
| Architecture & Engineering | 0 (0.0%) | 0 (0.0%) |
| Life, Physical & Social Science | 0 (0.0%) | 0 (0.0%) |
| Community & Social Service | 0 (0.0%) | 25 (100.0%) |
| Education, Arts & Media | 0 (0.0%) | 0 (0.0%) |
| Legal Services & Support | 0 (0.0%) | 0 (0.0%) |
| Education Instruction & Library | 0 (0.0%) | 25 (100.0%) |
| Arts, Media & Entertainment | 0 (0.0%) | 0 (0.0%) |
| Health Diagnosing & Treating | 0 (0.0%) | 9 (100.0%) |
| Health Technologists | 0 (0.0%) | 4 (100.0%) |
| Total (Category) | 12 (21.0%) | 45 (78.9%) |
| Total (Overall) | 71 (31.6%) | 154 (68.4%) |
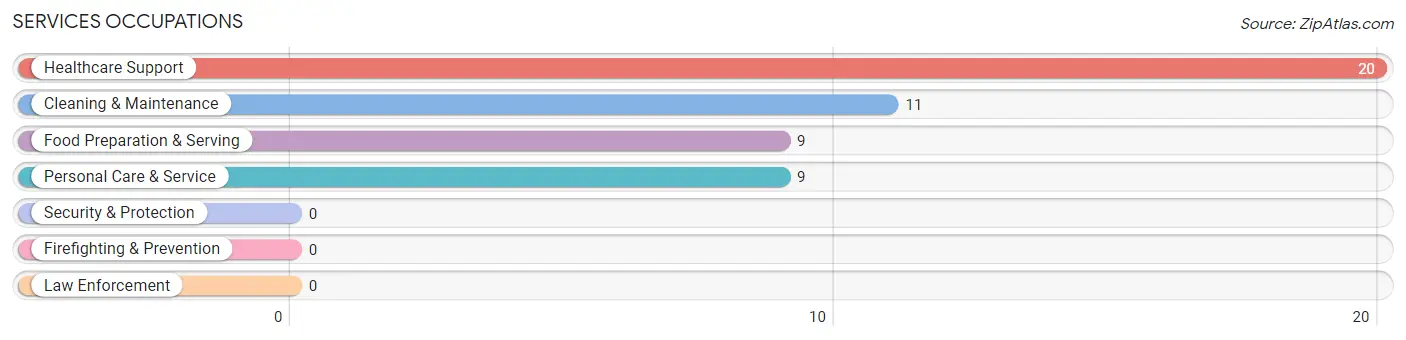
Services Occupations
The most common Services occupations in Camp Wood are Healthcare Support (20 | 8.9%), Cleaning & Maintenance (11 | 4.9%), Food Preparation & Serving (9 | 4.0%), and Personal Care & Service (9 | 4.0%).
Services Occupations by Sex
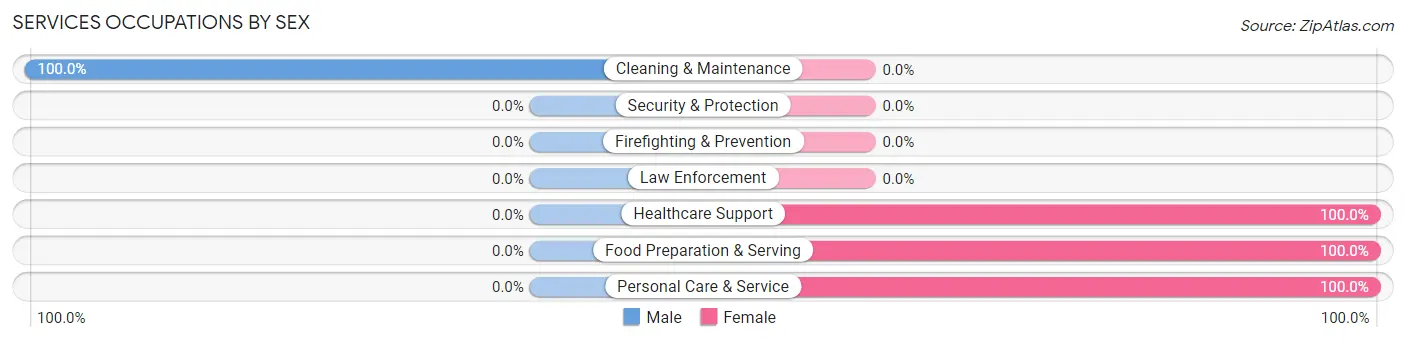
| Occupation | Male | Female |
| Healthcare Support | 0 (0.0%) | 20 (100.0%) |
| Security & Protection | 0 (0.0%) | 0 (0.0%) |
| Firefighting & Prevention | 0 (0.0%) | 0 (0.0%) |
| Law Enforcement | 0 (0.0%) | 0 (0.0%) |
| Food Preparation & Serving | 0 (0.0%) | 9 (100.0%) |
| Cleaning & Maintenance | 11 (100.0%) | 0 (0.0%) |
| Personal Care & Service | 0 (0.0%) | 9 (100.0%) |
| Total (Category) | 11 (22.5%) | 38 (77.5%) |
| Total (Overall) | 71 (31.6%) | 154 (68.4%) |
Sales and Office Occupations
The most common Sales and Office occupations in Camp Wood are , and Sales & Related (64 | 28.4%).
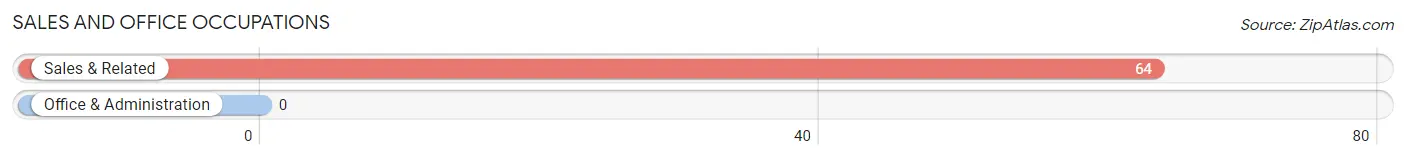
Sales and Office Occupations by Sex
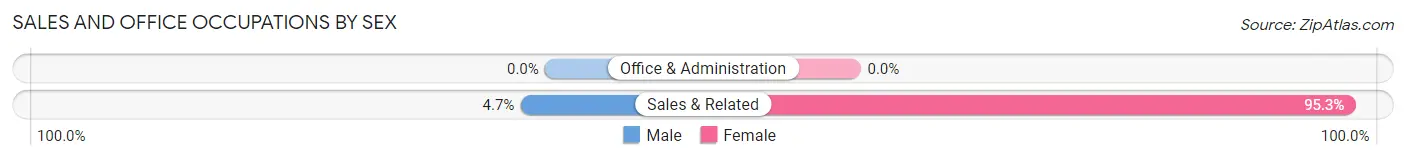
| Occupation | Male | Female |
| Sales & Related | 3 (4.7%) | 61 (95.3%) |
| Office & Administration | 0 (0.0%) | 0 (0.0%) |
| Total (Category) | 3 (4.7%) | 61 (95.3%) |
| Total (Overall) | 71 (31.6%) | 154 (68.4%) |
Natural Resources, Construction and Maintenance Occupations
The most common Natural Resources, Construction and Maintenance occupations in Camp Wood are , and Construction & Extraction (33 | 14.7%).
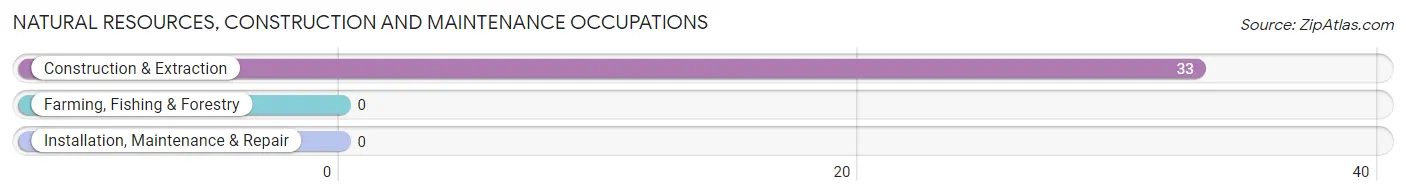
Natural Resources, Construction and Maintenance Occupations by Sex
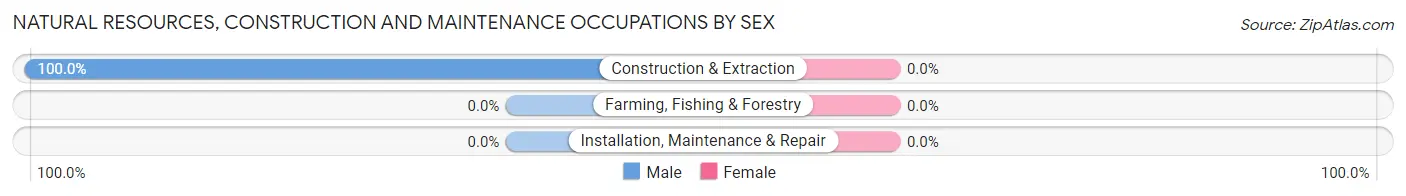
| Occupation | Male | Female |
| Farming, Fishing & Forestry | 0 (0.0%) | 0 (0.0%) |
| Construction & Extraction | 33 (100.0%) | 0 (0.0%) |
| Installation, Maintenance & Repair | 0 (0.0%) | 0 (0.0%) |
| Total (Category) | 33 (100.0%) | 0 (0.0%) |
| Total (Overall) | 71 (31.6%) | 154 (68.4%) |
Production, Transportation and Moving Occupations
The most common Production, Transportation and Moving occupations in Camp Wood are Transportation (16 | 7.1%), and Material Moving (6 | 2.7%).
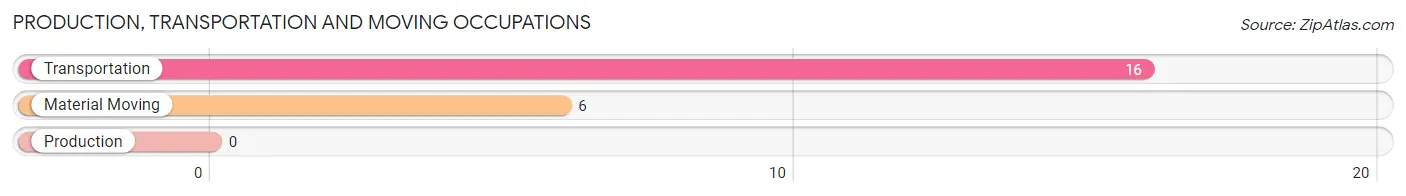
Production, Transportation and Moving Occupations by Sex
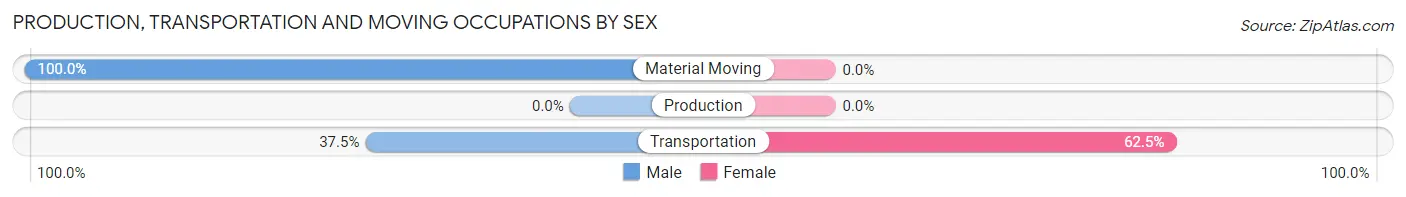
| Occupation | Male | Female |
| Production | 0 (0.0%) | 0 (0.0%) |
| Transportation | 6 (37.5%) | 10 (62.5%) |
| Material Moving | 6 (100.0%) | 0 (0.0%) |
| Total (Category) | 12 (54.5%) | 10 (45.5%) |
| Total (Overall) | 71 (31.6%) | 154 (68.4%) |
Employment Industries by Sex in Camp Wood
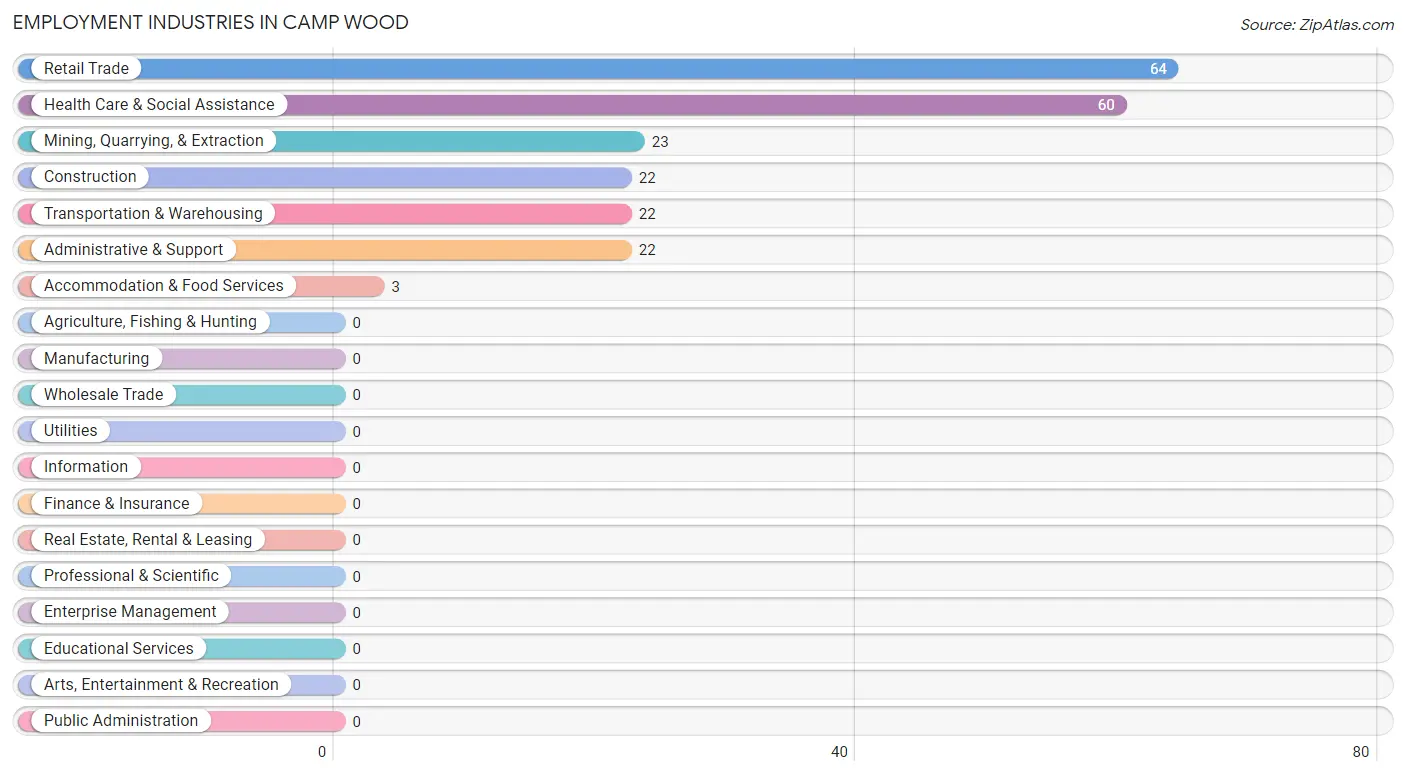
Employment Industries in Camp Wood
The major employment industries in Camp Wood include Retail Trade (64 | 28.4%), Health Care & Social Assistance (60 | 26.7%), Mining, Quarrying, & Extraction (23 | 10.2%), Construction (22 | 9.8%), and Transportation & Warehousing (22 | 9.8%).
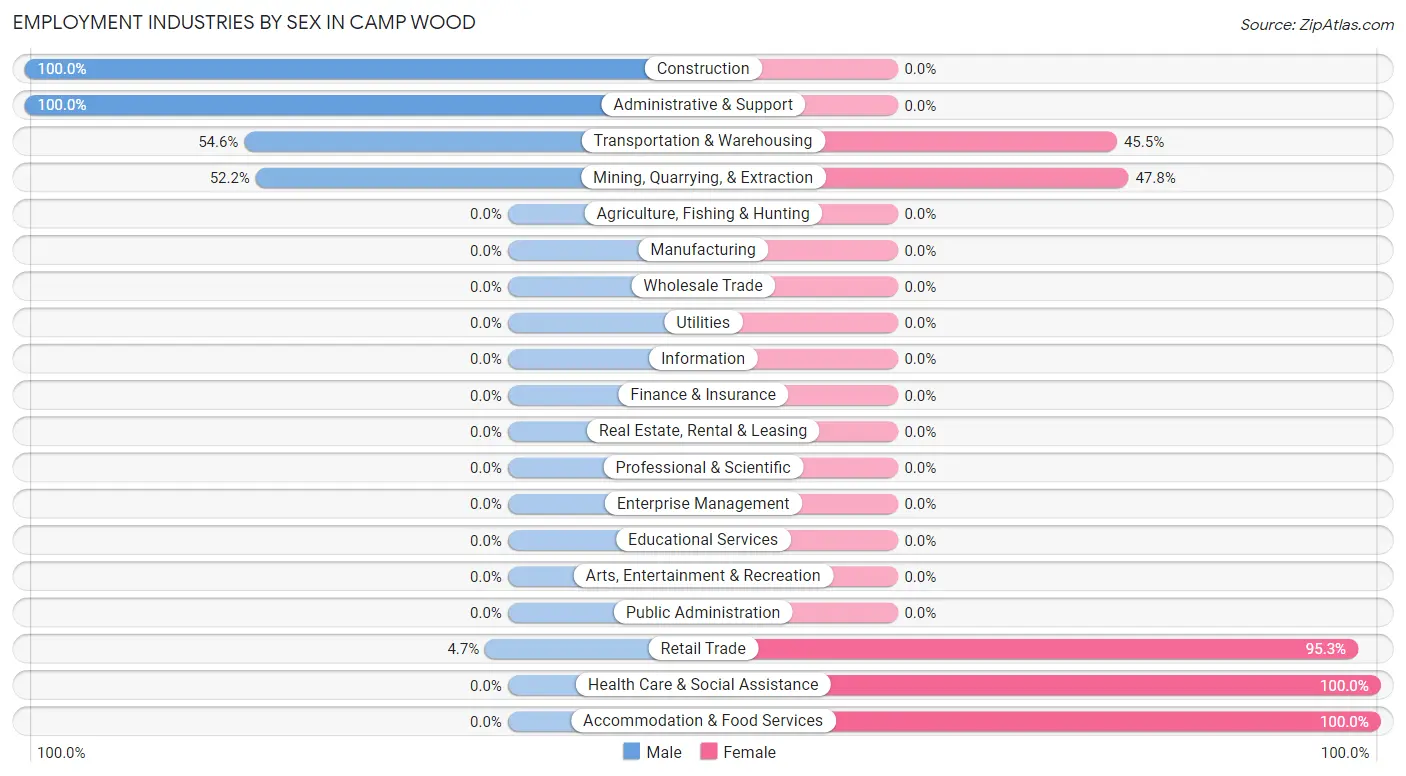
Employment Industries by Sex in Camp Wood
The Camp Wood industries that see more men than women are Construction (100.0%), Administrative & Support (100.0%), and Transportation & Warehousing (54.5%), whereas the industries that tend to have a higher number of women are Health Care & Social Assistance (100.0%), Accommodation & Food Services (100.0%), and Retail Trade (95.3%).
| Industry | Male | Female |
| Agriculture, Fishing & Hunting | 0 (0.0%) | 0 (0.0%) |
| Mining, Quarrying, & Extraction | 12 (52.2%) | 11 (47.8%) |
| Construction | 22 (100.0%) | 0 (0.0%) |
| Manufacturing | 0 (0.0%) | 0 (0.0%) |
| Wholesale Trade | 0 (0.0%) | 0 (0.0%) |
| Retail Trade | 3 (4.7%) | 61 (95.3%) |
| Transportation & Warehousing | 12 (54.5%) | 10 (45.5%) |
| Utilities | 0 (0.0%) | 0 (0.0%) |
| Information | 0 (0.0%) | 0 (0.0%) |
| Finance & Insurance | 0 (0.0%) | 0 (0.0%) |
| Real Estate, Rental & Leasing | 0 (0.0%) | 0 (0.0%) |
| Professional & Scientific | 0 (0.0%) | 0 (0.0%) |
| Enterprise Management | 0 (0.0%) | 0 (0.0%) |
| Administrative & Support | 22 (100.0%) | 0 (0.0%) |
| Educational Services | 0 (0.0%) | 0 (0.0%) |
| Health Care & Social Assistance | 0 (0.0%) | 60 (100.0%) |
| Arts, Entertainment & Recreation | 0 (0.0%) | 0 (0.0%) |
| Accommodation & Food Services | 0 (0.0%) | 3 (100.0%) |
| Public Administration | 0 (0.0%) | 0 (0.0%) |
| Total | 71 (31.6%) | 154 (68.4%) |
Education in Camp Wood
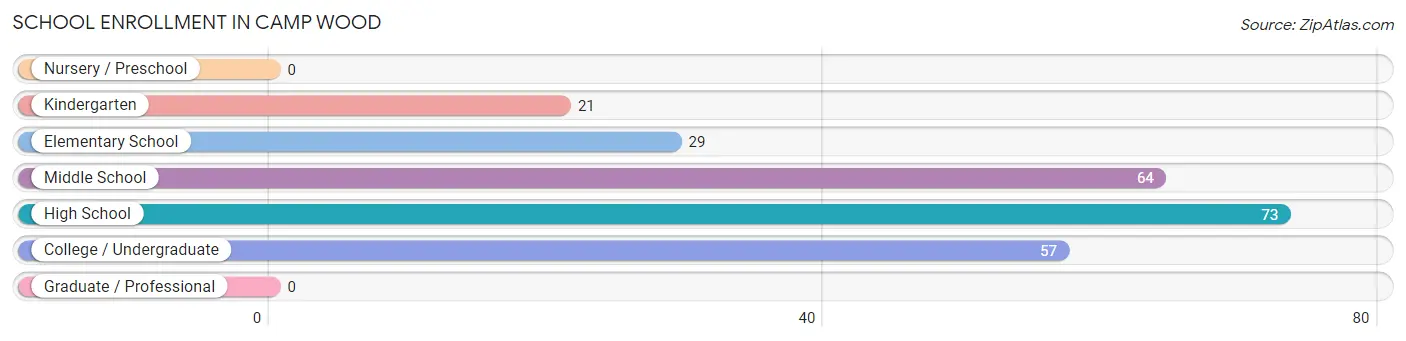
School Enrollment in Camp Wood
The most common levels of schooling among the 244 students in Camp Wood are high school (73 | 29.9%), middle school (64 | 26.2%), and college / undergraduate (57 | 23.4%).
| School Level | # Students | % Students |
| Nursery / Preschool | 0 | 0.0% |
| Kindergarten | 21 | 8.6% |
| Elementary School | 29 | 11.9% |
| Middle School | 64 | 26.2% |
| High School | 73 | 29.9% |
| College / Undergraduate | 57 | 23.4% |
| Graduate / Professional | 0 | 0.0% |
| Total | 244 | 100.0% |
School Enrollment by Age by Funding Source in Camp Wood
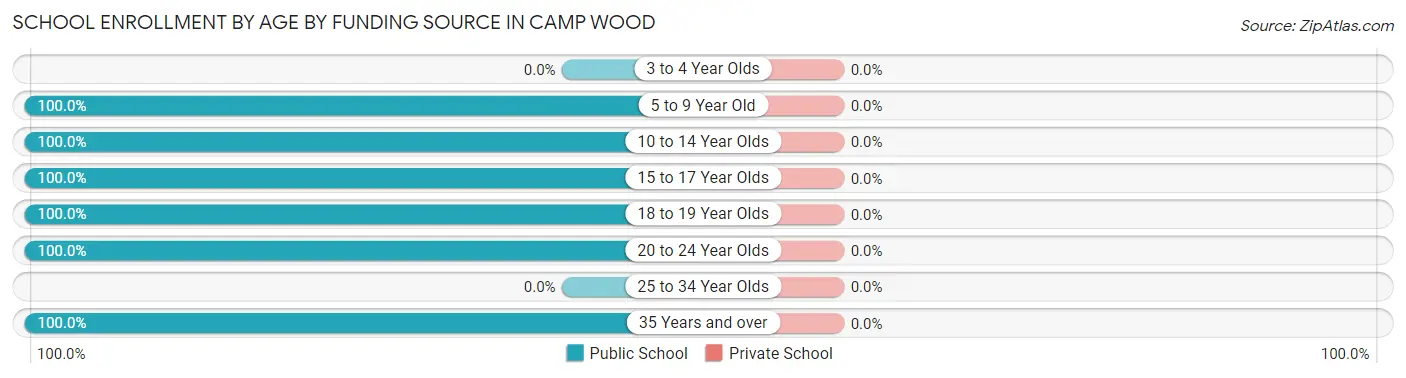
| Age Bracket | Public School | Private School |
| 3 to 4 Year Olds | 0 (0.0%) | 0 (0.0%) |
| 5 to 9 Year Old | 50 (100.0%) | 0 (0.0%) |
| 10 to 14 Year Olds | 49 (100.0%) | 0 (0.0%) |
| 15 to 17 Year Olds | 73 (100.0%) | 0 (0.0%) |
| 18 to 19 Year Olds | 21 (100.0%) | 0 (0.0%) |
| 20 to 24 Year Olds | 41 (100.0%) | 0 (0.0%) |
| 25 to 34 Year Olds | 0 (0.0%) | 0 (0.0%) |
| 35 Years and over | 10 (100.0%) | 0 (0.0%) |
| Total | 244 (100.0%) | 0 (0.0%) |
Educational Attainment by Field of Study in Camp Wood
Science & technology (8 | 50.0%), business (4 | 25.0%), and education (4 | 25.0%) are the most common fields of study among 16 individuals in Camp Wood who have obtained a bachelor's degree or higher.
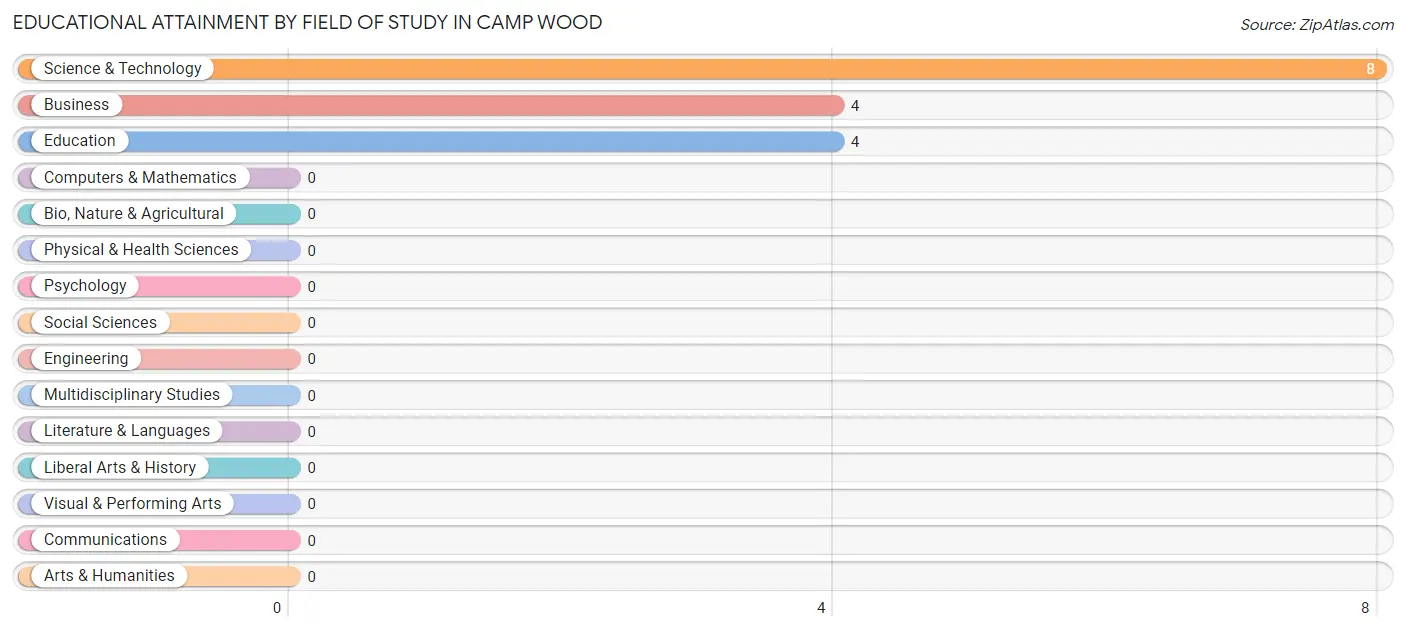
| Field of Study | # Graduates | % Graduates |
| Computers & Mathematics | 0 | 0.0% |
| Bio, Nature & Agricultural | 0 | 0.0% |
| Physical & Health Sciences | 0 | 0.0% |
| Psychology | 0 | 0.0% |
| Social Sciences | 0 | 0.0% |
| Engineering | 0 | 0.0% |
| Multidisciplinary Studies | 0 | 0.0% |
| Science & Technology | 8 | 50.0% |
| Business | 4 | 25.0% |
| Education | 4 | 25.0% |
| Literature & Languages | 0 | 0.0% |
| Liberal Arts & History | 0 | 0.0% |
| Visual & Performing Arts | 0 | 0.0% |
| Communications | 0 | 0.0% |
| Arts & Humanities | 0 | 0.0% |
| Total | 16 | 100.0% |
Transportation & Commute in Camp Wood
Vehicle Availability by Sex in Camp Wood
The most prevalent vehicle ownership categories in Camp Wood are males with 2 vehicles (29, accounting for 40.8%) and females with 2 vehicles (77, making up 20.9%).
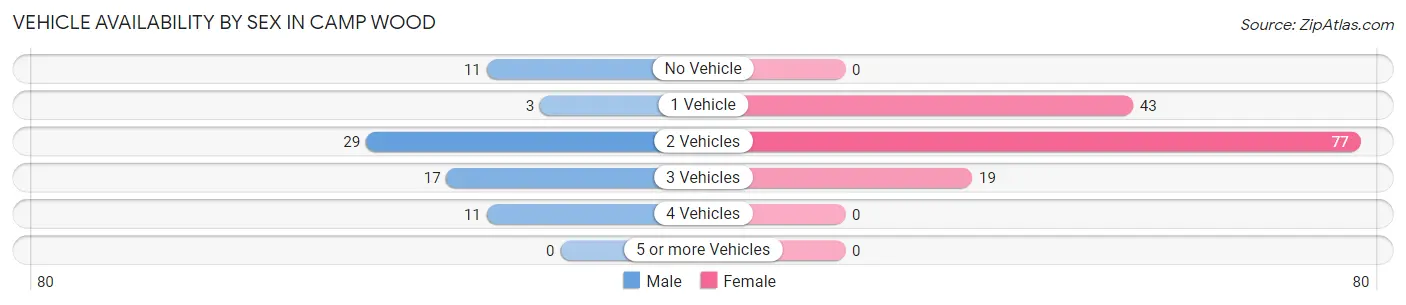
| Vehicles Available | Male | Female |
| No Vehicle | 11 (15.5%) | 0 (0.0%) |
| 1 Vehicle | 3 (4.2%) | 43 (30.9%) |
| 2 Vehicles | 29 (40.8%) | 77 (55.4%) |
| 3 Vehicles | 17 (23.9%) | 19 (13.7%) |
| 4 Vehicles | 11 (15.5%) | 0 (0.0%) |
| 5 or more Vehicles | 0 (0.0%) | 0 (0.0%) |
| Total | 71 (100.0%) | 139 (100.0%) |
Commute Time in Camp Wood
The most frequently occuring commute durations in Camp Wood are 5 to 9 minutes (118 commuters, 66.3%), 45 to 59 minutes (22 commuters, 12.4%), and 90 or more minutes (16 commuters, 9.0%).
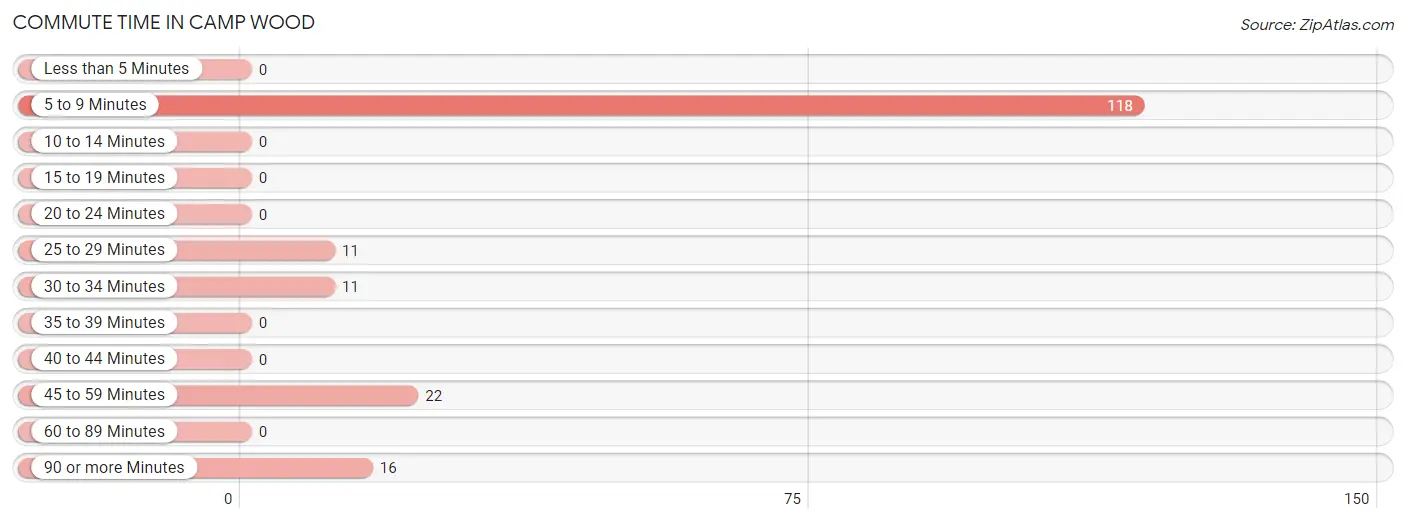
| Commute Time | # Commuters | % Commuters |
| Less than 5 Minutes | 0 | 0.0% |
| 5 to 9 Minutes | 118 | 66.3% |
| 10 to 14 Minutes | 0 | 0.0% |
| 15 to 19 Minutes | 0 | 0.0% |
| 20 to 24 Minutes | 0 | 0.0% |
| 25 to 29 Minutes | 11 | 6.2% |
| 30 to 34 Minutes | 11 | 6.2% |
| 35 to 39 Minutes | 0 | 0.0% |
| 40 to 44 Minutes | 0 | 0.0% |
| 45 to 59 Minutes | 22 | 12.4% |
| 60 to 89 Minutes | 0 | 0.0% |
| 90 or more Minutes | 16 | 9.0% |
Commute Time by Sex in Camp Wood
The most common commute times in Camp Wood are 45 to 59 minutes (17 commuters, 28.8%) for males and 5 to 9 minutes (104 commuters, 87.4%) for females.
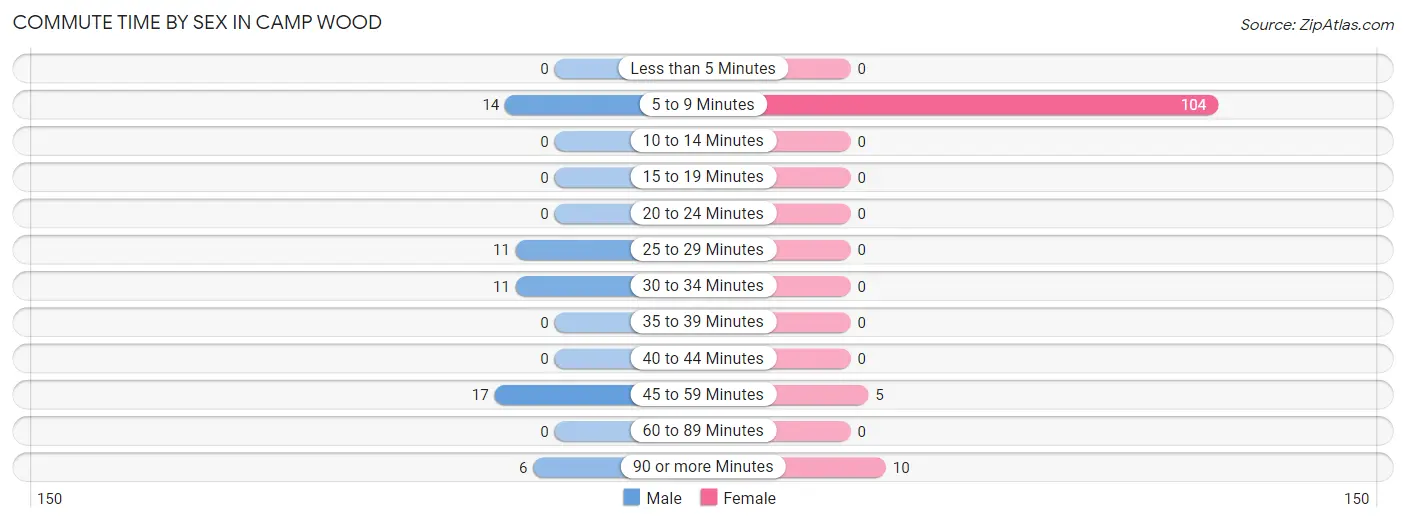
| Commute Time | Male | Female |
| Less than 5 Minutes | 0 (0.0%) | 0 (0.0%) |
| 5 to 9 Minutes | 14 (23.7%) | 104 (87.4%) |
| 10 to 14 Minutes | 0 (0.0%) | 0 (0.0%) |
| 15 to 19 Minutes | 0 (0.0%) | 0 (0.0%) |
| 20 to 24 Minutes | 0 (0.0%) | 0 (0.0%) |
| 25 to 29 Minutes | 11 (18.6%) | 0 (0.0%) |
| 30 to 34 Minutes | 11 (18.6%) | 0 (0.0%) |
| 35 to 39 Minutes | 0 (0.0%) | 0 (0.0%) |
| 40 to 44 Minutes | 0 (0.0%) | 0 (0.0%) |
| 45 to 59 Minutes | 17 (28.8%) | 5 (4.2%) |
| 60 to 89 Minutes | 0 (0.0%) | 0 (0.0%) |
| 90 or more Minutes | 6 (10.2%) | 10 (8.4%) |
Time of Departure to Work by Sex in Camp Wood
The most frequent times of departure to work in Camp Wood are 7:00 AM to 7:29 AM (20, 33.9%) for males and 6:00 AM to 6:29 AM (61, 51.3%) for females.
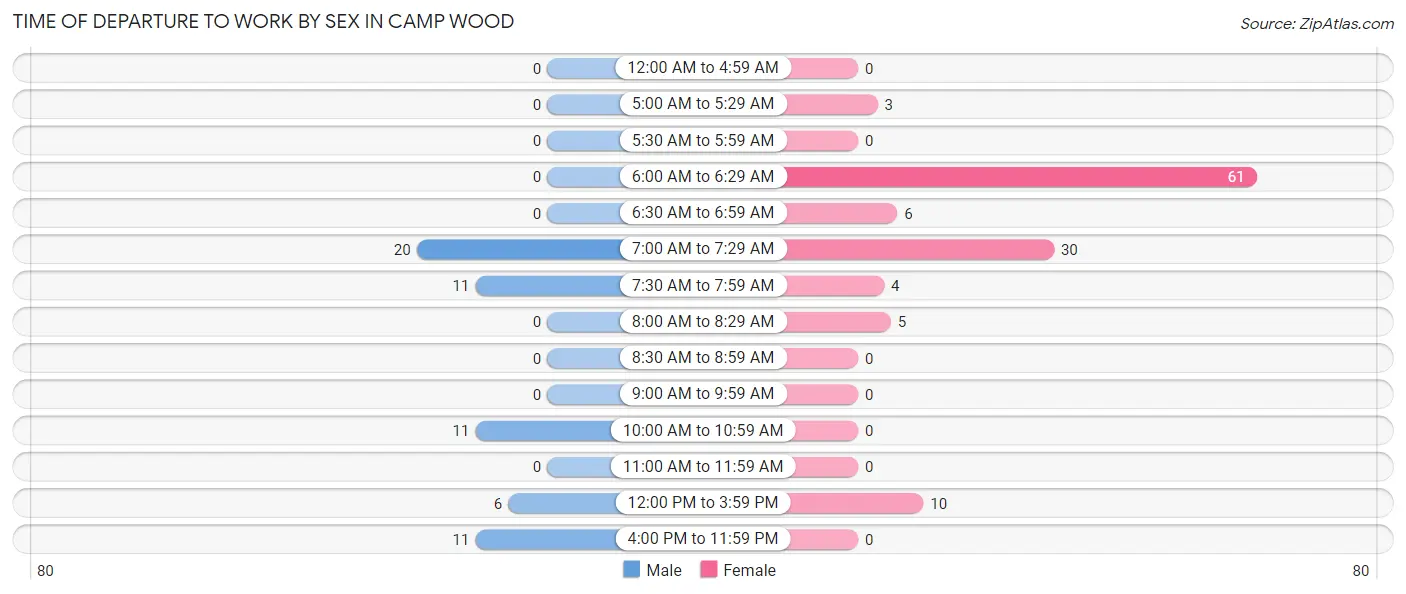
| Time of Departure | Male | Female |
| 12:00 AM to 4:59 AM | 0 (0.0%) | 0 (0.0%) |
| 5:00 AM to 5:29 AM | 0 (0.0%) | 3 (2.5%) |
| 5:30 AM to 5:59 AM | 0 (0.0%) | 0 (0.0%) |
| 6:00 AM to 6:29 AM | 0 (0.0%) | 61 (51.3%) |
| 6:30 AM to 6:59 AM | 0 (0.0%) | 6 (5.0%) |
| 7:00 AM to 7:29 AM | 20 (33.9%) | 30 (25.2%) |
| 7:30 AM to 7:59 AM | 11 (18.6%) | 4 (3.4%) |
| 8:00 AM to 8:29 AM | 0 (0.0%) | 5 (4.2%) |
| 8:30 AM to 8:59 AM | 0 (0.0%) | 0 (0.0%) |
| 9:00 AM to 9:59 AM | 0 (0.0%) | 0 (0.0%) |
| 10:00 AM to 10:59 AM | 11 (18.6%) | 0 (0.0%) |
| 11:00 AM to 11:59 AM | 0 (0.0%) | 0 (0.0%) |
| 12:00 PM to 3:59 PM | 6 (10.2%) | 10 (8.4%) |
| 4:00 PM to 11:59 PM | 11 (18.6%) | 0 (0.0%) |
| Total | 59 (100.0%) | 119 (100.0%) |
Housing Occupancy in Camp Wood
Occupancy by Ownership in Camp Wood
Of the total 190 dwellings in Camp Wood, owner-occupied units account for 119 (62.6%), while renter-occupied units make up 71 (37.4%).
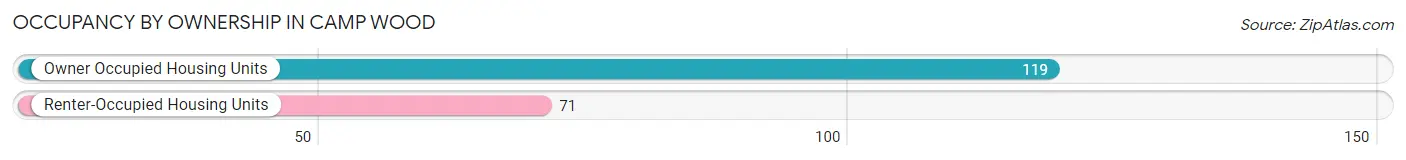
| Occupancy | # Housing Units | % Housing Units |
| Owner Occupied Housing Units | 119 | 62.6% |
| Renter-Occupied Housing Units | 71 | 37.4% |
| Total Occupied Housing Units | 190 | 100.0% |
Occupancy by Household Size in Camp Wood
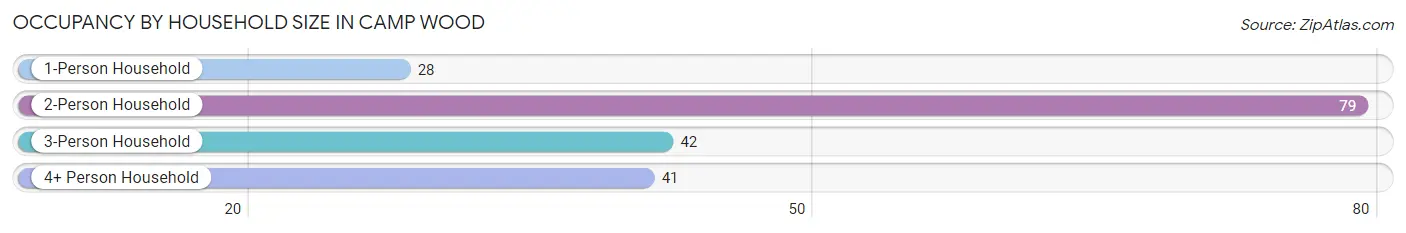
| Household Size | # Housing Units | % Housing Units |
| 1-Person Household | 28 | 14.7% |
| 2-Person Household | 79 | 41.6% |
| 3-Person Household | 42 | 22.1% |
| 4+ Person Household | 41 | 21.6% |
| Total Housing Units | 190 | 100.0% |
Occupancy by Ownership by Household Size in Camp Wood
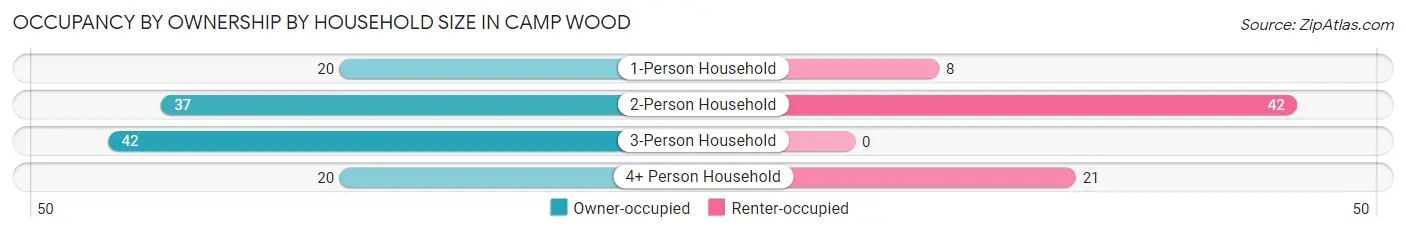
| Household Size | Owner-occupied | Renter-occupied |
| 1-Person Household | 20 (71.4%) | 8 (28.6%) |
| 2-Person Household | 37 (46.8%) | 42 (53.2%) |
| 3-Person Household | 42 (100.0%) | 0 (0.0%) |
| 4+ Person Household | 20 (48.8%) | 21 (51.2%) |
| Total Housing Units | 119 (62.6%) | 71 (37.4%) |
Occupancy by Educational Attainment in Camp Wood
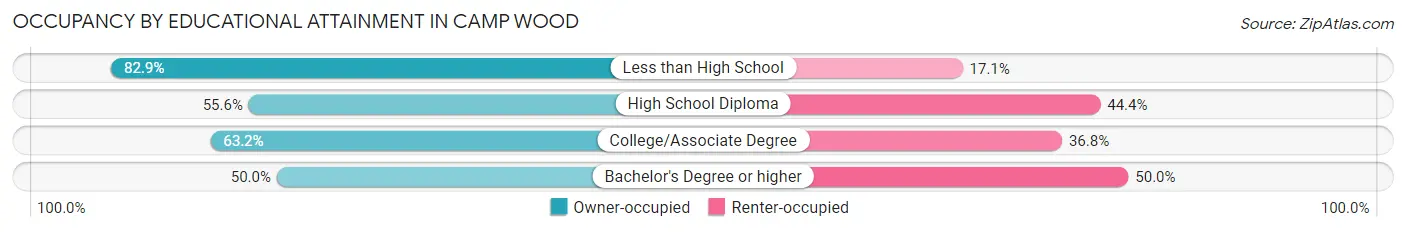
| Household Size | Owner-occupied | Renter-occupied |
| Less than High School | 29 (82.9%) | 6 (17.1%) |
| High School Diploma | 50 (55.6%) | 40 (44.4%) |
| College/Associate Degree | 36 (63.2%) | 21 (36.8%) |
| Bachelor's Degree or higher | 4 (50.0%) | 4 (50.0%) |
Occupancy by Age of Householder in Camp Wood
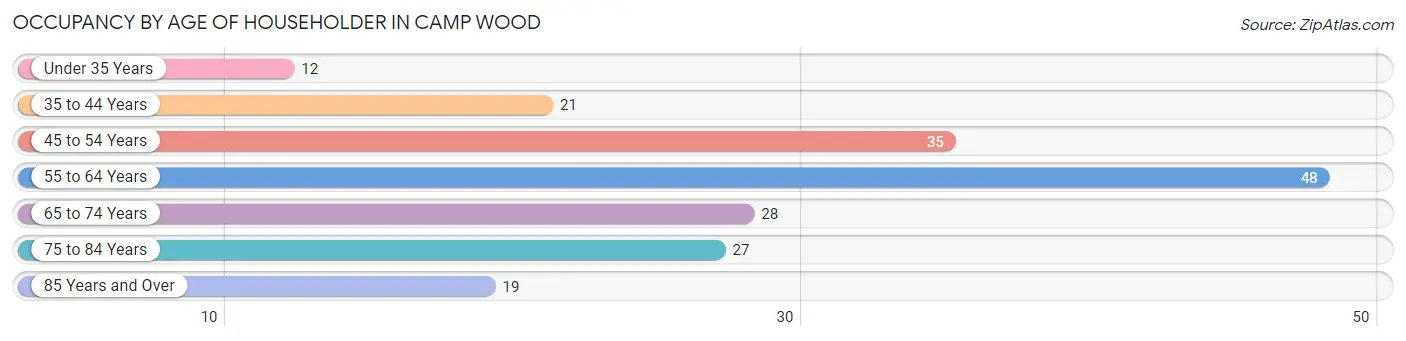
| Age Bracket | # Households | % Households |
| Under 35 Years | 12 | 6.3% |
| 35 to 44 Years | 21 | 11.1% |
| 45 to 54 Years | 35 | 18.4% |
| 55 to 64 Years | 48 | 25.3% |
| 65 to 74 Years | 28 | 14.7% |
| 75 to 84 Years | 27 | 14.2% |
| 85 Years and Over | 19 | 10.0% |
| Total | 190 | 100.0% |
Housing Finances in Camp Wood
Median Income by Occupancy in Camp Wood
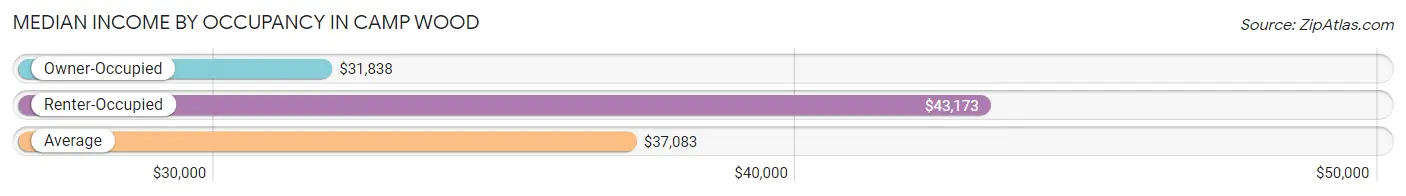
| Occupancy Type | # Households | Median Income |
| Owner-Occupied | 119 (62.6%) | $31,838 |
| Renter-Occupied | 71 (37.4%) | $43,173 |
| Average | 190 (100.0%) | $37,083 |
Occupancy by Householder Income Bracket in Camp Wood
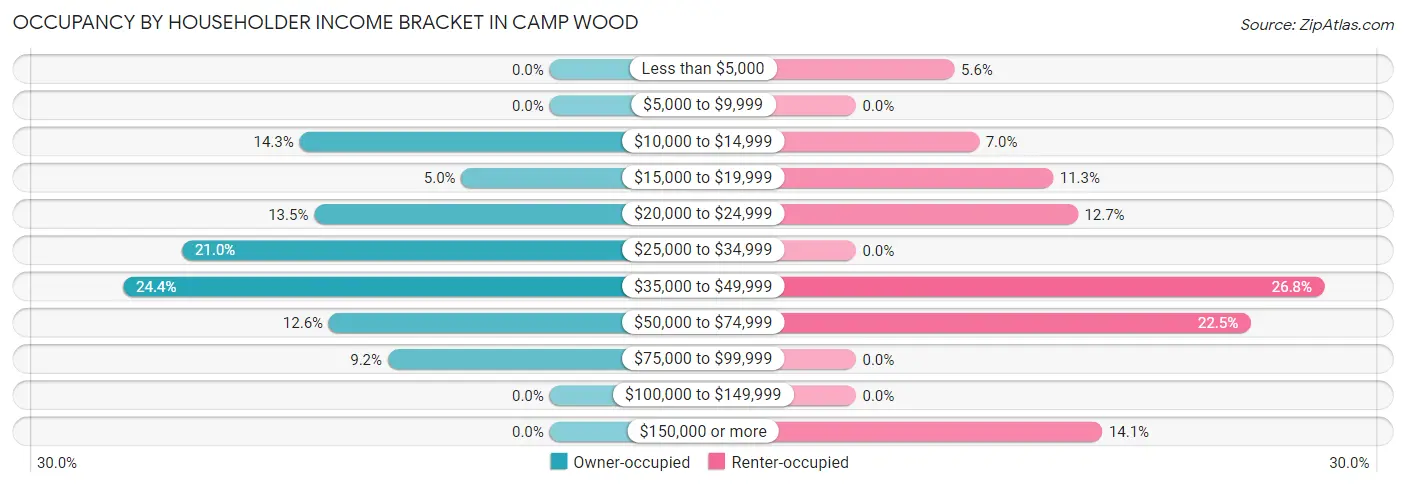
| Income Bracket | Owner-occupied | Renter-occupied |
| Less than $5,000 | 0 (0.0%) | 4 (5.6%) |
| $5,000 to $9,999 | 0 (0.0%) | 0 (0.0%) |
| $10,000 to $14,999 | 17 (14.3%) | 5 (7.0%) |
| $15,000 to $19,999 | 6 (5.0%) | 8 (11.3%) |
| $20,000 to $24,999 | 16 (13.5%) | 9 (12.7%) |
| $25,000 to $34,999 | 25 (21.0%) | 0 (0.0%) |
| $35,000 to $49,999 | 29 (24.4%) | 19 (26.8%) |
| $50,000 to $74,999 | 15 (12.6%) | 16 (22.5%) |
| $75,000 to $99,999 | 11 (9.2%) | 0 (0.0%) |
| $100,000 to $149,999 | 0 (0.0%) | 0 (0.0%) |
| $150,000 or more | 0 (0.0%) | 10 (14.1%) |
| Total | 119 (100.0%) | 71 (100.0%) |
Monthly Housing Cost Tiers in Camp Wood
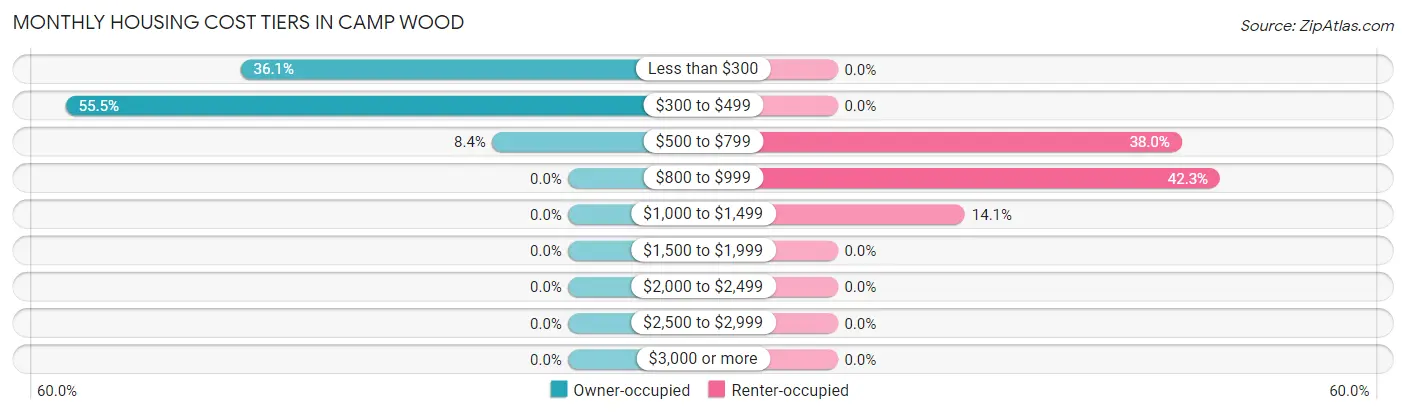
| Monthly Cost | Owner-occupied | Renter-occupied |
| Less than $300 | 43 (36.1%) | 0 (0.0%) |
| $300 to $499 | 66 (55.5%) | 0 (0.0%) |
| $500 to $799 | 10 (8.4%) | 27 (38.0%) |
| $800 to $999 | 0 (0.0%) | 30 (42.2%) |
| $1,000 to $1,499 | 0 (0.0%) | 10 (14.1%) |
| $1,500 to $1,999 | 0 (0.0%) | 0 (0.0%) |
| $2,000 to $2,499 | 0 (0.0%) | 0 (0.0%) |
| $2,500 to $2,999 | 0 (0.0%) | 0 (0.0%) |
| $3,000 or more | 0 (0.0%) | 0 (0.0%) |
| Total | 119 (100.0%) | 71 (100.0%) |
Physical Housing Characteristics in Camp Wood
Housing Structures in Camp Wood
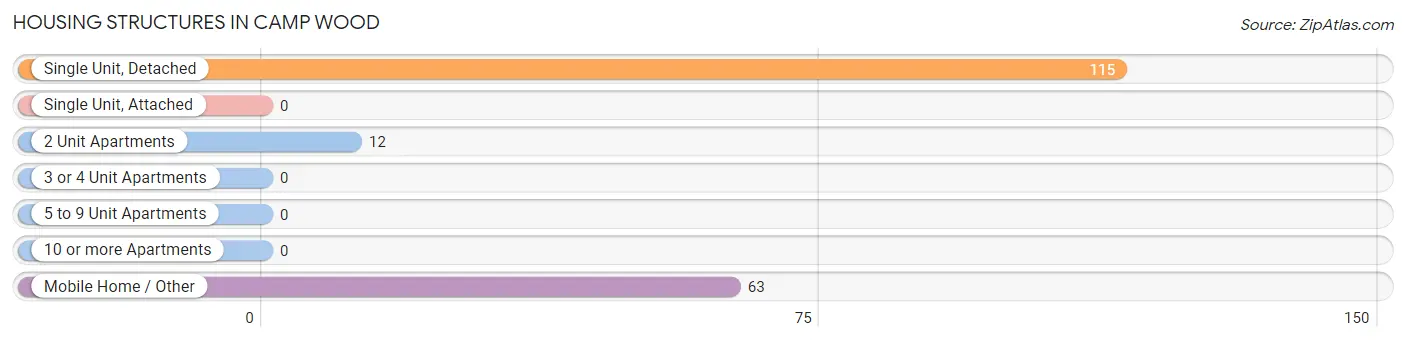
| Structure Type | # Housing Units | % Housing Units |
| Single Unit, Detached | 115 | 60.5% |
| Single Unit, Attached | 0 | 0.0% |
| 2 Unit Apartments | 12 | 6.3% |
| 3 or 4 Unit Apartments | 0 | 0.0% |
| 5 to 9 Unit Apartments | 0 | 0.0% |
| 10 or more Apartments | 0 | 0.0% |
| Mobile Home / Other | 63 | 33.2% |
| Total | 190 | 100.0% |
Housing Structures by Occupancy in Camp Wood
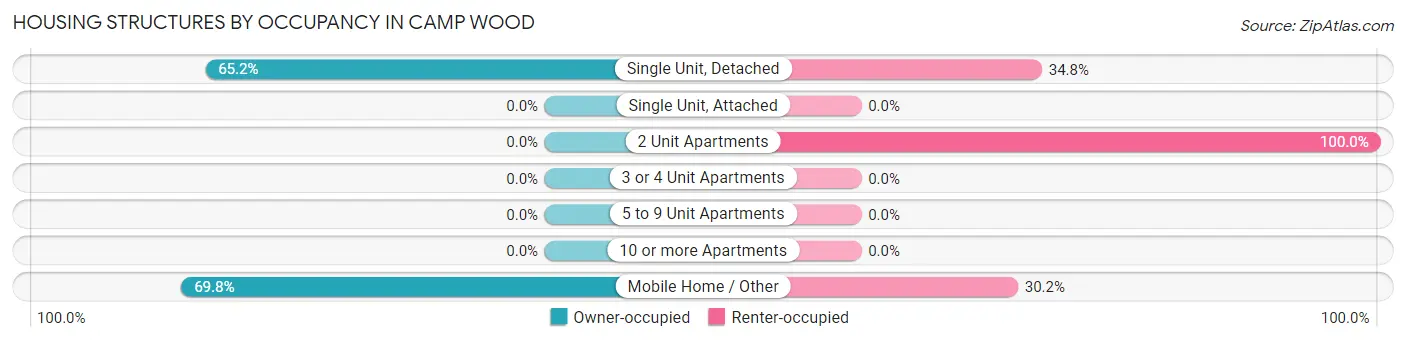
| Structure Type | Owner-occupied | Renter-occupied |
| Single Unit, Detached | 75 (65.2%) | 40 (34.8%) |
| Single Unit, Attached | 0 (0.0%) | 0 (0.0%) |
| 2 Unit Apartments | 0 (0.0%) | 12 (100.0%) |
| 3 or 4 Unit Apartments | 0 (0.0%) | 0 (0.0%) |
| 5 to 9 Unit Apartments | 0 (0.0%) | 0 (0.0%) |
| 10 or more Apartments | 0 (0.0%) | 0 (0.0%) |
| Mobile Home / Other | 44 (69.8%) | 19 (30.2%) |
| Total | 119 (62.6%) | 71 (37.4%) |
Housing Structures by Number of Rooms in Camp Wood
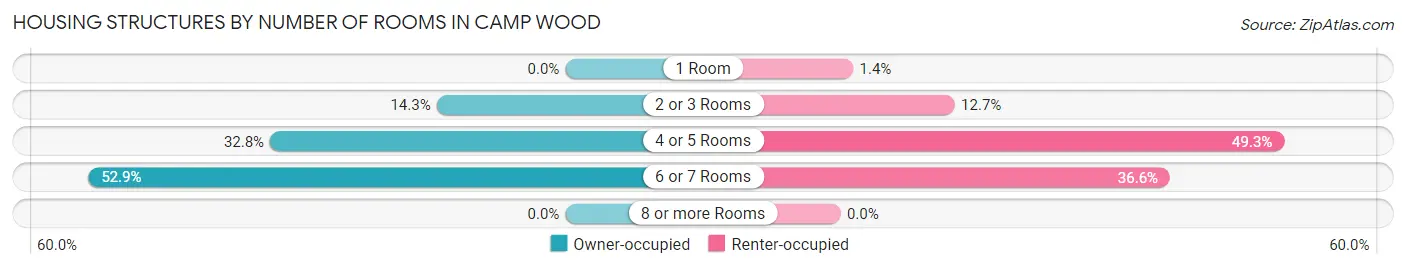
| Number of Rooms | Owner-occupied | Renter-occupied |
| 1 Room | 0 (0.0%) | 1 (1.4%) |
| 2 or 3 Rooms | 17 (14.3%) | 9 (12.7%) |
| 4 or 5 Rooms | 39 (32.8%) | 35 (49.3%) |
| 6 or 7 Rooms | 63 (52.9%) | 26 (36.6%) |
| 8 or more Rooms | 0 (0.0%) | 0 (0.0%) |
| Total | 119 (100.0%) | 71 (100.0%) |
Housing Structure by Heating Type in Camp Wood
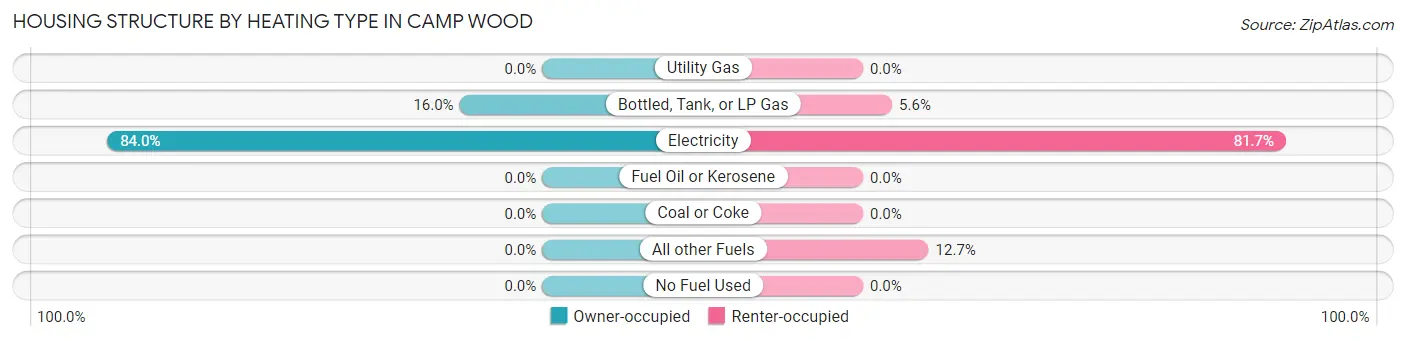
| Heating Type | Owner-occupied | Renter-occupied |
| Utility Gas | 0 (0.0%) | 0 (0.0%) |
| Bottled, Tank, or LP Gas | 19 (16.0%) | 4 (5.6%) |
| Electricity | 100 (84.0%) | 58 (81.7%) |
| Fuel Oil or Kerosene | 0 (0.0%) | 0 (0.0%) |
| Coal or Coke | 0 (0.0%) | 0 (0.0%) |
| All other Fuels | 0 (0.0%) | 9 (12.7%) |
| No Fuel Used | 0 (0.0%) | 0 (0.0%) |
| Total | 119 (100.0%) | 71 (100.0%) |
Household Vehicle Usage in Camp Wood
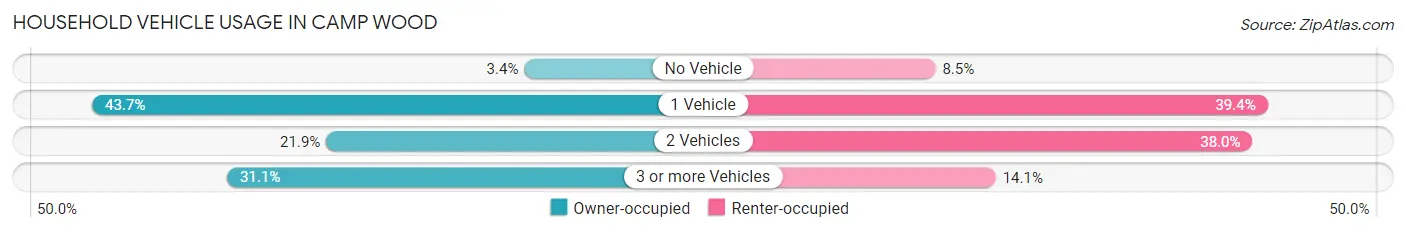
| Vehicles per Household | Owner-occupied | Renter-occupied |
| No Vehicle | 4 (3.4%) | 6 (8.5%) |
| 1 Vehicle | 52 (43.7%) | 28 (39.4%) |
| 2 Vehicles | 26 (21.8%) | 27 (38.0%) |
| 3 or more Vehicles | 37 (31.1%) | 10 (14.1%) |
| Total | 119 (100.0%) | 71 (100.0%) |
Real Estate & Mortgages in Camp Wood
Real Estate and Mortgage Overview in Camp Wood
| Characteristic | Without Mortgage | With Mortgage |
| Housing Units | 119 | 0 |
| Median Property Value | $39,100 | $0 |
| Median Household Income | $31,838 | $0 |
| Monthly Housing Costs | $341 | $0 |
| Real Estate Taxes | $550 | $0 |
Property Value by Mortgage Status in Camp Wood
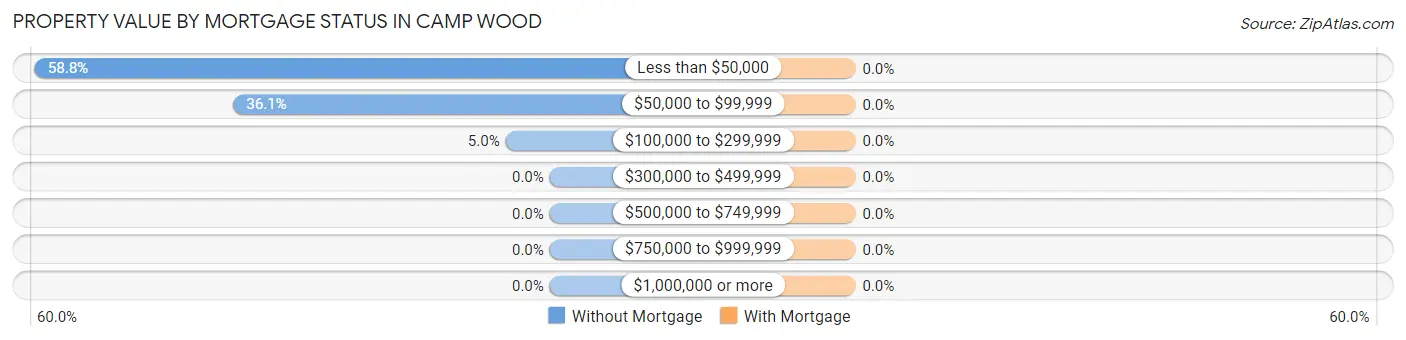
| Property Value | Without Mortgage | With Mortgage |
| Less than $50,000 | 70 (58.8%) | 0 (0.0%) |
| $50,000 to $99,999 | 43 (36.1%) | 0 (0.0%) |
| $100,000 to $299,999 | 6 (5.0%) | 0 (0.0%) |
| $300,000 to $499,999 | 0 (0.0%) | 0 (0.0%) |
| $500,000 to $749,999 | 0 (0.0%) | 0 (0.0%) |
| $750,000 to $999,999 | 0 (0.0%) | 0 (0.0%) |
| $1,000,000 or more | 0 (0.0%) | 0 (0.0%) |
| Total | 119 (100.0%) | 0 (0.0%) |
Household Income by Mortgage Status in Camp Wood
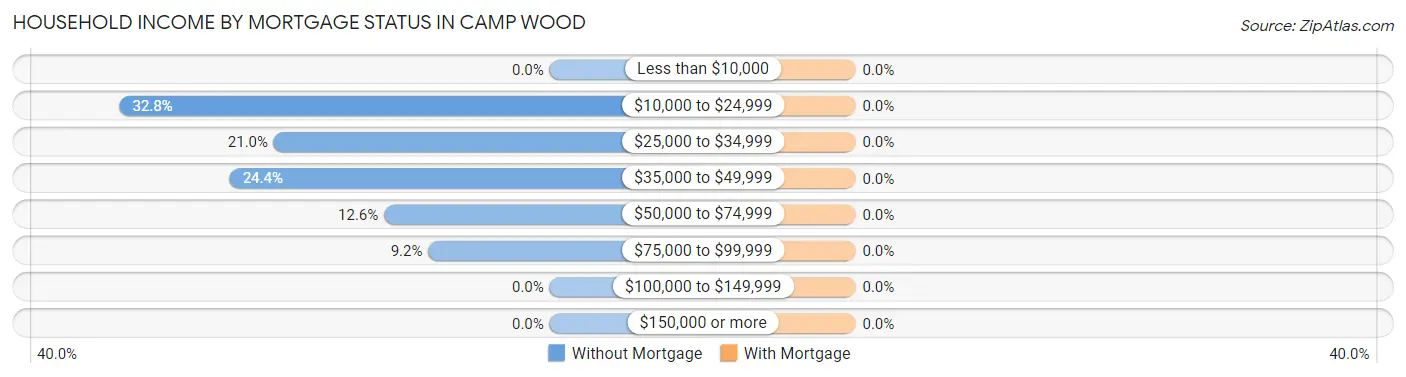
| Household Income | Without Mortgage | With Mortgage |
| Less than $10,000 | 0 (0.0%) | 0 (0.0%) |
| $10,000 to $24,999 | 39 (32.8%) | 0 (0.0%) |
| $25,000 to $34,999 | 25 (21.0%) | 0 (0.0%) |
| $35,000 to $49,999 | 29 (24.4%) | 0 (0.0%) |
| $50,000 to $74,999 | 15 (12.6%) | 0 (0.0%) |
| $75,000 to $99,999 | 11 (9.2%) | 0 (0.0%) |
| $100,000 to $149,999 | 0 (0.0%) | 0 (0.0%) |
| $150,000 or more | 0 (0.0%) | 0 (0.0%) |
| Total | 119 (100.0%) | 0 (0.0%) |
Property Value to Household Income Ratio in Camp Wood
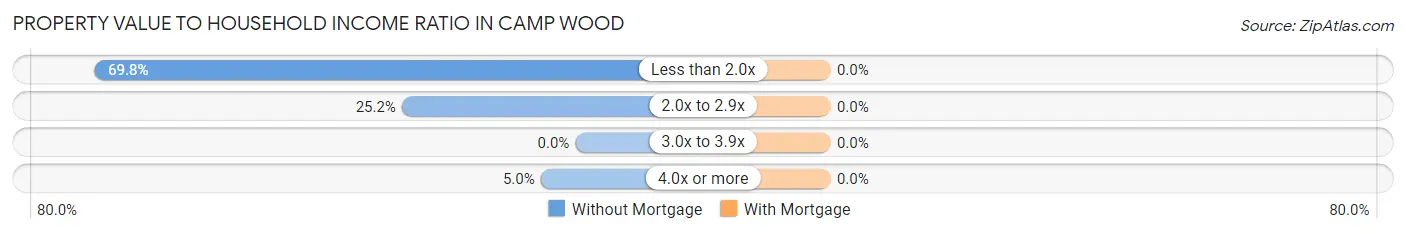
| Value-to-Income Ratio | Without Mortgage | With Mortgage |
| Less than 2.0x | 83 (69.8%) | 0 (0.0%) |
| 2.0x to 2.9x | 30 (25.2%) | 0 (0.0%) |
| 3.0x to 3.9x | 0 (0.0%) | 0 (0.0%) |
| 4.0x or more | 6 (5.0%) | 0 (0.0%) |
| Total | 119 (100.0%) | 0 (0.0%) |
Real Estate Taxes by Mortgage Status in Camp Wood
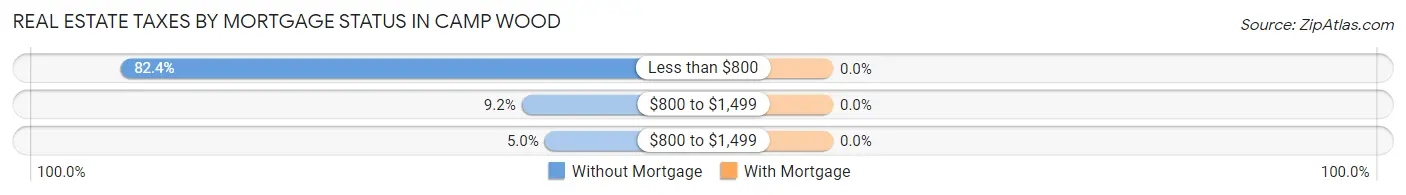
| Property Taxes | Without Mortgage | With Mortgage |
| Less than $800 | 98 (82.4%) | 0 (0.0%) |
| $800 to $1,499 | 11 (9.2%) | 0 (0.0%) |
| $800 to $1,499 | 6 (5.0%) | 0 (0.0%) |
| Total | 119 (100.0%) | 0 (0.0%) |
Health & Disability in Camp Wood
Health Insurance Coverage by Age in Camp Wood
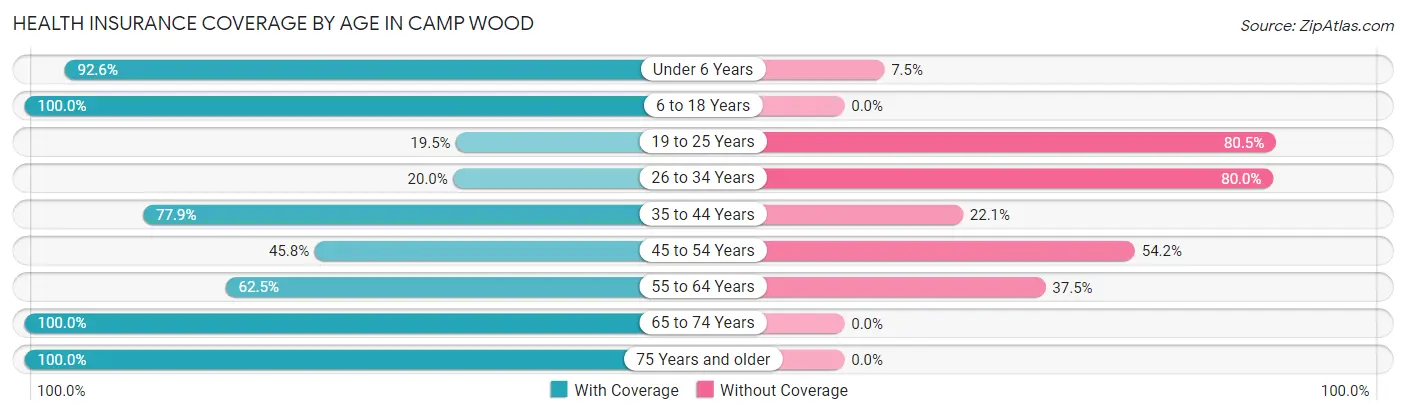
| Age Bracket | With Coverage | Without Coverage |
| Under 6 Years | 87 (92.5%) | 7 (7.4%) |
| 6 to 18 Years | 197 (100.0%) | 0 (0.0%) |
| 19 to 25 Years | 15 (19.5%) | 62 (80.5%) |
| 26 to 34 Years | 10 (20.0%) | 40 (80.0%) |
| 35 to 44 Years | 74 (77.9%) | 21 (22.1%) |
| 45 to 54 Years | 66 (45.8%) | 78 (54.2%) |
| 55 to 64 Years | 60 (62.5%) | 36 (37.5%) |
| 65 to 74 Years | 70 (100.0%) | 0 (0.0%) |
| 75 Years and older | 62 (100.0%) | 0 (0.0%) |
| Total | 641 (72.4%) | 244 (27.6%) |
Health Insurance Coverage by Citizenship Status in Camp Wood
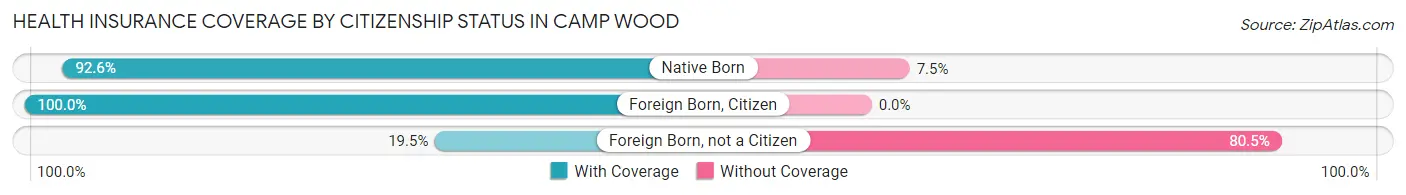
| Citizenship Status | With Coverage | Without Coverage |
| Native Born | 87 (92.5%) | 7 (7.4%) |
| Foreign Born, Citizen | 197 (100.0%) | 0 (0.0%) |
| Foreign Born, not a Citizen | 15 (19.5%) | 62 (80.5%) |
Health Insurance Coverage by Household Income in Camp Wood
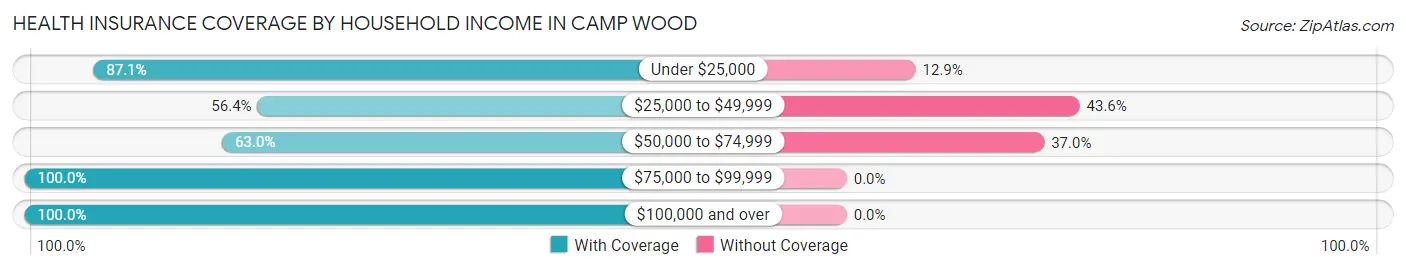
| Household Income | With Coverage | Without Coverage |
| Under $25,000 | 196 (87.1%) | 29 (12.9%) |
| $25,000 to $49,999 | 243 (56.4%) | 188 (43.6%) |
| $50,000 to $74,999 | 46 (63.0%) | 27 (37.0%) |
| $75,000 to $99,999 | 26 (100.0%) | 0 (0.0%) |
| $100,000 and over | 130 (100.0%) | 0 (0.0%) |
Public vs Private Health Insurance Coverage by Age in Camp Wood
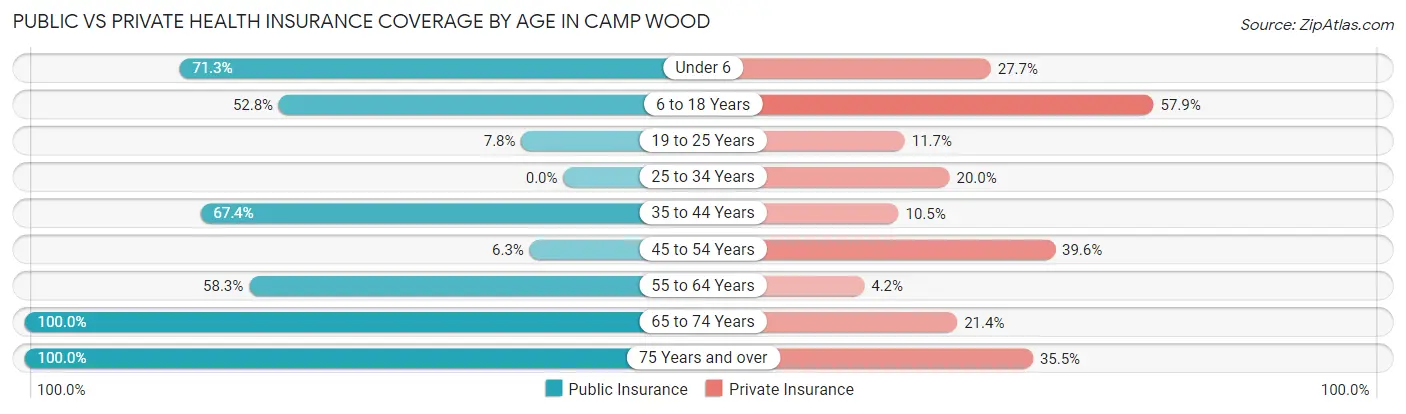
| Age Bracket | Public Insurance | Private Insurance |
| Under 6 | 67 (71.3%) | 26 (27.7%) |
| 6 to 18 Years | 104 (52.8%) | 114 (57.9%) |
| 19 to 25 Years | 6 (7.8%) | 9 (11.7%) |
| 25 to 34 Years | 0 (0.0%) | 10 (20.0%) |
| 35 to 44 Years | 64 (67.4%) | 10 (10.5%) |
| 45 to 54 Years | 9 (6.2%) | 57 (39.6%) |
| 55 to 64 Years | 56 (58.3%) | 4 (4.2%) |
| 65 to 74 Years | 70 (100.0%) | 15 (21.4%) |
| 75 Years and over | 62 (100.0%) | 22 (35.5%) |
| Total | 438 (49.5%) | 267 (30.2%) |
Disability Status by Sex by Age in Camp Wood
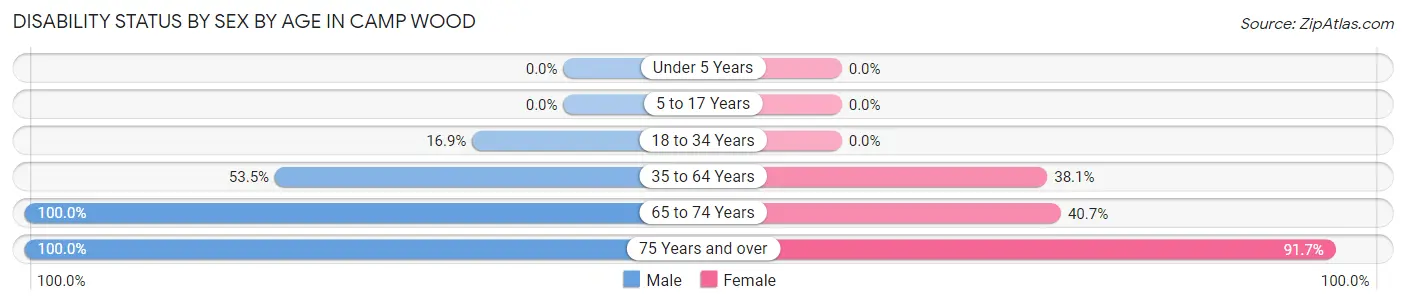
| Age Bracket | Male | Female |
| Under 5 Years | 0 (0.0%) | 0 (0.0%) |
| 5 to 17 Years | 0 (0.0%) | 0 (0.0%) |
| 18 to 34 Years | 11 (16.9%) | 0 (0.0%) |
| 35 to 64 Years | 53 (53.5%) | 90 (38.1%) |
| 65 to 74 Years | 11 (100.0%) | 24 (40.7%) |
| 75 Years and over | 26 (100.0%) | 33 (91.7%) |
Disability Class by Sex by Age in Camp Wood
Disability Class: Hearing Difficulty
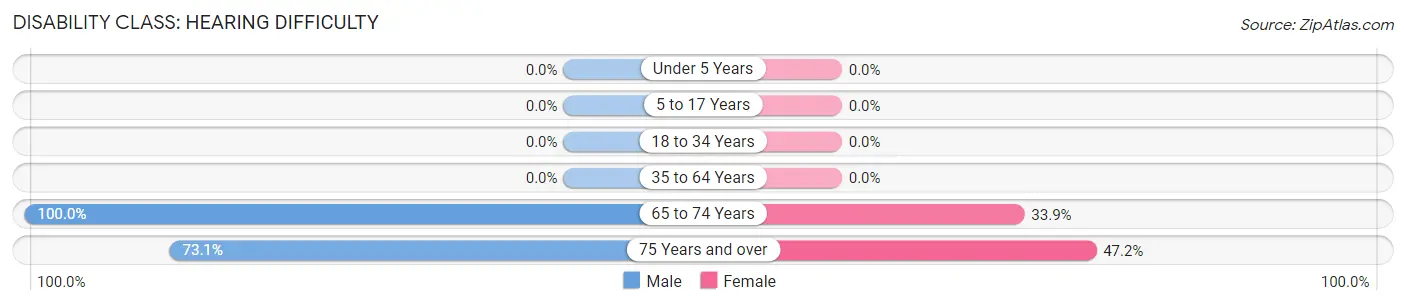
| Age Bracket | Male | Female |
| Under 5 Years | 0 (0.0%) | 0 (0.0%) |
| 5 to 17 Years | 0 (0.0%) | 0 (0.0%) |
| 18 to 34 Years | 0 (0.0%) | 0 (0.0%) |
| 35 to 64 Years | 0 (0.0%) | 0 (0.0%) |
| 65 to 74 Years | 11 (100.0%) | 20 (33.9%) |
| 75 Years and over | 19 (73.1%) | 17 (47.2%) |
Disability Class: Vision Difficulty
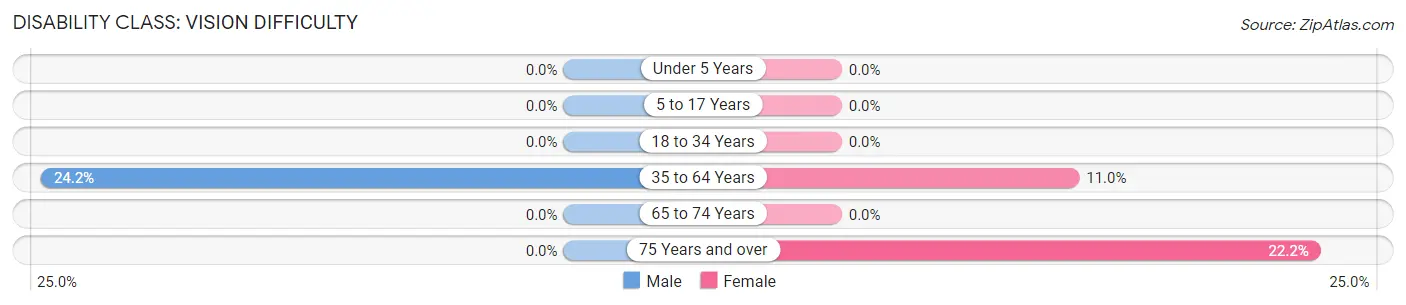
| Age Bracket | Male | Female |
| Under 5 Years | 0 (0.0%) | 0 (0.0%) |
| 5 to 17 Years | 0 (0.0%) | 0 (0.0%) |
| 18 to 34 Years | 0 (0.0%) | 0 (0.0%) |
| 35 to 64 Years | 24 (24.2%) | 26 (11.0%) |
| 65 to 74 Years | 0 (0.0%) | 0 (0.0%) |
| 75 Years and over | 0 (0.0%) | 8 (22.2%) |
Disability Class: Cognitive Difficulty
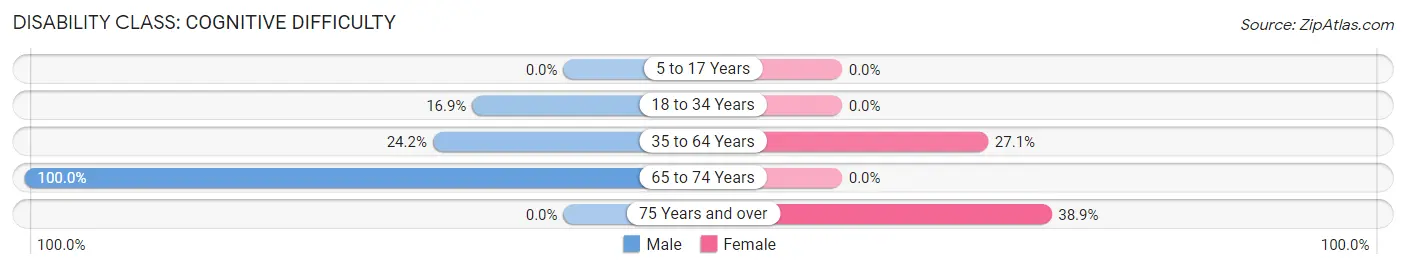
| Age Bracket | Male | Female |
| 5 to 17 Years | 0 (0.0%) | 0 (0.0%) |
| 18 to 34 Years | 11 (16.9%) | 0 (0.0%) |
| 35 to 64 Years | 24 (24.2%) | 64 (27.1%) |
| 65 to 74 Years | 11 (100.0%) | 0 (0.0%) |
| 75 Years and over | 0 (0.0%) | 14 (38.9%) |
Disability Class: Ambulatory Difficulty
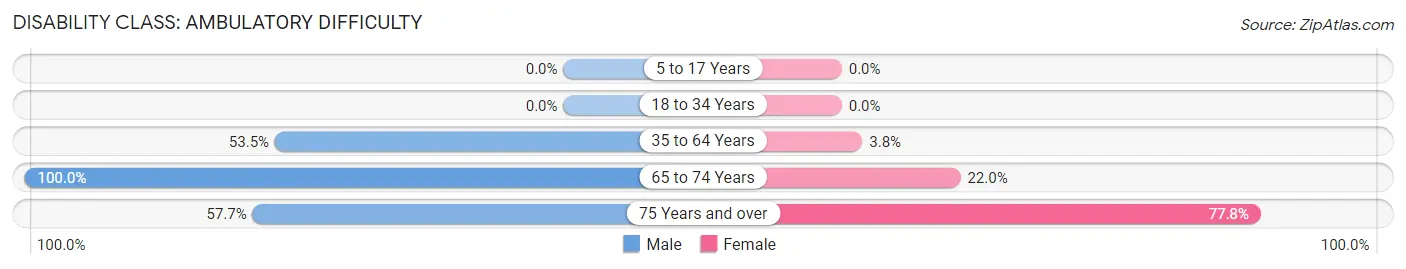
| Age Bracket | Male | Female |
| 5 to 17 Years | 0 (0.0%) | 0 (0.0%) |
| 18 to 34 Years | 0 (0.0%) | 0 (0.0%) |
| 35 to 64 Years | 53 (53.5%) | 9 (3.8%) |
| 65 to 74 Years | 11 (100.0%) | 13 (22.0%) |
| 75 Years and over | 15 (57.7%) | 28 (77.8%) |
Disability Class: Self-Care Difficulty
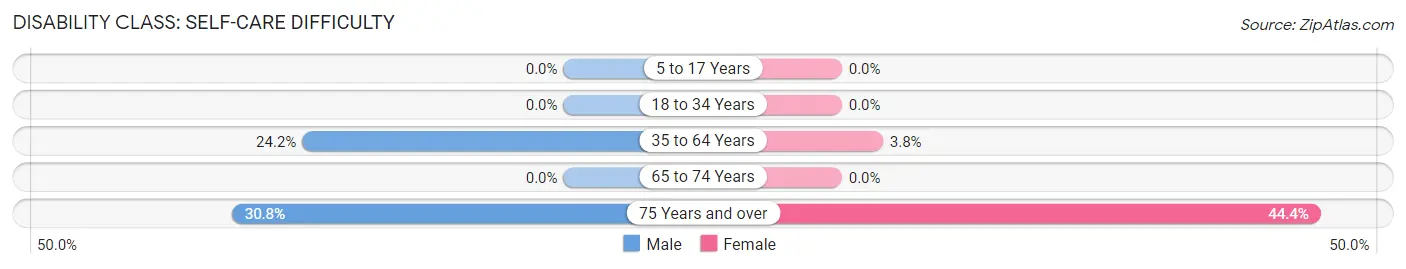
| Age Bracket | Male | Female |
| 5 to 17 Years | 0 (0.0%) | 0 (0.0%) |
| 18 to 34 Years | 0 (0.0%) | 0 (0.0%) |
| 35 to 64 Years | 24 (24.2%) | 9 (3.8%) |
| 65 to 74 Years | 0 (0.0%) | 0 (0.0%) |
| 75 Years and over | 8 (30.8%) | 16 (44.4%) |
Technology Access in Camp Wood
Computing Device Access in Camp Wood
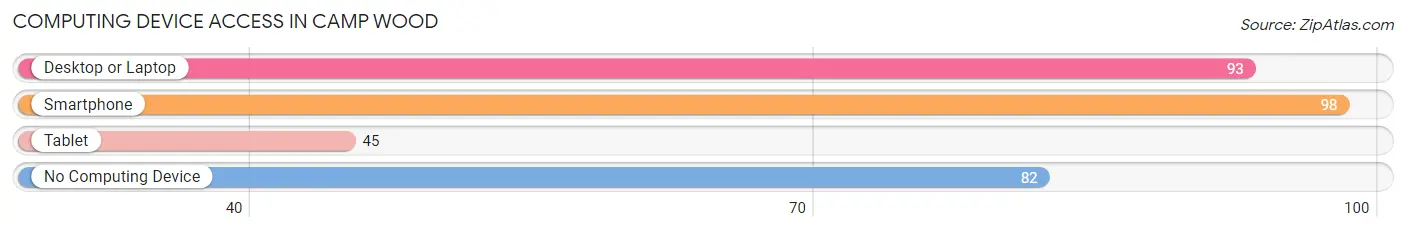
| Device Type | # Households | % Households |
| Desktop or Laptop | 93 | 48.9% |
| Smartphone | 98 | 51.6% |
| Tablet | 45 | 23.7% |
| No Computing Device | 82 | 43.2% |
| Total | 190 | 100.0% |
Internet Access in Camp Wood
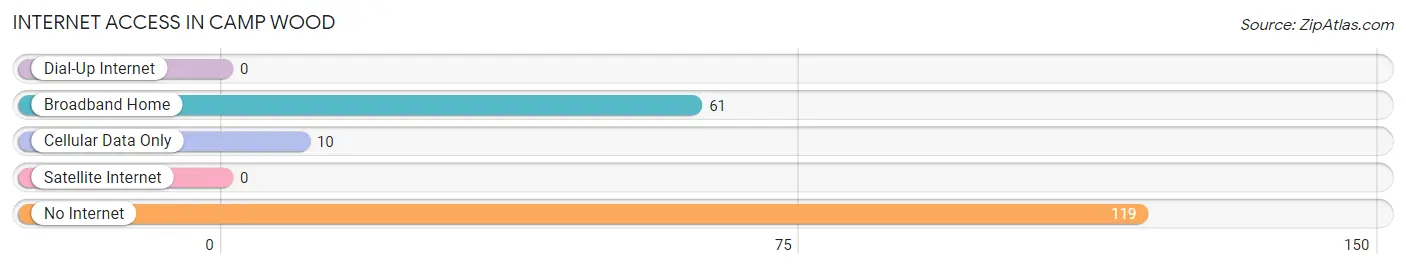
| Internet Type | # Households | % Households |
| Dial-Up Internet | 0 | 0.0% |
| Broadband Home | 61 | 32.1% |
| Cellular Data Only | 10 | 5.3% |
| Satellite Internet | 0 | 0.0% |
| No Internet | 119 | 62.6% |
| Total | 190 | 100.0% |
Camp Wood Summary
Introduction
Camp Wood is a small unincorporated community located in Real County, Texas. It is situated in the Edwards Plateau region of the state, and is located about 80 miles west of San Antonio. The town is home to a population of about 1,000 people, and is known for its scenic beauty and outdoor recreation opportunities.
History
Camp Wood was first established in the late 1800s as a logging camp. The town was named after the nearby Wood family, who owned a large amount of land in the area. The town grew slowly over the years, and by the early 1900s, it had become a popular destination for hunters and fishermen.
In the 1920s, Camp Wood began to attract more visitors, as the town became a popular destination for tourists. The town was also home to a number of businesses, including a hotel, a general store, and a post office.
In the 1940s, Camp Wood was the site of a Civilian Conservation Corps camp. The camp was used to train young men in forestry and conservation, and it was also used to build roads and other infrastructure in the area.
Geography
Camp Wood is located in Real County, Texas, in the Edwards Plateau region of the state. The town is situated at the intersection of U.S. Highway 83 and State Highway 55. The town is located about 80 miles west of San Antonio, and about 130 miles northwest of Austin.
The terrain around Camp Wood is mostly flat, with some rolling hills. The area is mostly covered in grasslands, with some wooded areas. The nearby Frio River provides a source of water for the town.
Economy
The economy of Camp Wood is largely based on tourism. The town is a popular destination for hunters and fishermen, and it is also home to a number of businesses, including a hotel, a general store, and a post office.
The town is also home to a number of small businesses, including a gas station, a restaurant, and a grocery store. The town is also home to a number of small manufacturing businesses, including a furniture factory and a woodworking shop.
Demographics
As of the 2010 census, the population of Camp Wood was 1,000. The town is predominantly white, with about 95% of the population being white. The median household income in the town is $30,000, and the median age is 44.
Conclusion
Camp Wood is a small unincorporated community located in Real County, Texas. The town is known for its scenic beauty and outdoor recreation opportunities, and it is a popular destination for hunters and fishermen. The town is home to a population of about 1,000 people, and the economy is largely based on tourism. The town is predominantly white, with a median household income of $30,000 and a median age of 44.
Common Questions
What is Per Capita Income in Camp Wood?
Per Capita income in Camp Wood is $11,936.
What is the Median Family Income in Camp Wood?
Median Family Income in Camp Wood is $43,424.
What is the Median Household income in Camp Wood?
Median Household Income in Camp Wood is $37,083.
What is Inequality or Gini Index in Camp Wood?
Inequality or Gini Index in Camp Wood is 0.39.
What is the Total Population of Camp Wood?
Total Population of Camp Wood is 970.
What is the Total Male Population of Camp Wood?
Total Male Population of Camp Wood is 470.
What is the Total Female Population of Camp Wood?
Total Female Population of Camp Wood is 500.
What is the Ratio of Males per 100 Females in Camp Wood?
There are 94.00 Males per 100 Females in Camp Wood.
What is the Ratio of Females per 100 Males in Camp Wood?
There are 106.38 Females per 100 Males in Camp Wood.
What is the Median Population Age in Camp Wood?
Median Population Age in Camp Wood is 40.7 Years.
What is the Average Family Size in Camp Wood
Average Family Size in Camp Wood is 5.3 People.
What is the Average Household Size in Camp Wood
Average Household Size in Camp Wood is 4.7 People.
How Large is the Labor Force in Camp Wood?
There are 225 People in the Labor Forcein in Camp Wood.
What is the Percentage of People in the Labor Force in Camp Wood?
29.8% of People are in the Labor Force in Camp Wood.