Burnet, TX Map & Demographics
Burnet Map
Burnet Overview
$35,622
PER CAPITA INCOME
$90,492
AVG FAMILY INCOME
$77,376
AVG HOUSEHOLD INCOME
49.6%
WAGE / INCOME GAP [ % ]
50.4¢/ $1
WAGE / INCOME GAP [ $ ]
0.42
INEQUALITY / GINI INDEX
6,464
TOTAL POPULATION
3,001
MALE POPULATION
3,463
FEMALE POPULATION
86.66
MALES / 100 FEMALES
115.39
FEMALES / 100 MALES
39.9
MEDIAN AGE
3.2
AVG FAMILY SIZE
2.6
AVG HOUSEHOLD SIZE
3,084
LABOR FORCE [ PEOPLE ]
57.7%
PERCENT IN LABOR FORCE
3.2%
UNEMPLOYMENT RATE
Burnet Zip Codes
Burnet Area Codes
Income in Burnet
Income Overview in Burnet
Per Capita Income in Burnet is $35,622, while median incomes of families and households are $90,492 and $77,376 respectively.
| Characteristic | Number | Measure |
| Per Capita Income | 6,464 | $35,622 |
| Median Family Income | 1,388 | $90,492 |
| Mean Family Income | 1,388 | $111,473 |
| Median Household Income | 2,243 | $77,376 |
| Mean Household Income | 2,243 | $92,882 |
| Income Deficit | 1,388 | $0 |
| Wage / Income Gap (%) | 6,464 | 49.58% |
| Wage / Income Gap ($) | 6,464 | 50.42¢ per $1 |
| Gini / Inequality Index | 6,464 | 0.42 |
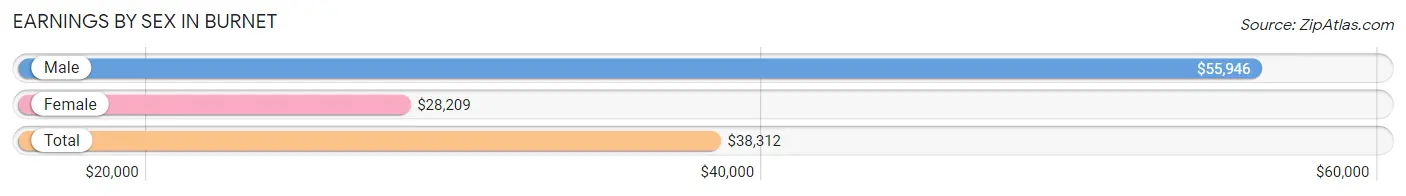
Earnings by Sex in Burnet
Average Earnings in Burnet are $38,312, $55,946 for men and $28,209 for women, a difference of 49.6%.
| Sex | Number | Average Earnings |
| Male | 1,610 (47.0%) | $55,946 |
| Female | 1,814 (53.0%) | $28,209 |
| Total | 3,424 (100.0%) | $38,312 |
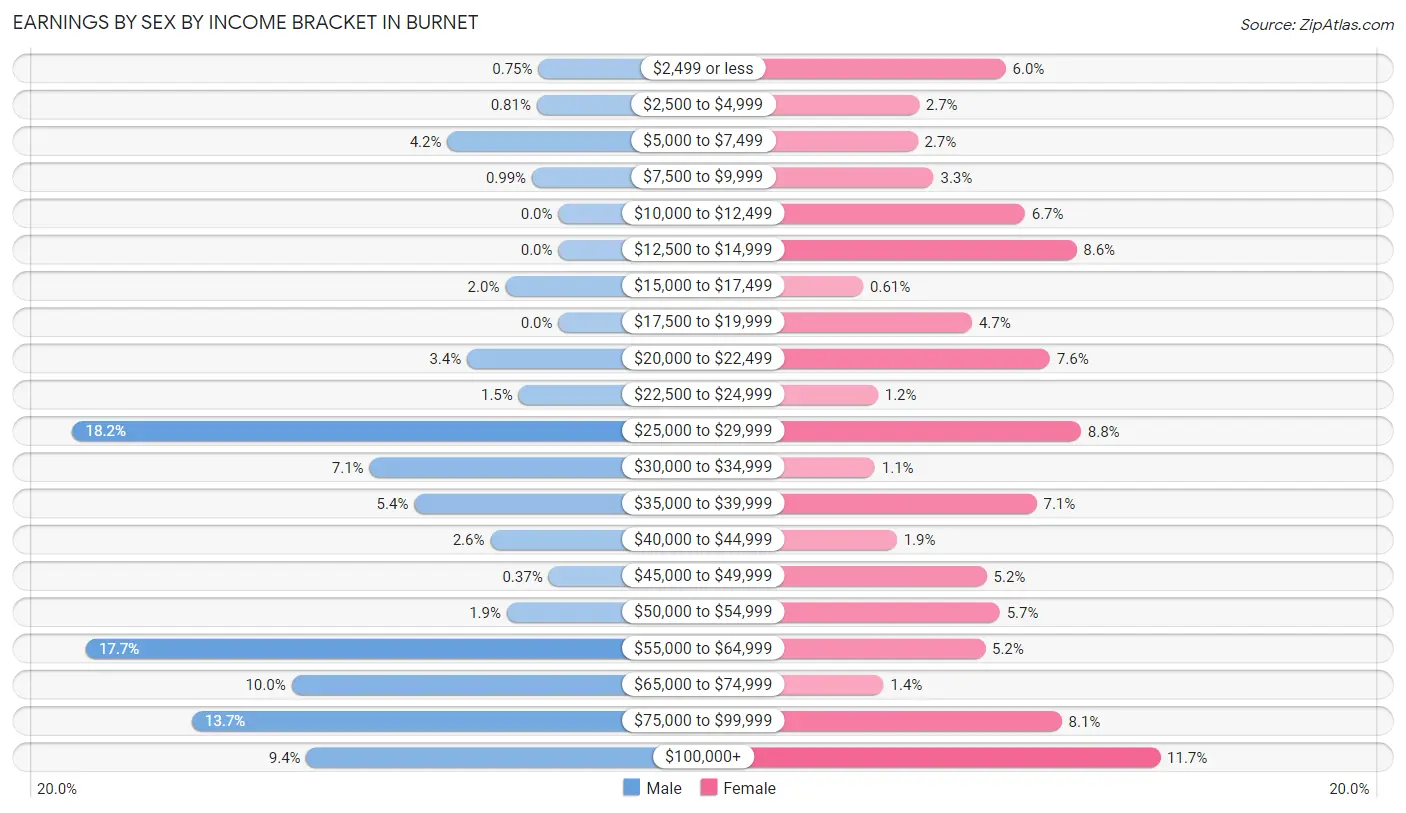
Earnings by Sex by Income Bracket in Burnet
The most common earnings brackets in Burnet are $25,000 to $29,999 for men (293 | 18.2%) and $100,000+ for women (213 | 11.7%).
| Income | Male | Female |
| $2,499 or less | 12 (0.7%) | 108 (5.9%) |
| $2,500 to $4,999 | 13 (0.8%) | 49 (2.7%) |
| $5,000 to $7,499 | 67 (4.2%) | 48 (2.6%) |
| $7,500 to $9,999 | 16 (1.0%) | 59 (3.3%) |
| $10,000 to $12,499 | 0 (0.0%) | 121 (6.7%) |
| $12,500 to $14,999 | 0 (0.0%) | 156 (8.6%) |
| $15,000 to $17,499 | 32 (2.0%) | 11 (0.6%) |
| $17,500 to $19,999 | 0 (0.0%) | 85 (4.7%) |
| $20,000 to $22,499 | 55 (3.4%) | 138 (7.6%) |
| $22,500 to $24,999 | 24 (1.5%) | 21 (1.2%) |
| $25,000 to $29,999 | 293 (18.2%) | 159 (8.8%) |
| $30,000 to $34,999 | 114 (7.1%) | 19 (1.1%) |
| $35,000 to $39,999 | 87 (5.4%) | 129 (7.1%) |
| $40,000 to $44,999 | 41 (2.5%) | 34 (1.9%) |
| $45,000 to $49,999 | 6 (0.4%) | 95 (5.2%) |
| $50,000 to $54,999 | 31 (1.9%) | 104 (5.7%) |
| $55,000 to $64,999 | 285 (17.7%) | 94 (5.2%) |
| $65,000 to $74,999 | 161 (10.0%) | 25 (1.4%) |
| $75,000 to $99,999 | 221 (13.7%) | 146 (8.1%) |
| $100,000+ | 152 (9.4%) | 213 (11.7%) |
| Total | 1,610 (100.0%) | 1,814 (100.0%) |
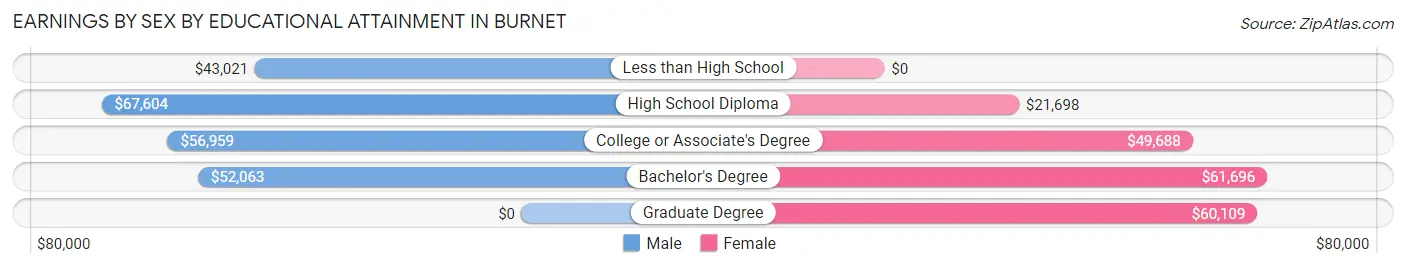
Earnings by Sex by Educational Attainment in Burnet
Average earnings in Burnet are $59,618 for men and $38,357 for women, a difference of 35.7%. Men with an educational attainment of high school diploma enjoy the highest average annual earnings of $67,604, while those with less than high school education earn the least with $43,021. Women with an educational attainment of bachelor's degree earn the most with the average annual earnings of $61,696, while those with high school diploma education have the smallest earnings of $21,698.
| Educational Attainment | Male Income | Female Income |
| Less than High School | $43,021 | $0 |
| High School Diploma | $67,604 | $21,698 |
| College or Associate's Degree | $56,959 | $49,688 |
| Bachelor's Degree | $52,063 | $61,696 |
| Graduate Degree | - | - |
| Total | $59,618 | $38,357 |
Family Income in Burnet
Family Income Brackets in Burnet
According to the Burnet family income data, there are 328 families falling into the $100,000 to $149,999 income range, which is the most common income bracket and makes up 23.6% of all families.
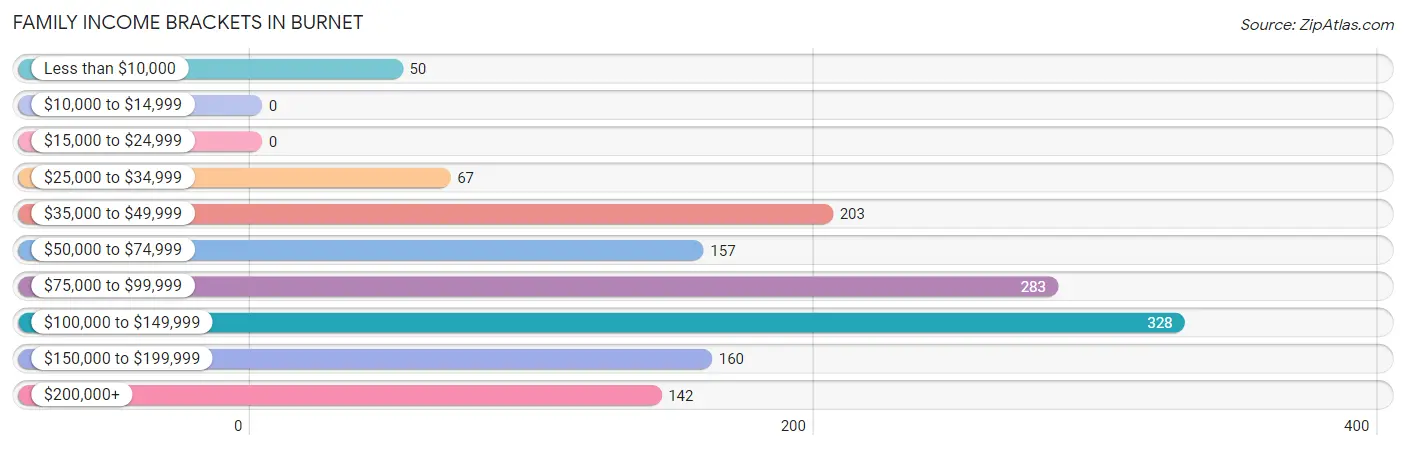
| Income Bracket | # Families | % Families |
| Less than $10,000 | 50 | 3.6% |
| $10,000 to $14,999 | 0 | 0.0% |
| $15,000 to $24,999 | 0 | 0.0% |
| $25,000 to $34,999 | 67 | 4.8% |
| $35,000 to $49,999 | 203 | 14.6% |
| $50,000 to $74,999 | 157 | 11.3% |
| $75,000 to $99,999 | 283 | 20.4% |
| $100,000 to $149,999 | 328 | 23.6% |
| $150,000 to $199,999 | 160 | 11.5% |
| $200,000+ | 142 | 10.2% |
Family Income by Famaliy Size in Burnet
5-person families (58 | 4.2%) account for the highest median family income in Burnet with $190,694 per family, while 3-person families (416 | 30.0%) have the highest median income of $43,918 per family member.
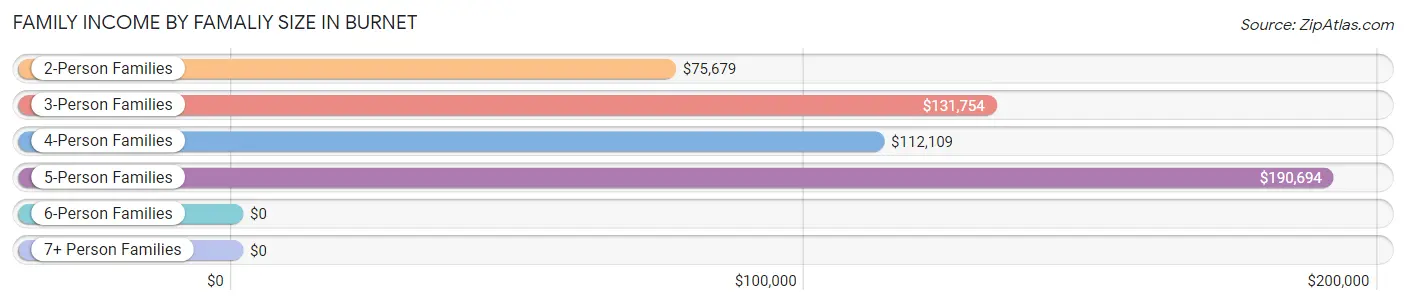
| Income Bracket | # Families | Median Income |
| 2-Person Families | 652 (47.0%) | $75,679 |
| 3-Person Families | 416 (30.0%) | $131,754 |
| 4-Person Families | 163 (11.7%) | $112,109 |
| 5-Person Families | 58 (4.2%) | $190,694 |
| 6-Person Families | 34 (2.5%) | $0 |
| 7+ Person Families | 65 (4.7%) | $0 |
| Total | 1,388 (100.0%) | $90,492 |
Family Income by Number of Earners in Burnet
The median family income in Burnet is $90,492, with families comprising 3+ earners (189) having the highest median family income of $153,542, while families with 1 earner (320) have the lowest median family income of $43,667, accounting for 13.6% and 23.1% of families, respectively.
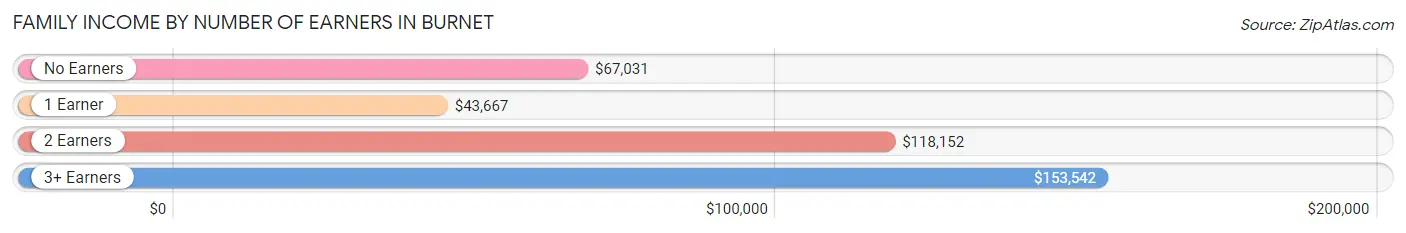
| Number of Earners | # Families | Median Income |
| No Earners | 273 (19.7%) | $67,031 |
| 1 Earner | 320 (23.1%) | $43,667 |
| 2 Earners | 606 (43.7%) | $118,152 |
| 3+ Earners | 189 (13.6%) | $153,542 |
| Total | 1,388 (100.0%) | $90,492 |
Household Income in Burnet
Household Income Brackets in Burnet
With 451 households falling in the category, the $75,000 to $99,999 income range is the most frequent in Burnet, accounting for 20.1% of all households. In contrast, only 74 households (3.3%) fall into the $15,000 to $24,999 income bracket, making it the least populous group.
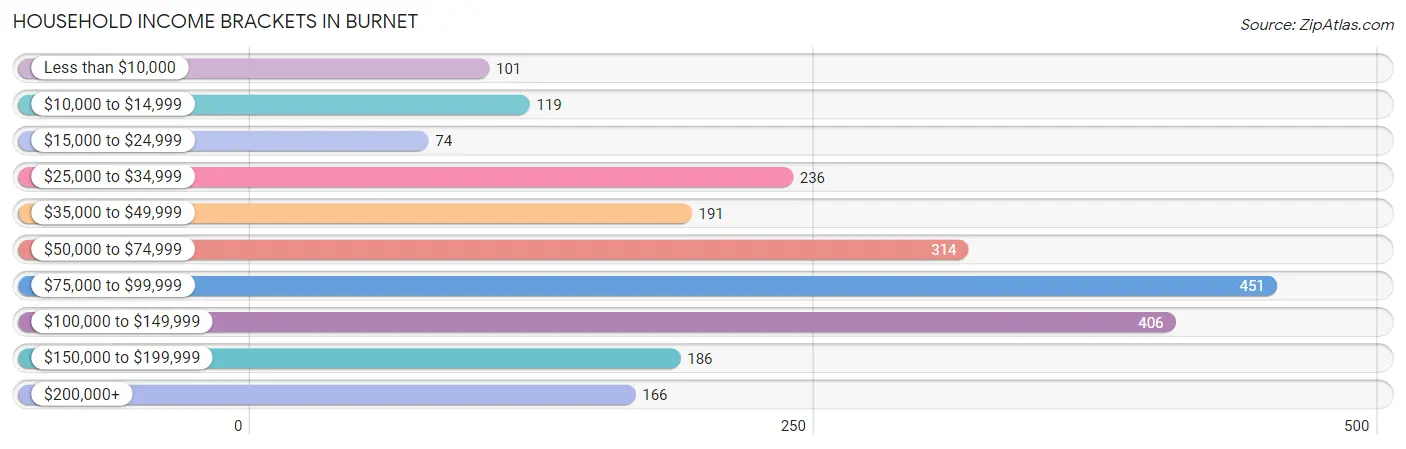
| Income Bracket | # Households | % Households |
| Less than $10,000 | 101 | 4.5% |
| $10,000 to $14,999 | 119 | 5.3% |
| $15,000 to $24,999 | 74 | 3.3% |
| $25,000 to $34,999 | 236 | 10.5% |
| $35,000 to $49,999 | 191 | 8.5% |
| $50,000 to $74,999 | 314 | 14.0% |
| $75,000 to $99,999 | 451 | 20.1% |
| $100,000 to $149,999 | 406 | 18.1% |
| $150,000 to $199,999 | 186 | 8.3% |
| $200,000+ | 166 | 7.4% |
Household Income by Householder Age in Burnet
The median household income in Burnet is $77,376, with the highest median household income of $91,155 found in the 25 to 44 years age bracket for the primary householder. A total of 591 households (26.4%) fall into this category. Meanwhile, the 15 to 24 years age bracket for the primary householder has the lowest median household income of $46,818, with 110 households (4.9%) in this group.
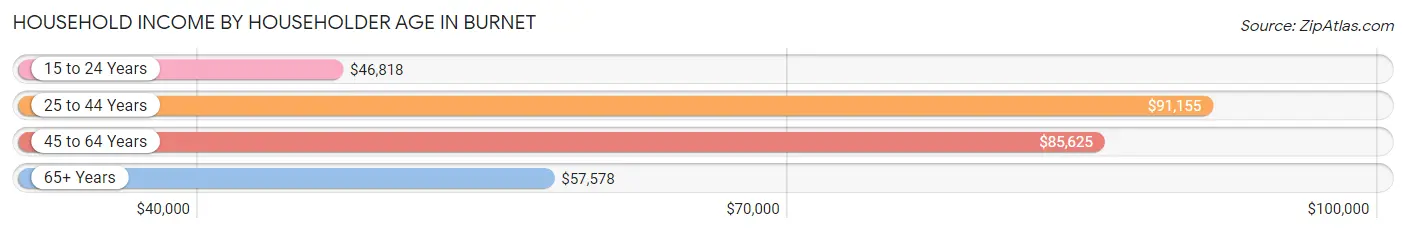
| Income Bracket | # Households | Median Income |
| 15 to 24 Years | 110 (4.9%) | $46,818 |
| 25 to 44 Years | 591 (26.4%) | $91,155 |
| 45 to 64 Years | 785 (35.0%) | $85,625 |
| 65+ Years | 757 (33.8%) | $57,578 |
| Total | 2,243 (100.0%) | $77,376 |
Poverty in Burnet
Income Below Poverty by Sex and Age in Burnet
With 7.6% poverty level for males and 5.4% for females among the residents of Burnet, 45 to 54 year old males and 12 to 14 year old females are the most vulnerable to poverty, with 93 males (26.6%) and 59 females (72.0%) in their respective age groups living below the poverty level.
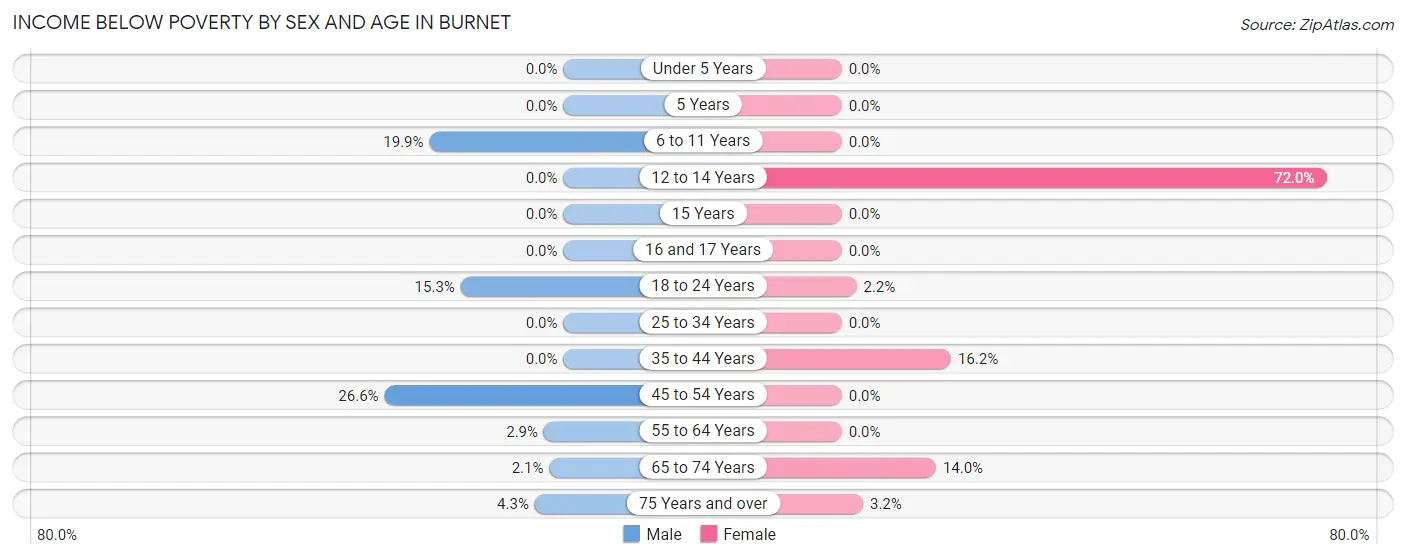
| Age Bracket | Male | Female |
| Under 5 Years | 0 (0.0%) | 0 (0.0%) |
| 5 Years | 0 (0.0%) | 0 (0.0%) |
| 6 to 11 Years | 40 (19.9%) | 0 (0.0%) |
| 12 to 14 Years | 0 (0.0%) | 59 (72.0%) |
| 15 Years | 0 (0.0%) | 0 (0.0%) |
| 16 and 17 Years | 0 (0.0%) | 0 (0.0%) |
| 18 to 24 Years | 45 (15.2%) | 8 (2.2%) |
| 25 to 34 Years | 0 (0.0%) | 0 (0.0%) |
| 35 to 44 Years | 0 (0.0%) | 41 (16.2%) |
| 45 to 54 Years | 93 (26.6%) | 0 (0.0%) |
| 55 to 64 Years | 14 (2.9%) | 0 (0.0%) |
| 65 to 74 Years | 4 (2.1%) | 45 (14.0%) |
| 75 Years and over | 11 (4.3%) | 14 (3.2%) |
| Total | 207 (7.6%) | 167 (5.4%) |
Income Above Poverty by Sex and Age in Burnet
According to the poverty statistics in Burnet, males aged under 5 years and females aged under 5 years are the age groups that are most secure financially, with 100.0% of males and 100.0% of females in these age groups living above the poverty line.
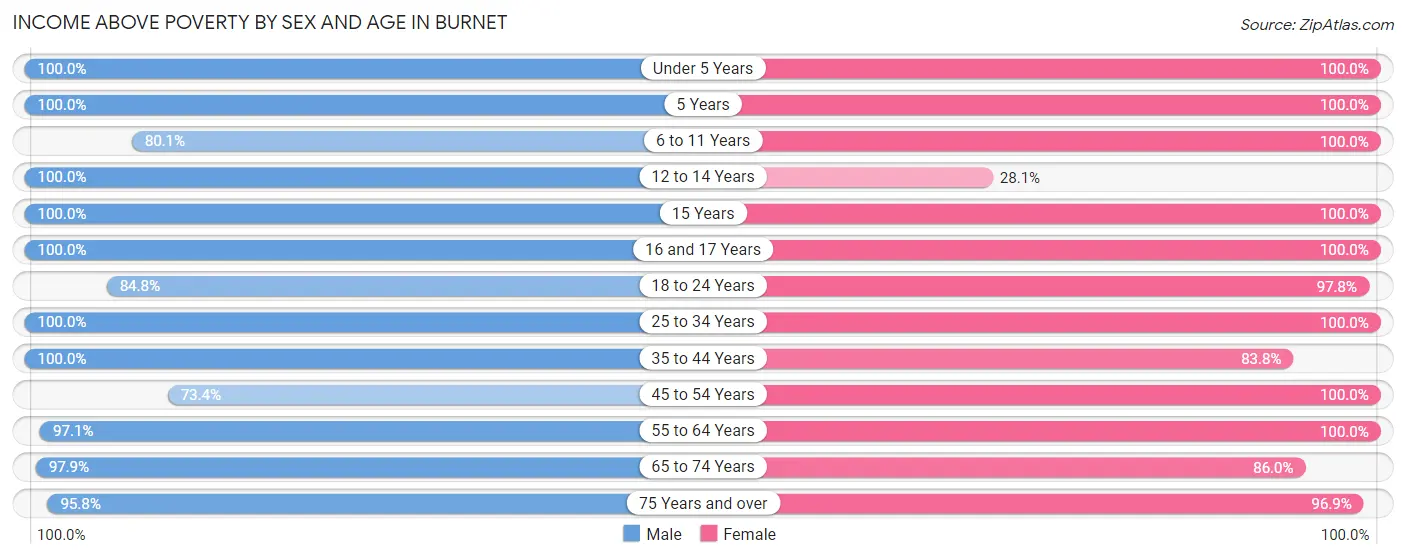
| Age Bracket | Male | Female |
| Under 5 Years | 136 (100.0%) | 210 (100.0%) |
| 5 Years | 36 (100.0%) | 31 (100.0%) |
| 6 to 11 Years | 161 (80.1%) | 289 (100.0%) |
| 12 to 14 Years | 71 (100.0%) | 23 (28.1%) |
| 15 Years | 29 (100.0%) | 24 (100.0%) |
| 16 and 17 Years | 13 (100.0%) | 28 (100.0%) |
| 18 to 24 Years | 250 (84.8%) | 358 (97.8%) |
| 25 to 34 Years | 416 (100.0%) | 413 (100.0%) |
| 35 to 44 Years | 230 (100.0%) | 212 (83.8%) |
| 45 to 54 Years | 257 (73.4%) | 281 (100.0%) |
| 55 to 64 Years | 471 (97.1%) | 357 (100.0%) |
| 65 to 74 Years | 188 (97.9%) | 277 (86.0%) |
| 75 Years and over | 248 (95.8%) | 430 (96.9%) |
| Total | 2,506 (92.4%) | 2,933 (94.6%) |
Income Below Poverty Among Married-Couple Families in Burnet
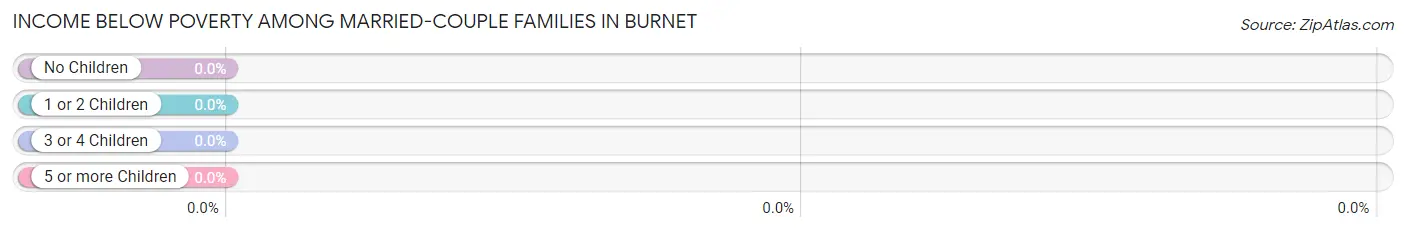
| Children | Above Poverty | Below Poverty |
| No Children | 634 (100.0%) | 0 (0.0%) |
| 1 or 2 Children | 329 (100.0%) | 0 (0.0%) |
| 3 or 4 Children | 42 (100.0%) | 0 (0.0%) |
| 5 or more Children | 65 (100.0%) | 0 (0.0%) |
| Total | 1,070 (100.0%) | 0 (0.0%) |
Income Below Poverty Among Single-Parent Households in Burnet
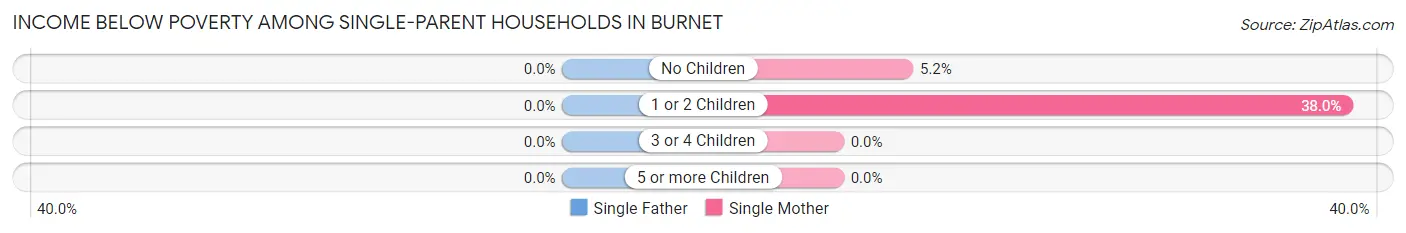
| Children | Single Father | Single Mother |
| No Children | 0 (0.0%) | 9 (5.2%) |
| 1 or 2 Children | 0 (0.0%) | 41 (38.0%) |
| 3 or 4 Children | 0 (0.0%) | 0 (0.0%) |
| 5 or more Children | 0 (0.0%) | 0 (0.0%) |
| Total | 0 (0.0%) | 50 (17.7%) |
Income Below Poverty Among Married-Couple vs Single-Parent Households in Burnet
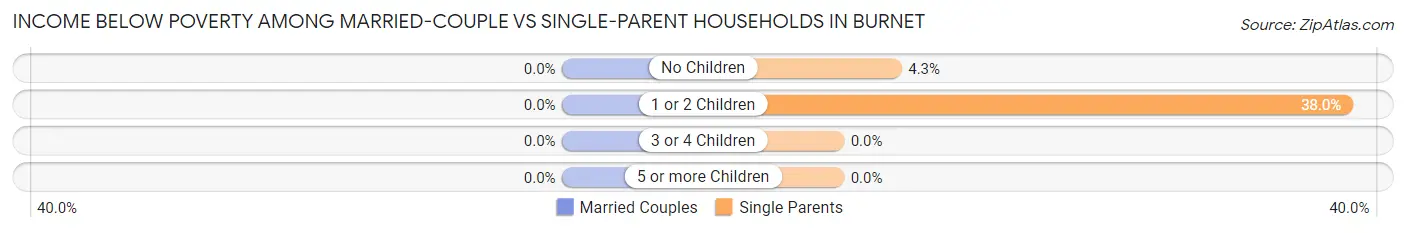
| Children | Married-Couple Families | Single-Parent Households |
| No Children | 0 (0.0%) | 9 (4.3%) |
| 1 or 2 Children | 0 (0.0%) | 41 (38.0%) |
| 3 or 4 Children | 0 (0.0%) | 0 (0.0%) |
| 5 or more Children | 0 (0.0%) | 0 (0.0%) |
| Total | 0 (0.0%) | 50 (15.7%) |
Race in Burnet
The most populous races in Burnet are White / Caucasian (5,818 | 90.0%), Hispanic or Latino (1,087 | 16.8%), and Two or more Races (423 | 6.5%).
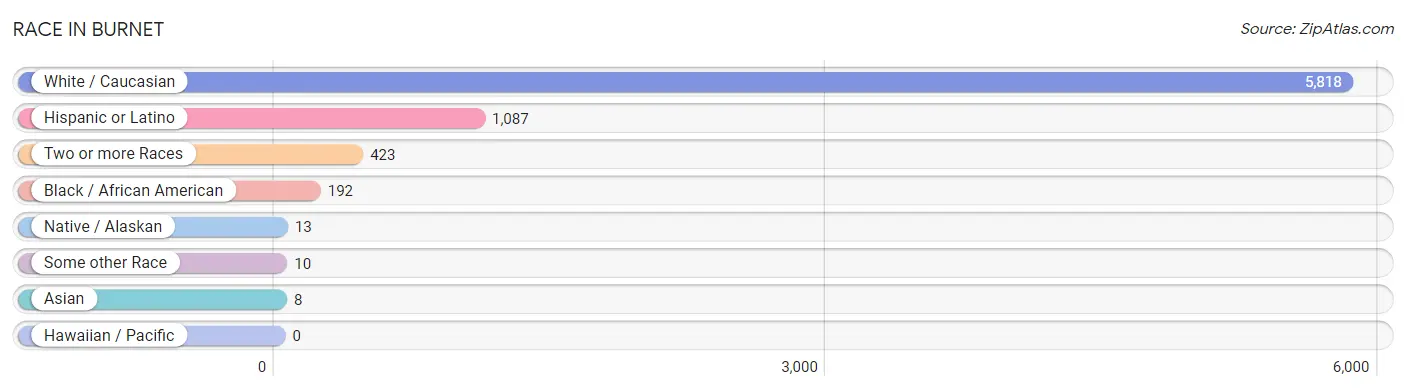
| Race | # Population | % Population |
| Asian | 8 | 0.1% |
| Black / African American | 192 | 3.0% |
| Hawaiian / Pacific | 0 | 0.0% |
| Hispanic or Latino | 1,087 | 16.8% |
| Native / Alaskan | 13 | 0.2% |
| White / Caucasian | 5,818 | 90.0% |
| Two or more Races | 423 | 6.5% |
| Some other Race | 10 | 0.2% |
| Total | 6,464 | 100.0% |
Ancestry in Burnet
The most populous ancestries reported in Burnet are Mexican (1,032 | 16.0%), German (918 | 14.2%), Irish (792 | 12.2%), English (585 | 9.0%), and American (520 | 8.0%), together accounting for 59.5% of all Burnet residents.
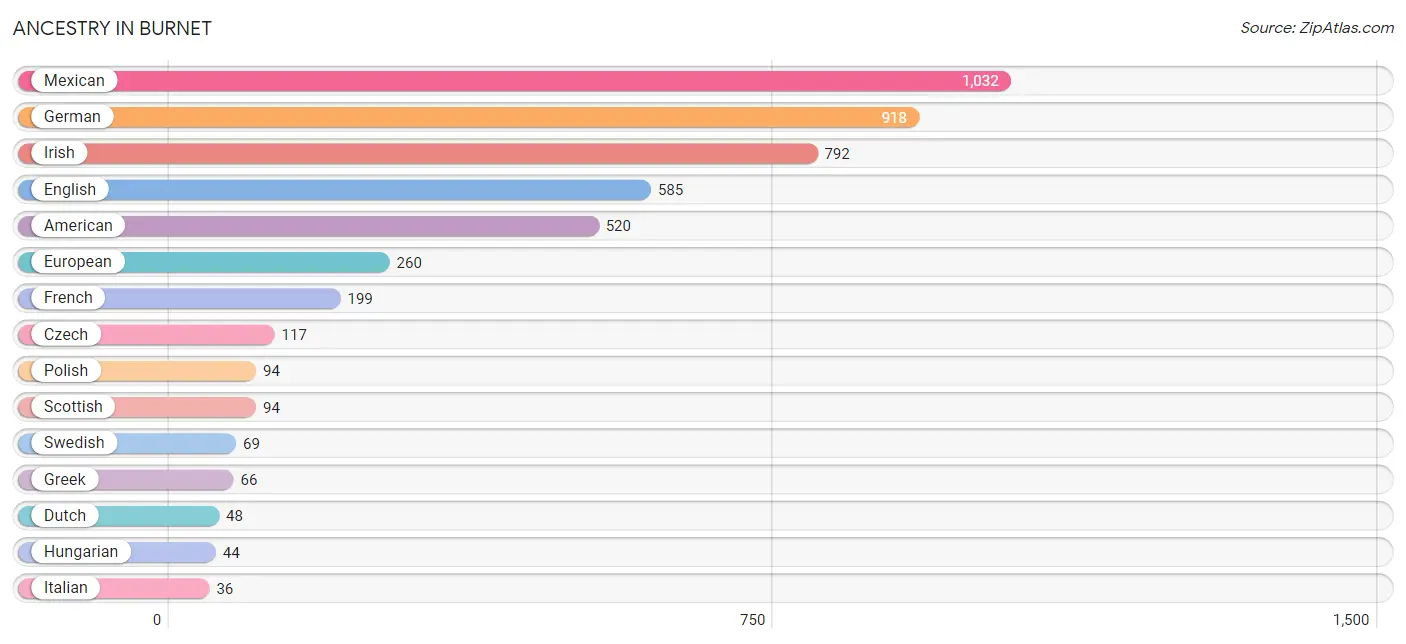
| Ancestry | # Population | % Population |
| African | 5 | 0.1% |
| American | 520 | 8.0% |
| Apache | 7 | 0.1% |
| Arab | 14 | 0.2% |
| Central American | 19 | 0.3% |
| Cherokee | 6 | 0.1% |
| Czech | 117 | 1.8% |
| Dutch | 48 | 0.7% |
| English | 585 | 9.0% |
| European | 260 | 4.0% |
| French | 199 | 3.1% |
| French Canadian | 16 | 0.3% |
| German | 918 | 14.2% |
| Greek | 66 | 1.0% |
| Guamanian / Chamorro | 12 | 0.2% |
| Guatemalan | 8 | 0.1% |
| Honduran | 11 | 0.2% |
| Hungarian | 44 | 0.7% |
| Indian (Asian) | 12 | 0.2% |
| Irish | 792 | 12.2% |
| Italian | 36 | 0.6% |
| Jordanian | 14 | 0.2% |
| Mexican | 1,032 | 16.0% |
| Native Hawaiian | 12 | 0.2% |
| Northern European | 13 | 0.2% |
| Pennsylvania German | 8 | 0.1% |
| Peruvian | 6 | 0.1% |
| Polish | 94 | 1.5% |
| Portuguese | 22 | 0.3% |
| Samoan | 12 | 0.2% |
| Scandinavian | 15 | 0.2% |
| Scottish | 94 | 1.5% |
| Slavic | 25 | 0.4% |
| South American | 6 | 0.1% |
| Spaniard | 14 | 0.2% |
| Subsaharan African | 5 | 0.1% |
| Swedish | 69 | 1.1% |
| Thai | 8 | 0.1% |
| Welsh | 23 | 0.4% | View All 39 Rows |
Immigrants in Burnet
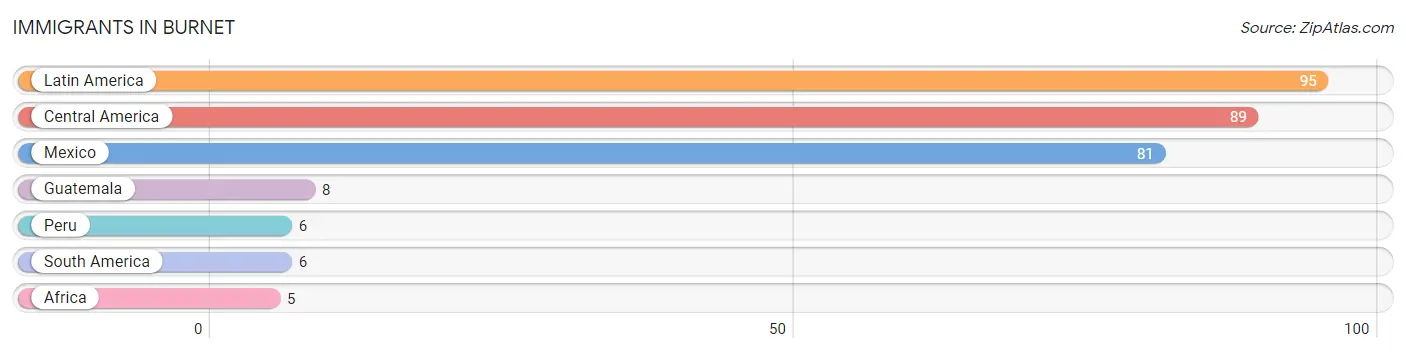
The most numerous immigrant groups reported in Burnet came from Latin America (95 | 1.5%), Central America (89 | 1.4%), Mexico (81 | 1.3%), Guatemala (8 | 0.1%), and Peru (6 | 0.1%), together accounting for 4.3% of all Burnet residents.
| Immigration Origin | # Population | % Population |
| Africa | 5 | 0.1% |
| Central America | 89 | 1.4% |
| Guatemala | 8 | 0.1% |
| Latin America | 95 | 1.5% |
| Mexico | 81 | 1.3% |
| Peru | 6 | 0.1% |
| South America | 6 | 0.1% | View All 7 Rows |
Sex and Age in Burnet
Sex and Age in Burnet
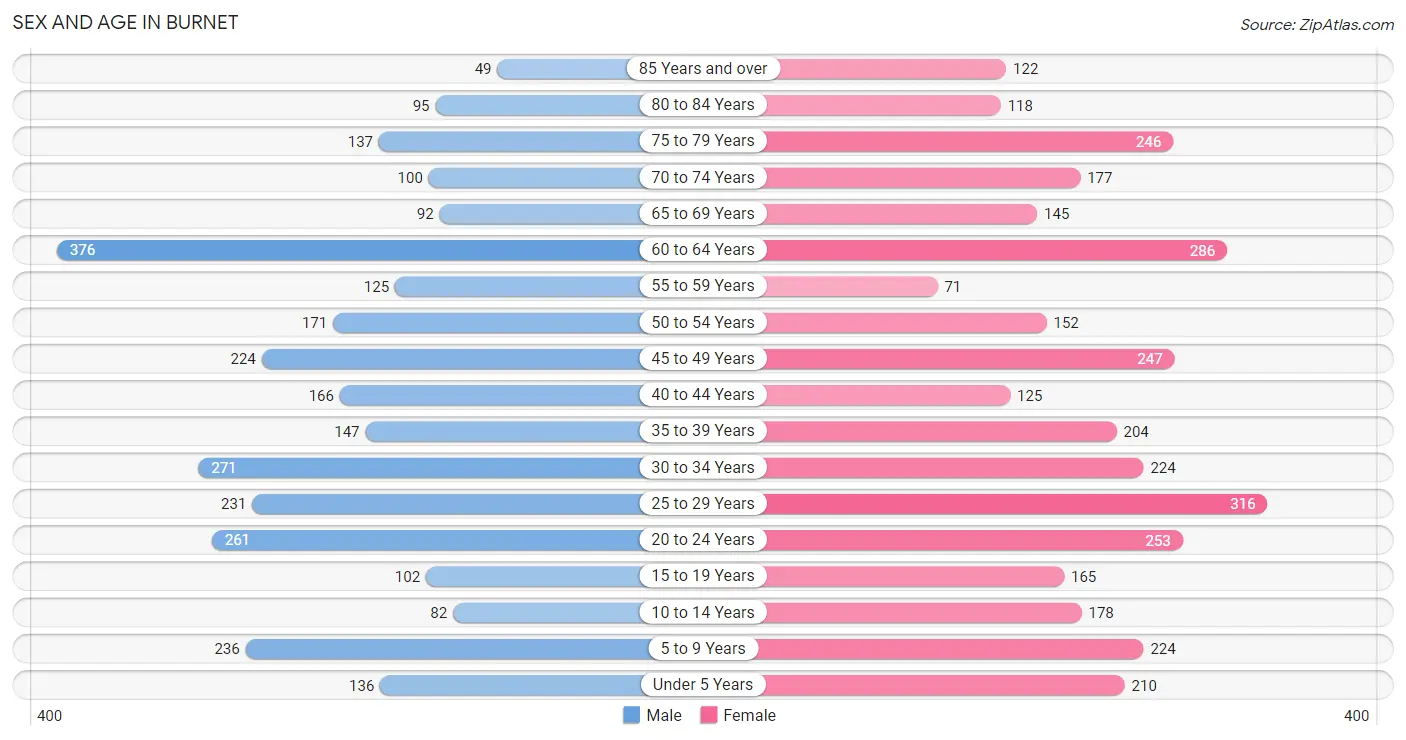
The most populous age groups in Burnet are 60 to 64 Years (376 | 12.5%) for men and 25 to 29 Years (316 | 9.1%) for women.
| Age Bracket | Male | Female |
| Under 5 Years | 136 (4.5%) | 210 (6.1%) |
| 5 to 9 Years | 236 (7.9%) | 224 (6.5%) |
| 10 to 14 Years | 82 (2.7%) | 178 (5.1%) |
| 15 to 19 Years | 102 (3.4%) | 165 (4.8%) |
| 20 to 24 Years | 261 (8.7%) | 253 (7.3%) |
| 25 to 29 Years | 231 (7.7%) | 316 (9.1%) |
| 30 to 34 Years | 271 (9.0%) | 224 (6.5%) |
| 35 to 39 Years | 147 (4.9%) | 204 (5.9%) |
| 40 to 44 Years | 166 (5.5%) | 125 (3.6%) |
| 45 to 49 Years | 224 (7.5%) | 247 (7.1%) |
| 50 to 54 Years | 171 (5.7%) | 152 (4.4%) |
| 55 to 59 Years | 125 (4.2%) | 71 (2.1%) |
| 60 to 64 Years | 376 (12.5%) | 286 (8.3%) |
| 65 to 69 Years | 92 (3.1%) | 145 (4.2%) |
| 70 to 74 Years | 100 (3.3%) | 177 (5.1%) |
| 75 to 79 Years | 137 (4.6%) | 246 (7.1%) |
| 80 to 84 Years | 95 (3.2%) | 118 (3.4%) |
| 85 Years and over | 49 (1.6%) | 122 (3.5%) |
| Total | 3,001 (100.0%) | 3,463 (100.0%) |
Families and Households in Burnet
Median Family Size in Burnet
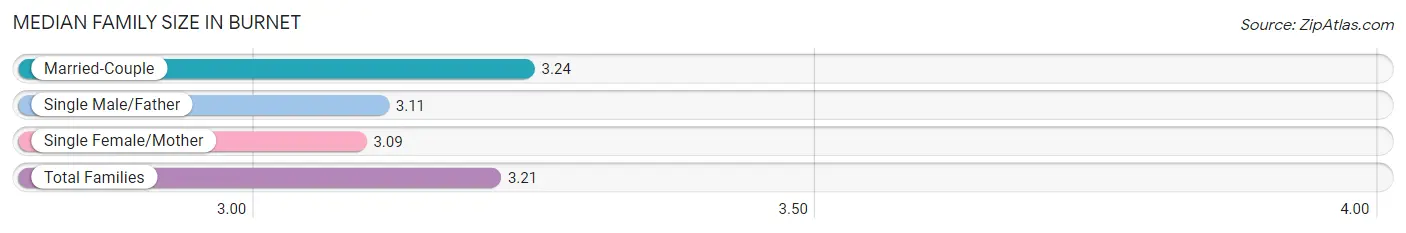
The median family size in Burnet is 3.21 persons per family, with married-couple families (1,070 | 77.1%) accounting for the largest median family size of 3.24 persons per family. On the other hand, single female/mother families (282 | 20.3%) represent the smallest median family size with 3.09 persons per family.
| Family Type | # Families | Family Size |
| Married-Couple | 1,070 (77.1%) | 3.24 |
| Single Male/Father | 36 (2.6%) | 3.11 |
| Single Female/Mother | 282 (20.3%) | 3.09 |
| Total Families | 1,388 (100.0%) | 3.21 |
Median Household Size in Burnet
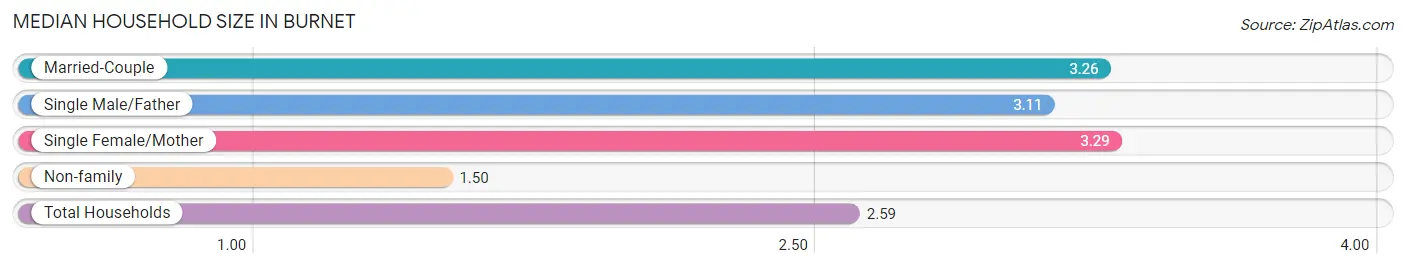
The median household size in Burnet is 2.59 persons per household, with single female/mother households (282 | 12.6%) accounting for the largest median household size of 3.29 persons per household. non-family households (855 | 38.1%) represent the smallest median household size with 1.50 persons per household.
| Household Type | # Households | Household Size |
| Married-Couple | 1,070 (47.7%) | 3.26 |
| Single Male/Father | 36 (1.6%) | 3.11 |
| Single Female/Mother | 282 (12.6%) | 3.29 |
| Non-family | 855 (38.1%) | 1.50 |
| Total Households | 2,243 (100.0%) | 2.59 |
Household Size by Marriage Status in Burnet
Out of a total of 2,243 households in Burnet, 1,388 (61.9%) are family households, while 855 (38.1%) are nonfamily households. The most numerous type of family households are 2-person households, comprising 603, and the most common type of nonfamily households are 1-person households, comprising 604.
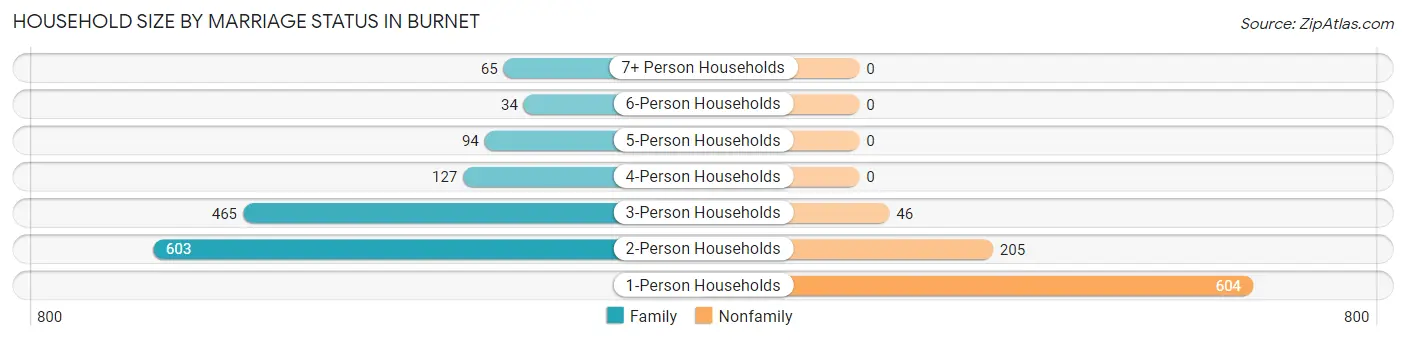
| Household Size | Family Households | Nonfamily Households |
| 1-Person Households | - | 604 (26.9%) |
| 2-Person Households | 603 (26.9%) | 205 (9.1%) |
| 3-Person Households | 465 (20.7%) | 46 (2.1%) |
| 4-Person Households | 127 (5.7%) | 0 (0.0%) |
| 5-Person Households | 94 (4.2%) | 0 (0.0%) |
| 6-Person Households | 34 (1.5%) | 0 (0.0%) |
| 7+ Person Households | 65 (2.9%) | 0 (0.0%) |
| Total | 1,388 (61.9%) | 855 (38.1%) |
Female Fertility in Burnet
Fertility by Age in Burnet
Average fertility rate in Burnet is 25.0 births per 1,000 women. Women in the age bracket of 20 to 34 years have the highest fertility rate with 49.0 births per 1,000 women. Women in the age bracket of 20 to 34 years acount for 100.0% of all women with births.
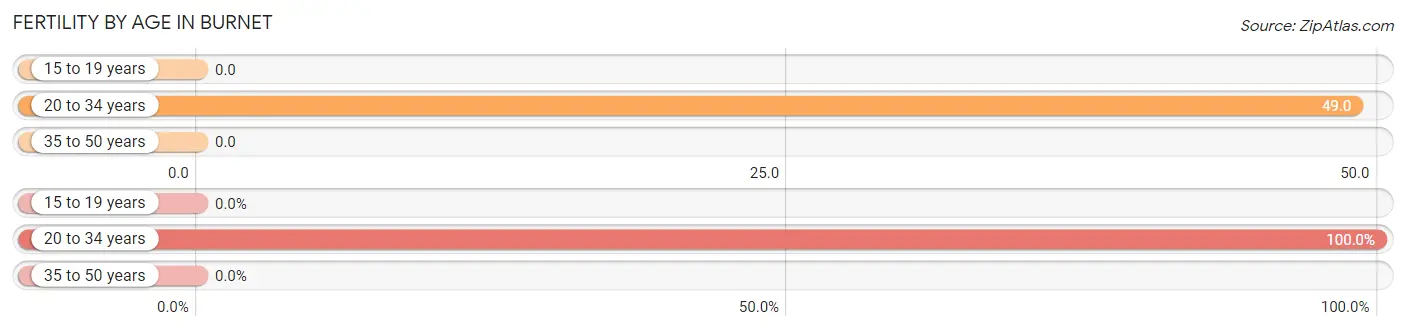
| Age Bracket | Women with Births | Births / 1,000 Women |
| 15 to 19 years | 0 (0.0%) | 0.0 |
| 20 to 34 years | 39 (100.0%) | 49.0 |
| 35 to 50 years | 0 (0.0%) | 0.0 |
| Total | 39 (100.0%) | 25.0 |
Fertility by Age by Marriage Status in Burnet
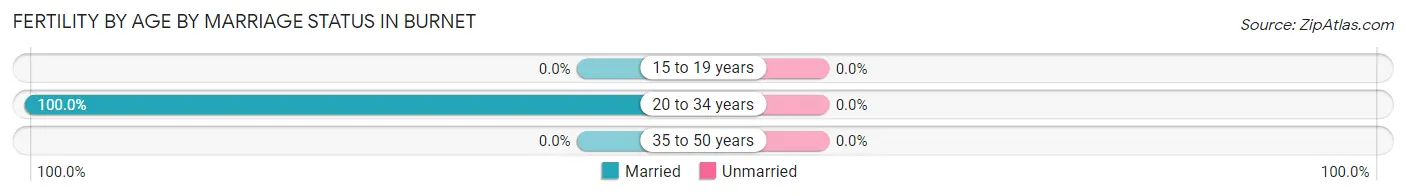
| Age Bracket | Married | Unmarried |
| 15 to 19 years | 0 (0.0%) | 0 (0.0%) |
| 20 to 34 years | 39 (100.0%) | 0 (0.0%) |
| 35 to 50 years | 0 (0.0%) | 0 (0.0%) |
| Total | 39 (100.0%) | 0 (0.0%) |
Fertility by Education in Burnet
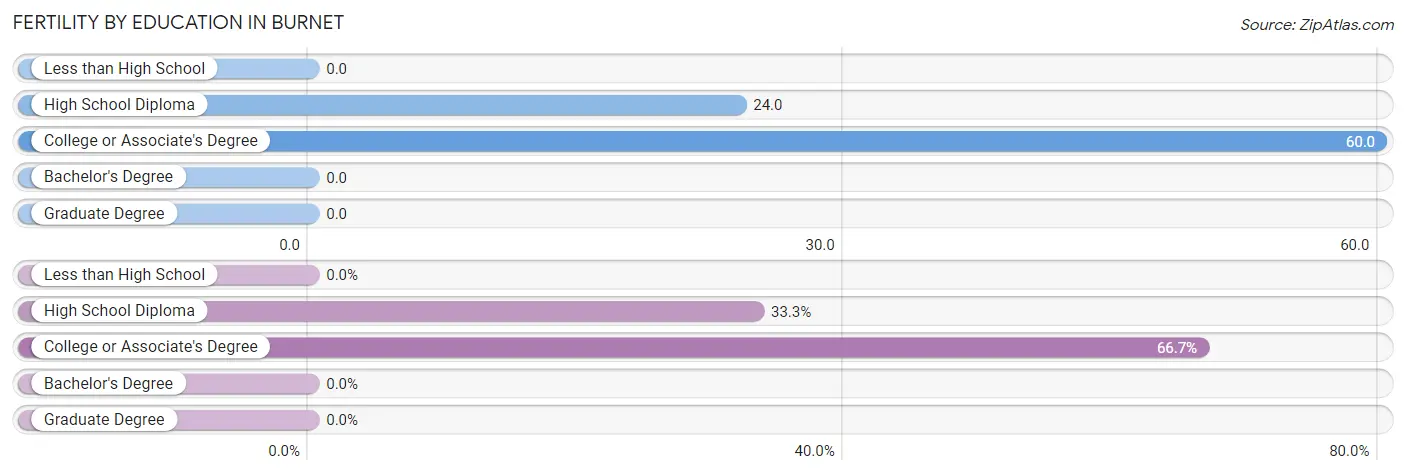
| Educational Attainment | Women with Births | Births / 1,000 Women |
| Less than High School | 0 (0.0%) | 0.0 |
| High School Diploma | 13 (33.3%) | 24.0 |
| College or Associate's Degree | 26 (66.7%) | 60.0 |
| Bachelor's Degree | 0 (0.0%) | 0.0 |
| Graduate Degree | 0 (0.0%) | 0.0 |
| Total | 39 (100.0%) | 25.0 |
Fertility by Education by Marriage Status in Burnet
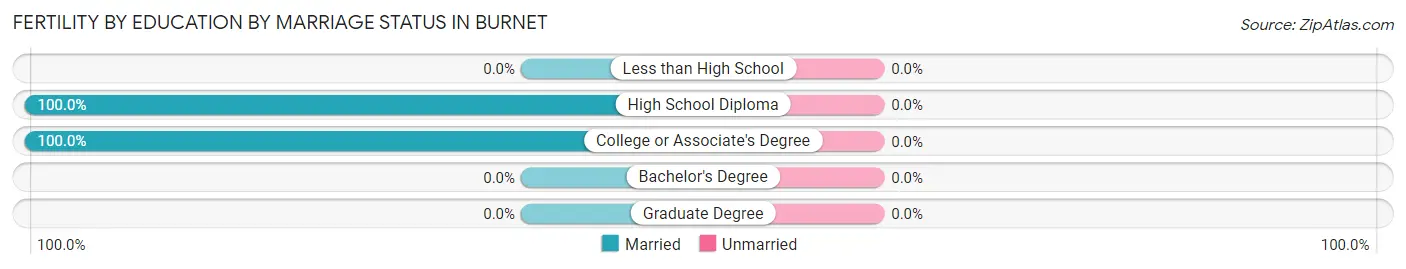
| Educational Attainment | Married | Unmarried |
| Less than High School | 0 (0.0%) | 0 (0.0%) |
| High School Diploma | 13 (100.0%) | 0 (0.0%) |
| College or Associate's Degree | 26 (100.0%) | 0 (0.0%) |
| Bachelor's Degree | 0 (0.0%) | 0 (0.0%) |
| Graduate Degree | 0 (0.0%) | 0 (0.0%) |
| Total | 39 (100.0%) | 0 (0.0%) |
Employment Characteristics in Burnet
Employment by Class of Employer in Burnet
Among the 2,959 employed individuals in Burnet, private company employees (1,894 | 64.0%), self-employed (not incorporated) (301 | 10.2%), and not-for-profit organizations (292 | 9.9%) make up the most common classes of employment.
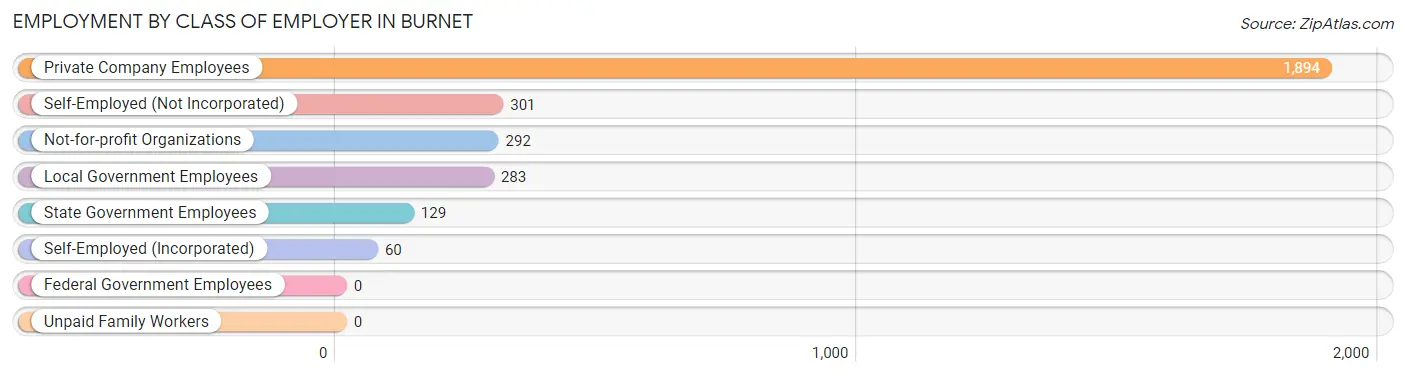
| Employer Class | # Employees | % Employees |
| Private Company Employees | 1,894 | 64.0% |
| Self-Employed (Incorporated) | 60 | 2.0% |
| Self-Employed (Not Incorporated) | 301 | 10.2% |
| Not-for-profit Organizations | 292 | 9.9% |
| Local Government Employees | 283 | 9.6% |
| State Government Employees | 129 | 4.4% |
| Federal Government Employees | 0 | 0.0% |
| Unpaid Family Workers | 0 | 0.0% |
| Total | 2,959 | 100.0% |
Employment Status by Age in Burnet
According to the labor force statistics for Burnet, out of the total population over 16 years of age (5,345), 57.7% or 3,084 individuals are in the labor force, with 3.2% or 99 of them unemployed. The age group with the highest labor force participation rate is 60 to 64 years, with 80.8% or 535 individuals in the labor force. Within the labor force, the 25 to 29 years age range has the highest percentage of unemployed individuals, with 12.5% or 48 of them being unemployed.
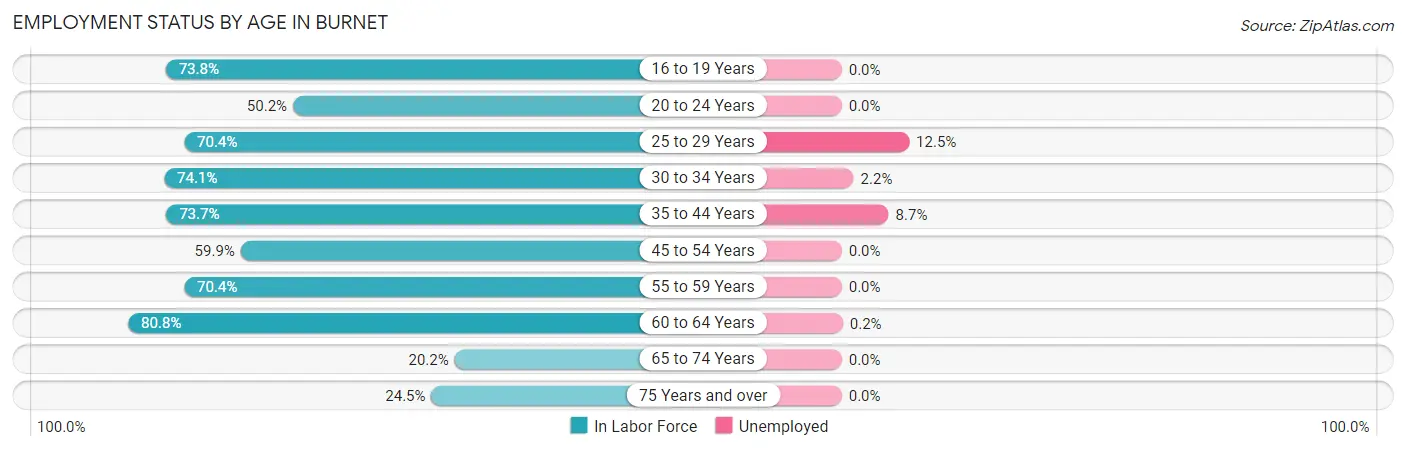
| Age Bracket | In Labor Force | Unemployed |
| 16 to 19 Years | 158 (73.8%) | 0 (0.0%) |
| 20 to 24 Years | 258 (50.2%) | 0 (0.0%) |
| 25 to 29 Years | 385 (70.4%) | 48 (12.5%) |
| 30 to 34 Years | 367 (74.1%) | 8 (2.2%) |
| 35 to 44 Years | 473 (73.7%) | 41 (8.7%) |
| 45 to 54 Years | 476 (59.9%) | 0 (0.0%) |
| 55 to 59 Years | 138 (70.4%) | 0 (0.0%) |
| 60 to 64 Years | 535 (80.8%) | 1 (0.2%) |
| 65 to 74 Years | 104 (20.2%) | 0 (0.0%) |
| 75 Years and over | 188 (24.5%) | 0 (0.0%) |
| Total | 3,084 (57.7%) | 99 (3.2%) |
Employment Status by Educational Attainment in Burnet
According to labor force statistics for Burnet, 71.2% of individuals (2,375) out of the total population between 25 and 64 years of age (3,336) are in the labor force, with 4.1% or 97 of them being unemployed. The group with the highest labor force participation rate are those with the educational attainment of bachelor's degree or higher, with 90.2% or 636 individuals in the labor force. Within the labor force, individuals with high school diploma education have the highest percentage of unemployment, with 6.3% or 48 of them being unemployed.
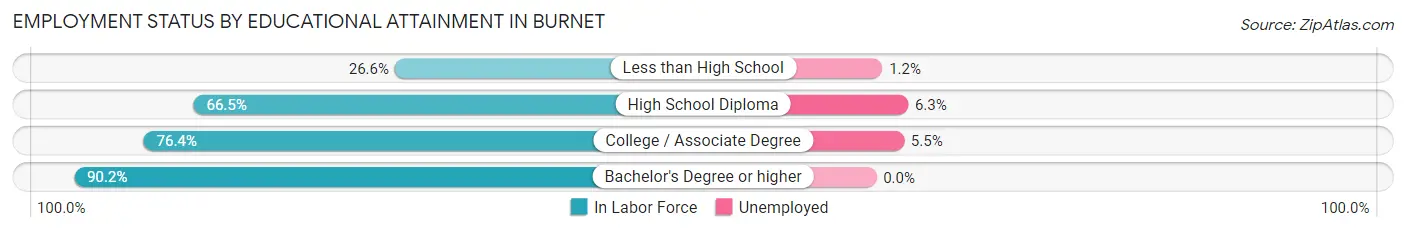
| Educational Attainment | In Labor Force | Unemployed |
| Less than High School | 84 (26.6%) | 4 (1.2%) |
| High School Diploma | 767 (66.5%) | 73 (6.3%) |
| College / Associate Degree | 887 (76.4%) | 64 (5.5%) |
| Bachelor's Degree or higher | 636 (90.2%) | 0 (0.0%) |
| Total | 2,375 (71.2%) | 137 (4.1%) |
Employment Occupations by Sex in Burnet
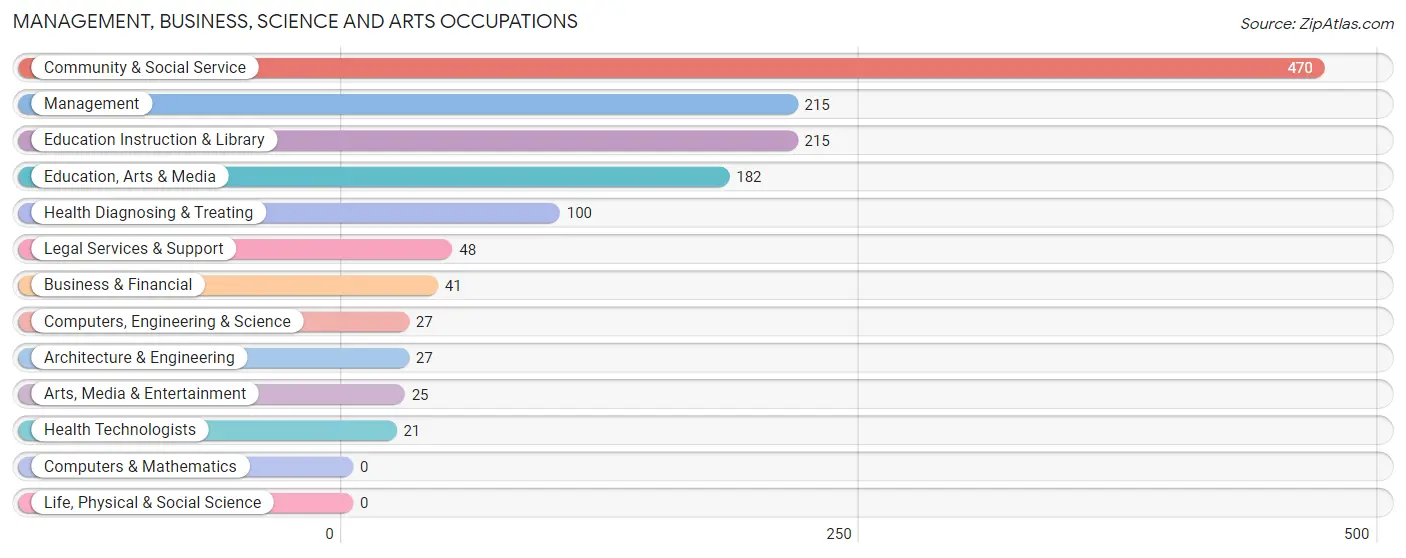
Management, Business, Science and Arts Occupations
The most common Management, Business, Science and Arts occupations in Burnet are Community & Social Service (470 | 15.8%), Management (215 | 7.2%), Education Instruction & Library (215 | 7.2%), Education, Arts & Media (182 | 6.1%), and Health Diagnosing & Treating (100 | 3.4%).
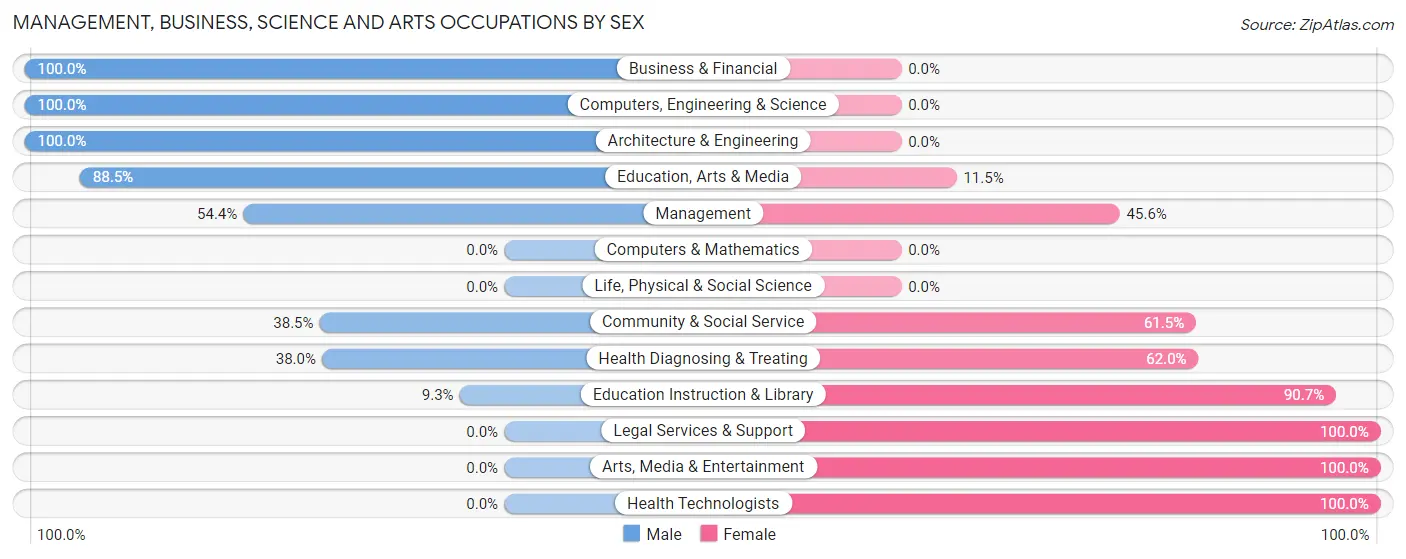
Management, Business, Science and Arts Occupations by Sex
Within the Management, Business, Science and Arts occupations in Burnet, the most male-oriented occupations are Business & Financial (100.0%), Computers, Engineering & Science (100.0%), and Architecture & Engineering (100.0%), while the most female-oriented occupations are Legal Services & Support (100.0%), Arts, Media & Entertainment (100.0%), and Health Technologists (100.0%).
| Occupation | Male | Female |
| Management | 117 (54.4%) | 98 (45.6%) |
| Business & Financial | 41 (100.0%) | 0 (0.0%) |
| Computers, Engineering & Science | 27 (100.0%) | 0 (0.0%) |
| Computers & Mathematics | 0 (0.0%) | 0 (0.0%) |
| Architecture & Engineering | 27 (100.0%) | 0 (0.0%) |
| Life, Physical & Social Science | 0 (0.0%) | 0 (0.0%) |
| Community & Social Service | 181 (38.5%) | 289 (61.5%) |
| Education, Arts & Media | 161 (88.5%) | 21 (11.5%) |
| Legal Services & Support | 0 (0.0%) | 48 (100.0%) |
| Education Instruction & Library | 20 (9.3%) | 195 (90.7%) |
| Arts, Media & Entertainment | 0 (0.0%) | 25 (100.0%) |
| Health Diagnosing & Treating | 38 (38.0%) | 62 (62.0%) |
| Health Technologists | 0 (0.0%) | 21 (100.0%) |
| Total (Category) | 404 (47.4%) | 449 (52.6%) |
| Total (Overall) | 1,439 (48.2%) | 1,545 (51.8%) |
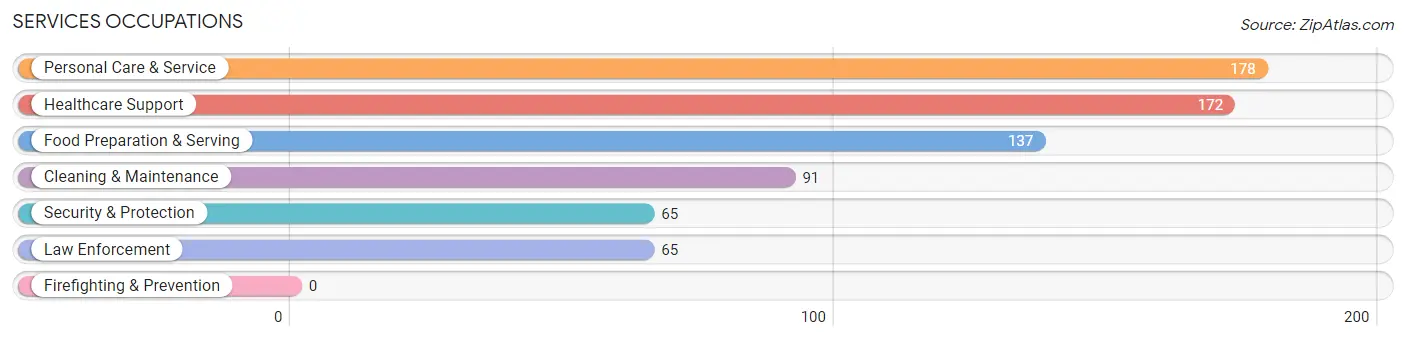
Services Occupations
The most common Services occupations in Burnet are Personal Care & Service (178 | 6.0%), Healthcare Support (172 | 5.8%), Food Preparation & Serving (137 | 4.6%), Cleaning & Maintenance (91 | 3.0%), and Security & Protection (65 | 2.2%).
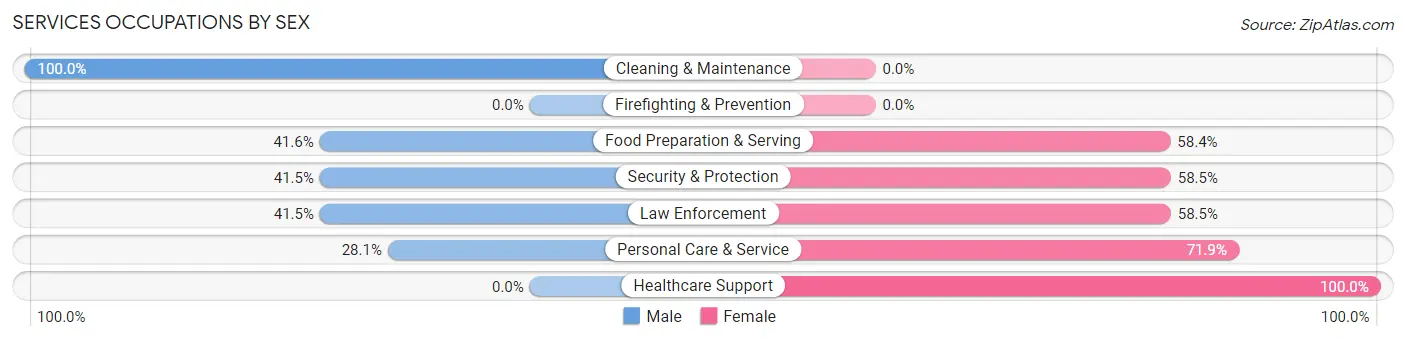
Services Occupations by Sex
Within the Services occupations in Burnet, the most male-oriented occupations are Cleaning & Maintenance (100.0%), Food Preparation & Serving (41.6%), and Security & Protection (41.5%), while the most female-oriented occupations are Healthcare Support (100.0%), Personal Care & Service (71.9%), and Security & Protection (58.5%).
| Occupation | Male | Female |
| Healthcare Support | 0 (0.0%) | 172 (100.0%) |
| Security & Protection | 27 (41.5%) | 38 (58.5%) |
| Firefighting & Prevention | 0 (0.0%) | 0 (0.0%) |
| Law Enforcement | 27 (41.5%) | 38 (58.5%) |
| Food Preparation & Serving | 57 (41.6%) | 80 (58.4%) |
| Cleaning & Maintenance | 91 (100.0%) | 0 (0.0%) |
| Personal Care & Service | 50 (28.1%) | 128 (71.9%) |
| Total (Category) | 225 (35.0%) | 418 (65.0%) |
| Total (Overall) | 1,439 (48.2%) | 1,545 (51.8%) |
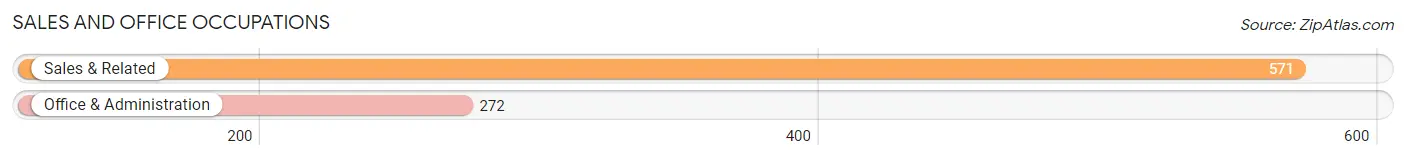
Sales and Office Occupations
The most common Sales and Office occupations in Burnet are Sales & Related (571 | 19.1%), and Office & Administration (272 | 9.1%).
Sales and Office Occupations by Sex
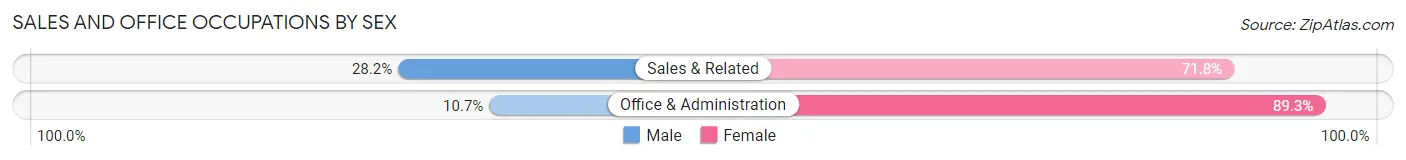
| Occupation | Male | Female |
| Sales & Related | 161 (28.2%) | 410 (71.8%) |
| Office & Administration | 29 (10.7%) | 243 (89.3%) |
| Total (Category) | 190 (22.5%) | 653 (77.5%) |
| Total (Overall) | 1,439 (48.2%) | 1,545 (51.8%) |
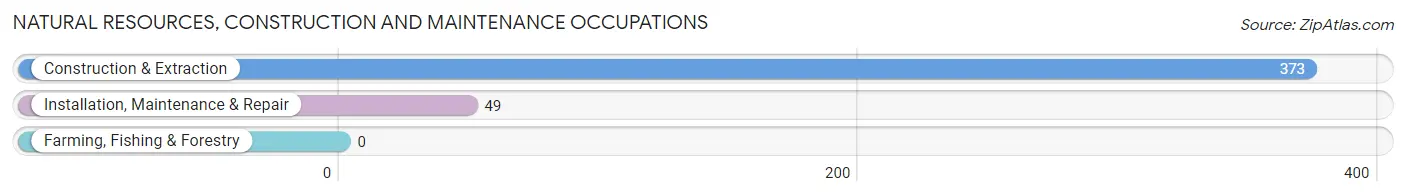
Natural Resources, Construction and Maintenance Occupations
The most common Natural Resources, Construction and Maintenance occupations in Burnet are Construction & Extraction (373 | 12.5%), and Installation, Maintenance & Repair (49 | 1.6%).
Natural Resources, Construction and Maintenance Occupations by Sex
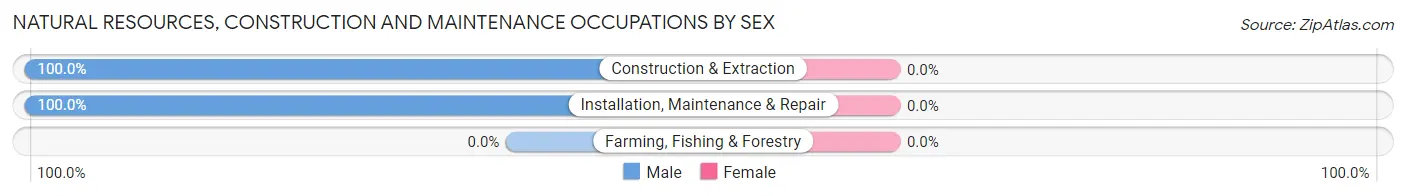
| Occupation | Male | Female |
| Farming, Fishing & Forestry | 0 (0.0%) | 0 (0.0%) |
| Construction & Extraction | 373 (100.0%) | 0 (0.0%) |
| Installation, Maintenance & Repair | 49 (100.0%) | 0 (0.0%) |
| Total (Category) | 422 (100.0%) | 0 (0.0%) |
| Total (Overall) | 1,439 (48.2%) | 1,545 (51.8%) |
Production, Transportation and Moving Occupations
The most common Production, Transportation and Moving occupations in Burnet are Transportation (137 | 4.6%), and Production (86 | 2.9%).
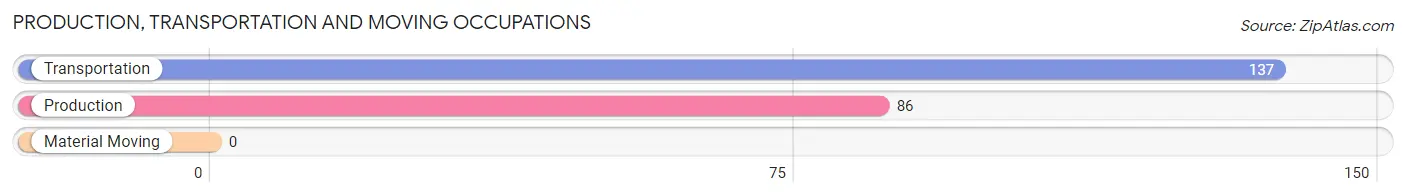
Production, Transportation and Moving Occupations by Sex
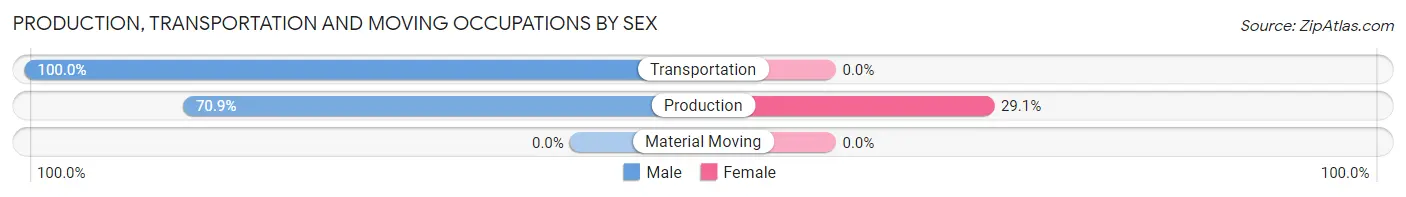
| Occupation | Male | Female |
| Production | 61 (70.9%) | 25 (29.1%) |
| Transportation | 137 (100.0%) | 0 (0.0%) |
| Material Moving | 0 (0.0%) | 0 (0.0%) |
| Total (Category) | 198 (88.8%) | 25 (11.2%) |
| Total (Overall) | 1,439 (48.2%) | 1,545 (51.8%) |
Employment Industries by Sex in Burnet
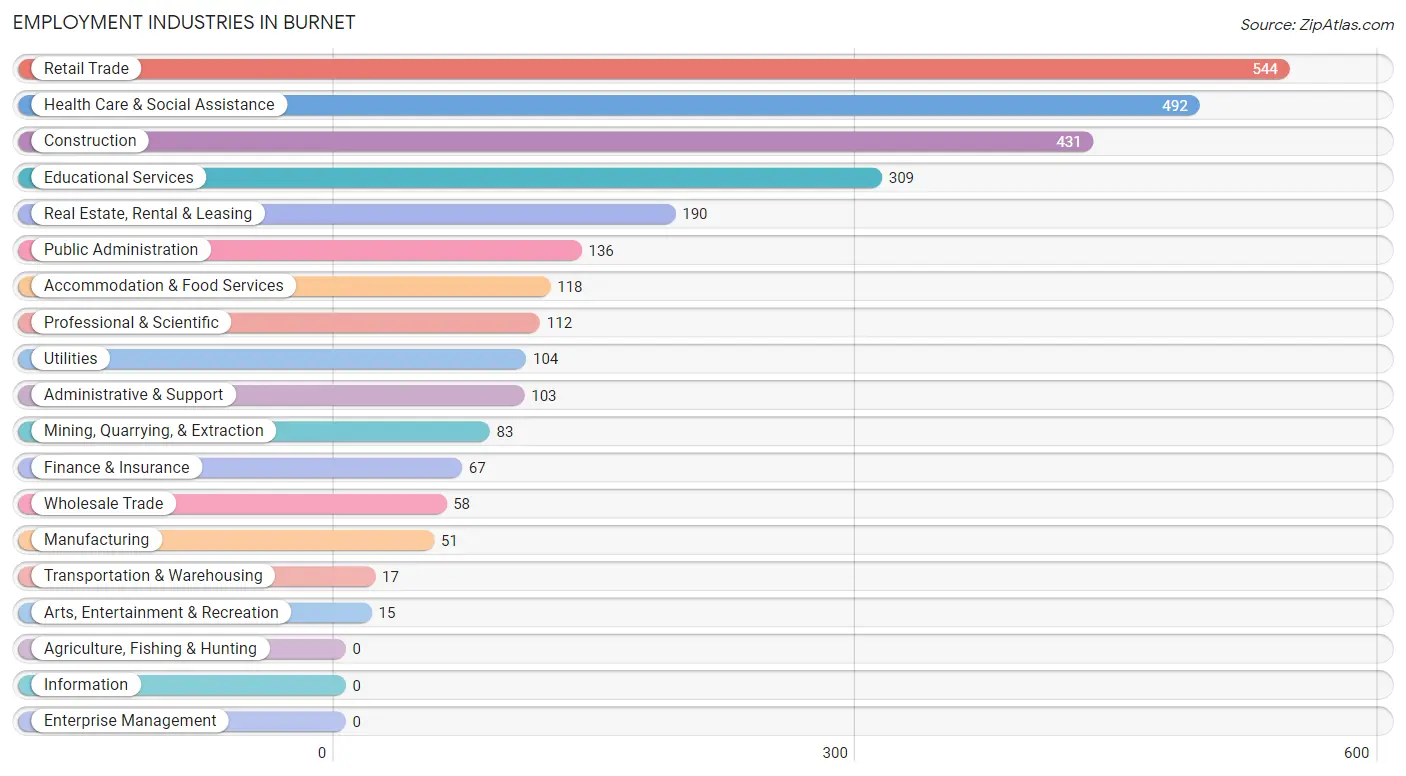
Employment Industries in Burnet
The major employment industries in Burnet include Retail Trade (544 | 18.2%), Health Care & Social Assistance (492 | 16.5%), Construction (431 | 14.4%), Educational Services (309 | 10.4%), and Real Estate, Rental & Leasing (190 | 6.4%).
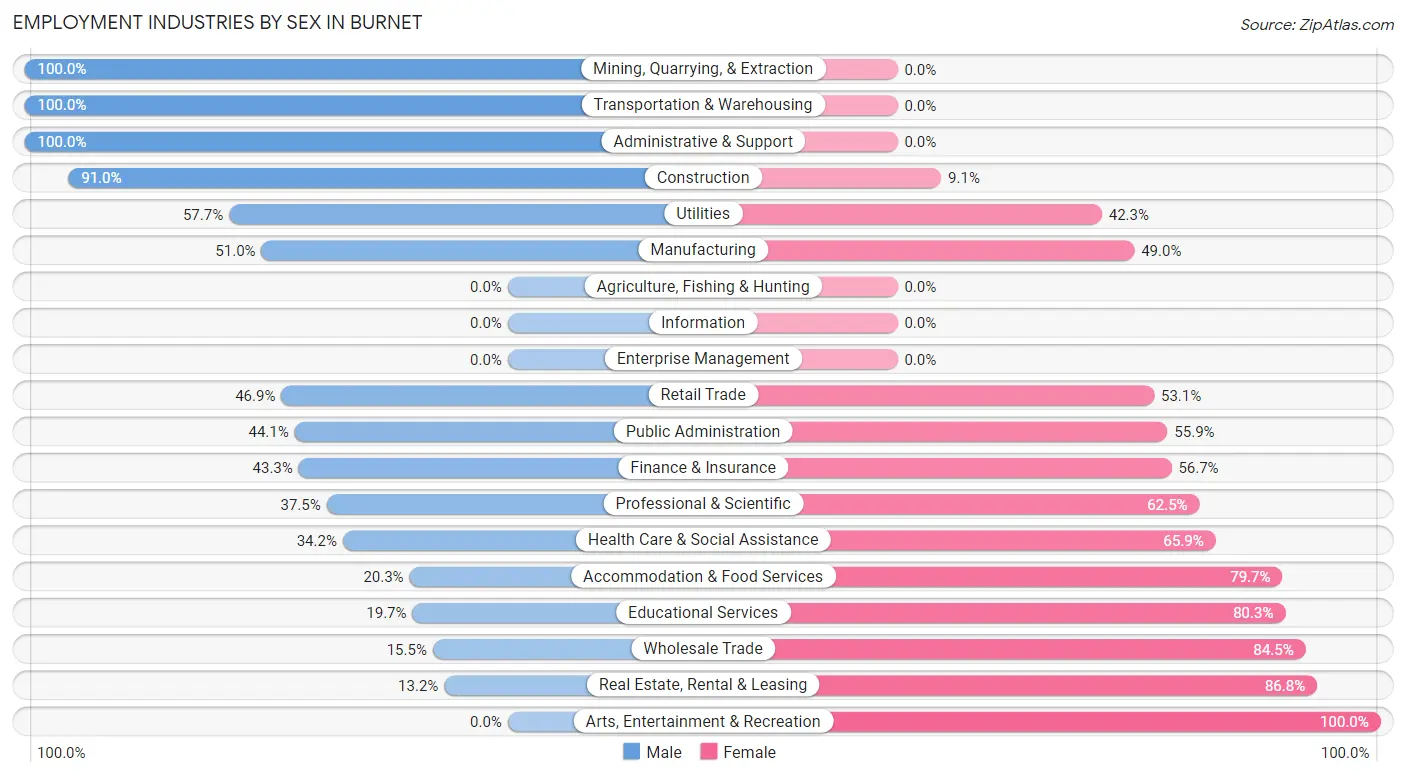
Employment Industries by Sex in Burnet
The Burnet industries that see more men than women are Mining, Quarrying, & Extraction (100.0%), Transportation & Warehousing (100.0%), and Administrative & Support (100.0%), whereas the industries that tend to have a higher number of women are Arts, Entertainment & Recreation (100.0%), Real Estate, Rental & Leasing (86.8%), and Wholesale Trade (84.5%).
| Industry | Male | Female |
| Agriculture, Fishing & Hunting | 0 (0.0%) | 0 (0.0%) |
| Mining, Quarrying, & Extraction | 83 (100.0%) | 0 (0.0%) |
| Construction | 392 (90.9%) | 39 (9.0%) |
| Manufacturing | 26 (51.0%) | 25 (49.0%) |
| Wholesale Trade | 9 (15.5%) | 49 (84.5%) |
| Retail Trade | 255 (46.9%) | 289 (53.1%) |
| Transportation & Warehousing | 17 (100.0%) | 0 (0.0%) |
| Utilities | 60 (57.7%) | 44 (42.3%) |
| Information | 0 (0.0%) | 0 (0.0%) |
| Finance & Insurance | 29 (43.3%) | 38 (56.7%) |
| Real Estate, Rental & Leasing | 25 (13.2%) | 165 (86.8%) |
| Professional & Scientific | 42 (37.5%) | 70 (62.5%) |
| Enterprise Management | 0 (0.0%) | 0 (0.0%) |
| Administrative & Support | 103 (100.0%) | 0 (0.0%) |
| Educational Services | 61 (19.7%) | 248 (80.3%) |
| Health Care & Social Assistance | 168 (34.2%) | 324 (65.8%) |
| Arts, Entertainment & Recreation | 0 (0.0%) | 15 (100.0%) |
| Accommodation & Food Services | 24 (20.3%) | 94 (79.7%) |
| Public Administration | 60 (44.1%) | 76 (55.9%) |
| Total | 1,439 (48.2%) | 1,545 (51.8%) |
Education in Burnet
School Enrollment in Burnet
The most common levels of schooling among the 1,214 students in Burnet are elementary school (408 | 33.6%), middle school (245 | 20.2%), and high school (214 | 17.6%).
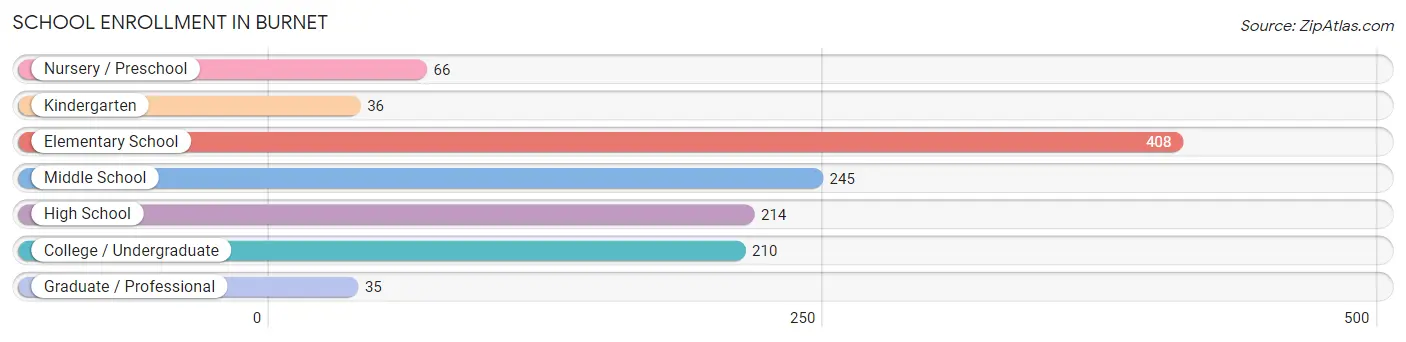
| School Level | # Students | % Students |
| Nursery / Preschool | 66 | 5.4% |
| Kindergarten | 36 | 3.0% |
| Elementary School | 408 | 33.6% |
| Middle School | 245 | 20.2% |
| High School | 214 | 17.6% |
| College / Undergraduate | 210 | 17.3% |
| Graduate / Professional | 35 | 2.9% |
| Total | 1,214 | 100.0% |
School Enrollment by Age by Funding Source in Burnet
Out of a total of 1,214 students who are enrolled in schools in Burnet, 300 (24.7%) attend a private institution, while the remaining 914 (75.3%) are enrolled in public schools. The age group of 18 to 19 year olds has the highest likelihood of being enrolled in private schools, with 76 (56.7% in the age bracket) enrolled. Conversely, the age group of 3 to 4 year olds has the lowest likelihood of being enrolled in a private school, with 55 (100.0% in the age bracket) attending a public institution.
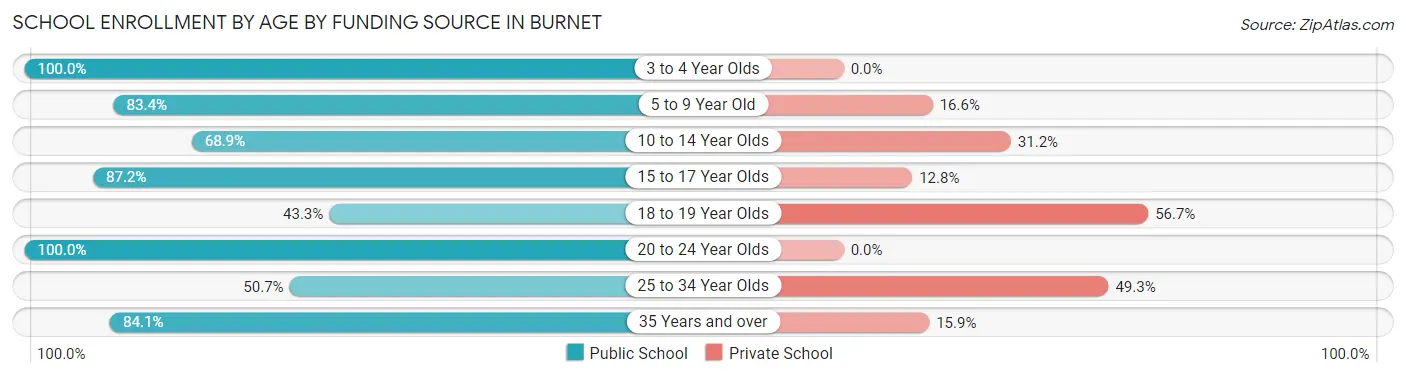
| Age Bracket | Public School | Private School |
| 3 to 4 Year Olds | 55 (100.0%) | 0 (0.0%) |
| 5 to 9 Year Old | 367 (83.4%) | 73 (16.6%) |
| 10 to 14 Year Olds | 179 (68.9%) | 81 (31.1%) |
| 15 to 17 Year Olds | 82 (87.2%) | 12 (12.8%) |
| 18 to 19 Year Olds | 58 (43.3%) | 76 (56.7%) |
| 20 to 24 Year Olds | 20 (100.0%) | 0 (0.0%) |
| 25 to 34 Year Olds | 37 (50.7%) | 36 (49.3%) |
| 35 Years and over | 116 (84.1%) | 22 (15.9%) |
| Total | 914 (75.3%) | 300 (24.7%) |
Educational Attainment by Field of Study in Burnet
Education (284 | 25.8%), bio, nature & agricultural (146 | 13.3%), business (145 | 13.2%), arts & humanities (111 | 10.1%), and visual & performing arts (97 | 8.8%) are the most common fields of study among 1,100 individuals in Burnet who have obtained a bachelor's degree or higher.
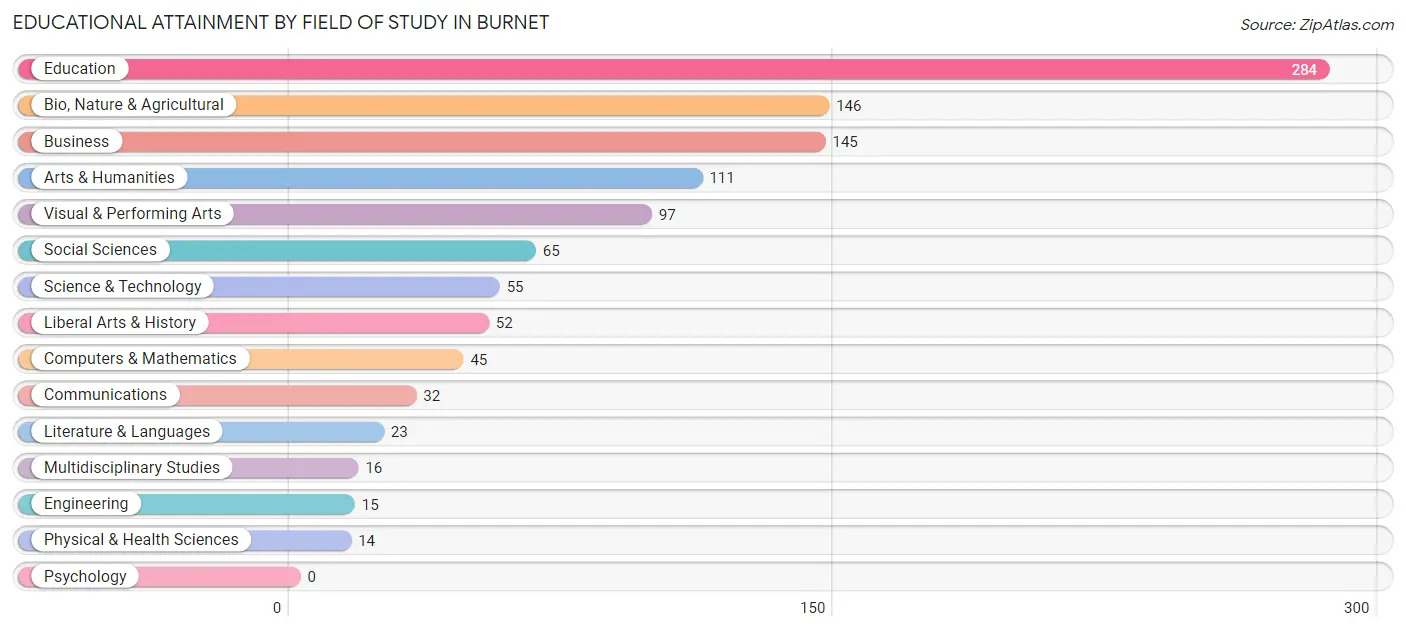
| Field of Study | # Graduates | % Graduates |
| Computers & Mathematics | 45 | 4.1% |
| Bio, Nature & Agricultural | 146 | 13.3% |
| Physical & Health Sciences | 14 | 1.3% |
| Psychology | 0 | 0.0% |
| Social Sciences | 65 | 5.9% |
| Engineering | 15 | 1.4% |
| Multidisciplinary Studies | 16 | 1.5% |
| Science & Technology | 55 | 5.0% |
| Business | 145 | 13.2% |
| Education | 284 | 25.8% |
| Literature & Languages | 23 | 2.1% |
| Liberal Arts & History | 52 | 4.7% |
| Visual & Performing Arts | 97 | 8.8% |
| Communications | 32 | 2.9% |
| Arts & Humanities | 111 | 10.1% |
| Total | 1,100 | 100.0% |
Transportation & Commute in Burnet
Vehicle Availability by Sex in Burnet
The most prevalent vehicle ownership categories in Burnet are males with 2 vehicles (1,016, accounting for 70.6%) and females with 2 vehicles (727, making up 66.8%).
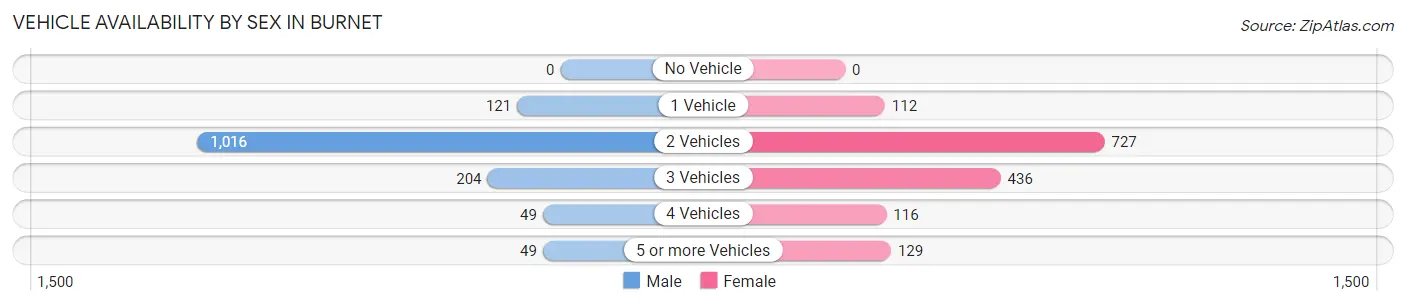
| Vehicles Available | Male | Female |
| No Vehicle | 0 (0.0%) | 0 (0.0%) |
| 1 Vehicle | 121 (8.4%) | 112 (7.4%) |
| 2 Vehicles | 1,016 (70.6%) | 727 (47.8%) |
| 3 Vehicles | 204 (14.2%) | 436 (28.7%) |
| 4 Vehicles | 49 (3.4%) | 116 (7.6%) |
| 5 or more Vehicles | 49 (3.4%) | 129 (8.5%) |
| Total | 1,439 (100.0%) | 1,520 (100.0%) |
Commute Time in Burnet
The most frequently occuring commute durations in Burnet are less than 5 minutes (676 commuters, 24.4%), 10 to 14 minutes (372 commuters, 13.5%), and 5 to 9 minutes (327 commuters, 11.8%).
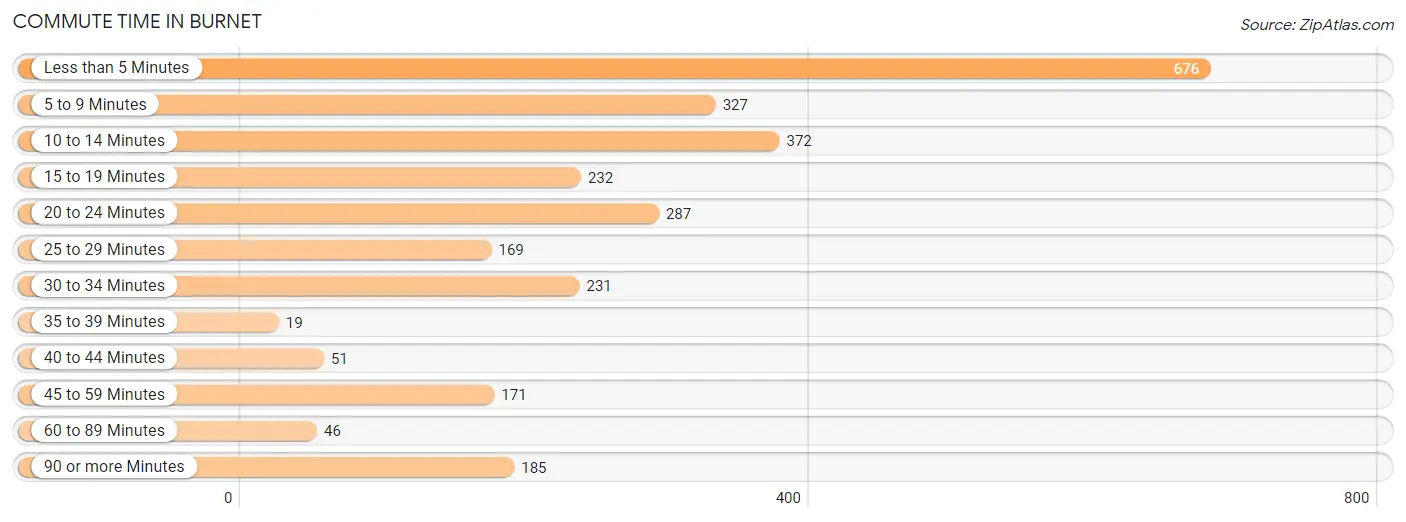
| Commute Time | # Commuters | % Commuters |
| Less than 5 Minutes | 676 | 24.4% |
| 5 to 9 Minutes | 327 | 11.8% |
| 10 to 14 Minutes | 372 | 13.5% |
| 15 to 19 Minutes | 232 | 8.4% |
| 20 to 24 Minutes | 287 | 10.4% |
| 25 to 29 Minutes | 169 | 6.1% |
| 30 to 34 Minutes | 231 | 8.4% |
| 35 to 39 Minutes | 19 | 0.7% |
| 40 to 44 Minutes | 51 | 1.8% |
| 45 to 59 Minutes | 171 | 6.2% |
| 60 to 89 Minutes | 46 | 1.7% |
| 90 or more Minutes | 185 | 6.7% |
Commute Time by Sex in Burnet
The most common commute times in Burnet are 20 to 24 minutes (209 commuters, 15.6%) for males and less than 5 minutes (613 commuters, 43.0%) for females.
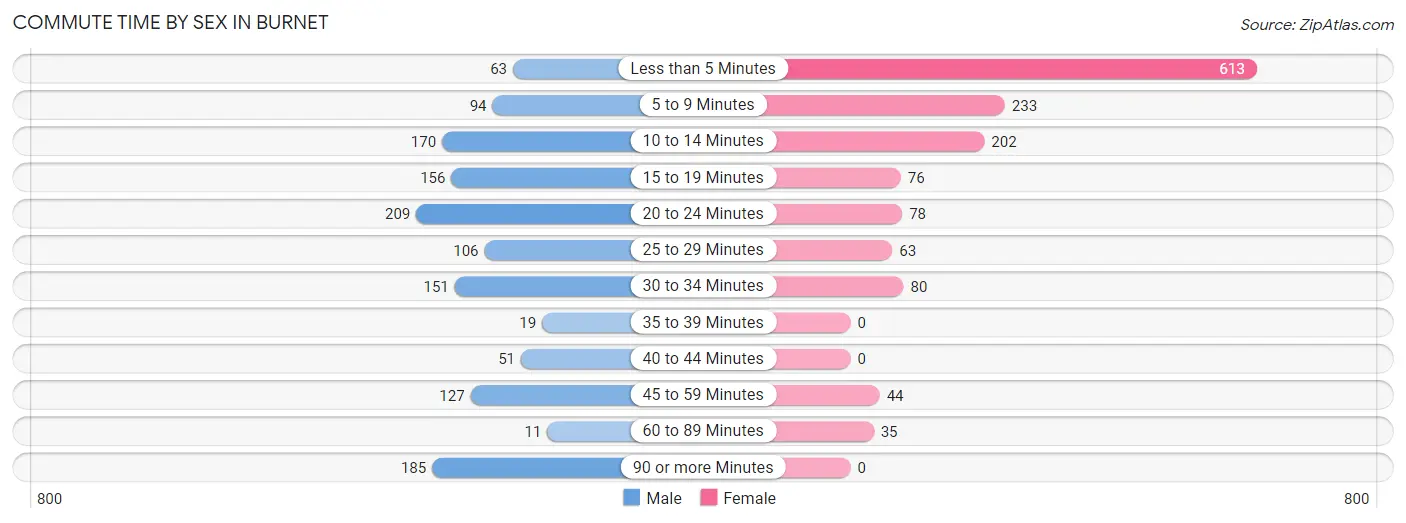
| Commute Time | Male | Female |
| Less than 5 Minutes | 63 (4.7%) | 613 (43.0%) |
| 5 to 9 Minutes | 94 (7.0%) | 233 (16.4%) |
| 10 to 14 Minutes | 170 (12.7%) | 202 (14.2%) |
| 15 to 19 Minutes | 156 (11.6%) | 76 (5.3%) |
| 20 to 24 Minutes | 209 (15.6%) | 78 (5.5%) |
| 25 to 29 Minutes | 106 (7.9%) | 63 (4.4%) |
| 30 to 34 Minutes | 151 (11.3%) | 80 (5.6%) |
| 35 to 39 Minutes | 19 (1.4%) | 0 (0.0%) |
| 40 to 44 Minutes | 51 (3.8%) | 0 (0.0%) |
| 45 to 59 Minutes | 127 (9.5%) | 44 (3.1%) |
| 60 to 89 Minutes | 11 (0.8%) | 35 (2.5%) |
| 90 or more Minutes | 185 (13.8%) | 0 (0.0%) |
Time of Departure to Work by Sex in Burnet
The most frequent times of departure to work in Burnet are 7:00 AM to 7:29 AM (357, 26.6%) for males and 7:30 AM to 7:59 AM (236, 16.6%) for females.
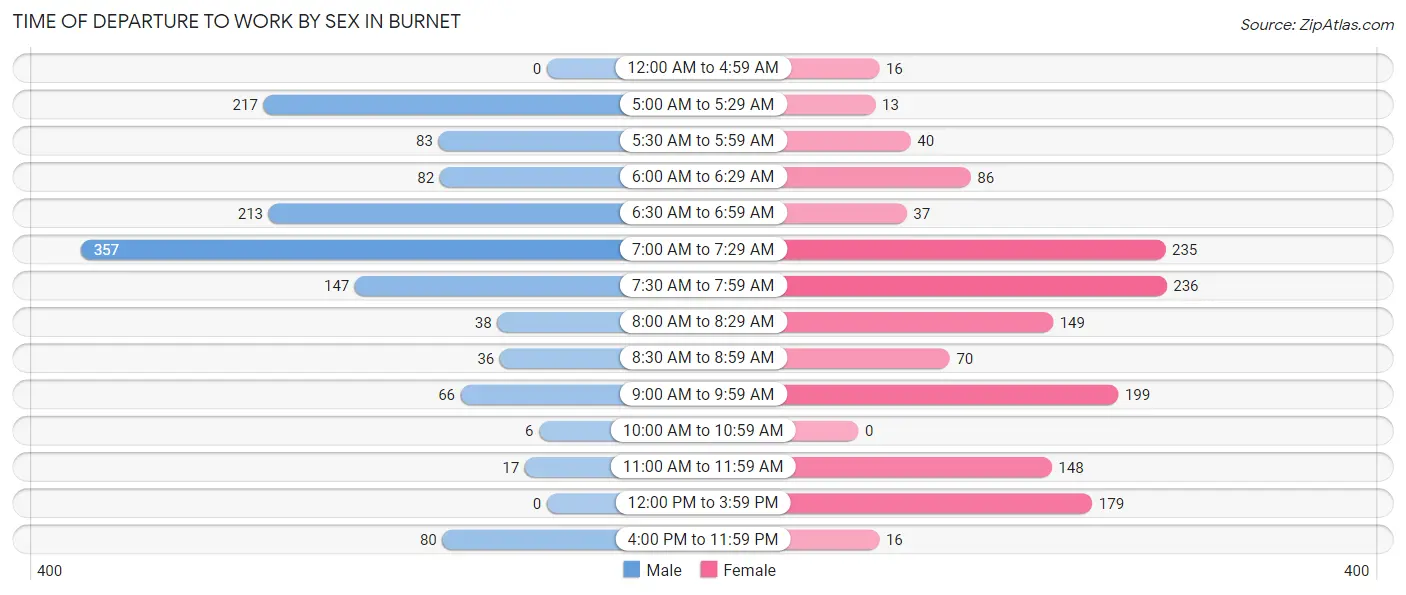
| Time of Departure | Male | Female |
| 12:00 AM to 4:59 AM | 0 (0.0%) | 16 (1.1%) |
| 5:00 AM to 5:29 AM | 217 (16.2%) | 13 (0.9%) |
| 5:30 AM to 5:59 AM | 83 (6.2%) | 40 (2.8%) |
| 6:00 AM to 6:29 AM | 82 (6.1%) | 86 (6.0%) |
| 6:30 AM to 6:59 AM | 213 (15.9%) | 37 (2.6%) |
| 7:00 AM to 7:29 AM | 357 (26.6%) | 235 (16.5%) |
| 7:30 AM to 7:59 AM | 147 (11.0%) | 236 (16.6%) |
| 8:00 AM to 8:29 AM | 38 (2.8%) | 149 (10.5%) |
| 8:30 AM to 8:59 AM | 36 (2.7%) | 70 (4.9%) |
| 9:00 AM to 9:59 AM | 66 (4.9%) | 199 (14.0%) |
| 10:00 AM to 10:59 AM | 6 (0.4%) | 0 (0.0%) |
| 11:00 AM to 11:59 AM | 17 (1.3%) | 148 (10.4%) |
| 12:00 PM to 3:59 PM | 0 (0.0%) | 179 (12.6%) |
| 4:00 PM to 11:59 PM | 80 (6.0%) | 16 (1.1%) |
| Total | 1,342 (100.0%) | 1,424 (100.0%) |
Housing Occupancy in Burnet
Occupancy by Ownership in Burnet
Of the total 2,243 dwellings in Burnet, owner-occupied units account for 1,761 (78.5%), while renter-occupied units make up 482 (21.5%).
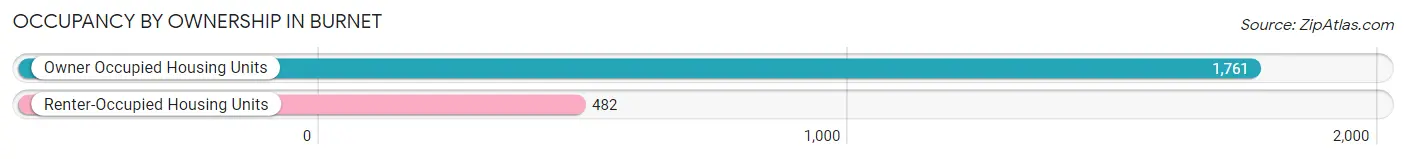
| Occupancy | # Housing Units | % Housing Units |
| Owner Occupied Housing Units | 1,761 | 78.5% |
| Renter-Occupied Housing Units | 482 | 21.5% |
| Total Occupied Housing Units | 2,243 | 100.0% |
Occupancy by Household Size in Burnet
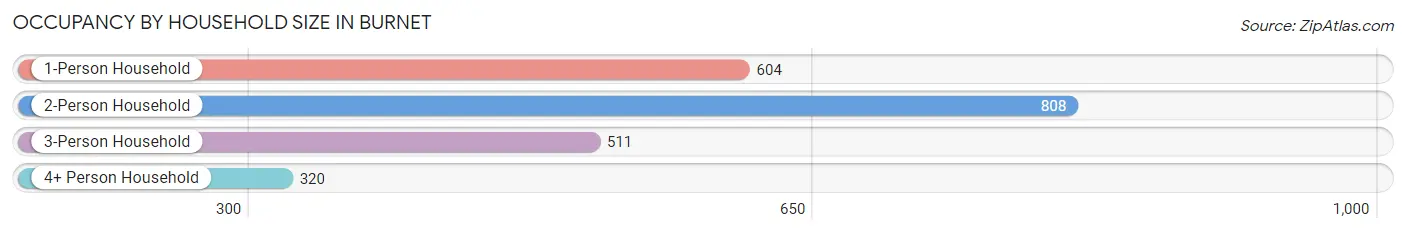
| Household Size | # Housing Units | % Housing Units |
| 1-Person Household | 604 | 26.9% |
| 2-Person Household | 808 | 36.0% |
| 3-Person Household | 511 | 22.8% |
| 4+ Person Household | 320 | 14.3% |
| Total Housing Units | 2,243 | 100.0% |
Occupancy by Ownership by Household Size in Burnet
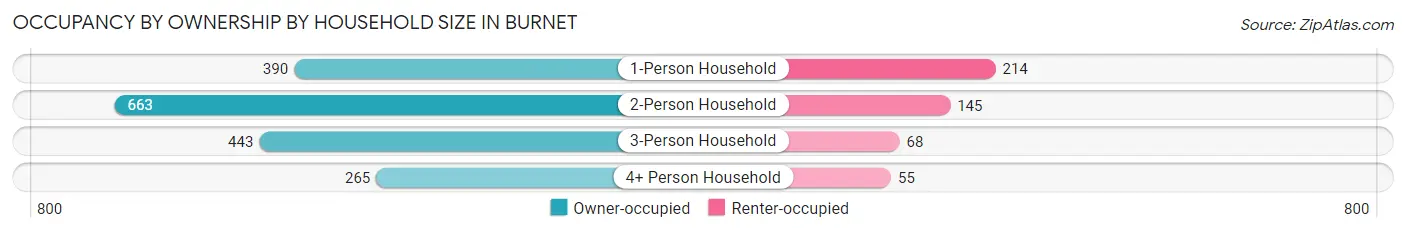
| Household Size | Owner-occupied | Renter-occupied |
| 1-Person Household | 390 (64.6%) | 214 (35.4%) |
| 2-Person Household | 663 (82.1%) | 145 (17.9%) |
| 3-Person Household | 443 (86.7%) | 68 (13.3%) |
| 4+ Person Household | 265 (82.8%) | 55 (17.2%) |
| Total Housing Units | 1,761 (78.5%) | 482 (21.5%) |
Occupancy by Educational Attainment in Burnet
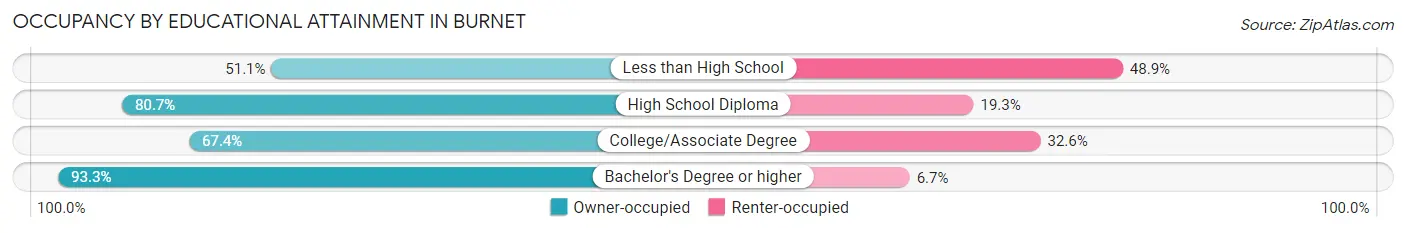
| Household Size | Owner-occupied | Renter-occupied |
| Less than High School | 95 (51.1%) | 91 (48.9%) |
| High School Diploma | 514 (80.7%) | 123 (19.3%) |
| College/Associate Degree | 451 (67.4%) | 218 (32.6%) |
| Bachelor's Degree or higher | 701 (93.3%) | 50 (6.7%) |
Occupancy by Age of Householder in Burnet
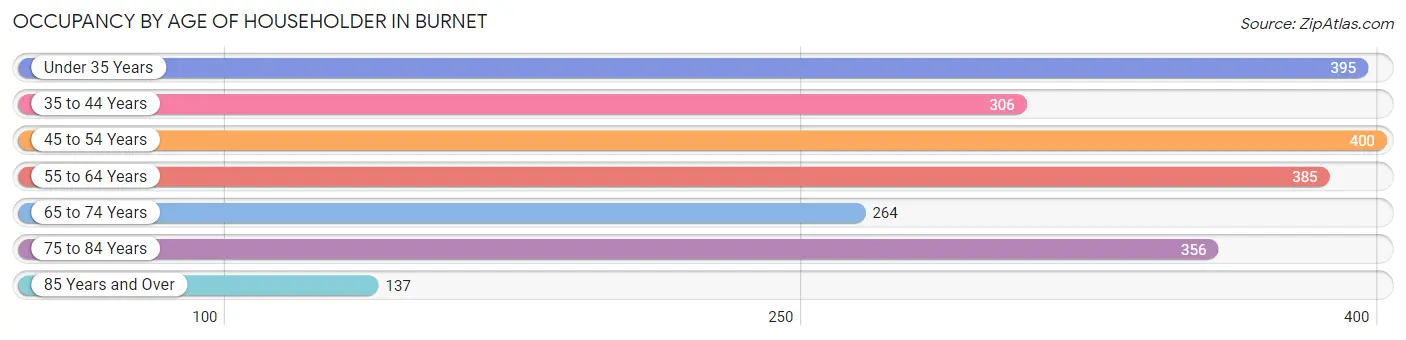
| Age Bracket | # Households | % Households |
| Under 35 Years | 395 | 17.6% |
| 35 to 44 Years | 306 | 13.6% |
| 45 to 54 Years | 400 | 17.8% |
| 55 to 64 Years | 385 | 17.2% |
| 65 to 74 Years | 264 | 11.8% |
| 75 to 84 Years | 356 | 15.9% |
| 85 Years and Over | 137 | 6.1% |
| Total | 2,243 | 100.0% |
Housing Finances in Burnet
Median Income by Occupancy in Burnet
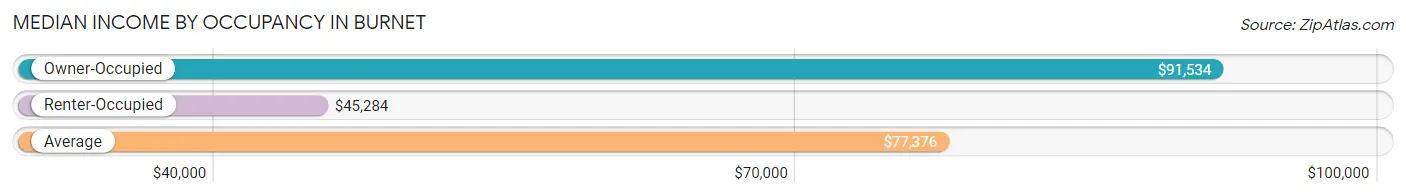
| Occupancy Type | # Households | Median Income |
| Owner-Occupied | 1,761 (78.5%) | $91,534 |
| Renter-Occupied | 482 (21.5%) | $45,284 |
| Average | 2,243 (100.0%) | $77,376 |
Occupancy by Householder Income Bracket in Burnet
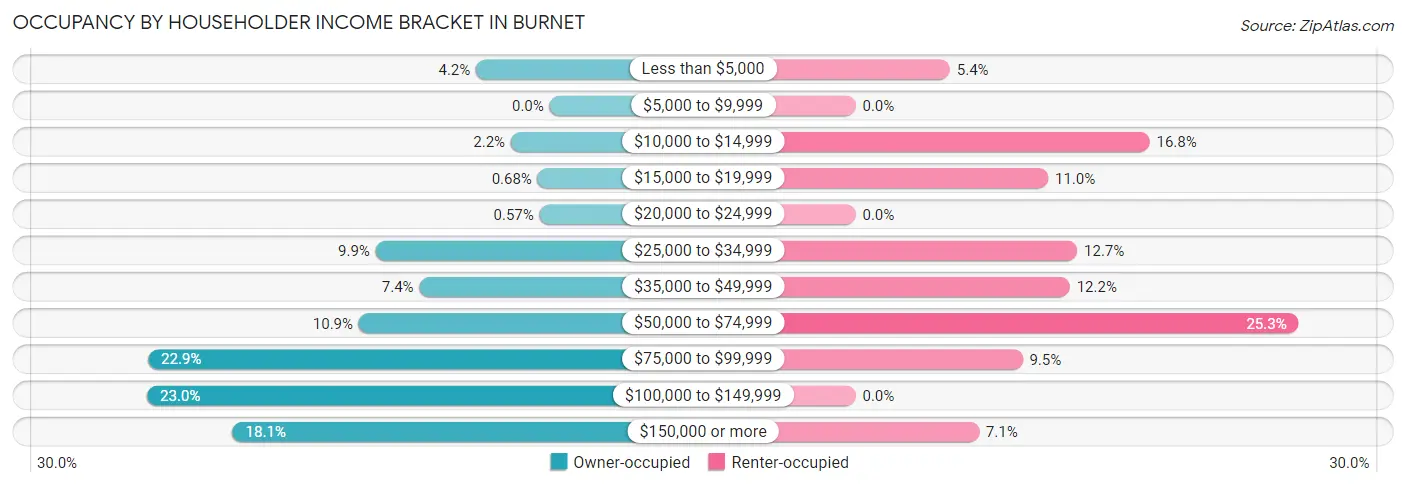
| Income Bracket | Owner-occupied | Renter-occupied |
| Less than $5,000 | 74 (4.2%) | 26 (5.4%) |
| $5,000 to $9,999 | 0 (0.0%) | 0 (0.0%) |
| $10,000 to $14,999 | 39 (2.2%) | 81 (16.8%) |
| $15,000 to $19,999 | 12 (0.7%) | 53 (11.0%) |
| $20,000 to $24,999 | 10 (0.6%) | 0 (0.0%) |
| $25,000 to $34,999 | 175 (9.9%) | 61 (12.7%) |
| $35,000 to $49,999 | 131 (7.4%) | 59 (12.2%) |
| $50,000 to $74,999 | 192 (10.9%) | 122 (25.3%) |
| $75,000 to $99,999 | 404 (22.9%) | 46 (9.5%) |
| $100,000 to $149,999 | 405 (23.0%) | 0 (0.0%) |
| $150,000 or more | 319 (18.1%) | 34 (7.0%) |
| Total | 1,761 (100.0%) | 482 (100.0%) |
Monthly Housing Cost Tiers in Burnet
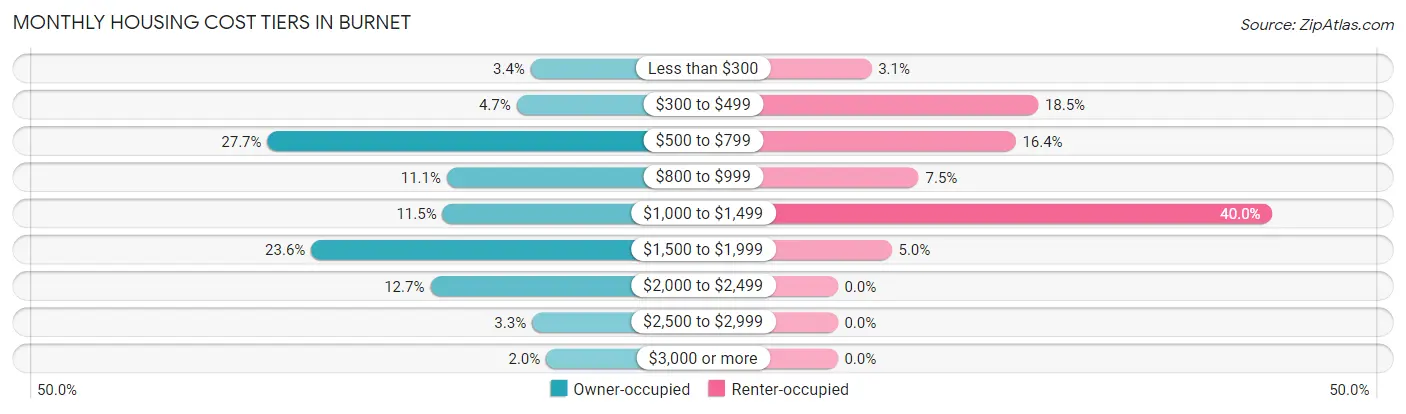
| Monthly Cost | Owner-occupied | Renter-occupied |
| Less than $300 | 60 (3.4%) | 15 (3.1%) |
| $300 to $499 | 83 (4.7%) | 89 (18.5%) |
| $500 to $799 | 487 (27.7%) | 79 (16.4%) |
| $800 to $999 | 196 (11.1%) | 36 (7.5%) |
| $1,000 to $1,499 | 203 (11.5%) | 193 (40.0%) |
| $1,500 to $1,999 | 416 (23.6%) | 24 (5.0%) |
| $2,000 to $2,499 | 223 (12.7%) | 0 (0.0%) |
| $2,500 to $2,999 | 58 (3.3%) | 0 (0.0%) |
| $3,000 or more | 35 (2.0%) | 0 (0.0%) |
| Total | 1,761 (100.0%) | 482 (100.0%) |
Physical Housing Characteristics in Burnet
Housing Structures in Burnet
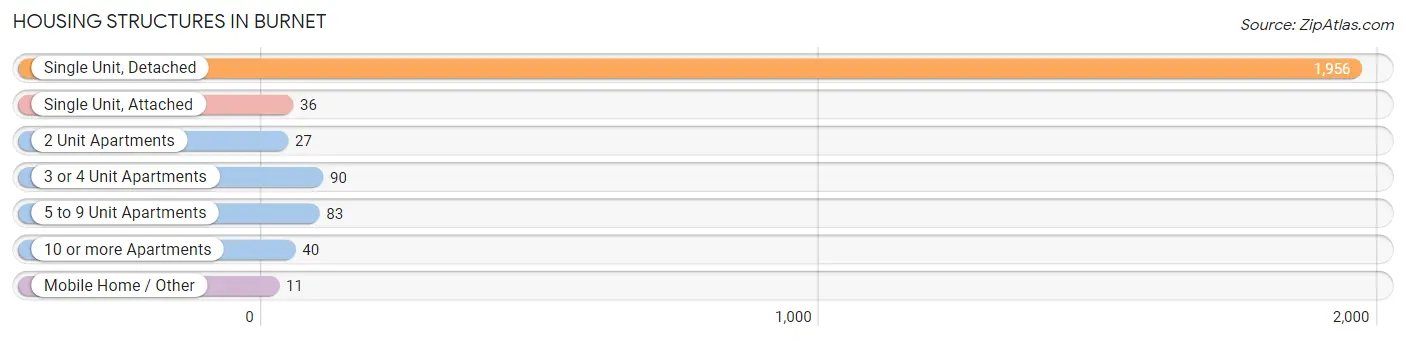
| Structure Type | # Housing Units | % Housing Units |
| Single Unit, Detached | 1,956 | 87.2% |
| Single Unit, Attached | 36 | 1.6% |
| 2 Unit Apartments | 27 | 1.2% |
| 3 or 4 Unit Apartments | 90 | 4.0% |
| 5 to 9 Unit Apartments | 83 | 3.7% |
| 10 or more Apartments | 40 | 1.8% |
| Mobile Home / Other | 11 | 0.5% |
| Total | 2,243 | 100.0% |
Housing Structures by Occupancy in Burnet
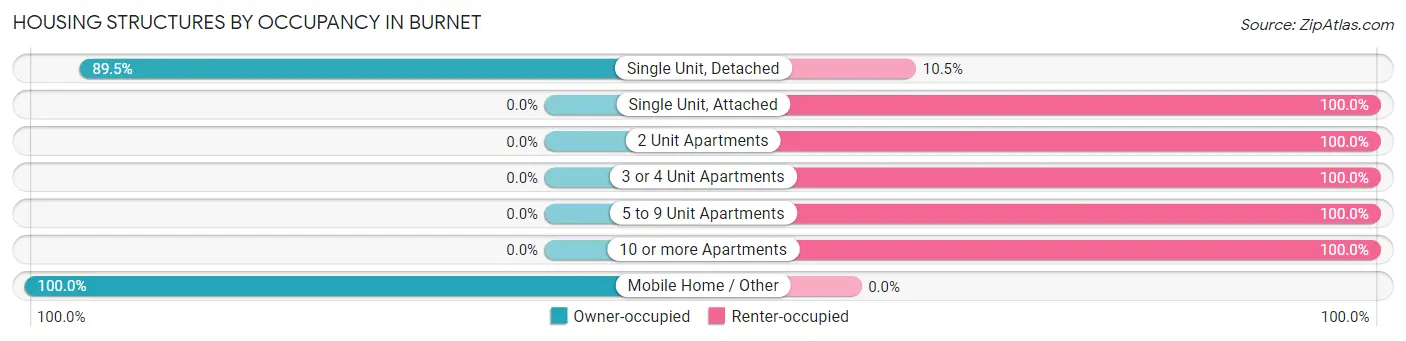
| Structure Type | Owner-occupied | Renter-occupied |
| Single Unit, Detached | 1,750 (89.5%) | 206 (10.5%) |
| Single Unit, Attached | 0 (0.0%) | 36 (100.0%) |
| 2 Unit Apartments | 0 (0.0%) | 27 (100.0%) |
| 3 or 4 Unit Apartments | 0 (0.0%) | 90 (100.0%) |
| 5 to 9 Unit Apartments | 0 (0.0%) | 83 (100.0%) |
| 10 or more Apartments | 0 (0.0%) | 40 (100.0%) |
| Mobile Home / Other | 11 (100.0%) | 0 (0.0%) |
| Total | 1,761 (78.5%) | 482 (21.5%) |
Housing Structures by Number of Rooms in Burnet
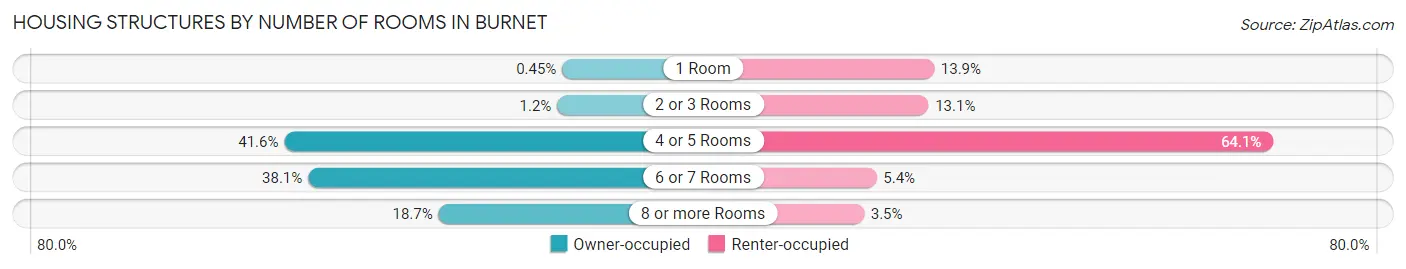
| Number of Rooms | Owner-occupied | Renter-occupied |
| 1 Room | 8 (0.4%) | 67 (13.9%) |
| 2 or 3 Rooms | 21 (1.2%) | 63 (13.1%) |
| 4 or 5 Rooms | 732 (41.6%) | 309 (64.1%) |
| 6 or 7 Rooms | 670 (38.1%) | 26 (5.4%) |
| 8 or more Rooms | 330 (18.7%) | 17 (3.5%) |
| Total | 1,761 (100.0%) | 482 (100.0%) |
Housing Structure by Heating Type in Burnet
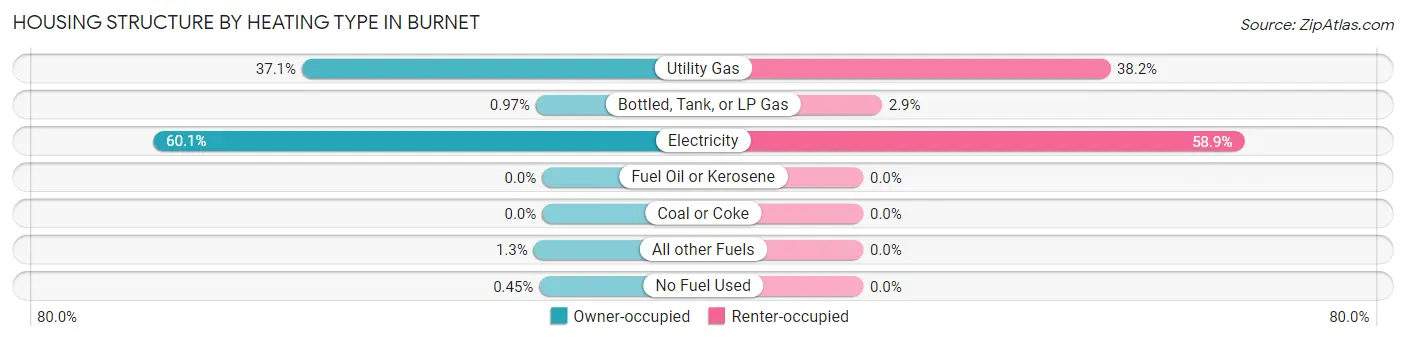
| Heating Type | Owner-occupied | Renter-occupied |
| Utility Gas | 654 (37.1%) | 184 (38.2%) |
| Bottled, Tank, or LP Gas | 17 (1.0%) | 14 (2.9%) |
| Electricity | 1,059 (60.1%) | 284 (58.9%) |
| Fuel Oil or Kerosene | 0 (0.0%) | 0 (0.0%) |
| Coal or Coke | 0 (0.0%) | 0 (0.0%) |
| All other Fuels | 23 (1.3%) | 0 (0.0%) |
| No Fuel Used | 8 (0.4%) | 0 (0.0%) |
| Total | 1,761 (100.0%) | 482 (100.0%) |
Household Vehicle Usage in Burnet
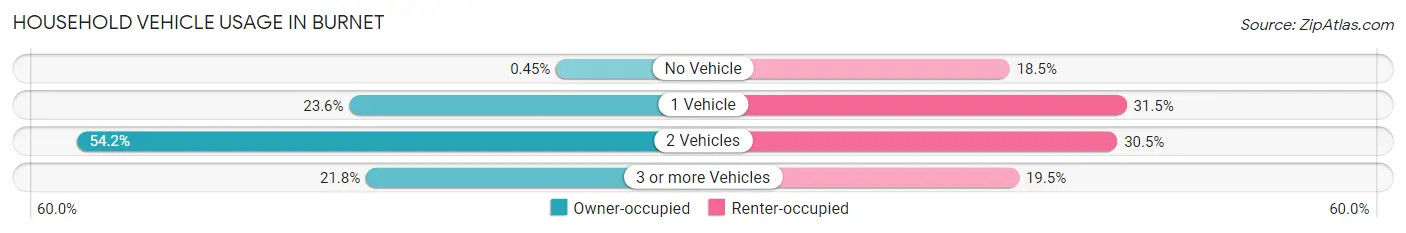
| Vehicles per Household | Owner-occupied | Renter-occupied |
| No Vehicle | 8 (0.4%) | 89 (18.5%) |
| 1 Vehicle | 416 (23.6%) | 152 (31.5%) |
| 2 Vehicles | 954 (54.2%) | 147 (30.5%) |
| 3 or more Vehicles | 383 (21.7%) | 94 (19.5%) |
| Total | 1,761 (100.0%) | 482 (100.0%) |
Real Estate & Mortgages in Burnet
Real Estate and Mortgage Overview in Burnet
| Characteristic | Without Mortgage | With Mortgage |
| Housing Units | 878 | 883 |
| Median Property Value | $239,200 | $238,300 |
| Median Household Income | $82,083 | $224 |
| Monthly Housing Costs | $689 | $15 |
| Real Estate Taxes | $3,151 | $34 |
Property Value by Mortgage Status in Burnet
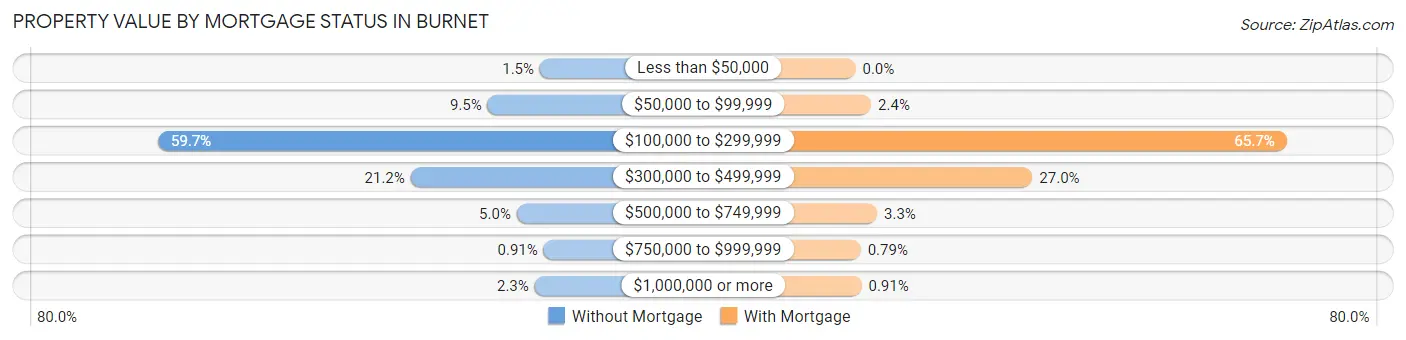
| Property Value | Without Mortgage | With Mortgage |
| Less than $50,000 | 13 (1.5%) | 0 (0.0%) |
| $50,000 to $99,999 | 83 (9.5%) | 21 (2.4%) |
| $100,000 to $299,999 | 524 (59.7%) | 580 (65.7%) |
| $300,000 to $499,999 | 186 (21.2%) | 238 (27.0%) |
| $500,000 to $749,999 | 44 (5.0%) | 29 (3.3%) |
| $750,000 to $999,999 | 8 (0.9%) | 7 (0.8%) |
| $1,000,000 or more | 20 (2.3%) | 8 (0.9%) |
| Total | 878 (100.0%) | 883 (100.0%) |
Household Income by Mortgage Status in Burnet
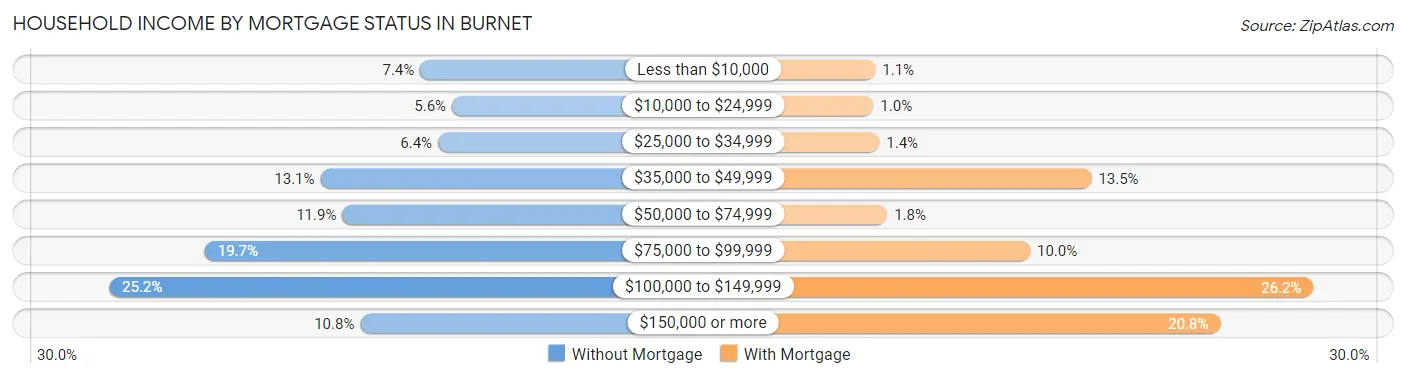
| Household Income | Without Mortgage | With Mortgage |
| Less than $10,000 | 65 (7.4%) | 10 (1.1%) |
| $10,000 to $24,999 | 49 (5.6%) | 9 (1.0%) |
| $25,000 to $34,999 | 56 (6.4%) | 12 (1.4%) |
| $35,000 to $49,999 | 115 (13.1%) | 119 (13.5%) |
| $50,000 to $74,999 | 104 (11.8%) | 16 (1.8%) |
| $75,000 to $99,999 | 173 (19.7%) | 88 (10.0%) |
| $100,000 to $149,999 | 221 (25.2%) | 231 (26.2%) |
| $150,000 or more | 95 (10.8%) | 184 (20.8%) |
| Total | 878 (100.0%) | 883 (100.0%) |
Property Value to Household Income Ratio in Burnet
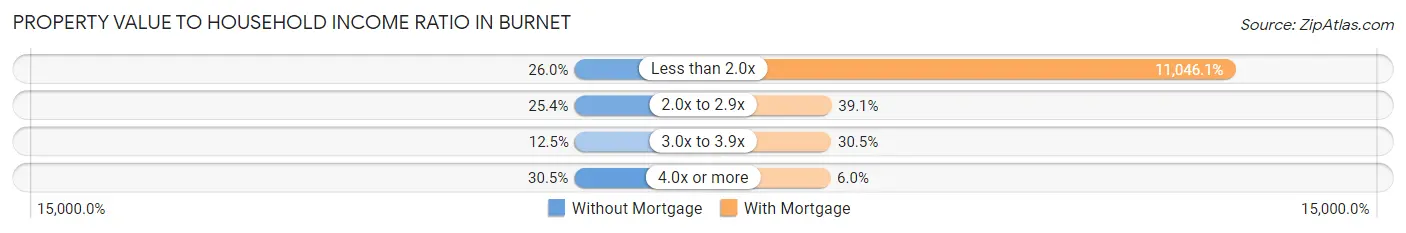
| Value-to-Income Ratio | Without Mortgage | With Mortgage |
| Less than 2.0x | 228 (26.0%) | 97,537 (11,046.1%) |
| 2.0x to 2.9x | 223 (25.4%) | 345 (39.1%) |
| 3.0x to 3.9x | 110 (12.5%) | 269 (30.5%) |
| 4.0x or more | 268 (30.5%) | 53 (6.0%) |
| Total | 878 (100.0%) | 883 (100.0%) |
Real Estate Taxes by Mortgage Status in Burnet
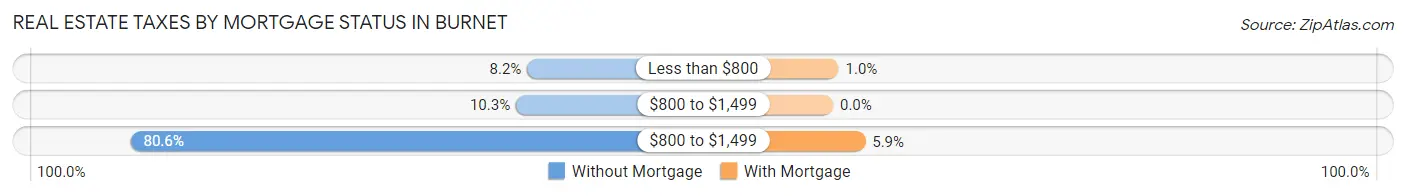
| Property Taxes | Without Mortgage | With Mortgage |
| Less than $800 | 72 (8.2%) | 9 (1.0%) |
| $800 to $1,499 | 90 (10.2%) | 0 (0.0%) |
| $800 to $1,499 | 708 (80.6%) | 52 (5.9%) |
| Total | 878 (100.0%) | 883 (100.0%) |
Health & Disability in Burnet
Health Insurance Coverage by Age in Burnet
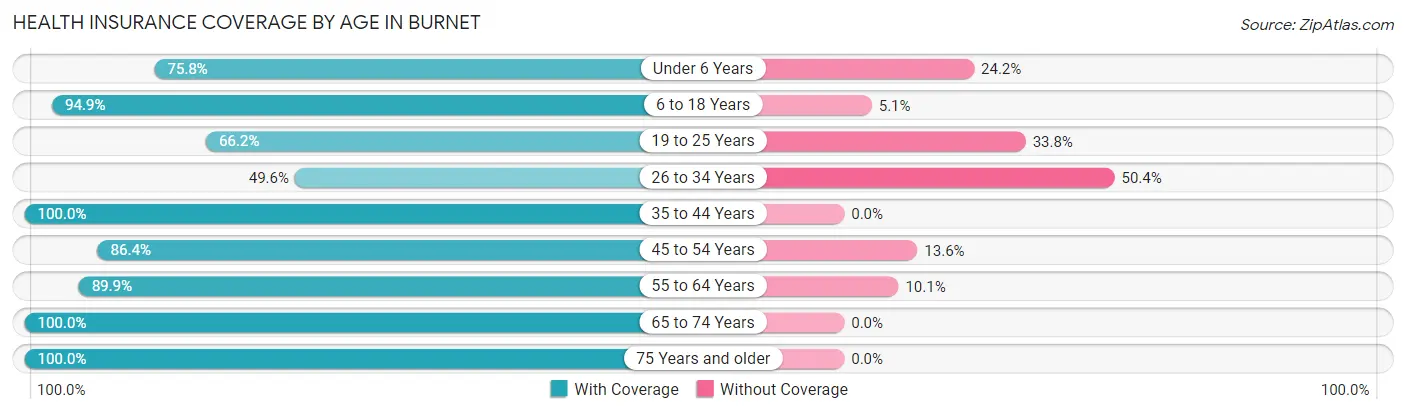
| Age Bracket | With Coverage | Without Coverage |
| Under 6 Years | 313 (75.8%) | 100 (24.2%) |
| 6 to 18 Years | 814 (94.9%) | 44 (5.1%) |
| 19 to 25 Years | 399 (66.2%) | 204 (33.8%) |
| 26 to 34 Years | 385 (49.6%) | 391 (50.4%) |
| 35 to 44 Years | 483 (100.0%) | 0 (0.0%) |
| 45 to 54 Years | 545 (86.4%) | 86 (13.6%) |
| 55 to 64 Years | 757 (89.9%) | 85 (10.1%) |
| 65 to 74 Years | 514 (100.0%) | 0 (0.0%) |
| 75 Years and older | 703 (100.0%) | 0 (0.0%) |
| Total | 4,913 (84.4%) | 910 (15.6%) |
Health Insurance Coverage by Citizenship Status in Burnet
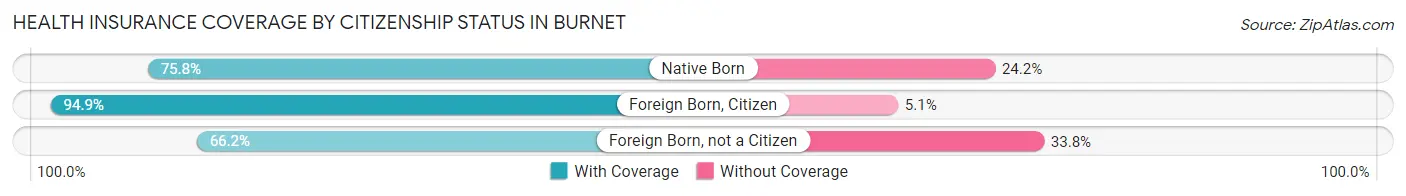
| Citizenship Status | With Coverage | Without Coverage |
| Native Born | 313 (75.8%) | 100 (24.2%) |
| Foreign Born, Citizen | 814 (94.9%) | 44 (5.1%) |
| Foreign Born, not a Citizen | 399 (66.2%) | 204 (33.8%) |
Health Insurance Coverage by Household Income in Burnet
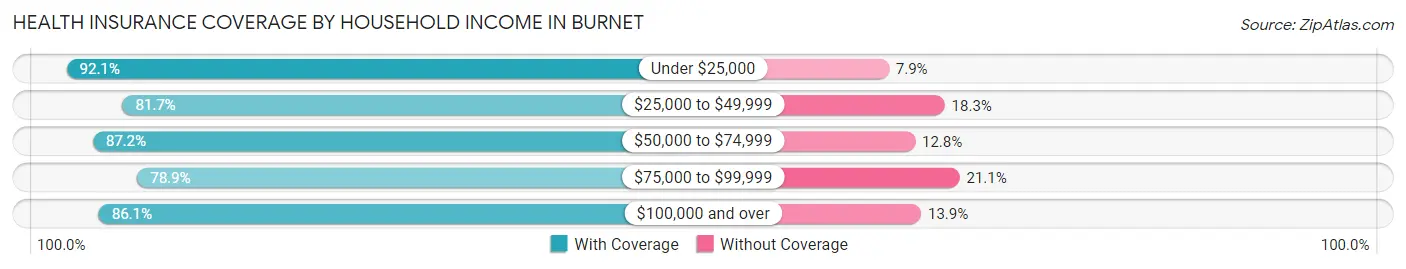
| Household Income | With Coverage | Without Coverage |
| Under $25,000 | 386 (92.1%) | 33 (7.9%) |
| $25,000 to $49,999 | 650 (81.7%) | 146 (18.3%) |
| $50,000 to $74,999 | 580 (87.2%) | 85 (12.8%) |
| $75,000 to $99,999 | 1,083 (78.9%) | 290 (21.1%) |
| $100,000 and over | 2,204 (86.1%) | 356 (13.9%) |
Public vs Private Health Insurance Coverage by Age in Burnet
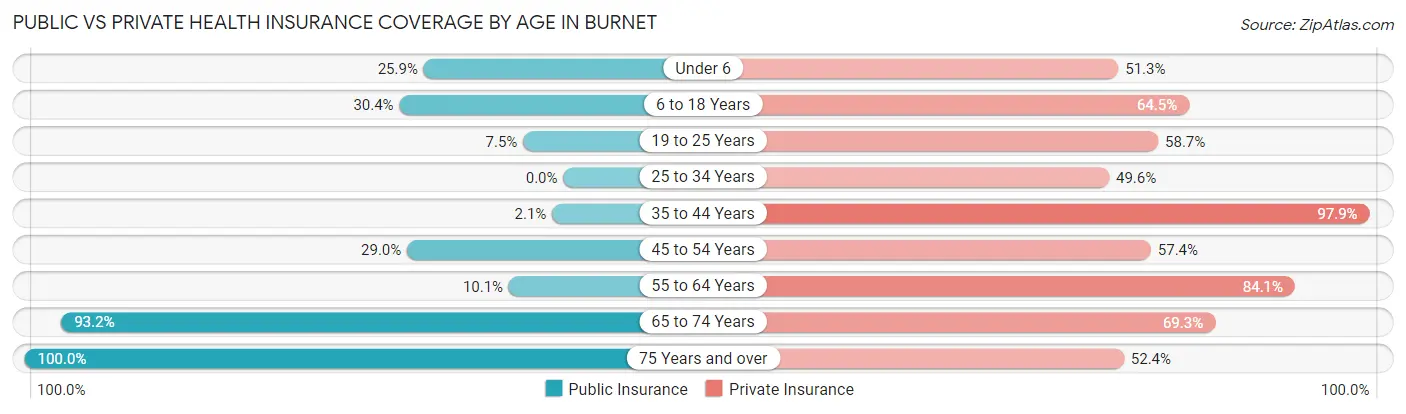
| Age Bracket | Public Insurance | Private Insurance |
| Under 6 | 107 (25.9%) | 212 (51.3%) |
| 6 to 18 Years | 261 (30.4%) | 553 (64.4%) |
| 19 to 25 Years | 45 (7.5%) | 354 (58.7%) |
| 25 to 34 Years | 0 (0.0%) | 385 (49.6%) |
| 35 to 44 Years | 10 (2.1%) | 473 (97.9%) |
| 45 to 54 Years | 183 (29.0%) | 362 (57.4%) |
| 55 to 64 Years | 85 (10.1%) | 708 (84.1%) |
| 65 to 74 Years | 479 (93.2%) | 356 (69.3%) |
| 75 Years and over | 703 (100.0%) | 368 (52.3%) |
| Total | 1,873 (32.2%) | 3,771 (64.8%) |
Disability Status by Sex by Age in Burnet
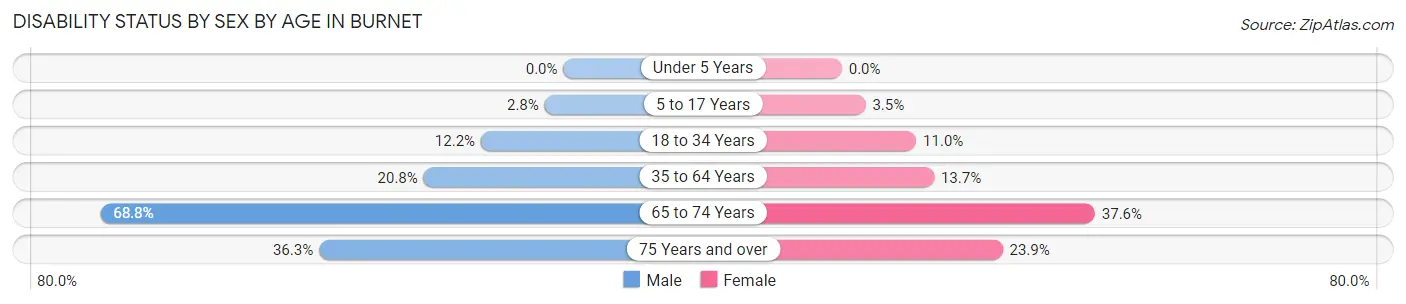
| Age Bracket | Male | Female |
| Under 5 Years | 0 (0.0%) | 0 (0.0%) |
| 5 to 17 Years | 10 (2.8%) | 16 (3.5%) |
| 18 to 34 Years | 87 (12.2%) | 86 (11.0%) |
| 35 to 64 Years | 221 (20.7%) | 122 (13.7%) |
| 65 to 74 Years | 132 (68.8%) | 121 (37.6%) |
| 75 Years and over | 94 (36.3%) | 106 (23.9%) |
Disability Class by Sex by Age in Burnet
Disability Class: Hearing Difficulty
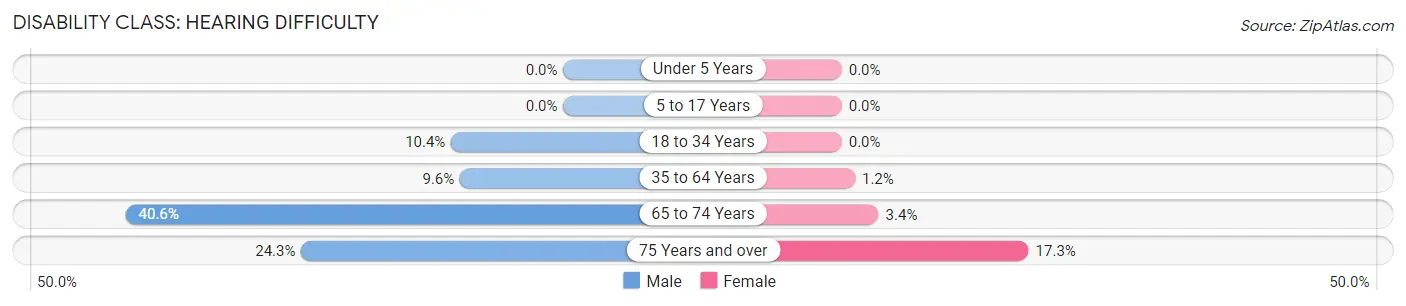
| Age Bracket | Male | Female |
| Under 5 Years | 0 (0.0%) | 0 (0.0%) |
| 5 to 17 Years | 0 (0.0%) | 0 (0.0%) |
| 18 to 34 Years | 74 (10.4%) | 0 (0.0%) |
| 35 to 64 Years | 102 (9.6%) | 11 (1.2%) |
| 65 to 74 Years | 78 (40.6%) | 11 (3.4%) |
| 75 Years and over | 63 (24.3%) | 77 (17.3%) |
Disability Class: Vision Difficulty
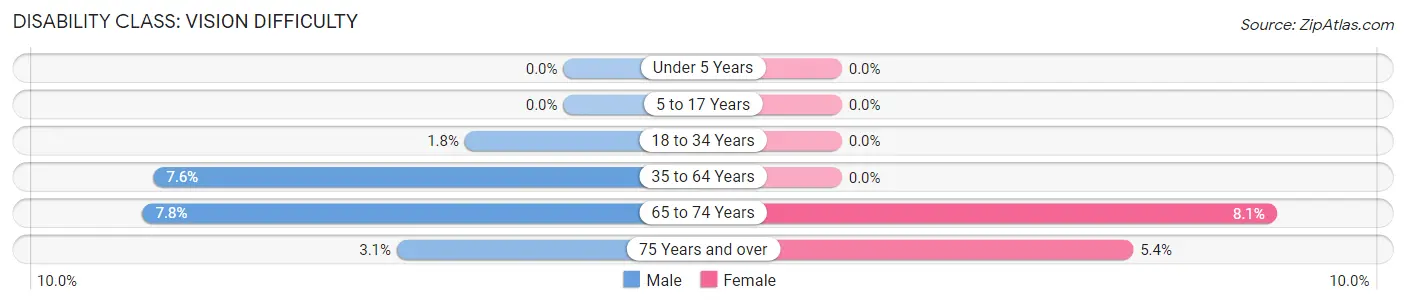
| Age Bracket | Male | Female |
| Under 5 Years | 0 (0.0%) | 0 (0.0%) |
| 5 to 17 Years | 0 (0.0%) | 0 (0.0%) |
| 18 to 34 Years | 13 (1.8%) | 0 (0.0%) |
| 35 to 64 Years | 81 (7.6%) | 0 (0.0%) |
| 65 to 74 Years | 15 (7.8%) | 26 (8.1%) |
| 75 Years and over | 8 (3.1%) | 24 (5.4%) |
Disability Class: Cognitive Difficulty
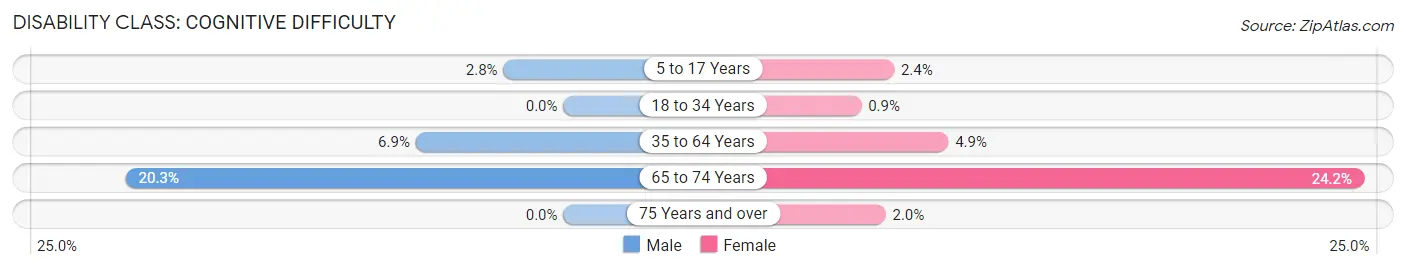
| Age Bracket | Male | Female |
| 5 to 17 Years | 10 (2.8%) | 11 (2.4%) |
| 18 to 34 Years | 0 (0.0%) | 7 (0.9%) |
| 35 to 64 Years | 73 (6.9%) | 44 (4.9%) |
| 65 to 74 Years | 39 (20.3%) | 78 (24.2%) |
| 75 Years and over | 0 (0.0%) | 9 (2.0%) |
Disability Class: Ambulatory Difficulty
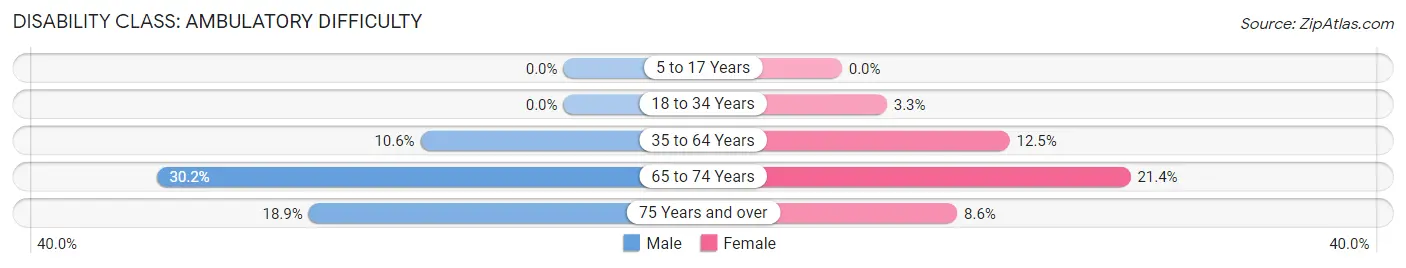
| Age Bracket | Male | Female |
| 5 to 17 Years | 0 (0.0%) | 0 (0.0%) |
| 18 to 34 Years | 0 (0.0%) | 26 (3.3%) |
| 35 to 64 Years | 113 (10.6%) | 111 (12.5%) |
| 65 to 74 Years | 58 (30.2%) | 69 (21.4%) |
| 75 Years and over | 49 (18.9%) | 38 (8.6%) |
Disability Class: Self-Care Difficulty
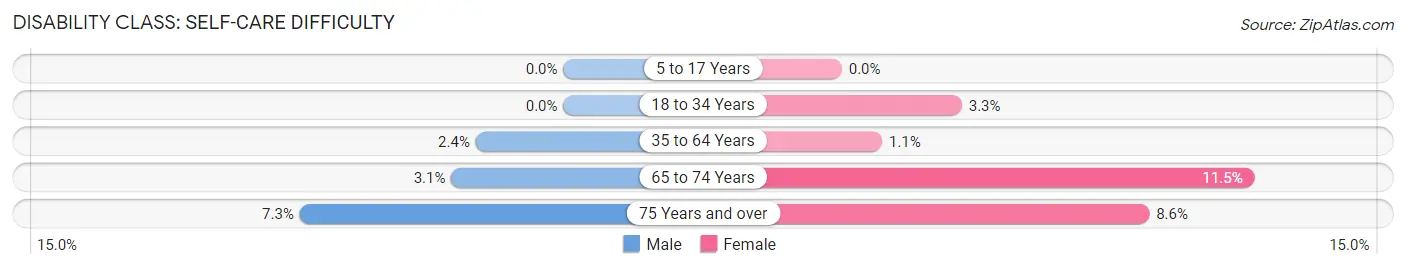
| Age Bracket | Male | Female |
| 5 to 17 Years | 0 (0.0%) | 0 (0.0%) |
| 18 to 34 Years | 0 (0.0%) | 26 (3.3%) |
| 35 to 64 Years | 26 (2.4%) | 10 (1.1%) |
| 65 to 74 Years | 6 (3.1%) | 37 (11.5%) |
| 75 Years and over | 19 (7.3%) | 38 (8.6%) |
Technology Access in Burnet
Computing Device Access in Burnet
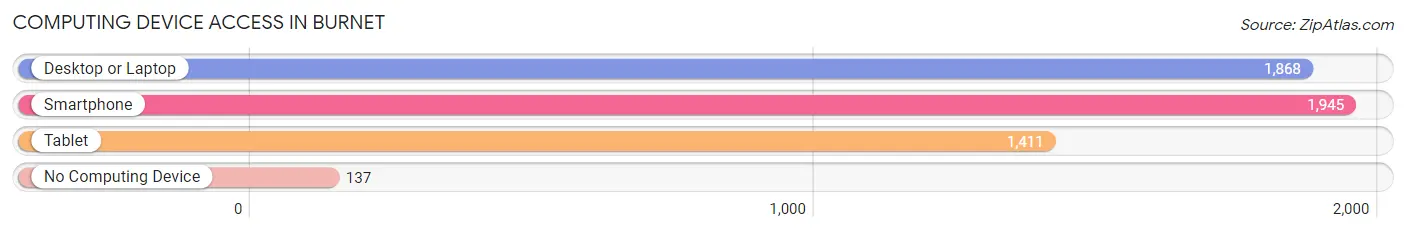
| Device Type | # Households | % Households |
| Desktop or Laptop | 1,868 | 83.3% |
| Smartphone | 1,945 | 86.7% |
| Tablet | 1,411 | 62.9% |
| No Computing Device | 137 | 6.1% |
| Total | 2,243 | 100.0% |
Internet Access in Burnet
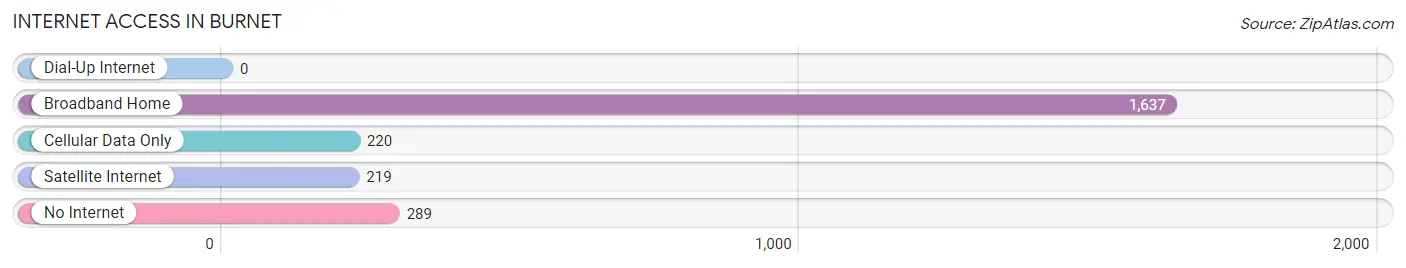
| Internet Type | # Households | % Households |
| Dial-Up Internet | 0 | 0.0% |
| Broadband Home | 1,637 | 73.0% |
| Cellular Data Only | 220 | 9.8% |
| Satellite Internet | 219 | 9.8% |
| No Internet | 289 | 12.9% |
| Total | 2,243 | 100.0% |
Burnet Summary
Burnet, Texas is a city located in Burnet County in the state of Texas. It is the county seat of Burnet County and is located about 55 miles northwest of Austin. The city has a population of 5,987 as of the 2010 census.
History
Burnet was founded in 1847 by David G. Burnet, a former president of the Republic of Texas. The city was named after him and was originally called Hamilton. The city was officially incorporated in 1852 and was the first county seat of Burnet County.
In the late 19th century, Burnet was a major stop on the Chisholm Trail, a cattle trail that ran from Texas to Kansas. The city was also a major stop on the Austin and Northwestern Railroad, which ran from Austin to Burnet and then to Lampasas.
Geography
Burnet is located at the intersection of U.S. Highway 281 and State Highway 29 in the Hill Country region of Central Texas. The city is situated on the eastern edge of the Balcones Escarpment, a geological formation that runs through Central Texas. The city is surrounded by rolling hills and is located about 55 miles northwest of Austin.
The climate in Burnet is generally mild, with hot summers and cool winters. The average annual temperature is around 68 degrees Fahrenheit. The average annual precipitation is around 33 inches.
Economy
The economy of Burnet is largely based on agriculture and tourism. The city is home to several wineries and vineyards, as well as a number of other tourist attractions. The city is also home to several manufacturing companies, including a large paper mill.
The city is also home to several educational institutions, including the University of Texas at Austin, Texas State University, and Austin Community College.
Demographics
As of the 2010 census, the population of Burnet was 5,987. The racial makeup of the city was 79.3% White, 0.7% African American, 0.7% Native American, 0.3% Asian, 0.1% Pacific Islander, 16.7% from other races, and 2.1% from two or more races. Hispanic or Latino of any race were 33.2% of the population.
The median income for a household in Burnet was $37,917, and the median income for a family was $45,938. The per capita income for the city was $20,945. About 16.2% of families and 19.7% of the population were below the poverty line, including 28.2% of those under age 18 and 11.2% of those age 65 or over.
Burnet is a small city with a rich history and a diverse economy. The city is home to several wineries and vineyards, as well as a number of other tourist attractions. The city is also home to several educational institutions, including the University of Texas at Austin, Texas State University, and Austin Community College. The city has a population of 5,987 as of the 2010 census and has a median income of $37,917.
Common Questions
What is Per Capita Income in Burnet?
Per Capita income in Burnet is $35,622.
What is the Median Family Income in Burnet?
Median Family Income in Burnet is $90,492.
What is the Median Household income in Burnet?
Median Household Income in Burnet is $77,376.
What is Income or Wage Gap in Burnet?
Income or Wage Gap in Burnet is 49.6%.
Women in Burnet earn 50.4 cents for every dollar earned by a man.
What is Inequality or Gini Index in Burnet?
Inequality or Gini Index in Burnet is 0.42.
What is the Total Population of Burnet?
Total Population of Burnet is 6,464.
What is the Total Male Population of Burnet?
Total Male Population of Burnet is 3,001.
What is the Total Female Population of Burnet?
Total Female Population of Burnet is 3,463.
What is the Ratio of Males per 100 Females in Burnet?
There are 86.66 Males per 100 Females in Burnet.
What is the Ratio of Females per 100 Males in Burnet?
There are 115.39 Females per 100 Males in Burnet.
What is the Median Population Age in Burnet?
Median Population Age in Burnet is 39.9 Years.
What is the Average Family Size in Burnet
Average Family Size in Burnet is 3.2 People.
What is the Average Household Size in Burnet
Average Household Size in Burnet is 2.6 People.
How Large is the Labor Force in Burnet?
There are 3,084 People in the Labor Forcein in Burnet.
What is the Percentage of People in the Labor Force in Burnet?
57.7% of People are in the Labor Force in Burnet.
What is the Unemployment Rate in Burnet?
Unemployment Rate in Burnet is 3.2%.