Burkburnett, TX Map & Demographics
Burkburnett Map
Burkburnett Overview
$32,381
PER CAPITA INCOME
$80,776
AVG FAMILY INCOME
$62,143
AVG HOUSEHOLD INCOME
21.8%
WAGE / INCOME GAP [ % ]
78.2¢/ $1
WAGE / INCOME GAP [ $ ]
0.39
INEQUALITY / GINI INDEX
10,979
TOTAL POPULATION
5,181
MALE POPULATION
5,798
FEMALE POPULATION
89.36
MALES / 100 FEMALES
111.91
FEMALES / 100 MALES
42.5
MEDIAN AGE
3.0
AVG FAMILY SIZE
2.5
AVG HOUSEHOLD SIZE
5,476
LABOR FORCE [ PEOPLE ]
60.6%
PERCENT IN LABOR FORCE
5.0%
UNEMPLOYMENT RATE
Burkburnett Zip Codes
Burkburnett Area Codes
Income in Burkburnett
Income Overview in Burkburnett
Per Capita Income in Burkburnett is $32,381, while median incomes of families and households are $80,776 and $62,143 respectively.
| Characteristic | Number | Measure |
| Per Capita Income | 10,979 | $32,381 |
| Median Family Income | 3,114 | $80,776 |
| Mean Family Income | 3,114 | $92,725 |
| Median Household Income | 4,462 | $62,143 |
| Mean Household Income | 4,462 | $78,152 |
| Income Deficit | 3,114 | $0 |
| Wage / Income Gap (%) | 10,979 | 21.81% |
| Wage / Income Gap ($) | 10,979 | 78.19¢ per $1 |
| Gini / Inequality Index | 10,979 | 0.39 |
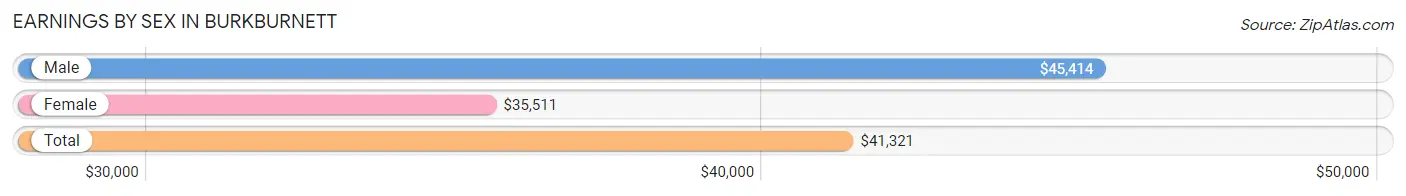
Earnings by Sex in Burkburnett
Average Earnings in Burkburnett are $41,321, $45,414 for men and $35,511 for women, a difference of 21.8%.
| Sex | Number | Average Earnings |
| Male | 3,017 (52.3%) | $45,414 |
| Female | 2,751 (47.7%) | $35,511 |
| Total | 5,768 (100.0%) | $41,321 |
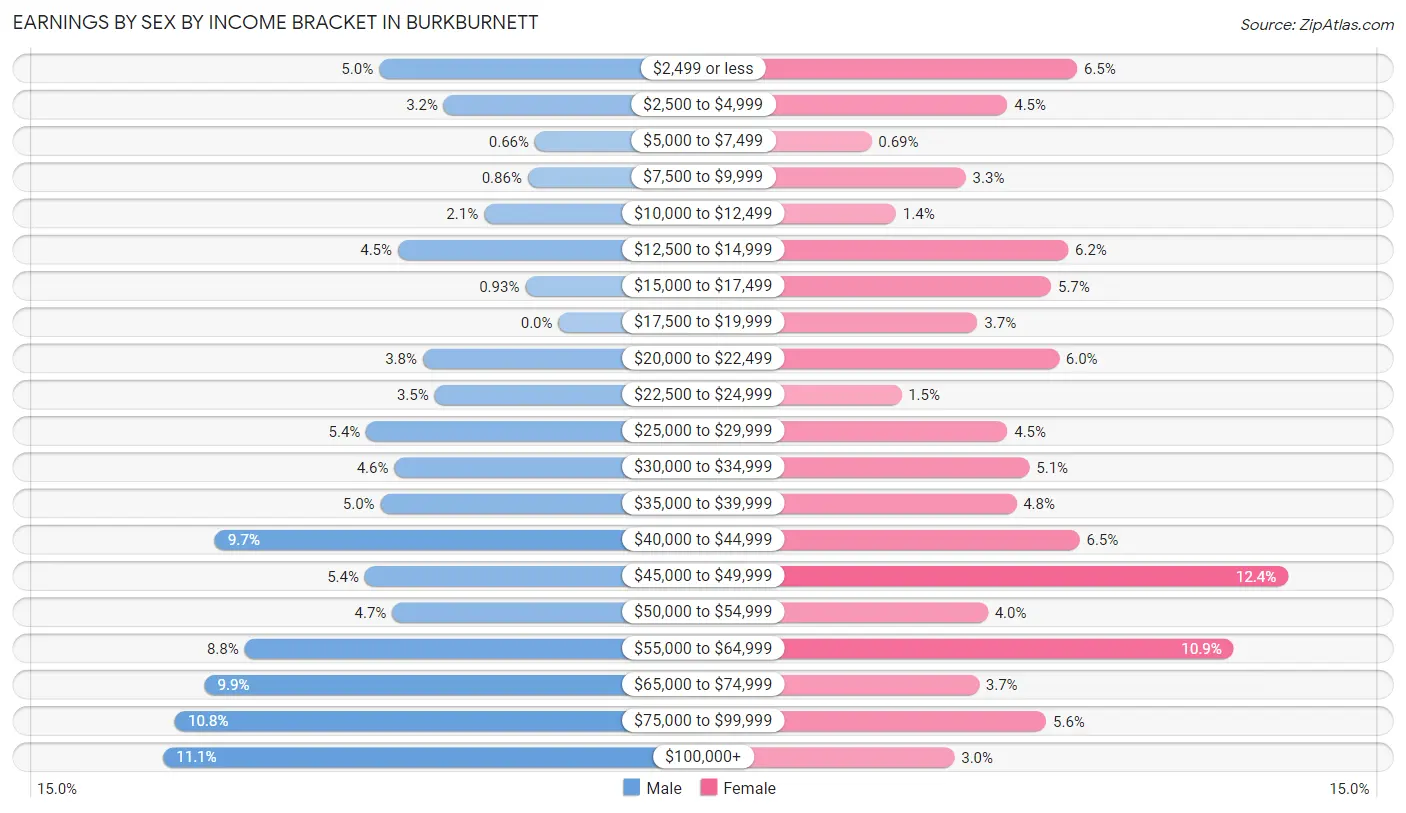
Earnings by Sex by Income Bracket in Burkburnett
The most common earnings brackets in Burkburnett are $100,000+ for men (335 | 11.1%) and $45,000 to $49,999 for women (341 | 12.4%).
| Income | Male | Female |
| $2,499 or less | 152 (5.0%) | 178 (6.5%) |
| $2,500 to $4,999 | 97 (3.2%) | 124 (4.5%) |
| $5,000 to $7,499 | 20 (0.7%) | 19 (0.7%) |
| $7,500 to $9,999 | 26 (0.9%) | 92 (3.3%) |
| $10,000 to $12,499 | 63 (2.1%) | 38 (1.4%) |
| $12,500 to $14,999 | 136 (4.5%) | 171 (6.2%) |
| $15,000 to $17,499 | 28 (0.9%) | 158 (5.7%) |
| $17,500 to $19,999 | 0 (0.0%) | 101 (3.7%) |
| $20,000 to $22,499 | 115 (3.8%) | 164 (6.0%) |
| $22,500 to $24,999 | 105 (3.5%) | 42 (1.5%) |
| $25,000 to $29,999 | 163 (5.4%) | 124 (4.5%) |
| $30,000 to $34,999 | 139 (4.6%) | 141 (5.1%) |
| $35,000 to $39,999 | 151 (5.0%) | 131 (4.8%) |
| $40,000 to $44,999 | 291 (9.7%) | 180 (6.5%) |
| $45,000 to $49,999 | 164 (5.4%) | 341 (12.4%) |
| $50,000 to $54,999 | 141 (4.7%) | 109 (4.0%) |
| $55,000 to $64,999 | 266 (8.8%) | 299 (10.9%) |
| $65,000 to $74,999 | 300 (9.9%) | 102 (3.7%) |
| $75,000 to $99,999 | 325 (10.8%) | 154 (5.6%) |
| $100,000+ | 335 (11.1%) | 83 (3.0%) |
| Total | 3,017 (100.0%) | 2,751 (100.0%) |
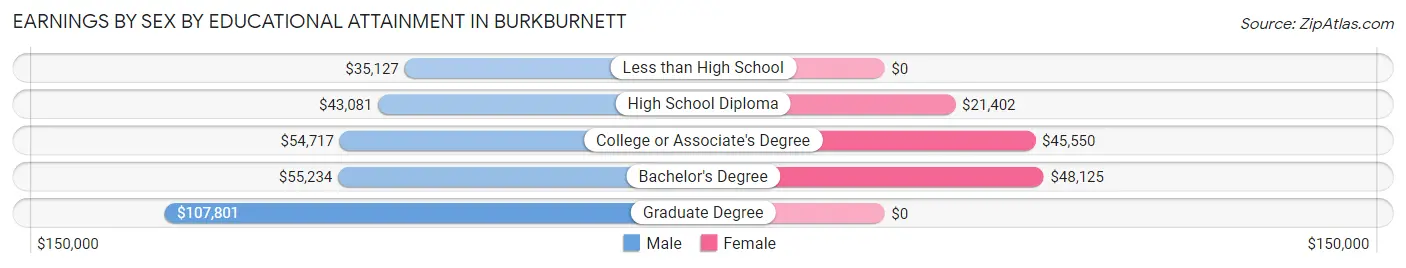
Earnings by Sex by Educational Attainment in Burkburnett
Average earnings in Burkburnett are $50,944 for men and $40,762 for women, a difference of 20.0%. Men with an educational attainment of graduate degree enjoy the highest average annual earnings of $107,801, while those with less than high school education earn the least with $35,127. Women with an educational attainment of bachelor's degree earn the most with the average annual earnings of $48,125, while those with high school diploma education have the smallest earnings of $21,402.
| Educational Attainment | Male Income | Female Income |
| Less than High School | $35,127 | $0 |
| High School Diploma | $43,081 | $21,402 |
| College or Associate's Degree | $54,717 | $45,550 |
| Bachelor's Degree | $55,234 | $48,125 |
| Graduate Degree | $107,801 | $0 |
| Total | $50,944 | $40,762 |
Family Income in Burkburnett
Family Income Brackets in Burkburnett
According to the Burkburnett family income data, there are 978 families falling into the $100,000 to $149,999 income range, which is the most common income bracket and makes up 31.4% of all families.
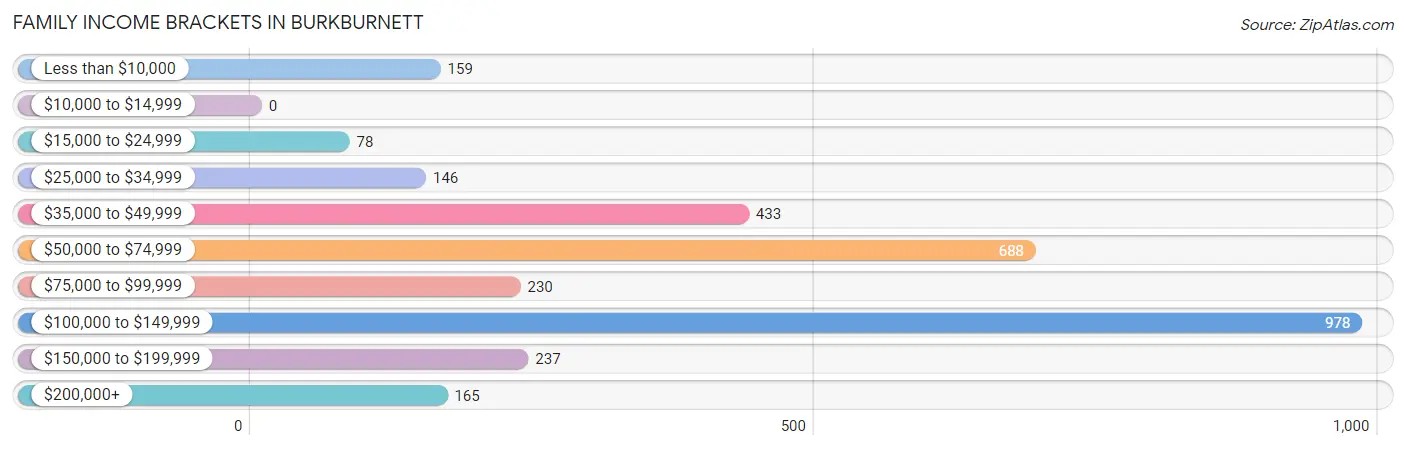
| Income Bracket | # Families | % Families |
| Less than $10,000 | 159 | 5.1% |
| $10,000 to $14,999 | 0 | 0.0% |
| $15,000 to $24,999 | 78 | 2.5% |
| $25,000 to $34,999 | 146 | 4.7% |
| $35,000 to $49,999 | 433 | 13.9% |
| $50,000 to $74,999 | 688 | 22.1% |
| $75,000 to $99,999 | 230 | 7.4% |
| $100,000 to $149,999 | 978 | 31.4% |
| $150,000 to $199,999 | 237 | 7.6% |
| $200,000+ | 165 | 5.3% |
Family Income by Famaliy Size in Burkburnett
6-person families (66 | 2.1%) account for the highest median family income in Burkburnett with $136,042 per family, while 3-person families (604 | 19.4%) have the highest median income of $32,809 per family member.
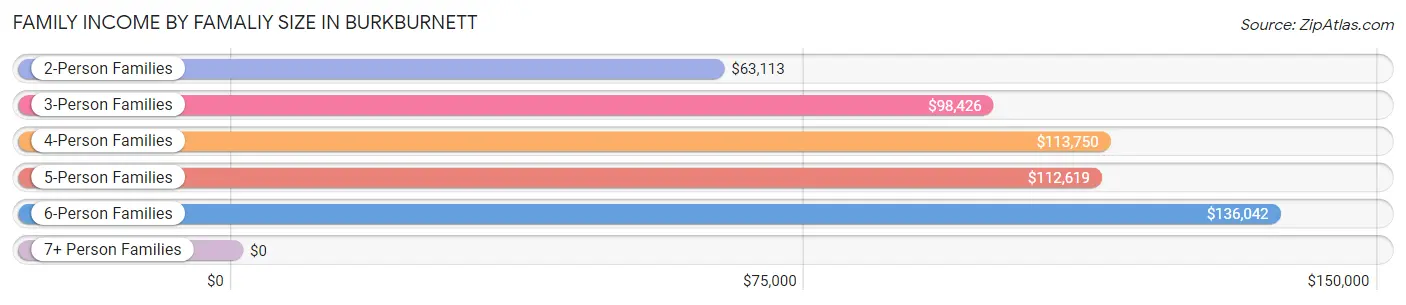
| Income Bracket | # Families | Median Income |
| 2-Person Families | 1,842 (59.2%) | $63,113 |
| 3-Person Families | 604 (19.4%) | $98,426 |
| 4-Person Families | 385 (12.4%) | $113,750 |
| 5-Person Families | 198 (6.4%) | $112,619 |
| 6-Person Families | 66 (2.1%) | $136,042 |
| 7+ Person Families | 19 (0.6%) | $0 |
| Total | 3,114 (100.0%) | $80,776 |
Family Income by Number of Earners in Burkburnett
The median family income in Burkburnett is $80,776, with families comprising 3+ earners (313) having the highest median family income of $134,375, while families with no earners (546) have the lowest median family income of $46,688, accounting for 10.1% and 17.5% of families, respectively.
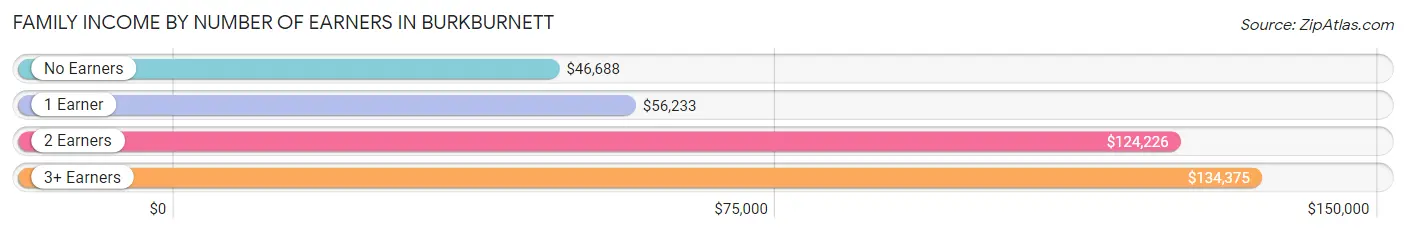
| Number of Earners | # Families | Median Income |
| No Earners | 546 (17.5%) | $46,688 |
| 1 Earner | 1,129 (36.3%) | $56,233 |
| 2 Earners | 1,126 (36.2%) | $124,226 |
| 3+ Earners | 313 (10.1%) | $134,375 |
| Total | 3,114 (100.0%) | $80,776 |
Household Income in Burkburnett
Household Income Brackets in Burkburnett
With 1,031 households falling in the category, the $100,000 to $149,999 income range is the most frequent in Burkburnett, accounting for 23.1% of all households. In contrast, only 134 households (3.0%) fall into the $10,000 to $14,999 income bracket, making it the least populous group.
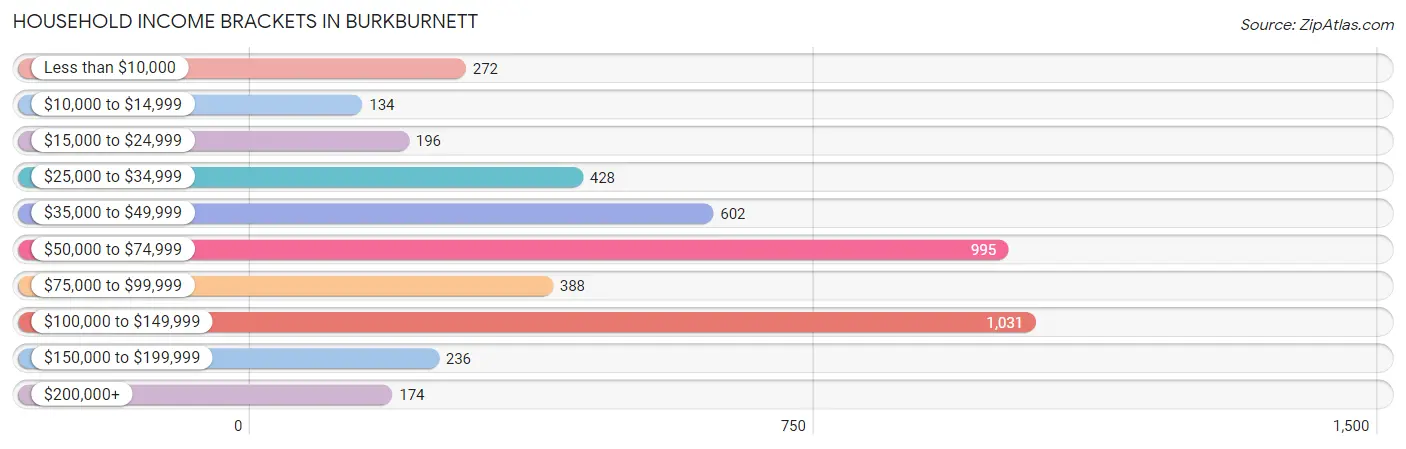
| Income Bracket | # Households | % Households |
| Less than $10,000 | 272 | 6.1% |
| $10,000 to $14,999 | 134 | 3.0% |
| $15,000 to $24,999 | 196 | 4.4% |
| $25,000 to $34,999 | 428 | 9.6% |
| $35,000 to $49,999 | 602 | 13.5% |
| $50,000 to $74,999 | 995 | 22.3% |
| $75,000 to $99,999 | 388 | 8.7% |
| $100,000 to $149,999 | 1,031 | 23.1% |
| $150,000 to $199,999 | 236 | 5.3% |
| $200,000+ | 174 | 3.9% |
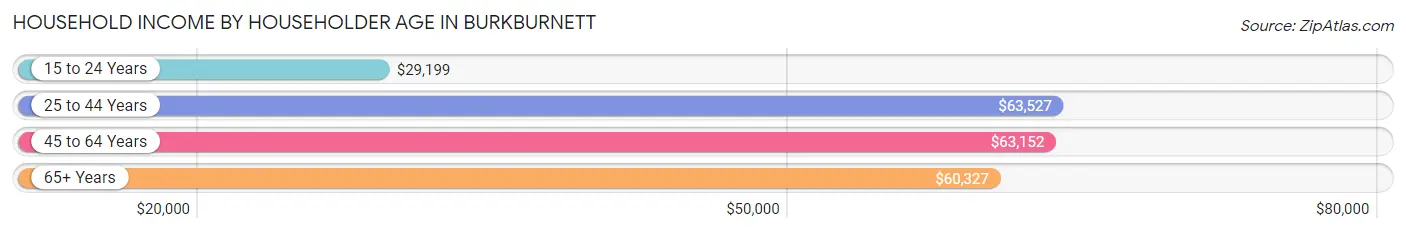
Household Income by Householder Age in Burkburnett
The median household income in Burkburnett is $62,143, with the highest median household income of $63,527 found in the 25 to 44 years age bracket for the primary householder. A total of 1,386 households (31.1%) fall into this category. Meanwhile, the 15 to 24 years age bracket for the primary householder has the lowest median household income of $29,199, with 129 households (2.9%) in this group.
| Income Bracket | # Households | Median Income |
| 15 to 24 Years | 129 (2.9%) | $29,199 |
| 25 to 44 Years | 1,386 (31.1%) | $63,527 |
| 45 to 64 Years | 1,688 (37.8%) | $63,152 |
| 65+ Years | 1,259 (28.2%) | $60,327 |
| Total | 4,462 (100.0%) | $62,143 |
Poverty in Burkburnett
Income Below Poverty by Sex and Age in Burkburnett
With 7.7% poverty level for males and 10.4% for females among the residents of Burkburnett, under 5 year old males and 16 and 17 year old females are the most vulnerable to poverty, with 102 males (30.7%) and 84 females (45.2%) in their respective age groups living below the poverty level.
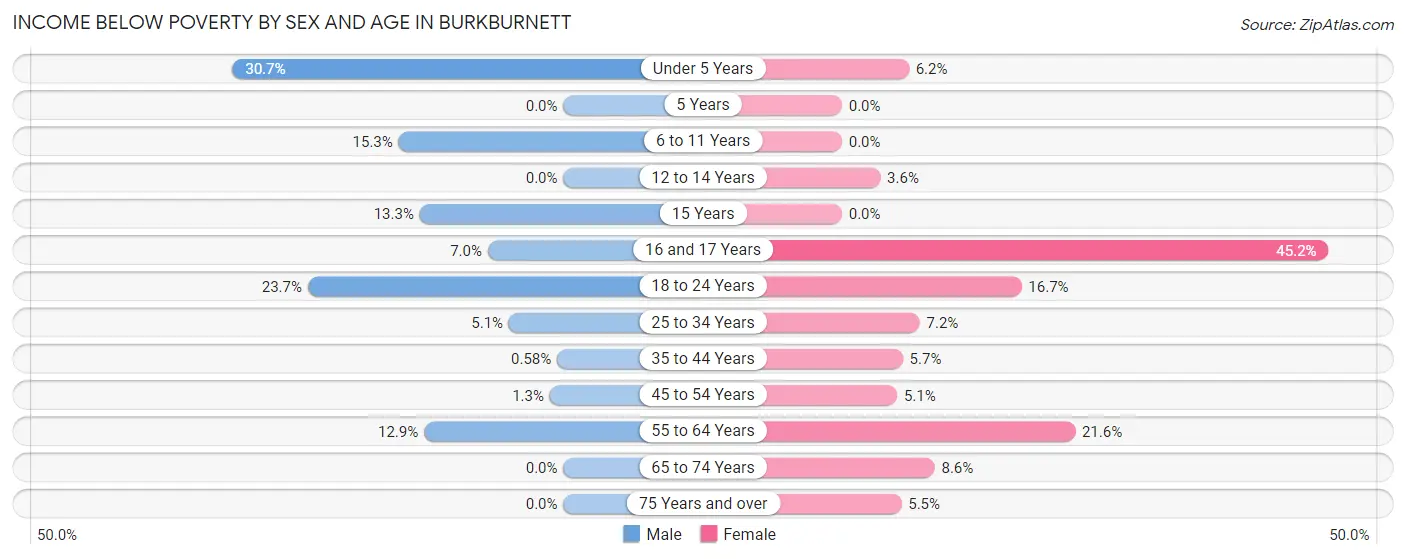
| Age Bracket | Male | Female |
| Under 5 Years | 102 (30.7%) | 20 (6.2%) |
| 5 Years | 0 (0.0%) | 0 (0.0%) |
| 6 to 11 Years | 39 (15.3%) | 0 (0.0%) |
| 12 to 14 Years | 0 (0.0%) | 8 (3.6%) |
| 15 Years | 8 (13.3%) | 0 (0.0%) |
| 16 and 17 Years | 11 (7.0%) | 84 (45.2%) |
| 18 to 24 Years | 97 (23.7%) | 72 (16.7%) |
| 25 to 34 Years | 33 (5.1%) | 49 (7.2%) |
| 35 to 44 Years | 3 (0.6%) | 59 (5.7%) |
| 45 to 54 Years | 11 (1.3%) | 22 (5.1%) |
| 55 to 64 Years | 91 (12.9%) | 211 (21.6%) |
| 65 to 74 Years | 0 (0.0%) | 49 (8.6%) |
| 75 Years and over | 0 (0.0%) | 24 (5.5%) |
| Total | 395 (7.7%) | 598 (10.4%) |
Income Above Poverty by Sex and Age in Burkburnett
According to the poverty statistics in Burkburnett, males aged 5 years and females aged 5 years are the age groups that are most secure financially, with 100.0% of males and 100.0% of females in these age groups living above the poverty line.
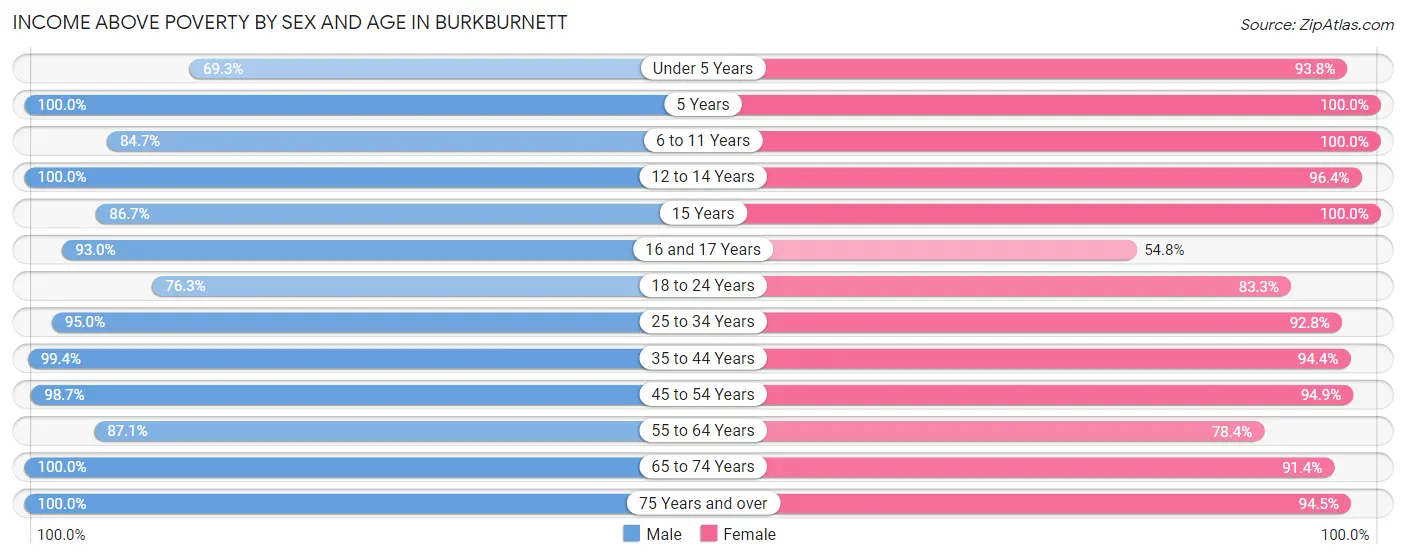
| Age Bracket | Male | Female |
| Under 5 Years | 230 (69.3%) | 302 (93.8%) |
| 5 Years | 98 (100.0%) | 53 (100.0%) |
| 6 to 11 Years | 216 (84.7%) | 291 (100.0%) |
| 12 to 14 Years | 152 (100.0%) | 217 (96.4%) |
| 15 Years | 52 (86.7%) | 116 (100.0%) |
| 16 and 17 Years | 146 (93.0%) | 102 (54.8%) |
| 18 to 24 Years | 312 (76.3%) | 360 (83.3%) |
| 25 to 34 Years | 620 (95.0%) | 630 (92.8%) |
| 35 to 44 Years | 518 (99.4%) | 985 (94.4%) |
| 45 to 54 Years | 864 (98.7%) | 408 (94.9%) |
| 55 to 64 Years | 613 (87.1%) | 764 (78.4%) |
| 65 to 74 Years | 617 (100.0%) | 520 (91.4%) |
| 75 Years and over | 294 (100.0%) | 411 (94.5%) |
| Total | 4,732 (92.3%) | 5,159 (89.6%) |
Income Below Poverty Among Married-Couple Families in Burkburnett
The poverty statistics for married-couple families in Burkburnett show that 0.4% or 8 of the total 2,307 families live below the poverty line. Families with no children have the highest poverty rate of 0.5%, comprising of 8 families. On the other hand, families with 1 or 2 children have the lowest poverty rate of 0.0%, which includes 0 families.
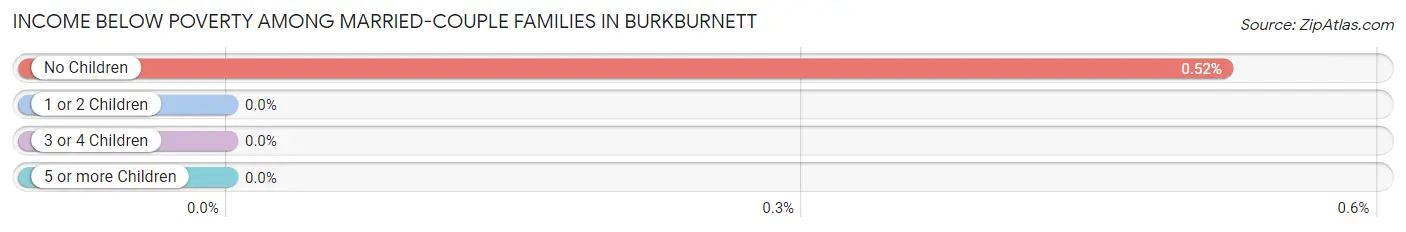
| Children | Above Poverty | Below Poverty |
| No Children | 1,523 (99.5%) | 8 (0.5%) |
| 1 or 2 Children | 702 (100.0%) | 0 (0.0%) |
| 3 or 4 Children | 74 (100.0%) | 0 (0.0%) |
| 5 or more Children | 0 (0.0%) | 0 (0.0%) |
| Total | 2,299 (99.7%) | 8 (0.4%) |
Income Below Poverty Among Single-Parent Households in Burkburnett
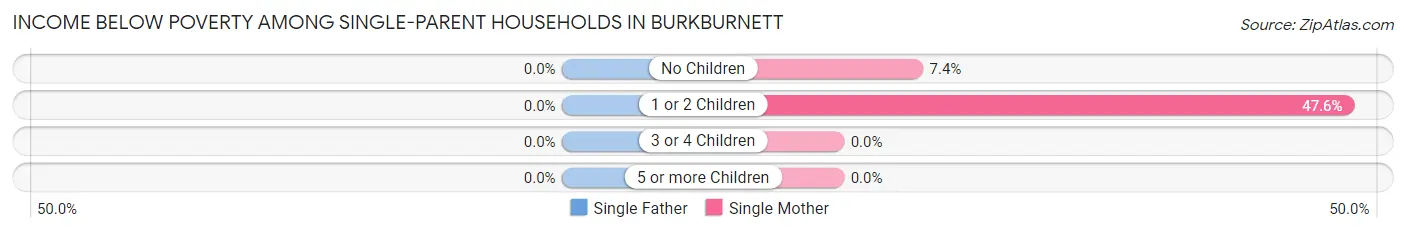
| Children | Single Father | Single Mother |
| No Children | 0 (0.0%) | 30 (7.3%) |
| 1 or 2 Children | 0 (0.0%) | 146 (47.6%) |
| 3 or 4 Children | 0 (0.0%) | 0 (0.0%) |
| 5 or more Children | 0 (0.0%) | 0 (0.0%) |
| Total | 0 (0.0%) | 176 (22.6%) |
Income Below Poverty Among Married-Couple vs Single-Parent Households in Burkburnett
The poverty data for Burkburnett shows that 8 of the married-couple family households (0.4%) and 176 of the single-parent households (21.8%) are living below the poverty level. Within the married-couple family households, those with no children have the highest poverty rate, with 8 households (0.5%) falling below the poverty line. Among the single-parent households, those with 1 or 2 children have the highest poverty rate, with 146 household (47.6%) living below poverty.
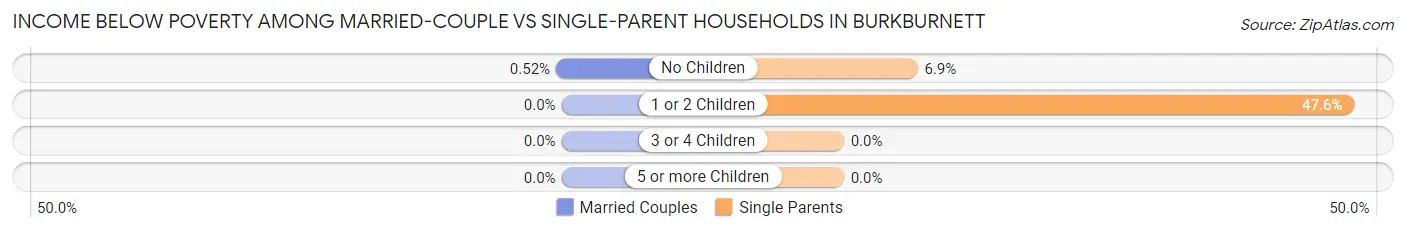
| Children | Married-Couple Families | Single-Parent Households |
| No Children | 8 (0.5%) | 30 (6.9%) |
| 1 or 2 Children | 0 (0.0%) | 146 (47.6%) |
| 3 or 4 Children | 0 (0.0%) | 0 (0.0%) |
| 5 or more Children | 0 (0.0%) | 0 (0.0%) |
| Total | 8 (0.4%) | 176 (21.8%) |
Race in Burkburnett
The most populous races in Burkburnett are White / Caucasian (9,694 | 88.3%), Hispanic or Latino (1,794 | 16.3%), and Two or more Races (840 | 7.6%).
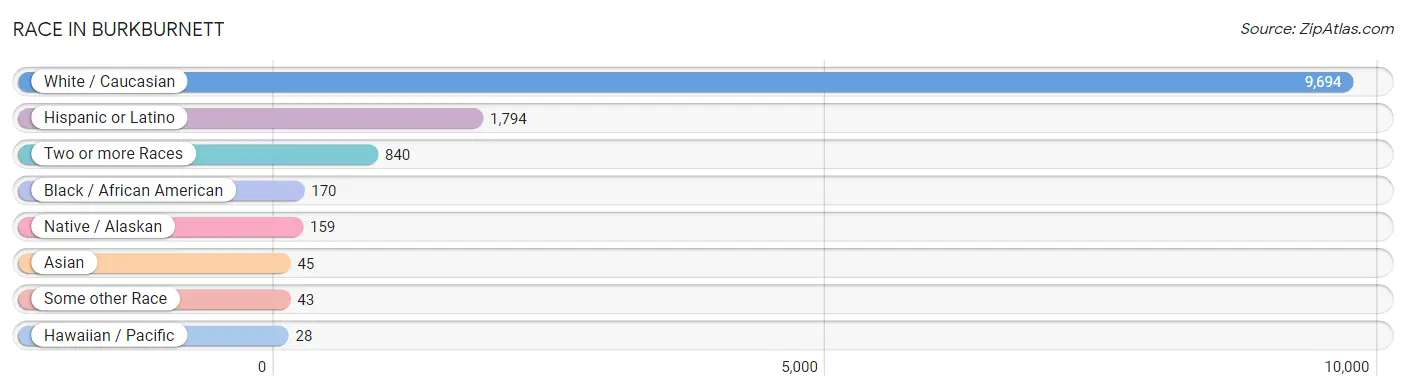
| Race | # Population | % Population |
| Asian | 45 | 0.4% |
| Black / African American | 170 | 1.5% |
| Hawaiian / Pacific | 28 | 0.3% |
| Hispanic or Latino | 1,794 | 16.3% |
| Native / Alaskan | 159 | 1.5% |
| White / Caucasian | 9,694 | 88.3% |
| Two or more Races | 840 | 7.6% |
| Some other Race | 43 | 0.4% |
| Total | 10,979 | 100.0% |
Ancestry in Burkburnett
The most populous ancestries reported in Burkburnett are Mexican (1,475 | 13.4%), Irish (1,374 | 12.5%), English (1,329 | 12.1%), German (1,257 | 11.5%), and American (773 | 7.0%), together accounting for 56.5% of all Burkburnett residents.
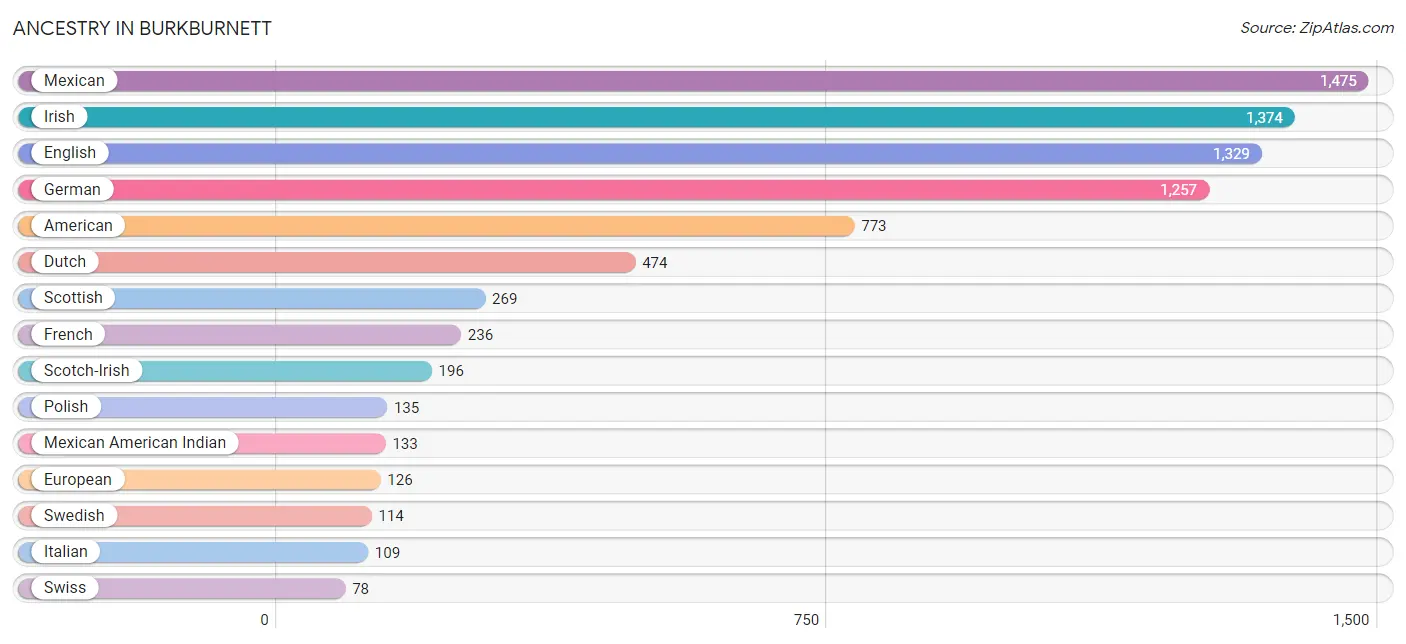
| Ancestry | # Population | % Population |
| American | 773 | 7.0% |
| Bahamian | 24 | 0.2% |
| Bhutanese | 12 | 0.1% |
| British | 28 | 0.3% |
| Canadian | 44 | 0.4% |
| Central American | 11 | 0.1% |
| Cherokee | 43 | 0.4% |
| Choctaw | 14 | 0.1% |
| Colombian | 10 | 0.1% |
| Cuban | 20 | 0.2% |
| Czech | 13 | 0.1% |
| Danish | 25 | 0.2% |
| Dominican | 18 | 0.2% |
| Dutch | 474 | 4.3% |
| Eastern European | 31 | 0.3% |
| English | 1,329 | 12.1% |
| European | 126 | 1.1% |
| Finnish | 13 | 0.1% |
| French | 236 | 2.1% |
| French Canadian | 37 | 0.3% |
| German | 1,257 | 11.5% |
| Greek | 3 | 0.0% |
| Guamanian / Chamorro | 28 | 0.3% |
| Irish | 1,374 | 12.5% |
| Italian | 109 | 1.0% |
| Mexican | 1,475 | 13.4% |
| Mexican American Indian | 133 | 1.2% |
| Norwegian | 54 | 0.5% |
| Polish | 135 | 1.2% |
| Russian | 27 | 0.3% |
| Salvadoran | 11 | 0.1% |
| Scandinavian | 52 | 0.5% |
| Scotch-Irish | 196 | 1.8% |
| Scottish | 269 | 2.5% |
| Slavic | 10 | 0.1% |
| South American | 10 | 0.1% |
| Spaniard | 8 | 0.1% |
| Swedish | 114 | 1.0% |
| Swiss | 78 | 0.7% |
| Welsh | 33 | 0.3% | View All 40 Rows |
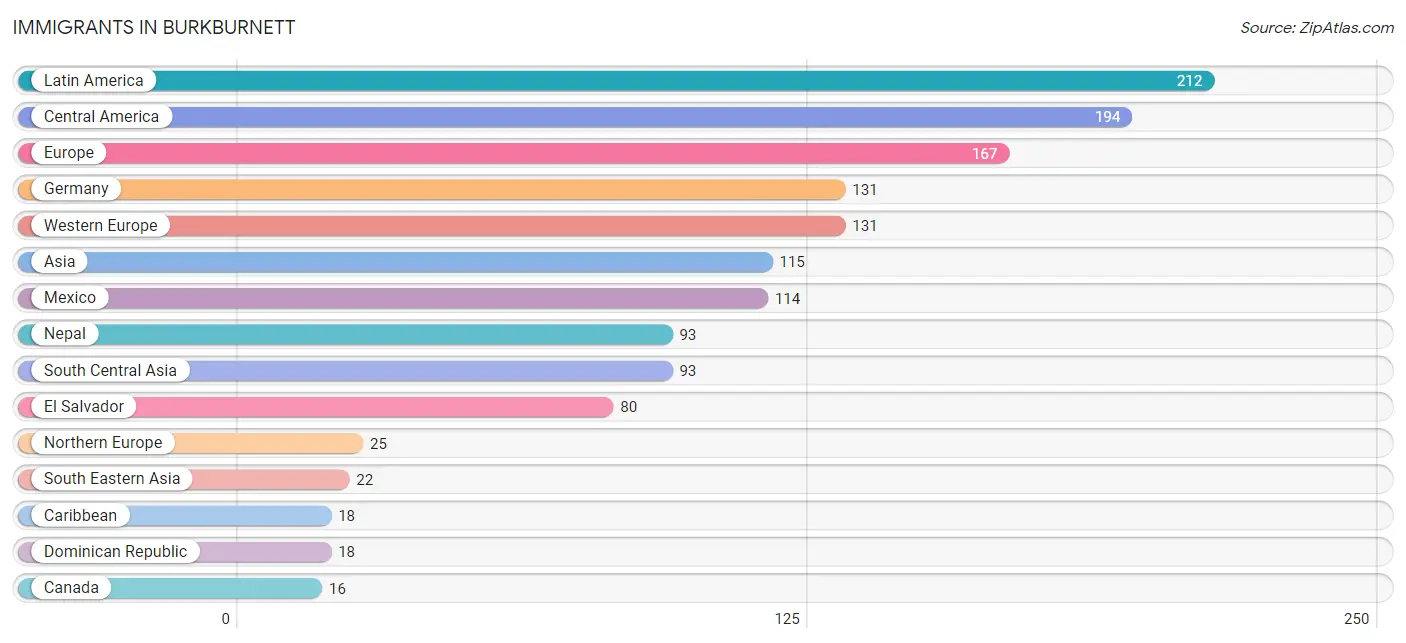
Immigrants in Burkburnett
The most numerous immigrant groups reported in Burkburnett came from Latin America (212 | 1.9%), Central America (194 | 1.8%), Europe (167 | 1.5%), Germany (131 | 1.2%), and Western Europe (131 | 1.2%), together accounting for 7.6% of all Burkburnett residents.
| Immigration Origin | # Population | % Population |
| Asia | 115 | 1.1% |
| Azores | 11 | 0.1% |
| Canada | 16 | 0.2% |
| Caribbean | 18 | 0.2% |
| Central America | 194 | 1.8% |
| Dominican Republic | 18 | 0.2% |
| El Salvador | 80 | 0.7% |
| Europe | 167 | 1.5% |
| Germany | 131 | 1.2% |
| Ireland | 10 | 0.1% |
| Laos | 8 | 0.1% |
| Latin America | 212 | 1.9% |
| Mexico | 114 | 1.0% |
| Nepal | 93 | 0.9% |
| Northern Europe | 25 | 0.2% |
| Portugal | 11 | 0.1% |
| South Central Asia | 93 | 0.9% |
| South Eastern Asia | 22 | 0.2% |
| Southern Europe | 11 | 0.1% |
| Vietnam | 14 | 0.1% |
| Western Europe | 131 | 1.2% | View All 21 Rows |
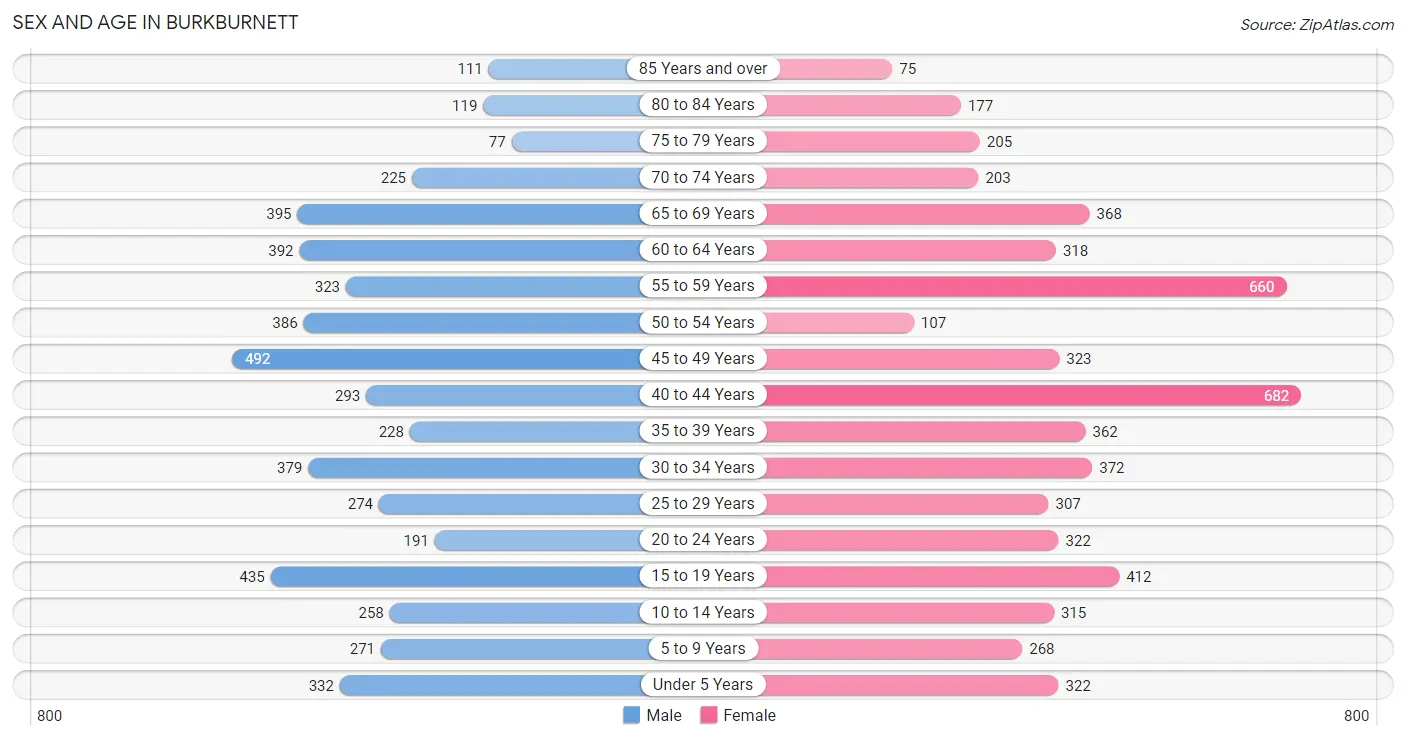
Sex and Age in Burkburnett
Sex and Age in Burkburnett
The most populous age groups in Burkburnett are 45 to 49 Years (492 | 9.5%) for men and 40 to 44 Years (682 | 11.8%) for women.
| Age Bracket | Male | Female |
| Under 5 Years | 332 (6.4%) | 322 (5.6%) |
| 5 to 9 Years | 271 (5.2%) | 268 (4.6%) |
| 10 to 14 Years | 258 (5.0%) | 315 (5.4%) |
| 15 to 19 Years | 435 (8.4%) | 412 (7.1%) |
| 20 to 24 Years | 191 (3.7%) | 322 (5.6%) |
| 25 to 29 Years | 274 (5.3%) | 307 (5.3%) |
| 30 to 34 Years | 379 (7.3%) | 372 (6.4%) |
| 35 to 39 Years | 228 (4.4%) | 362 (6.2%) |
| 40 to 44 Years | 293 (5.7%) | 682 (11.8%) |
| 45 to 49 Years | 492 (9.5%) | 323 (5.6%) |
| 50 to 54 Years | 386 (7.4%) | 107 (1.8%) |
| 55 to 59 Years | 323 (6.2%) | 660 (11.4%) |
| 60 to 64 Years | 392 (7.6%) | 318 (5.5%) |
| 65 to 69 Years | 395 (7.6%) | 368 (6.4%) |
| 70 to 74 Years | 225 (4.3%) | 203 (3.5%) |
| 75 to 79 Years | 77 (1.5%) | 205 (3.5%) |
| 80 to 84 Years | 119 (2.3%) | 177 (3.0%) |
| 85 Years and over | 111 (2.1%) | 75 (1.3%) |
| Total | 5,181 (100.0%) | 5,798 (100.0%) |
Families and Households in Burkburnett
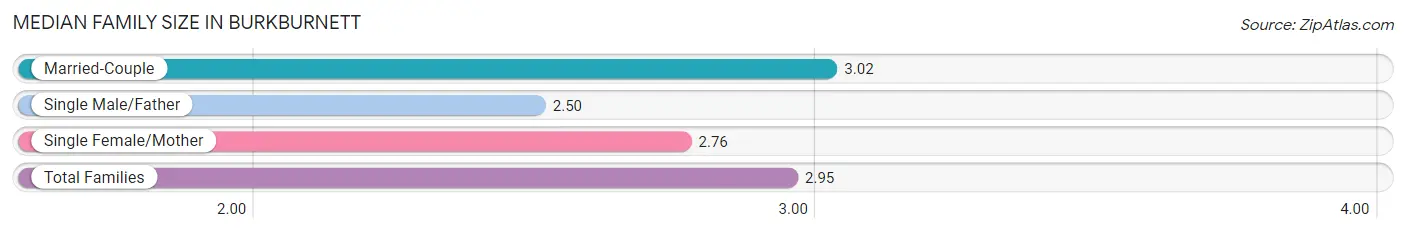
Median Family Size in Burkburnett
The median family size in Burkburnett is 2.95 persons per family, with married-couple families (2,307 | 74.1%) accounting for the largest median family size of 3.02 persons per family. On the other hand, single male/father families (28 | 0.9%) represent the smallest median family size with 2.50 persons per family.
| Family Type | # Families | Family Size |
| Married-Couple | 2,307 (74.1%) | 3.02 |
| Single Male/Father | 28 (0.9%) | 2.50 |
| Single Female/Mother | 779 (25.0%) | 2.76 |
| Total Families | 3,114 (100.0%) | 2.95 |
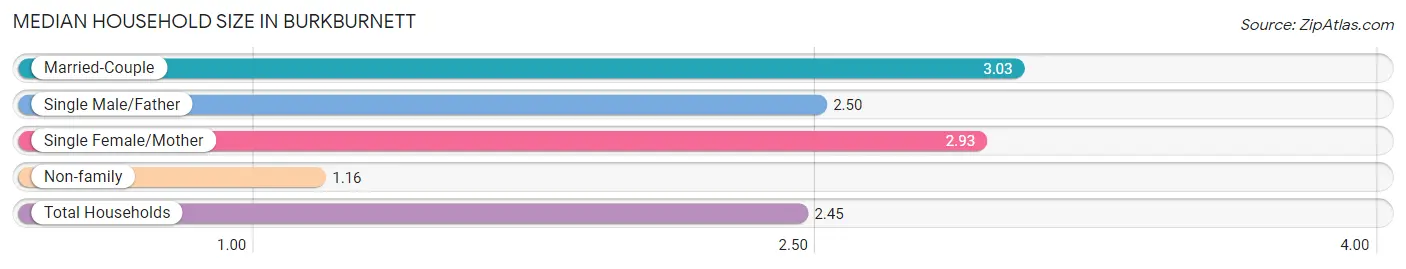
Median Household Size in Burkburnett
The median household size in Burkburnett is 2.45 persons per household, with married-couple households (2,307 | 51.7%) accounting for the largest median household size of 3.03 persons per household. non-family households (1,348 | 30.2%) represent the smallest median household size with 1.16 persons per household.
| Household Type | # Households | Household Size |
| Married-Couple | 2,307 (51.7%) | 3.03 |
| Single Male/Father | 28 (0.6%) | 2.50 |
| Single Female/Mother | 779 (17.5%) | 2.93 |
| Non-family | 1,348 (30.2%) | 1.16 |
| Total Households | 4,462 (100.0%) | 2.45 |
Household Size by Marriage Status in Burkburnett
Out of a total of 4,462 households in Burkburnett, 3,114 (69.8%) are family households, while 1,348 (30.2%) are nonfamily households. The most numerous type of family households are 2-person households, comprising 1,746, and the most common type of nonfamily households are 1-person households, comprising 1,189.
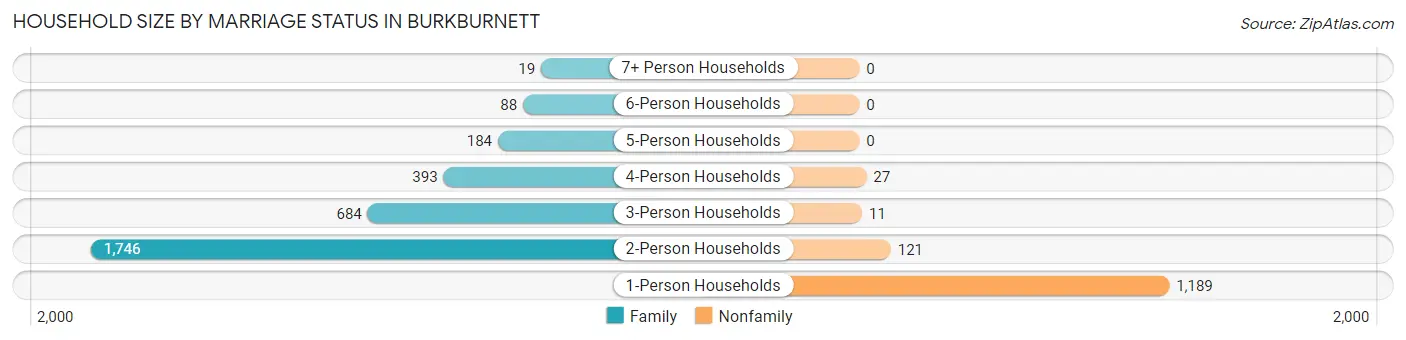
| Household Size | Family Households | Nonfamily Households |
| 1-Person Households | - | 1,189 (26.7%) |
| 2-Person Households | 1,746 (39.1%) | 121 (2.7%) |
| 3-Person Households | 684 (15.3%) | 11 (0.3%) |
| 4-Person Households | 393 (8.8%) | 27 (0.6%) |
| 5-Person Households | 184 (4.1%) | 0 (0.0%) |
| 6-Person Households | 88 (2.0%) | 0 (0.0%) |
| 7+ Person Households | 19 (0.4%) | 0 (0.0%) |
| Total | 3,114 (69.8%) | 1,348 (30.2%) |
Female Fertility in Burkburnett
Fertility by Age in Burkburnett
Average fertility rate in Burkburnett is 67.0 births per 1,000 women. Women in the age bracket of 20 to 34 years have the highest fertility rate with 138.0 births per 1,000 women. Women in the age bracket of 20 to 34 years acount for 73.4% of all women with births.
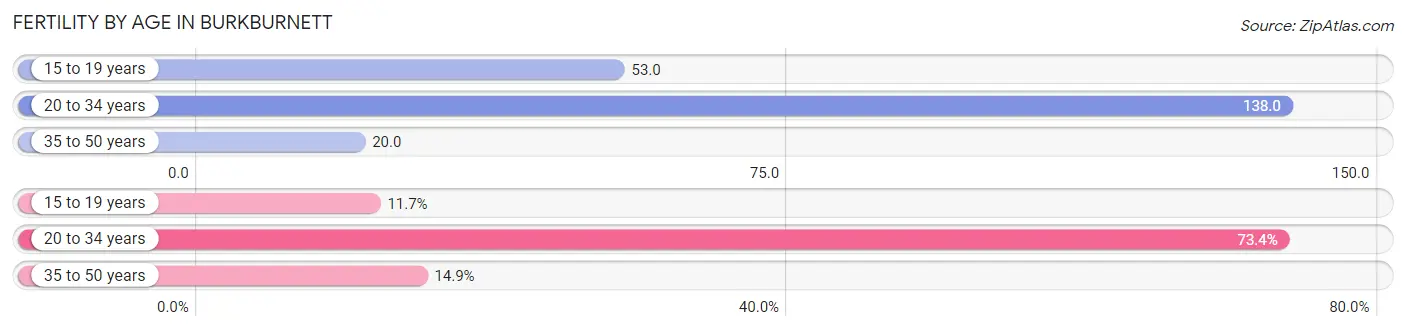
| Age Bracket | Women with Births | Births / 1,000 Women |
| 15 to 19 years | 22 (11.7%) | 53.0 |
| 20 to 34 years | 138 (73.4%) | 138.0 |
| 35 to 50 years | 28 (14.9%) | 20.0 |
| Total | 188 (100.0%) | 67.0 |
Fertility by Age by Marriage Status in Burkburnett
60.1% of women with births (188) in Burkburnett are married. The highest percentage of unmarried women with births falls into 15 to 19 years age bracket with 100.0% of them unmarried at the time of birth, while the lowest percentage of unmarried women with births belong to 35 to 50 years age bracket with 0.0% of them unmarried.
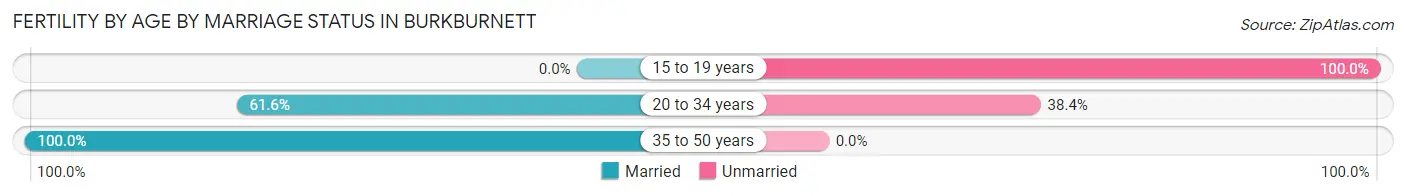
| Age Bracket | Married | Unmarried |
| 15 to 19 years | 0 (0.0%) | 22 (100.0%) |
| 20 to 34 years | 85 (61.6%) | 53 (38.4%) |
| 35 to 50 years | 28 (100.0%) | 0 (0.0%) |
| Total | 113 (60.1%) | 75 (39.9%) |
Fertility by Education in Burkburnett
Average fertility rate in Burkburnett is 67.0 births per 1,000 women. Women with the education attainment of college or associate's degree have the highest fertility rate of 113.0 births per 1,000 women, while women with the education attainment of high school diploma have the lowest fertility at 31.0 births per 1,000 women. Women with the education attainment of college or associate's degree represent 53.7% of all women with births.
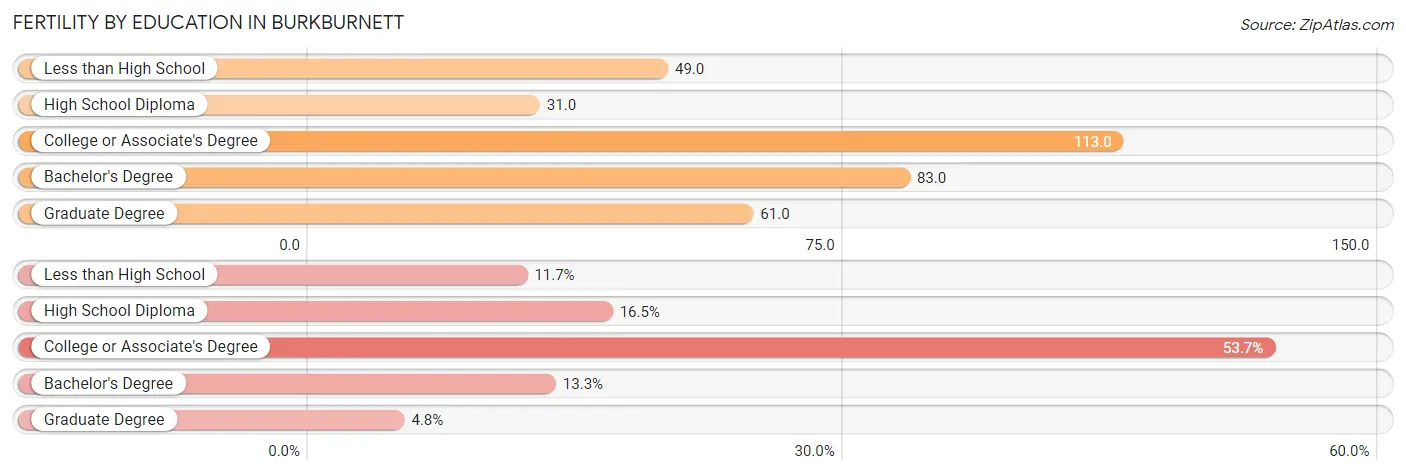
| Educational Attainment | Women with Births | Births / 1,000 Women |
| Less than High School | 22 (11.7%) | 49.0 |
| High School Diploma | 31 (16.5%) | 31.0 |
| College or Associate's Degree | 101 (53.7%) | 113.0 |
| Bachelor's Degree | 25 (13.3%) | 83.0 |
| Graduate Degree | 9 (4.8%) | 61.0 |
| Total | 188 (100.0%) | 67.0 |
Fertility by Education by Marriage Status in Burkburnett
39.9% of women with births in Burkburnett are unmarried. Women with the educational attainment of bachelor's degree are most likely to be married with 100.0% of them married at childbirth, while women with the educational attainment of less than high school are least likely to be married with 100.0% of them unmarried at childbirth.
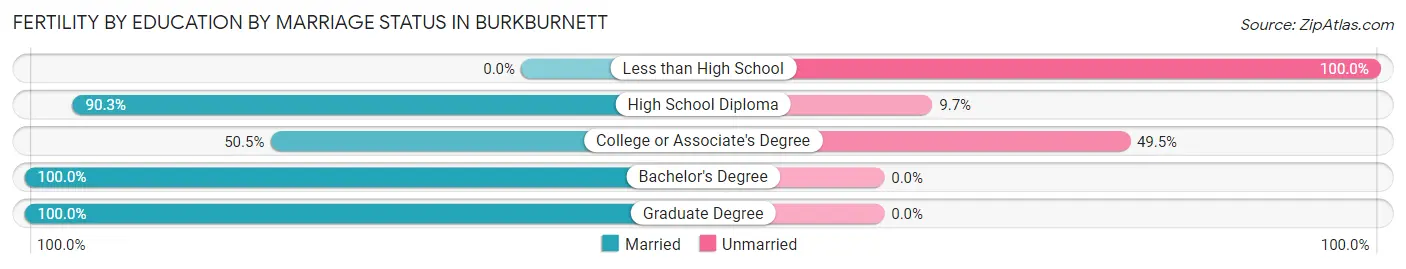
| Educational Attainment | Married | Unmarried |
| Less than High School | 0 (0.0%) | 22 (100.0%) |
| High School Diploma | 28 (90.3%) | 3 (9.7%) |
| College or Associate's Degree | 51 (50.5%) | 50 (49.5%) |
| Bachelor's Degree | 25 (100.0%) | 0 (0.0%) |
| Graduate Degree | 9 (100.0%) | 0 (0.0%) |
| Total | 113 (60.1%) | 75 (39.9%) |
Employment Characteristics in Burkburnett
Employment by Class of Employer in Burkburnett
Among the 5,106 employed individuals in Burkburnett, private company employees (3,261 | 63.9%), federal government employees (751 | 14.7%), and local government employees (362 | 7.1%) make up the most common classes of employment.
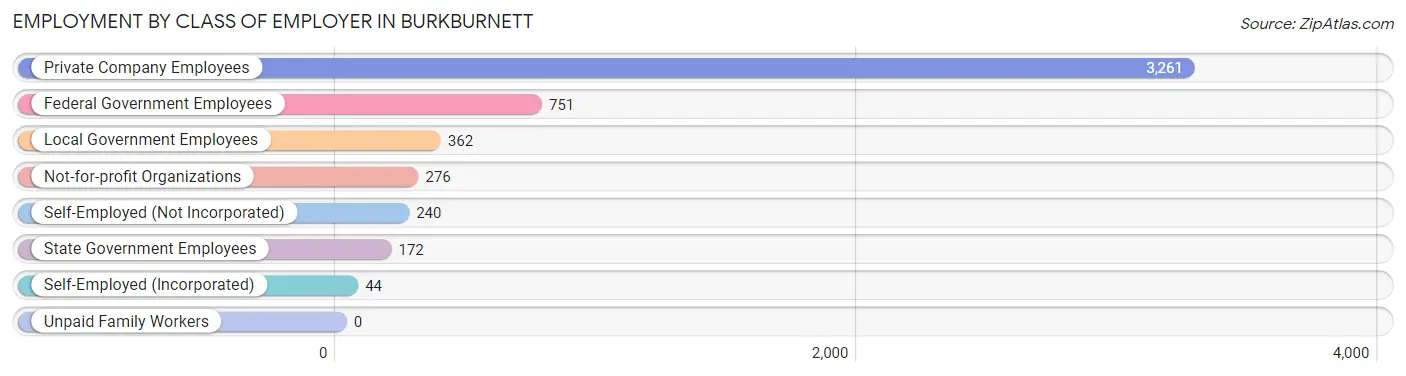
| Employer Class | # Employees | % Employees |
| Private Company Employees | 3,261 | 63.9% |
| Self-Employed (Incorporated) | 44 | 0.9% |
| Self-Employed (Not Incorporated) | 240 | 4.7% |
| Not-for-profit Organizations | 276 | 5.4% |
| Local Government Employees | 362 | 7.1% |
| State Government Employees | 172 | 3.4% |
| Federal Government Employees | 751 | 14.7% |
| Unpaid Family Workers | 0 | 0.0% |
| Total | 5,106 | 100.0% |
Employment Status by Age in Burkburnett
According to the labor force statistics for Burkburnett, out of the total population over 16 years of age (9,037), 60.6% or 5,476 individuals are in the labor force, with 5.0% or 274 of them unemployed. The age group with the highest labor force participation rate is 30 to 34 years, with 87.6% or 658 individuals in the labor force. Within the labor force, the 16 to 19 years age range has the highest percentage of unemployed individuals, with 21.1% or 60 of them being unemployed.
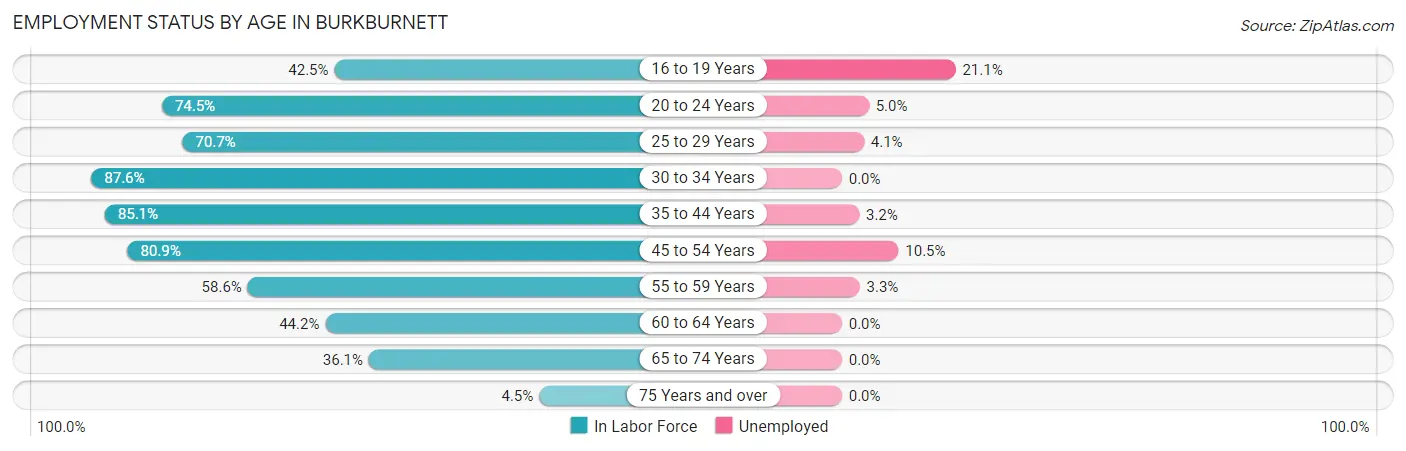
| Age Bracket | In Labor Force | Unemployed |
| 16 to 19 Years | 285 (42.5%) | 60 (21.1%) |
| 20 to 24 Years | 382 (74.5%) | 19 (5.0%) |
| 25 to 29 Years | 411 (70.7%) | 17 (4.1%) |
| 30 to 34 Years | 658 (87.6%) | 0 (0.0%) |
| 35 to 44 Years | 1,332 (85.1%) | 43 (3.2%) |
| 45 to 54 Years | 1,058 (80.9%) | 111 (10.5%) |
| 55 to 59 Years | 576 (58.6%) | 19 (3.3%) |
| 60 to 64 Years | 314 (44.2%) | 0 (0.0%) |
| 65 to 74 Years | 430 (36.1%) | 0 (0.0%) |
| 75 Years and over | 34 (4.5%) | 0 (0.0%) |
| Total | 5,476 (60.6%) | 274 (5.0%) |
Employment Status by Educational Attainment in Burkburnett
According to labor force statistics for Burkburnett, 73.7% of individuals (4,347) out of the total population between 25 and 64 years of age (5,898) are in the labor force, with 4.5% or 196 of them being unemployed. The group with the highest labor force participation rate are those with the educational attainment of bachelor's degree or higher, with 84.0% or 990 individuals in the labor force. Within the labor force, individuals with less than high school education have the highest percentage of unemployment, with 9.6% or 33 of them being unemployed.
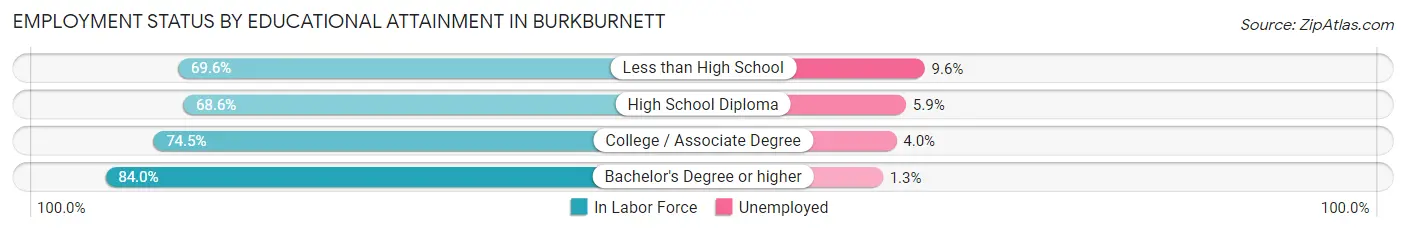
| Educational Attainment | In Labor Force | Unemployed |
| Less than High School | 345 (69.6%) | 48 (9.6%) |
| High School Diploma | 1,535 (68.6%) | 132 (5.9%) |
| College / Associate Degree | 1,480 (74.5%) | 79 (4.0%) |
| Bachelor's Degree or higher | 990 (84.0%) | 15 (1.3%) |
| Total | 4,347 (73.7%) | 265 (4.5%) |
Employment Occupations by Sex in Burkburnett
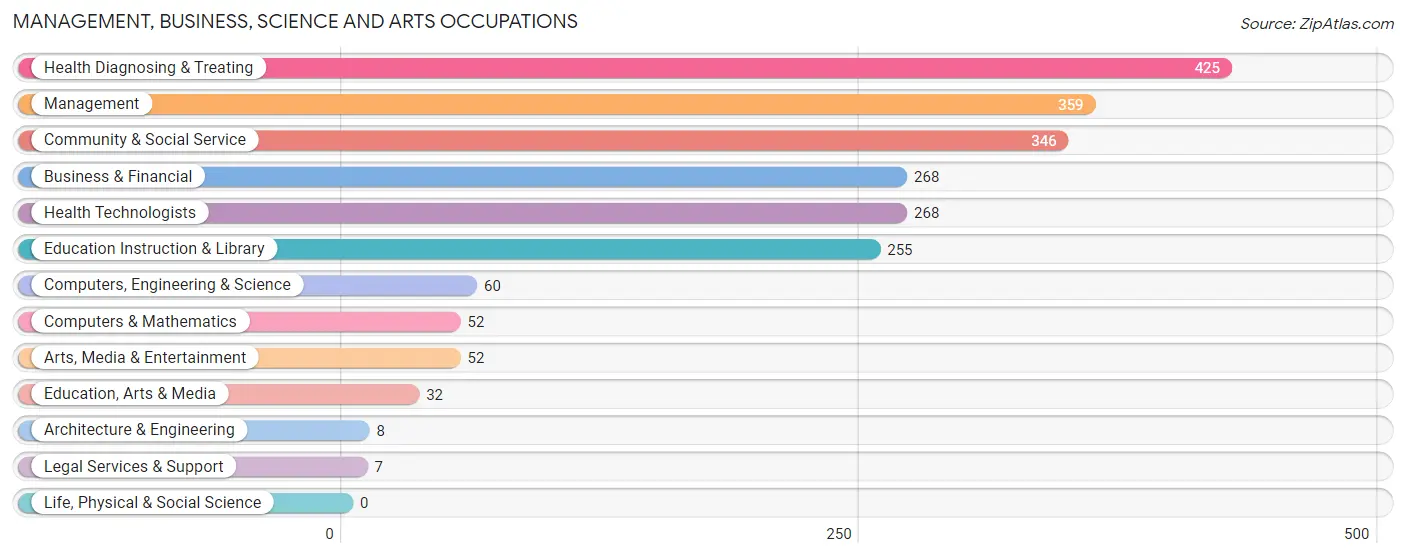
Management, Business, Science and Arts Occupations
The most common Management, Business, Science and Arts occupations in Burkburnett are Health Diagnosing & Treating (425 | 8.4%), Management (359 | 7.1%), Community & Social Service (346 | 6.9%), Business & Financial (268 | 5.3%), and Health Technologists (268 | 5.3%).
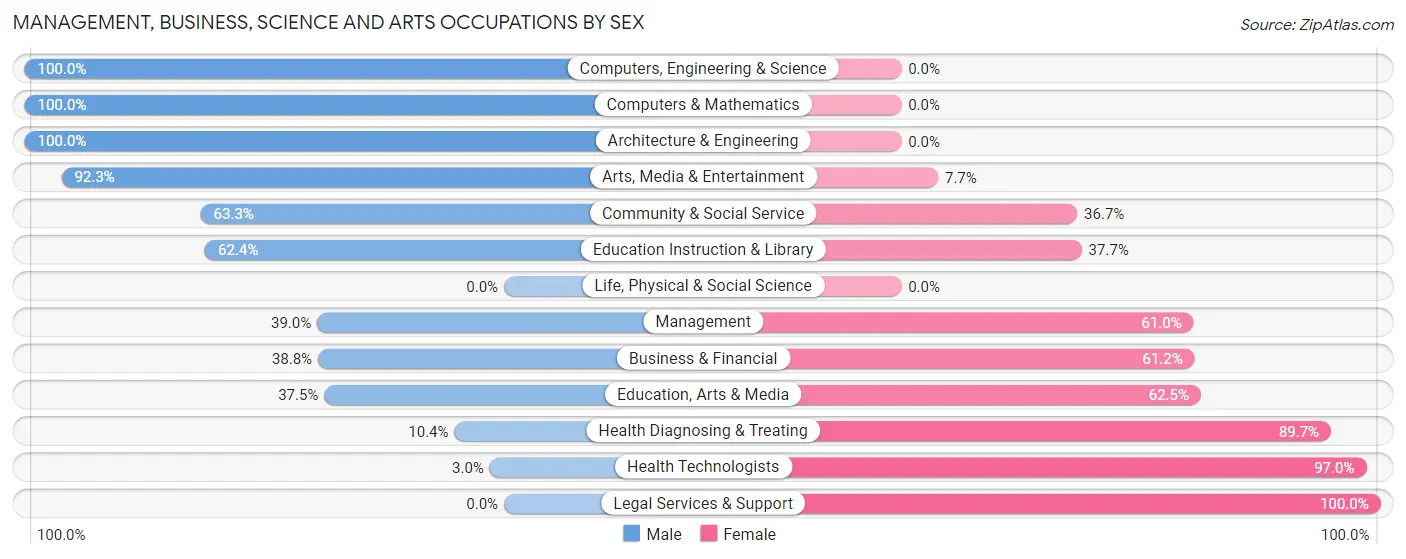
Management, Business, Science and Arts Occupations by Sex
Within the Management, Business, Science and Arts occupations in Burkburnett, the most male-oriented occupations are Computers, Engineering & Science (100.0%), Computers & Mathematics (100.0%), and Architecture & Engineering (100.0%), while the most female-oriented occupations are Legal Services & Support (100.0%), Health Technologists (97.0%), and Health Diagnosing & Treating (89.6%).
| Occupation | Male | Female |
| Management | 140 (39.0%) | 219 (61.0%) |
| Business & Financial | 104 (38.8%) | 164 (61.2%) |
| Computers, Engineering & Science | 60 (100.0%) | 0 (0.0%) |
| Computers & Mathematics | 52 (100.0%) | 0 (0.0%) |
| Architecture & Engineering | 8 (100.0%) | 0 (0.0%) |
| Life, Physical & Social Science | 0 (0.0%) | 0 (0.0%) |
| Community & Social Service | 219 (63.3%) | 127 (36.7%) |
| Education, Arts & Media | 12 (37.5%) | 20 (62.5%) |
| Legal Services & Support | 0 (0.0%) | 7 (100.0%) |
| Education Instruction & Library | 159 (62.4%) | 96 (37.7%) |
| Arts, Media & Entertainment | 48 (92.3%) | 4 (7.7%) |
| Health Diagnosing & Treating | 44 (10.3%) | 381 (89.6%) |
| Health Technologists | 8 (3.0%) | 260 (97.0%) |
| Total (Category) | 567 (38.9%) | 891 (61.1%) |
| Total (Overall) | 2,532 (50.2%) | 2,509 (49.8%) |
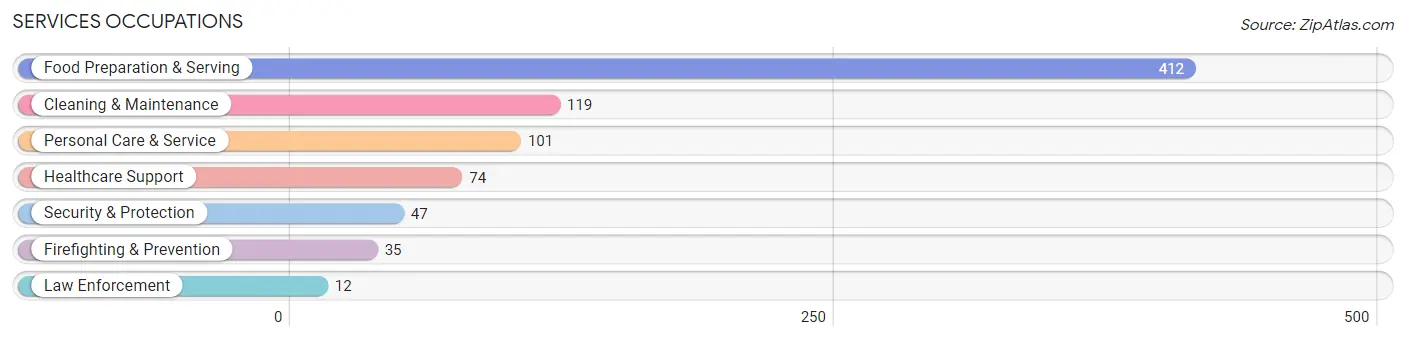
Services Occupations
The most common Services occupations in Burkburnett are Food Preparation & Serving (412 | 8.2%), Cleaning & Maintenance (119 | 2.4%), Personal Care & Service (101 | 2.0%), Healthcare Support (74 | 1.5%), and Security & Protection (47 | 0.9%).
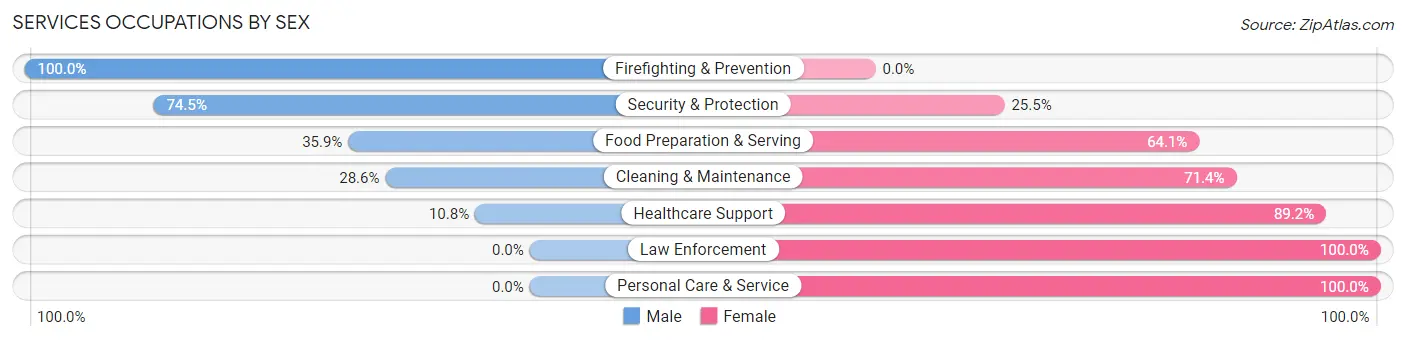
Services Occupations by Sex
Within the Services occupations in Burkburnett, the most male-oriented occupations are Firefighting & Prevention (100.0%), Security & Protection (74.5%), and Food Preparation & Serving (35.9%), while the most female-oriented occupations are Law Enforcement (100.0%), Personal Care & Service (100.0%), and Healthcare Support (89.2%).
| Occupation | Male | Female |
| Healthcare Support | 8 (10.8%) | 66 (89.2%) |
| Security & Protection | 35 (74.5%) | 12 (25.5%) |
| Firefighting & Prevention | 35 (100.0%) | 0 (0.0%) |
| Law Enforcement | 0 (0.0%) | 12 (100.0%) |
| Food Preparation & Serving | 148 (35.9%) | 264 (64.1%) |
| Cleaning & Maintenance | 34 (28.6%) | 85 (71.4%) |
| Personal Care & Service | 0 (0.0%) | 101 (100.0%) |
| Total (Category) | 225 (29.9%) | 528 (70.1%) |
| Total (Overall) | 2,532 (50.2%) | 2,509 (49.8%) |
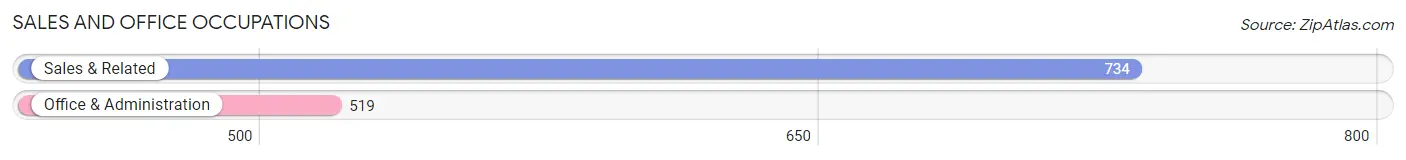
Sales and Office Occupations
The most common Sales and Office occupations in Burkburnett are Sales & Related (734 | 14.6%), and Office & Administration (519 | 10.3%).
Sales and Office Occupations by Sex
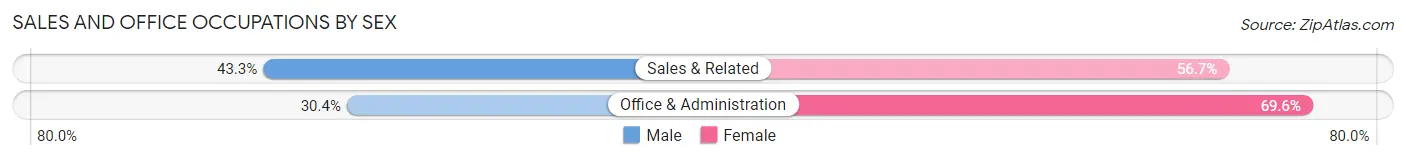
| Occupation | Male | Female |
| Sales & Related | 318 (43.3%) | 416 (56.7%) |
| Office & Administration | 158 (30.4%) | 361 (69.6%) |
| Total (Category) | 476 (38.0%) | 777 (62.0%) |
| Total (Overall) | 2,532 (50.2%) | 2,509 (49.8%) |
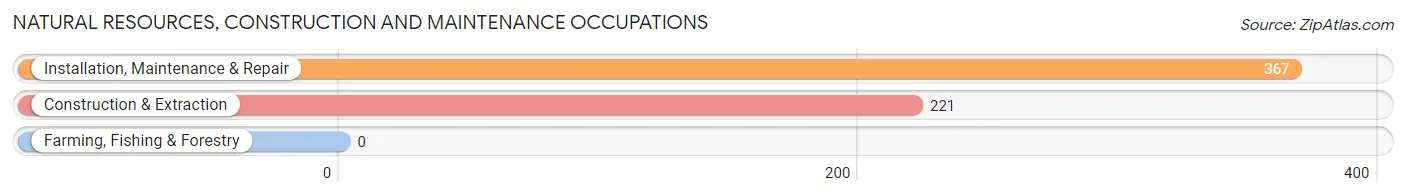
Natural Resources, Construction and Maintenance Occupations
The most common Natural Resources, Construction and Maintenance occupations in Burkburnett are Installation, Maintenance & Repair (367 | 7.3%), and Construction & Extraction (221 | 4.4%).
Natural Resources, Construction and Maintenance Occupations by Sex
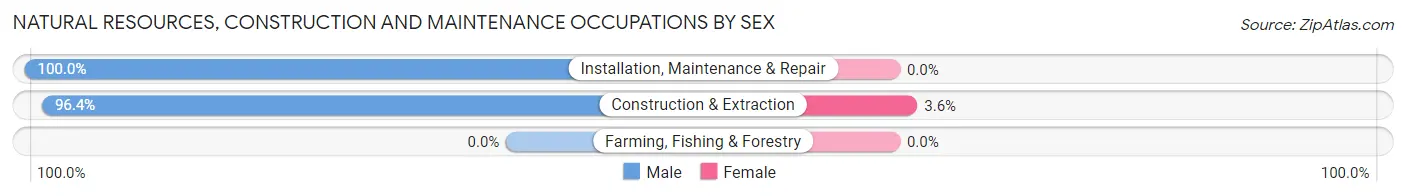
| Occupation | Male | Female |
| Farming, Fishing & Forestry | 0 (0.0%) | 0 (0.0%) |
| Construction & Extraction | 213 (96.4%) | 8 (3.6%) |
| Installation, Maintenance & Repair | 367 (100.0%) | 0 (0.0%) |
| Total (Category) | 580 (98.6%) | 8 (1.4%) |
| Total (Overall) | 2,532 (50.2%) | 2,509 (49.8%) |
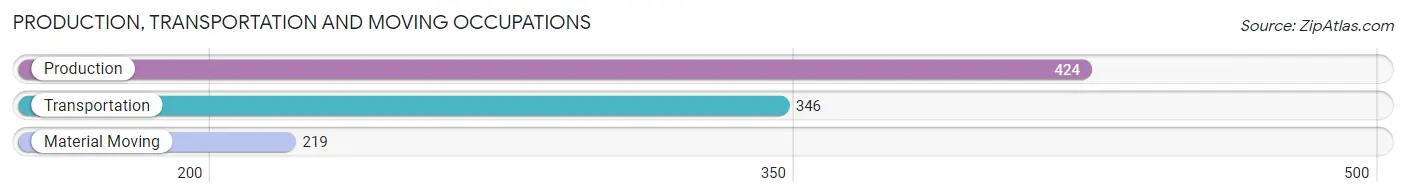
Production, Transportation and Moving Occupations
The most common Production, Transportation and Moving occupations in Burkburnett are Production (424 | 8.4%), Transportation (346 | 6.9%), and Material Moving (219 | 4.3%).
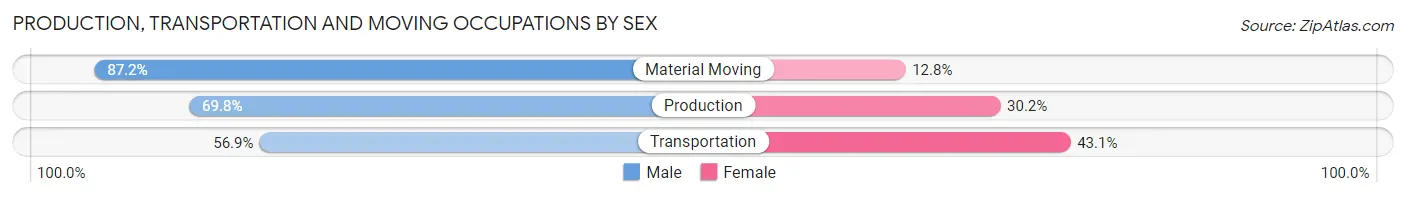
Production, Transportation and Moving Occupations by Sex
| Occupation | Male | Female |
| Production | 296 (69.8%) | 128 (30.2%) |
| Transportation | 197 (56.9%) | 149 (43.1%) |
| Material Moving | 191 (87.2%) | 28 (12.8%) |
| Total (Category) | 684 (69.2%) | 305 (30.8%) |
| Total (Overall) | 2,532 (50.2%) | 2,509 (49.8%) |
Employment Industries by Sex in Burkburnett
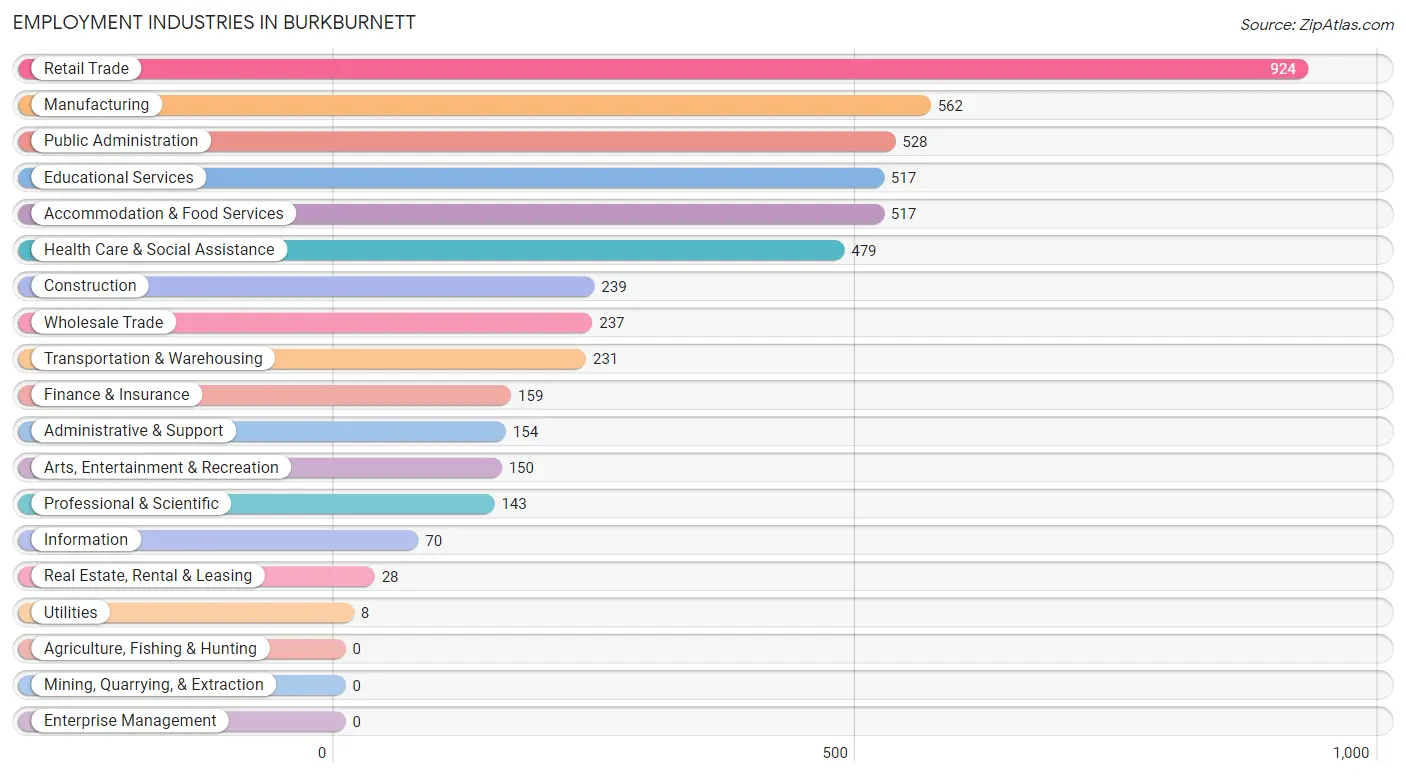
Employment Industries in Burkburnett
The major employment industries in Burkburnett include Retail Trade (924 | 18.3%), Manufacturing (562 | 11.2%), Public Administration (528 | 10.5%), Educational Services (517 | 10.3%), and Accommodation & Food Services (517 | 10.3%).
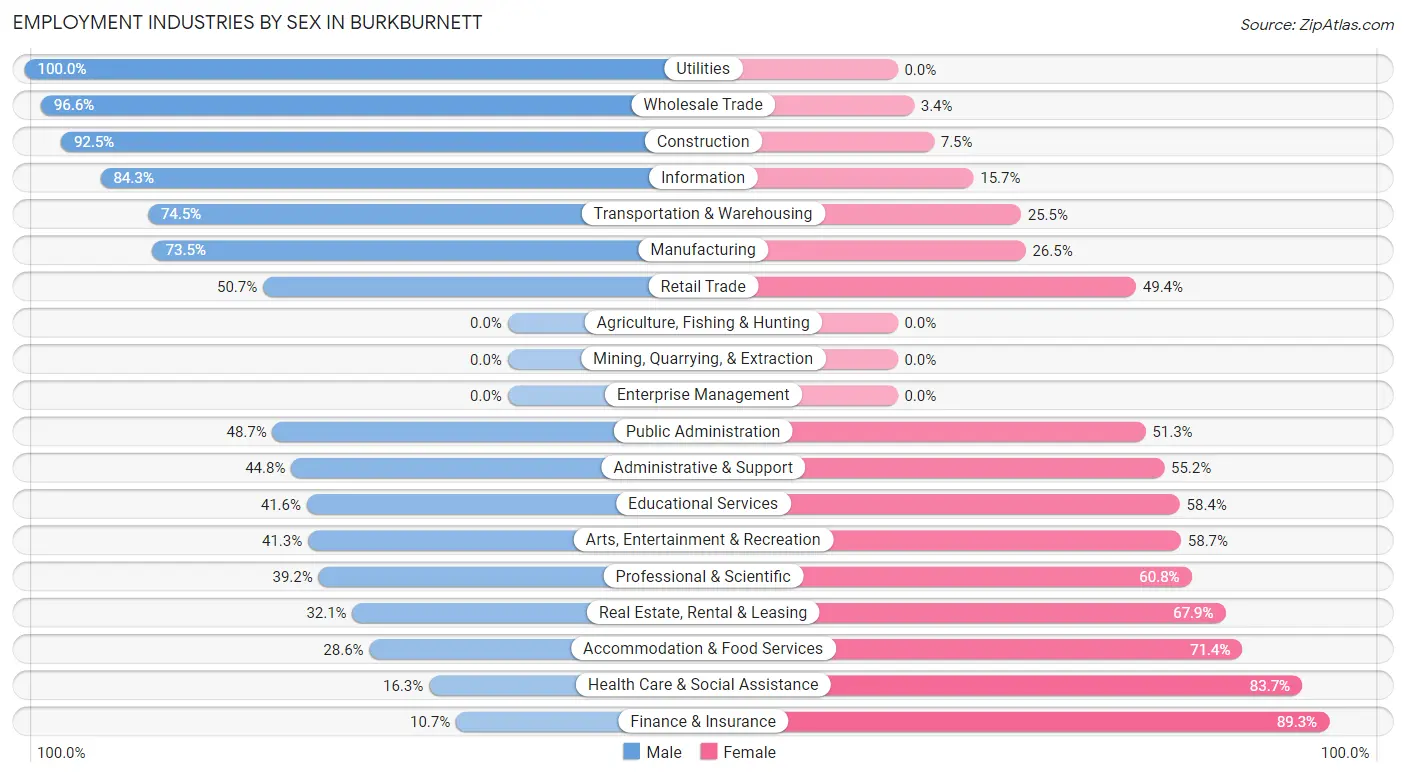
Employment Industries by Sex in Burkburnett
The Burkburnett industries that see more men than women are Utilities (100.0%), Wholesale Trade (96.6%), and Construction (92.5%), whereas the industries that tend to have a higher number of women are Finance & Insurance (89.3%), Health Care & Social Assistance (83.7%), and Accommodation & Food Services (71.4%).
| Industry | Male | Female |
| Agriculture, Fishing & Hunting | 0 (0.0%) | 0 (0.0%) |
| Mining, Quarrying, & Extraction | 0 (0.0%) | 0 (0.0%) |
| Construction | 221 (92.5%) | 18 (7.5%) |
| Manufacturing | 413 (73.5%) | 149 (26.5%) |
| Wholesale Trade | 229 (96.6%) | 8 (3.4%) |
| Retail Trade | 468 (50.6%) | 456 (49.3%) |
| Transportation & Warehousing | 172 (74.5%) | 59 (25.5%) |
| Utilities | 8 (100.0%) | 0 (0.0%) |
| Information | 59 (84.3%) | 11 (15.7%) |
| Finance & Insurance | 17 (10.7%) | 142 (89.3%) |
| Real Estate, Rental & Leasing | 9 (32.1%) | 19 (67.9%) |
| Professional & Scientific | 56 (39.2%) | 87 (60.8%) |
| Enterprise Management | 0 (0.0%) | 0 (0.0%) |
| Administrative & Support | 69 (44.8%) | 85 (55.2%) |
| Educational Services | 215 (41.6%) | 302 (58.4%) |
| Health Care & Social Assistance | 78 (16.3%) | 401 (83.7%) |
| Arts, Entertainment & Recreation | 62 (41.3%) | 88 (58.7%) |
| Accommodation & Food Services | 148 (28.6%) | 369 (71.4%) |
| Public Administration | 257 (48.7%) | 271 (51.3%) |
| Total | 2,532 (50.2%) | 2,509 (49.8%) |
Education in Burkburnett
School Enrollment in Burkburnett
The most common levels of schooling among the 2,196 students in Burkburnett are high school (663 | 30.2%), elementary school (458 | 20.9%), and middle school (397 | 18.1%).
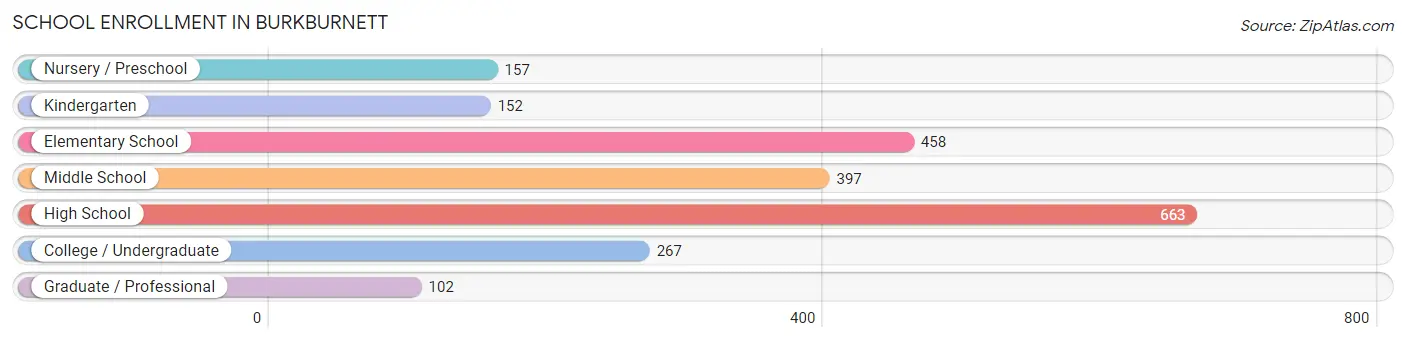
| School Level | # Students | % Students |
| Nursery / Preschool | 157 | 7.1% |
| Kindergarten | 152 | 6.9% |
| Elementary School | 458 | 20.9% |
| Middle School | 397 | 18.1% |
| High School | 663 | 30.2% |
| College / Undergraduate | 267 | 12.2% |
| Graduate / Professional | 102 | 4.6% |
| Total | 2,196 | 100.0% |
School Enrollment by Age by Funding Source in Burkburnett
Out of a total of 2,196 students who are enrolled in schools in Burkburnett, 235 (10.7%) attend a private institution, while the remaining 1,961 (89.3%) are enrolled in public schools. The age group of 3 to 4 year olds has the highest likelihood of being enrolled in private schools, with 51 (39.5% in the age bracket) enrolled. Conversely, the age group of 5 to 9 year old has the lowest likelihood of being enrolled in a private school, with 539 (100.0% in the age bracket) attending a public institution.
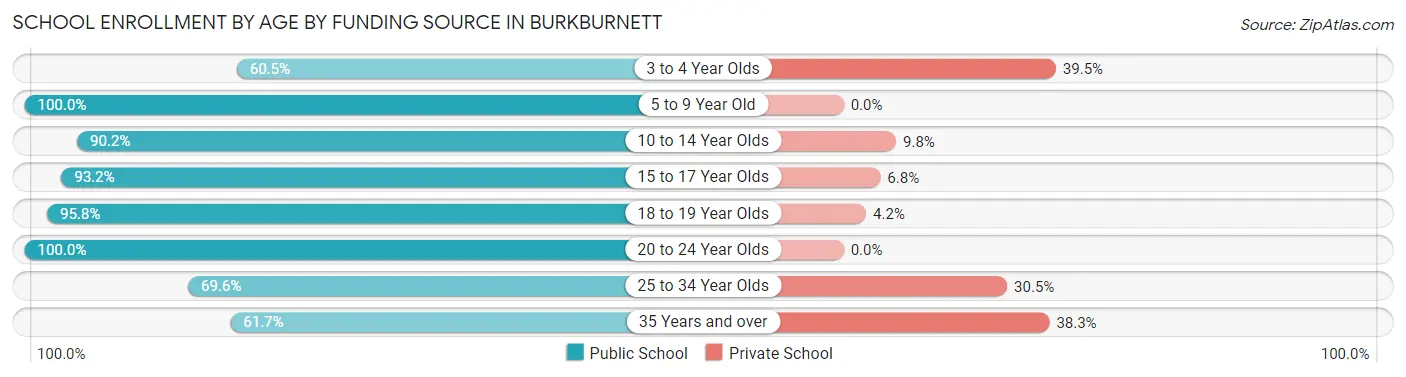
| Age Bracket | Public School | Private School |
| 3 to 4 Year Olds | 78 (60.5%) | 51 (39.5%) |
| 5 to 9 Year Old | 539 (100.0%) | 0 (0.0%) |
| 10 to 14 Year Olds | 517 (90.2%) | 56 (9.8%) |
| 15 to 17 Year Olds | 436 (93.2%) | 32 (6.8%) |
| 18 to 19 Year Olds | 160 (95.8%) | 7 (4.2%) |
| 20 to 24 Year Olds | 40 (100.0%) | 0 (0.0%) |
| 25 to 34 Year Olds | 153 (69.6%) | 67 (30.4%) |
| 35 Years and over | 37 (61.7%) | 23 (38.3%) |
| Total | 1,961 (89.3%) | 235 (10.7%) |
Educational Attainment by Field of Study in Burkburnett
Business (375 | 22.2%), education (322 | 19.1%), arts & humanities (237 | 14.0%), psychology (216 | 12.8%), and visual & performing arts (123 | 7.3%) are the most common fields of study among 1,689 individuals in Burkburnett who have obtained a bachelor's degree or higher.
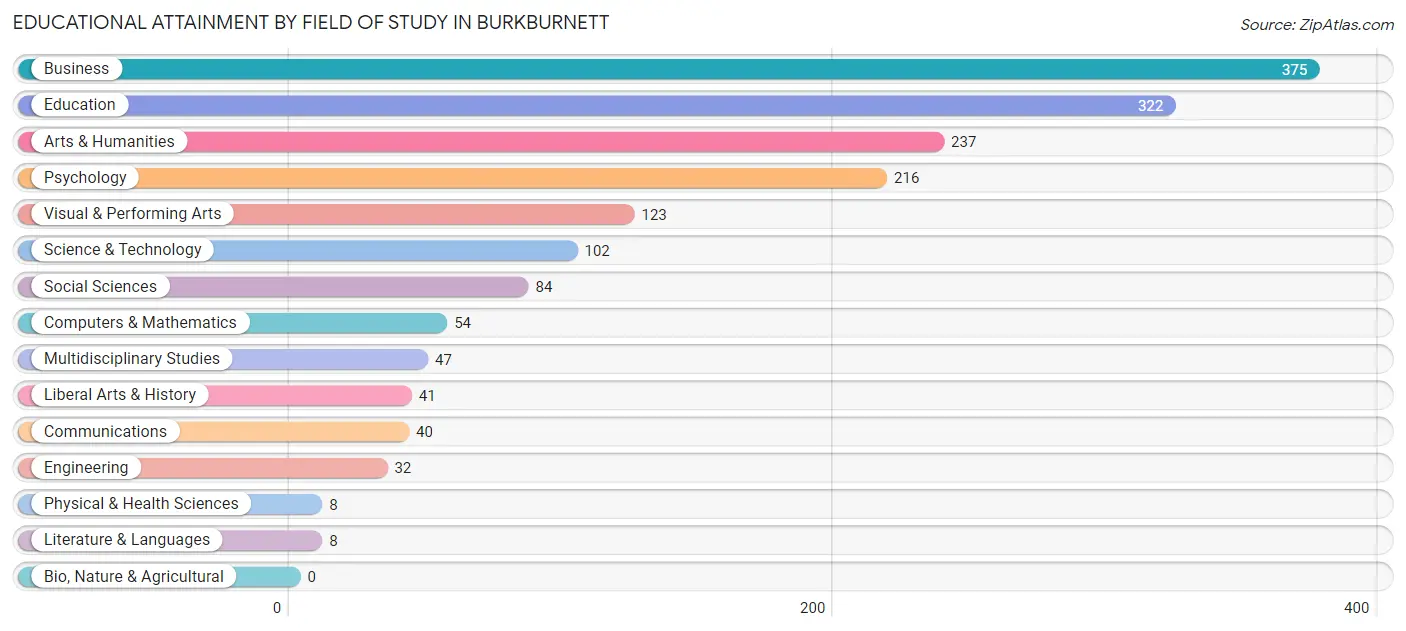
| Field of Study | # Graduates | % Graduates |
| Computers & Mathematics | 54 | 3.2% |
| Bio, Nature & Agricultural | 0 | 0.0% |
| Physical & Health Sciences | 8 | 0.5% |
| Psychology | 216 | 12.8% |
| Social Sciences | 84 | 5.0% |
| Engineering | 32 | 1.9% |
| Multidisciplinary Studies | 47 | 2.8% |
| Science & Technology | 102 | 6.0% |
| Business | 375 | 22.2% |
| Education | 322 | 19.1% |
| Literature & Languages | 8 | 0.5% |
| Liberal Arts & History | 41 | 2.4% |
| Visual & Performing Arts | 123 | 7.3% |
| Communications | 40 | 2.4% |
| Arts & Humanities | 237 | 14.0% |
| Total | 1,689 | 100.0% |
Transportation & Commute in Burkburnett
Vehicle Availability by Sex in Burkburnett
The most prevalent vehicle ownership categories in Burkburnett are males with 2 vehicles (1,205, accounting for 44.9%) and females with 2 vehicles (689, making up 49.7%).
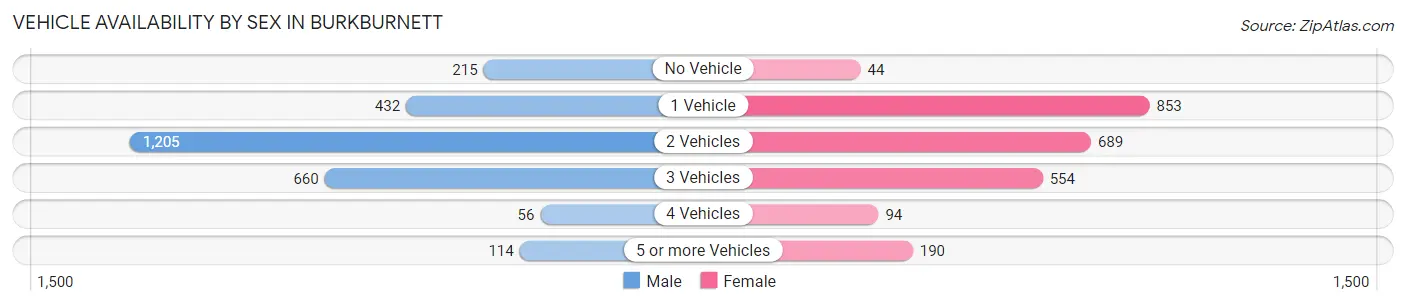
| Vehicles Available | Male | Female |
| No Vehicle | 215 (8.0%) | 44 (1.8%) |
| 1 Vehicle | 432 (16.1%) | 853 (35.2%) |
| 2 Vehicles | 1,205 (44.9%) | 689 (28.4%) |
| 3 Vehicles | 660 (24.6%) | 554 (22.9%) |
| 4 Vehicles | 56 (2.1%) | 94 (3.9%) |
| 5 or more Vehicles | 114 (4.3%) | 190 (7.8%) |
| Total | 2,682 (100.0%) | 2,424 (100.0%) |
Commute Time in Burkburnett
The most frequently occuring commute durations in Burkburnett are 20 to 24 minutes (1,126 commuters, 22.6%), 15 to 19 minutes (940 commuters, 18.9%), and 5 to 9 minutes (927 commuters, 18.6%).
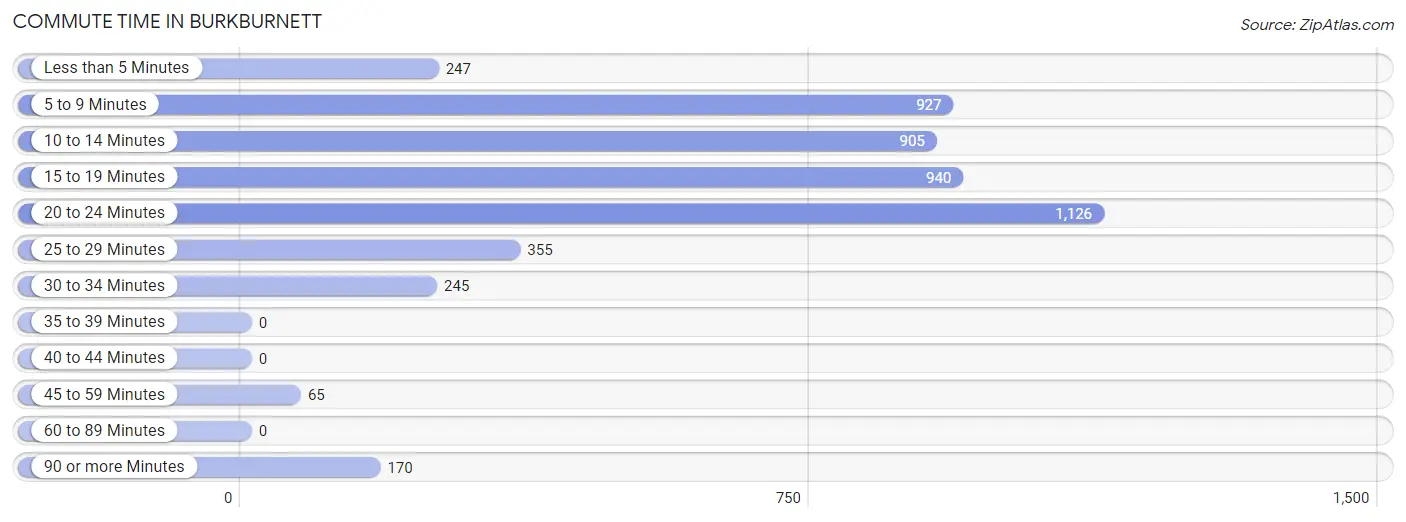
| Commute Time | # Commuters | % Commuters |
| Less than 5 Minutes | 247 | 5.0% |
| 5 to 9 Minutes | 927 | 18.6% |
| 10 to 14 Minutes | 905 | 18.2% |
| 15 to 19 Minutes | 940 | 18.9% |
| 20 to 24 Minutes | 1,126 | 22.6% |
| 25 to 29 Minutes | 355 | 7.1% |
| 30 to 34 Minutes | 245 | 4.9% |
| 35 to 39 Minutes | 0 | 0.0% |
| 40 to 44 Minutes | 0 | 0.0% |
| 45 to 59 Minutes | 65 | 1.3% |
| 60 to 89 Minutes | 0 | 0.0% |
| 90 or more Minutes | 170 | 3.4% |
Commute Time by Sex in Burkburnett
The most common commute times in Burkburnett are 15 to 19 minutes (619 commuters, 23.6%) for males and 20 to 24 minutes (582 commuters, 24.7%) for females.
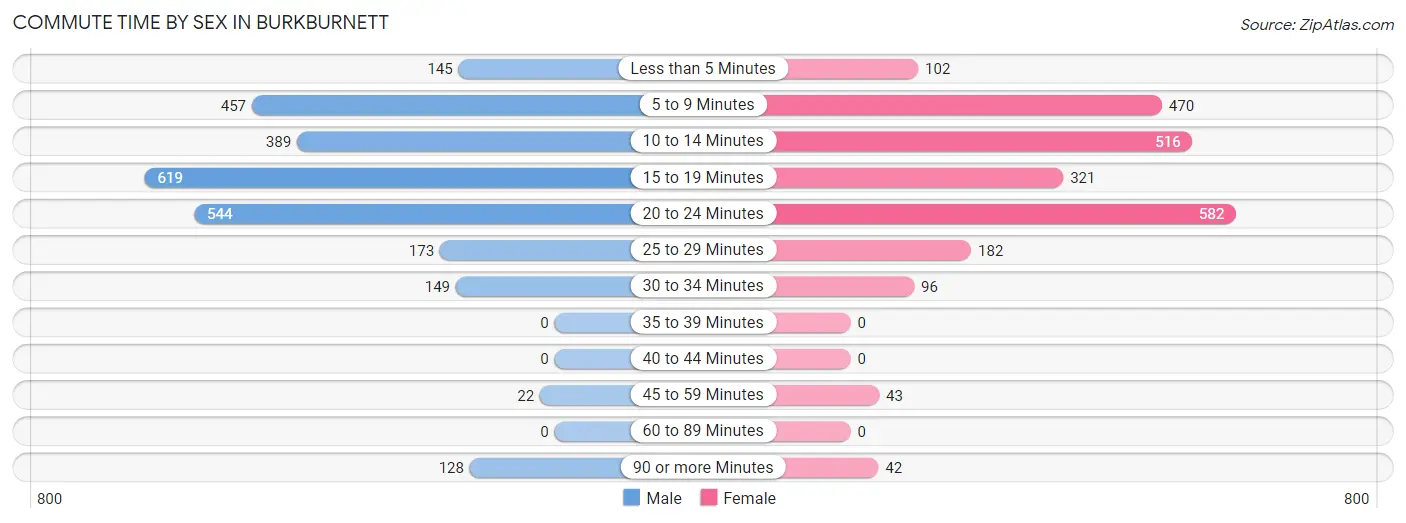
| Commute Time | Male | Female |
| Less than 5 Minutes | 145 (5.5%) | 102 (4.3%) |
| 5 to 9 Minutes | 457 (17.4%) | 470 (20.0%) |
| 10 to 14 Minutes | 389 (14.8%) | 516 (21.9%) |
| 15 to 19 Minutes | 619 (23.6%) | 321 (13.6%) |
| 20 to 24 Minutes | 544 (20.7%) | 582 (24.7%) |
| 25 to 29 Minutes | 173 (6.6%) | 182 (7.7%) |
| 30 to 34 Minutes | 149 (5.7%) | 96 (4.1%) |
| 35 to 39 Minutes | 0 (0.0%) | 0 (0.0%) |
| 40 to 44 Minutes | 0 (0.0%) | 0 (0.0%) |
| 45 to 59 Minutes | 22 (0.8%) | 43 (1.8%) |
| 60 to 89 Minutes | 0 (0.0%) | 0 (0.0%) |
| 90 or more Minutes | 128 (4.9%) | 42 (1.8%) |
Time of Departure to Work by Sex in Burkburnett
The most frequent times of departure to work in Burkburnett are 6:30 AM to 6:59 AM (438, 16.7%) for males and 7:00 AM to 7:29 AM (495, 21.0%) for females.
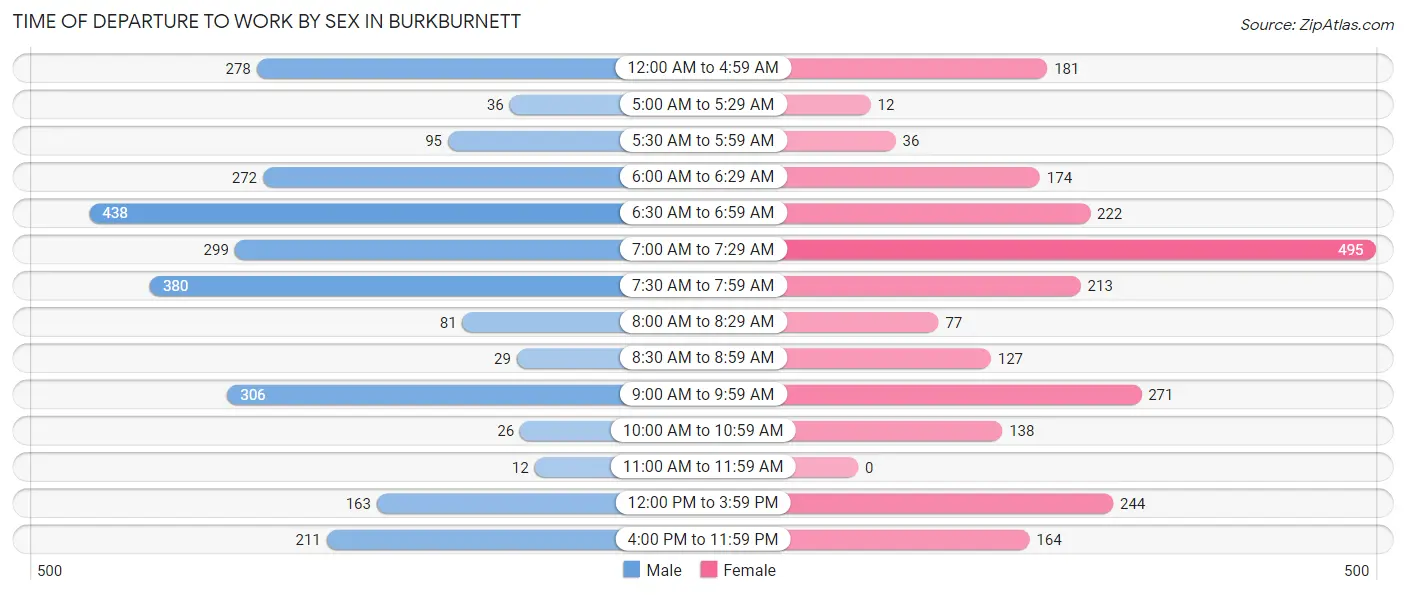
| Time of Departure | Male | Female |
| 12:00 AM to 4:59 AM | 278 (10.6%) | 181 (7.7%) |
| 5:00 AM to 5:29 AM | 36 (1.4%) | 12 (0.5%) |
| 5:30 AM to 5:59 AM | 95 (3.6%) | 36 (1.5%) |
| 6:00 AM to 6:29 AM | 272 (10.4%) | 174 (7.4%) |
| 6:30 AM to 6:59 AM | 438 (16.7%) | 222 (9.4%) |
| 7:00 AM to 7:29 AM | 299 (11.4%) | 495 (21.0%) |
| 7:30 AM to 7:59 AM | 380 (14.5%) | 213 (9.0%) |
| 8:00 AM to 8:29 AM | 81 (3.1%) | 77 (3.3%) |
| 8:30 AM to 8:59 AM | 29 (1.1%) | 127 (5.4%) |
| 9:00 AM to 9:59 AM | 306 (11.7%) | 271 (11.5%) |
| 10:00 AM to 10:59 AM | 26 (1.0%) | 138 (5.9%) |
| 11:00 AM to 11:59 AM | 12 (0.5%) | 0 (0.0%) |
| 12:00 PM to 3:59 PM | 163 (6.2%) | 244 (10.4%) |
| 4:00 PM to 11:59 PM | 211 (8.0%) | 164 (7.0%) |
| Total | 2,626 (100.0%) | 2,354 (100.0%) |
Housing Occupancy in Burkburnett
Occupancy by Ownership in Burkburnett
Of the total 4,462 dwellings in Burkburnett, owner-occupied units account for 2,819 (63.2%), while renter-occupied units make up 1,643 (36.8%).
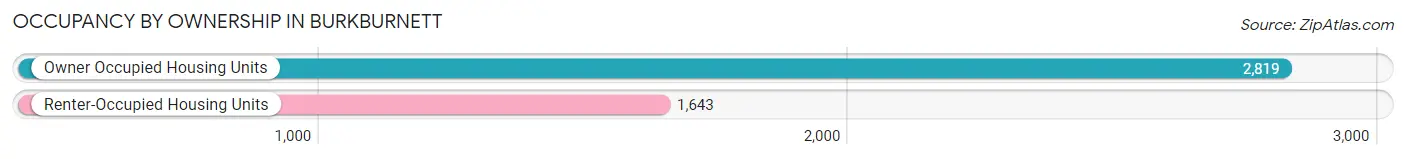
| Occupancy | # Housing Units | % Housing Units |
| Owner Occupied Housing Units | 2,819 | 63.2% |
| Renter-Occupied Housing Units | 1,643 | 36.8% |
| Total Occupied Housing Units | 4,462 | 100.0% |
Occupancy by Household Size in Burkburnett
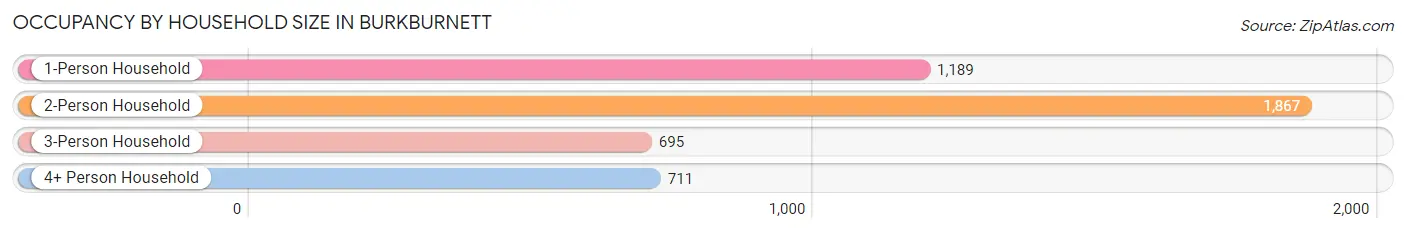
| Household Size | # Housing Units | % Housing Units |
| 1-Person Household | 1,189 | 26.7% |
| 2-Person Household | 1,867 | 41.8% |
| 3-Person Household | 695 | 15.6% |
| 4+ Person Household | 711 | 15.9% |
| Total Housing Units | 4,462 | 100.0% |
Occupancy by Ownership by Household Size in Burkburnett
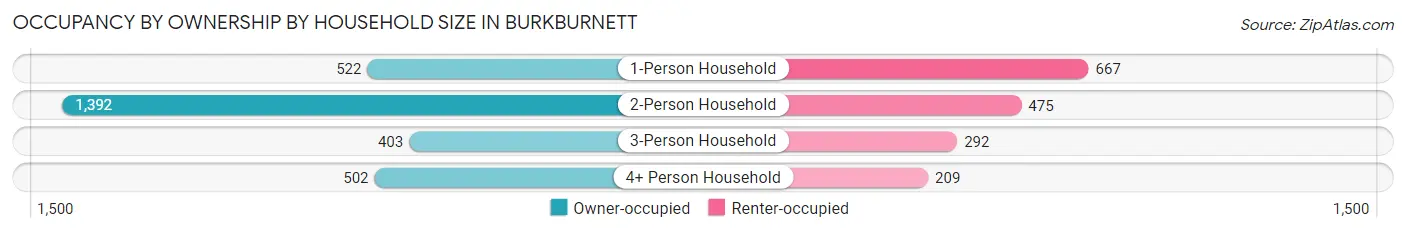
| Household Size | Owner-occupied | Renter-occupied |
| 1-Person Household | 522 (43.9%) | 667 (56.1%) |
| 2-Person Household | 1,392 (74.6%) | 475 (25.4%) |
| 3-Person Household | 403 (58.0%) | 292 (42.0%) |
| 4+ Person Household | 502 (70.6%) | 209 (29.4%) |
| Total Housing Units | 2,819 (63.2%) | 1,643 (36.8%) |
Occupancy by Educational Attainment in Burkburnett
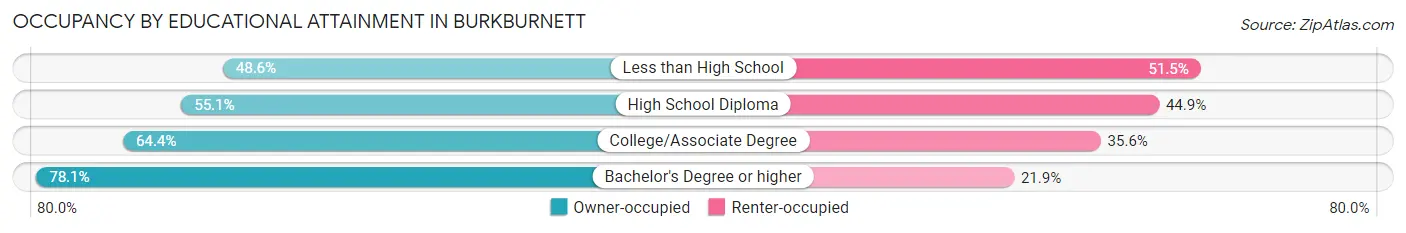
| Household Size | Owner-occupied | Renter-occupied |
| Less than High School | 235 (48.5%) | 249 (51.4%) |
| High School Diploma | 713 (55.1%) | 580 (44.9%) |
| College/Associate Degree | 1,063 (64.4%) | 588 (35.6%) |
| Bachelor's Degree or higher | 808 (78.1%) | 226 (21.9%) |
Occupancy by Age of Householder in Burkburnett
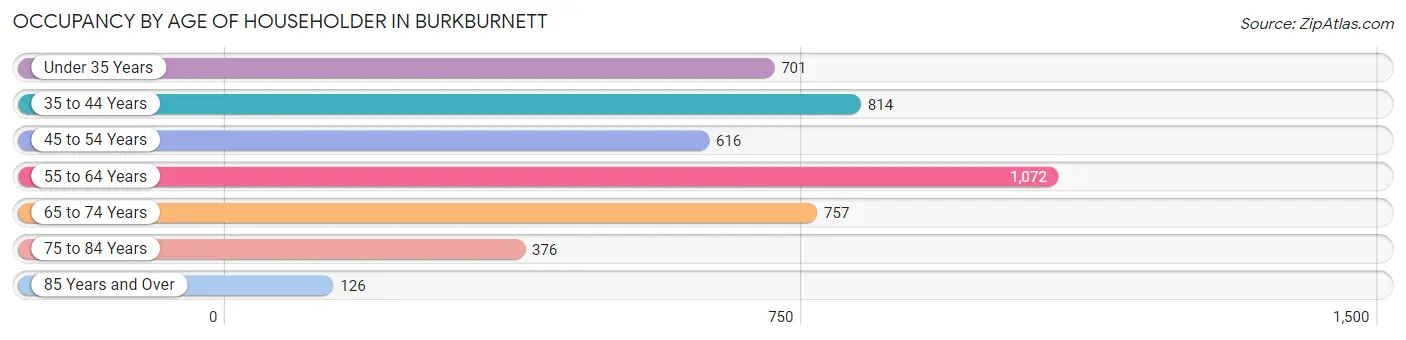
| Age Bracket | # Households | % Households |
| Under 35 Years | 701 | 15.7% |
| 35 to 44 Years | 814 | 18.2% |
| 45 to 54 Years | 616 | 13.8% |
| 55 to 64 Years | 1,072 | 24.0% |
| 65 to 74 Years | 757 | 17.0% |
| 75 to 84 Years | 376 | 8.4% |
| 85 Years and Over | 126 | 2.8% |
| Total | 4,462 | 100.0% |
Housing Finances in Burkburnett
Median Income by Occupancy in Burkburnett
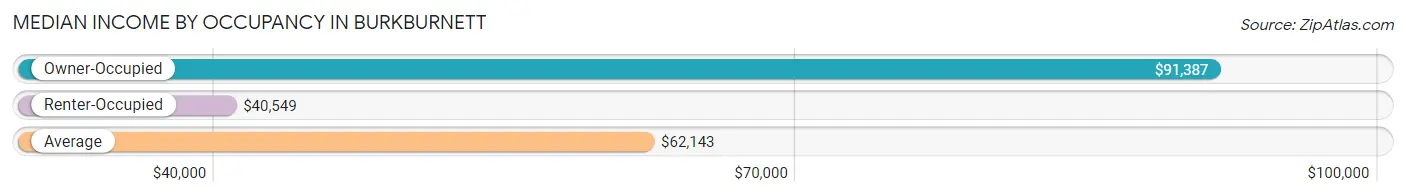
| Occupancy Type | # Households | Median Income |
| Owner-Occupied | 2,819 (63.2%) | $91,387 |
| Renter-Occupied | 1,643 (36.8%) | $40,549 |
| Average | 4,462 (100.0%) | $62,143 |
Occupancy by Householder Income Bracket in Burkburnett
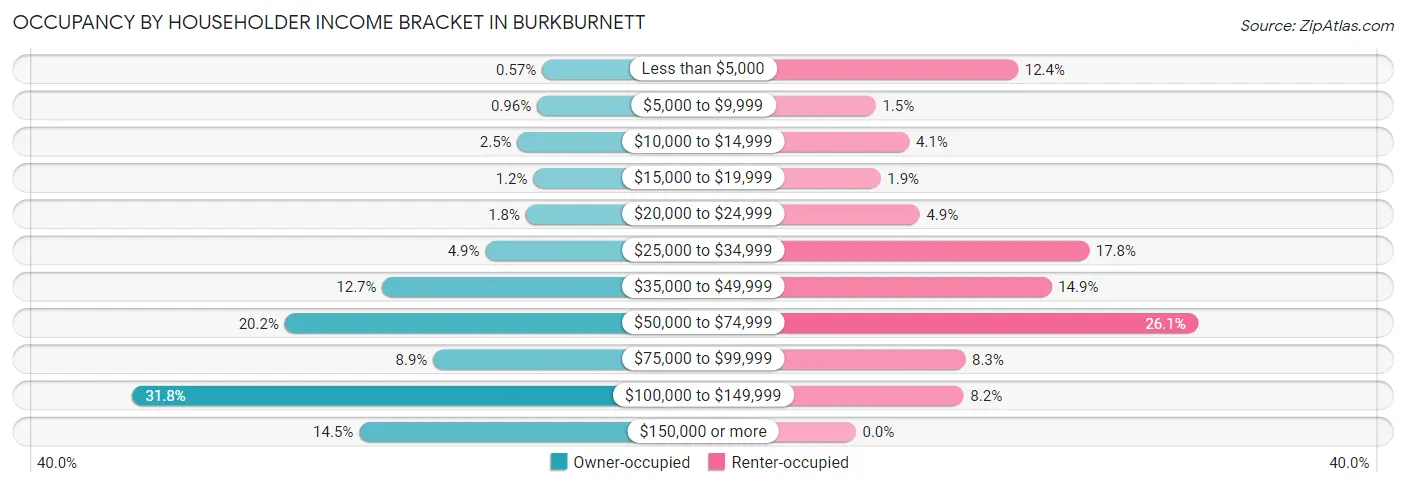
| Income Bracket | Owner-occupied | Renter-occupied |
| Less than $5,000 | 16 (0.6%) | 203 (12.4%) |
| $5,000 to $9,999 | 27 (1.0%) | 25 (1.5%) |
| $10,000 to $14,999 | 69 (2.5%) | 67 (4.1%) |
| $15,000 to $19,999 | 35 (1.2%) | 31 (1.9%) |
| $20,000 to $24,999 | 51 (1.8%) | 80 (4.9%) |
| $25,000 to $34,999 | 138 (4.9%) | 292 (17.8%) |
| $35,000 to $49,999 | 359 (12.7%) | 245 (14.9%) |
| $50,000 to $74,999 | 569 (20.2%) | 428 (26.1%) |
| $75,000 to $99,999 | 250 (8.9%) | 137 (8.3%) |
| $100,000 to $149,999 | 896 (31.8%) | 135 (8.2%) |
| $150,000 or more | 409 (14.5%) | 0 (0.0%) |
| Total | 2,819 (100.0%) | 1,643 (100.0%) |
Monthly Housing Cost Tiers in Burkburnett
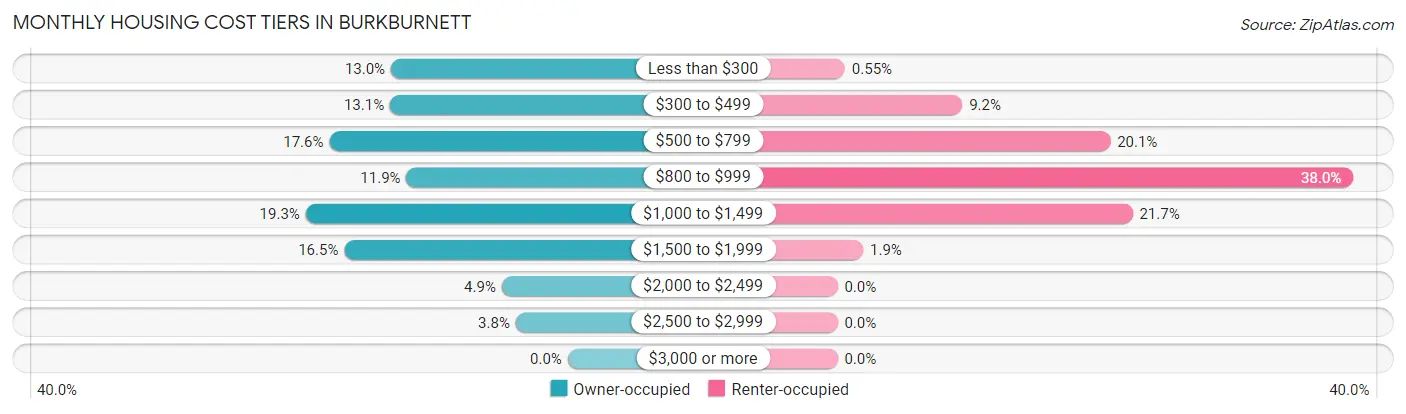
| Monthly Cost | Owner-occupied | Renter-occupied |
| Less than $300 | 367 (13.0%) | 9 (0.5%) |
| $300 to $499 | 369 (13.1%) | 151 (9.2%) |
| $500 to $799 | 495 (17.6%) | 330 (20.1%) |
| $800 to $999 | 335 (11.9%) | 624 (38.0%) |
| $1,000 to $1,499 | 544 (19.3%) | 357 (21.7%) |
| $1,500 to $1,999 | 464 (16.5%) | 31 (1.9%) |
| $2,000 to $2,499 | 137 (4.9%) | 0 (0.0%) |
| $2,500 to $2,999 | 108 (3.8%) | 0 (0.0%) |
| $3,000 or more | 0 (0.0%) | 0 (0.0%) |
| Total | 2,819 (100.0%) | 1,643 (100.0%) |
Physical Housing Characteristics in Burkburnett
Housing Structures in Burkburnett
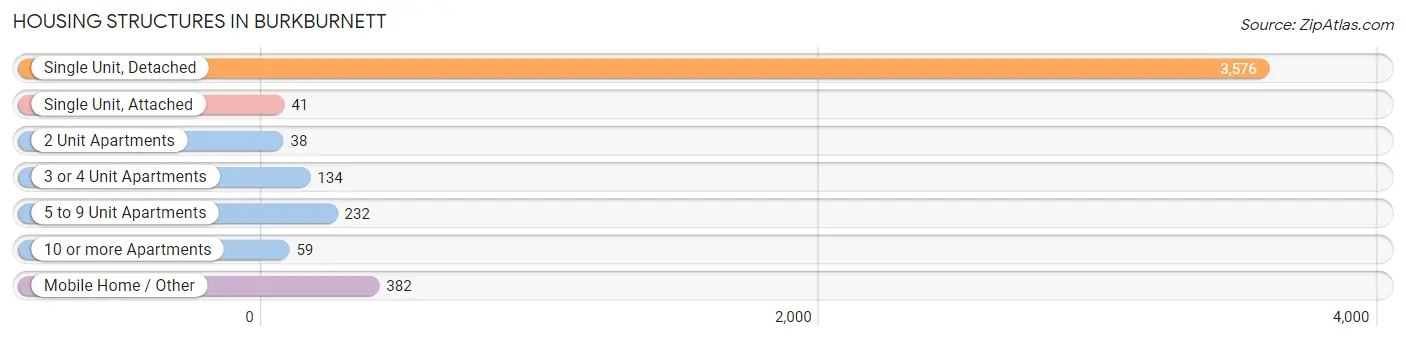
| Structure Type | # Housing Units | % Housing Units |
| Single Unit, Detached | 3,576 | 80.1% |
| Single Unit, Attached | 41 | 0.9% |
| 2 Unit Apartments | 38 | 0.9% |
| 3 or 4 Unit Apartments | 134 | 3.0% |
| 5 to 9 Unit Apartments | 232 | 5.2% |
| 10 or more Apartments | 59 | 1.3% |
| Mobile Home / Other | 382 | 8.6% |
| Total | 4,462 | 100.0% |
Housing Structures by Occupancy in Burkburnett
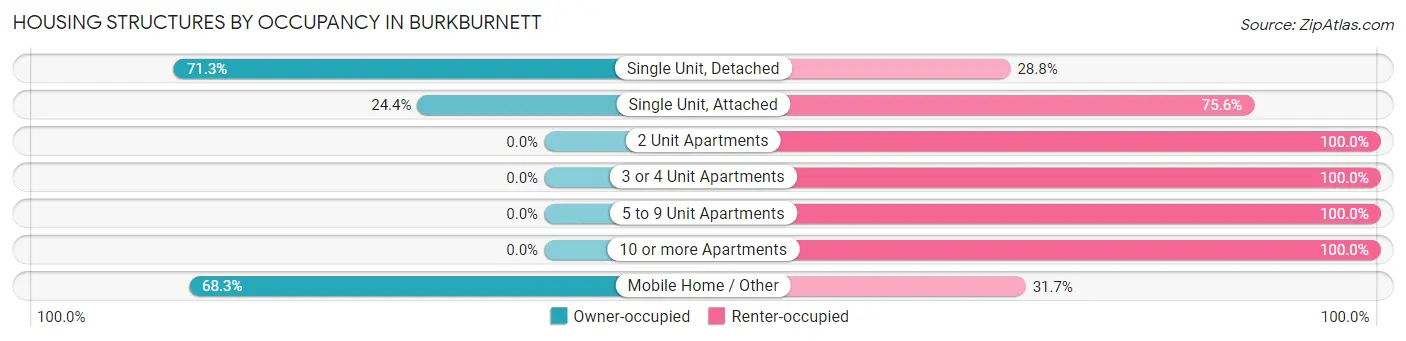
| Structure Type | Owner-occupied | Renter-occupied |
| Single Unit, Detached | 2,548 (71.3%) | 1,028 (28.7%) |
| Single Unit, Attached | 10 (24.4%) | 31 (75.6%) |
| 2 Unit Apartments | 0 (0.0%) | 38 (100.0%) |
| 3 or 4 Unit Apartments | 0 (0.0%) | 134 (100.0%) |
| 5 to 9 Unit Apartments | 0 (0.0%) | 232 (100.0%) |
| 10 or more Apartments | 0 (0.0%) | 59 (100.0%) |
| Mobile Home / Other | 261 (68.3%) | 121 (31.7%) |
| Total | 2,819 (63.2%) | 1,643 (36.8%) |
Housing Structures by Number of Rooms in Burkburnett
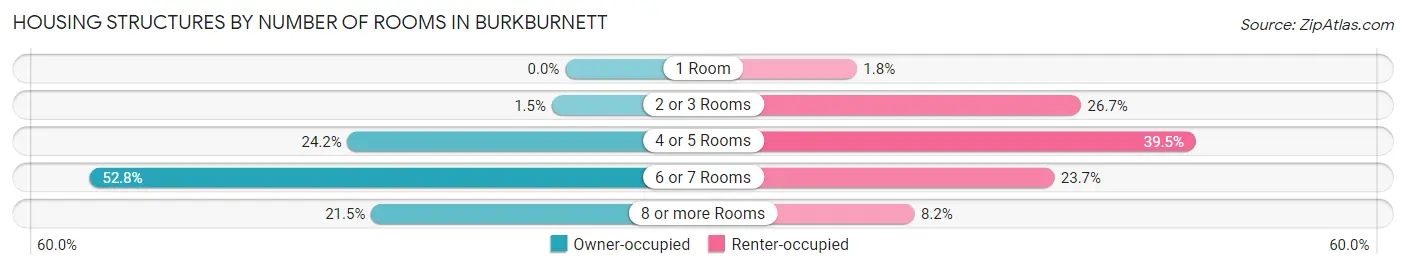
| Number of Rooms | Owner-occupied | Renter-occupied |
| 1 Room | 0 (0.0%) | 30 (1.8%) |
| 2 or 3 Rooms | 42 (1.5%) | 439 (26.7%) |
| 4 or 5 Rooms | 681 (24.2%) | 649 (39.5%) |
| 6 or 7 Rooms | 1,489 (52.8%) | 390 (23.7%) |
| 8 or more Rooms | 607 (21.5%) | 135 (8.2%) |
| Total | 2,819 (100.0%) | 1,643 (100.0%) |
Housing Structure by Heating Type in Burkburnett
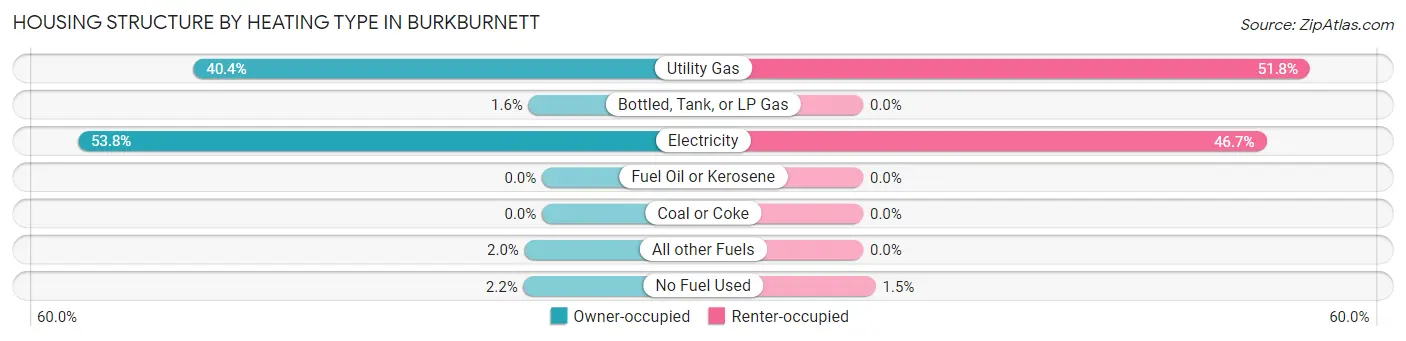
| Heating Type | Owner-occupied | Renter-occupied |
| Utility Gas | 1,140 (40.4%) | 851 (51.8%) |
| Bottled, Tank, or LP Gas | 44 (1.6%) | 0 (0.0%) |
| Electricity | 1,517 (53.8%) | 768 (46.7%) |
| Fuel Oil or Kerosene | 0 (0.0%) | 0 (0.0%) |
| Coal or Coke | 0 (0.0%) | 0 (0.0%) |
| All other Fuels | 57 (2.0%) | 0 (0.0%) |
| No Fuel Used | 61 (2.2%) | 24 (1.5%) |
| Total | 2,819 (100.0%) | 1,643 (100.0%) |
Household Vehicle Usage in Burkburnett
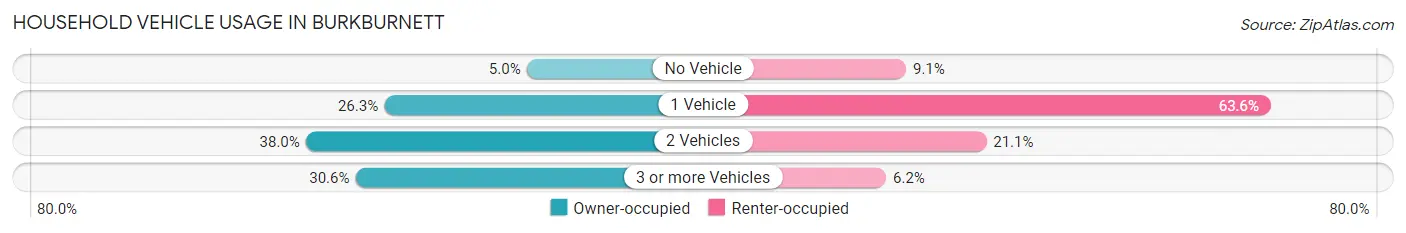
| Vehicles per Household | Owner-occupied | Renter-occupied |
| No Vehicle | 142 (5.0%) | 150 (9.1%) |
| 1 Vehicle | 742 (26.3%) | 1,045 (63.6%) |
| 2 Vehicles | 1,072 (38.0%) | 347 (21.1%) |
| 3 or more Vehicles | 863 (30.6%) | 101 (6.1%) |
| Total | 2,819 (100.0%) | 1,643 (100.0%) |
Real Estate & Mortgages in Burkburnett
Real Estate and Mortgage Overview in Burkburnett
| Characteristic | Without Mortgage | With Mortgage |
| Housing Units | 1,453 | 1,366 |
| Median Property Value | $107,600 | $168,700 |
| Median Household Income | $68,125 | $306 |
| Monthly Housing Costs | $495 | $0 |
| Real Estate Taxes | $1,672 | $186 |
Property Value by Mortgage Status in Burkburnett
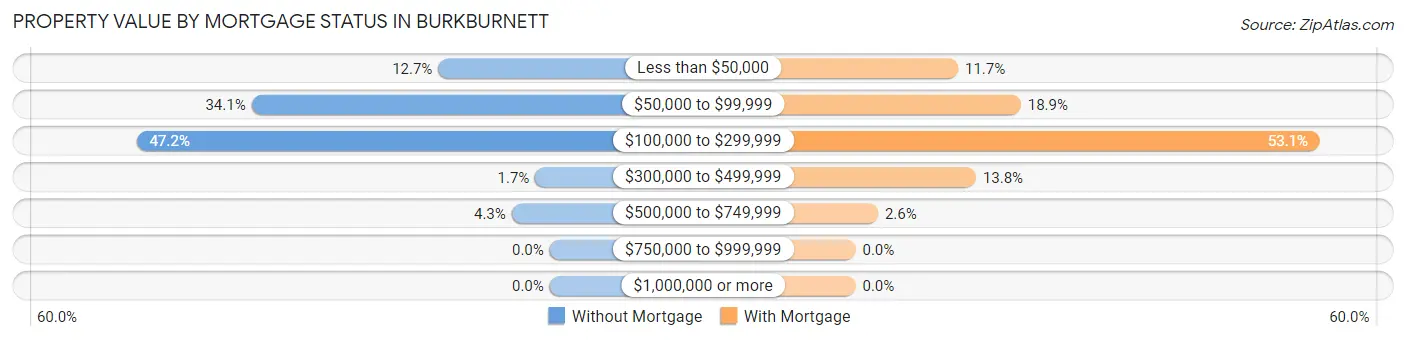
| Property Value | Without Mortgage | With Mortgage |
| Less than $50,000 | 185 (12.7%) | 160 (11.7%) |
| $50,000 to $99,999 | 495 (34.1%) | 258 (18.9%) |
| $100,000 to $299,999 | 686 (47.2%) | 725 (53.1%) |
| $300,000 to $499,999 | 24 (1.7%) | 188 (13.8%) |
| $500,000 to $749,999 | 63 (4.3%) | 35 (2.6%) |
| $750,000 to $999,999 | 0 (0.0%) | 0 (0.0%) |
| $1,000,000 or more | 0 (0.0%) | 0 (0.0%) |
| Total | 1,453 (100.0%) | 1,366 (100.0%) |
Household Income by Mortgage Status in Burkburnett
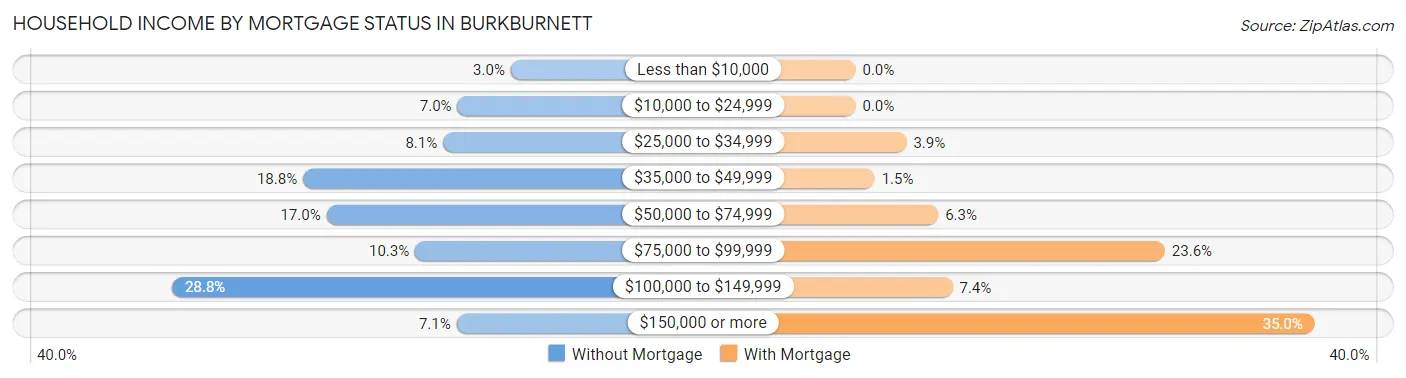
| Household Income | Without Mortgage | With Mortgage |
| Less than $10,000 | 43 (3.0%) | 0 (0.0%) |
| $10,000 to $24,999 | 102 (7.0%) | 0 (0.0%) |
| $25,000 to $34,999 | 118 (8.1%) | 53 (3.9%) |
| $35,000 to $49,999 | 273 (18.8%) | 20 (1.5%) |
| $50,000 to $74,999 | 247 (17.0%) | 86 (6.3%) |
| $75,000 to $99,999 | 149 (10.2%) | 322 (23.6%) |
| $100,000 to $149,999 | 418 (28.8%) | 101 (7.4%) |
| $150,000 or more | 103 (7.1%) | 478 (35.0%) |
| Total | 1,453 (100.0%) | 1,366 (100.0%) |
Property Value to Household Income Ratio in Burkburnett
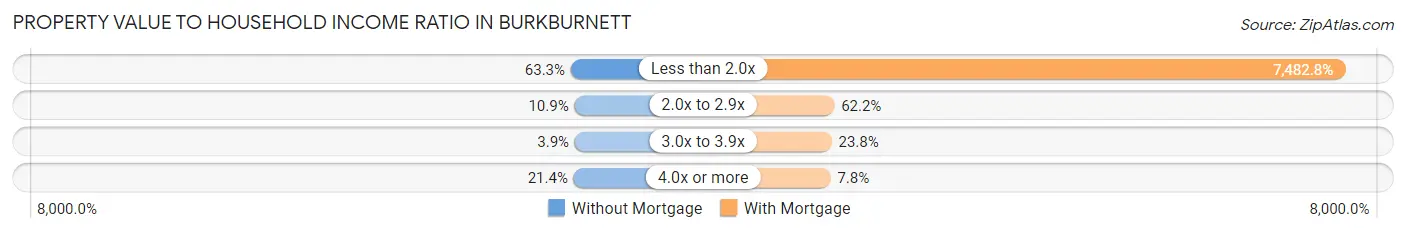
| Value-to-Income Ratio | Without Mortgage | With Mortgage |
| Less than 2.0x | 919 (63.2%) | 102,215 (7,482.8%) |
| 2.0x to 2.9x | 159 (10.9%) | 850 (62.2%) |
| 3.0x to 3.9x | 56 (3.8%) | 325 (23.8%) |
| 4.0x or more | 311 (21.4%) | 106 (7.8%) |
| Total | 1,453 (100.0%) | 1,366 (100.0%) |
Real Estate Taxes by Mortgage Status in Burkburnett
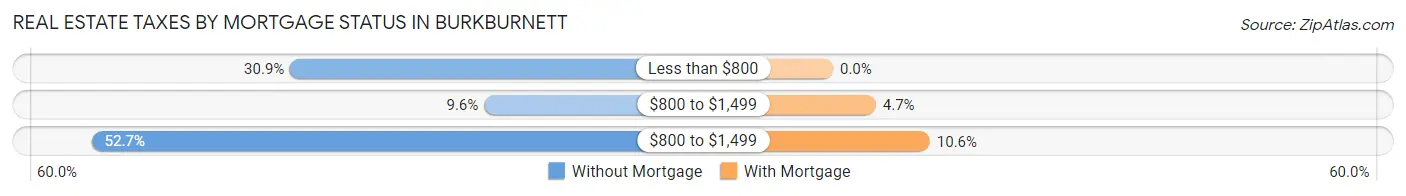
| Property Taxes | Without Mortgage | With Mortgage |
| Less than $800 | 449 (30.9%) | 0 (0.0%) |
| $800 to $1,499 | 140 (9.6%) | 64 (4.7%) |
| $800 to $1,499 | 765 (52.6%) | 145 (10.6%) |
| Total | 1,453 (100.0%) | 1,366 (100.0%) |
Health & Disability in Burkburnett
Health Insurance Coverage by Age in Burkburnett
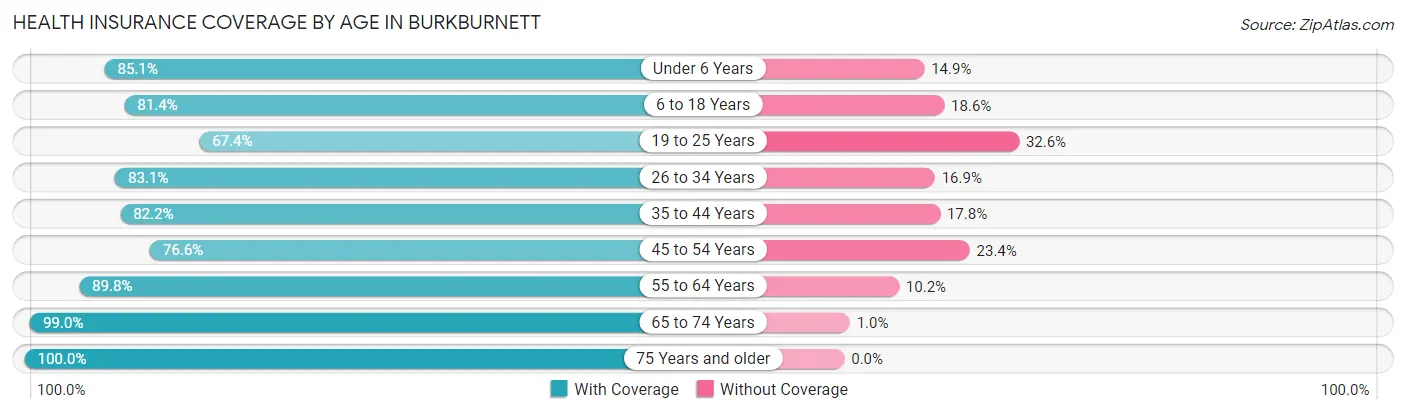
| Age Bracket | With Coverage | Without Coverage |
| Under 6 Years | 685 (85.1%) | 120 (14.9%) |
| 6 to 18 Years | 1,342 (81.4%) | 307 (18.6%) |
| 19 to 25 Years | 528 (67.4%) | 255 (32.6%) |
| 26 to 34 Years | 902 (83.1%) | 183 (16.9%) |
| 35 to 44 Years | 1,257 (82.2%) | 273 (17.8%) |
| 45 to 54 Years | 1,000 (76.6%) | 305 (23.4%) |
| 55 to 64 Years | 1,508 (89.8%) | 171 (10.2%) |
| 65 to 74 Years | 1,174 (99.0%) | 12 (1.0%) |
| 75 Years and older | 729 (100.0%) | 0 (0.0%) |
| Total | 9,125 (84.9%) | 1,626 (15.1%) |
Health Insurance Coverage by Citizenship Status in Burkburnett
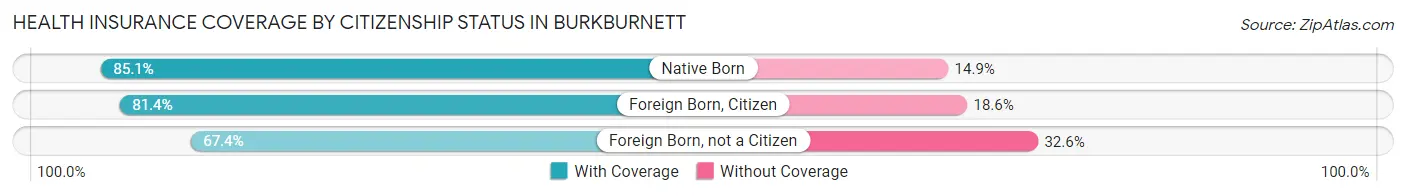
| Citizenship Status | With Coverage | Without Coverage |
| Native Born | 685 (85.1%) | 120 (14.9%) |
| Foreign Born, Citizen | 1,342 (81.4%) | 307 (18.6%) |
| Foreign Born, not a Citizen | 528 (67.4%) | 255 (32.6%) |
Health Insurance Coverage by Household Income in Burkburnett
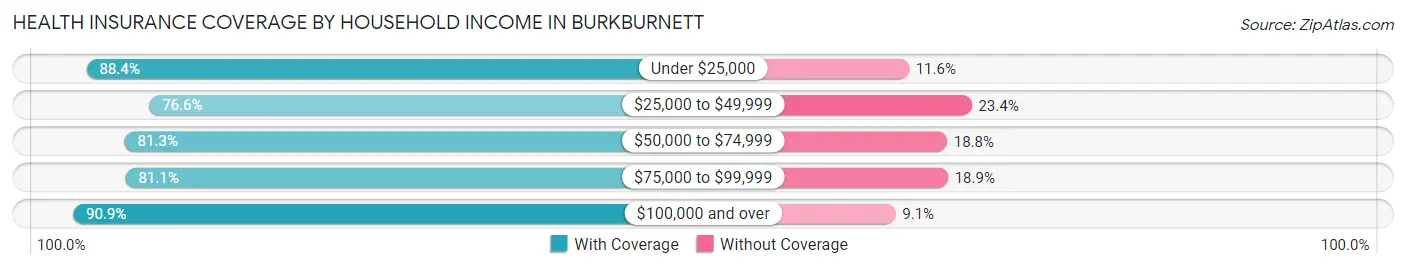
| Household Income | With Coverage | Without Coverage |
| Under $25,000 | 838 (88.4%) | 110 (11.6%) |
| $25,000 to $49,999 | 1,588 (76.6%) | 484 (23.4%) |
| $50,000 to $74,999 | 1,733 (81.2%) | 400 (18.8%) |
| $75,000 to $99,999 | 986 (81.1%) | 230 (18.9%) |
| $100,000 and over | 3,978 (90.9%) | 398 (9.1%) |
Public vs Private Health Insurance Coverage by Age in Burkburnett
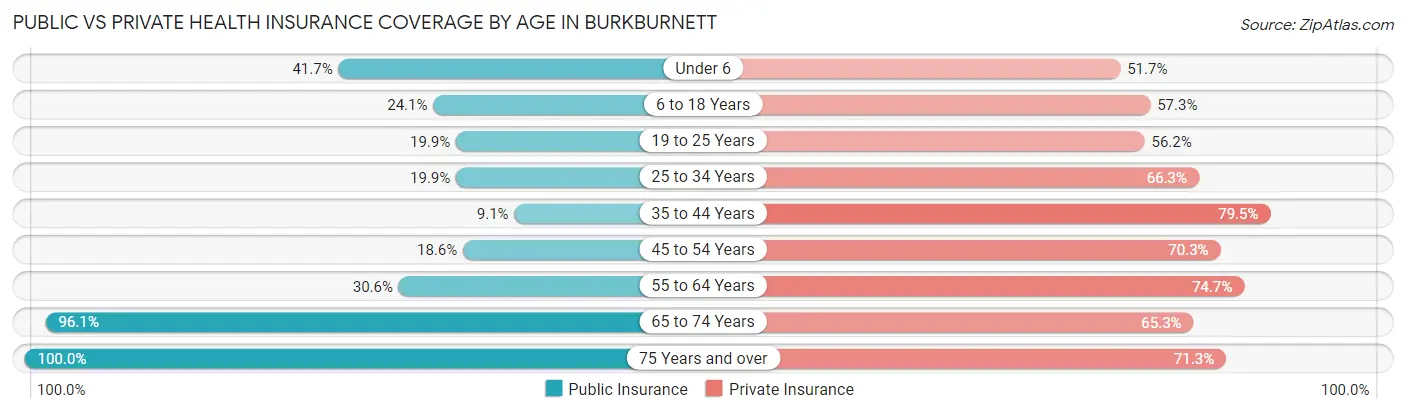
| Age Bracket | Public Insurance | Private Insurance |
| Under 6 | 336 (41.7%) | 416 (51.7%) |
| 6 to 18 Years | 398 (24.1%) | 944 (57.3%) |
| 19 to 25 Years | 156 (19.9%) | 440 (56.2%) |
| 25 to 34 Years | 216 (19.9%) | 719 (66.3%) |
| 35 to 44 Years | 139 (9.1%) | 1,217 (79.5%) |
| 45 to 54 Years | 243 (18.6%) | 917 (70.3%) |
| 55 to 64 Years | 513 (30.5%) | 1,254 (74.7%) |
| 65 to 74 Years | 1,140 (96.1%) | 774 (65.3%) |
| 75 Years and over | 729 (100.0%) | 520 (71.3%) |
| Total | 3,870 (36.0%) | 7,201 (67.0%) |
Disability Status by Sex by Age in Burkburnett
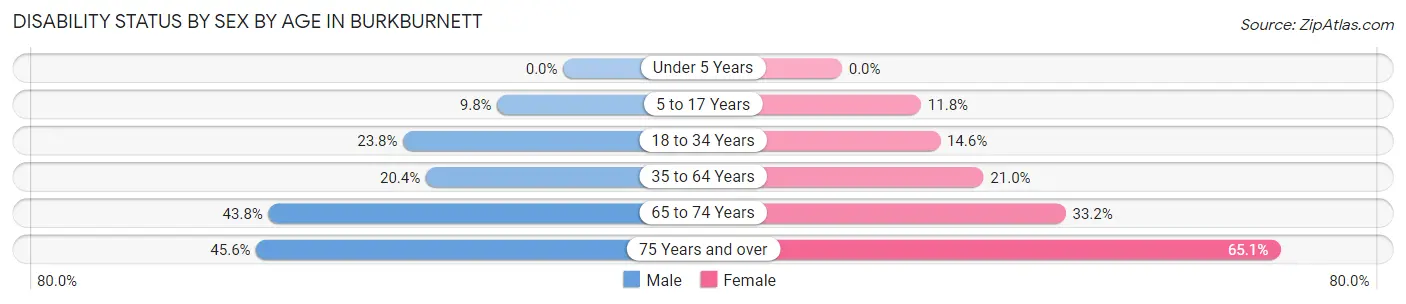
| Age Bracket | Male | Female |
| Under 5 Years | 0 (0.0%) | 0 (0.0%) |
| 5 to 17 Years | 73 (9.8%) | 104 (11.7%) |
| 18 to 34 Years | 220 (23.8%) | 162 (14.6%) |
| 35 to 64 Years | 421 (20.4%) | 515 (21.0%) |
| 65 to 74 Years | 270 (43.8%) | 189 (33.2%) |
| 75 Years and over | 134 (45.6%) | 283 (65.1%) |
Disability Class by Sex by Age in Burkburnett
Disability Class: Hearing Difficulty
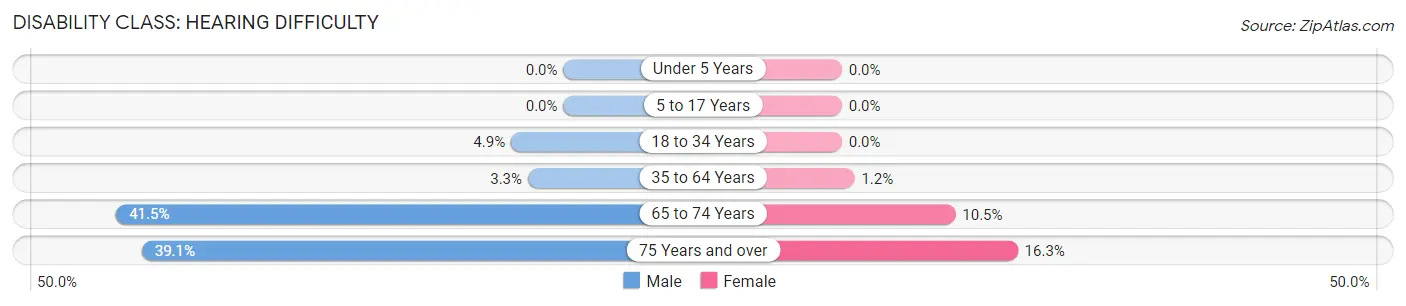
| Age Bracket | Male | Female |
| Under 5 Years | 0 (0.0%) | 0 (0.0%) |
| 5 to 17 Years | 0 (0.0%) | 0 (0.0%) |
| 18 to 34 Years | 45 (4.9%) | 0 (0.0%) |
| 35 to 64 Years | 68 (3.3%) | 29 (1.2%) |
| 65 to 74 Years | 256 (41.5%) | 60 (10.5%) |
| 75 Years and over | 115 (39.1%) | 71 (16.3%) |
Disability Class: Vision Difficulty
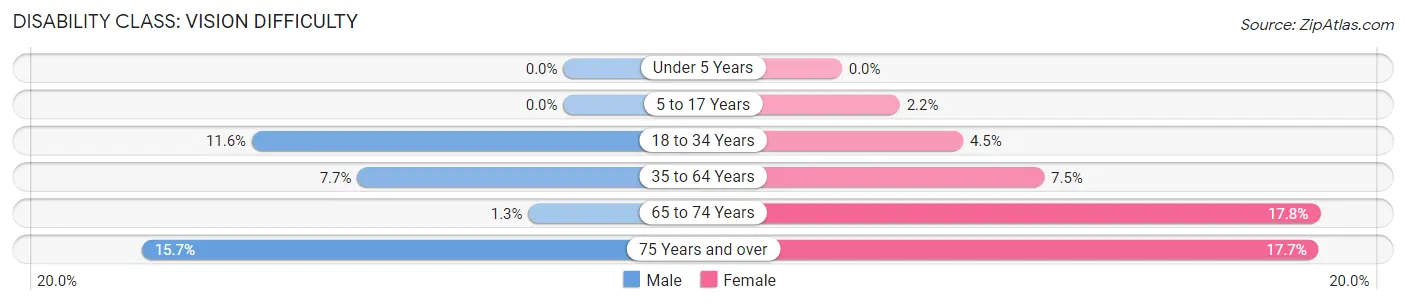
| Age Bracket | Male | Female |
| Under 5 Years | 0 (0.0%) | 0 (0.0%) |
| 5 to 17 Years | 0 (0.0%) | 19 (2.1%) |
| 18 to 34 Years | 107 (11.6%) | 50 (4.5%) |
| 35 to 64 Years | 158 (7.6%) | 184 (7.5%) |
| 65 to 74 Years | 8 (1.3%) | 101 (17.7%) |
| 75 Years and over | 46 (15.7%) | 77 (17.7%) |
Disability Class: Cognitive Difficulty
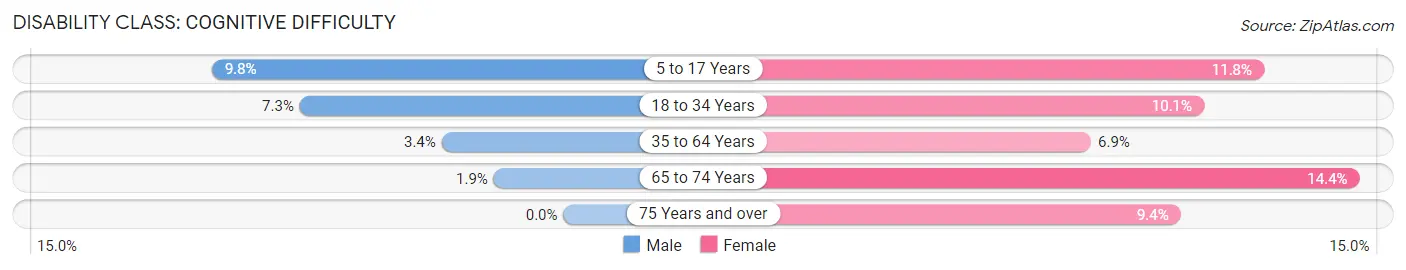
| Age Bracket | Male | Female |
| 5 to 17 Years | 73 (9.8%) | 104 (11.7%) |
| 18 to 34 Years | 68 (7.3%) | 112 (10.1%) |
| 35 to 64 Years | 70 (3.4%) | 170 (6.9%) |
| 65 to 74 Years | 12 (1.9%) | 82 (14.4%) |
| 75 Years and over | 0 (0.0%) | 41 (9.4%) |
Disability Class: Ambulatory Difficulty
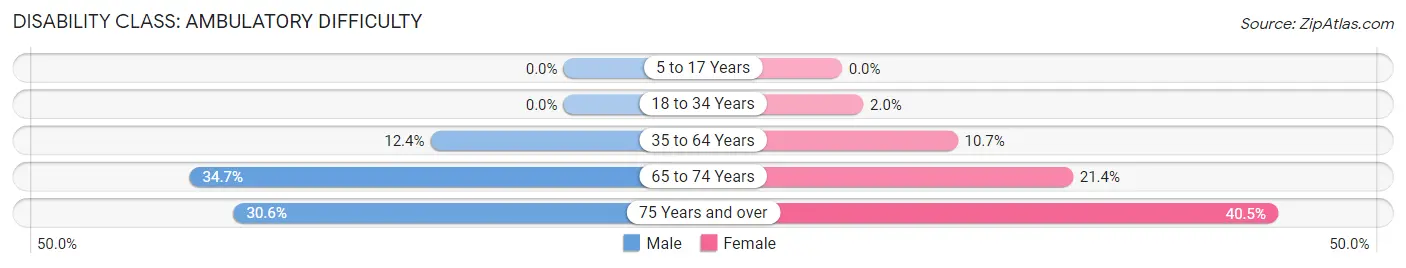
| Age Bracket | Male | Female |
| 5 to 17 Years | 0 (0.0%) | 0 (0.0%) |
| 18 to 34 Years | 0 (0.0%) | 22 (2.0%) |
| 35 to 64 Years | 255 (12.3%) | 263 (10.7%) |
| 65 to 74 Years | 214 (34.7%) | 122 (21.4%) |
| 75 Years and over | 90 (30.6%) | 176 (40.5%) |
Disability Class: Self-Care Difficulty
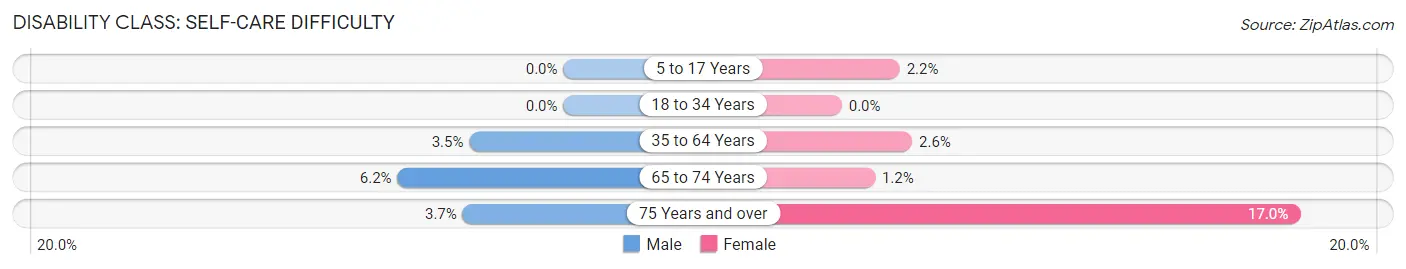
| Age Bracket | Male | Female |
| 5 to 17 Years | 0 (0.0%) | 19 (2.1%) |
| 18 to 34 Years | 0 (0.0%) | 0 (0.0%) |
| 35 to 64 Years | 72 (3.5%) | 64 (2.6%) |
| 65 to 74 Years | 38 (6.2%) | 7 (1.2%) |
| 75 Years and over | 11 (3.7%) | 74 (17.0%) |
Technology Access in Burkburnett
Computing Device Access in Burkburnett
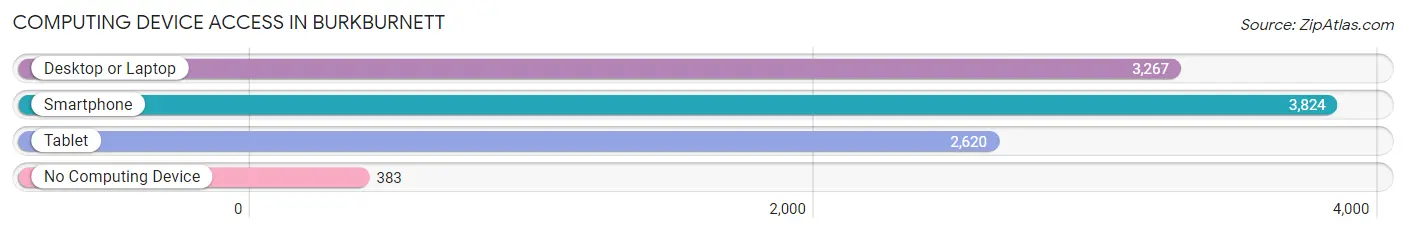
| Device Type | # Households | % Households |
| Desktop or Laptop | 3,267 | 73.2% |
| Smartphone | 3,824 | 85.7% |
| Tablet | 2,620 | 58.7% |
| No Computing Device | 383 | 8.6% |
| Total | 4,462 | 100.0% |
Internet Access in Burkburnett
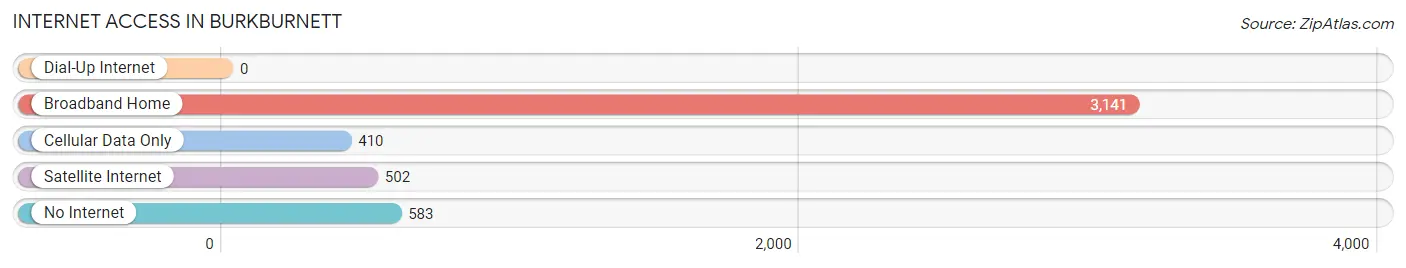
| Internet Type | # Households | % Households |
| Dial-Up Internet | 0 | 0.0% |
| Broadband Home | 3,141 | 70.4% |
| Cellular Data Only | 410 | 9.2% |
| Satellite Internet | 502 | 11.3% |
| No Internet | 583 | 13.1% |
| Total | 4,462 | 100.0% |
Burkburnett Summary
Burkburnett, Texas is a small city located in Wichita County, Texas. It is situated on the Red River, just north of Wichita Falls. The city was founded in 1910 and has a population of around 10,000 people.
History
Burkburnett was founded in 1910 by a group of investors led by Frank Kell, who named the city after his wife, Mary Burkburnett. The city was originally intended to be a railroad town, but the railroad never came. Instead, the city became a center for oil production. In 1911, the first oil well was drilled in the area, and by the 1920s, the city was producing more oil than any other city in Texas.
The city experienced a boom in the 1920s and 1930s, with the population growing to over 10,000 people. During this time, the city was home to several movie theaters, a bowling alley, and a variety of other businesses.
The city experienced a decline in the 1940s and 1950s, as the oil industry began to decline. The population dropped to around 5,000 people by the 1960s.
In the 1970s, the city began to experience a resurgence, as the oil industry began to recover. The population has grown steadily since then, and today the city has a population of around 10,000 people.
Geography
Burkburnett is located in the Red River Valley, just north of Wichita Falls. The city is situated on the Red River, and is surrounded by rolling hills and prairies. The city is located in the Central Time Zone.
The climate in Burkburnett is generally mild, with hot summers and cool winters. The average temperature in the summer is around 90 degrees Fahrenheit, and the average temperature in the winter is around 40 degrees Fahrenheit.
Economy
The economy of Burkburnett is largely based on oil production. The city is home to several oil companies, and the oil industry is the main source of employment in the city.
In addition to oil production, the city is also home to several manufacturing companies, including a steel mill and a paper mill. The city is also home to several retail stores, restaurants, and other businesses.
Demographics
As of the 2010 census, the population of Burkburnett was 9,999. The racial makeup of the city was 79.3% White, 15.2% African American, 0.7% Native American, 0.7% Asian, 0.1% Pacific Islander, and 3.9% from other races. Hispanic or Latino of any race were 8.2% of the population.
The median household income in Burkburnett was $37,917, and the median family income was $45,938. The per capita income was $19,945. About 16.2% of families and 19.2% of the population were below the poverty line, including 28.2% of those under age 18 and 11.2% of those age 65 or over.
Burkburnett is served by the Burkburnett Independent School District. The city is also home to several churches, including the First United Methodist Church, the First Baptist Church, and the Church of Christ.
Common Questions
What is Per Capita Income in Burkburnett?
Per Capita income in Burkburnett is $32,381.
What is the Median Family Income in Burkburnett?
Median Family Income in Burkburnett is $80,776.
What is the Median Household income in Burkburnett?
Median Household Income in Burkburnett is $62,143.
What is Income or Wage Gap in Burkburnett?
Income or Wage Gap in Burkburnett is 21.8%.
Women in Burkburnett earn 78.2 cents for every dollar earned by a man.
What is Inequality or Gini Index in Burkburnett?
Inequality or Gini Index in Burkburnett is 0.39.
What is the Total Population of Burkburnett?
Total Population of Burkburnett is 10,979.
What is the Total Male Population of Burkburnett?
Total Male Population of Burkburnett is 5,181.
What is the Total Female Population of Burkburnett?
Total Female Population of Burkburnett is 5,798.
What is the Ratio of Males per 100 Females in Burkburnett?
There are 89.36 Males per 100 Females in Burkburnett.
What is the Ratio of Females per 100 Males in Burkburnett?
There are 111.91 Females per 100 Males in Burkburnett.
What is the Median Population Age in Burkburnett?
Median Population Age in Burkburnett is 42.5 Years.
What is the Average Family Size in Burkburnett
Average Family Size in Burkburnett is 3.0 People.
What is the Average Household Size in Burkburnett
Average Household Size in Burkburnett is 2.5 People.
How Large is the Labor Force in Burkburnett?
There are 5,476 People in the Labor Forcein in Burkburnett.
What is the Percentage of People in the Labor Force in Burkburnett?
60.6% of People are in the Labor Force in Burkburnett.
What is the Unemployment Rate in Burkburnett?
Unemployment Rate in Burkburnett is 5.0%.