Buna, TX Map & Demographics
Buna Map
Buna Overview
$21,471
PER CAPITA INCOME
$63,571
AVG FAMILY INCOME
$36,250
AVG HOUSEHOLD INCOME
36.1%
WAGE / INCOME GAP [ % ]
63.9¢/ $1
WAGE / INCOME GAP [ $ ]
0.39
INEQUALITY / GINI INDEX
1,908
TOTAL POPULATION
735
MALE POPULATION
1,173
FEMALE POPULATION
62.66
MALES / 100 FEMALES
159.59
FEMALES / 100 MALES
36.7
MEDIAN AGE
2.7
AVG FAMILY SIZE
2.3
AVG HOUSEHOLD SIZE
615
LABOR FORCE [ PEOPLE ]
42.7%
PERCENT IN LABOR FORCE
17.9%
UNEMPLOYMENT RATE
Buna Zip Codes
Buna Area Codes
Income in Buna
Income Overview in Buna
Per Capita Income in Buna is $21,471, while median incomes of families and households are $63,571 and $36,250 respectively.
| Characteristic | Number | Measure |
| Per Capita Income | 1,908 | $21,471 |
| Median Family Income | 572 | $63,571 |
| Mean Family Income | 572 | $57,281 |
| Median Household Income | 820 | $36,250 |
| Mean Household Income | 820 | $51,512 |
| Income Deficit | 572 | $0 |
| Wage / Income Gap (%) | 1,908 | 36.11% |
| Wage / Income Gap ($) | 1,908 | 63.89¢ per $1 |
| Gini / Inequality Index | 1,908 | 0.39 |
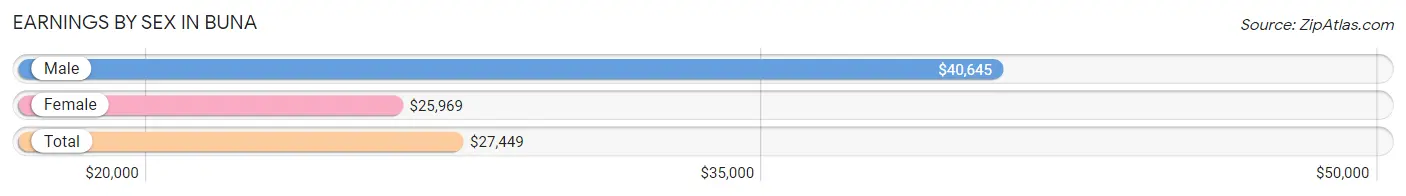
Earnings by Sex in Buna
Average Earnings in Buna are $27,449, $40,645 for men and $25,969 for women, a difference of 36.1%.
| Sex | Number | Average Earnings |
| Male | 290 (47.2%) | $40,645 |
| Female | 324 (52.8%) | $25,969 |
| Total | 614 (100.0%) | $27,449 |
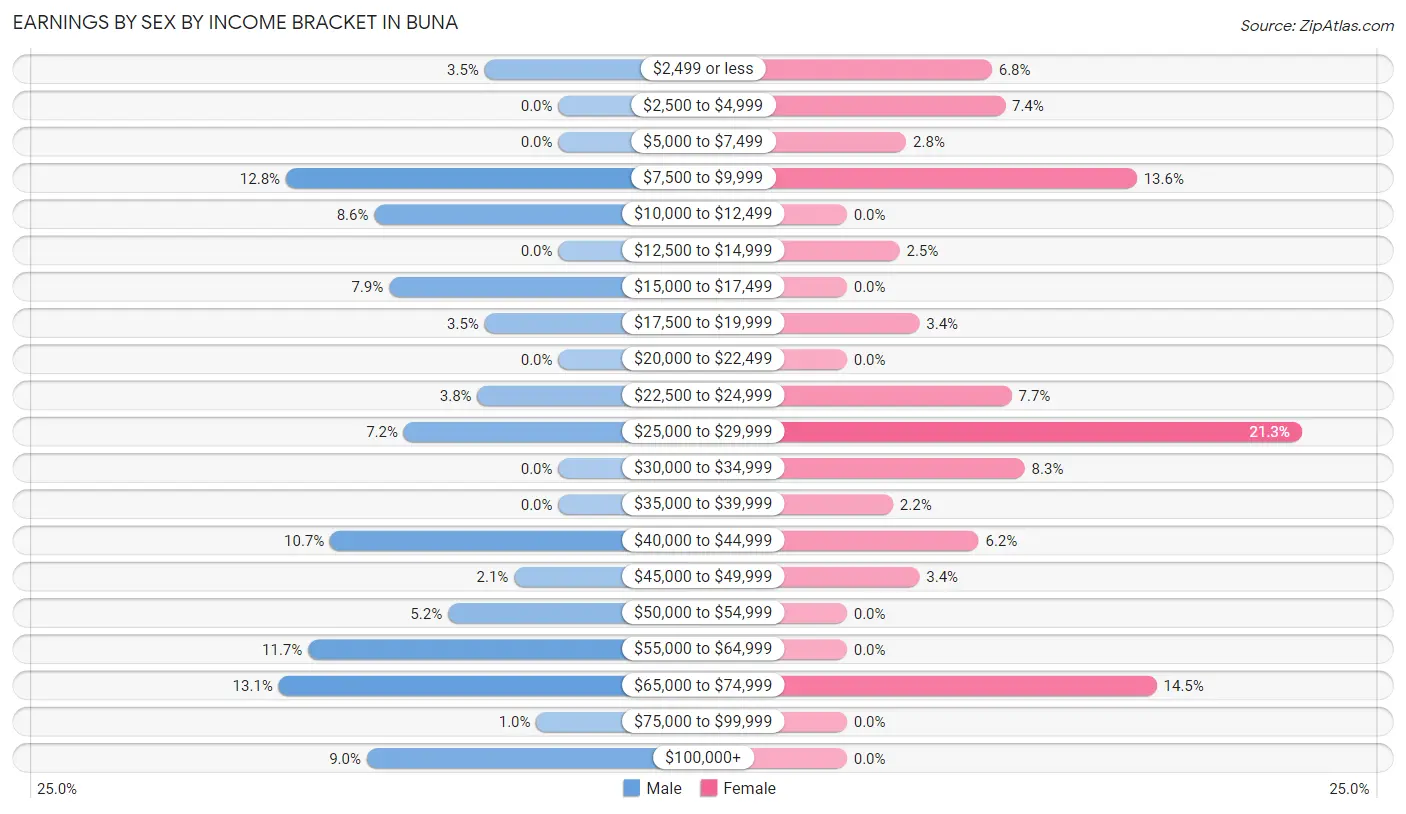
Earnings by Sex by Income Bracket in Buna
The most common earnings brackets in Buna are $65,000 to $74,999 for men (38 | 13.1%) and $25,000 to $29,999 for women (69 | 21.3%).
| Income | Male | Female |
| $2,499 or less | 10 (3.5%) | 22 (6.8%) |
| $2,500 to $4,999 | 0 (0.0%) | 24 (7.4%) |
| $5,000 to $7,499 | 0 (0.0%) | 9 (2.8%) |
| $7,500 to $9,999 | 37 (12.8%) | 44 (13.6%) |
| $10,000 to $12,499 | 25 (8.6%) | 0 (0.0%) |
| $12,500 to $14,999 | 0 (0.0%) | 8 (2.5%) |
| $15,000 to $17,499 | 23 (7.9%) | 0 (0.0%) |
| $17,500 to $19,999 | 10 (3.5%) | 11 (3.4%) |
| $20,000 to $22,499 | 0 (0.0%) | 0 (0.0%) |
| $22,500 to $24,999 | 11 (3.8%) | 25 (7.7%) |
| $25,000 to $29,999 | 21 (7.2%) | 69 (21.3%) |
| $30,000 to $34,999 | 0 (0.0%) | 27 (8.3%) |
| $35,000 to $39,999 | 0 (0.0%) | 7 (2.2%) |
| $40,000 to $44,999 | 31 (10.7%) | 20 (6.2%) |
| $45,000 to $49,999 | 6 (2.1%) | 11 (3.4%) |
| $50,000 to $54,999 | 15 (5.2%) | 0 (0.0%) |
| $55,000 to $64,999 | 34 (11.7%) | 0 (0.0%) |
| $65,000 to $74,999 | 38 (13.1%) | 47 (14.5%) |
| $75,000 to $99,999 | 3 (1.0%) | 0 (0.0%) |
| $100,000+ | 26 (9.0%) | 0 (0.0%) |
| Total | 290 (100.0%) | 324 (100.0%) |
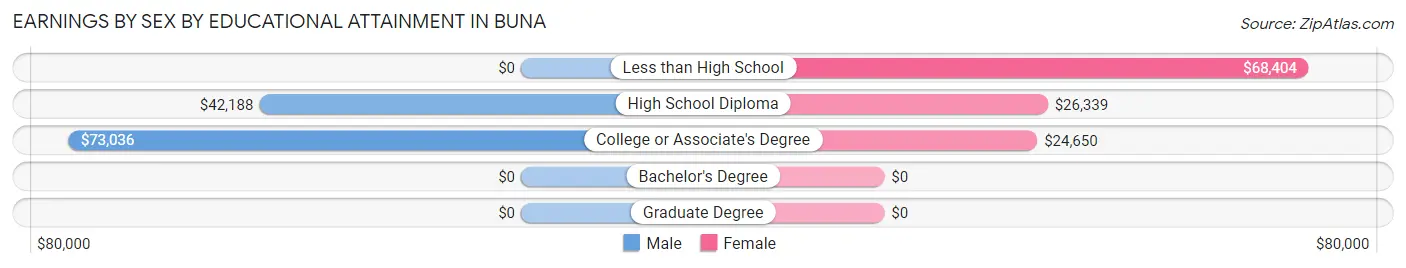
Earnings by Sex by Educational Attainment in Buna
Average earnings in Buna are $42,258 for men and $26,505 for women, a difference of 37.3%. Men with an educational attainment of college or associate's degree enjoy the highest average annual earnings of $73,036, while those with high school diploma education earn the least with $42,188. Women with an educational attainment of less than high school earn the most with the average annual earnings of $68,404, while those with college or associate's degree education have the smallest earnings of $24,650.
| Educational Attainment | Male Income | Female Income |
| Less than High School | - | - |
| High School Diploma | $42,188 | $26,339 |
| College or Associate's Degree | $73,036 | $24,650 |
| Bachelor's Degree | - | - |
| Graduate Degree | - | - |
| Total | $42,258 | $26,505 |
Family Income in Buna
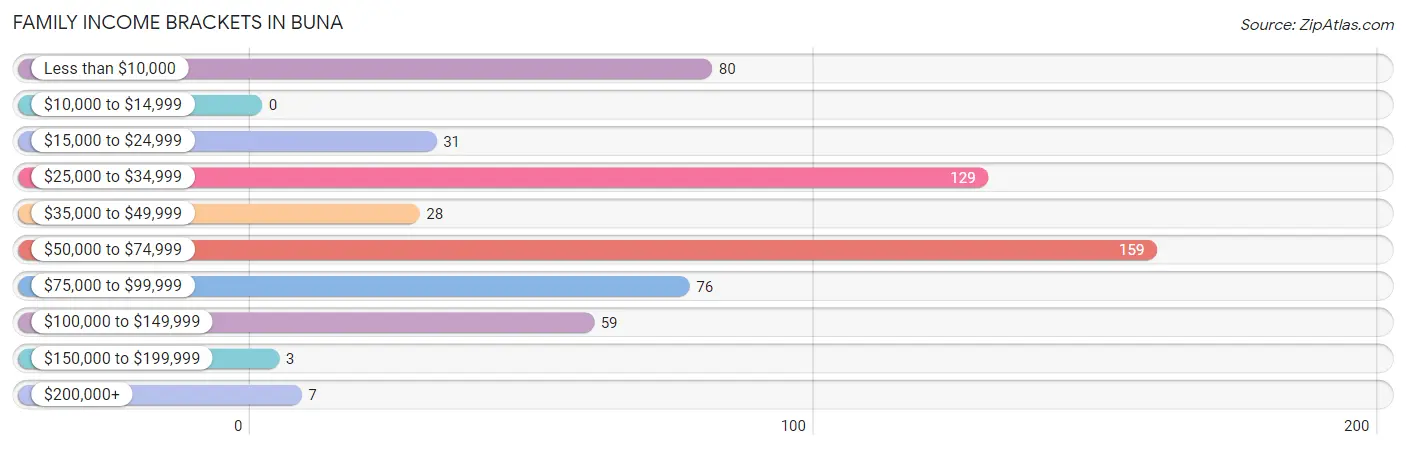
Family Income Brackets in Buna
According to the Buna family income data, there are 159 families falling into the $50,000 to $74,999 income range, which is the most common income bracket and makes up 27.8% of all families.
| Income Bracket | # Families | % Families |
| Less than $10,000 | 80 | 14.0% |
| $10,000 to $14,999 | 0 | 0.0% |
| $15,000 to $24,999 | 31 | 5.4% |
| $25,000 to $34,999 | 129 | 22.6% |
| $35,000 to $49,999 | 28 | 4.9% |
| $50,000 to $74,999 | 159 | 27.8% |
| $75,000 to $99,999 | 76 | 13.3% |
| $100,000 to $149,999 | 59 | 10.3% |
| $150,000 to $199,999 | 3 | 0.5% |
| $200,000+ | 7 | 1.2% |
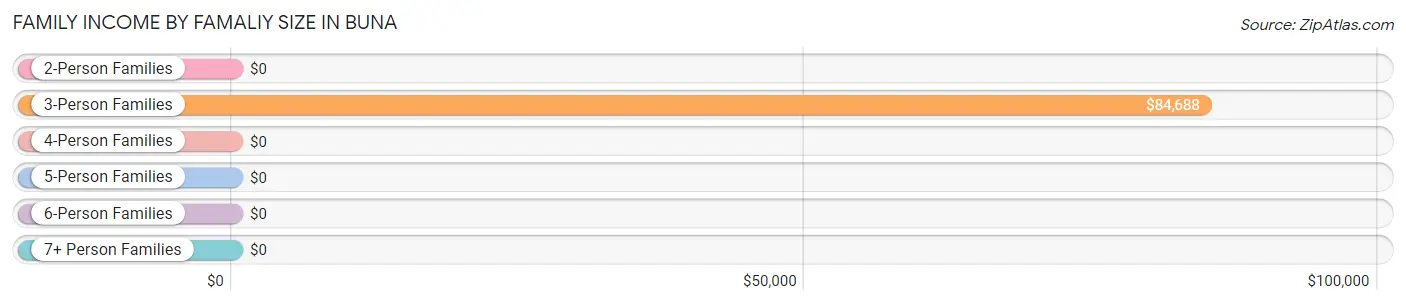
Family Income by Famaliy Size in Buna
3-person families (91 | 15.9%) account for the highest median family income in Buna with $84,688 per family, while 3-person families (91 | 15.9%) have the highest median income of $28,229 per family member.
| Income Bracket | # Families | Median Income |
| 2-Person Families | 338 (59.1%) | $0 |
| 3-Person Families | 91 (15.9%) | $84,688 |
| 4-Person Families | 49 (8.6%) | $0 |
| 5-Person Families | 9 (1.6%) | $0 |
| 6-Person Families | 77 (13.5%) | $0 |
| 7+ Person Families | 8 (1.4%) | $0 |
| Total | 572 (100.0%) | $63,571 |
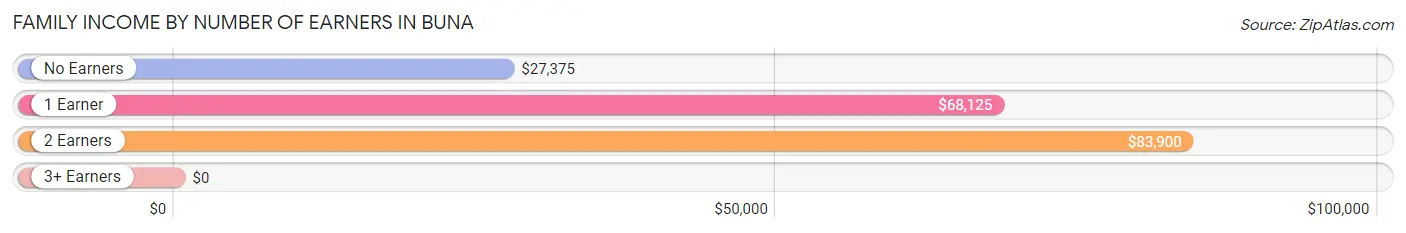
Family Income by Number of Earners in Buna
| Number of Earners | # Families | Median Income |
| No Earners | 179 (31.3%) | $27,375 |
| 1 Earner | 318 (55.6%) | $68,125 |
| 2 Earners | 70 (12.2%) | $83,900 |
| 3+ Earners | 5 (0.9%) | $0 |
| Total | 572 (100.0%) | $63,571 |
Household Income in Buna
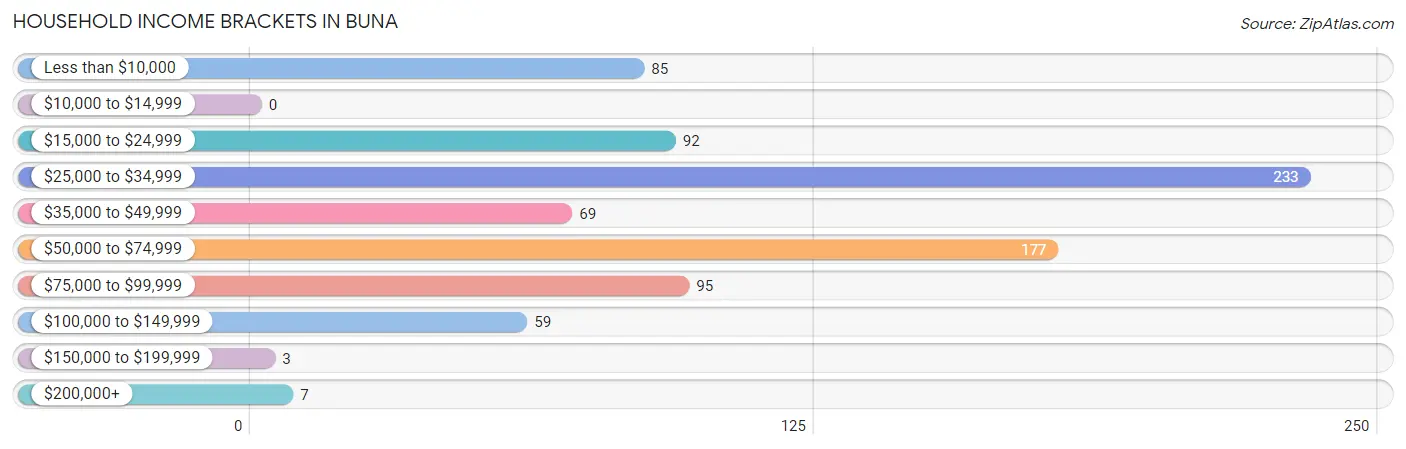
Household Income Brackets in Buna
With 233 households falling in the category, the $25,000 to $34,999 income range is the most frequent in Buna, accounting for 28.4% of all households.
| Income Bracket | # Households | % Households |
| Less than $10,000 | 85 | 10.4% |
| $10,000 to $14,999 | 0 | 0.0% |
| $15,000 to $24,999 | 92 | 11.2% |
| $25,000 to $34,999 | 233 | 28.4% |
| $35,000 to $49,999 | 69 | 8.4% |
| $50,000 to $74,999 | 177 | 21.6% |
| $75,000 to $99,999 | 95 | 11.6% |
| $100,000 to $149,999 | 59 | 7.2% |
| $150,000 to $199,999 | 3 | 0.4% |
| $200,000+ | 7 | 0.9% |
Household Income by Householder Age in Buna
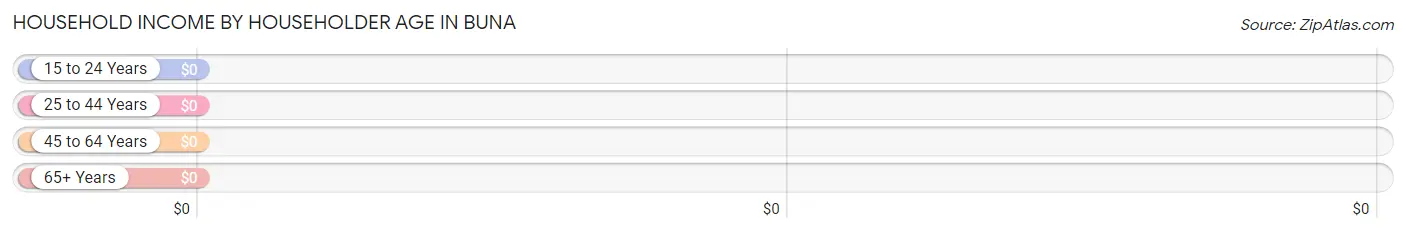
| Income Bracket | # Households | Median Income |
| 15 to 24 Years | 48 (5.9%) | $0 |
| 25 to 44 Years | 343 (41.8%) | $0 |
| 45 to 64 Years | 112 (13.7%) | $0 |
| 65+ Years | 317 (38.7%) | $0 |
| Total | 820 (100.0%) | $36,250 |
Poverty in Buna
Income Below Poverty by Sex and Age in Buna
With 16.4% poverty level for males and 22.1% for females among the residents of Buna, under 5 year old males and 16 and 17 year old females are the most vulnerable to poverty, with 10 males (100.0%) and 20 females (100.0%) in their respective age groups living below the poverty level.
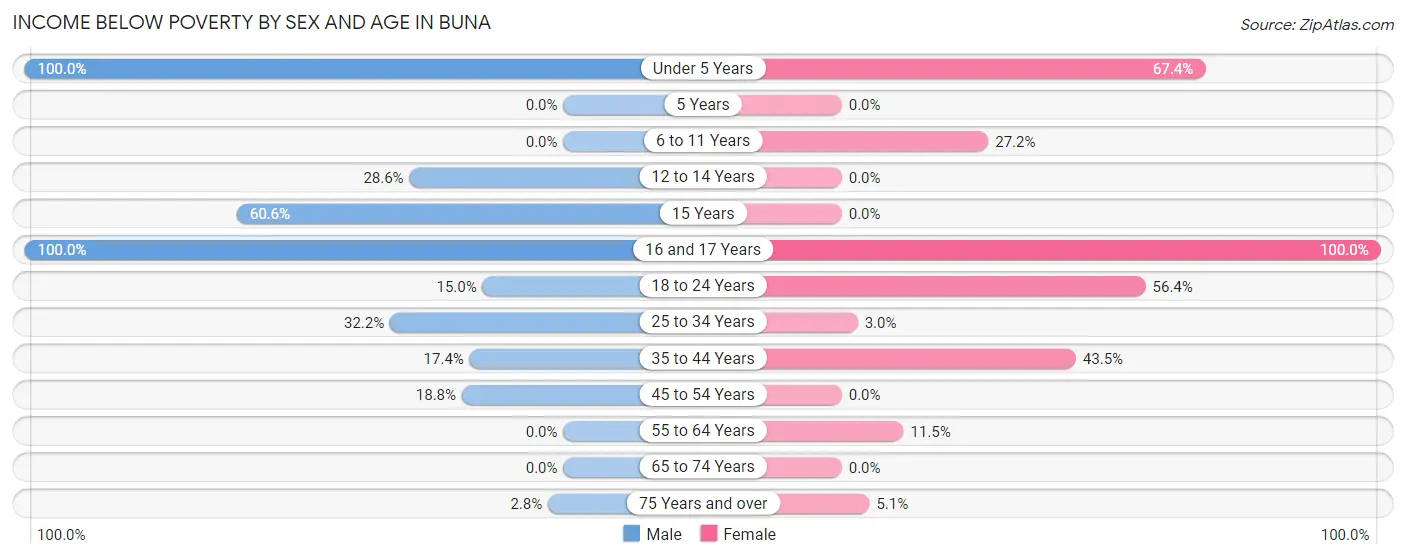
| Age Bracket | Male | Female |
| Under 5 Years | 10 (100.0%) | 29 (67.4%) |
| 5 Years | 0 (0.0%) | 0 (0.0%) |
| 6 to 11 Years | 0 (0.0%) | 34 (27.2%) |
| 12 to 14 Years | 4 (28.6%) | 0 (0.0%) |
| 15 Years | 20 (60.6%) | 0 (0.0%) |
| 16 and 17 Years | 11 (100.0%) | 20 (100.0%) |
| 18 to 24 Years | 6 (15.0%) | 75 (56.4%) |
| 25 to 34 Years | 37 (32.2%) | 4 (3.0%) |
| 35 to 44 Years | 12 (17.4%) | 73 (43.4%) |
| 45 to 54 Years | 13 (18.8%) | 0 (0.0%) |
| 55 to 64 Years | 0 (0.0%) | 11 (11.5%) |
| 65 to 74 Years | 0 (0.0%) | 0 (0.0%) |
| 75 Years and over | 5 (2.8%) | 9 (5.1%) |
| Total | 118 (16.4%) | 255 (22.1%) |
Income Above Poverty by Sex and Age in Buna
According to the poverty statistics in Buna, males aged 5 years and females aged 5 years are the age groups that are most secure financially, with 100.0% of males and 100.0% of females in these age groups living above the poverty line.
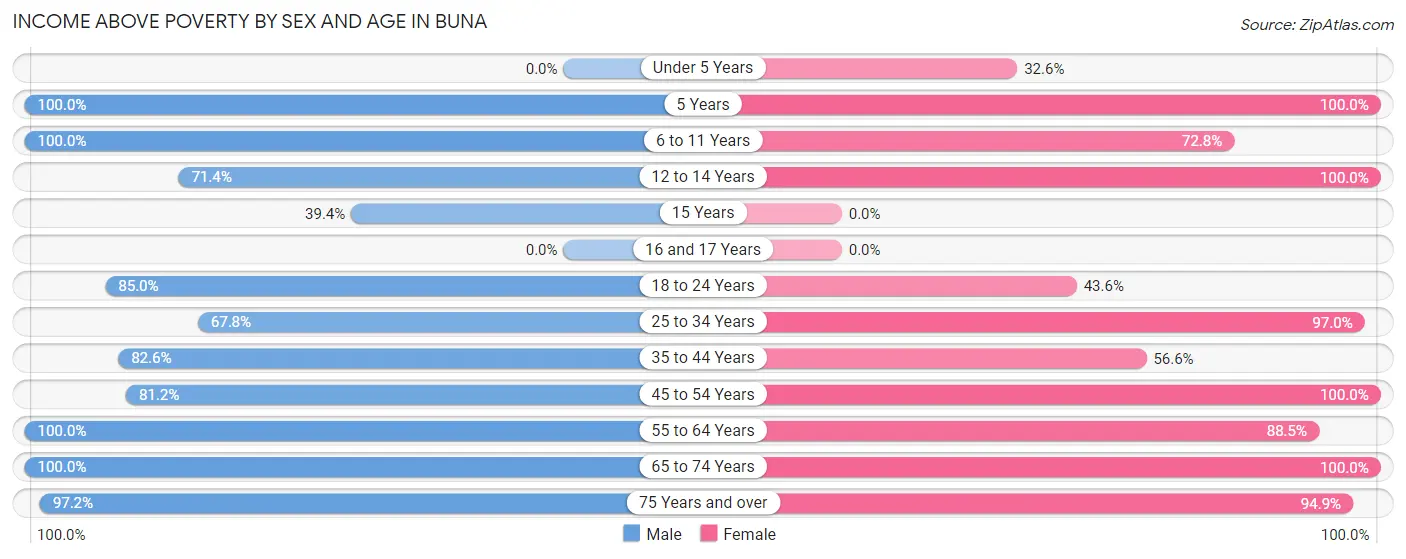
| Age Bracket | Male | Female |
| Under 5 Years | 0 (0.0%) | 14 (32.6%) |
| 5 Years | 3 (100.0%) | 102 (100.0%) |
| 6 to 11 Years | 88 (100.0%) | 91 (72.8%) |
| 12 to 14 Years | 10 (71.4%) | 44 (100.0%) |
| 15 Years | 13 (39.4%) | 0 (0.0%) |
| 16 and 17 Years | 0 (0.0%) | 0 (0.0%) |
| 18 to 24 Years | 34 (85.0%) | 58 (43.6%) |
| 25 to 34 Years | 78 (67.8%) | 131 (97.0%) |
| 35 to 44 Years | 57 (82.6%) | 95 (56.6%) |
| 45 to 54 Years | 56 (81.2%) | 32 (100.0%) |
| 55 to 64 Years | 36 (100.0%) | 85 (88.5%) |
| 65 to 74 Years | 57 (100.0%) | 81 (100.0%) |
| 75 Years and over | 171 (97.2%) | 166 (94.9%) |
| Total | 603 (83.6%) | 899 (77.9%) |
Income Below Poverty Among Married-Couple Families in Buna
The poverty statistics for married-couple families in Buna show that 11.8% or 48 of the total 408 families live below the poverty line. Families with no children have the highest poverty rate of 16.3%, comprising of 48 families. On the other hand, families with 1 or 2 children have the lowest poverty rate of 0.0%, which includes 0 families.
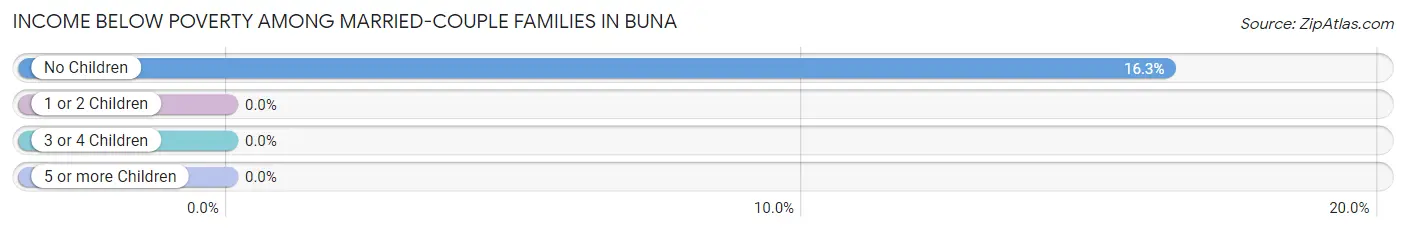
| Children | Above Poverty | Below Poverty |
| No Children | 246 (83.7%) | 48 (16.3%) |
| 1 or 2 Children | 34 (100.0%) | 0 (0.0%) |
| 3 or 4 Children | 77 (100.0%) | 0 (0.0%) |
| 5 or more Children | 3 (100.0%) | 0 (0.0%) |
| Total | 360 (88.2%) | 48 (11.8%) |
Income Below Poverty Among Single-Parent Households in Buna
According to the poverty data in Buna, 13.9% or 5 single-father households and 46.9% or 60 single-mother households are living below the poverty line. Among single-father households, those with 3 or 4 children have the highest poverty rate, with 5 households (100.0%) experiencing poverty. Likewise, among single-mother households, those with 1 or 2 children have the highest poverty rate, with 60 households (57.1%) falling below the poverty line.
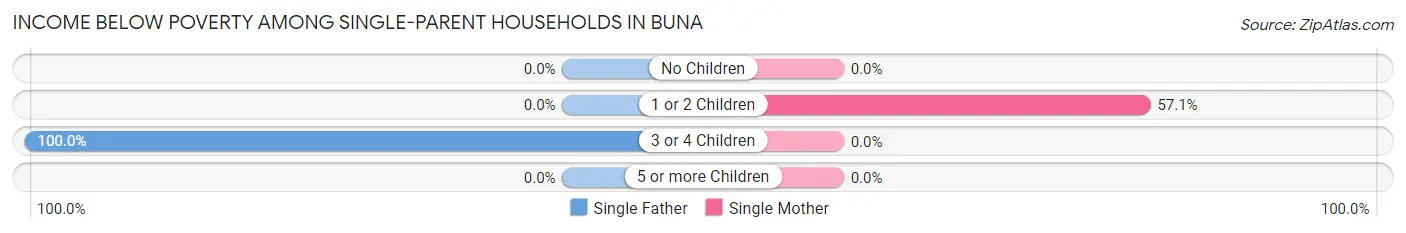
| Children | Single Father | Single Mother |
| No Children | 0 (0.0%) | 0 (0.0%) |
| 1 or 2 Children | 0 (0.0%) | 60 (57.1%) |
| 3 or 4 Children | 5 (100.0%) | 0 (0.0%) |
| 5 or more Children | 0 (0.0%) | 0 (0.0%) |
| Total | 5 (13.9%) | 60 (46.9%) |
Income Below Poverty Among Married-Couple vs Single-Parent Households in Buna
The poverty data for Buna shows that 48 of the married-couple family households (11.8%) and 65 of the single-parent households (39.6%) are living below the poverty level. Within the married-couple family households, those with no children have the highest poverty rate, with 48 households (16.3%) falling below the poverty line. Among the single-parent households, those with 1 or 2 children have the highest poverty rate, with 60 household (47.6%) living below poverty.
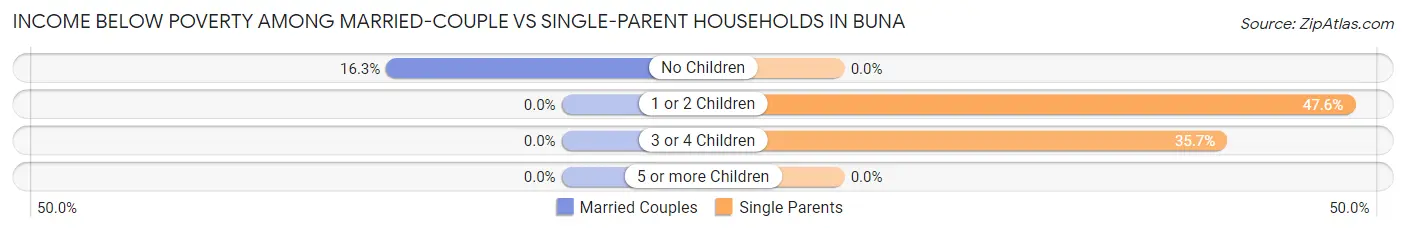
| Children | Married-Couple Families | Single-Parent Households |
| No Children | 48 (16.3%) | 0 (0.0%) |
| 1 or 2 Children | 0 (0.0%) | 60 (47.6%) |
| 3 or 4 Children | 0 (0.0%) | 5 (35.7%) |
| 5 or more Children | 0 (0.0%) | 0 (0.0%) |
| Total | 48 (11.8%) | 65 (39.6%) |
Race in Buna
The most populous races in Buna are White / Caucasian (1,693 | 88.7%), Hispanic or Latino (160 | 8.4%), and Some other Race (154 | 8.1%).
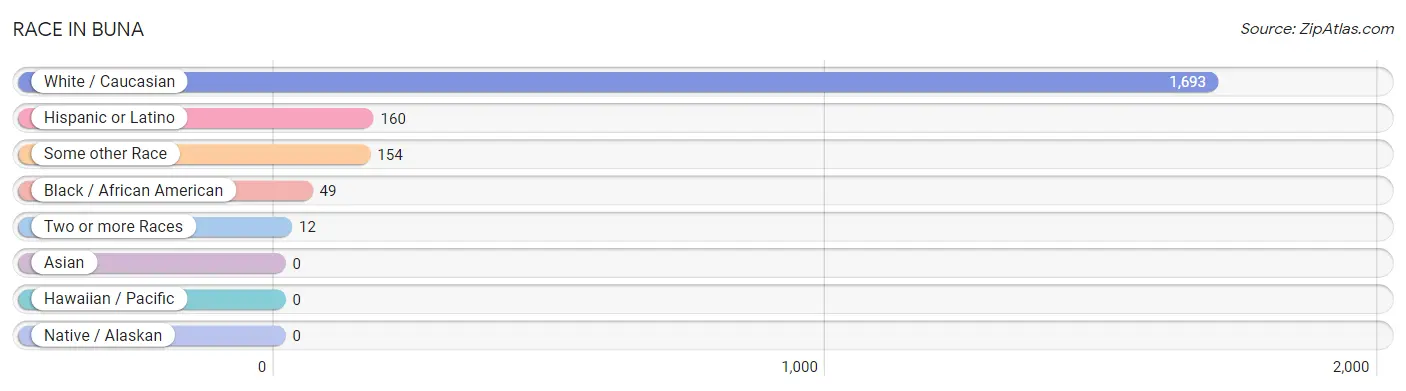
| Race | # Population | % Population |
| Asian | 0 | 0.0% |
| Black / African American | 49 | 2.6% |
| Hawaiian / Pacific | 0 | 0.0% |
| Hispanic or Latino | 160 | 8.4% |
| Native / Alaskan | 0 | 0.0% |
| White / Caucasian | 1,693 | 88.7% |
| Two or more Races | 12 | 0.6% |
| Some other Race | 154 | 8.1% |
| Total | 1,908 | 100.0% |
Ancestry in Buna
The most populous ancestries reported in Buna are American (997 | 52.2%), Mexican (150 | 7.9%), English (69 | 3.6%), German (69 | 3.6%), and European (59 | 3.1%), together accounting for 70.4% of all Buna residents.
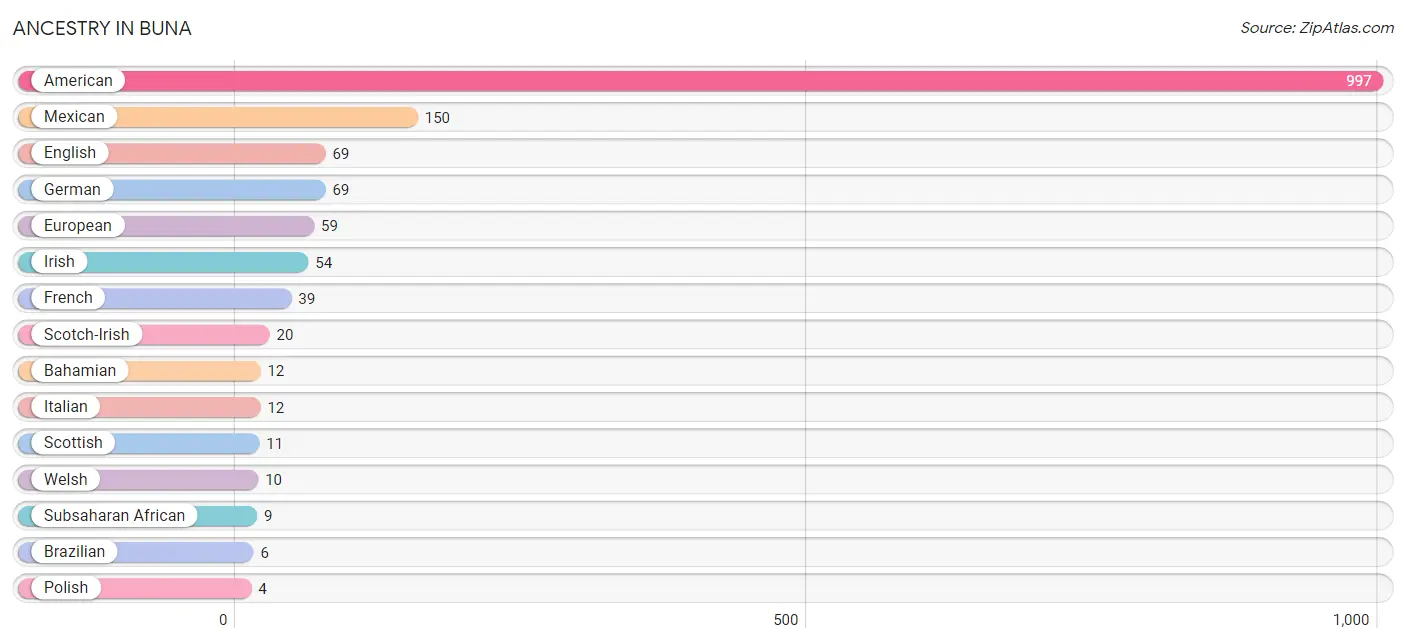
| Ancestry | # Population | % Population |
| American | 997 | 52.2% |
| Bahamian | 12 | 0.6% |
| Brazilian | 6 | 0.3% |
| English | 69 | 3.6% |
| European | 59 | 3.1% |
| French | 39 | 2.0% |
| German | 69 | 3.6% |
| Irish | 54 | 2.8% |
| Italian | 12 | 0.6% |
| Mexican | 150 | 7.9% |
| Polish | 4 | 0.2% |
| Scandinavian | 2 | 0.1% |
| Scotch-Irish | 20 | 1.1% |
| Scottish | 11 | 0.6% |
| Subsaharan African | 9 | 0.5% |
| Welsh | 10 | 0.5% | View All 16 Rows |
Immigrants in Buna
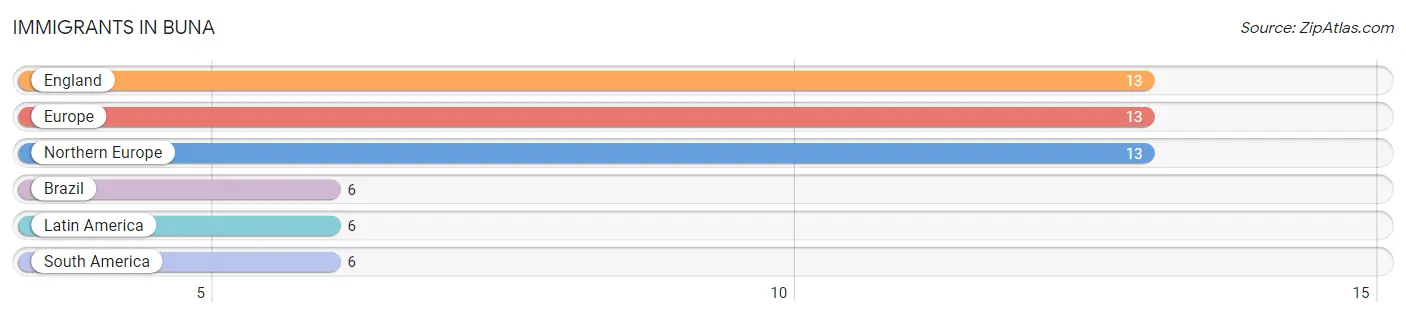
The most numerous immigrant groups reported in Buna came from England (13 | 0.7%), Europe (13 | 0.7%), Northern Europe (13 | 0.7%), Brazil (6 | 0.3%), and Latin America (6 | 0.3%), together accounting for 2.7% of all Buna residents.
| Immigration Origin | # Population | % Population |
| Brazil | 6 | 0.3% |
| England | 13 | 0.7% |
| Europe | 13 | 0.7% |
| Latin America | 6 | 0.3% |
| Northern Europe | 13 | 0.7% |
| South America | 6 | 0.3% | View All 6 Rows |
Sex and Age in Buna
Sex and Age in Buna
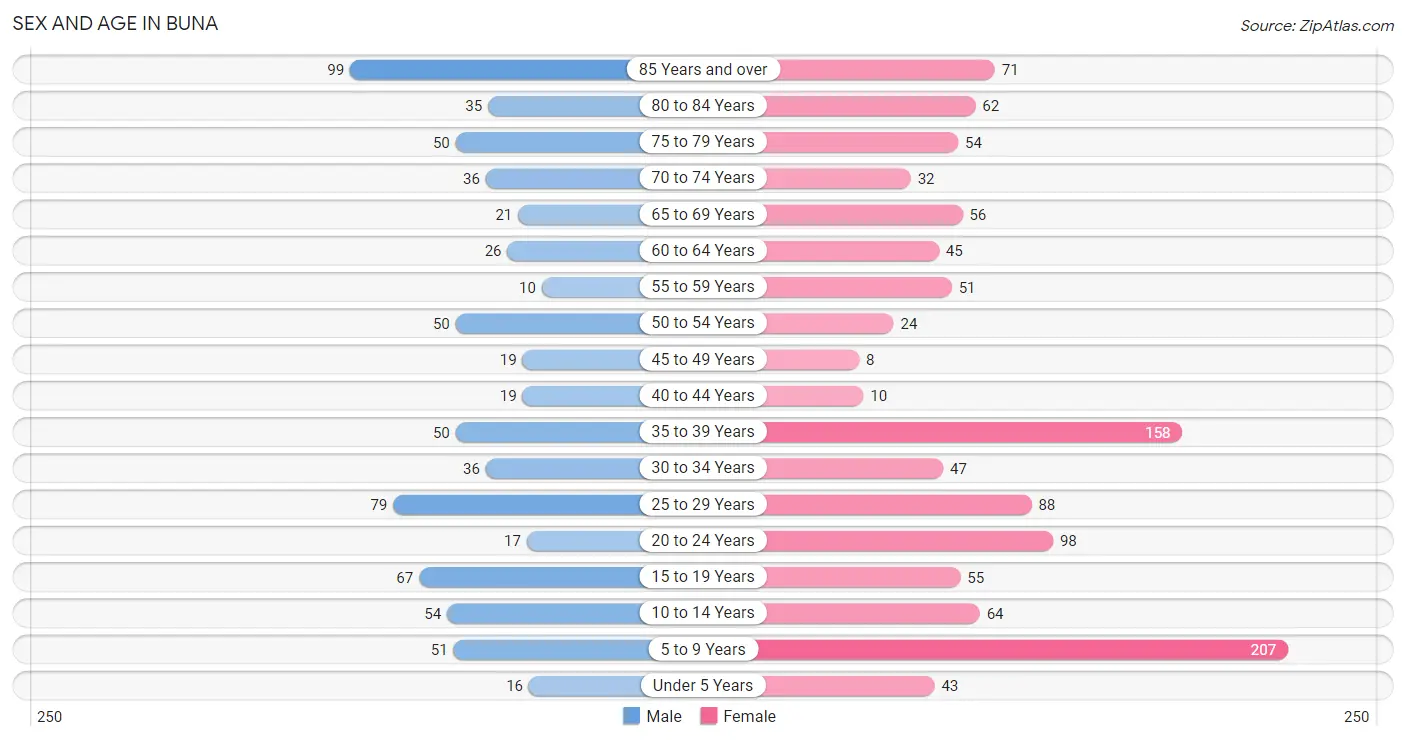
The most populous age groups in Buna are 85 Years and over (99 | 13.5%) for men and 5 to 9 Years (207 | 17.6%) for women.
| Age Bracket | Male | Female |
| Under 5 Years | 16 (2.2%) | 43 (3.7%) |
| 5 to 9 Years | 51 (6.9%) | 207 (17.6%) |
| 10 to 14 Years | 54 (7.3%) | 64 (5.5%) |
| 15 to 19 Years | 67 (9.1%) | 55 (4.7%) |
| 20 to 24 Years | 17 (2.3%) | 98 (8.4%) |
| 25 to 29 Years | 79 (10.7%) | 88 (7.5%) |
| 30 to 34 Years | 36 (4.9%) | 47 (4.0%) |
| 35 to 39 Years | 50 (6.8%) | 158 (13.5%) |
| 40 to 44 Years | 19 (2.6%) | 10 (0.9%) |
| 45 to 49 Years | 19 (2.6%) | 8 (0.7%) |
| 50 to 54 Years | 50 (6.8%) | 24 (2.1%) |
| 55 to 59 Years | 10 (1.4%) | 51 (4.3%) |
| 60 to 64 Years | 26 (3.5%) | 45 (3.8%) |
| 65 to 69 Years | 21 (2.9%) | 56 (4.8%) |
| 70 to 74 Years | 36 (4.9%) | 32 (2.7%) |
| 75 to 79 Years | 50 (6.8%) | 54 (4.6%) |
| 80 to 84 Years | 35 (4.8%) | 62 (5.3%) |
| 85 Years and over | 99 (13.5%) | 71 (6.0%) |
| Total | 735 (100.0%) | 1,173 (100.0%) |
Families and Households in Buna
Median Family Size in Buna
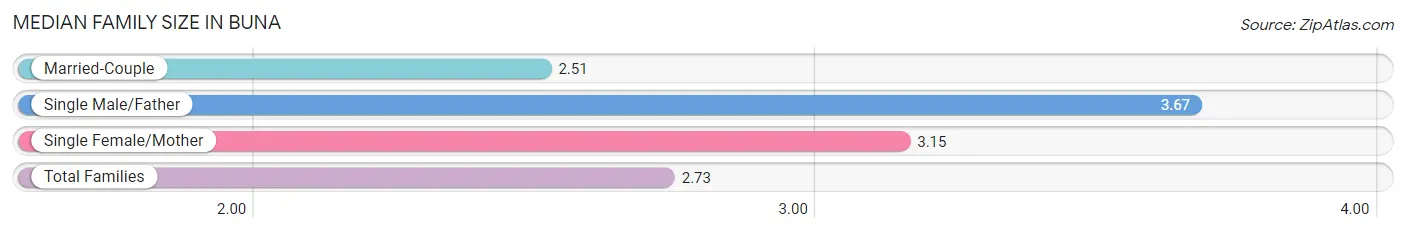
The median family size in Buna is 2.73 persons per family, with single male/father families (36 | 6.3%) accounting for the largest median family size of 3.67 persons per family. On the other hand, married-couple families (408 | 71.3%) represent the smallest median family size with 2.51 persons per family.
| Family Type | # Families | Family Size |
| Married-Couple | 408 (71.3%) | 2.51 |
| Single Male/Father | 36 (6.3%) | 3.67 |
| Single Female/Mother | 128 (22.4%) | 3.15 |
| Total Families | 572 (100.0%) | 2.73 |
Median Household Size in Buna
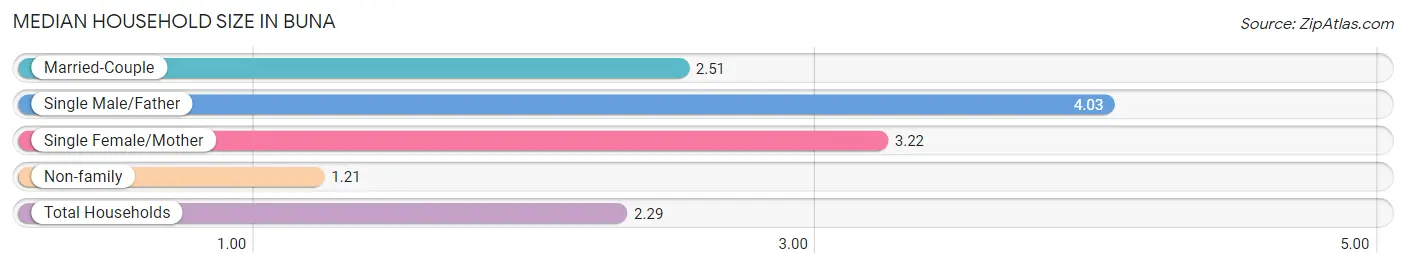
The median household size in Buna is 2.29 persons per household, with single male/father households (36 | 4.4%) accounting for the largest median household size of 4.03 persons per household. non-family households (248 | 30.2%) represent the smallest median household size with 1.21 persons per household.
| Household Type | # Households | Household Size |
| Married-Couple | 408 (49.8%) | 2.51 |
| Single Male/Father | 36 (4.4%) | 4.03 |
| Single Female/Mother | 128 (15.6%) | 3.22 |
| Non-family | 248 (30.2%) | 1.21 |
| Total Households | 820 (100.0%) | 2.29 |
Household Size by Marriage Status in Buna
Out of a total of 820 households in Buna, 572 (69.8%) are family households, while 248 (30.2%) are nonfamily households. The most numerous type of family households are 2-person households, comprising 313, and the most common type of nonfamily households are 1-person households, comprising 184.
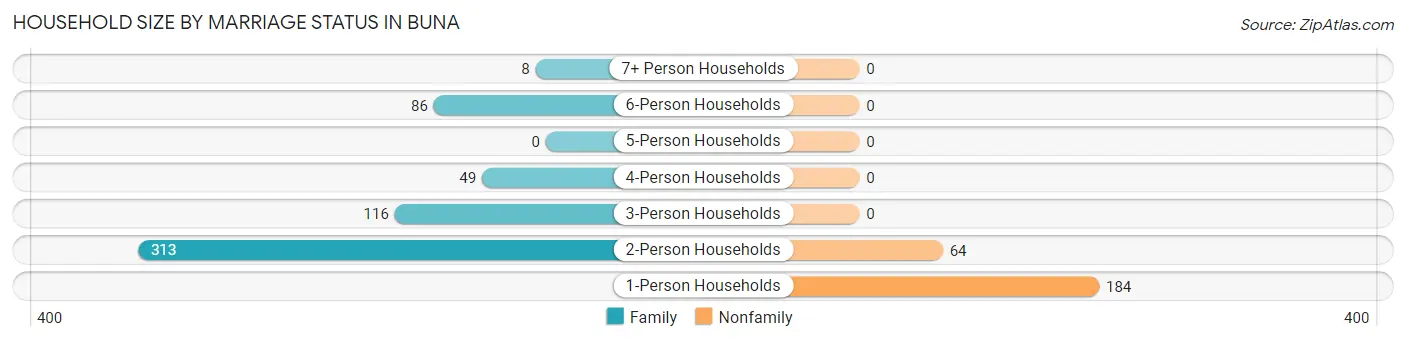
| Household Size | Family Households | Nonfamily Households |
| 1-Person Households | - | 184 (22.4%) |
| 2-Person Households | 313 (38.2%) | 64 (7.8%) |
| 3-Person Households | 116 (14.1%) | 0 (0.0%) |
| 4-Person Households | 49 (6.0%) | 0 (0.0%) |
| 5-Person Households | 0 (0.0%) | 0 (0.0%) |
| 6-Person Households | 86 (10.5%) | 0 (0.0%) |
| 7+ Person Households | 8 (1.0%) | 0 (0.0%) |
| Total | 572 (69.8%) | 248 (30.2%) |
Female Fertility in Buna
Fertility by Age in Buna
Average fertility rate in Buna is 13.0 births per 1,000 women. Women in the age bracket of 15 to 19 years have the highest fertility rate with 109.0 births per 1,000 women. Women in the age bracket of 15 to 19 years acount for 100.0% of all women with births.
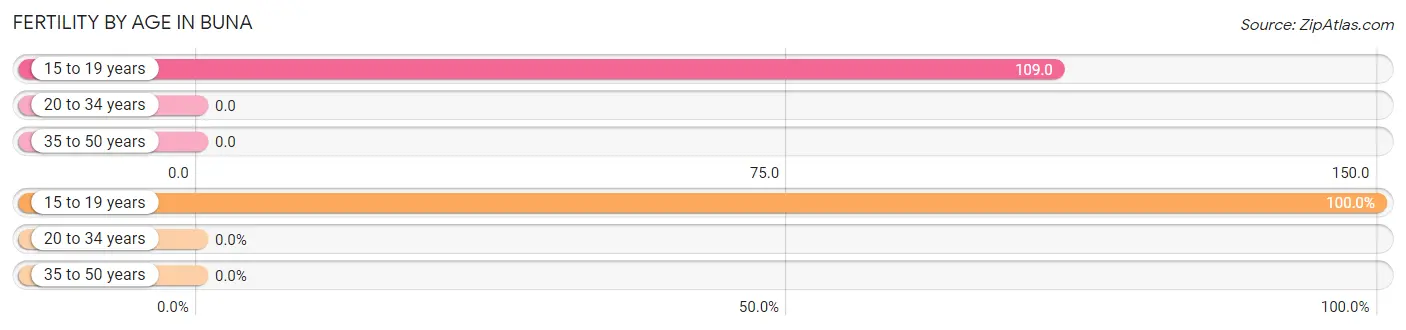
| Age Bracket | Women with Births | Births / 1,000 Women |
| 15 to 19 years | 6 (100.0%) | 109.0 |
| 20 to 34 years | 0 (0.0%) | 0.0 |
| 35 to 50 years | 0 (0.0%) | 0.0 |
| Total | 6 (100.0%) | 13.0 |
Fertility by Age by Marriage Status in Buna
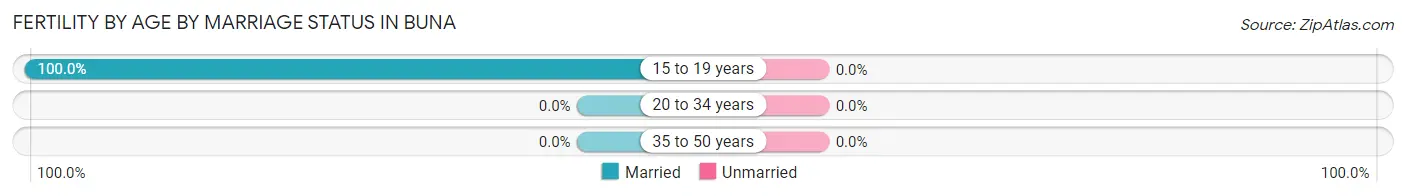
| Age Bracket | Married | Unmarried |
| 15 to 19 years | 6 (100.0%) | 0 (0.0%) |
| 20 to 34 years | 0 (0.0%) | 0 (0.0%) |
| 35 to 50 years | 0 (0.0%) | 0 (0.0%) |
| Total | 6 (100.0%) | 0 (0.0%) |
Fertility by Education in Buna
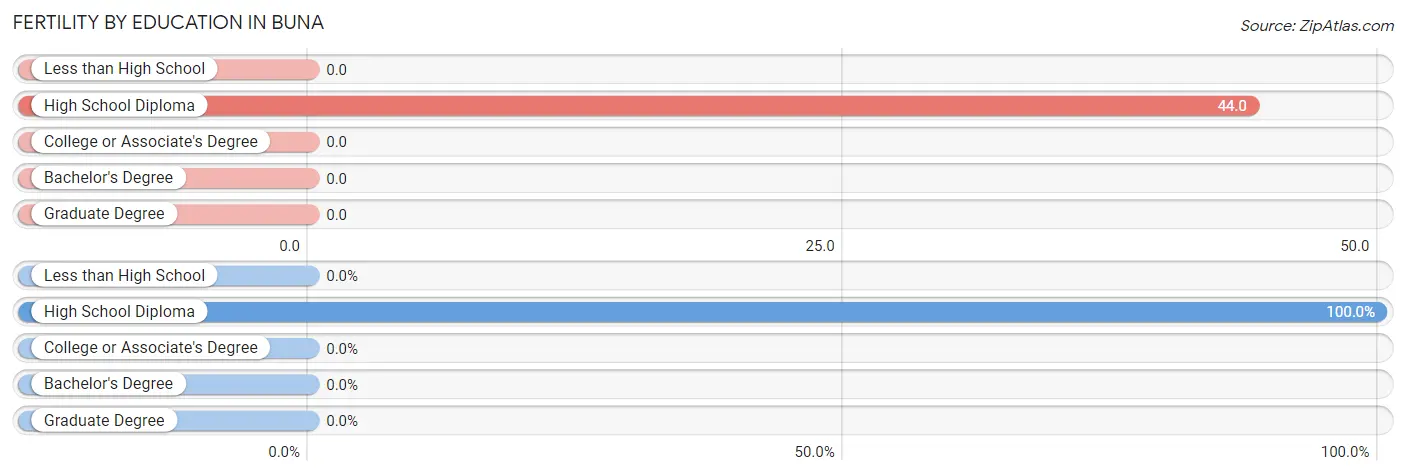
| Educational Attainment | Women with Births | Births / 1,000 Women |
| Less than High School | 0 (0.0%) | 0.0 |
| High School Diploma | 6 (100.0%) | 44.0 |
| College or Associate's Degree | 0 (0.0%) | 0.0 |
| Bachelor's Degree | 0 (0.0%) | 0.0 |
| Graduate Degree | 0 (0.0%) | 0.0 |
| Total | 6 (100.0%) | 13.0 |
Fertility by Education by Marriage Status in Buna
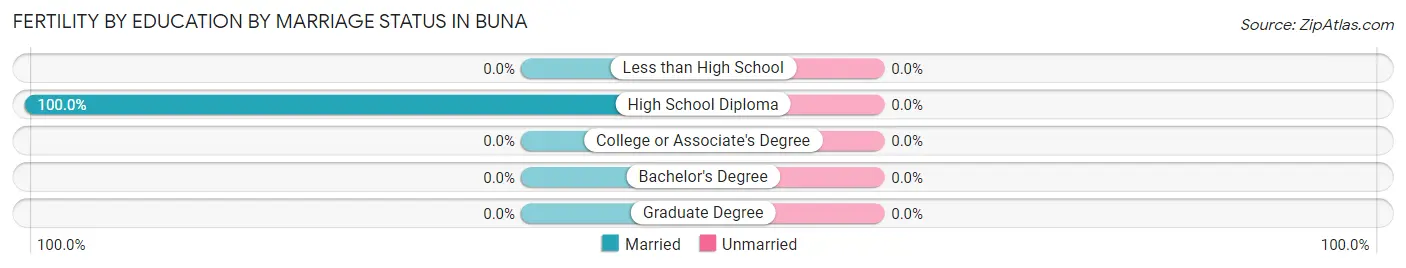
| Educational Attainment | Married | Unmarried |
| Less than High School | 0 (0.0%) | 0 (0.0%) |
| High School Diploma | 6 (100.0%) | 0 (0.0%) |
| College or Associate's Degree | 0 (0.0%) | 0 (0.0%) |
| Bachelor's Degree | 0 (0.0%) | 0 (0.0%) |
| Graduate Degree | 0 (0.0%) | 0 (0.0%) |
| Total | 6 (100.0%) | 0 (0.0%) |
Employment Characteristics in Buna
Employment by Class of Employer in Buna
Among the 505 employed individuals in Buna, private company employees (419 | 83.0%), local government employees (37 | 7.3%), and state government employees (26 | 5.1%) make up the most common classes of employment.
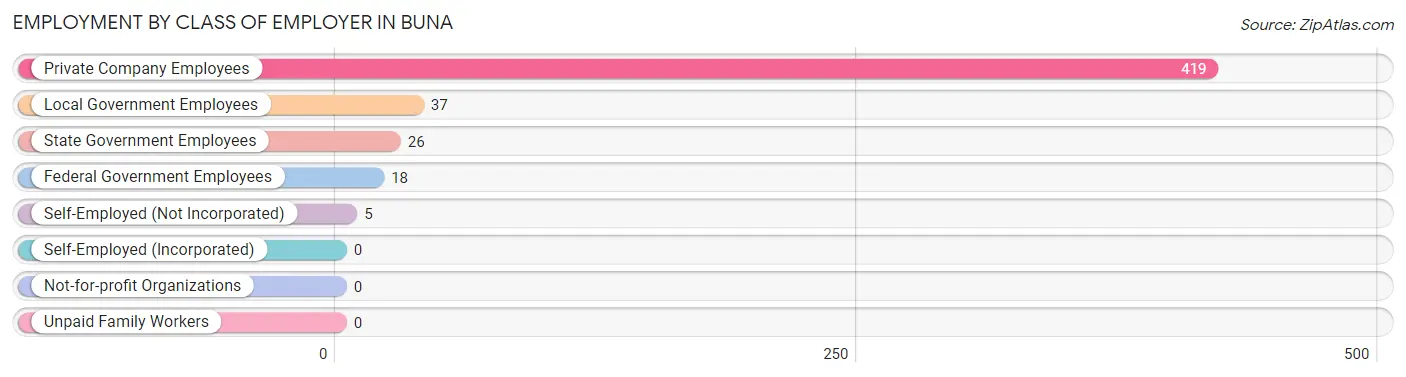
| Employer Class | # Employees | % Employees |
| Private Company Employees | 419 | 83.0% |
| Self-Employed (Incorporated) | 0 | 0.0% |
| Self-Employed (Not Incorporated) | 5 | 1.0% |
| Not-for-profit Organizations | 0 | 0.0% |
| Local Government Employees | 37 | 7.3% |
| State Government Employees | 26 | 5.1% |
| Federal Government Employees | 18 | 3.6% |
| Unpaid Family Workers | 0 | 0.0% |
| Total | 505 | 100.0% |
Employment Status by Age in Buna
According to the labor force statistics for Buna, out of the total population over 16 years of age (1,440), 42.7% or 615 individuals are in the labor force, with 17.9% or 110 of them unemployed. The age group with the highest labor force participation rate is 35 to 44 years, with 93.7% or 222 individuals in the labor force. Within the labor force, the 16 to 19 years age range has the highest percentage of unemployed individuals, with 68.1% or 49 of them being unemployed.
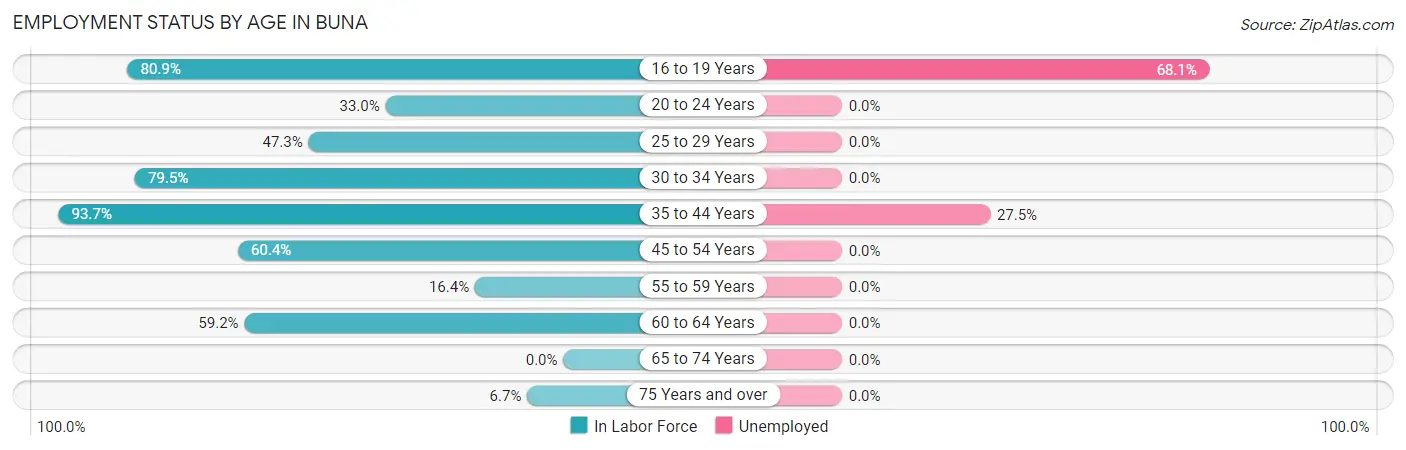
| Age Bracket | In Labor Force | Unemployed |
| 16 to 19 Years | 72 (80.9%) | 49 (68.1%) |
| 20 to 24 Years | 38 (33.0%) | 0 (0.0%) |
| 25 to 29 Years | 79 (47.3%) | 0 (0.0%) |
| 30 to 34 Years | 66 (79.5%) | 0 (0.0%) |
| 35 to 44 Years | 222 (93.7%) | 61 (27.5%) |
| 45 to 54 Years | 61 (60.4%) | 0 (0.0%) |
| 55 to 59 Years | 10 (16.4%) | 0 (0.0%) |
| 60 to 64 Years | 42 (59.2%) | 0 (0.0%) |
| 65 to 74 Years | 0 (0.0%) | 0 (0.0%) |
| 75 Years and over | 25 (6.7%) | 0 (0.0%) |
| Total | 615 (42.7%) | 110 (17.9%) |
Employment Status by Educational Attainment in Buna
According to labor force statistics for Buna, 66.7% of individuals (480) out of the total population between 25 and 64 years of age (720) are in the labor force, with 12.7% or 61 of them being unemployed. The group with the highest labor force participation rate are those with the educational attainment of college / associate degree, with 76.6% or 144 individuals in the labor force. Within the labor force, individuals with less than high school education have the highest percentage of unemployment, with 82.8% or 53 of them being unemployed.
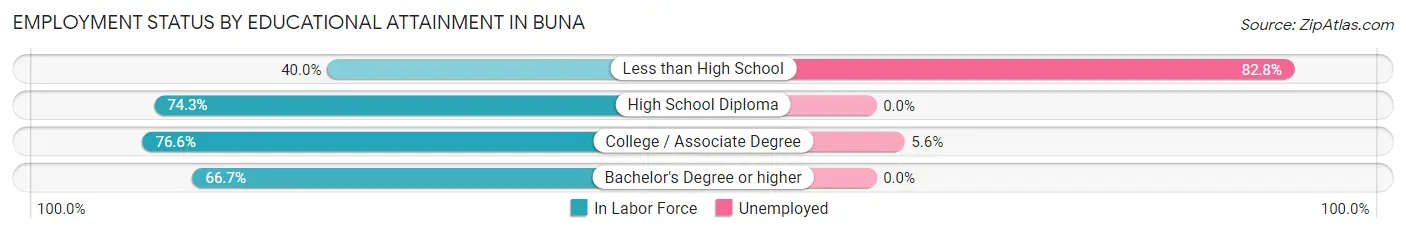
| Educational Attainment | In Labor Force | Unemployed |
| Less than High School | 64 (40.0%) | 132 (82.8%) |
| High School Diploma | 234 (74.3%) | 0 (0.0%) |
| College / Associate Degree | 144 (76.6%) | 11 (5.6%) |
| Bachelor's Degree or higher | 38 (66.7%) | 0 (0.0%) |
| Total | 480 (66.7%) | 91 (12.7%) |
Employment Occupations by Sex in Buna
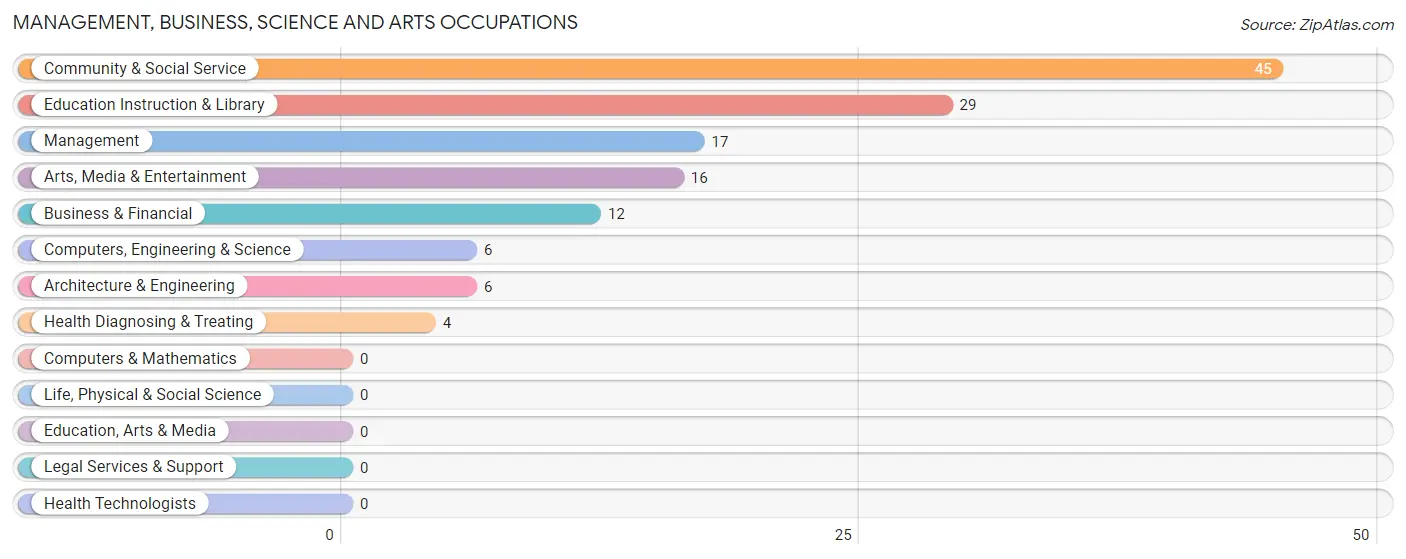
Management, Business, Science and Arts Occupations
The most common Management, Business, Science and Arts occupations in Buna are Community & Social Service (45 | 8.9%), Education Instruction & Library (29 | 5.7%), Management (17 | 3.4%), Arts, Media & Entertainment (16 | 3.2%), and Business & Financial (12 | 2.4%).
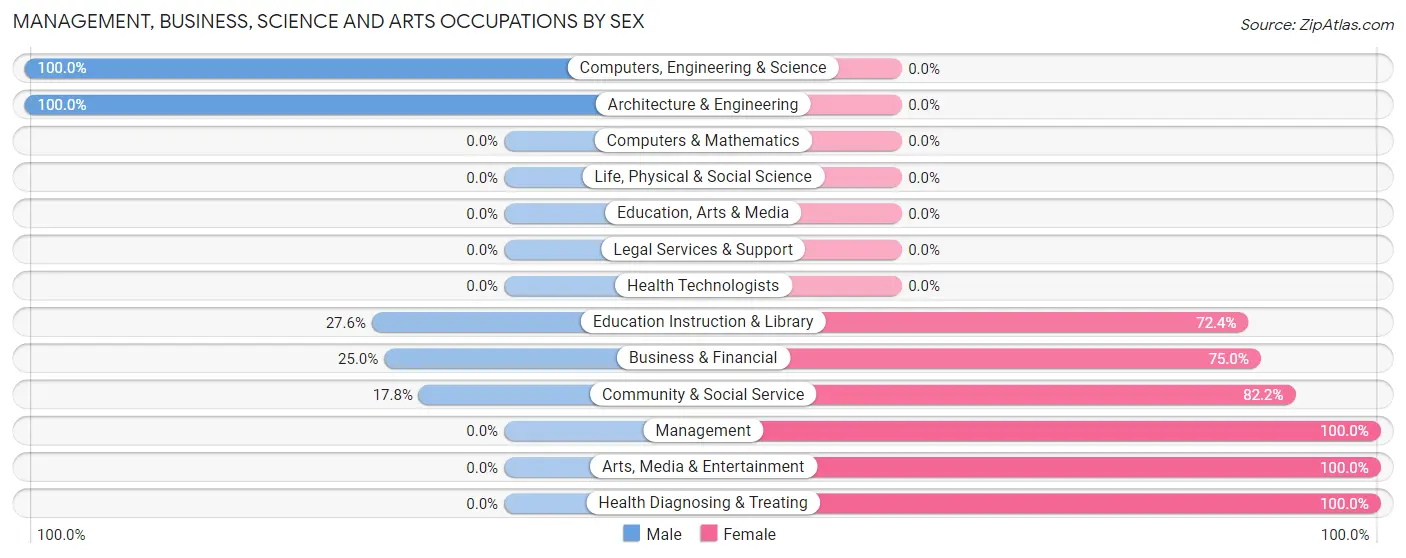
Management, Business, Science and Arts Occupations by Sex
Within the Management, Business, Science and Arts occupations in Buna, the most male-oriented occupations are Computers, Engineering & Science (100.0%), Architecture & Engineering (100.0%), and Education Instruction & Library (27.6%), while the most female-oriented occupations are Management (100.0%), Arts, Media & Entertainment (100.0%), and Health Diagnosing & Treating (100.0%).
| Occupation | Male | Female |
| Management | 0 (0.0%) | 17 (100.0%) |
| Business & Financial | 3 (25.0%) | 9 (75.0%) |
| Computers, Engineering & Science | 6 (100.0%) | 0 (0.0%) |
| Computers & Mathematics | 0 (0.0%) | 0 (0.0%) |
| Architecture & Engineering | 6 (100.0%) | 0 (0.0%) |
| Life, Physical & Social Science | 0 (0.0%) | 0 (0.0%) |
| Community & Social Service | 8 (17.8%) | 37 (82.2%) |
| Education, Arts & Media | 0 (0.0%) | 0 (0.0%) |
| Legal Services & Support | 0 (0.0%) | 0 (0.0%) |
| Education Instruction & Library | 8 (27.6%) | 21 (72.4%) |
| Arts, Media & Entertainment | 0 (0.0%) | 16 (100.0%) |
| Health Diagnosing & Treating | 0 (0.0%) | 4 (100.0%) |
| Health Technologists | 0 (0.0%) | 0 (0.0%) |
| Total (Category) | 17 (20.2%) | 67 (79.8%) |
| Total (Overall) | 290 (57.4%) | 215 (42.6%) |
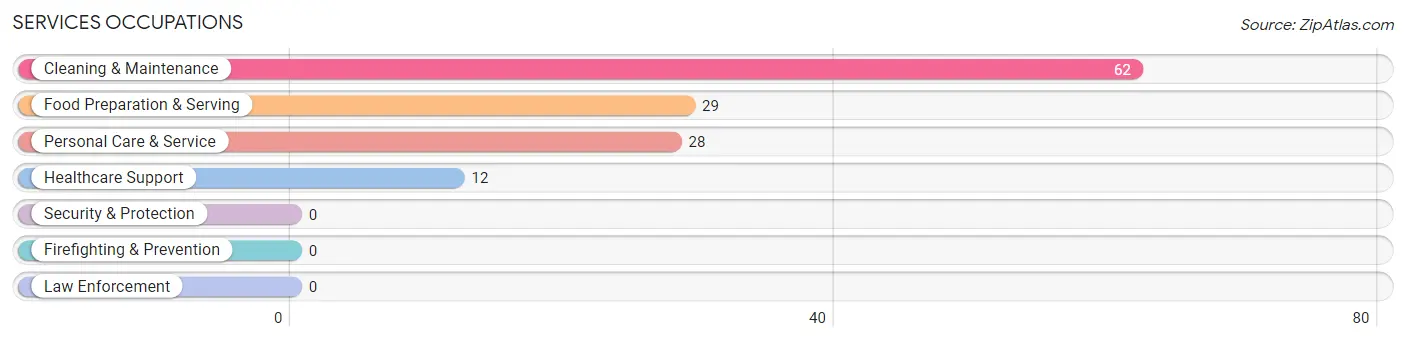
Services Occupations
The most common Services occupations in Buna are Cleaning & Maintenance (62 | 12.3%), Food Preparation & Serving (29 | 5.7%), Personal Care & Service (28 | 5.5%), and Healthcare Support (12 | 2.4%).
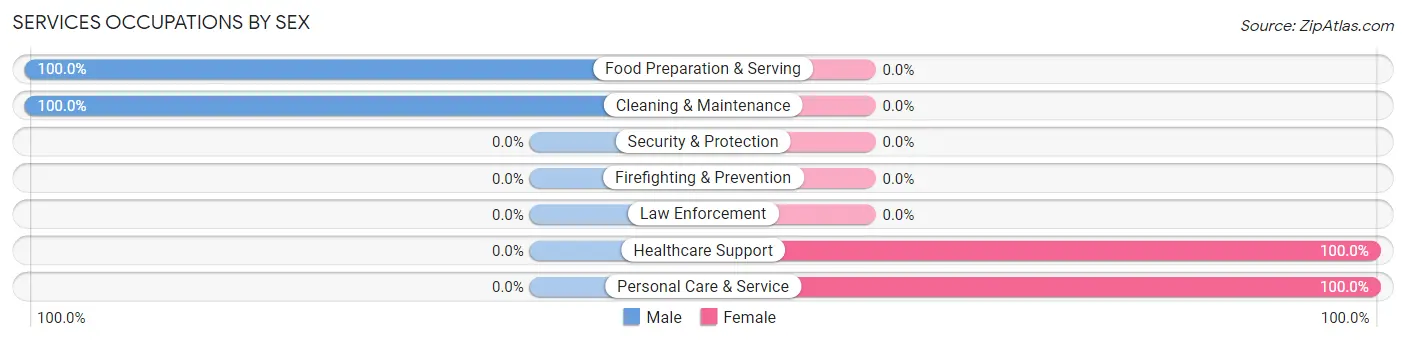
Services Occupations by Sex
Within the Services occupations in Buna, the most male-oriented occupations are Food Preparation & Serving (100.0%), and Cleaning & Maintenance (100.0%), while the most female-oriented occupations are Healthcare Support (100.0%), and Personal Care & Service (100.0%).
| Occupation | Male | Female |
| Healthcare Support | 0 (0.0%) | 12 (100.0%) |
| Security & Protection | 0 (0.0%) | 0 (0.0%) |
| Firefighting & Prevention | 0 (0.0%) | 0 (0.0%) |
| Law Enforcement | 0 (0.0%) | 0 (0.0%) |
| Food Preparation & Serving | 29 (100.0%) | 0 (0.0%) |
| Cleaning & Maintenance | 62 (100.0%) | 0 (0.0%) |
| Personal Care & Service | 0 (0.0%) | 28 (100.0%) |
| Total (Category) | 91 (69.5%) | 40 (30.5%) |
| Total (Overall) | 290 (57.4%) | 215 (42.6%) |
Sales and Office Occupations
The most common Sales and Office occupations in Buna are Office & Administration (88 | 17.4%), and Sales & Related (10 | 2.0%).
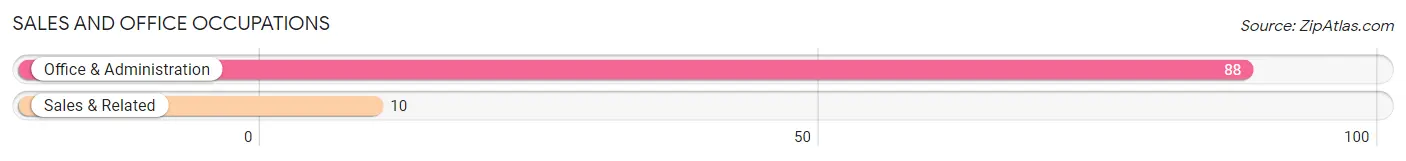
Sales and Office Occupations by Sex

| Occupation | Male | Female |
| Sales & Related | 10 (100.0%) | 0 (0.0%) |
| Office & Administration | 0 (0.0%) | 88 (100.0%) |
| Total (Category) | 10 (10.2%) | 88 (89.8%) |
| Total (Overall) | 290 (57.4%) | 215 (42.6%) |
Natural Resources, Construction and Maintenance Occupations
The most common Natural Resources, Construction and Maintenance occupations in Buna are Construction & Extraction (102 | 20.2%), and Installation, Maintenance & Repair (16 | 3.2%).
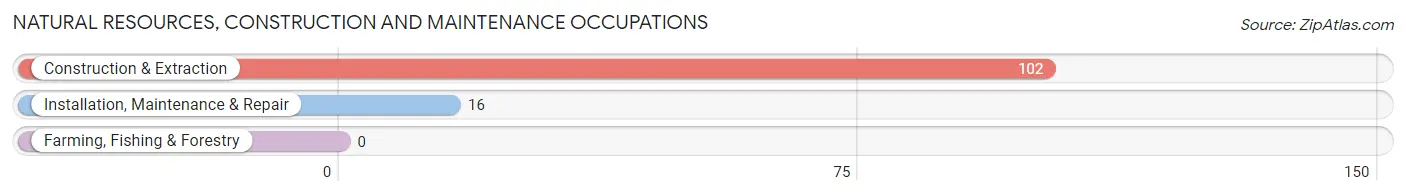
Natural Resources, Construction and Maintenance Occupations by Sex
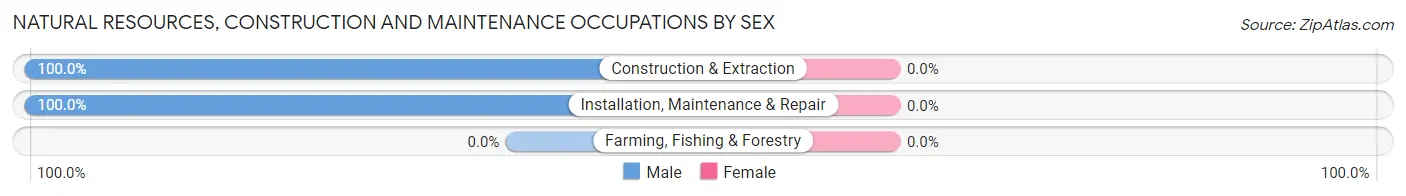
| Occupation | Male | Female |
| Farming, Fishing & Forestry | 0 (0.0%) | 0 (0.0%) |
| Construction & Extraction | 102 (100.0%) | 0 (0.0%) |
| Installation, Maintenance & Repair | 16 (100.0%) | 0 (0.0%) |
| Total (Category) | 118 (100.0%) | 0 (0.0%) |
| Total (Overall) | 290 (57.4%) | 215 (42.6%) |
Production, Transportation and Moving Occupations
The most common Production, Transportation and Moving occupations in Buna are Production (66 | 13.1%), Transportation (4 | 0.8%), and Material Moving (4 | 0.8%).
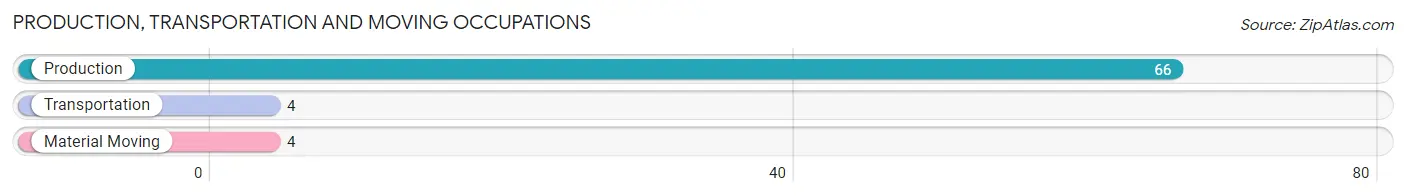
Production, Transportation and Moving Occupations by Sex
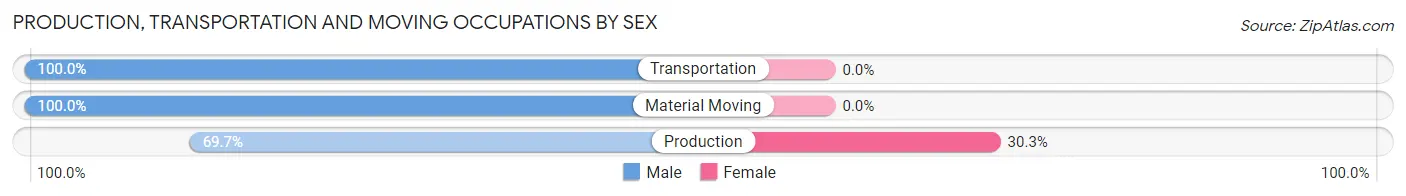
| Occupation | Male | Female |
| Production | 46 (69.7%) | 20 (30.3%) |
| Transportation | 4 (100.0%) | 0 (0.0%) |
| Material Moving | 4 (100.0%) | 0 (0.0%) |
| Total (Category) | 54 (73.0%) | 20 (27.0%) |
| Total (Overall) | 290 (57.4%) | 215 (42.6%) |
Employment Industries by Sex in Buna
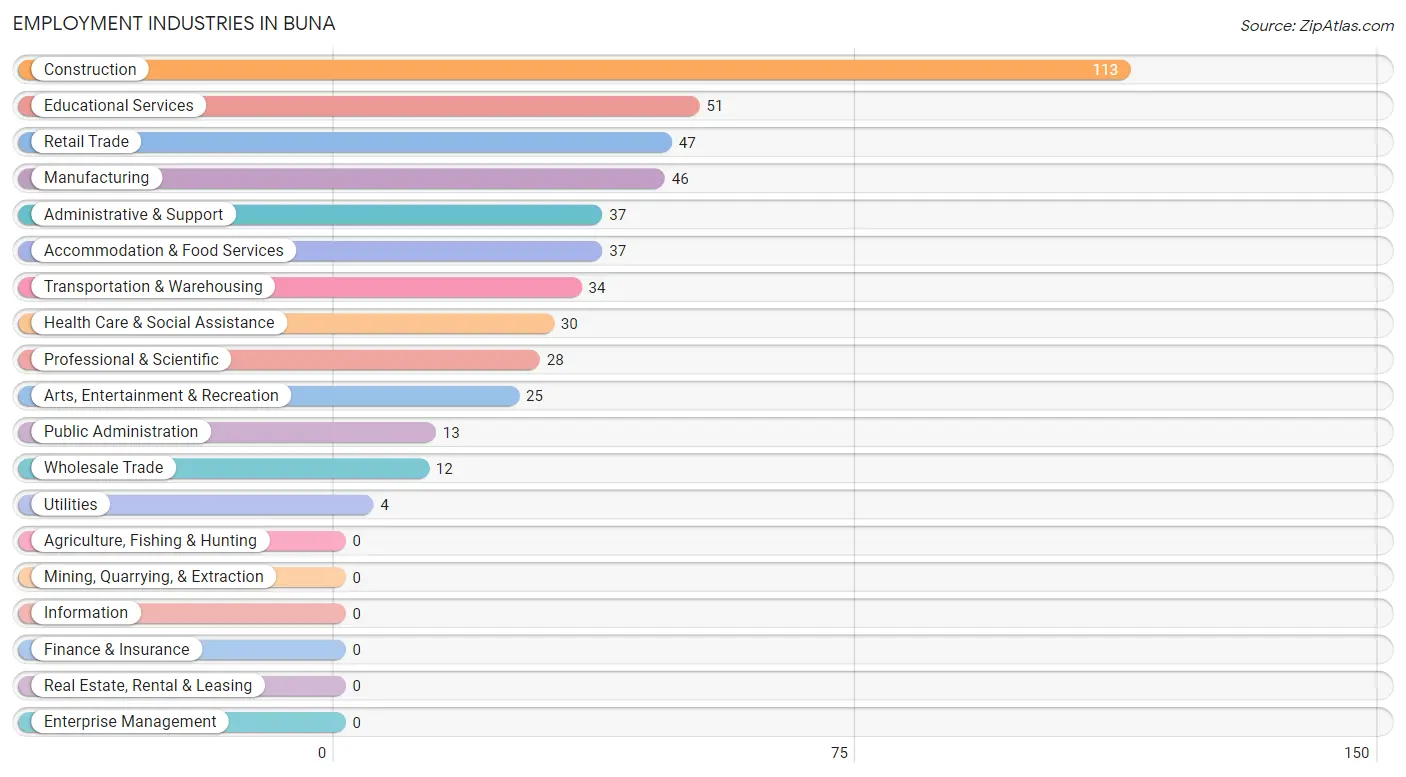
Employment Industries in Buna
The major employment industries in Buna include Construction (113 | 22.4%), Educational Services (51 | 10.1%), Retail Trade (47 | 9.3%), Manufacturing (46 | 9.1%), and Administrative & Support (37 | 7.3%).
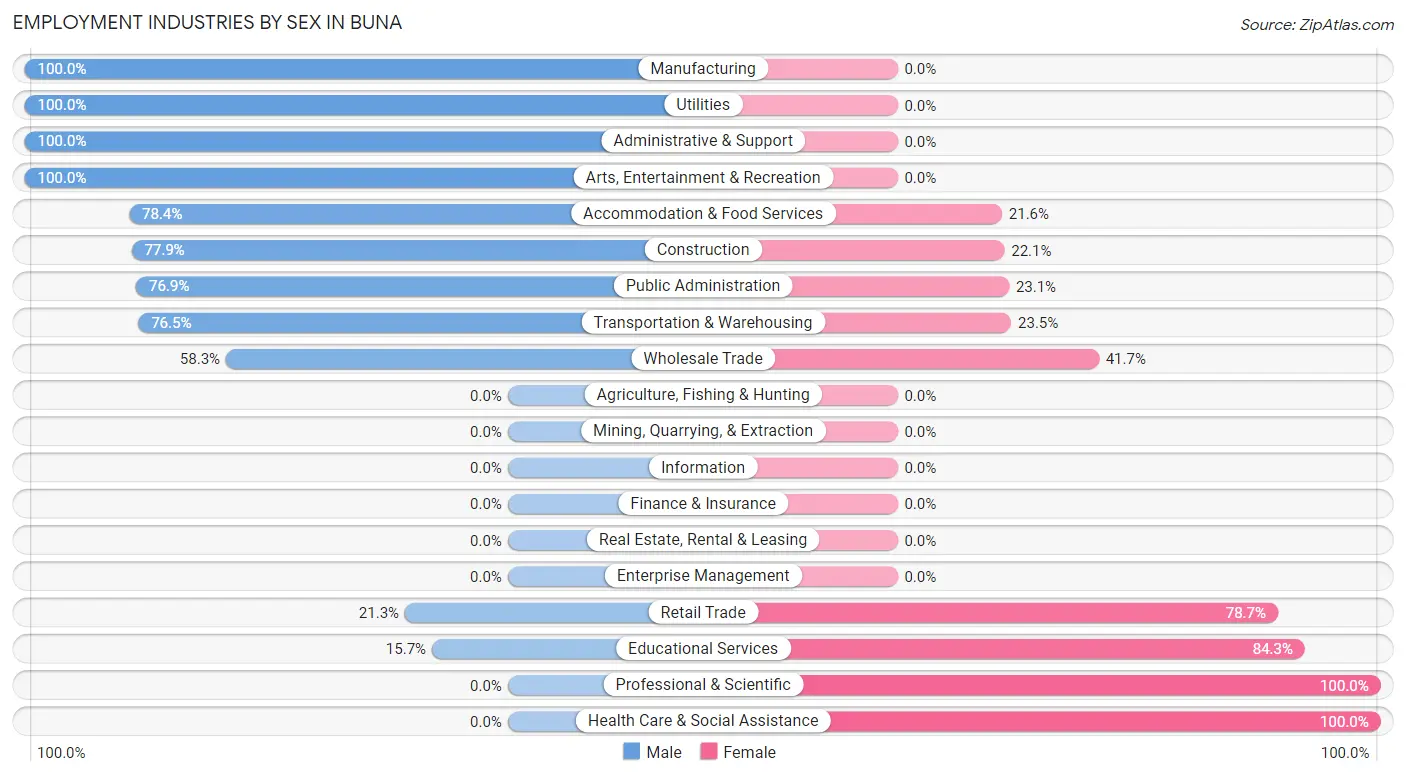
Employment Industries by Sex in Buna
The Buna industries that see more men than women are Manufacturing (100.0%), Utilities (100.0%), and Administrative & Support (100.0%), whereas the industries that tend to have a higher number of women are Professional & Scientific (100.0%), Health Care & Social Assistance (100.0%), and Educational Services (84.3%).
| Industry | Male | Female |
| Agriculture, Fishing & Hunting | 0 (0.0%) | 0 (0.0%) |
| Mining, Quarrying, & Extraction | 0 (0.0%) | 0 (0.0%) |
| Construction | 88 (77.9%) | 25 (22.1%) |
| Manufacturing | 46 (100.0%) | 0 (0.0%) |
| Wholesale Trade | 7 (58.3%) | 5 (41.7%) |
| Retail Trade | 10 (21.3%) | 37 (78.7%) |
| Transportation & Warehousing | 26 (76.5%) | 8 (23.5%) |
| Utilities | 4 (100.0%) | 0 (0.0%) |
| Information | 0 (0.0%) | 0 (0.0%) |
| Finance & Insurance | 0 (0.0%) | 0 (0.0%) |
| Real Estate, Rental & Leasing | 0 (0.0%) | 0 (0.0%) |
| Professional & Scientific | 0 (0.0%) | 28 (100.0%) |
| Enterprise Management | 0 (0.0%) | 0 (0.0%) |
| Administrative & Support | 37 (100.0%) | 0 (0.0%) |
| Educational Services | 8 (15.7%) | 43 (84.3%) |
| Health Care & Social Assistance | 0 (0.0%) | 30 (100.0%) |
| Arts, Entertainment & Recreation | 25 (100.0%) | 0 (0.0%) |
| Accommodation & Food Services | 29 (78.4%) | 8 (21.6%) |
| Public Administration | 10 (76.9%) | 3 (23.1%) |
| Total | 290 (57.4%) | 215 (42.6%) |
Education in Buna
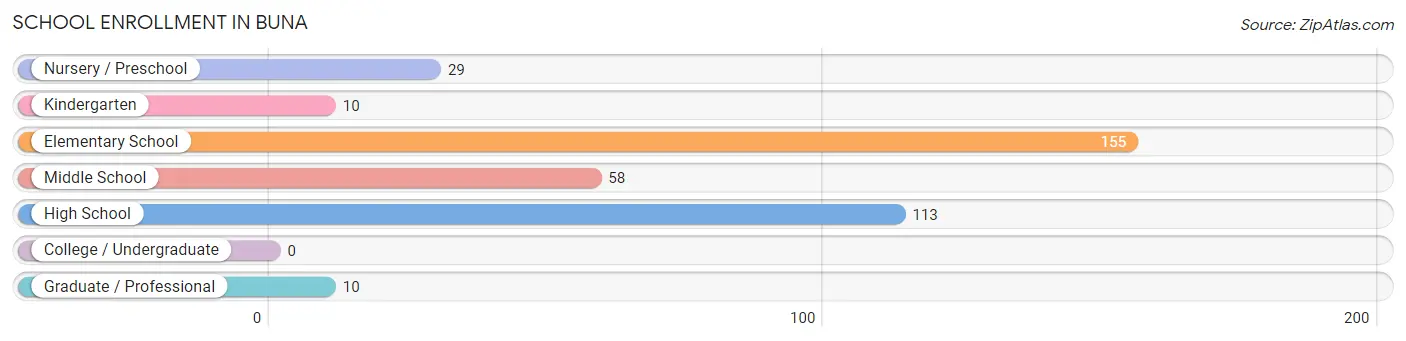
School Enrollment in Buna
The most common levels of schooling among the 375 students in Buna are elementary school (155 | 41.3%), high school (113 | 30.1%), and middle school (58 | 15.5%).
| School Level | # Students | % Students |
| Nursery / Preschool | 29 | 7.7% |
| Kindergarten | 10 | 2.7% |
| Elementary School | 155 | 41.3% |
| Middle School | 58 | 15.5% |
| High School | 113 | 30.1% |
| College / Undergraduate | 0 | 0.0% |
| Graduate / Professional | 10 | 2.7% |
| Total | 375 | 100.0% |
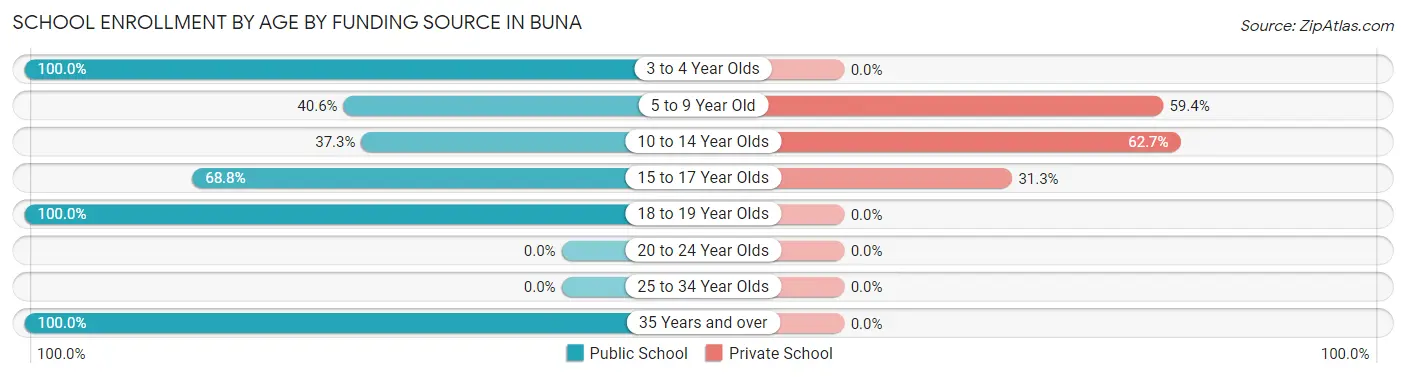
School Enrollment by Age by Funding Source in Buna
Out of a total of 375 students who are enrolled in schools in Buna, 170 (45.3%) attend a private institution, while the remaining 205 (54.7%) are enrolled in public schools. The age group of 10 to 14 year olds has the highest likelihood of being enrolled in private schools, with 74 (62.7% in the age bracket) enrolled. Conversely, the age group of 3 to 4 year olds has the lowest likelihood of being enrolled in a private school, with 26 (100.0% in the age bracket) attending a public institution.
| Age Bracket | Public School | Private School |
| 3 to 4 Year Olds | 26 (100.0%) | 0 (0.0%) |
| 5 to 9 Year Old | 52 (40.6%) | 76 (59.4%) |
| 10 to 14 Year Olds | 44 (37.3%) | 74 (62.7%) |
| 15 to 17 Year Olds | 44 (68.8%) | 20 (31.2%) |
| 18 to 19 Year Olds | 29 (100.0%) | 0 (0.0%) |
| 20 to 24 Year Olds | 0 (0.0%) | 0 (0.0%) |
| 25 to 34 Year Olds | 0 (0.0%) | 0 (0.0%) |
| 35 Years and over | 10 (100.0%) | 0 (0.0%) |
| Total | 205 (54.7%) | 170 (45.3%) |
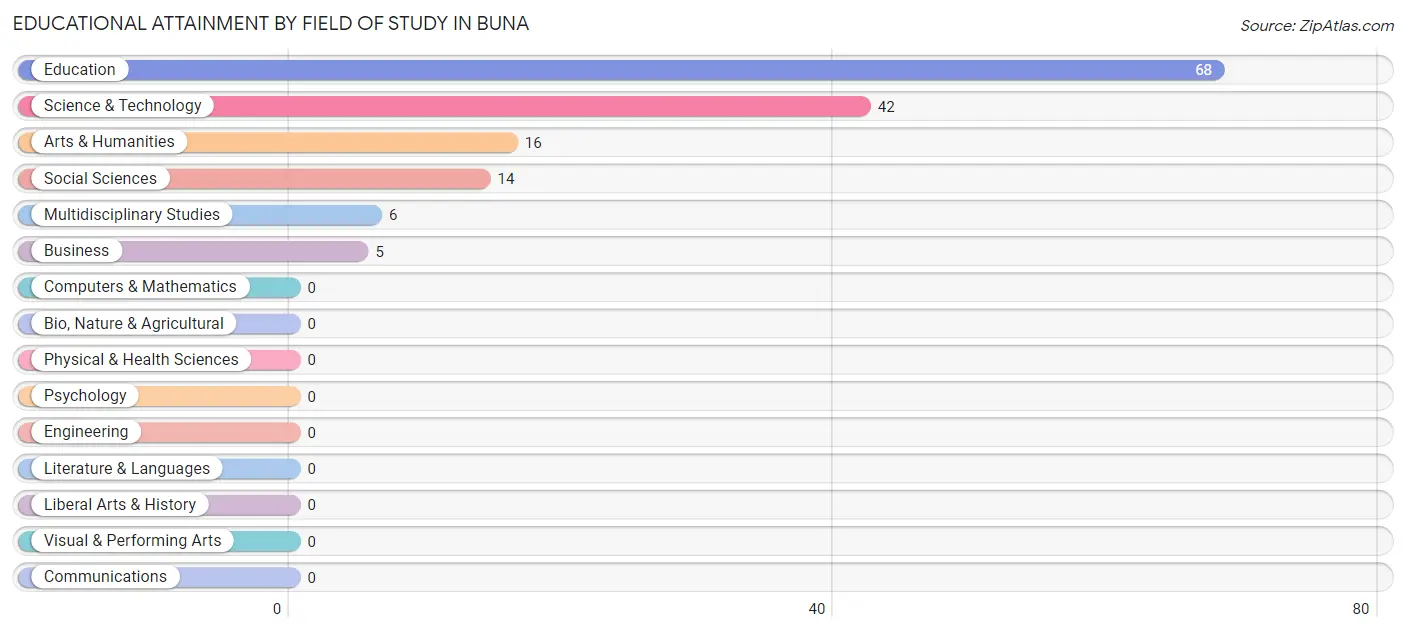
Educational Attainment by Field of Study in Buna
Education (68 | 45.0%), science & technology (42 | 27.8%), arts & humanities (16 | 10.6%), social sciences (14 | 9.3%), and multidisciplinary studies (6 | 4.0%) are the most common fields of study among 151 individuals in Buna who have obtained a bachelor's degree or higher.
| Field of Study | # Graduates | % Graduates |
| Computers & Mathematics | 0 | 0.0% |
| Bio, Nature & Agricultural | 0 | 0.0% |
| Physical & Health Sciences | 0 | 0.0% |
| Psychology | 0 | 0.0% |
| Social Sciences | 14 | 9.3% |
| Engineering | 0 | 0.0% |
| Multidisciplinary Studies | 6 | 4.0% |
| Science & Technology | 42 | 27.8% |
| Business | 5 | 3.3% |
| Education | 68 | 45.0% |
| Literature & Languages | 0 | 0.0% |
| Liberal Arts & History | 0 | 0.0% |
| Visual & Performing Arts | 0 | 0.0% |
| Communications | 0 | 0.0% |
| Arts & Humanities | 16 | 10.6% |
| Total | 151 | 100.0% |
Transportation & Commute in Buna
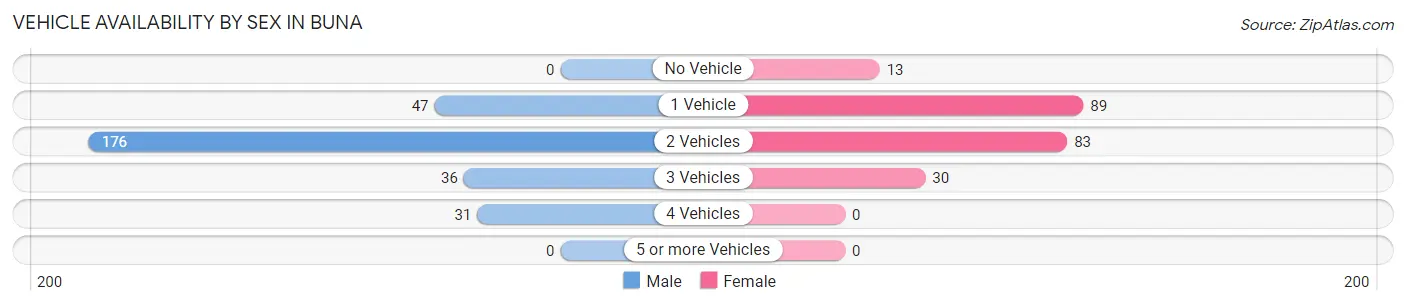
Vehicle Availability by Sex in Buna
The most prevalent vehicle ownership categories in Buna are males with 2 vehicles (176, accounting for 60.7%) and females with 2 vehicles (83, making up 81.9%).
| Vehicles Available | Male | Female |
| No Vehicle | 0 (0.0%) | 13 (6.0%) |
| 1 Vehicle | 47 (16.2%) | 89 (41.4%) |
| 2 Vehicles | 176 (60.7%) | 83 (38.6%) |
| 3 Vehicles | 36 (12.4%) | 30 (14.0%) |
| 4 Vehicles | 31 (10.7%) | 0 (0.0%) |
| 5 or more Vehicles | 0 (0.0%) | 0 (0.0%) |
| Total | 290 (100.0%) | 215 (100.0%) |
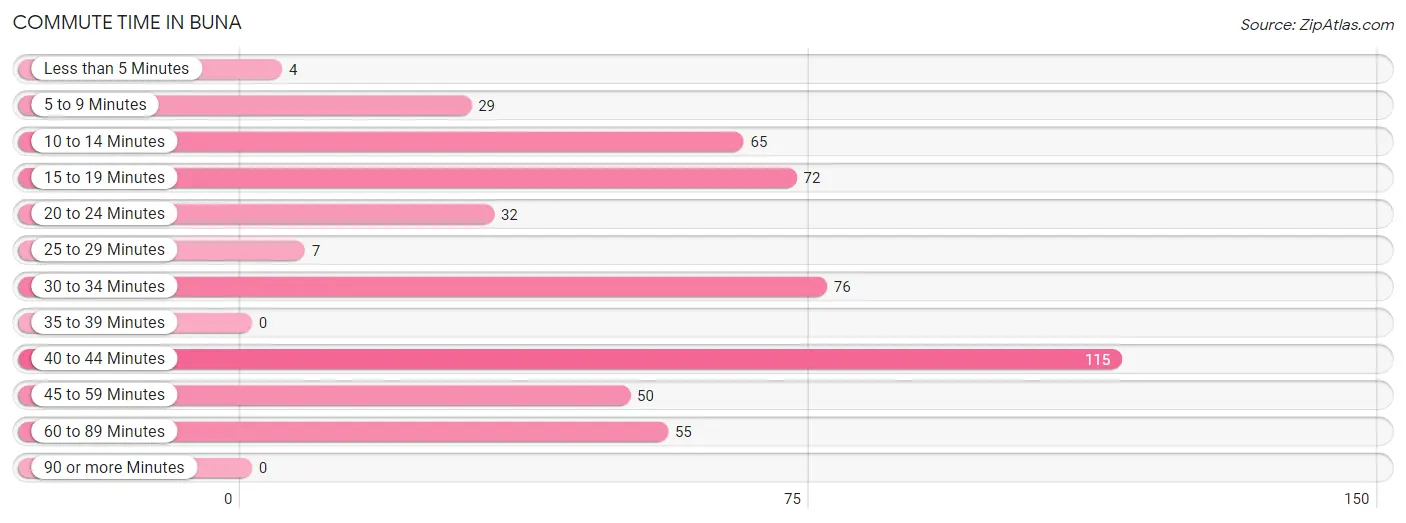
Commute Time in Buna
The most frequently occuring commute durations in Buna are 40 to 44 minutes (115 commuters, 22.8%), 30 to 34 minutes (76 commuters, 15.0%), and 15 to 19 minutes (72 commuters, 14.3%).
| Commute Time | # Commuters | % Commuters |
| Less than 5 Minutes | 4 | 0.8% |
| 5 to 9 Minutes | 29 | 5.7% |
| 10 to 14 Minutes | 65 | 12.9% |
| 15 to 19 Minutes | 72 | 14.3% |
| 20 to 24 Minutes | 32 | 6.3% |
| 25 to 29 Minutes | 7 | 1.4% |
| 30 to 34 Minutes | 76 | 15.0% |
| 35 to 39 Minutes | 0 | 0.0% |
| 40 to 44 Minutes | 115 | 22.8% |
| 45 to 59 Minutes | 50 | 9.9% |
| 60 to 89 Minutes | 55 | 10.9% |
| 90 or more Minutes | 0 | 0.0% |
Commute Time by Sex in Buna
The most common commute times in Buna are 40 to 44 minutes (74 commuters, 25.5%) for males and 45 to 59 minutes (47 commuters, 21.9%) for females.
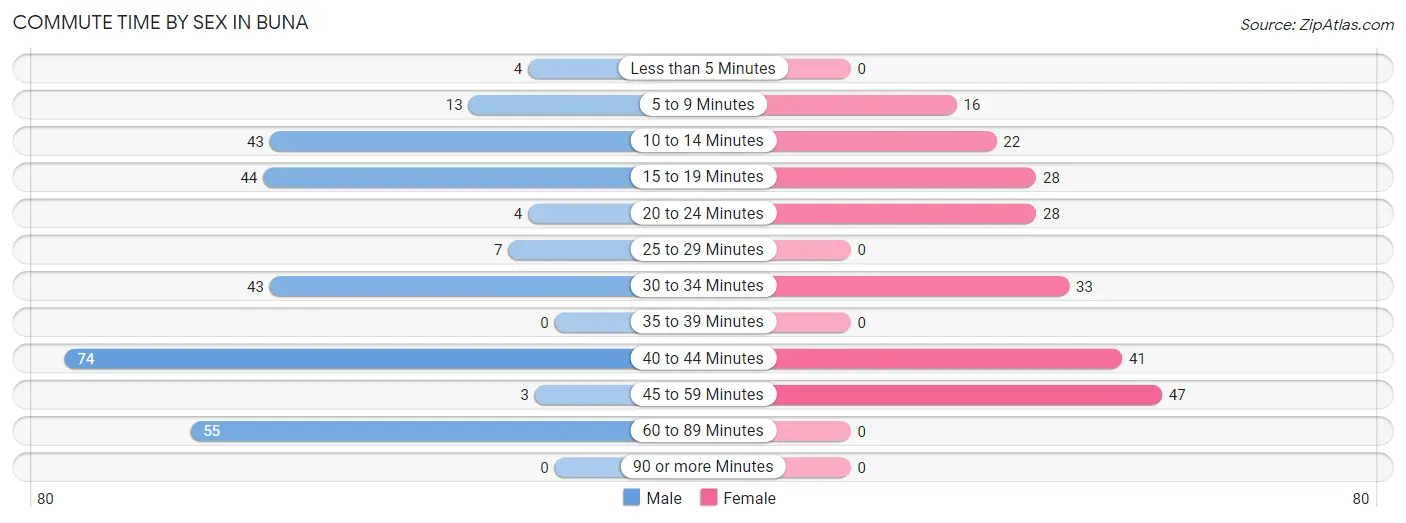
| Commute Time | Male | Female |
| Less than 5 Minutes | 4 (1.4%) | 0 (0.0%) |
| 5 to 9 Minutes | 13 (4.5%) | 16 (7.4%) |
| 10 to 14 Minutes | 43 (14.8%) | 22 (10.2%) |
| 15 to 19 Minutes | 44 (15.2%) | 28 (13.0%) |
| 20 to 24 Minutes | 4 (1.4%) | 28 (13.0%) |
| 25 to 29 Minutes | 7 (2.4%) | 0 (0.0%) |
| 30 to 34 Minutes | 43 (14.8%) | 33 (15.3%) |
| 35 to 39 Minutes | 0 (0.0%) | 0 (0.0%) |
| 40 to 44 Minutes | 74 (25.5%) | 41 (19.1%) |
| 45 to 59 Minutes | 3 (1.0%) | 47 (21.9%) |
| 60 to 89 Minutes | 55 (19.0%) | 0 (0.0%) |
| 90 or more Minutes | 0 (0.0%) | 0 (0.0%) |
Time of Departure to Work by Sex in Buna
The most frequent times of departure to work in Buna are 6:00 AM to 6:29 AM (78, 26.9%) for males and 7:00 AM to 7:29 AM (80, 37.2%) for females.
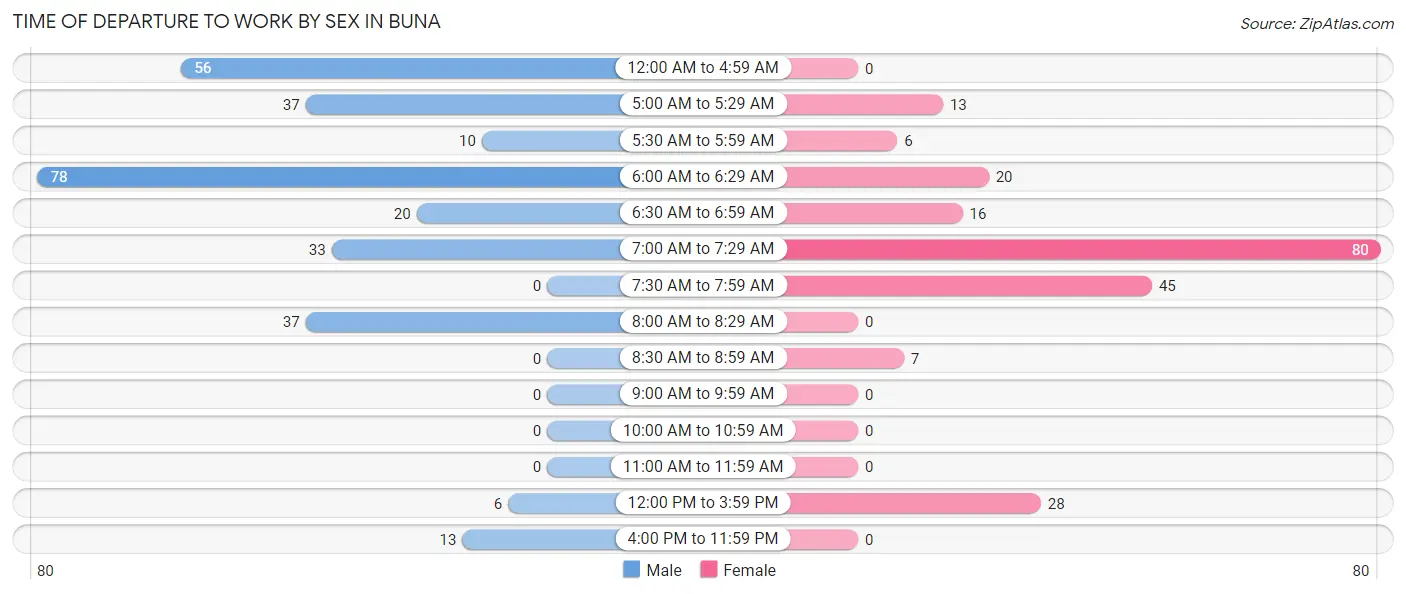
| Time of Departure | Male | Female |
| 12:00 AM to 4:59 AM | 56 (19.3%) | 0 (0.0%) |
| 5:00 AM to 5:29 AM | 37 (12.8%) | 13 (6.0%) |
| 5:30 AM to 5:59 AM | 10 (3.5%) | 6 (2.8%) |
| 6:00 AM to 6:29 AM | 78 (26.9%) | 20 (9.3%) |
| 6:30 AM to 6:59 AM | 20 (6.9%) | 16 (7.4%) |
| 7:00 AM to 7:29 AM | 33 (11.4%) | 80 (37.2%) |
| 7:30 AM to 7:59 AM | 0 (0.0%) | 45 (20.9%) |
| 8:00 AM to 8:29 AM | 37 (12.8%) | 0 (0.0%) |
| 8:30 AM to 8:59 AM | 0 (0.0%) | 7 (3.3%) |
| 9:00 AM to 9:59 AM | 0 (0.0%) | 0 (0.0%) |
| 10:00 AM to 10:59 AM | 0 (0.0%) | 0 (0.0%) |
| 11:00 AM to 11:59 AM | 0 (0.0%) | 0 (0.0%) |
| 12:00 PM to 3:59 PM | 6 (2.1%) | 28 (13.0%) |
| 4:00 PM to 11:59 PM | 13 (4.5%) | 0 (0.0%) |
| Total | 290 (100.0%) | 215 (100.0%) |
Housing Occupancy in Buna
Occupancy by Ownership in Buna
Of the total 820 dwellings in Buna, owner-occupied units account for 644 (78.5%), while renter-occupied units make up 176 (21.5%).
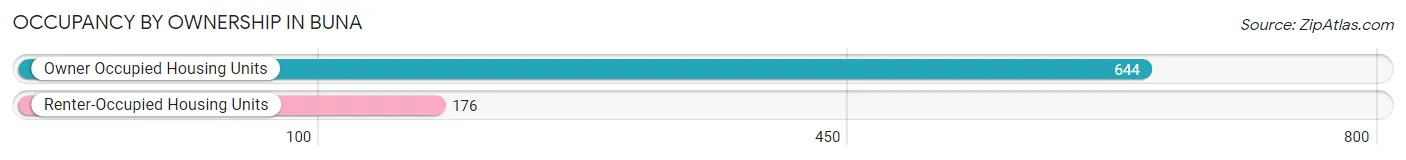
| Occupancy | # Housing Units | % Housing Units |
| Owner Occupied Housing Units | 644 | 78.5% |
| Renter-Occupied Housing Units | 176 | 21.5% |
| Total Occupied Housing Units | 820 | 100.0% |
Occupancy by Household Size in Buna
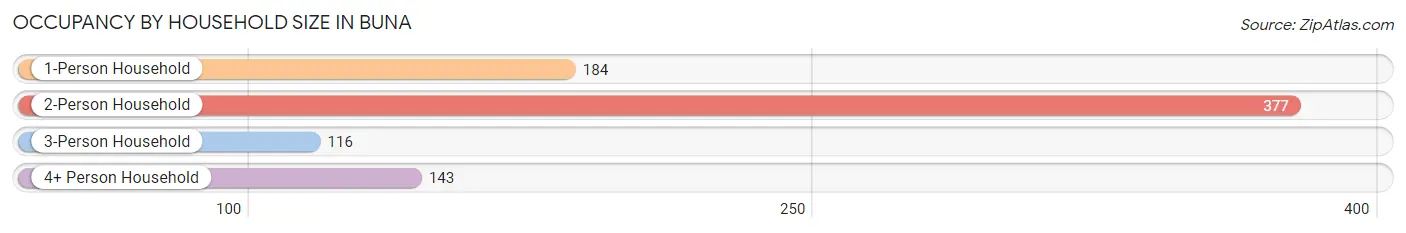
| Household Size | # Housing Units | % Housing Units |
| 1-Person Household | 184 | 22.4% |
| 2-Person Household | 377 | 46.0% |
| 3-Person Household | 116 | 14.1% |
| 4+ Person Household | 143 | 17.4% |
| Total Housing Units | 820 | 100.0% |
Occupancy by Ownership by Household Size in Buna
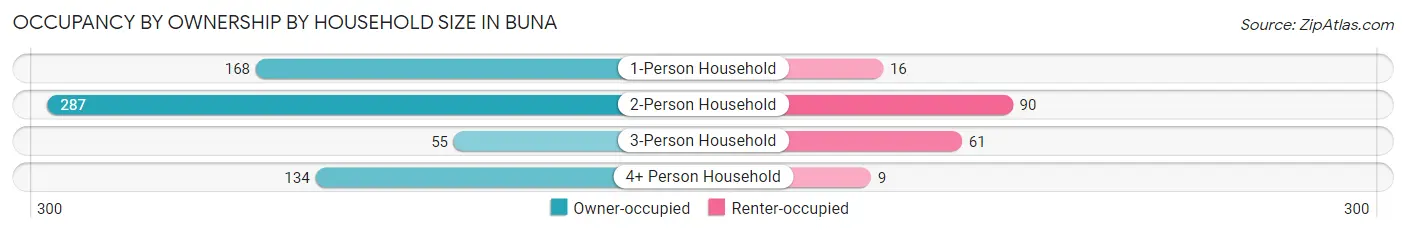
| Household Size | Owner-occupied | Renter-occupied |
| 1-Person Household | 168 (91.3%) | 16 (8.7%) |
| 2-Person Household | 287 (76.1%) | 90 (23.9%) |
| 3-Person Household | 55 (47.4%) | 61 (52.6%) |
| 4+ Person Household | 134 (93.7%) | 9 (6.3%) |
| Total Housing Units | 644 (78.5%) | 176 (21.5%) |
Occupancy by Educational Attainment in Buna
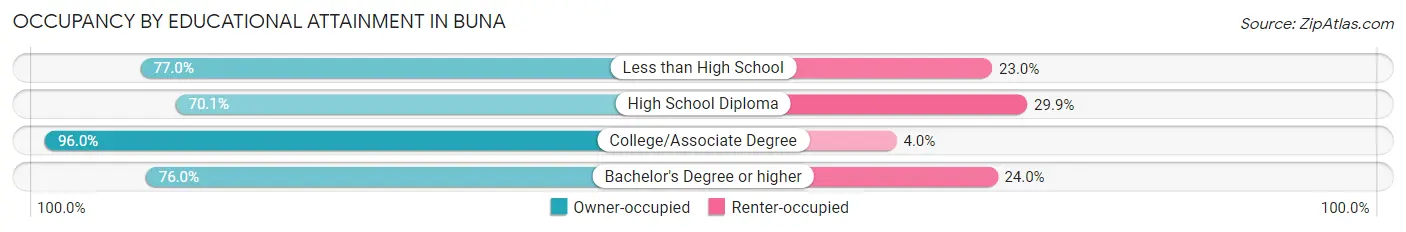
| Household Size | Owner-occupied | Renter-occupied |
| Less than High School | 134 (77.0%) | 40 (23.0%) |
| High School Diploma | 241 (70.1%) | 103 (29.9%) |
| College/Associate Degree | 190 (96.0%) | 8 (4.0%) |
| Bachelor's Degree or higher | 79 (76.0%) | 25 (24.0%) |
Occupancy by Age of Householder in Buna
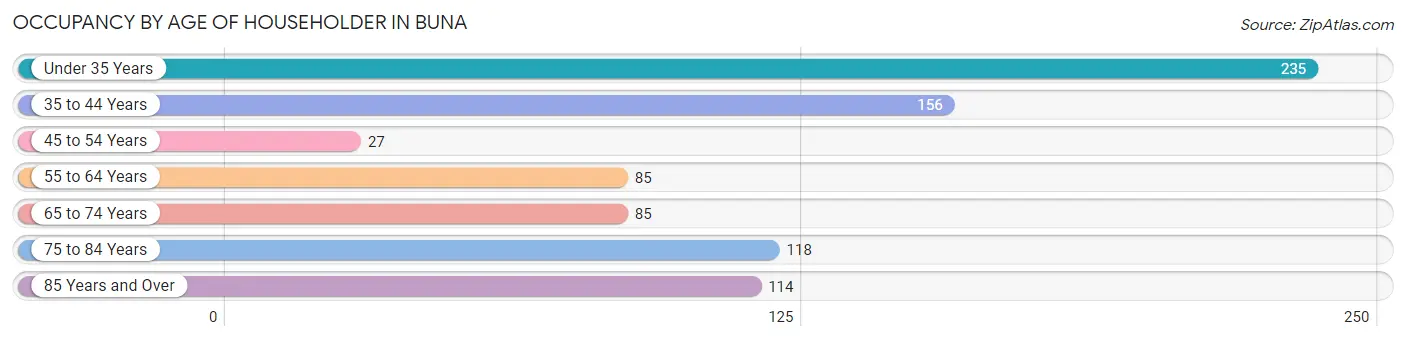
| Age Bracket | # Households | % Households |
| Under 35 Years | 235 | 28.7% |
| 35 to 44 Years | 156 | 19.0% |
| 45 to 54 Years | 27 | 3.3% |
| 55 to 64 Years | 85 | 10.4% |
| 65 to 74 Years | 85 | 10.4% |
| 75 to 84 Years | 118 | 14.4% |
| 85 Years and Over | 114 | 13.9% |
| Total | 820 | 100.0% |
Housing Finances in Buna
Median Income by Occupancy in Buna
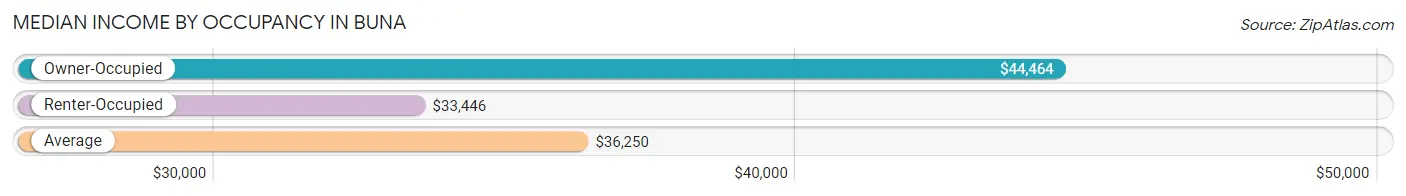
| Occupancy Type | # Households | Median Income |
| Owner-Occupied | 644 (78.5%) | $44,464 |
| Renter-Occupied | 176 (21.5%) | $33,446 |
| Average | 820 (100.0%) | $36,250 |
Occupancy by Householder Income Bracket in Buna
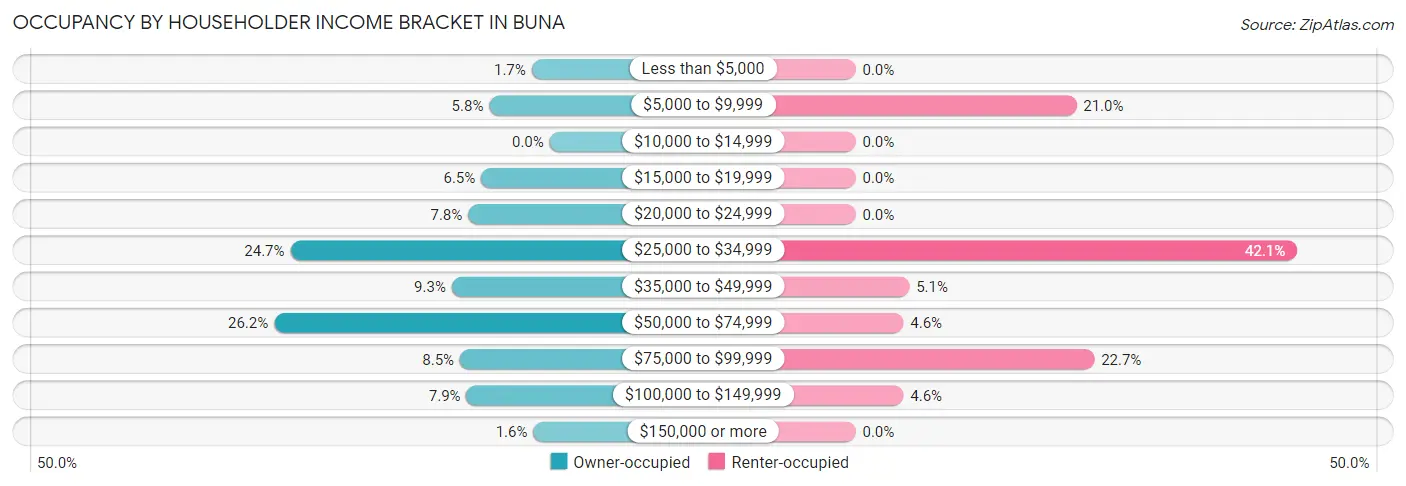
| Income Bracket | Owner-occupied | Renter-occupied |
| Less than $5,000 | 11 (1.7%) | 0 (0.0%) |
| $5,000 to $9,999 | 37 (5.8%) | 37 (21.0%) |
| $10,000 to $14,999 | 0 (0.0%) | 0 (0.0%) |
| $15,000 to $19,999 | 42 (6.5%) | 0 (0.0%) |
| $20,000 to $24,999 | 50 (7.8%) | 0 (0.0%) |
| $25,000 to $34,999 | 159 (24.7%) | 74 (42.0%) |
| $35,000 to $49,999 | 60 (9.3%) | 9 (5.1%) |
| $50,000 to $74,999 | 169 (26.2%) | 8 (4.5%) |
| $75,000 to $99,999 | 55 (8.5%) | 40 (22.7%) |
| $100,000 to $149,999 | 51 (7.9%) | 8 (4.5%) |
| $150,000 or more | 10 (1.5%) | 0 (0.0%) |
| Total | 644 (100.0%) | 176 (100.0%) |
Monthly Housing Cost Tiers in Buna
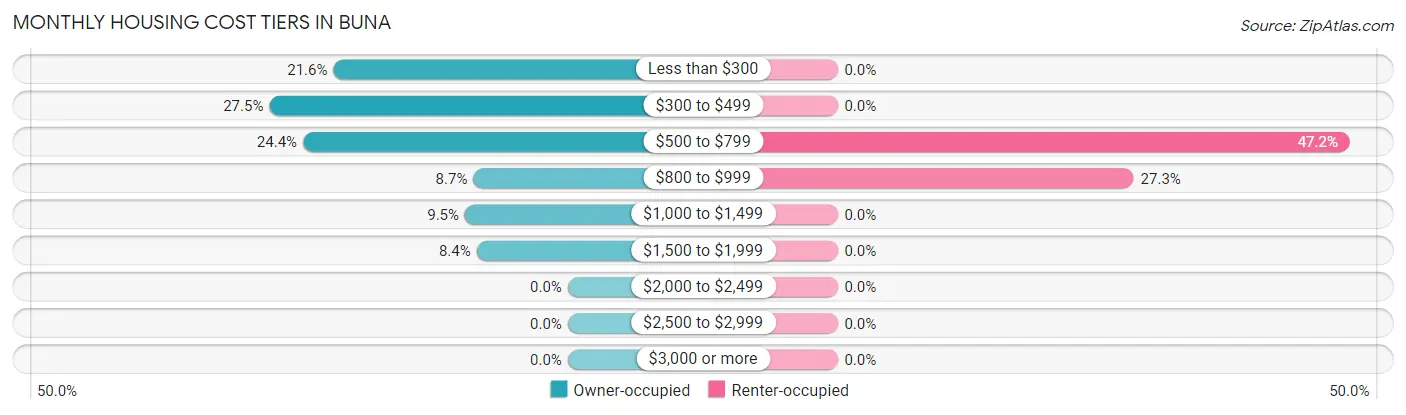
| Monthly Cost | Owner-occupied | Renter-occupied |
| Less than $300 | 139 (21.6%) | 0 (0.0%) |
| $300 to $499 | 177 (27.5%) | 0 (0.0%) |
| $500 to $799 | 157 (24.4%) | 83 (47.2%) |
| $800 to $999 | 56 (8.7%) | 48 (27.3%) |
| $1,000 to $1,499 | 61 (9.5%) | 0 (0.0%) |
| $1,500 to $1,999 | 54 (8.4%) | 0 (0.0%) |
| $2,000 to $2,499 | 0 (0.0%) | 0 (0.0%) |
| $2,500 to $2,999 | 0 (0.0%) | 0 (0.0%) |
| $3,000 or more | 0 (0.0%) | 0 (0.0%) |
| Total | 644 (100.0%) | 176 (100.0%) |
Physical Housing Characteristics in Buna
Housing Structures in Buna
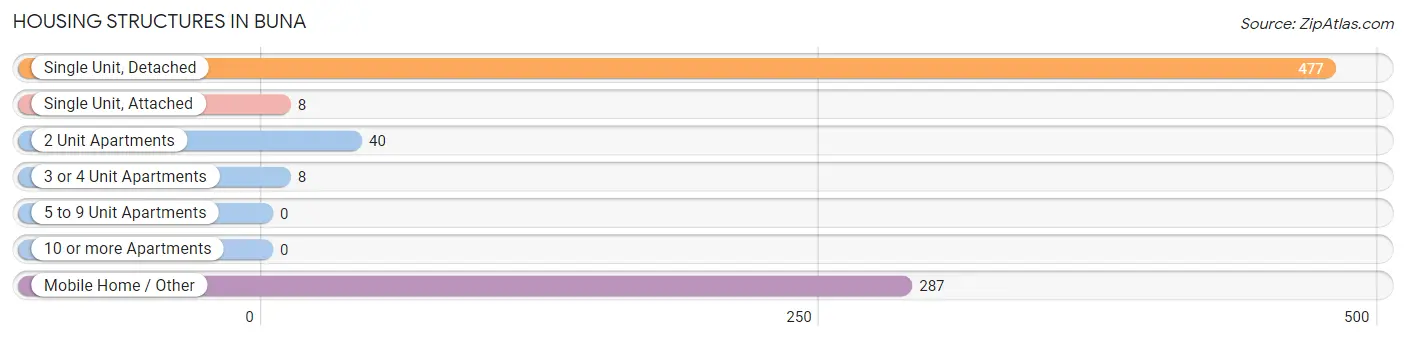
| Structure Type | # Housing Units | % Housing Units |
| Single Unit, Detached | 477 | 58.2% |
| Single Unit, Attached | 8 | 1.0% |
| 2 Unit Apartments | 40 | 4.9% |
| 3 or 4 Unit Apartments | 8 | 1.0% |
| 5 to 9 Unit Apartments | 0 | 0.0% |
| 10 or more Apartments | 0 | 0.0% |
| Mobile Home / Other | 287 | 35.0% |
| Total | 820 | 100.0% |
Housing Structures by Occupancy in Buna
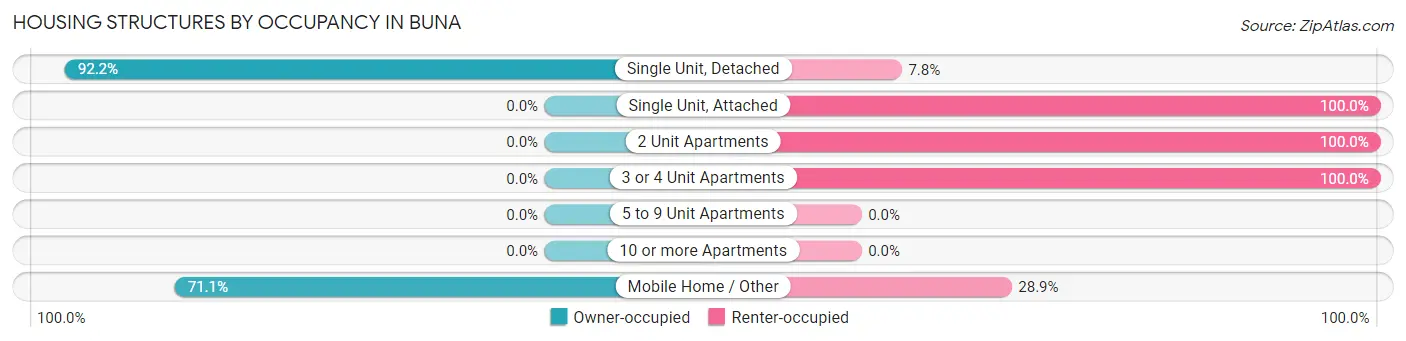
| Structure Type | Owner-occupied | Renter-occupied |
| Single Unit, Detached | 440 (92.2%) | 37 (7.8%) |
| Single Unit, Attached | 0 (0.0%) | 8 (100.0%) |
| 2 Unit Apartments | 0 (0.0%) | 40 (100.0%) |
| 3 or 4 Unit Apartments | 0 (0.0%) | 8 (100.0%) |
| 5 to 9 Unit Apartments | 0 (0.0%) | 0 (0.0%) |
| 10 or more Apartments | 0 (0.0%) | 0 (0.0%) |
| Mobile Home / Other | 204 (71.1%) | 83 (28.9%) |
| Total | 644 (78.5%) | 176 (21.5%) |
Housing Structures by Number of Rooms in Buna
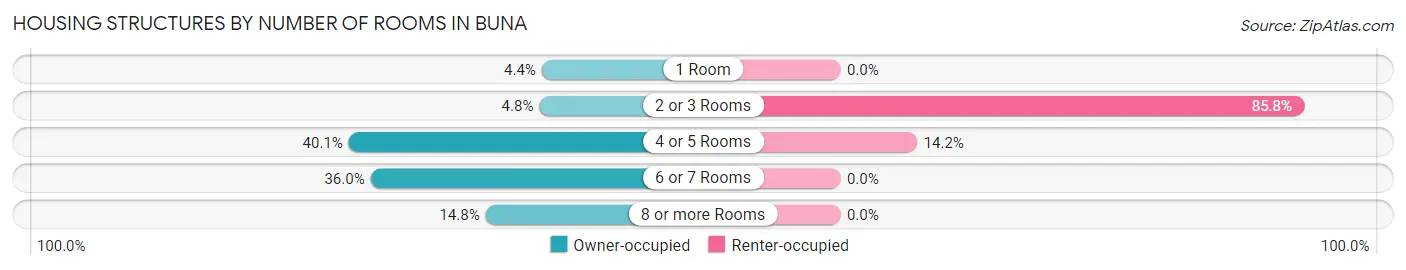
| Number of Rooms | Owner-occupied | Renter-occupied |
| 1 Room | 28 (4.3%) | 0 (0.0%) |
| 2 or 3 Rooms | 31 (4.8%) | 151 (85.8%) |
| 4 or 5 Rooms | 258 (40.1%) | 25 (14.2%) |
| 6 or 7 Rooms | 232 (36.0%) | 0 (0.0%) |
| 8 or more Rooms | 95 (14.7%) | 0 (0.0%) |
| Total | 644 (100.0%) | 176 (100.0%) |
Housing Structure by Heating Type in Buna
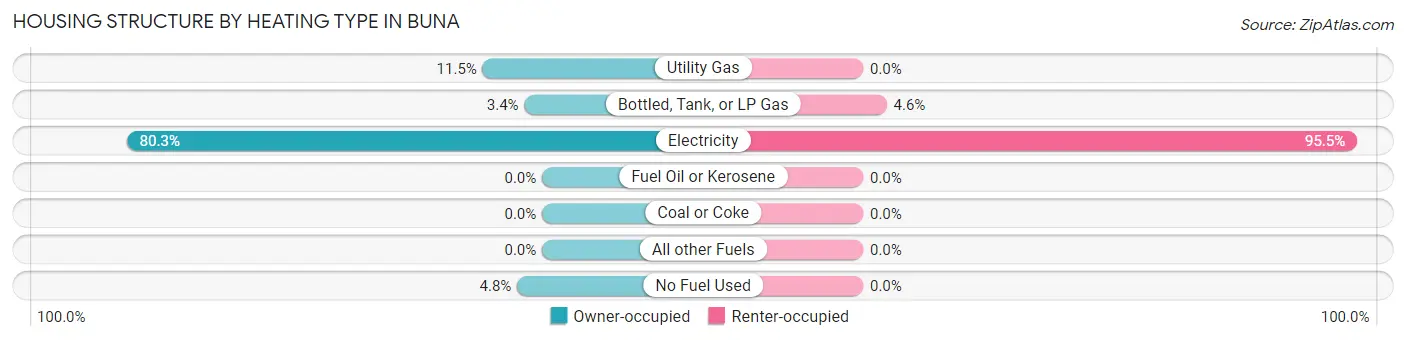
| Heating Type | Owner-occupied | Renter-occupied |
| Utility Gas | 74 (11.5%) | 0 (0.0%) |
| Bottled, Tank, or LP Gas | 22 (3.4%) | 8 (4.5%) |
| Electricity | 517 (80.3%) | 168 (95.5%) |
| Fuel Oil or Kerosene | 0 (0.0%) | 0 (0.0%) |
| Coal or Coke | 0 (0.0%) | 0 (0.0%) |
| All other Fuels | 0 (0.0%) | 0 (0.0%) |
| No Fuel Used | 31 (4.8%) | 0 (0.0%) |
| Total | 644 (100.0%) | 176 (100.0%) |
Household Vehicle Usage in Buna
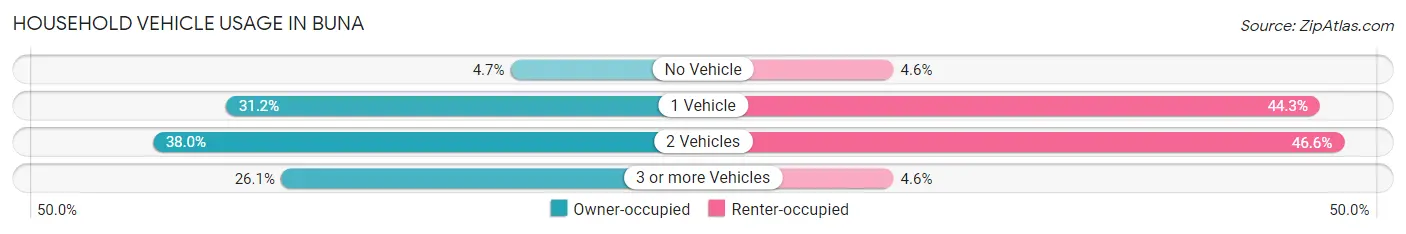
| Vehicles per Household | Owner-occupied | Renter-occupied |
| No Vehicle | 30 (4.7%) | 8 (4.5%) |
| 1 Vehicle | 201 (31.2%) | 78 (44.3%) |
| 2 Vehicles | 245 (38.0%) | 82 (46.6%) |
| 3 or more Vehicles | 168 (26.1%) | 8 (4.5%) |
| Total | 644 (100.0%) | 176 (100.0%) |
Real Estate & Mortgages in Buna
Real Estate and Mortgage Overview in Buna
| Characteristic | Without Mortgage | With Mortgage |
| Housing Units | 457 | 187 |
| Median Property Value | $88,100 | $144,300 |
| Median Household Income | - | - |
| Monthly Housing Costs | $366 | $0 |
| Real Estate Taxes | $1,051 | $6 |
Property Value by Mortgage Status in Buna
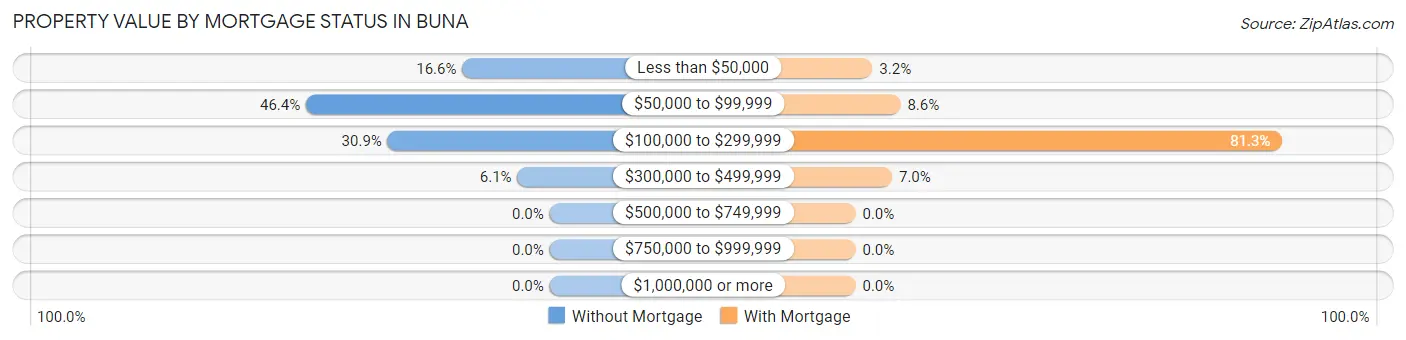
| Property Value | Without Mortgage | With Mortgage |
| Less than $50,000 | 76 (16.6%) | 6 (3.2%) |
| $50,000 to $99,999 | 212 (46.4%) | 16 (8.6%) |
| $100,000 to $299,999 | 141 (30.8%) | 152 (81.3%) |
| $300,000 to $499,999 | 28 (6.1%) | 13 (7.0%) |
| $500,000 to $749,999 | 0 (0.0%) | 0 (0.0%) |
| $750,000 to $999,999 | 0 (0.0%) | 0 (0.0%) |
| $1,000,000 or more | 0 (0.0%) | 0 (0.0%) |
| Total | 457 (100.0%) | 187 (100.0%) |
Household Income by Mortgage Status in Buna
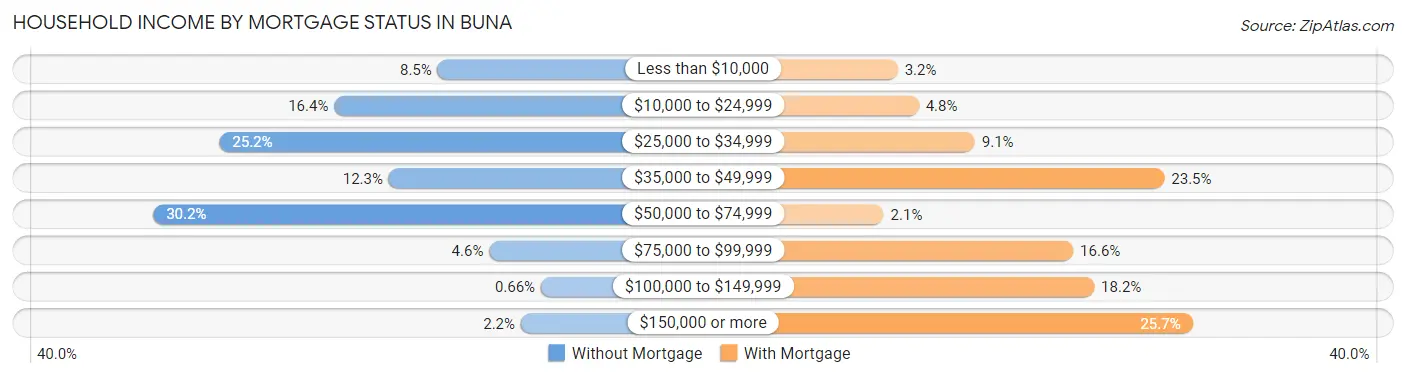
| Household Income | Without Mortgage | With Mortgage |
| Less than $10,000 | 39 (8.5%) | 6 (3.2%) |
| $10,000 to $24,999 | 75 (16.4%) | 9 (4.8%) |
| $25,000 to $34,999 | 115 (25.2%) | 17 (9.1%) |
| $35,000 to $49,999 | 56 (12.2%) | 44 (23.5%) |
| $50,000 to $74,999 | 138 (30.2%) | 4 (2.1%) |
| $75,000 to $99,999 | 21 (4.6%) | 31 (16.6%) |
| $100,000 to $149,999 | 3 (0.7%) | 34 (18.2%) |
| $150,000 or more | 10 (2.2%) | 48 (25.7%) |
| Total | 457 (100.0%) | 187 (100.0%) |
Property Value to Household Income Ratio in Buna
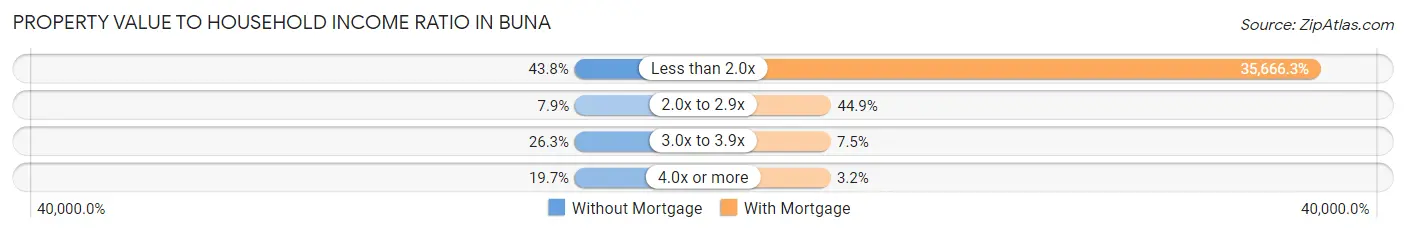
| Value-to-Income Ratio | Without Mortgage | With Mortgage |
| Less than 2.0x | 200 (43.8%) | 66,696 (35,666.3%) |
| 2.0x to 2.9x | 36 (7.9%) | 84 (44.9%) |
| 3.0x to 3.9x | 120 (26.3%) | 14 (7.5%) |
| 4.0x or more | 90 (19.7%) | 6 (3.2%) |
| Total | 457 (100.0%) | 187 (100.0%) |
Real Estate Taxes by Mortgage Status in Buna
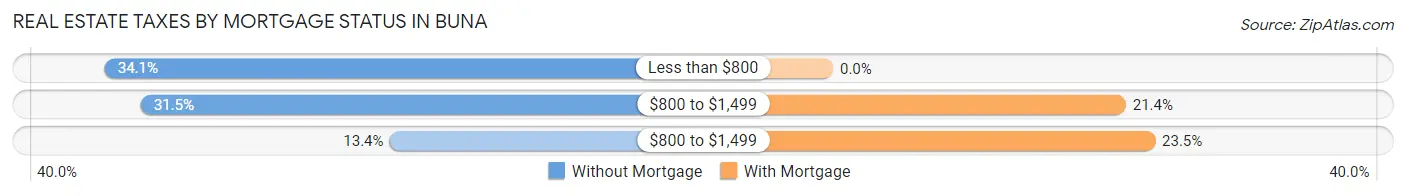
| Property Taxes | Without Mortgage | With Mortgage |
| Less than $800 | 156 (34.1%) | 0 (0.0%) |
| $800 to $1,499 | 144 (31.5%) | 40 (21.4%) |
| $800 to $1,499 | 61 (13.4%) | 44 (23.5%) |
| Total | 457 (100.0%) | 187 (100.0%) |
Health & Disability in Buna
Health Insurance Coverage by Age in Buna
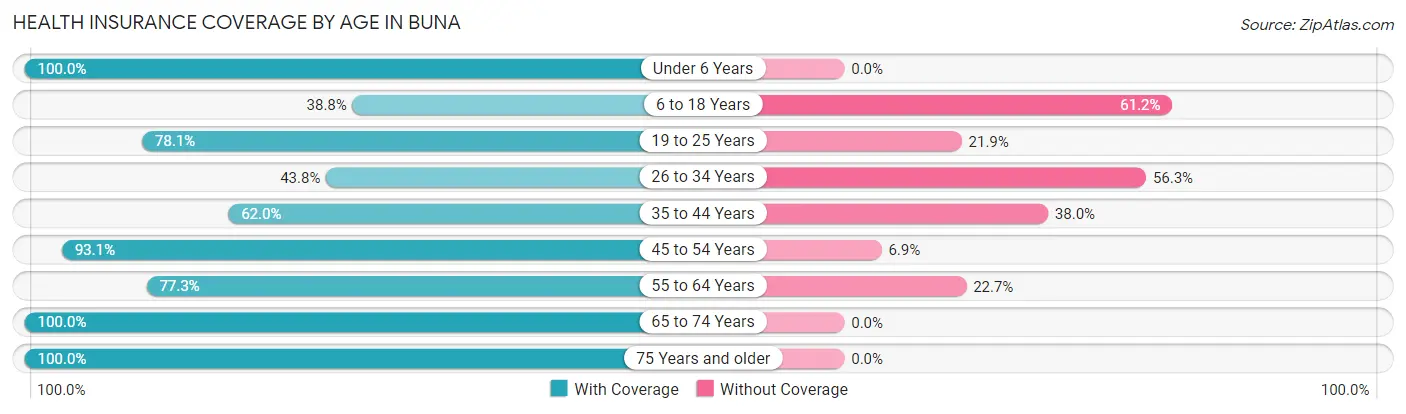
| Age Bracket | With Coverage | Without Coverage |
| Under 6 Years | 164 (100.0%) | 0 (0.0%) |
| 6 to 18 Years | 139 (38.8%) | 219 (61.2%) |
| 19 to 25 Years | 125 (78.1%) | 35 (21.9%) |
| 26 to 34 Years | 105 (43.8%) | 135 (56.2%) |
| 35 to 44 Years | 147 (62.0%) | 90 (38.0%) |
| 45 to 54 Years | 94 (93.1%) | 7 (6.9%) |
| 55 to 64 Years | 102 (77.3%) | 30 (22.7%) |
| 65 to 74 Years | 138 (100.0%) | 0 (0.0%) |
| 75 Years and older | 351 (100.0%) | 0 (0.0%) |
| Total | 1,365 (72.6%) | 516 (27.4%) |
Health Insurance Coverage by Citizenship Status in Buna
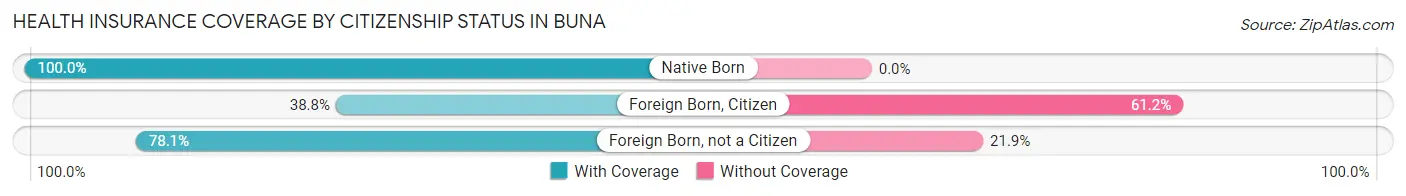
| Citizenship Status | With Coverage | Without Coverage |
| Native Born | 164 (100.0%) | 0 (0.0%) |
| Foreign Born, Citizen | 139 (38.8%) | 219 (61.2%) |
| Foreign Born, not a Citizen | 125 (78.1%) | 35 (21.9%) |
Health Insurance Coverage by Household Income in Buna
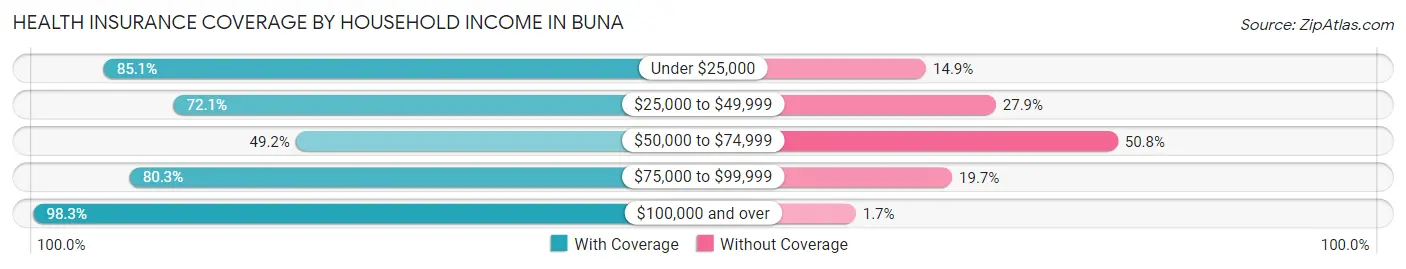
| Household Income | With Coverage | Without Coverage |
| Under $25,000 | 275 (85.1%) | 48 (14.9%) |
| $25,000 to $49,999 | 449 (72.1%) | 174 (27.9%) |
| $50,000 to $74,999 | 225 (49.2%) | 232 (50.8%) |
| $75,000 to $99,999 | 240 (80.3%) | 59 (19.7%) |
| $100,000 and over | 176 (98.3%) | 3 (1.7%) |
Public vs Private Health Insurance Coverage by Age in Buna
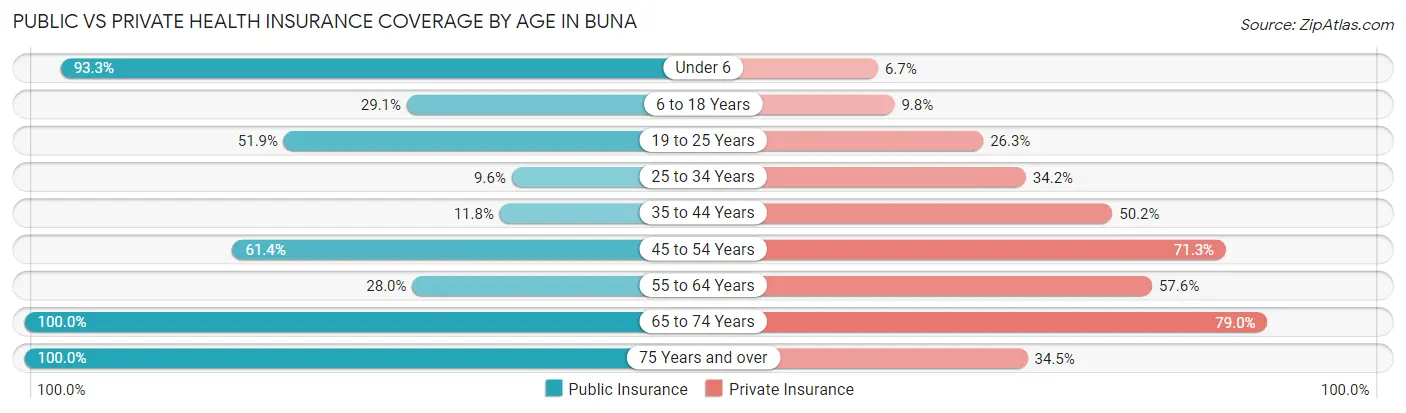
| Age Bracket | Public Insurance | Private Insurance |
| Under 6 | 153 (93.3%) | 11 (6.7%) |
| 6 to 18 Years | 104 (29.0%) | 35 (9.8%) |
| 19 to 25 Years | 83 (51.9%) | 42 (26.3%) |
| 25 to 34 Years | 23 (9.6%) | 82 (34.2%) |
| 35 to 44 Years | 28 (11.8%) | 119 (50.2%) |
| 45 to 54 Years | 62 (61.4%) | 72 (71.3%) |
| 55 to 64 Years | 37 (28.0%) | 76 (57.6%) |
| 65 to 74 Years | 138 (100.0%) | 109 (79.0%) |
| 75 Years and over | 351 (100.0%) | 121 (34.5%) |
| Total | 979 (52.0%) | 667 (35.5%) |
Disability Status by Sex by Age in Buna
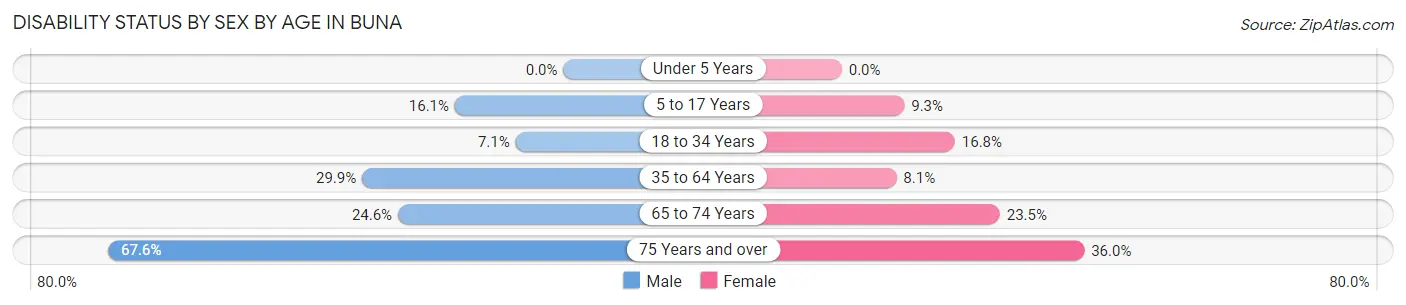
| Age Bracket | Male | Female |
| Under 5 Years | 0 (0.0%) | 0 (0.0%) |
| 5 to 17 Years | 24 (16.1%) | 27 (9.3%) |
| 18 to 34 Years | 11 (7.1%) | 45 (16.8%) |
| 35 to 64 Years | 52 (29.9%) | 24 (8.1%) |
| 65 to 74 Years | 14 (24.6%) | 19 (23.5%) |
| 75 Years and over | 119 (67.6%) | 63 (36.0%) |
Disability Class by Sex by Age in Buna
Disability Class: Hearing Difficulty
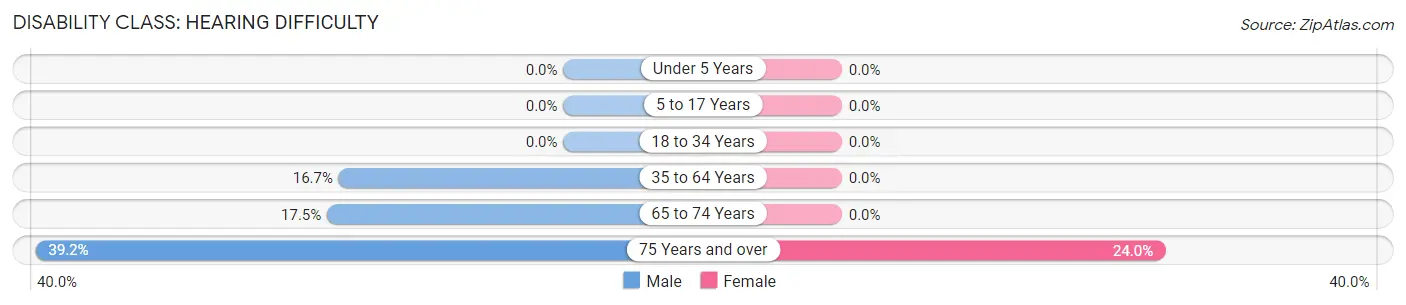
| Age Bracket | Male | Female |
| Under 5 Years | 0 (0.0%) | 0 (0.0%) |
| 5 to 17 Years | 0 (0.0%) | 0 (0.0%) |
| 18 to 34 Years | 0 (0.0%) | 0 (0.0%) |
| 35 to 64 Years | 29 (16.7%) | 0 (0.0%) |
| 65 to 74 Years | 10 (17.5%) | 0 (0.0%) |
| 75 Years and over | 69 (39.2%) | 42 (24.0%) |
Disability Class: Vision Difficulty
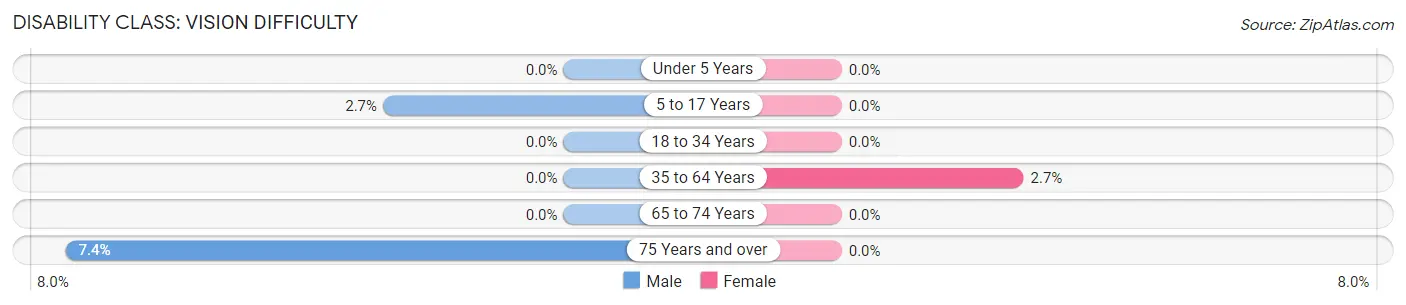
| Age Bracket | Male | Female |
| Under 5 Years | 0 (0.0%) | 0 (0.0%) |
| 5 to 17 Years | 4 (2.7%) | 0 (0.0%) |
| 18 to 34 Years | 0 (0.0%) | 0 (0.0%) |
| 35 to 64 Years | 0 (0.0%) | 8 (2.7%) |
| 65 to 74 Years | 0 (0.0%) | 0 (0.0%) |
| 75 Years and over | 13 (7.4%) | 0 (0.0%) |
Disability Class: Cognitive Difficulty
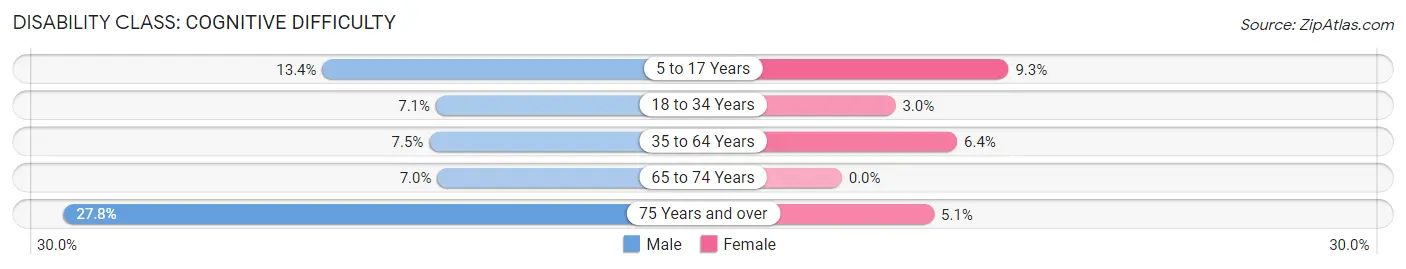
| Age Bracket | Male | Female |
| 5 to 17 Years | 20 (13.4%) | 27 (9.3%) |
| 18 to 34 Years | 11 (7.1%) | 8 (3.0%) |
| 35 to 64 Years | 13 (7.5%) | 19 (6.4%) |
| 65 to 74 Years | 4 (7.0%) | 0 (0.0%) |
| 75 Years and over | 49 (27.8%) | 9 (5.1%) |
Disability Class: Ambulatory Difficulty
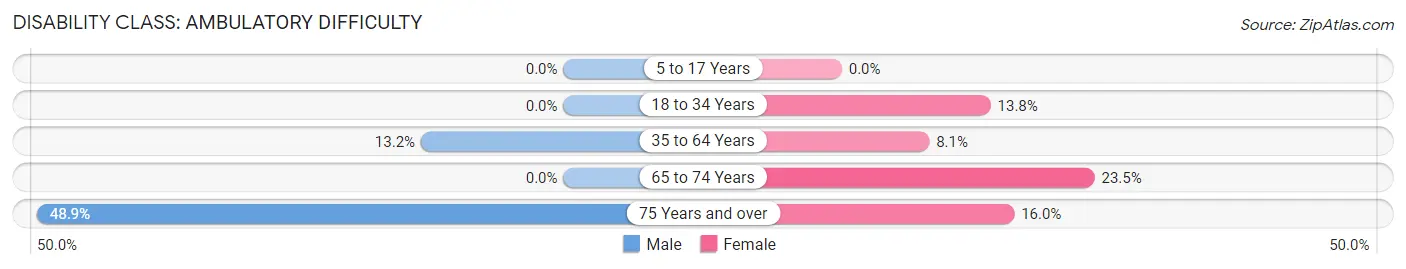
| Age Bracket | Male | Female |
| 5 to 17 Years | 0 (0.0%) | 0 (0.0%) |
| 18 to 34 Years | 0 (0.0%) | 37 (13.8%) |
| 35 to 64 Years | 23 (13.2%) | 24 (8.1%) |
| 65 to 74 Years | 0 (0.0%) | 19 (23.5%) |
| 75 Years and over | 86 (48.9%) | 28 (16.0%) |
Disability Class: Self-Care Difficulty
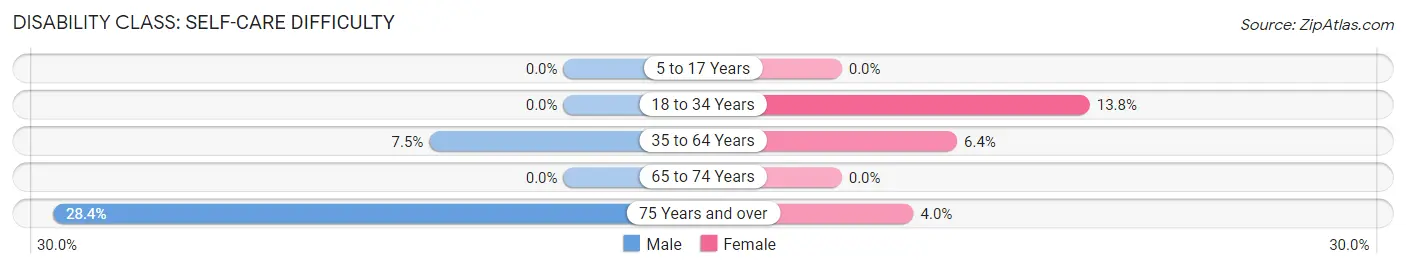
| Age Bracket | Male | Female |
| 5 to 17 Years | 0 (0.0%) | 0 (0.0%) |
| 18 to 34 Years | 0 (0.0%) | 37 (13.8%) |
| 35 to 64 Years | 13 (7.5%) | 19 (6.4%) |
| 65 to 74 Years | 0 (0.0%) | 0 (0.0%) |
| 75 Years and over | 50 (28.4%) | 7 (4.0%) |
Technology Access in Buna
Computing Device Access in Buna
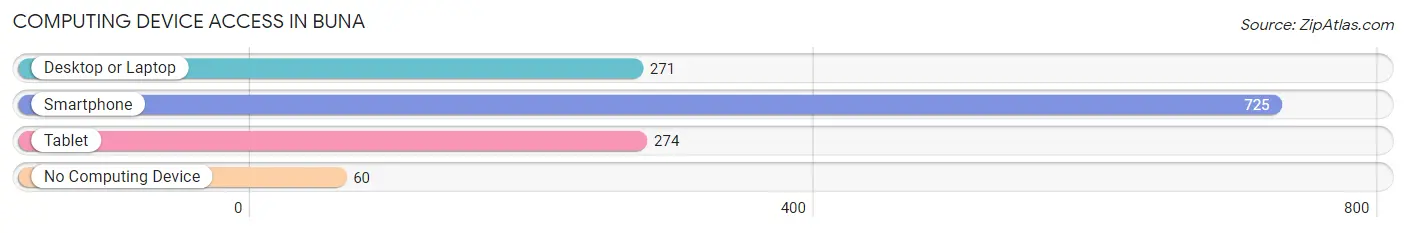
| Device Type | # Households | % Households |
| Desktop or Laptop | 271 | 33.1% |
| Smartphone | 725 | 88.4% |
| Tablet | 274 | 33.4% |
| No Computing Device | 60 | 7.3% |
| Total | 820 | 100.0% |
Internet Access in Buna
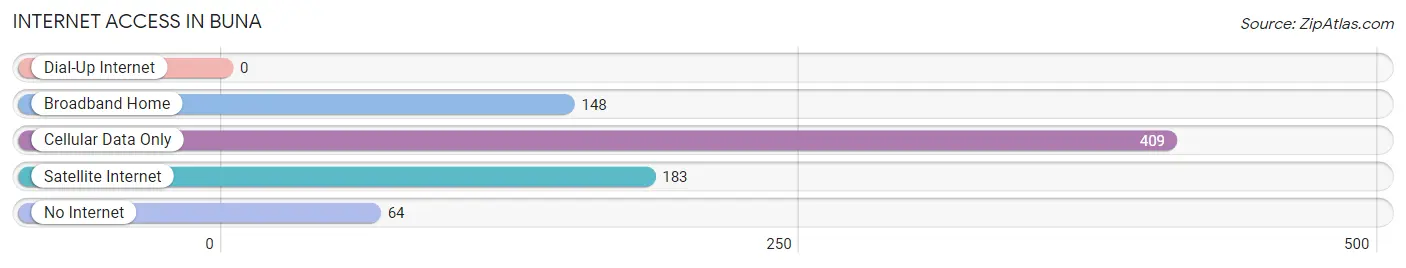
| Internet Type | # Households | % Households |
| Dial-Up Internet | 0 | 0.0% |
| Broadband Home | 148 | 18.0% |
| Cellular Data Only | 409 | 49.9% |
| Satellite Internet | 183 | 22.3% |
| No Internet | 64 | 7.8% |
| Total | 820 | 100.0% |
Buna Summary
Buna is a small town located in Jasper County, Texas, United States. It is situated on the banks of the Neches River, about 25 miles east of Beaumont. The population of Buna was 1,845 at the 2010 census.
History
The area that is now Buna was first settled in the early 1800s by the Atakapa Indians. The town was originally known as "Atakapa", but was later changed to "Buna" in 1837. The name "Buna" is derived from the Atakapa word for "river".
In 1845, the town was officially incorporated as Buna, Texas. The town was originally a trading post for the Atakapa Indians, but soon became a center for the lumber industry. The lumber industry was the main source of income for the town until the early 1900s, when the oil industry began to take over.
In the early 1900s, the town was home to several oil refineries, which provided jobs for many of the town's residents. The oil industry continued to be the main source of income for the town until the late 1970s, when the oil industry began to decline.
Geography
Buna is located in Jasper County, Texas, at the intersection of US Highway 96 and State Highway 87. The town is situated on the banks of the Neches River, about 25 miles east of Beaumont. The town is surrounded by dense forests and is located in the Piney Woods region of East Texas.
The climate in Buna is humid subtropical, with hot summers and mild winters. The average annual temperature is 68°F, with an average high of 90°F in the summer and an average low of 45°F in the winter.
Economy
The economy of Buna is largely based on the oil and gas industry. The town is home to several oil refineries, which provide jobs for many of the town's residents. The town is also home to several small businesses, including restaurants, retail stores, and service providers.
The town is also home to several large employers, including the Buna Independent School District, the Buna Volunteer Fire Department, and the Buna Police Department.
Demographics
As of the 2010 census, the population of Buna was 1,845. The racial makeup of the town was 79.3% White, 16.2% African American, 0.7% Native American, 0.3% Asian, 0.1% Pacific Islander, and 3.4% from other races. Hispanic or Latino of any race were 6.2% of the population.
The median household income in Buna was $37,917, and the median family income was $45,938. The per capita income for the town was $17,945. About 17.2% of families and 20.3% of the population were below the poverty line, including 28.3% of those under age 18 and 11.2% of those age 65 or over.
Common Questions
What is Per Capita Income in Buna?
Per Capita income in Buna is $21,471.
What is the Median Family Income in Buna?
Median Family Income in Buna is $63,571.
What is the Median Household income in Buna?
Median Household Income in Buna is $36,250.
What is Income or Wage Gap in Buna?
Income or Wage Gap in Buna is 36.1%.
Women in Buna earn 63.9 cents for every dollar earned by a man.
What is Inequality or Gini Index in Buna?
Inequality or Gini Index in Buna is 0.39.
What is the Total Population of Buna?
Total Population of Buna is 1,908.
What is the Total Male Population of Buna?
Total Male Population of Buna is 735.
What is the Total Female Population of Buna?
Total Female Population of Buna is 1,173.
What is the Ratio of Males per 100 Females in Buna?
There are 62.66 Males per 100 Females in Buna.
What is the Ratio of Females per 100 Males in Buna?
There are 159.59 Females per 100 Males in Buna.
What is the Median Population Age in Buna?
Median Population Age in Buna is 36.7 Years.
What is the Average Family Size in Buna
Average Family Size in Buna is 2.7 People.
What is the Average Household Size in Buna
Average Household Size in Buna is 2.3 People.
How Large is the Labor Force in Buna?
There are 615 People in the Labor Forcein in Buna.
What is the Percentage of People in the Labor Force in Buna?
42.7% of People are in the Labor Force in Buna.
What is the Unemployment Rate in Buna?
Unemployment Rate in Buna is 17.9%.