Bulverde, TX Map & Demographics
Bulverde Map
Bulverde Overview
$48,896
PER CAPITA INCOME
$111,584
AVG FAMILY INCOME
$107,315
AVG HOUSEHOLD INCOME
58.7%
WAGE / INCOME GAP [ % ]
41.3¢/ $1
WAGE / INCOME GAP [ $ ]
0.38
INEQUALITY / GINI INDEX
5,827
TOTAL POPULATION
2,924
MALE POPULATION
2,903
FEMALE POPULATION
100.72
MALES / 100 FEMALES
99.28
FEMALES / 100 MALES
53.7
MEDIAN AGE
2.8
AVG FAMILY SIZE
2.6
AVG HOUSEHOLD SIZE
2,653
LABOR FORCE [ PEOPLE ]
50.7%
PERCENT IN LABOR FORCE
0.5%
UNEMPLOYMENT RATE
Bulverde Zip Codes
Bulverde Area Codes
Income in Bulverde
Income Overview in Bulverde
Per Capita Income in Bulverde is $48,896, while median incomes of families and households are $111,584 and $107,315 respectively.
| Characteristic | Number | Measure |
| Per Capita Income | 5,827 | $48,896 |
| Median Family Income | 1,906 | $111,584 |
| Mean Family Income | 1,906 | $137,704 |
| Median Household Income | 2,214 | $107,315 |
| Mean Household Income | 2,214 | $126,735 |
| Income Deficit | 1,906 | $0 |
| Wage / Income Gap (%) | 5,827 | 58.70% |
| Wage / Income Gap ($) | 5,827 | 41.30¢ per $1 |
| Gini / Inequality Index | 5,827 | 0.38 |
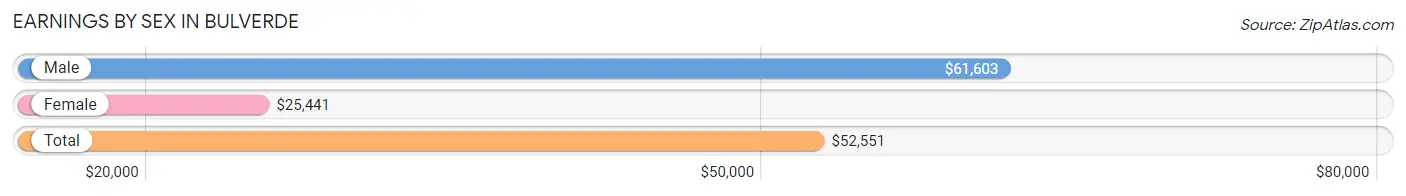
Earnings by Sex in Bulverde
Average Earnings in Bulverde are $52,551, $61,603 for men and $25,441 for women, a difference of 58.7%.
| Sex | Number | Average Earnings |
| Male | 1,768 (60.7%) | $61,603 |
| Female | 1,146 (39.3%) | $25,441 |
| Total | 2,914 (100.0%) | $52,551 |
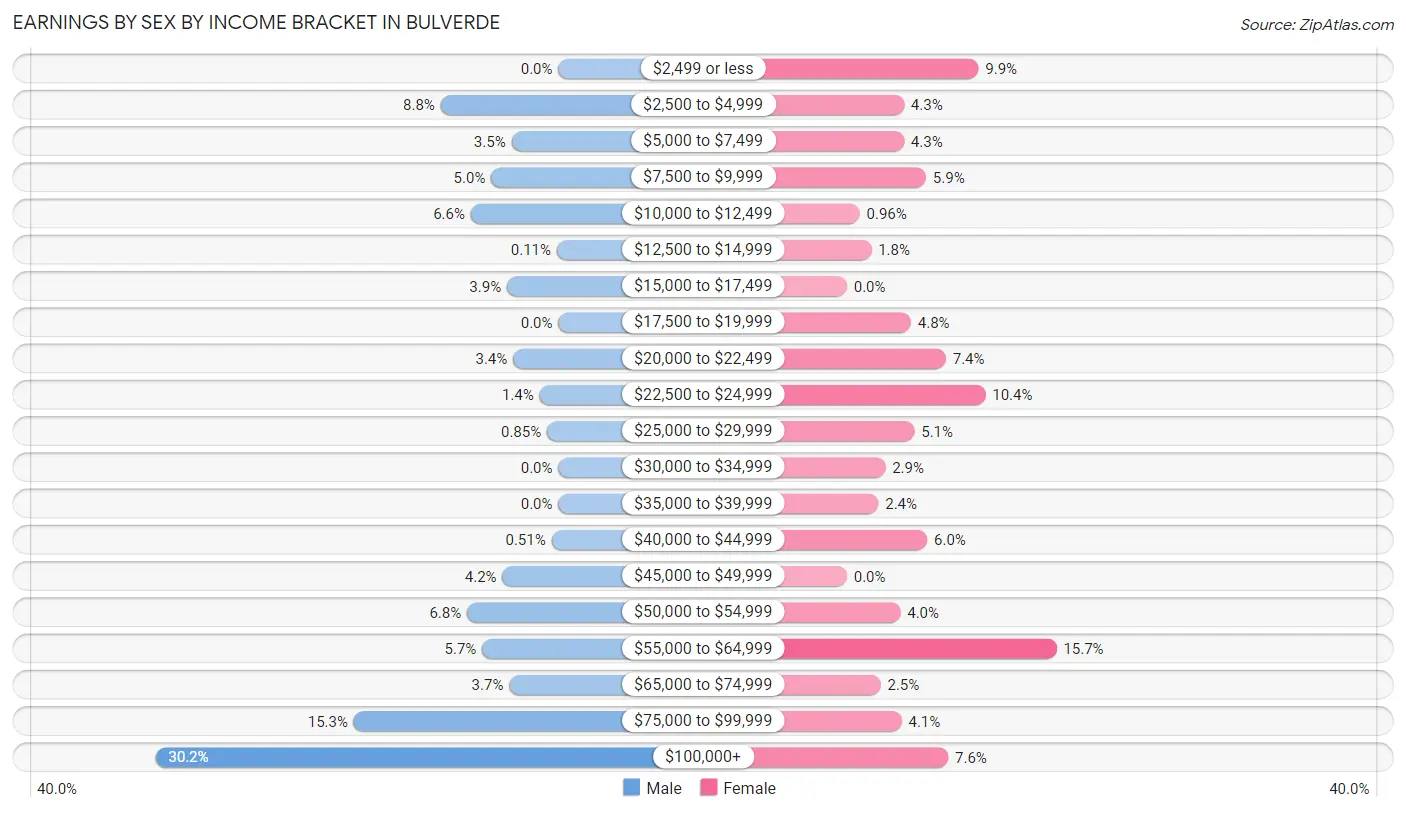
Earnings by Sex by Income Bracket in Bulverde
The most common earnings brackets in Bulverde are $100,000+ for men (534 | 30.2%) and $55,000 to $64,999 for women (180 | 15.7%).
| Income | Male | Female |
| $2,499 or less | 0 (0.0%) | 113 (9.9%) |
| $2,500 to $4,999 | 156 (8.8%) | 49 (4.3%) |
| $5,000 to $7,499 | 62 (3.5%) | 49 (4.3%) |
| $7,500 to $9,999 | 89 (5.0%) | 68 (5.9%) |
| $10,000 to $12,499 | 116 (6.6%) | 11 (1.0%) |
| $12,500 to $14,999 | 2 (0.1%) | 21 (1.8%) |
| $15,000 to $17,499 | 68 (3.8%) | 0 (0.0%) |
| $17,500 to $19,999 | 0 (0.0%) | 55 (4.8%) |
| $20,000 to $22,499 | 60 (3.4%) | 85 (7.4%) |
| $22,500 to $24,999 | 25 (1.4%) | 119 (10.4%) |
| $25,000 to $29,999 | 15 (0.9%) | 58 (5.1%) |
| $30,000 to $34,999 | 0 (0.0%) | 33 (2.9%) |
| $35,000 to $39,999 | 0 (0.0%) | 27 (2.4%) |
| $40,000 to $44,999 | 9 (0.5%) | 69 (6.0%) |
| $45,000 to $49,999 | 74 (4.2%) | 0 (0.0%) |
| $50,000 to $54,999 | 121 (6.8%) | 46 (4.0%) |
| $55,000 to $64,999 | 101 (5.7%) | 180 (15.7%) |
| $65,000 to $74,999 | 65 (3.7%) | 29 (2.5%) |
| $75,000 to $99,999 | 271 (15.3%) | 47 (4.1%) |
| $100,000+ | 534 (30.2%) | 87 (7.6%) |
| Total | 1,768 (100.0%) | 1,146 (100.0%) |
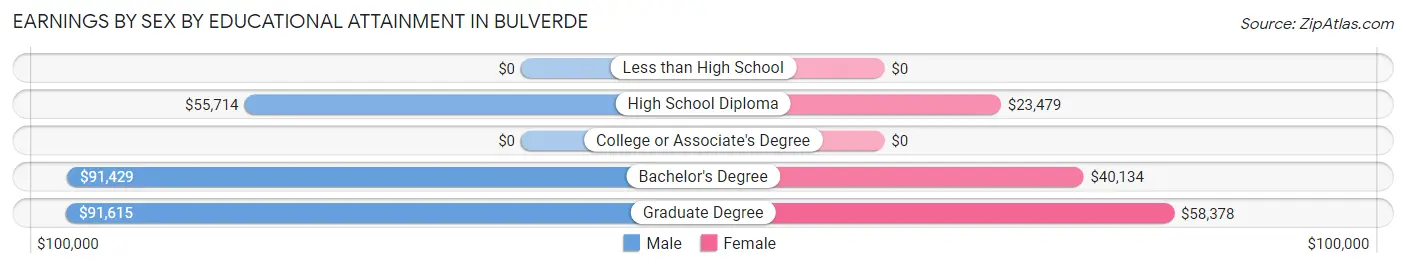
Earnings by Sex by Educational Attainment in Bulverde
Average earnings in Bulverde are $83,071 for men and $33,409 for women, a difference of 59.8%. Men with an educational attainment of graduate degree enjoy the highest average annual earnings of $91,615, while those with high school diploma education earn the least with $55,714. Women with an educational attainment of graduate degree earn the most with the average annual earnings of $58,378, while those with high school diploma education have the smallest earnings of $23,479.
| Educational Attainment | Male Income | Female Income |
| Less than High School | - | - |
| High School Diploma | $55,714 | $23,479 |
| College or Associate's Degree | - | - |
| Bachelor's Degree | $91,429 | $40,134 |
| Graduate Degree | $91,615 | $58,378 |
| Total | $83,071 | $33,409 |
Family Income in Bulverde
Family Income Brackets in Bulverde
According to the Bulverde family income data, there are 511 families falling into the $100,000 to $149,999 income range, which is the most common income bracket and makes up 26.8% of all families.
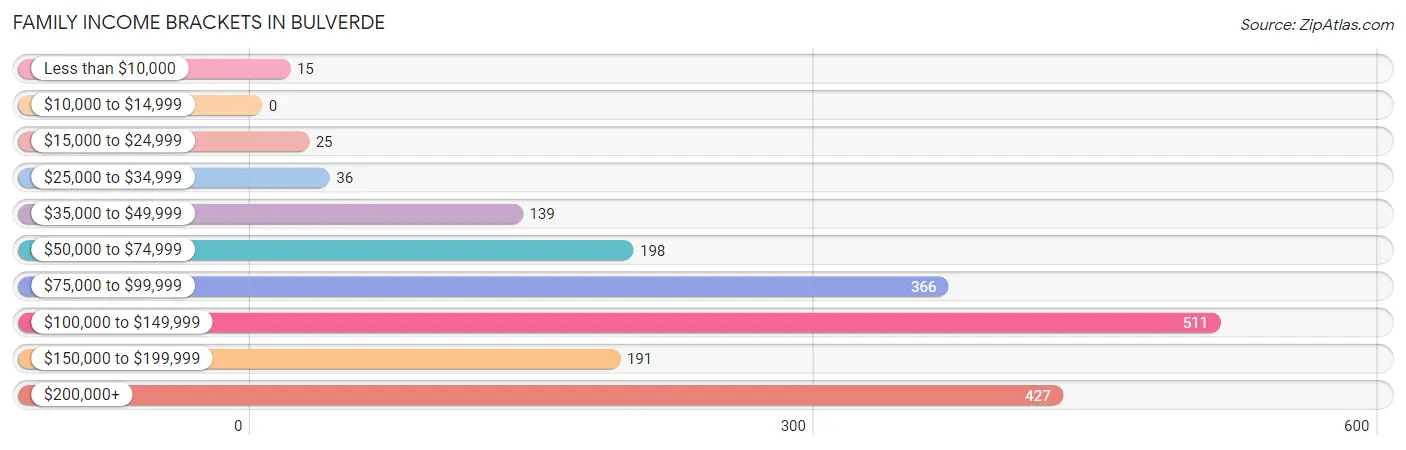
| Income Bracket | # Families | % Families |
| Less than $10,000 | 15 | 0.8% |
| $10,000 to $14,999 | 0 | 0.0% |
| $15,000 to $24,999 | 25 | 1.3% |
| $25,000 to $34,999 | 36 | 1.9% |
| $35,000 to $49,999 | 139 | 7.3% |
| $50,000 to $74,999 | 198 | 10.4% |
| $75,000 to $99,999 | 366 | 19.2% |
| $100,000 to $149,999 | 511 | 26.8% |
| $150,000 to $199,999 | 191 | 10.0% |
| $200,000+ | 427 | 22.4% |
Family Income by Famaliy Size in Bulverde
4-person families (322 | 16.9%) account for the highest median family income in Bulverde with $210,599 per family, while 2-person families (1,162 | 61.0%) have the highest median income of $55,255 per family member.
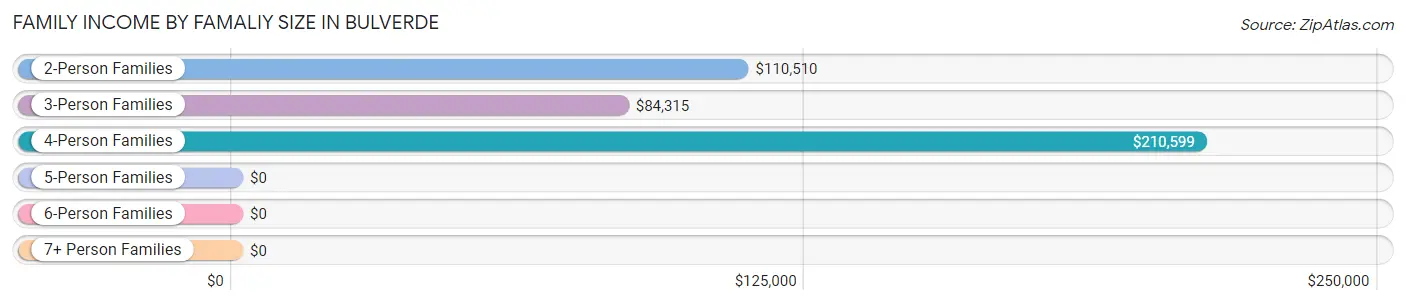
| Income Bracket | # Families | Median Income |
| 2-Person Families | 1,162 (61.0%) | $110,510 |
| 3-Person Families | 291 (15.3%) | $84,315 |
| 4-Person Families | 322 (16.9%) | $210,599 |
| 5-Person Families | 128 (6.7%) | $0 |
| 6-Person Families | 0 (0.0%) | $0 |
| 7+ Person Families | 3 (0.2%) | $0 |
| Total | 1,906 (100.0%) | $111,584 |
Family Income by Number of Earners in Bulverde
The median family income in Bulverde is $111,584, with families comprising 3+ earners (145) having the highest median family income of $203,516, while families with 1 earner (450) have the lowest median family income of $96,905, accounting for 7.6% and 23.6% of families, respectively.
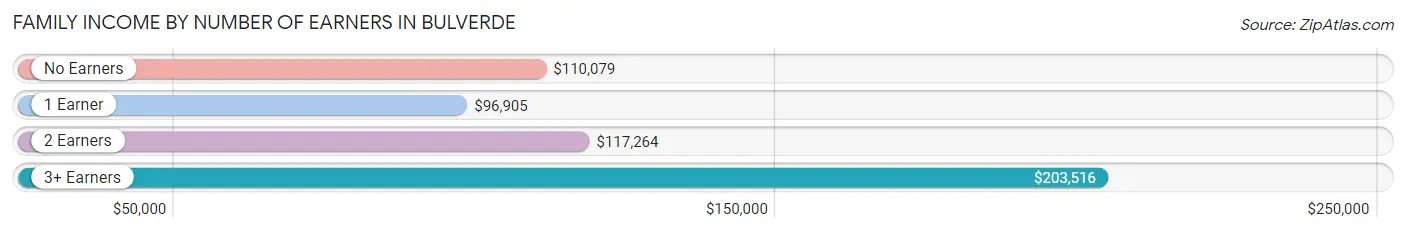
| Number of Earners | # Families | Median Income |
| No Earners | 502 (26.3%) | $110,079 |
| 1 Earner | 450 (23.6%) | $96,905 |
| 2 Earners | 809 (42.4%) | $117,264 |
| 3+ Earners | 145 (7.6%) | $203,516 |
| Total | 1,906 (100.0%) | $111,584 |
Household Income in Bulverde
Household Income Brackets in Bulverde
With 558 households falling in the category, the $100,000 to $149,999 income range is the most frequent in Bulverde, accounting for 25.2% of all households. In contrast, only 15 households (0.7%) fall into the less than $10,000 income bracket, making it the least populous group.
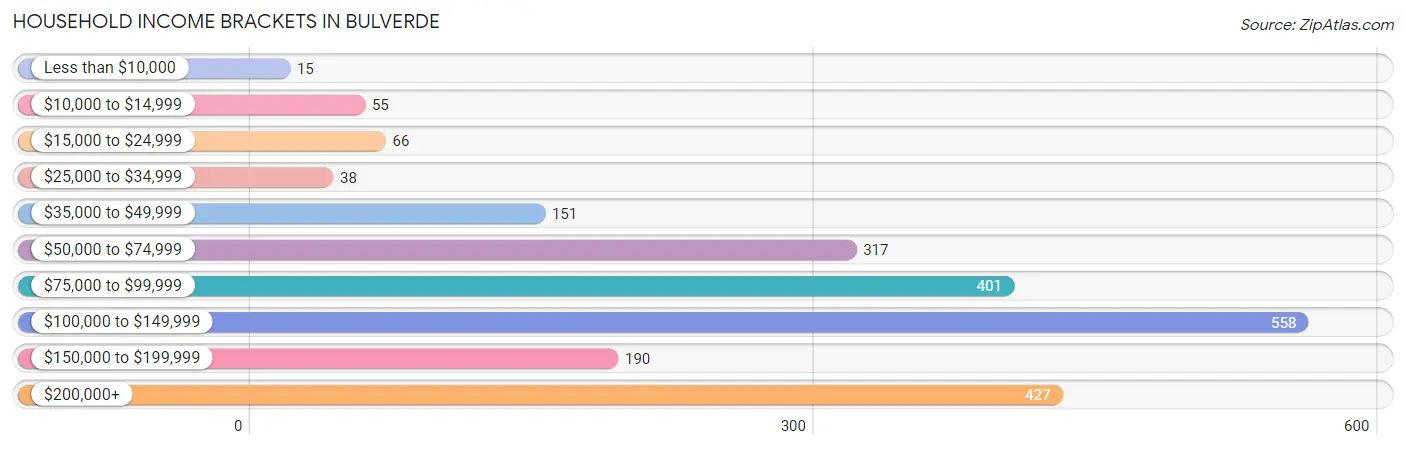
| Income Bracket | # Households | % Households |
| Less than $10,000 | 15 | 0.7% |
| $10,000 to $14,999 | 55 | 2.5% |
| $15,000 to $24,999 | 66 | 3.0% |
| $25,000 to $34,999 | 38 | 1.7% |
| $35,000 to $49,999 | 151 | 6.8% |
| $50,000 to $74,999 | 317 | 14.3% |
| $75,000 to $99,999 | 401 | 18.1% |
| $100,000 to $149,999 | 558 | 25.2% |
| $150,000 to $199,999 | 190 | 8.6% |
| $200,000+ | 427 | 19.3% |
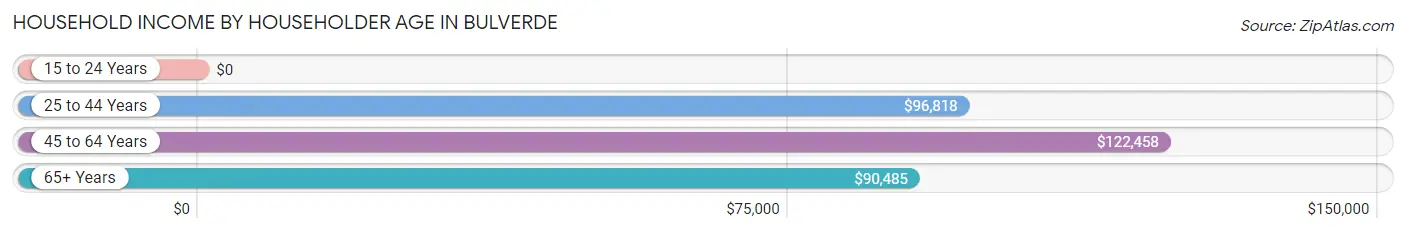
Household Income by Householder Age in Bulverde
The median household income in Bulverde is $107,315, with the highest median household income of $122,458 found in the 45 to 64 years age bracket for the primary householder. A total of 933 households (42.1%) fall into this category.
| Income Bracket | # Households | Median Income |
| 15 to 24 Years | 0 (0.0%) | $0 |
| 25 to 44 Years | 364 (16.4%) | $96,818 |
| 45 to 64 Years | 933 (42.1%) | $122,458 |
| 65+ Years | 917 (41.4%) | $90,485 |
| Total | 2,214 (100.0%) | $107,315 |
Poverty in Bulverde
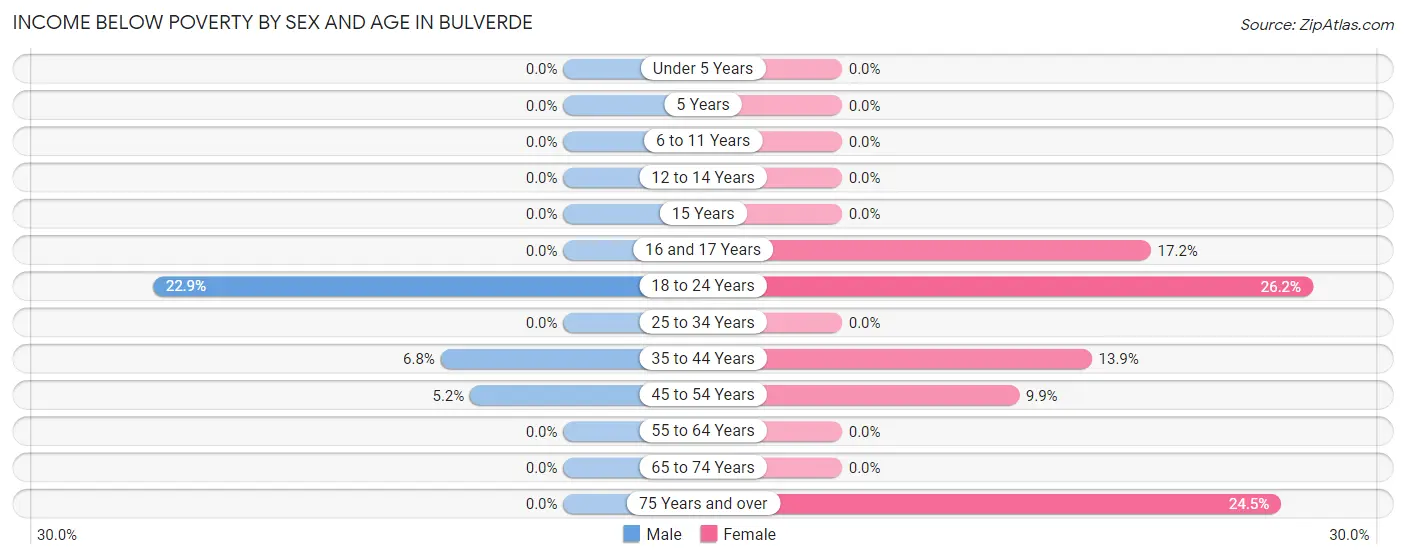
Income Below Poverty by Sex and Age in Bulverde
With 3.6% poverty level for males and 8.0% for females among the residents of Bulverde, 18 to 24 year old males and 18 to 24 year old females are the most vulnerable to poverty, with 64 males (22.9%) and 64 females (26.2%) in their respective age groups living below the poverty level.
| Age Bracket | Male | Female |
| Under 5 Years | 0 (0.0%) | 0 (0.0%) |
| 5 Years | 0 (0.0%) | 0 (0.0%) |
| 6 to 11 Years | 0 (0.0%) | 0 (0.0%) |
| 12 to 14 Years | 0 (0.0%) | 0 (0.0%) |
| 15 Years | 0 (0.0%) | 0 (0.0%) |
| 16 and 17 Years | 0 (0.0%) | 16 (17.2%) |
| 18 to 24 Years | 64 (22.9%) | 64 (26.2%) |
| 25 to 34 Years | 0 (0.0%) | 0 (0.0%) |
| 35 to 44 Years | 17 (6.8%) | 42 (13.9%) |
| 45 to 54 Years | 25 (5.2%) | 29 (9.9%) |
| 55 to 64 Years | 0 (0.0%) | 0 (0.0%) |
| 65 to 74 Years | 0 (0.0%) | 0 (0.0%) |
| 75 Years and over | 0 (0.0%) | 79 (24.5%) |
| Total | 106 (3.6%) | 230 (8.0%) |
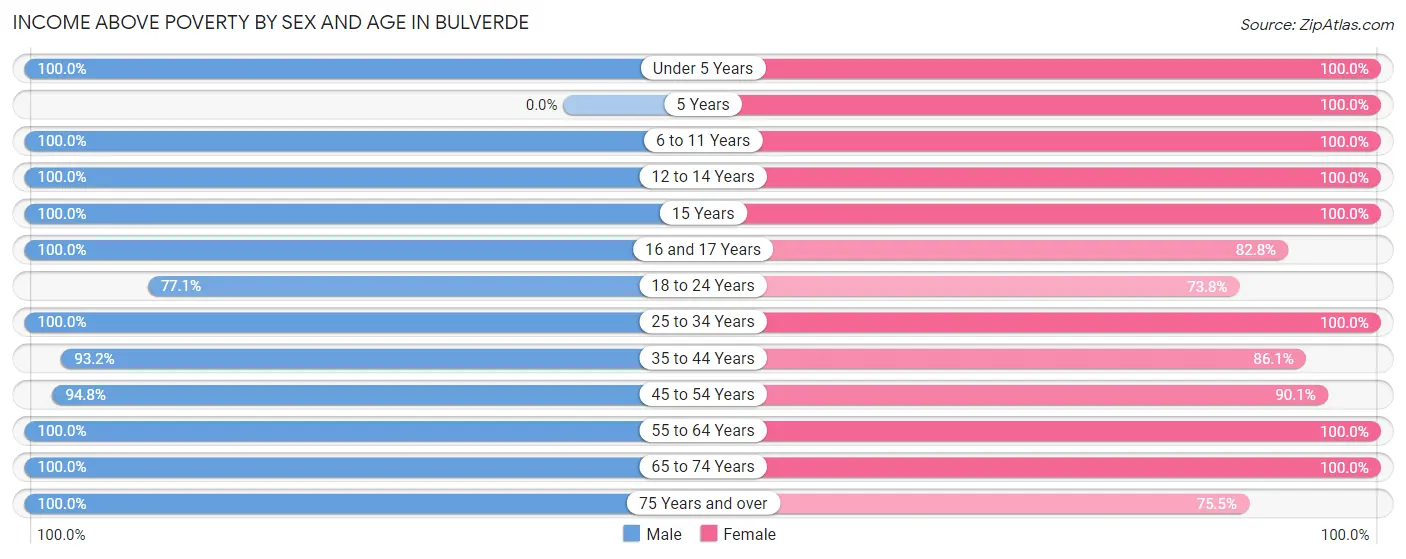
Income Above Poverty by Sex and Age in Bulverde
According to the poverty statistics in Bulverde, males aged under 5 years and females aged under 5 years are the age groups that are most secure financially, with 100.0% of males and 100.0% of females in these age groups living above the poverty line.
| Age Bracket | Male | Female |
| Under 5 Years | 61 (100.0%) | 45 (100.0%) |
| 5 Years | 0 (0.0%) | 18 (100.0%) |
| 6 to 11 Years | 217 (100.0%) | 107 (100.0%) |
| 12 to 14 Years | 60 (100.0%) | 55 (100.0%) |
| 15 Years | 20 (100.0%) | 12 (100.0%) |
| 16 and 17 Years | 56 (100.0%) | 77 (82.8%) |
| 18 to 24 Years | 216 (77.1%) | 180 (73.8%) |
| 25 to 34 Years | 220 (100.0%) | 199 (100.0%) |
| 35 to 44 Years | 232 (93.2%) | 260 (86.1%) |
| 45 to 54 Years | 457 (94.8%) | 265 (90.1%) |
| 55 to 64 Years | 454 (100.0%) | 628 (100.0%) |
| 65 to 74 Years | 417 (100.0%) | 569 (100.0%) |
| 75 Years and over | 408 (100.0%) | 244 (75.5%) |
| Total | 2,818 (96.4%) | 2,659 (92.0%) |
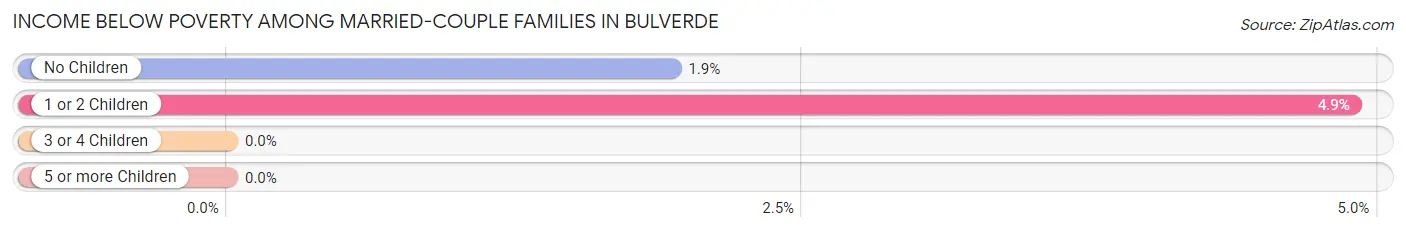
Income Below Poverty Among Married-Couple Families in Bulverde
The poverty statistics for married-couple families in Bulverde show that 2.4% or 40 of the total 1,660 families live below the poverty line. Families with 1 or 2 children have the highest poverty rate of 4.9%, comprising of 15 families. On the other hand, families with 3 or 4 children have the lowest poverty rate of 0.0%, which includes 0 families.
| Children | Above Poverty | Below Poverty |
| No Children | 1,273 (98.1%) | 25 (1.9%) |
| 1 or 2 Children | 292 (95.1%) | 15 (4.9%) |
| 3 or 4 Children | 55 (100.0%) | 0 (0.0%) |
| 5 or more Children | 0 (0.0%) | 0 (0.0%) |
| Total | 1,620 (97.6%) | 40 (2.4%) |
Income Below Poverty Among Single-Parent Households in Bulverde
| Children | Single Father | Single Mother |
| No Children | 0 (0.0%) | 0 (0.0%) |
| 1 or 2 Children | 0 (0.0%) | 0 (0.0%) |
| 3 or 4 Children | 0 (0.0%) | 0 (0.0%) |
| 5 or more Children | 0 (0.0%) | 0 (0.0%) |
| Total | 0 (0.0%) | 0 (0.0%) |
Income Below Poverty Among Married-Couple vs Single-Parent Households in Bulverde
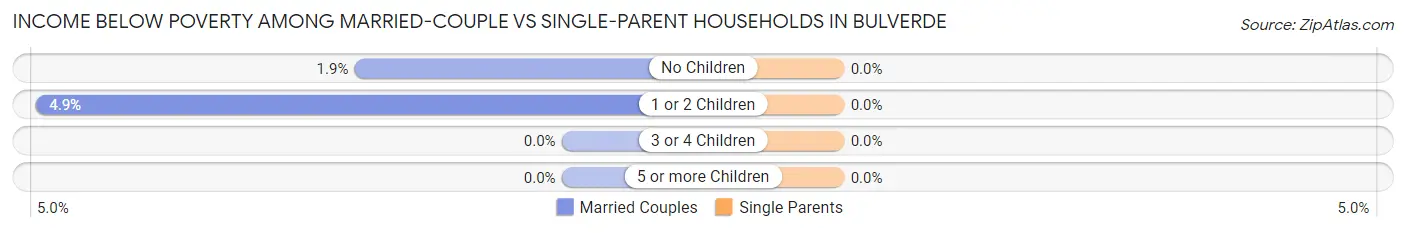
| Children | Married-Couple Families | Single-Parent Households |
| No Children | 25 (1.9%) | 0 (0.0%) |
| 1 or 2 Children | 15 (4.9%) | 0 (0.0%) |
| 3 or 4 Children | 0 (0.0%) | 0 (0.0%) |
| 5 or more Children | 0 (0.0%) | 0 (0.0%) |
| Total | 40 (2.4%) | 0 (0.0%) |
Race in Bulverde
The most populous races in Bulverde are White / Caucasian (4,928 | 84.6%), Hispanic or Latino (1,203 | 20.6%), and Two or more Races (385 | 6.6%).
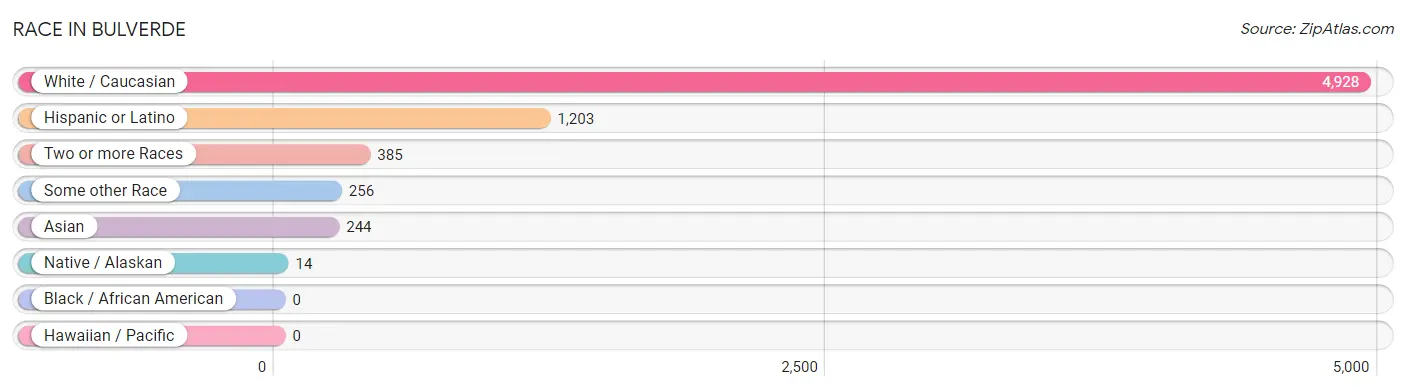
| Race | # Population | % Population |
| Asian | 244 | 4.2% |
| Black / African American | 0 | 0.0% |
| Hawaiian / Pacific | 0 | 0.0% |
| Hispanic or Latino | 1,203 | 20.6% |
| Native / Alaskan | 14 | 0.2% |
| White / Caucasian | 4,928 | 84.6% |
| Two or more Races | 385 | 6.6% |
| Some other Race | 256 | 4.4% |
| Total | 5,827 | 100.0% |
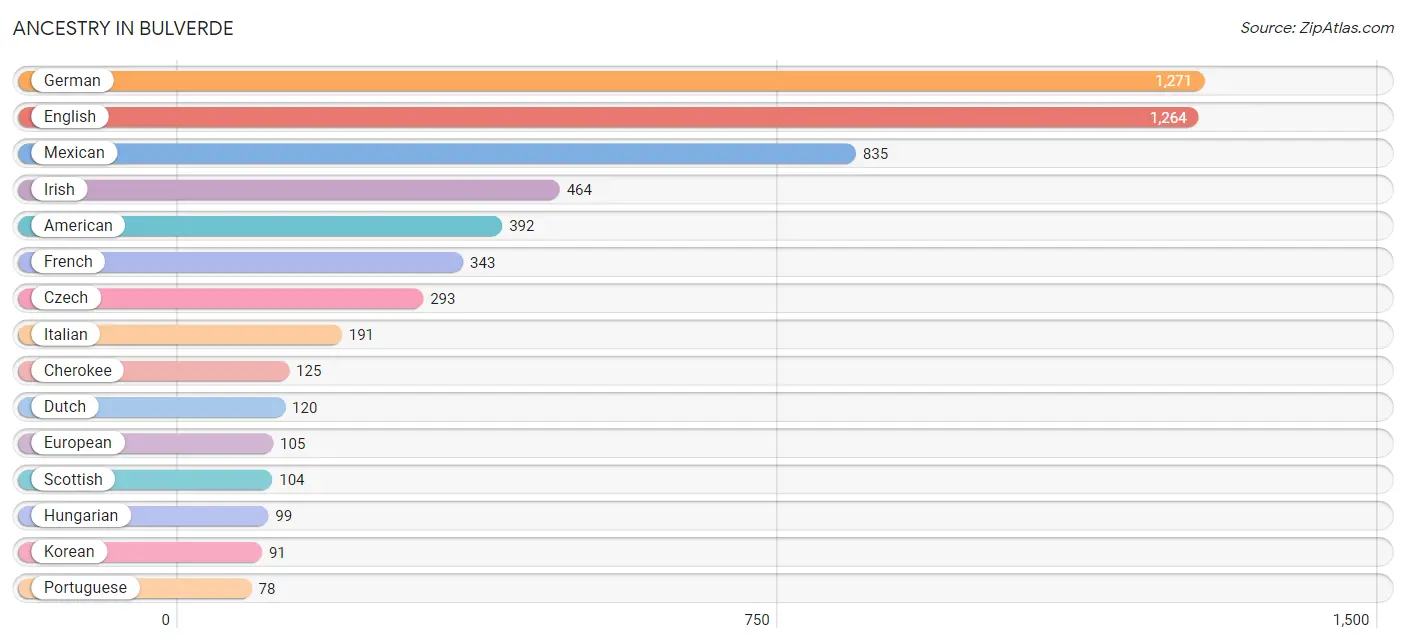
Ancestry in Bulverde
The most populous ancestries reported in Bulverde are German (1,271 | 21.8%), English (1,264 | 21.7%), Mexican (835 | 14.3%), Irish (464 | 8.0%), and American (392 | 6.7%), together accounting for 72.5% of all Bulverde residents.
| Ancestry | # Population | % Population |
| American | 392 | 6.7% |
| Arab | 13 | 0.2% |
| Austrian | 17 | 0.3% |
| Bhutanese | 49 | 0.8% |
| British | 27 | 0.5% |
| Burmese | 24 | 0.4% |
| Cherokee | 125 | 2.1% |
| Colombian | 13 | 0.2% |
| Czech | 293 | 5.0% |
| Dutch | 120 | 2.1% |
| English | 1,264 | 21.7% |
| European | 105 | 1.8% |
| French | 343 | 5.9% |
| French Canadian | 46 | 0.8% |
| German | 1,271 | 21.8% |
| Hungarian | 99 | 1.7% |
| Indian (Asian) | 42 | 0.7% |
| Irish | 464 | 8.0% |
| Italian | 191 | 3.3% |
| Japanese | 42 | 0.7% |
| Korean | 91 | 1.6% |
| Lebanese | 13 | 0.2% |
| Mexican | 835 | 14.3% |
| Norwegian | 50 | 0.9% |
| Polish | 74 | 1.3% |
| Portuguese | 78 | 1.3% |
| Puerto Rican | 61 | 1.1% |
| Scotch-Irish | 48 | 0.8% |
| Scottish | 104 | 1.8% |
| Slovak | 13 | 0.2% |
| South African | 12 | 0.2% |
| South American | 13 | 0.2% |
| Spaniard | 10 | 0.2% |
| Sri Lankan | 10 | 0.2% |
| Subsaharan African | 12 | 0.2% |
| Swedish | 23 | 0.4% |
| Swiss | 11 | 0.2% | View All 37 Rows |
Immigrants in Bulverde
The most numerous immigrant groups reported in Bulverde came from Asia (179 | 3.1%), Latin America (109 | 1.9%), Central America (96 | 1.7%), Mexico (96 | 1.7%), and South Eastern Asia (81 | 1.4%), together accounting for 9.6% of all Bulverde residents.
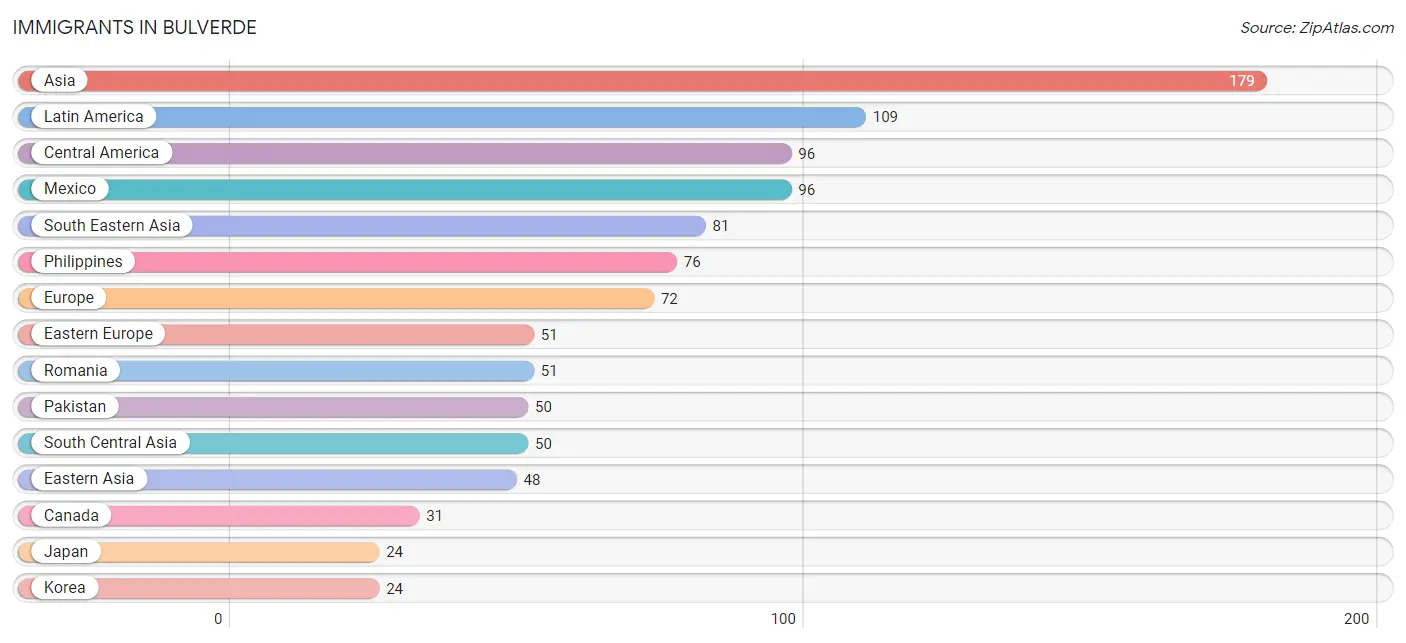
| Immigration Origin | # Population | % Population |
| Africa | 5 | 0.1% |
| Asia | 179 | 3.1% |
| Canada | 31 | 0.5% |
| Central America | 96 | 1.7% |
| Colombia | 13 | 0.2% |
| Eastern Asia | 48 | 0.8% |
| Eastern Europe | 51 | 0.9% |
| England | 21 | 0.4% |
| Europe | 72 | 1.2% |
| Japan | 24 | 0.4% |
| Korea | 24 | 0.4% |
| Latin America | 109 | 1.9% |
| Mexico | 96 | 1.7% |
| Northern Europe | 21 | 0.4% |
| Pakistan | 50 | 0.9% |
| Philippines | 76 | 1.3% |
| Romania | 51 | 0.9% |
| South Africa | 5 | 0.1% |
| South America | 13 | 0.2% |
| South Central Asia | 50 | 0.9% |
| South Eastern Asia | 81 | 1.4% |
| Vietnam | 5 | 0.1% | View All 22 Rows |
Sex and Age in Bulverde
Sex and Age in Bulverde
The most populous age groups in Bulverde are 55 to 59 Years (273 | 9.3%) for men and 70 to 74 Years (416 | 14.3%) for women.
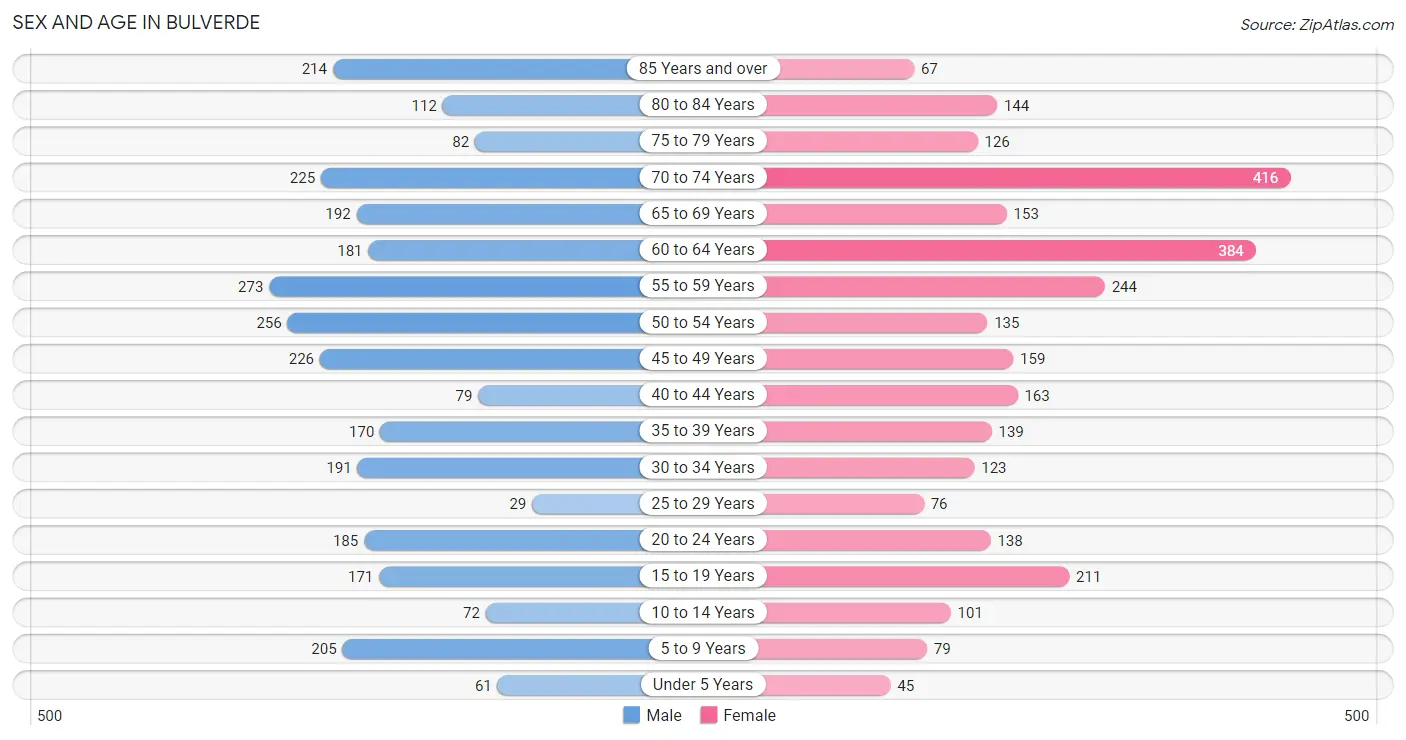
| Age Bracket | Male | Female |
| Under 5 Years | 61 (2.1%) | 45 (1.5%) |
| 5 to 9 Years | 205 (7.0%) | 79 (2.7%) |
| 10 to 14 Years | 72 (2.5%) | 101 (3.5%) |
| 15 to 19 Years | 171 (5.9%) | 211 (7.3%) |
| 20 to 24 Years | 185 (6.3%) | 138 (4.8%) |
| 25 to 29 Years | 29 (1.0%) | 76 (2.6%) |
| 30 to 34 Years | 191 (6.5%) | 123 (4.2%) |
| 35 to 39 Years | 170 (5.8%) | 139 (4.8%) |
| 40 to 44 Years | 79 (2.7%) | 163 (5.6%) |
| 45 to 49 Years | 226 (7.7%) | 159 (5.5%) |
| 50 to 54 Years | 256 (8.8%) | 135 (4.6%) |
| 55 to 59 Years | 273 (9.3%) | 244 (8.4%) |
| 60 to 64 Years | 181 (6.2%) | 384 (13.2%) |
| 65 to 69 Years | 192 (6.6%) | 153 (5.3%) |
| 70 to 74 Years | 225 (7.7%) | 416 (14.3%) |
| 75 to 79 Years | 82 (2.8%) | 126 (4.3%) |
| 80 to 84 Years | 112 (3.8%) | 144 (5.0%) |
| 85 Years and over | 214 (7.3%) | 67 (2.3%) |
| Total | 2,924 (100.0%) | 2,903 (100.0%) |
Families and Households in Bulverde
Median Family Size in Bulverde
The median family size in Bulverde is 2.79 persons per family, with single female/mother families (108 | 5.7%) accounting for the largest median family size of 2.86 persons per family. On the other hand, married-couple families (1,660 | 87.1%) represent the smallest median family size with 2.78 persons per family.
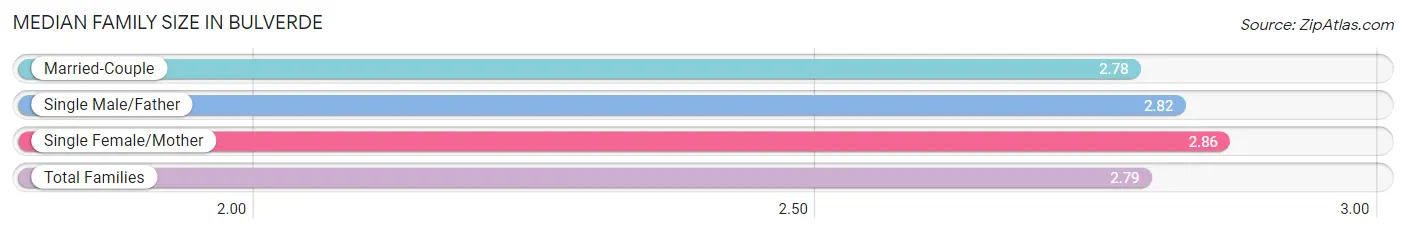
| Family Type | # Families | Family Size |
| Married-Couple | 1,660 (87.1%) | 2.78 |
| Single Male/Father | 138 (7.2%) | 2.82 |
| Single Female/Mother | 108 (5.7%) | 2.86 |
| Total Families | 1,906 (100.0%) | 2.79 |
Median Household Size in Bulverde
The median household size in Bulverde is 2.62 persons per household, with single female/mother households (108 | 4.9%) accounting for the largest median household size of 2.86 persons per household. non-family households (308 | 13.9%) represent the smallest median household size with 1.31 persons per household.
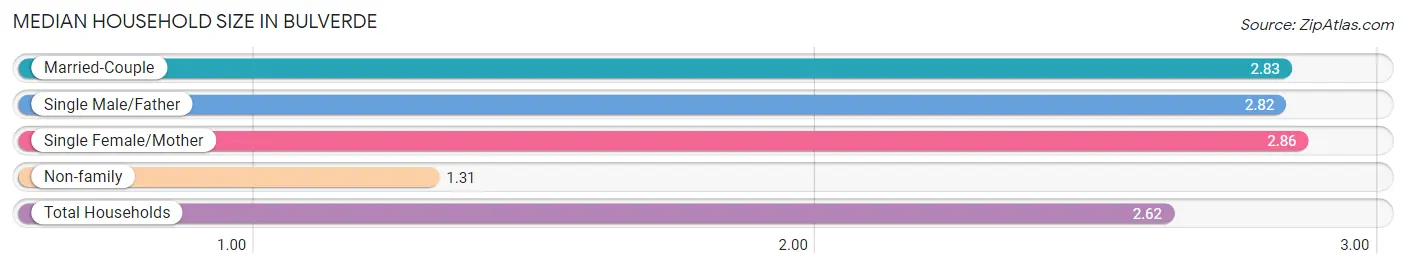
| Household Type | # Households | Household Size |
| Married-Couple | 1,660 (75.0%) | 2.83 |
| Single Male/Father | 138 (6.2%) | 2.82 |
| Single Female/Mother | 108 (4.9%) | 2.86 |
| Non-family | 308 (13.9%) | 1.31 |
| Total Households | 2,214 (100.0%) | 2.62 |
Household Size by Marriage Status in Bulverde
Out of a total of 2,214 households in Bulverde, 1,906 (86.1%) are family households, while 308 (13.9%) are nonfamily households. The most numerous type of family households are 2-person households, comprising 1,162, and the most common type of nonfamily households are 1-person households, comprising 214.
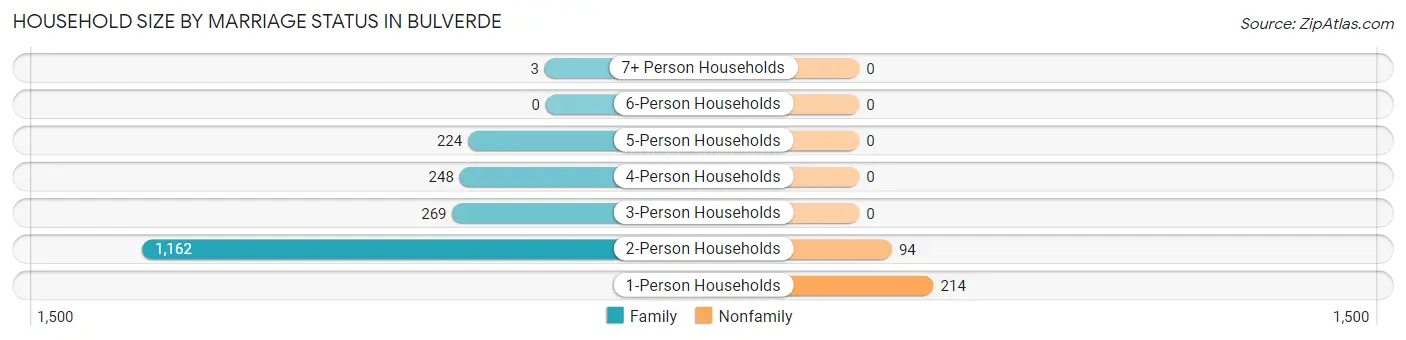
| Household Size | Family Households | Nonfamily Households |
| 1-Person Households | - | 214 (9.7%) |
| 2-Person Households | 1,162 (52.5%) | 94 (4.3%) |
| 3-Person Households | 269 (12.1%) | 0 (0.0%) |
| 4-Person Households | 248 (11.2%) | 0 (0.0%) |
| 5-Person Households | 224 (10.1%) | 0 (0.0%) |
| 6-Person Households | 0 (0.0%) | 0 (0.0%) |
| 7+ Person Households | 3 (0.1%) | 0 (0.0%) |
| Total | 1,906 (86.1%) | 308 (13.9%) |
Female Fertility in Bulverde
Fertility by Age in Bulverde
Average fertility rate in Bulverde is 6.0 births per 1,000 women. Women in the age bracket of 20 to 34 years have the highest fertility rate with 18.0 births per 1,000 women. Women in the age bracket of 20 to 34 years acount for 100.0% of all women with births.
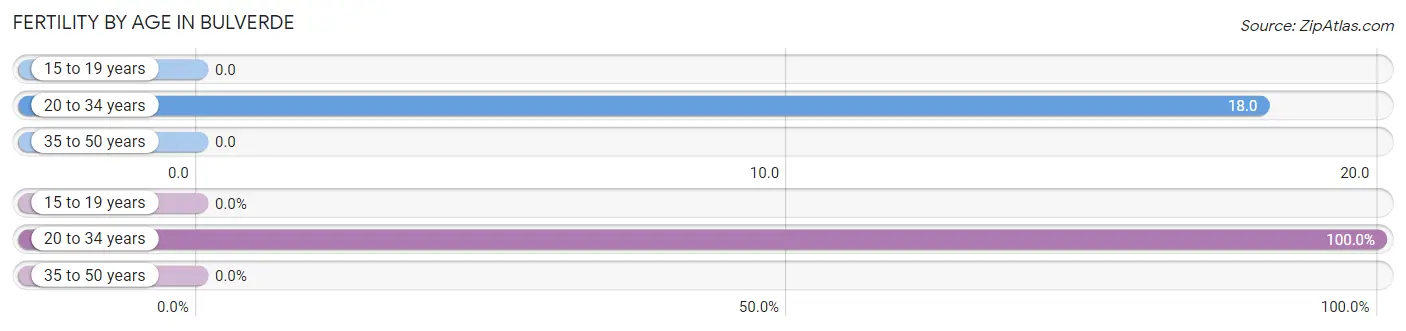
| Age Bracket | Women with Births | Births / 1,000 Women |
| 15 to 19 years | 0 (0.0%) | 0.0 |
| 20 to 34 years | 6 (100.0%) | 18.0 |
| 35 to 50 years | 0 (0.0%) | 0.0 |
| Total | 6 (100.0%) | 6.0 |
Fertility by Age by Marriage Status in Bulverde
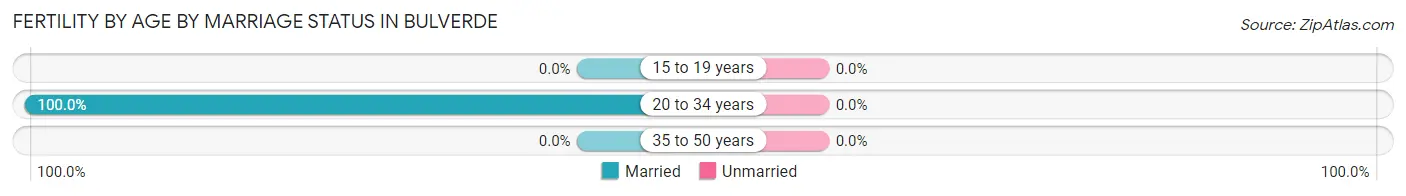
| Age Bracket | Married | Unmarried |
| 15 to 19 years | 0 (0.0%) | 0 (0.0%) |
| 20 to 34 years | 6 (100.0%) | 0 (0.0%) |
| 35 to 50 years | 0 (0.0%) | 0 (0.0%) |
| Total | 6 (100.0%) | 0 (0.0%) |
Fertility by Education in Bulverde
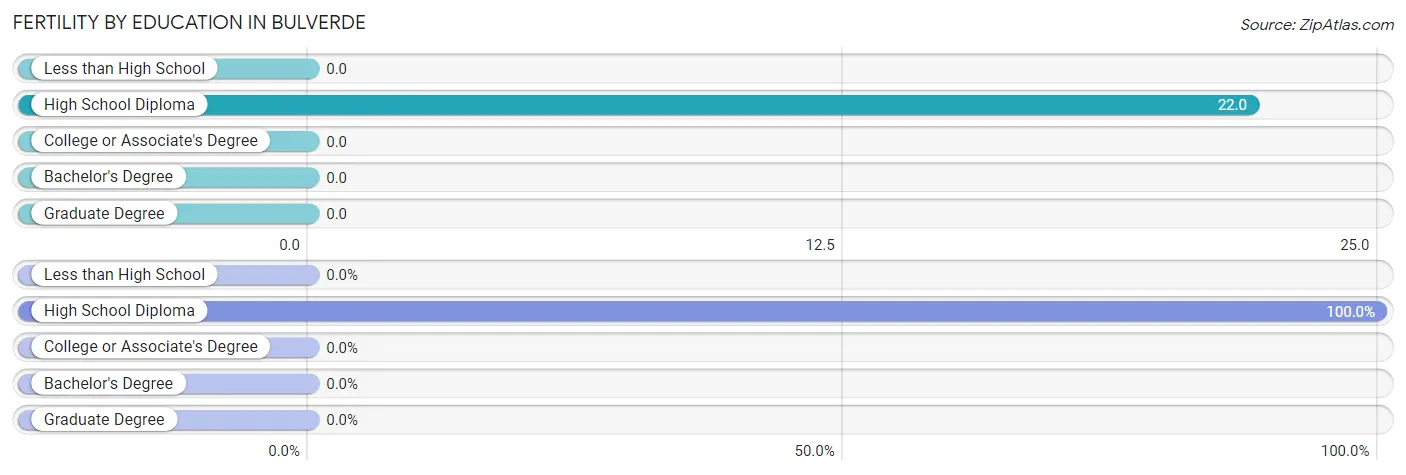
| Educational Attainment | Women with Births | Births / 1,000 Women |
| Less than High School | 0 (0.0%) | 0.0 |
| High School Diploma | 6 (100.0%) | 22.0 |
| College or Associate's Degree | 0 (0.0%) | 0.0 |
| Bachelor's Degree | 0 (0.0%) | 0.0 |
| Graduate Degree | 0 (0.0%) | 0.0 |
| Total | 6 (100.0%) | 6.0 |
Fertility by Education by Marriage Status in Bulverde
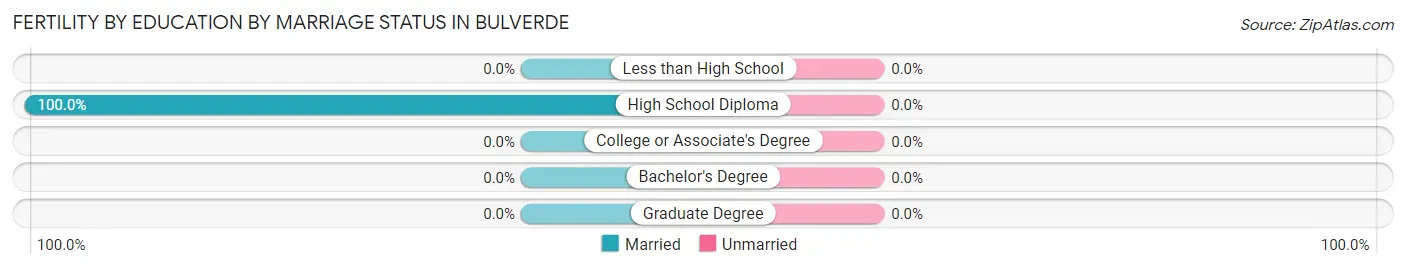
| Educational Attainment | Married | Unmarried |
| Less than High School | 0 (0.0%) | 0 (0.0%) |
| High School Diploma | 6 (100.0%) | 0 (0.0%) |
| College or Associate's Degree | 0 (0.0%) | 0 (0.0%) |
| Bachelor's Degree | 0 (0.0%) | 0 (0.0%) |
| Graduate Degree | 0 (0.0%) | 0 (0.0%) |
| Total | 6 (100.0%) | 0 (0.0%) |
Employment Characteristics in Bulverde
Employment by Class of Employer in Bulverde
Among the 2,611 employed individuals in Bulverde, private company employees (1,553 | 59.5%), self-employed (incorporated) (501 | 19.2%), and not-for-profit organizations (194 | 7.4%) make up the most common classes of employment.
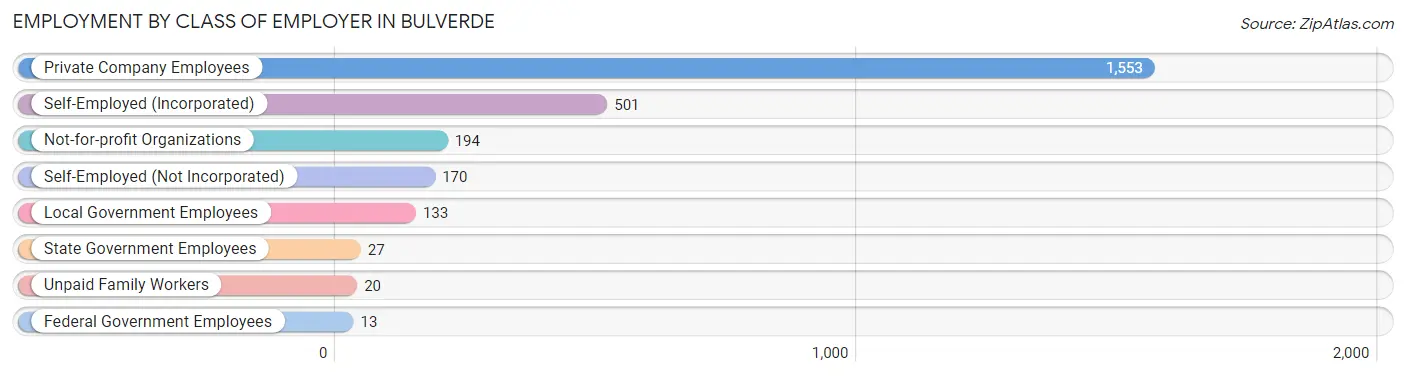
| Employer Class | # Employees | % Employees |
| Private Company Employees | 1,553 | 59.5% |
| Self-Employed (Incorporated) | 501 | 19.2% |
| Self-Employed (Not Incorporated) | 170 | 6.5% |
| Not-for-profit Organizations | 194 | 7.4% |
| Local Government Employees | 133 | 5.1% |
| State Government Employees | 27 | 1.0% |
| Federal Government Employees | 13 | 0.5% |
| Unpaid Family Workers | 20 | 0.8% |
| Total | 2,611 | 100.0% |
Employment Status by Age in Bulverde
According to the labor force statistics for Bulverde, out of the total population over 16 years of age (5,232), 50.7% or 2,653 individuals are in the labor force, with 0.5% or 13 of them unemployed. The age group with the highest labor force participation rate is 30 to 34 years, with 88.9% or 279 individuals in the labor force. Within the labor force, the 60 to 64 years age range has the highest percentage of unemployed individuals, with 5.2% or 14 of them being unemployed.
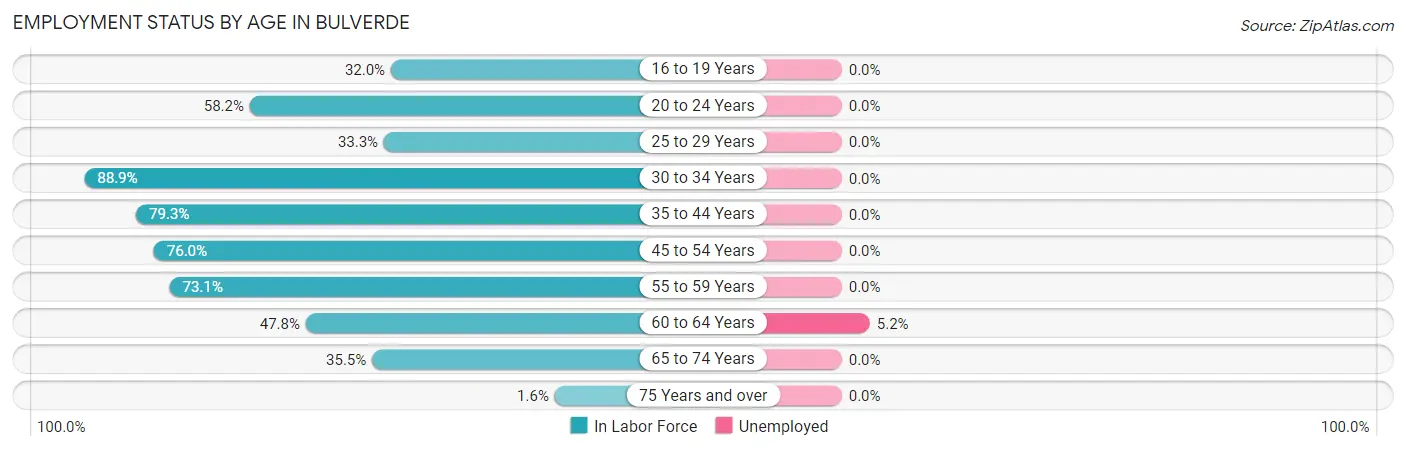
| Age Bracket | In Labor Force | Unemployed |
| 16 to 19 Years | 112 (32.0%) | 0 (0.0%) |
| 20 to 24 Years | 188 (58.2%) | 0 (0.0%) |
| 25 to 29 Years | 35 (33.3%) | 0 (0.0%) |
| 30 to 34 Years | 279 (88.9%) | 0 (0.0%) |
| 35 to 44 Years | 437 (79.3%) | 0 (0.0%) |
| 45 to 54 Years | 590 (76.0%) | 0 (0.0%) |
| 55 to 59 Years | 378 (73.1%) | 0 (0.0%) |
| 60 to 64 Years | 270 (47.8%) | 14 (5.2%) |
| 65 to 74 Years | 350 (35.5%) | 0 (0.0%) |
| 75 Years and over | 12 (1.6%) | 0 (0.0%) |
| Total | 2,653 (50.7%) | 13 (0.5%) |
Employment Status by Educational Attainment in Bulverde
According to labor force statistics for Bulverde, 70.3% of individuals (1,988) out of the total population between 25 and 64 years of age (2,828) are in the labor force, with 0.7% or 14 of them being unemployed. The group with the highest labor force participation rate are those with the educational attainment of college / associate degree, with 91.1% or 483 individuals in the labor force. Within the labor force, individuals with college / associate degree education have the highest percentage of unemployment, with 2.9% or 14 of them being unemployed.
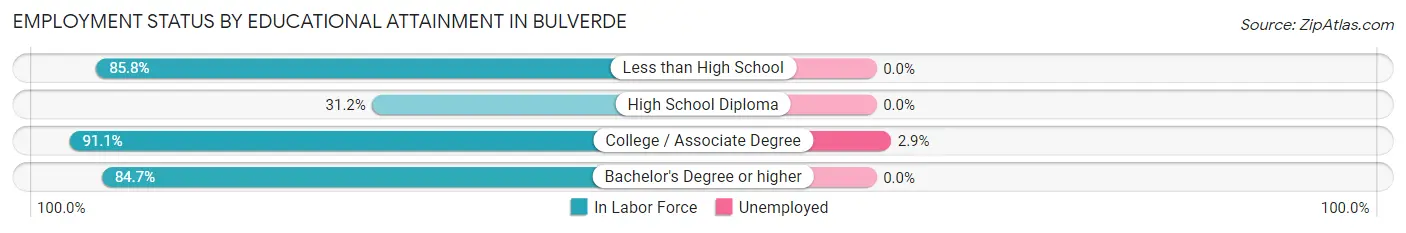
| Educational Attainment | In Labor Force | Unemployed |
| Less than High School | 109 (85.8%) | 0 (0.0%) |
| High School Diploma | 258 (31.2%) | 0 (0.0%) |
| College / Associate Degree | 483 (91.1%) | 15 (2.9%) |
| Bachelor's Degree or higher | 1,139 (84.7%) | 0 (0.0%) |
| Total | 1,988 (70.3%) | 20 (0.7%) |
Employment Occupations by Sex in Bulverde
Management, Business, Science and Arts Occupations
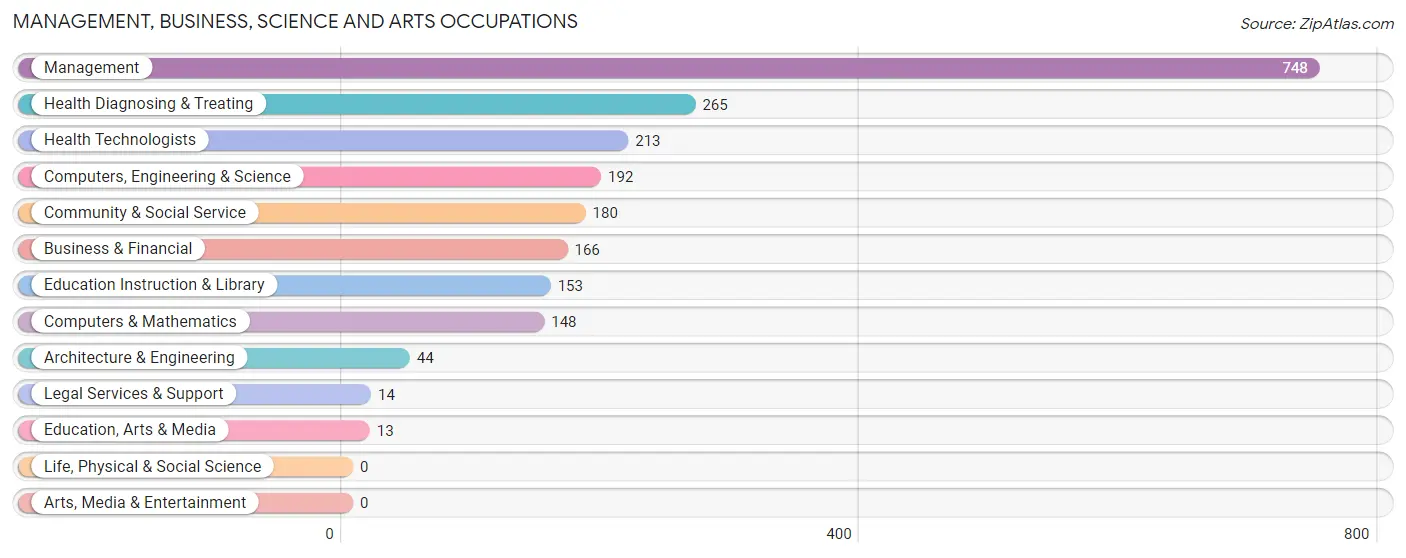
The most common Management, Business, Science and Arts occupations in Bulverde are Management (748 | 28.4%), Health Diagnosing & Treating (265 | 10.1%), Health Technologists (213 | 8.1%), Computers, Engineering & Science (192 | 7.3%), and Community & Social Service (180 | 6.8%).
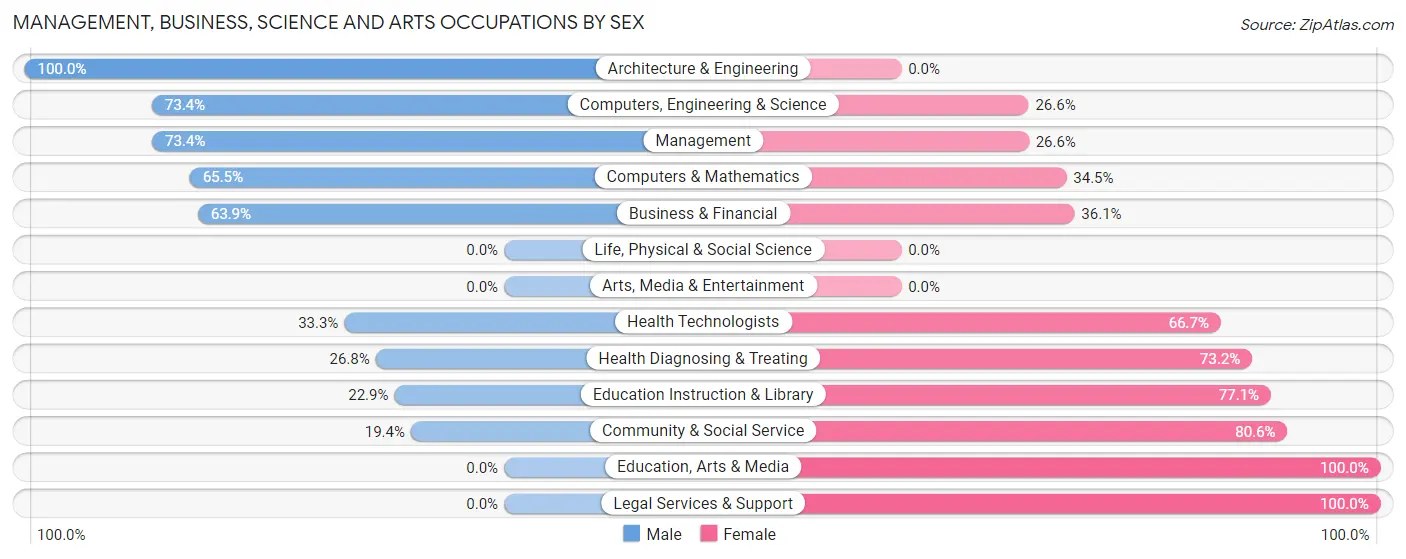
Management, Business, Science and Arts Occupations by Sex
Within the Management, Business, Science and Arts occupations in Bulverde, the most male-oriented occupations are Architecture & Engineering (100.0%), Computers, Engineering & Science (73.4%), and Management (73.4%), while the most female-oriented occupations are Education, Arts & Media (100.0%), Legal Services & Support (100.0%), and Community & Social Service (80.6%).
| Occupation | Male | Female |
| Management | 549 (73.4%) | 199 (26.6%) |
| Business & Financial | 106 (63.9%) | 60 (36.1%) |
| Computers, Engineering & Science | 141 (73.4%) | 51 (26.6%) |
| Computers & Mathematics | 97 (65.5%) | 51 (34.5%) |
| Architecture & Engineering | 44 (100.0%) | 0 (0.0%) |
| Life, Physical & Social Science | 0 (0.0%) | 0 (0.0%) |
| Community & Social Service | 35 (19.4%) | 145 (80.6%) |
| Education, Arts & Media | 0 (0.0%) | 13 (100.0%) |
| Legal Services & Support | 0 (0.0%) | 14 (100.0%) |
| Education Instruction & Library | 35 (22.9%) | 118 (77.1%) |
| Arts, Media & Entertainment | 0 (0.0%) | 0 (0.0%) |
| Health Diagnosing & Treating | 71 (26.8%) | 194 (73.2%) |
| Health Technologists | 71 (33.3%) | 142 (66.7%) |
| Total (Category) | 902 (58.2%) | 649 (41.8%) |
| Total (Overall) | 1,676 (63.6%) | 961 (36.4%) |
Services Occupations
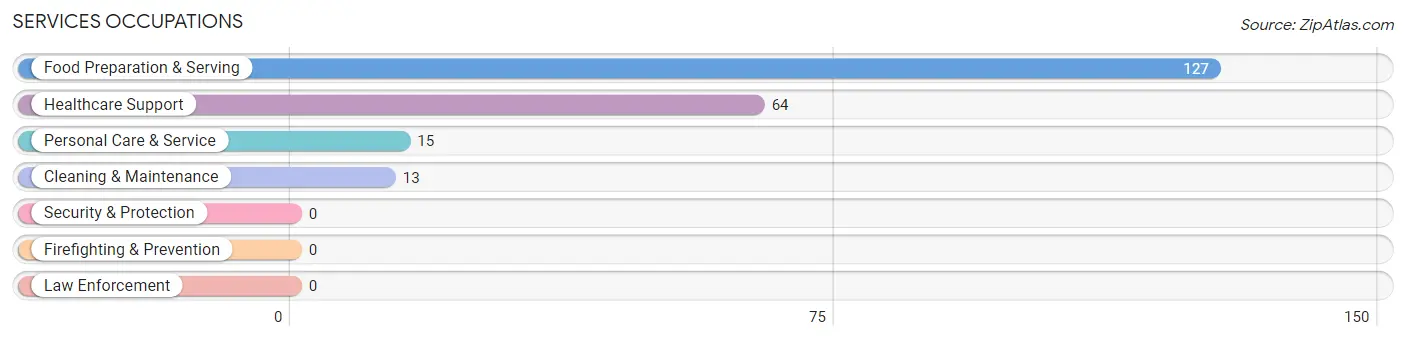
The most common Services occupations in Bulverde are Food Preparation & Serving (127 | 4.8%), Healthcare Support (64 | 2.4%), Personal Care & Service (15 | 0.6%), and Cleaning & Maintenance (13 | 0.5%).
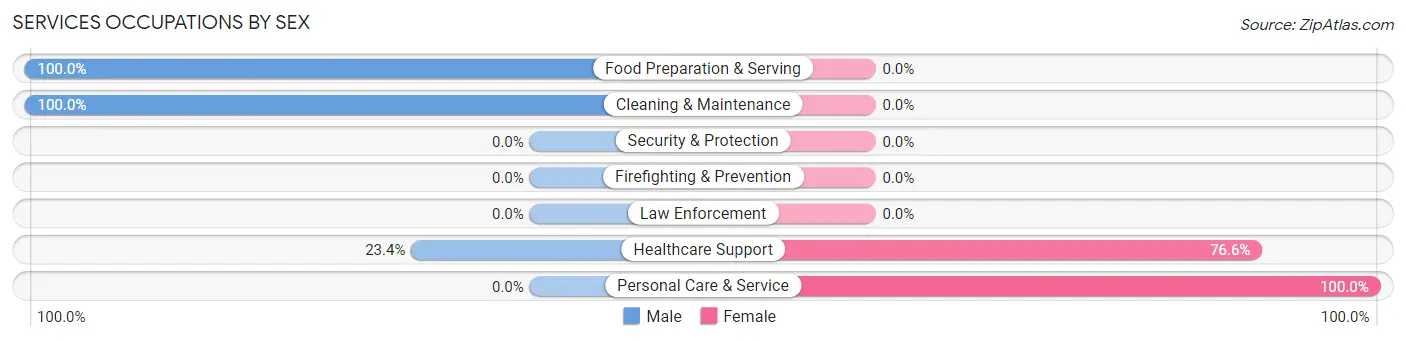
Services Occupations by Sex
Within the Services occupations in Bulverde, the most male-oriented occupations are Food Preparation & Serving (100.0%), Cleaning & Maintenance (100.0%), and Healthcare Support (23.4%), while the most female-oriented occupations are Personal Care & Service (100.0%), and Healthcare Support (76.6%).
| Occupation | Male | Female |
| Healthcare Support | 15 (23.4%) | 49 (76.6%) |
| Security & Protection | 0 (0.0%) | 0 (0.0%) |
| Firefighting & Prevention | 0 (0.0%) | 0 (0.0%) |
| Law Enforcement | 0 (0.0%) | 0 (0.0%) |
| Food Preparation & Serving | 127 (100.0%) | 0 (0.0%) |
| Cleaning & Maintenance | 13 (100.0%) | 0 (0.0%) |
| Personal Care & Service | 0 (0.0%) | 15 (100.0%) |
| Total (Category) | 155 (70.8%) | 64 (29.2%) |
| Total (Overall) | 1,676 (63.6%) | 961 (36.4%) |
Sales and Office Occupations
The most common Sales and Office occupations in Bulverde are Sales & Related (281 | 10.7%), and Office & Administration (258 | 9.8%).

Sales and Office Occupations by Sex

| Occupation | Male | Female |
| Sales & Related | 231 (82.2%) | 50 (17.8%) |
| Office & Administration | 100 (38.8%) | 158 (61.2%) |
| Total (Category) | 331 (61.4%) | 208 (38.6%) |
| Total (Overall) | 1,676 (63.6%) | 961 (36.4%) |
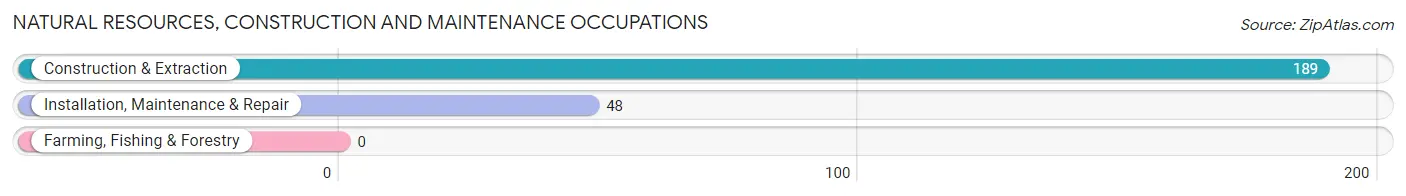
Natural Resources, Construction and Maintenance Occupations
The most common Natural Resources, Construction and Maintenance occupations in Bulverde are Construction & Extraction (189 | 7.2%), and Installation, Maintenance & Repair (48 | 1.8%).
Natural Resources, Construction and Maintenance Occupations by Sex
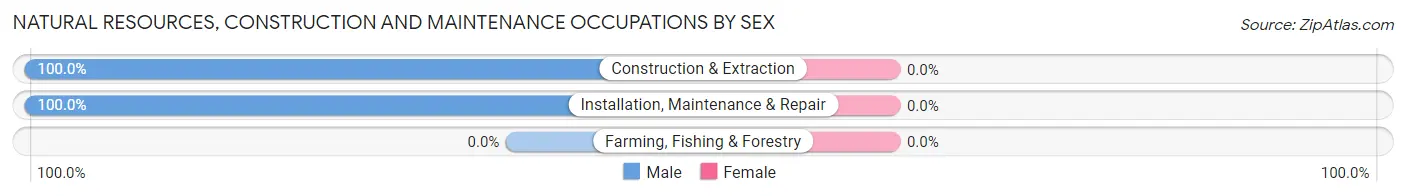
| Occupation | Male | Female |
| Farming, Fishing & Forestry | 0 (0.0%) | 0 (0.0%) |
| Construction & Extraction | 189 (100.0%) | 0 (0.0%) |
| Installation, Maintenance & Repair | 48 (100.0%) | 0 (0.0%) |
| Total (Category) | 237 (100.0%) | 0 (0.0%) |
| Total (Overall) | 1,676 (63.6%) | 961 (36.4%) |
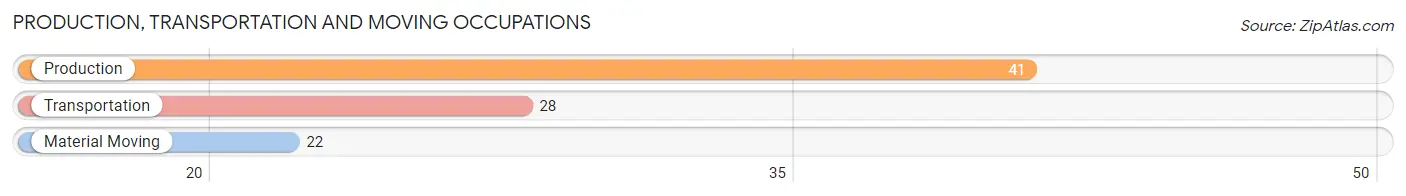
Production, Transportation and Moving Occupations
The most common Production, Transportation and Moving occupations in Bulverde are Production (41 | 1.5%), Transportation (28 | 1.1%), and Material Moving (22 | 0.8%).
Production, Transportation and Moving Occupations by Sex
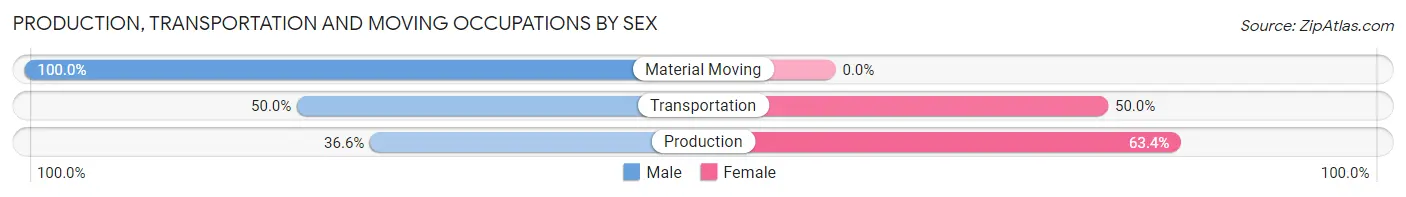
| Occupation | Male | Female |
| Production | 15 (36.6%) | 26 (63.4%) |
| Transportation | 14 (50.0%) | 14 (50.0%) |
| Material Moving | 22 (100.0%) | 0 (0.0%) |
| Total (Category) | 51 (56.0%) | 40 (44.0%) |
| Total (Overall) | 1,676 (63.6%) | 961 (36.4%) |
Employment Industries by Sex in Bulverde
Employment Industries in Bulverde
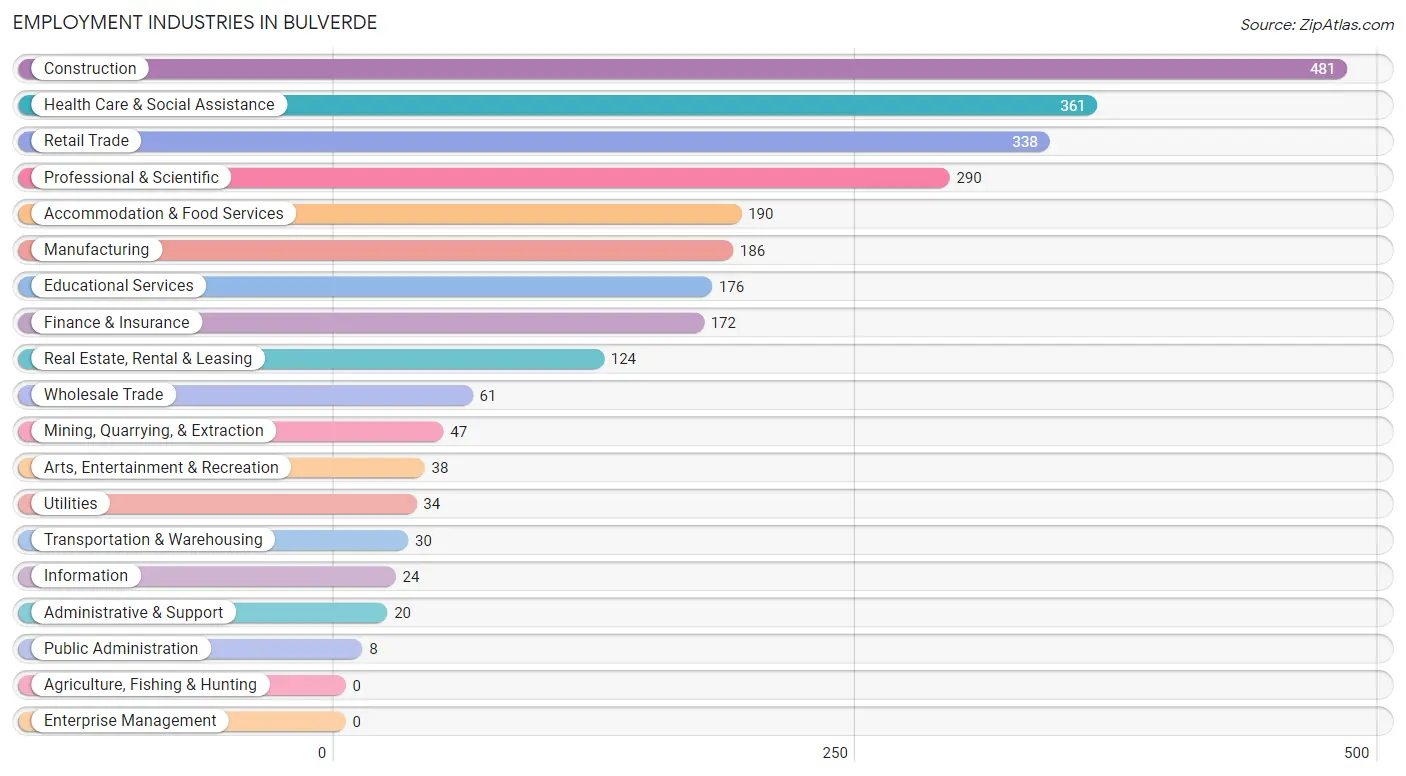
The major employment industries in Bulverde include Construction (481 | 18.2%), Health Care & Social Assistance (361 | 13.7%), Retail Trade (338 | 12.8%), Professional & Scientific (290 | 11.0%), and Accommodation & Food Services (190 | 7.2%).
Employment Industries by Sex in Bulverde
The Bulverde industries that see more men than women are Mining, Quarrying, & Extraction (100.0%), Utilities (100.0%), and Information (100.0%), whereas the industries that tend to have a higher number of women are Arts, Entertainment & Recreation (100.0%), Public Administration (100.0%), and Health Care & Social Assistance (75.3%).
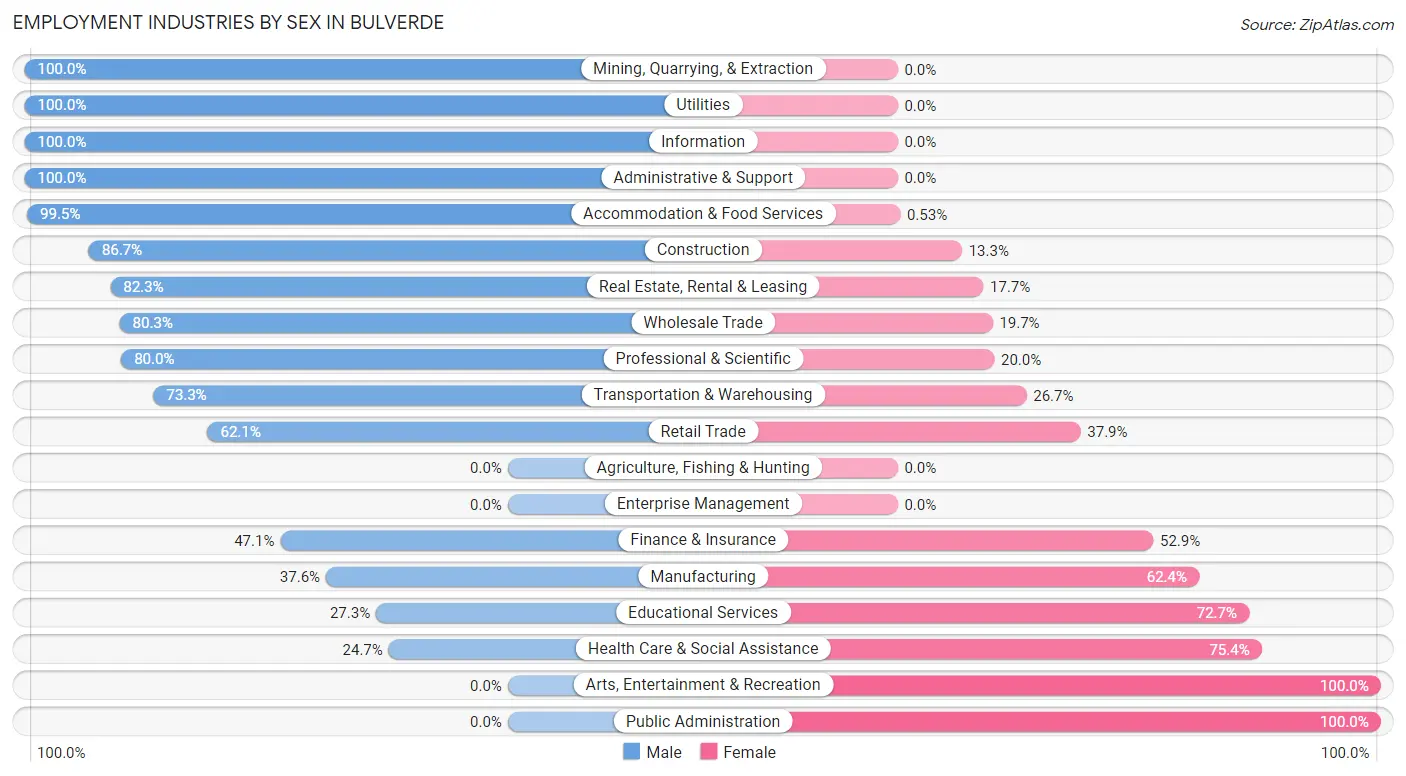
| Industry | Male | Female |
| Agriculture, Fishing & Hunting | 0 (0.0%) | 0 (0.0%) |
| Mining, Quarrying, & Extraction | 47 (100.0%) | 0 (0.0%) |
| Construction | 417 (86.7%) | 64 (13.3%) |
| Manufacturing | 70 (37.6%) | 116 (62.4%) |
| Wholesale Trade | 49 (80.3%) | 12 (19.7%) |
| Retail Trade | 210 (62.1%) | 128 (37.9%) |
| Transportation & Warehousing | 22 (73.3%) | 8 (26.7%) |
| Utilities | 34 (100.0%) | 0 (0.0%) |
| Information | 24 (100.0%) | 0 (0.0%) |
| Finance & Insurance | 81 (47.1%) | 91 (52.9%) |
| Real Estate, Rental & Leasing | 102 (82.3%) | 22 (17.7%) |
| Professional & Scientific | 232 (80.0%) | 58 (20.0%) |
| Enterprise Management | 0 (0.0%) | 0 (0.0%) |
| Administrative & Support | 20 (100.0%) | 0 (0.0%) |
| Educational Services | 48 (27.3%) | 128 (72.7%) |
| Health Care & Social Assistance | 89 (24.6%) | 272 (75.3%) |
| Arts, Entertainment & Recreation | 0 (0.0%) | 38 (100.0%) |
| Accommodation & Food Services | 189 (99.5%) | 1 (0.5%) |
| Public Administration | 0 (0.0%) | 8 (100.0%) |
| Total | 1,676 (63.6%) | 961 (36.4%) |
Education in Bulverde
School Enrollment in Bulverde
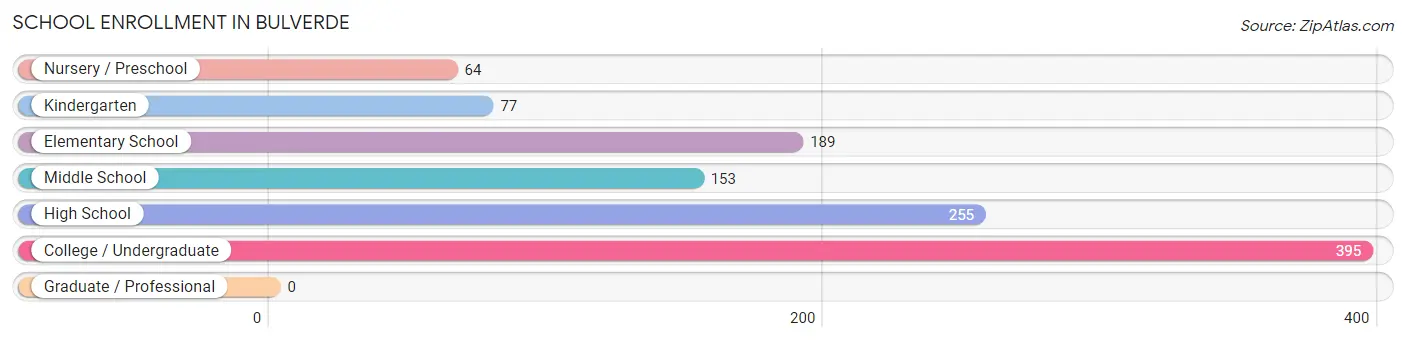
The most common levels of schooling among the 1,133 students in Bulverde are college / undergraduate (395 | 34.9%), high school (255 | 22.5%), and elementary school (189 | 16.7%).
| School Level | # Students | % Students |
| Nursery / Preschool | 64 | 5.7% |
| Kindergarten | 77 | 6.8% |
| Elementary School | 189 | 16.7% |
| Middle School | 153 | 13.5% |
| High School | 255 | 22.5% |
| College / Undergraduate | 395 | 34.9% |
| Graduate / Professional | 0 | 0.0% |
| Total | 1,133 | 100.0% |
School Enrollment by Age by Funding Source in Bulverde
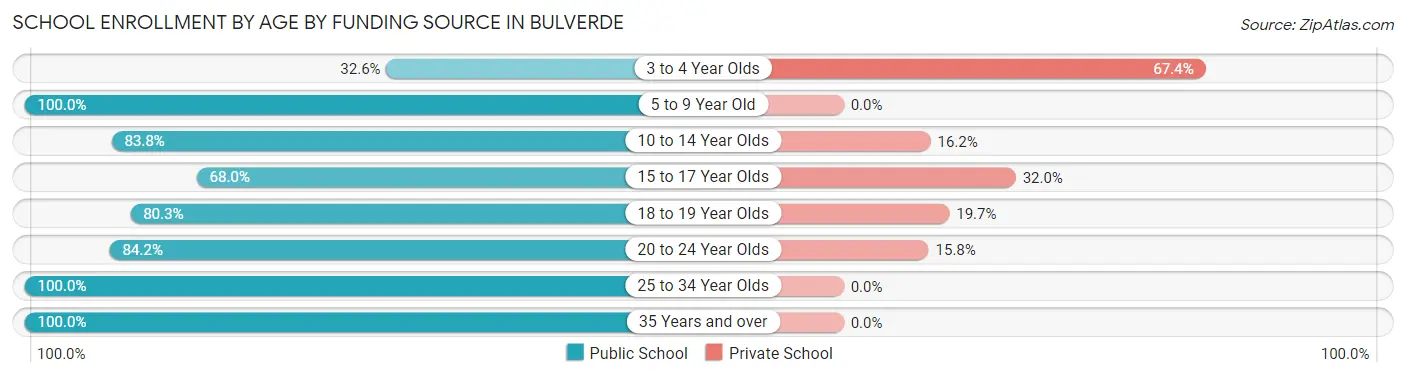
Out of a total of 1,133 students who are enrolled in schools in Bulverde, 182 (16.1%) attend a private institution, while the remaining 951 (83.9%) are enrolled in public schools. The age group of 3 to 4 year olds has the highest likelihood of being enrolled in private schools, with 31 (67.4% in the age bracket) enrolled. Conversely, the age group of 5 to 9 year old has the lowest likelihood of being enrolled in a private school, with 284 (100.0% in the age bracket) attending a public institution.
| Age Bracket | Public School | Private School |
| 3 to 4 Year Olds | 15 (32.6%) | 31 (67.4%) |
| 5 to 9 Year Old | 284 (100.0%) | 0 (0.0%) |
| 10 to 14 Year Olds | 145 (83.8%) | 28 (16.2%) |
| 15 to 17 Year Olds | 123 (68.0%) | 58 (32.0%) |
| 18 to 19 Year Olds | 151 (80.3%) | 37 (19.7%) |
| 20 to 24 Year Olds | 149 (84.2%) | 28 (15.8%) |
| 25 to 34 Year Olds | 37 (100.0%) | 0 (0.0%) |
| 35 Years and over | 47 (100.0%) | 0 (0.0%) |
| Total | 951 (83.9%) | 182 (16.1%) |
Educational Attainment by Field of Study in Bulverde
Business (447 | 25.1%), education (349 | 19.6%), science & technology (255 | 14.3%), engineering (192 | 10.8%), and bio, nature & agricultural (155 | 8.7%) are the most common fields of study among 1,780 individuals in Bulverde who have obtained a bachelor's degree or higher.
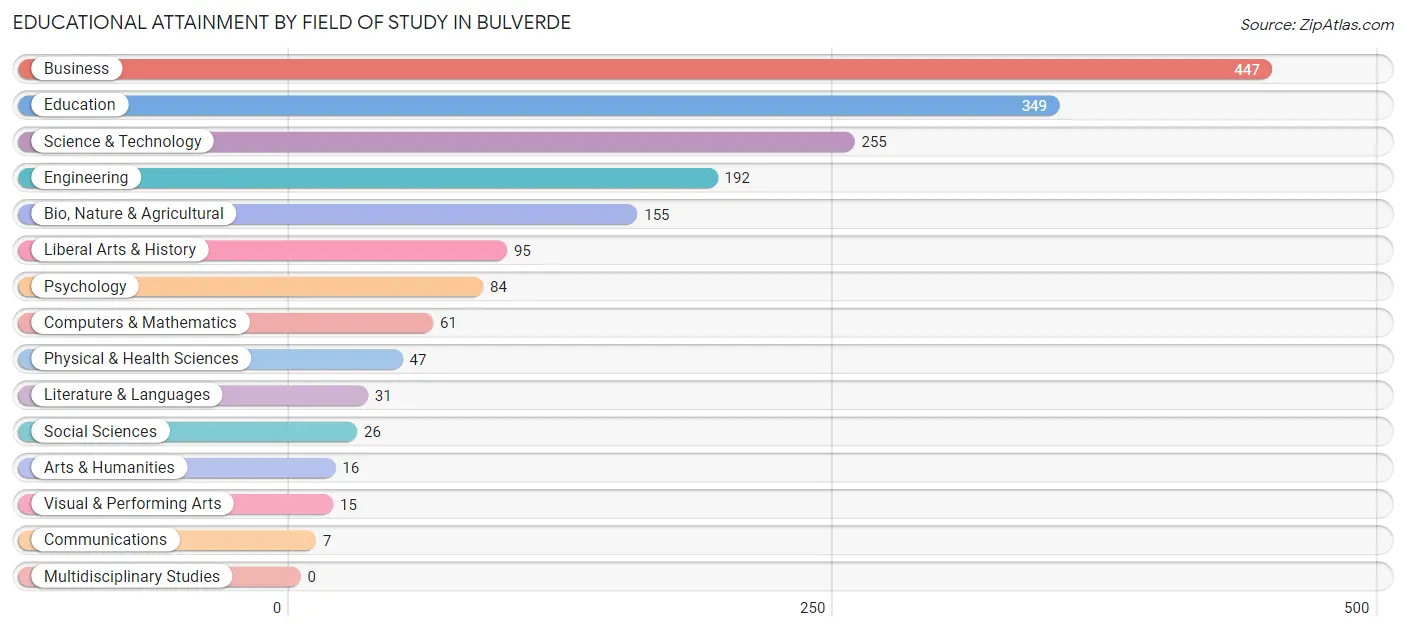
| Field of Study | # Graduates | % Graduates |
| Computers & Mathematics | 61 | 3.4% |
| Bio, Nature & Agricultural | 155 | 8.7% |
| Physical & Health Sciences | 47 | 2.6% |
| Psychology | 84 | 4.7% |
| Social Sciences | 26 | 1.5% |
| Engineering | 192 | 10.8% |
| Multidisciplinary Studies | 0 | 0.0% |
| Science & Technology | 255 | 14.3% |
| Business | 447 | 25.1% |
| Education | 349 | 19.6% |
| Literature & Languages | 31 | 1.7% |
| Liberal Arts & History | 95 | 5.3% |
| Visual & Performing Arts | 15 | 0.8% |
| Communications | 7 | 0.4% |
| Arts & Humanities | 16 | 0.9% |
| Total | 1,780 | 100.0% |
Transportation & Commute in Bulverde
Vehicle Availability by Sex in Bulverde
The most prevalent vehicle ownership categories in Bulverde are males with 3 vehicles (572, accounting for 34.5%) and females with 3 vehicles (349, making up 60.2%).
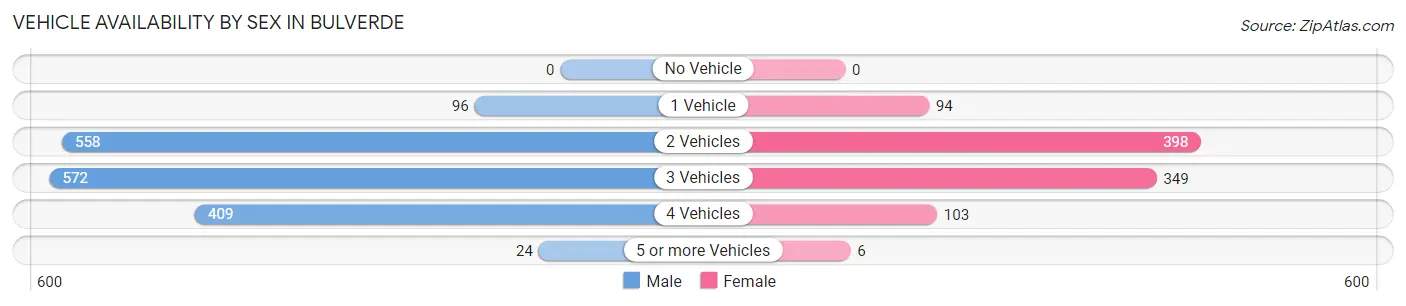
| Vehicles Available | Male | Female |
| No Vehicle | 0 (0.0%) | 0 (0.0%) |
| 1 Vehicle | 96 (5.8%) | 94 (9.9%) |
| 2 Vehicles | 558 (33.6%) | 398 (41.9%) |
| 3 Vehicles | 572 (34.5%) | 349 (36.7%) |
| 4 Vehicles | 409 (24.6%) | 103 (10.8%) |
| 5 or more Vehicles | 24 (1.5%) | 6 (0.6%) |
| Total | 1,659 (100.0%) | 950 (100.0%) |
Commute Time in Bulverde
The most frequently occuring commute durations in Bulverde are 30 to 34 minutes (513 commuters, 24.9%), 45 to 59 minutes (334 commuters, 16.2%), and 60 to 89 minutes (211 commuters, 10.2%).
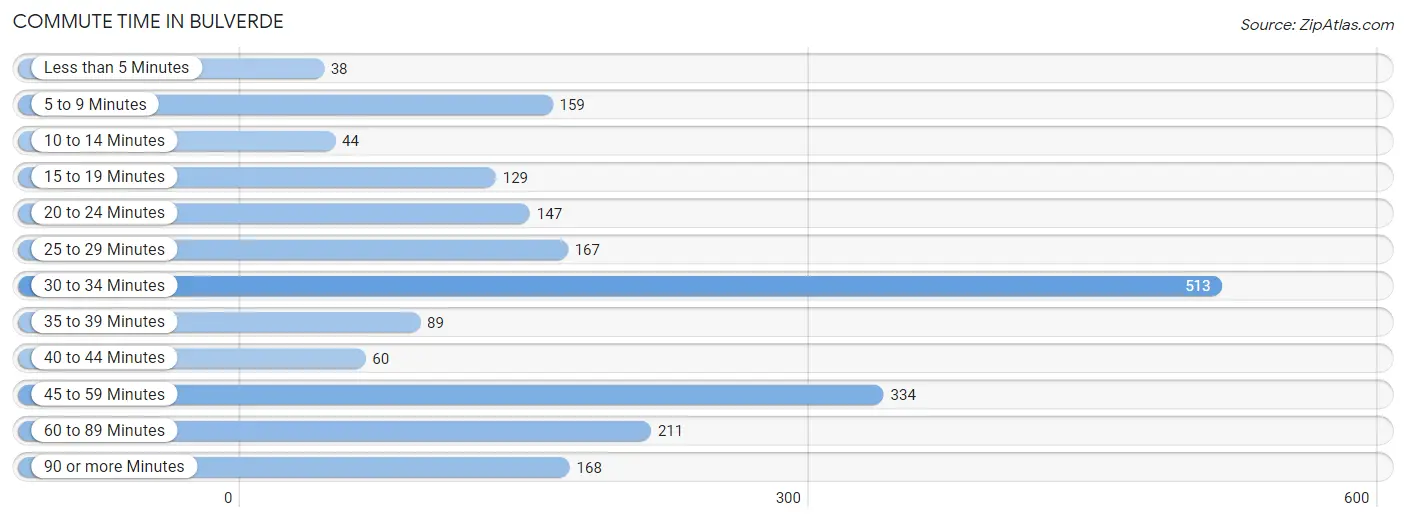
| Commute Time | # Commuters | % Commuters |
| Less than 5 Minutes | 38 | 1.8% |
| 5 to 9 Minutes | 159 | 7.7% |
| 10 to 14 Minutes | 44 | 2.1% |
| 15 to 19 Minutes | 129 | 6.3% |
| 20 to 24 Minutes | 147 | 7.1% |
| 25 to 29 Minutes | 167 | 8.1% |
| 30 to 34 Minutes | 513 | 24.9% |
| 35 to 39 Minutes | 89 | 4.3% |
| 40 to 44 Minutes | 60 | 2.9% |
| 45 to 59 Minutes | 334 | 16.2% |
| 60 to 89 Minutes | 211 | 10.2% |
| 90 or more Minutes | 168 | 8.2% |
Commute Time by Sex in Bulverde
The most common commute times in Bulverde are 30 to 34 minutes (299 commuters, 23.6%) for males and 30 to 34 minutes (214 commuters, 27.1%) for females.
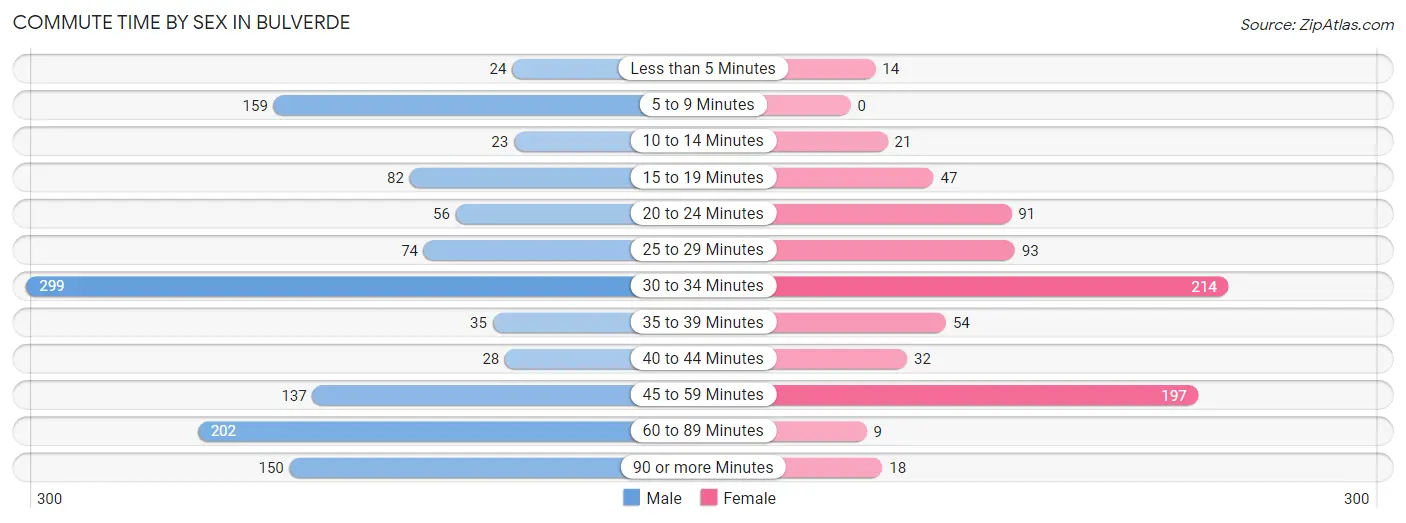
| Commute Time | Male | Female |
| Less than 5 Minutes | 24 (1.9%) | 14 (1.8%) |
| 5 to 9 Minutes | 159 (12.5%) | 0 (0.0%) |
| 10 to 14 Minutes | 23 (1.8%) | 21 (2.7%) |
| 15 to 19 Minutes | 82 (6.5%) | 47 (5.9%) |
| 20 to 24 Minutes | 56 (4.4%) | 91 (11.5%) |
| 25 to 29 Minutes | 74 (5.8%) | 93 (11.8%) |
| 30 to 34 Minutes | 299 (23.6%) | 214 (27.1%) |
| 35 to 39 Minutes | 35 (2.8%) | 54 (6.8%) |
| 40 to 44 Minutes | 28 (2.2%) | 32 (4.1%) |
| 45 to 59 Minutes | 137 (10.8%) | 197 (24.9%) |
| 60 to 89 Minutes | 202 (15.9%) | 9 (1.1%) |
| 90 or more Minutes | 150 (11.8%) | 18 (2.3%) |
Time of Departure to Work by Sex in Bulverde
The most frequent times of departure to work in Bulverde are 7:00 AM to 7:29 AM (329, 25.9%) for males and 7:00 AM to 7:29 AM (218, 27.6%) for females.
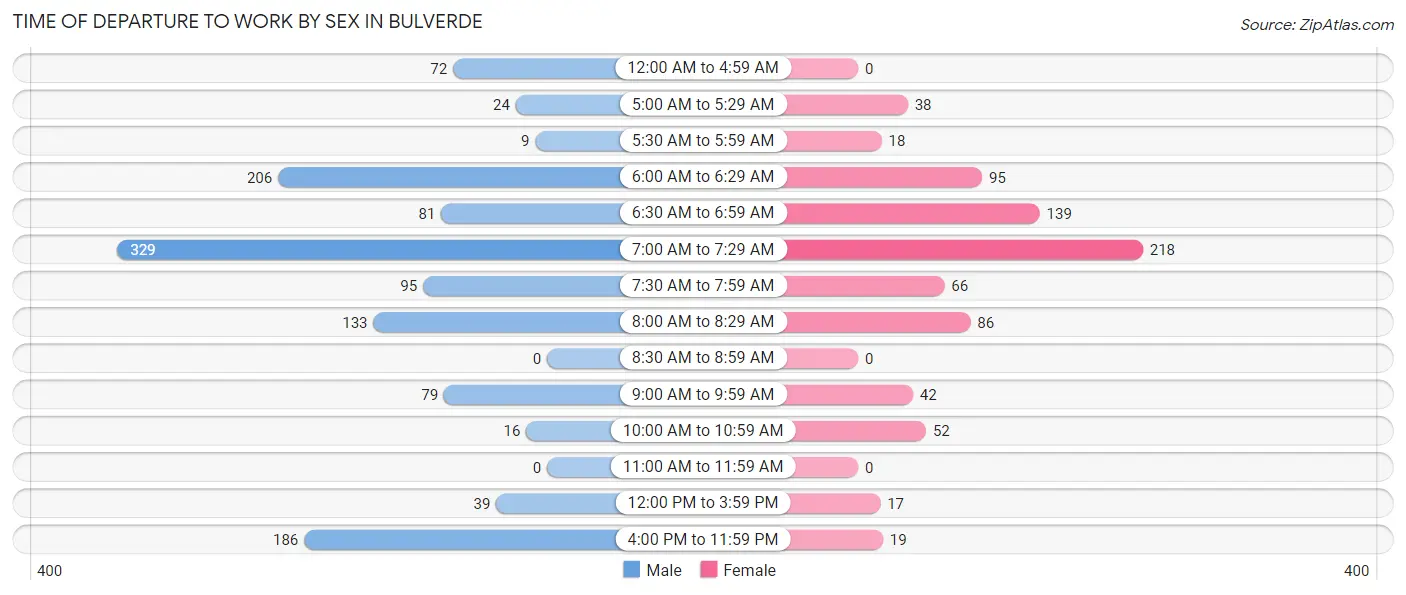
| Time of Departure | Male | Female |
| 12:00 AM to 4:59 AM | 72 (5.7%) | 0 (0.0%) |
| 5:00 AM to 5:29 AM | 24 (1.9%) | 38 (4.8%) |
| 5:30 AM to 5:59 AM | 9 (0.7%) | 18 (2.3%) |
| 6:00 AM to 6:29 AM | 206 (16.2%) | 95 (12.0%) |
| 6:30 AM to 6:59 AM | 81 (6.4%) | 139 (17.6%) |
| 7:00 AM to 7:29 AM | 329 (25.9%) | 218 (27.6%) |
| 7:30 AM to 7:59 AM | 95 (7.5%) | 66 (8.4%) |
| 8:00 AM to 8:29 AM | 133 (10.5%) | 86 (10.9%) |
| 8:30 AM to 8:59 AM | 0 (0.0%) | 0 (0.0%) |
| 9:00 AM to 9:59 AM | 79 (6.2%) | 42 (5.3%) |
| 10:00 AM to 10:59 AM | 16 (1.3%) | 52 (6.6%) |
| 11:00 AM to 11:59 AM | 0 (0.0%) | 0 (0.0%) |
| 12:00 PM to 3:59 PM | 39 (3.1%) | 17 (2.1%) |
| 4:00 PM to 11:59 PM | 186 (14.7%) | 19 (2.4%) |
| Total | 1,269 (100.0%) | 790 (100.0%) |
Housing Occupancy in Bulverde
Occupancy by Ownership in Bulverde
Of the total 2,214 dwellings in Bulverde, owner-occupied units account for 2,040 (92.1%), while renter-occupied units make up 174 (7.9%).
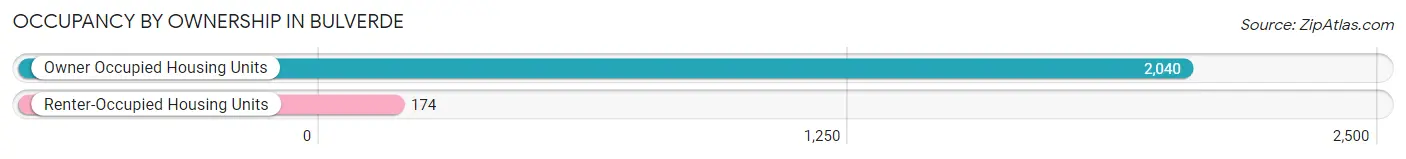
| Occupancy | # Housing Units | % Housing Units |
| Owner Occupied Housing Units | 2,040 | 92.1% |
| Renter-Occupied Housing Units | 174 | 7.9% |
| Total Occupied Housing Units | 2,214 | 100.0% |
Occupancy by Household Size in Bulverde
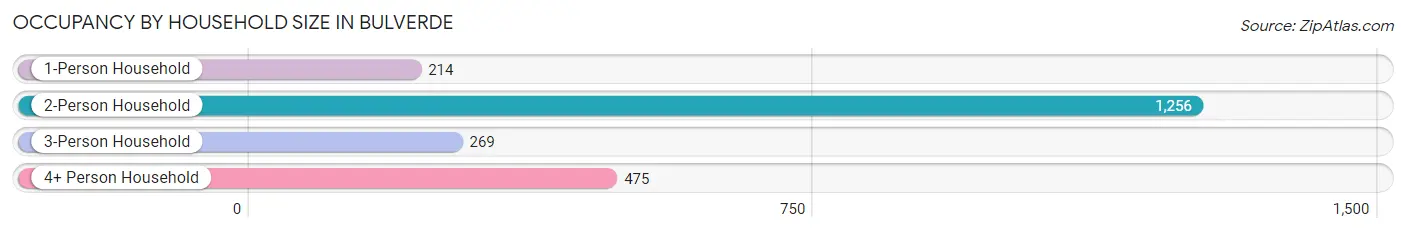
| Household Size | # Housing Units | % Housing Units |
| 1-Person Household | 214 | 9.7% |
| 2-Person Household | 1,256 | 56.7% |
| 3-Person Household | 269 | 12.1% |
| 4+ Person Household | 475 | 21.4% |
| Total Housing Units | 2,214 | 100.0% |
Occupancy by Ownership by Household Size in Bulverde
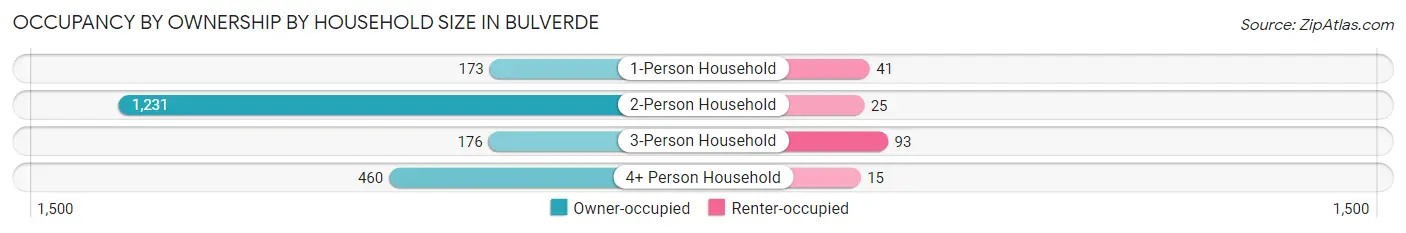
| Household Size | Owner-occupied | Renter-occupied |
| 1-Person Household | 173 (80.8%) | 41 (19.2%) |
| 2-Person Household | 1,231 (98.0%) | 25 (2.0%) |
| 3-Person Household | 176 (65.4%) | 93 (34.6%) |
| 4+ Person Household | 460 (96.8%) | 15 (3.2%) |
| Total Housing Units | 2,040 (92.1%) | 174 (7.9%) |
Occupancy by Educational Attainment in Bulverde
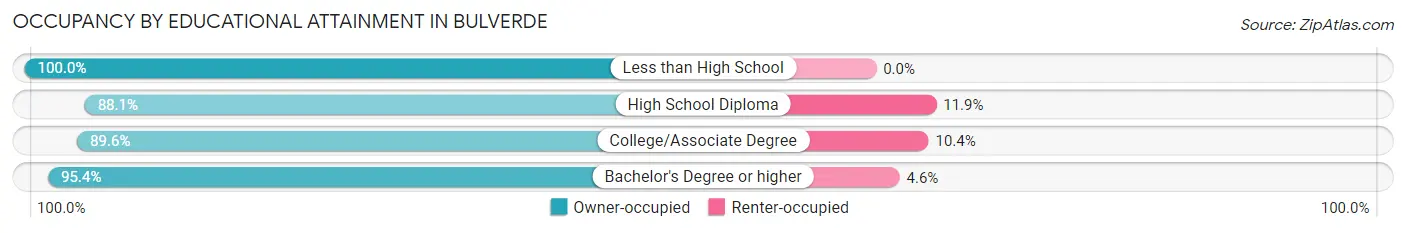
| Household Size | Owner-occupied | Renter-occupied |
| Less than High School | 113 (100.0%) | 0 (0.0%) |
| High School Diploma | 303 (88.1%) | 41 (11.9%) |
| College/Associate Degree | 802 (89.6%) | 93 (10.4%) |
| Bachelor's Degree or higher | 822 (95.4%) | 40 (4.6%) |
Occupancy by Age of Householder in Bulverde
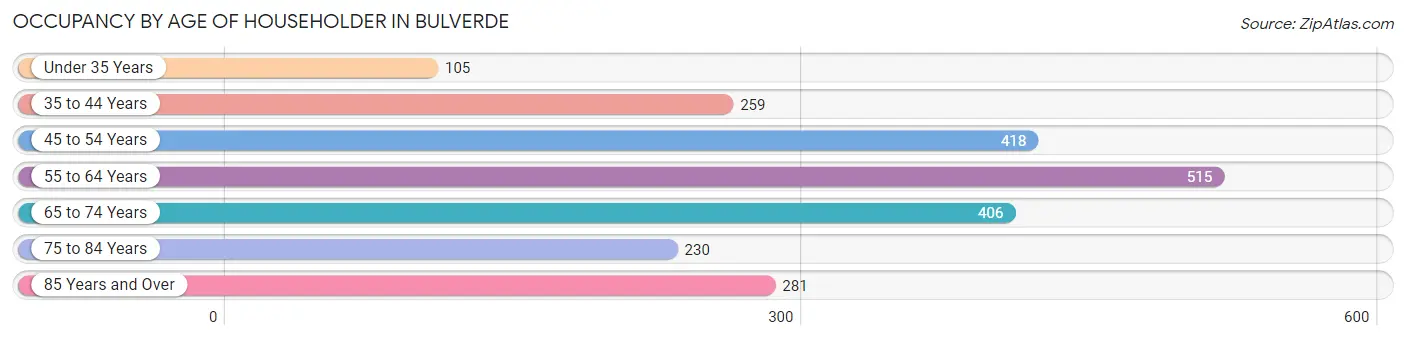
| Age Bracket | # Households | % Households |
| Under 35 Years | 105 | 4.7% |
| 35 to 44 Years | 259 | 11.7% |
| 45 to 54 Years | 418 | 18.9% |
| 55 to 64 Years | 515 | 23.3% |
| 65 to 74 Years | 406 | 18.3% |
| 75 to 84 Years | 230 | 10.4% |
| 85 Years and Over | 281 | 12.7% |
| Total | 2,214 | 100.0% |
Housing Finances in Bulverde
Median Income by Occupancy in Bulverde
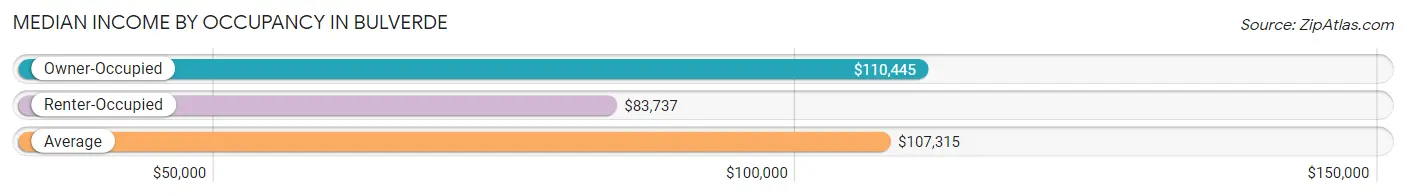
| Occupancy Type | # Households | Median Income |
| Owner-Occupied | 2,040 (92.1%) | $110,445 |
| Renter-Occupied | 174 (7.9%) | $83,737 |
| Average | 2,214 (100.0%) | $107,315 |
Occupancy by Householder Income Bracket in Bulverde
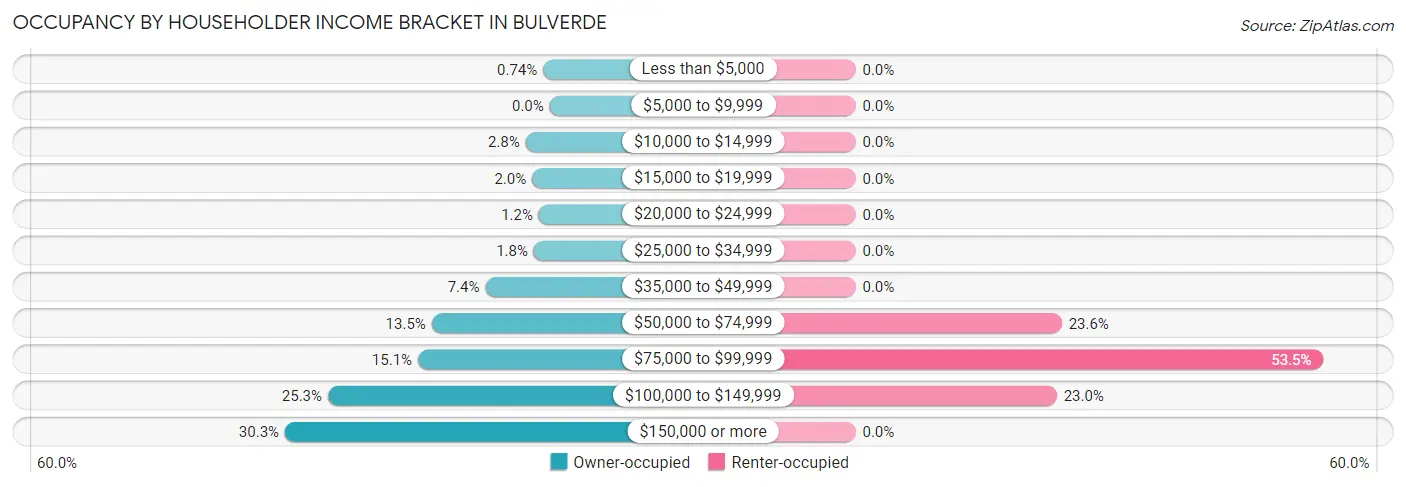
| Income Bracket | Owner-occupied | Renter-occupied |
| Less than $5,000 | 15 (0.7%) | 0 (0.0%) |
| $5,000 to $9,999 | 0 (0.0%) | 0 (0.0%) |
| $10,000 to $14,999 | 56 (2.8%) | 0 (0.0%) |
| $15,000 to $19,999 | 41 (2.0%) | 0 (0.0%) |
| $20,000 to $24,999 | 25 (1.2%) | 0 (0.0%) |
| $25,000 to $34,999 | 37 (1.8%) | 0 (0.0%) |
| $35,000 to $49,999 | 150 (7.3%) | 0 (0.0%) |
| $50,000 to $74,999 | 275 (13.5%) | 41 (23.6%) |
| $75,000 to $99,999 | 307 (15.0%) | 93 (53.4%) |
| $100,000 to $149,999 | 517 (25.3%) | 40 (23.0%) |
| $150,000 or more | 617 (30.2%) | 0 (0.0%) |
| Total | 2,040 (100.0%) | 174 (100.0%) |
Monthly Housing Cost Tiers in Bulverde
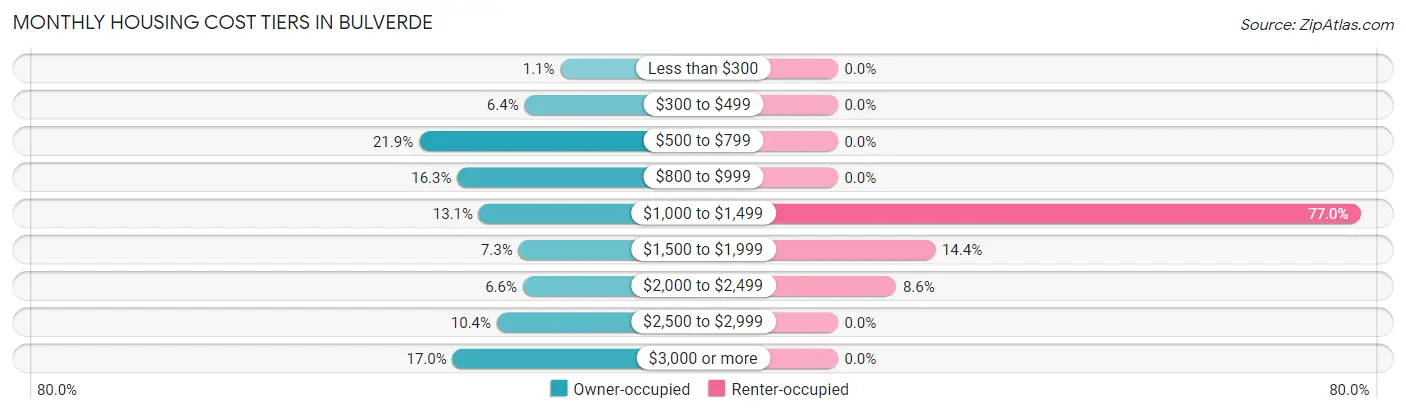
| Monthly Cost | Owner-occupied | Renter-occupied |
| Less than $300 | 22 (1.1%) | 0 (0.0%) |
| $300 to $499 | 130 (6.4%) | 0 (0.0%) |
| $500 to $799 | 447 (21.9%) | 0 (0.0%) |
| $800 to $999 | 332 (16.3%) | 0 (0.0%) |
| $1,000 to $1,499 | 267 (13.1%) | 134 (77.0%) |
| $1,500 to $1,999 | 148 (7.2%) | 25 (14.4%) |
| $2,000 to $2,499 | 135 (6.6%) | 15 (8.6%) |
| $2,500 to $2,999 | 213 (10.4%) | 0 (0.0%) |
| $3,000 or more | 346 (17.0%) | 0 (0.0%) |
| Total | 2,040 (100.0%) | 174 (100.0%) |
Physical Housing Characteristics in Bulverde
Housing Structures in Bulverde
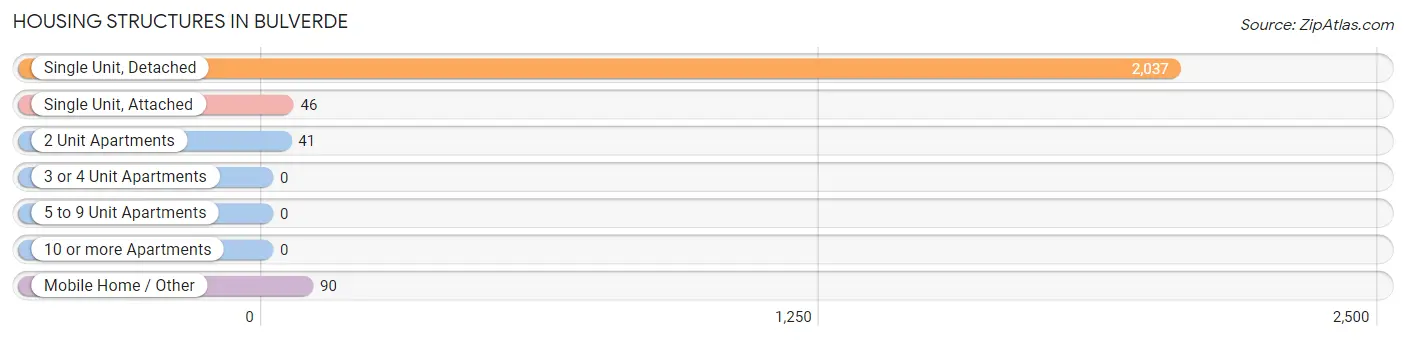
| Structure Type | # Housing Units | % Housing Units |
| Single Unit, Detached | 2,037 | 92.0% |
| Single Unit, Attached | 46 | 2.1% |
| 2 Unit Apartments | 41 | 1.8% |
| 3 or 4 Unit Apartments | 0 | 0.0% |
| 5 to 9 Unit Apartments | 0 | 0.0% |
| 10 or more Apartments | 0 | 0.0% |
| Mobile Home / Other | 90 | 4.1% |
| Total | 2,214 | 100.0% |
Housing Structures by Occupancy in Bulverde
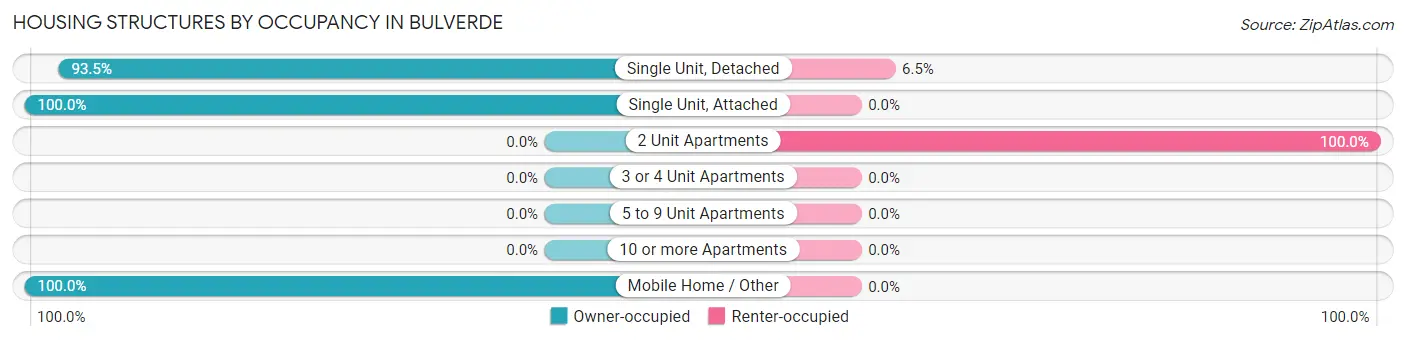
| Structure Type | Owner-occupied | Renter-occupied |
| Single Unit, Detached | 1,904 (93.5%) | 133 (6.5%) |
| Single Unit, Attached | 46 (100.0%) | 0 (0.0%) |
| 2 Unit Apartments | 0 (0.0%) | 41 (100.0%) |
| 3 or 4 Unit Apartments | 0 (0.0%) | 0 (0.0%) |
| 5 to 9 Unit Apartments | 0 (0.0%) | 0 (0.0%) |
| 10 or more Apartments | 0 (0.0%) | 0 (0.0%) |
| Mobile Home / Other | 90 (100.0%) | 0 (0.0%) |
| Total | 2,040 (92.1%) | 174 (7.9%) |
Housing Structures by Number of Rooms in Bulverde
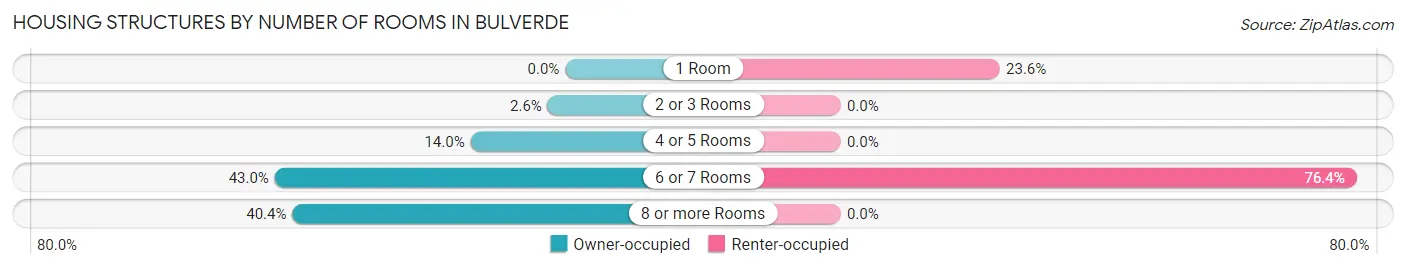
| Number of Rooms | Owner-occupied | Renter-occupied |
| 1 Room | 0 (0.0%) | 41 (23.6%) |
| 2 or 3 Rooms | 53 (2.6%) | 0 (0.0%) |
| 4 or 5 Rooms | 286 (14.0%) | 0 (0.0%) |
| 6 or 7 Rooms | 877 (43.0%) | 133 (76.4%) |
| 8 or more Rooms | 824 (40.4%) | 0 (0.0%) |
| Total | 2,040 (100.0%) | 174 (100.0%) |
Housing Structure by Heating Type in Bulverde
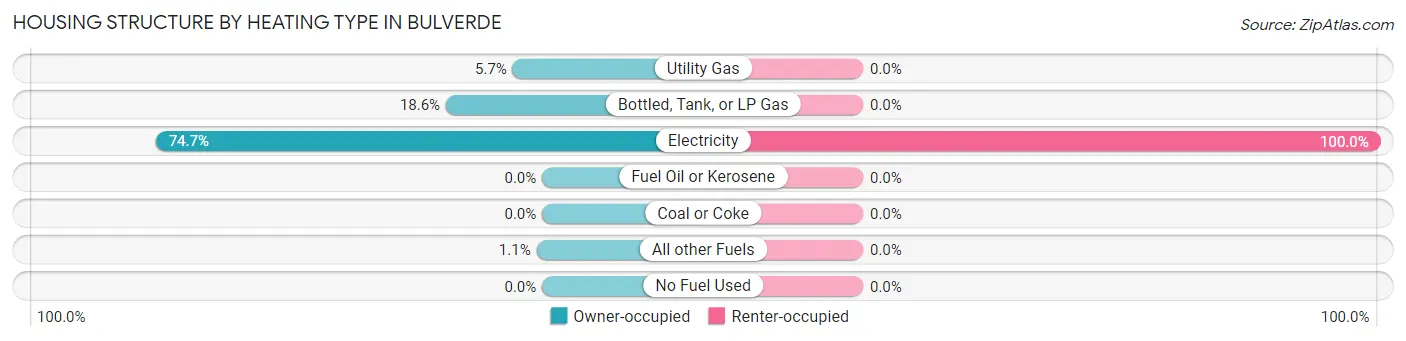
| Heating Type | Owner-occupied | Renter-occupied |
| Utility Gas | 116 (5.7%) | 0 (0.0%) |
| Bottled, Tank, or LP Gas | 379 (18.6%) | 0 (0.0%) |
| Electricity | 1,523 (74.7%) | 174 (100.0%) |
| Fuel Oil or Kerosene | 0 (0.0%) | 0 (0.0%) |
| Coal or Coke | 0 (0.0%) | 0 (0.0%) |
| All other Fuels | 22 (1.1%) | 0 (0.0%) |
| No Fuel Used | 0 (0.0%) | 0 (0.0%) |
| Total | 2,040 (100.0%) | 174 (100.0%) |
Household Vehicle Usage in Bulverde
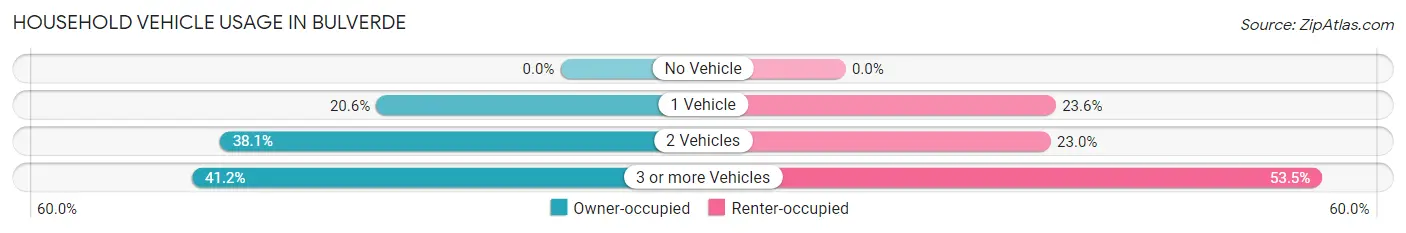
| Vehicles per Household | Owner-occupied | Renter-occupied |
| No Vehicle | 0 (0.0%) | 0 (0.0%) |
| 1 Vehicle | 421 (20.6%) | 41 (23.6%) |
| 2 Vehicles | 778 (38.1%) | 40 (23.0%) |
| 3 or more Vehicles | 841 (41.2%) | 93 (53.4%) |
| Total | 2,040 (100.0%) | 174 (100.0%) |
Real Estate & Mortgages in Bulverde
Real Estate and Mortgage Overview in Bulverde
| Characteristic | Without Mortgage | With Mortgage |
| Housing Units | 1,084 | 956 |
| Median Property Value | $287,200 | $474,200 |
| Median Household Income | $99,432 | $420 |
| Monthly Housing Costs | $776 | $346 |
| Real Estate Taxes | $3,973 | $0 |
Property Value by Mortgage Status in Bulverde
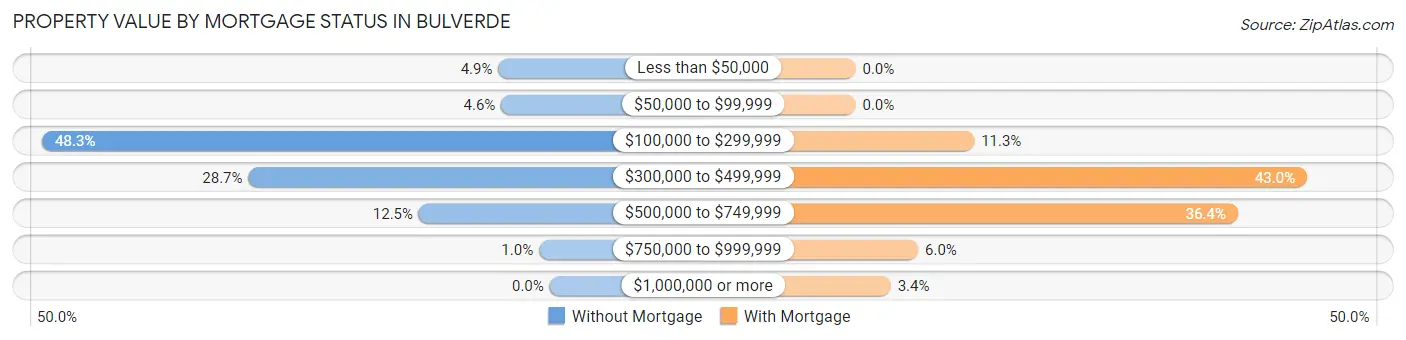
| Property Value | Without Mortgage | With Mortgage |
| Less than $50,000 | 53 (4.9%) | 0 (0.0%) |
| $50,000 to $99,999 | 50 (4.6%) | 0 (0.0%) |
| $100,000 to $299,999 | 524 (48.3%) | 108 (11.3%) |
| $300,000 to $499,999 | 311 (28.7%) | 411 (43.0%) |
| $500,000 to $749,999 | 135 (12.4%) | 348 (36.4%) |
| $750,000 to $999,999 | 11 (1.0%) | 57 (6.0%) |
| $1,000,000 or more | 0 (0.0%) | 32 (3.4%) |
| Total | 1,084 (100.0%) | 956 (100.0%) |
Household Income by Mortgage Status in Bulverde
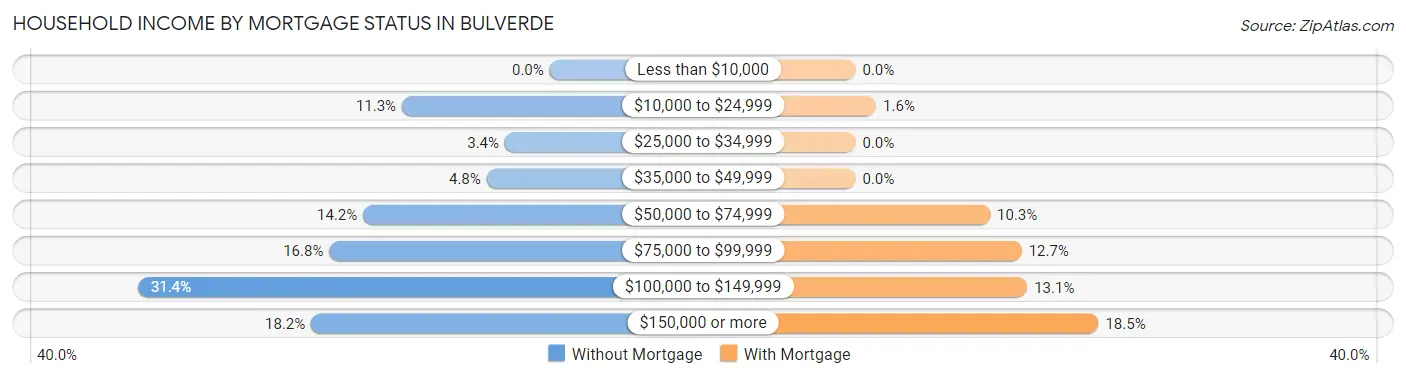
| Household Income | Without Mortgage | With Mortgage |
| Less than $10,000 | 0 (0.0%) | 0 (0.0%) |
| $10,000 to $24,999 | 122 (11.3%) | 15 (1.6%) |
| $25,000 to $34,999 | 37 (3.4%) | 0 (0.0%) |
| $35,000 to $49,999 | 52 (4.8%) | 0 (0.0%) |
| $50,000 to $74,999 | 154 (14.2%) | 98 (10.2%) |
| $75,000 to $99,999 | 182 (16.8%) | 121 (12.7%) |
| $100,000 to $149,999 | 340 (31.4%) | 125 (13.1%) |
| $150,000 or more | 197 (18.2%) | 177 (18.5%) |
| Total | 1,084 (100.0%) | 956 (100.0%) |
Property Value to Household Income Ratio in Bulverde
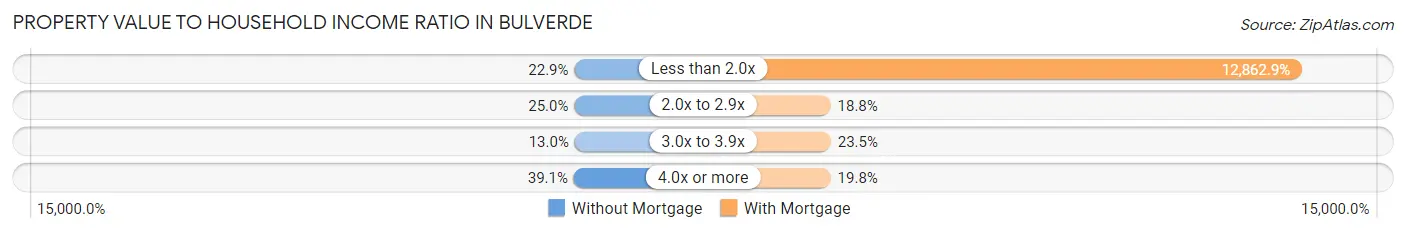
| Value-to-Income Ratio | Without Mortgage | With Mortgage |
| Less than 2.0x | 248 (22.9%) | 122,969 (12,862.9%) |
| 2.0x to 2.9x | 271 (25.0%) | 180 (18.8%) |
| 3.0x to 3.9x | 141 (13.0%) | 225 (23.5%) |
| 4.0x or more | 424 (39.1%) | 189 (19.8%) |
| Total | 1,084 (100.0%) | 956 (100.0%) |
Real Estate Taxes by Mortgage Status in Bulverde

| Property Taxes | Without Mortgage | With Mortgage |
| Less than $800 | 22 (2.0%) | 15 (1.6%) |
| $800 to $1,499 | 28 (2.6%) | 0 (0.0%) |
| $800 to $1,499 | 968 (89.3%) | 23 (2.4%) |
| Total | 1,084 (100.0%) | 956 (100.0%) |
Health & Disability in Bulverde
Health Insurance Coverage by Age in Bulverde
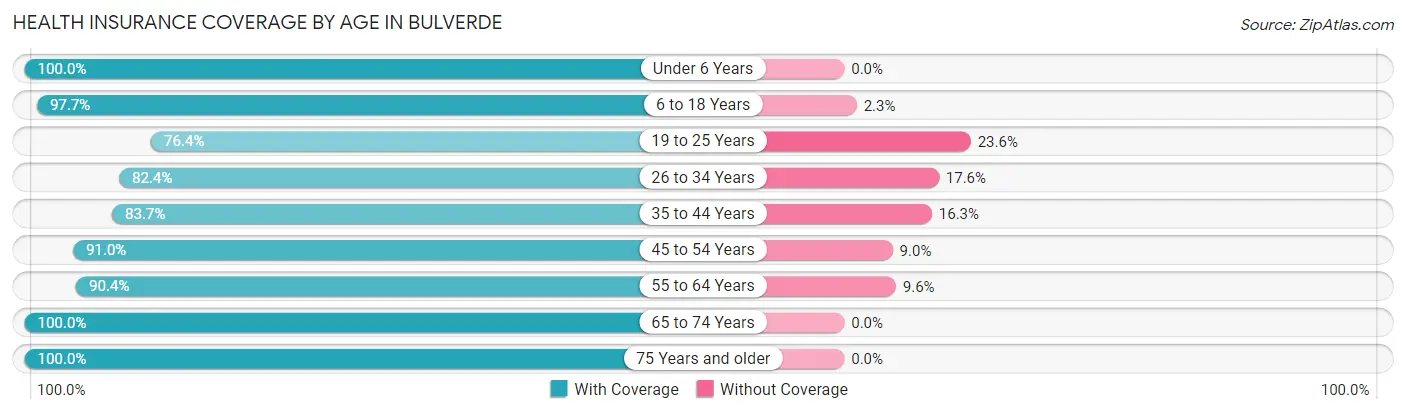
| Age Bracket | With Coverage | Without Coverage |
| Under 6 Years | 124 (100.0%) | 0 (0.0%) |
| 6 to 18 Years | 762 (97.7%) | 18 (2.3%) |
| 19 to 25 Years | 295 (76.4%) | 91 (23.6%) |
| 26 to 34 Years | 327 (82.4%) | 70 (17.6%) |
| 35 to 44 Years | 461 (83.7%) | 90 (16.3%) |
| 45 to 54 Years | 706 (91.0%) | 70 (9.0%) |
| 55 to 64 Years | 978 (90.4%) | 104 (9.6%) |
| 65 to 74 Years | 986 (100.0%) | 0 (0.0%) |
| 75 Years and older | 731 (100.0%) | 0 (0.0%) |
| Total | 5,370 (92.4%) | 443 (7.6%) |
Health Insurance Coverage by Citizenship Status in Bulverde

| Citizenship Status | With Coverage | Without Coverage |
| Native Born | 124 (100.0%) | 0 (0.0%) |
| Foreign Born, Citizen | 762 (97.7%) | 18 (2.3%) |
| Foreign Born, not a Citizen | 295 (76.4%) | 91 (23.6%) |
Health Insurance Coverage by Household Income in Bulverde
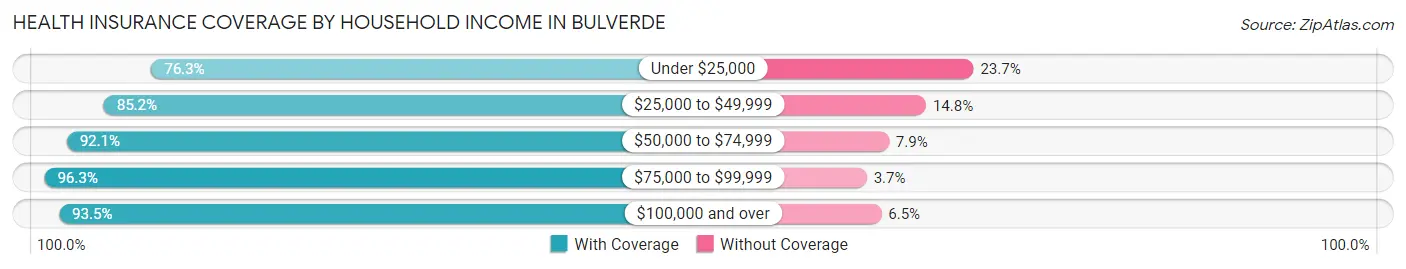
| Household Income | With Coverage | Without Coverage |
| Under $25,000 | 196 (76.3%) | 61 (23.7%) |
| $25,000 to $49,999 | 373 (85.2%) | 65 (14.8%) |
| $50,000 to $74,999 | 665 (92.1%) | 57 (7.9%) |
| $75,000 to $99,999 | 930 (96.3%) | 36 (3.7%) |
| $100,000 and over | 3,202 (93.5%) | 222 (6.5%) |
Public vs Private Health Insurance Coverage by Age in Bulverde
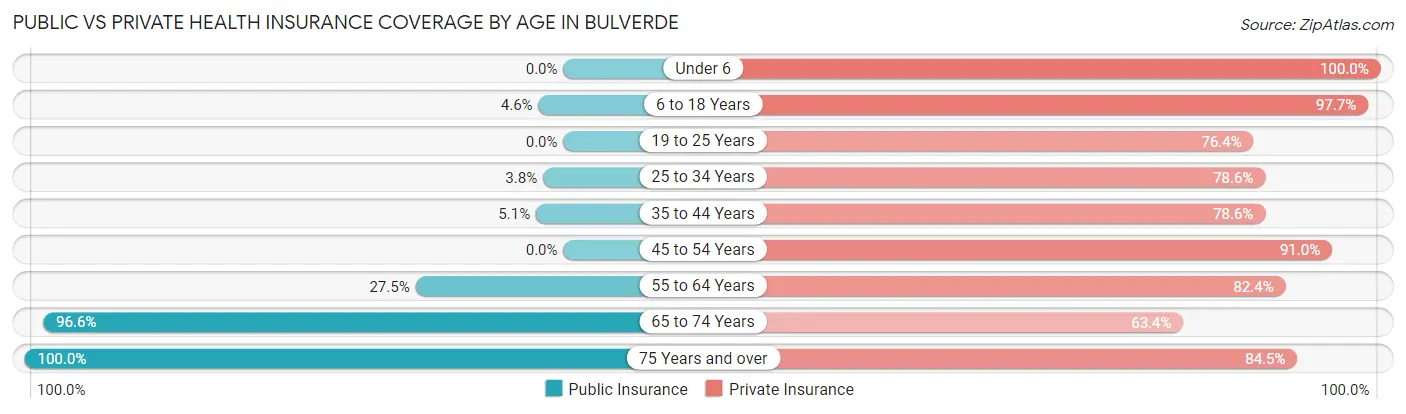
| Age Bracket | Public Insurance | Private Insurance |
| Under 6 | 0 (0.0%) | 124 (100.0%) |
| 6 to 18 Years | 36 (4.6%) | 762 (97.7%) |
| 19 to 25 Years | 0 (0.0%) | 295 (76.4%) |
| 25 to 34 Years | 15 (3.8%) | 312 (78.6%) |
| 35 to 44 Years | 28 (5.1%) | 433 (78.6%) |
| 45 to 54 Years | 0 (0.0%) | 706 (91.0%) |
| 55 to 64 Years | 297 (27.5%) | 891 (82.4%) |
| 65 to 74 Years | 952 (96.6%) | 625 (63.4%) |
| 75 Years and over | 731 (100.0%) | 618 (84.5%) |
| Total | 2,059 (35.4%) | 4,766 (82.0%) |
Disability Status by Sex by Age in Bulverde
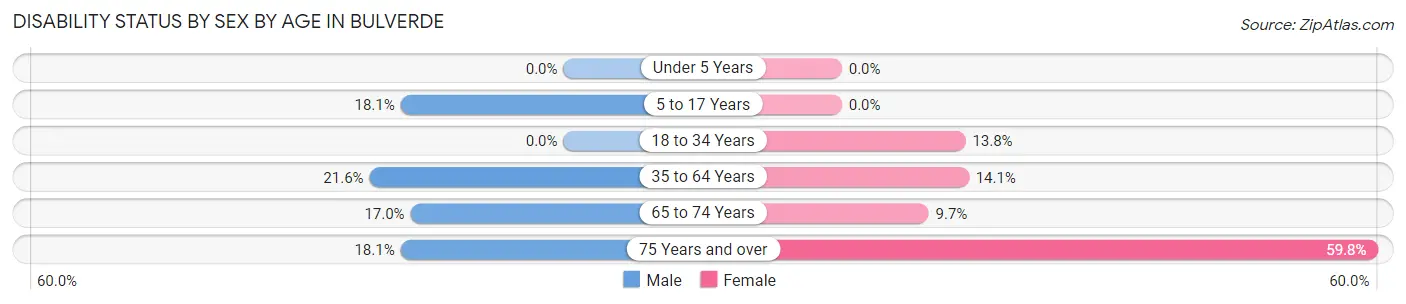
| Age Bracket | Male | Female |
| Under 5 Years | 0 (0.0%) | 0 (0.0%) |
| 5 to 17 Years | 64 (18.1%) | 0 (0.0%) |
| 18 to 34 Years | 0 (0.0%) | 61 (13.8%) |
| 35 to 64 Years | 256 (21.6%) | 173 (14.1%) |
| 65 to 74 Years | 71 (17.0%) | 55 (9.7%) |
| 75 Years and over | 74 (18.1%) | 193 (59.8%) |
Disability Class by Sex by Age in Bulverde
Disability Class: Hearing Difficulty
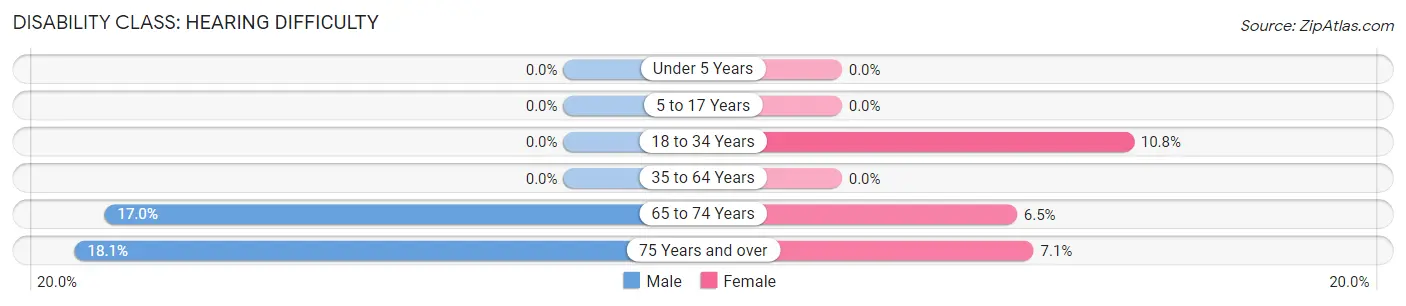
| Age Bracket | Male | Female |
| Under 5 Years | 0 (0.0%) | 0 (0.0%) |
| 5 to 17 Years | 0 (0.0%) | 0 (0.0%) |
| 18 to 34 Years | 0 (0.0%) | 48 (10.8%) |
| 35 to 64 Years | 0 (0.0%) | 0 (0.0%) |
| 65 to 74 Years | 71 (17.0%) | 37 (6.5%) |
| 75 Years and over | 74 (18.1%) | 23 (7.1%) |
Disability Class: Vision Difficulty
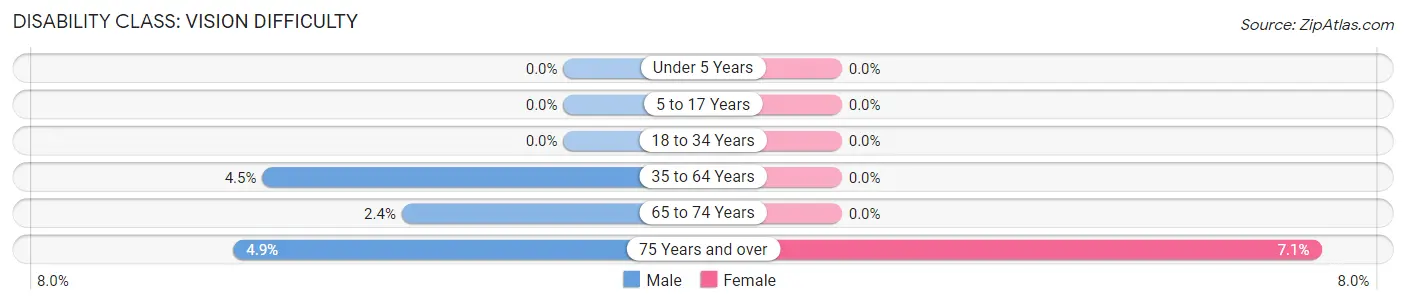
| Age Bracket | Male | Female |
| Under 5 Years | 0 (0.0%) | 0 (0.0%) |
| 5 to 17 Years | 0 (0.0%) | 0 (0.0%) |
| 18 to 34 Years | 0 (0.0%) | 0 (0.0%) |
| 35 to 64 Years | 53 (4.5%) | 0 (0.0%) |
| 65 to 74 Years | 10 (2.4%) | 0 (0.0%) |
| 75 Years and over | 20 (4.9%) | 23 (7.1%) |
Disability Class: Cognitive Difficulty
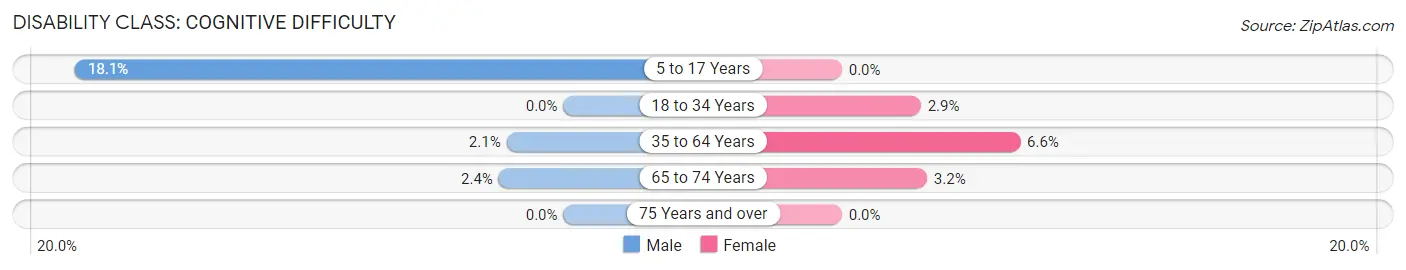
| Age Bracket | Male | Female |
| 5 to 17 Years | 64 (18.1%) | 0 (0.0%) |
| 18 to 34 Years | 0 (0.0%) | 13 (2.9%) |
| 35 to 64 Years | 25 (2.1%) | 81 (6.6%) |
| 65 to 74 Years | 10 (2.4%) | 18 (3.2%) |
| 75 Years and over | 0 (0.0%) | 0 (0.0%) |
Disability Class: Ambulatory Difficulty
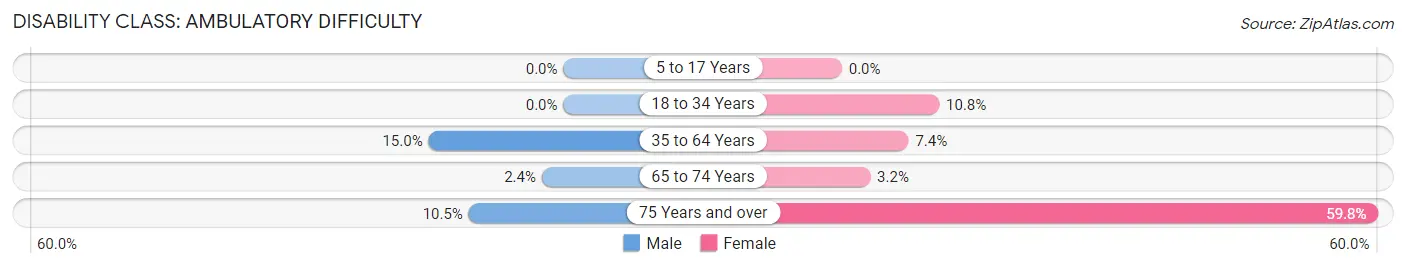
| Age Bracket | Male | Female |
| 5 to 17 Years | 0 (0.0%) | 0 (0.0%) |
| 18 to 34 Years | 0 (0.0%) | 48 (10.8%) |
| 35 to 64 Years | 178 (15.0%) | 91 (7.4%) |
| 65 to 74 Years | 10 (2.4%) | 18 (3.2%) |
| 75 Years and over | 43 (10.5%) | 193 (59.8%) |
Disability Class: Self-Care Difficulty
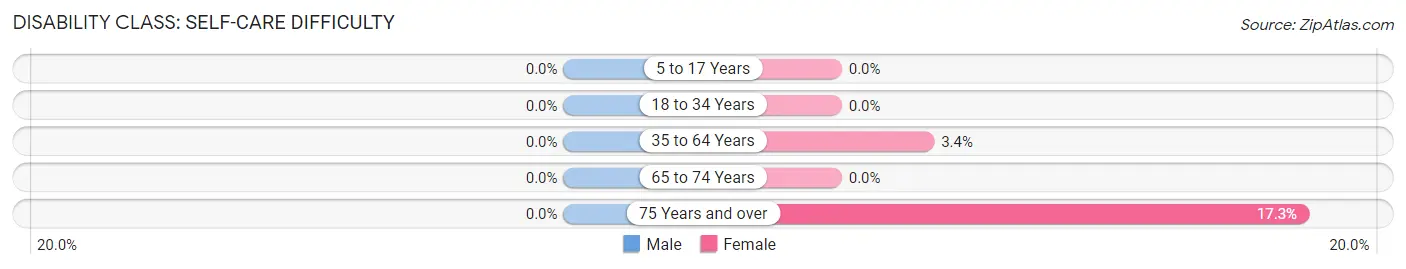
| Age Bracket | Male | Female |
| 5 to 17 Years | 0 (0.0%) | 0 (0.0%) |
| 18 to 34 Years | 0 (0.0%) | 0 (0.0%) |
| 35 to 64 Years | 0 (0.0%) | 42 (3.4%) |
| 65 to 74 Years | 0 (0.0%) | 0 (0.0%) |
| 75 Years and over | 0 (0.0%) | 56 (17.3%) |
Technology Access in Bulverde
Computing Device Access in Bulverde
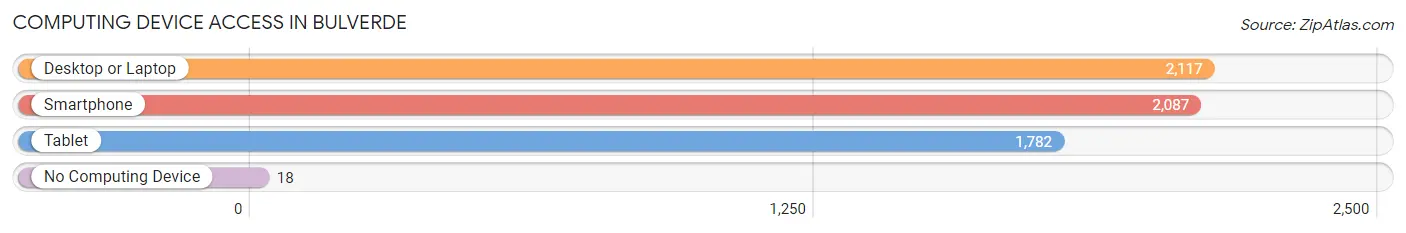
| Device Type | # Households | % Households |
| Desktop or Laptop | 2,117 | 95.6% |
| Smartphone | 2,087 | 94.3% |
| Tablet | 1,782 | 80.5% |
| No Computing Device | 18 | 0.8% |
| Total | 2,214 | 100.0% |
Internet Access in Bulverde
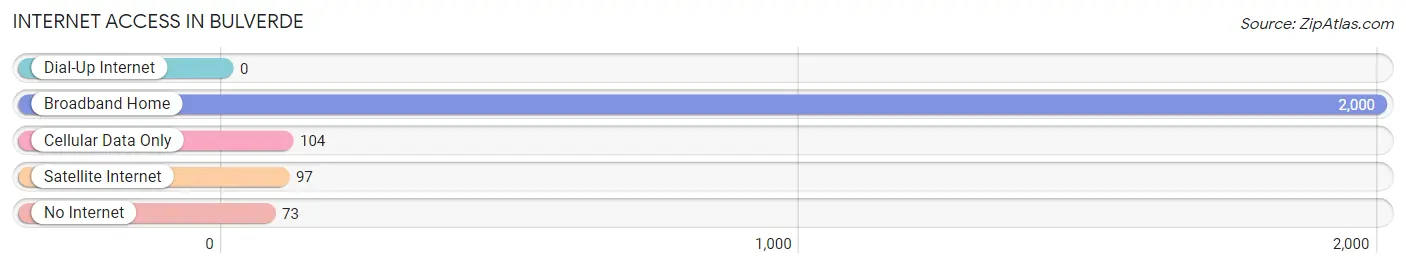
| Internet Type | # Households | % Households |
| Dial-Up Internet | 0 | 0.0% |
| Broadband Home | 2,000 | 90.3% |
| Cellular Data Only | 104 | 4.7% |
| Satellite Internet | 97 | 4.4% |
| No Internet | 73 | 3.3% |
| Total | 2,214 | 100.0% |
Bulverde Summary
Bulverde is a small city located in Comal County, Texas, United States. It is situated about 25 miles north of San Antonio and is part of the San Antonio Metropolitan Statistical Area. The city was incorporated in 2000 and has a population of around 5,000 people.
History
The area that is now Bulverde was originally inhabited by Native American tribes, including the Tonkawa, Comanche, and Lipan Apache. The first European settlers arrived in the area in the early 1800s, and the town was officially established in 1852. The town was named after a local creek, which was named after a German settler named John Bulverde.
In the late 1800s, the town began to grow as a center for ranching and farming. The town was also home to a number of businesses, including a general store, a blacksmith shop, and a cotton gin.
In the early 1900s, the town began to experience a period of growth and development. The town was connected to San Antonio by a railroad line in 1910, and the first school was built in 1912. The town continued to grow throughout the 20th century, and in 2000, it was officially incorporated as a city.
Geography
Bulverde is located in Comal County, Texas, about 25 miles north of San Antonio. The city is situated in the Hill Country region of Texas, and is surrounded by rolling hills and wooded areas. The city is located at the intersection of State Highway 46 and State Highway 281.
The climate in Bulverde is generally mild, with hot summers and mild winters. The average temperature in the summer is around 90 degrees Fahrenheit, and the average temperature in the winter is around 50 degrees Fahrenheit.
Economy
The economy of Bulverde is largely based on tourism and retail. The city is home to a number of tourist attractions, including the Natural Bridge Caverns, the Natural Bridge Wildlife Ranch, and the Natural Bridge Wildlife Park. The city is also home to a number of retail stores, restaurants, and other businesses.
The city is also home to a number of manufacturing and industrial businesses, including a number of food processing plants. The city is also home to a number of technology companies, including a number of software development firms.
Demographics
As of the 2010 census, the population of Bulverde was 5,000. The racial makeup of the city was 94.3% White, 0.7% African American, 0.3% Native American, 0.7% Asian, 0.1% Pacific Islander, 2.3% from other races, and 1.9% from two or more races. Hispanic or Latino of any race were 8.3% of the population.
The median household income in Bulverde was $60,000, and the median family income was $68,000. The per capita income in the city was $25,000. About 8.3% of the population was below the poverty line.
Common Questions
What is Per Capita Income in Bulverde?
Per Capita income in Bulverde is $48,896.
What is the Median Family Income in Bulverde?
Median Family Income in Bulverde is $111,584.
What is the Median Household income in Bulverde?
Median Household Income in Bulverde is $107,315.
What is Income or Wage Gap in Bulverde?
Income or Wage Gap in Bulverde is 58.7%.
Women in Bulverde earn 41.3 cents for every dollar earned by a man.
What is Inequality or Gini Index in Bulverde?
Inequality or Gini Index in Bulverde is 0.38.
What is the Total Population of Bulverde?
Total Population of Bulverde is 5,827.
What is the Total Male Population of Bulverde?
Total Male Population of Bulverde is 2,924.
What is the Total Female Population of Bulverde?
Total Female Population of Bulverde is 2,903.
What is the Ratio of Males per 100 Females in Bulverde?
There are 100.72 Males per 100 Females in Bulverde.
What is the Ratio of Females per 100 Males in Bulverde?
There are 99.28 Females per 100 Males in Bulverde.
What is the Median Population Age in Bulverde?
Median Population Age in Bulverde is 53.7 Years.
What is the Average Family Size in Bulverde
Average Family Size in Bulverde is 2.8 People.
What is the Average Household Size in Bulverde
Average Household Size in Bulverde is 2.6 People.
How Large is the Labor Force in Bulverde?
There are 2,653 People in the Labor Forcein in Bulverde.
What is the Percentage of People in the Labor Force in Bulverde?
50.7% of People are in the Labor Force in Bulverde.
What is the Unemployment Rate in Bulverde?
Unemployment Rate in Bulverde is 0.5%.