Brownsboro, TX Map & Demographics
Brownsboro Map
Brownsboro Overview
$29,152
PER CAPITA INCOME
$70,583
AVG FAMILY INCOME
$57,454
AVG HOUSEHOLD INCOME
50.7%
WAGE / INCOME GAP [ % ]
49.3¢/ $1
WAGE / INCOME GAP [ $ ]
0.46
INEQUALITY / GINI INDEX
1,490
TOTAL POPULATION
697
MALE POPULATION
793
FEMALE POPULATION
87.89
MALES / 100 FEMALES
113.77
FEMALES / 100 MALES
28.9
MEDIAN AGE
3.3
AVG FAMILY SIZE
3.0
AVG HOUSEHOLD SIZE
754
LABOR FORCE [ PEOPLE ]
69.6%
PERCENT IN LABOR FORCE
2.5%
UNEMPLOYMENT RATE
Brownsboro Zip Codes
Income in Brownsboro
Income Overview in Brownsboro
Per Capita Income in Brownsboro is $29,152, while median incomes of families and households are $70,583 and $57,454 respectively.
| Characteristic | Number | Measure |
| Per Capita Income | 1,490 | $29,152 |
| Median Family Income | 391 | $70,583 |
| Mean Family Income | 391 | $73,493 |
| Median Household Income | 495 | $57,454 |
| Mean Household Income | 495 | $82,884 |
| Income Deficit | 391 | $0 |
| Wage / Income Gap (%) | 1,490 | 50.72% |
| Wage / Income Gap ($) | 1,490 | 49.28¢ per $1 |
| Gini / Inequality Index | 1,490 | 0.46 |
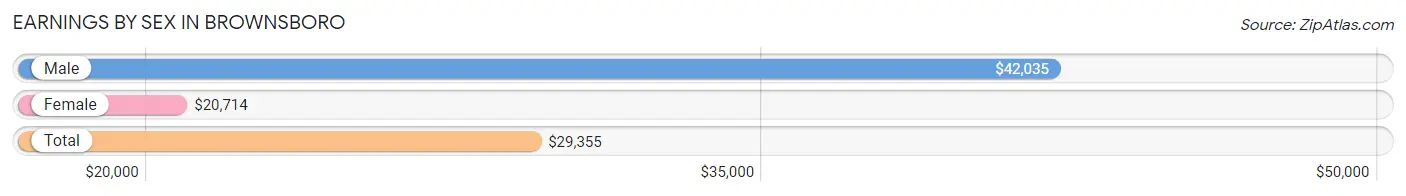
Earnings by Sex in Brownsboro
Average Earnings in Brownsboro are $29,355, $42,035 for men and $20,714 for women, a difference of 50.7%.
| Sex | Number | Average Earnings |
| Male | 438 (54.1%) | $42,035 |
| Female | 372 (45.9%) | $20,714 |
| Total | 810 (100.0%) | $29,355 |
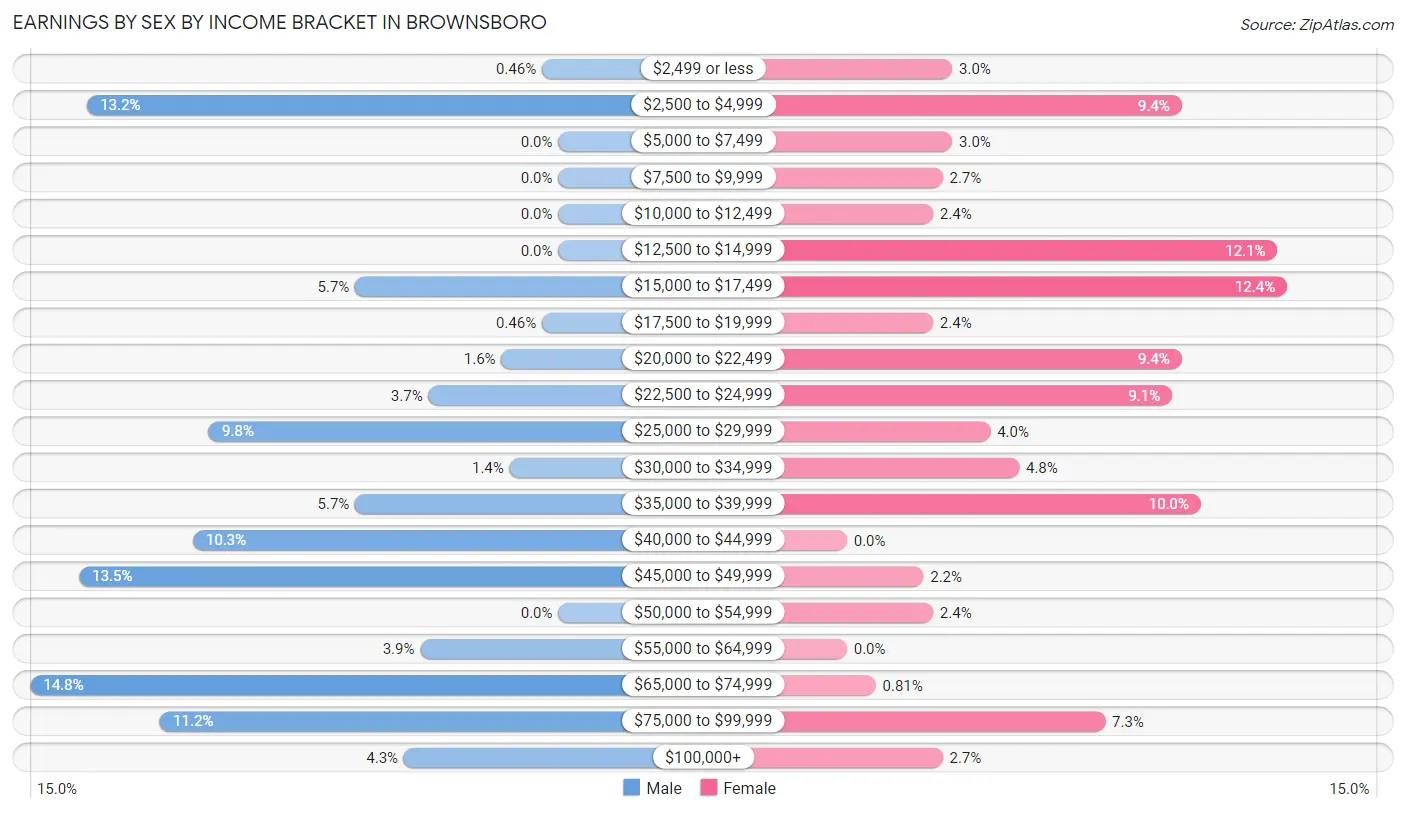
Earnings by Sex by Income Bracket in Brownsboro
The most common earnings brackets in Brownsboro are $65,000 to $74,999 for men (65 | 14.8%) and $15,000 to $17,499 for women (46 | 12.4%).
| Income | Male | Female |
| $2,499 or less | 2 (0.5%) | 11 (3.0%) |
| $2,500 to $4,999 | 58 (13.2%) | 35 (9.4%) |
| $5,000 to $7,499 | 0 (0.0%) | 11 (3.0%) |
| $7,500 to $9,999 | 0 (0.0%) | 10 (2.7%) |
| $10,000 to $12,499 | 0 (0.0%) | 9 (2.4%) |
| $12,500 to $14,999 | 0 (0.0%) | 45 (12.1%) |
| $15,000 to $17,499 | 25 (5.7%) | 46 (12.4%) |
| $17,500 to $19,999 | 2 (0.5%) | 9 (2.4%) |
| $20,000 to $22,499 | 7 (1.6%) | 35 (9.4%) |
| $22,500 to $24,999 | 16 (3.6%) | 34 (9.1%) |
| $25,000 to $29,999 | 43 (9.8%) | 15 (4.0%) |
| $30,000 to $34,999 | 6 (1.4%) | 18 (4.8%) |
| $35,000 to $39,999 | 25 (5.7%) | 37 (10.0%) |
| $40,000 to $44,999 | 45 (10.3%) | 0 (0.0%) |
| $45,000 to $49,999 | 59 (13.5%) | 8 (2.1%) |
| $50,000 to $54,999 | 0 (0.0%) | 9 (2.4%) |
| $55,000 to $64,999 | 17 (3.9%) | 0 (0.0%) |
| $65,000 to $74,999 | 65 (14.8%) | 3 (0.8%) |
| $75,000 to $99,999 | 49 (11.2%) | 27 (7.3%) |
| $100,000+ | 19 (4.3%) | 10 (2.7%) |
| Total | 438 (100.0%) | 372 (100.0%) |
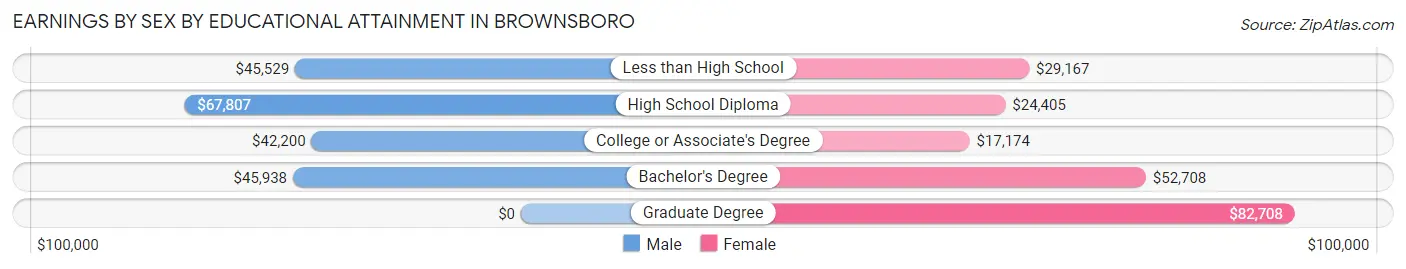
Earnings by Sex by Educational Attainment in Brownsboro
Average earnings in Brownsboro are $46,226 for men and $24,741 for women, a difference of 46.5%. Men with an educational attainment of high school diploma enjoy the highest average annual earnings of $67,807, while those with college or associate's degree education earn the least with $42,200. Women with an educational attainment of graduate degree earn the most with the average annual earnings of $82,708, while those with college or associate's degree education have the smallest earnings of $17,174.
| Educational Attainment | Male Income | Female Income |
| Less than High School | $45,529 | $29,167 |
| High School Diploma | $67,807 | $24,405 |
| College or Associate's Degree | $42,200 | $17,174 |
| Bachelor's Degree | $45,938 | $52,708 |
| Graduate Degree | - | - |
| Total | $46,226 | $24,741 |
Family Income in Brownsboro
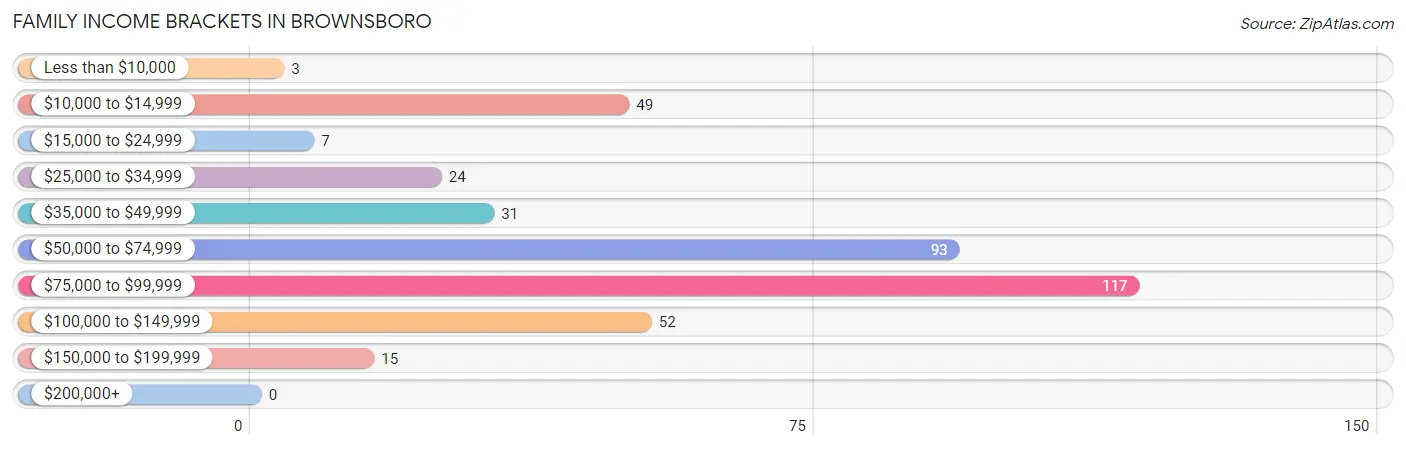
Family Income Brackets in Brownsboro
According to the Brownsboro family income data, there are 117 families falling into the $75,000 to $99,999 income range, which is the most common income bracket and makes up 29.9% of all families.
| Income Bracket | # Families | % Families |
| Less than $10,000 | 3 | 0.8% |
| $10,000 to $14,999 | 49 | 12.5% |
| $15,000 to $24,999 | 7 | 1.8% |
| $25,000 to $34,999 | 24 | 6.1% |
| $35,000 to $49,999 | 31 | 7.9% |
| $50,000 to $74,999 | 93 | 23.8% |
| $75,000 to $99,999 | 117 | 29.9% |
| $100,000 to $149,999 | 52 | 13.3% |
| $150,000 to $199,999 | 15 | 3.8% |
| $200,000+ | 0 | 0.0% |
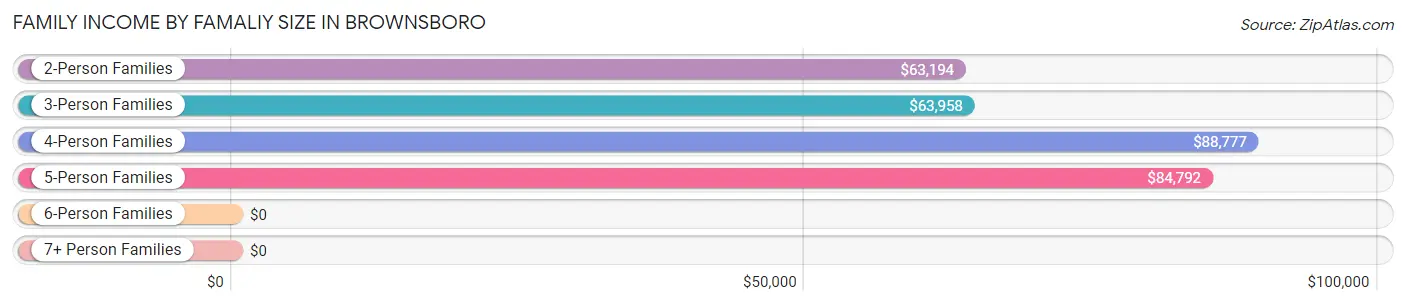
Family Income by Famaliy Size in Brownsboro
4-person families (85 | 21.7%) account for the highest median family income in Brownsboro with $88,777 per family, while 2-person families (107 | 27.4%) have the highest median income of $31,597 per family member.
| Income Bracket | # Families | Median Income |
| 2-Person Families | 107 (27.4%) | $63,194 |
| 3-Person Families | 159 (40.7%) | $63,958 |
| 4-Person Families | 85 (21.7%) | $88,777 |
| 5-Person Families | 23 (5.9%) | $84,792 |
| 6-Person Families | 17 (4.3%) | $0 |
| 7+ Person Families | 0 (0.0%) | $0 |
| Total | 391 (100.0%) | $70,583 |
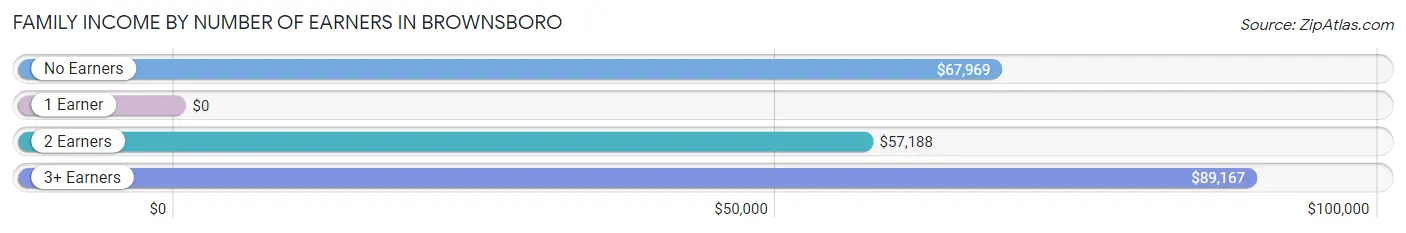
Family Income by Number of Earners in Brownsboro
| Number of Earners | # Families | Median Income |
| No Earners | 49 (12.5%) | $67,969 |
| 1 Earner | 125 (32.0%) | $0 |
| 2 Earners | 109 (27.9%) | $57,188 |
| 3+ Earners | 108 (27.6%) | $89,167 |
| Total | 391 (100.0%) | $70,583 |
Household Income in Brownsboro
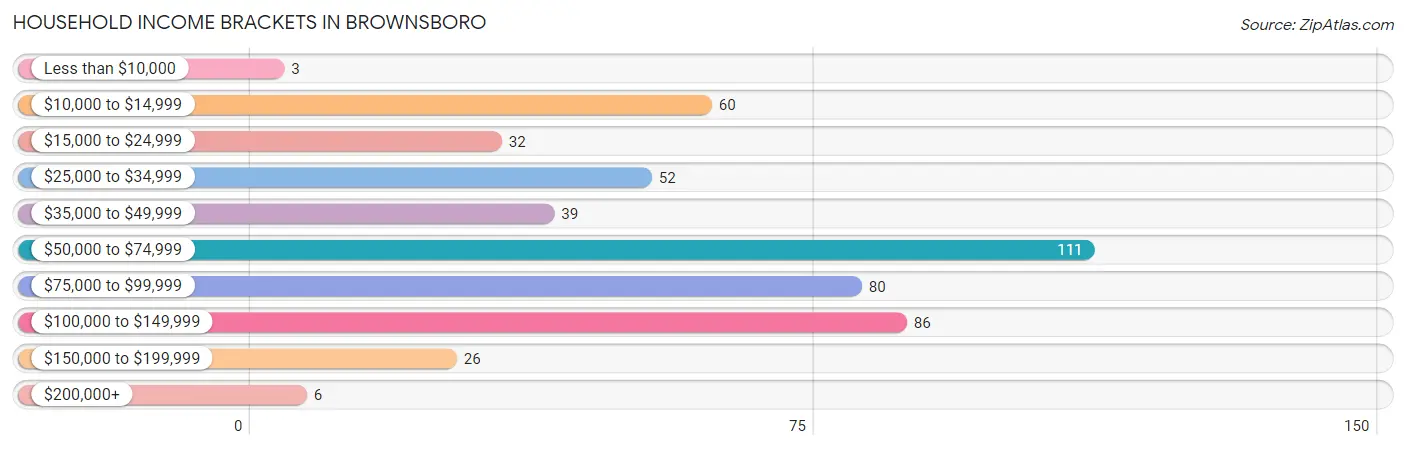
Household Income Brackets in Brownsboro
With 111 households falling in the category, the $50,000 to $74,999 income range is the most frequent in Brownsboro, accounting for 22.4% of all households. In contrast, only 3 households (0.6%) fall into the less than $10,000 income bracket, making it the least populous group.
| Income Bracket | # Households | % Households |
| Less than $10,000 | 3 | 0.6% |
| $10,000 to $14,999 | 60 | 12.1% |
| $15,000 to $24,999 | 32 | 6.5% |
| $25,000 to $34,999 | 52 | 10.5% |
| $35,000 to $49,999 | 39 | 7.9% |
| $50,000 to $74,999 | 111 | 22.4% |
| $75,000 to $99,999 | 80 | 16.2% |
| $100,000 to $149,999 | 86 | 17.4% |
| $150,000 to $199,999 | 26 | 5.3% |
| $200,000+ | 6 | 1.2% |
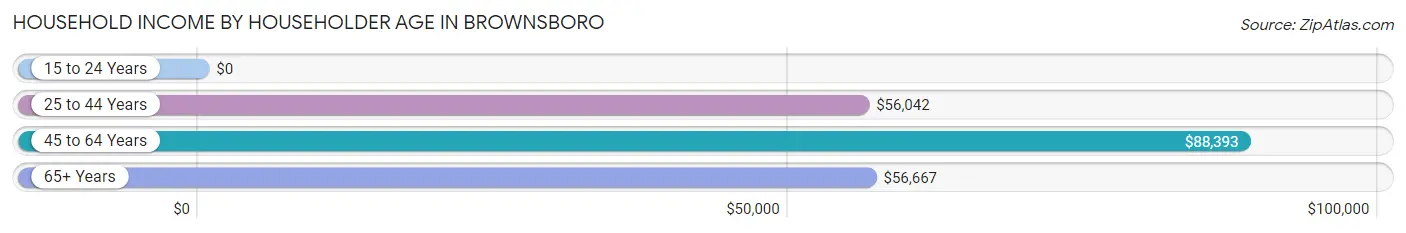
Household Income by Householder Age in Brownsboro
The median household income in Brownsboro is $57,454, with the highest median household income of $88,393 found in the 45 to 64 years age bracket for the primary householder. A total of 203 households (41.0%) fall into this category. Meanwhile, the 15 to 24 years age bracket for the primary householder has the lowest median household income of $0, with 70 households (14.1%) in this group.
| Income Bracket | # Households | Median Income |
| 15 to 24 Years | 70 (14.1%) | $0 |
| 25 to 44 Years | 114 (23.0%) | $56,042 |
| 45 to 64 Years | 203 (41.0%) | $88,393 |
| 65+ Years | 108 (21.8%) | $56,667 |
| Total | 495 (100.0%) | $57,454 |
Poverty in Brownsboro
Income Below Poverty by Sex and Age in Brownsboro
With 10.8% poverty level for males and 18.1% for females among the residents of Brownsboro, under 5 year old males and 16 and 17 year old females are the most vulnerable to poverty, with 51 males (51.5%) and 9 females (69.2%) in their respective age groups living below the poverty level.
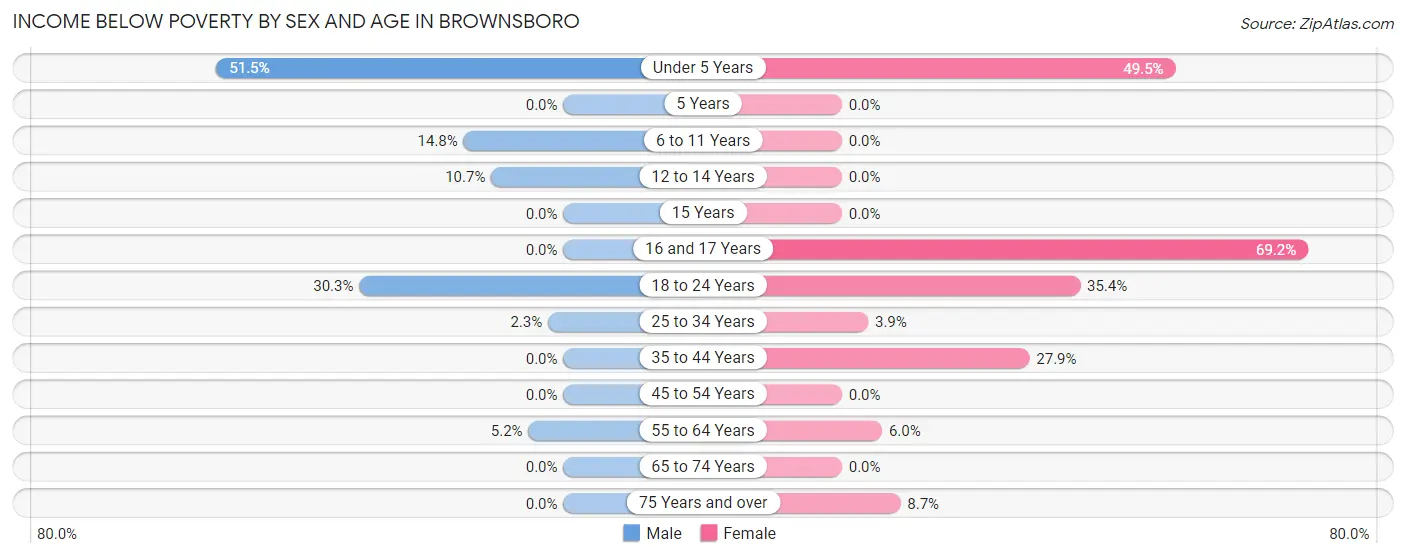
| Age Bracket | Male | Female |
| Under 5 Years | 51 (51.5%) | 54 (49.5%) |
| 5 Years | 0 (0.0%) | 0 (0.0%) |
| 6 to 11 Years | 4 (14.8%) | 0 (0.0%) |
| 12 to 14 Years | 3 (10.7%) | 0 (0.0%) |
| 15 Years | 0 (0.0%) | 0 (0.0%) |
| 16 and 17 Years | 0 (0.0%) | 9 (69.2%) |
| 18 to 24 Years | 10 (30.3%) | 46 (35.4%) |
| 25 to 34 Years | 3 (2.3%) | 3 (3.9%) |
| 35 to 44 Years | 0 (0.0%) | 22 (27.9%) |
| 45 to 54 Years | 0 (0.0%) | 0 (0.0%) |
| 55 to 64 Years | 4 (5.2%) | 4 (6.0%) |
| 65 to 74 Years | 0 (0.0%) | 0 (0.0%) |
| 75 Years and over | 0 (0.0%) | 4 (8.7%) |
| Total | 75 (10.8%) | 142 (18.1%) |
Income Above Poverty by Sex and Age in Brownsboro
According to the poverty statistics in Brownsboro, males aged 5 years and females aged 5 years are the age groups that are most secure financially, with 100.0% of males and 100.0% of females in these age groups living above the poverty line.
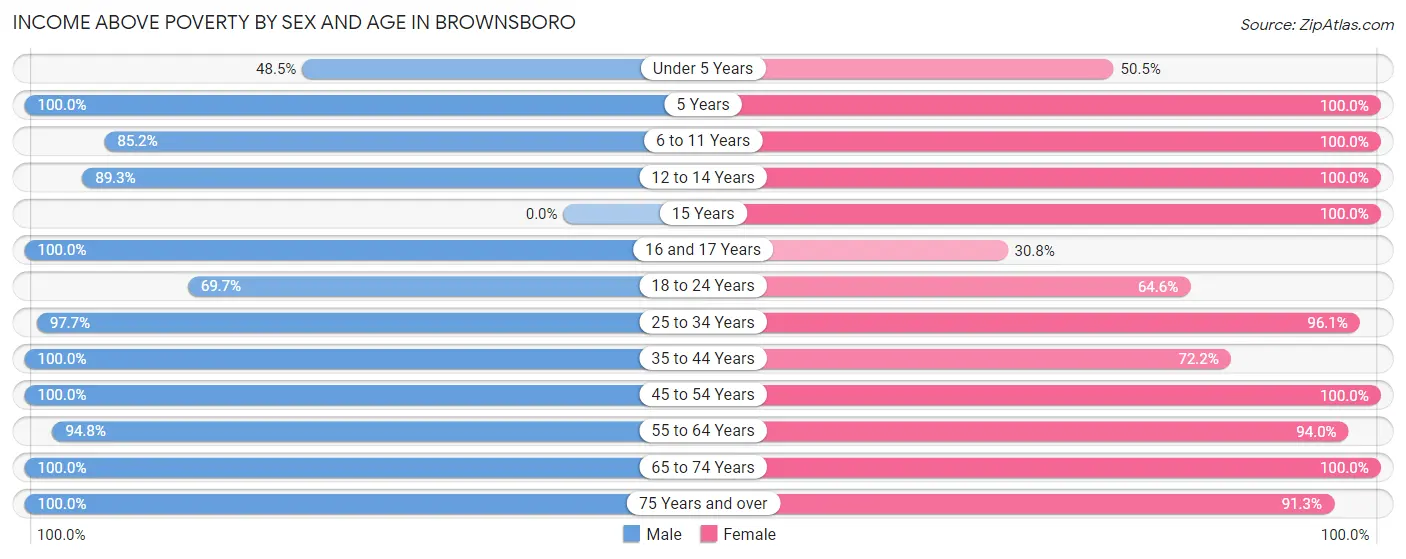
| Age Bracket | Male | Female |
| Under 5 Years | 48 (48.5%) | 55 (50.5%) |
| 5 Years | 2 (100.0%) | 3 (100.0%) |
| 6 to 11 Years | 23 (85.2%) | 44 (100.0%) |
| 12 to 14 Years | 25 (89.3%) | 71 (100.0%) |
| 15 Years | 0 (0.0%) | 14 (100.0%) |
| 16 and 17 Years | 49 (100.0%) | 4 (30.8%) |
| 18 to 24 Years | 23 (69.7%) | 84 (64.6%) |
| 25 to 34 Years | 129 (97.7%) | 74 (96.1%) |
| 35 to 44 Years | 57 (100.0%) | 57 (72.2%) |
| 45 to 54 Years | 109 (100.0%) | 103 (100.0%) |
| 55 to 64 Years | 73 (94.8%) | 63 (94.0%) |
| 65 to 74 Years | 52 (100.0%) | 28 (100.0%) |
| 75 Years and over | 32 (100.0%) | 42 (91.3%) |
| Total | 622 (89.2%) | 642 (81.9%) |
Income Below Poverty Among Married-Couple Families in Brownsboro
The poverty statistics for married-couple families in Brownsboro show that 2.4% or 7 of the total 294 families live below the poverty line. Families with 3 or 4 children have the highest poverty rate of 13.0%, comprising of 3 families. On the other hand, families with 1 or 2 children have the lowest poverty rate of 0.0%, which includes 0 families.
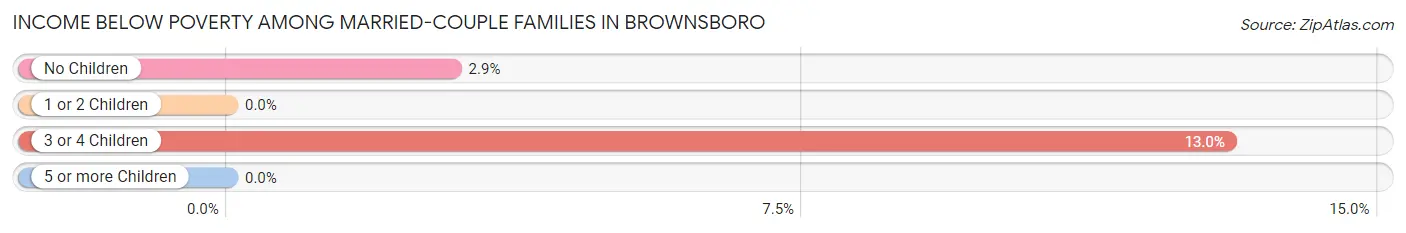
| Children | Above Poverty | Below Poverty |
| No Children | 133 (97.1%) | 4 (2.9%) |
| 1 or 2 Children | 134 (100.0%) | 0 (0.0%) |
| 3 or 4 Children | 20 (87.0%) | 3 (13.0%) |
| 5 or more Children | 0 (0.0%) | 0 (0.0%) |
| Total | 287 (97.6%) | 7 (2.4%) |
Income Below Poverty Among Single-Parent Households in Brownsboro
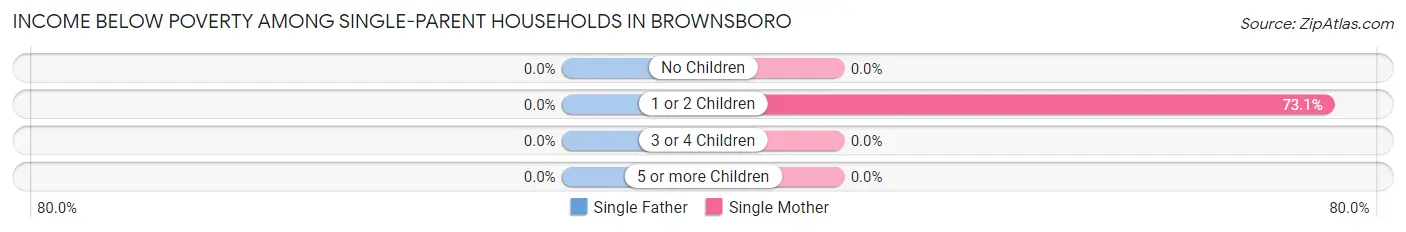
| Children | Single Father | Single Mother |
| No Children | 0 (0.0%) | 0 (0.0%) |
| 1 or 2 Children | 0 (0.0%) | 49 (73.1%) |
| 3 or 4 Children | 0 (0.0%) | 0 (0.0%) |
| 5 or more Children | 0 (0.0%) | 0 (0.0%) |
| Total | 0 (0.0%) | 49 (65.3%) |
Income Below Poverty Among Married-Couple vs Single-Parent Households in Brownsboro
The poverty data for Brownsboro shows that 7 of the married-couple family households (2.4%) and 49 of the single-parent households (50.5%) are living below the poverty level. Within the married-couple family households, those with 3 or 4 children have the highest poverty rate, with 3 households (13.0%) falling below the poverty line. Among the single-parent households, those with 1 or 2 children have the highest poverty rate, with 49 household (55.1%) living below poverty.
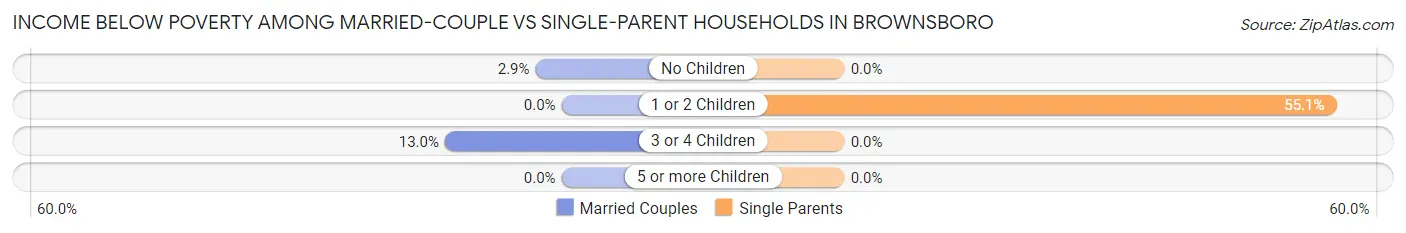
| Children | Married-Couple Families | Single-Parent Households |
| No Children | 4 (2.9%) | 0 (0.0%) |
| 1 or 2 Children | 0 (0.0%) | 49 (55.1%) |
| 3 or 4 Children | 3 (13.0%) | 0 (0.0%) |
| 5 or more Children | 0 (0.0%) | 0 (0.0%) |
| Total | 7 (2.4%) | 49 (50.5%) |
Race in Brownsboro
The most populous races in Brownsboro are White / Caucasian (1,321 | 88.7%), Hispanic or Latino (161 | 10.8%), and Black / African American (83 | 5.6%).
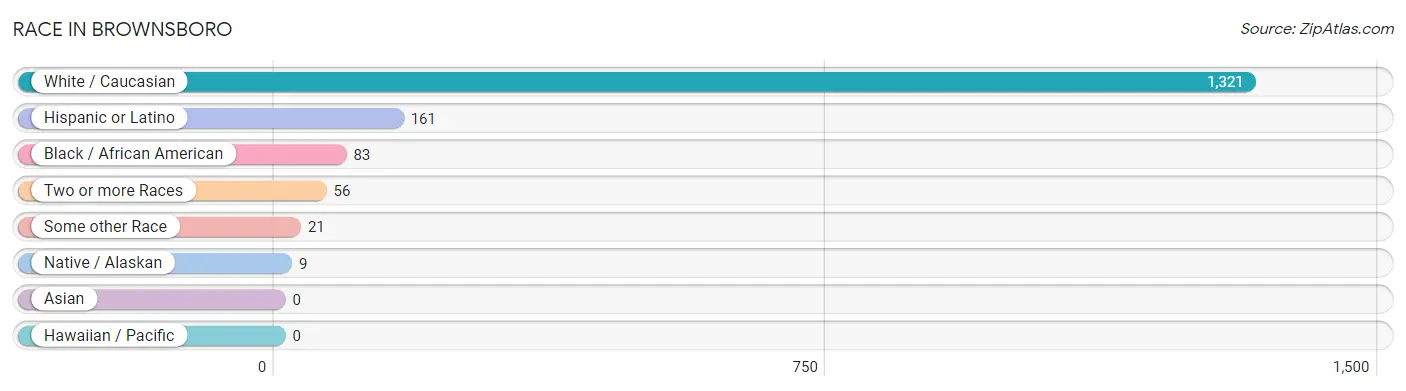
| Race | # Population | % Population |
| Asian | 0 | 0.0% |
| Black / African American | 83 | 5.6% |
| Hawaiian / Pacific | 0 | 0.0% |
| Hispanic or Latino | 161 | 10.8% |
| Native / Alaskan | 9 | 0.6% |
| White / Caucasian | 1,321 | 88.7% |
| Two or more Races | 56 | 3.8% |
| Some other Race | 21 | 1.4% |
| Total | 1,490 | 100.0% |
Ancestry in Brownsboro
The most populous ancestries reported in Brownsboro are German (295 | 19.8%), Irish (262 | 17.6%), Mexican (138 | 9.3%), English (134 | 9.0%), and American (70 | 4.7%), together accounting for 60.3% of all Brownsboro residents.
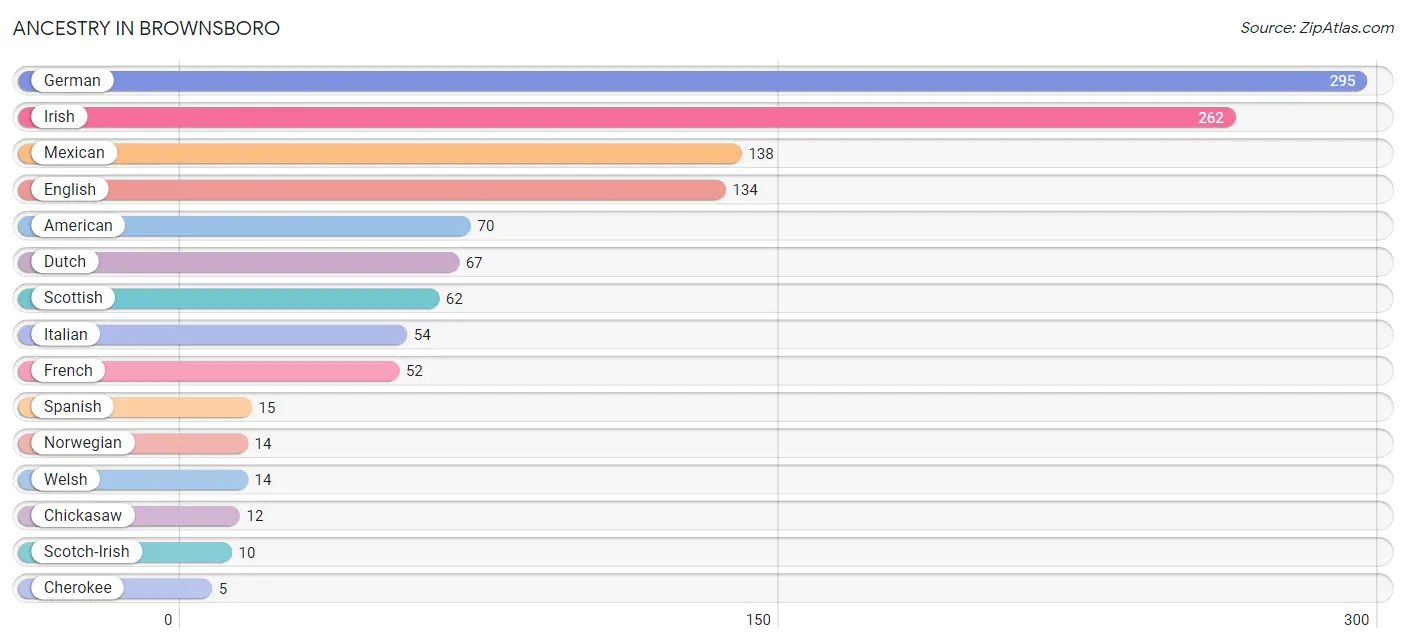
| Ancestry | # Population | % Population |
| American | 70 | 4.7% |
| Central American | 4 | 0.3% |
| Cherokee | 5 | 0.3% |
| Chickasaw | 12 | 0.8% |
| Czech | 4 | 0.3% |
| Danish | 3 | 0.2% |
| Dutch | 67 | 4.5% |
| English | 134 | 9.0% |
| French | 52 | 3.5% |
| German | 295 | 19.8% |
| Irish | 262 | 17.6% |
| Italian | 54 | 3.6% |
| Mexican | 138 | 9.3% |
| Norwegian | 14 | 0.9% |
| Puerto Rican | 4 | 0.3% |
| Salvadoran | 4 | 0.3% |
| Scotch-Irish | 10 | 0.7% |
| Scottish | 62 | 4.2% |
| Spanish | 15 | 1.0% |
| Swedish | 5 | 0.3% |
| Welsh | 14 | 0.9% | View All 21 Rows |
Immigrants in Brownsboro
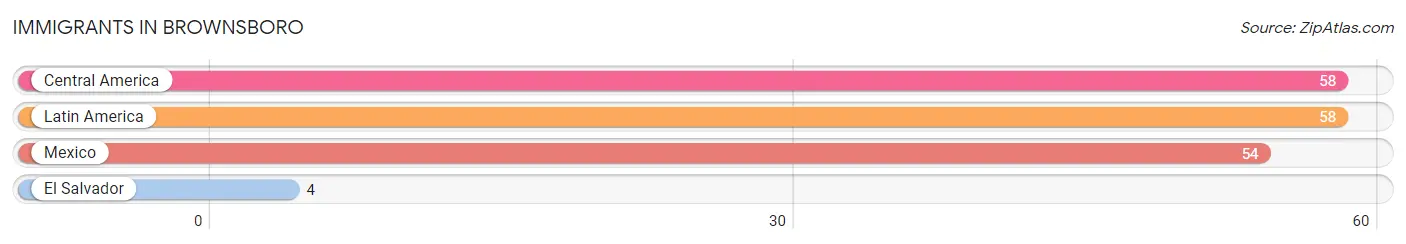
The most numerous immigrant groups reported in Brownsboro came from Central America (58 | 3.9%), Latin America (58 | 3.9%), Mexico (54 | 3.6%), and El Salvador (4 | 0.3%), together accounting for 11.7% of all Brownsboro residents.
| Immigration Origin | # Population | % Population |
| Central America | 58 | 3.9% |
| El Salvador | 4 | 0.3% |
| Latin America | 58 | 3.9% |
| Mexico | 54 | 3.6% | View All 4 Rows |
Sex and Age in Brownsboro
Sex and Age in Brownsboro
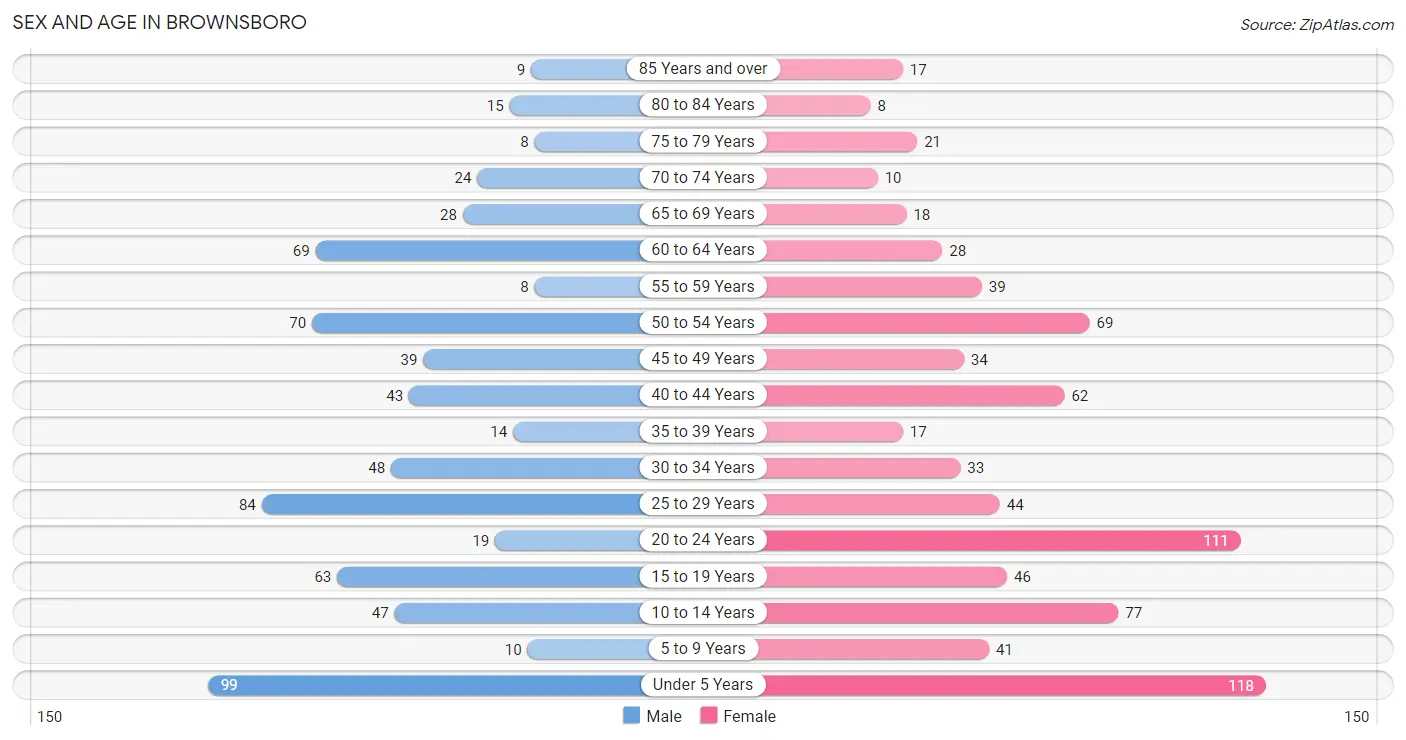
The most populous age groups in Brownsboro are Under 5 Years (99 | 14.2%) for men and Under 5 Years (118 | 14.9%) for women.
| Age Bracket | Male | Female |
| Under 5 Years | 99 (14.2%) | 118 (14.9%) |
| 5 to 9 Years | 10 (1.4%) | 41 (5.2%) |
| 10 to 14 Years | 47 (6.7%) | 77 (9.7%) |
| 15 to 19 Years | 63 (9.0%) | 46 (5.8%) |
| 20 to 24 Years | 19 (2.7%) | 111 (14.0%) |
| 25 to 29 Years | 84 (12.0%) | 44 (5.6%) |
| 30 to 34 Years | 48 (6.9%) | 33 (4.2%) |
| 35 to 39 Years | 14 (2.0%) | 17 (2.1%) |
| 40 to 44 Years | 43 (6.2%) | 62 (7.8%) |
| 45 to 49 Years | 39 (5.6%) | 34 (4.3%) |
| 50 to 54 Years | 70 (10.0%) | 69 (8.7%) |
| 55 to 59 Years | 8 (1.1%) | 39 (4.9%) |
| 60 to 64 Years | 69 (9.9%) | 28 (3.5%) |
| 65 to 69 Years | 28 (4.0%) | 18 (2.3%) |
| 70 to 74 Years | 24 (3.4%) | 10 (1.3%) |
| 75 to 79 Years | 8 (1.1%) | 21 (2.6%) |
| 80 to 84 Years | 15 (2.1%) | 8 (1.0%) |
| 85 Years and over | 9 (1.3%) | 17 (2.1%) |
| Total | 697 (100.0%) | 793 (100.0%) |
Families and Households in Brownsboro
Median Family Size in Brownsboro
The median family size in Brownsboro is 3.30 persons per family, with single male/father families (22 | 5.6%) accounting for the largest median family size of 3.45 persons per family. On the other hand, single female/mother families (75 | 19.2%) represent the smallest median family size with 3.16 persons per family.
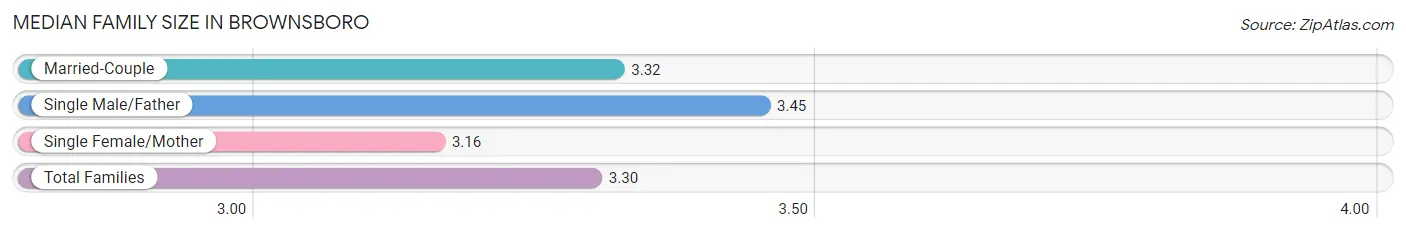
| Family Type | # Families | Family Size |
| Married-Couple | 294 (75.2%) | 3.32 |
| Single Male/Father | 22 (5.6%) | 3.45 |
| Single Female/Mother | 75 (19.2%) | 3.16 |
| Total Families | 391 (100.0%) | 3.30 |
Median Household Size in Brownsboro
The median household size in Brownsboro is 3.01 persons per household, with single male/father households (22 | 4.4%) accounting for the largest median household size of 4 persons per household. non-family households (104 | 21.0%) represent the smallest median household size with 1.20 persons per household.
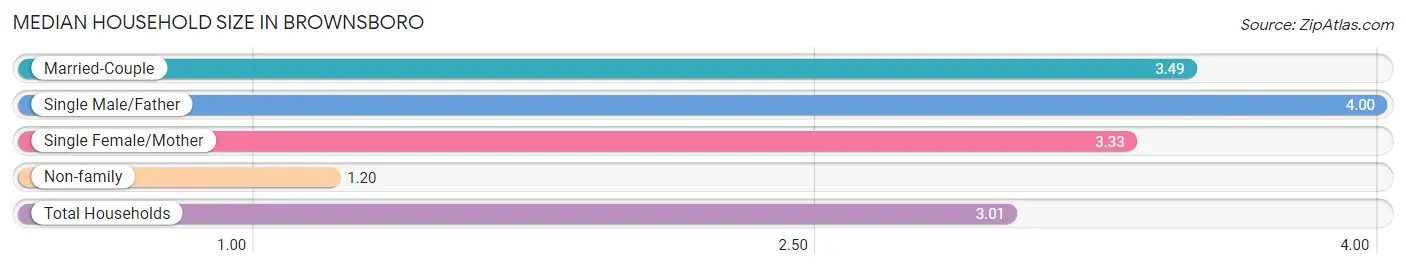
| Household Type | # Households | Household Size |
| Married-Couple | 294 (59.4%) | 3.49 |
| Single Male/Father | 22 (4.4%) | 4.00 |
| Single Female/Mother | 75 (15.1%) | 3.33 |
| Non-family | 104 (21.0%) | 1.20 |
| Total Households | 495 (100.0%) | 3.01 |
Household Size by Marriage Status in Brownsboro
Out of a total of 495 households in Brownsboro, 391 (79.0%) are family households, while 104 (21.0%) are nonfamily households. The most numerous type of family households are 3-person households, comprising 127, and the most common type of nonfamily households are 1-person households, comprising 89.
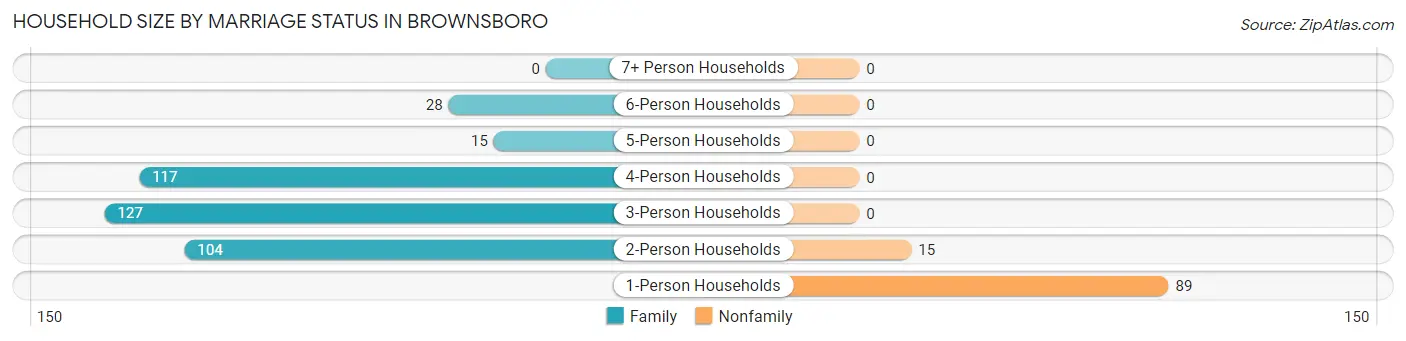
| Household Size | Family Households | Nonfamily Households |
| 1-Person Households | - | 89 (18.0%) |
| 2-Person Households | 104 (21.0%) | 15 (3.0%) |
| 3-Person Households | 127 (25.7%) | 0 (0.0%) |
| 4-Person Households | 117 (23.6%) | 0 (0.0%) |
| 5-Person Households | 15 (3.0%) | 0 (0.0%) |
| 6-Person Households | 28 (5.7%) | 0 (0.0%) |
| 7+ Person Households | 0 (0.0%) | 0 (0.0%) |
| Total | 391 (79.0%) | 104 (21.0%) |
Female Fertility in Brownsboro
Fertility by Age in Brownsboro
Average fertility rate in Brownsboro is 69.0 births per 1,000 women. Women in the age bracket of 20 to 34 years have the highest fertility rate with 128.0 births per 1,000 women. Women in the age bracket of 20 to 34 years acount for 100.0% of all women with births.
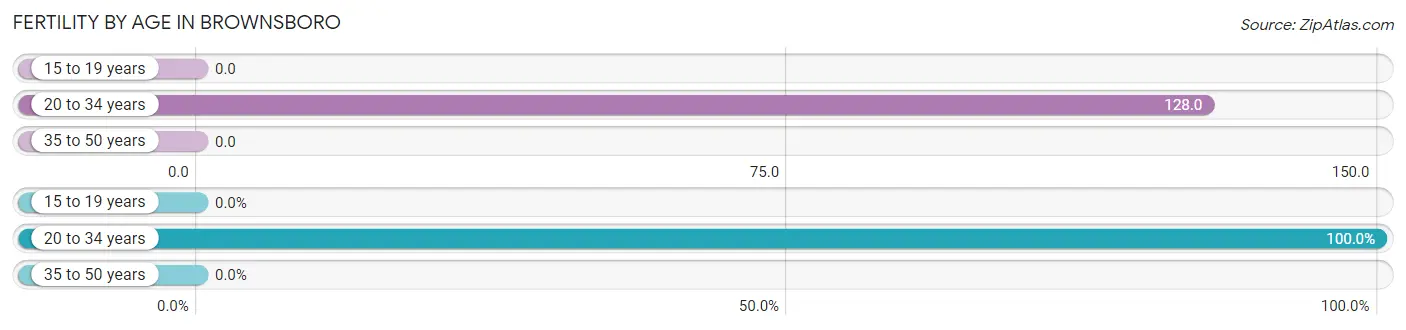
| Age Bracket | Women with Births | Births / 1,000 Women |
| 15 to 19 years | 0 (0.0%) | 0.0 |
| 20 to 34 years | 24 (100.0%) | 128.0 |
| 35 to 50 years | 0 (0.0%) | 0.0 |
| Total | 24 (100.0%) | 69.0 |
Fertility by Age by Marriage Status in Brownsboro
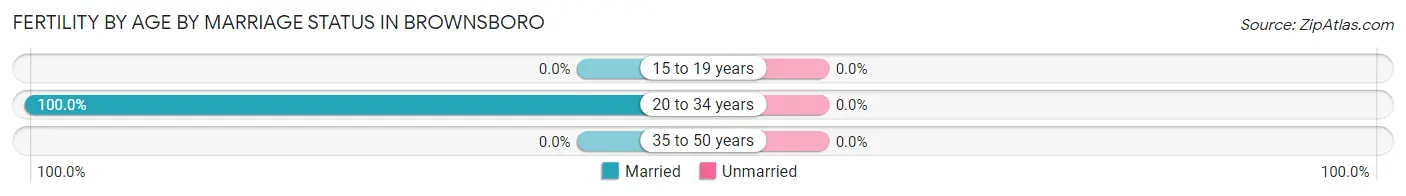
| Age Bracket | Married | Unmarried |
| 15 to 19 years | 0 (0.0%) | 0 (0.0%) |
| 20 to 34 years | 24 (100.0%) | 0 (0.0%) |
| 35 to 50 years | 0 (0.0%) | 0 (0.0%) |
| Total | 24 (100.0%) | 0 (0.0%) |
Fertility by Education in Brownsboro
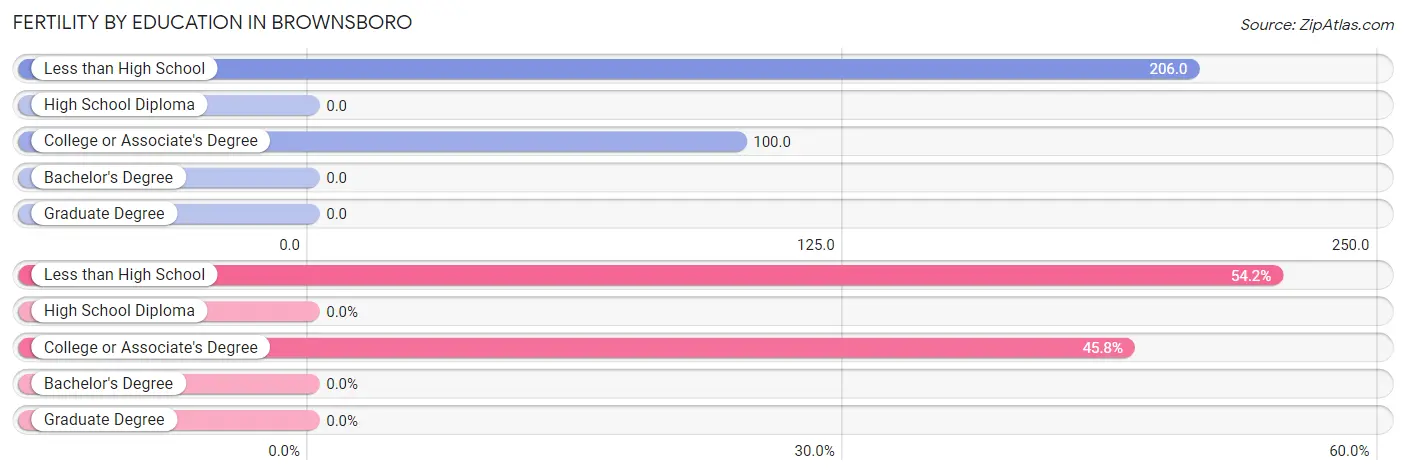
| Educational Attainment | Women with Births | Births / 1,000 Women |
| Less than High School | 13 (54.2%) | 206.0 |
| High School Diploma | 0 (0.0%) | 0.0 |
| College or Associate's Degree | 11 (45.8%) | 100.0 |
| Bachelor's Degree | 0 (0.0%) | 0.0 |
| Graduate Degree | 0 (0.0%) | 0.0 |
| Total | 24 (100.0%) | 69.0 |
Fertility by Education by Marriage Status in Brownsboro
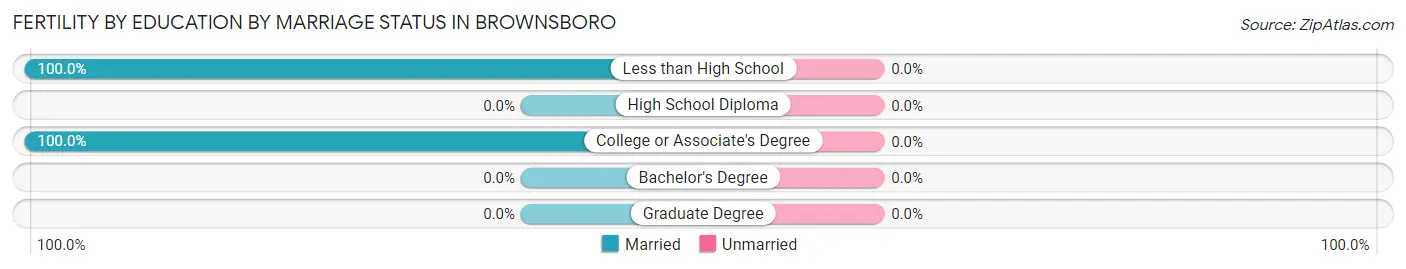
| Educational Attainment | Married | Unmarried |
| Less than High School | 13 (100.0%) | 0 (0.0%) |
| High School Diploma | 0 (0.0%) | 0 (0.0%) |
| College or Associate's Degree | 11 (100.0%) | 0 (0.0%) |
| Bachelor's Degree | 0 (0.0%) | 0 (0.0%) |
| Graduate Degree | 0 (0.0%) | 0 (0.0%) |
| Total | 24 (100.0%) | 0 (0.0%) |
Employment Characteristics in Brownsboro
Employment by Class of Employer in Brownsboro
Among the 723 employed individuals in Brownsboro, private company employees (531 | 73.4%), not-for-profit organizations (79 | 10.9%), and local government employees (50 | 6.9%) make up the most common classes of employment.
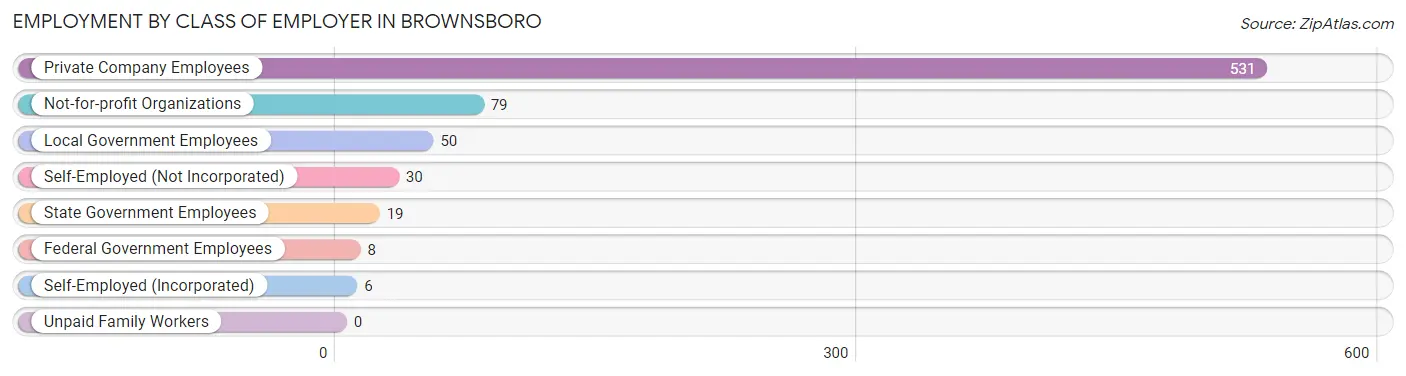
| Employer Class | # Employees | % Employees |
| Private Company Employees | 531 | 73.4% |
| Self-Employed (Incorporated) | 6 | 0.8% |
| Self-Employed (Not Incorporated) | 30 | 4.2% |
| Not-for-profit Organizations | 79 | 10.9% |
| Local Government Employees | 50 | 6.9% |
| State Government Employees | 19 | 2.6% |
| Federal Government Employees | 8 | 1.1% |
| Unpaid Family Workers | 0 | 0.0% |
| Total | 723 | 100.0% |
Employment Status by Age in Brownsboro
According to the labor force statistics for Brownsboro, out of the total population over 16 years of age (1,084), 69.6% or 754 individuals are in the labor force, with 2.5% or 19 of them unemployed. The age group with the highest labor force participation rate is 45 to 54 years, with 97.6% or 207 individuals in the labor force. Within the labor force, the 75 years and over age range has the highest percentage of unemployed individuals, with 50.0% or 5 of them being unemployed.
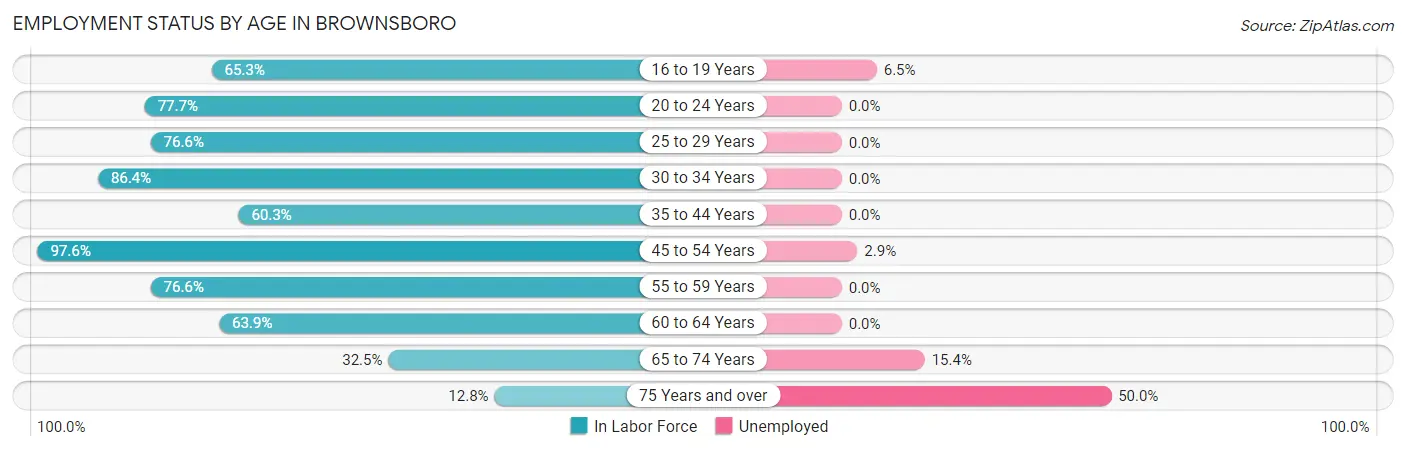
| Age Bracket | In Labor Force | Unemployed |
| 16 to 19 Years | 62 (65.3%) | 4 (6.5%) |
| 20 to 24 Years | 101 (77.7%) | 0 (0.0%) |
| 25 to 29 Years | 98 (76.6%) | 0 (0.0%) |
| 30 to 34 Years | 70 (86.4%) | 0 (0.0%) |
| 35 to 44 Years | 82 (60.3%) | 0 (0.0%) |
| 45 to 54 Years | 207 (97.6%) | 6 (2.9%) |
| 55 to 59 Years | 36 (76.6%) | 0 (0.0%) |
| 60 to 64 Years | 62 (63.9%) | 0 (0.0%) |
| 65 to 74 Years | 26 (32.5%) | 4 (15.4%) |
| 75 Years and over | 10 (12.8%) | 5 (50.0%) |
| Total | 754 (69.6%) | 19 (2.5%) |
Employment Status by Educational Attainment in Brownsboro
According to labor force statistics for Brownsboro, 79.2% of individuals (555) out of the total population between 25 and 64 years of age (701) are in the labor force, with 1.1% or 6 of them being unemployed. The group with the highest labor force participation rate are those with the educational attainment of high school diploma, with 84.6% or 226 individuals in the labor force. Within the labor force, individuals with bachelor's degree or higher education have the highest percentage of unemployment, with 10.3% or 6 of them being unemployed.
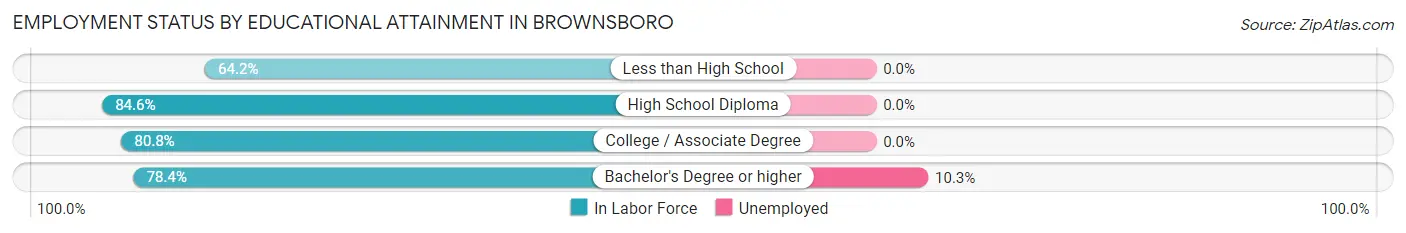
| Educational Attainment | In Labor Force | Unemployed |
| Less than High School | 77 (64.2%) | 0 (0.0%) |
| High School Diploma | 226 (84.6%) | 0 (0.0%) |
| College / Associate Degree | 194 (80.8%) | 0 (0.0%) |
| Bachelor's Degree or higher | 58 (78.4%) | 8 (10.3%) |
| Total | 555 (79.2%) | 8 (1.1%) |
Employment Occupations by Sex in Brownsboro
Management, Business, Science and Arts Occupations
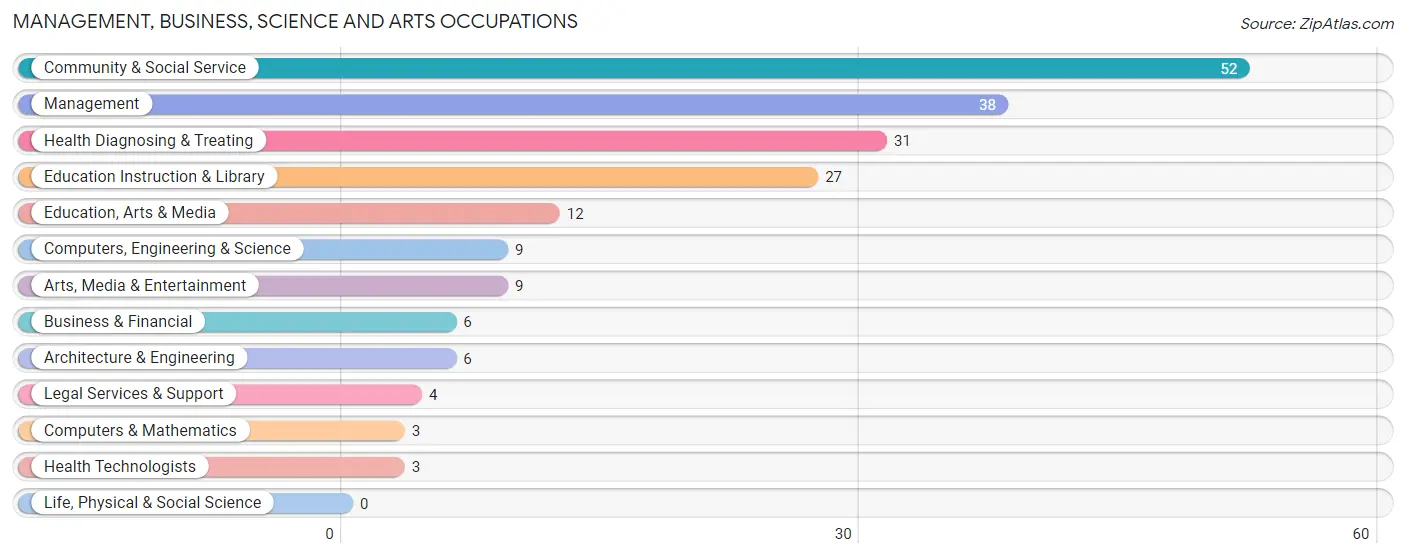
The most common Management, Business, Science and Arts occupations in Brownsboro are Community & Social Service (52 | 7.1%), Management (38 | 5.2%), Health Diagnosing & Treating (31 | 4.2%), Education Instruction & Library (27 | 3.7%), and Education, Arts & Media (12 | 1.6%).
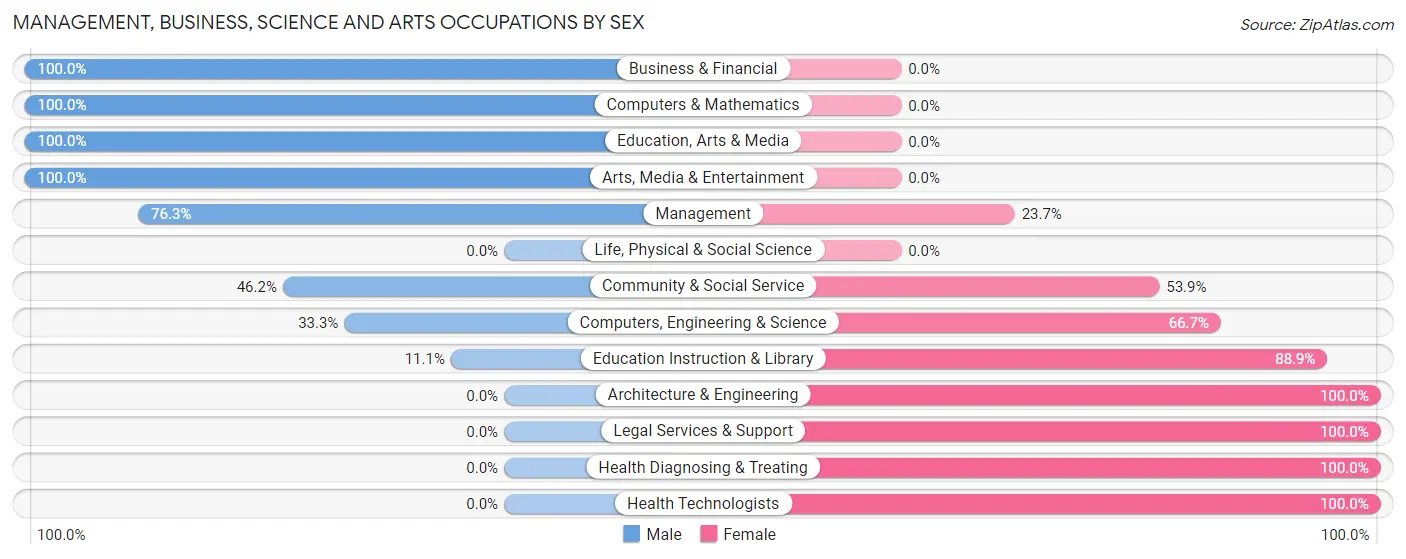
Management, Business, Science and Arts Occupations by Sex
Within the Management, Business, Science and Arts occupations in Brownsboro, the most male-oriented occupations are Business & Financial (100.0%), Computers & Mathematics (100.0%), and Education, Arts & Media (100.0%), while the most female-oriented occupations are Architecture & Engineering (100.0%), Legal Services & Support (100.0%), and Health Diagnosing & Treating (100.0%).
| Occupation | Male | Female |
| Management | 29 (76.3%) | 9 (23.7%) |
| Business & Financial | 6 (100.0%) | 0 (0.0%) |
| Computers, Engineering & Science | 3 (33.3%) | 6 (66.7%) |
| Computers & Mathematics | 3 (100.0%) | 0 (0.0%) |
| Architecture & Engineering | 0 (0.0%) | 6 (100.0%) |
| Life, Physical & Social Science | 0 (0.0%) | 0 (0.0%) |
| Community & Social Service | 24 (46.2%) | 28 (53.8%) |
| Education, Arts & Media | 12 (100.0%) | 0 (0.0%) |
| Legal Services & Support | 0 (0.0%) | 4 (100.0%) |
| Education Instruction & Library | 3 (11.1%) | 24 (88.9%) |
| Arts, Media & Entertainment | 9 (100.0%) | 0 (0.0%) |
| Health Diagnosing & Treating | 0 (0.0%) | 31 (100.0%) |
| Health Technologists | 0 (0.0%) | 3 (100.0%) |
| Total (Category) | 62 (45.6%) | 74 (54.4%) |
| Total (Overall) | 420 (57.1%) | 315 (42.9%) |
Services Occupations
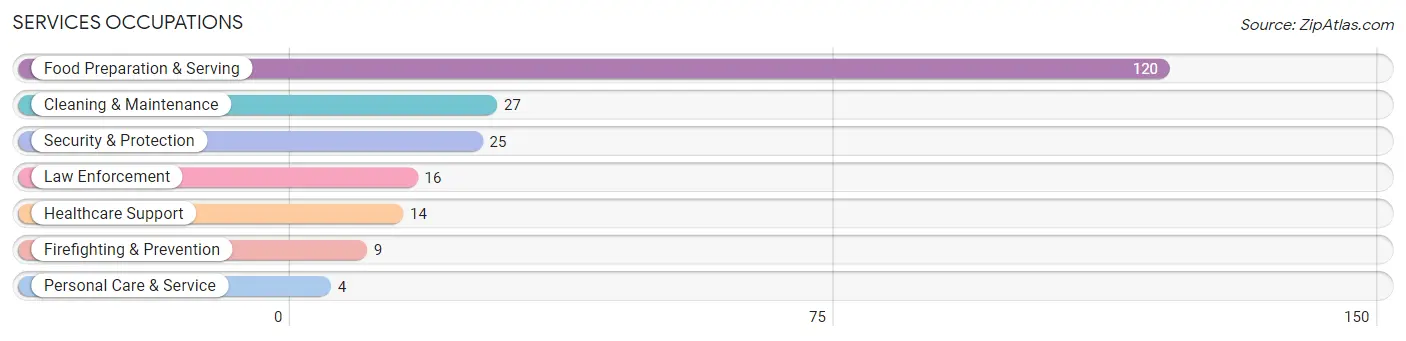
The most common Services occupations in Brownsboro are Food Preparation & Serving (120 | 16.3%), Cleaning & Maintenance (27 | 3.7%), Security & Protection (25 | 3.4%), Law Enforcement (16 | 2.2%), and Healthcare Support (14 | 1.9%).
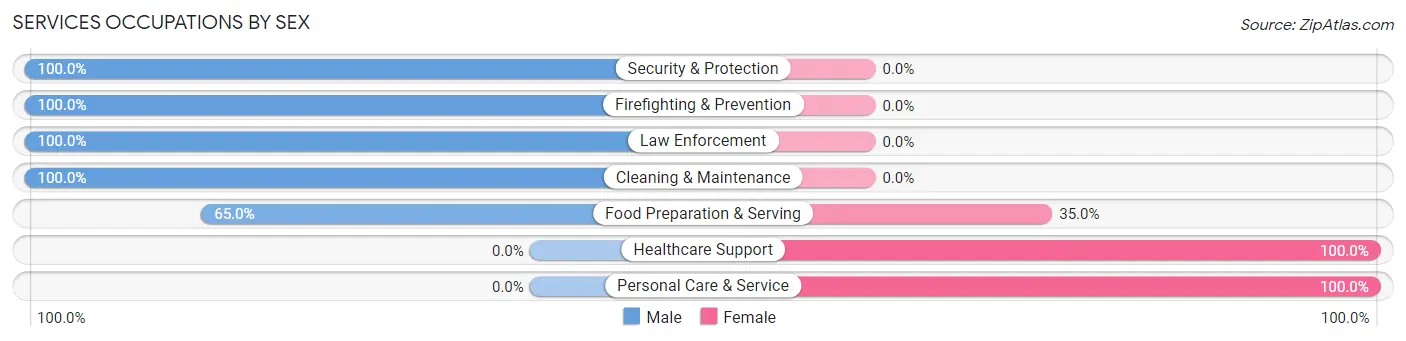
Services Occupations by Sex
Within the Services occupations in Brownsboro, the most male-oriented occupations are Security & Protection (100.0%), Firefighting & Prevention (100.0%), and Law Enforcement (100.0%), while the most female-oriented occupations are Healthcare Support (100.0%), Personal Care & Service (100.0%), and Food Preparation & Serving (35.0%).
| Occupation | Male | Female |
| Healthcare Support | 0 (0.0%) | 14 (100.0%) |
| Security & Protection | 25 (100.0%) | 0 (0.0%) |
| Firefighting & Prevention | 9 (100.0%) | 0 (0.0%) |
| Law Enforcement | 16 (100.0%) | 0 (0.0%) |
| Food Preparation & Serving | 78 (65.0%) | 42 (35.0%) |
| Cleaning & Maintenance | 27 (100.0%) | 0 (0.0%) |
| Personal Care & Service | 0 (0.0%) | 4 (100.0%) |
| Total (Category) | 130 (68.4%) | 60 (31.6%) |
| Total (Overall) | 420 (57.1%) | 315 (42.9%) |
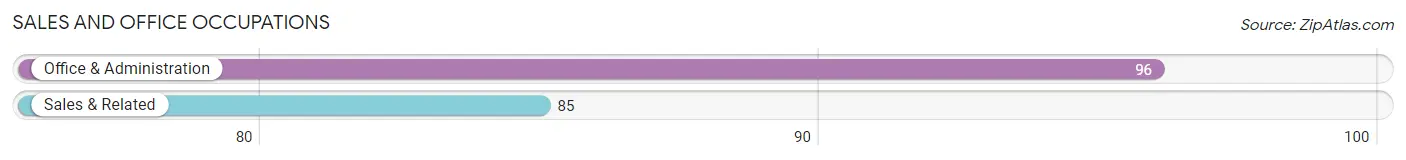
Sales and Office Occupations
The most common Sales and Office occupations in Brownsboro are Office & Administration (96 | 13.1%), and Sales & Related (85 | 11.6%).
Sales and Office Occupations by Sex
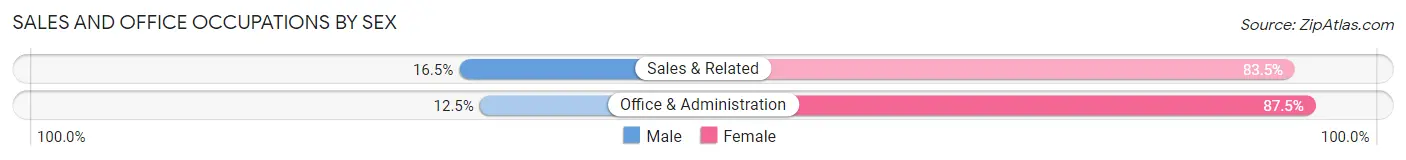
| Occupation | Male | Female |
| Sales & Related | 14 (16.5%) | 71 (83.5%) |
| Office & Administration | 12 (12.5%) | 84 (87.5%) |
| Total (Category) | 26 (14.4%) | 155 (85.6%) |
| Total (Overall) | 420 (57.1%) | 315 (42.9%) |
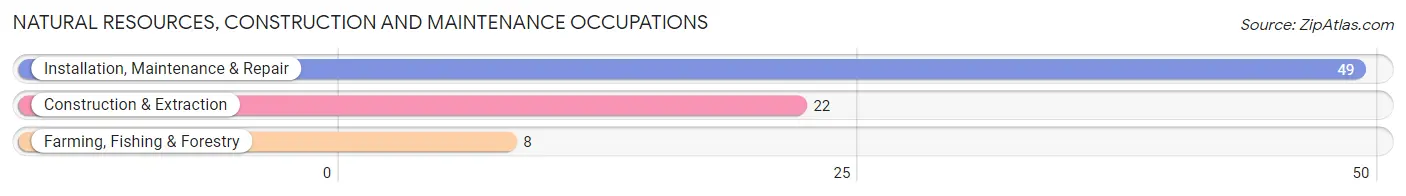
Natural Resources, Construction and Maintenance Occupations
The most common Natural Resources, Construction and Maintenance occupations in Brownsboro are Installation, Maintenance & Repair (49 | 6.7%), Construction & Extraction (22 | 3.0%), and Farming, Fishing & Forestry (8 | 1.1%).
Natural Resources, Construction and Maintenance Occupations by Sex
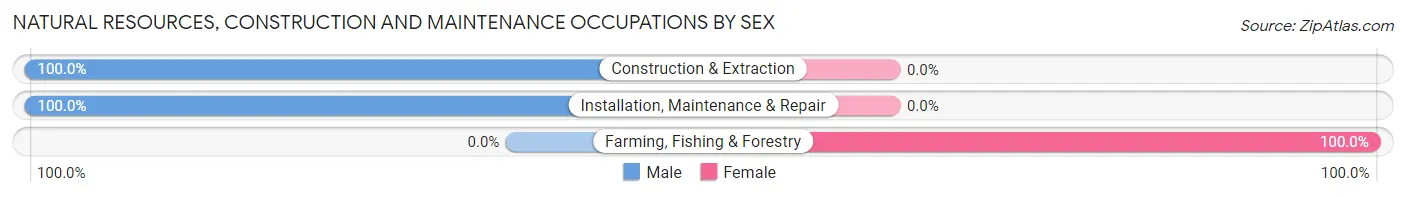
| Occupation | Male | Female |
| Farming, Fishing & Forestry | 0 (0.0%) | 8 (100.0%) |
| Construction & Extraction | 22 (100.0%) | 0 (0.0%) |
| Installation, Maintenance & Repair | 49 (100.0%) | 0 (0.0%) |
| Total (Category) | 71 (89.9%) | 8 (10.1%) |
| Total (Overall) | 420 (57.1%) | 315 (42.9%) |
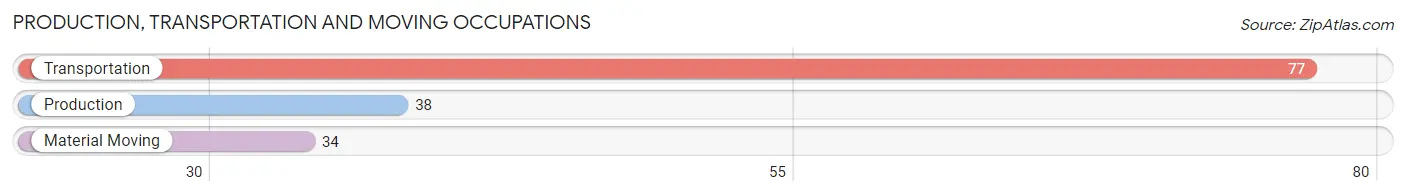
Production, Transportation and Moving Occupations
The most common Production, Transportation and Moving occupations in Brownsboro are Transportation (77 | 10.5%), Production (38 | 5.2%), and Material Moving (34 | 4.6%).
Production, Transportation and Moving Occupations by Sex
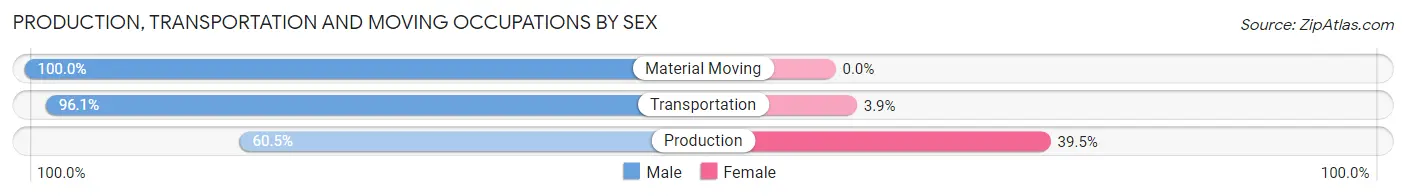
| Occupation | Male | Female |
| Production | 23 (60.5%) | 15 (39.5%) |
| Transportation | 74 (96.1%) | 3 (3.9%) |
| Material Moving | 34 (100.0%) | 0 (0.0%) |
| Total (Category) | 131 (87.9%) | 18 (12.1%) |
| Total (Overall) | 420 (57.1%) | 315 (42.9%) |
Employment Industries by Sex in Brownsboro
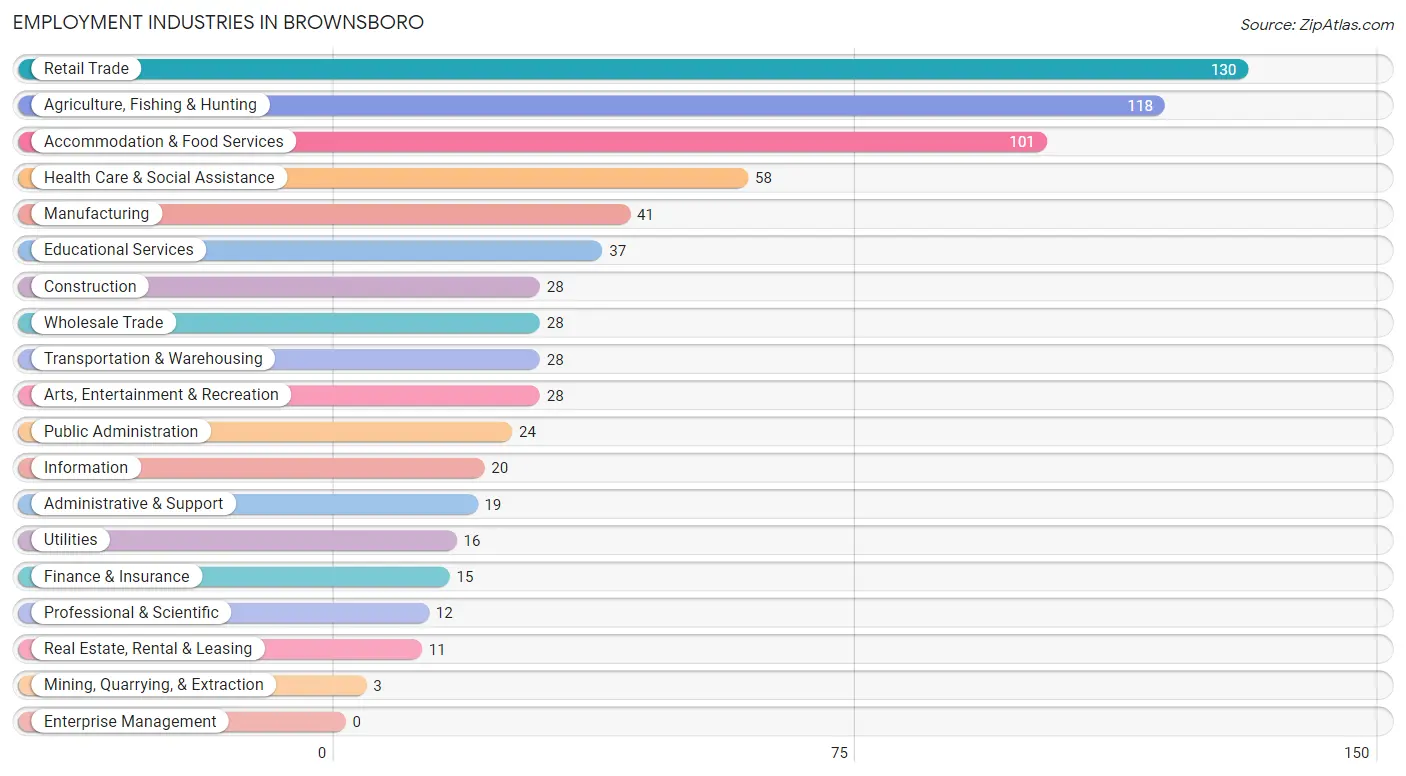
Employment Industries in Brownsboro
The major employment industries in Brownsboro include Retail Trade (130 | 17.7%), Agriculture, Fishing & Hunting (118 | 16.1%), Accommodation & Food Services (101 | 13.7%), Health Care & Social Assistance (58 | 7.9%), and Manufacturing (41 | 5.6%).
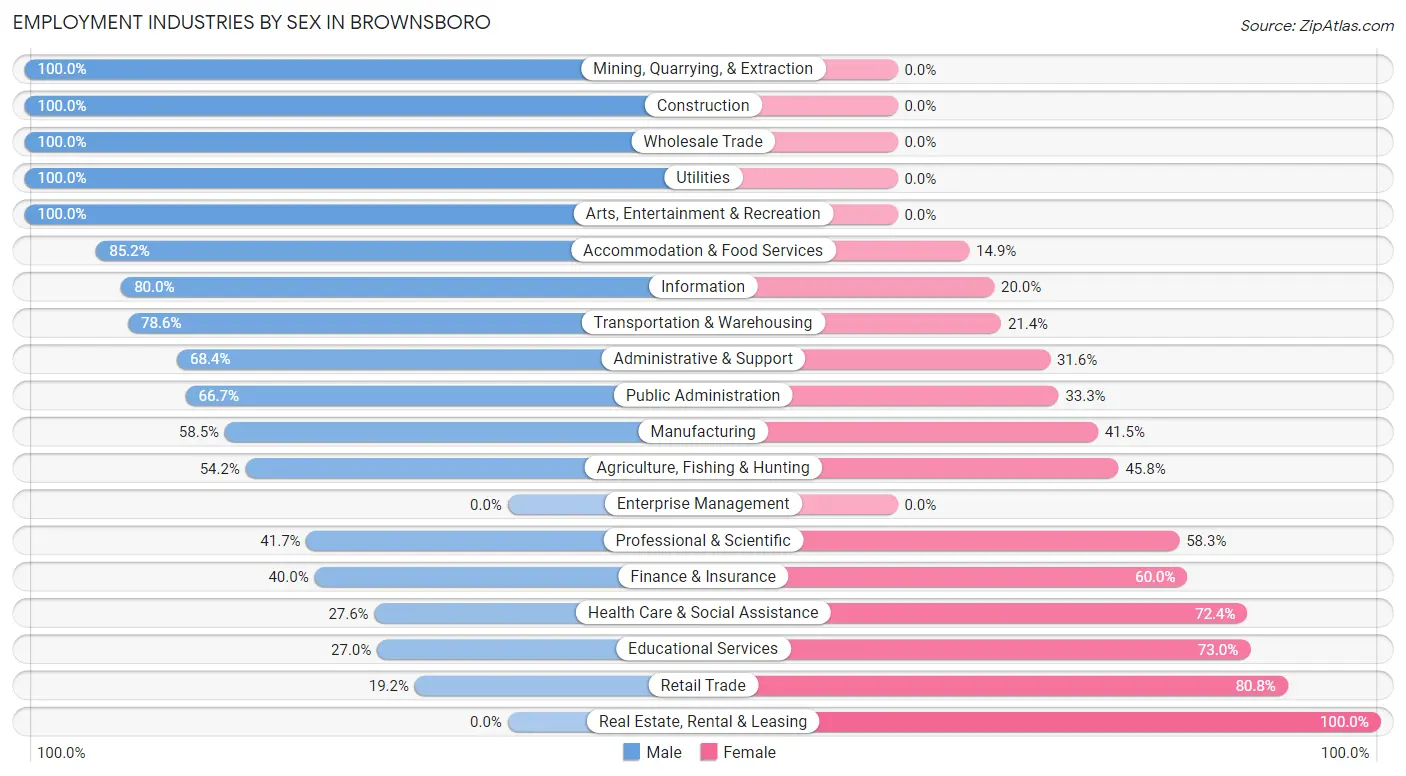
Employment Industries by Sex in Brownsboro
The Brownsboro industries that see more men than women are Mining, Quarrying, & Extraction (100.0%), Construction (100.0%), and Wholesale Trade (100.0%), whereas the industries that tend to have a higher number of women are Real Estate, Rental & Leasing (100.0%), Retail Trade (80.8%), and Educational Services (73.0%).
| Industry | Male | Female |
| Agriculture, Fishing & Hunting | 64 (54.2%) | 54 (45.8%) |
| Mining, Quarrying, & Extraction | 3 (100.0%) | 0 (0.0%) |
| Construction | 28 (100.0%) | 0 (0.0%) |
| Manufacturing | 24 (58.5%) | 17 (41.5%) |
| Wholesale Trade | 28 (100.0%) | 0 (0.0%) |
| Retail Trade | 25 (19.2%) | 105 (80.8%) |
| Transportation & Warehousing | 22 (78.6%) | 6 (21.4%) |
| Utilities | 16 (100.0%) | 0 (0.0%) |
| Information | 16 (80.0%) | 4 (20.0%) |
| Finance & Insurance | 6 (40.0%) | 9 (60.0%) |
| Real Estate, Rental & Leasing | 0 (0.0%) | 11 (100.0%) |
| Professional & Scientific | 5 (41.7%) | 7 (58.3%) |
| Enterprise Management | 0 (0.0%) | 0 (0.0%) |
| Administrative & Support | 13 (68.4%) | 6 (31.6%) |
| Educational Services | 10 (27.0%) | 27 (73.0%) |
| Health Care & Social Assistance | 16 (27.6%) | 42 (72.4%) |
| Arts, Entertainment & Recreation | 28 (100.0%) | 0 (0.0%) |
| Accommodation & Food Services | 86 (85.2%) | 15 (14.8%) |
| Public Administration | 16 (66.7%) | 8 (33.3%) |
| Total | 420 (57.1%) | 315 (42.9%) |
Education in Brownsboro
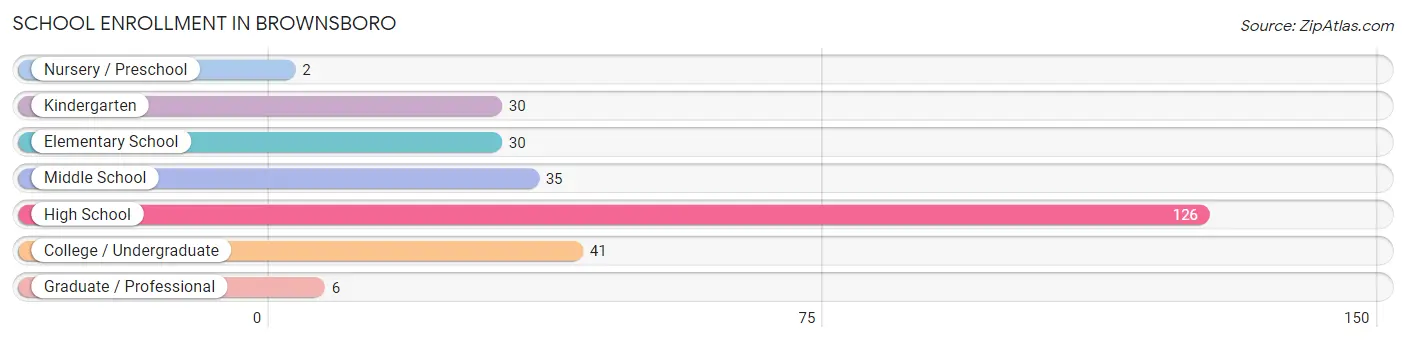
School Enrollment in Brownsboro
The most common levels of schooling among the 270 students in Brownsboro are high school (126 | 46.7%), college / undergraduate (41 | 15.2%), and middle school (35 | 13.0%).
| School Level | # Students | % Students |
| Nursery / Preschool | 2 | 0.7% |
| Kindergarten | 30 | 11.1% |
| Elementary School | 30 | 11.1% |
| Middle School | 35 | 13.0% |
| High School | 126 | 46.7% |
| College / Undergraduate | 41 | 15.2% |
| Graduate / Professional | 6 | 2.2% |
| Total | 270 | 100.0% |
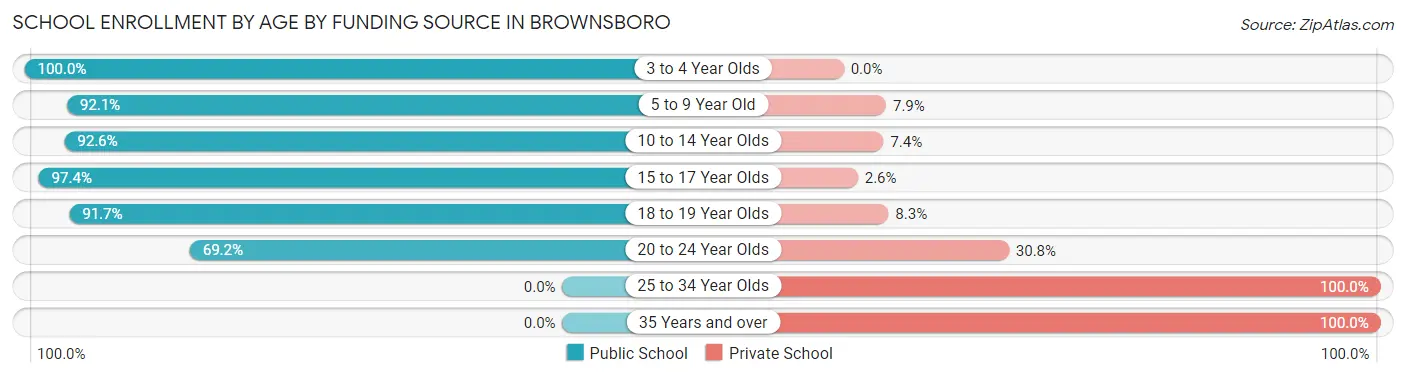
School Enrollment by Age by Funding Source in Brownsboro
Out of a total of 270 students who are enrolled in schools in Brownsboro, 37 (13.7%) attend a private institution, while the remaining 233 (86.3%) are enrolled in public schools. The age group of 25 to 34 year olds has the highest likelihood of being enrolled in private schools, with 7 (100.0% in the age bracket) enrolled. Conversely, the age group of 3 to 4 year olds has the lowest likelihood of being enrolled in a private school, with 9 (100.0% in the age bracket) attending a public institution.
| Age Bracket | Public School | Private School |
| 3 to 4 Year Olds | 9 (100.0%) | 0 (0.0%) |
| 5 to 9 Year Old | 35 (92.1%) | 3 (7.9%) |
| 10 to 14 Year Olds | 75 (92.6%) | 6 (7.4%) |
| 15 to 17 Year Olds | 74 (97.4%) | 2 (2.6%) |
| 18 to 19 Year Olds | 22 (91.7%) | 2 (8.3%) |
| 20 to 24 Year Olds | 18 (69.2%) | 8 (30.8%) |
| 25 to 34 Year Olds | 0 (0.0%) | 7 (100.0%) |
| 35 Years and over | 0 (0.0%) | 9 (100.0%) |
| Total | 233 (86.3%) | 37 (13.7%) |
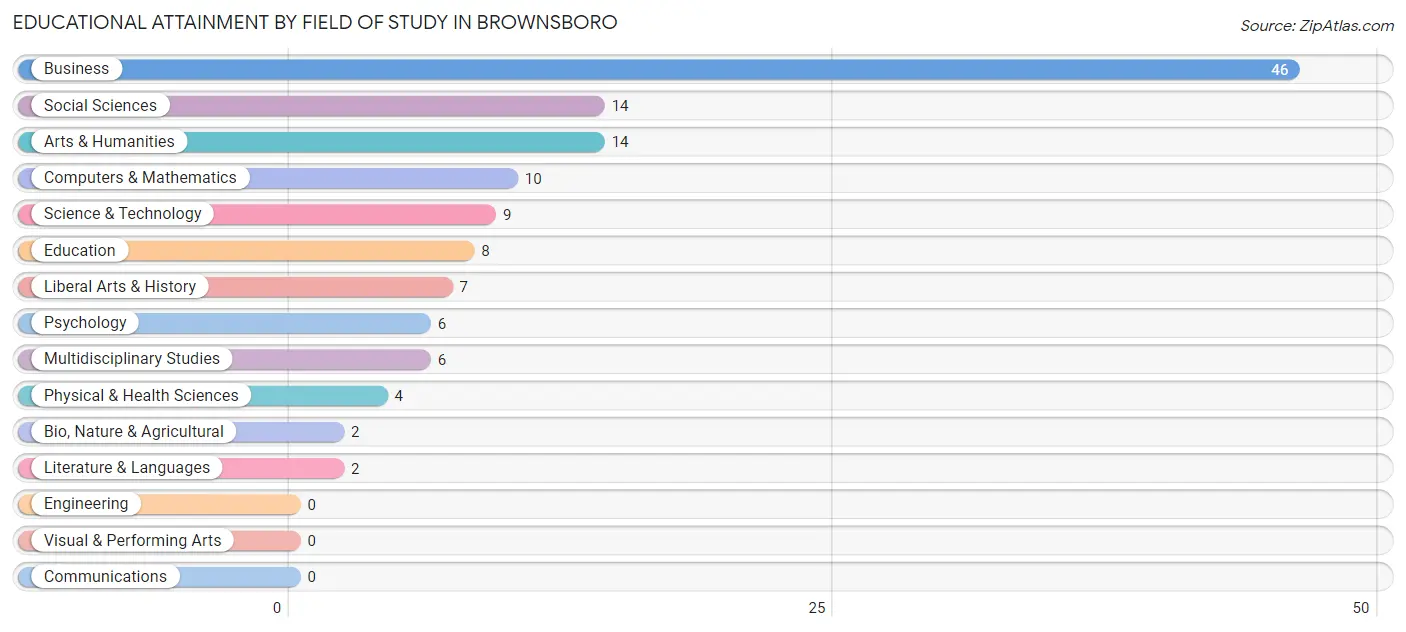
Educational Attainment by Field of Study in Brownsboro
Business (46 | 35.9%), social sciences (14 | 10.9%), arts & humanities (14 | 10.9%), computers & mathematics (10 | 7.8%), and science & technology (9 | 7.0%) are the most common fields of study among 128 individuals in Brownsboro who have obtained a bachelor's degree or higher.
| Field of Study | # Graduates | % Graduates |
| Computers & Mathematics | 10 | 7.8% |
| Bio, Nature & Agricultural | 2 | 1.6% |
| Physical & Health Sciences | 4 | 3.1% |
| Psychology | 6 | 4.7% |
| Social Sciences | 14 | 10.9% |
| Engineering | 0 | 0.0% |
| Multidisciplinary Studies | 6 | 4.7% |
| Science & Technology | 9 | 7.0% |
| Business | 46 | 35.9% |
| Education | 8 | 6.2% |
| Literature & Languages | 2 | 1.6% |
| Liberal Arts & History | 7 | 5.5% |
| Visual & Performing Arts | 0 | 0.0% |
| Communications | 0 | 0.0% |
| Arts & Humanities | 14 | 10.9% |
| Total | 128 | 100.0% |
Transportation & Commute in Brownsboro
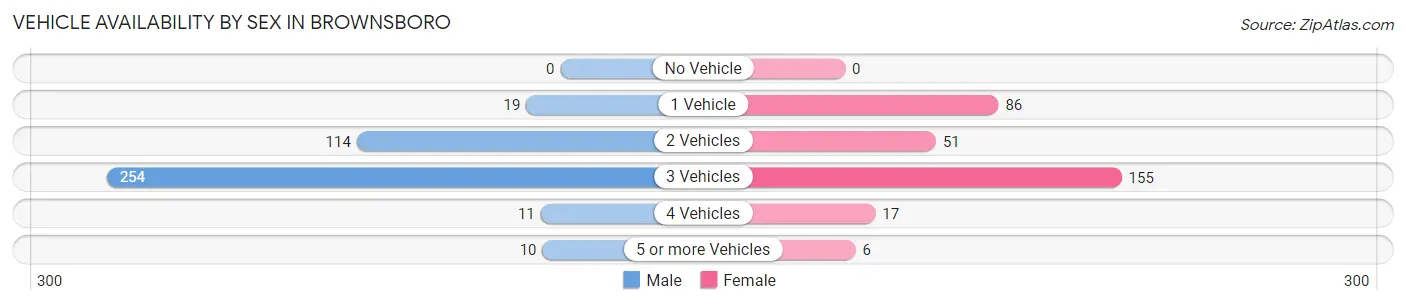
Vehicle Availability by Sex in Brownsboro
The most prevalent vehicle ownership categories in Brownsboro are males with 3 vehicles (254, accounting for 62.3%) and females with 3 vehicles (155, making up 80.6%).
| Vehicles Available | Male | Female |
| No Vehicle | 0 (0.0%) | 0 (0.0%) |
| 1 Vehicle | 19 (4.7%) | 86 (27.3%) |
| 2 Vehicles | 114 (27.9%) | 51 (16.2%) |
| 3 Vehicles | 254 (62.3%) | 155 (49.2%) |
| 4 Vehicles | 11 (2.7%) | 17 (5.4%) |
| 5 or more Vehicles | 10 (2.5%) | 6 (1.9%) |
| Total | 408 (100.0%) | 315 (100.0%) |
Commute Time in Brownsboro
The most frequently occuring commute durations in Brownsboro are 45 to 59 minutes (137 commuters, 19.8%), 20 to 24 minutes (105 commuters, 15.2%), and 30 to 34 minutes (101 commuters, 14.6%).
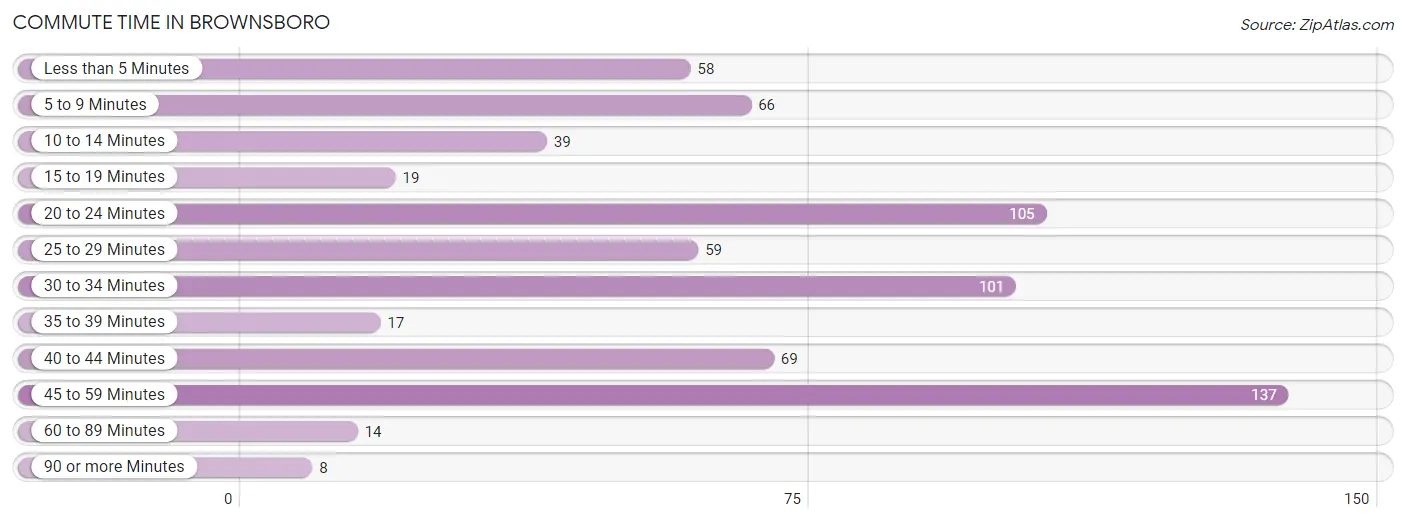
| Commute Time | # Commuters | % Commuters |
| Less than 5 Minutes | 58 | 8.4% |
| 5 to 9 Minutes | 66 | 9.5% |
| 10 to 14 Minutes | 39 | 5.6% |
| 15 to 19 Minutes | 19 | 2.8% |
| 20 to 24 Minutes | 105 | 15.2% |
| 25 to 29 Minutes | 59 | 8.5% |
| 30 to 34 Minutes | 101 | 14.6% |
| 35 to 39 Minutes | 17 | 2.5% |
| 40 to 44 Minutes | 69 | 10.0% |
| 45 to 59 Minutes | 137 | 19.8% |
| 60 to 89 Minutes | 14 | 2.0% |
| 90 or more Minutes | 8 | 1.2% |
Commute Time by Sex in Brownsboro
The most common commute times in Brownsboro are 45 to 59 minutes (84 commuters, 21.8%) for males and 45 to 59 minutes (53 commuters, 17.3%) for females.
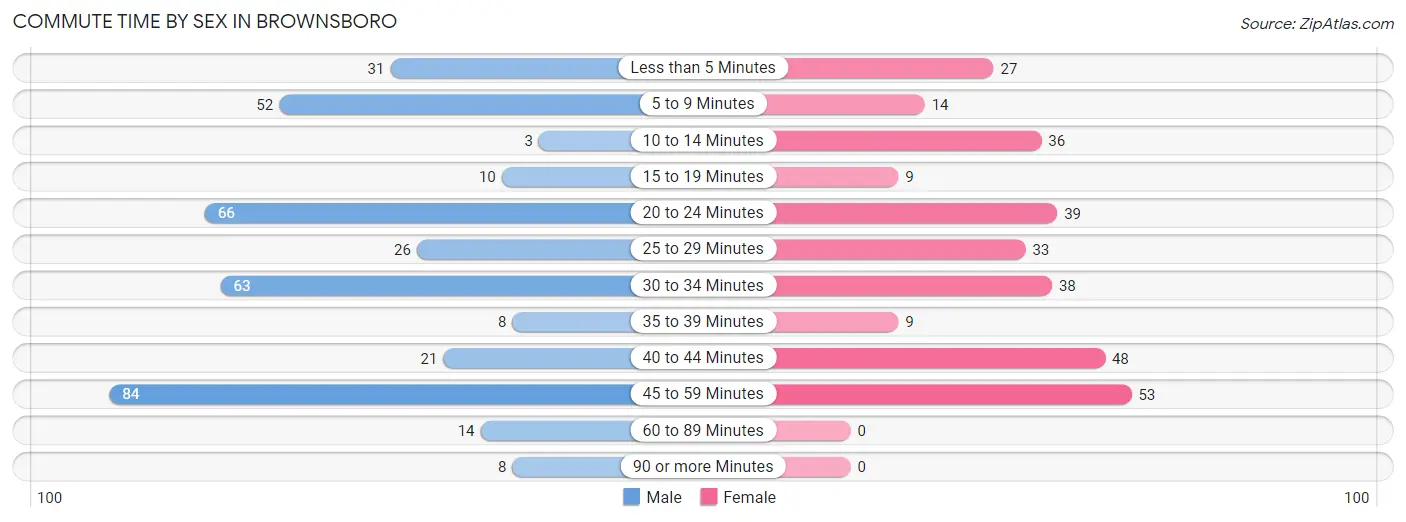
| Commute Time | Male | Female |
| Less than 5 Minutes | 31 (8.0%) | 27 (8.8%) |
| 5 to 9 Minutes | 52 (13.5%) | 14 (4.6%) |
| 10 to 14 Minutes | 3 (0.8%) | 36 (11.8%) |
| 15 to 19 Minutes | 10 (2.6%) | 9 (2.9%) |
| 20 to 24 Minutes | 66 (17.1%) | 39 (12.8%) |
| 25 to 29 Minutes | 26 (6.7%) | 33 (10.8%) |
| 30 to 34 Minutes | 63 (16.3%) | 38 (12.4%) |
| 35 to 39 Minutes | 8 (2.1%) | 9 (2.9%) |
| 40 to 44 Minutes | 21 (5.4%) | 48 (15.7%) |
| 45 to 59 Minutes | 84 (21.8%) | 53 (17.3%) |
| 60 to 89 Minutes | 14 (3.6%) | 0 (0.0%) |
| 90 or more Minutes | 8 (2.1%) | 0 (0.0%) |
Time of Departure to Work by Sex in Brownsboro
The most frequent times of departure to work in Brownsboro are 7:00 AM to 7:29 AM (85, 22.0%) for males and 8:00 AM to 8:29 AM (57, 18.6%) for females.
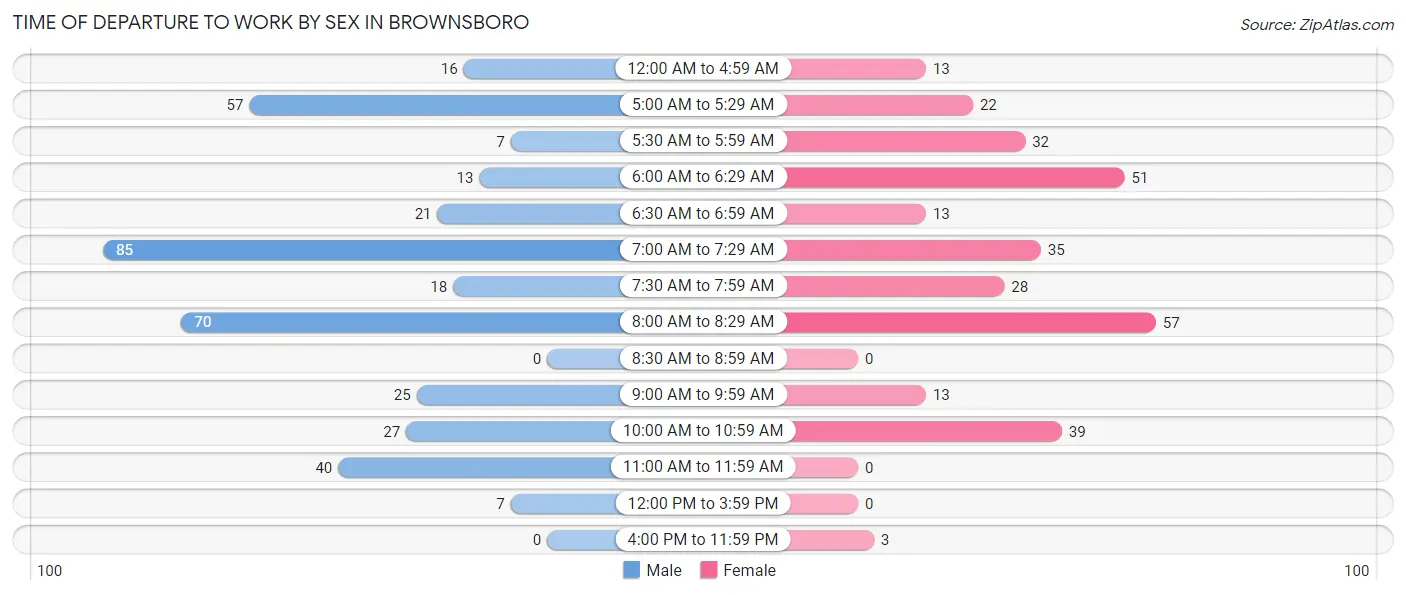
| Time of Departure | Male | Female |
| 12:00 AM to 4:59 AM | 16 (4.2%) | 13 (4.3%) |
| 5:00 AM to 5:29 AM | 57 (14.8%) | 22 (7.2%) |
| 5:30 AM to 5:59 AM | 7 (1.8%) | 32 (10.5%) |
| 6:00 AM to 6:29 AM | 13 (3.4%) | 51 (16.7%) |
| 6:30 AM to 6:59 AM | 21 (5.4%) | 13 (4.3%) |
| 7:00 AM to 7:29 AM | 85 (22.0%) | 35 (11.4%) |
| 7:30 AM to 7:59 AM | 18 (4.7%) | 28 (9.1%) |
| 8:00 AM to 8:29 AM | 70 (18.1%) | 57 (18.6%) |
| 8:30 AM to 8:59 AM | 0 (0.0%) | 0 (0.0%) |
| 9:00 AM to 9:59 AM | 25 (6.5%) | 13 (4.3%) |
| 10:00 AM to 10:59 AM | 27 (7.0%) | 39 (12.8%) |
| 11:00 AM to 11:59 AM | 40 (10.4%) | 0 (0.0%) |
| 12:00 PM to 3:59 PM | 7 (1.8%) | 0 (0.0%) |
| 4:00 PM to 11:59 PM | 0 (0.0%) | 3 (1.0%) |
| Total | 386 (100.0%) | 306 (100.0%) |
Housing Occupancy in Brownsboro
Occupancy by Ownership in Brownsboro
Of the total 495 dwellings in Brownsboro, owner-occupied units account for 264 (53.3%), while renter-occupied units make up 231 (46.7%).
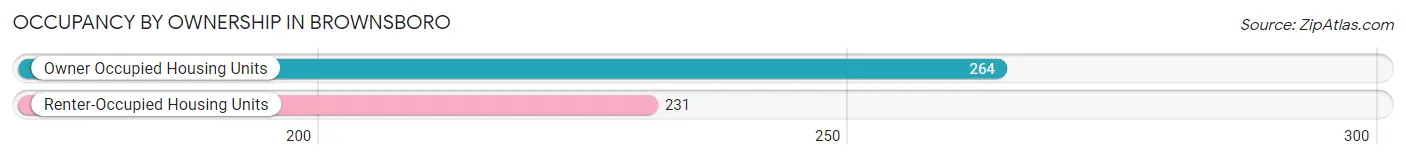
| Occupancy | # Housing Units | % Housing Units |
| Owner Occupied Housing Units | 264 | 53.3% |
| Renter-Occupied Housing Units | 231 | 46.7% |
| Total Occupied Housing Units | 495 | 100.0% |
Occupancy by Household Size in Brownsboro
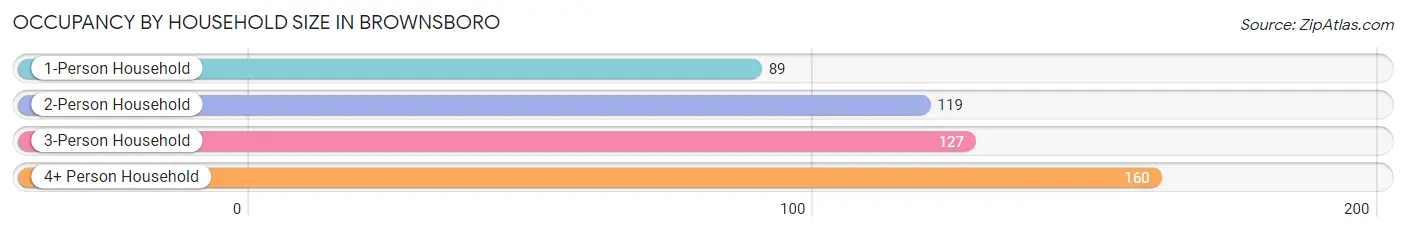
| Household Size | # Housing Units | % Housing Units |
| 1-Person Household | 89 | 18.0% |
| 2-Person Household | 119 | 24.0% |
| 3-Person Household | 127 | 25.7% |
| 4+ Person Household | 160 | 32.3% |
| Total Housing Units | 495 | 100.0% |
Occupancy by Ownership by Household Size in Brownsboro
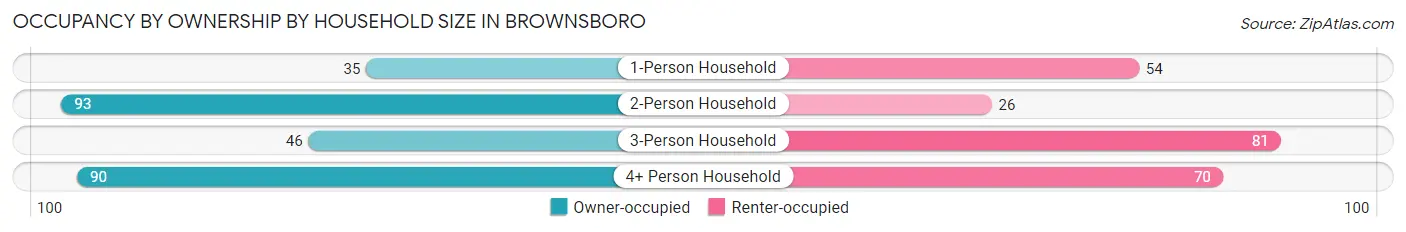
| Household Size | Owner-occupied | Renter-occupied |
| 1-Person Household | 35 (39.3%) | 54 (60.7%) |
| 2-Person Household | 93 (78.1%) | 26 (21.8%) |
| 3-Person Household | 46 (36.2%) | 81 (63.8%) |
| 4+ Person Household | 90 (56.2%) | 70 (43.8%) |
| Total Housing Units | 264 (53.3%) | 231 (46.7%) |
Occupancy by Educational Attainment in Brownsboro
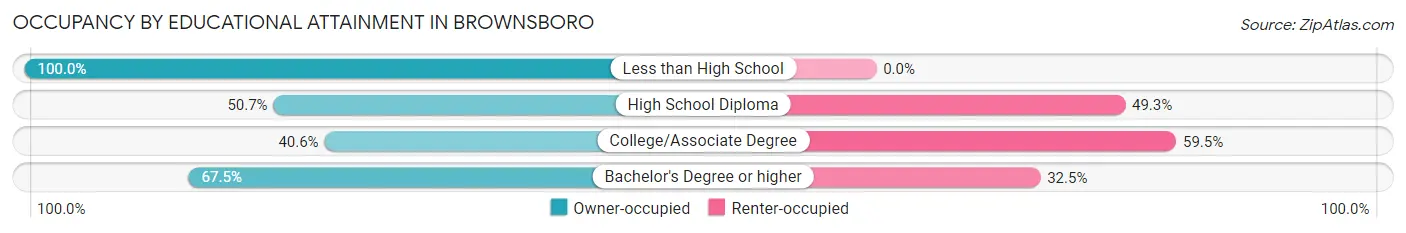
| Household Size | Owner-occupied | Renter-occupied |
| Less than High School | 43 (100.0%) | 0 (0.0%) |
| High School Diploma | 77 (50.7%) | 75 (49.3%) |
| College/Associate Degree | 88 (40.6%) | 129 (59.5%) |
| Bachelor's Degree or higher | 56 (67.5%) | 27 (32.5%) |
Occupancy by Age of Householder in Brownsboro
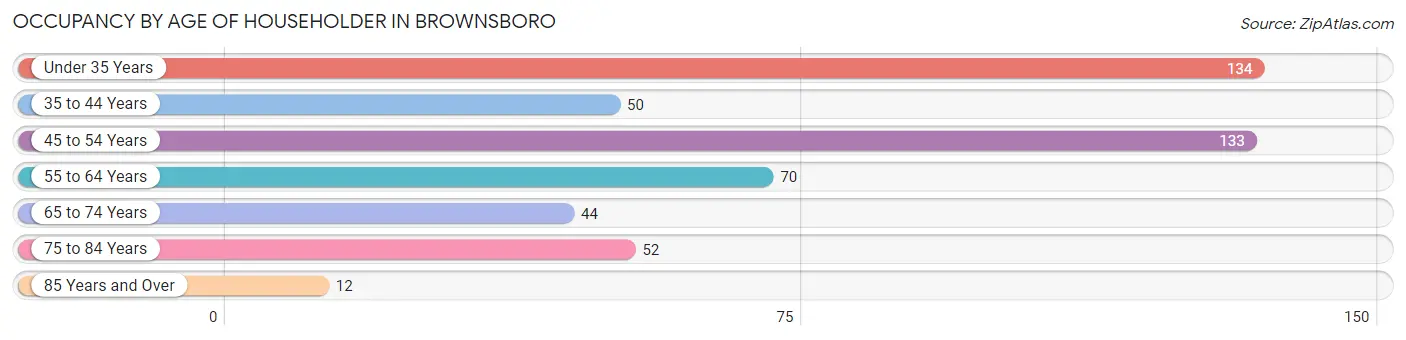
| Age Bracket | # Households | % Households |
| Under 35 Years | 134 | 27.1% |
| 35 to 44 Years | 50 | 10.1% |
| 45 to 54 Years | 133 | 26.9% |
| 55 to 64 Years | 70 | 14.1% |
| 65 to 74 Years | 44 | 8.9% |
| 75 to 84 Years | 52 | 10.5% |
| 85 Years and Over | 12 | 2.4% |
| Total | 495 | 100.0% |
Housing Finances in Brownsboro
Median Income by Occupancy in Brownsboro
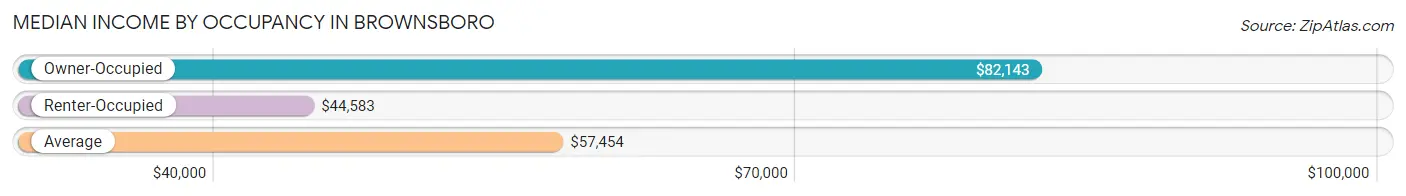
| Occupancy Type | # Households | Median Income |
| Owner-Occupied | 264 (53.3%) | $82,143 |
| Renter-Occupied | 231 (46.7%) | $44,583 |
| Average | 495 (100.0%) | $57,454 |
Occupancy by Householder Income Bracket in Brownsboro
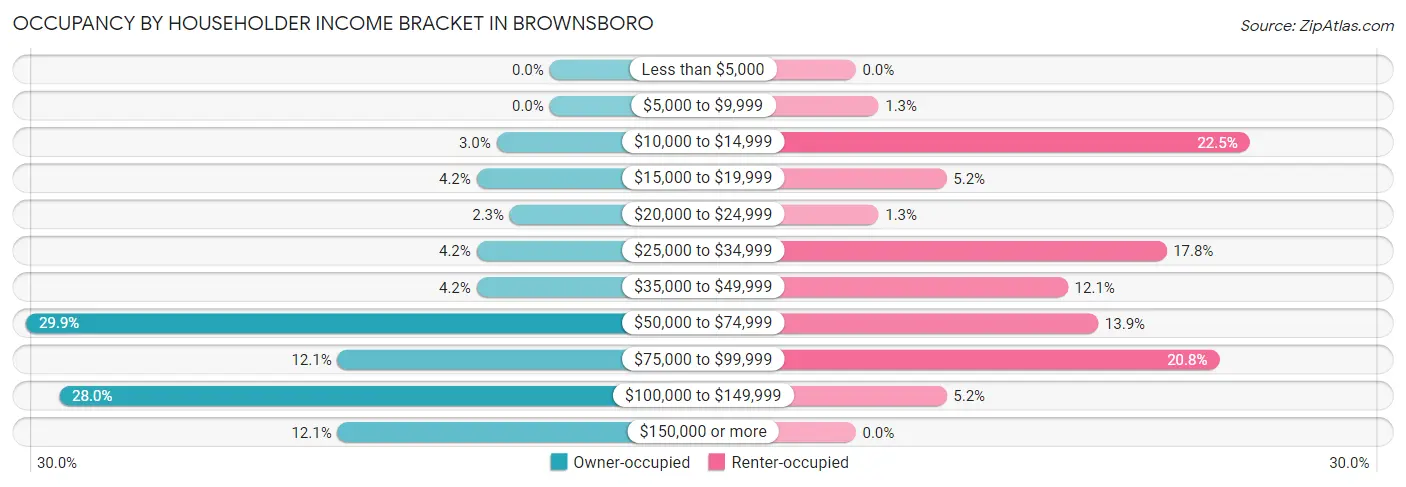
| Income Bracket | Owner-occupied | Renter-occupied |
| Less than $5,000 | 0 (0.0%) | 0 (0.0%) |
| $5,000 to $9,999 | 0 (0.0%) | 3 (1.3%) |
| $10,000 to $14,999 | 8 (3.0%) | 52 (22.5%) |
| $15,000 to $19,999 | 11 (4.2%) | 12 (5.2%) |
| $20,000 to $24,999 | 6 (2.3%) | 3 (1.3%) |
| $25,000 to $34,999 | 11 (4.2%) | 41 (17.7%) |
| $35,000 to $49,999 | 11 (4.2%) | 28 (12.1%) |
| $50,000 to $74,999 | 79 (29.9%) | 32 (13.9%) |
| $75,000 to $99,999 | 32 (12.1%) | 48 (20.8%) |
| $100,000 to $149,999 | 74 (28.0%) | 12 (5.2%) |
| $150,000 or more | 32 (12.1%) | 0 (0.0%) |
| Total | 264 (100.0%) | 231 (100.0%) |
Monthly Housing Cost Tiers in Brownsboro
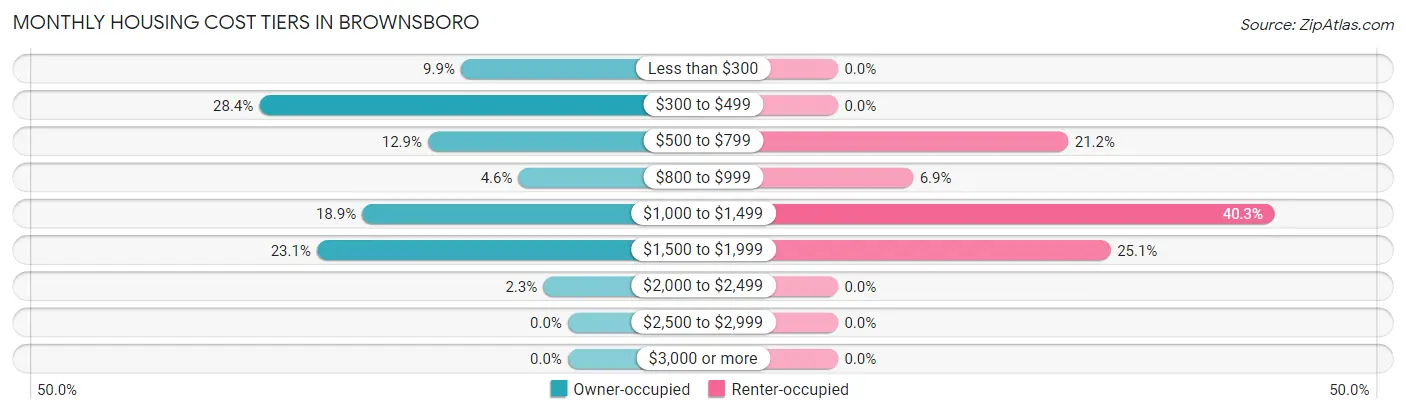
| Monthly Cost | Owner-occupied | Renter-occupied |
| Less than $300 | 26 (9.9%) | 0 (0.0%) |
| $300 to $499 | 75 (28.4%) | 0 (0.0%) |
| $500 to $799 | 34 (12.9%) | 49 (21.2%) |
| $800 to $999 | 12 (4.5%) | 16 (6.9%) |
| $1,000 to $1,499 | 50 (18.9%) | 93 (40.3%) |
| $1,500 to $1,999 | 61 (23.1%) | 58 (25.1%) |
| $2,000 to $2,499 | 6 (2.3%) | 0 (0.0%) |
| $2,500 to $2,999 | 0 (0.0%) | 0 (0.0%) |
| $3,000 or more | 0 (0.0%) | 0 (0.0%) |
| Total | 264 (100.0%) | 231 (100.0%) |
Physical Housing Characteristics in Brownsboro
Housing Structures in Brownsboro
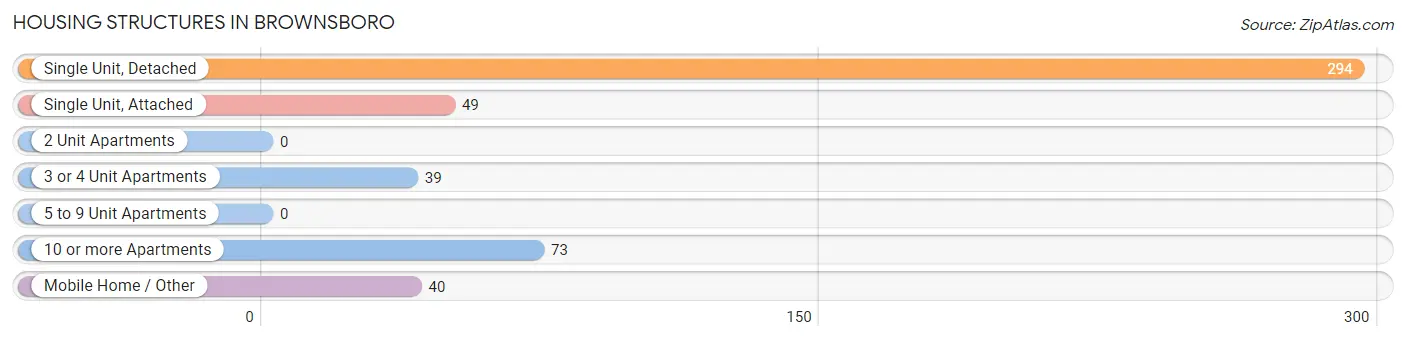
| Structure Type | # Housing Units | % Housing Units |
| Single Unit, Detached | 294 | 59.4% |
| Single Unit, Attached | 49 | 9.9% |
| 2 Unit Apartments | 0 | 0.0% |
| 3 or 4 Unit Apartments | 39 | 7.9% |
| 5 to 9 Unit Apartments | 0 | 0.0% |
| 10 or more Apartments | 73 | 14.7% |
| Mobile Home / Other | 40 | 8.1% |
| Total | 495 | 100.0% |
Housing Structures by Occupancy in Brownsboro
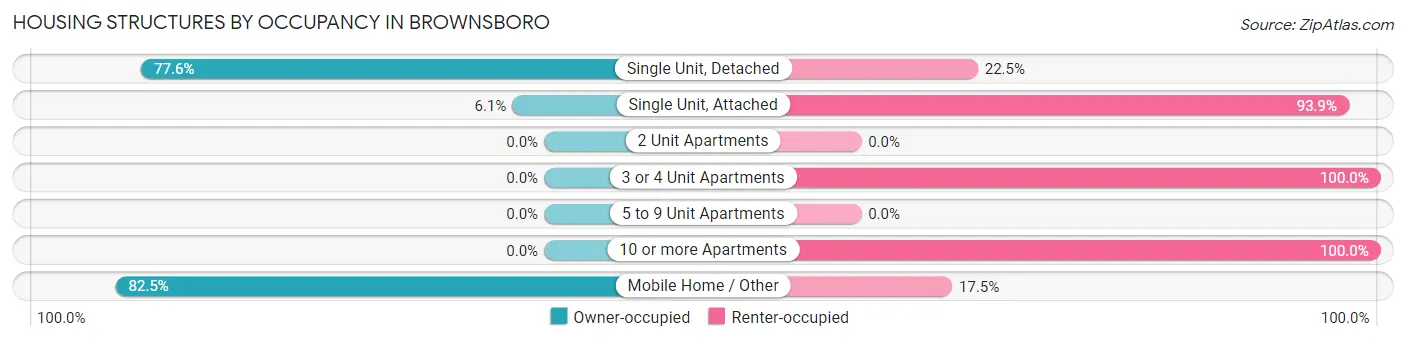
| Structure Type | Owner-occupied | Renter-occupied |
| Single Unit, Detached | 228 (77.5%) | 66 (22.5%) |
| Single Unit, Attached | 3 (6.1%) | 46 (93.9%) |
| 2 Unit Apartments | 0 (0.0%) | 0 (0.0%) |
| 3 or 4 Unit Apartments | 0 (0.0%) | 39 (100.0%) |
| 5 to 9 Unit Apartments | 0 (0.0%) | 0 (0.0%) |
| 10 or more Apartments | 0 (0.0%) | 73 (100.0%) |
| Mobile Home / Other | 33 (82.5%) | 7 (17.5%) |
| Total | 264 (53.3%) | 231 (46.7%) |
Housing Structures by Number of Rooms in Brownsboro
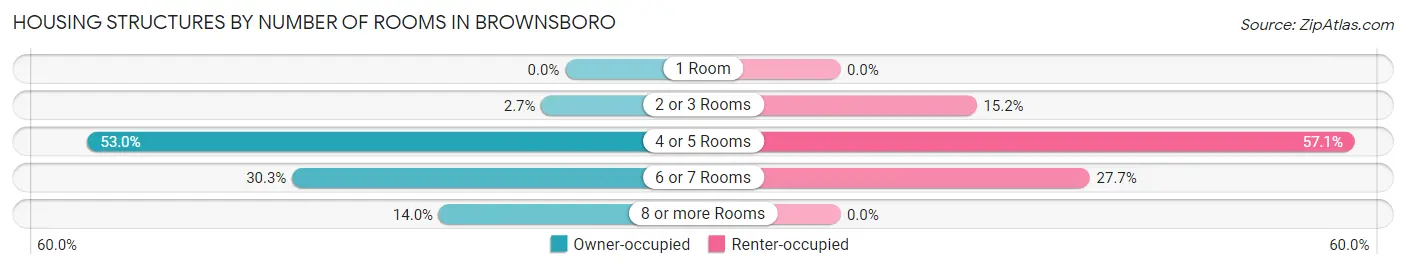
| Number of Rooms | Owner-occupied | Renter-occupied |
| 1 Room | 0 (0.0%) | 0 (0.0%) |
| 2 or 3 Rooms | 7 (2.6%) | 35 (15.1%) |
| 4 or 5 Rooms | 140 (53.0%) | 132 (57.1%) |
| 6 or 7 Rooms | 80 (30.3%) | 64 (27.7%) |
| 8 or more Rooms | 37 (14.0%) | 0 (0.0%) |
| Total | 264 (100.0%) | 231 (100.0%) |
Housing Structure by Heating Type in Brownsboro
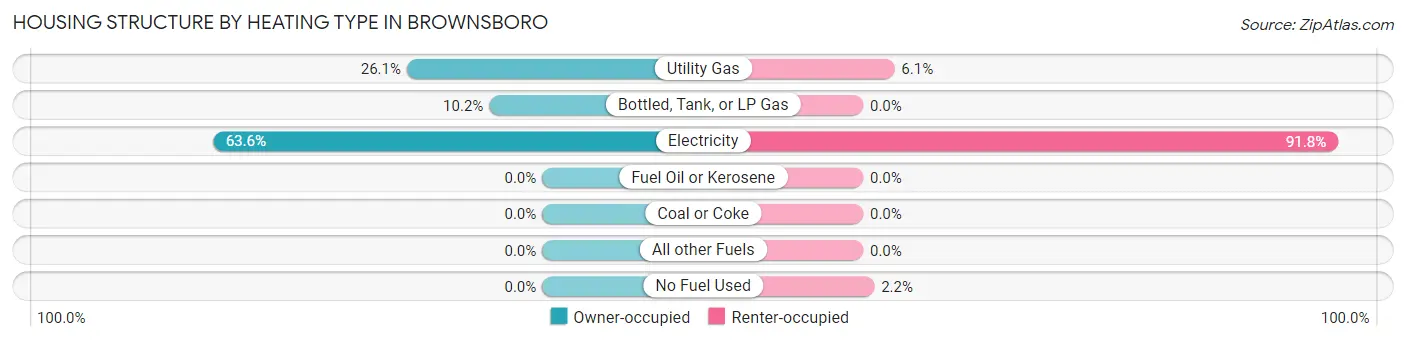
| Heating Type | Owner-occupied | Renter-occupied |
| Utility Gas | 69 (26.1%) | 14 (6.1%) |
| Bottled, Tank, or LP Gas | 27 (10.2%) | 0 (0.0%) |
| Electricity | 168 (63.6%) | 212 (91.8%) |
| Fuel Oil or Kerosene | 0 (0.0%) | 0 (0.0%) |
| Coal or Coke | 0 (0.0%) | 0 (0.0%) |
| All other Fuels | 0 (0.0%) | 0 (0.0%) |
| No Fuel Used | 0 (0.0%) | 5 (2.2%) |
| Total | 264 (100.0%) | 231 (100.0%) |
Household Vehicle Usage in Brownsboro
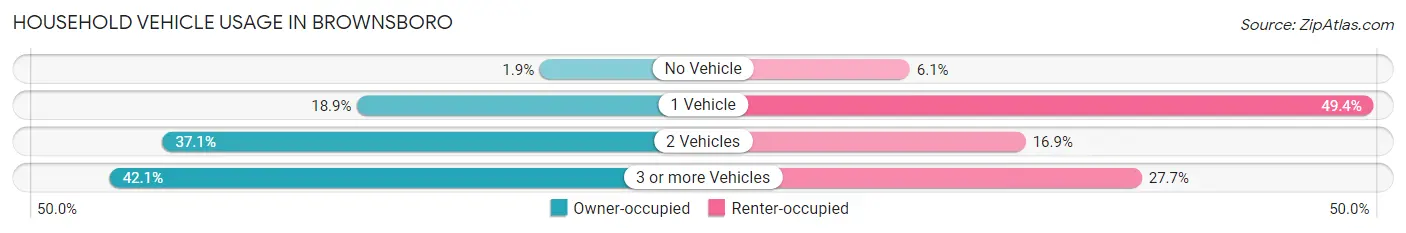
| Vehicles per Household | Owner-occupied | Renter-occupied |
| No Vehicle | 5 (1.9%) | 14 (6.1%) |
| 1 Vehicle | 50 (18.9%) | 114 (49.3%) |
| 2 Vehicles | 98 (37.1%) | 39 (16.9%) |
| 3 or more Vehicles | 111 (42.0%) | 64 (27.7%) |
| Total | 264 (100.0%) | 231 (100.0%) |
Real Estate & Mortgages in Brownsboro
Real Estate and Mortgage Overview in Brownsboro
| Characteristic | Without Mortgage | With Mortgage |
| Housing Units | 145 | 119 |
| Median Property Value | $96,200 | $193,600 |
| Median Household Income | $63,194 | $21 |
| Monthly Housing Costs | $425 | $0 |
| Real Estate Taxes | $1,000 | $0 |
Property Value by Mortgage Status in Brownsboro
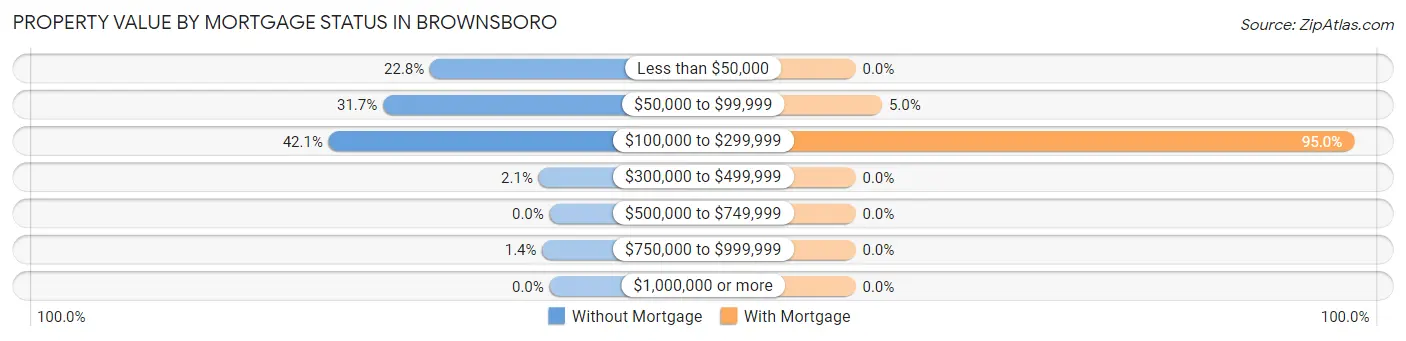
| Property Value | Without Mortgage | With Mortgage |
| Less than $50,000 | 33 (22.8%) | 0 (0.0%) |
| $50,000 to $99,999 | 46 (31.7%) | 6 (5.0%) |
| $100,000 to $299,999 | 61 (42.1%) | 113 (95.0%) |
| $300,000 to $499,999 | 3 (2.1%) | 0 (0.0%) |
| $500,000 to $749,999 | 0 (0.0%) | 0 (0.0%) |
| $750,000 to $999,999 | 2 (1.4%) | 0 (0.0%) |
| $1,000,000 or more | 0 (0.0%) | 0 (0.0%) |
| Total | 145 (100.0%) | 119 (100.0%) |
Household Income by Mortgage Status in Brownsboro
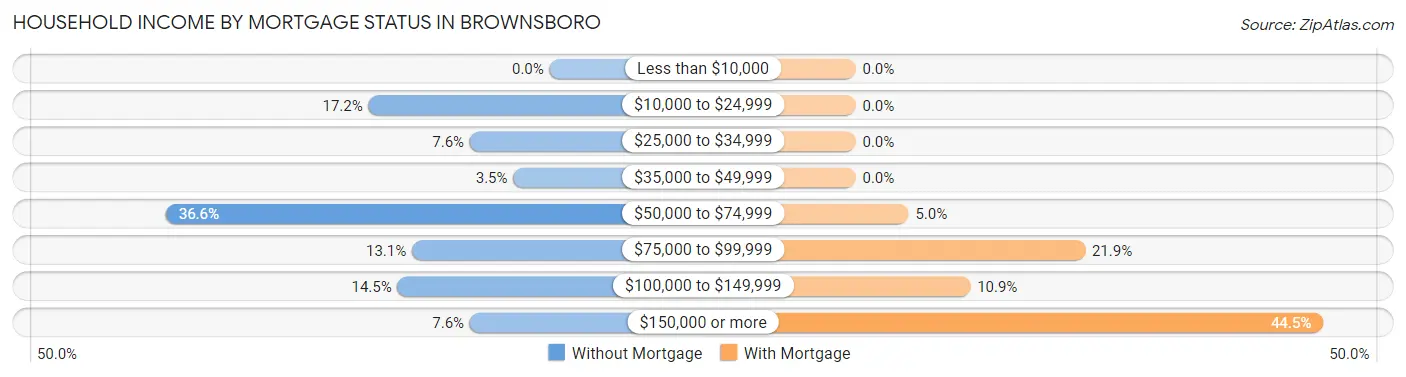
| Household Income | Without Mortgage | With Mortgage |
| Less than $10,000 | 0 (0.0%) | 0 (0.0%) |
| $10,000 to $24,999 | 25 (17.2%) | 0 (0.0%) |
| $25,000 to $34,999 | 11 (7.6%) | 0 (0.0%) |
| $35,000 to $49,999 | 5 (3.5%) | 0 (0.0%) |
| $50,000 to $74,999 | 53 (36.5%) | 6 (5.0%) |
| $75,000 to $99,999 | 19 (13.1%) | 26 (21.8%) |
| $100,000 to $149,999 | 21 (14.5%) | 13 (10.9%) |
| $150,000 or more | 11 (7.6%) | 53 (44.5%) |
| Total | 145 (100.0%) | 119 (100.0%) |
Property Value to Household Income Ratio in Brownsboro
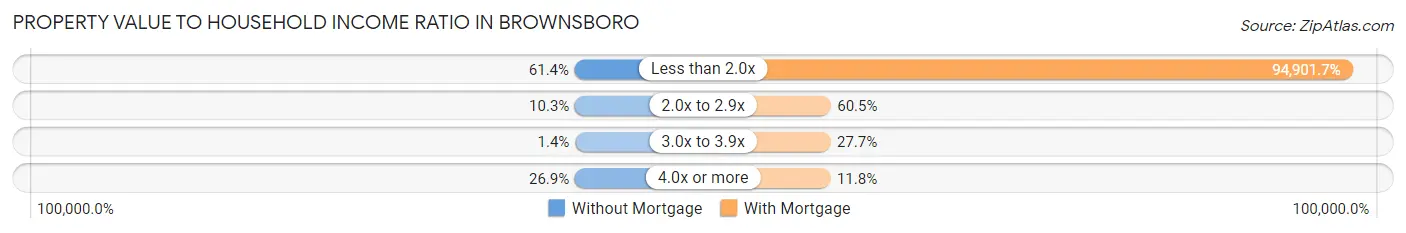
| Value-to-Income Ratio | Without Mortgage | With Mortgage |
| Less than 2.0x | 89 (61.4%) | 112,933 (94,901.7%) |
| 2.0x to 2.9x | 15 (10.3%) | 72 (60.5%) |
| 3.0x to 3.9x | 2 (1.4%) | 33 (27.7%) |
| 4.0x or more | 39 (26.9%) | 14 (11.8%) |
| Total | 145 (100.0%) | 119 (100.0%) |
Real Estate Taxes by Mortgage Status in Brownsboro
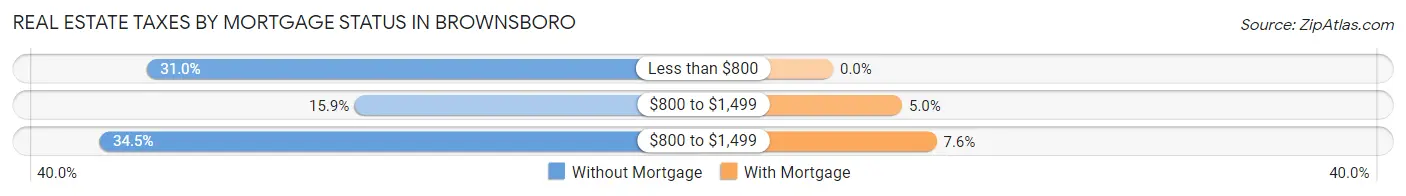
| Property Taxes | Without Mortgage | With Mortgage |
| Less than $800 | 45 (31.0%) | 0 (0.0%) |
| $800 to $1,499 | 23 (15.9%) | 6 (5.0%) |
| $800 to $1,499 | 50 (34.5%) | 9 (7.6%) |
| Total | 145 (100.0%) | 119 (100.0%) |
Health & Disability in Brownsboro
Health Insurance Coverage by Age in Brownsboro
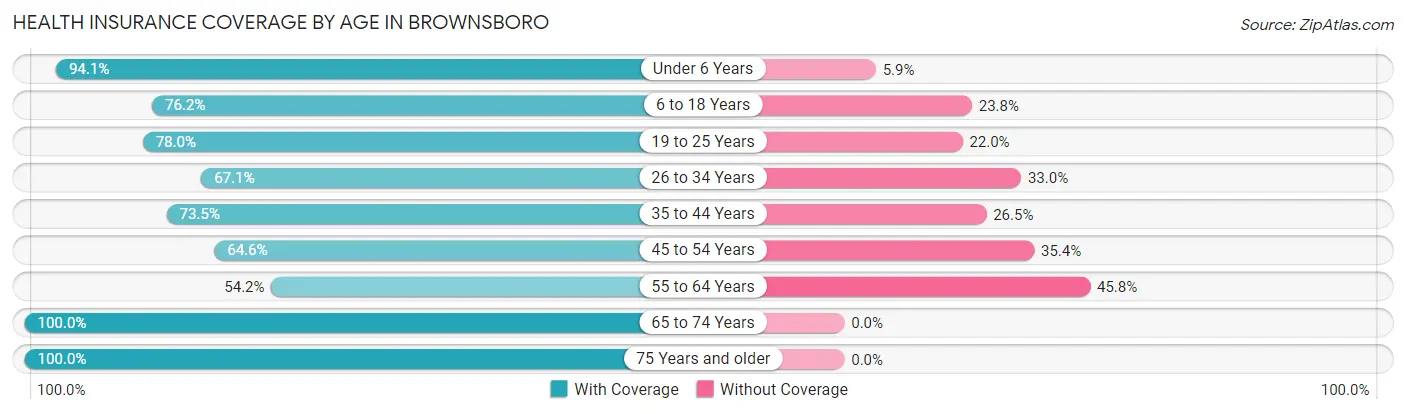
| Age Bracket | With Coverage | Without Coverage |
| Under 6 Years | 209 (94.1%) | 13 (5.9%) |
| 6 to 18 Years | 202 (76.2%) | 63 (23.8%) |
| 19 to 25 Years | 138 (78.0%) | 39 (22.0%) |
| 26 to 34 Years | 118 (67.0%) | 58 (33.0%) |
| 35 to 44 Years | 100 (73.5%) | 36 (26.5%) |
| 45 to 54 Years | 137 (64.6%) | 75 (35.4%) |
| 55 to 64 Years | 78 (54.2%) | 66 (45.8%) |
| 65 to 74 Years | 80 (100.0%) | 0 (0.0%) |
| 75 Years and older | 78 (100.0%) | 0 (0.0%) |
| Total | 1,140 (76.5%) | 350 (23.5%) |
Health Insurance Coverage by Citizenship Status in Brownsboro
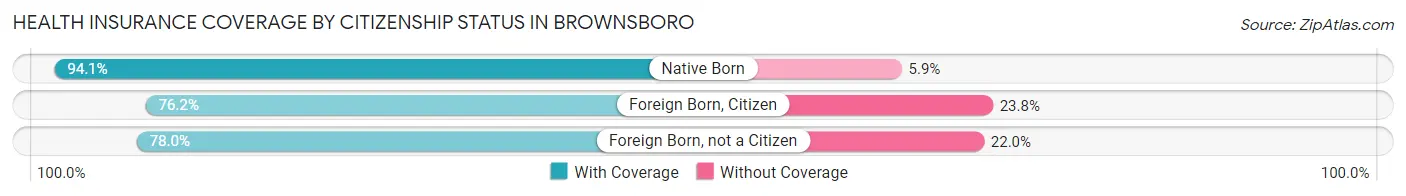
| Citizenship Status | With Coverage | Without Coverage |
| Native Born | 209 (94.1%) | 13 (5.9%) |
| Foreign Born, Citizen | 202 (76.2%) | 63 (23.8%) |
| Foreign Born, not a Citizen | 138 (78.0%) | 39 (22.0%) |
Health Insurance Coverage by Household Income in Brownsboro
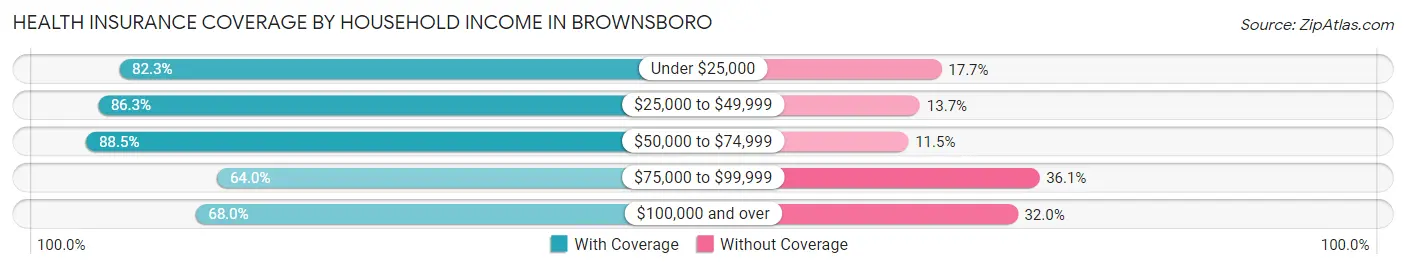
| Household Income | With Coverage | Without Coverage |
| Under $25,000 | 209 (82.3%) | 45 (17.7%) |
| $25,000 to $49,999 | 189 (86.3%) | 30 (13.7%) |
| $50,000 to $74,999 | 269 (88.5%) | 35 (11.5%) |
| $75,000 to $99,999 | 188 (63.9%) | 106 (36.0%) |
| $100,000 and over | 285 (68.0%) | 134 (32.0%) |
Public vs Private Health Insurance Coverage by Age in Brownsboro
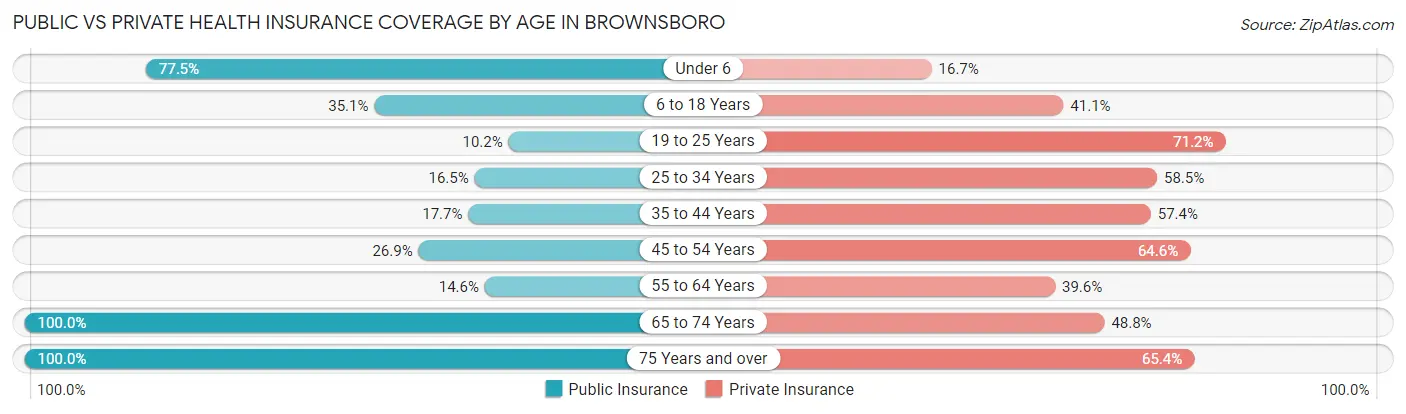
| Age Bracket | Public Insurance | Private Insurance |
| Under 6 | 172 (77.5%) | 37 (16.7%) |
| 6 to 18 Years | 93 (35.1%) | 109 (41.1%) |
| 19 to 25 Years | 18 (10.2%) | 126 (71.2%) |
| 25 to 34 Years | 29 (16.5%) | 103 (58.5%) |
| 35 to 44 Years | 24 (17.6%) | 78 (57.4%) |
| 45 to 54 Years | 57 (26.9%) | 137 (64.6%) |
| 55 to 64 Years | 21 (14.6%) | 57 (39.6%) |
| 65 to 74 Years | 80 (100.0%) | 39 (48.7%) |
| 75 Years and over | 78 (100.0%) | 51 (65.4%) |
| Total | 572 (38.4%) | 737 (49.5%) |
Disability Status by Sex by Age in Brownsboro
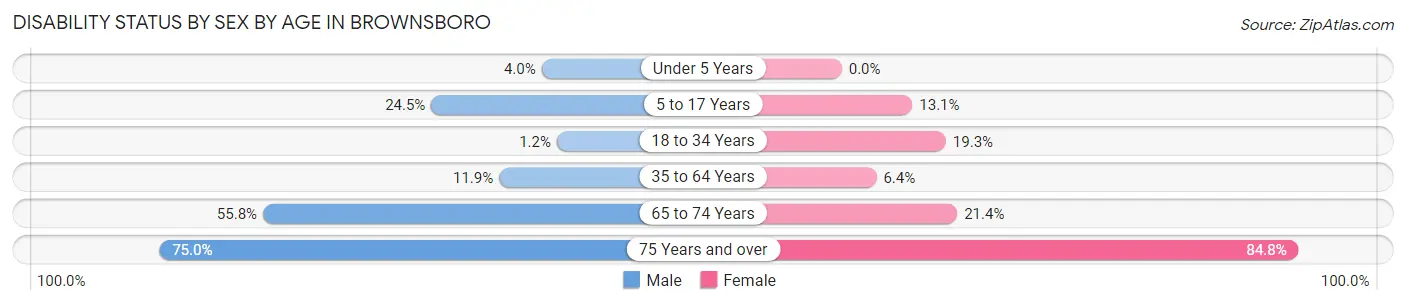
| Age Bracket | Male | Female |
| Under 5 Years | 4 (4.0%) | 0 (0.0%) |
| 5 to 17 Years | 26 (24.5%) | 19 (13.1%) |
| 18 to 34 Years | 2 (1.2%) | 40 (19.3%) |
| 35 to 64 Years | 29 (11.9%) | 16 (6.4%) |
| 65 to 74 Years | 29 (55.8%) | 6 (21.4%) |
| 75 Years and over | 24 (75.0%) | 39 (84.8%) |
Disability Class by Sex by Age in Brownsboro
Disability Class: Hearing Difficulty
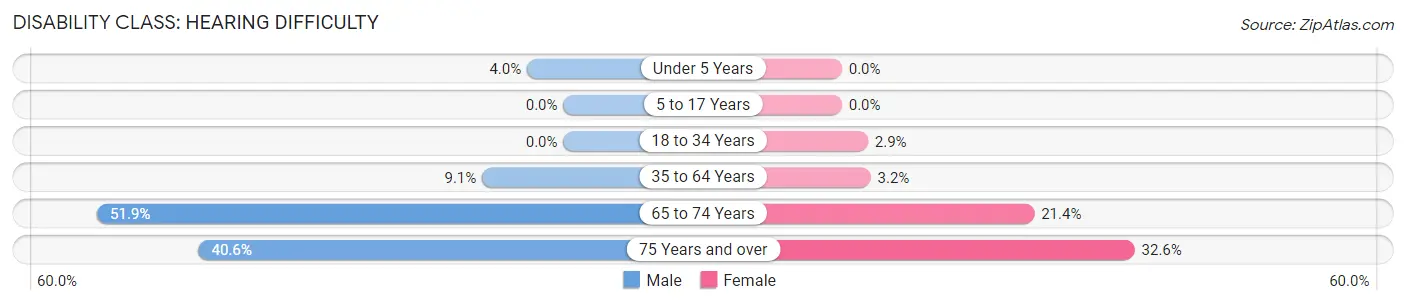
| Age Bracket | Male | Female |
| Under 5 Years | 4 (4.0%) | 0 (0.0%) |
| 5 to 17 Years | 0 (0.0%) | 0 (0.0%) |
| 18 to 34 Years | 0 (0.0%) | 6 (2.9%) |
| 35 to 64 Years | 22 (9.0%) | 8 (3.2%) |
| 65 to 74 Years | 27 (51.9%) | 6 (21.4%) |
| 75 Years and over | 13 (40.6%) | 15 (32.6%) |
Disability Class: Vision Difficulty
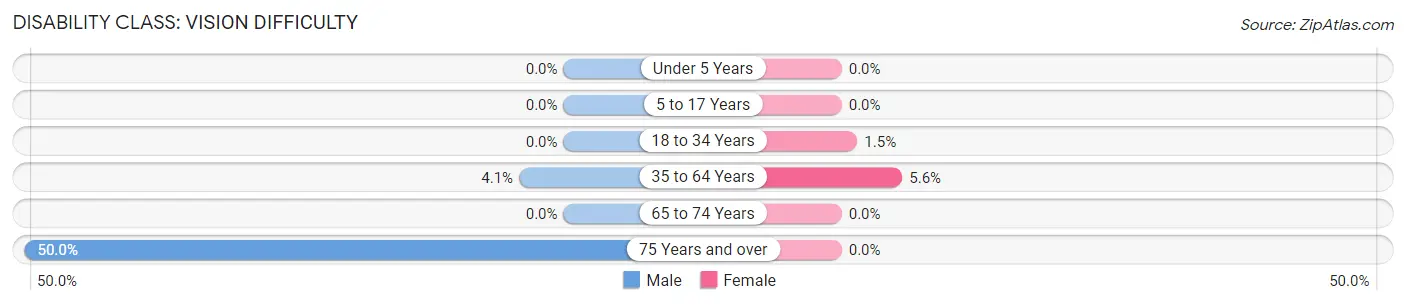
| Age Bracket | Male | Female |
| Under 5 Years | 0 (0.0%) | 0 (0.0%) |
| 5 to 17 Years | 0 (0.0%) | 0 (0.0%) |
| 18 to 34 Years | 0 (0.0%) | 3 (1.5%) |
| 35 to 64 Years | 10 (4.1%) | 14 (5.6%) |
| 65 to 74 Years | 0 (0.0%) | 0 (0.0%) |
| 75 Years and over | 16 (50.0%) | 0 (0.0%) |
Disability Class: Cognitive Difficulty
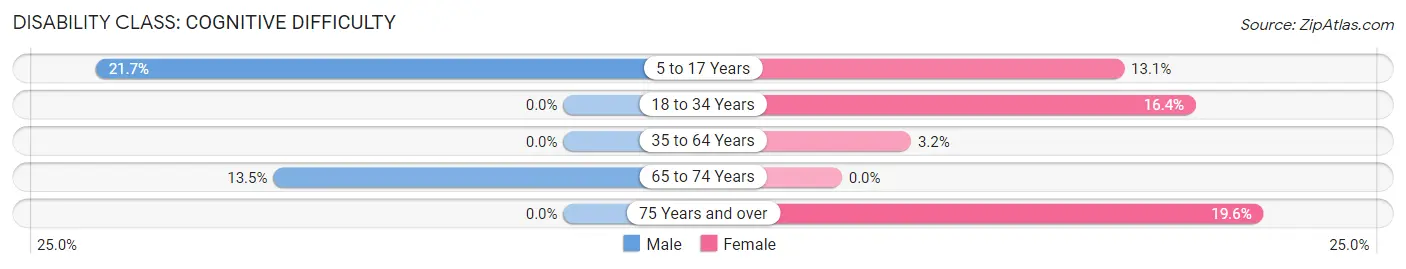
| Age Bracket | Male | Female |
| 5 to 17 Years | 23 (21.7%) | 19 (13.1%) |
| 18 to 34 Years | 0 (0.0%) | 34 (16.4%) |
| 35 to 64 Years | 0 (0.0%) | 8 (3.2%) |
| 65 to 74 Years | 7 (13.5%) | 0 (0.0%) |
| 75 Years and over | 0 (0.0%) | 9 (19.6%) |
Disability Class: Ambulatory Difficulty
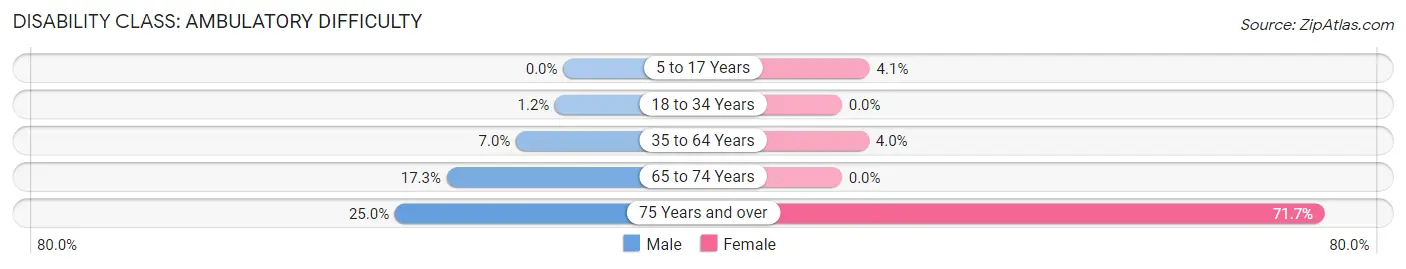
| Age Bracket | Male | Female |
| 5 to 17 Years | 0 (0.0%) | 6 (4.1%) |
| 18 to 34 Years | 2 (1.2%) | 0 (0.0%) |
| 35 to 64 Years | 17 (7.0%) | 10 (4.0%) |
| 65 to 74 Years | 9 (17.3%) | 0 (0.0%) |
| 75 Years and over | 8 (25.0%) | 33 (71.7%) |
Disability Class: Self-Care Difficulty
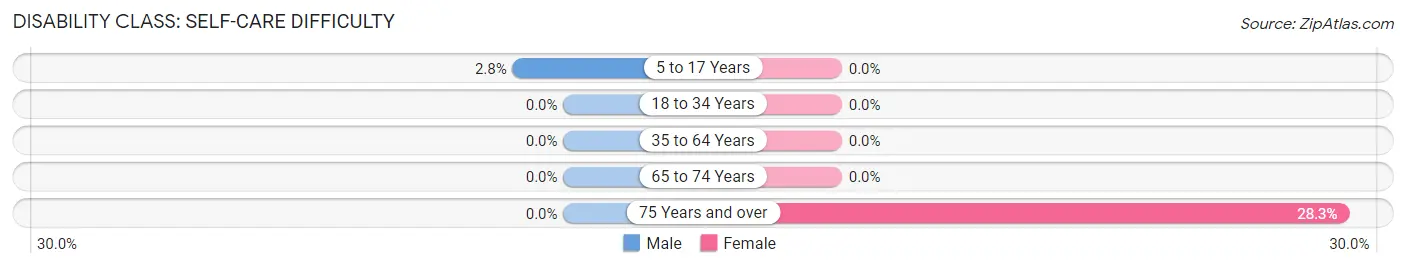
| Age Bracket | Male | Female |
| 5 to 17 Years | 3 (2.8%) | 0 (0.0%) |
| 18 to 34 Years | 0 (0.0%) | 0 (0.0%) |
| 35 to 64 Years | 0 (0.0%) | 0 (0.0%) |
| 65 to 74 Years | 0 (0.0%) | 0 (0.0%) |
| 75 Years and over | 0 (0.0%) | 13 (28.3%) |
Technology Access in Brownsboro
Computing Device Access in Brownsboro
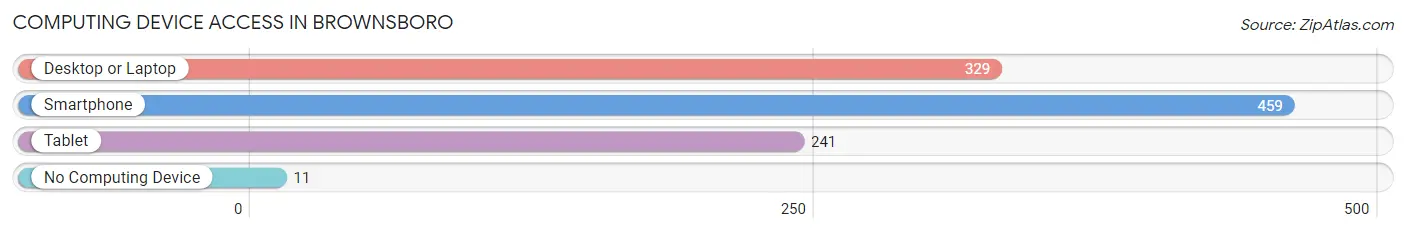
| Device Type | # Households | % Households |
| Desktop or Laptop | 329 | 66.5% |
| Smartphone | 459 | 92.7% |
| Tablet | 241 | 48.7% |
| No Computing Device | 11 | 2.2% |
| Total | 495 | 100.0% |
Internet Access in Brownsboro
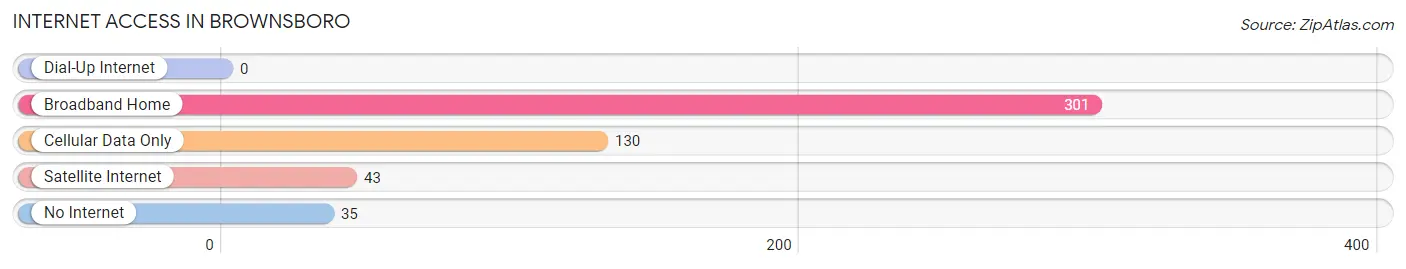
| Internet Type | # Households | % Households |
| Dial-Up Internet | 0 | 0.0% |
| Broadband Home | 301 | 60.8% |
| Cellular Data Only | 130 | 26.3% |
| Satellite Internet | 43 | 8.7% |
| No Internet | 35 | 7.1% |
| Total | 495 | 100.0% |
Brownsboro Summary
Brownsboro, Texas is a small town located in Henderson County, Texas. It is situated about 20 miles east of Tyler, Texas and about 75 miles southeast of Dallas. The town was founded in 1846 and was named after the first settler, William Brown. The population of Brownsboro was 1,093 in the 2010 census.
History
The town of Brownsboro was founded in 1846 by William Brown, who was the first settler in the area. Brown was a veteran of the Texas Revolution and had served in the Battle of San Jacinto. He was granted a land grant from the Republic of Texas in 1846 and established a homestead in the area. The town was originally known as Brown's Station, but the name was changed to Brownsboro in 1848.
The town grew slowly over the years, but it was not until the arrival of the railroad in 1872 that it began to experience significant growth. The railroad brought new businesses and industries to the area, and the population of Brownsboro began to increase. By the early 1900s, the town had become a thriving agricultural center, with cotton, corn, and other crops being grown in the area.
In the early 1900s, Brownsboro also became a popular tourist destination. The town was known for its mineral springs, which were believed to have healing properties. The mineral springs attracted visitors from all over the country, and the town became a popular destination for health seekers.
Geography
Brownsboro is located in Henderson County, Texas. It is situated about 20 miles east of Tyler, Texas and about 75 miles southeast of Dallas. The town is located in the East Texas Piney Woods region, and the terrain is mostly flat with some rolling hills. The climate is humid subtropical, with hot summers and mild winters.
The town is situated on the banks of the Neches River, which is a tributary of the Trinity River. The Neches River is a popular destination for fishing, boating, and other recreational activities. The town is also located near several lakes, including Lake Palestine, Lake Athens, and Lake Tyler.
Economy
The economy of Brownsboro is largely based on agriculture. The town is located in an area that is known for its fertile soil, and the area is home to many farms and ranches. The town is also home to several manufacturing companies, including a paper mill and a furniture factory.
The town is also home to several retail stores, restaurants, and other businesses. The town is served by several major highways, including Interstate 20, US Highway 175, and US Highway 79.
Demographics
As of the 2010 census, the population of Brownsboro was 1,093. The racial makeup of the town was 87.3% White, 8.2% African American, 0.7% Native American, 0.3% Asian, and 3.5% from other races. The median household income was $37,917, and the median family income was $45,000.
The town is served by the Brownsboro Independent School District, which consists of three elementary schools, one middle school, and one high school. The town is also home to several churches, including the First United Methodist Church, the First Baptist Church, and the Church of Christ.
Conclusion
Brownsboro, Texas is a small town located in Henderson County, Texas. It was founded in 1846 and has a population of 1,093 as of the 2010 census. The town is situated on the banks of the Neches River and is known for its mineral springs. The economy of the town is largely based on agriculture, and the town is served by several major highways. The town is also served by the Brownsboro Independent School District, and there are several churches in the area.
Common Questions
What is Per Capita Income in Brownsboro?
Per Capita income in Brownsboro is $29,152.
What is the Median Family Income in Brownsboro?
Median Family Income in Brownsboro is $70,583.
What is the Median Household income in Brownsboro?
Median Household Income in Brownsboro is $57,454.
What is Income or Wage Gap in Brownsboro?
Income or Wage Gap in Brownsboro is 50.7%.
Women in Brownsboro earn 49.3 cents for every dollar earned by a man.
What is Inequality or Gini Index in Brownsboro?
Inequality or Gini Index in Brownsboro is 0.46.
What is the Total Population of Brownsboro?
Total Population of Brownsboro is 1,490.
What is the Total Male Population of Brownsboro?
Total Male Population of Brownsboro is 697.
What is the Total Female Population of Brownsboro?
Total Female Population of Brownsboro is 793.
What is the Ratio of Males per 100 Females in Brownsboro?
There are 87.89 Males per 100 Females in Brownsboro.
What is the Ratio of Females per 100 Males in Brownsboro?
There are 113.77 Females per 100 Males in Brownsboro.
What is the Median Population Age in Brownsboro?
Median Population Age in Brownsboro is 28.9 Years.
What is the Average Family Size in Brownsboro
Average Family Size in Brownsboro is 3.3 People.
What is the Average Household Size in Brownsboro
Average Household Size in Brownsboro is 3.0 People.
How Large is the Labor Force in Brownsboro?
There are 754 People in the Labor Forcein in Brownsboro.
What is the Percentage of People in the Labor Force in Brownsboro?
69.6% of People are in the Labor Force in Brownsboro.
What is the Unemployment Rate in Brownsboro?
Unemployment Rate in Brownsboro is 2.5%.