Bridgeport, TX Map & Demographics
Bridgeport Map
Bridgeport Overview
$32,215
PER CAPITA INCOME
$98,167
AVG FAMILY INCOME
$96,231
AVG HOUSEHOLD INCOME
27.8%
WAGE / INCOME GAP [ % ]
72.2¢/ $1
WAGE / INCOME GAP [ $ ]
0.34
INEQUALITY / GINI INDEX
6,044
TOTAL POPULATION
3,313
MALE POPULATION
2,731
FEMALE POPULATION
121.31
MALES / 100 FEMALES
82.43
FEMALES / 100 MALES
33.9
MEDIAN AGE
3.5
AVG FAMILY SIZE
3.1
AVG HOUSEHOLD SIZE
2,942
LABOR FORCE [ PEOPLE ]
62.8%
PERCENT IN LABOR FORCE
2.9%
UNEMPLOYMENT RATE
Bridgeport Zip Codes
Bridgeport Area Codes
Income in Bridgeport
Income Overview in Bridgeport
Per Capita Income in Bridgeport is $32,215, while median incomes of families and households are $98,167 and $96,231 respectively.
| Characteristic | Number | Measure |
| Per Capita Income | 6,044 | $32,215 |
| Median Family Income | 1,374 | $98,167 |
| Mean Family Income | 1,374 | $118,475 |
| Median Household Income | 1,747 | $96,231 |
| Mean Household Income | 1,747 | $108,629 |
| Income Deficit | 1,374 | $0 |
| Wage / Income Gap (%) | 6,044 | 27.78% |
| Wage / Income Gap ($) | 6,044 | 72.22¢ per $1 |
| Gini / Inequality Index | 6,044 | 0.34 |
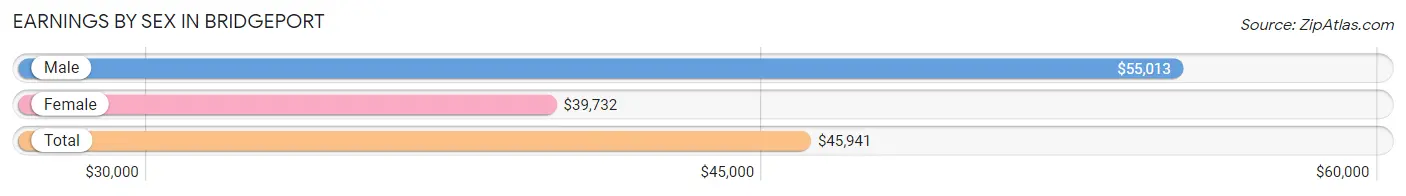
Earnings by Sex in Bridgeport
Average Earnings in Bridgeport are $45,941, $55,013 for men and $39,732 for women, a difference of 27.8%.
| Sex | Number | Average Earnings |
| Male | 1,771 (58.3%) | $55,013 |
| Female | 1,266 (41.7%) | $39,732 |
| Total | 3,037 (100.0%) | $45,941 |
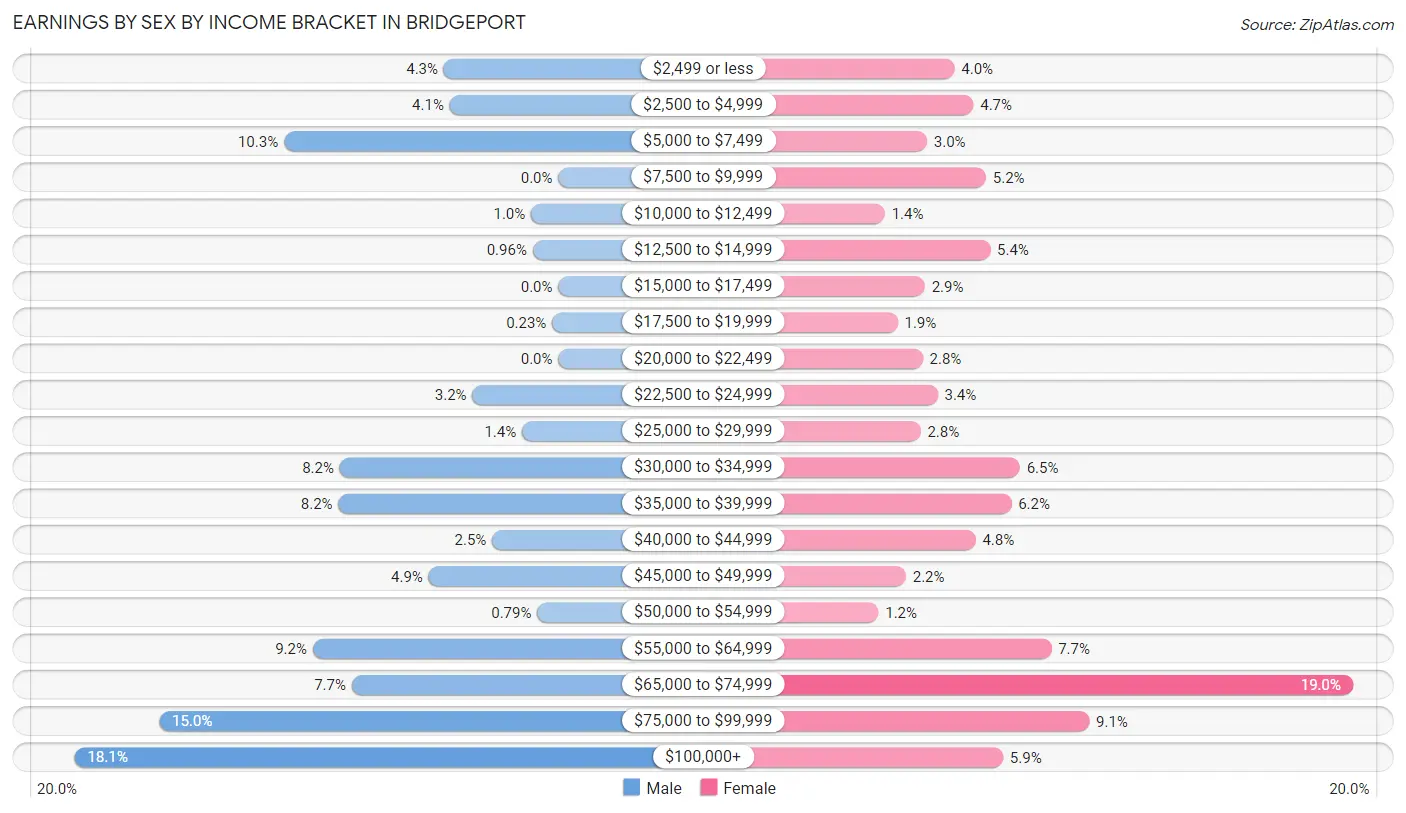
Earnings by Sex by Income Bracket in Bridgeport
The most common earnings brackets in Bridgeport are $100,000+ for men (321 | 18.1%) and $65,000 to $74,999 for women (240 | 19.0%).
| Income | Male | Female |
| $2,499 or less | 76 (4.3%) | 51 (4.0%) |
| $2,500 to $4,999 | 72 (4.1%) | 60 (4.7%) |
| $5,000 to $7,499 | 182 (10.3%) | 38 (3.0%) |
| $7,500 to $9,999 | 0 (0.0%) | 66 (5.2%) |
| $10,000 to $12,499 | 18 (1.0%) | 18 (1.4%) |
| $12,500 to $14,999 | 17 (1.0%) | 68 (5.4%) |
| $15,000 to $17,499 | 0 (0.0%) | 37 (2.9%) |
| $17,500 to $19,999 | 4 (0.2%) | 24 (1.9%) |
| $20,000 to $22,499 | 0 (0.0%) | 36 (2.8%) |
| $22,500 to $24,999 | 57 (3.2%) | 43 (3.4%) |
| $25,000 to $29,999 | 24 (1.4%) | 35 (2.8%) |
| $30,000 to $34,999 | 145 (8.2%) | 82 (6.5%) |
| $35,000 to $39,999 | 146 (8.2%) | 78 (6.2%) |
| $40,000 to $44,999 | 44 (2.5%) | 61 (4.8%) |
| $45,000 to $49,999 | 86 (4.9%) | 28 (2.2%) |
| $50,000 to $54,999 | 14 (0.8%) | 15 (1.2%) |
| $55,000 to $64,999 | 163 (9.2%) | 97 (7.7%) |
| $65,000 to $74,999 | 137 (7.7%) | 240 (19.0%) |
| $75,000 to $99,999 | 265 (15.0%) | 115 (9.1%) |
| $100,000+ | 321 (18.1%) | 74 (5.9%) |
| Total | 1,771 (100.0%) | 1,266 (100.0%) |
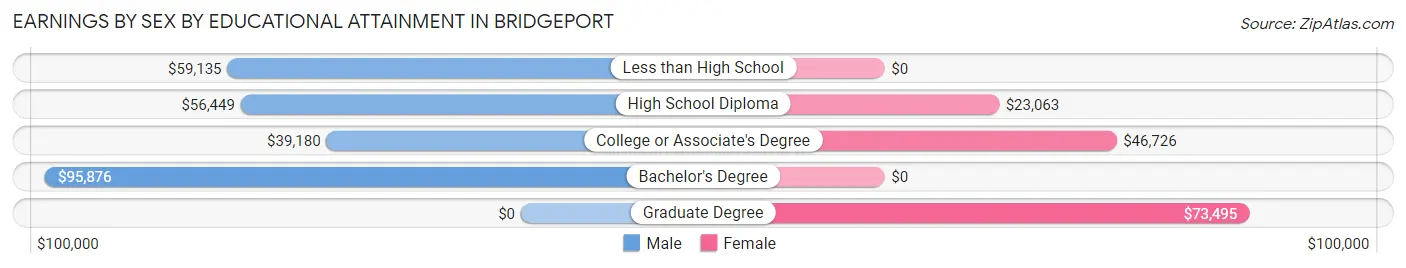
Earnings by Sex by Educational Attainment in Bridgeport
Average earnings in Bridgeport are $59,083 for men and $42,316 for women, a difference of 28.4%. Men with an educational attainment of bachelor's degree enjoy the highest average annual earnings of $95,876, while those with college or associate's degree education earn the least with $39,180. Women with an educational attainment of graduate degree earn the most with the average annual earnings of $73,495, while those with high school diploma education have the smallest earnings of $23,063.
| Educational Attainment | Male Income | Female Income |
| Less than High School | $59,135 | $0 |
| High School Diploma | $56,449 | $23,063 |
| College or Associate's Degree | $39,180 | $46,726 |
| Bachelor's Degree | $95,876 | $0 |
| Graduate Degree | - | - |
| Total | $59,083 | $42,316 |
Family Income in Bridgeport
Family Income Brackets in Bridgeport
According to the Bridgeport family income data, there are 356 families falling into the $100,000 to $149,999 income range, which is the most common income bracket and makes up 25.9% of all families.
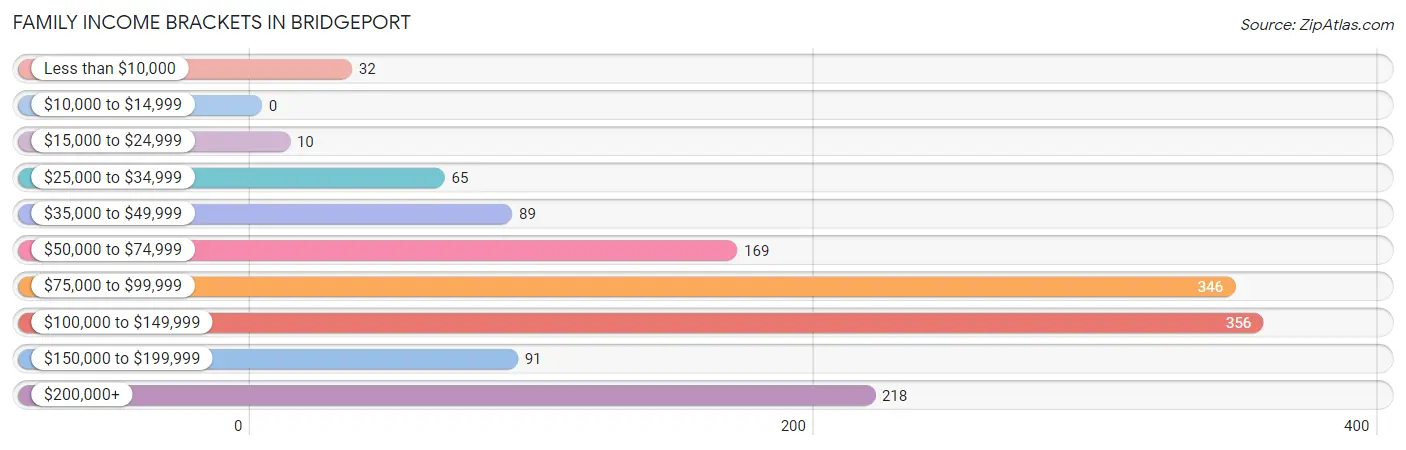
| Income Bracket | # Families | % Families |
| Less than $10,000 | 32 | 2.3% |
| $10,000 to $14,999 | 0 | 0.0% |
| $15,000 to $24,999 | 10 | 0.7% |
| $25,000 to $34,999 | 65 | 4.7% |
| $35,000 to $49,999 | 89 | 6.5% |
| $50,000 to $74,999 | 169 | 12.3% |
| $75,000 to $99,999 | 346 | 25.2% |
| $100,000 to $149,999 | 356 | 25.9% |
| $150,000 to $199,999 | 91 | 6.6% |
| $200,000+ | 218 | 15.9% |
Family Income by Famaliy Size in Bridgeport
5-person families (125 | 9.1%) account for the highest median family income in Bridgeport with $147,292 per family, while 2-person families (570 | 41.5%) have the highest median income of $52,763 per family member.
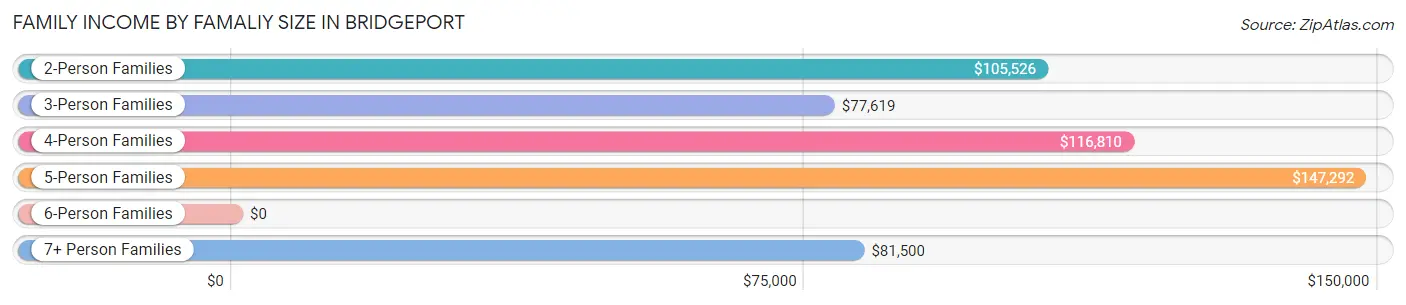
| Income Bracket | # Families | Median Income |
| 2-Person Families | 570 (41.5%) | $105,526 |
| 3-Person Families | 262 (19.1%) | $77,619 |
| 4-Person Families | 272 (19.8%) | $116,810 |
| 5-Person Families | 125 (9.1%) | $147,292 |
| 6-Person Families | 13 (0.9%) | $0 |
| 7+ Person Families | 132 (9.6%) | $81,500 |
| Total | 1,374 (100.0%) | $98,167 |
Family Income by Number of Earners in Bridgeport
The median family income in Bridgeport is $98,167, with families comprising 2 earners (477) having the highest median family income of $170,574, while families with no earners (149) have the lowest median family income of $40,398, accounting for 34.7% and 10.8% of families, respectively.
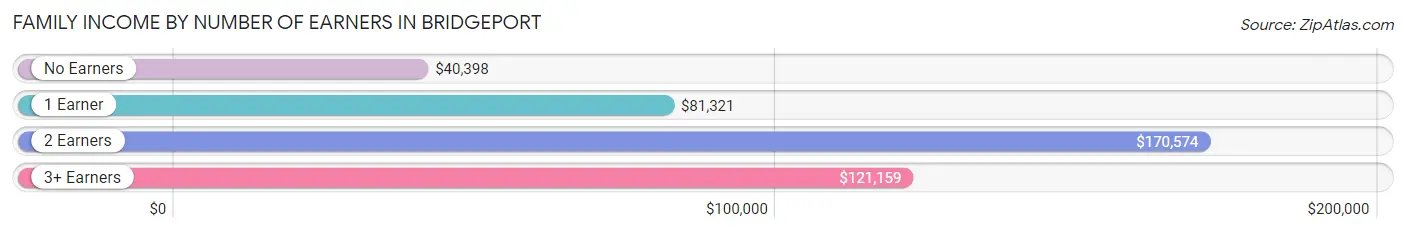
| Number of Earners | # Families | Median Income |
| No Earners | 149 (10.8%) | $40,398 |
| 1 Earner | 424 (30.9%) | $81,321 |
| 2 Earners | 477 (34.7%) | $170,574 |
| 3+ Earners | 324 (23.6%) | $121,159 |
| Total | 1,374 (100.0%) | $98,167 |
Household Income in Bridgeport
Household Income Brackets in Bridgeport
With 452 households falling in the category, the $100,000 to $149,999 income range is the most frequent in Bridgeport, accounting for 25.9% of all households.
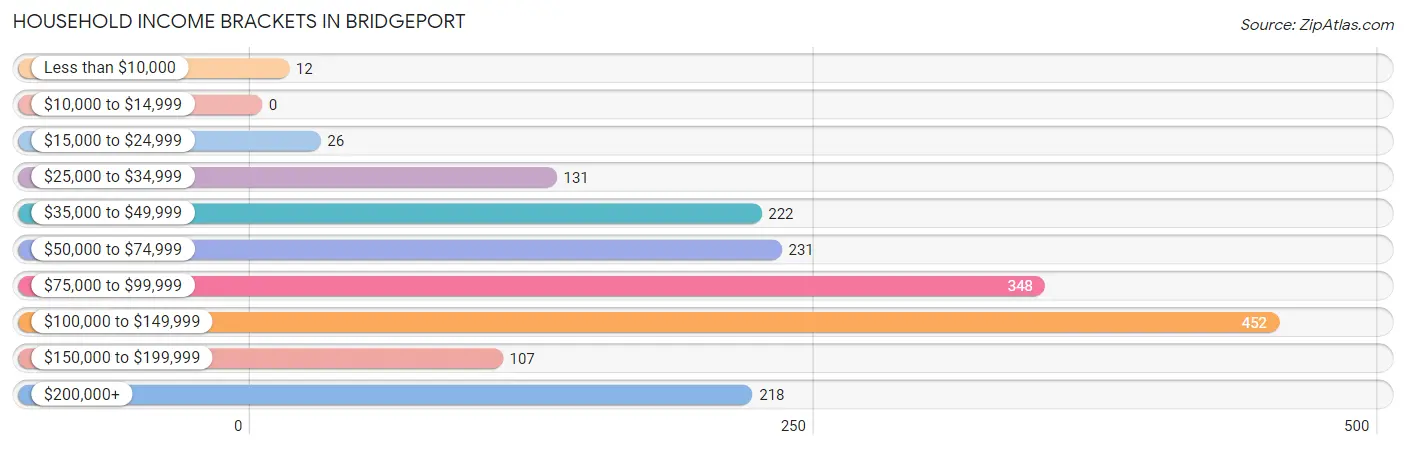
| Income Bracket | # Households | % Households |
| Less than $10,000 | 12 | 0.7% |
| $10,000 to $14,999 | 0 | 0.0% |
| $15,000 to $24,999 | 26 | 1.5% |
| $25,000 to $34,999 | 131 | 7.5% |
| $35,000 to $49,999 | 222 | 12.7% |
| $50,000 to $74,999 | 231 | 13.2% |
| $75,000 to $99,999 | 348 | 19.9% |
| $100,000 to $149,999 | 452 | 25.9% |
| $150,000 to $199,999 | 107 | 6.1% |
| $200,000+ | 218 | 12.5% |
Household Income by Householder Age in Bridgeport
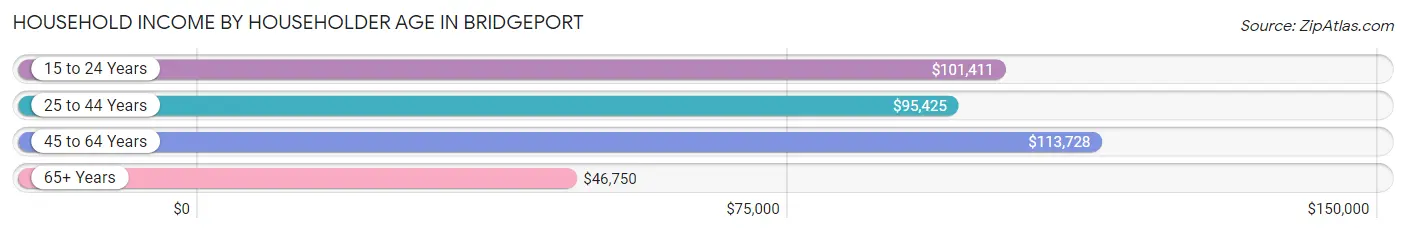
The median household income in Bridgeport is $96,231, with the highest median household income of $113,728 found in the 45 to 64 years age bracket for the primary householder. A total of 635 households (36.3%) fall into this category. Meanwhile, the 65+ years age bracket for the primary householder has the lowest median household income of $46,750, with 300 households (17.2%) in this group.
| Income Bracket | # Households | Median Income |
| 15 to 24 Years | 91 (5.2%) | $101,411 |
| 25 to 44 Years | 721 (41.3%) | $95,425 |
| 45 to 64 Years | 635 (36.3%) | $113,728 |
| 65+ Years | 300 (17.2%) | $46,750 |
| Total | 1,747 (100.0%) | $96,231 |
Poverty in Bridgeport
Income Below Poverty by Sex and Age in Bridgeport
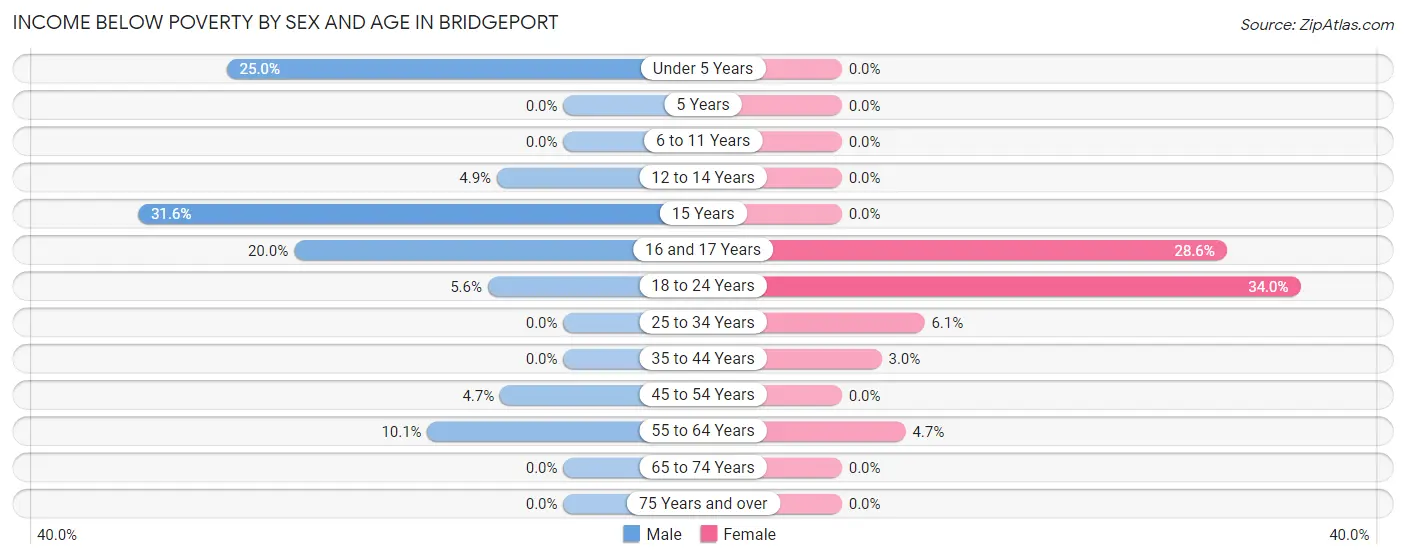
With 4.8% poverty level for males and 6.1% for females among the residents of Bridgeport, 15 year old males and 18 to 24 year old females are the most vulnerable to poverty, with 12 males (31.6%) and 80 females (34.0%) in their respective age groups living below the poverty level.
| Age Bracket | Male | Female |
| Under 5 Years | 42 (25.0%) | 0 (0.0%) |
| 5 Years | 0 (0.0%) | 0 (0.0%) |
| 6 to 11 Years | 0 (0.0%) | 0 (0.0%) |
| 12 to 14 Years | 10 (4.9%) | 0 (0.0%) |
| 15 Years | 12 (31.6%) | 0 (0.0%) |
| 16 and 17 Years | 12 (20.0%) | 42 (28.6%) |
| 18 to 24 Years | 12 (5.6%) | 80 (34.0%) |
| 25 to 34 Years | 0 (0.0%) | 18 (6.1%) |
| 35 to 44 Years | 0 (0.0%) | 10 (2.9%) |
| 45 to 54 Years | 18 (4.7%) | 0 (0.0%) |
| 55 to 64 Years | 23 (10.1%) | 15 (4.7%) |
| 65 to 74 Years | 0 (0.0%) | 0 (0.0%) |
| 75 Years and over | 0 (0.0%) | 0 (0.0%) |
| Total | 129 (4.8%) | 165 (6.1%) |
Income Above Poverty by Sex and Age in Bridgeport
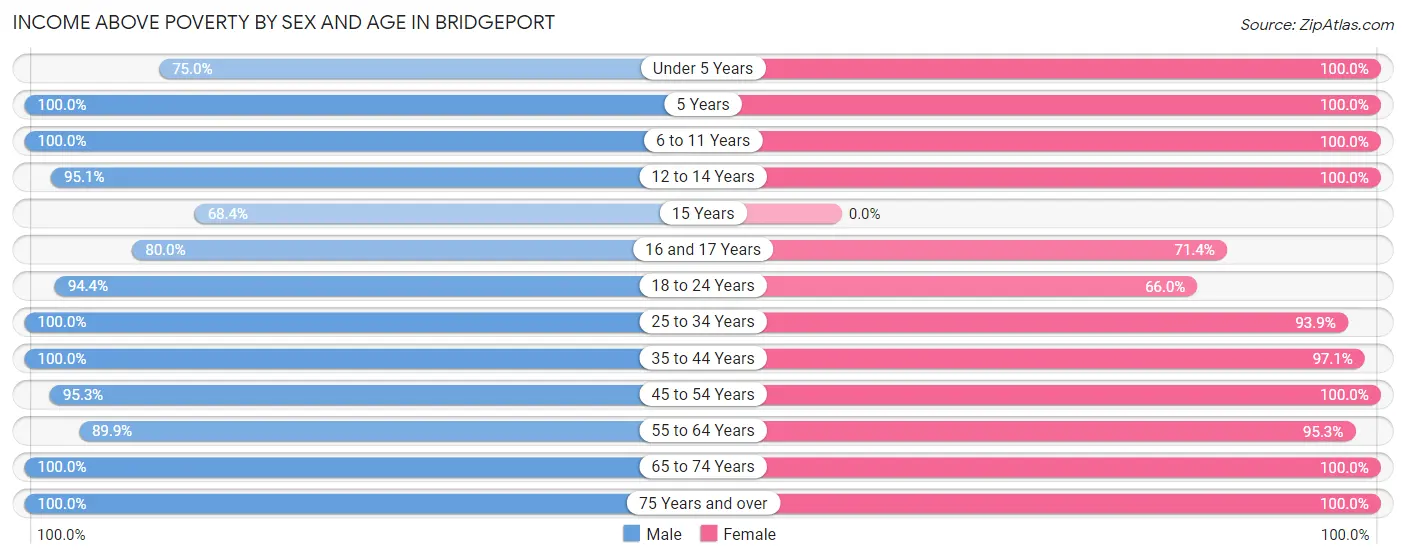
According to the poverty statistics in Bridgeport, males aged 5 years and females aged under 5 years are the age groups that are most secure financially, with 100.0% of males and 100.0% of females in these age groups living above the poverty line.
| Age Bracket | Male | Female |
| Under 5 Years | 126 (75.0%) | 224 (100.0%) |
| 5 Years | 45 (100.0%) | 48 (100.0%) |
| 6 to 11 Years | 260 (100.0%) | 173 (100.0%) |
| 12 to 14 Years | 193 (95.1%) | 200 (100.0%) |
| 15 Years | 26 (68.4%) | 0 (0.0%) |
| 16 and 17 Years | 48 (80.0%) | 105 (71.4%) |
| 18 to 24 Years | 202 (94.4%) | 155 (66.0%) |
| 25 to 34 Years | 542 (100.0%) | 275 (93.9%) |
| 35 to 44 Years | 289 (100.0%) | 329 (97.1%) |
| 45 to 54 Years | 365 (95.3%) | 418 (100.0%) |
| 55 to 64 Years | 205 (89.9%) | 302 (95.3%) |
| 65 to 74 Years | 162 (100.0%) | 162 (100.0%) |
| 75 Years and over | 115 (100.0%) | 137 (100.0%) |
| Total | 2,578 (95.2%) | 2,528 (93.9%) |
Income Below Poverty Among Married-Couple Families in Bridgeport
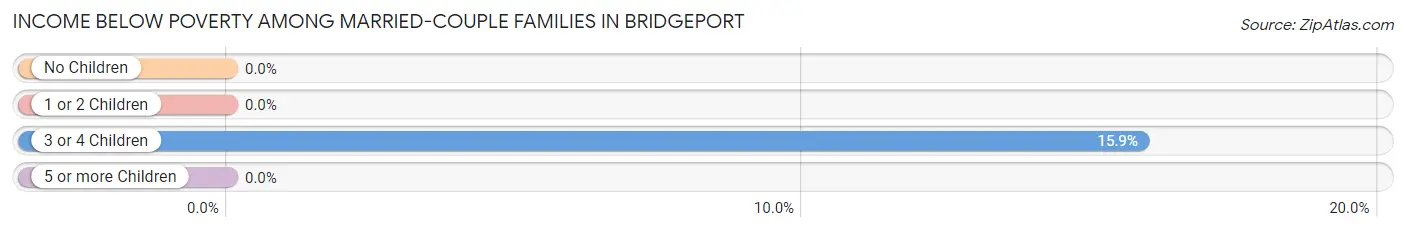
The poverty statistics for married-couple families in Bridgeport show that 0.9% or 10 of the total 1,071 families live below the poverty line. Families with 3 or 4 children have the highest poverty rate of 15.9%, comprising of 10 families. On the other hand, families with no children have the lowest poverty rate of 0.0%, which includes 0 families.
| Children | Above Poverty | Below Poverty |
| No Children | 660 (100.0%) | 0 (0.0%) |
| 1 or 2 Children | 226 (100.0%) | 0 (0.0%) |
| 3 or 4 Children | 53 (84.1%) | 10 (15.9%) |
| 5 or more Children | 122 (100.0%) | 0 (0.0%) |
| Total | 1,061 (99.1%) | 10 (0.9%) |
Income Below Poverty Among Single-Parent Households in Bridgeport
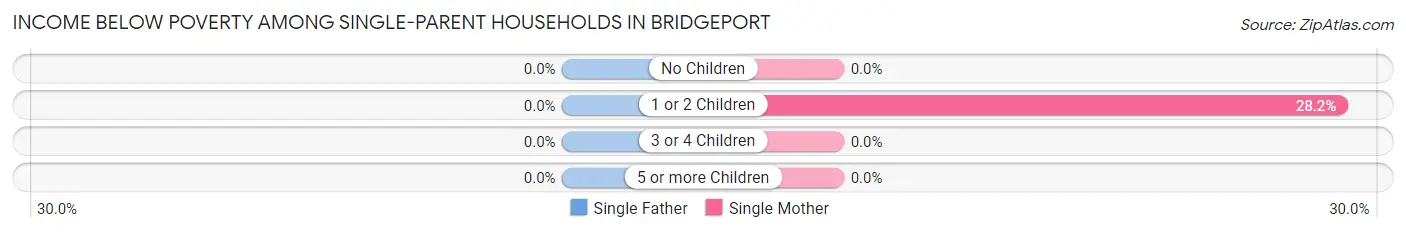
| Children | Single Father | Single Mother |
| No Children | 0 (0.0%) | 0 (0.0%) |
| 1 or 2 Children | 0 (0.0%) | 31 (28.2%) |
| 3 or 4 Children | 0 (0.0%) | 0 (0.0%) |
| 5 or more Children | 0 (0.0%) | 0 (0.0%) |
| Total | 0 (0.0%) | 31 (15.2%) |
Income Below Poverty Among Married-Couple vs Single-Parent Households in Bridgeport
The poverty data for Bridgeport shows that 10 of the married-couple family households (0.9%) and 31 of the single-parent households (10.2%) are living below the poverty level. Within the married-couple family households, those with 3 or 4 children have the highest poverty rate, with 10 households (15.9%) falling below the poverty line. Among the single-parent households, those with 1 or 2 children have the highest poverty rate, with 31 household (14.8%) living below poverty.
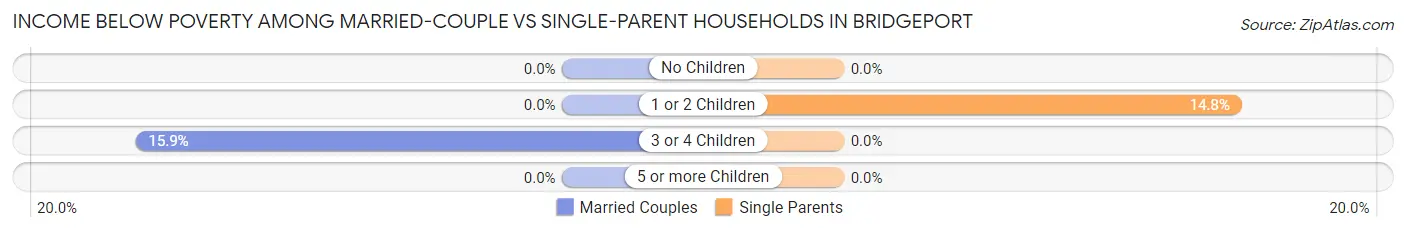
| Children | Married-Couple Families | Single-Parent Households |
| No Children | 0 (0.0%) | 0 (0.0%) |
| 1 or 2 Children | 0 (0.0%) | 31 (14.8%) |
| 3 or 4 Children | 10 (15.9%) | 0 (0.0%) |
| 5 or more Children | 0 (0.0%) | 0 (0.0%) |
| Total | 10 (0.9%) | 31 (10.2%) |
Race in Bridgeport
The most populous races in Bridgeport are White / Caucasian (4,985 | 82.5%), Hispanic or Latino (2,252 | 37.3%), and Some other Race (306 | 5.1%).
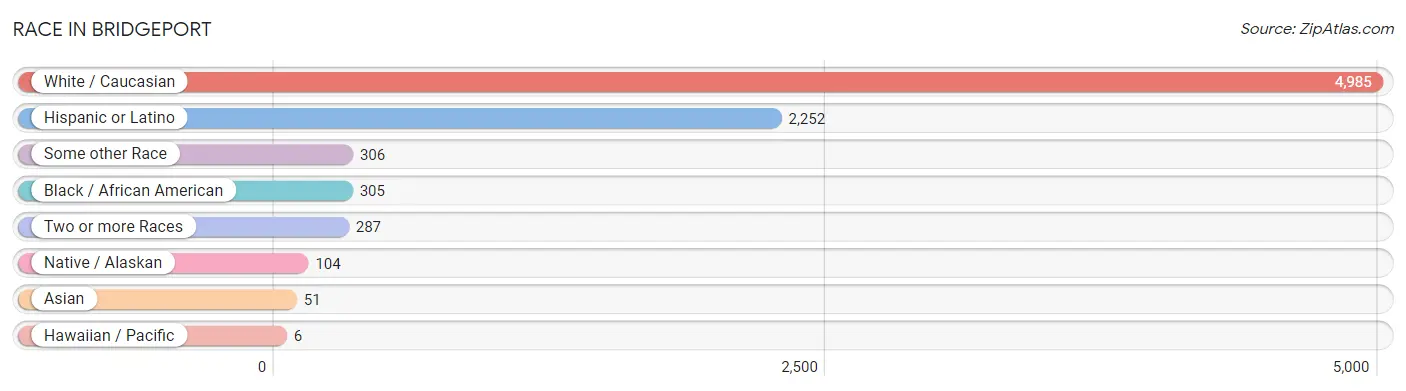
| Race | # Population | % Population |
| Asian | 51 | 0.8% |
| Black / African American | 305 | 5.1% |
| Hawaiian / Pacific | 6 | 0.1% |
| Hispanic or Latino | 2,252 | 37.3% |
| Native / Alaskan | 104 | 1.7% |
| White / Caucasian | 4,985 | 82.5% |
| Two or more Races | 287 | 4.8% |
| Some other Race | 306 | 5.1% |
| Total | 6,044 | 100.0% |
Ancestry in Bridgeport
The most populous ancestries reported in Bridgeport are Mexican (2,169 | 35.9%), German (777 | 12.9%), English (396 | 6.6%), Irish (325 | 5.4%), and Scotch-Irish (299 | 5.0%), together accounting for 65.6% of all Bridgeport residents.
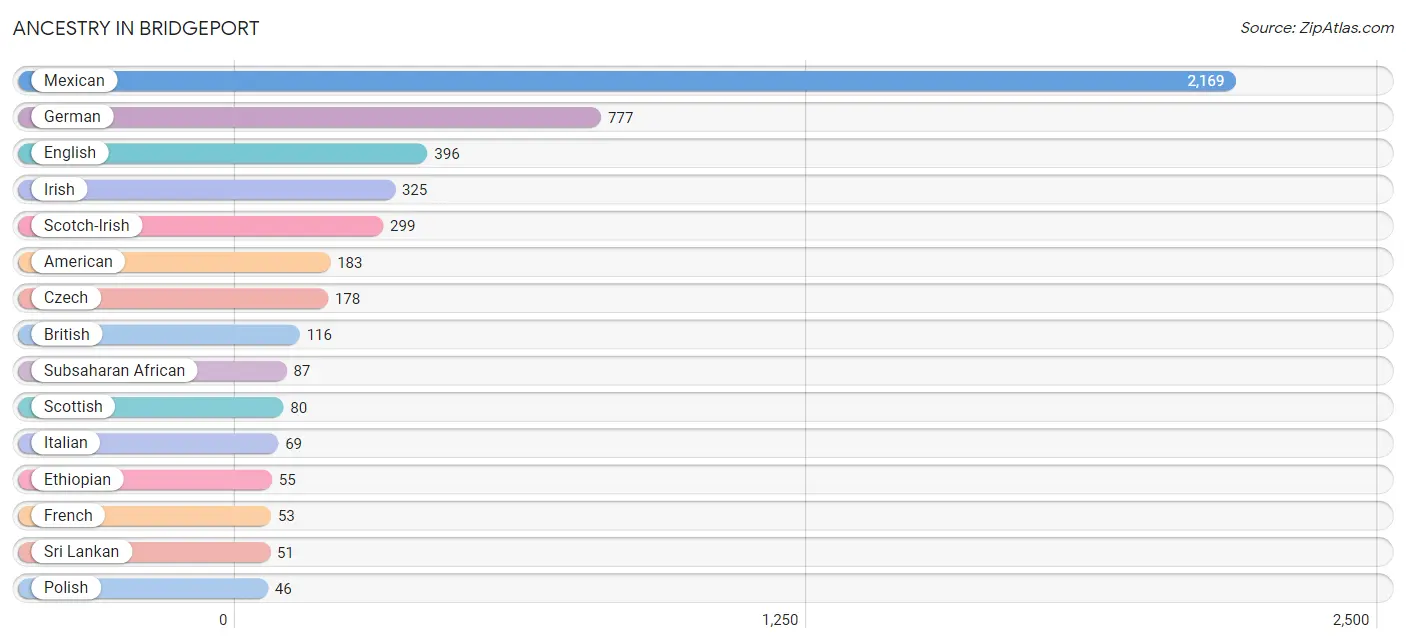
| Ancestry | # Population | % Population |
| African | 32 | 0.5% |
| Alaska Native | 5 | 0.1% |
| American | 183 | 3.0% |
| British | 116 | 1.9% |
| Central American | 12 | 0.2% |
| Cherokee | 40 | 0.7% |
| Czech | 178 | 2.9% |
| Czechoslovakian | 36 | 0.6% |
| Dutch | 7 | 0.1% |
| Dutch West Indian | 28 | 0.5% |
| Eastern European | 25 | 0.4% |
| Ecuadorian | 33 | 0.5% |
| English | 396 | 6.6% |
| Ethiopian | 55 | 0.9% |
| French | 53 | 0.9% |
| German | 777 | 12.9% |
| Guatemalan | 12 | 0.2% |
| Hungarian | 7 | 0.1% |
| Irish | 325 | 5.4% |
| Italian | 69 | 1.1% |
| Mexican | 2,169 | 35.9% |
| Norwegian | 39 | 0.6% |
| Polish | 46 | 0.8% |
| Potawatomi | 10 | 0.2% |
| Puerto Rican | 17 | 0.3% |
| Samoan | 6 | 0.1% |
| Scandinavian | 15 | 0.3% |
| Scotch-Irish | 299 | 5.0% |
| Scottish | 80 | 1.3% |
| South American | 33 | 0.5% |
| Spanish | 15 | 0.3% |
| Sri Lankan | 51 | 0.8% |
| Subsaharan African | 87 | 1.4% |
| Swedish | 5 | 0.1% | View All 34 Rows |
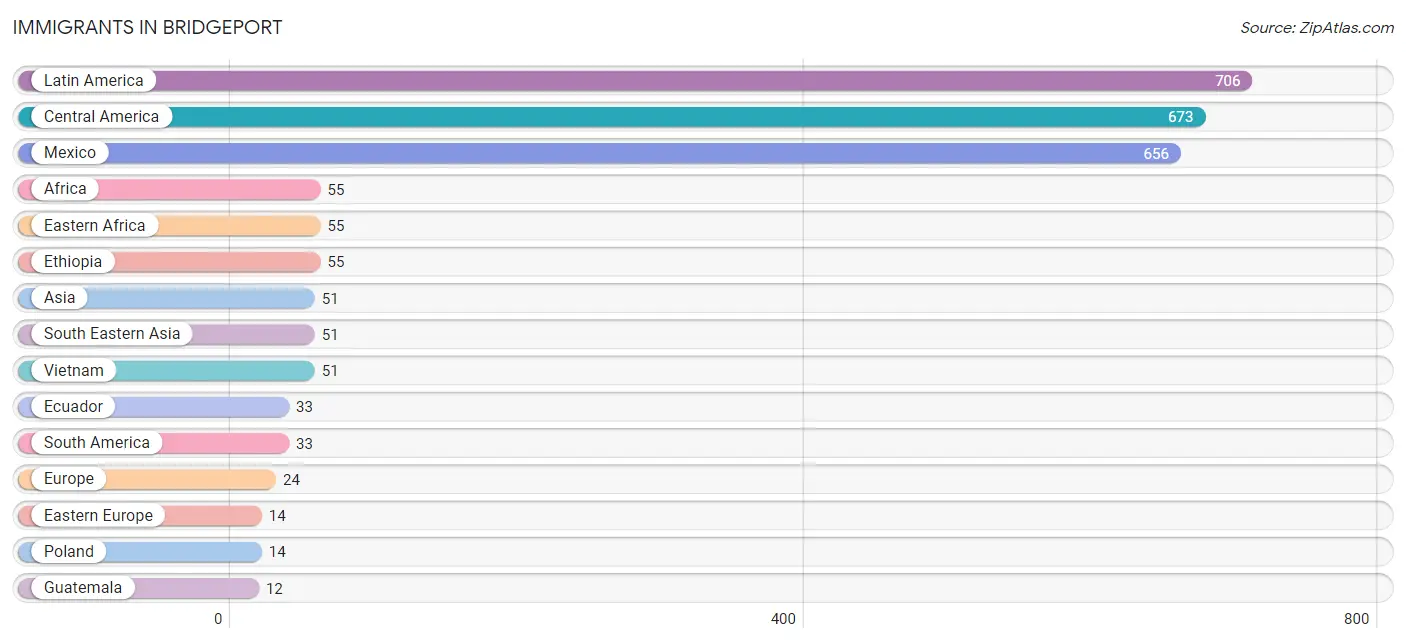
Immigrants in Bridgeport
The most numerous immigrant groups reported in Bridgeport came from Latin America (706 | 11.7%), Central America (673 | 11.1%), Mexico (656 | 10.8%), Africa (55 | 0.9%), and Eastern Africa (55 | 0.9%), together accounting for 35.5% of all Bridgeport residents.
| Immigration Origin | # Population | % Population |
| Africa | 55 | 0.9% |
| Asia | 51 | 0.8% |
| Central America | 673 | 11.1% |
| Eastern Africa | 55 | 0.9% |
| Eastern Europe | 14 | 0.2% |
| Ecuador | 33 | 0.5% |
| El Salvador | 5 | 0.1% |
| Ethiopia | 55 | 0.9% |
| Europe | 24 | 0.4% |
| Germany | 10 | 0.2% |
| Guatemala | 12 | 0.2% |
| Latin America | 706 | 11.7% |
| Mexico | 656 | 10.8% |
| Poland | 14 | 0.2% |
| South America | 33 | 0.5% |
| South Eastern Asia | 51 | 0.8% |
| Vietnam | 51 | 0.8% |
| Western Europe | 10 | 0.2% | View All 18 Rows |
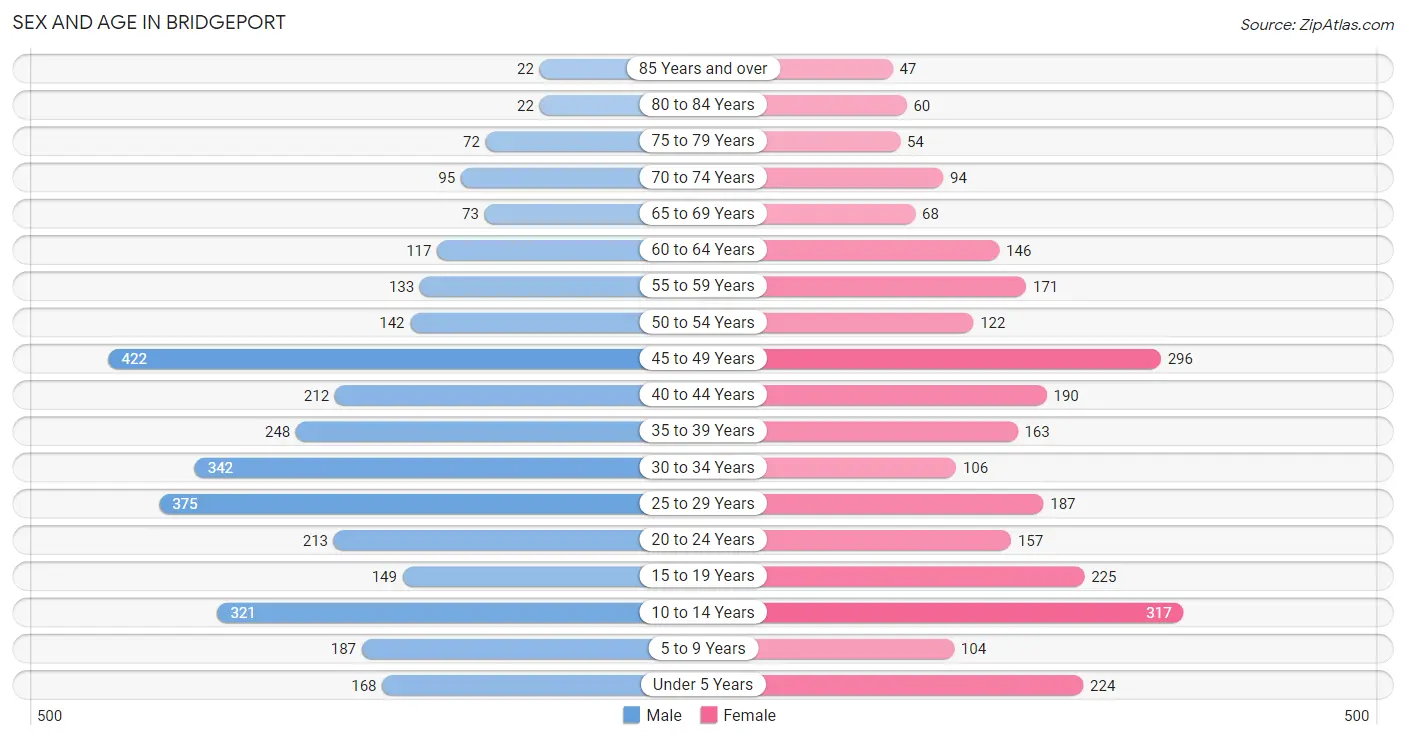
Sex and Age in Bridgeport
Sex and Age in Bridgeport
The most populous age groups in Bridgeport are 45 to 49 Years (422 | 12.7%) for men and 10 to 14 Years (317 | 11.6%) for women.
| Age Bracket | Male | Female |
| Under 5 Years | 168 (5.1%) | 224 (8.2%) |
| 5 to 9 Years | 187 (5.6%) | 104 (3.8%) |
| 10 to 14 Years | 321 (9.7%) | 317 (11.6%) |
| 15 to 19 Years | 149 (4.5%) | 225 (8.2%) |
| 20 to 24 Years | 213 (6.4%) | 157 (5.8%) |
| 25 to 29 Years | 375 (11.3%) | 187 (6.9%) |
| 30 to 34 Years | 342 (10.3%) | 106 (3.9%) |
| 35 to 39 Years | 248 (7.5%) | 163 (6.0%) |
| 40 to 44 Years | 212 (6.4%) | 190 (7.0%) |
| 45 to 49 Years | 422 (12.7%) | 296 (10.8%) |
| 50 to 54 Years | 142 (4.3%) | 122 (4.5%) |
| 55 to 59 Years | 133 (4.0%) | 171 (6.3%) |
| 60 to 64 Years | 117 (3.5%) | 146 (5.3%) |
| 65 to 69 Years | 73 (2.2%) | 68 (2.5%) |
| 70 to 74 Years | 95 (2.9%) | 94 (3.4%) |
| 75 to 79 Years | 72 (2.2%) | 54 (2.0%) |
| 80 to 84 Years | 22 (0.7%) | 60 (2.2%) |
| 85 Years and over | 22 (0.7%) | 47 (1.7%) |
| Total | 3,313 (100.0%) | 2,731 (100.0%) |
Families and Households in Bridgeport
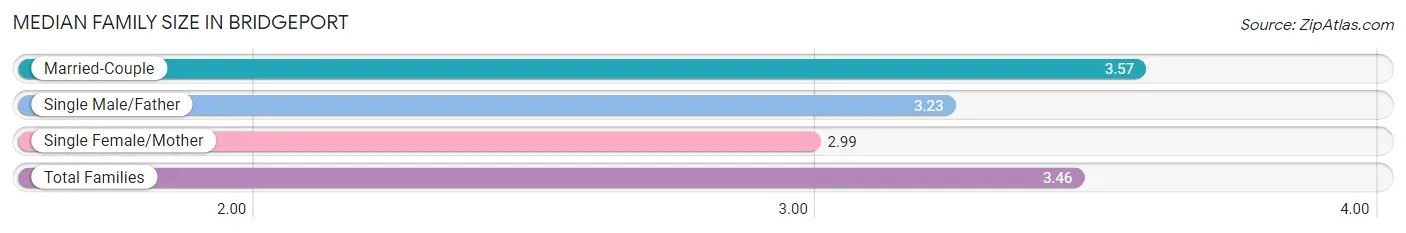
Median Family Size in Bridgeport
The median family size in Bridgeport is 3.46 persons per family, with married-couple families (1,071 | 77.9%) accounting for the largest median family size of 3.57 persons per family. On the other hand, single female/mother families (204 | 14.8%) represent the smallest median family size with 2.99 persons per family.
| Family Type | # Families | Family Size |
| Married-Couple | 1,071 (77.9%) | 3.57 |
| Single Male/Father | 99 (7.2%) | 3.23 |
| Single Female/Mother | 204 (14.8%) | 2.99 |
| Total Families | 1,374 (100.0%) | 3.46 |
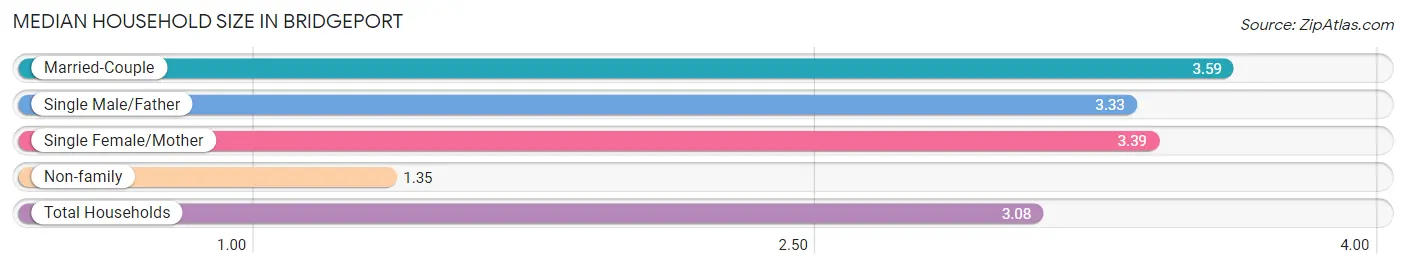
Median Household Size in Bridgeport
The median household size in Bridgeport is 3.08 persons per household, with married-couple households (1,071 | 61.3%) accounting for the largest median household size of 3.59 persons per household. non-family households (373 | 21.3%) represent the smallest median household size with 1.35 persons per household.
| Household Type | # Households | Household Size |
| Married-Couple | 1,071 (61.3%) | 3.59 |
| Single Male/Father | 99 (5.7%) | 3.33 |
| Single Female/Mother | 204 (11.7%) | 3.39 |
| Non-family | 373 (21.3%) | 1.35 |
| Total Households | 1,747 (100.0%) | 3.08 |
Household Size by Marriage Status in Bridgeport
Out of a total of 1,747 households in Bridgeport, 1,374 (78.6%) are family households, while 373 (21.3%) are nonfamily households. The most numerous type of family households are 2-person households, comprising 554, and the most common type of nonfamily households are 1-person households, comprising 321.
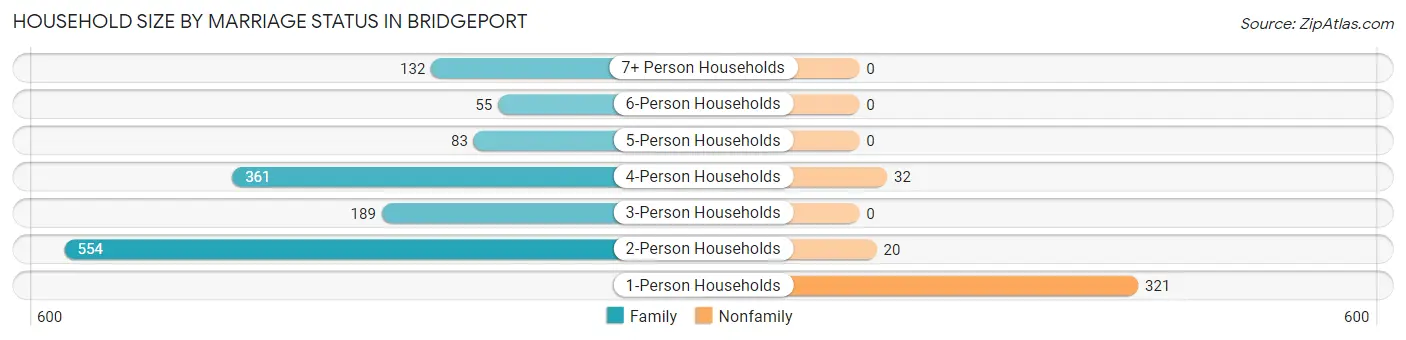
| Household Size | Family Households | Nonfamily Households |
| 1-Person Households | - | 321 (18.4%) |
| 2-Person Households | 554 (31.7%) | 20 (1.1%) |
| 3-Person Households | 189 (10.8%) | 0 (0.0%) |
| 4-Person Households | 361 (20.7%) | 32 (1.8%) |
| 5-Person Households | 83 (4.8%) | 0 (0.0%) |
| 6-Person Households | 55 (3.2%) | 0 (0.0%) |
| 7+ Person Households | 132 (7.6%) | 0 (0.0%) |
| Total | 1,374 (78.6%) | 373 (21.3%) |
Female Fertility in Bridgeport
Fertility by Age in Bridgeport
Average fertility rate in Bridgeport is 89.0 births per 1,000 women. Women in the age bracket of 20 to 34 years have the highest fertility rate with 138.0 births per 1,000 women. Women in the age bracket of 20 to 34 years acount for 50.8% of all women with births.
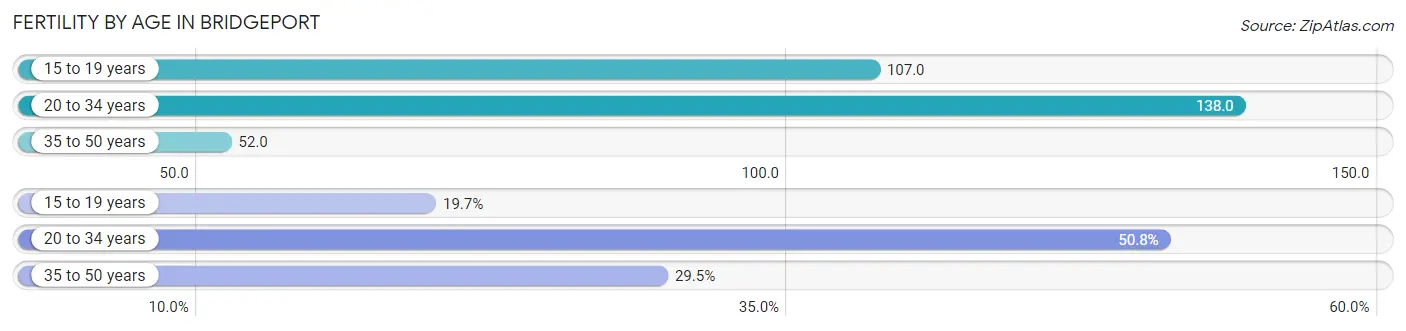
| Age Bracket | Women with Births | Births / 1,000 Women |
| 15 to 19 years | 24 (19.7%) | 107.0 |
| 20 to 34 years | 62 (50.8%) | 138.0 |
| 35 to 50 years | 36 (29.5%) | 52.0 |
| Total | 122 (100.0%) | 89.0 |
Fertility by Age by Marriage Status in Bridgeport
69.7% of women with births (122) in Bridgeport are married. The highest percentage of unmarried women with births falls into 20 to 34 years age bracket with 59.7% of them unmarried at the time of birth, while the lowest percentage of unmarried women with births belong to 15 to 19 years age bracket with 0.0% of them unmarried.
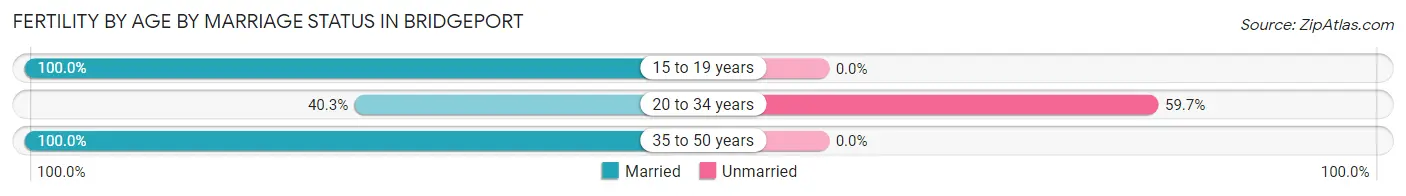
| Age Bracket | Married | Unmarried |
| 15 to 19 years | 24 (100.0%) | 0 (0.0%) |
| 20 to 34 years | 25 (40.3%) | 37 (59.7%) |
| 35 to 50 years | 36 (100.0%) | 0 (0.0%) |
| Total | 85 (69.7%) | 37 (30.3%) |
Fertility by Education in Bridgeport
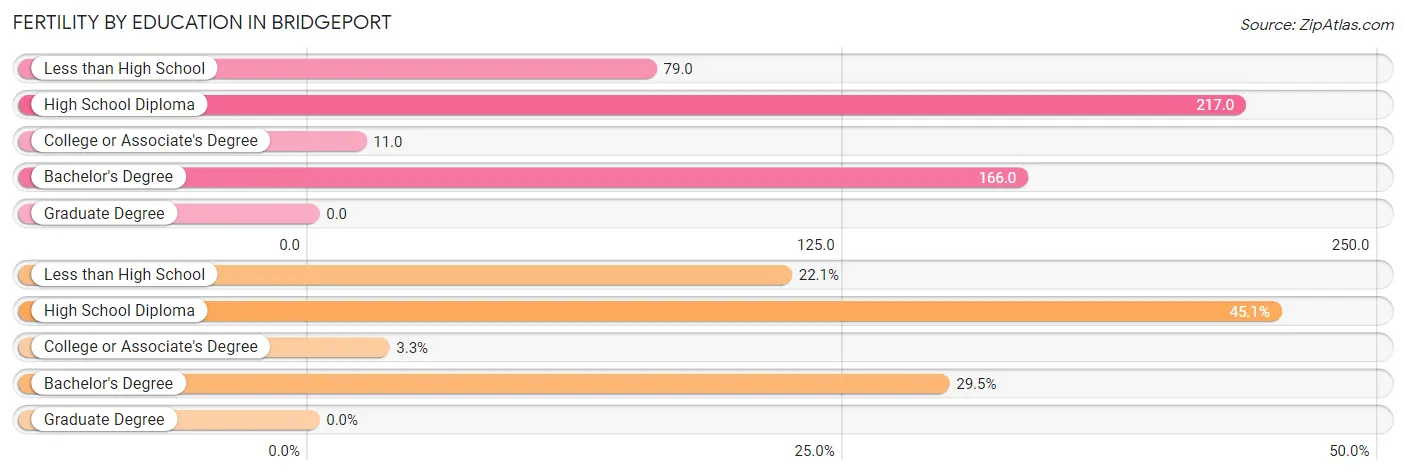
| Educational Attainment | Women with Births | Births / 1,000 Women |
| Less than High School | 27 (22.1%) | 79.0 |
| High School Diploma | 55 (45.1%) | 217.0 |
| College or Associate's Degree | 4 (3.3%) | 11.0 |
| Bachelor's Degree | 36 (29.5%) | 166.0 |
| Graduate Degree | 0 (0.0%) | 0.0 |
| Total | 122 (100.0%) | 89.0 |
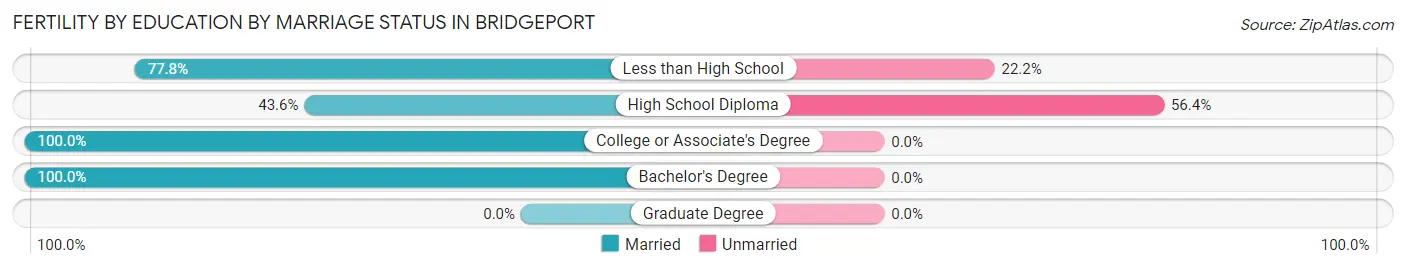
Fertility by Education by Marriage Status in Bridgeport
30.3% of women with births in Bridgeport are unmarried. Women with the educational attainment of college or associate's degree are most likely to be married with 100.0% of them married at childbirth, while women with the educational attainment of high school diploma are least likely to be married with 56.4% of them unmarried at childbirth.
| Educational Attainment | Married | Unmarried |
| Less than High School | 21 (77.8%) | 6 (22.2%) |
| High School Diploma | 24 (43.6%) | 31 (56.4%) |
| College or Associate's Degree | 4 (100.0%) | 0 (0.0%) |
| Bachelor's Degree | 36 (100.0%) | 0 (0.0%) |
| Graduate Degree | 0 (0.0%) | 0 (0.0%) |
| Total | 85 (69.7%) | 37 (30.3%) |
Employment Characteristics in Bridgeport
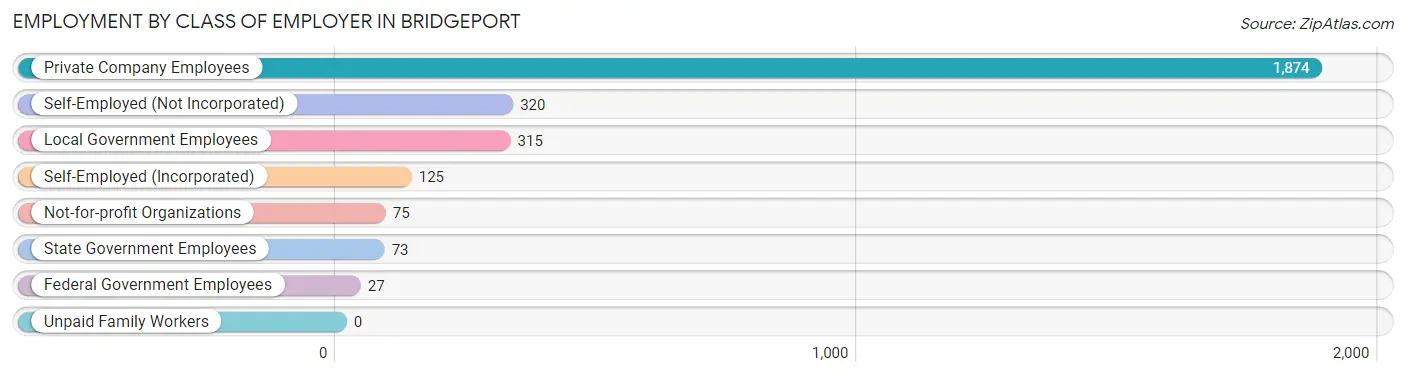
Employment by Class of Employer in Bridgeport
Among the 2,809 employed individuals in Bridgeport, private company employees (1,874 | 66.7%), self-employed (not incorporated) (320 | 11.4%), and local government employees (315 | 11.2%) make up the most common classes of employment.
| Employer Class | # Employees | % Employees |
| Private Company Employees | 1,874 | 66.7% |
| Self-Employed (Incorporated) | 125 | 4.4% |
| Self-Employed (Not Incorporated) | 320 | 11.4% |
| Not-for-profit Organizations | 75 | 2.7% |
| Local Government Employees | 315 | 11.2% |
| State Government Employees | 73 | 2.6% |
| Federal Government Employees | 27 | 1.0% |
| Unpaid Family Workers | 0 | 0.0% |
| Total | 2,809 | 100.0% |
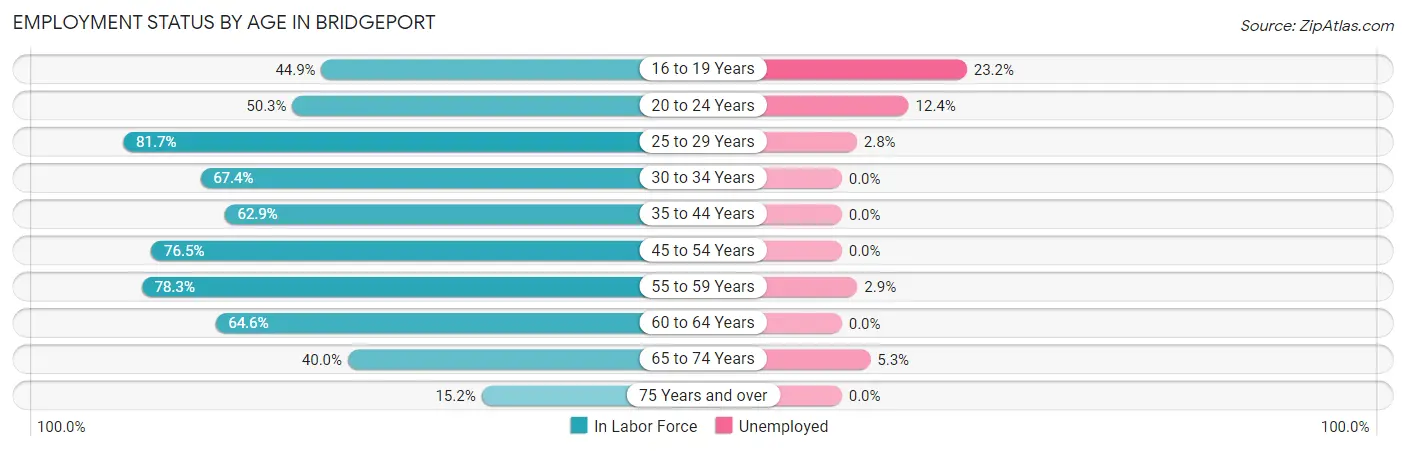
Employment Status by Age in Bridgeport
According to the labor force statistics for Bridgeport, out of the total population over 16 years of age (4,685), 62.8% or 2,942 individuals are in the labor force, with 2.9% or 85 of them unemployed. The age group with the highest labor force participation rate is 25 to 29 years, with 81.7% or 459 individuals in the labor force. Within the labor force, the 16 to 19 years age range has the highest percentage of unemployed individuals, with 23.2% or 35 of them being unemployed.
| Age Bracket | In Labor Force | Unemployed |
| 16 to 19 Years | 151 (44.9%) | 35 (23.2%) |
| 20 to 24 Years | 186 (50.3%) | 23 (12.4%) |
| 25 to 29 Years | 459 (81.7%) | 13 (2.8%) |
| 30 to 34 Years | 302 (67.4%) | 0 (0.0%) |
| 35 to 44 Years | 511 (62.9%) | 0 (0.0%) |
| 45 to 54 Years | 751 (76.5%) | 0 (0.0%) |
| 55 to 59 Years | 238 (78.3%) | 7 (2.9%) |
| 60 to 64 Years | 170 (64.6%) | 0 (0.0%) |
| 65 to 74 Years | 132 (40.0%) | 7 (5.3%) |
| 75 Years and over | 42 (15.2%) | 0 (0.0%) |
| Total | 2,942 (62.8%) | 85 (2.9%) |
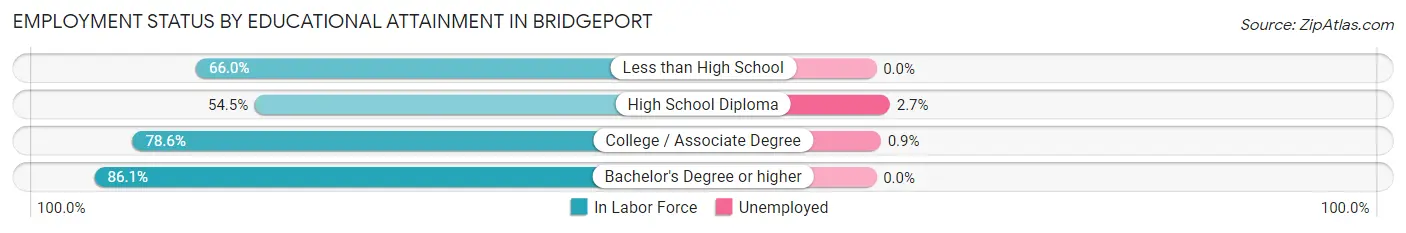
Employment Status by Educational Attainment in Bridgeport
According to labor force statistics for Bridgeport, 72.1% of individuals (2,431) out of the total population between 25 and 64 years of age (3,372) are in the labor force, with 0.8% or 19 of them being unemployed. The group with the highest labor force participation rate are those with the educational attainment of bachelor's degree or higher, with 86.1% or 754 individuals in the labor force. Within the labor force, individuals with high school diploma education have the highest percentage of unemployment, with 2.7% or 13 of them being unemployed.
| Educational Attainment | In Labor Force | Unemployed |
| Less than High School | 369 (66.0%) | 0 (0.0%) |
| High School Diploma | 487 (54.5%) | 24 (2.7%) |
| College / Associate Degree | 821 (78.6%) | 9 (0.9%) |
| Bachelor's Degree or higher | 754 (86.1%) | 0 (0.0%) |
| Total | 2,431 (72.1%) | 27 (0.8%) |
Employment Occupations by Sex in Bridgeport
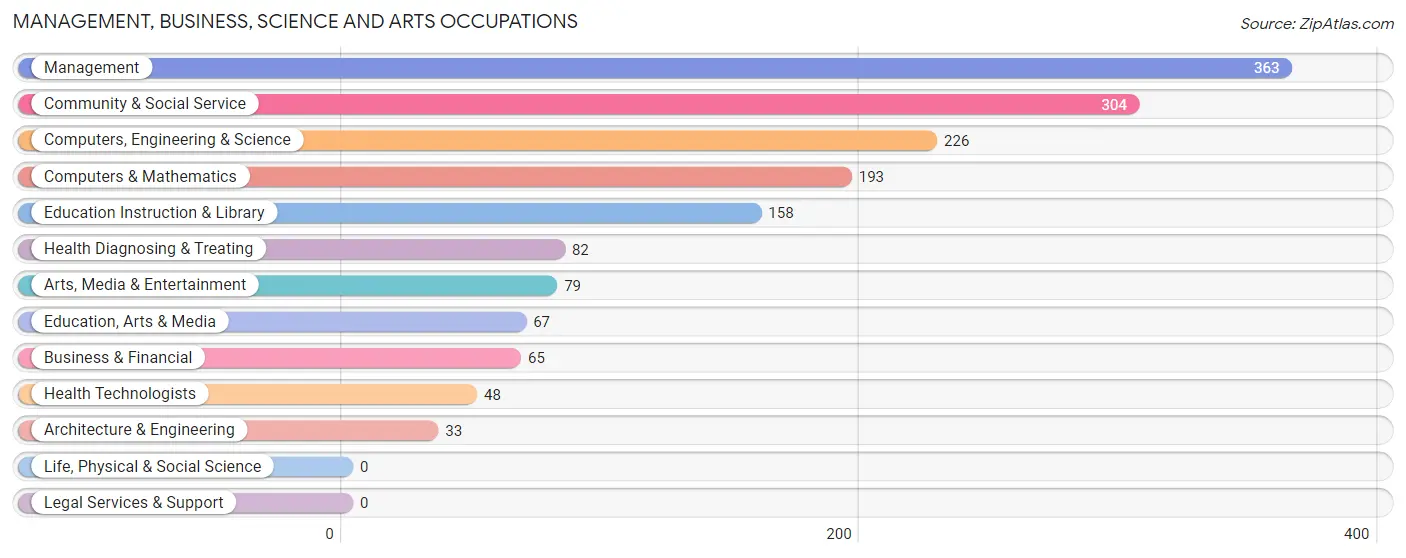
Management, Business, Science and Arts Occupations
The most common Management, Business, Science and Arts occupations in Bridgeport are Management (363 | 12.7%), Community & Social Service (304 | 10.6%), Computers, Engineering & Science (226 | 7.9%), Computers & Mathematics (193 | 6.8%), and Education Instruction & Library (158 | 5.5%).
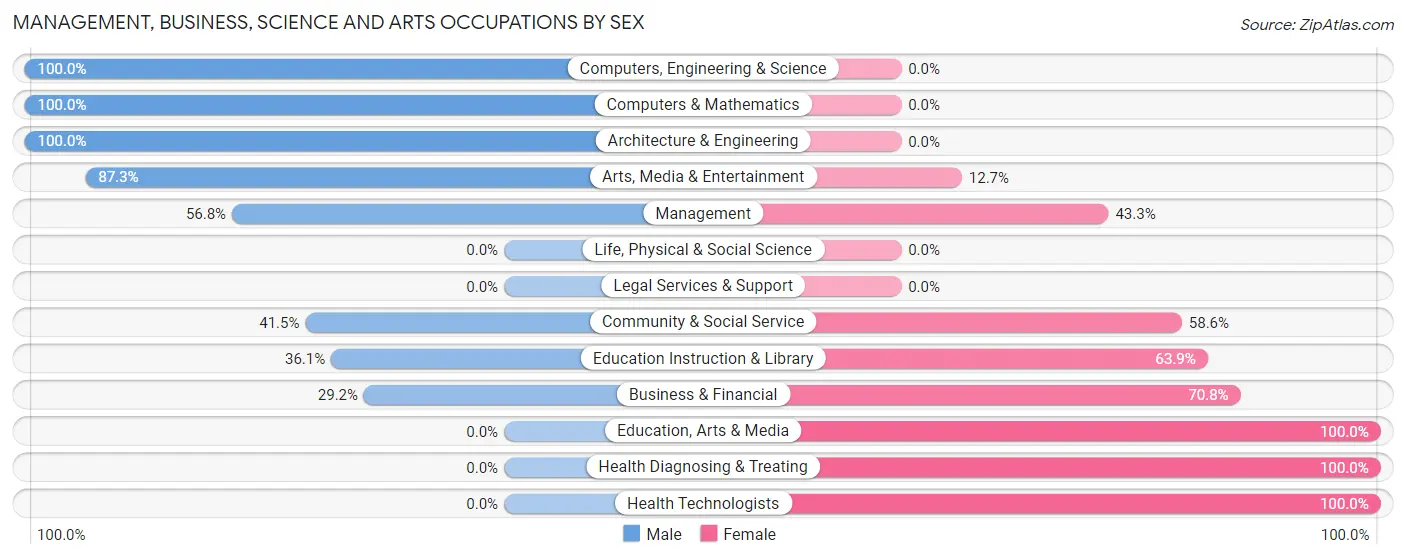
Management, Business, Science and Arts Occupations by Sex
Within the Management, Business, Science and Arts occupations in Bridgeport, the most male-oriented occupations are Computers, Engineering & Science (100.0%), Computers & Mathematics (100.0%), and Architecture & Engineering (100.0%), while the most female-oriented occupations are Education, Arts & Media (100.0%), Health Diagnosing & Treating (100.0%), and Health Technologists (100.0%).
| Occupation | Male | Female |
| Management | 206 (56.8%) | 157 (43.2%) |
| Business & Financial | 19 (29.2%) | 46 (70.8%) |
| Computers, Engineering & Science | 226 (100.0%) | 0 (0.0%) |
| Computers & Mathematics | 193 (100.0%) | 0 (0.0%) |
| Architecture & Engineering | 33 (100.0%) | 0 (0.0%) |
| Life, Physical & Social Science | 0 (0.0%) | 0 (0.0%) |
| Community & Social Service | 126 (41.4%) | 178 (58.6%) |
| Education, Arts & Media | 0 (0.0%) | 67 (100.0%) |
| Legal Services & Support | 0 (0.0%) | 0 (0.0%) |
| Education Instruction & Library | 57 (36.1%) | 101 (63.9%) |
| Arts, Media & Entertainment | 69 (87.3%) | 10 (12.7%) |
| Health Diagnosing & Treating | 0 (0.0%) | 82 (100.0%) |
| Health Technologists | 0 (0.0%) | 48 (100.0%) |
| Total (Category) | 577 (55.5%) | 463 (44.5%) |
| Total (Overall) | 1,645 (57.6%) | 1,212 (42.4%) |
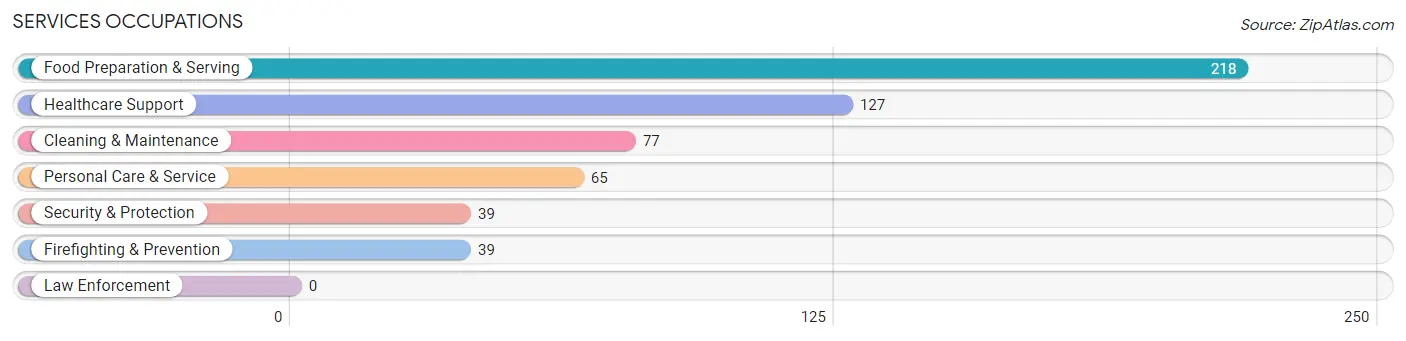
Services Occupations
The most common Services occupations in Bridgeport are Food Preparation & Serving (218 | 7.6%), Healthcare Support (127 | 4.4%), Cleaning & Maintenance (77 | 2.7%), Personal Care & Service (65 | 2.3%), and Security & Protection (39 | 1.4%).
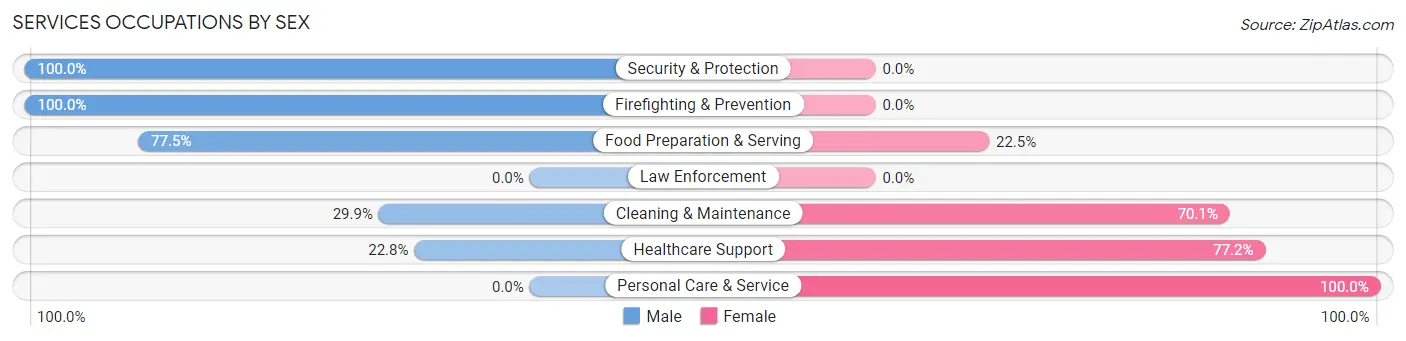
Services Occupations by Sex
Within the Services occupations in Bridgeport, the most male-oriented occupations are Security & Protection (100.0%), Firefighting & Prevention (100.0%), and Food Preparation & Serving (77.5%), while the most female-oriented occupations are Personal Care & Service (100.0%), Healthcare Support (77.2%), and Cleaning & Maintenance (70.1%).
| Occupation | Male | Female |
| Healthcare Support | 29 (22.8%) | 98 (77.2%) |
| Security & Protection | 39 (100.0%) | 0 (0.0%) |
| Firefighting & Prevention | 39 (100.0%) | 0 (0.0%) |
| Law Enforcement | 0 (0.0%) | 0 (0.0%) |
| Food Preparation & Serving | 169 (77.5%) | 49 (22.5%) |
| Cleaning & Maintenance | 23 (29.9%) | 54 (70.1%) |
| Personal Care & Service | 0 (0.0%) | 65 (100.0%) |
| Total (Category) | 260 (49.4%) | 266 (50.6%) |
| Total (Overall) | 1,645 (57.6%) | 1,212 (42.4%) |
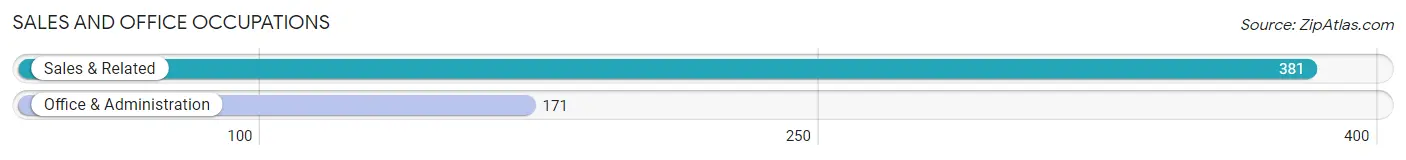
Sales and Office Occupations
The most common Sales and Office occupations in Bridgeport are Sales & Related (381 | 13.3%), and Office & Administration (171 | 6.0%).
Sales and Office Occupations by Sex
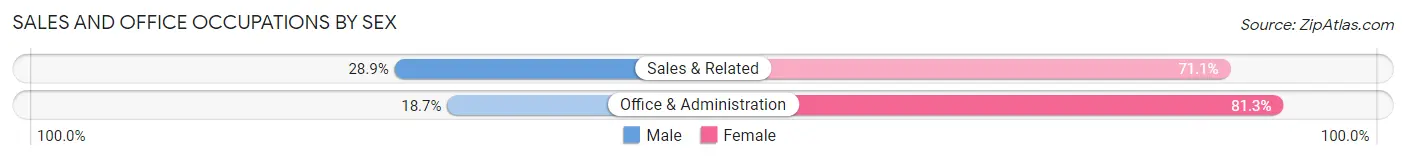
| Occupation | Male | Female |
| Sales & Related | 110 (28.9%) | 271 (71.1%) |
| Office & Administration | 32 (18.7%) | 139 (81.3%) |
| Total (Category) | 142 (25.7%) | 410 (74.3%) |
| Total (Overall) | 1,645 (57.6%) | 1,212 (42.4%) |
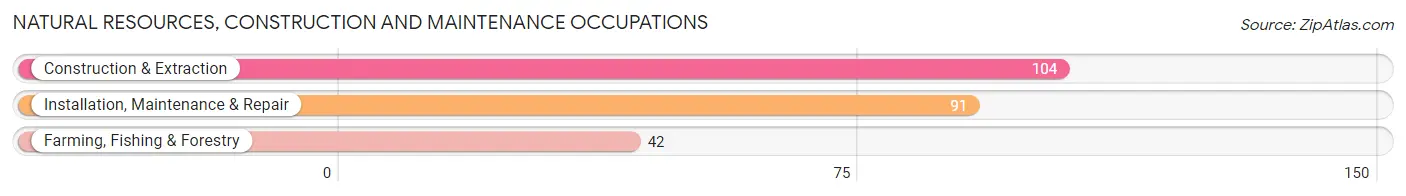
Natural Resources, Construction and Maintenance Occupations
The most common Natural Resources, Construction and Maintenance occupations in Bridgeport are Construction & Extraction (104 | 3.6%), Installation, Maintenance & Repair (91 | 3.2%), and Farming, Fishing & Forestry (42 | 1.5%).
Natural Resources, Construction and Maintenance Occupations by Sex
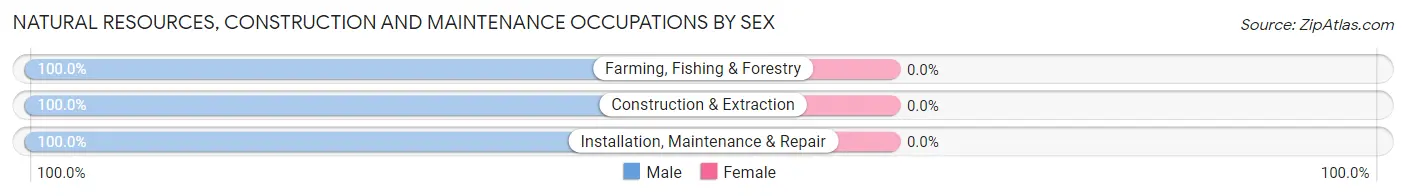
| Occupation | Male | Female |
| Farming, Fishing & Forestry | 42 (100.0%) | 0 (0.0%) |
| Construction & Extraction | 104 (100.0%) | 0 (0.0%) |
| Installation, Maintenance & Repair | 91 (100.0%) | 0 (0.0%) |
| Total (Category) | 237 (100.0%) | 0 (0.0%) |
| Total (Overall) | 1,645 (57.6%) | 1,212 (42.4%) |
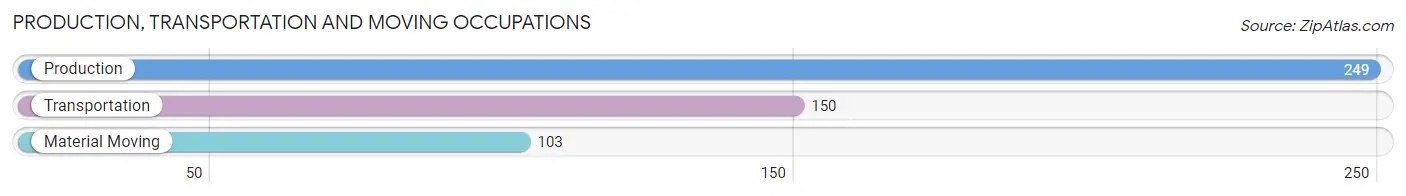
Production, Transportation and Moving Occupations
The most common Production, Transportation and Moving occupations in Bridgeport are Production (249 | 8.7%), Transportation (150 | 5.2%), and Material Moving (103 | 3.6%).
Production, Transportation and Moving Occupations by Sex
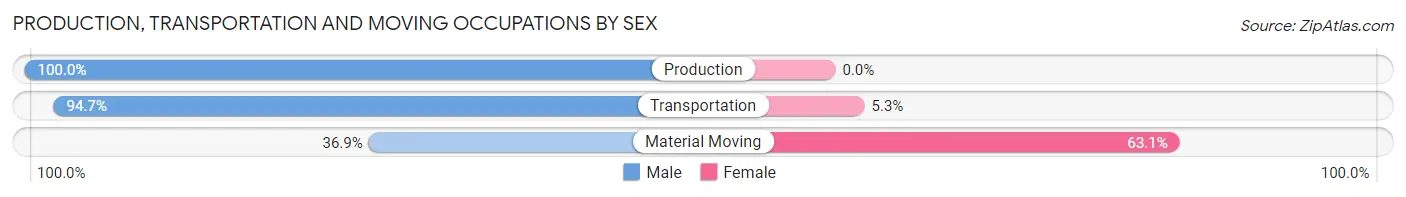
| Occupation | Male | Female |
| Production | 249 (100.0%) | 0 (0.0%) |
| Transportation | 142 (94.7%) | 8 (5.3%) |
| Material Moving | 38 (36.9%) | 65 (63.1%) |
| Total (Category) | 429 (85.5%) | 73 (14.5%) |
| Total (Overall) | 1,645 (57.6%) | 1,212 (42.4%) |
Employment Industries by Sex in Bridgeport
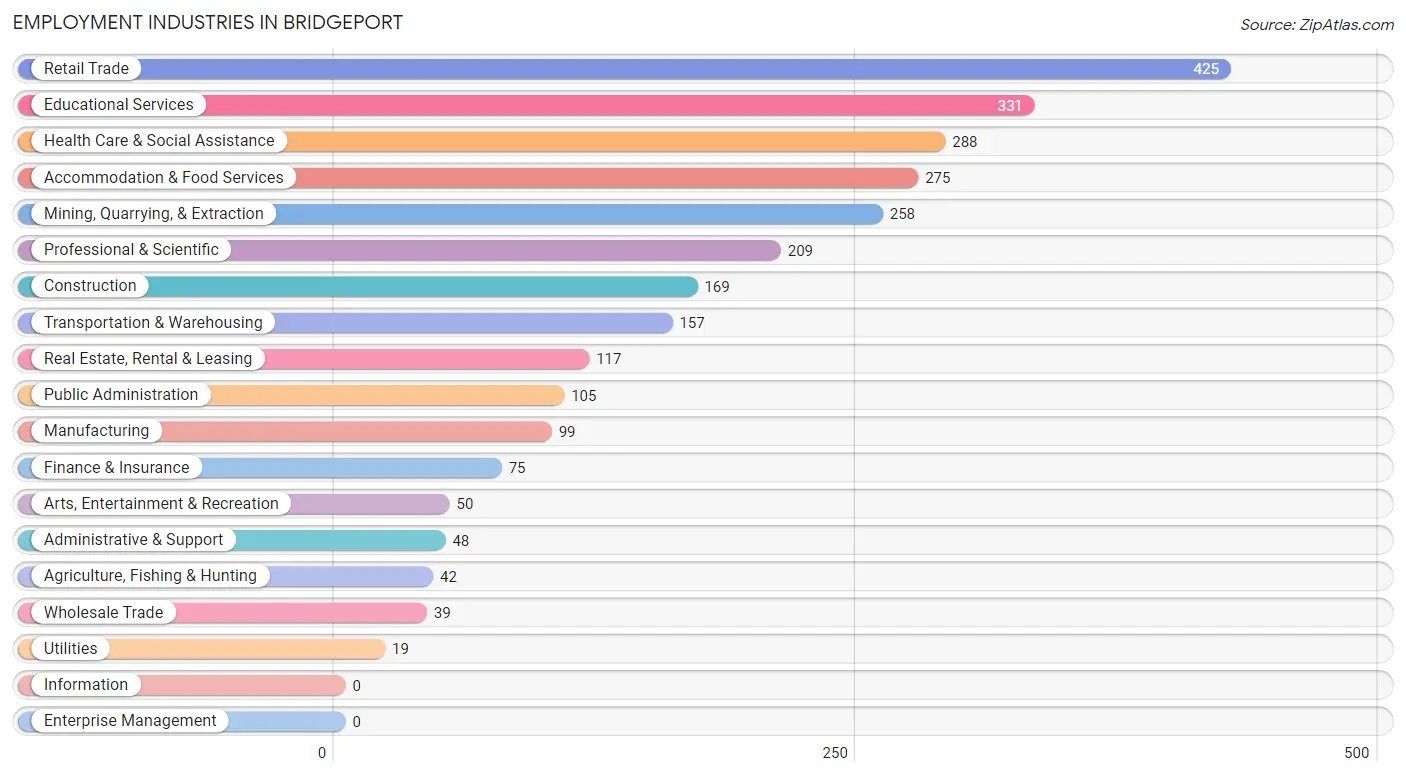
Employment Industries in Bridgeport
The major employment industries in Bridgeport include Retail Trade (425 | 14.9%), Educational Services (331 | 11.6%), Health Care & Social Assistance (288 | 10.1%), Accommodation & Food Services (275 | 9.6%), and Mining, Quarrying, & Extraction (258 | 9.0%).
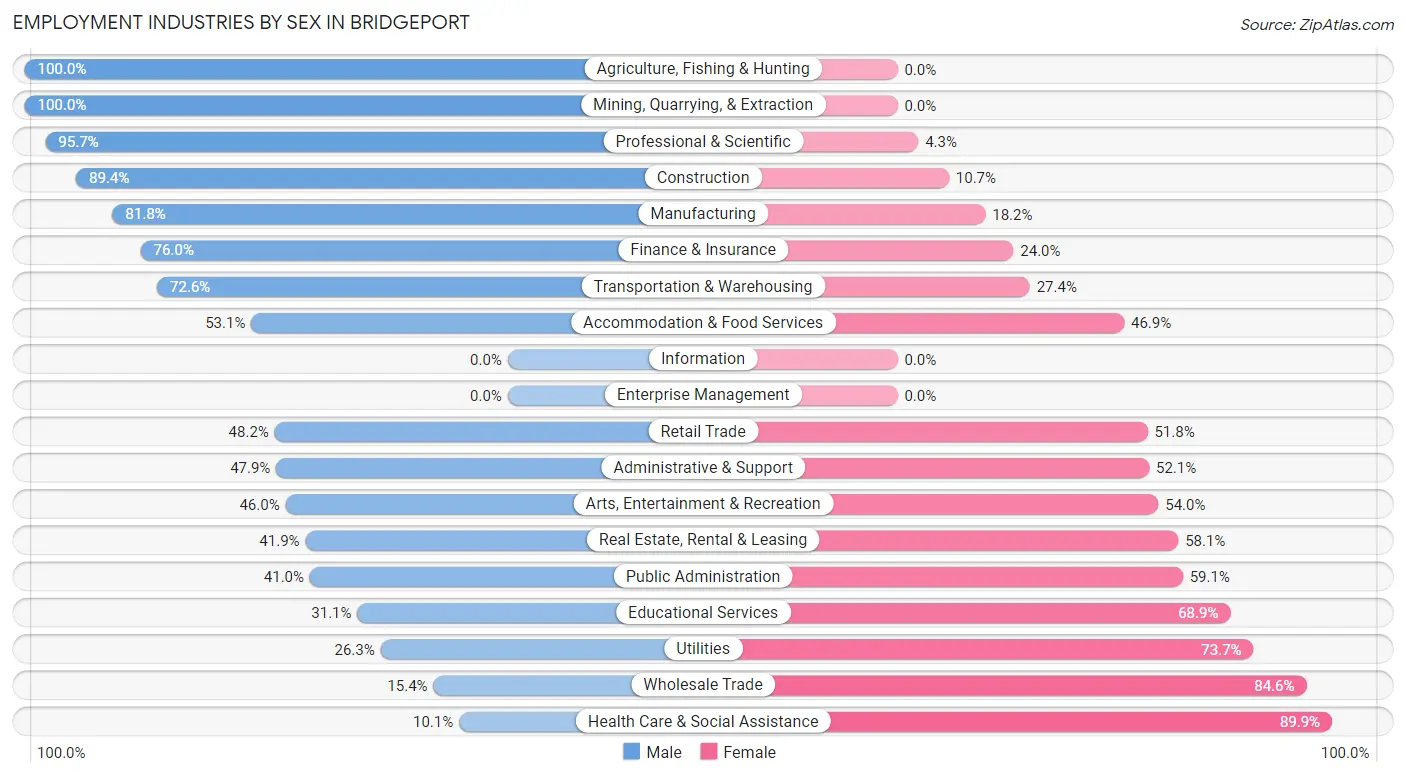
Employment Industries by Sex in Bridgeport
The Bridgeport industries that see more men than women are Agriculture, Fishing & Hunting (100.0%), Mining, Quarrying, & Extraction (100.0%), and Professional & Scientific (95.7%), whereas the industries that tend to have a higher number of women are Health Care & Social Assistance (89.9%), Wholesale Trade (84.6%), and Utilities (73.7%).
| Industry | Male | Female |
| Agriculture, Fishing & Hunting | 42 (100.0%) | 0 (0.0%) |
| Mining, Quarrying, & Extraction | 258 (100.0%) | 0 (0.0%) |
| Construction | 151 (89.3%) | 18 (10.6%) |
| Manufacturing | 81 (81.8%) | 18 (18.2%) |
| Wholesale Trade | 6 (15.4%) | 33 (84.6%) |
| Retail Trade | 205 (48.2%) | 220 (51.8%) |
| Transportation & Warehousing | 114 (72.6%) | 43 (27.4%) |
| Utilities | 5 (26.3%) | 14 (73.7%) |
| Information | 0 (0.0%) | 0 (0.0%) |
| Finance & Insurance | 57 (76.0%) | 18 (24.0%) |
| Real Estate, Rental & Leasing | 49 (41.9%) | 68 (58.1%) |
| Professional & Scientific | 200 (95.7%) | 9 (4.3%) |
| Enterprise Management | 0 (0.0%) | 0 (0.0%) |
| Administrative & Support | 23 (47.9%) | 25 (52.1%) |
| Educational Services | 103 (31.1%) | 228 (68.9%) |
| Health Care & Social Assistance | 29 (10.1%) | 259 (89.9%) |
| Arts, Entertainment & Recreation | 23 (46.0%) | 27 (54.0%) |
| Accommodation & Food Services | 146 (53.1%) | 129 (46.9%) |
| Public Administration | 43 (40.9%) | 62 (59.1%) |
| Total | 1,645 (57.6%) | 1,212 (42.4%) |
Education in Bridgeport
School Enrollment in Bridgeport
The most common levels of schooling among the 1,531 students in Bridgeport are middle school (540 | 35.3%), high school (447 | 29.2%), and elementary school (292 | 19.1%).
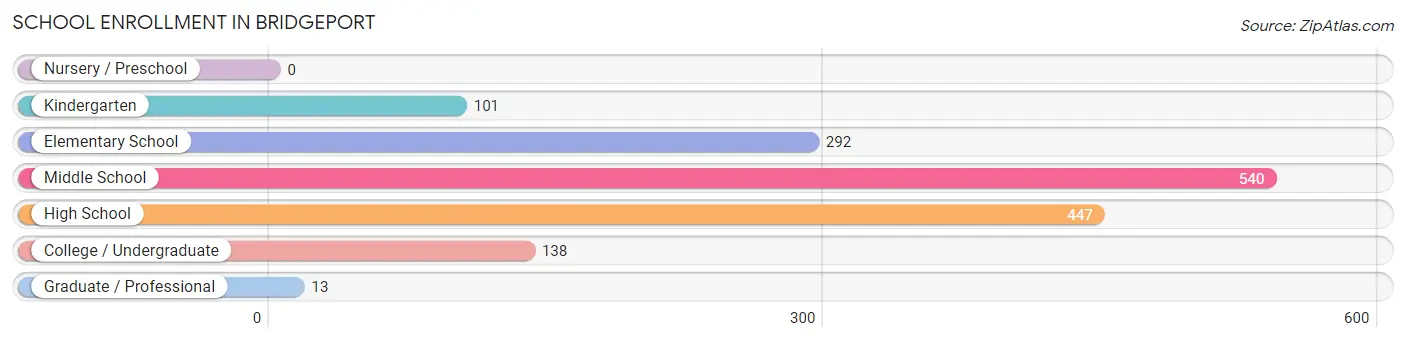
| School Level | # Students | % Students |
| Nursery / Preschool | 0 | 0.0% |
| Kindergarten | 101 | 6.6% |
| Elementary School | 292 | 19.1% |
| Middle School | 540 | 35.3% |
| High School | 447 | 29.2% |
| College / Undergraduate | 138 | 9.0% |
| Graduate / Professional | 13 | 0.9% |
| Total | 1,531 | 100.0% |
School Enrollment by Age by Funding Source in Bridgeport
Out of a total of 1,531 students who are enrolled in schools in Bridgeport, 392 (25.6%) attend a private institution, while the remaining 1,139 (74.4%) are enrolled in public schools. The age group of 10 to 14 year olds has the highest likelihood of being enrolled in private schools, with 257 (40.3% in the age bracket) enrolled. Conversely, the age group of 20 to 24 year olds has the lowest likelihood of being enrolled in a private school, with 195 (100.0% in the age bracket) attending a public institution.
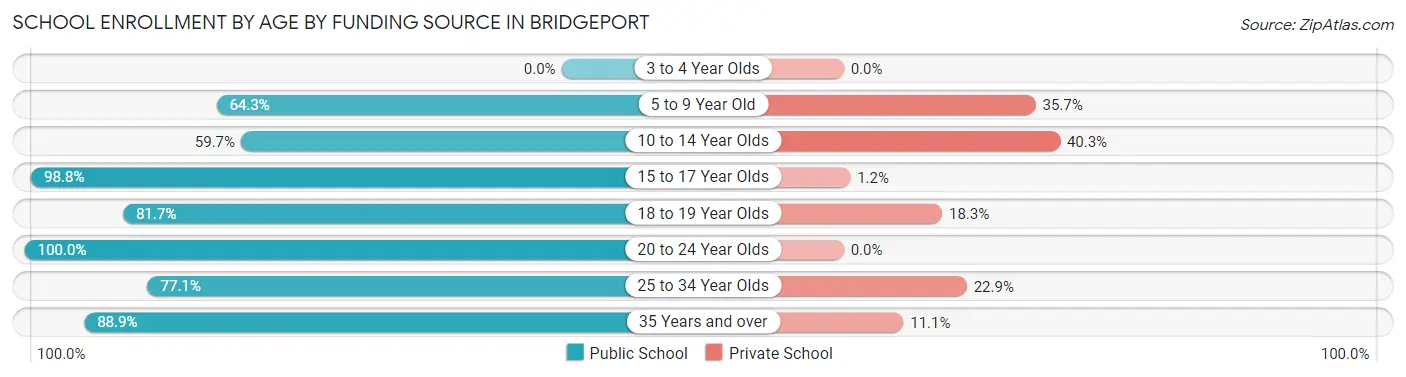
| Age Bracket | Public School | Private School |
| 3 to 4 Year Olds | 0 (0.0%) | 0 (0.0%) |
| 5 to 9 Year Old | 187 (64.3%) | 104 (35.7%) |
| 10 to 14 Year Olds | 381 (59.7%) | 257 (40.3%) |
| 15 to 17 Year Olds | 242 (98.8%) | 3 (1.2%) |
| 18 to 19 Year Olds | 49 (81.7%) | 11 (18.3%) |
| 20 to 24 Year Olds | 195 (100.0%) | 0 (0.0%) |
| 25 to 34 Year Olds | 37 (77.1%) | 11 (22.9%) |
| 35 Years and over | 48 (88.9%) | 6 (11.1%) |
| Total | 1,139 (74.4%) | 392 (25.6%) |
Educational Attainment by Field of Study in Bridgeport
Arts & humanities (203 | 17.9%), bio, nature & agricultural (190 | 16.8%), science & technology (169 | 14.9%), business (143 | 12.6%), and computers & mathematics (131 | 11.6%) are the most common fields of study among 1,132 individuals in Bridgeport who have obtained a bachelor's degree or higher.
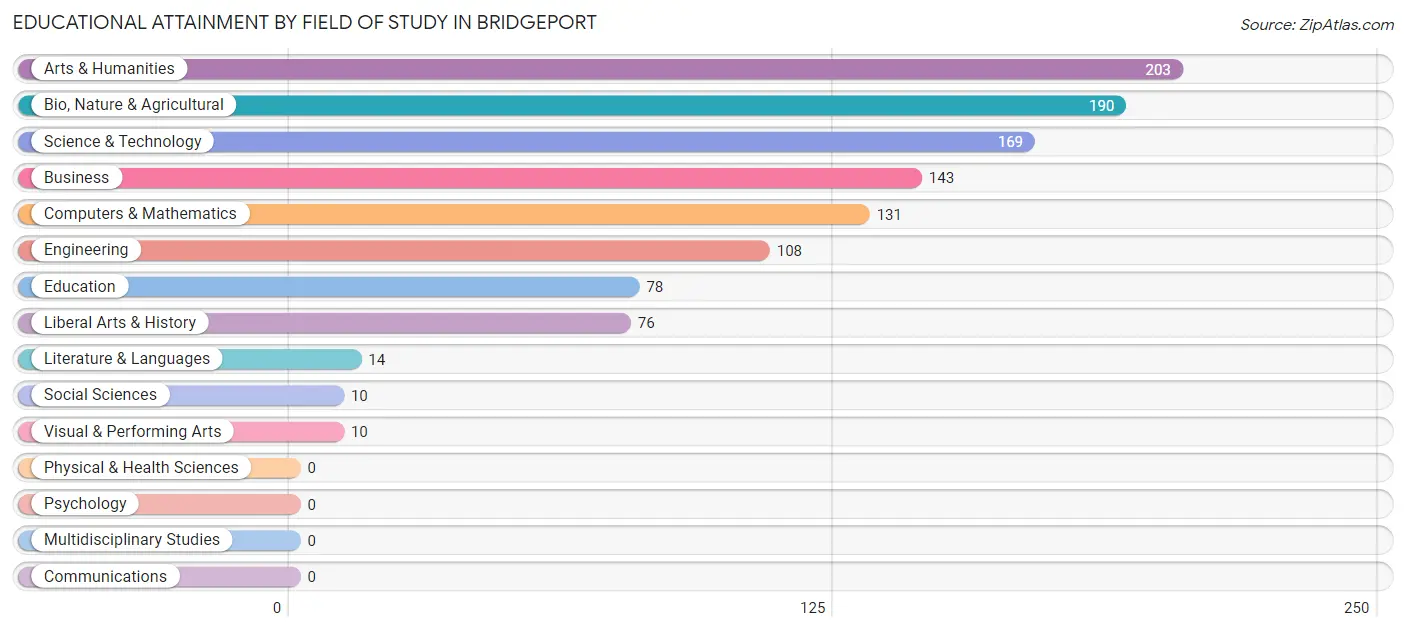
| Field of Study | # Graduates | % Graduates |
| Computers & Mathematics | 131 | 11.6% |
| Bio, Nature & Agricultural | 190 | 16.8% |
| Physical & Health Sciences | 0 | 0.0% |
| Psychology | 0 | 0.0% |
| Social Sciences | 10 | 0.9% |
| Engineering | 108 | 9.5% |
| Multidisciplinary Studies | 0 | 0.0% |
| Science & Technology | 169 | 14.9% |
| Business | 143 | 12.6% |
| Education | 78 | 6.9% |
| Literature & Languages | 14 | 1.2% |
| Liberal Arts & History | 76 | 6.7% |
| Visual & Performing Arts | 10 | 0.9% |
| Communications | 0 | 0.0% |
| Arts & Humanities | 203 | 17.9% |
| Total | 1,132 | 100.0% |
Transportation & Commute in Bridgeport
Vehicle Availability by Sex in Bridgeport
The most prevalent vehicle ownership categories in Bridgeport are males with 2 vehicles (865, accounting for 53.9%) and females with 2 vehicles (567, making up 72.0%).
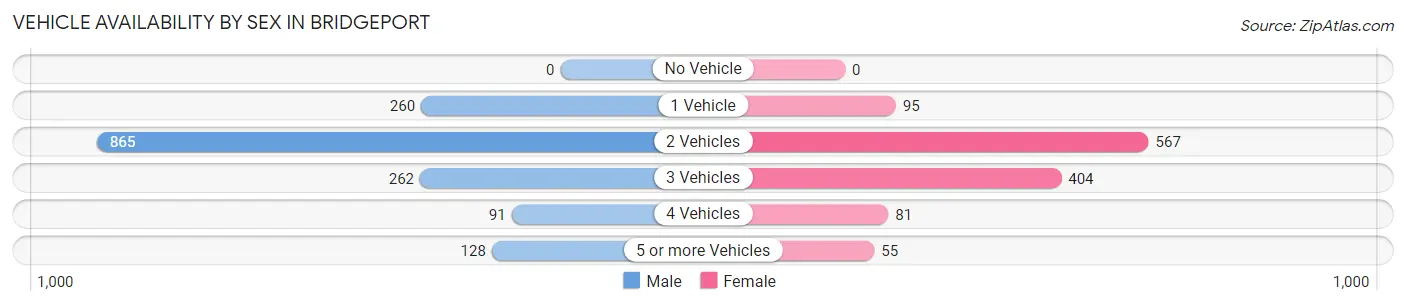
| Vehicles Available | Male | Female |
| No Vehicle | 0 (0.0%) | 0 (0.0%) |
| 1 Vehicle | 260 (16.2%) | 95 (7.9%) |
| 2 Vehicles | 865 (53.9%) | 567 (47.2%) |
| 3 Vehicles | 262 (16.3%) | 404 (33.6%) |
| 4 Vehicles | 91 (5.7%) | 81 (6.7%) |
| 5 or more Vehicles | 128 (8.0%) | 55 (4.6%) |
| Total | 1,606 (100.0%) | 1,202 (100.0%) |
Commute Time in Bridgeport
The most frequently occuring commute durations in Bridgeport are 15 to 19 minutes (593 commuters, 22.3%), 5 to 9 minutes (554 commuters, 20.8%), and 10 to 14 minutes (392 commuters, 14.7%).
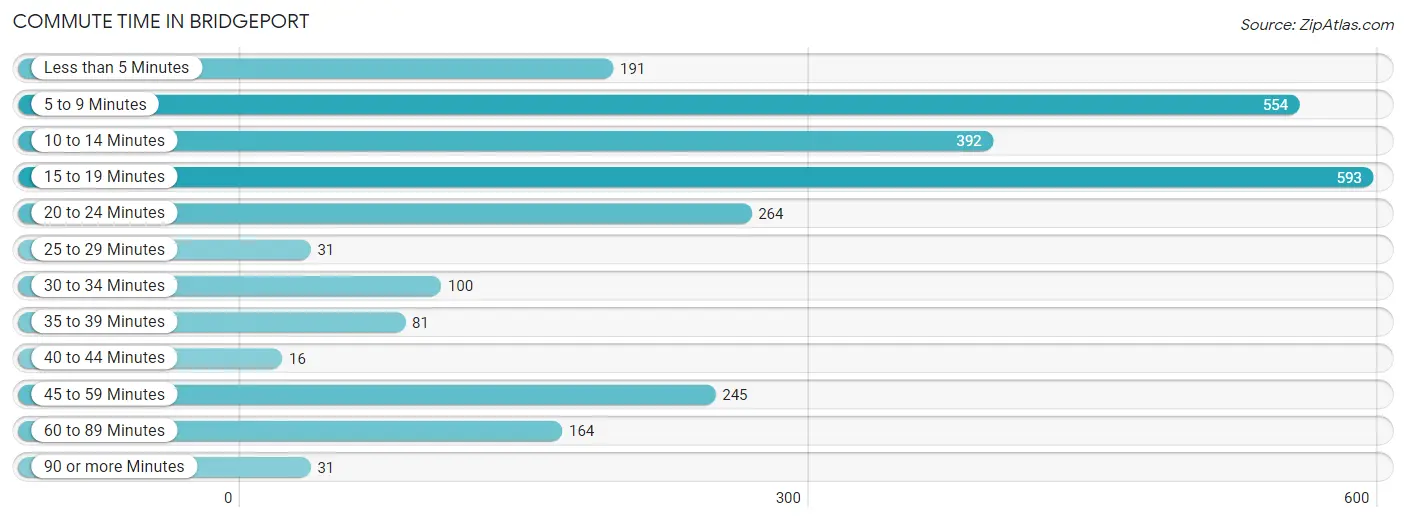
| Commute Time | # Commuters | % Commuters |
| Less than 5 Minutes | 191 | 7.2% |
| 5 to 9 Minutes | 554 | 20.8% |
| 10 to 14 Minutes | 392 | 14.7% |
| 15 to 19 Minutes | 593 | 22.3% |
| 20 to 24 Minutes | 264 | 9.9% |
| 25 to 29 Minutes | 31 | 1.2% |
| 30 to 34 Minutes | 100 | 3.8% |
| 35 to 39 Minutes | 81 | 3.0% |
| 40 to 44 Minutes | 16 | 0.6% |
| 45 to 59 Minutes | 245 | 9.2% |
| 60 to 89 Minutes | 164 | 6.2% |
| 90 or more Minutes | 31 | 1.2% |
Commute Time by Sex in Bridgeport
The most common commute times in Bridgeport are 15 to 19 minutes (352 commuters, 22.9%) for males and 5 to 9 minutes (272 commuters, 24.2%) for females.
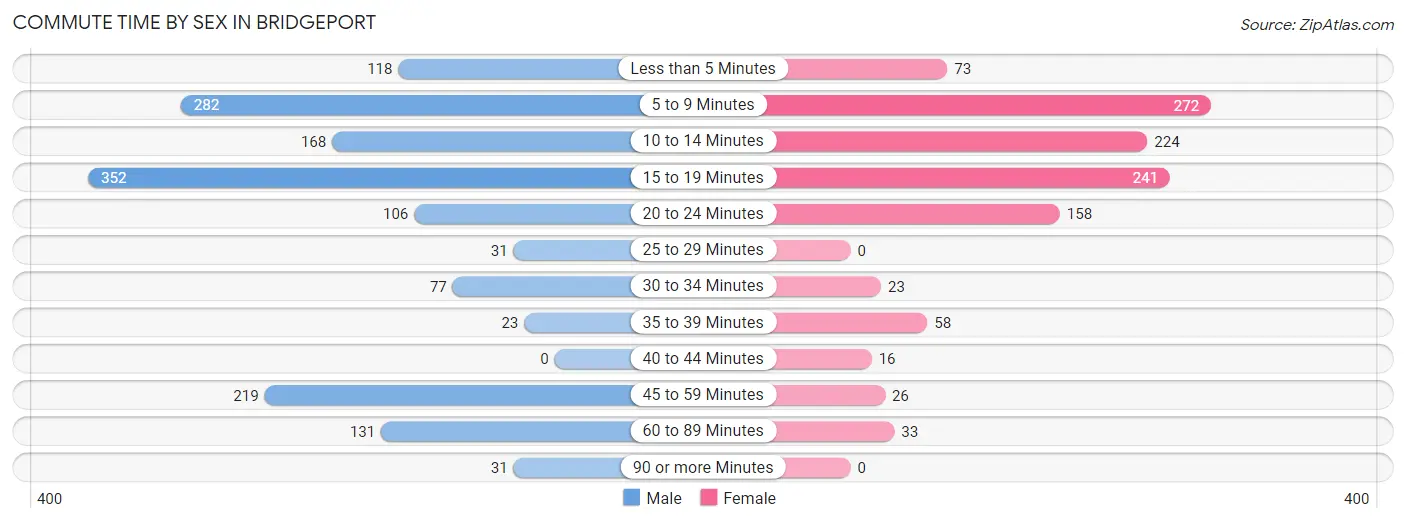
| Commute Time | Male | Female |
| Less than 5 Minutes | 118 (7.7%) | 73 (6.5%) |
| 5 to 9 Minutes | 282 (18.3%) | 272 (24.2%) |
| 10 to 14 Minutes | 168 (10.9%) | 224 (19.9%) |
| 15 to 19 Minutes | 352 (22.9%) | 241 (21.4%) |
| 20 to 24 Minutes | 106 (6.9%) | 158 (14.1%) |
| 25 to 29 Minutes | 31 (2.0%) | 0 (0.0%) |
| 30 to 34 Minutes | 77 (5.0%) | 23 (2.1%) |
| 35 to 39 Minutes | 23 (1.5%) | 58 (5.2%) |
| 40 to 44 Minutes | 0 (0.0%) | 16 (1.4%) |
| 45 to 59 Minutes | 219 (14.2%) | 26 (2.3%) |
| 60 to 89 Minutes | 131 (8.5%) | 33 (2.9%) |
| 90 or more Minutes | 31 (2.0%) | 0 (0.0%) |
Time of Departure to Work by Sex in Bridgeport
The most frequent times of departure to work in Bridgeport are 6:30 AM to 6:59 AM (424, 27.6%) for males and 7:00 AM to 7:29 AM (354, 31.5%) for females.
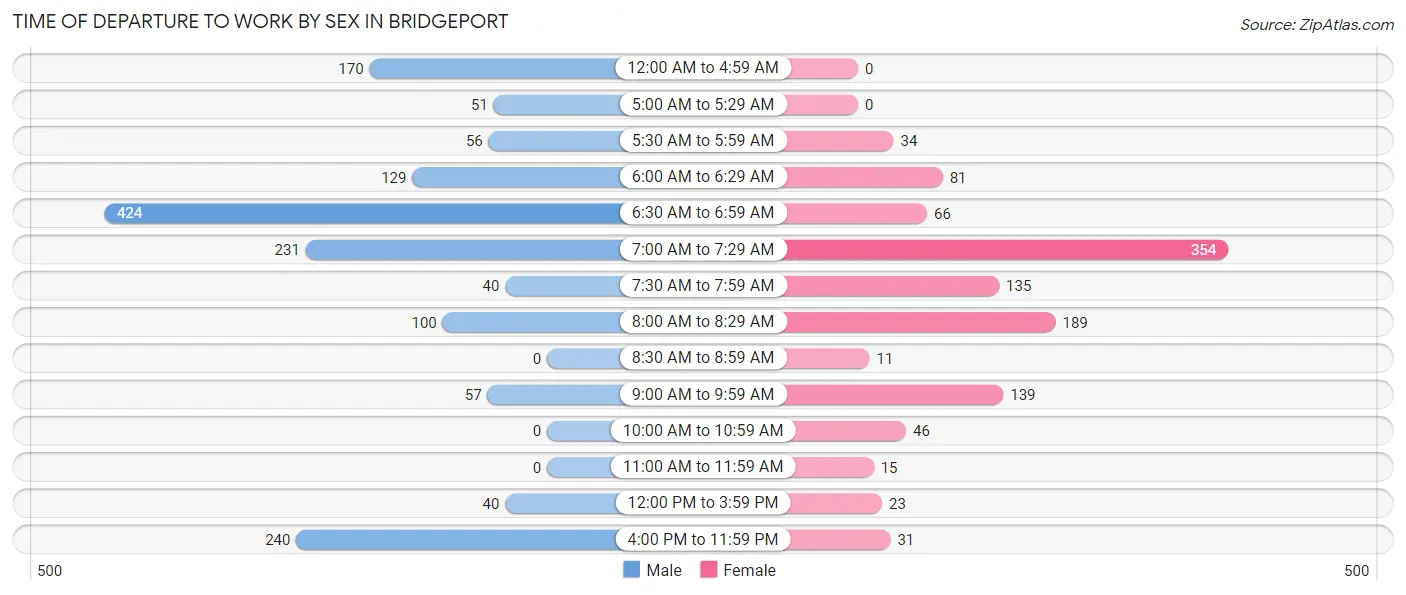
| Time of Departure | Male | Female |
| 12:00 AM to 4:59 AM | 170 (11.1%) | 0 (0.0%) |
| 5:00 AM to 5:29 AM | 51 (3.3%) | 0 (0.0%) |
| 5:30 AM to 5:59 AM | 56 (3.6%) | 34 (3.0%) |
| 6:00 AM to 6:29 AM | 129 (8.4%) | 81 (7.2%) |
| 6:30 AM to 6:59 AM | 424 (27.6%) | 66 (5.9%) |
| 7:00 AM to 7:29 AM | 231 (15.0%) | 354 (31.5%) |
| 7:30 AM to 7:59 AM | 40 (2.6%) | 135 (12.0%) |
| 8:00 AM to 8:29 AM | 100 (6.5%) | 189 (16.8%) |
| 8:30 AM to 8:59 AM | 0 (0.0%) | 11 (1.0%) |
| 9:00 AM to 9:59 AM | 57 (3.7%) | 139 (12.4%) |
| 10:00 AM to 10:59 AM | 0 (0.0%) | 46 (4.1%) |
| 11:00 AM to 11:59 AM | 0 (0.0%) | 15 (1.3%) |
| 12:00 PM to 3:59 PM | 40 (2.6%) | 23 (2.1%) |
| 4:00 PM to 11:59 PM | 240 (15.6%) | 31 (2.8%) |
| Total | 1,538 (100.0%) | 1,124 (100.0%) |
Housing Occupancy in Bridgeport
Occupancy by Ownership in Bridgeport
Of the total 1,747 dwellings in Bridgeport, owner-occupied units account for 1,140 (65.2%), while renter-occupied units make up 607 (34.7%).
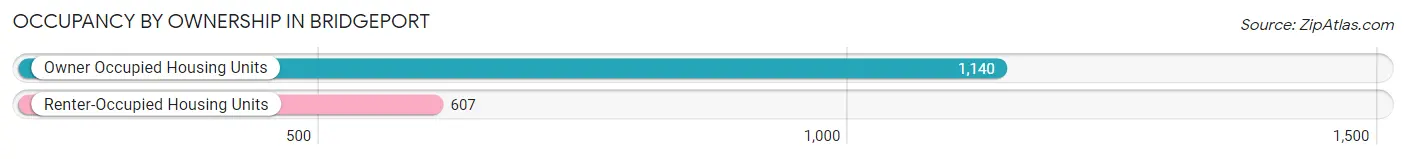
| Occupancy | # Housing Units | % Housing Units |
| Owner Occupied Housing Units | 1,140 | 65.2% |
| Renter-Occupied Housing Units | 607 | 34.7% |
| Total Occupied Housing Units | 1,747 | 100.0% |
Occupancy by Household Size in Bridgeport
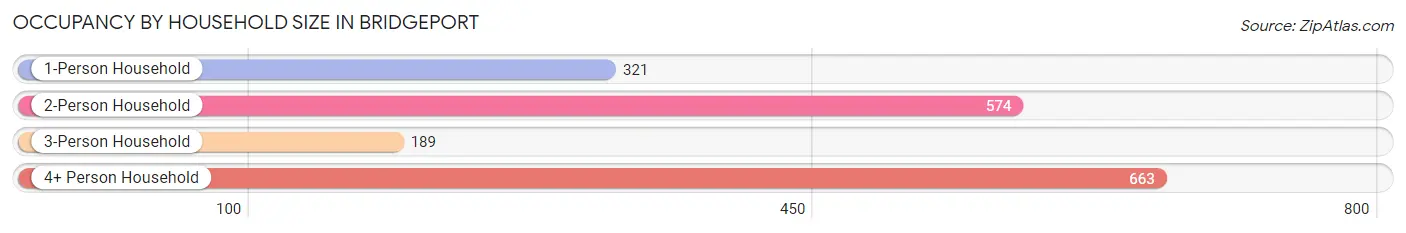
| Household Size | # Housing Units | % Housing Units |
| 1-Person Household | 321 | 18.4% |
| 2-Person Household | 574 | 32.9% |
| 3-Person Household | 189 | 10.8% |
| 4+ Person Household | 663 | 38.0% |
| Total Housing Units | 1,747 | 100.0% |
Occupancy by Ownership by Household Size in Bridgeport
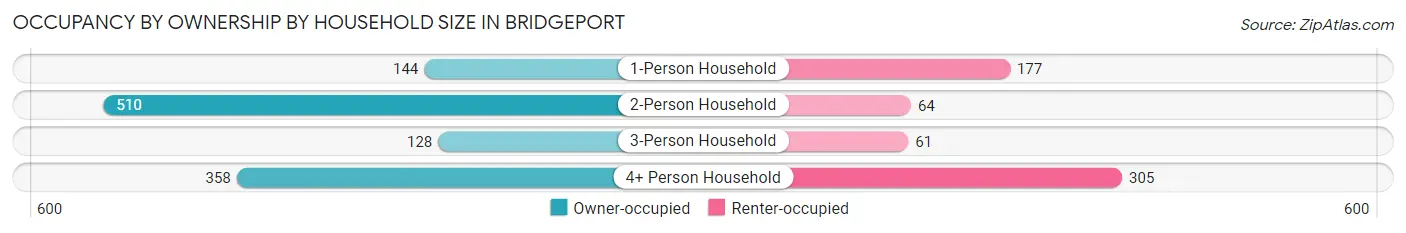
| Household Size | Owner-occupied | Renter-occupied |
| 1-Person Household | 144 (44.9%) | 177 (55.1%) |
| 2-Person Household | 510 (88.8%) | 64 (11.2%) |
| 3-Person Household | 128 (67.7%) | 61 (32.3%) |
| 4+ Person Household | 358 (54.0%) | 305 (46.0%) |
| Total Housing Units | 1,140 (65.2%) | 607 (34.7%) |
Occupancy by Educational Attainment in Bridgeport
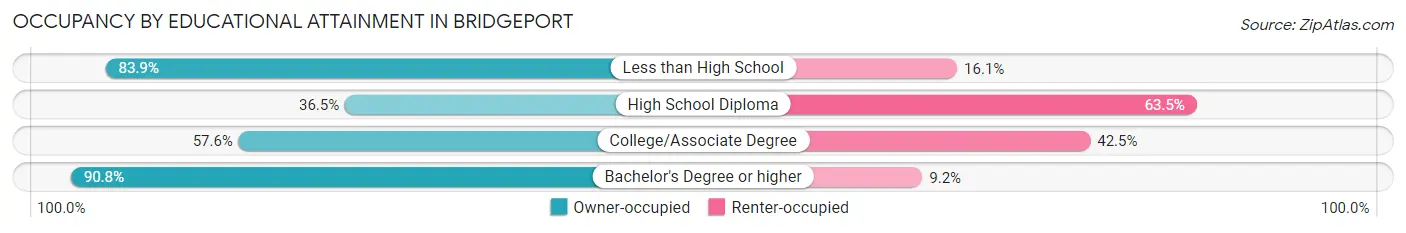
| Household Size | Owner-occupied | Renter-occupied |
| Less than High School | 115 (83.9%) | 22 (16.1%) |
| High School Diploma | 144 (36.5%) | 251 (63.5%) |
| College/Associate Degree | 385 (57.6%) | 284 (42.4%) |
| Bachelor's Degree or higher | 496 (90.8%) | 50 (9.2%) |
Occupancy by Age of Householder in Bridgeport
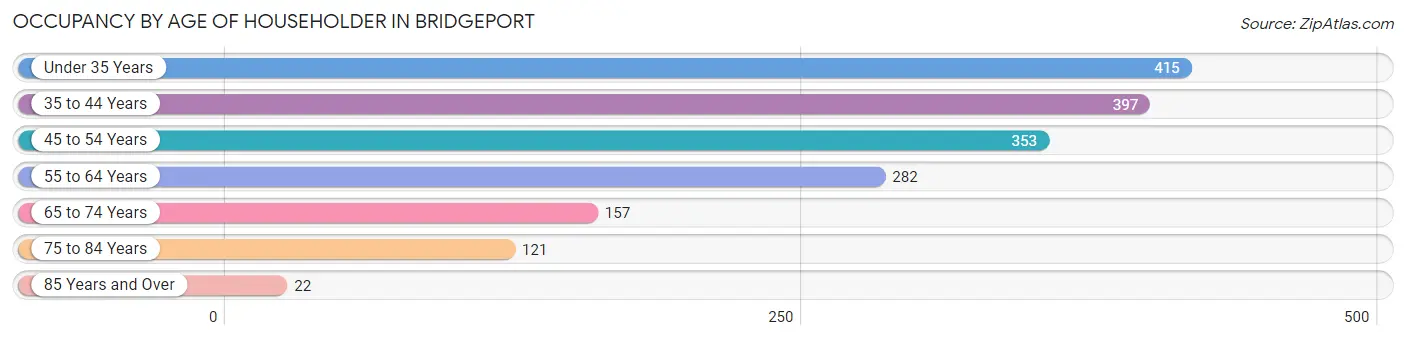
| Age Bracket | # Households | % Households |
| Under 35 Years | 415 | 23.8% |
| 35 to 44 Years | 397 | 22.7% |
| 45 to 54 Years | 353 | 20.2% |
| 55 to 64 Years | 282 | 16.1% |
| 65 to 74 Years | 157 | 9.0% |
| 75 to 84 Years | 121 | 6.9% |
| 85 Years and Over | 22 | 1.3% |
| Total | 1,747 | 100.0% |
Housing Finances in Bridgeport
Median Income by Occupancy in Bridgeport
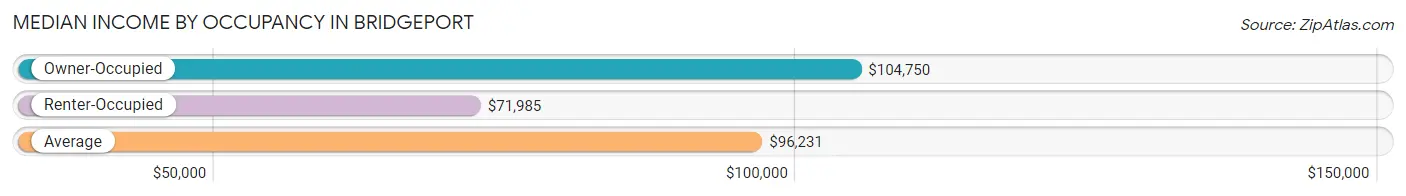
| Occupancy Type | # Households | Median Income |
| Owner-Occupied | 1,140 (65.2%) | $104,750 |
| Renter-Occupied | 607 (34.7%) | $71,985 |
| Average | 1,747 (100.0%) | $96,231 |
Occupancy by Householder Income Bracket in Bridgeport
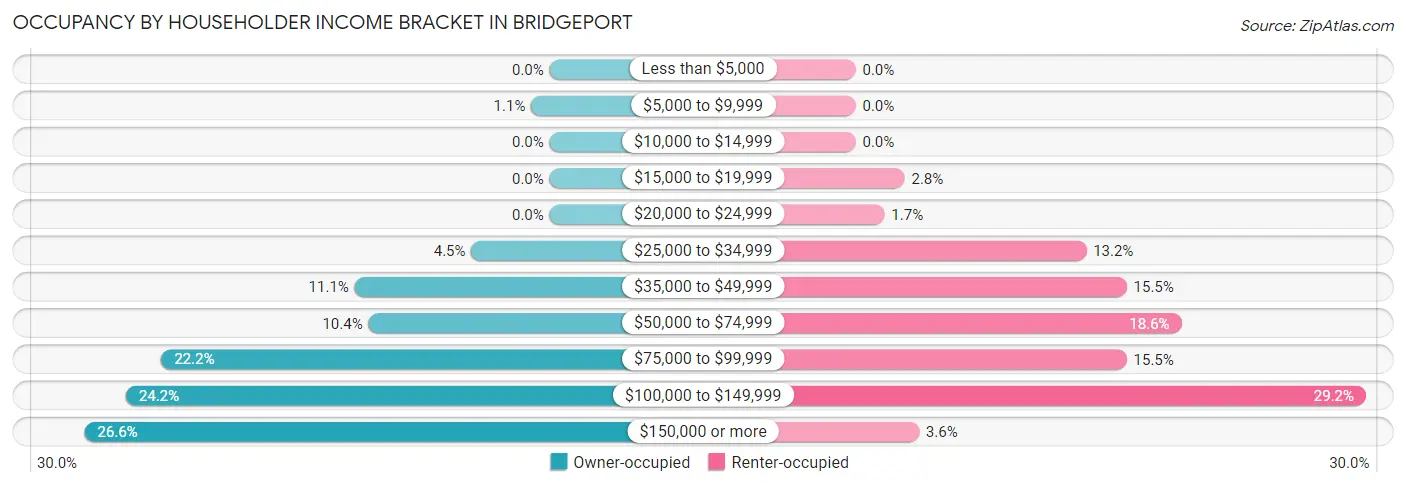
| Income Bracket | Owner-occupied | Renter-occupied |
| Less than $5,000 | 0 (0.0%) | 0 (0.0%) |
| $5,000 to $9,999 | 12 (1.1%) | 0 (0.0%) |
| $10,000 to $14,999 | 0 (0.0%) | 0 (0.0%) |
| $15,000 to $19,999 | 0 (0.0%) | 17 (2.8%) |
| $20,000 to $24,999 | 0 (0.0%) | 10 (1.7%) |
| $25,000 to $34,999 | 51 (4.5%) | 80 (13.2%) |
| $35,000 to $49,999 | 127 (11.1%) | 94 (15.5%) |
| $50,000 to $74,999 | 118 (10.3%) | 113 (18.6%) |
| $75,000 to $99,999 | 253 (22.2%) | 94 (15.5%) |
| $100,000 to $149,999 | 276 (24.2%) | 177 (29.2%) |
| $150,000 or more | 303 (26.6%) | 22 (3.6%) |
| Total | 1,140 (100.0%) | 607 (100.0%) |
Monthly Housing Cost Tiers in Bridgeport
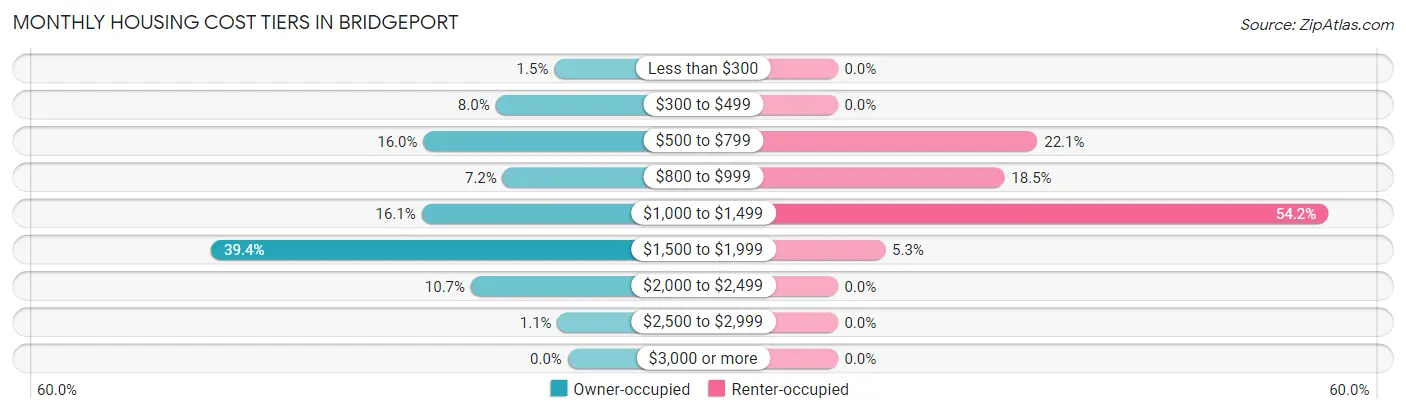
| Monthly Cost | Owner-occupied | Renter-occupied |
| Less than $300 | 17 (1.5%) | 0 (0.0%) |
| $300 to $499 | 91 (8.0%) | 0 (0.0%) |
| $500 to $799 | 182 (16.0%) | 134 (22.1%) |
| $800 to $999 | 82 (7.2%) | 112 (18.4%) |
| $1,000 to $1,499 | 184 (16.1%) | 329 (54.2%) |
| $1,500 to $1,999 | 449 (39.4%) | 32 (5.3%) |
| $2,000 to $2,499 | 122 (10.7%) | 0 (0.0%) |
| $2,500 to $2,999 | 13 (1.1%) | 0 (0.0%) |
| $3,000 or more | 0 (0.0%) | 0 (0.0%) |
| Total | 1,140 (100.0%) | 607 (100.0%) |
Physical Housing Characteristics in Bridgeport
Housing Structures in Bridgeport
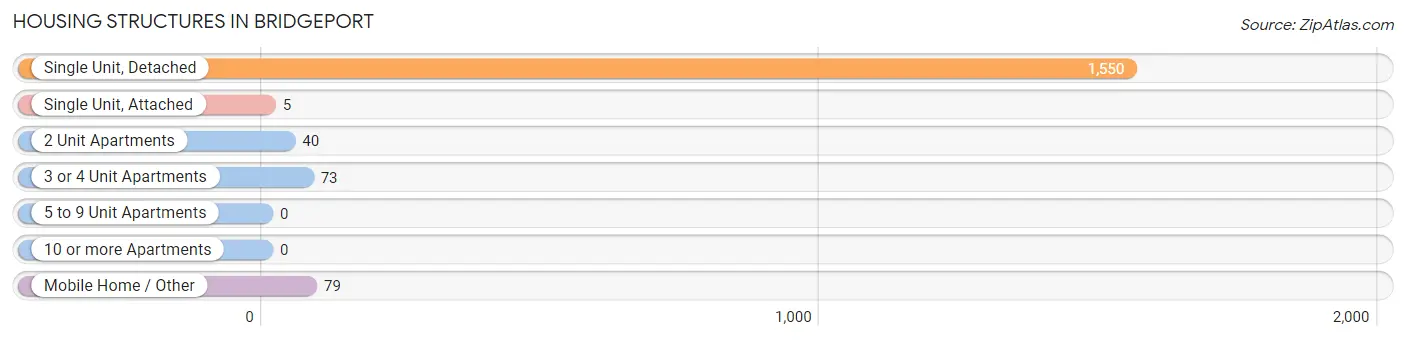
| Structure Type | # Housing Units | % Housing Units |
| Single Unit, Detached | 1,550 | 88.7% |
| Single Unit, Attached | 5 | 0.3% |
| 2 Unit Apartments | 40 | 2.3% |
| 3 or 4 Unit Apartments | 73 | 4.2% |
| 5 to 9 Unit Apartments | 0 | 0.0% |
| 10 or more Apartments | 0 | 0.0% |
| Mobile Home / Other | 79 | 4.5% |
| Total | 1,747 | 100.0% |
Housing Structures by Occupancy in Bridgeport
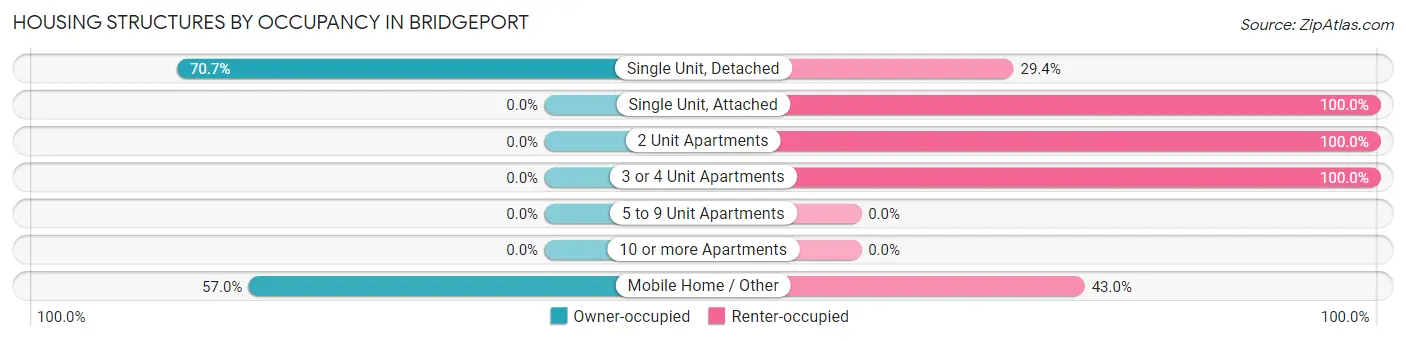
| Structure Type | Owner-occupied | Renter-occupied |
| Single Unit, Detached | 1,095 (70.7%) | 455 (29.3%) |
| Single Unit, Attached | 0 (0.0%) | 5 (100.0%) |
| 2 Unit Apartments | 0 (0.0%) | 40 (100.0%) |
| 3 or 4 Unit Apartments | 0 (0.0%) | 73 (100.0%) |
| 5 to 9 Unit Apartments | 0 (0.0%) | 0 (0.0%) |
| 10 or more Apartments | 0 (0.0%) | 0 (0.0%) |
| Mobile Home / Other | 45 (57.0%) | 34 (43.0%) |
| Total | 1,140 (65.2%) | 607 (34.7%) |
Housing Structures by Number of Rooms in Bridgeport
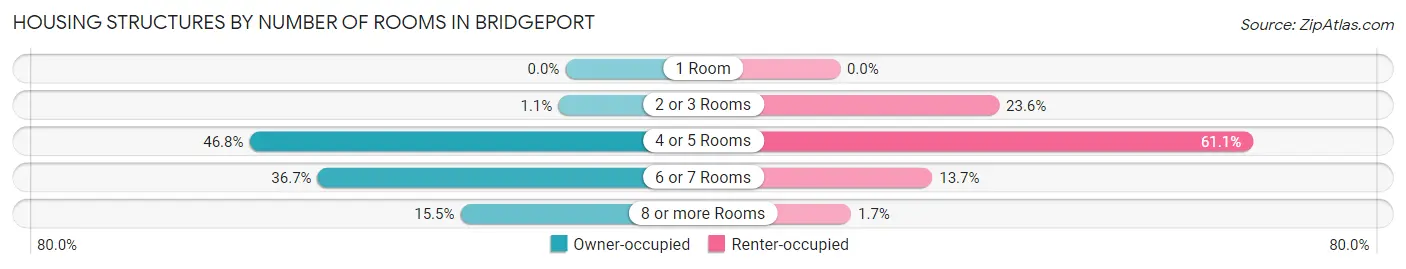
| Number of Rooms | Owner-occupied | Renter-occupied |
| 1 Room | 0 (0.0%) | 0 (0.0%) |
| 2 or 3 Rooms | 12 (1.1%) | 143 (23.6%) |
| 4 or 5 Rooms | 533 (46.8%) | 371 (61.1%) |
| 6 or 7 Rooms | 418 (36.7%) | 83 (13.7%) |
| 8 or more Rooms | 177 (15.5%) | 10 (1.7%) |
| Total | 1,140 (100.0%) | 607 (100.0%) |
Housing Structure by Heating Type in Bridgeport
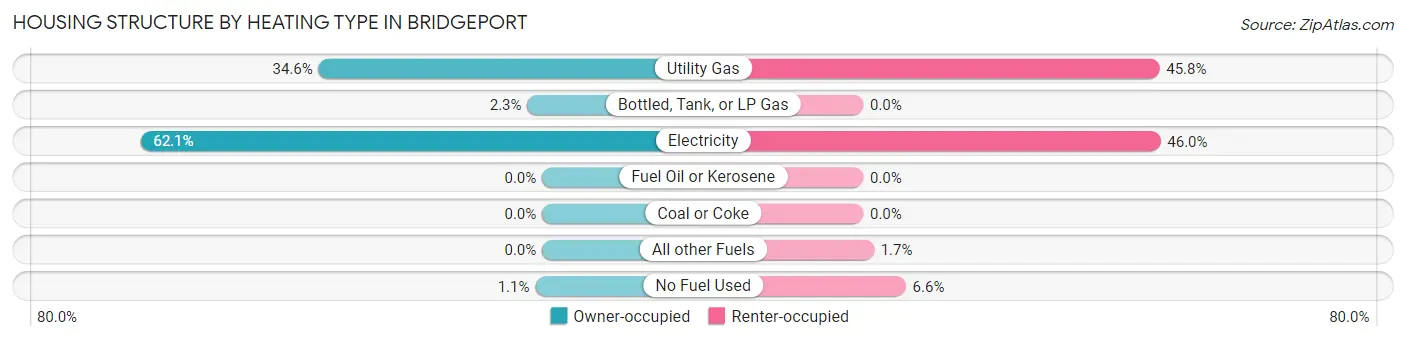
| Heating Type | Owner-occupied | Renter-occupied |
| Utility Gas | 394 (34.6%) | 278 (45.8%) |
| Bottled, Tank, or LP Gas | 26 (2.3%) | 0 (0.0%) |
| Electricity | 708 (62.1%) | 279 (46.0%) |
| Fuel Oil or Kerosene | 0 (0.0%) | 0 (0.0%) |
| Coal or Coke | 0 (0.0%) | 0 (0.0%) |
| All other Fuels | 0 (0.0%) | 10 (1.7%) |
| No Fuel Used | 12 (1.1%) | 40 (6.6%) |
| Total | 1,140 (100.0%) | 607 (100.0%) |
Household Vehicle Usage in Bridgeport
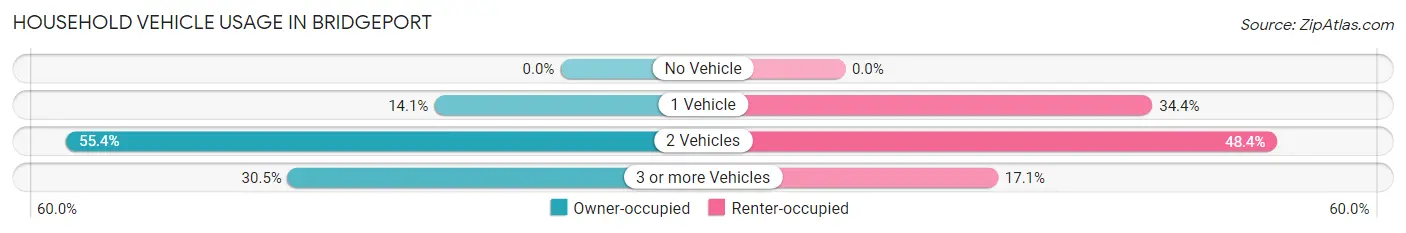
| Vehicles per Household | Owner-occupied | Renter-occupied |
| No Vehicle | 0 (0.0%) | 0 (0.0%) |
| 1 Vehicle | 161 (14.1%) | 209 (34.4%) |
| 2 Vehicles | 631 (55.3%) | 294 (48.4%) |
| 3 or more Vehicles | 348 (30.5%) | 104 (17.1%) |
| Total | 1,140 (100.0%) | 607 (100.0%) |
Real Estate & Mortgages in Bridgeport
Real Estate and Mortgage Overview in Bridgeport
| Characteristic | Without Mortgage | With Mortgage |
| Housing Units | 415 | 725 |
| Median Property Value | $165,800 | $254,200 |
| Median Household Income | $76,823 | $267 |
| Monthly Housing Costs | $707 | $0 |
| Real Estate Taxes | $2,633 | $15 |
Property Value by Mortgage Status in Bridgeport
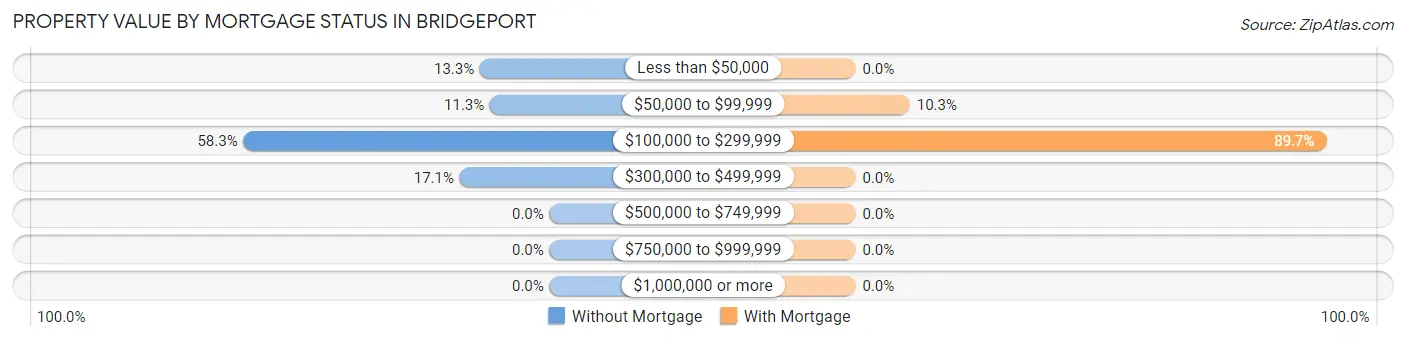
| Property Value | Without Mortgage | With Mortgage |
| Less than $50,000 | 55 (13.3%) | 0 (0.0%) |
| $50,000 to $99,999 | 47 (11.3%) | 75 (10.3%) |
| $100,000 to $299,999 | 242 (58.3%) | 650 (89.7%) |
| $300,000 to $499,999 | 71 (17.1%) | 0 (0.0%) |
| $500,000 to $749,999 | 0 (0.0%) | 0 (0.0%) |
| $750,000 to $999,999 | 0 (0.0%) | 0 (0.0%) |
| $1,000,000 or more | 0 (0.0%) | 0 (0.0%) |
| Total | 415 (100.0%) | 725 (100.0%) |
Household Income by Mortgage Status in Bridgeport
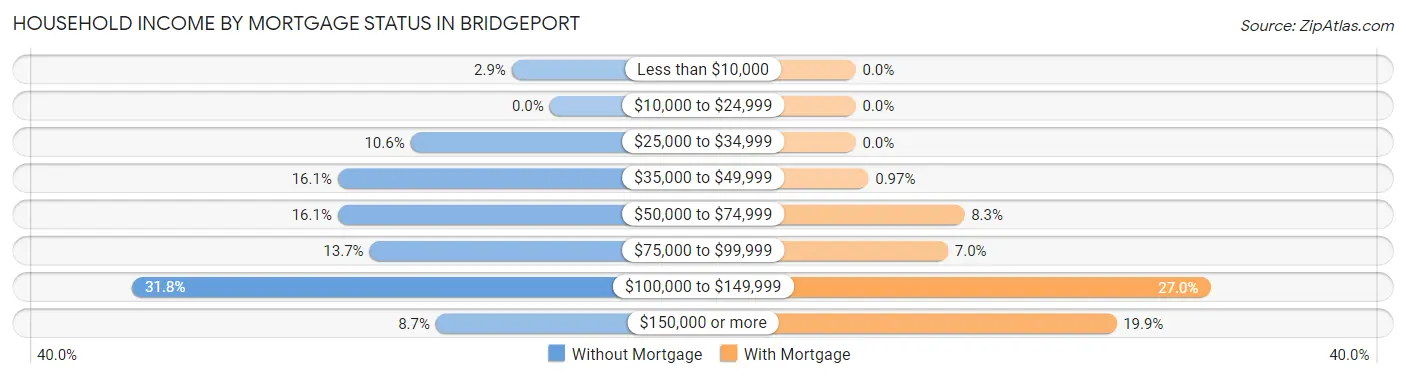
| Household Income | Without Mortgage | With Mortgage |
| Less than $10,000 | 12 (2.9%) | 0 (0.0%) |
| $10,000 to $24,999 | 0 (0.0%) | 0 (0.0%) |
| $25,000 to $34,999 | 44 (10.6%) | 0 (0.0%) |
| $35,000 to $49,999 | 67 (16.1%) | 7 (1.0%) |
| $50,000 to $74,999 | 67 (16.1%) | 60 (8.3%) |
| $75,000 to $99,999 | 57 (13.7%) | 51 (7.0%) |
| $100,000 to $149,999 | 132 (31.8%) | 196 (27.0%) |
| $150,000 or more | 36 (8.7%) | 144 (19.9%) |
| Total | 415 (100.0%) | 725 (100.0%) |
Property Value to Household Income Ratio in Bridgeport
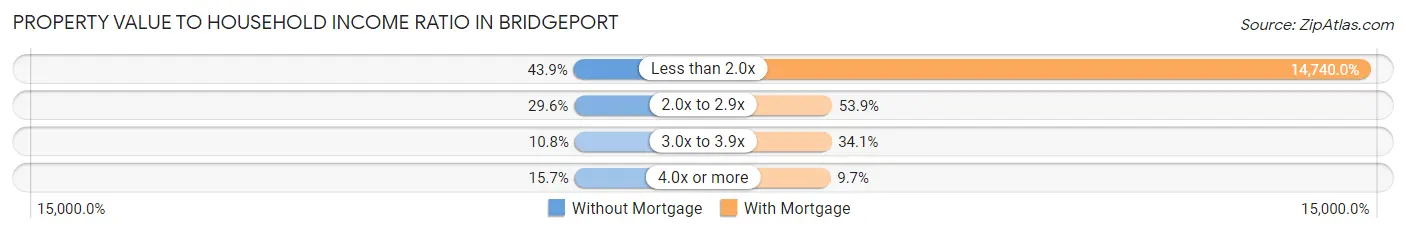
| Value-to-Income Ratio | Without Mortgage | With Mortgage |
| Less than 2.0x | 182 (43.9%) | 106,865 (14,740.0%) |
| 2.0x to 2.9x | 123 (29.6%) | 391 (53.9%) |
| 3.0x to 3.9x | 45 (10.8%) | 247 (34.1%) |
| 4.0x or more | 65 (15.7%) | 70 (9.7%) |
| Total | 415 (100.0%) | 725 (100.0%) |
Real Estate Taxes by Mortgage Status in Bridgeport
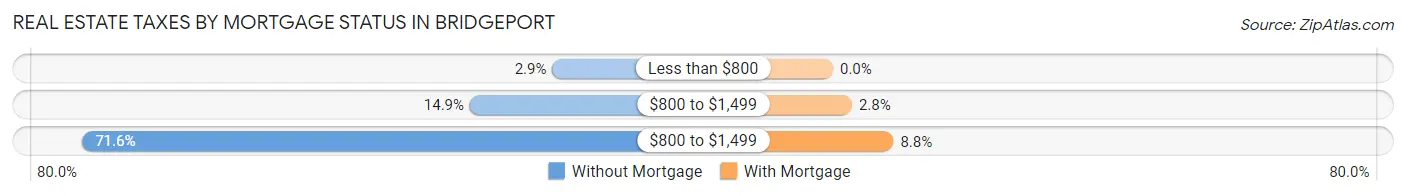
| Property Taxes | Without Mortgage | With Mortgage |
| Less than $800 | 12 (2.9%) | 0 (0.0%) |
| $800 to $1,499 | 62 (14.9%) | 20 (2.8%) |
| $800 to $1,499 | 297 (71.6%) | 64 (8.8%) |
| Total | 415 (100.0%) | 725 (100.0%) |
Health & Disability in Bridgeport
Health Insurance Coverage by Age in Bridgeport
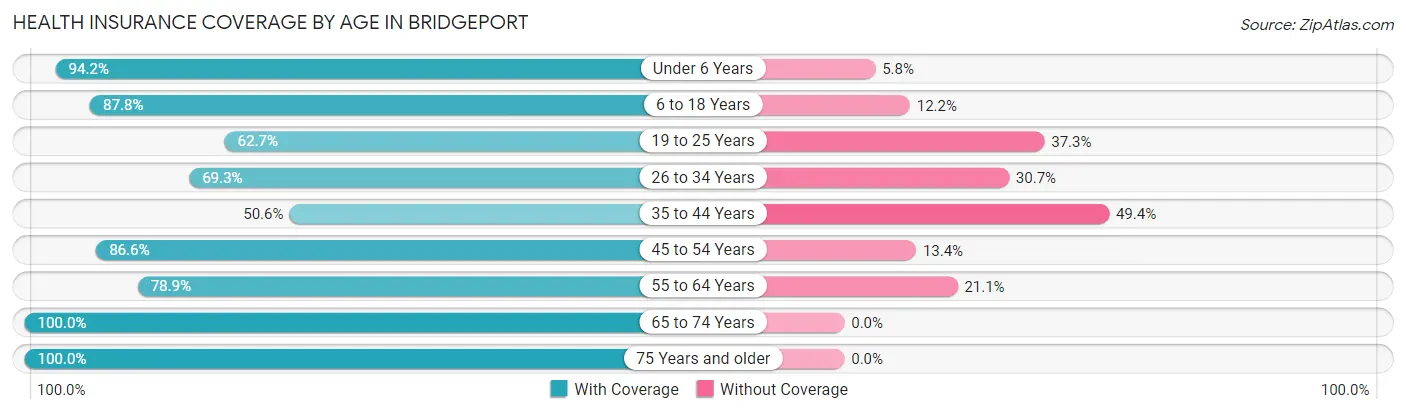
| Age Bracket | With Coverage | Without Coverage |
| Under 6 Years | 457 (94.2%) | 28 (5.8%) |
| 6 to 18 Years | 992 (87.8%) | 138 (12.2%) |
| 19 to 25 Years | 274 (62.7%) | 163 (37.3%) |
| 26 to 34 Years | 553 (69.3%) | 245 (30.7%) |
| 35 to 44 Years | 318 (50.6%) | 310 (49.4%) |
| 45 to 54 Years | 694 (86.6%) | 107 (13.4%) |
| 55 to 64 Years | 430 (78.9%) | 115 (21.1%) |
| 65 to 74 Years | 324 (100.0%) | 0 (0.0%) |
| 75 Years and older | 252 (100.0%) | 0 (0.0%) |
| Total | 4,294 (79.5%) | 1,106 (20.5%) |
Health Insurance Coverage by Citizenship Status in Bridgeport
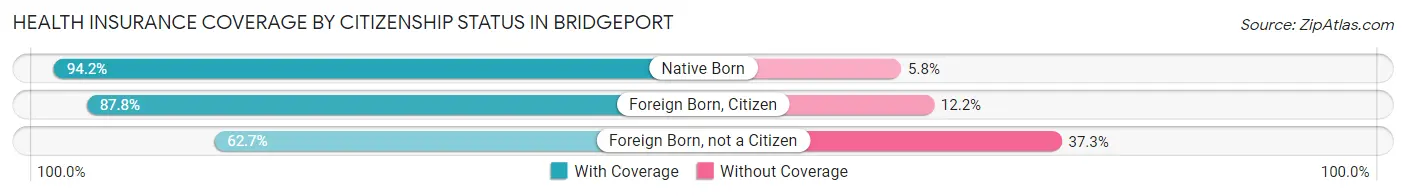
| Citizenship Status | With Coverage | Without Coverage |
| Native Born | 457 (94.2%) | 28 (5.8%) |
| Foreign Born, Citizen | 992 (87.8%) | 138 (12.2%) |
| Foreign Born, not a Citizen | 274 (62.7%) | 163 (37.3%) |
Health Insurance Coverage by Household Income in Bridgeport
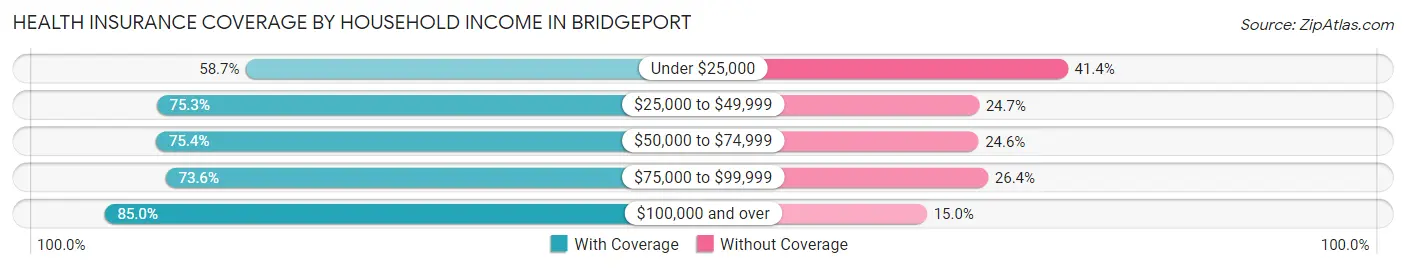
| Household Income | With Coverage | Without Coverage |
| Under $25,000 | 61 (58.7%) | 43 (41.3%) |
| $25,000 to $49,999 | 466 (75.3%) | 153 (24.7%) |
| $50,000 to $74,999 | 591 (75.4%) | 193 (24.6%) |
| $75,000 to $99,999 | 888 (73.6%) | 319 (26.4%) |
| $100,000 and over | 2,261 (85.0%) | 398 (15.0%) |
Public vs Private Health Insurance Coverage by Age in Bridgeport
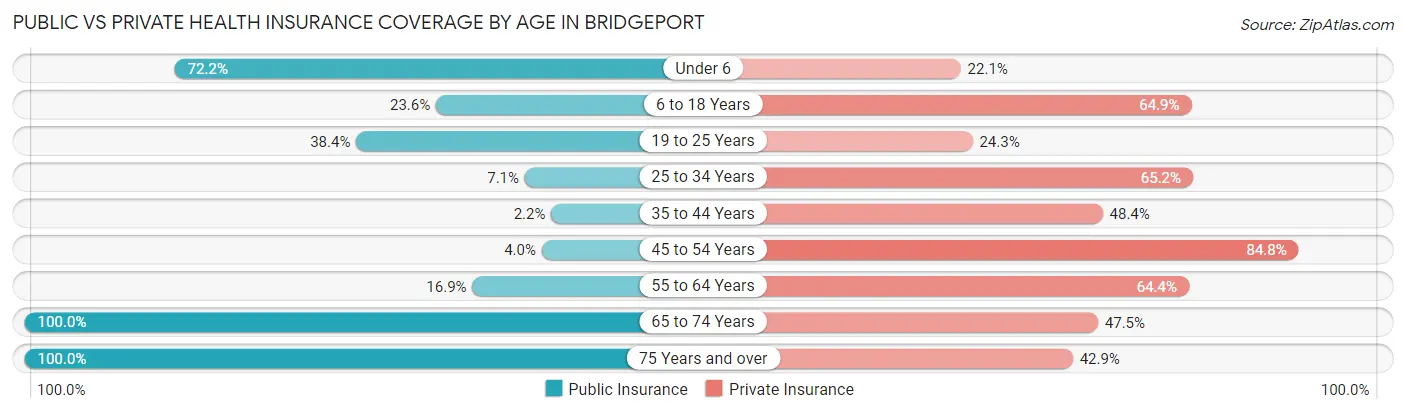
| Age Bracket | Public Insurance | Private Insurance |
| Under 6 | 350 (72.2%) | 107 (22.1%) |
| 6 to 18 Years | 267 (23.6%) | 733 (64.9%) |
| 19 to 25 Years | 168 (38.4%) | 106 (24.3%) |
| 25 to 34 Years | 57 (7.1%) | 520 (65.2%) |
| 35 to 44 Years | 14 (2.2%) | 304 (48.4%) |
| 45 to 54 Years | 32 (4.0%) | 679 (84.8%) |
| 55 to 64 Years | 92 (16.9%) | 351 (64.4%) |
| 65 to 74 Years | 324 (100.0%) | 154 (47.5%) |
| 75 Years and over | 252 (100.0%) | 108 (42.9%) |
| Total | 1,556 (28.8%) | 3,062 (56.7%) |
Disability Status by Sex by Age in Bridgeport
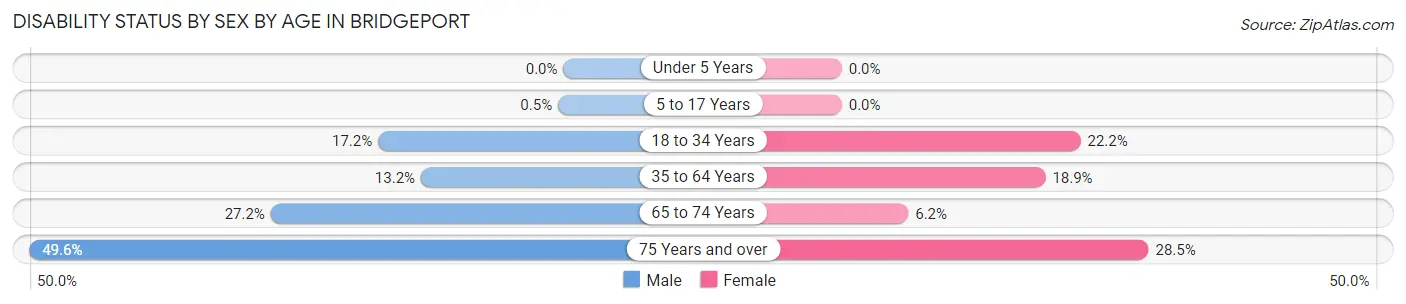
| Age Bracket | Male | Female |
| Under 5 Years | 0 (0.0%) | 0 (0.0%) |
| 5 to 17 Years | 3 (0.5%) | 0 (0.0%) |
| 18 to 34 Years | 130 (17.2%) | 117 (22.2%) |
| 35 to 64 Years | 119 (13.2%) | 203 (18.9%) |
| 65 to 74 Years | 44 (27.2%) | 10 (6.2%) |
| 75 Years and over | 57 (49.6%) | 39 (28.5%) |
Disability Class by Sex by Age in Bridgeport
Disability Class: Hearing Difficulty
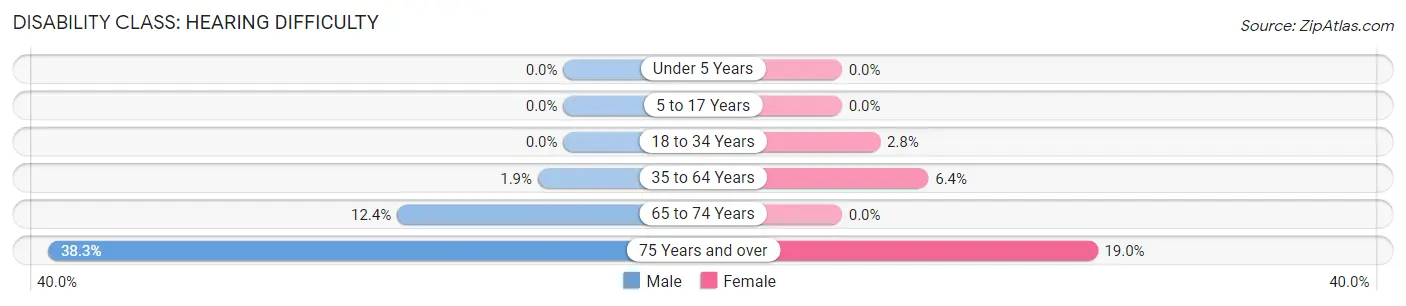
| Age Bracket | Male | Female |
| Under 5 Years | 0 (0.0%) | 0 (0.0%) |
| 5 to 17 Years | 0 (0.0%) | 0 (0.0%) |
| 18 to 34 Years | 0 (0.0%) | 15 (2.8%) |
| 35 to 64 Years | 17 (1.9%) | 69 (6.4%) |
| 65 to 74 Years | 20 (12.3%) | 0 (0.0%) |
| 75 Years and over | 44 (38.3%) | 26 (19.0%) |
Disability Class: Vision Difficulty
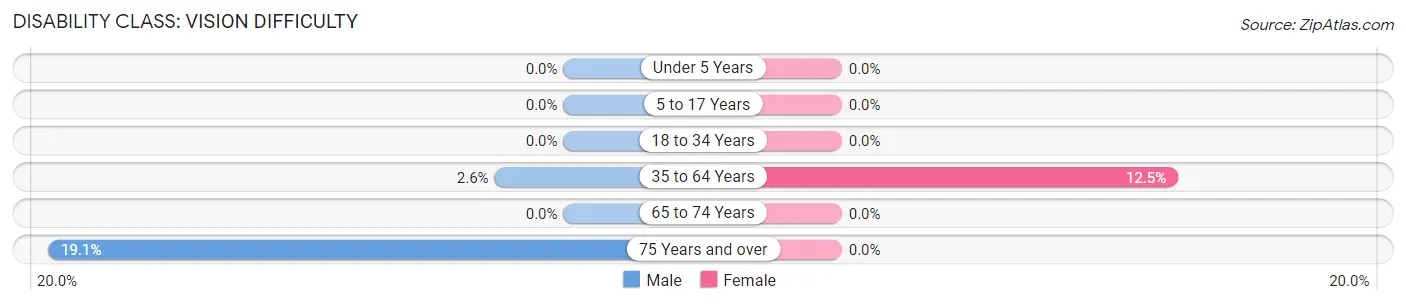
| Age Bracket | Male | Female |
| Under 5 Years | 0 (0.0%) | 0 (0.0%) |
| 5 to 17 Years | 0 (0.0%) | 0 (0.0%) |
| 18 to 34 Years | 0 (0.0%) | 0 (0.0%) |
| 35 to 64 Years | 23 (2.6%) | 134 (12.5%) |
| 65 to 74 Years | 0 (0.0%) | 0 (0.0%) |
| 75 Years and over | 22 (19.1%) | 0 (0.0%) |
Disability Class: Cognitive Difficulty
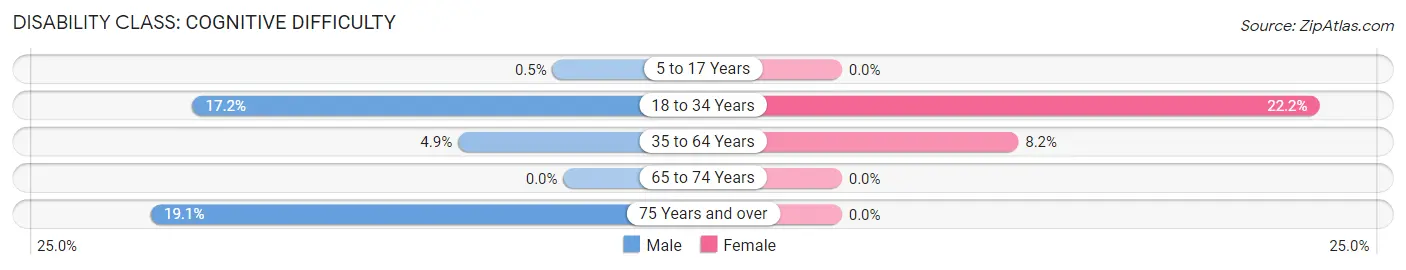
| Age Bracket | Male | Female |
| 5 to 17 Years | 3 (0.5%) | 0 (0.0%) |
| 18 to 34 Years | 130 (17.2%) | 117 (22.2%) |
| 35 to 64 Years | 44 (4.9%) | 88 (8.2%) |
| 65 to 74 Years | 0 (0.0%) | 0 (0.0%) |
| 75 Years and over | 22 (19.1%) | 0 (0.0%) |
Disability Class: Ambulatory Difficulty
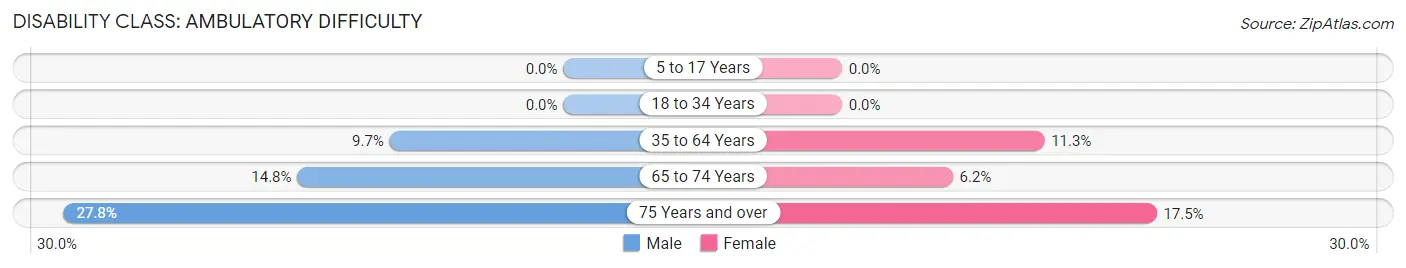
| Age Bracket | Male | Female |
| 5 to 17 Years | 0 (0.0%) | 0 (0.0%) |
| 18 to 34 Years | 0 (0.0%) | 0 (0.0%) |
| 35 to 64 Years | 87 (9.7%) | 121 (11.3%) |
| 65 to 74 Years | 24 (14.8%) | 10 (6.2%) |
| 75 Years and over | 32 (27.8%) | 24 (17.5%) |
Disability Class: Self-Care Difficulty
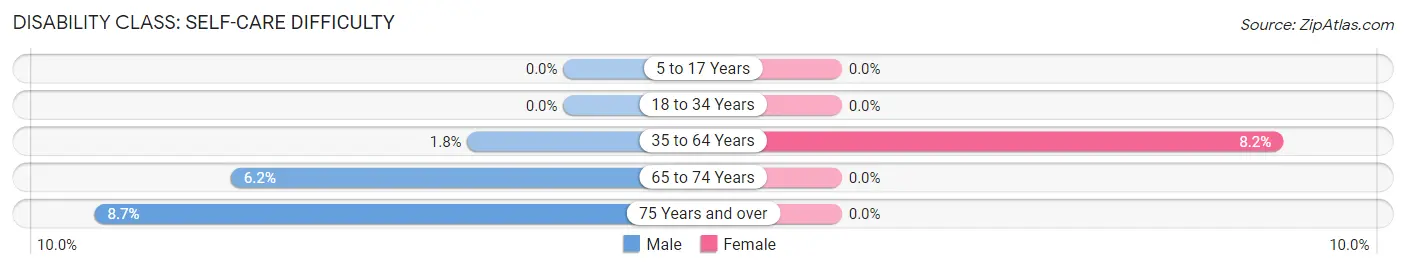
| Age Bracket | Male | Female |
| 5 to 17 Years | 0 (0.0%) | 0 (0.0%) |
| 18 to 34 Years | 0 (0.0%) | 0 (0.0%) |
| 35 to 64 Years | 16 (1.8%) | 88 (8.2%) |
| 65 to 74 Years | 10 (6.2%) | 0 (0.0%) |
| 75 Years and over | 10 (8.7%) | 0 (0.0%) |
Technology Access in Bridgeport
Computing Device Access in Bridgeport
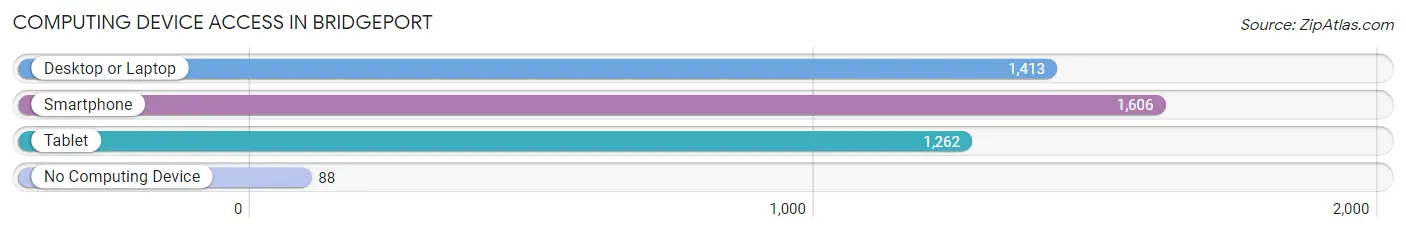
| Device Type | # Households | % Households |
| Desktop or Laptop | 1,413 | 80.9% |
| Smartphone | 1,606 | 91.9% |
| Tablet | 1,262 | 72.2% |
| No Computing Device | 88 | 5.0% |
| Total | 1,747 | 100.0% |
Internet Access in Bridgeport
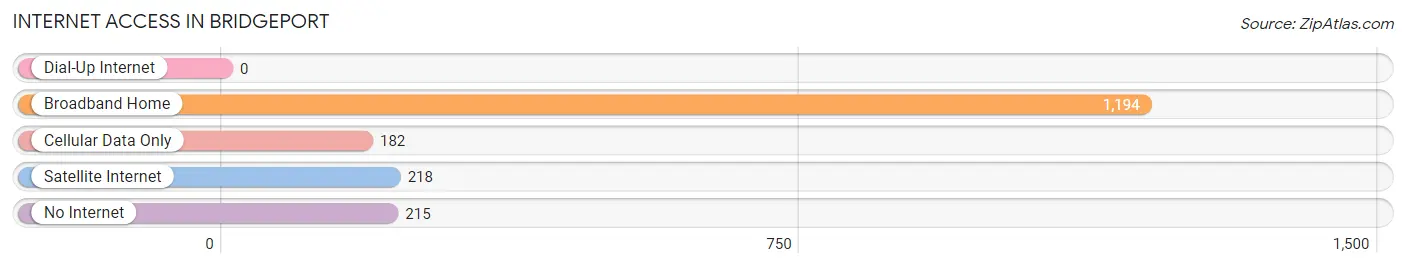
| Internet Type | # Households | % Households |
| Dial-Up Internet | 0 | 0.0% |
| Broadband Home | 1,194 | 68.3% |
| Cellular Data Only | 182 | 10.4% |
| Satellite Internet | 218 | 12.5% |
| No Internet | 215 | 12.3% |
| Total | 1,747 | 100.0% |
Bridgeport Summary
Bridgeport, Texas is a city located in Wise County, Texas, United States. The population was 6,400 at the 2010 census. It is the county seat of Wise County. The city is part of the Dallas–Fort Worth–Arlington metropolitan area.
History
The area that is now Bridgeport was first settled in the 1840s. The town was originally called "Newport" and was later renamed "Bridgeport" in 1872 when the first bridge was built across the West Fork of the Trinity River. The bridge was built to connect the two sides of the river, which had previously been separated by a large ravine.
The city was officially incorporated in 1876 and has since grown to become the largest city in Wise County. The city was a major stop on the Texas and Pacific Railway, which helped to spur its growth.
Geography
Bridgeport is located at 33°7′45″N 97°51′45″W (33.129444, -97.862472). According to the United States Census Bureau, the city has a total area of 5.2 square miles (13.4 km2), all of it land.
Economy
The economy of Bridgeport is largely based on agriculture and manufacturing. The city is home to several large manufacturing plants, including a Tyson Foods poultry processing plant and a General Motors plant. The city is also home to several large agricultural operations, including a large cattle ranch and several large farms.
The city is also home to several large retail stores, including Walmart, Lowe's, and Home Depot. The city is also home to several restaurants, including several fast food restaurants and several local restaurants.
Demographics
As of the census of 2010, there were 6,400 people, 2,541 households, and 1,717 families residing in the city. The population density was 1,228.3 people per square mile (473.3/km2). There were 2,845 housing units at an average density of 551.2 per square mile (212.7/km2). The racial makeup of the city was 81.2% White, 11.2% African American, 0.7% Native American, 0.7% Asian, 0.1% Pacific Islander, 4.3% from other races, and 2.0% from two or more races. Hispanic or Latino of any race were 11.7% of the population.
There were 2,541 households, out of which 32.2% had children under the age of 18 living with them, 48.2% were married couples living together, 14.7% had a female householder with no husband present, and 32.2% were non-families. 27.2% of all households were made up of individuals, and 11.7% had someone living alone who was 65 years of age or older. The average household size was 2.50 and the average family size was 3.04.
In the city, the population was spread out, with 25.7% under the age of 18, 8.3% from 18 to 24, 28.2% from 25 to 44, 22.7% from 45 to 64, and 15.1% who were 65 years of age or older. The median age was 36 years. For every 100 females, there were 93.2 males. For every 100 females age 18 and over, there were 89.3 males.
The median income for a household in the city was $35,938, and the median income for a family was $41,944. Males had a median income of $31,944 versus $22,917 for females. The per capita income for the city was $17,845. About 10.2% of families and 13.2% of the population were below the poverty line, including 17.2% of those under age 18 and 10.2% of those age 65 or over.
Common Questions
What is Per Capita Income in Bridgeport?
Per Capita income in Bridgeport is $32,215.
What is the Median Family Income in Bridgeport?
Median Family Income in Bridgeport is $98,167.
What is the Median Household income in Bridgeport?
Median Household Income in Bridgeport is $96,231.
What is Income or Wage Gap in Bridgeport?
Income or Wage Gap in Bridgeport is 27.8%.
Women in Bridgeport earn 72.2 cents for every dollar earned by a man.
What is Inequality or Gini Index in Bridgeport?
Inequality or Gini Index in Bridgeport is 0.34.
What is the Total Population of Bridgeport?
Total Population of Bridgeport is 6,044.
What is the Total Male Population of Bridgeport?
Total Male Population of Bridgeport is 3,313.
What is the Total Female Population of Bridgeport?
Total Female Population of Bridgeport is 2,731.
What is the Ratio of Males per 100 Females in Bridgeport?
There are 121.31 Males per 100 Females in Bridgeport.
What is the Ratio of Females per 100 Males in Bridgeport?
There are 82.43 Females per 100 Males in Bridgeport.
What is the Median Population Age in Bridgeport?
Median Population Age in Bridgeport is 33.9 Years.
What is the Average Family Size in Bridgeport
Average Family Size in Bridgeport is 3.5 People.
What is the Average Household Size in Bridgeport
Average Household Size in Bridgeport is 3.1 People.
How Large is the Labor Force in Bridgeport?
There are 2,942 People in the Labor Forcein in Bridgeport.
What is the Percentage of People in the Labor Force in Bridgeport?
62.8% of People are in the Labor Force in Bridgeport.
What is the Unemployment Rate in Bridgeport?
Unemployment Rate in Bridgeport is 2.9%.