Brackettville, TX Map & Demographics
Brackettville Map
Brackettville Overview
$19,988
PER CAPITA INCOME
$24,539
AVG HOUSEHOLD INCOME
0.44
INEQUALITY / GINI INDEX
1,408
TOTAL POPULATION
761
MALE POPULATION
647
FEMALE POPULATION
117.62
MALES / 100 FEMALES
85.02
FEMALES / 100 MALES
34.2
MEDIAN AGE
4.9
AVG FAMILY SIZE
3.6
AVG HOUSEHOLD SIZE
617
LABOR FORCE [ PEOPLE ]
54.1%
PERCENT IN LABOR FORCE
4.2%
UNEMPLOYMENT RATE
Brackettville Zip Codes
Brackettville Area Codes
Income in Brackettville
Income Overview in Brackettville
| Characteristic | Number | Measure |
| Per Capita Income | 1,408 | $19,988 |
| Median Family Income | 240 | $0 |
| Mean Family Income | 240 | $62,553 |
| Median Household Income | 390 | $24,539 |
| Mean Household Income | 390 | $45,642 |
| Income Deficit | 240 | $0 |
| Wage / Income Gap (%) | 1,408 | 0.00% |
| Wage / Income Gap ($) | 1,408 | 100.00¢ per $1 |
| Gini / Inequality Index | 1,408 | 0.44 |
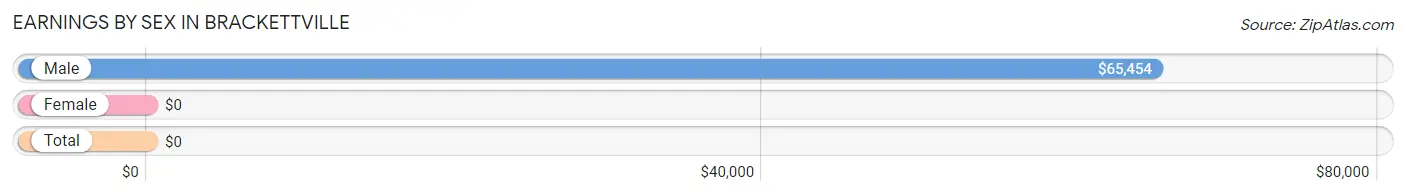
Earnings by Sex in Brackettville
| Sex | Number | Average Earnings |
| Male | 327 (52.1%) | $65,454 |
| Female | 300 (47.8%) | $0 |
| Total | 627 (100.0%) | $0 |
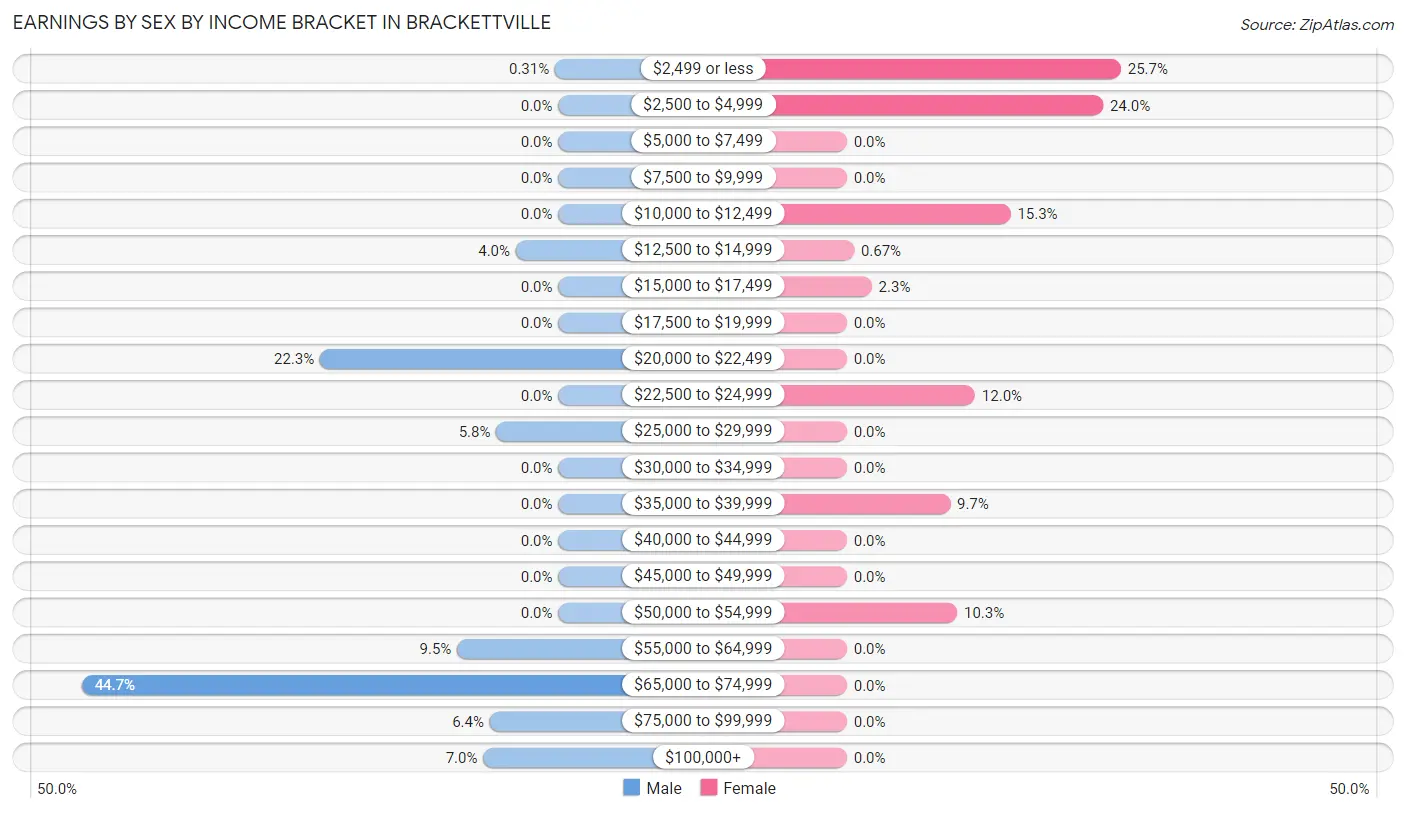
Earnings by Sex by Income Bracket in Brackettville
The most common earnings brackets in Brackettville are $65,000 to $74,999 for men (146 | 44.7%) and $2,499 or less for women (77 | 25.7%).
| Income | Male | Female |
| $2,499 or less | 1 (0.3%) | 77 (25.7%) |
| $2,500 to $4,999 | 0 (0.0%) | 72 (24.0%) |
| $5,000 to $7,499 | 0 (0.0%) | 0 (0.0%) |
| $7,500 to $9,999 | 0 (0.0%) | 0 (0.0%) |
| $10,000 to $12,499 | 0 (0.0%) | 46 (15.3%) |
| $12,500 to $14,999 | 13 (4.0%) | 2 (0.7%) |
| $15,000 to $17,499 | 0 (0.0%) | 7 (2.3%) |
| $17,500 to $19,999 | 0 (0.0%) | 0 (0.0%) |
| $20,000 to $22,499 | 73 (22.3%) | 0 (0.0%) |
| $22,500 to $24,999 | 0 (0.0%) | 36 (12.0%) |
| $25,000 to $29,999 | 19 (5.8%) | 0 (0.0%) |
| $30,000 to $34,999 | 0 (0.0%) | 0 (0.0%) |
| $35,000 to $39,999 | 0 (0.0%) | 29 (9.7%) |
| $40,000 to $44,999 | 0 (0.0%) | 0 (0.0%) |
| $45,000 to $49,999 | 0 (0.0%) | 0 (0.0%) |
| $50,000 to $54,999 | 0 (0.0%) | 31 (10.3%) |
| $55,000 to $64,999 | 31 (9.5%) | 0 (0.0%) |
| $65,000 to $74,999 | 146 (44.7%) | 0 (0.0%) |
| $75,000 to $99,999 | 21 (6.4%) | 0 (0.0%) |
| $100,000+ | 23 (7.0%) | 0 (0.0%) |
| Total | 327 (100.0%) | 300 (100.0%) |
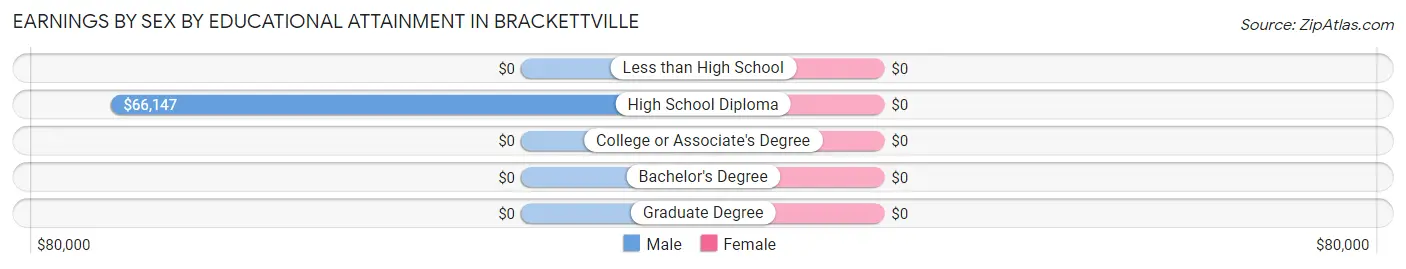
Earnings by Sex by Educational Attainment in Brackettville
| Educational Attainment | Male Income | Female Income |
| Less than High School | - | - |
| High School Diploma | $66,147 | $0 |
| College or Associate's Degree | - | - |
| Bachelor's Degree | - | - |
| Graduate Degree | - | - |
| Total | $65,651 | $23,993 |
Family Income in Brackettville
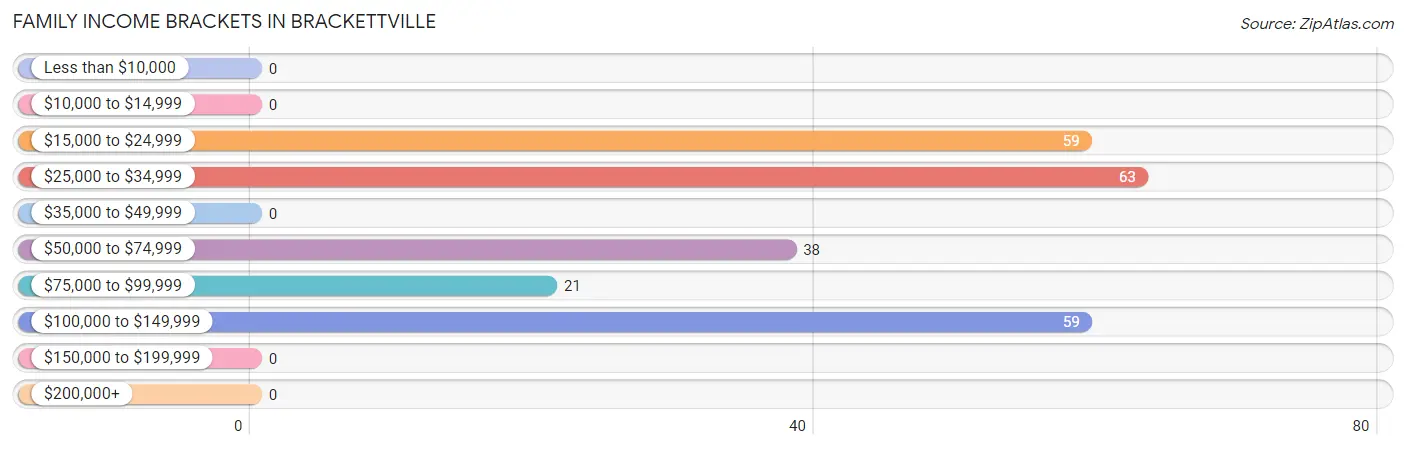
Family Income Brackets in Brackettville
According to the Brackettville family income data, there are 63 families falling into the $25,000 to $34,999 income range, which is the most common income bracket and makes up 26.3% of all families.
| Income Bracket | # Families | % Families |
| Less than $10,000 | 0 | 0.0% |
| $10,000 to $14,999 | 0 | 0.0% |
| $15,000 to $24,999 | 59 | 24.6% |
| $25,000 to $34,999 | 63 | 26.3% |
| $35,000 to $49,999 | 0 | 0.0% |
| $50,000 to $74,999 | 38 | 15.8% |
| $75,000 to $99,999 | 21 | 8.8% |
| $100,000 to $149,999 | 59 | 24.6% |
| $150,000 to $199,999 | 0 | 0.0% |
| $200,000+ | 0 | 0.0% |
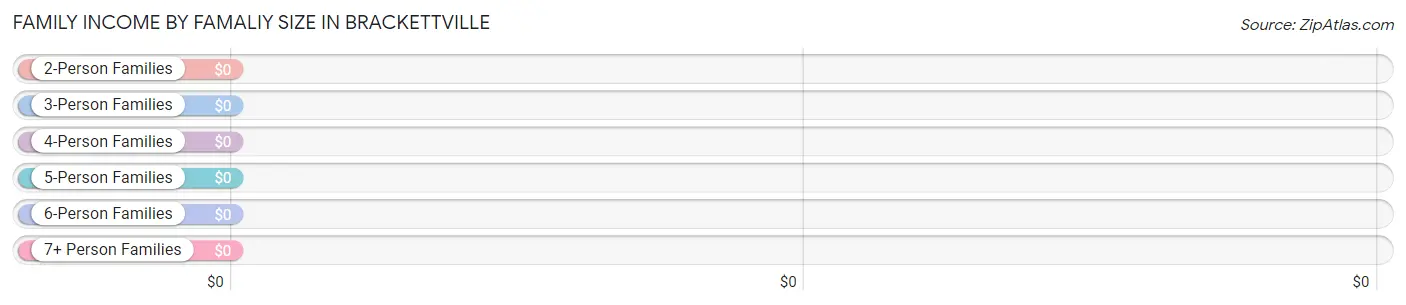
Family Income by Famaliy Size in Brackettville
| Income Bracket | # Families | Median Income |
| 2-Person Families | 52 (21.7%) | $0 |
| 3-Person Families | 73 (30.4%) | $0 |
| 4-Person Families | 96 (40.0%) | $0 |
| 5-Person Families | 19 (7.9%) | $0 |
| 6-Person Families | 0 (0.0%) | $0 |
| 7+ Person Families | 0 (0.0%) | $0 |
| Total | 240 (100.0%) | $0 |
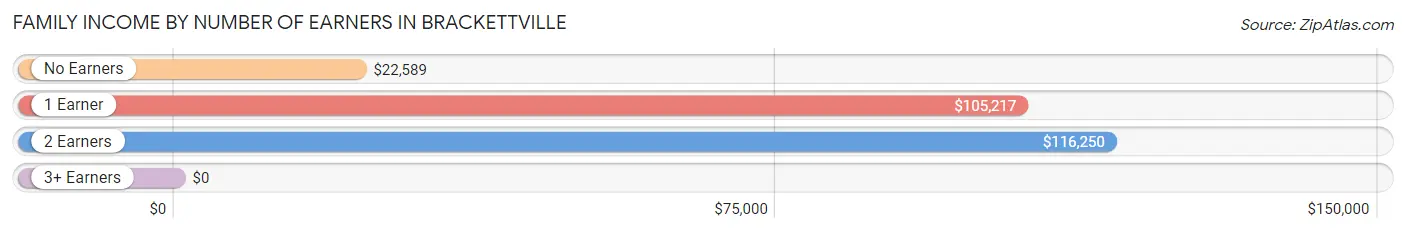
Family Income by Number of Earners in Brackettville
| Number of Earners | # Families | Median Income |
| No Earners | 61 (25.4%) | $22,589 |
| 1 Earner | 56 (23.3%) | $105,217 |
| 2 Earners | 58 (24.2%) | $116,250 |
| 3+ Earners | 65 (27.1%) | $0 |
| Total | 240 (100.0%) | $0 |
Household Income in Brackettville
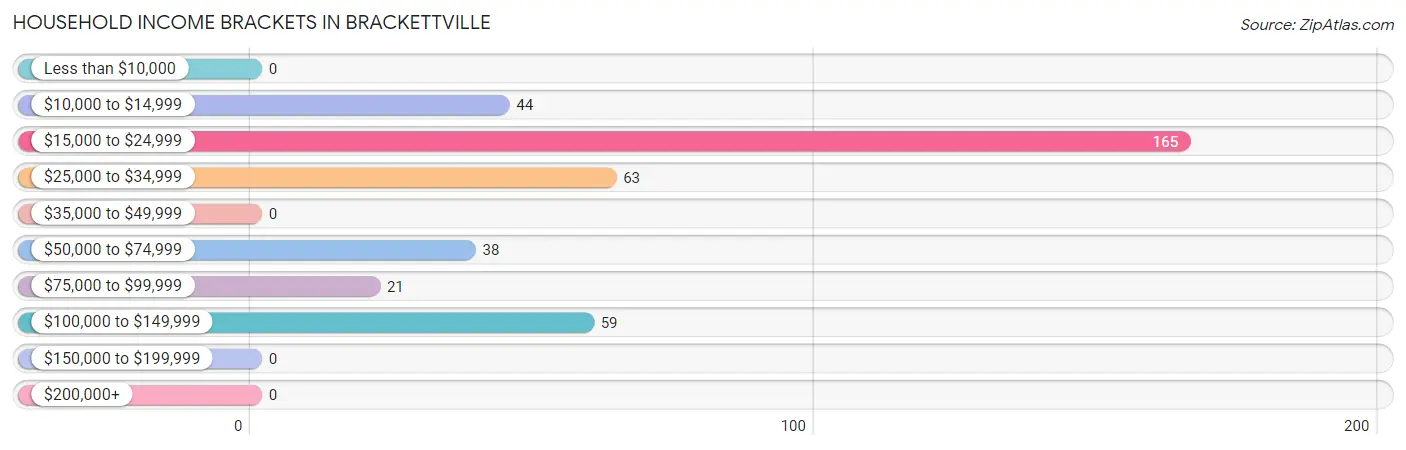
Household Income Brackets in Brackettville
With 165 households falling in the category, the $15,000 to $24,999 income range is the most frequent in Brackettville, accounting for 42.3% of all households.
| Income Bracket | # Households | % Households |
| Less than $10,000 | 0 | 0.0% |
| $10,000 to $14,999 | 44 | 11.3% |
| $15,000 to $24,999 | 165 | 42.3% |
| $25,000 to $34,999 | 63 | 16.2% |
| $35,000 to $49,999 | 0 | 0.0% |
| $50,000 to $74,999 | 38 | 9.7% |
| $75,000 to $99,999 | 21 | 5.4% |
| $100,000 to $149,999 | 59 | 15.1% |
| $150,000 to $199,999 | 0 | 0.0% |
| $200,000+ | 0 | 0.0% |
Household Income by Householder Age in Brackettville
The median household income in Brackettville is $24,539, with the highest median household income of $92,202 found in the 25 to 44 years age bracket for the primary householder. A total of 51 households (13.1%) fall into this category. Meanwhile, the 15 to 24 years age bracket for the primary householder has the lowest median household income of $0, with 27 households (6.9%) in this group.
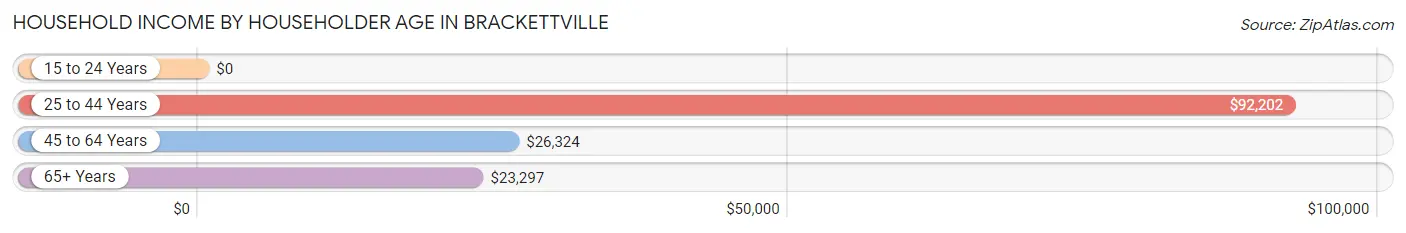
| Income Bracket | # Households | Median Income |
| 15 to 24 Years | 27 (6.9%) | $0 |
| 25 to 44 Years | 51 (13.1%) | $92,202 |
| 45 to 64 Years | 160 (41.0%) | $26,324 |
| 65+ Years | 152 (39.0%) | $23,297 |
| Total | 390 (100.0%) | $24,539 |
Poverty in Brackettville
Income Below Poverty by Sex and Age in Brackettville
With 17.7% poverty level for males and 29.8% for females among the residents of Brackettville, 55 to 64 year old males and 12 to 14 year old females are the most vulnerable to poverty, with 43 males (86.0%) and 25 females (100.0%) in their respective age groups living below the poverty level.
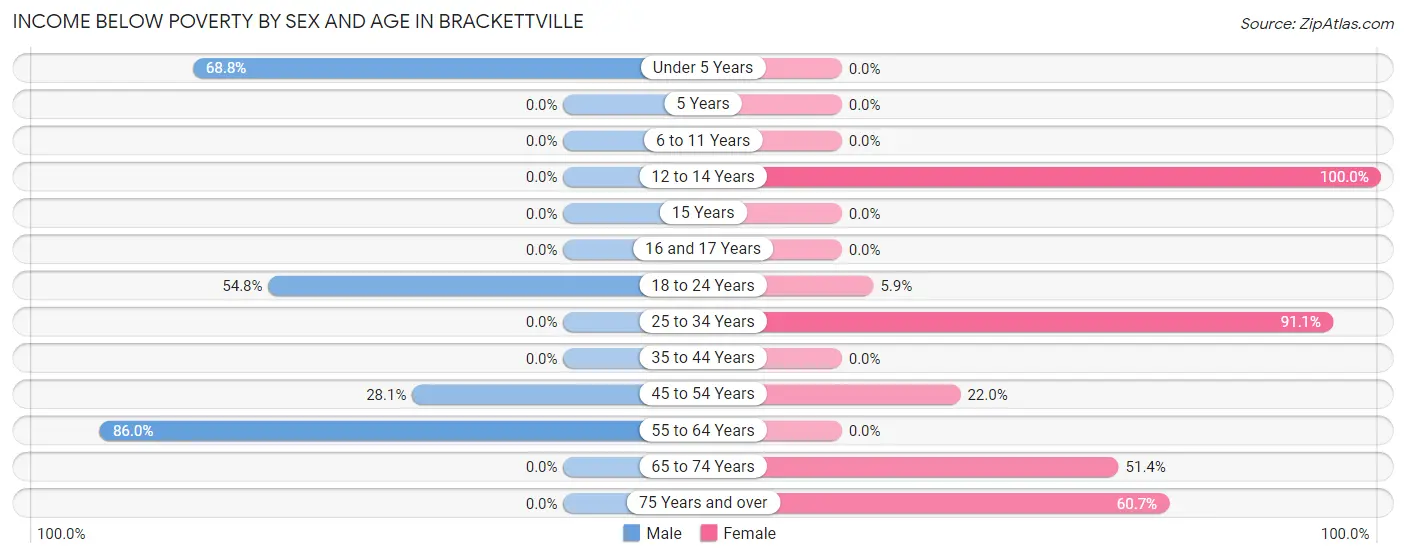
| Age Bracket | Male | Female |
| Under 5 Years | 44 (68.8%) | 0 (0.0%) |
| 5 Years | 0 (0.0%) | 0 (0.0%) |
| 6 to 11 Years | 0 (0.0%) | 0 (0.0%) |
| 12 to 14 Years | 0 (0.0%) | 25 (100.0%) |
| 15 Years | 0 (0.0%) | 0 (0.0%) |
| 16 and 17 Years | 0 (0.0%) | 0 (0.0%) |
| 18 to 24 Years | 23 (54.8%) | 10 (5.9%) |
| 25 to 34 Years | 0 (0.0%) | 72 (91.1%) |
| 35 to 44 Years | 0 (0.0%) | 0 (0.0%) |
| 45 to 54 Years | 23 (28.1%) | 13 (22.0%) |
| 55 to 64 Years | 43 (86.0%) | 0 (0.0%) |
| 65 to 74 Years | 0 (0.0%) | 56 (51.4%) |
| 75 Years and over | 0 (0.0%) | 17 (60.7%) |
| Total | 133 (17.7%) | 193 (29.8%) |
Income Above Poverty by Sex and Age in Brackettville
According to the poverty statistics in Brackettville, males aged 5 years and females aged under 5 years are the age groups that are most secure financially, with 100.0% of males and 100.0% of females in these age groups living above the poverty line.
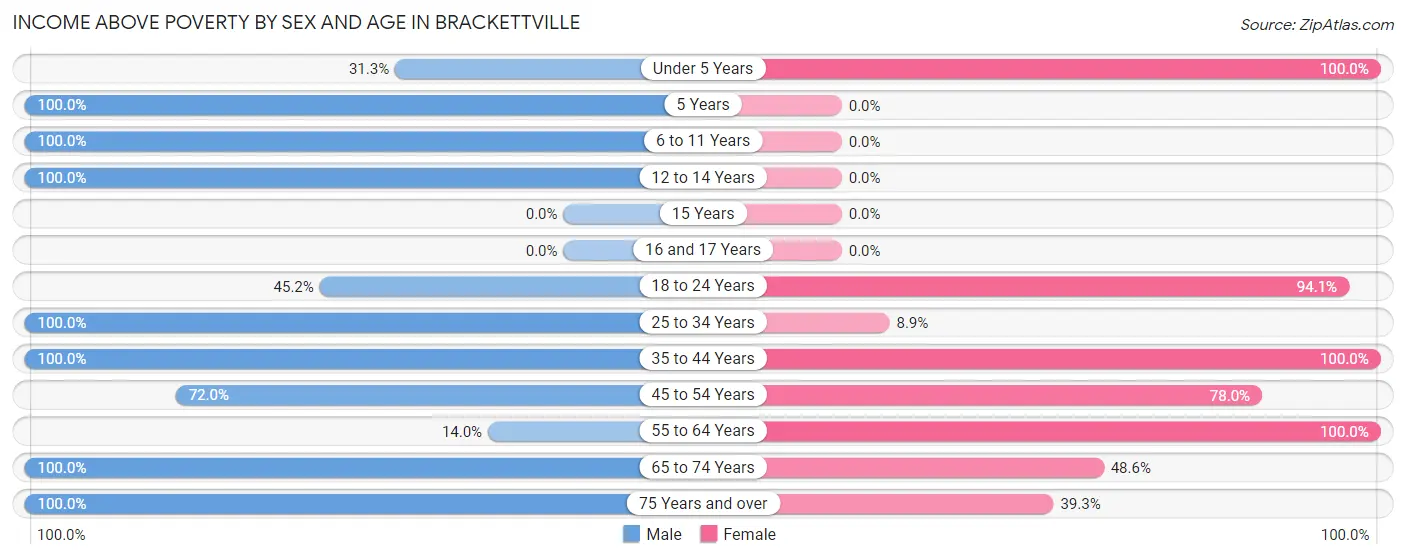
| Age Bracket | Male | Female |
| Under 5 Years | 20 (31.2%) | 71 (100.0%) |
| 5 Years | 31 (100.0%) | 0 (0.0%) |
| 6 to 11 Years | 48 (100.0%) | 0 (0.0%) |
| 12 to 14 Years | 29 (100.0%) | 0 (0.0%) |
| 15 Years | 0 (0.0%) | 0 (0.0%) |
| 16 and 17 Years | 0 (0.0%) | 0 (0.0%) |
| 18 to 24 Years | 19 (45.2%) | 160 (94.1%) |
| 25 to 34 Years | 263 (100.0%) | 7 (8.9%) |
| 35 to 44 Years | 21 (100.0%) | 63 (100.0%) |
| 45 to 54 Years | 59 (72.0%) | 46 (78.0%) |
| 55 to 64 Years | 7 (14.0%) | 43 (100.0%) |
| 65 to 74 Years | 115 (100.0%) | 53 (48.6%) |
| 75 Years and over | 8 (100.0%) | 11 (39.3%) |
| Total | 620 (82.3%) | 454 (70.2%) |
Income Below Poverty Among Married-Couple Families in Brackettville
The poverty statistics for married-couple families in Brackettville show that 7.1% or 8 of the total 113 families live below the poverty line. Families with 1 or 2 children have the highest poverty rate of 29.6%, comprising of 8 families. On the other hand, families with no children have the lowest poverty rate of 0.0%, which includes 0 families.
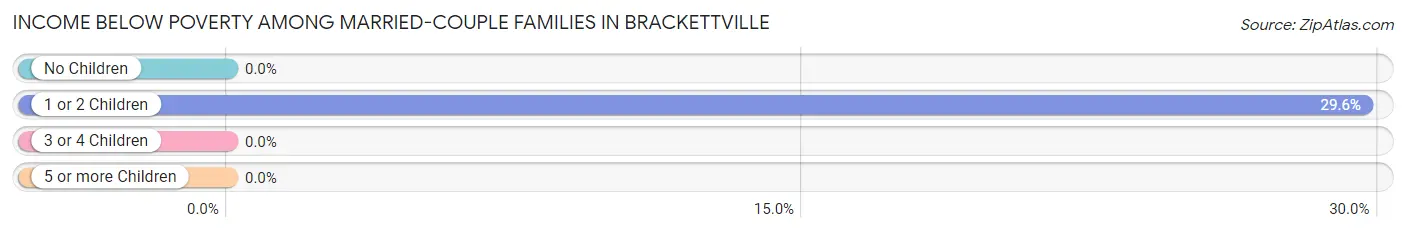
| Children | Above Poverty | Below Poverty |
| No Children | 67 (100.0%) | 0 (0.0%) |
| 1 or 2 Children | 19 (70.4%) | 8 (29.6%) |
| 3 or 4 Children | 19 (100.0%) | 0 (0.0%) |
| 5 or more Children | 0 (0.0%) | 0 (0.0%) |
| Total | 105 (92.9%) | 8 (7.1%) |
Income Below Poverty Among Single-Parent Households in Brackettville
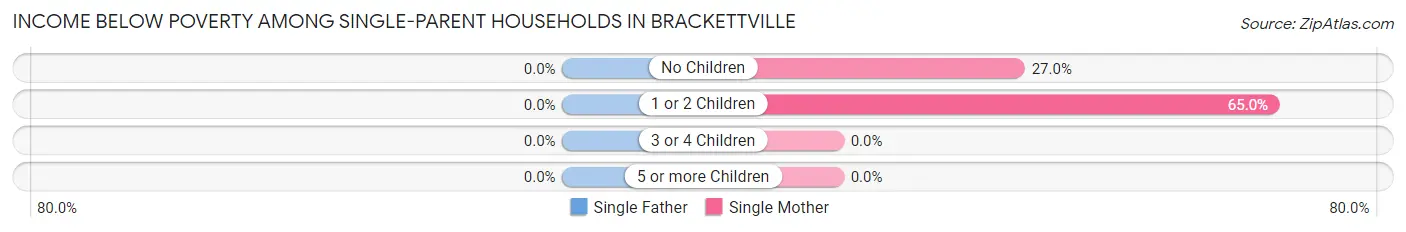
| Children | Single Father | Single Mother |
| No Children | 0 (0.0%) | 17 (27.0%) |
| 1 or 2 Children | 0 (0.0%) | 13 (65.0%) |
| 3 or 4 Children | 0 (0.0%) | 0 (0.0%) |
| 5 or more Children | 0 (0.0%) | 0 (0.0%) |
| Total | 0 (0.0%) | 30 (36.1%) |
Income Below Poverty Among Married-Couple vs Single-Parent Households in Brackettville
The poverty data for Brackettville shows that 8 of the married-couple family households (7.1%) and 30 of the single-parent households (23.6%) are living below the poverty level. Within the married-couple family households, those with 1 or 2 children have the highest poverty rate, with 8 households (29.6%) falling below the poverty line. Among the single-parent households, those with 1 or 2 children have the highest poverty rate, with 13 household (65.0%) living below poverty.
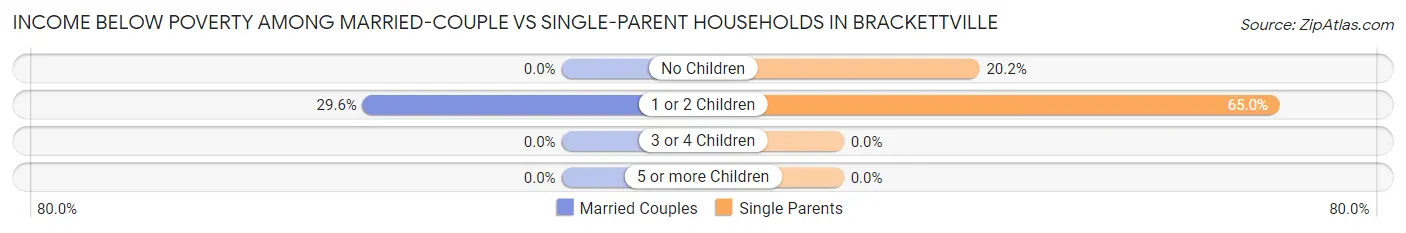
| Children | Married-Couple Families | Single-Parent Households |
| No Children | 0 (0.0%) | 17 (20.2%) |
| 1 or 2 Children | 8 (29.6%) | 13 (65.0%) |
| 3 or 4 Children | 0 (0.0%) | 0 (0.0%) |
| 5 or more Children | 0 (0.0%) | 0 (0.0%) |
| Total | 8 (7.1%) | 30 (23.6%) |
Race in Brackettville
The most populous races in Brackettville are Hispanic or Latino (1,181 | 83.9%), White / Caucasian (1,046 | 74.3%), and Two or more Races (326 | 23.2%).
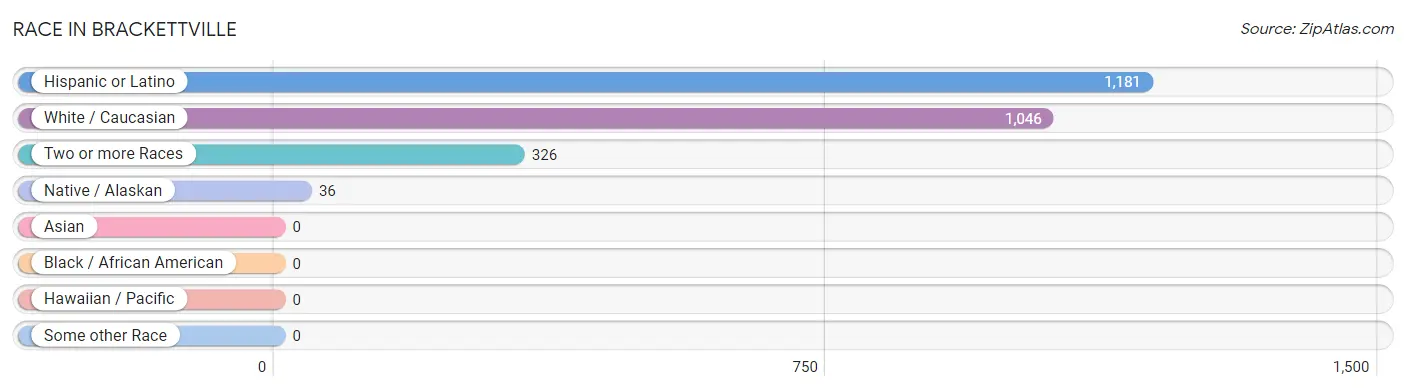
| Race | # Population | % Population |
| Asian | 0 | 0.0% |
| Black / African American | 0 | 0.0% |
| Hawaiian / Pacific | 0 | 0.0% |
| Hispanic or Latino | 1,181 | 83.9% |
| Native / Alaskan | 36 | 2.6% |
| White / Caucasian | 1,046 | 74.3% |
| Two or more Races | 326 | 23.2% |
| Some other Race | 0 | 0.0% |
| Total | 1,408 | 100.0% |
Ancestry in Brackettville
The most populous ancestries reported in Brackettville are Mexican (1,079 | 76.6%), German (132 | 9.4%), Irish (101 | 7.2%), Puerto Rican (42 | 3.0%), and Apache (36 | 2.6%), together accounting for 98.7% of all Brackettville residents.
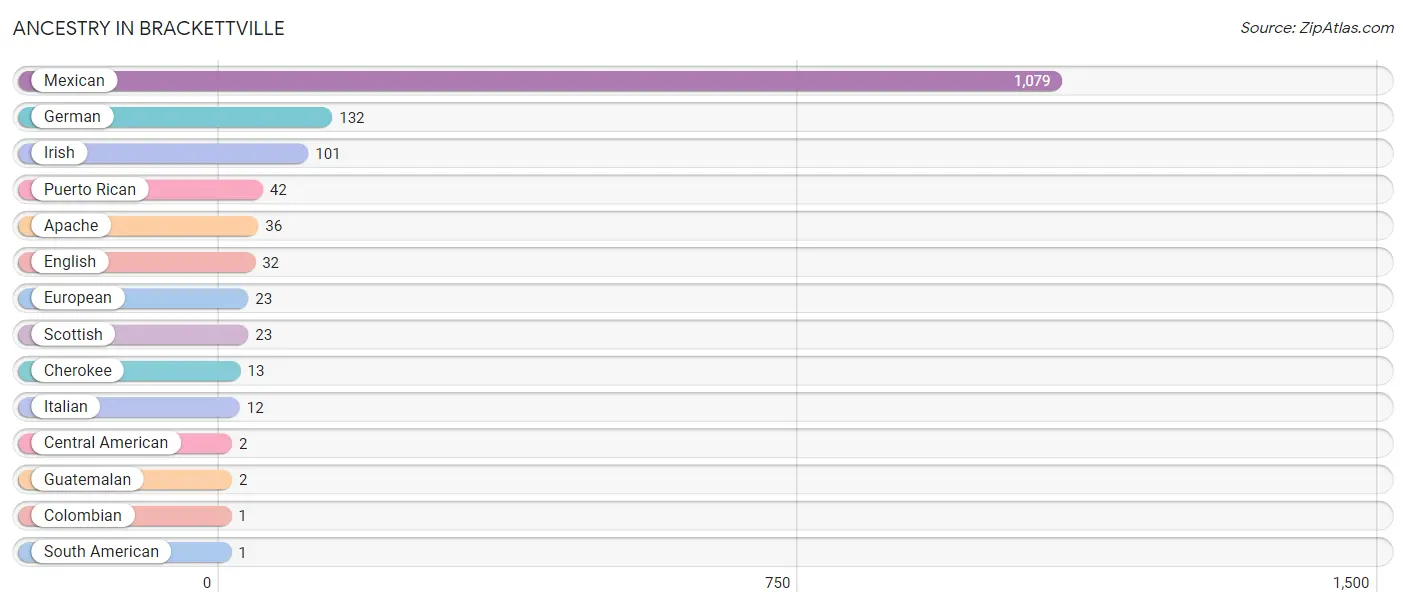
| Ancestry | # Population | % Population |
| Apache | 36 | 2.6% |
| Central American | 2 | 0.1% |
| Cherokee | 13 | 0.9% |
| Colombian | 1 | 0.1% |
| English | 32 | 2.3% |
| European | 23 | 1.6% |
| German | 132 | 9.4% |
| Guatemalan | 2 | 0.1% |
| Irish | 101 | 7.2% |
| Italian | 12 | 0.9% |
| Mexican | 1,079 | 76.6% |
| Puerto Rican | 42 | 3.0% |
| Scottish | 23 | 1.6% |
| South American | 1 | 0.1% | View All 14 Rows |
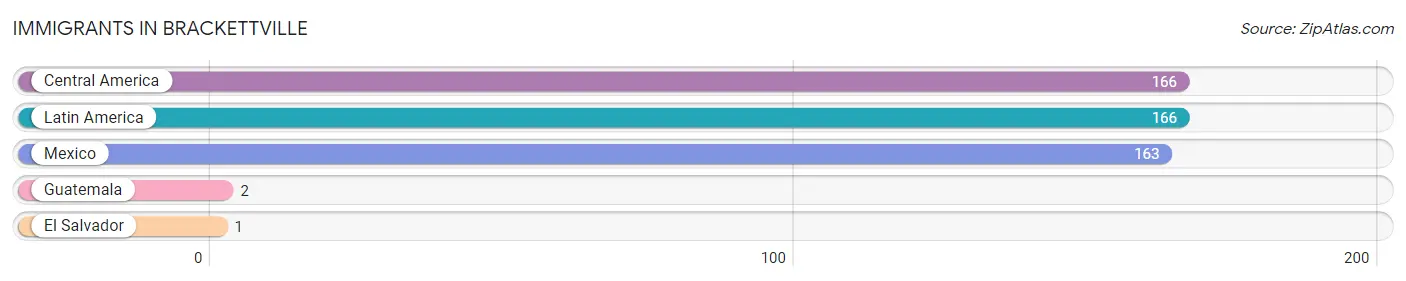
Immigrants in Brackettville
The most numerous immigrant groups reported in Brackettville came from Central America (166 | 11.8%), Latin America (166 | 11.8%), Mexico (163 | 11.6%), Guatemala (2 | 0.1%), and El Salvador (1 | 0.1%), together accounting for 35.4% of all Brackettville residents.
| Immigration Origin | # Population | % Population |
| Central America | 166 | 11.8% |
| El Salvador | 1 | 0.1% |
| Guatemala | 2 | 0.1% |
| Latin America | 166 | 11.8% |
| Mexico | 163 | 11.6% | View All 5 Rows |
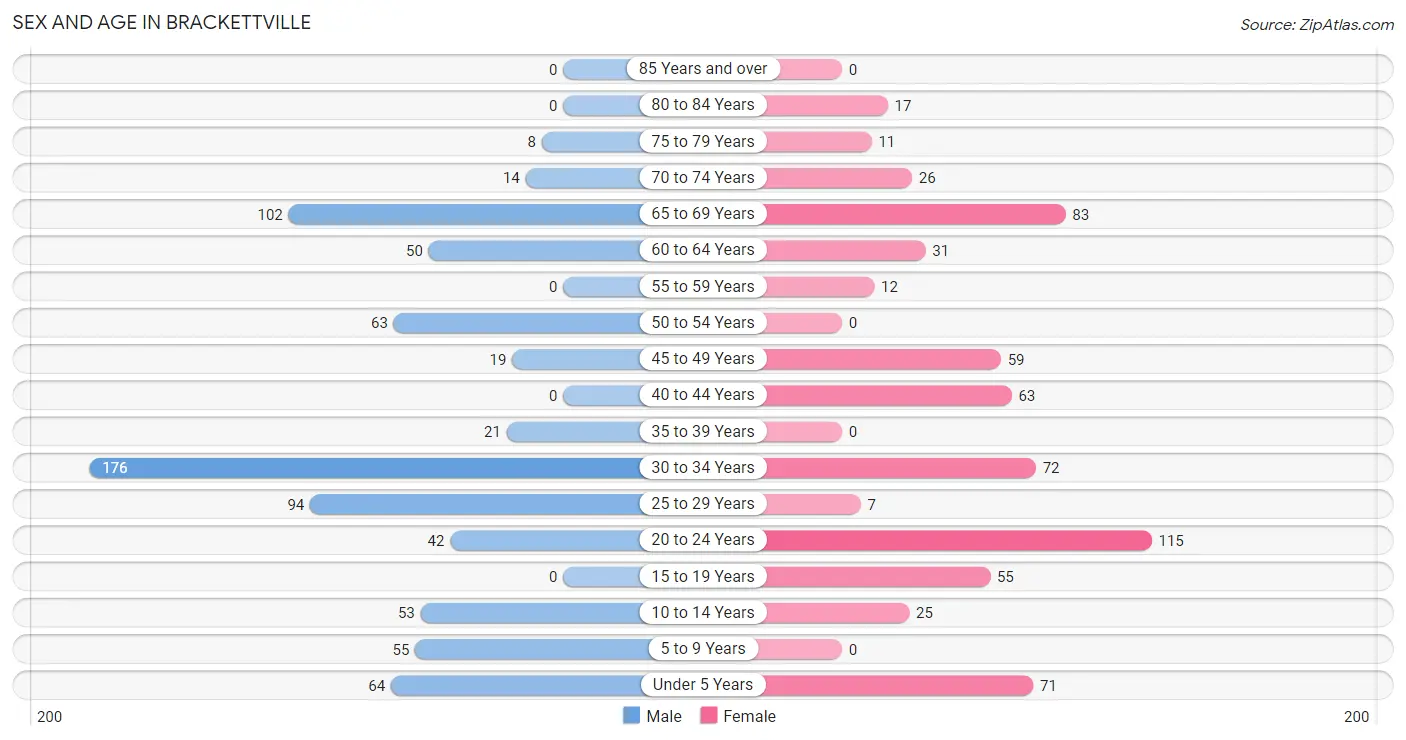
Sex and Age in Brackettville
Sex and Age in Brackettville
The most populous age groups in Brackettville are 30 to 34 Years (176 | 23.1%) for men and 20 to 24 Years (115 | 17.8%) for women.
| Age Bracket | Male | Female |
| Under 5 Years | 64 (8.4%) | 71 (11.0%) |
| 5 to 9 Years | 55 (7.2%) | 0 (0.0%) |
| 10 to 14 Years | 53 (7.0%) | 25 (3.9%) |
| 15 to 19 Years | 0 (0.0%) | 55 (8.5%) |
| 20 to 24 Years | 42 (5.5%) | 115 (17.8%) |
| 25 to 29 Years | 94 (12.3%) | 7 (1.1%) |
| 30 to 34 Years | 176 (23.1%) | 72 (11.1%) |
| 35 to 39 Years | 21 (2.8%) | 0 (0.0%) |
| 40 to 44 Years | 0 (0.0%) | 63 (9.7%) |
| 45 to 49 Years | 19 (2.5%) | 59 (9.1%) |
| 50 to 54 Years | 63 (8.3%) | 0 (0.0%) |
| 55 to 59 Years | 0 (0.0%) | 12 (1.8%) |
| 60 to 64 Years | 50 (6.6%) | 31 (4.8%) |
| 65 to 69 Years | 102 (13.4%) | 83 (12.8%) |
| 70 to 74 Years | 14 (1.8%) | 26 (4.0%) |
| 75 to 79 Years | 8 (1.1%) | 11 (1.7%) |
| 80 to 84 Years | 0 (0.0%) | 17 (2.6%) |
| 85 Years and over | 0 (0.0%) | 0 (0.0%) |
| Total | 761 (100.0%) | 647 (100.0%) |
Families and Households in Brackettville
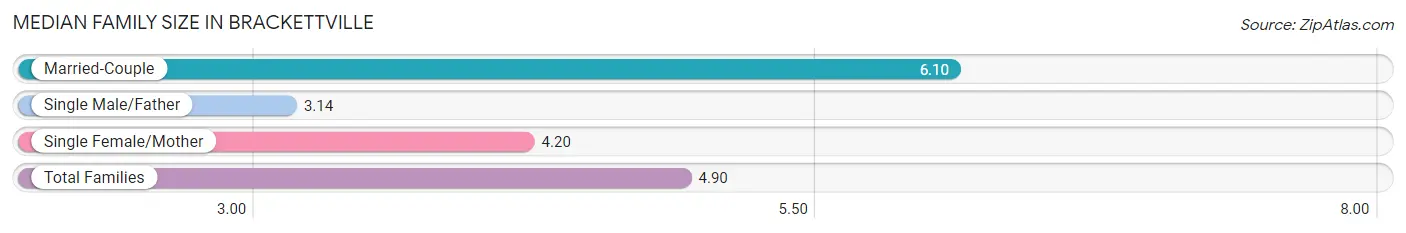
Median Family Size in Brackettville
The median family size in Brackettville is 4.90 persons per family, with married-couple families (113 | 47.1%) accounting for the largest median family size of 6.1 persons per family. On the other hand, single male/father families (44 | 18.3%) represent the smallest median family size with 3.14 persons per family.
| Family Type | # Families | Family Size |
| Married-Couple | 113 (47.1%) | 6.10 |
| Single Male/Father | 44 (18.3%) | 3.14 |
| Single Female/Mother | 83 (34.6%) | 4.20 |
| Total Families | 240 (100.0%) | 4.90 |
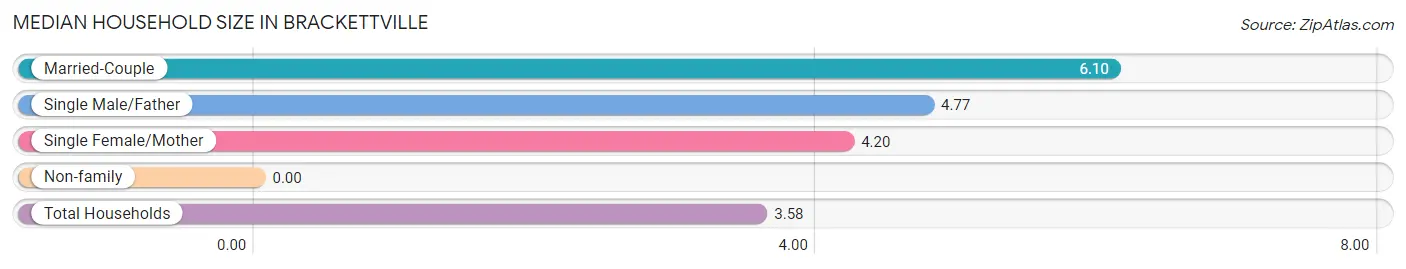
Median Household Size in Brackettville
| Household Type | # Households | Household Size |
| Married-Couple | 113 (29.0%) | 6.10 |
| Single Male/Father | 44 (11.3%) | 4.77 |
| Single Female/Mother | 83 (21.3%) | 4.20 |
| Non-family | 150 (38.5%) | - |
| Total Households | 390 (100.0%) | 3.58 |
Household Size by Marriage Status in Brackettville
Out of a total of 390 households in Brackettville, 240 (61.5%) are family households, while 150 (38.5%) are nonfamily households. The most numerous type of family households are 3-person households, comprising 73, and the most common type of nonfamily households are 1-person households, comprising 150.
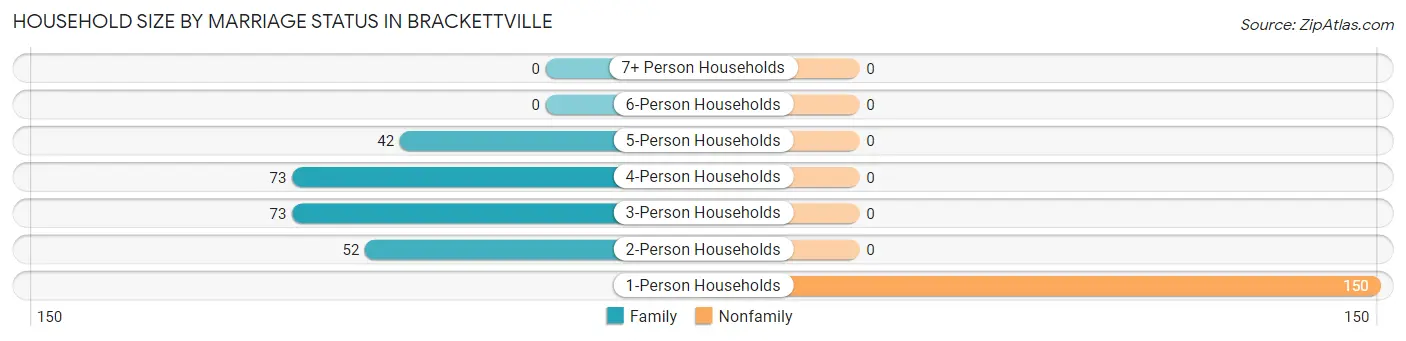
| Household Size | Family Households | Nonfamily Households |
| 1-Person Households | - | 150 (38.5%) |
| 2-Person Households | 52 (13.3%) | 0 (0.0%) |
| 3-Person Households | 73 (18.7%) | 0 (0.0%) |
| 4-Person Households | 73 (18.7%) | 0 (0.0%) |
| 5-Person Households | 42 (10.8%) | 0 (0.0%) |
| 6-Person Households | 0 (0.0%) | 0 (0.0%) |
| 7+ Person Households | 0 (0.0%) | 0 (0.0%) |
| Total | 240 (61.5%) | 150 (38.5%) |
Female Fertility in Brackettville
Fertility by Age in Brackettville
Average fertility rate in Brackettville is 51.0 births per 1,000 women. Women in the age bracket of 20 to 34 years have the highest fertility rate with 98.0 births per 1,000 women. Women in the age bracket of 20 to 34 years acount for 100.0% of all women with births.
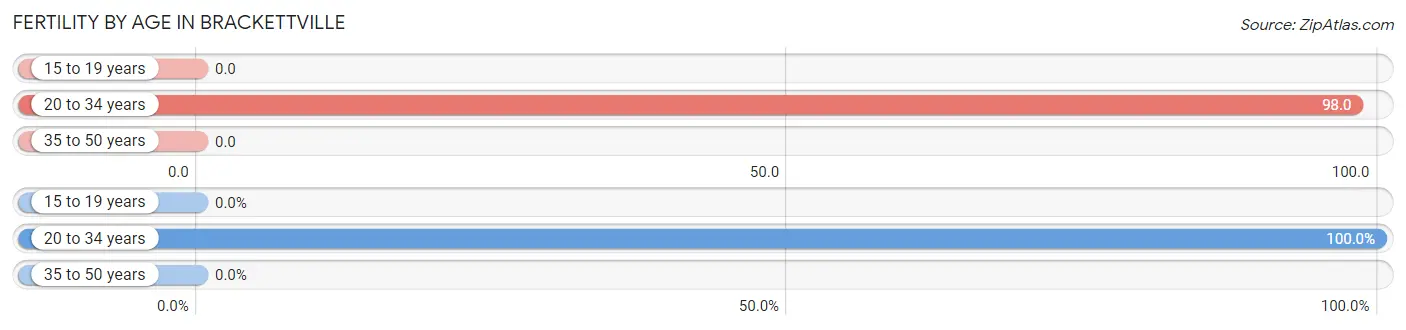
| Age Bracket | Women with Births | Births / 1,000 Women |
| 15 to 19 years | 0 (0.0%) | 0.0 |
| 20 to 34 years | 19 (100.0%) | 98.0 |
| 35 to 50 years | 0 (0.0%) | 0.0 |
| Total | 19 (100.0%) | 51.0 |
Fertility by Age by Marriage Status in Brackettville
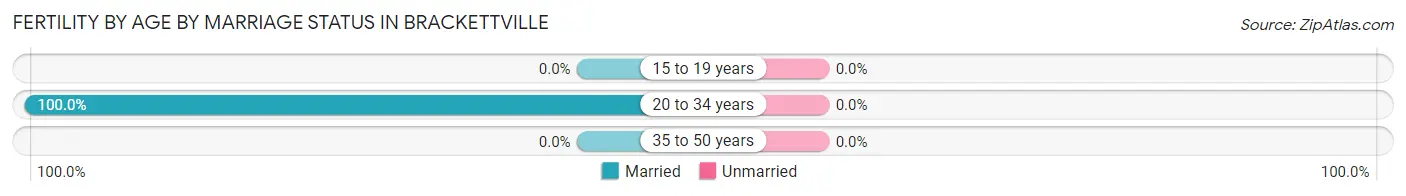
| Age Bracket | Married | Unmarried |
| 15 to 19 years | 0 (0.0%) | 0 (0.0%) |
| 20 to 34 years | 19 (100.0%) | 0 (0.0%) |
| 35 to 50 years | 0 (0.0%) | 0 (0.0%) |
| Total | 19 (100.0%) | 0 (0.0%) |
Fertility by Education in Brackettville
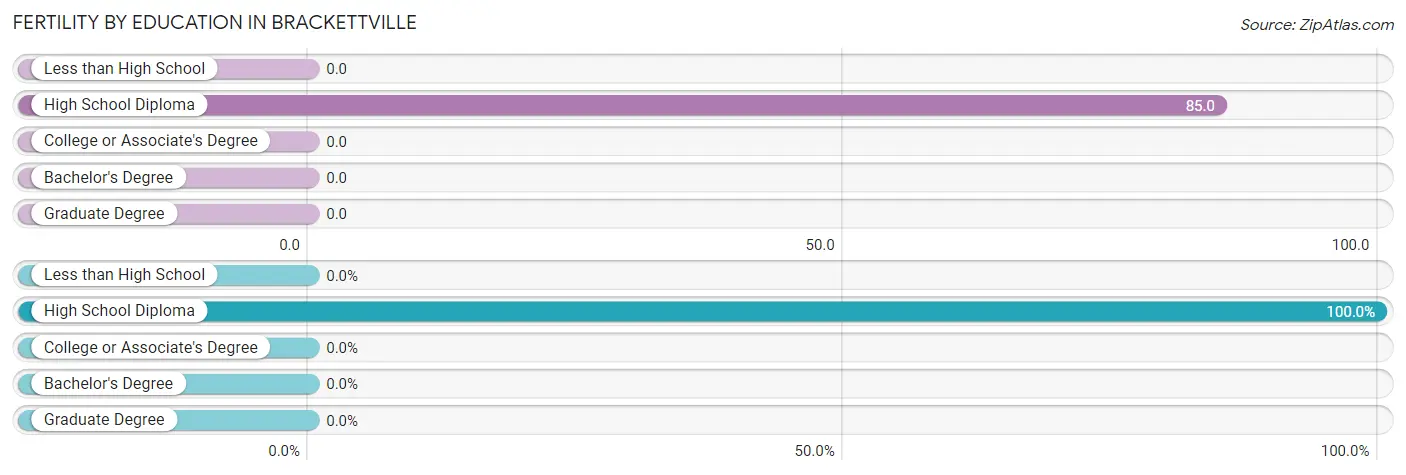
| Educational Attainment | Women with Births | Births / 1,000 Women |
| Less than High School | 0 (0.0%) | 0.0 |
| High School Diploma | 19 (100.0%) | 85.0 |
| College or Associate's Degree | 0 (0.0%) | 0.0 |
| Bachelor's Degree | 0 (0.0%) | 0.0 |
| Graduate Degree | 0 (0.0%) | 0.0 |
| Total | 19 (100.0%) | 51.0 |
Fertility by Education by Marriage Status in Brackettville
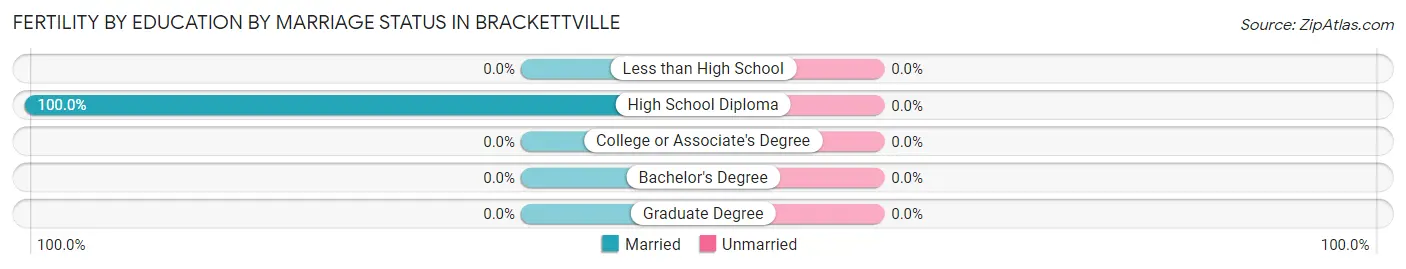
| Educational Attainment | Married | Unmarried |
| Less than High School | 0 (0.0%) | 0 (0.0%) |
| High School Diploma | 19 (100.0%) | 0 (0.0%) |
| College or Associate's Degree | 0 (0.0%) | 0 (0.0%) |
| Bachelor's Degree | 0 (0.0%) | 0 (0.0%) |
| Graduate Degree | 0 (0.0%) | 0 (0.0%) |
| Total | 19 (100.0%) | 0 (0.0%) |
Employment Characteristics in Brackettville
Employment by Class of Employer in Brackettville
Among the 591 employed individuals in Brackettville, private company employees (292 | 49.4%), local government employees (132 | 22.3%), and self-employed (not incorporated) (82 | 13.9%) make up the most common classes of employment.
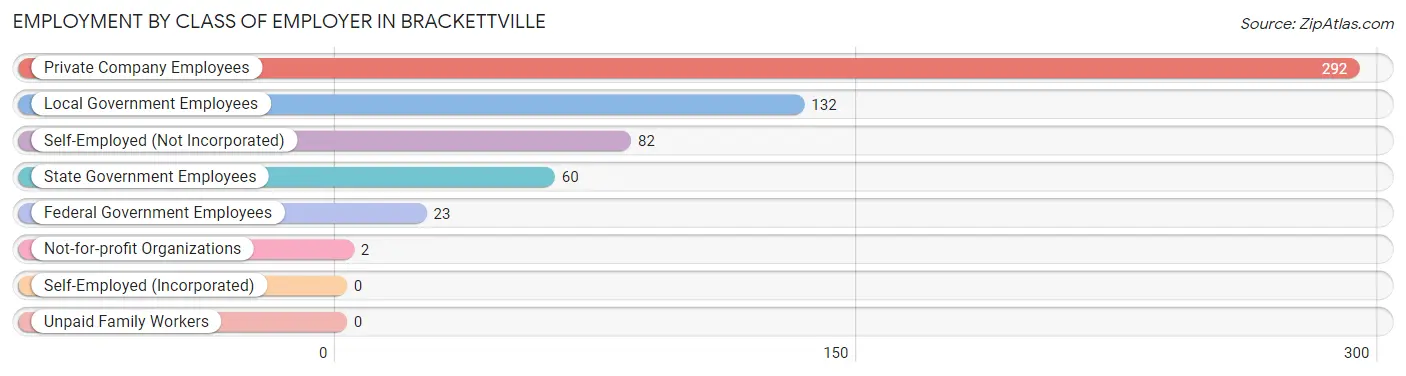
| Employer Class | # Employees | % Employees |
| Private Company Employees | 292 | 49.4% |
| Self-Employed (Incorporated) | 0 | 0.0% |
| Self-Employed (Not Incorporated) | 82 | 13.9% |
| Not-for-profit Organizations | 2 | 0.3% |
| Local Government Employees | 132 | 22.3% |
| State Government Employees | 60 | 10.2% |
| Federal Government Employees | 23 | 3.9% |
| Unpaid Family Workers | 0 | 0.0% |
| Total | 591 | 100.0% |
Employment Status by Age in Brackettville
According to the labor force statistics for Brackettville, out of the total population over 16 years of age (1,140), 54.1% or 617 individuals are in the labor force, with 4.2% or 26 of them unemployed. The age group with the highest labor force participation rate is 25 to 29 years, with 100.0% or 101 individuals in the labor force. Within the labor force, the 60 to 64 years age range has the highest percentage of unemployed individuals, with 18.4% or 7 of them being unemployed.
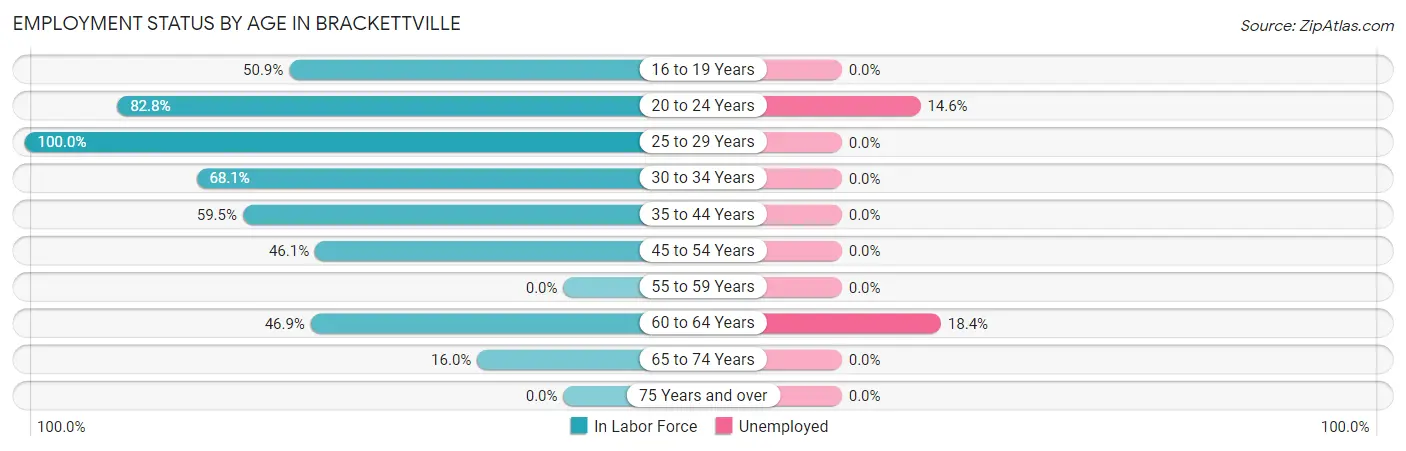
| Age Bracket | In Labor Force | Unemployed |
| 16 to 19 Years | 28 (50.9%) | 0 (0.0%) |
| 20 to 24 Years | 130 (82.8%) | 19 (14.6%) |
| 25 to 29 Years | 101 (100.0%) | 0 (0.0%) |
| 30 to 34 Years | 169 (68.1%) | 0 (0.0%) |
| 35 to 44 Years | 50 (59.5%) | 0 (0.0%) |
| 45 to 54 Years | 65 (46.1%) | 0 (0.0%) |
| 55 to 59 Years | 0 (0.0%) | 0 (0.0%) |
| 60 to 64 Years | 38 (46.9%) | 7 (18.4%) |
| 65 to 74 Years | 36 (16.0%) | 0 (0.0%) |
| 75 Years and over | 0 (0.0%) | 0 (0.0%) |
| Total | 617 (54.1%) | 26 (4.2%) |
Employment Status by Educational Attainment in Brackettville
According to labor force statistics for Brackettville, 63.4% of individuals (423) out of the total population between 25 and 64 years of age (667) are in the labor force, with 1.7% or 7 of them being unemployed. The group with the highest labor force participation rate are those with the educational attainment of high school diploma, with 85.5% or 283 individuals in the labor force. Within the labor force, individuals with college / associate degree education have the highest percentage of unemployment, with 6.4% or 7 of them being unemployed.
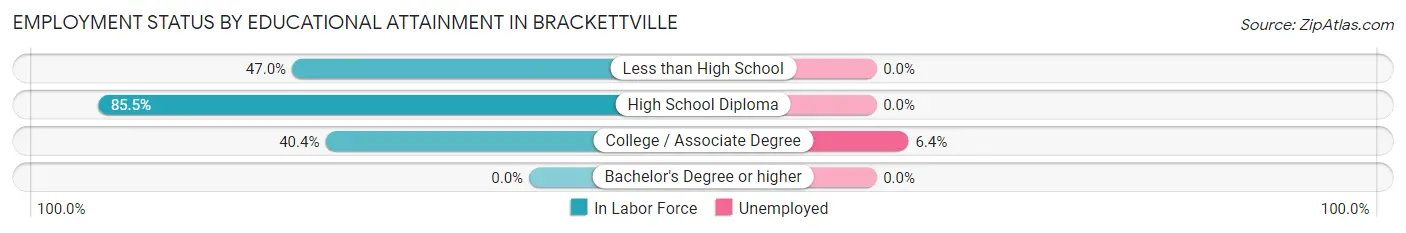
| Educational Attainment | In Labor Force | Unemployed |
| Less than High School | 31 (47.0%) | 0 (0.0%) |
| High School Diploma | 283 (85.5%) | 0 (0.0%) |
| College / Associate Degree | 109 (40.4%) | 17 (6.4%) |
| Bachelor's Degree or higher | 0 (0.0%) | 0 (0.0%) |
| Total | 423 (63.4%) | 11 (1.7%) |
Employment Occupations by Sex in Brackettville
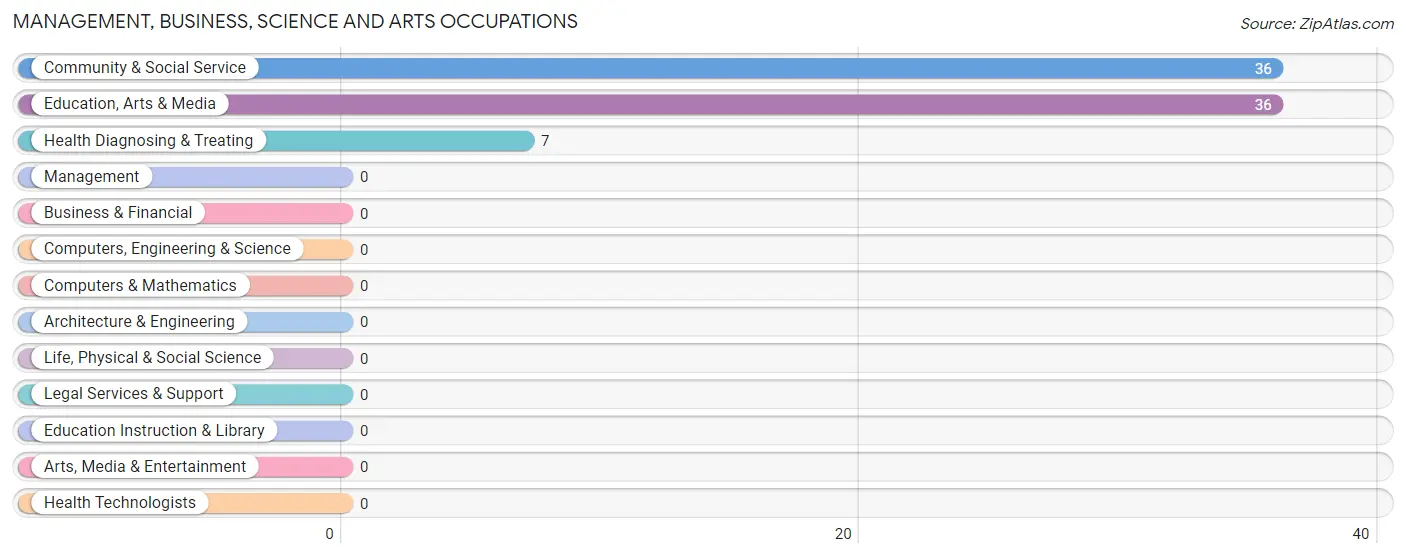
Management, Business, Science and Arts Occupations
The most common Management, Business, Science and Arts occupations in Brackettville are Community & Social Service (36 | 6.1%), Education, Arts & Media (36 | 6.1%), and Health Diagnosing & Treating (7 | 1.2%).
Management, Business, Science and Arts Occupations by Sex
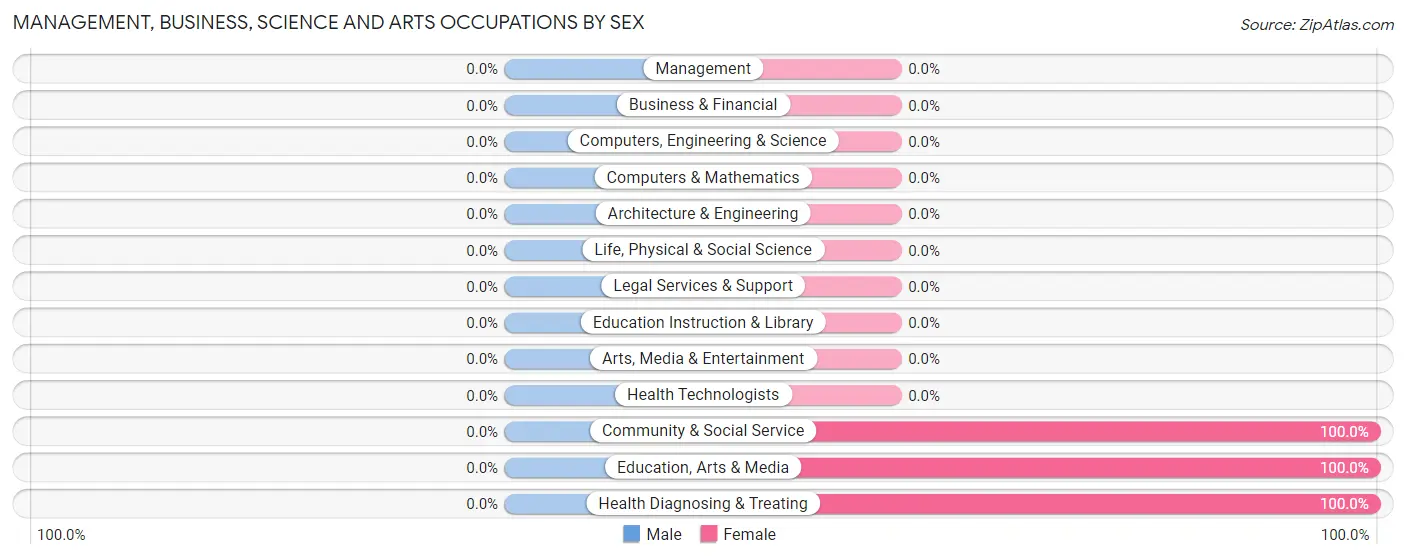
| Occupation | Male | Female |
| Management | 0 (0.0%) | 0 (0.0%) |
| Business & Financial | 0 (0.0%) | 0 (0.0%) |
| Computers, Engineering & Science | 0 (0.0%) | 0 (0.0%) |
| Computers & Mathematics | 0 (0.0%) | 0 (0.0%) |
| Architecture & Engineering | 0 (0.0%) | 0 (0.0%) |
| Life, Physical & Social Science | 0 (0.0%) | 0 (0.0%) |
| Community & Social Service | 0 (0.0%) | 36 (100.0%) |
| Education, Arts & Media | 0 (0.0%) | 36 (100.0%) |
| Legal Services & Support | 0 (0.0%) | 0 (0.0%) |
| Education Instruction & Library | 0 (0.0%) | 0 (0.0%) |
| Arts, Media & Entertainment | 0 (0.0%) | 0 (0.0%) |
| Health Diagnosing & Treating | 0 (0.0%) | 7 (100.0%) |
| Health Technologists | 0 (0.0%) | 0 (0.0%) |
| Total (Category) | 0 (0.0%) | 43 (100.0%) |
| Total (Overall) | 326 (55.2%) | 265 (44.8%) |
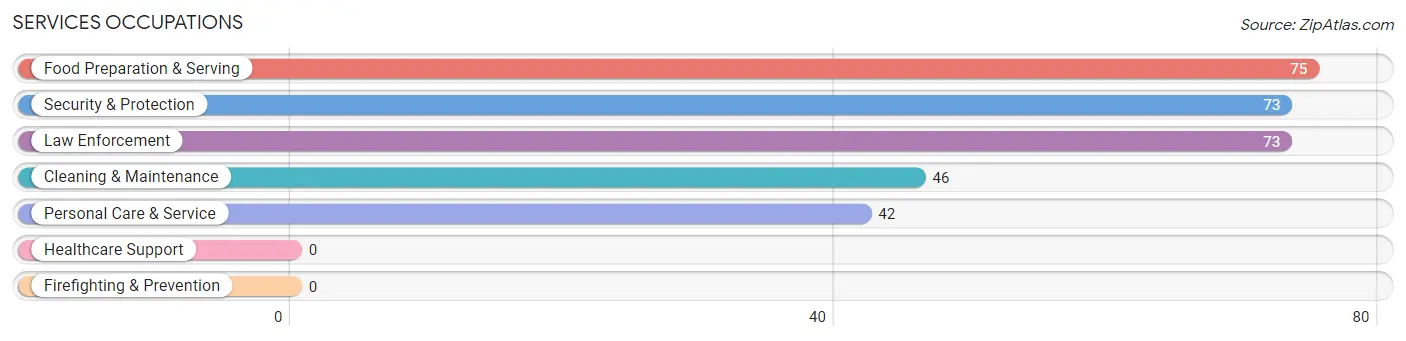
Services Occupations
The most common Services occupations in Brackettville are Food Preparation & Serving (75 | 12.7%), Security & Protection (73 | 12.3%), Law Enforcement (73 | 12.3%), Cleaning & Maintenance (46 | 7.8%), and Personal Care & Service (42 | 7.1%).
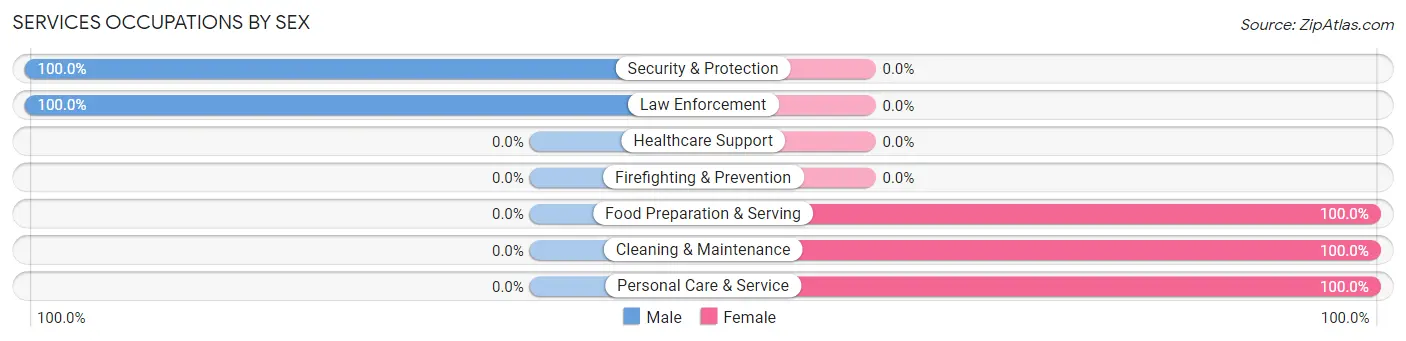
Services Occupations by Sex
Within the Services occupations in Brackettville, the most male-oriented occupations are Security & Protection (100.0%), and Law Enforcement (100.0%), while the most female-oriented occupations are Food Preparation & Serving (100.0%), Cleaning & Maintenance (100.0%), and Personal Care & Service (100.0%).
| Occupation | Male | Female |
| Healthcare Support | 0 (0.0%) | 0 (0.0%) |
| Security & Protection | 73 (100.0%) | 0 (0.0%) |
| Firefighting & Prevention | 0 (0.0%) | 0 (0.0%) |
| Law Enforcement | 73 (100.0%) | 0 (0.0%) |
| Food Preparation & Serving | 0 (0.0%) | 75 (100.0%) |
| Cleaning & Maintenance | 0 (0.0%) | 46 (100.0%) |
| Personal Care & Service | 0 (0.0%) | 42 (100.0%) |
| Total (Category) | 73 (30.9%) | 163 (69.1%) |
| Total (Overall) | 326 (55.2%) | 265 (44.8%) |
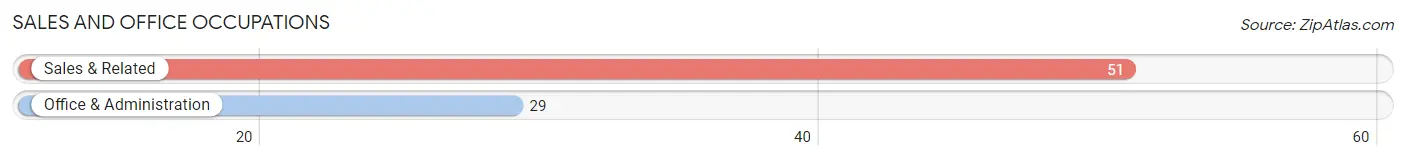
Sales and Office Occupations
The most common Sales and Office occupations in Brackettville are Sales & Related (51 | 8.6%), and Office & Administration (29 | 4.9%).
Sales and Office Occupations by Sex
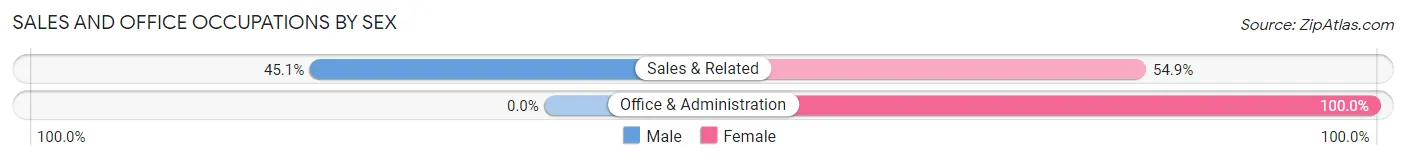
| Occupation | Male | Female |
| Sales & Related | 23 (45.1%) | 28 (54.9%) |
| Office & Administration | 0 (0.0%) | 29 (100.0%) |
| Total (Category) | 23 (28.7%) | 57 (71.3%) |
| Total (Overall) | 326 (55.2%) | 265 (44.8%) |
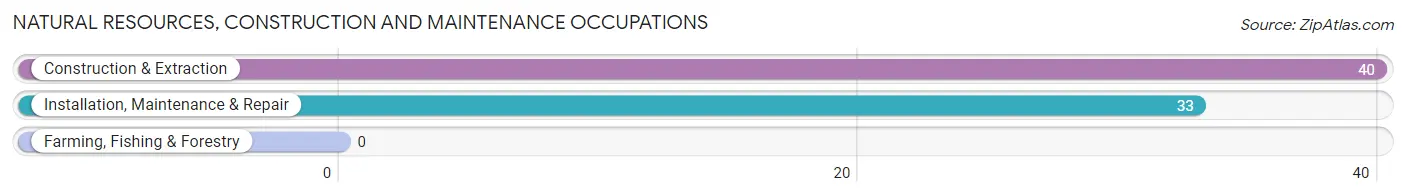
Natural Resources, Construction and Maintenance Occupations
The most common Natural Resources, Construction and Maintenance occupations in Brackettville are Construction & Extraction (40 | 6.8%), and Installation, Maintenance & Repair (33 | 5.6%).
Natural Resources, Construction and Maintenance Occupations by Sex
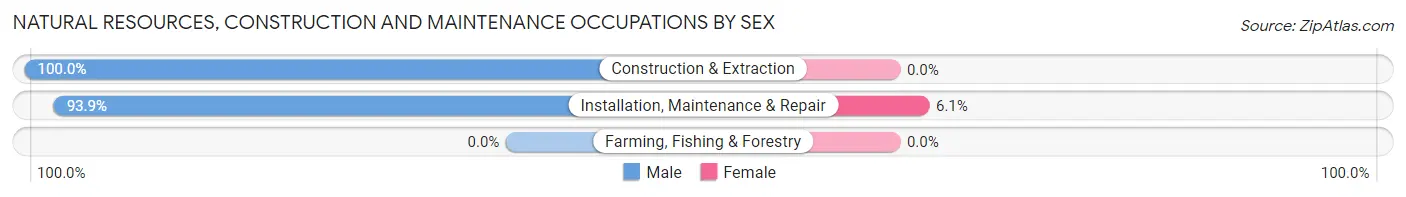
| Occupation | Male | Female |
| Farming, Fishing & Forestry | 0 (0.0%) | 0 (0.0%) |
| Construction & Extraction | 40 (100.0%) | 0 (0.0%) |
| Installation, Maintenance & Repair | 31 (93.9%) | 2 (6.1%) |
| Total (Category) | 71 (97.3%) | 2 (2.7%) |
| Total (Overall) | 326 (55.2%) | 265 (44.8%) |
Production, Transportation and Moving Occupations
The most common Production, Transportation and Moving occupations in Brackettville are Transportation (146 | 24.7%), and Material Moving (13 | 2.2%).
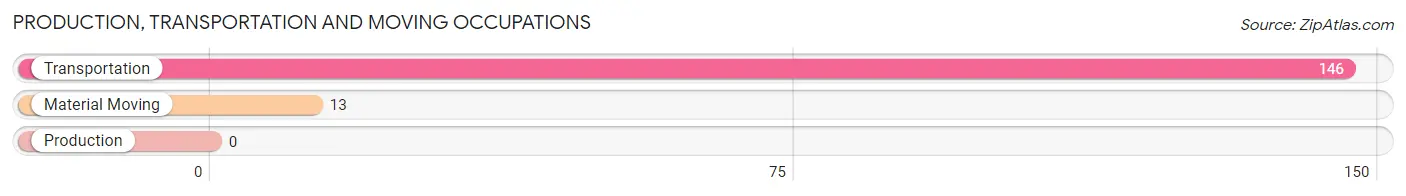
Production, Transportation and Moving Occupations by Sex
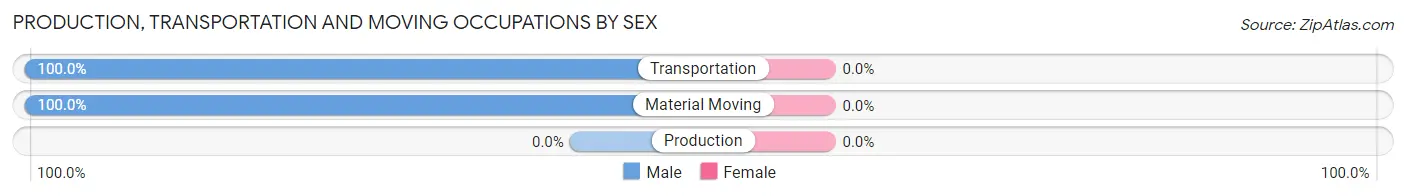
| Occupation | Male | Female |
| Production | 0 (0.0%) | 0 (0.0%) |
| Transportation | 146 (100.0%) | 0 (0.0%) |
| Material Moving | 13 (100.0%) | 0 (0.0%) |
| Total (Category) | 159 (100.0%) | 0 (0.0%) |
| Total (Overall) | 326 (55.2%) | 265 (44.8%) |
Employment Industries by Sex in Brackettville
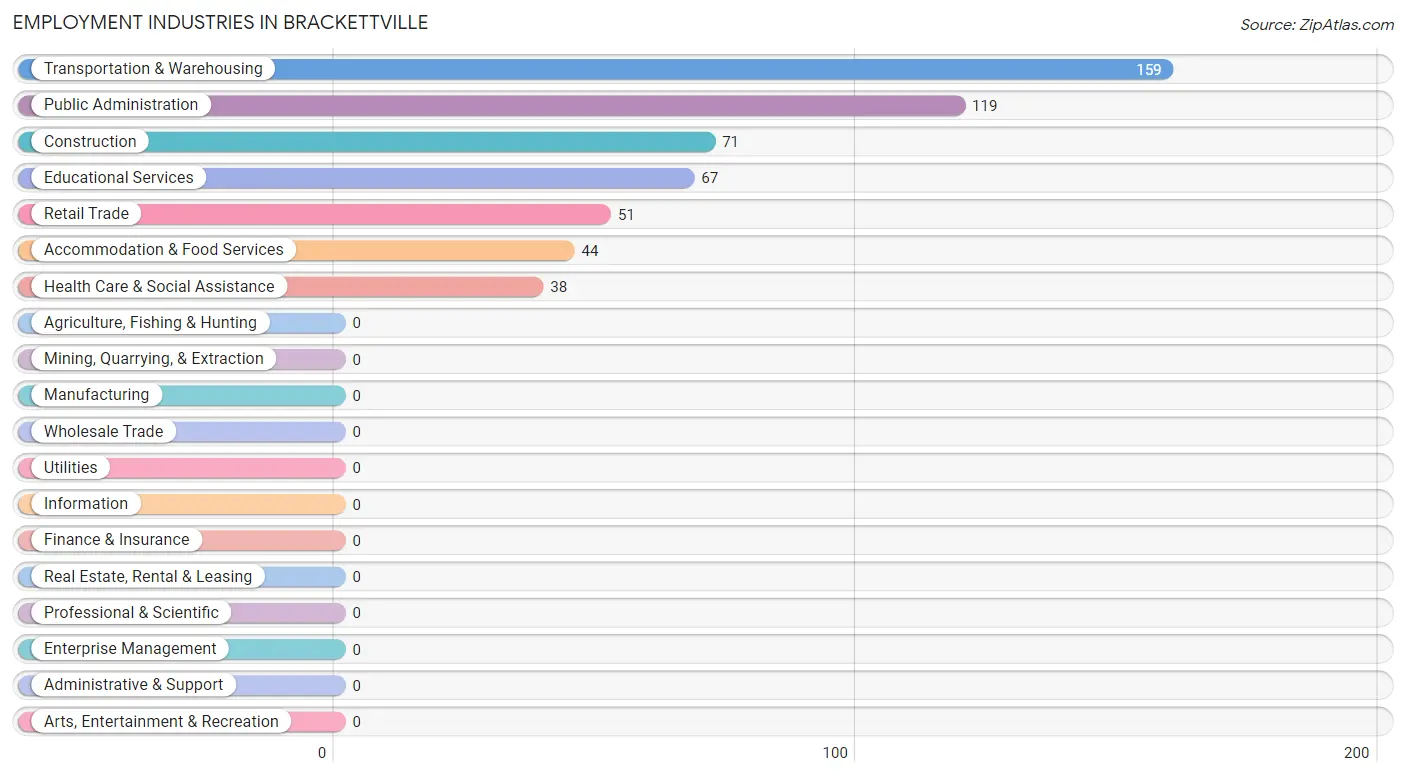
Employment Industries in Brackettville
The major employment industries in Brackettville include Transportation & Warehousing (159 | 26.9%), Public Administration (119 | 20.1%), Construction (71 | 12.0%), Educational Services (67 | 11.3%), and Retail Trade (51 | 8.6%).
Employment Industries by Sex in Brackettville
The Brackettville industries that see more men than women are Construction (100.0%), Transportation & Warehousing (100.0%), and Public Administration (61.3%), whereas the industries that tend to have a higher number of women are Educational Services (100.0%), Health Care & Social Assistance (100.0%), and Accommodation & Food Services (100.0%).
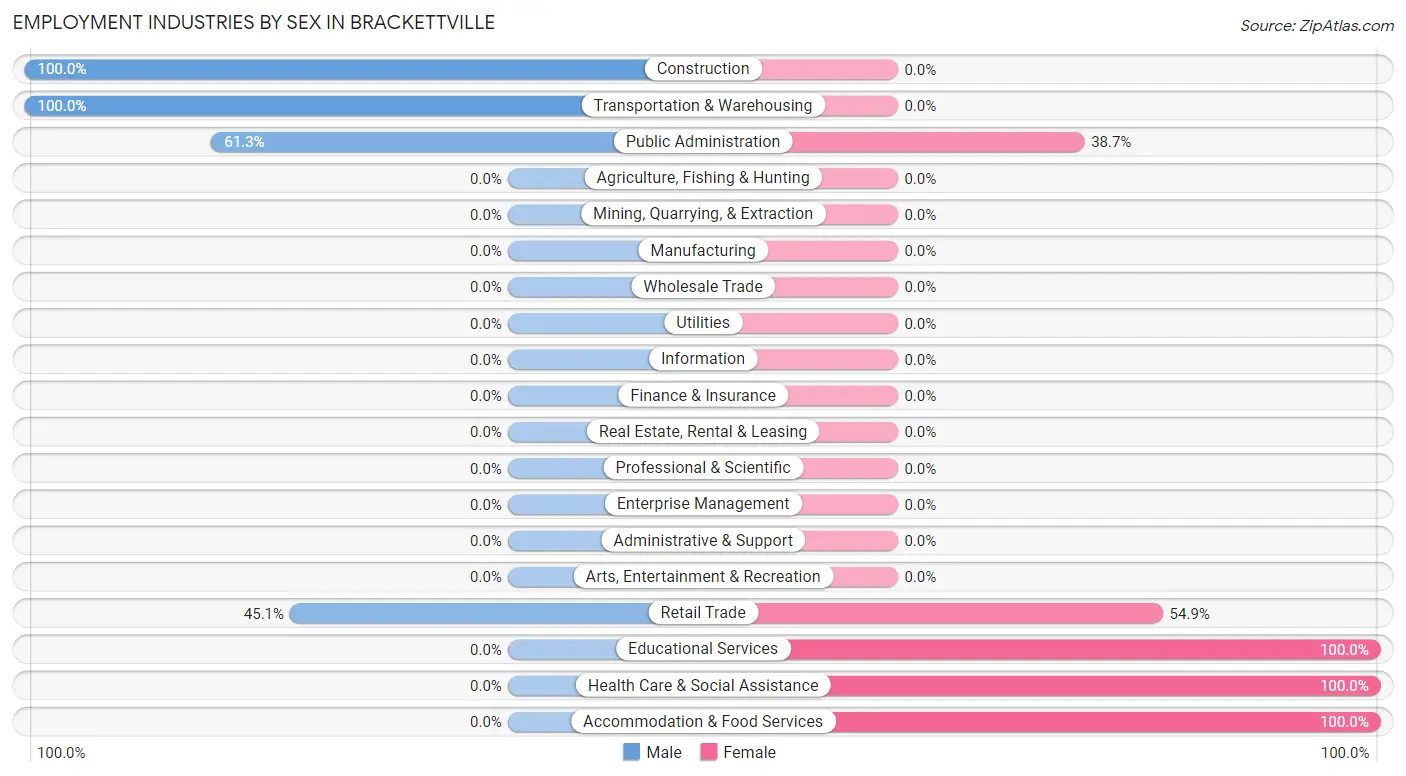
| Industry | Male | Female |
| Agriculture, Fishing & Hunting | 0 (0.0%) | 0 (0.0%) |
| Mining, Quarrying, & Extraction | 0 (0.0%) | 0 (0.0%) |
| Construction | 71 (100.0%) | 0 (0.0%) |
| Manufacturing | 0 (0.0%) | 0 (0.0%) |
| Wholesale Trade | 0 (0.0%) | 0 (0.0%) |
| Retail Trade | 23 (45.1%) | 28 (54.9%) |
| Transportation & Warehousing | 159 (100.0%) | 0 (0.0%) |
| Utilities | 0 (0.0%) | 0 (0.0%) |
| Information | 0 (0.0%) | 0 (0.0%) |
| Finance & Insurance | 0 (0.0%) | 0 (0.0%) |
| Real Estate, Rental & Leasing | 0 (0.0%) | 0 (0.0%) |
| Professional & Scientific | 0 (0.0%) | 0 (0.0%) |
| Enterprise Management | 0 (0.0%) | 0 (0.0%) |
| Administrative & Support | 0 (0.0%) | 0 (0.0%) |
| Educational Services | 0 (0.0%) | 67 (100.0%) |
| Health Care & Social Assistance | 0 (0.0%) | 38 (100.0%) |
| Arts, Entertainment & Recreation | 0 (0.0%) | 0 (0.0%) |
| Accommodation & Food Services | 0 (0.0%) | 44 (100.0%) |
| Public Administration | 73 (61.3%) | 46 (38.7%) |
| Total | 326 (55.2%) | 265 (44.8%) |
Education in Brackettville
School Enrollment in Brackettville
The most common levels of schooling among the 135 students in Brackettville are middle school (54 | 40.0%), kindergarten (31 | 23.0%), and high school (28 | 20.7%).
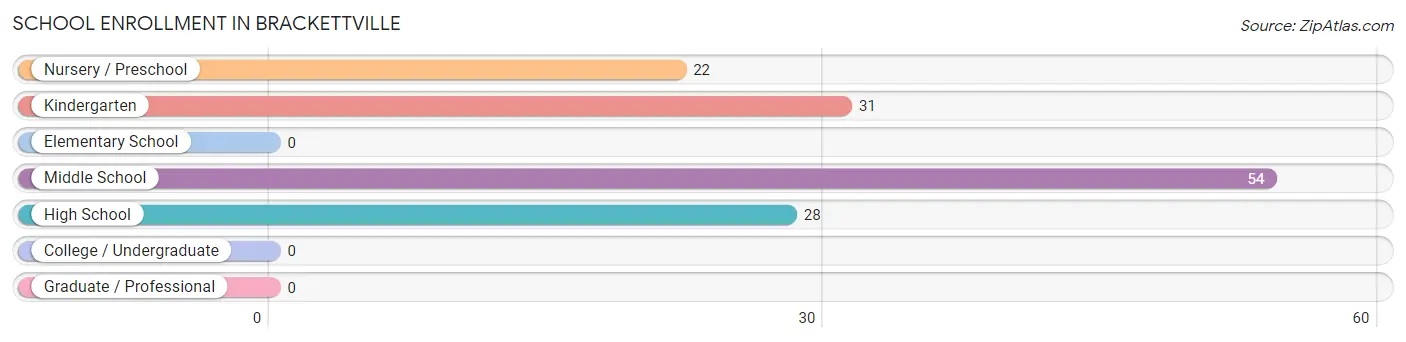
| School Level | # Students | % Students |
| Nursery / Preschool | 22 | 16.3% |
| Kindergarten | 31 | 23.0% |
| Elementary School | 0 | 0.0% |
| Middle School | 54 | 40.0% |
| High School | 28 | 20.7% |
| College / Undergraduate | 0 | 0.0% |
| Graduate / Professional | 0 | 0.0% |
| Total | 135 | 100.0% |
School Enrollment by Age by Funding Source in Brackettville
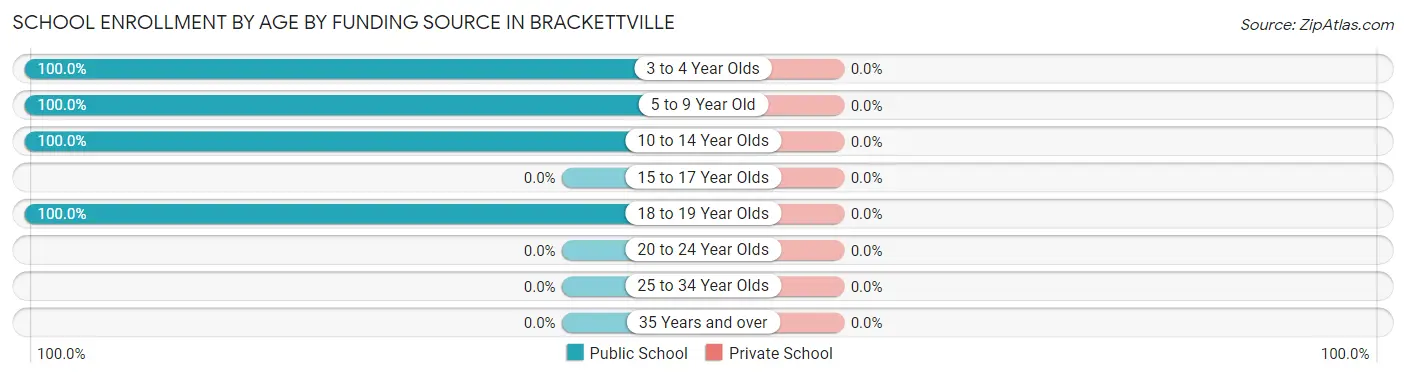
| Age Bracket | Public School | Private School |
| 3 to 4 Year Olds | 22 (100.0%) | 0 (0.0%) |
| 5 to 9 Year Old | 31 (100.0%) | 0 (0.0%) |
| 10 to 14 Year Olds | 54 (100.0%) | 0 (0.0%) |
| 15 to 17 Year Olds | 0 (0.0%) | 0 (0.0%) |
| 18 to 19 Year Olds | 28 (100.0%) | 0 (0.0%) |
| 20 to 24 Year Olds | 0 (0.0%) | 0 (0.0%) |
| 25 to 34 Year Olds | 0 (0.0%) | 0 (0.0%) |
| 35 Years and over | 0 (0.0%) | 0 (0.0%) |
| Total | 135 (100.0%) | 0 (0.0%) |
Educational Attainment by Field of Study in Brackettville
, and education (36 | 100.0%) are the most common fields of study among 36 individuals in Brackettville who have obtained a bachelor's degree or higher.
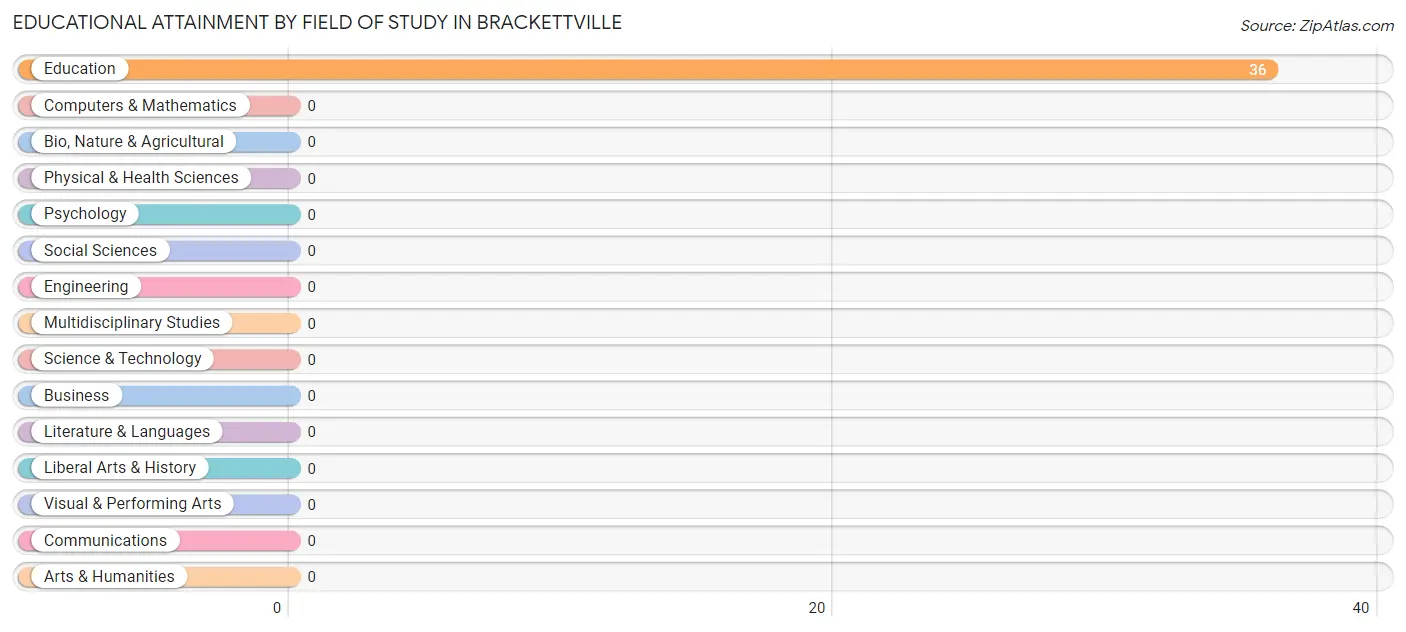
| Field of Study | # Graduates | % Graduates |
| Computers & Mathematics | 0 | 0.0% |
| Bio, Nature & Agricultural | 0 | 0.0% |
| Physical & Health Sciences | 0 | 0.0% |
| Psychology | 0 | 0.0% |
| Social Sciences | 0 | 0.0% |
| Engineering | 0 | 0.0% |
| Multidisciplinary Studies | 0 | 0.0% |
| Science & Technology | 0 | 0.0% |
| Business | 0 | 0.0% |
| Education | 36 | 100.0% |
| Literature & Languages | 0 | 0.0% |
| Liberal Arts & History | 0 | 0.0% |
| Visual & Performing Arts | 0 | 0.0% |
| Communications | 0 | 0.0% |
| Arts & Humanities | 0 | 0.0% |
| Total | 36 | 100.0% |
Transportation & Commute in Brackettville
Vehicle Availability by Sex in Brackettville
The most prevalent vehicle ownership categories in Brackettville are males with 3 vehicles (177, accounting for 54.3%) and females with 3 vehicles (67, making up 67.3%).
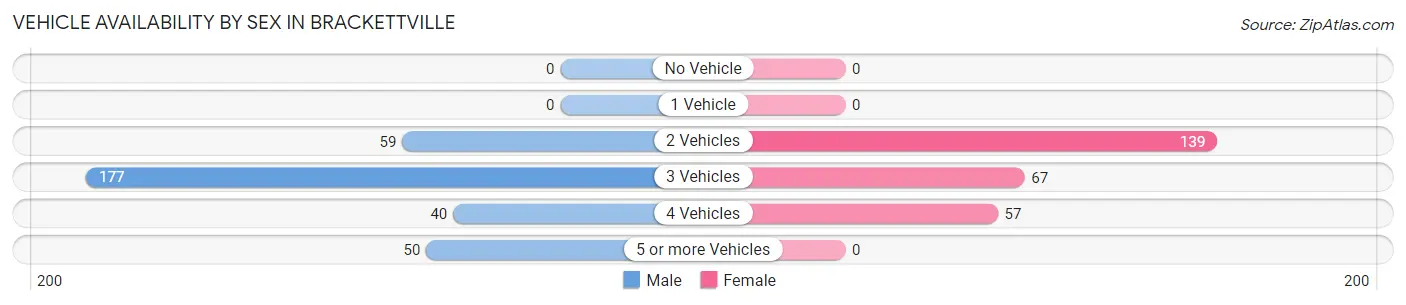
| Vehicles Available | Male | Female |
| No Vehicle | 0 (0.0%) | 0 (0.0%) |
| 1 Vehicle | 0 (0.0%) | 0 (0.0%) |
| 2 Vehicles | 59 (18.1%) | 139 (52.8%) |
| 3 Vehicles | 177 (54.3%) | 67 (25.5%) |
| 4 Vehicles | 40 (12.3%) | 57 (21.7%) |
| 5 or more Vehicles | 50 (15.3%) | 0 (0.0%) |
| Total | 326 (100.0%) | 263 (100.0%) |
Commute Time in Brackettville
The most frequently occuring commute durations in Brackettville are 5 to 9 minutes (351 commuters, 64.2%), less than 5 minutes (119 commuters, 21.8%), and 45 to 59 minutes (57 commuters, 10.4%).
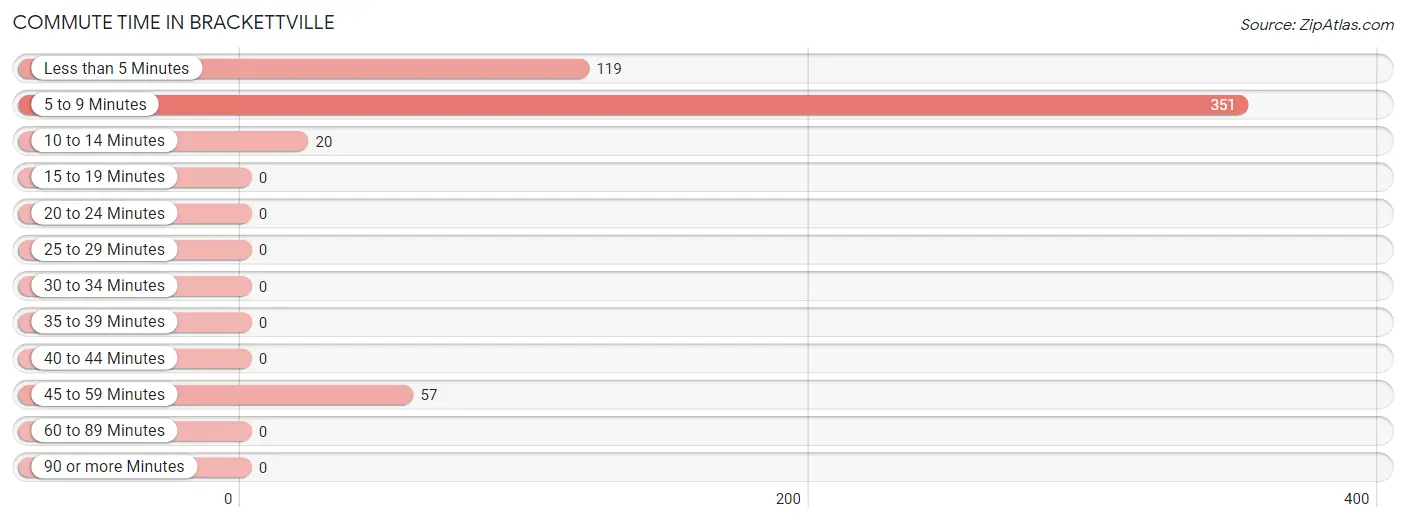
| Commute Time | # Commuters | % Commuters |
| Less than 5 Minutes | 119 | 21.8% |
| 5 to 9 Minutes | 351 | 64.2% |
| 10 to 14 Minutes | 20 | 3.7% |
| 15 to 19 Minutes | 0 | 0.0% |
| 20 to 24 Minutes | 0 | 0.0% |
| 25 to 29 Minutes | 0 | 0.0% |
| 30 to 34 Minutes | 0 | 0.0% |
| 35 to 39 Minutes | 0 | 0.0% |
| 40 to 44 Minutes | 0 | 0.0% |
| 45 to 59 Minutes | 57 | 10.4% |
| 60 to 89 Minutes | 0 | 0.0% |
| 90 or more Minutes | 0 | 0.0% |
Commute Time by Sex in Brackettville
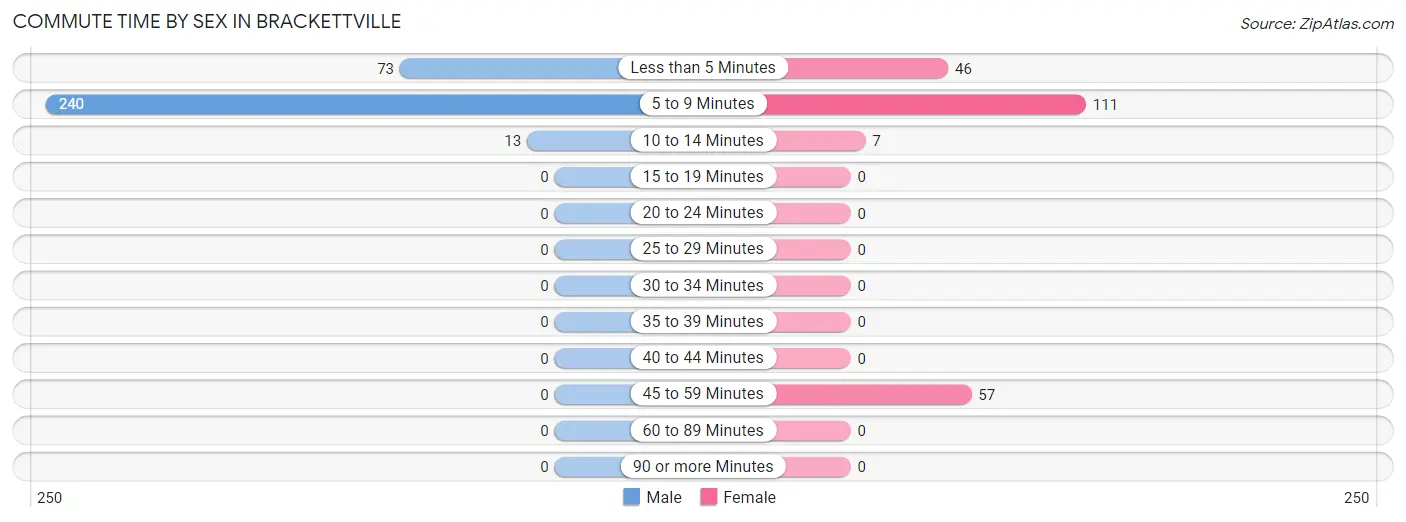
The most common commute times in Brackettville are 5 to 9 minutes (240 commuters, 73.6%) for males and 5 to 9 minutes (111 commuters, 50.2%) for females.
| Commute Time | Male | Female |
| Less than 5 Minutes | 73 (22.4%) | 46 (20.8%) |
| 5 to 9 Minutes | 240 (73.6%) | 111 (50.2%) |
| 10 to 14 Minutes | 13 (4.0%) | 7 (3.2%) |
| 15 to 19 Minutes | 0 (0.0%) | 0 (0.0%) |
| 20 to 24 Minutes | 0 (0.0%) | 0 (0.0%) |
| 25 to 29 Minutes | 0 (0.0%) | 0 (0.0%) |
| 30 to 34 Minutes | 0 (0.0%) | 0 (0.0%) |
| 35 to 39 Minutes | 0 (0.0%) | 0 (0.0%) |
| 40 to 44 Minutes | 0 (0.0%) | 0 (0.0%) |
| 45 to 59 Minutes | 0 (0.0%) | 57 (25.8%) |
| 60 to 89 Minutes | 0 (0.0%) | 0 (0.0%) |
| 90 or more Minutes | 0 (0.0%) | 0 (0.0%) |
Time of Departure to Work by Sex in Brackettville
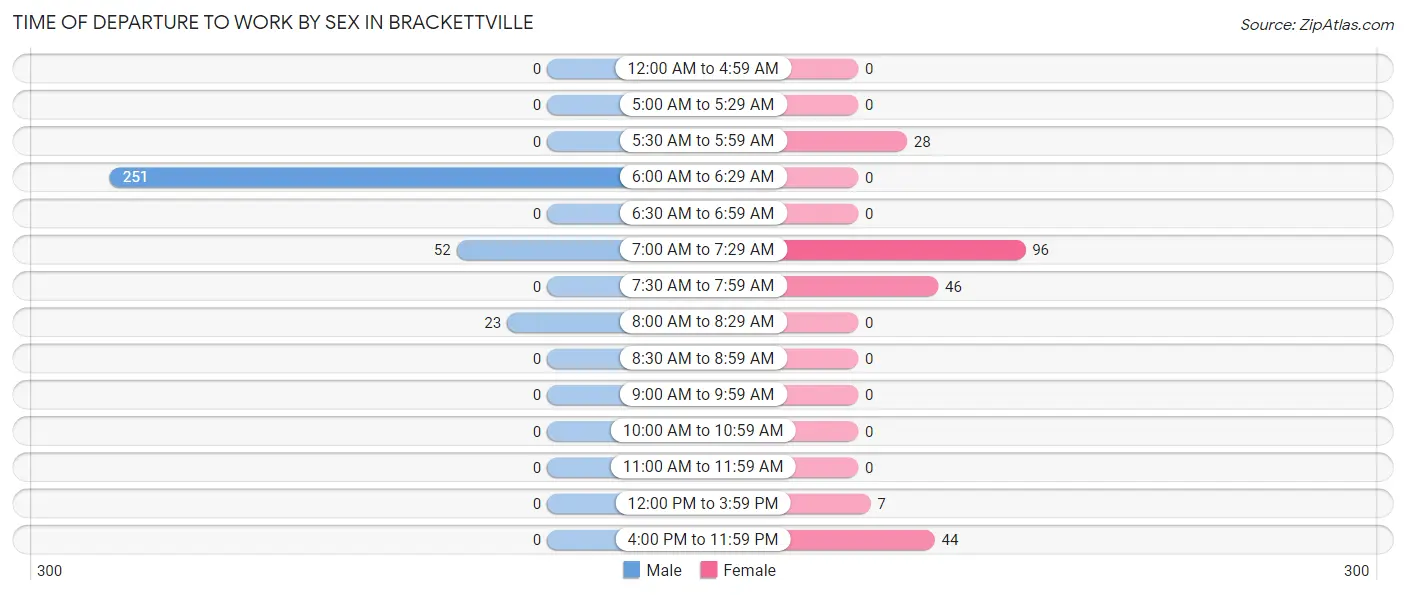
The most frequent times of departure to work in Brackettville are 6:00 AM to 6:29 AM (251, 77.0%) for males and 7:00 AM to 7:29 AM (96, 43.4%) for females.
| Time of Departure | Male | Female |
| 12:00 AM to 4:59 AM | 0 (0.0%) | 0 (0.0%) |
| 5:00 AM to 5:29 AM | 0 (0.0%) | 0 (0.0%) |
| 5:30 AM to 5:59 AM | 0 (0.0%) | 28 (12.7%) |
| 6:00 AM to 6:29 AM | 251 (77.0%) | 0 (0.0%) |
| 6:30 AM to 6:59 AM | 0 (0.0%) | 0 (0.0%) |
| 7:00 AM to 7:29 AM | 52 (16.0%) | 96 (43.4%) |
| 7:30 AM to 7:59 AM | 0 (0.0%) | 46 (20.8%) |
| 8:00 AM to 8:29 AM | 23 (7.1%) | 0 (0.0%) |
| 8:30 AM to 8:59 AM | 0 (0.0%) | 0 (0.0%) |
| 9:00 AM to 9:59 AM | 0 (0.0%) | 0 (0.0%) |
| 10:00 AM to 10:59 AM | 0 (0.0%) | 0 (0.0%) |
| 11:00 AM to 11:59 AM | 0 (0.0%) | 0 (0.0%) |
| 12:00 PM to 3:59 PM | 0 (0.0%) | 7 (3.2%) |
| 4:00 PM to 11:59 PM | 0 (0.0%) | 44 (19.9%) |
| Total | 326 (100.0%) | 221 (100.0%) |
Housing Occupancy in Brackettville
Occupancy by Ownership in Brackettville
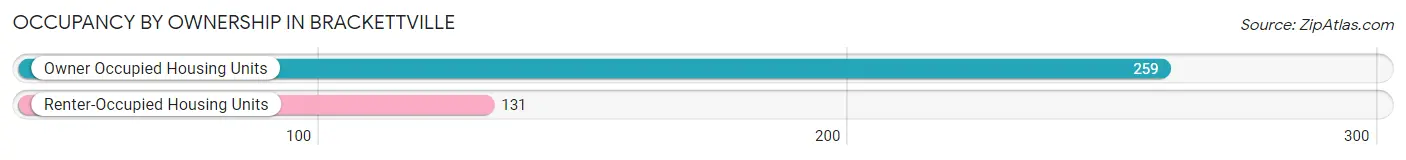
Of the total 390 dwellings in Brackettville, owner-occupied units account for 259 (66.4%), while renter-occupied units make up 131 (33.6%).
| Occupancy | # Housing Units | % Housing Units |
| Owner Occupied Housing Units | 259 | 66.4% |
| Renter-Occupied Housing Units | 131 | 33.6% |
| Total Occupied Housing Units | 390 | 100.0% |
Occupancy by Household Size in Brackettville
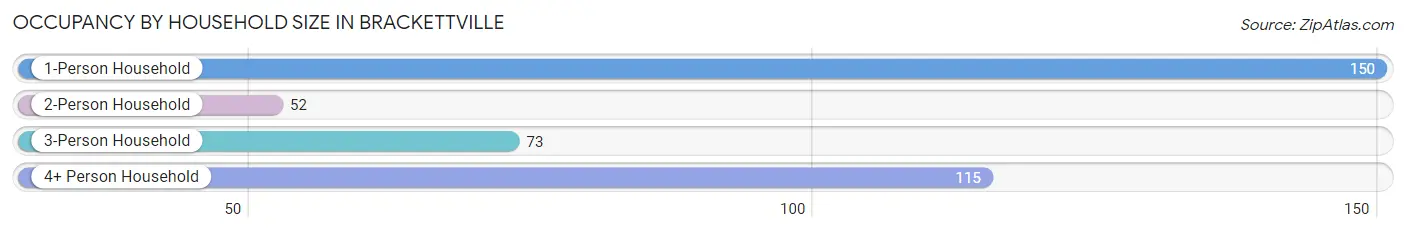
| Household Size | # Housing Units | % Housing Units |
| 1-Person Household | 150 | 38.5% |
| 2-Person Household | 52 | 13.3% |
| 3-Person Household | 73 | 18.7% |
| 4+ Person Household | 115 | 29.5% |
| Total Housing Units | 390 | 100.0% |
Occupancy by Ownership by Household Size in Brackettville
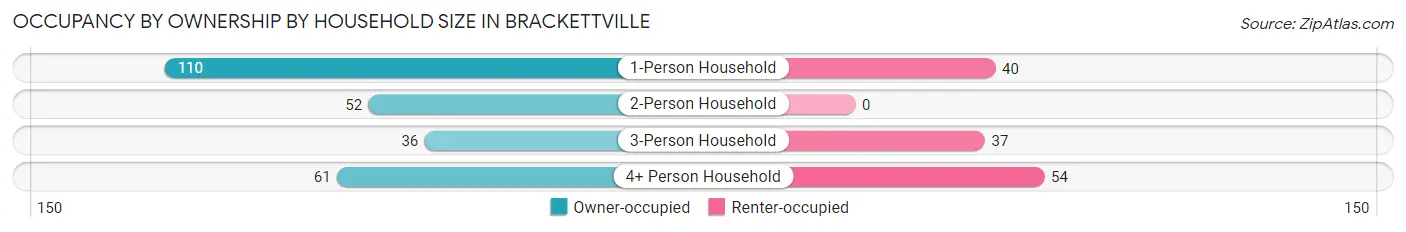
| Household Size | Owner-occupied | Renter-occupied |
| 1-Person Household | 110 (73.3%) | 40 (26.7%) |
| 2-Person Household | 52 (100.0%) | 0 (0.0%) |
| 3-Person Household | 36 (49.3%) | 37 (50.7%) |
| 4+ Person Household | 61 (53.0%) | 54 (47.0%) |
| Total Housing Units | 259 (66.4%) | 131 (33.6%) |
Occupancy by Educational Attainment in Brackettville
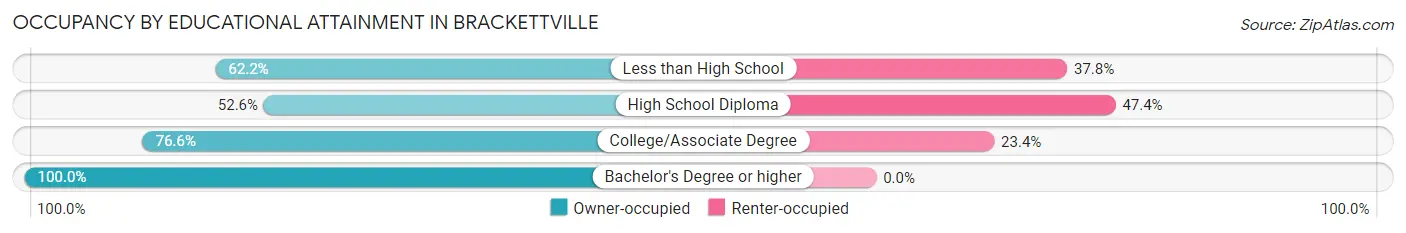
| Household Size | Owner-occupied | Renter-occupied |
| Less than High School | 46 (62.2%) | 28 (37.8%) |
| High School Diploma | 82 (52.6%) | 74 (47.4%) |
| College/Associate Degree | 95 (76.6%) | 29 (23.4%) |
| Bachelor's Degree or higher | 36 (100.0%) | 0 (0.0%) |
Occupancy by Age of Householder in Brackettville
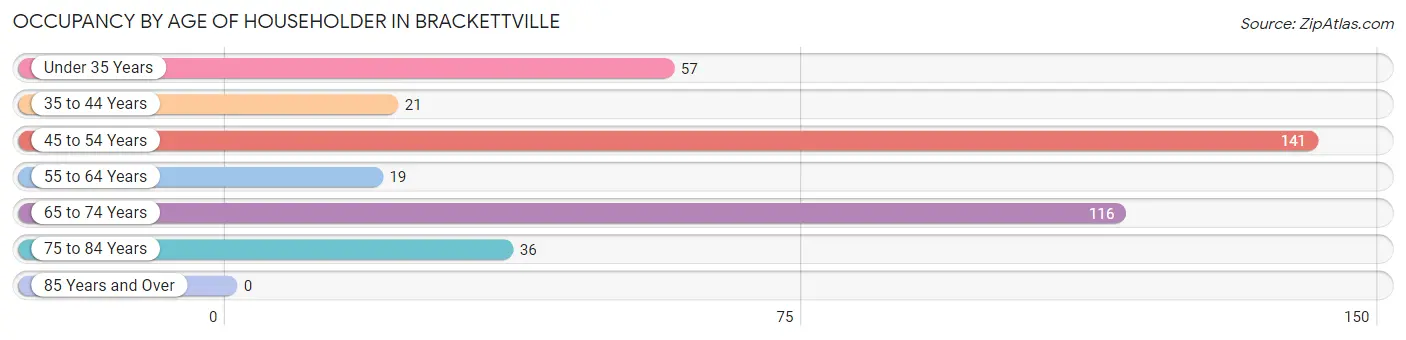
| Age Bracket | # Households | % Households |
| Under 35 Years | 57 | 14.6% |
| 35 to 44 Years | 21 | 5.4% |
| 45 to 54 Years | 141 | 36.1% |
| 55 to 64 Years | 19 | 4.9% |
| 65 to 74 Years | 116 | 29.7% |
| 75 to 84 Years | 36 | 9.2% |
| 85 Years and Over | 0 | 0.0% |
| Total | 390 | 100.0% |
Housing Finances in Brackettville
Median Income by Occupancy in Brackettville
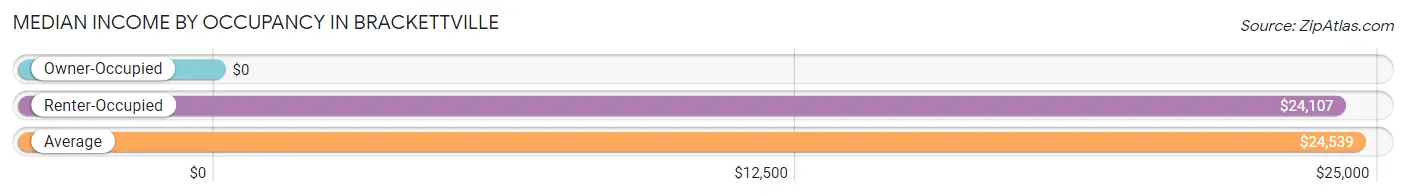
| Occupancy Type | # Households | Median Income |
| Owner-Occupied | 259 (66.4%) | $0 |
| Renter-Occupied | 131 (33.6%) | $24,107 |
| Average | 390 (100.0%) | $24,539 |
Occupancy by Householder Income Bracket in Brackettville
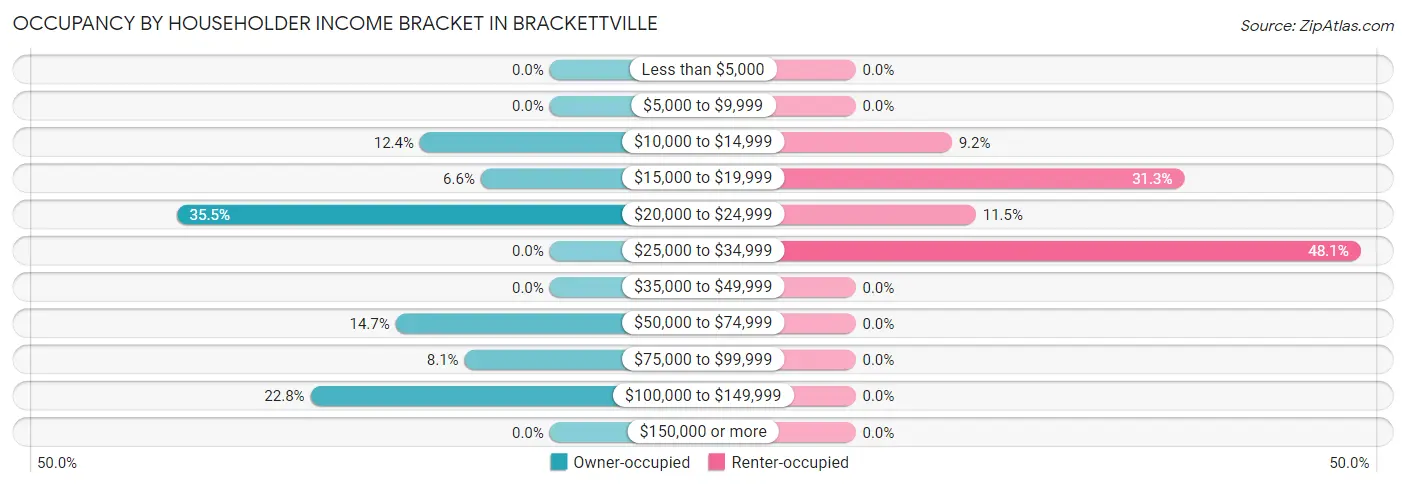
| Income Bracket | Owner-occupied | Renter-occupied |
| Less than $5,000 | 0 (0.0%) | 0 (0.0%) |
| $5,000 to $9,999 | 0 (0.0%) | 0 (0.0%) |
| $10,000 to $14,999 | 32 (12.4%) | 12 (9.2%) |
| $15,000 to $19,999 | 17 (6.6%) | 41 (31.3%) |
| $20,000 to $24,999 | 92 (35.5%) | 15 (11.5%) |
| $25,000 to $34,999 | 0 (0.0%) | 63 (48.1%) |
| $35,000 to $49,999 | 0 (0.0%) | 0 (0.0%) |
| $50,000 to $74,999 | 38 (14.7%) | 0 (0.0%) |
| $75,000 to $99,999 | 21 (8.1%) | 0 (0.0%) |
| $100,000 to $149,999 | 59 (22.8%) | 0 (0.0%) |
| $150,000 or more | 0 (0.0%) | 0 (0.0%) |
| Total | 259 (100.0%) | 131 (100.0%) |
Monthly Housing Cost Tiers in Brackettville
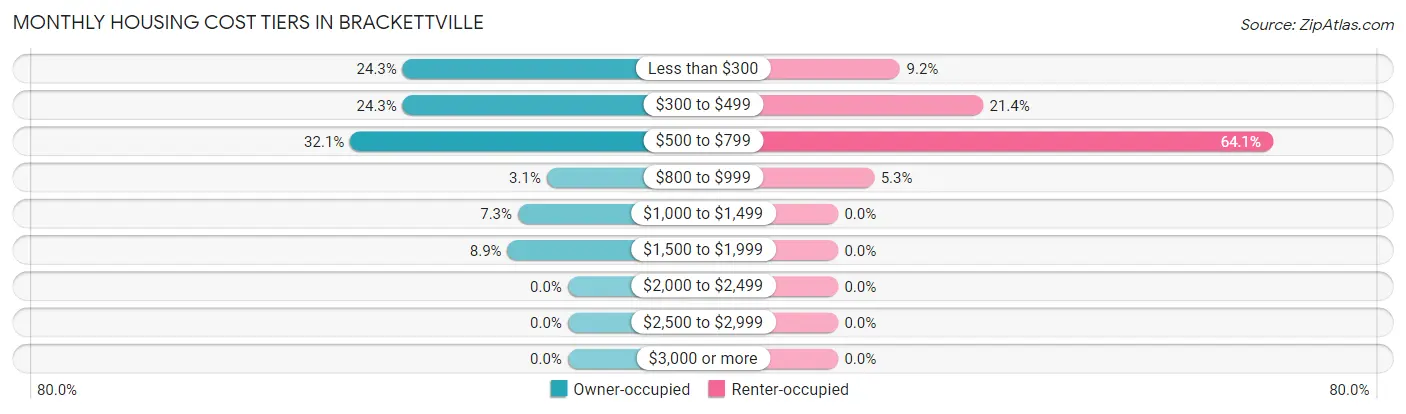
| Monthly Cost | Owner-occupied | Renter-occupied |
| Less than $300 | 63 (24.3%) | 12 (9.2%) |
| $300 to $499 | 63 (24.3%) | 28 (21.4%) |
| $500 to $799 | 83 (32.1%) | 84 (64.1%) |
| $800 to $999 | 8 (3.1%) | 7 (5.3%) |
| $1,000 to $1,499 | 19 (7.3%) | 0 (0.0%) |
| $1,500 to $1,999 | 23 (8.9%) | 0 (0.0%) |
| $2,000 to $2,499 | 0 (0.0%) | 0 (0.0%) |
| $2,500 to $2,999 | 0 (0.0%) | 0 (0.0%) |
| $3,000 or more | 0 (0.0%) | 0 (0.0%) |
| Total | 259 (100.0%) | 131 (100.0%) |
Physical Housing Characteristics in Brackettville
Housing Structures in Brackettville
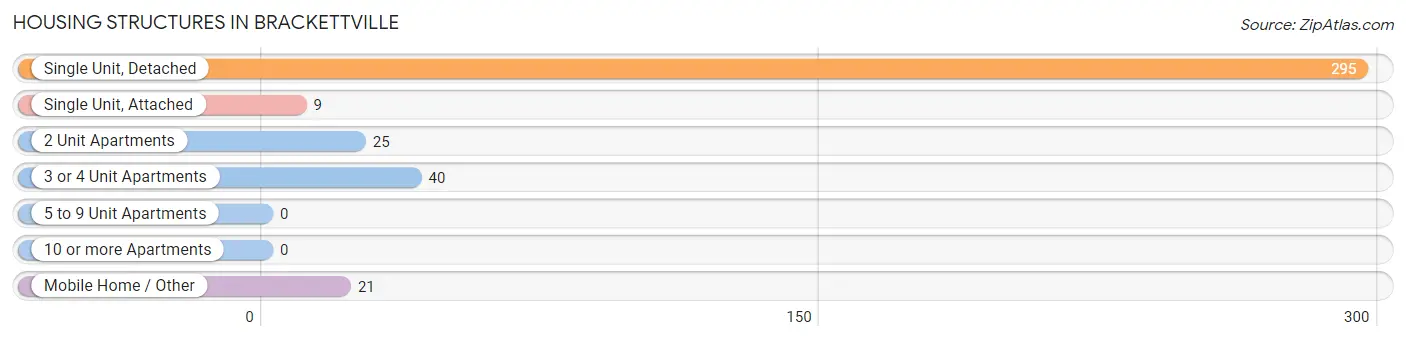
| Structure Type | # Housing Units | % Housing Units |
| Single Unit, Detached | 295 | 75.6% |
| Single Unit, Attached | 9 | 2.3% |
| 2 Unit Apartments | 25 | 6.4% |
| 3 or 4 Unit Apartments | 40 | 10.3% |
| 5 to 9 Unit Apartments | 0 | 0.0% |
| 10 or more Apartments | 0 | 0.0% |
| Mobile Home / Other | 21 | 5.4% |
| Total | 390 | 100.0% |
Housing Structures by Occupancy in Brackettville
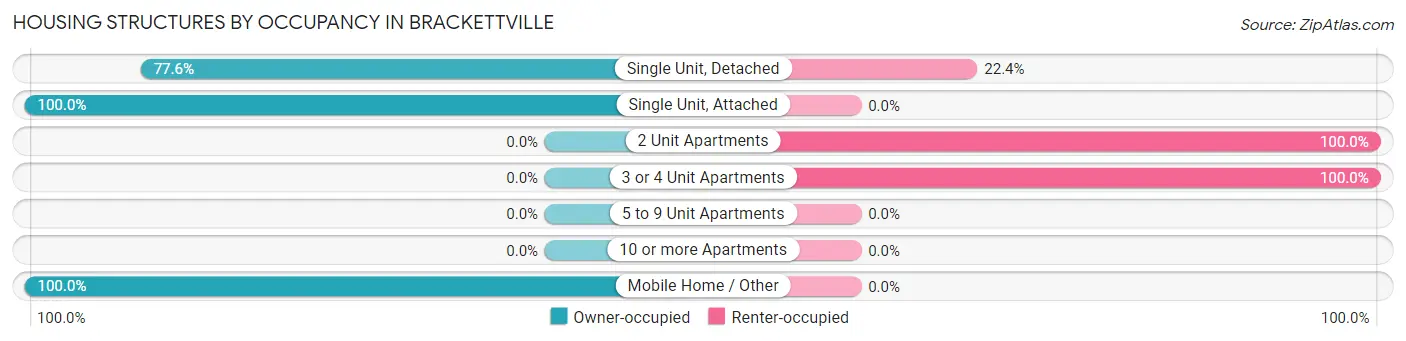
| Structure Type | Owner-occupied | Renter-occupied |
| Single Unit, Detached | 229 (77.6%) | 66 (22.4%) |
| Single Unit, Attached | 9 (100.0%) | 0 (0.0%) |
| 2 Unit Apartments | 0 (0.0%) | 25 (100.0%) |
| 3 or 4 Unit Apartments | 0 (0.0%) | 40 (100.0%) |
| 5 to 9 Unit Apartments | 0 (0.0%) | 0 (0.0%) |
| 10 or more Apartments | 0 (0.0%) | 0 (0.0%) |
| Mobile Home / Other | 21 (100.0%) | 0 (0.0%) |
| Total | 259 (66.4%) | 131 (33.6%) |
Housing Structures by Number of Rooms in Brackettville
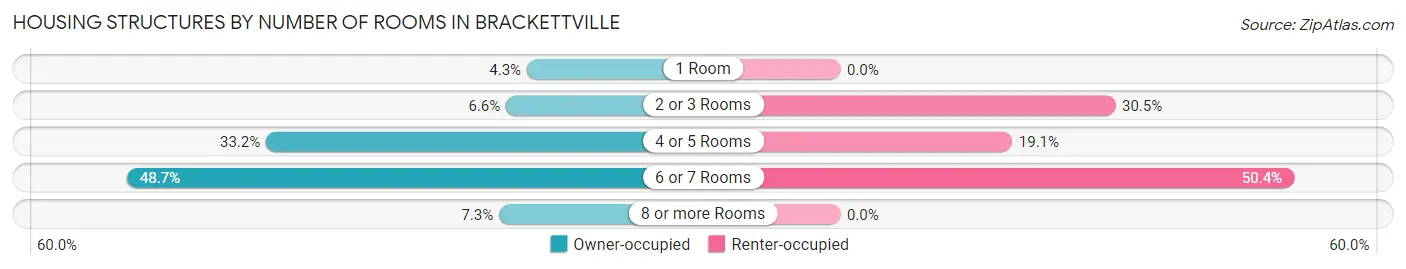
| Number of Rooms | Owner-occupied | Renter-occupied |
| 1 Room | 11 (4.3%) | 0 (0.0%) |
| 2 or 3 Rooms | 17 (6.6%) | 40 (30.5%) |
| 4 or 5 Rooms | 86 (33.2%) | 25 (19.1%) |
| 6 or 7 Rooms | 126 (48.6%) | 66 (50.4%) |
| 8 or more Rooms | 19 (7.3%) | 0 (0.0%) |
| Total | 259 (100.0%) | 131 (100.0%) |
Housing Structure by Heating Type in Brackettville
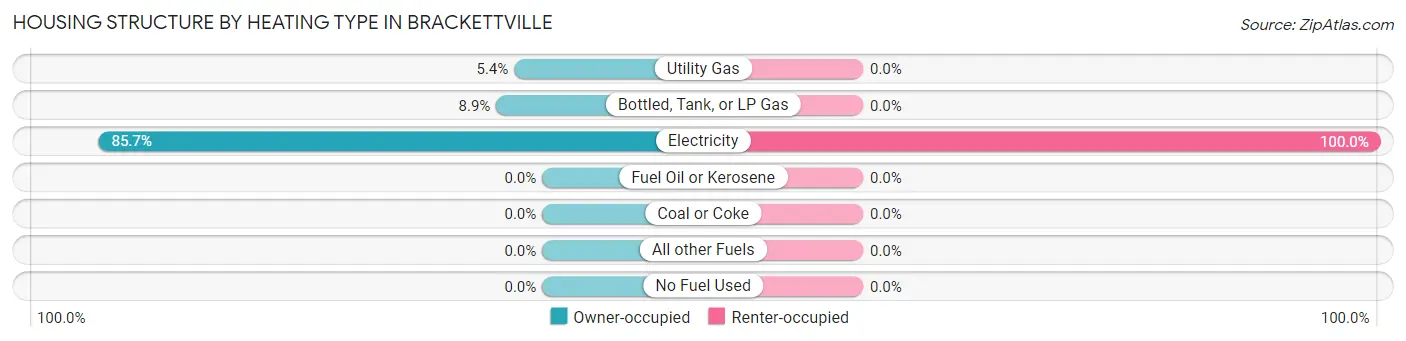
| Heating Type | Owner-occupied | Renter-occupied |
| Utility Gas | 14 (5.4%) | 0 (0.0%) |
| Bottled, Tank, or LP Gas | 23 (8.9%) | 0 (0.0%) |
| Electricity | 222 (85.7%) | 131 (100.0%) |
| Fuel Oil or Kerosene | 0 (0.0%) | 0 (0.0%) |
| Coal or Coke | 0 (0.0%) | 0 (0.0%) |
| All other Fuels | 0 (0.0%) | 0 (0.0%) |
| No Fuel Used | 0 (0.0%) | 0 (0.0%) |
| Total | 259 (100.0%) | 131 (100.0%) |
Household Vehicle Usage in Brackettville
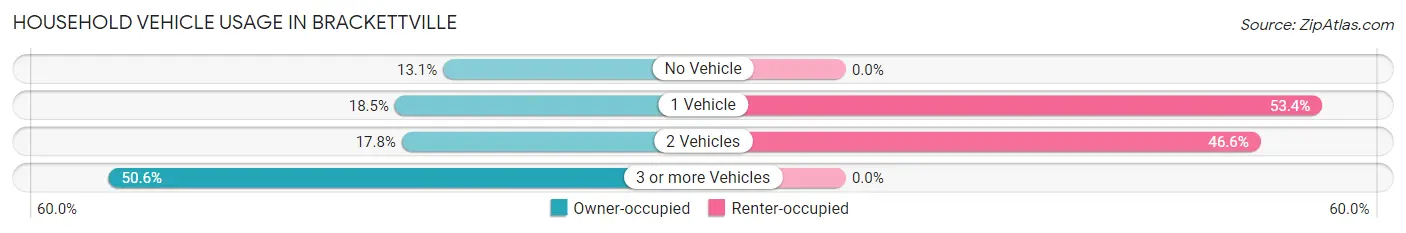
| Vehicles per Household | Owner-occupied | Renter-occupied |
| No Vehicle | 34 (13.1%) | 0 (0.0%) |
| 1 Vehicle | 48 (18.5%) | 70 (53.4%) |
| 2 Vehicles | 46 (17.8%) | 61 (46.6%) |
| 3 or more Vehicles | 131 (50.6%) | 0 (0.0%) |
| Total | 259 (100.0%) | 131 (100.0%) |
Real Estate & Mortgages in Brackettville
Real Estate and Mortgage Overview in Brackettville
| Characteristic | Without Mortgage | With Mortgage |
| Housing Units | 206 | 53 |
| Median Property Value | $54,300 | $158,200 |
| Median Household Income | - | - |
| Monthly Housing Costs | $457 | $0 |
| Real Estate Taxes | $823 | $0 |
Property Value by Mortgage Status in Brackettville
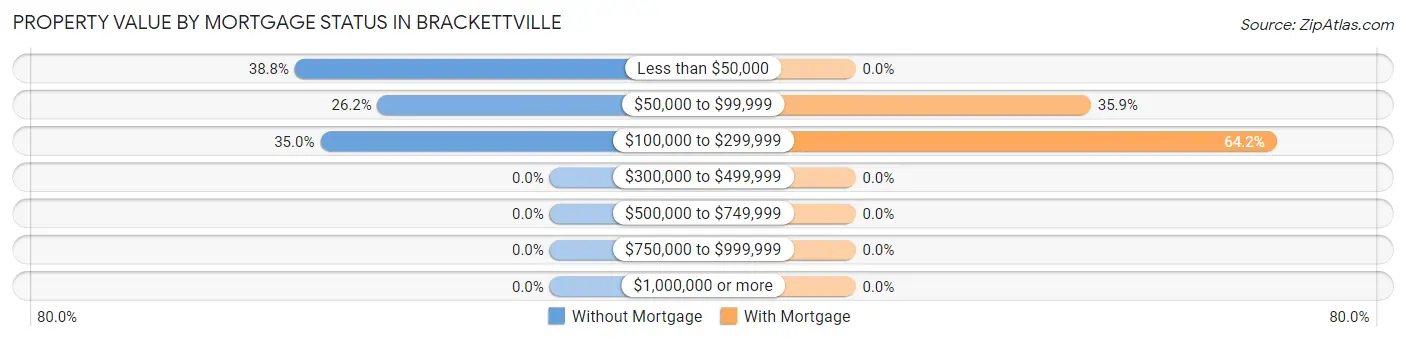
| Property Value | Without Mortgage | With Mortgage |
| Less than $50,000 | 80 (38.8%) | 0 (0.0%) |
| $50,000 to $99,999 | 54 (26.2%) | 19 (35.8%) |
| $100,000 to $299,999 | 72 (34.9%) | 34 (64.1%) |
| $300,000 to $499,999 | 0 (0.0%) | 0 (0.0%) |
| $500,000 to $749,999 | 0 (0.0%) | 0 (0.0%) |
| $750,000 to $999,999 | 0 (0.0%) | 0 (0.0%) |
| $1,000,000 or more | 0 (0.0%) | 0 (0.0%) |
| Total | 206 (100.0%) | 53 (100.0%) |
Household Income by Mortgage Status in Brackettville
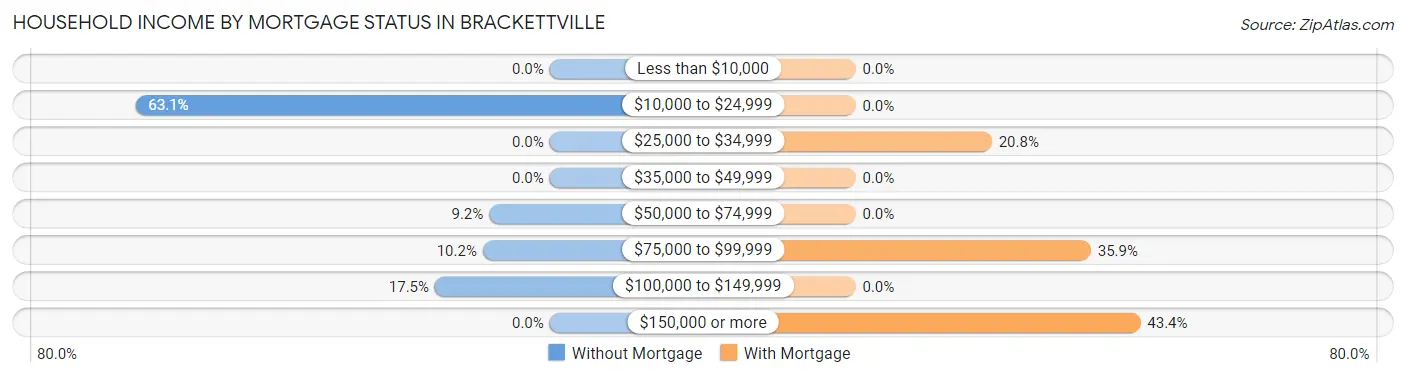
| Household Income | Without Mortgage | With Mortgage |
| Less than $10,000 | 0 (0.0%) | 0 (0.0%) |
| $10,000 to $24,999 | 130 (63.1%) | 0 (0.0%) |
| $25,000 to $34,999 | 0 (0.0%) | 11 (20.7%) |
| $35,000 to $49,999 | 0 (0.0%) | 0 (0.0%) |
| $50,000 to $74,999 | 19 (9.2%) | 0 (0.0%) |
| $75,000 to $99,999 | 21 (10.2%) | 19 (35.8%) |
| $100,000 to $149,999 | 36 (17.5%) | 0 (0.0%) |
| $150,000 or more | 0 (0.0%) | 23 (43.4%) |
| Total | 206 (100.0%) | 53 (100.0%) |
Property Value to Household Income Ratio in Brackettville
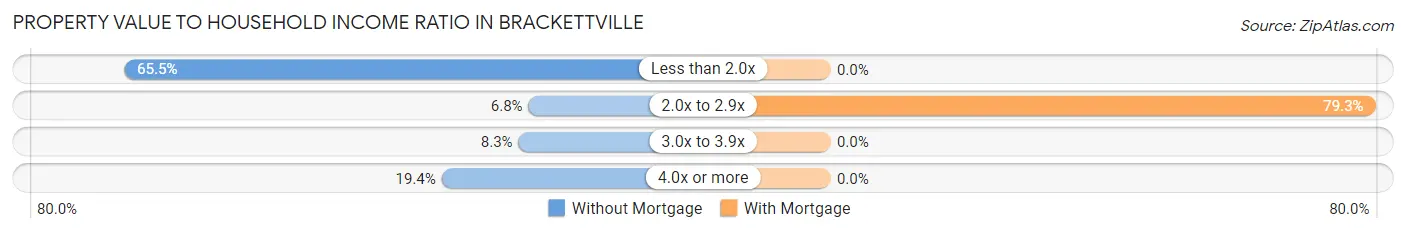
| Value-to-Income Ratio | Without Mortgage | With Mortgage |
| Less than 2.0x | 135 (65.5%) | 0 (0.0%) |
| 2.0x to 2.9x | 14 (6.8%) | 42 (79.2%) |
| 3.0x to 3.9x | 17 (8.3%) | 0 (0.0%) |
| 4.0x or more | 40 (19.4%) | 0 (0.0%) |
| Total | 206 (100.0%) | 53 (100.0%) |
Real Estate Taxes by Mortgage Status in Brackettville
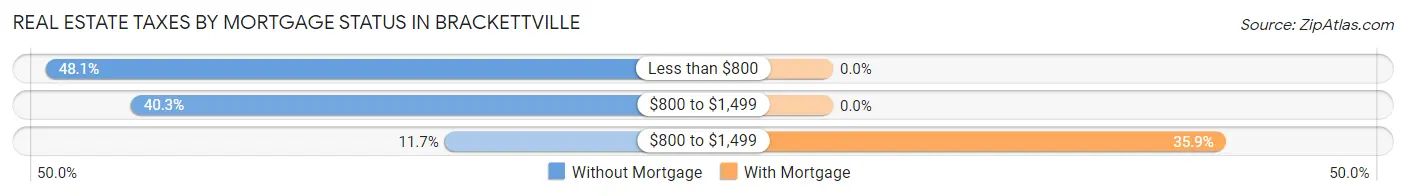
| Property Taxes | Without Mortgage | With Mortgage |
| Less than $800 | 99 (48.1%) | 0 (0.0%) |
| $800 to $1,499 | 83 (40.3%) | 0 (0.0%) |
| $800 to $1,499 | 24 (11.7%) | 19 (35.8%) |
| Total | 206 (100.0%) | 53 (100.0%) |
Health & Disability in Brackettville
Health Insurance Coverage by Age in Brackettville
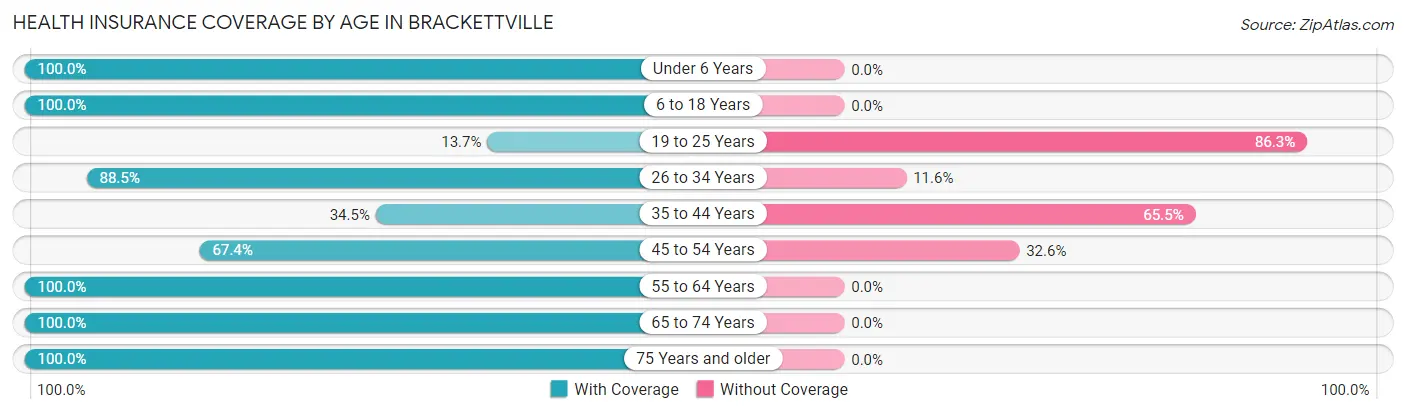
| Age Bracket | With Coverage | Without Coverage |
| Under 6 Years | 166 (100.0%) | 0 (0.0%) |
| 6 to 18 Years | 130 (100.0%) | 0 (0.0%) |
| 19 to 25 Years | 27 (13.7%) | 170 (86.3%) |
| 26 to 34 Years | 291 (88.4%) | 38 (11.6%) |
| 35 to 44 Years | 29 (34.5%) | 55 (65.5%) |
| 45 to 54 Years | 95 (67.4%) | 46 (32.6%) |
| 55 to 64 Years | 93 (100.0%) | 0 (0.0%) |
| 65 to 74 Years | 224 (100.0%) | 0 (0.0%) |
| 75 Years and older | 36 (100.0%) | 0 (0.0%) |
| Total | 1,091 (77.9%) | 309 (22.1%) |
Health Insurance Coverage by Citizenship Status in Brackettville
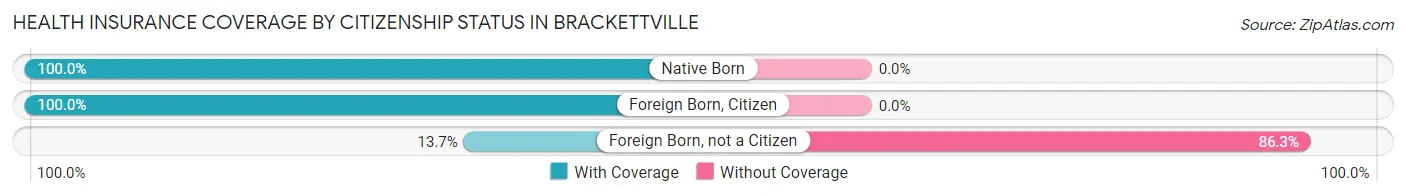
| Citizenship Status | With Coverage | Without Coverage |
| Native Born | 166 (100.0%) | 0 (0.0%) |
| Foreign Born, Citizen | 130 (100.0%) | 0 (0.0%) |
| Foreign Born, not a Citizen | 27 (13.7%) | 170 (86.3%) |
Health Insurance Coverage by Household Income in Brackettville
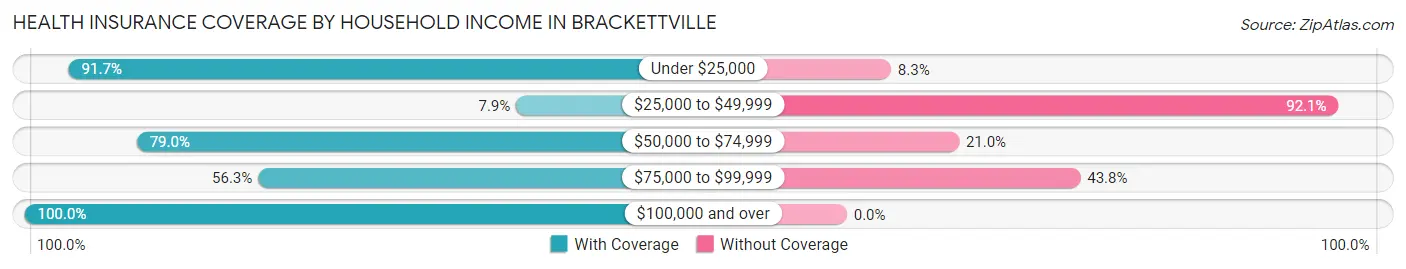
| Household Income | With Coverage | Without Coverage |
| Under $25,000 | 422 (91.7%) | 38 (8.3%) |
| $25,000 to $49,999 | 17 (7.9%) | 198 (92.1%) |
| $50,000 to $74,999 | 188 (79.0%) | 50 (21.0%) |
| $75,000 to $99,999 | 27 (56.2%) | 21 (43.8%) |
| $100,000 and over | 437 (100.0%) | 0 (0.0%) |
Public vs Private Health Insurance Coverage by Age in Brackettville
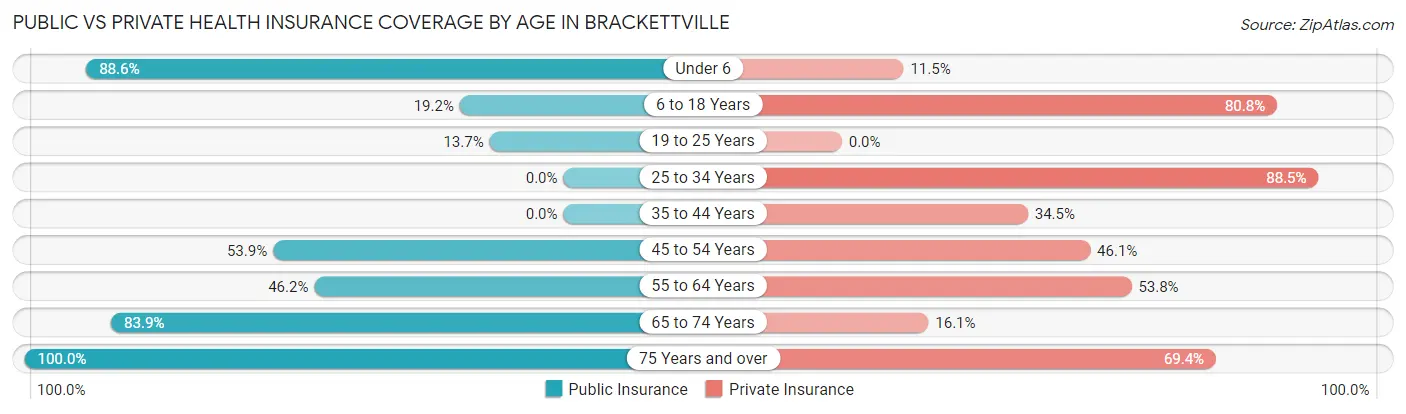
| Age Bracket | Public Insurance | Private Insurance |
| Under 6 | 147 (88.5%) | 19 (11.5%) |
| 6 to 18 Years | 25 (19.2%) | 105 (80.8%) |
| 19 to 25 Years | 27 (13.7%) | 0 (0.0%) |
| 25 to 34 Years | 0 (0.0%) | 291 (88.4%) |
| 35 to 44 Years | 0 (0.0%) | 29 (34.5%) |
| 45 to 54 Years | 76 (53.9%) | 65 (46.1%) |
| 55 to 64 Years | 43 (46.2%) | 50 (53.8%) |
| 65 to 74 Years | 188 (83.9%) | 36 (16.1%) |
| 75 Years and over | 36 (100.0%) | 25 (69.4%) |
| Total | 542 (38.7%) | 620 (44.3%) |
Disability Status by Sex by Age in Brackettville
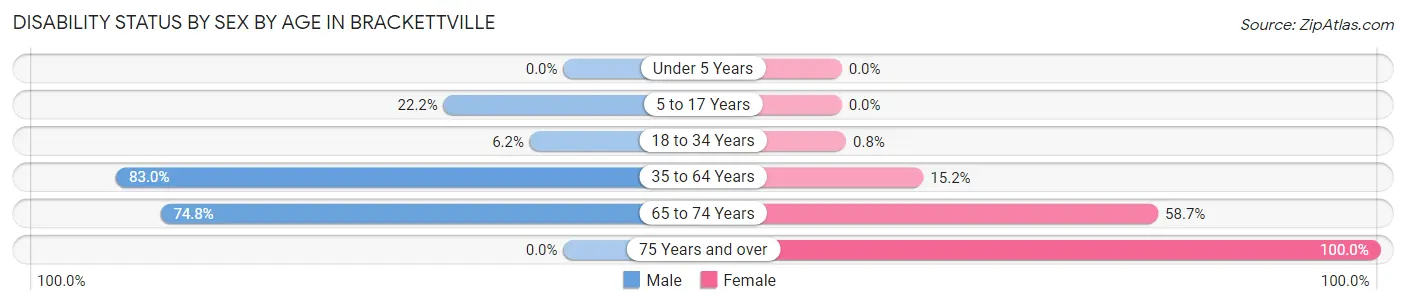
| Age Bracket | Male | Female |
| Under 5 Years | 0 (0.0%) | 0 (0.0%) |
| 5 to 17 Years | 24 (22.2%) | 0 (0.0%) |
| 18 to 34 Years | 19 (6.2%) | 2 (0.8%) |
| 35 to 64 Years | 127 (83.0%) | 25 (15.1%) |
| 65 to 74 Years | 86 (74.8%) | 64 (58.7%) |
| 75 Years and over | 0 (0.0%) | 28 (100.0%) |
Disability Class by Sex by Age in Brackettville
Disability Class: Hearing Difficulty
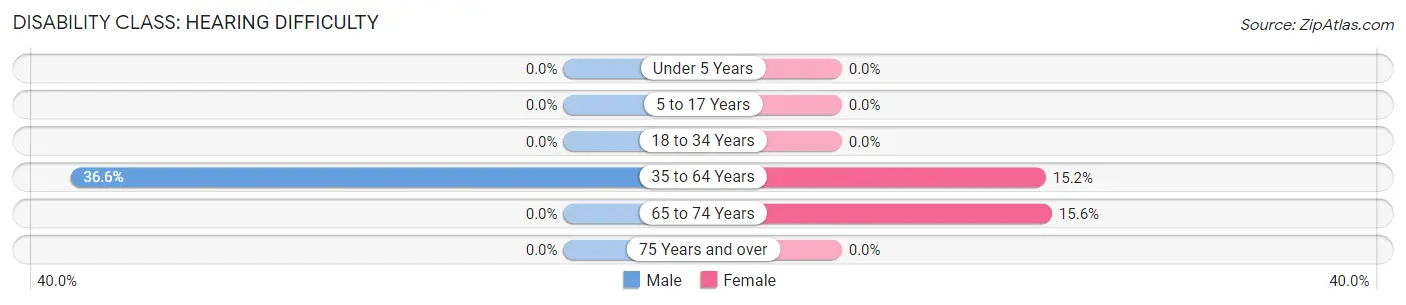
| Age Bracket | Male | Female |
| Under 5 Years | 0 (0.0%) | 0 (0.0%) |
| 5 to 17 Years | 0 (0.0%) | 0 (0.0%) |
| 18 to 34 Years | 0 (0.0%) | 0 (0.0%) |
| 35 to 64 Years | 56 (36.6%) | 25 (15.1%) |
| 65 to 74 Years | 0 (0.0%) | 17 (15.6%) |
| 75 Years and over | 0 (0.0%) | 0 (0.0%) |
Disability Class: Vision Difficulty
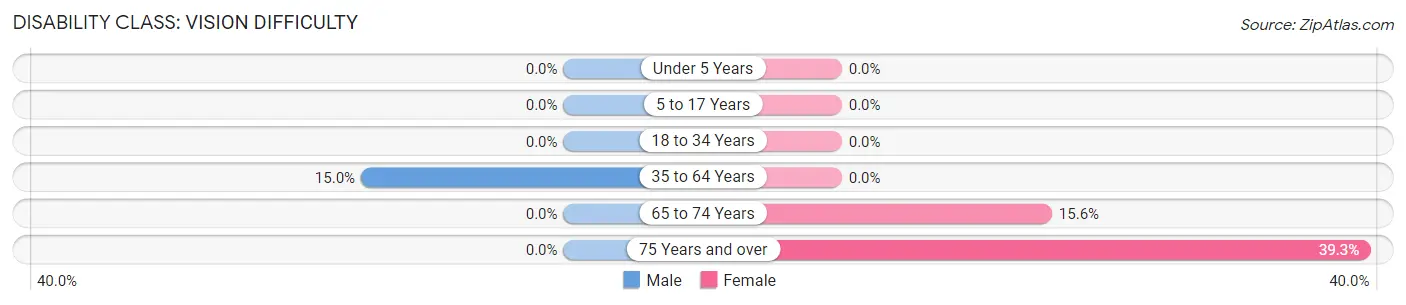
| Age Bracket | Male | Female |
| Under 5 Years | 0 (0.0%) | 0 (0.0%) |
| 5 to 17 Years | 0 (0.0%) | 0 (0.0%) |
| 18 to 34 Years | 0 (0.0%) | 0 (0.0%) |
| 35 to 64 Years | 23 (15.0%) | 0 (0.0%) |
| 65 to 74 Years | 0 (0.0%) | 17 (15.6%) |
| 75 Years and over | 0 (0.0%) | 11 (39.3%) |
Disability Class: Cognitive Difficulty
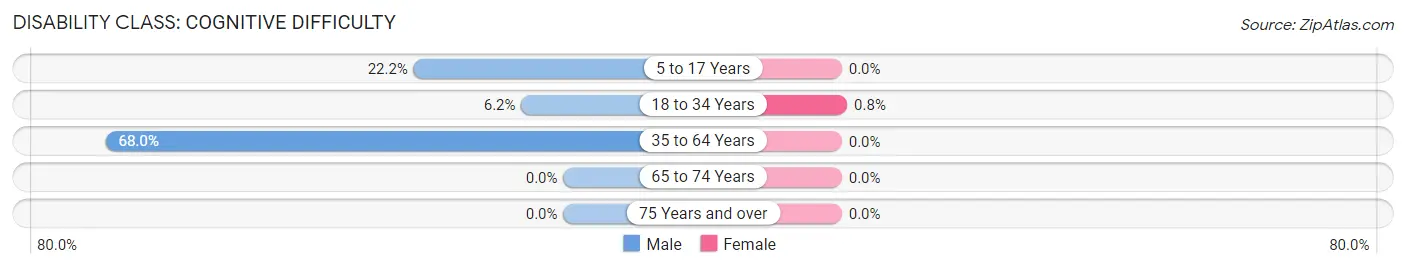
| Age Bracket | Male | Female |
| 5 to 17 Years | 24 (22.2%) | 0 (0.0%) |
| 18 to 34 Years | 19 (6.2%) | 2 (0.8%) |
| 35 to 64 Years | 104 (68.0%) | 0 (0.0%) |
| 65 to 74 Years | 0 (0.0%) | 0 (0.0%) |
| 75 Years and over | 0 (0.0%) | 0 (0.0%) |
Disability Class: Ambulatory Difficulty
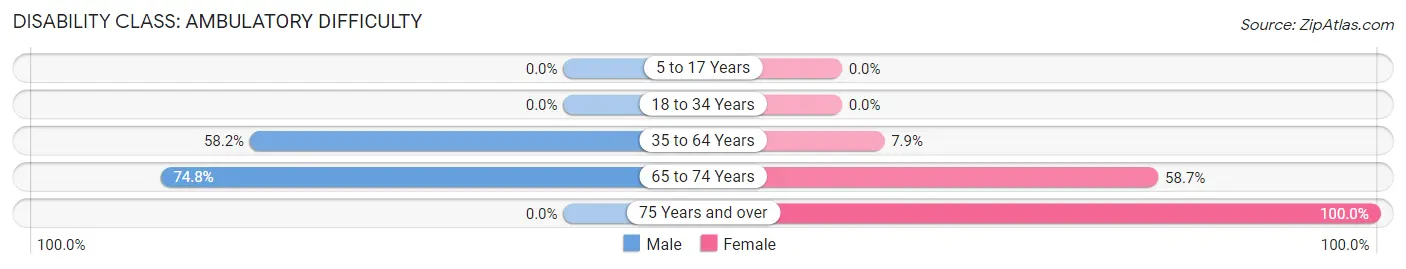
| Age Bracket | Male | Female |
| 5 to 17 Years | 0 (0.0%) | 0 (0.0%) |
| 18 to 34 Years | 0 (0.0%) | 0 (0.0%) |
| 35 to 64 Years | 89 (58.2%) | 13 (7.9%) |
| 65 to 74 Years | 86 (74.8%) | 64 (58.7%) |
| 75 Years and over | 0 (0.0%) | 28 (100.0%) |
Disability Class: Self-Care Difficulty
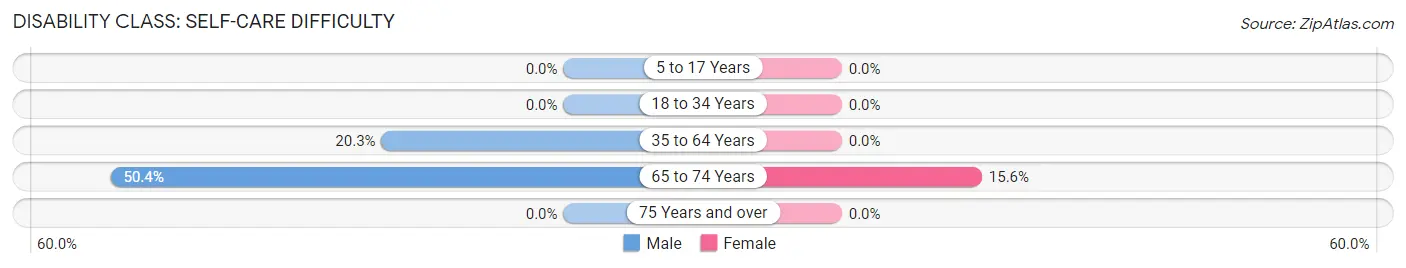
| Age Bracket | Male | Female |
| 5 to 17 Years | 0 (0.0%) | 0 (0.0%) |
| 18 to 34 Years | 0 (0.0%) | 0 (0.0%) |
| 35 to 64 Years | 31 (20.3%) | 0 (0.0%) |
| 65 to 74 Years | 58 (50.4%) | 17 (15.6%) |
| 75 Years and over | 0 (0.0%) | 0 (0.0%) |
Technology Access in Brackettville
Computing Device Access in Brackettville
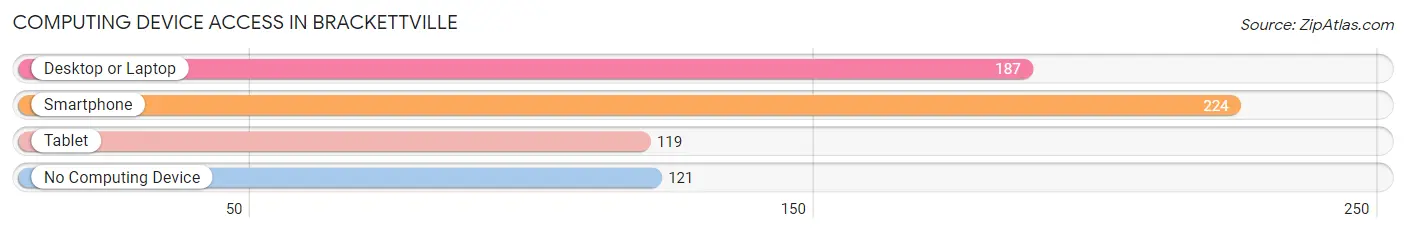
| Device Type | # Households | % Households |
| Desktop or Laptop | 187 | 47.9% |
| Smartphone | 224 | 57.4% |
| Tablet | 119 | 30.5% |
| No Computing Device | 121 | 31.0% |
| Total | 390 | 100.0% |
Internet Access in Brackettville
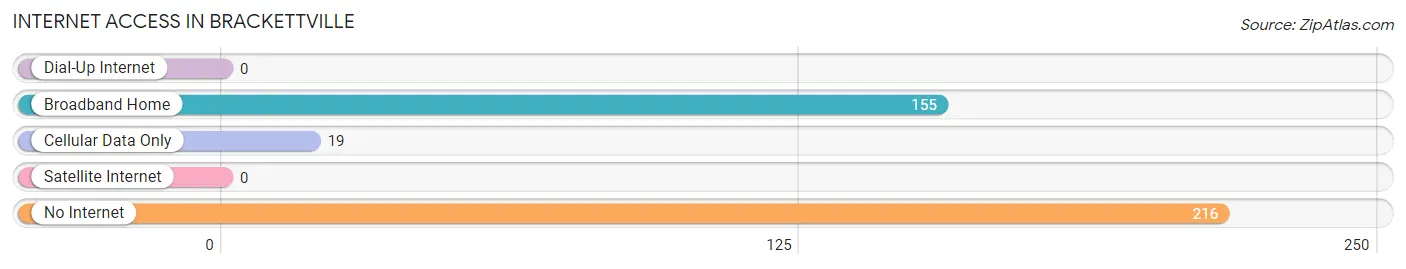
| Internet Type | # Households | % Households |
| Dial-Up Internet | 0 | 0.0% |
| Broadband Home | 155 | 39.7% |
| Cellular Data Only | 19 | 4.9% |
| Satellite Internet | 0 | 0.0% |
| No Internet | 216 | 55.4% |
| Total | 390 | 100.0% |
Brackettville Summary
Brackettville is a small town located in Kinney County, Texas, United States. It is situated on the northern edge of the Edwards Plateau, approximately 70 miles west of San Antonio. The town was founded in 1852 by Edward Brackett, a former Texas Ranger, and was named after him. As of the 2010 census, the population of Brackettville was 1,876.
History
The area around Brackettville was first inhabited by Native American tribes, including the Comanche, Lipan Apache, and Tonkawa. The first Europeans to settle in the area were Spanish missionaries and explorers, who arrived in the late 1700s. In 1852, Edward Brackett, a former Texas Ranger, established a trading post in the area. The town was named after him and was officially incorporated in 1873.
In the late 1800s, Brackettville became a popular stop on the Chisholm Trail, a cattle trail that ran from Texas to Kansas. During this time, the town was home to several saloons, gambling halls, and brothels. In the early 1900s, the town began to decline as the cattle industry moved away from the area.
In the 1920s, the town was revitalized when the U.S. Army established Fort Clark, a military base, nearby. The base was used to train soldiers for World War II and the Korean War. In the 1950s, the base was converted into a training center for the U.S. Air Force. The base was closed in the 1970s, but the town has continued to thrive.
Geography
Brackettville is located in Kinney County, Texas, approximately 70 miles west of San Antonio. The town is situated on the northern edge of the Edwards Plateau, a region of rolling hills and limestone outcroppings. The town is surrounded by several ranches and farms, and is home to several small lakes and rivers.
Economy
The economy of Brackettville is largely based on agriculture and ranching. The town is home to several large ranches, including the historic King Ranch, which is one of the largest ranches in the United States. The town is also home to several small businesses, including restaurants, shops, and hotels.
Demographics
As of the 2010 census, the population of Brackettville was 1,876. The racial makeup of the town was 79.3% White, 0.7% African American, 0.3% Native American, 0.2% Asian, 0.1% Pacific Islander, 17.2% from other races, and 2.4% from two or more races. Hispanic or Latino of any race were 44.2% of the population.
The median household income in Brackettville was $30,938, and the median family income was $35,625. The per capita income for the town was $14,945. About 18.2% of the population was below the poverty line.
Conclusion
Brackettville is a small town located in Kinney County, Texas, United States. It was founded in 1852 by Edward Brackett, a former Texas Ranger, and was named after him. The town was revitalized in the 1920s when the U.S. Army established Fort Clark nearby. The economy of Brackettville is largely based on agriculture and ranching, and the town is home to several large ranches, including the historic King Ranch. As of the 2010 census, the population of Brackettville was 1,876. The median household income in Brackettville was $30,938, and the median family income was $35,625.
Common Questions
What is Per Capita Income in Brackettville?
Per Capita income in Brackettville is $19,988.
What is the Median Household income in Brackettville?
Median Household Income in Brackettville is $24,539.
What is Inequality or Gini Index in Brackettville?
Inequality or Gini Index in Brackettville is 0.44.
What is the Total Population of Brackettville?
Total Population of Brackettville is 1,408.
What is the Total Male Population of Brackettville?
Total Male Population of Brackettville is 761.
What is the Total Female Population of Brackettville?
Total Female Population of Brackettville is 647.
What is the Ratio of Males per 100 Females in Brackettville?
There are 117.62 Males per 100 Females in Brackettville.
What is the Ratio of Females per 100 Males in Brackettville?
There are 85.02 Females per 100 Males in Brackettville.
What is the Median Population Age in Brackettville?
Median Population Age in Brackettville is 34.2 Years.
What is the Average Family Size in Brackettville
Average Family Size in Brackettville is 4.9 People.
What is the Average Household Size in Brackettville
Average Household Size in Brackettville is 3.6 People.
How Large is the Labor Force in Brackettville?
There are 617 People in the Labor Forcein in Brackettville.
What is the Percentage of People in the Labor Force in Brackettville?
54.1% of People are in the Labor Force in Brackettville.
What is the Unemployment Rate in Brackettville?
Unemployment Rate in Brackettville is 4.2%.