Bowie, TX Map & Demographics
Bowie Map
Bowie Overview
$27,227
PER CAPITA INCOME
$82,983
AVG FAMILY INCOME
$60,659
AVG HOUSEHOLD INCOME
44.1%
WAGE / INCOME GAP [ % ]
55.9¢/ $1
WAGE / INCOME GAP [ $ ]
0.35
INEQUALITY / GINI INDEX
5,483
TOTAL POPULATION
2,574
MALE POPULATION
2,909
FEMALE POPULATION
88.48
MALES / 100 FEMALES
113.01
FEMALES / 100 MALES
36.4
MEDIAN AGE
3.2
AVG FAMILY SIZE
2.6
AVG HOUSEHOLD SIZE
2,244
LABOR FORCE [ PEOPLE ]
54.1%
PERCENT IN LABOR FORCE
2.4%
UNEMPLOYMENT RATE
Bowie Zip Codes
Bowie Area Codes
Income in Bowie
Income Overview in Bowie
Per Capita Income in Bowie is $27,227, while median incomes of families and households are $82,983 and $60,659 respectively.
| Characteristic | Number | Measure |
| Per Capita Income | 5,483 | $27,227 |
| Median Family Income | 1,297 | $82,983 |
| Mean Family Income | 1,297 | $84,584 |
| Median Household Income | 2,048 | $60,659 |
| Mean Household Income | 2,048 | $70,857 |
| Income Deficit | 1,297 | $0 |
| Wage / Income Gap (%) | 5,483 | 44.08% |
| Wage / Income Gap ($) | 5,483 | 55.92¢ per $1 |
| Gini / Inequality Index | 5,483 | 0.35 |
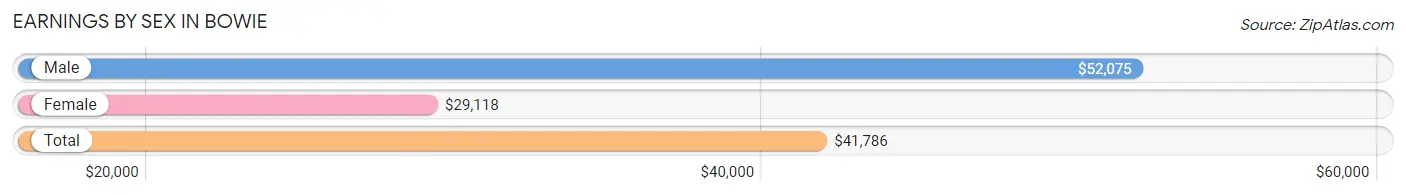
Earnings by Sex in Bowie
Average Earnings in Bowie are $41,786, $52,075 for men and $29,118 for women, a difference of 44.1%.
| Sex | Number | Average Earnings |
| Male | 1,240 (50.4%) | $52,075 |
| Female | 1,222 (49.6%) | $29,118 |
| Total | 2,462 (100.0%) | $41,786 |
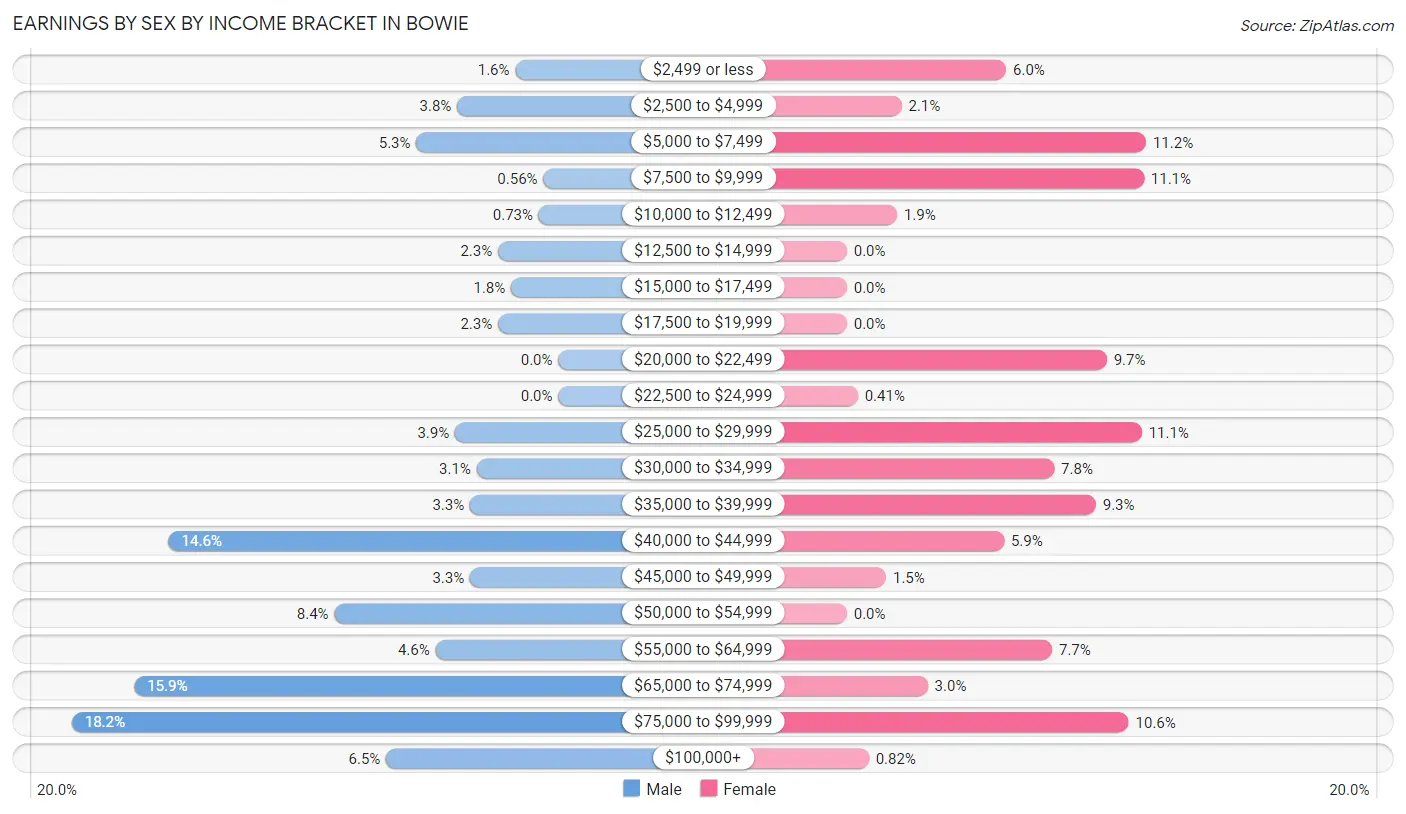
Earnings by Sex by Income Bracket in Bowie
The most common earnings brackets in Bowie are $75,000 to $99,999 for men (226 | 18.2%) and $5,000 to $7,499 for women (137 | 11.2%).
| Income | Male | Female |
| $2,499 or less | 20 (1.6%) | 73 (6.0%) |
| $2,500 to $4,999 | 47 (3.8%) | 25 (2.1%) |
| $5,000 to $7,499 | 66 (5.3%) | 137 (11.2%) |
| $7,500 to $9,999 | 7 (0.6%) | 136 (11.1%) |
| $10,000 to $12,499 | 9 (0.7%) | 23 (1.9%) |
| $12,500 to $14,999 | 28 (2.3%) | 0 (0.0%) |
| $15,000 to $17,499 | 22 (1.8%) | 0 (0.0%) |
| $17,500 to $19,999 | 28 (2.3%) | 0 (0.0%) |
| $20,000 to $22,499 | 0 (0.0%) | 119 (9.7%) |
| $22,500 to $24,999 | 0 (0.0%) | 5 (0.4%) |
| $25,000 to $29,999 | 48 (3.9%) | 135 (11.1%) |
| $30,000 to $34,999 | 38 (3.1%) | 95 (7.8%) |
| $35,000 to $39,999 | 41 (3.3%) | 114 (9.3%) |
| $40,000 to $44,999 | 181 (14.6%) | 72 (5.9%) |
| $45,000 to $49,999 | 41 (3.3%) | 18 (1.5%) |
| $50,000 to $54,999 | 104 (8.4%) | 0 (0.0%) |
| $55,000 to $64,999 | 57 (4.6%) | 94 (7.7%) |
| $65,000 to $74,999 | 197 (15.9%) | 37 (3.0%) |
| $75,000 to $99,999 | 226 (18.2%) | 129 (10.6%) |
| $100,000+ | 80 (6.5%) | 10 (0.8%) |
| Total | 1,240 (100.0%) | 1,222 (100.0%) |
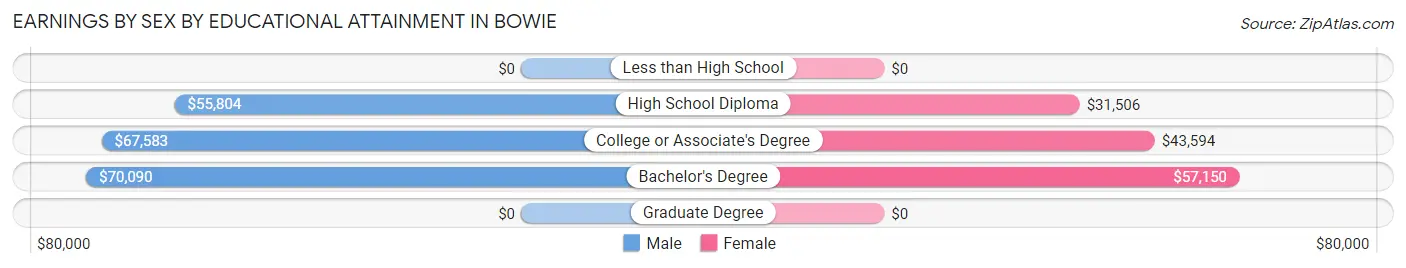
Earnings by Sex by Educational Attainment in Bowie
Average earnings in Bowie are $56,535 for men and $33,460 for women, a difference of 40.8%. Men with an educational attainment of bachelor's degree enjoy the highest average annual earnings of $70,090, while those with high school diploma education earn the least with $55,804. Women with an educational attainment of bachelor's degree earn the most with the average annual earnings of $57,150, while those with high school diploma education have the smallest earnings of $31,506.
| Educational Attainment | Male Income | Female Income |
| Less than High School | - | - |
| High School Diploma | $55,804 | $31,506 |
| College or Associate's Degree | $67,583 | $43,594 |
| Bachelor's Degree | $70,090 | $57,150 |
| Graduate Degree | - | - |
| Total | $56,535 | $33,460 |
Family Income in Bowie
Family Income Brackets in Bowie
According to the Bowie family income data, there are 354 families falling into the $50,000 to $74,999 income range, which is the most common income bracket and makes up 27.3% of all families.
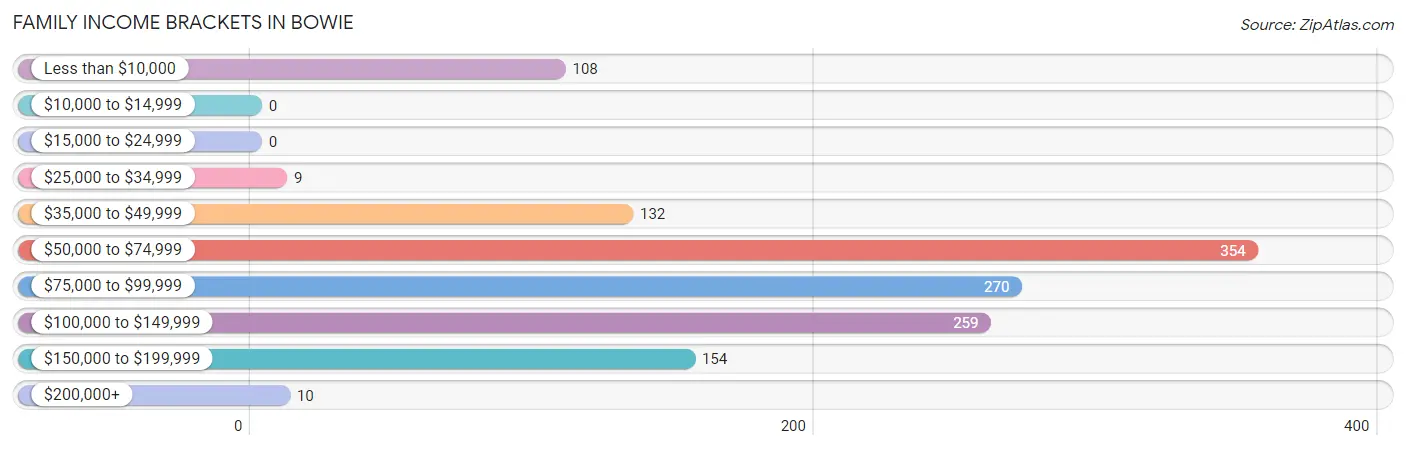
| Income Bracket | # Families | % Families |
| Less than $10,000 | 108 | 8.3% |
| $10,000 to $14,999 | 0 | 0.0% |
| $15,000 to $24,999 | 0 | 0.0% |
| $25,000 to $34,999 | 9 | 0.7% |
| $35,000 to $49,999 | 132 | 10.2% |
| $50,000 to $74,999 | 354 | 27.3% |
| $75,000 to $99,999 | 270 | 20.8% |
| $100,000 to $149,999 | 259 | 20.0% |
| $150,000 to $199,999 | 154 | 11.9% |
| $200,000+ | 10 | 0.8% |
Family Income by Famaliy Size in Bowie
5-person families (228 | 17.6%) account for the highest median family income in Bowie with $100,246 per family, while 3-person families (398 | 30.7%) have the highest median income of $31,066 per family member.
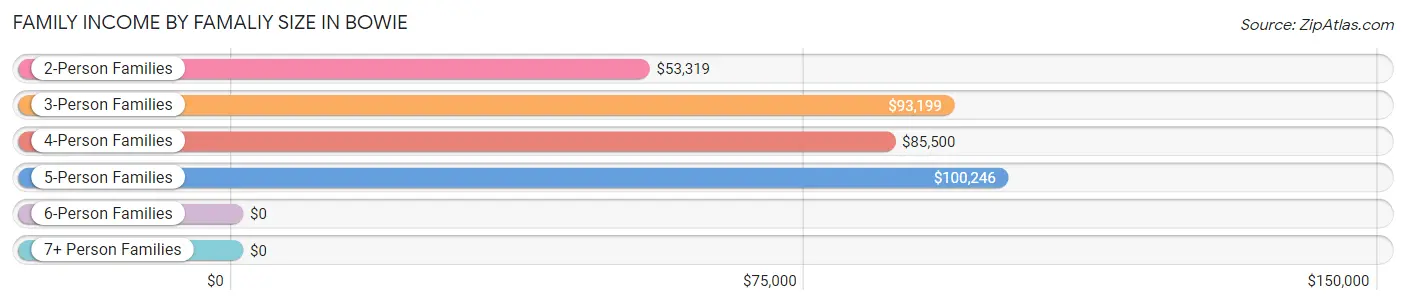
| Income Bracket | # Families | Median Income |
| 2-Person Families | 473 (36.5%) | $53,319 |
| 3-Person Families | 398 (30.7%) | $93,199 |
| 4-Person Families | 198 (15.3%) | $85,500 |
| 5-Person Families | 228 (17.6%) | $100,246 |
| 6-Person Families | 0 (0.0%) | $0 |
| 7+ Person Families | 0 (0.0%) | $0 |
| Total | 1,297 (100.0%) | $82,983 |
Family Income by Number of Earners in Bowie
The median family income in Bowie is $82,983, with families comprising 3+ earners (164) having the highest median family income of $132,542, while families with no earners (187) have the lowest median family income of $63,681, accounting for 12.6% and 14.4% of families, respectively.
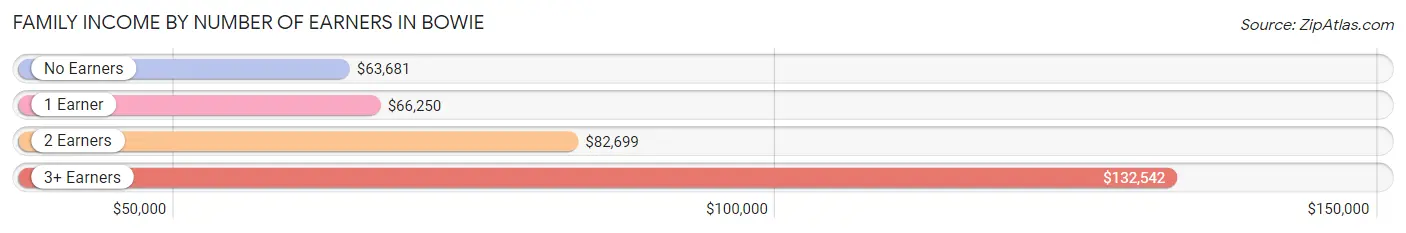
| Number of Earners | # Families | Median Income |
| No Earners | 187 (14.4%) | $63,681 |
| 1 Earner | 577 (44.5%) | $66,250 |
| 2 Earners | 369 (28.4%) | $82,699 |
| 3+ Earners | 164 (12.6%) | $132,542 |
| Total | 1,297 (100.0%) | $82,983 |
Household Income in Bowie
Household Income Brackets in Bowie
With 512 households falling in the category, the $50,000 to $74,999 income range is the most frequent in Bowie, accounting for 25.0% of all households. In contrast, only 10 households (0.5%) fall into the $200,000+ income bracket, making it the least populous group.
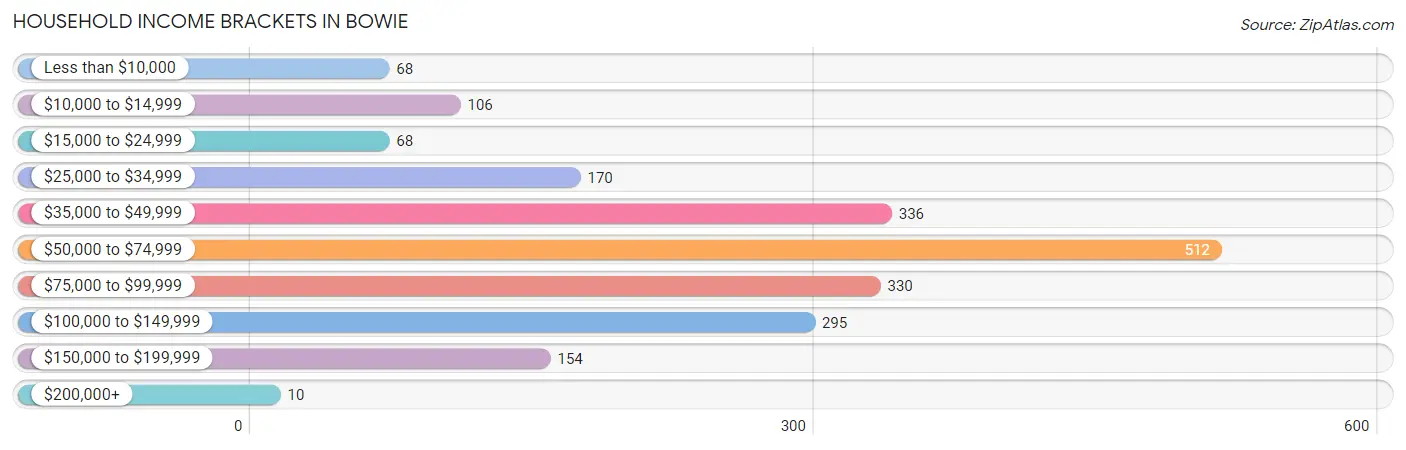
| Income Bracket | # Households | % Households |
| Less than $10,000 | 68 | 3.3% |
| $10,000 to $14,999 | 106 | 5.2% |
| $15,000 to $24,999 | 68 | 3.3% |
| $25,000 to $34,999 | 170 | 8.3% |
| $35,000 to $49,999 | 336 | 16.4% |
| $50,000 to $74,999 | 512 | 25.0% |
| $75,000 to $99,999 | 330 | 16.1% |
| $100,000 to $149,999 | 295 | 14.4% |
| $150,000 to $199,999 | 154 | 7.5% |
| $200,000+ | 10 | 0.5% |
Household Income by Householder Age in Bowie
The median household income in Bowie is $60,659, with the highest median household income of $83,990 found in the 25 to 44 years age bracket for the primary householder. A total of 669 households (32.7%) fall into this category. Meanwhile, the 65+ years age bracket for the primary householder has the lowest median household income of $41,953, with 571 households (27.9%) in this group.
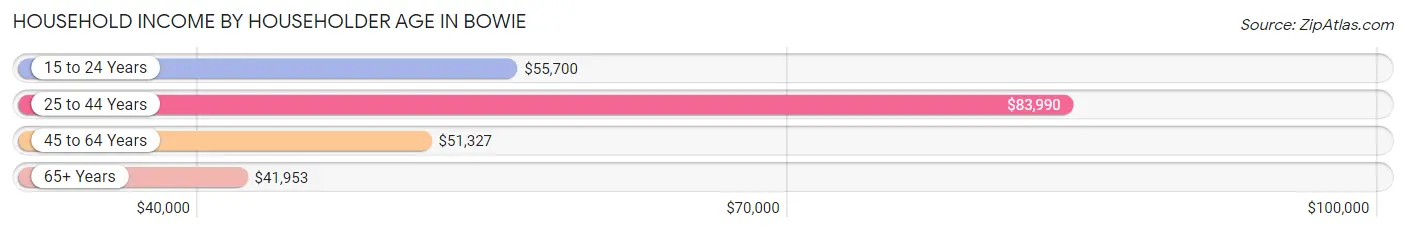
| Income Bracket | # Households | Median Income |
| 15 to 24 Years | 104 (5.1%) | $55,700 |
| 25 to 44 Years | 669 (32.7%) | $83,990 |
| 45 to 64 Years | 704 (34.4%) | $51,327 |
| 65+ Years | 571 (27.9%) | $41,953 |
| Total | 2,048 (100.0%) | $60,659 |
Poverty in Bowie
Income Below Poverty by Sex and Age in Bowie
With 16.3% poverty level for males and 13.4% for females among the residents of Bowie, 15 year old males and 6 to 11 year old females are the most vulnerable to poverty, with 65 males (100.0%) and 97 females (30.7%) in their respective age groups living below the poverty level.
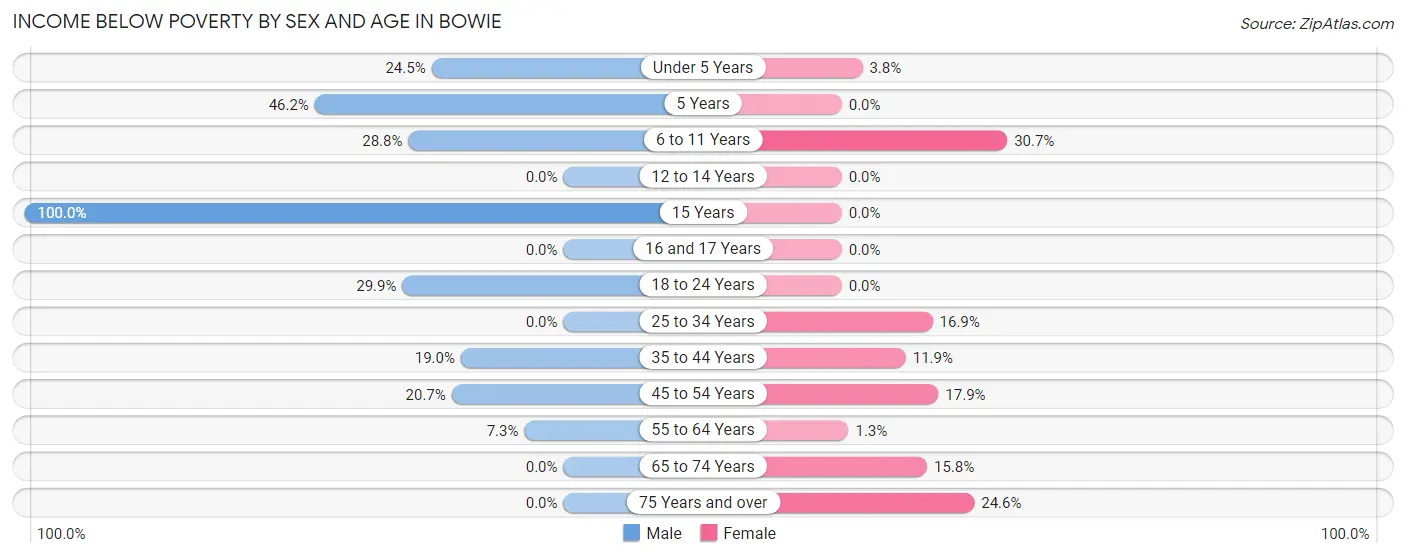
| Age Bracket | Male | Female |
| Under 5 Years | 47 (24.5%) | 7 (3.8%) |
| 5 Years | 6 (46.2%) | 0 (0.0%) |
| 6 to 11 Years | 97 (28.8%) | 97 (30.7%) |
| 12 to 14 Years | 0 (0.0%) | 0 (0.0%) |
| 15 Years | 65 (100.0%) | 0 (0.0%) |
| 16 and 17 Years | 0 (0.0%) | 0 (0.0%) |
| 18 to 24 Years | 58 (29.9%) | 0 (0.0%) |
| 25 to 34 Years | 0 (0.0%) | 71 (16.9%) |
| 35 to 44 Years | 43 (19.0%) | 41 (11.9%) |
| 45 to 54 Years | 73 (20.7%) | 45 (17.9%) |
| 55 to 64 Years | 19 (7.2%) | 5 (1.3%) |
| 65 to 74 Years | 0 (0.0%) | 19 (15.8%) |
| 75 Years and over | 0 (0.0%) | 89 (24.6%) |
| Total | 408 (16.3%) | 374 (13.4%) |
Income Above Poverty by Sex and Age in Bowie
According to the poverty statistics in Bowie, males aged 12 to 14 years and females aged 12 to 14 years are the age groups that are most secure financially, with 100.0% of males and 100.0% of females in these age groups living above the poverty line.
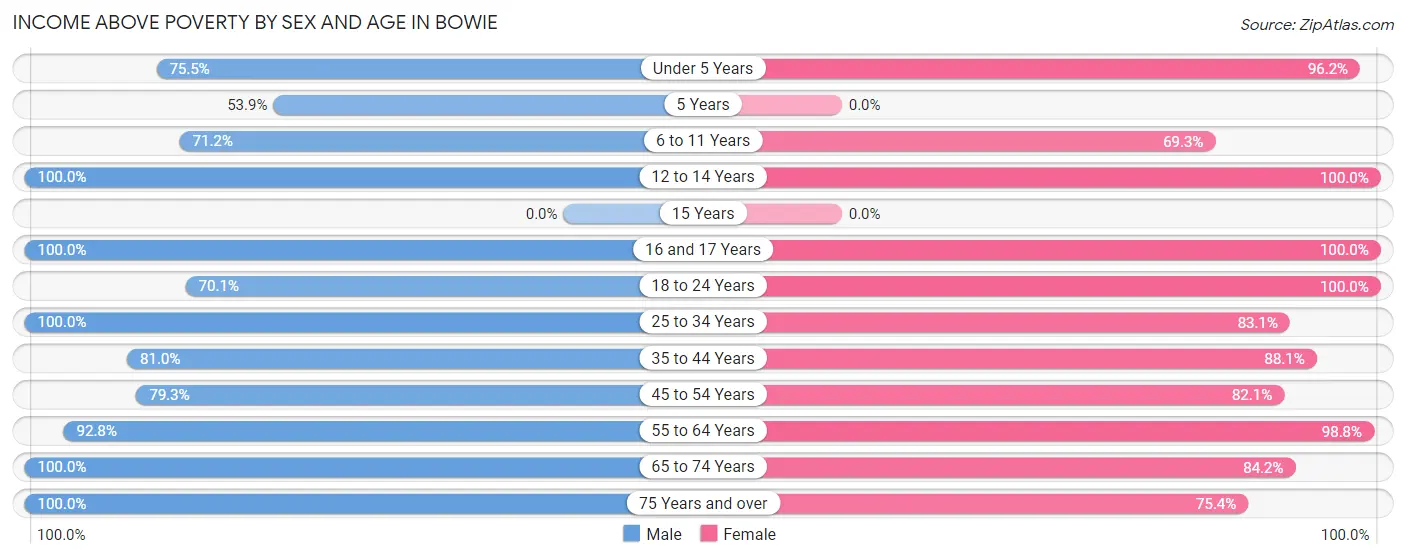
| Age Bracket | Male | Female |
| Under 5 Years | 145 (75.5%) | 176 (96.2%) |
| 5 Years | 7 (53.8%) | 0 (0.0%) |
| 6 to 11 Years | 240 (71.2%) | 219 (69.3%) |
| 12 to 14 Years | 84 (100.0%) | 145 (100.0%) |
| 15 Years | 0 (0.0%) | 0 (0.0%) |
| 16 and 17 Years | 44 (100.0%) | 86 (100.0%) |
| 18 to 24 Years | 136 (70.1%) | 170 (100.0%) |
| 25 to 34 Years | 431 (100.0%) | 350 (83.1%) |
| 35 to 44 Years | 183 (81.0%) | 304 (88.1%) |
| 45 to 54 Years | 279 (79.3%) | 206 (82.1%) |
| 55 to 64 Years | 243 (92.7%) | 396 (98.8%) |
| 65 to 74 Years | 87 (100.0%) | 101 (84.2%) |
| 75 Years and over | 224 (100.0%) | 273 (75.4%) |
| Total | 2,103 (83.8%) | 2,426 (86.6%) |
Income Below Poverty Among Married-Couple Families in Bowie
The poverty statistics for married-couple families in Bowie show that 2.4% or 23 of the total 974 families live below the poverty line. Families with no children have the highest poverty rate of 4.3%, comprising of 23 families. On the other hand, families with 1 or 2 children have the lowest poverty rate of 0.0%, which includes 0 families.
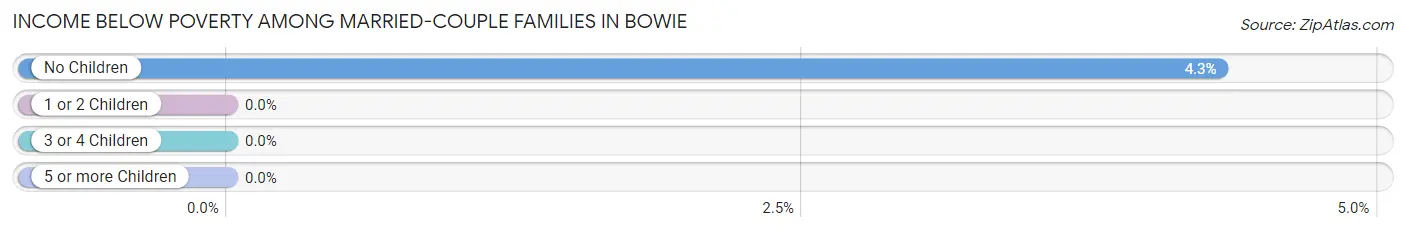
| Children | Above Poverty | Below Poverty |
| No Children | 511 (95.7%) | 23 (4.3%) |
| 1 or 2 Children | 282 (100.0%) | 0 (0.0%) |
| 3 or 4 Children | 158 (100.0%) | 0 (0.0%) |
| 5 or more Children | 0 (0.0%) | 0 (0.0%) |
| Total | 951 (97.6%) | 23 (2.4%) |
Income Below Poverty Among Single-Parent Households in Bowie
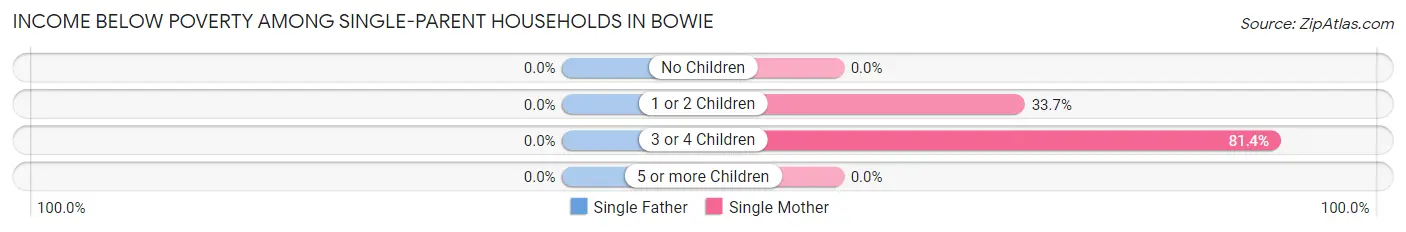
| Children | Single Father | Single Mother |
| No Children | 0 (0.0%) | 0 (0.0%) |
| 1 or 2 Children | 0 (0.0%) | 28 (33.7%) |
| 3 or 4 Children | 0 (0.0%) | 57 (81.4%) |
| 5 or more Children | 0 (0.0%) | 0 (0.0%) |
| Total | 0 (0.0%) | 85 (33.6%) |
Income Below Poverty Among Married-Couple vs Single-Parent Households in Bowie
The poverty data for Bowie shows that 23 of the married-couple family households (2.4%) and 85 of the single-parent households (26.3%) are living below the poverty level. Within the married-couple family households, those with no children have the highest poverty rate, with 23 households (4.3%) falling below the poverty line. Among the single-parent households, those with 3 or 4 children have the highest poverty rate, with 57 household (81.4%) living below poverty.
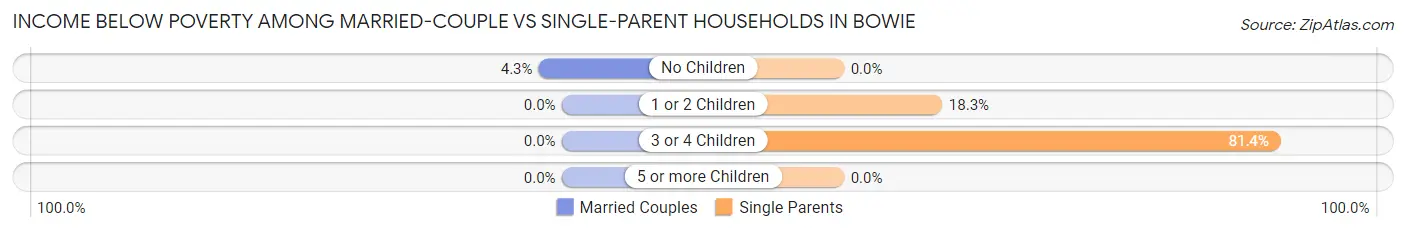
| Children | Married-Couple Families | Single-Parent Households |
| No Children | 23 (4.3%) | 0 (0.0%) |
| 1 or 2 Children | 0 (0.0%) | 28 (18.3%) |
| 3 or 4 Children | 0 (0.0%) | 57 (81.4%) |
| 5 or more Children | 0 (0.0%) | 0 (0.0%) |
| Total | 23 (2.4%) | 85 (26.3%) |
Race in Bowie
The most populous races in Bowie are White / Caucasian (5,097 | 93.0%), Hispanic or Latino (380 | 6.9%), and Two or more Races (263 | 4.8%).
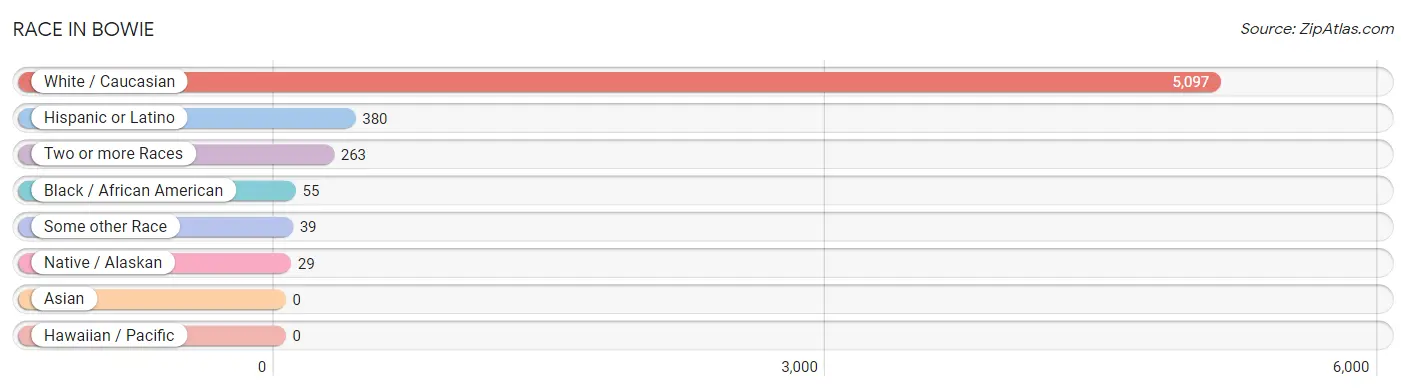
| Race | # Population | % Population |
| Asian | 0 | 0.0% |
| Black / African American | 55 | 1.0% |
| Hawaiian / Pacific | 0 | 0.0% |
| Hispanic or Latino | 380 | 6.9% |
| Native / Alaskan | 29 | 0.5% |
| White / Caucasian | 5,097 | 93.0% |
| Two or more Races | 263 | 4.8% |
| Some other Race | 39 | 0.7% |
| Total | 5,483 | 100.0% |
Ancestry in Bowie
The most populous ancestries reported in Bowie are Irish (717 | 13.1%), English (587 | 10.7%), American (545 | 9.9%), German (449 | 8.2%), and Mexican (347 | 6.3%), together accounting for 48.3% of all Bowie residents.
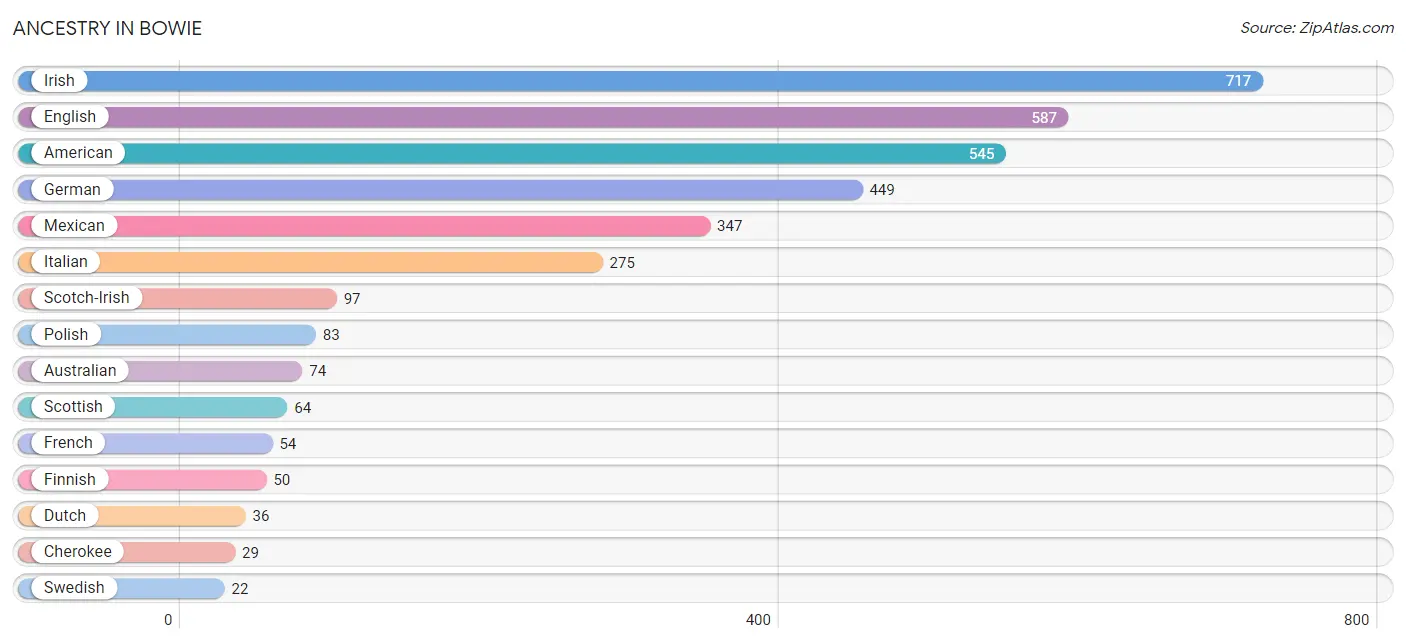
| Ancestry | # Population | % Population |
| American | 545 | 9.9% |
| Australian | 74 | 1.3% |
| Cherokee | 29 | 0.5% |
| Czech | 13 | 0.2% |
| Dutch | 36 | 0.7% |
| English | 587 | 10.7% |
| European | 12 | 0.2% |
| Finnish | 50 | 0.9% |
| French | 54 | 1.0% |
| German | 449 | 8.2% |
| Irish | 717 | 13.1% |
| Italian | 275 | 5.0% |
| Malaysian | 5 | 0.1% |
| Mexican | 347 | 6.3% |
| Polish | 83 | 1.5% |
| Scotch-Irish | 97 | 1.8% |
| Scottish | 64 | 1.2% |
| Swedish | 22 | 0.4% | View All 18 Rows |
Immigrants in Bowie
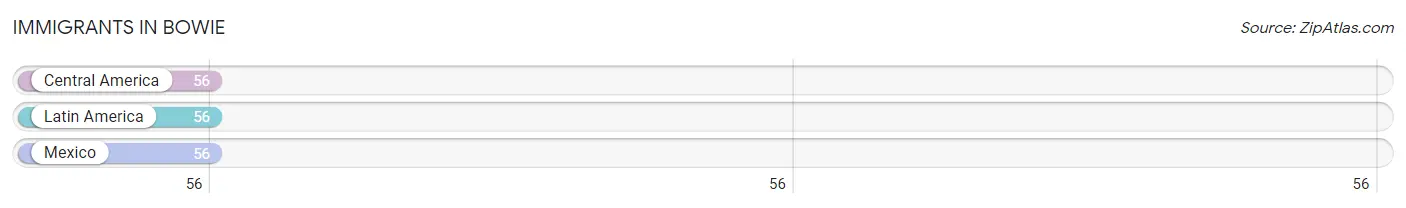
The most numerous immigrant groups reported in Bowie came from Central America (56 | 1.0%), Latin America (56 | 1.0%), and Mexico (56 | 1.0%), together accounting for 3.1% of all Bowie residents.
| Immigration Origin | # Population | % Population |
| Central America | 56 | 1.0% |
| Latin America | 56 | 1.0% |
| Mexico | 56 | 1.0% | View All 3 Rows |
Sex and Age in Bowie
Sex and Age in Bowie
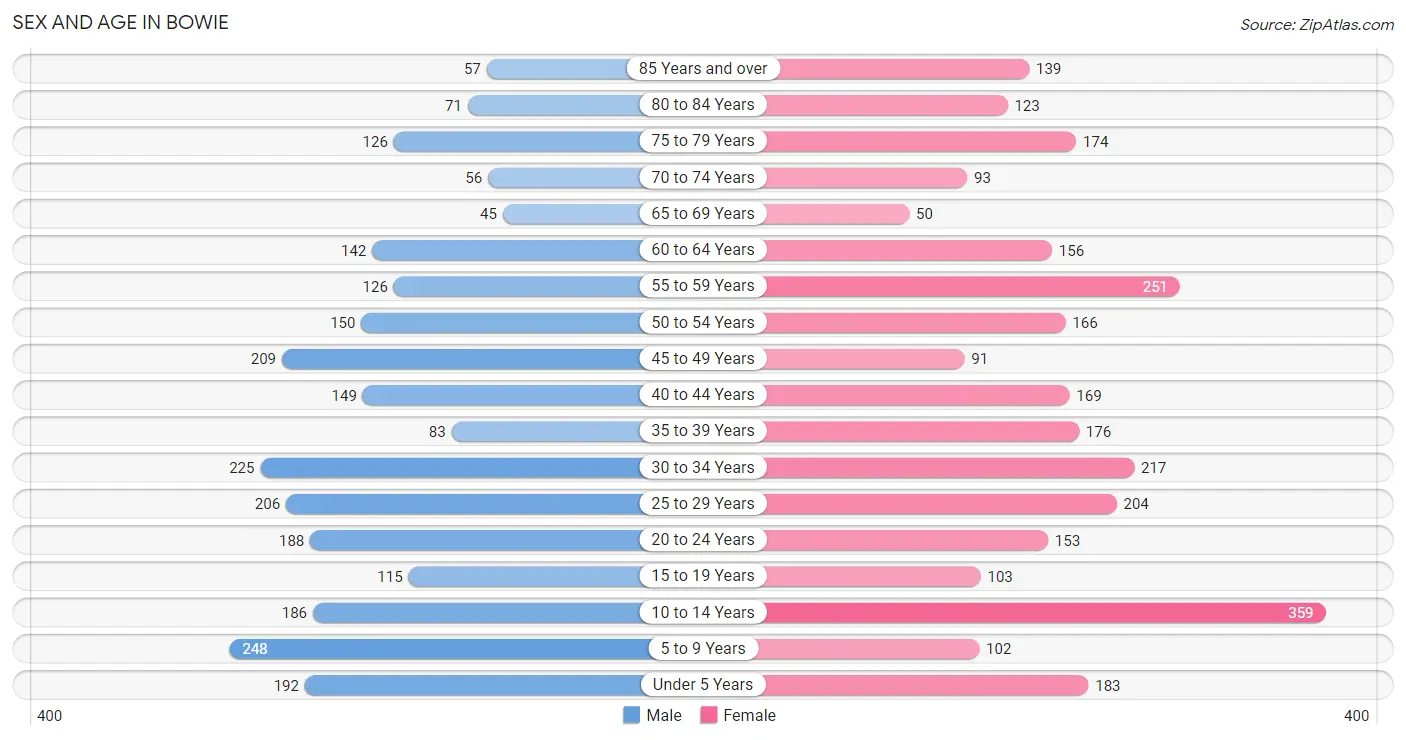
The most populous age groups in Bowie are 5 to 9 Years (248 | 9.6%) for men and 10 to 14 Years (359 | 12.3%) for women.
| Age Bracket | Male | Female |
| Under 5 Years | 192 (7.5%) | 183 (6.3%) |
| 5 to 9 Years | 248 (9.6%) | 102 (3.5%) |
| 10 to 14 Years | 186 (7.2%) | 359 (12.3%) |
| 15 to 19 Years | 115 (4.5%) | 103 (3.5%) |
| 20 to 24 Years | 188 (7.3%) | 153 (5.3%) |
| 25 to 29 Years | 206 (8.0%) | 204 (7.0%) |
| 30 to 34 Years | 225 (8.7%) | 217 (7.5%) |
| 35 to 39 Years | 83 (3.2%) | 176 (6.0%) |
| 40 to 44 Years | 149 (5.8%) | 169 (5.8%) |
| 45 to 49 Years | 209 (8.1%) | 91 (3.1%) |
| 50 to 54 Years | 150 (5.8%) | 166 (5.7%) |
| 55 to 59 Years | 126 (4.9%) | 251 (8.6%) |
| 60 to 64 Years | 142 (5.5%) | 156 (5.4%) |
| 65 to 69 Years | 45 (1.8%) | 50 (1.7%) |
| 70 to 74 Years | 56 (2.2%) | 93 (3.2%) |
| 75 to 79 Years | 126 (4.9%) | 174 (6.0%) |
| 80 to 84 Years | 71 (2.8%) | 123 (4.2%) |
| 85 Years and over | 57 (2.2%) | 139 (4.8%) |
| Total | 2,574 (100.0%) | 2,909 (100.0%) |
Families and Households in Bowie
Median Family Size in Bowie
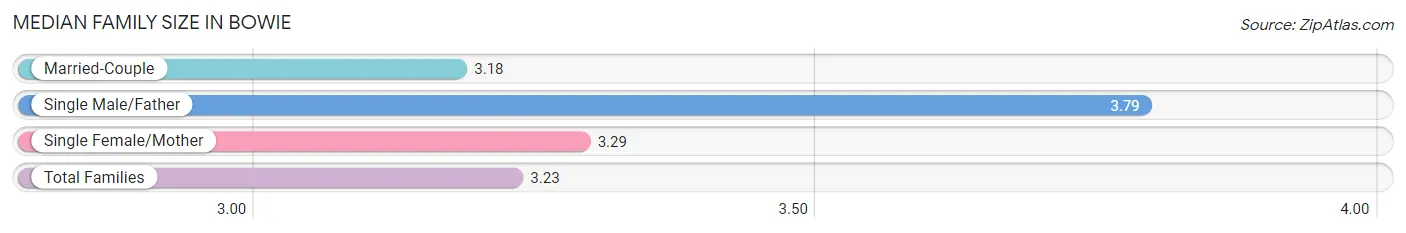
The median family size in Bowie is 3.23 persons per family, with single male/father families (70 | 5.4%) accounting for the largest median family size of 3.79 persons per family. On the other hand, married-couple families (974 | 75.1%) represent the smallest median family size with 3.18 persons per family.
| Family Type | # Families | Family Size |
| Married-Couple | 974 (75.1%) | 3.18 |
| Single Male/Father | 70 (5.4%) | 3.79 |
| Single Female/Mother | 253 (19.5%) | 3.29 |
| Total Families | 1,297 (100.0%) | 3.23 |
Median Household Size in Bowie
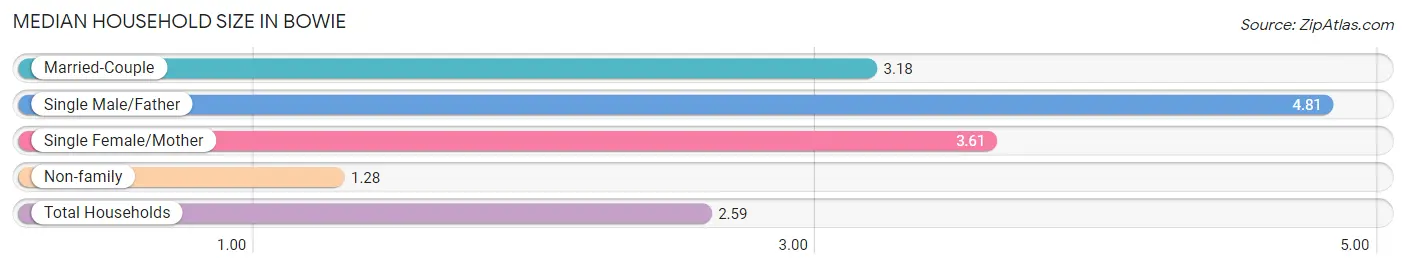
The median household size in Bowie is 2.59 persons per household, with single male/father households (70 | 3.4%) accounting for the largest median household size of 4.81 persons per household. non-family households (751 | 36.7%) represent the smallest median household size with 1.28 persons per household.
| Household Type | # Households | Household Size |
| Married-Couple | 974 (47.6%) | 3.18 |
| Single Male/Father | 70 (3.4%) | 4.81 |
| Single Female/Mother | 253 (12.3%) | 3.61 |
| Non-family | 751 (36.7%) | 1.28 |
| Total Households | 2,048 (100.0%) | 2.59 |
Household Size by Marriage Status in Bowie
Out of a total of 2,048 households in Bowie, 1,297 (63.3%) are family households, while 751 (36.7%) are nonfamily households. The most numerous type of family households are 2-person households, comprising 441, and the most common type of nonfamily households are 1-person households, comprising 558.
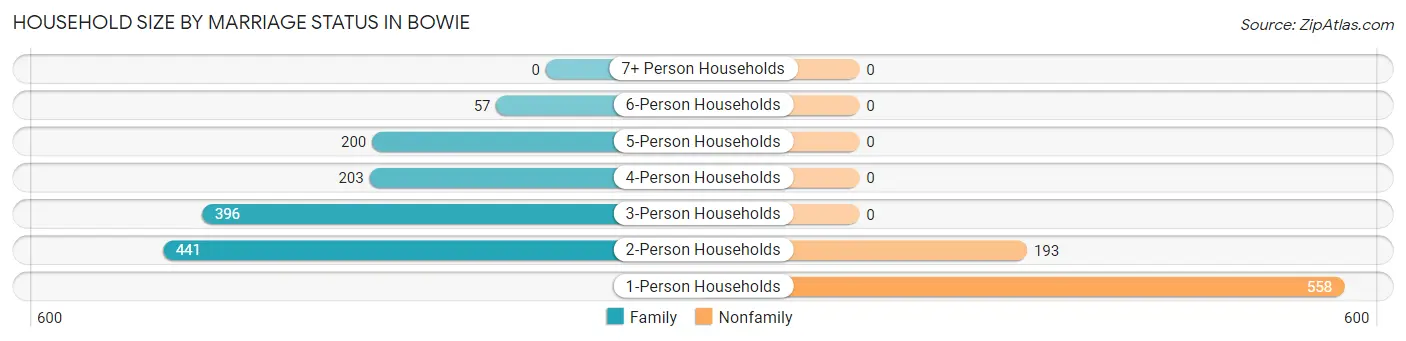
| Household Size | Family Households | Nonfamily Households |
| 1-Person Households | - | 558 (27.3%) |
| 2-Person Households | 441 (21.5%) | 193 (9.4%) |
| 3-Person Households | 396 (19.3%) | 0 (0.0%) |
| 4-Person Households | 203 (9.9%) | 0 (0.0%) |
| 5-Person Households | 200 (9.8%) | 0 (0.0%) |
| 6-Person Households | 57 (2.8%) | 0 (0.0%) |
| 7+ Person Households | 0 (0.0%) | 0 (0.0%) |
| Total | 1,297 (63.3%) | 751 (36.7%) |
Female Fertility in Bowie
Fertility by Age in Bowie
Average fertility rate in Bowie is 111.0 births per 1,000 women. Women in the age bracket of 20 to 34 years have the highest fertility rate with 214.0 births per 1,000 women. Women in the age bracket of 20 to 34 years acount for 100.0% of all women with births.
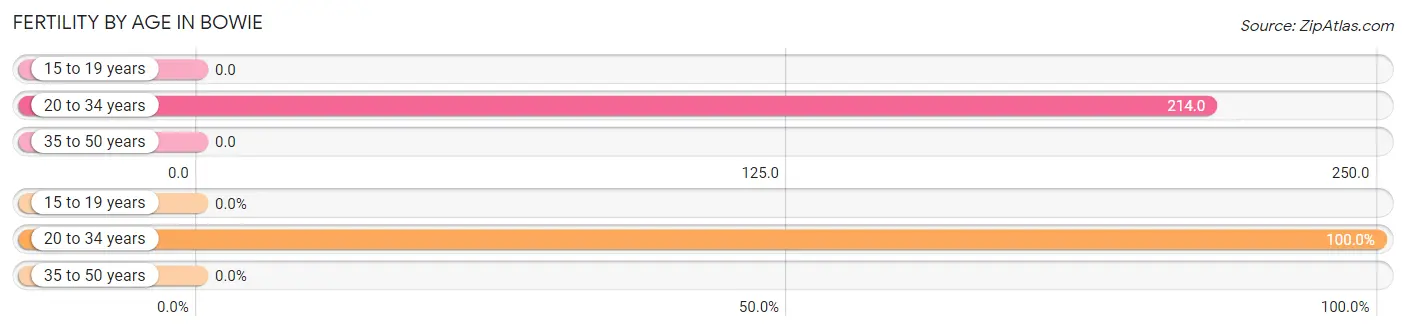
| Age Bracket | Women with Births | Births / 1,000 Women |
| 15 to 19 years | 0 (0.0%) | 0.0 |
| 20 to 34 years | 123 (100.0%) | 214.0 |
| 35 to 50 years | 0 (0.0%) | 0.0 |
| Total | 123 (100.0%) | 111.0 |
Fertility by Age by Marriage Status in Bowie
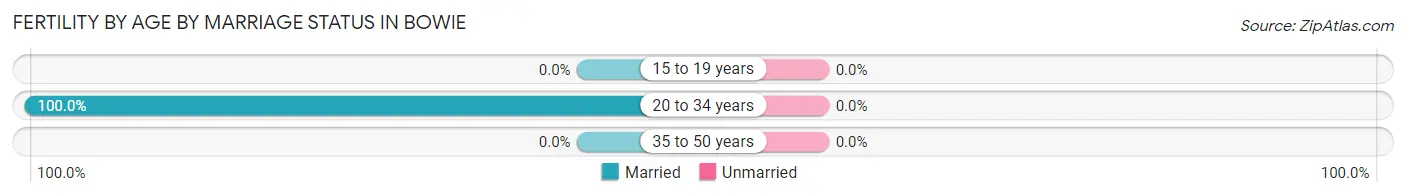
| Age Bracket | Married | Unmarried |
| 15 to 19 years | 0 (0.0%) | 0 (0.0%) |
| 20 to 34 years | 123 (100.0%) | 0 (0.0%) |
| 35 to 50 years | 0 (0.0%) | 0 (0.0%) |
| Total | 123 (100.0%) | 0 (0.0%) |
Fertility by Education in Bowie
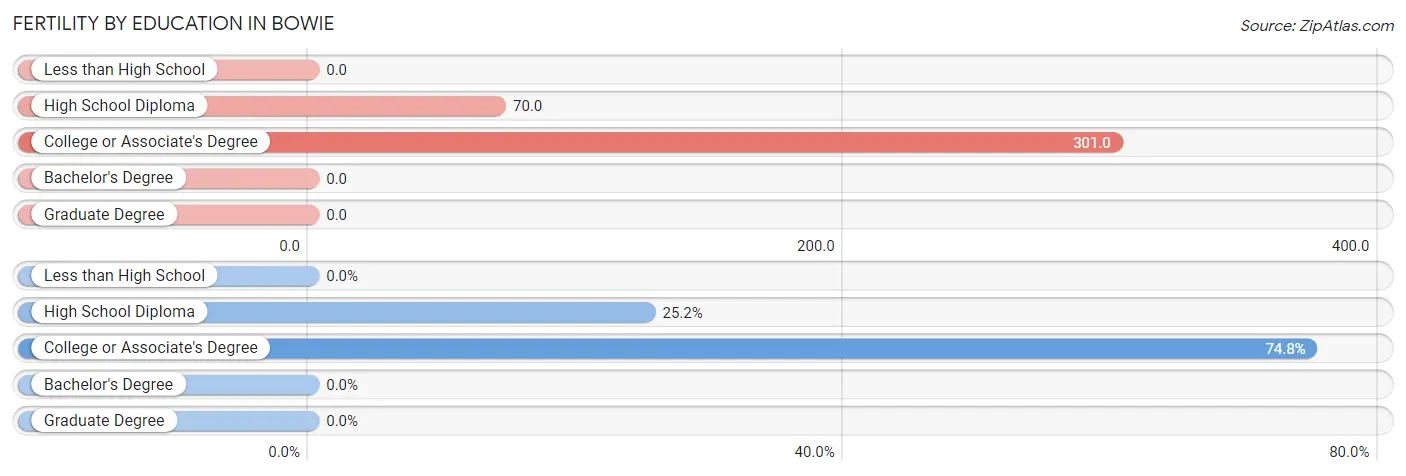
| Educational Attainment | Women with Births | Births / 1,000 Women |
| Less than High School | 0 (0.0%) | 0.0 |
| High School Diploma | 31 (25.2%) | 70.0 |
| College or Associate's Degree | 92 (74.8%) | 301.0 |
| Bachelor's Degree | 0 (0.0%) | 0.0 |
| Graduate Degree | 0 (0.0%) | 0.0 |
| Total | 123 (100.0%) | 111.0 |
Fertility by Education by Marriage Status in Bowie
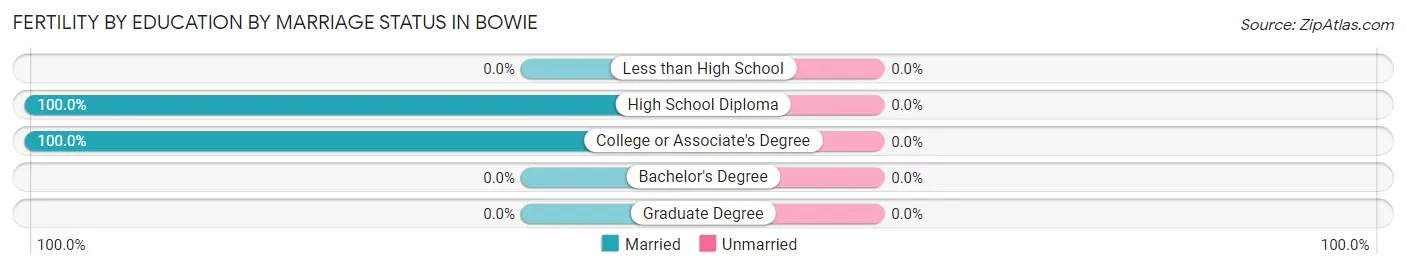
| Educational Attainment | Married | Unmarried |
| Less than High School | 0 (0.0%) | 0 (0.0%) |
| High School Diploma | 31 (100.0%) | 0 (0.0%) |
| College or Associate's Degree | 92 (100.0%) | 0 (0.0%) |
| Bachelor's Degree | 0 (0.0%) | 0 (0.0%) |
| Graduate Degree | 0 (0.0%) | 0 (0.0%) |
| Total | 123 (100.0%) | 0 (0.0%) |
Employment Characteristics in Bowie
Employment by Class of Employer in Bowie
Among the 2,190 employed individuals in Bowie, private company employees (1,579 | 72.1%), self-employed (not incorporated) (271 | 12.4%), and local government employees (236 | 10.8%) make up the most common classes of employment.
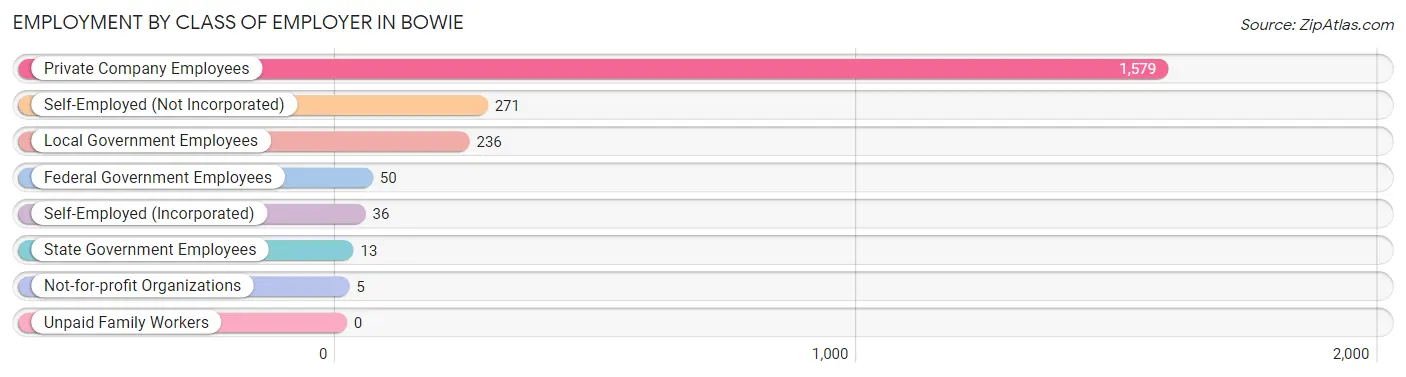
| Employer Class | # Employees | % Employees |
| Private Company Employees | 1,579 | 72.1% |
| Self-Employed (Incorporated) | 36 | 1.6% |
| Self-Employed (Not Incorporated) | 271 | 12.4% |
| Not-for-profit Organizations | 5 | 0.2% |
| Local Government Employees | 236 | 10.8% |
| State Government Employees | 13 | 0.6% |
| Federal Government Employees | 50 | 2.3% |
| Unpaid Family Workers | 0 | 0.0% |
| Total | 2,190 | 100.0% |
Employment Status by Age in Bowie
According to the labor force statistics for Bowie, out of the total population over 16 years of age (4,148), 54.1% or 2,244 individuals are in the labor force, with 2.4% or 54 of them unemployed. The age group with the highest labor force participation rate is 25 to 29 years, with 88.3% or 362 individuals in the labor force. Within the labor force, the 35 to 44 years age range has the highest percentage of unemployed individuals, with 9.9% or 42 of them being unemployed.
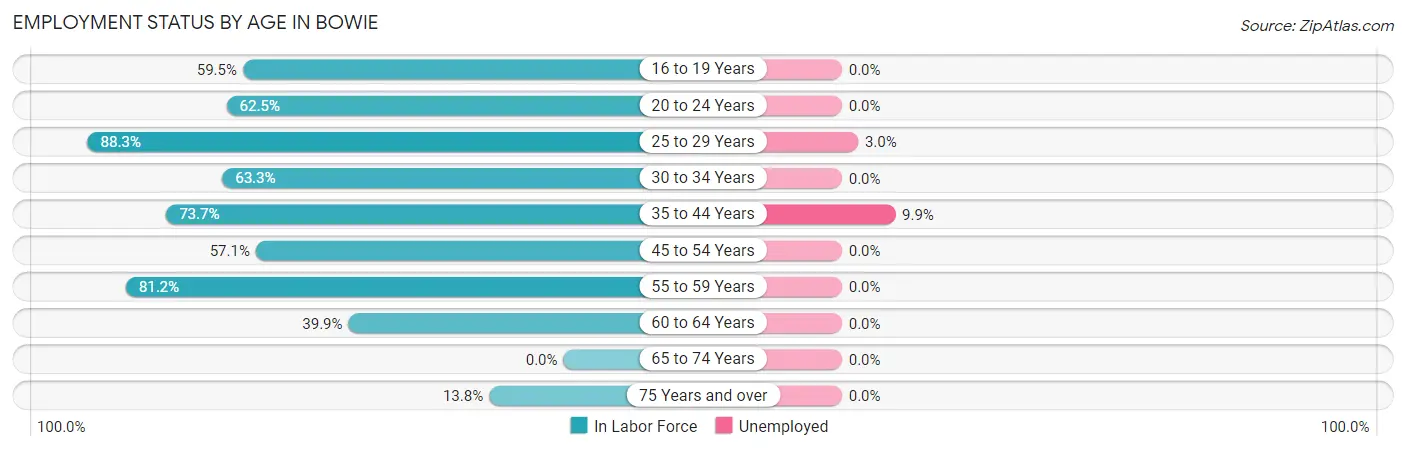
| Age Bracket | In Labor Force | Unemployed |
| 16 to 19 Years | 91 (59.5%) | 0 (0.0%) |
| 20 to 24 Years | 213 (62.5%) | 0 (0.0%) |
| 25 to 29 Years | 362 (88.3%) | 11 (3.0%) |
| 30 to 34 Years | 280 (63.3%) | 0 (0.0%) |
| 35 to 44 Years | 425 (73.7%) | 42 (9.9%) |
| 45 to 54 Years | 352 (57.1%) | 0 (0.0%) |
| 55 to 59 Years | 306 (81.2%) | 0 (0.0%) |
| 60 to 64 Years | 119 (39.9%) | 0 (0.0%) |
| 65 to 74 Years | 0 (0.0%) | 0 (0.0%) |
| 75 Years and over | 95 (13.8%) | 0 (0.0%) |
| Total | 2,244 (54.1%) | 54 (2.4%) |
Employment Status by Educational Attainment in Bowie
According to labor force statistics for Bowie, 67.8% of individuals (1,844) out of the total population between 25 and 64 years of age (2,720) are in the labor force, with 2.9% or 53 of them being unemployed. The group with the highest labor force participation rate are those with the educational attainment of bachelor's degree or higher, with 77.7% or 331 individuals in the labor force. Within the labor force, individuals with high school diploma education have the highest percentage of unemployment, with 5.9% or 53 of them being unemployed.
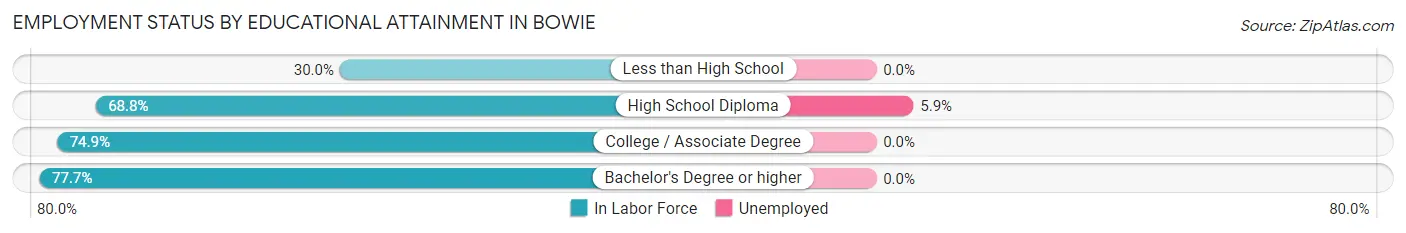
| Educational Attainment | In Labor Force | Unemployed |
| Less than High School | 84 (30.0%) | 0 (0.0%) |
| High School Diploma | 896 (68.8%) | 77 (5.9%) |
| College / Associate Degree | 533 (74.9%) | 0 (0.0%) |
| Bachelor's Degree or higher | 331 (77.7%) | 0 (0.0%) |
| Total | 1,844 (67.8%) | 79 (2.9%) |
Employment Occupations by Sex in Bowie
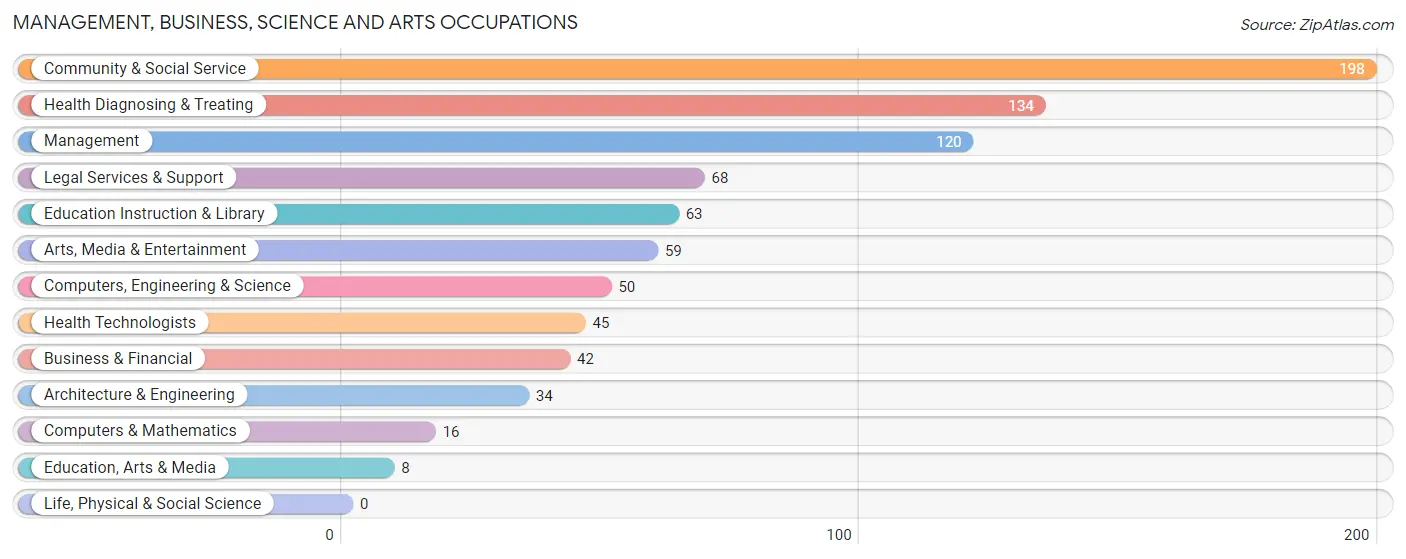
Management, Business, Science and Arts Occupations
The most common Management, Business, Science and Arts occupations in Bowie are Community & Social Service (198 | 9.1%), Health Diagnosing & Treating (134 | 6.1%), Management (120 | 5.5%), Legal Services & Support (68 | 3.1%), and Education Instruction & Library (63 | 2.9%).
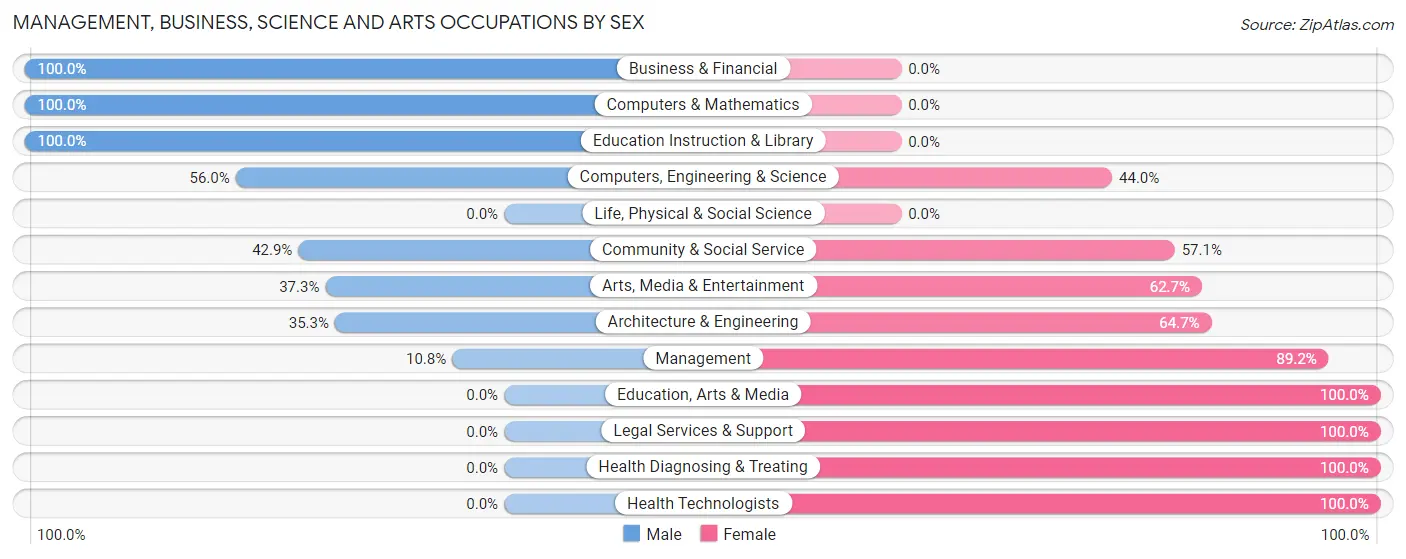
Management, Business, Science and Arts Occupations by Sex
Within the Management, Business, Science and Arts occupations in Bowie, the most male-oriented occupations are Business & Financial (100.0%), Computers & Mathematics (100.0%), and Education Instruction & Library (100.0%), while the most female-oriented occupations are Education, Arts & Media (100.0%), Legal Services & Support (100.0%), and Health Diagnosing & Treating (100.0%).
| Occupation | Male | Female |
| Management | 13 (10.8%) | 107 (89.2%) |
| Business & Financial | 42 (100.0%) | 0 (0.0%) |
| Computers, Engineering & Science | 28 (56.0%) | 22 (44.0%) |
| Computers & Mathematics | 16 (100.0%) | 0 (0.0%) |
| Architecture & Engineering | 12 (35.3%) | 22 (64.7%) |
| Life, Physical & Social Science | 0 (0.0%) | 0 (0.0%) |
| Community & Social Service | 85 (42.9%) | 113 (57.1%) |
| Education, Arts & Media | 0 (0.0%) | 8 (100.0%) |
| Legal Services & Support | 0 (0.0%) | 68 (100.0%) |
| Education Instruction & Library | 63 (100.0%) | 0 (0.0%) |
| Arts, Media & Entertainment | 22 (37.3%) | 37 (62.7%) |
| Health Diagnosing & Treating | 0 (0.0%) | 134 (100.0%) |
| Health Technologists | 0 (0.0%) | 45 (100.0%) |
| Total (Category) | 168 (30.9%) | 376 (69.1%) |
| Total (Overall) | 1,170 (53.6%) | 1,014 (46.4%) |
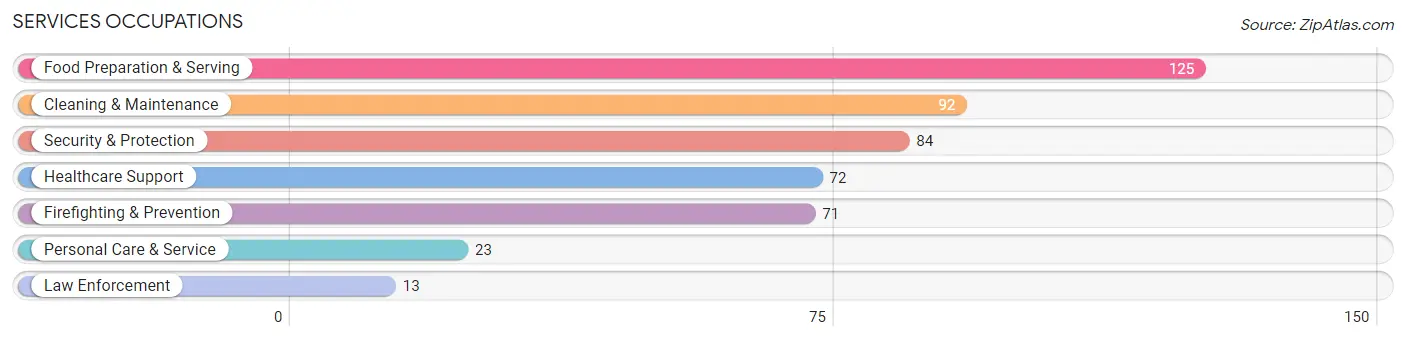
Services Occupations
The most common Services occupations in Bowie are Food Preparation & Serving (125 | 5.7%), Cleaning & Maintenance (92 | 4.2%), Security & Protection (84 | 3.8%), Healthcare Support (72 | 3.3%), and Firefighting & Prevention (71 | 3.3%).
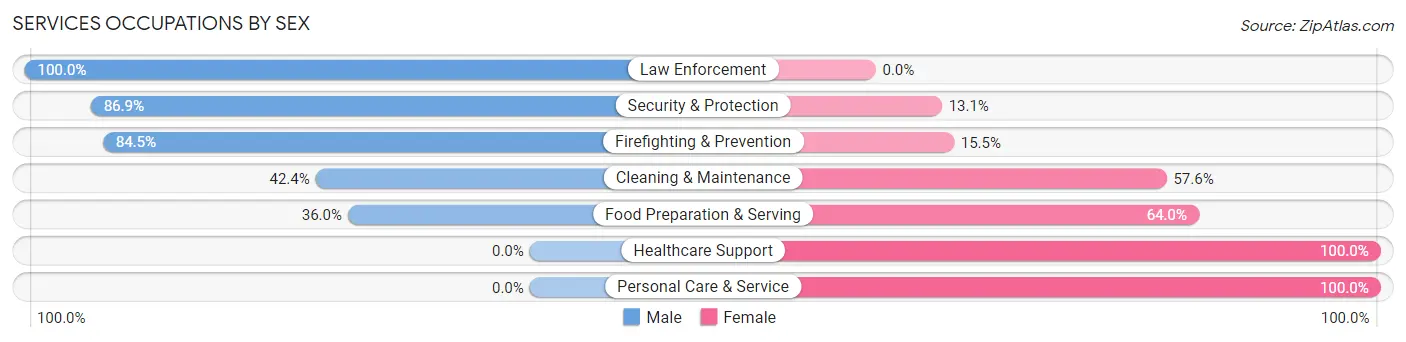
Services Occupations by Sex
Within the Services occupations in Bowie, the most male-oriented occupations are Law Enforcement (100.0%), Security & Protection (86.9%), and Firefighting & Prevention (84.5%), while the most female-oriented occupations are Healthcare Support (100.0%), Personal Care & Service (100.0%), and Food Preparation & Serving (64.0%).
| Occupation | Male | Female |
| Healthcare Support | 0 (0.0%) | 72 (100.0%) |
| Security & Protection | 73 (86.9%) | 11 (13.1%) |
| Firefighting & Prevention | 60 (84.5%) | 11 (15.5%) |
| Law Enforcement | 13 (100.0%) | 0 (0.0%) |
| Food Preparation & Serving | 45 (36.0%) | 80 (64.0%) |
| Cleaning & Maintenance | 39 (42.4%) | 53 (57.6%) |
| Personal Care & Service | 0 (0.0%) | 23 (100.0%) |
| Total (Category) | 157 (39.7%) | 239 (60.4%) |
| Total (Overall) | 1,170 (53.6%) | 1,014 (46.4%) |
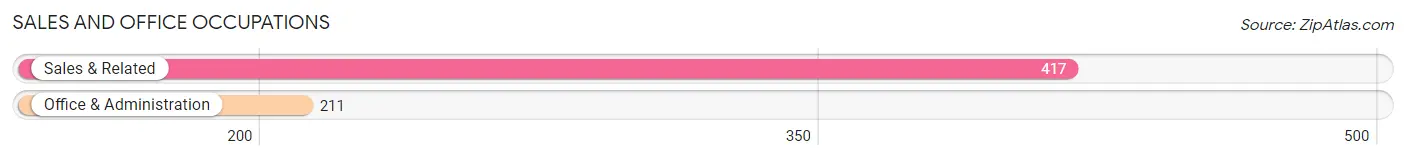
Sales and Office Occupations
The most common Sales and Office occupations in Bowie are Sales & Related (417 | 19.1%), and Office & Administration (211 | 9.7%).
Sales and Office Occupations by Sex
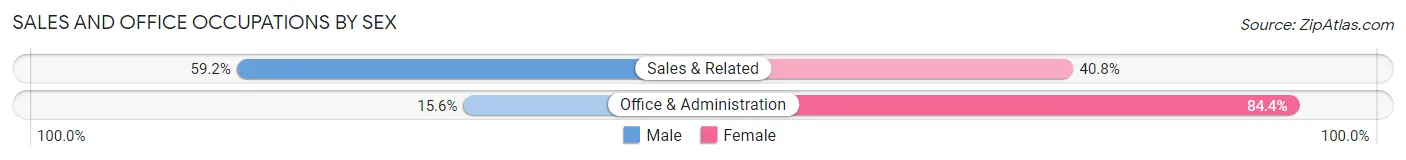
| Occupation | Male | Female |
| Sales & Related | 247 (59.2%) | 170 (40.8%) |
| Office & Administration | 33 (15.6%) | 178 (84.4%) |
| Total (Category) | 280 (44.6%) | 348 (55.4%) |
| Total (Overall) | 1,170 (53.6%) | 1,014 (46.4%) |
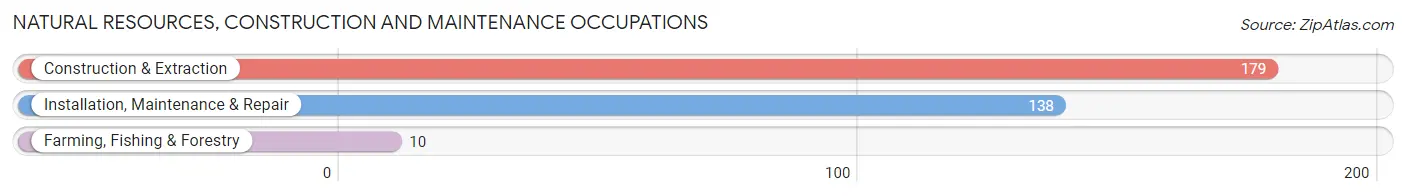
Natural Resources, Construction and Maintenance Occupations
The most common Natural Resources, Construction and Maintenance occupations in Bowie are Construction & Extraction (179 | 8.2%), Installation, Maintenance & Repair (138 | 6.3%), and Farming, Fishing & Forestry (10 | 0.5%).
Natural Resources, Construction and Maintenance Occupations by Sex
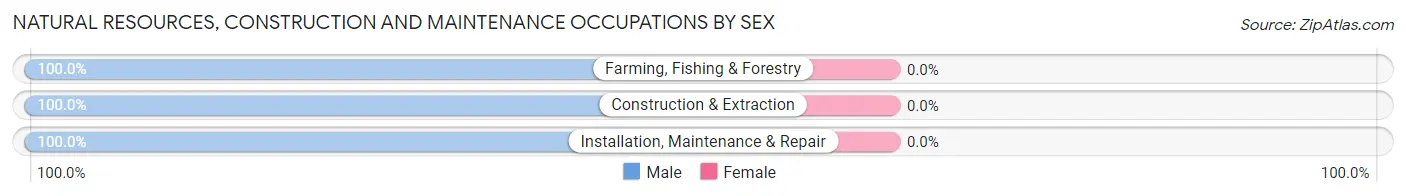
| Occupation | Male | Female |
| Farming, Fishing & Forestry | 10 (100.0%) | 0 (0.0%) |
| Construction & Extraction | 179 (100.0%) | 0 (0.0%) |
| Installation, Maintenance & Repair | 138 (100.0%) | 0 (0.0%) |
| Total (Category) | 327 (100.0%) | 0 (0.0%) |
| Total (Overall) | 1,170 (53.6%) | 1,014 (46.4%) |
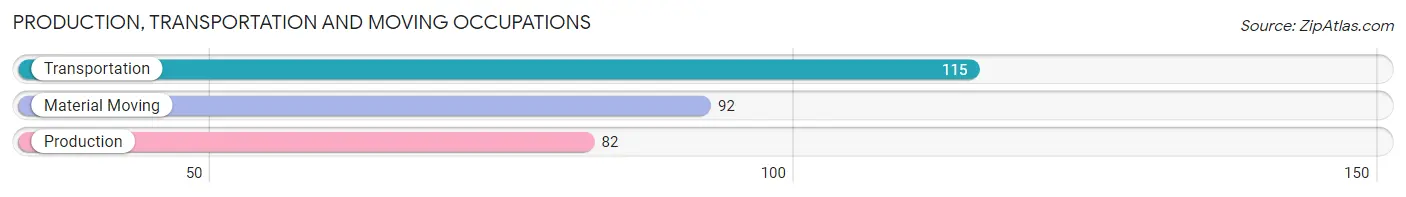
Production, Transportation and Moving Occupations
The most common Production, Transportation and Moving occupations in Bowie are Transportation (115 | 5.3%), Material Moving (92 | 4.2%), and Production (82 | 3.7%).
Production, Transportation and Moving Occupations by Sex
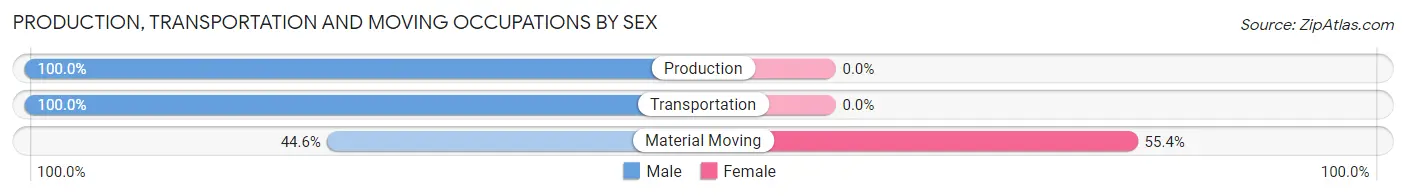
| Occupation | Male | Female |
| Production | 82 (100.0%) | 0 (0.0%) |
| Transportation | 115 (100.0%) | 0 (0.0%) |
| Material Moving | 41 (44.6%) | 51 (55.4%) |
| Total (Category) | 238 (82.4%) | 51 (17.6%) |
| Total (Overall) | 1,170 (53.6%) | 1,014 (46.4%) |
Employment Industries by Sex in Bowie
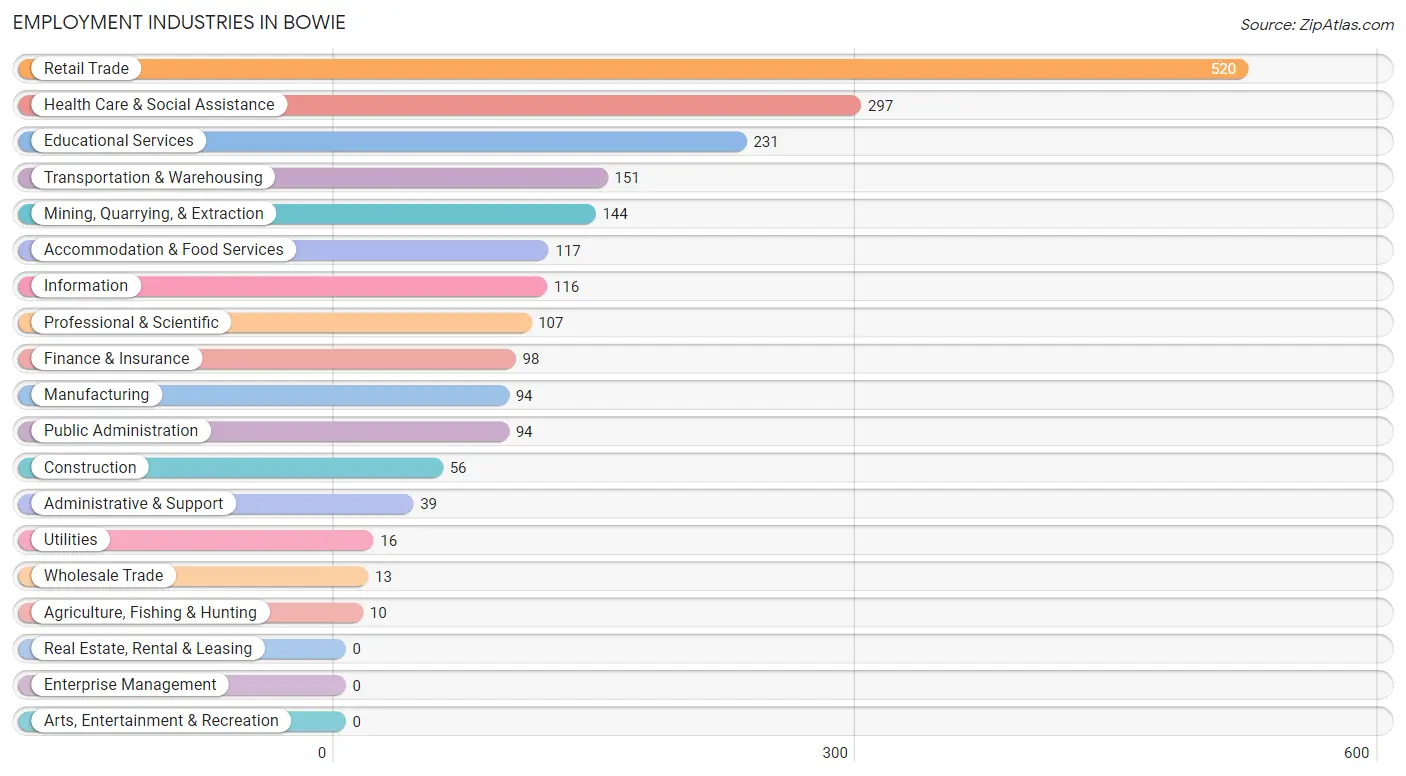
Employment Industries in Bowie
The major employment industries in Bowie include Retail Trade (520 | 23.8%), Health Care & Social Assistance (297 | 13.6%), Educational Services (231 | 10.6%), Transportation & Warehousing (151 | 6.9%), and Mining, Quarrying, & Extraction (144 | 6.6%).
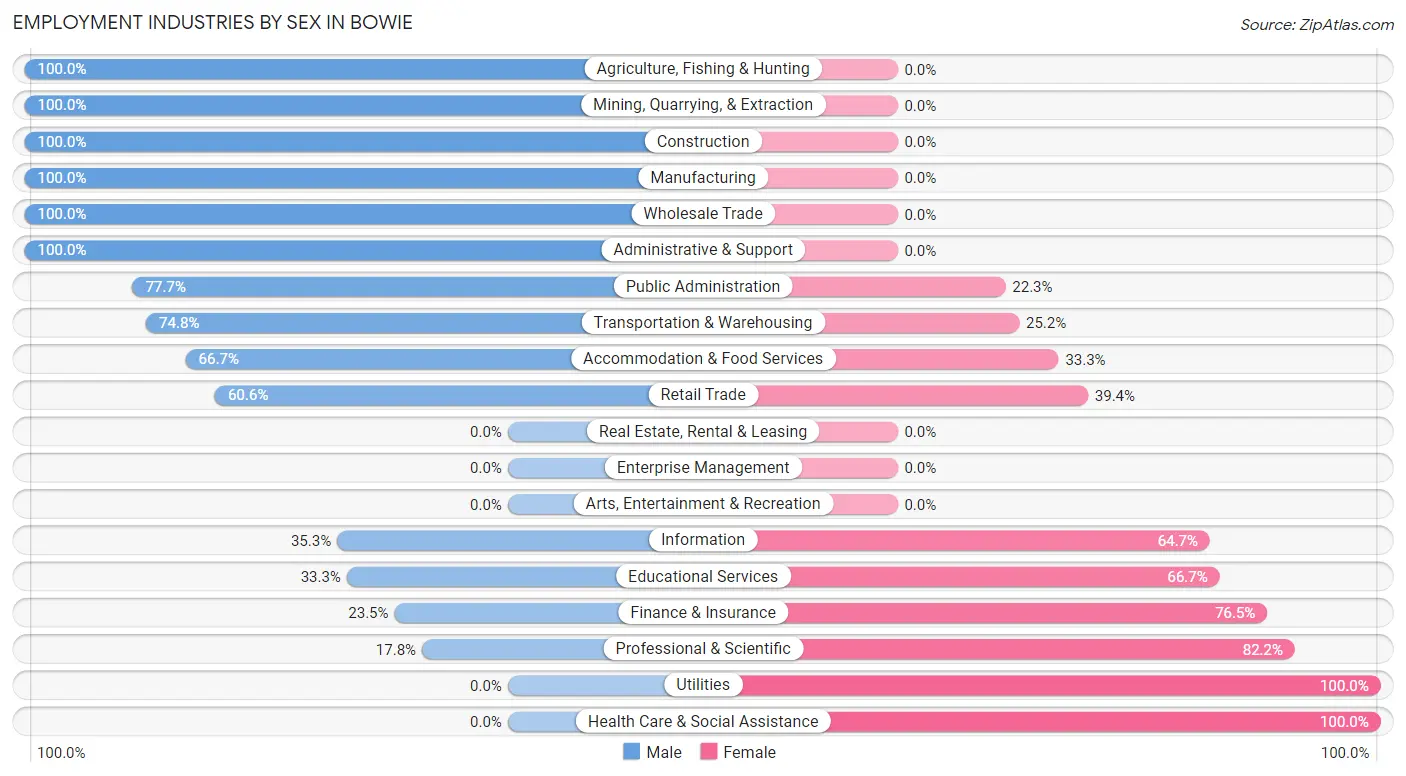
Employment Industries by Sex in Bowie
The Bowie industries that see more men than women are Agriculture, Fishing & Hunting (100.0%), Mining, Quarrying, & Extraction (100.0%), and Construction (100.0%), whereas the industries that tend to have a higher number of women are Utilities (100.0%), Health Care & Social Assistance (100.0%), and Professional & Scientific (82.2%).
| Industry | Male | Female |
| Agriculture, Fishing & Hunting | 10 (100.0%) | 0 (0.0%) |
| Mining, Quarrying, & Extraction | 144 (100.0%) | 0 (0.0%) |
| Construction | 56 (100.0%) | 0 (0.0%) |
| Manufacturing | 94 (100.0%) | 0 (0.0%) |
| Wholesale Trade | 13 (100.0%) | 0 (0.0%) |
| Retail Trade | 315 (60.6%) | 205 (39.4%) |
| Transportation & Warehousing | 113 (74.8%) | 38 (25.2%) |
| Utilities | 0 (0.0%) | 16 (100.0%) |
| Information | 41 (35.3%) | 75 (64.7%) |
| Finance & Insurance | 23 (23.5%) | 75 (76.5%) |
| Real Estate, Rental & Leasing | 0 (0.0%) | 0 (0.0%) |
| Professional & Scientific | 19 (17.8%) | 88 (82.2%) |
| Enterprise Management | 0 (0.0%) | 0 (0.0%) |
| Administrative & Support | 39 (100.0%) | 0 (0.0%) |
| Educational Services | 77 (33.3%) | 154 (66.7%) |
| Health Care & Social Assistance | 0 (0.0%) | 297 (100.0%) |
| Arts, Entertainment & Recreation | 0 (0.0%) | 0 (0.0%) |
| Accommodation & Food Services | 78 (66.7%) | 39 (33.3%) |
| Public Administration | 73 (77.7%) | 21 (22.3%) |
| Total | 1,170 (53.6%) | 1,014 (46.4%) |
Education in Bowie
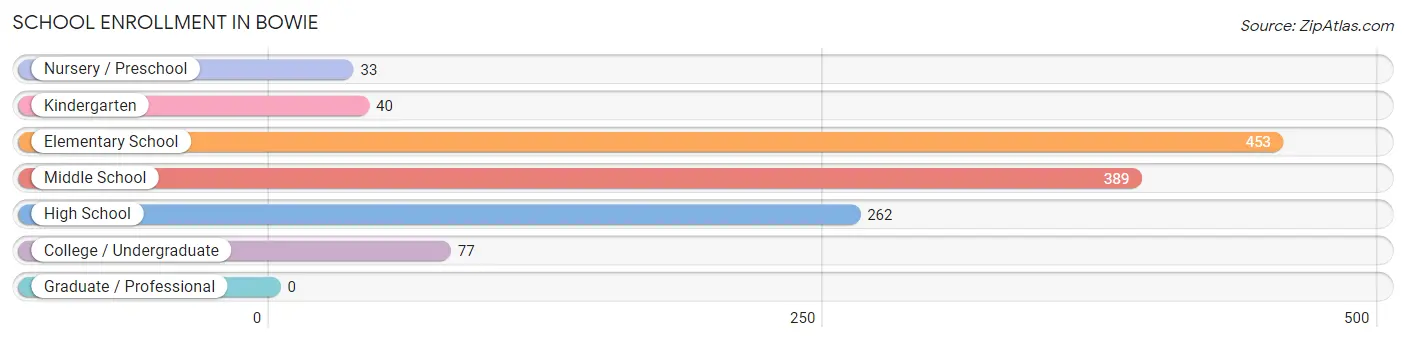
School Enrollment in Bowie
The most common levels of schooling among the 1,254 students in Bowie are elementary school (453 | 36.1%), middle school (389 | 31.0%), and high school (262 | 20.9%).
| School Level | # Students | % Students |
| Nursery / Preschool | 33 | 2.6% |
| Kindergarten | 40 | 3.2% |
| Elementary School | 453 | 36.1% |
| Middle School | 389 | 31.0% |
| High School | 262 | 20.9% |
| College / Undergraduate | 77 | 6.1% |
| Graduate / Professional | 0 | 0.0% |
| Total | 1,254 | 100.0% |
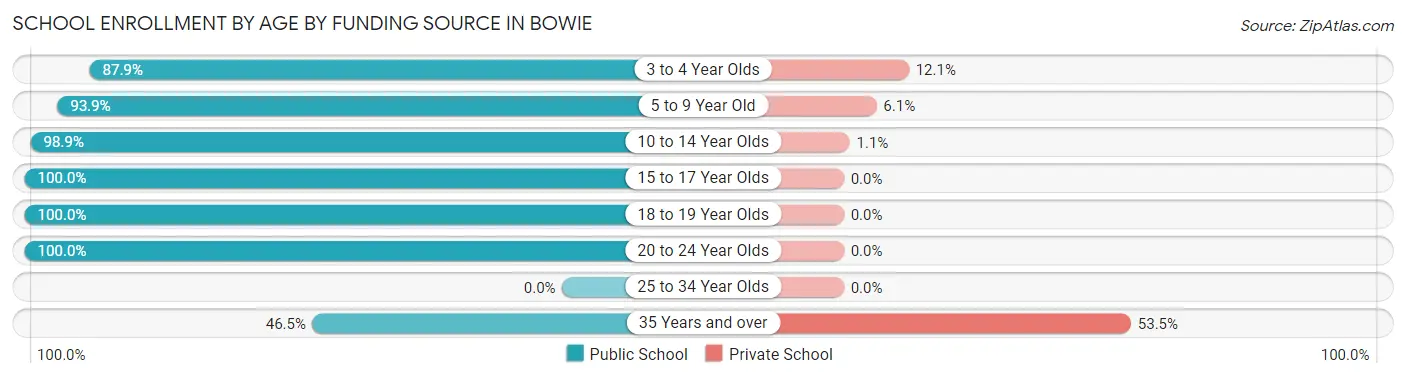
School Enrollment by Age by Funding Source in Bowie
Out of a total of 1,254 students who are enrolled in schools in Bowie, 76 (6.1%) attend a private institution, while the remaining 1,178 (93.9%) are enrolled in public schools. The age group of 35 years and over has the highest likelihood of being enrolled in private schools, with 46 (53.5% in the age bracket) enrolled. Conversely, the age group of 15 to 17 year olds has the lowest likelihood of being enrolled in a private school, with 195 (100.0% in the age bracket) attending a public institution.
| Age Bracket | Public School | Private School |
| 3 to 4 Year Olds | 29 (87.9%) | 4 (12.1%) |
| 5 to 9 Year Old | 323 (93.9%) | 21 (6.1%) |
| 10 to 14 Year Olds | 539 (98.9%) | 6 (1.1%) |
| 15 to 17 Year Olds | 195 (100.0%) | 0 (0.0%) |
| 18 to 19 Year Olds | 23 (100.0%) | 0 (0.0%) |
| 20 to 24 Year Olds | 28 (100.0%) | 0 (0.0%) |
| 25 to 34 Year Olds | 0 (0.0%) | 0 (0.0%) |
| 35 Years and over | 40 (46.5%) | 46 (53.5%) |
| Total | 1,178 (93.9%) | 76 (6.1%) |
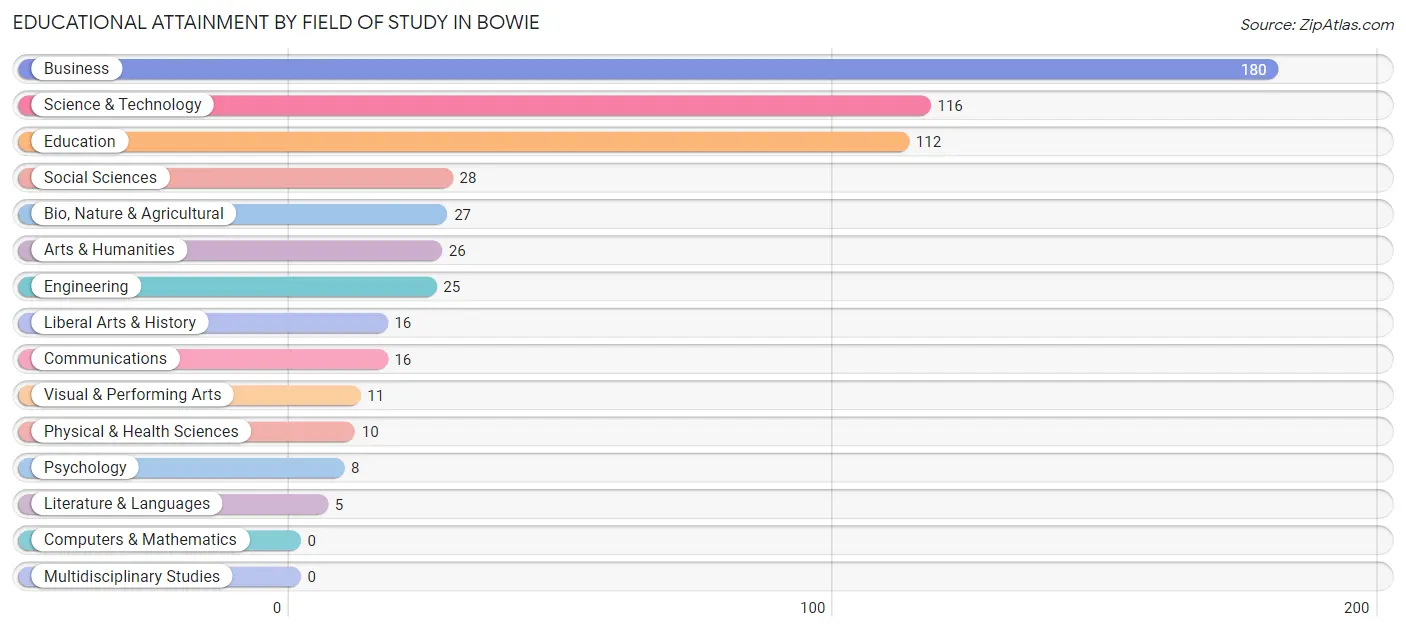
Educational Attainment by Field of Study in Bowie
Business (180 | 31.0%), science & technology (116 | 20.0%), education (112 | 19.3%), social sciences (28 | 4.8%), and bio, nature & agricultural (27 | 4.7%) are the most common fields of study among 580 individuals in Bowie who have obtained a bachelor's degree or higher.
| Field of Study | # Graduates | % Graduates |
| Computers & Mathematics | 0 | 0.0% |
| Bio, Nature & Agricultural | 27 | 4.7% |
| Physical & Health Sciences | 10 | 1.7% |
| Psychology | 8 | 1.4% |
| Social Sciences | 28 | 4.8% |
| Engineering | 25 | 4.3% |
| Multidisciplinary Studies | 0 | 0.0% |
| Science & Technology | 116 | 20.0% |
| Business | 180 | 31.0% |
| Education | 112 | 19.3% |
| Literature & Languages | 5 | 0.9% |
| Liberal Arts & History | 16 | 2.8% |
| Visual & Performing Arts | 11 | 1.9% |
| Communications | 16 | 2.8% |
| Arts & Humanities | 26 | 4.5% |
| Total | 580 | 100.0% |
Transportation & Commute in Bowie
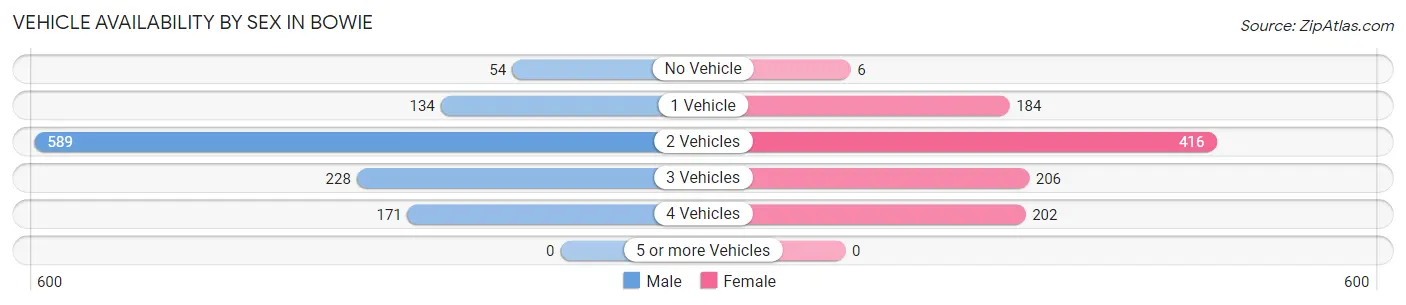
Vehicle Availability by Sex in Bowie
The most prevalent vehicle ownership categories in Bowie are males with 2 vehicles (589, accounting for 50.1%) and females with 2 vehicles (416, making up 58.1%).
| Vehicles Available | Male | Female |
| No Vehicle | 54 (4.6%) | 6 (0.6%) |
| 1 Vehicle | 134 (11.4%) | 184 (18.1%) |
| 2 Vehicles | 589 (50.1%) | 416 (41.0%) |
| 3 Vehicles | 228 (19.4%) | 206 (20.3%) |
| 4 Vehicles | 171 (14.5%) | 202 (19.9%) |
| 5 or more Vehicles | 0 (0.0%) | 0 (0.0%) |
| Total | 1,176 (100.0%) | 1,014 (100.0%) |
Commute Time in Bowie
The most frequently occuring commute durations in Bowie are 5 to 9 minutes (442 commuters, 21.6%), 60 to 89 minutes (394 commuters, 19.2%), and 45 to 59 minutes (362 commuters, 17.7%).
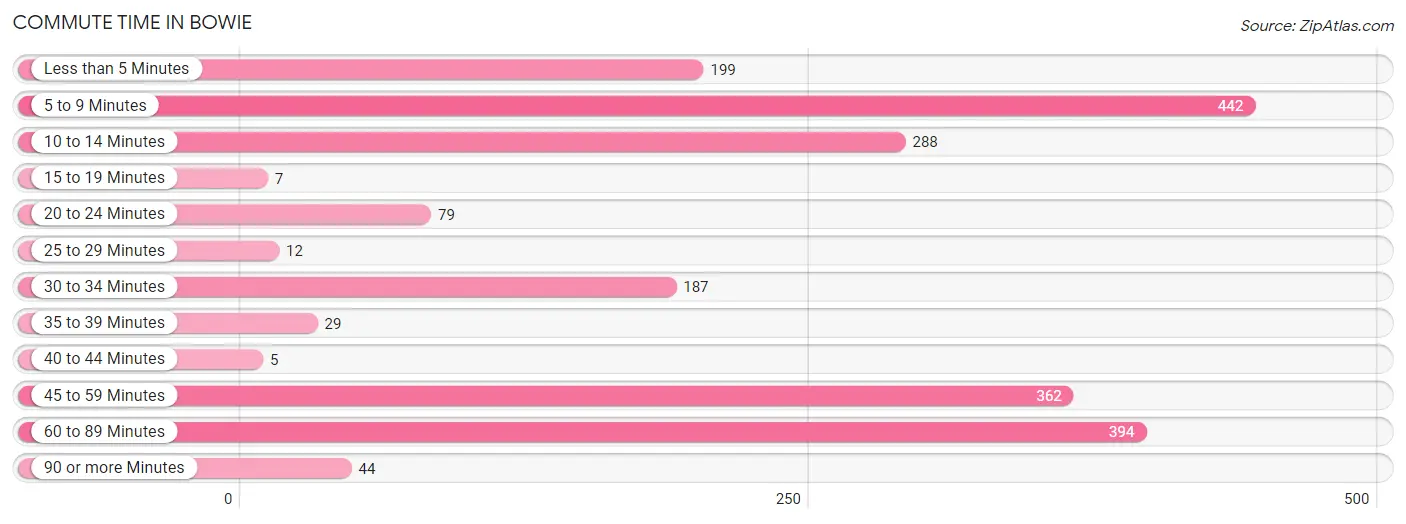
| Commute Time | # Commuters | % Commuters |
| Less than 5 Minutes | 199 | 9.7% |
| 5 to 9 Minutes | 442 | 21.6% |
| 10 to 14 Minutes | 288 | 14.1% |
| 15 to 19 Minutes | 7 | 0.3% |
| 20 to 24 Minutes | 79 | 3.9% |
| 25 to 29 Minutes | 12 | 0.6% |
| 30 to 34 Minutes | 187 | 9.1% |
| 35 to 39 Minutes | 29 | 1.4% |
| 40 to 44 Minutes | 5 | 0.2% |
| 45 to 59 Minutes | 362 | 17.7% |
| 60 to 89 Minutes | 394 | 19.2% |
| 90 or more Minutes | 44 | 2.1% |
Commute Time by Sex in Bowie
The most common commute times in Bowie are 60 to 89 minutes (236 commuters, 20.4%) for males and 5 to 9 minutes (267 commuters, 30.0%) for females.
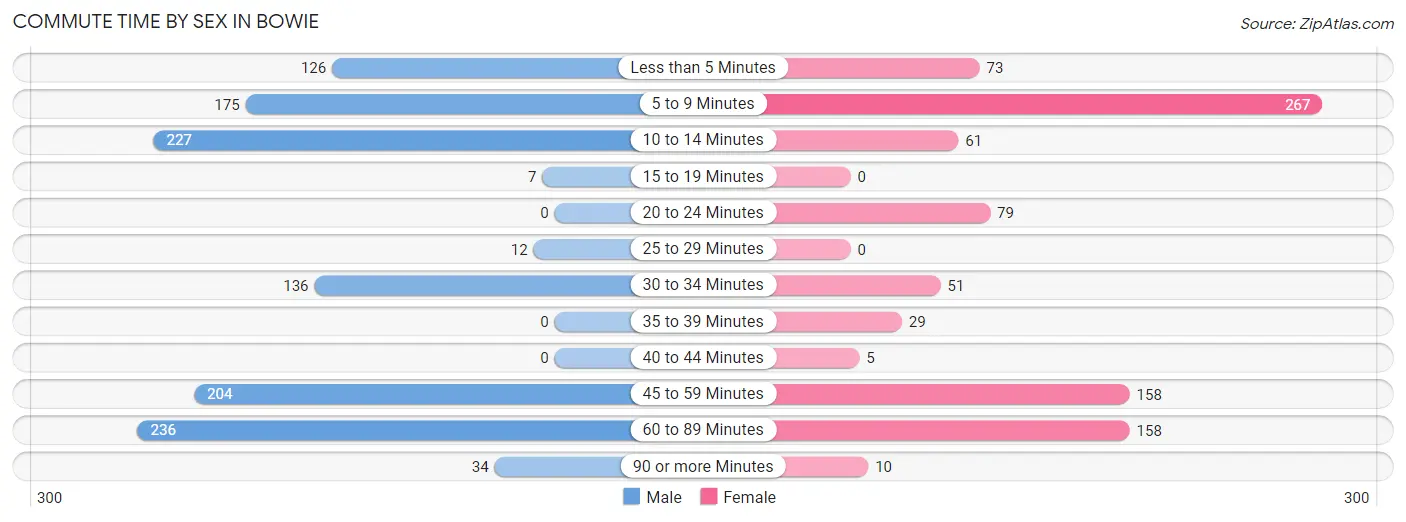
| Commute Time | Male | Female |
| Less than 5 Minutes | 126 (10.9%) | 73 (8.2%) |
| 5 to 9 Minutes | 175 (15.1%) | 267 (30.0%) |
| 10 to 14 Minutes | 227 (19.6%) | 61 (6.9%) |
| 15 to 19 Minutes | 7 (0.6%) | 0 (0.0%) |
| 20 to 24 Minutes | 0 (0.0%) | 79 (8.9%) |
| 25 to 29 Minutes | 12 (1.0%) | 0 (0.0%) |
| 30 to 34 Minutes | 136 (11.7%) | 51 (5.7%) |
| 35 to 39 Minutes | 0 (0.0%) | 29 (3.3%) |
| 40 to 44 Minutes | 0 (0.0%) | 5 (0.6%) |
| 45 to 59 Minutes | 204 (17.6%) | 158 (17.7%) |
| 60 to 89 Minutes | 236 (20.4%) | 158 (17.7%) |
| 90 or more Minutes | 34 (2.9%) | 10 (1.1%) |
Time of Departure to Work by Sex in Bowie
The most frequent times of departure to work in Bowie are 5:30 AM to 5:59 AM (365, 31.6%) for males and 5:30 AM to 5:59 AM (213, 23.9%) for females.
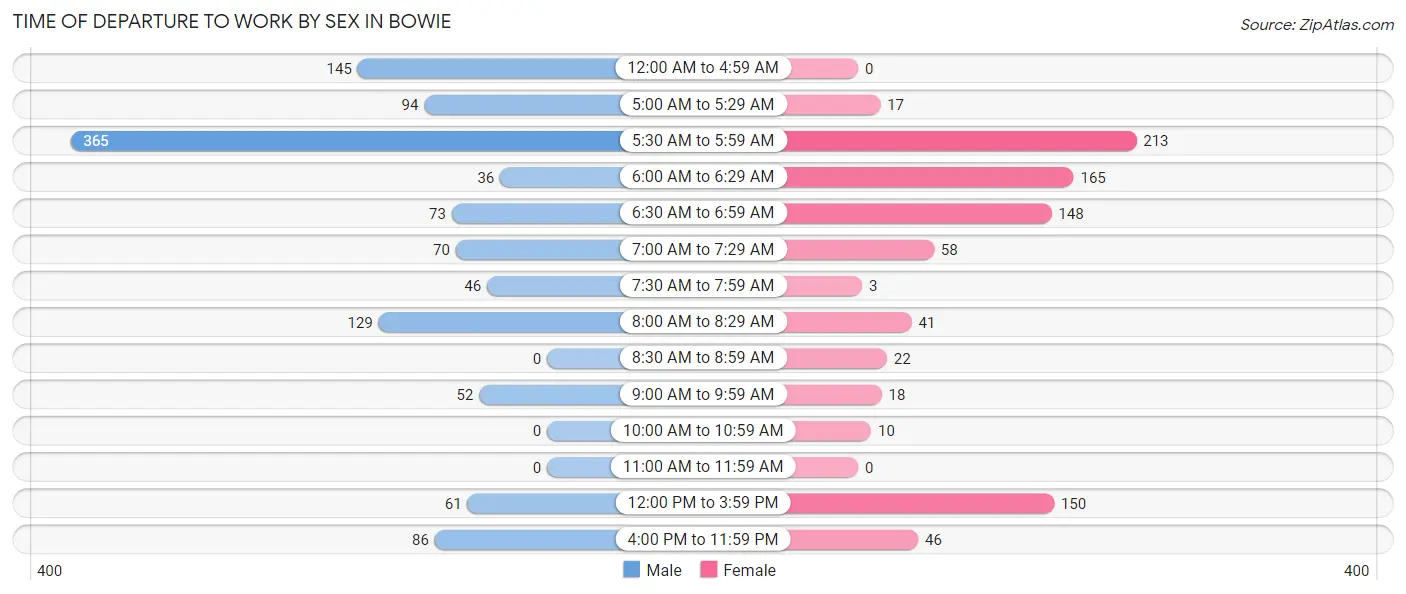
| Time of Departure | Male | Female |
| 12:00 AM to 4:59 AM | 145 (12.5%) | 0 (0.0%) |
| 5:00 AM to 5:29 AM | 94 (8.1%) | 17 (1.9%) |
| 5:30 AM to 5:59 AM | 365 (31.6%) | 213 (23.9%) |
| 6:00 AM to 6:29 AM | 36 (3.1%) | 165 (18.5%) |
| 6:30 AM to 6:59 AM | 73 (6.3%) | 148 (16.6%) |
| 7:00 AM to 7:29 AM | 70 (6.0%) | 58 (6.5%) |
| 7:30 AM to 7:59 AM | 46 (4.0%) | 3 (0.3%) |
| 8:00 AM to 8:29 AM | 129 (11.2%) | 41 (4.6%) |
| 8:30 AM to 8:59 AM | 0 (0.0%) | 22 (2.5%) |
| 9:00 AM to 9:59 AM | 52 (4.5%) | 18 (2.0%) |
| 10:00 AM to 10:59 AM | 0 (0.0%) | 10 (1.1%) |
| 11:00 AM to 11:59 AM | 0 (0.0%) | 0 (0.0%) |
| 12:00 PM to 3:59 PM | 61 (5.3%) | 150 (16.8%) |
| 4:00 PM to 11:59 PM | 86 (7.4%) | 46 (5.2%) |
| Total | 1,157 (100.0%) | 891 (100.0%) |
Housing Occupancy in Bowie
Occupancy by Ownership in Bowie
Of the total 2,048 dwellings in Bowie, owner-occupied units account for 1,419 (69.3%), while renter-occupied units make up 629 (30.7%).
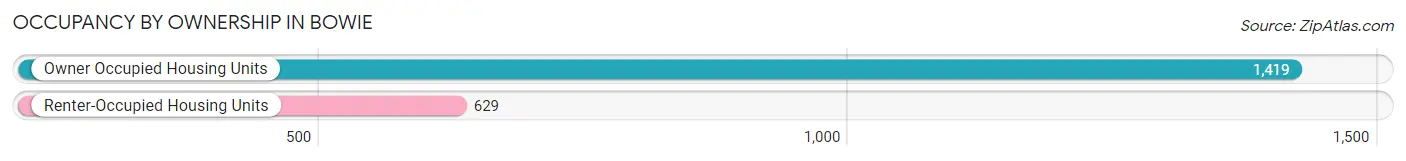
| Occupancy | # Housing Units | % Housing Units |
| Owner Occupied Housing Units | 1,419 | 69.3% |
| Renter-Occupied Housing Units | 629 | 30.7% |
| Total Occupied Housing Units | 2,048 | 100.0% |
Occupancy by Household Size in Bowie
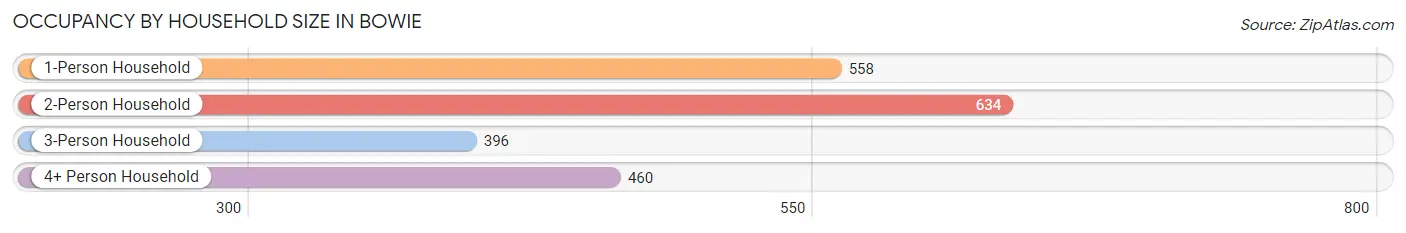
| Household Size | # Housing Units | % Housing Units |
| 1-Person Household | 558 | 27.3% |
| 2-Person Household | 634 | 31.0% |
| 3-Person Household | 396 | 19.3% |
| 4+ Person Household | 460 | 22.5% |
| Total Housing Units | 2,048 | 100.0% |
Occupancy by Ownership by Household Size in Bowie
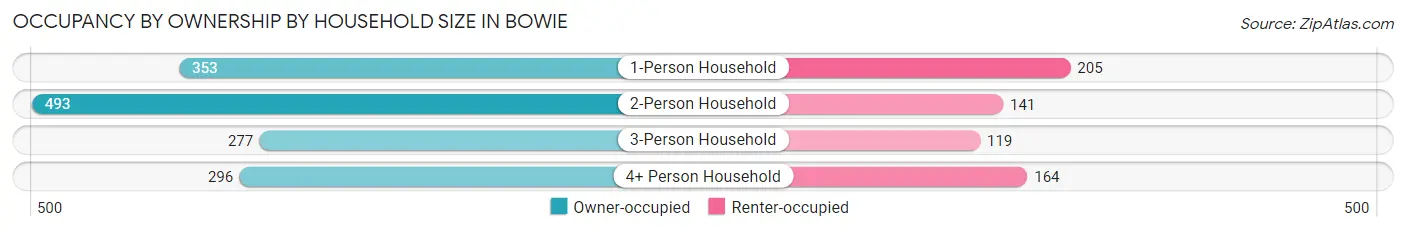
| Household Size | Owner-occupied | Renter-occupied |
| 1-Person Household | 353 (63.3%) | 205 (36.7%) |
| 2-Person Household | 493 (77.8%) | 141 (22.2%) |
| 3-Person Household | 277 (70.0%) | 119 (30.0%) |
| 4+ Person Household | 296 (64.3%) | 164 (35.6%) |
| Total Housing Units | 1,419 (69.3%) | 629 (30.7%) |
Occupancy by Educational Attainment in Bowie
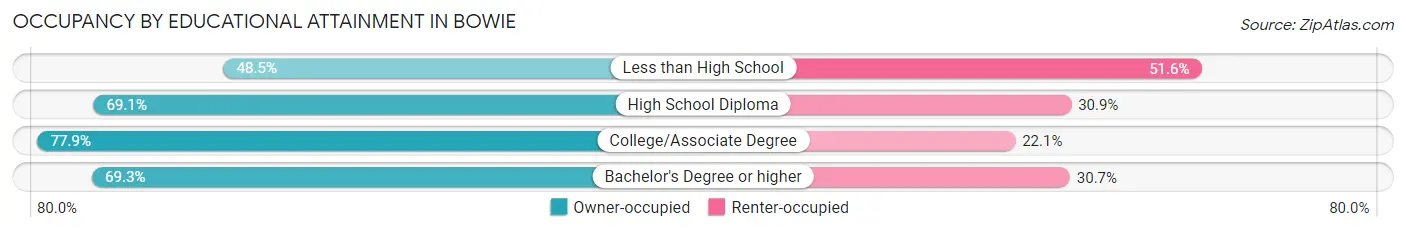
| Household Size | Owner-occupied | Renter-occupied |
| Less than High School | 94 (48.4%) | 100 (51.5%) |
| High School Diploma | 719 (69.1%) | 322 (30.9%) |
| College/Associate Degree | 385 (77.9%) | 109 (22.1%) |
| Bachelor's Degree or higher | 221 (69.3%) | 98 (30.7%) |
Occupancy by Age of Householder in Bowie
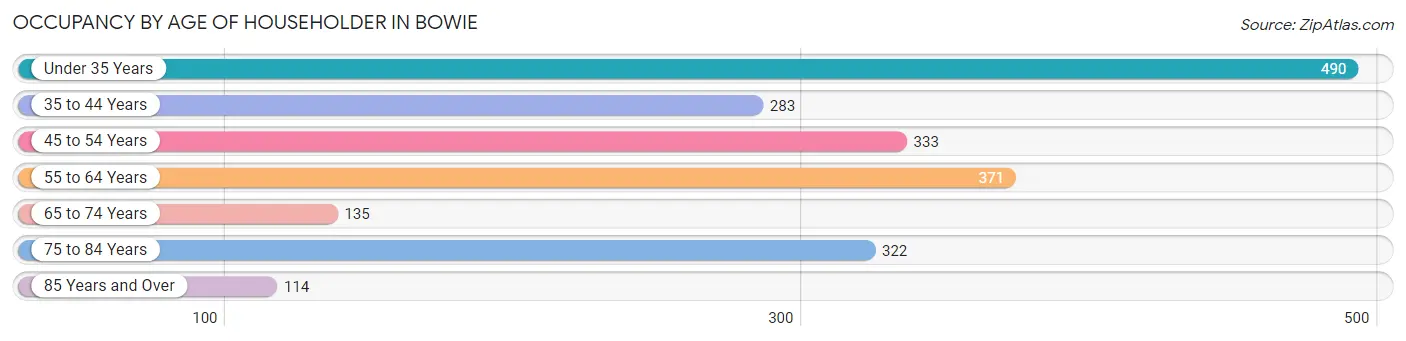
| Age Bracket | # Households | % Households |
| Under 35 Years | 490 | 23.9% |
| 35 to 44 Years | 283 | 13.8% |
| 45 to 54 Years | 333 | 16.3% |
| 55 to 64 Years | 371 | 18.1% |
| 65 to 74 Years | 135 | 6.6% |
| 75 to 84 Years | 322 | 15.7% |
| 85 Years and Over | 114 | 5.6% |
| Total | 2,048 | 100.0% |
Housing Finances in Bowie
Median Income by Occupancy in Bowie
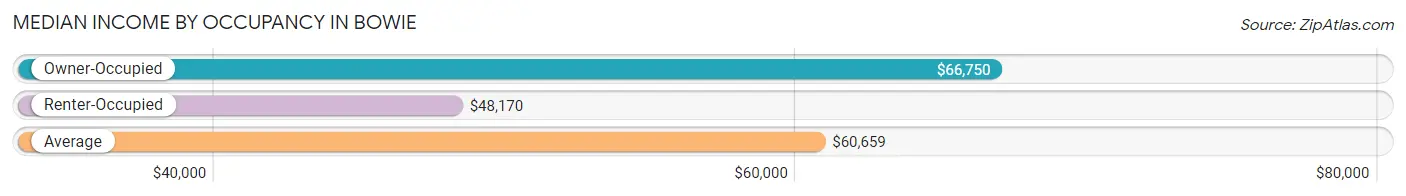
| Occupancy Type | # Households | Median Income |
| Owner-Occupied | 1,419 (69.3%) | $66,750 |
| Renter-Occupied | 629 (30.7%) | $48,170 |
| Average | 2,048 (100.0%) | $60,659 |
Occupancy by Householder Income Bracket in Bowie
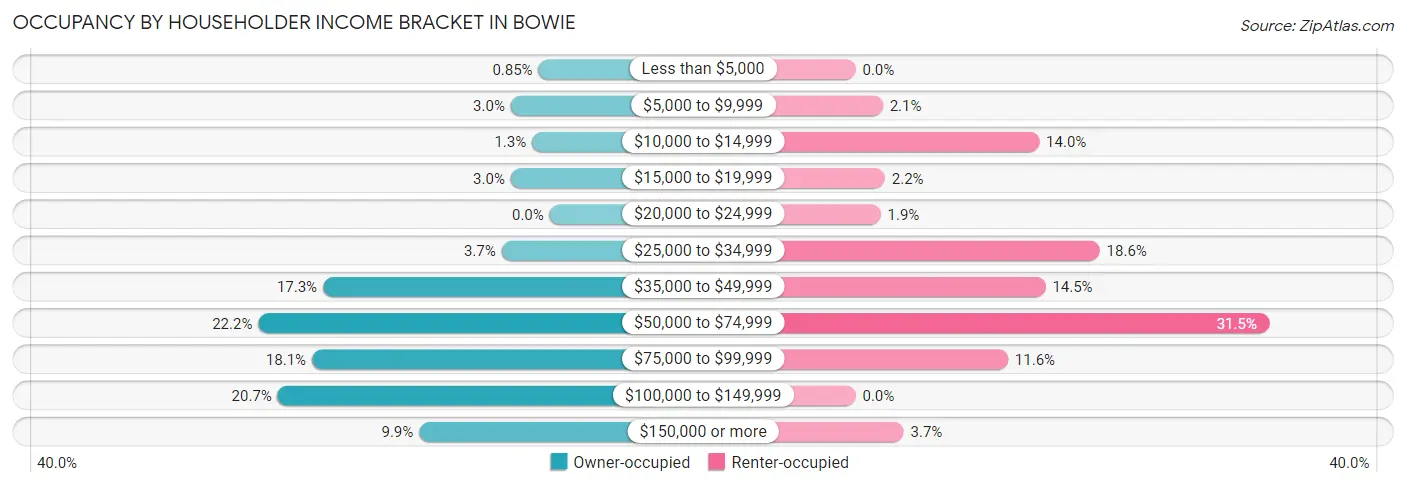
| Income Bracket | Owner-occupied | Renter-occupied |
| Less than $5,000 | 12 (0.9%) | 0 (0.0%) |
| $5,000 to $9,999 | 42 (3.0%) | 13 (2.1%) |
| $10,000 to $14,999 | 19 (1.3%) | 88 (14.0%) |
| $15,000 to $19,999 | 42 (3.0%) | 14 (2.2%) |
| $20,000 to $24,999 | 0 (0.0%) | 12 (1.9%) |
| $25,000 to $34,999 | 52 (3.7%) | 117 (18.6%) |
| $35,000 to $49,999 | 245 (17.3%) | 91 (14.5%) |
| $50,000 to $74,999 | 315 (22.2%) | 198 (31.5%) |
| $75,000 to $99,999 | 257 (18.1%) | 73 (11.6%) |
| $100,000 to $149,999 | 294 (20.7%) | 0 (0.0%) |
| $150,000 or more | 141 (9.9%) | 23 (3.7%) |
| Total | 1,419 (100.0%) | 629 (100.0%) |
Monthly Housing Cost Tiers in Bowie
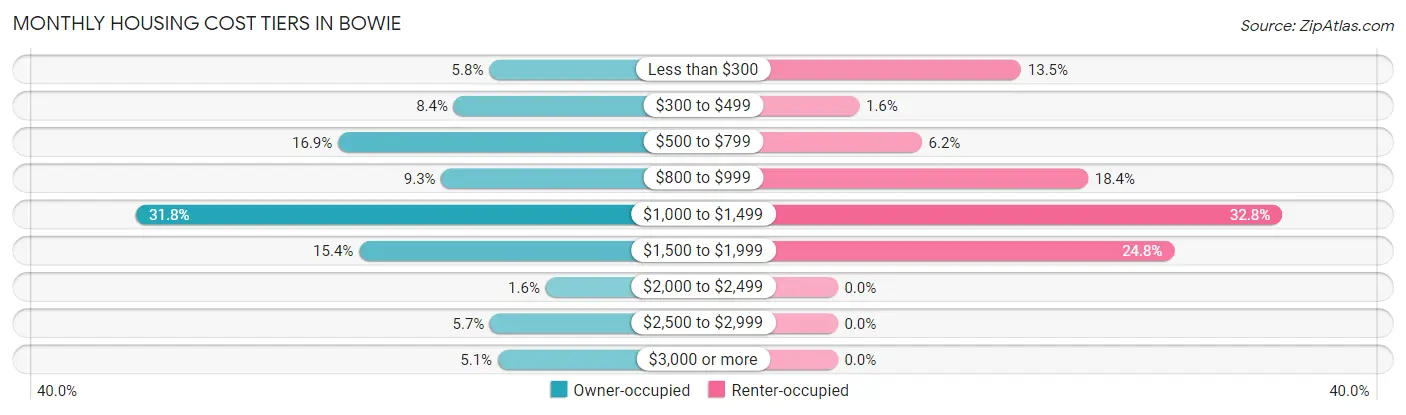
| Monthly Cost | Owner-occupied | Renter-occupied |
| Less than $300 | 82 (5.8%) | 85 (13.5%) |
| $300 to $499 | 119 (8.4%) | 10 (1.6%) |
| $500 to $799 | 240 (16.9%) | 39 (6.2%) |
| $800 to $999 | 132 (9.3%) | 116 (18.4%) |
| $1,000 to $1,499 | 451 (31.8%) | 206 (32.8%) |
| $1,500 to $1,999 | 218 (15.4%) | 156 (24.8%) |
| $2,000 to $2,499 | 23 (1.6%) | 0 (0.0%) |
| $2,500 to $2,999 | 81 (5.7%) | 0 (0.0%) |
| $3,000 or more | 73 (5.1%) | 0 (0.0%) |
| Total | 1,419 (100.0%) | 629 (100.0%) |
Physical Housing Characteristics in Bowie
Housing Structures in Bowie
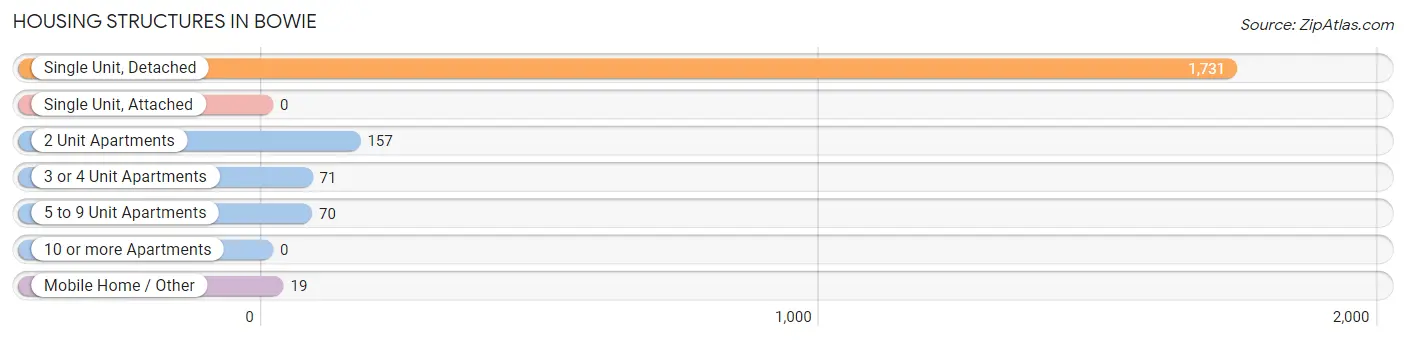
| Structure Type | # Housing Units | % Housing Units |
| Single Unit, Detached | 1,731 | 84.5% |
| Single Unit, Attached | 0 | 0.0% |
| 2 Unit Apartments | 157 | 7.7% |
| 3 or 4 Unit Apartments | 71 | 3.5% |
| 5 to 9 Unit Apartments | 70 | 3.4% |
| 10 or more Apartments | 0 | 0.0% |
| Mobile Home / Other | 19 | 0.9% |
| Total | 2,048 | 100.0% |
Housing Structures by Occupancy in Bowie
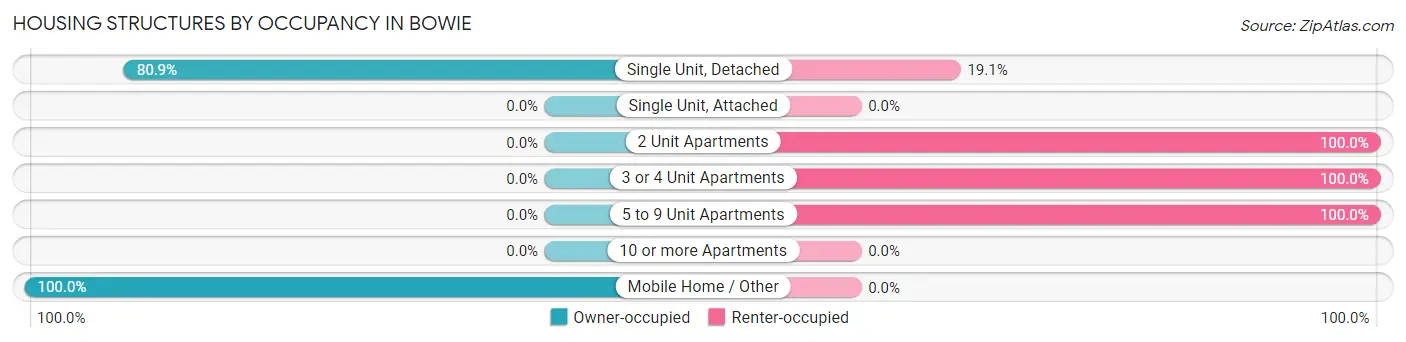
| Structure Type | Owner-occupied | Renter-occupied |
| Single Unit, Detached | 1,400 (80.9%) | 331 (19.1%) |
| Single Unit, Attached | 0 (0.0%) | 0 (0.0%) |
| 2 Unit Apartments | 0 (0.0%) | 157 (100.0%) |
| 3 or 4 Unit Apartments | 0 (0.0%) | 71 (100.0%) |
| 5 to 9 Unit Apartments | 0 (0.0%) | 70 (100.0%) |
| 10 or more Apartments | 0 (0.0%) | 0 (0.0%) |
| Mobile Home / Other | 19 (100.0%) | 0 (0.0%) |
| Total | 1,419 (69.3%) | 629 (30.7%) |
Housing Structures by Number of Rooms in Bowie
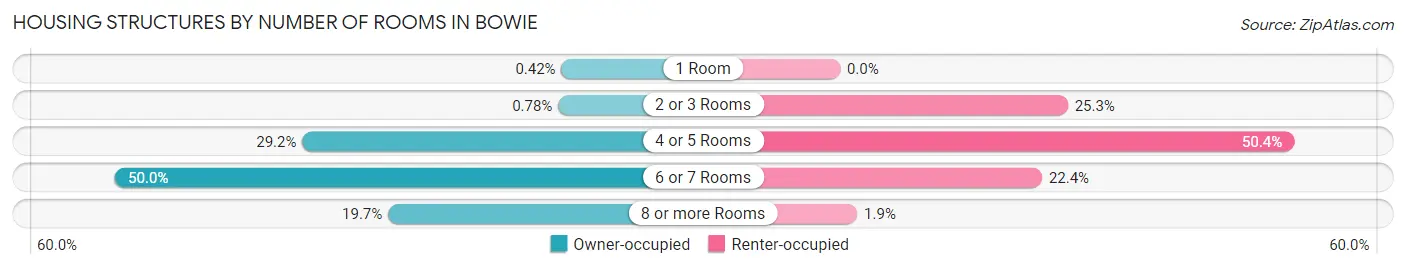
| Number of Rooms | Owner-occupied | Renter-occupied |
| 1 Room | 6 (0.4%) | 0 (0.0%) |
| 2 or 3 Rooms | 11 (0.8%) | 159 (25.3%) |
| 4 or 5 Rooms | 414 (29.2%) | 317 (50.4%) |
| 6 or 7 Rooms | 709 (50.0%) | 141 (22.4%) |
| 8 or more Rooms | 279 (19.7%) | 12 (1.9%) |
| Total | 1,419 (100.0%) | 629 (100.0%) |
Housing Structure by Heating Type in Bowie
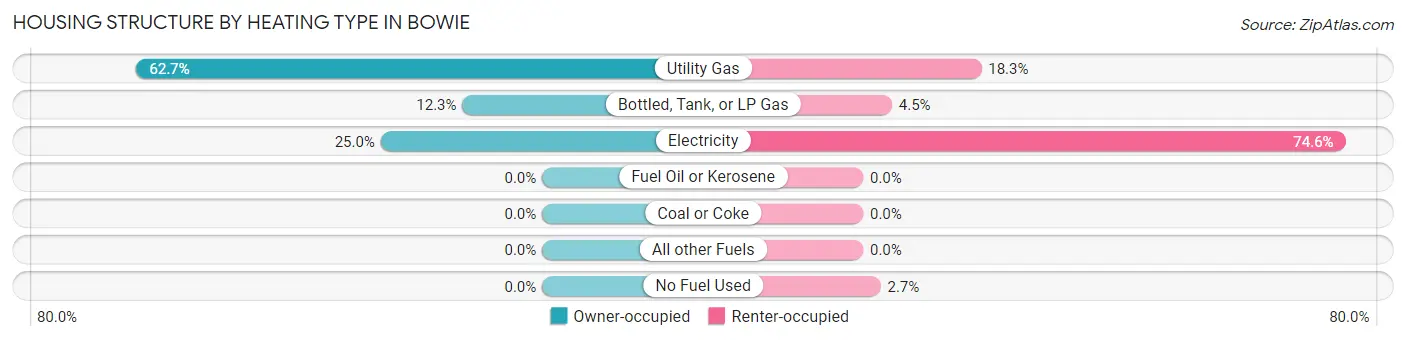
| Heating Type | Owner-occupied | Renter-occupied |
| Utility Gas | 890 (62.7%) | 115 (18.3%) |
| Bottled, Tank, or LP Gas | 175 (12.3%) | 28 (4.4%) |
| Electricity | 354 (24.9%) | 469 (74.6%) |
| Fuel Oil or Kerosene | 0 (0.0%) | 0 (0.0%) |
| Coal or Coke | 0 (0.0%) | 0 (0.0%) |
| All other Fuels | 0 (0.0%) | 0 (0.0%) |
| No Fuel Used | 0 (0.0%) | 17 (2.7%) |
| Total | 1,419 (100.0%) | 629 (100.0%) |
Household Vehicle Usage in Bowie
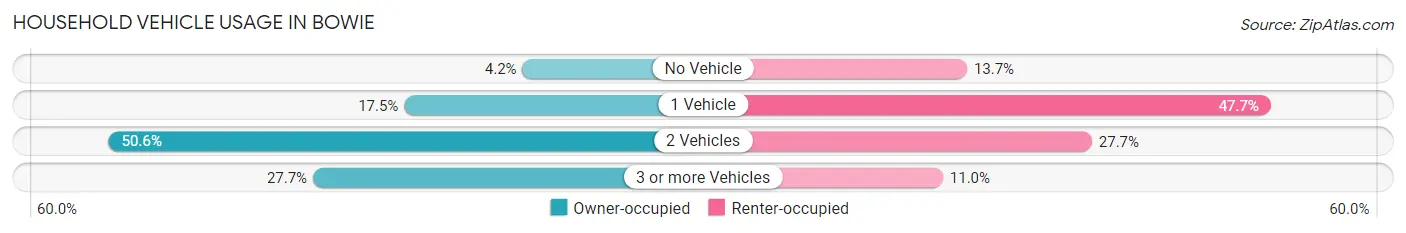
| Vehicles per Household | Owner-occupied | Renter-occupied |
| No Vehicle | 60 (4.2%) | 86 (13.7%) |
| 1 Vehicle | 248 (17.5%) | 300 (47.7%) |
| 2 Vehicles | 718 (50.6%) | 174 (27.7%) |
| 3 or more Vehicles | 393 (27.7%) | 69 (11.0%) |
| Total | 1,419 (100.0%) | 629 (100.0%) |
Real Estate & Mortgages in Bowie
Real Estate and Mortgage Overview in Bowie
| Characteristic | Without Mortgage | With Mortgage |
| Housing Units | 633 | 786 |
| Median Property Value | $157,400 | $199,100 |
| Median Household Income | $45,234 | $49 |
| Monthly Housing Costs | $570 | $73 |
| Real Estate Taxes | $1,779 | $5 |
Property Value by Mortgage Status in Bowie
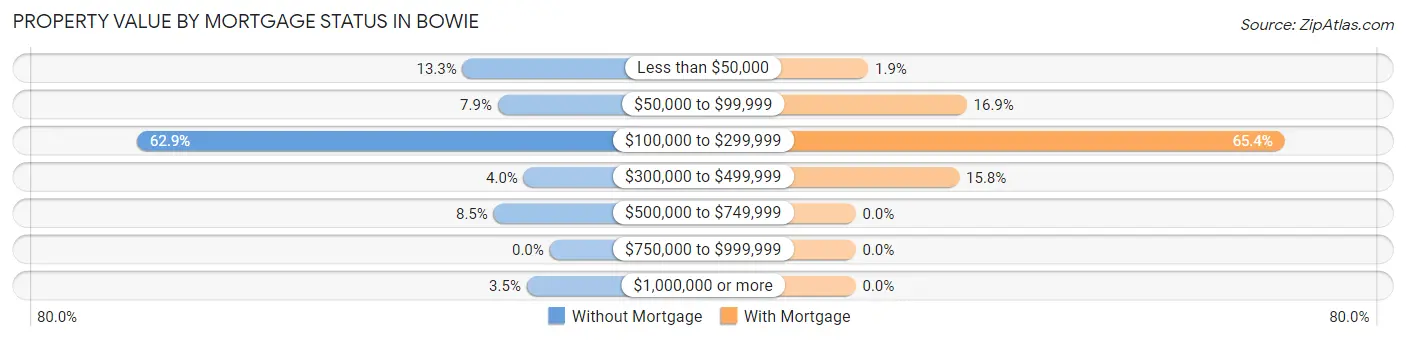
| Property Value | Without Mortgage | With Mortgage |
| Less than $50,000 | 84 (13.3%) | 15 (1.9%) |
| $50,000 to $99,999 | 50 (7.9%) | 133 (16.9%) |
| $100,000 to $299,999 | 398 (62.9%) | 514 (65.4%) |
| $300,000 to $499,999 | 25 (4.0%) | 124 (15.8%) |
| $500,000 to $749,999 | 54 (8.5%) | 0 (0.0%) |
| $750,000 to $999,999 | 0 (0.0%) | 0 (0.0%) |
| $1,000,000 or more | 22 (3.5%) | 0 (0.0%) |
| Total | 633 (100.0%) | 786 (100.0%) |
Household Income by Mortgage Status in Bowie
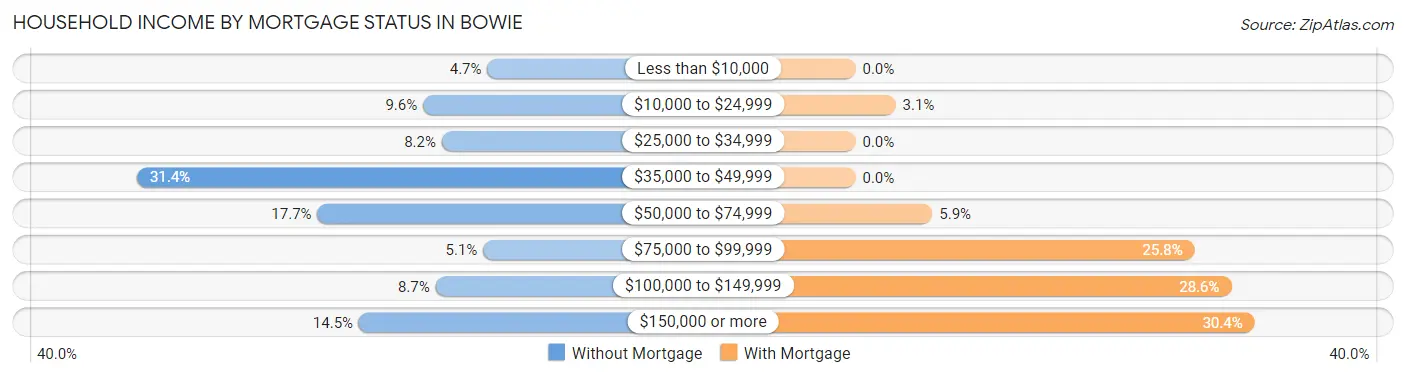
| Household Income | Without Mortgage | With Mortgage |
| Less than $10,000 | 30 (4.7%) | 0 (0.0%) |
| $10,000 to $24,999 | 61 (9.6%) | 24 (3.0%) |
| $25,000 to $34,999 | 52 (8.2%) | 0 (0.0%) |
| $35,000 to $49,999 | 199 (31.4%) | 0 (0.0%) |
| $50,000 to $74,999 | 112 (17.7%) | 46 (5.9%) |
| $75,000 to $99,999 | 32 (5.1%) | 203 (25.8%) |
| $100,000 to $149,999 | 55 (8.7%) | 225 (28.6%) |
| $150,000 or more | 92 (14.5%) | 239 (30.4%) |
| Total | 633 (100.0%) | 786 (100.0%) |
Property Value to Household Income Ratio in Bowie
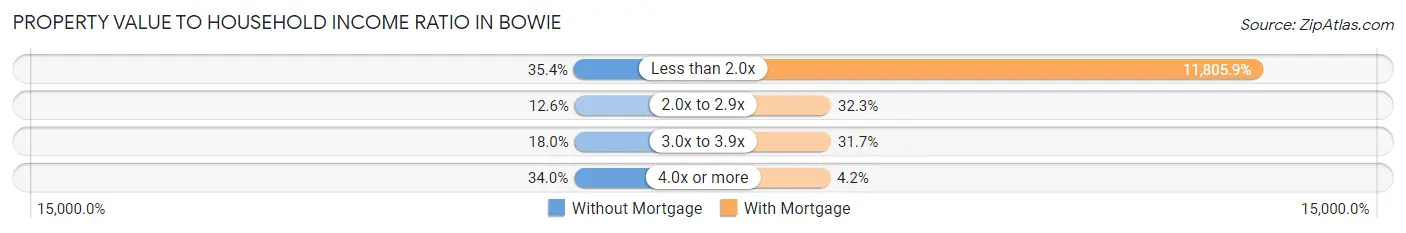
| Value-to-Income Ratio | Without Mortgage | With Mortgage |
| Less than 2.0x | 224 (35.4%) | 92,794 (11,805.8%) |
| 2.0x to 2.9x | 80 (12.6%) | 254 (32.3%) |
| 3.0x to 3.9x | 114 (18.0%) | 249 (31.7%) |
| 4.0x or more | 215 (34.0%) | 33 (4.2%) |
| Total | 633 (100.0%) | 786 (100.0%) |
Real Estate Taxes by Mortgage Status in Bowie
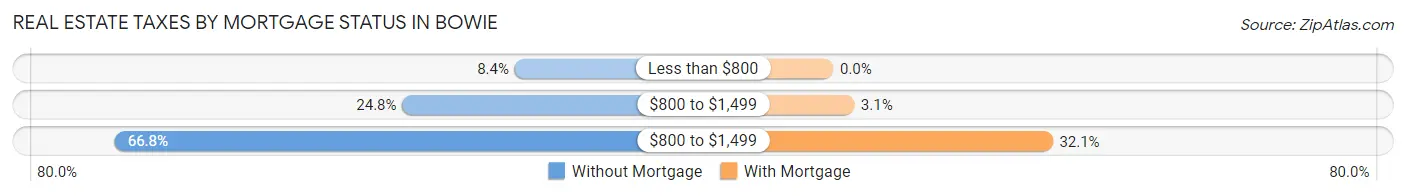
| Property Taxes | Without Mortgage | With Mortgage |
| Less than $800 | 53 (8.4%) | 0 (0.0%) |
| $800 to $1,499 | 157 (24.8%) | 24 (3.0%) |
| $800 to $1,499 | 423 (66.8%) | 252 (32.1%) |
| Total | 633 (100.0%) | 786 (100.0%) |
Health & Disability in Bowie
Health Insurance Coverage by Age in Bowie
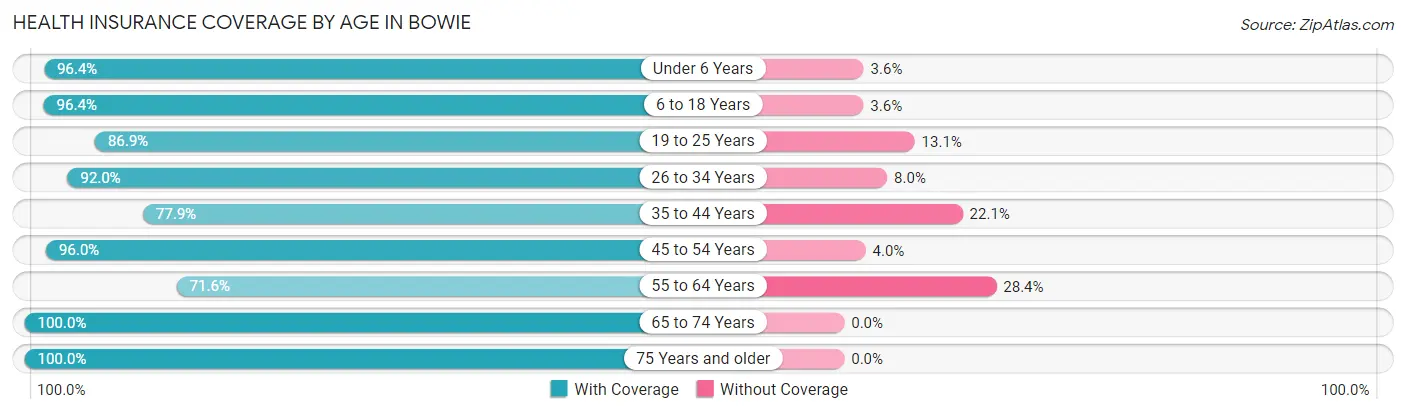
| Age Bracket | With Coverage | Without Coverage |
| Under 6 Years | 374 (96.4%) | 14 (3.6%) |
| 6 to 18 Years | 1,055 (96.4%) | 39 (3.6%) |
| 19 to 25 Years | 417 (86.9%) | 63 (13.1%) |
| 26 to 34 Years | 656 (92.0%) | 57 (8.0%) |
| 35 to 44 Years | 445 (77.9%) | 126 (22.1%) |
| 45 to 54 Years | 579 (96.0%) | 24 (4.0%) |
| 55 to 64 Years | 475 (71.6%) | 188 (28.4%) |
| 65 to 74 Years | 207 (100.0%) | 0 (0.0%) |
| 75 Years and older | 586 (100.0%) | 0 (0.0%) |
| Total | 4,794 (90.4%) | 511 (9.6%) |
Health Insurance Coverage by Citizenship Status in Bowie
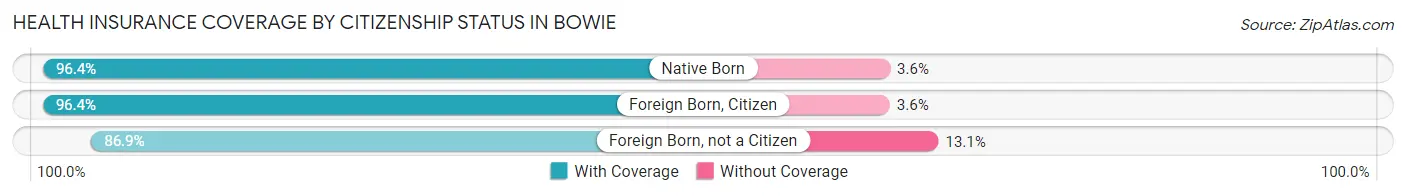
| Citizenship Status | With Coverage | Without Coverage |
| Native Born | 374 (96.4%) | 14 (3.6%) |
| Foreign Born, Citizen | 1,055 (96.4%) | 39 (3.6%) |
| Foreign Born, not a Citizen | 417 (86.9%) | 63 (13.1%) |
Health Insurance Coverage by Household Income in Bowie
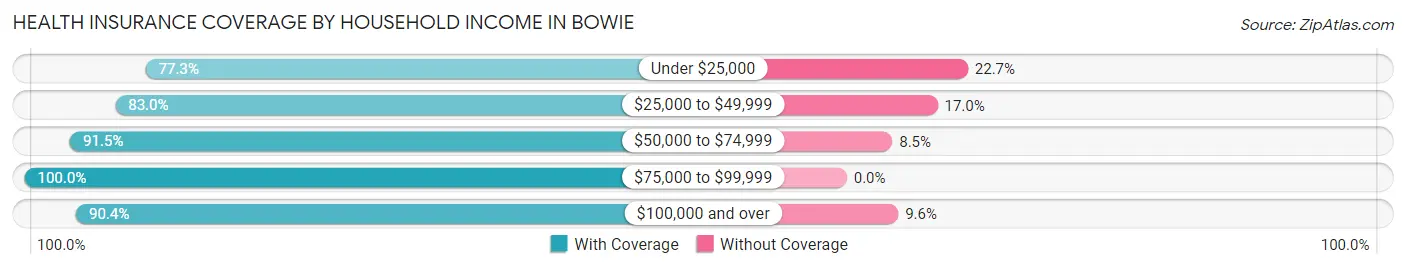
| Household Income | With Coverage | Without Coverage |
| Under $25,000 | 283 (77.3%) | 83 (22.7%) |
| $25,000 to $49,999 | 674 (83.0%) | 138 (17.0%) |
| $50,000 to $74,999 | 1,460 (91.5%) | 136 (8.5%) |
| $75,000 to $99,999 | 933 (100.0%) | 0 (0.0%) |
| $100,000 and over | 1,444 (90.4%) | 154 (9.6%) |
Public vs Private Health Insurance Coverage by Age in Bowie
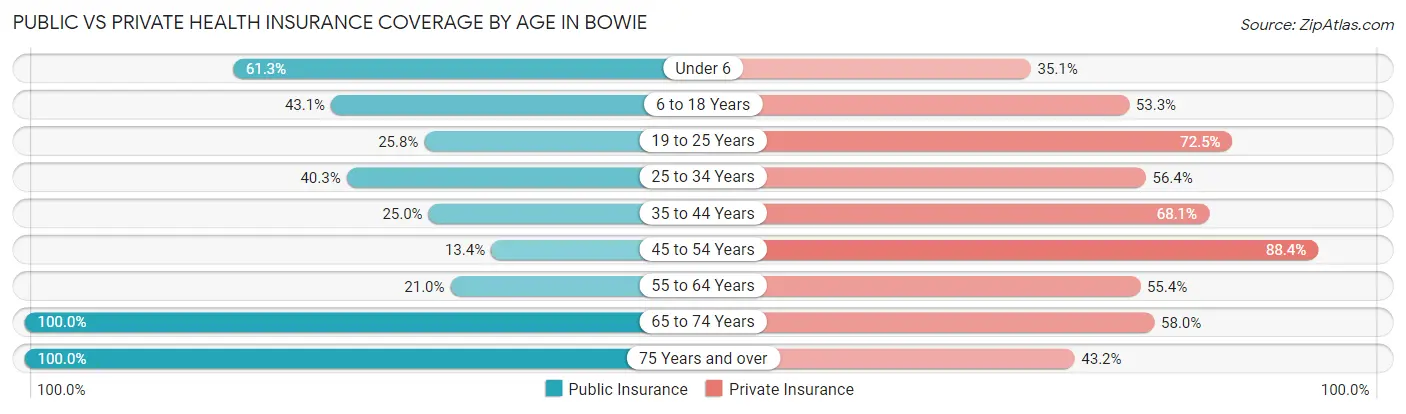
| Age Bracket | Public Insurance | Private Insurance |
| Under 6 | 238 (61.3%) | 136 (35.0%) |
| 6 to 18 Years | 472 (43.1%) | 583 (53.3%) |
| 19 to 25 Years | 124 (25.8%) | 348 (72.5%) |
| 25 to 34 Years | 287 (40.3%) | 402 (56.4%) |
| 35 to 44 Years | 143 (25.0%) | 389 (68.1%) |
| 45 to 54 Years | 81 (13.4%) | 533 (88.4%) |
| 55 to 64 Years | 139 (21.0%) | 367 (55.3%) |
| 65 to 74 Years | 207 (100.0%) | 120 (58.0%) |
| 75 Years and over | 586 (100.0%) | 253 (43.2%) |
| Total | 2,277 (42.9%) | 3,131 (59.0%) |
Disability Status by Sex by Age in Bowie
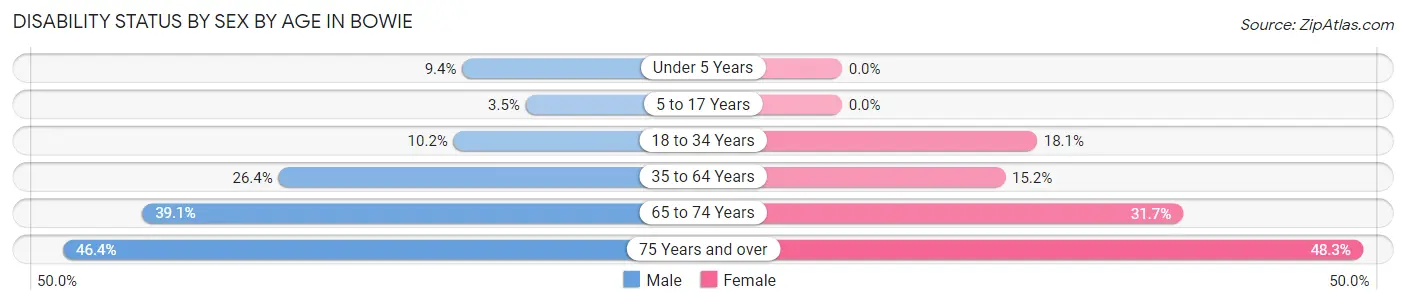
| Age Bracket | Male | Female |
| Under 5 Years | 18 (9.4%) | 0 (0.0%) |
| 5 to 17 Years | 19 (3.5%) | 0 (0.0%) |
| 18 to 34 Years | 63 (10.2%) | 107 (18.1%) |
| 35 to 64 Years | 222 (26.4%) | 151 (15.1%) |
| 65 to 74 Years | 34 (39.1%) | 38 (31.7%) |
| 75 Years and over | 104 (46.4%) | 175 (48.3%) |
Disability Class by Sex by Age in Bowie
Disability Class: Hearing Difficulty
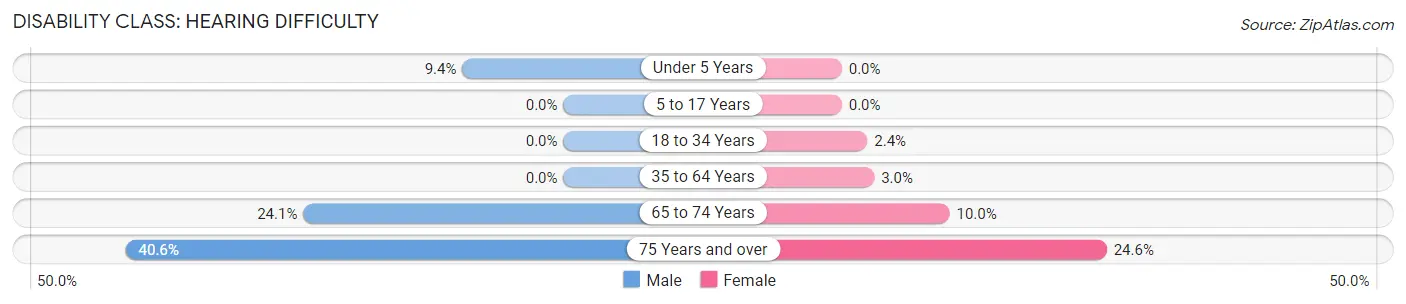
| Age Bracket | Male | Female |
| Under 5 Years | 18 (9.4%) | 0 (0.0%) |
| 5 to 17 Years | 0 (0.0%) | 0 (0.0%) |
| 18 to 34 Years | 0 (0.0%) | 14 (2.4%) |
| 35 to 64 Years | 0 (0.0%) | 30 (3.0%) |
| 65 to 74 Years | 21 (24.1%) | 12 (10.0%) |
| 75 Years and over | 91 (40.6%) | 89 (24.6%) |
Disability Class: Vision Difficulty
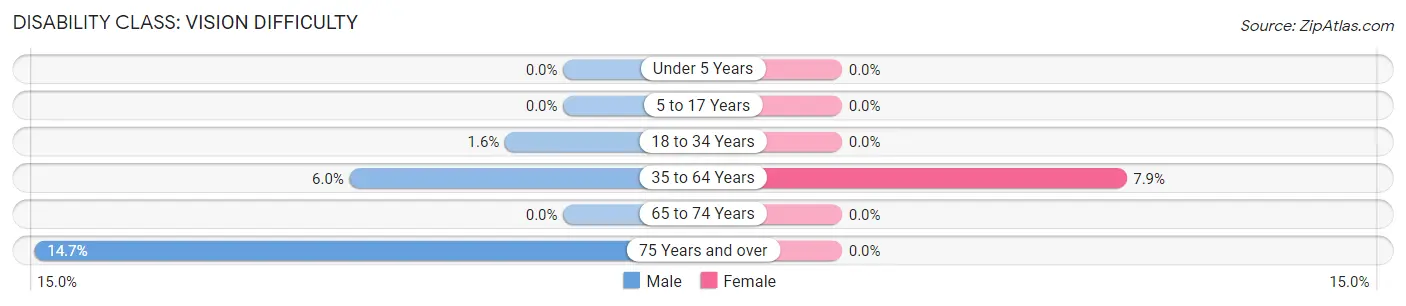
| Age Bracket | Male | Female |
| Under 5 Years | 0 (0.0%) | 0 (0.0%) |
| 5 to 17 Years | 0 (0.0%) | 0 (0.0%) |
| 18 to 34 Years | 10 (1.6%) | 0 (0.0%) |
| 35 to 64 Years | 50 (5.9%) | 79 (7.9%) |
| 65 to 74 Years | 0 (0.0%) | 0 (0.0%) |
| 75 Years and over | 33 (14.7%) | 0 (0.0%) |
Disability Class: Cognitive Difficulty
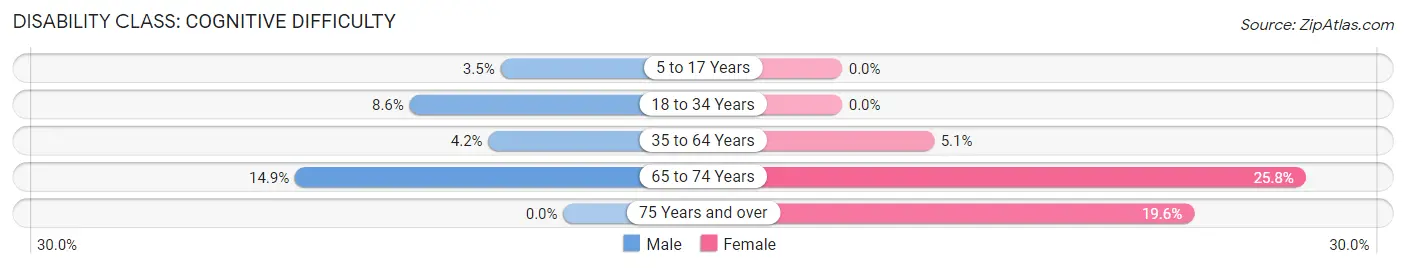
| Age Bracket | Male | Female |
| 5 to 17 Years | 19 (3.5%) | 0 (0.0%) |
| 18 to 34 Years | 53 (8.6%) | 0 (0.0%) |
| 35 to 64 Years | 35 (4.2%) | 51 (5.1%) |
| 65 to 74 Years | 13 (14.9%) | 31 (25.8%) |
| 75 Years and over | 0 (0.0%) | 71 (19.6%) |
Disability Class: Ambulatory Difficulty
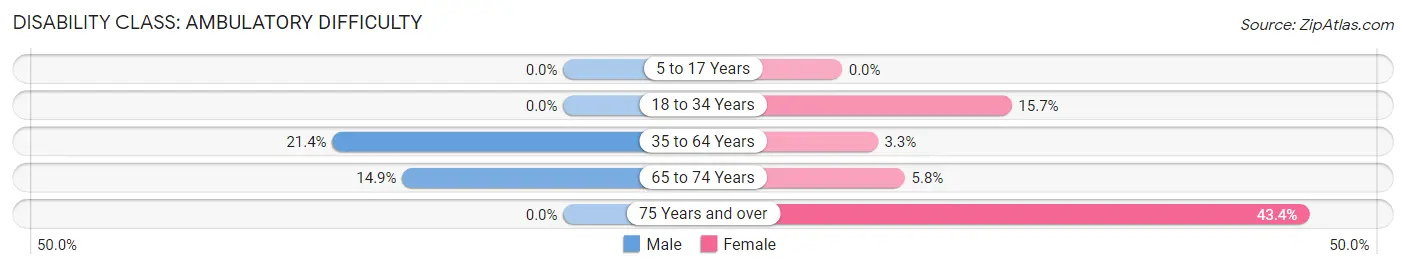
| Age Bracket | Male | Female |
| 5 to 17 Years | 0 (0.0%) | 0 (0.0%) |
| 18 to 34 Years | 0 (0.0%) | 93 (15.7%) |
| 35 to 64 Years | 180 (21.4%) | 33 (3.3%) |
| 65 to 74 Years | 13 (14.9%) | 7 (5.8%) |
| 75 Years and over | 0 (0.0%) | 157 (43.4%) |
Disability Class: Self-Care Difficulty
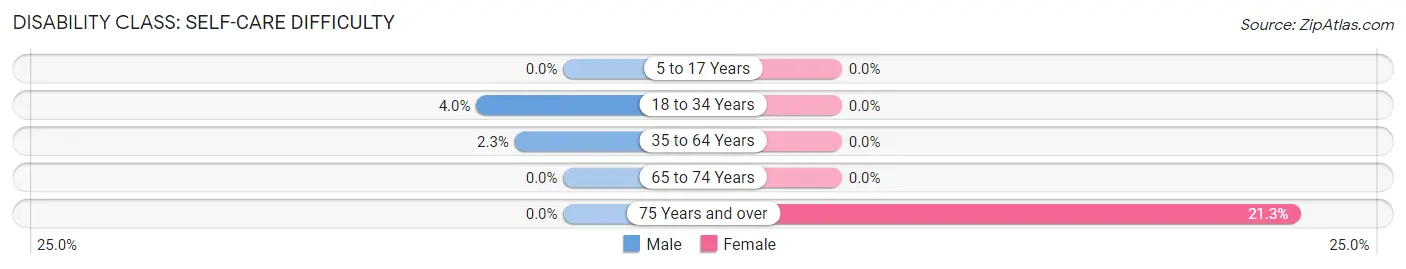
| Age Bracket | Male | Female |
| 5 to 17 Years | 0 (0.0%) | 0 (0.0%) |
| 18 to 34 Years | 25 (4.0%) | 0 (0.0%) |
| 35 to 64 Years | 19 (2.3%) | 0 (0.0%) |
| 65 to 74 Years | 0 (0.0%) | 0 (0.0%) |
| 75 Years and over | 0 (0.0%) | 77 (21.3%) |
Technology Access in Bowie
Computing Device Access in Bowie
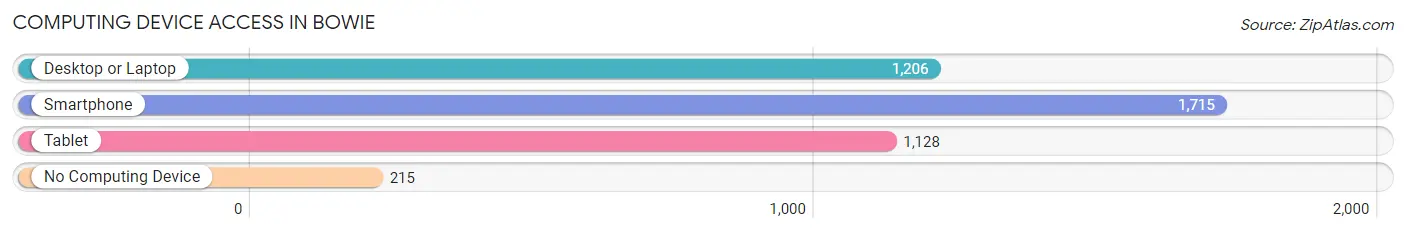
| Device Type | # Households | % Households |
| Desktop or Laptop | 1,206 | 58.9% |
| Smartphone | 1,715 | 83.7% |
| Tablet | 1,128 | 55.1% |
| No Computing Device | 215 | 10.5% |
| Total | 2,048 | 100.0% |
Internet Access in Bowie
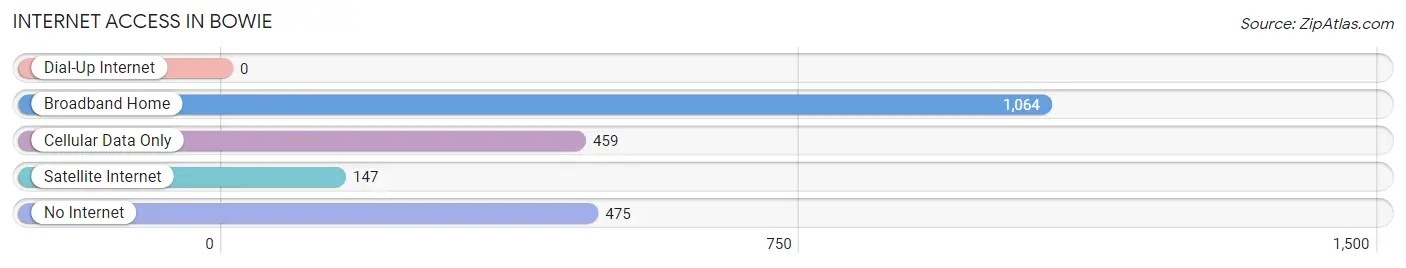
| Internet Type | # Households | % Households |
| Dial-Up Internet | 0 | 0.0% |
| Broadband Home | 1,064 | 51.9% |
| Cellular Data Only | 459 | 22.4% |
| Satellite Internet | 147 | 7.2% |
| No Internet | 475 | 23.2% |
| Total | 2,048 | 100.0% |
Bowie Summary
Bowie, Texas is a small town located in the northeast corner of Texas, in the county of Montague. It is situated on the banks of the Red River, and is the county seat of Montague County. The town was founded in 1878, and was named after James Bowie, a famous Texas Ranger and frontiersman.
Geography
Bowie is located in the northeast corner of Texas, in the county of Montague. It is situated on the banks of the Red River, and is the county seat of Montague County. The town is located at the intersection of U.S. Highway 81 and State Highway 59. The town is located in a rural area, and is surrounded by rolling hills and farmland. The climate in Bowie is semi-arid, with hot summers and mild winters.
Economy
The economy of Bowie is largely based on agriculture and ranching. The town is home to several large farms and ranches, and is a major producer of cotton, wheat, and other crops. The town is also home to several manufacturing companies, including a large paper mill and a plastics factory. The town is also home to several small businesses, including restaurants, retail stores, and service providers.
Demographics
As of the 2010 census, the population of Bowie was 5,218. The racial makeup of the town was 79.3% White, 15.2% African American, 0.5% Native American, 0.3% Asian, 0.1% Pacific Islander, and 4.6% from other races. The median household income in Bowie was $35,945, and the median family income was $41,944. The per capita income in Bowie was $17,845.
Conclusion
Bowie, Texas is a small town located in the northeast corner of Texas, in the county of Montague. It is situated on the banks of the Red River, and is the county seat of Montague County. The town was founded in 1878, and was named after James Bowie, a famous Texas Ranger and frontiersman. The economy of Bowie is largely based on agriculture and ranching, and the town is home to several large farms and ranches. The population of Bowie was 5,218 as of the 2010 census, and the median household income was $35,945. Bowie is a small town with a rich history and a strong agricultural economy.
Common Questions
What is Per Capita Income in Bowie?
Per Capita income in Bowie is $27,227.
What is the Median Family Income in Bowie?
Median Family Income in Bowie is $82,983.
What is the Median Household income in Bowie?
Median Household Income in Bowie is $60,659.
What is Income or Wage Gap in Bowie?
Income or Wage Gap in Bowie is 44.1%.
Women in Bowie earn 55.9 cents for every dollar earned by a man.
What is Inequality or Gini Index in Bowie?
Inequality or Gini Index in Bowie is 0.35.
What is the Total Population of Bowie?
Total Population of Bowie is 5,483.
What is the Total Male Population of Bowie?
Total Male Population of Bowie is 2,574.
What is the Total Female Population of Bowie?
Total Female Population of Bowie is 2,909.
What is the Ratio of Males per 100 Females in Bowie?
There are 88.48 Males per 100 Females in Bowie.
What is the Ratio of Females per 100 Males in Bowie?
There are 113.01 Females per 100 Males in Bowie.
What is the Median Population Age in Bowie?
Median Population Age in Bowie is 36.4 Years.
What is the Average Family Size in Bowie
Average Family Size in Bowie is 3.2 People.
What is the Average Household Size in Bowie
Average Household Size in Bowie is 2.6 People.
How Large is the Labor Force in Bowie?
There are 2,244 People in the Labor Forcein in Bowie.
What is the Percentage of People in the Labor Force in Bowie?
54.1% of People are in the Labor Force in Bowie.
What is the Unemployment Rate in Bowie?
Unemployment Rate in Bowie is 2.4%.