Borger, TX Map & Demographics
Borger Map
Borger Overview
$29,278
PER CAPITA INCOME
$70,405
AVG FAMILY INCOME
$54,159
AVG HOUSEHOLD INCOME
45.0%
WAGE / INCOME GAP [ % ]
55.0¢/ $1
WAGE / INCOME GAP [ $ ]
$9,128
FAMILY INCOME DEFICIT
0.44
INEQUALITY / GINI INDEX
12,505
TOTAL POPULATION
6,422
MALE POPULATION
6,083
FEMALE POPULATION
105.57
MALES / 100 FEMALES
94.72
FEMALES / 100 MALES
36.2
MEDIAN AGE
3.9
AVG FAMILY SIZE
3.0
AVG HOUSEHOLD SIZE
6,068
LABOR FORCE [ PEOPLE ]
61.8%
PERCENT IN LABOR FORCE
3.1%
UNEMPLOYMENT RATE
Borger Zip Codes
Borger Area Codes
Income in Borger
Income Overview in Borger
Per Capita Income in Borger is $29,278, while median incomes of families and households are $70,405 and $54,159 respectively.
| Characteristic | Number | Measure |
| Per Capita Income | 12,505 | $29,278 |
| Median Family Income | 2,624 | $70,405 |
| Mean Family Income | 2,624 | $93,790 |
| Median Household Income | 4,068 | $54,159 |
| Mean Household Income | 4,068 | $77,259 |
| Income Deficit | 2,624 | $9,128 |
| Wage / Income Gap (%) | 12,505 | 45.01% |
| Wage / Income Gap ($) | 12,505 | 54.99¢ per $1 |
| Gini / Inequality Index | 12,505 | 0.44 |
Earnings by Sex in Borger
Average Earnings in Borger are $34,115, $42,987 for men and $23,638 for women, a difference of 45.0%.
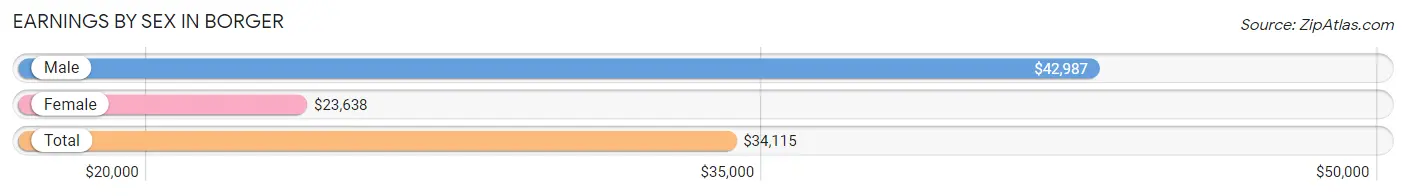
| Sex | Number | Average Earnings |
| Male | 3,621 (56.5%) | $42,987 |
| Female | 2,787 (43.5%) | $23,638 |
| Total | 6,408 (100.0%) | $34,115 |
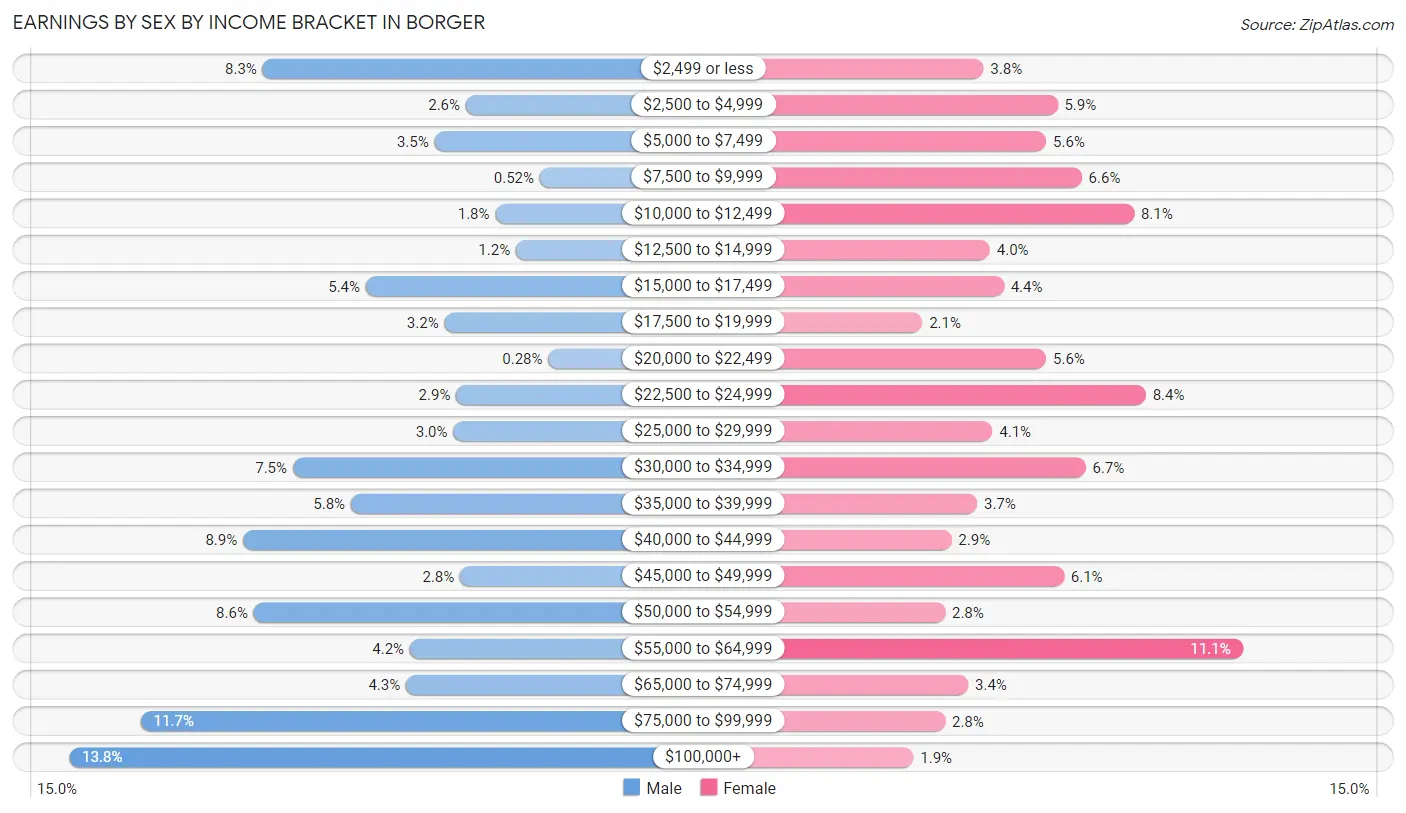
Earnings by Sex by Income Bracket in Borger
The most common earnings brackets in Borger are $100,000+ for men (498 | 13.8%) and $55,000 to $64,999 for women (310 | 11.1%).
| Income | Male | Female |
| $2,499 or less | 301 (8.3%) | 107 (3.8%) |
| $2,500 to $4,999 | 94 (2.6%) | 165 (5.9%) |
| $5,000 to $7,499 | 126 (3.5%) | 156 (5.6%) |
| $7,500 to $9,999 | 19 (0.5%) | 184 (6.6%) |
| $10,000 to $12,499 | 64 (1.8%) | 225 (8.1%) |
| $12,500 to $14,999 | 43 (1.2%) | 112 (4.0%) |
| $15,000 to $17,499 | 196 (5.4%) | 123 (4.4%) |
| $17,500 to $19,999 | 116 (3.2%) | 59 (2.1%) |
| $20,000 to $22,499 | 10 (0.3%) | 156 (5.6%) |
| $22,500 to $24,999 | 104 (2.9%) | 234 (8.4%) |
| $25,000 to $29,999 | 107 (2.9%) | 114 (4.1%) |
| $30,000 to $34,999 | 270 (7.5%) | 187 (6.7%) |
| $35,000 to $39,999 | 211 (5.8%) | 102 (3.7%) |
| $40,000 to $44,999 | 321 (8.9%) | 82 (2.9%) |
| $45,000 to $49,999 | 100 (2.8%) | 170 (6.1%) |
| $50,000 to $54,999 | 310 (8.6%) | 77 (2.8%) |
| $55,000 to $64,999 | 151 (4.2%) | 310 (11.1%) |
| $65,000 to $74,999 | 155 (4.3%) | 95 (3.4%) |
| $75,000 to $99,999 | 425 (11.7%) | 77 (2.8%) |
| $100,000+ | 498 (13.8%) | 52 (1.9%) |
| Total | 3,621 (100.0%) | 2,787 (100.0%) |
Earnings by Sex by Educational Attainment in Borger
Average earnings in Borger are $51,093 for men and $31,514 for women, a difference of 38.3%. Men with an educational attainment of bachelor's degree enjoy the highest average annual earnings of $84,942, while those with high school diploma education earn the least with $42,088. Women with an educational attainment of graduate degree earn the most with the average annual earnings of $63,153, while those with less than high school education have the smallest earnings of $17,457.
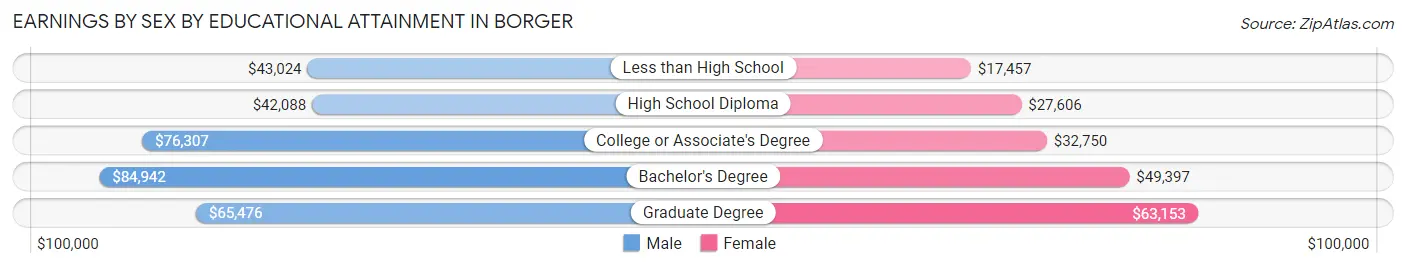
| Educational Attainment | Male Income | Female Income |
| Less than High School | $43,024 | $17,457 |
| High School Diploma | $42,088 | $27,606 |
| College or Associate's Degree | $76,307 | $32,750 |
| Bachelor's Degree | $84,942 | $49,397 |
| Graduate Degree | $65,476 | $63,153 |
| Total | $51,093 | $31,514 |
Family Income in Borger
Family Income Brackets in Borger
According to the Borger family income data, there are 556 families falling into the $50,000 to $74,999 income range, which is the most common income bracket and makes up 21.2% of all families. Conversely, the $10,000 to $14,999 income bracket is the least frequent group with only 31 families (1.2%) belonging to this category.
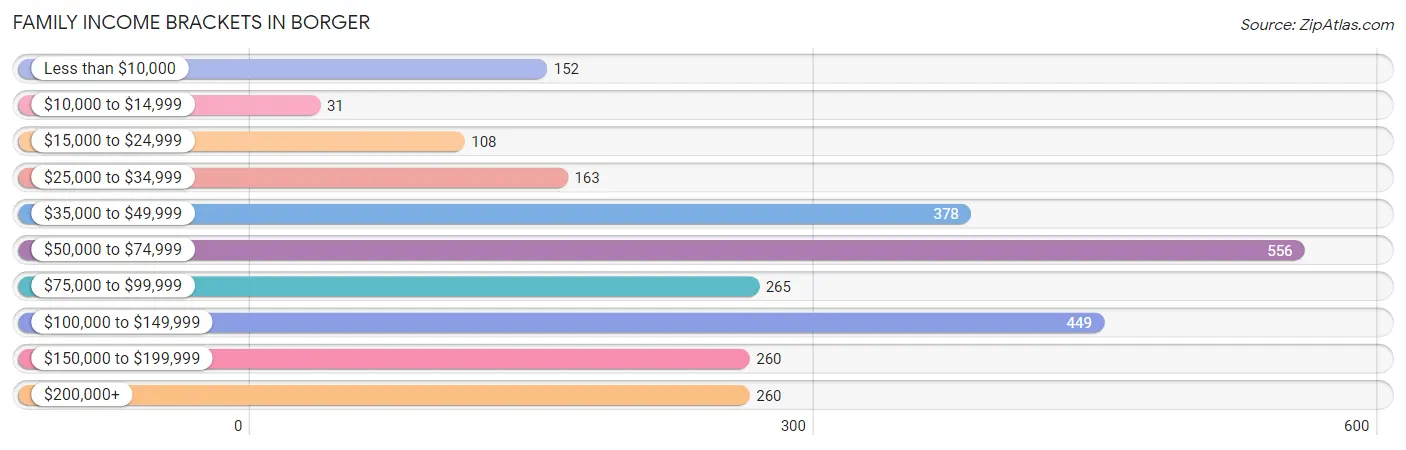
| Income Bracket | # Families | % Families |
| Less than $10,000 | 152 | 5.8% |
| $10,000 to $14,999 | 31 | 1.2% |
| $15,000 to $24,999 | 108 | 4.1% |
| $25,000 to $34,999 | 163 | 6.2% |
| $35,000 to $49,999 | 378 | 14.4% |
| $50,000 to $74,999 | 556 | 21.2% |
| $75,000 to $99,999 | 265 | 10.1% |
| $100,000 to $149,999 | 449 | 17.1% |
| $150,000 to $199,999 | 260 | 9.9% |
| $200,000+ | 260 | 9.9% |
Family Income by Famaliy Size in Borger
6-person families (66 | 2.5%) account for the highest median family income in Borger with $222,778 per family, while 6-person families (66 | 2.5%) have the highest median income of $37,130 per family member.
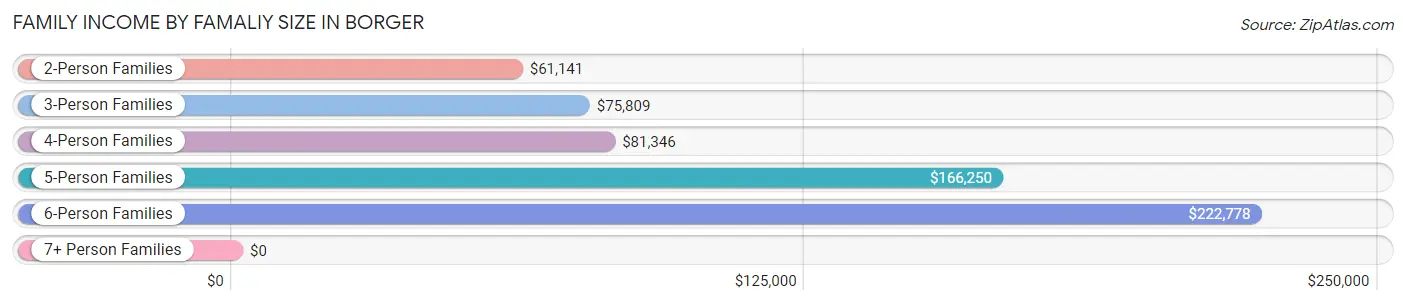
| Income Bracket | # Families | Median Income |
| 2-Person Families | 1,526 (58.2%) | $61,141 |
| 3-Person Families | 422 (16.1%) | $75,809 |
| 4-Person Families | 438 (16.7%) | $81,346 |
| 5-Person Families | 172 (6.6%) | $166,250 |
| 6-Person Families | 66 (2.5%) | $222,778 |
| 7+ Person Families | 0 (0.0%) | $0 |
| Total | 2,624 (100.0%) | $70,405 |
Family Income by Number of Earners in Borger
The median family income in Borger is $70,405, with families comprising 3+ earners (303) having the highest median family income of $163,329, while families with no earners (399) have the lowest median family income of $39,827, accounting for 11.6% and 15.2% of families, respectively.
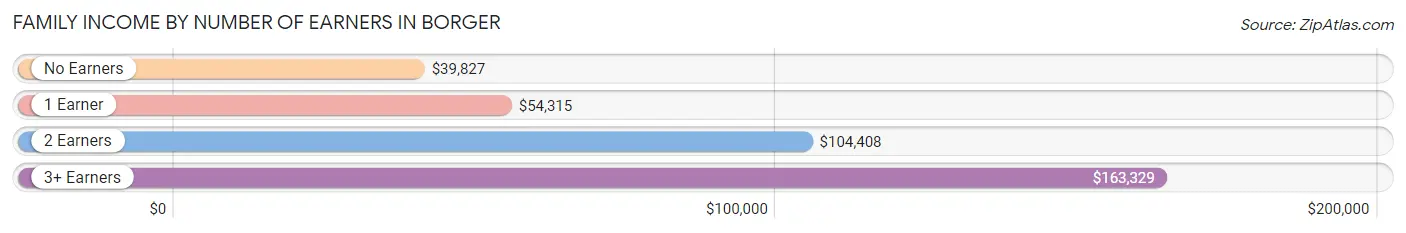
| Number of Earners | # Families | Median Income |
| No Earners | 399 (15.2%) | $39,827 |
| 1 Earner | 1,063 (40.5%) | $54,315 |
| 2 Earners | 859 (32.7%) | $104,408 |
| 3+ Earners | 303 (11.6%) | $163,329 |
| Total | 2,624 (100.0%) | $70,405 |
Household Income in Borger
Household Income Brackets in Borger
With 724 households falling in the category, the $50,000 to $74,999 income range is the most frequent in Borger, accounting for 17.8% of all households. In contrast, only 175 households (4.3%) fall into the $10,000 to $14,999 income bracket, making it the least populous group.
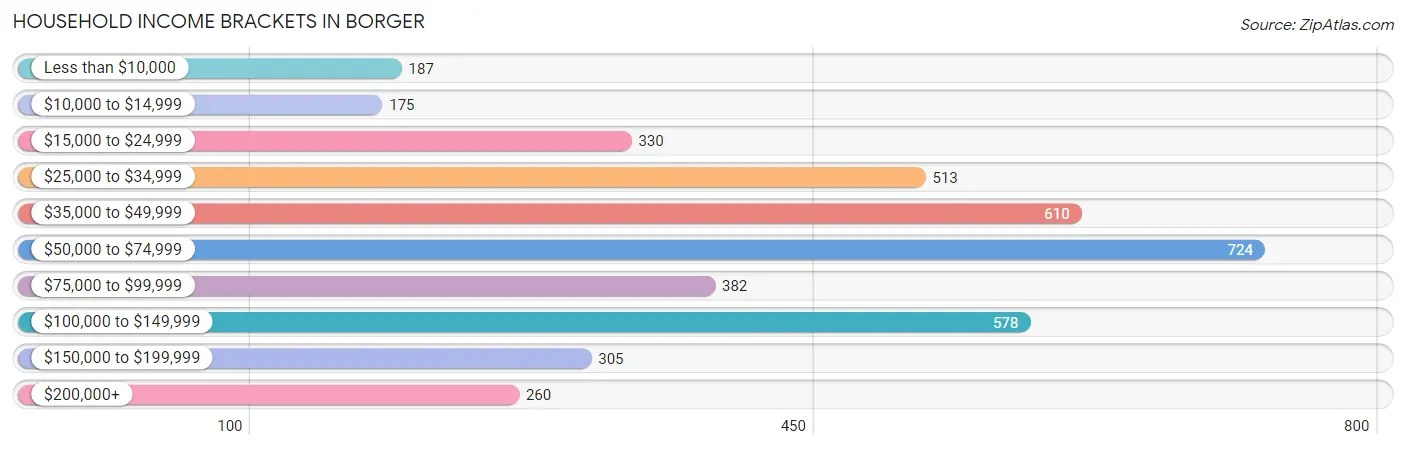
| Income Bracket | # Households | % Households |
| Less than $10,000 | 187 | 4.6% |
| $10,000 to $14,999 | 175 | 4.3% |
| $15,000 to $24,999 | 330 | 8.1% |
| $25,000 to $34,999 | 513 | 12.6% |
| $35,000 to $49,999 | 610 | 15.0% |
| $50,000 to $74,999 | 724 | 17.8% |
| $75,000 to $99,999 | 382 | 9.4% |
| $100,000 to $149,999 | 578 | 14.2% |
| $150,000 to $199,999 | 305 | 7.5% |
| $200,000+ | 260 | 6.4% |
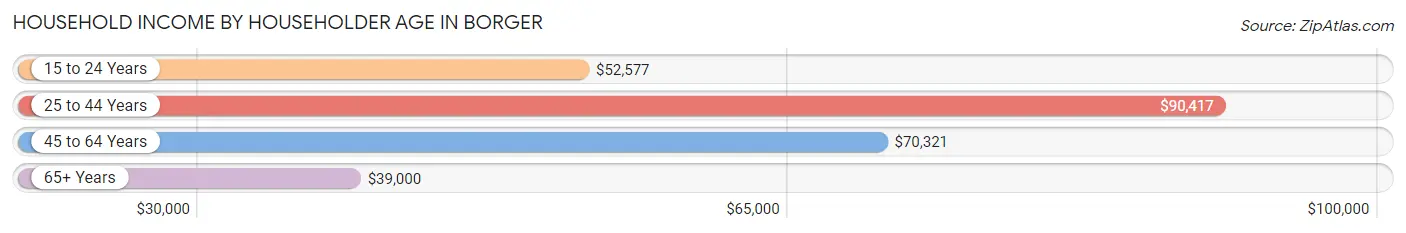
Household Income by Householder Age in Borger
The median household income in Borger is $54,159, with the highest median household income of $90,417 found in the 25 to 44 years age bracket for the primary householder. A total of 1,147 households (28.2%) fall into this category. Meanwhile, the 65+ years age bracket for the primary householder has the lowest median household income of $39,000, with 1,224 households (30.1%) in this group.
| Income Bracket | # Households | Median Income |
| 15 to 24 Years | 151 (3.7%) | $52,577 |
| 25 to 44 Years | 1,147 (28.2%) | $90,417 |
| 45 to 64 Years | 1,546 (38.0%) | $70,321 |
| 65+ Years | 1,224 (30.1%) | $39,000 |
| Total | 4,068 (100.0%) | $54,159 |
Poverty in Borger
Income Below Poverty by Sex and Age in Borger
With 9.1% poverty level for males and 13.3% for females among the residents of Borger, under 5 year old males and 6 to 11 year old females are the most vulnerable to poverty, with 132 males (36.1%) and 163 females (27.4%) in their respective age groups living below the poverty level.
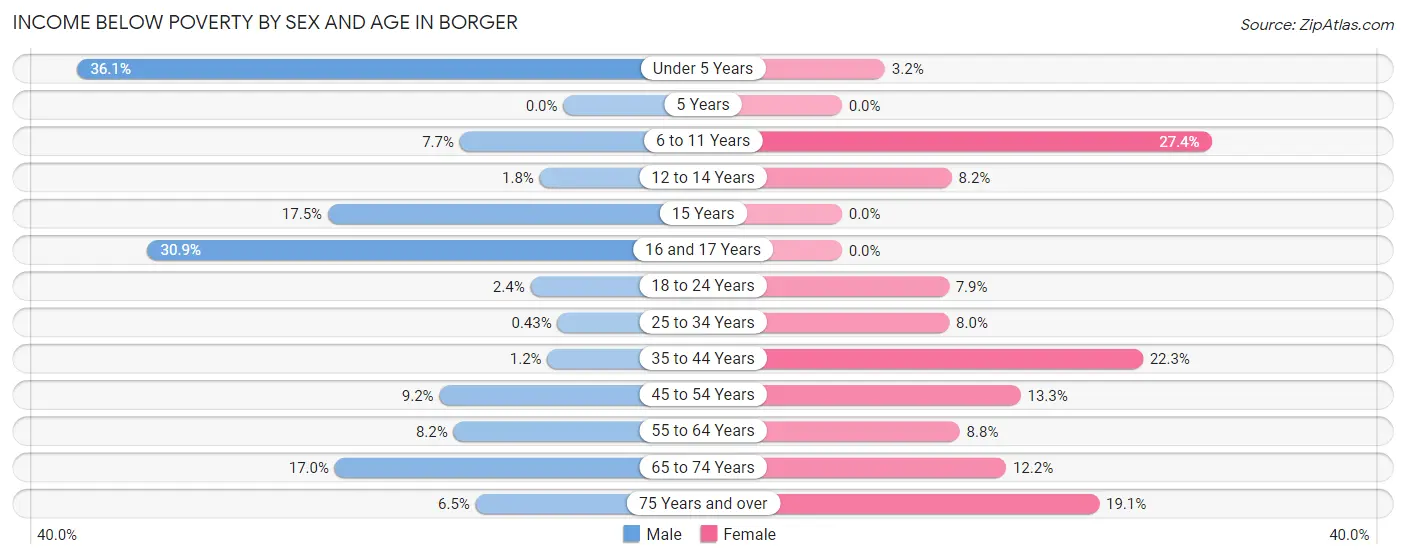
| Age Bracket | Male | Female |
| Under 5 Years | 132 (36.1%) | 11 (3.2%) |
| 5 Years | 0 (0.0%) | 0 (0.0%) |
| 6 to 11 Years | 41 (7.7%) | 163 (27.4%) |
| 12 to 14 Years | 5 (1.8%) | 15 (8.2%) |
| 15 Years | 25 (17.5%) | 0 (0.0%) |
| 16 and 17 Years | 100 (30.9%) | 0 (0.0%) |
| 18 to 24 Years | 18 (2.4%) | 51 (7.9%) |
| 25 to 34 Years | 4 (0.4%) | 49 (8.0%) |
| 35 to 44 Years | 8 (1.2%) | 193 (22.3%) |
| 45 to 54 Years | 60 (9.2%) | 90 (13.3%) |
| 55 to 64 Years | 67 (8.2%) | 66 (8.7%) |
| 65 to 74 Years | 101 (17.0%) | 69 (12.2%) |
| 75 Years and over | 20 (6.5%) | 85 (19.1%) |
| Total | 581 (9.1%) | 792 (13.3%) |
Income Above Poverty by Sex and Age in Borger
According to the poverty statistics in Borger, males aged 5 years and females aged 5 years are the age groups that are most secure financially, with 100.0% of males and 100.0% of females in these age groups living above the poverty line.
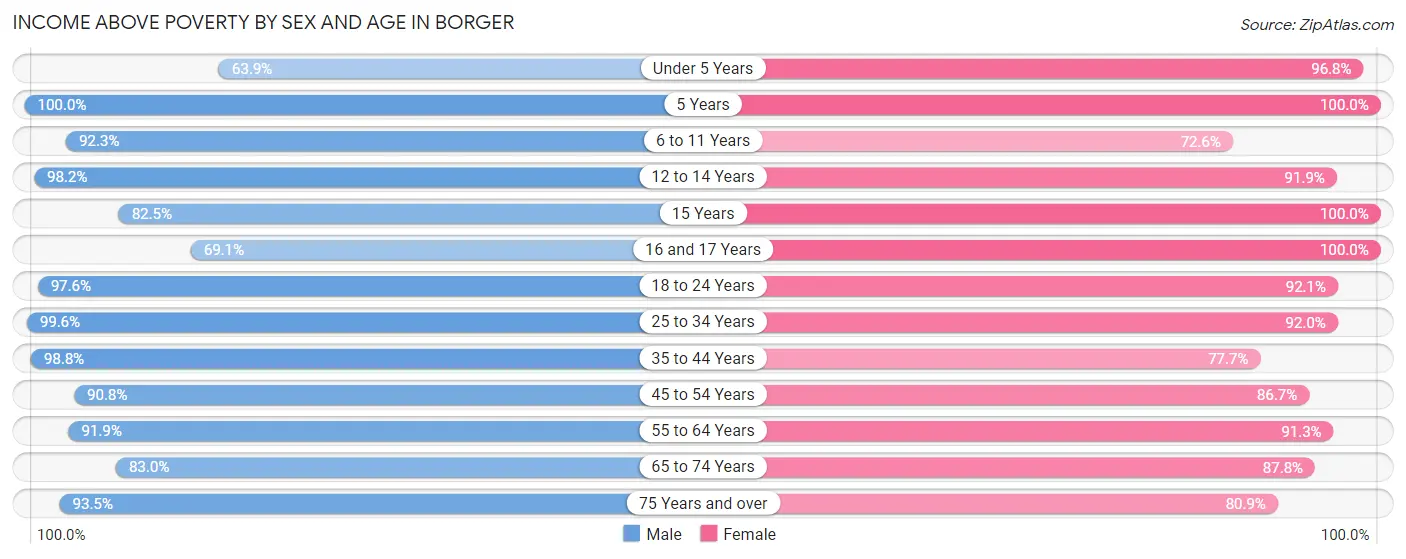
| Age Bracket | Male | Female |
| Under 5 Years | 234 (63.9%) | 333 (96.8%) |
| 5 Years | 8 (100.0%) | 77 (100.0%) |
| 6 to 11 Years | 492 (92.3%) | 431 (72.6%) |
| 12 to 14 Years | 279 (98.2%) | 169 (91.8%) |
| 15 Years | 118 (82.5%) | 138 (100.0%) |
| 16 and 17 Years | 224 (69.1%) | 78 (100.0%) |
| 18 to 24 Years | 719 (97.6%) | 591 (92.1%) |
| 25 to 34 Years | 935 (99.6%) | 566 (92.0%) |
| 35 to 44 Years | 669 (98.8%) | 671 (77.7%) |
| 45 to 54 Years | 592 (90.8%) | 588 (86.7%) |
| 55 to 64 Years | 755 (91.8%) | 688 (91.2%) |
| 65 to 74 Years | 494 (83.0%) | 497 (87.8%) |
| 75 Years and over | 287 (93.5%) | 360 (80.9%) |
| Total | 5,806 (90.9%) | 5,187 (86.8%) |
Income Below Poverty Among Married-Couple Families in Borger
The poverty statistics for married-couple families in Borger show that 3.0% or 60 of the total 1,997 families live below the poverty line. Families with no children have the highest poverty rate of 4.6%, comprising of 60 families. On the other hand, families with 1 or 2 children have the lowest poverty rate of 0.0%, which includes 0 families.
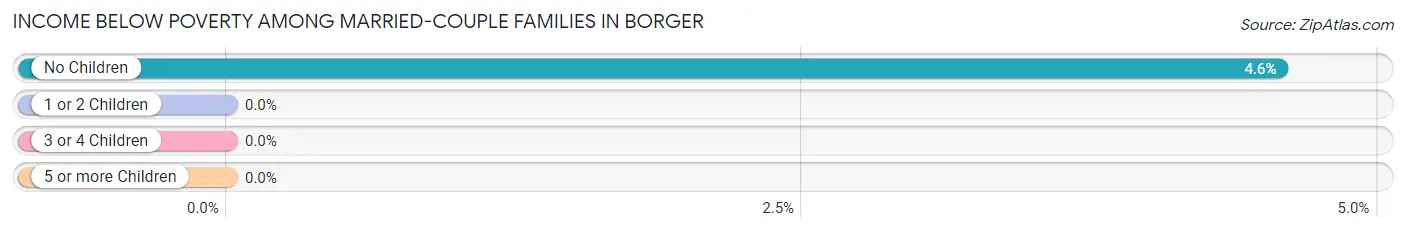
| Children | Above Poverty | Below Poverty |
| No Children | 1,253 (95.4%) | 60 (4.6%) |
| 1 or 2 Children | 494 (100.0%) | 0 (0.0%) |
| 3 or 4 Children | 190 (100.0%) | 0 (0.0%) |
| 5 or more Children | 0 (0.0%) | 0 (0.0%) |
| Total | 1,937 (97.0%) | 60 (3.0%) |
Income Below Poverty Among Single-Parent Households in Borger
According to the poverty data in Borger, 9.2% or 20 single-father households and 43.7% or 179 single-mother households are living below the poverty line. Among single-father households, those with 1 or 2 children have the highest poverty rate, with 14 households (10.6%) experiencing poverty. Likewise, among single-mother households, those with 3 or 4 children have the highest poverty rate, with 35 households (100.0%) falling below the poverty line.
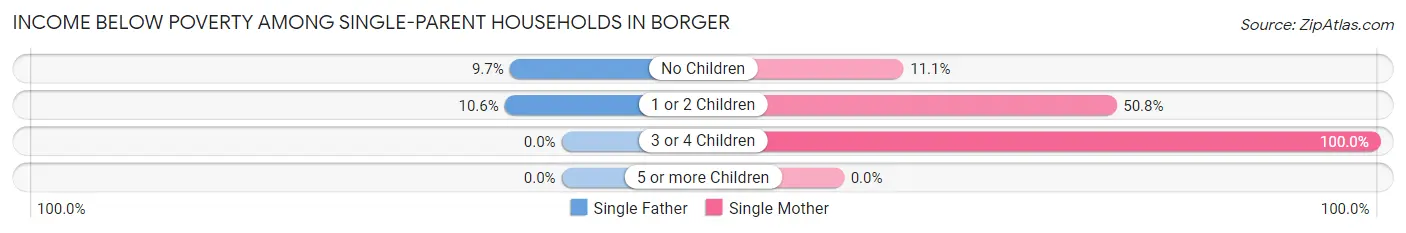
| Children | Single Father | Single Mother |
| No Children | 6 (9.7%) | 13 (11.1%) |
| 1 or 2 Children | 14 (10.6%) | 131 (50.8%) |
| 3 or 4 Children | 0 (0.0%) | 35 (100.0%) |
| 5 or more Children | 0 (0.0%) | 0 (0.0%) |
| Total | 20 (9.2%) | 179 (43.7%) |
Income Below Poverty Among Married-Couple vs Single-Parent Households in Borger
The poverty data for Borger shows that 60 of the married-couple family households (3.0%) and 199 of the single-parent households (31.7%) are living below the poverty level. Within the married-couple family households, those with no children have the highest poverty rate, with 60 households (4.6%) falling below the poverty line. Among the single-parent households, those with 3 or 4 children have the highest poverty rate, with 35 household (60.3%) living below poverty.
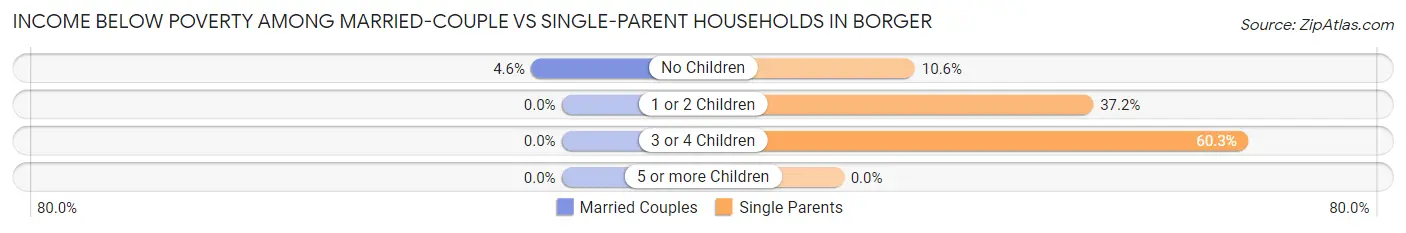
| Children | Married-Couple Families | Single-Parent Households |
| No Children | 60 (4.6%) | 19 (10.6%) |
| 1 or 2 Children | 0 (0.0%) | 145 (37.2%) |
| 3 or 4 Children | 0 (0.0%) | 35 (60.3%) |
| 5 or more Children | 0 (0.0%) | 0 (0.0%) |
| Total | 60 (3.0%) | 199 (31.7%) |
Race in Borger
The most populous races in Borger are White / Caucasian (9,277 | 74.2%), Hispanic or Latino (3,928 | 31.4%), and Two or more Races (1,691 | 13.5%).
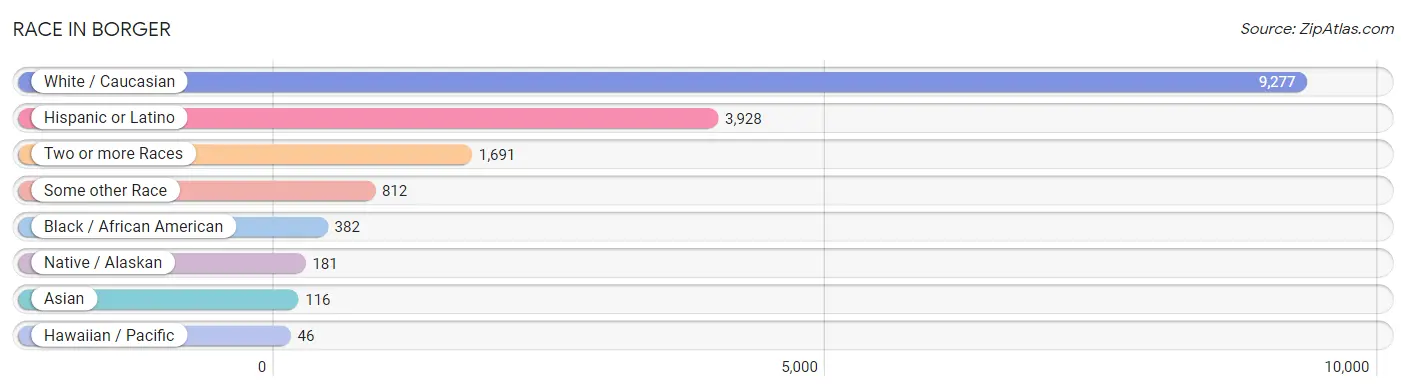
| Race | # Population | % Population |
| Asian | 116 | 0.9% |
| Black / African American | 382 | 3.0% |
| Hawaiian / Pacific | 46 | 0.4% |
| Hispanic or Latino | 3,928 | 31.4% |
| Native / Alaskan | 181 | 1.5% |
| White / Caucasian | 9,277 | 74.2% |
| Two or more Races | 1,691 | 13.5% |
| Some other Race | 812 | 6.5% |
| Total | 12,505 | 100.0% |
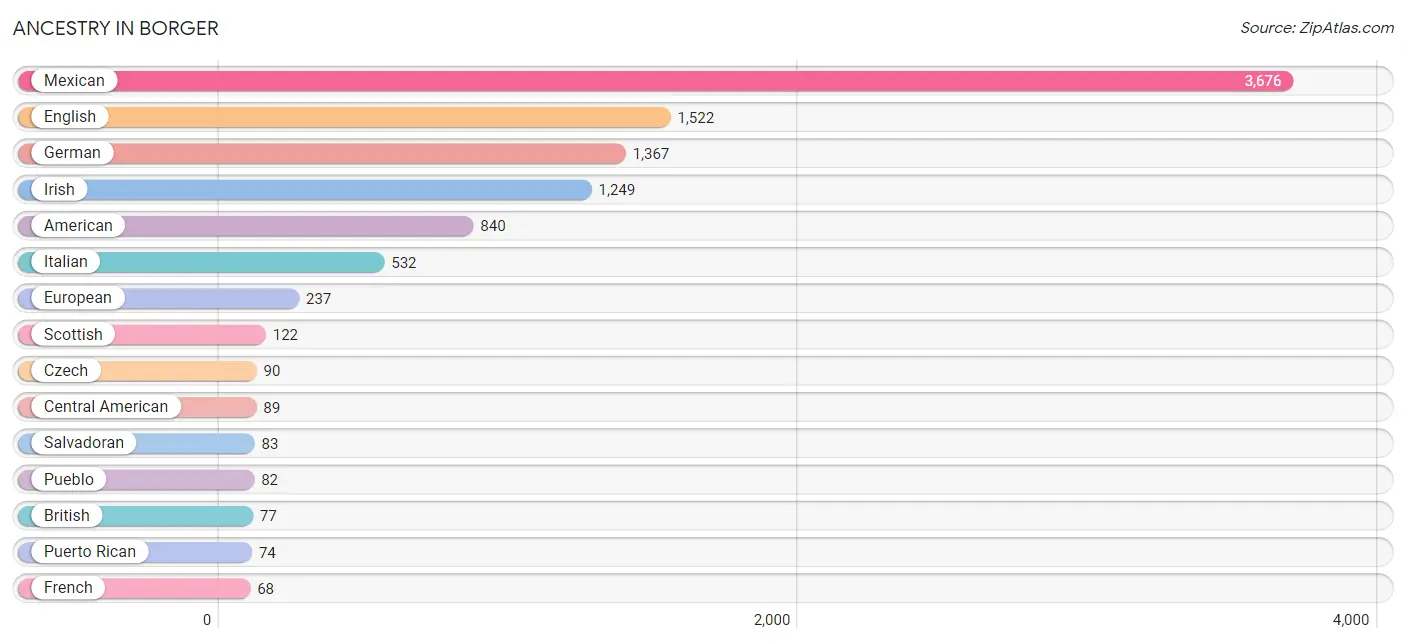
Ancestry in Borger
The most populous ancestries reported in Borger are Mexican (3,676 | 29.4%), English (1,522 | 12.2%), German (1,367 | 10.9%), Irish (1,249 | 10.0%), and American (840 | 6.7%), together accounting for 69.2% of all Borger residents.
| Ancestry | # Population | % Population |
| African | 9 | 0.1% |
| American | 840 | 6.7% |
| Arab | 1 | 0.0% |
| Belgian | 20 | 0.2% |
| Bhutanese | 39 | 0.3% |
| British | 77 | 0.6% |
| Burmese | 66 | 0.5% |
| Cajun | 12 | 0.1% |
| Canadian | 40 | 0.3% |
| Central American | 89 | 0.7% |
| Central American Indian | 46 | 0.4% |
| Cherokee | 58 | 0.5% |
| Chickasaw | 55 | 0.4% |
| Choctaw | 28 | 0.2% |
| Creek | 25 | 0.2% |
| Czech | 90 | 0.7% |
| Delaware | 8 | 0.1% |
| Dutch | 33 | 0.3% |
| Eastern European | 29 | 0.2% |
| English | 1,522 | 12.2% |
| European | 237 | 1.9% |
| French | 68 | 0.5% |
| German | 1,367 | 10.9% |
| Guamanian / Chamorro | 46 | 0.4% |
| Guatemalan | 1 | 0.0% |
| Honduran | 5 | 0.0% |
| Indian (Asian) | 6 | 0.1% |
| Irish | 1,249 | 10.0% |
| Italian | 532 | 4.3% |
| Korean | 4 | 0.0% |
| Mexican | 3,676 | 29.4% |
| Mexican American Indian | 3 | 0.0% |
| Northern European | 29 | 0.2% |
| Norwegian | 33 | 0.3% |
| Polish | 67 | 0.5% |
| Portuguese | 18 | 0.1% |
| Pueblo | 82 | 0.7% |
| Puerto Rican | 74 | 0.6% |
| Romanian | 15 | 0.1% |
| Russian | 37 | 0.3% |
| Salvadoran | 83 | 0.7% |
| Scandinavian | 7 | 0.1% |
| Scotch-Irish | 40 | 0.3% |
| Scottish | 122 | 1.0% |
| Slovene | 19 | 0.2% |
| Spaniard | 17 | 0.1% |
| Sri Lankan | 13 | 0.1% |
| Subsaharan African | 9 | 0.1% |
| Swedish | 8 | 0.1% |
| Swiss | 6 | 0.1% |
| Thai | 6 | 0.1% |
| Welsh | 27 | 0.2% | View All 52 Rows |
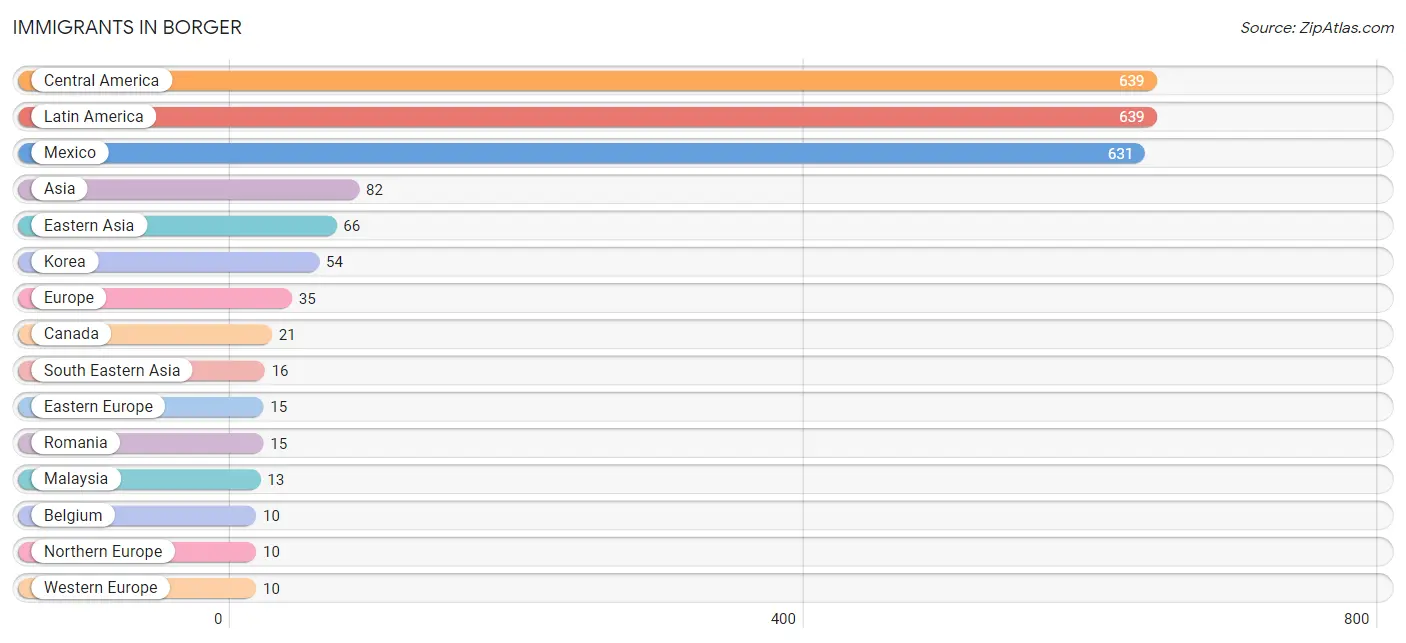
Immigrants in Borger
The most numerous immigrant groups reported in Borger came from Central America (639 | 5.1%), Latin America (639 | 5.1%), Mexico (631 | 5.1%), Asia (82 | 0.7%), and Eastern Asia (66 | 0.5%), together accounting for 16.5% of all Borger residents.
| Immigration Origin | # Population | % Population |
| Asia | 82 | 0.7% |
| Belgium | 10 | 0.1% |
| Canada | 21 | 0.2% |
| Central America | 639 | 5.1% |
| China | 6 | 0.1% |
| Eastern Asia | 66 | 0.5% |
| Eastern Europe | 15 | 0.1% |
| El Salvador | 8 | 0.1% |
| Europe | 35 | 0.3% |
| Japan | 6 | 0.1% |
| Korea | 54 | 0.4% |
| Latin America | 639 | 5.1% |
| Malaysia | 13 | 0.1% |
| Mexico | 631 | 5.1% |
| Northern Europe | 10 | 0.1% |
| Philippines | 3 | 0.0% |
| Romania | 15 | 0.1% |
| South Eastern Asia | 16 | 0.1% |
| Taiwan | 6 | 0.1% |
| Western Europe | 10 | 0.1% | View All 20 Rows |
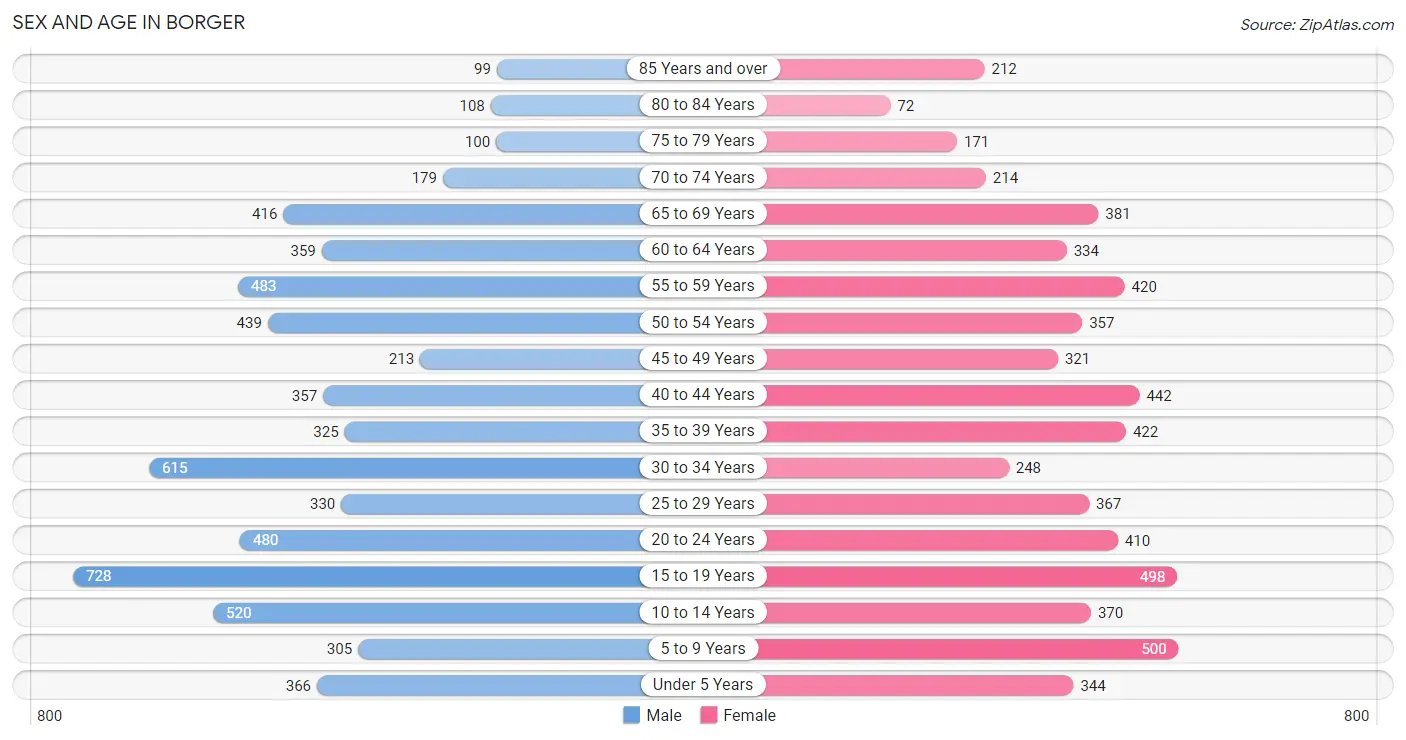
Sex and Age in Borger
Sex and Age in Borger
The most populous age groups in Borger are 15 to 19 Years (728 | 11.3%) for men and 5 to 9 Years (500 | 8.2%) for women.
| Age Bracket | Male | Female |
| Under 5 Years | 366 (5.7%) | 344 (5.7%) |
| 5 to 9 Years | 305 (4.8%) | 500 (8.2%) |
| 10 to 14 Years | 520 (8.1%) | 370 (6.1%) |
| 15 to 19 Years | 728 (11.3%) | 498 (8.2%) |
| 20 to 24 Years | 480 (7.5%) | 410 (6.7%) |
| 25 to 29 Years | 330 (5.1%) | 367 (6.0%) |
| 30 to 34 Years | 615 (9.6%) | 248 (4.1%) |
| 35 to 39 Years | 325 (5.1%) | 422 (6.9%) |
| 40 to 44 Years | 357 (5.6%) | 442 (7.3%) |
| 45 to 49 Years | 213 (3.3%) | 321 (5.3%) |
| 50 to 54 Years | 439 (6.8%) | 357 (5.9%) |
| 55 to 59 Years | 483 (7.5%) | 420 (6.9%) |
| 60 to 64 Years | 359 (5.6%) | 334 (5.5%) |
| 65 to 69 Years | 416 (6.5%) | 381 (6.3%) |
| 70 to 74 Years | 179 (2.8%) | 214 (3.5%) |
| 75 to 79 Years | 100 (1.6%) | 171 (2.8%) |
| 80 to 84 Years | 108 (1.7%) | 72 (1.2%) |
| 85 Years and over | 99 (1.5%) | 212 (3.5%) |
| Total | 6,422 (100.0%) | 6,083 (100.0%) |
Families and Households in Borger
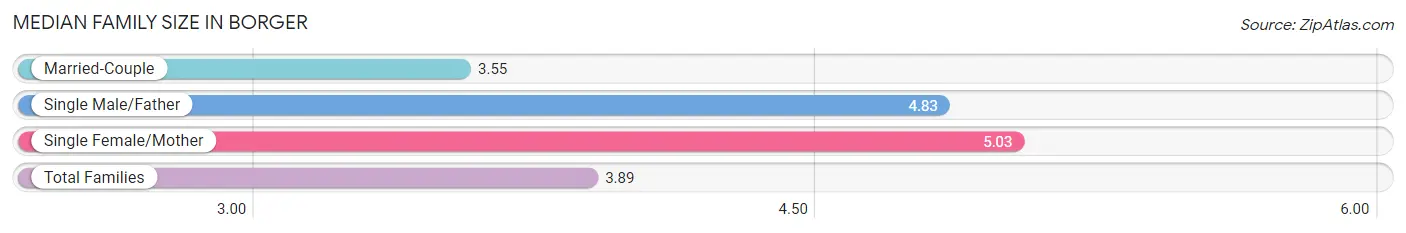
Median Family Size in Borger
The median family size in Borger is 3.89 persons per family, with single female/mother families (410 | 15.6%) accounting for the largest median family size of 5.03 persons per family. On the other hand, married-couple families (1,997 | 76.1%) represent the smallest median family size with 3.55 persons per family.
| Family Type | # Families | Family Size |
| Married-Couple | 1,997 (76.1%) | 3.55 |
| Single Male/Father | 217 (8.3%) | 4.83 |
| Single Female/Mother | 410 (15.6%) | 5.03 |
| Total Families | 2,624 (100.0%) | 3.89 |
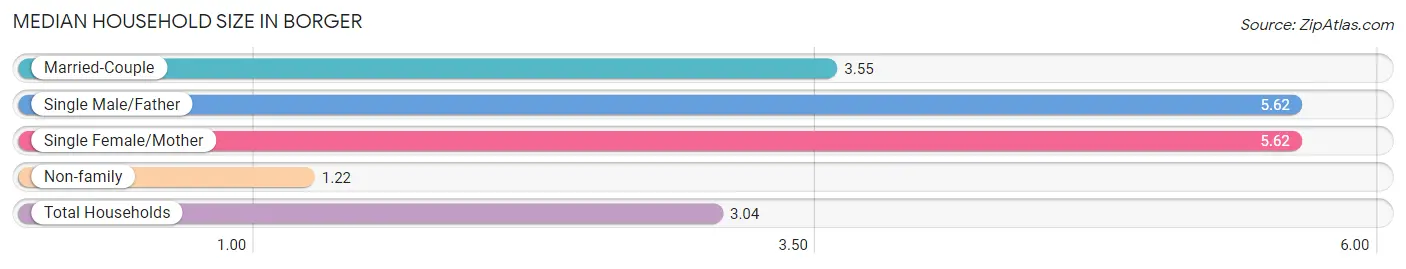
Median Household Size in Borger
The median household size in Borger is 3.04 persons per household, with single male/father households (217 | 5.3%) accounting for the largest median household size of 5.62 persons per household. non-family households (1,444 | 35.5%) represent the smallest median household size with 1.22 persons per household.
| Household Type | # Households | Household Size |
| Married-Couple | 1,997 (49.1%) | 3.55 |
| Single Male/Father | 217 (5.3%) | 5.62 |
| Single Female/Mother | 410 (10.1%) | 5.62 |
| Non-family | 1,444 (35.5%) | 1.22 |
| Total Households | 4,068 (100.0%) | 3.04 |
Household Size by Marriage Status in Borger
Out of a total of 4,068 households in Borger, 2,624 (64.5%) are family households, while 1,444 (35.5%) are nonfamily households. The most numerous type of family households are 2-person households, comprising 1,386, and the most common type of nonfamily households are 1-person households, comprising 1,296.
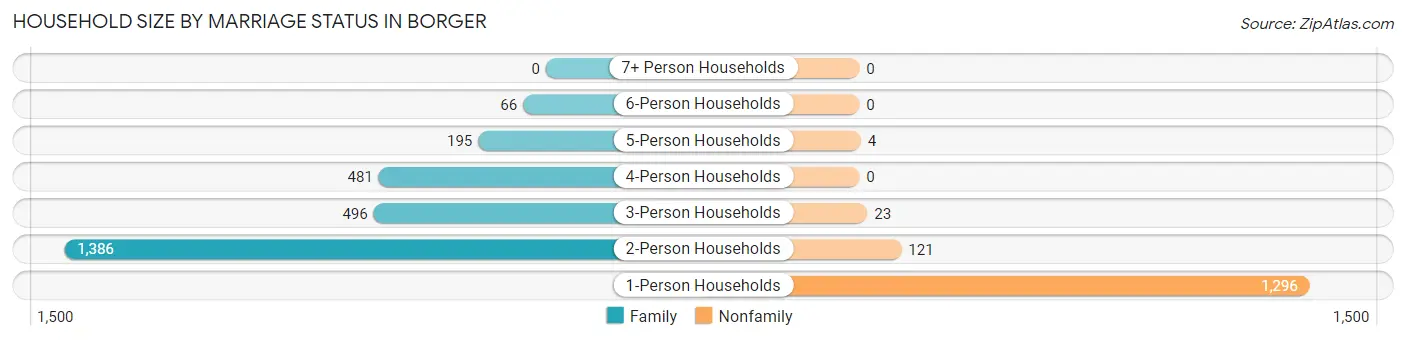
| Household Size | Family Households | Nonfamily Households |
| 1-Person Households | - | 1,296 (31.9%) |
| 2-Person Households | 1,386 (34.1%) | 121 (3.0%) |
| 3-Person Households | 496 (12.2%) | 23 (0.6%) |
| 4-Person Households | 481 (11.8%) | 0 (0.0%) |
| 5-Person Households | 195 (4.8%) | 4 (0.1%) |
| 6-Person Households | 66 (1.6%) | 0 (0.0%) |
| 7+ Person Households | 0 (0.0%) | 0 (0.0%) |
| Total | 2,624 (64.5%) | 1,444 (35.5%) |
Female Fertility in Borger
Fertility by Age in Borger
Average fertility rate in Borger is 45.0 births per 1,000 women. Women in the age bracket of 35 to 50 years have the highest fertility rate with 65.0 births per 1,000 women. Women in the age bracket of 35 to 50 years acount for 64.3% of all women with births.
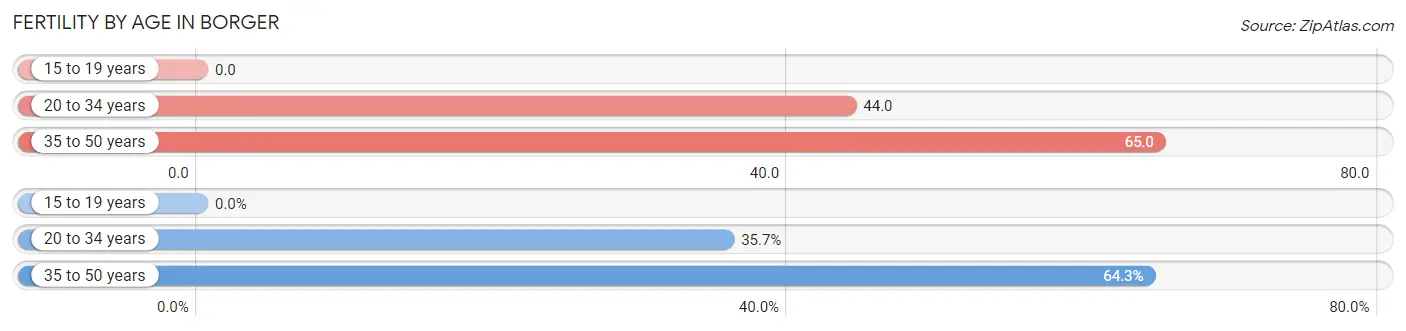
| Age Bracket | Women with Births | Births / 1,000 Women |
| 15 to 19 years | 0 (0.0%) | 0.0 |
| 20 to 34 years | 45 (35.7%) | 44.0 |
| 35 to 50 years | 81 (64.3%) | 65.0 |
| Total | 126 (100.0%) | 45.0 |
Fertility by Age by Marriage Status in Borger
28.6% of women with births (126) in Borger are married. The highest percentage of unmarried women with births falls into 35 to 50 years age bracket with 96.3% of them unmarried at the time of birth, while the lowest percentage of unmarried women with births belong to 20 to 34 years age bracket with 26.7% of them unmarried.
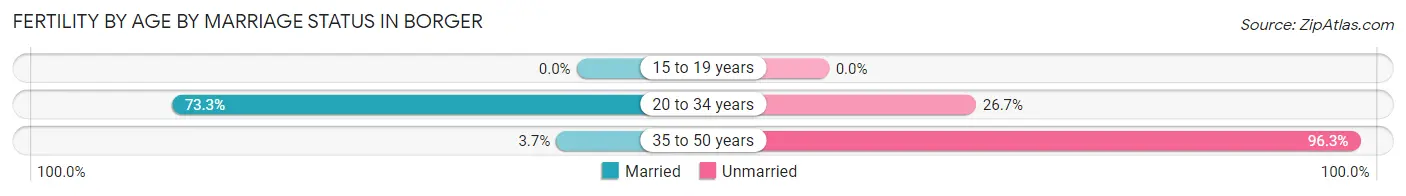
| Age Bracket | Married | Unmarried |
| 15 to 19 years | 0 (0.0%) | 0 (0.0%) |
| 20 to 34 years | 33 (73.3%) | 12 (26.7%) |
| 35 to 50 years | 3 (3.7%) | 78 (96.3%) |
| Total | 36 (28.6%) | 90 (71.4%) |
Fertility by Education in Borger
Average fertility rate in Borger is 45.0 births per 1,000 women. Women with the education attainment of less than high school have the highest fertility rate of 137.0 births per 1,000 women, while women with the education attainment of college or associate's degree have the lowest fertility at 3.0 births per 1,000 women. Women with the education attainment of less than high school represent 69.1% of all women with births.
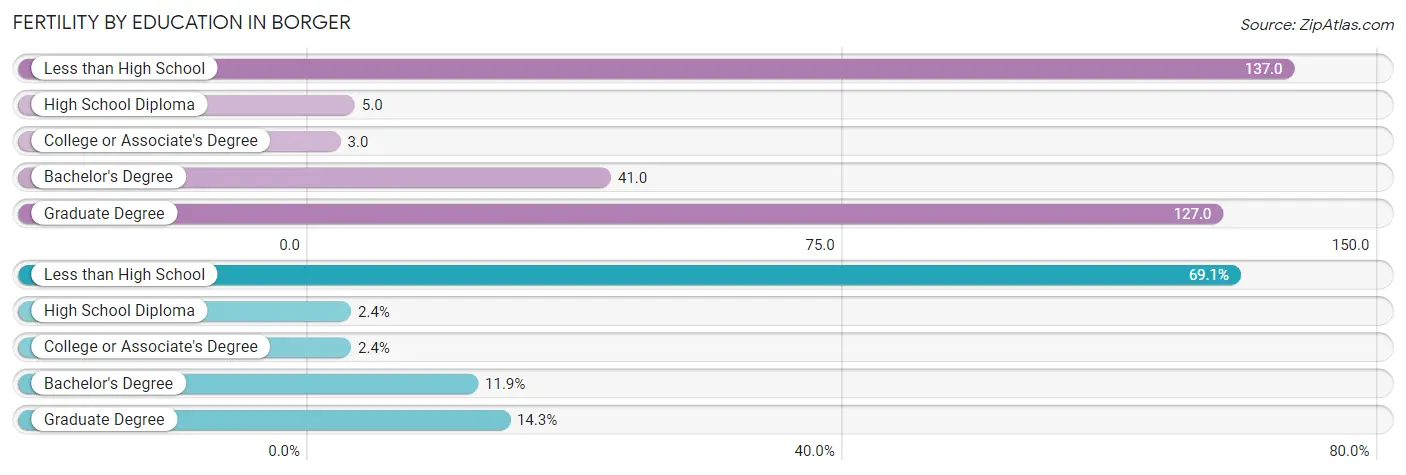
| Educational Attainment | Women with Births | Births / 1,000 Women |
| Less than High School | 87 (69.1%) | 137.0 |
| High School Diploma | 3 (2.4%) | 5.0 |
| College or Associate's Degree | 3 (2.4%) | 3.0 |
| Bachelor's Degree | 15 (11.9%) | 41.0 |
| Graduate Degree | 18 (14.3%) | 127.0 |
| Total | 126 (100.0%) | 45.0 |
Fertility by Education by Marriage Status in Borger
71.4% of women with births in Borger are unmarried. Women with the educational attainment of high school diploma are most likely to be married with 100.0% of them married at childbirth, while women with the educational attainment of less than high school are least likely to be married with 100.0% of them unmarried at childbirth.
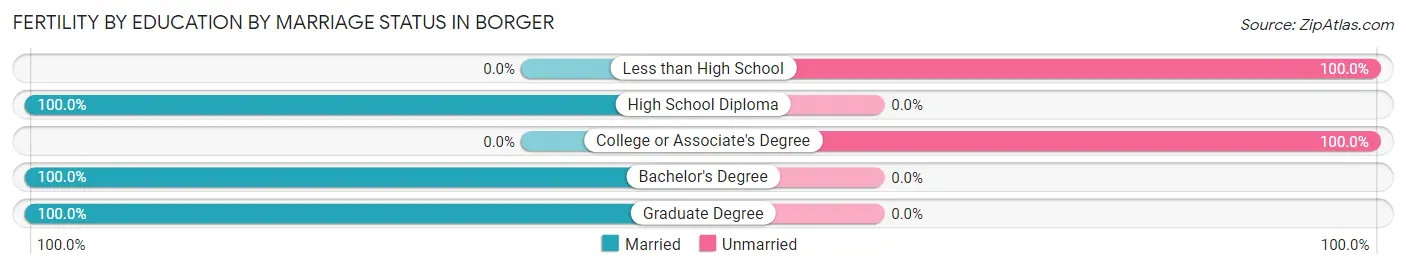
| Educational Attainment | Married | Unmarried |
| Less than High School | 0 (0.0%) | 87 (100.0%) |
| High School Diploma | 3 (100.0%) | 0 (0.0%) |
| College or Associate's Degree | 0 (0.0%) | 3 (100.0%) |
| Bachelor's Degree | 15 (100.0%) | 0 (0.0%) |
| Graduate Degree | 18 (100.0%) | 0 (0.0%) |
| Total | 36 (28.6%) | 90 (71.4%) |
Employment Characteristics in Borger
Employment by Class of Employer in Borger
Among the 5,737 employed individuals in Borger, private company employees (4,075 | 71.0%), local government employees (624 | 10.9%), and state government employees (322 | 5.6%) make up the most common classes of employment.
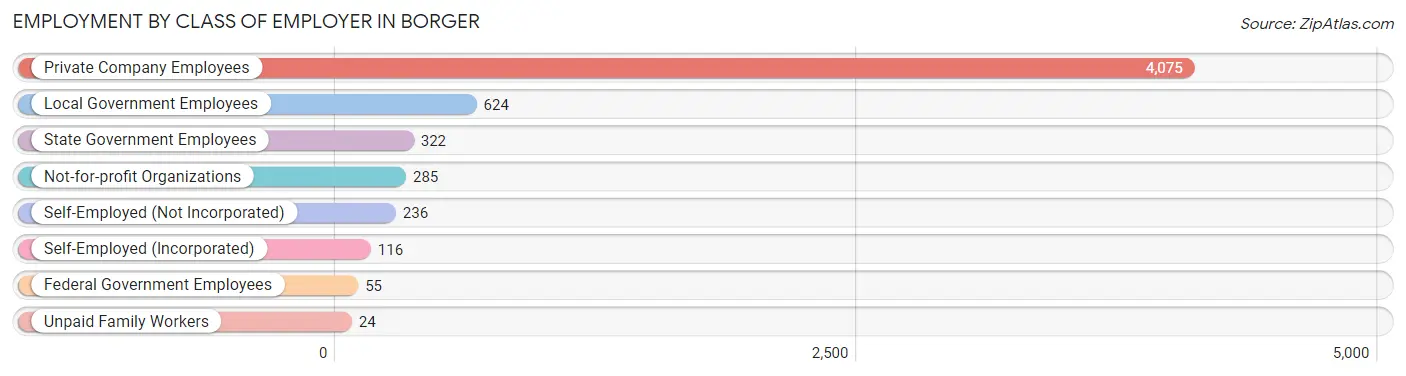
| Employer Class | # Employees | % Employees |
| Private Company Employees | 4,075 | 71.0% |
| Self-Employed (Incorporated) | 116 | 2.0% |
| Self-Employed (Not Incorporated) | 236 | 4.1% |
| Not-for-profit Organizations | 285 | 5.0% |
| Local Government Employees | 624 | 10.9% |
| State Government Employees | 322 | 5.6% |
| Federal Government Employees | 55 | 1.0% |
| Unpaid Family Workers | 24 | 0.4% |
| Total | 5,737 | 100.0% |
Employment Status by Age in Borger
According to the labor force statistics for Borger, out of the total population over 16 years of age (9,819), 61.8% or 6,068 individuals are in the labor force, with 3.1% or 188 of them unemployed. The age group with the highest labor force participation rate is 30 to 34 years, with 92.8% or 801 individuals in the labor force. Within the labor force, the 20 to 24 years age range has the highest percentage of unemployed individuals, with 13.9% or 111 of them being unemployed.
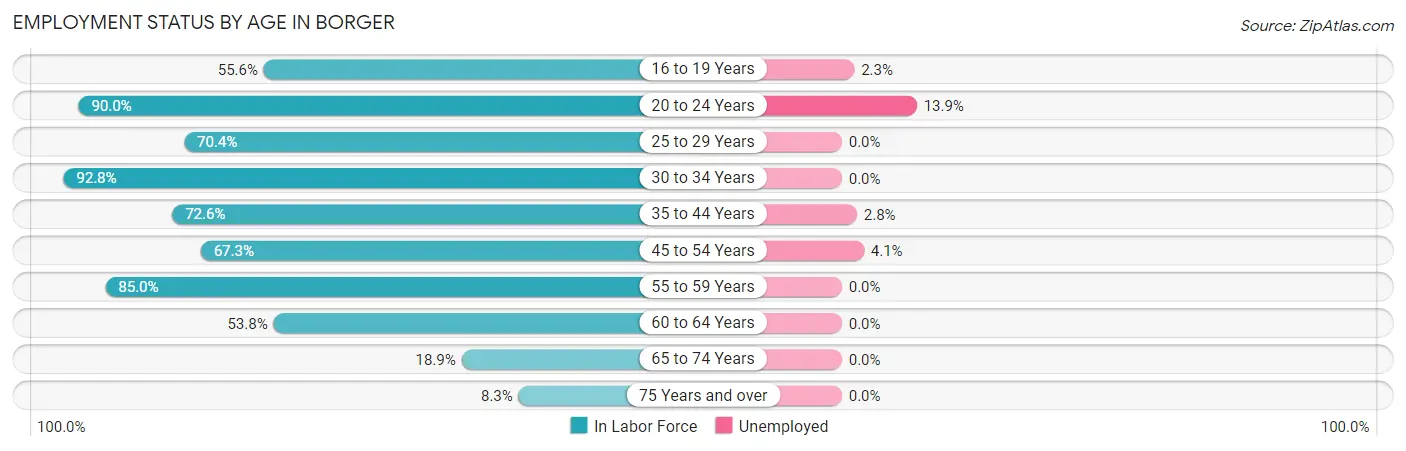
| Age Bracket | In Labor Force | Unemployed |
| 16 to 19 Years | 525 (55.6%) | 12 (2.3%) |
| 20 to 24 Years | 801 (90.0%) | 111 (13.9%) |
| 25 to 29 Years | 491 (70.4%) | 0 (0.0%) |
| 30 to 34 Years | 801 (92.8%) | 0 (0.0%) |
| 35 to 44 Years | 1,122 (72.6%) | 31 (2.8%) |
| 45 to 54 Years | 895 (67.3%) | 37 (4.1%) |
| 55 to 59 Years | 768 (85.0%) | 0 (0.0%) |
| 60 to 64 Years | 373 (53.8%) | 0 (0.0%) |
| 65 to 74 Years | 225 (18.9%) | 0 (0.0%) |
| 75 Years and over | 63 (8.3%) | 0 (0.0%) |
| Total | 6,068 (61.8%) | 188 (3.1%) |
Employment Status by Educational Attainment in Borger
According to labor force statistics for Borger, 73.8% of individuals (4,452) out of the total population between 25 and 64 years of age (6,032) are in the labor force, with 1.5% or 67 of them being unemployed. The group with the highest labor force participation rate are those with the educational attainment of bachelor's degree or higher, with 83.1% or 1,016 individuals in the labor force. Within the labor force, individuals with less than high school education have the highest percentage of unemployment, with 5.4% or 35 of them being unemployed.
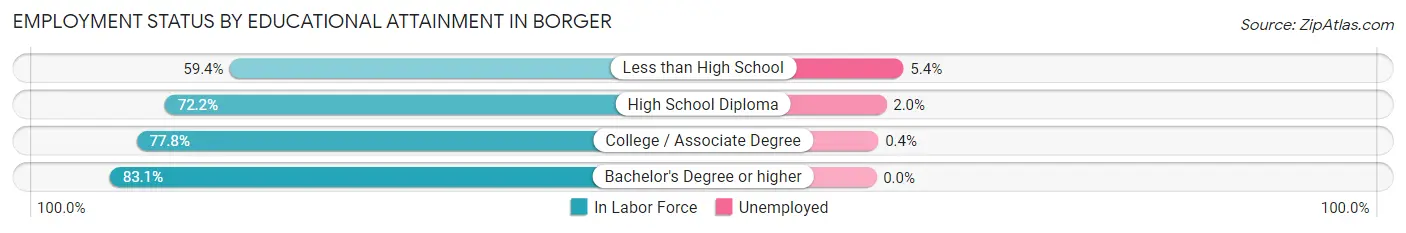
| Educational Attainment | In Labor Force | Unemployed |
| Less than High School | 654 (59.4%) | 59 (5.4%) |
| High School Diploma | 1,336 (72.2%) | 37 (2.0%) |
| College / Associate Degree | 1,445 (77.8%) | 7 (0.4%) |
| Bachelor's Degree or higher | 1,016 (83.1%) | 0 (0.0%) |
| Total | 4,452 (73.8%) | 90 (1.5%) |
Employment Occupations by Sex in Borger
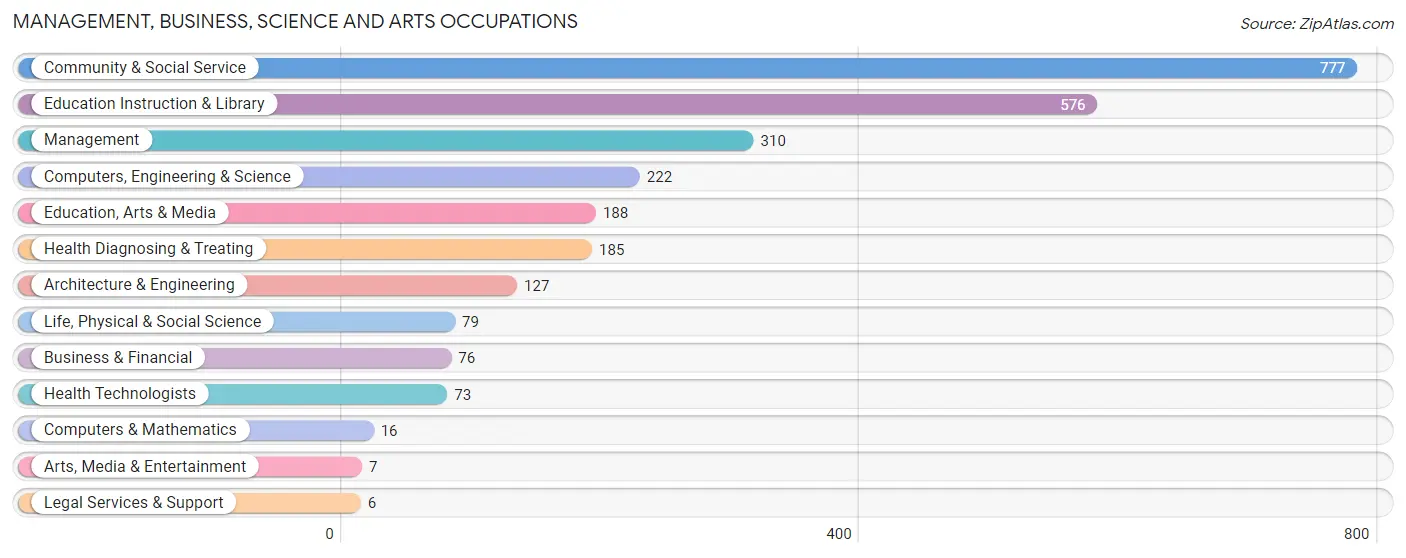
Management, Business, Science and Arts Occupations
The most common Management, Business, Science and Arts occupations in Borger are Community & Social Service (777 | 13.2%), Education Instruction & Library (576 | 9.8%), Management (310 | 5.3%), Computers, Engineering & Science (222 | 3.8%), and Education, Arts & Media (188 | 3.2%).
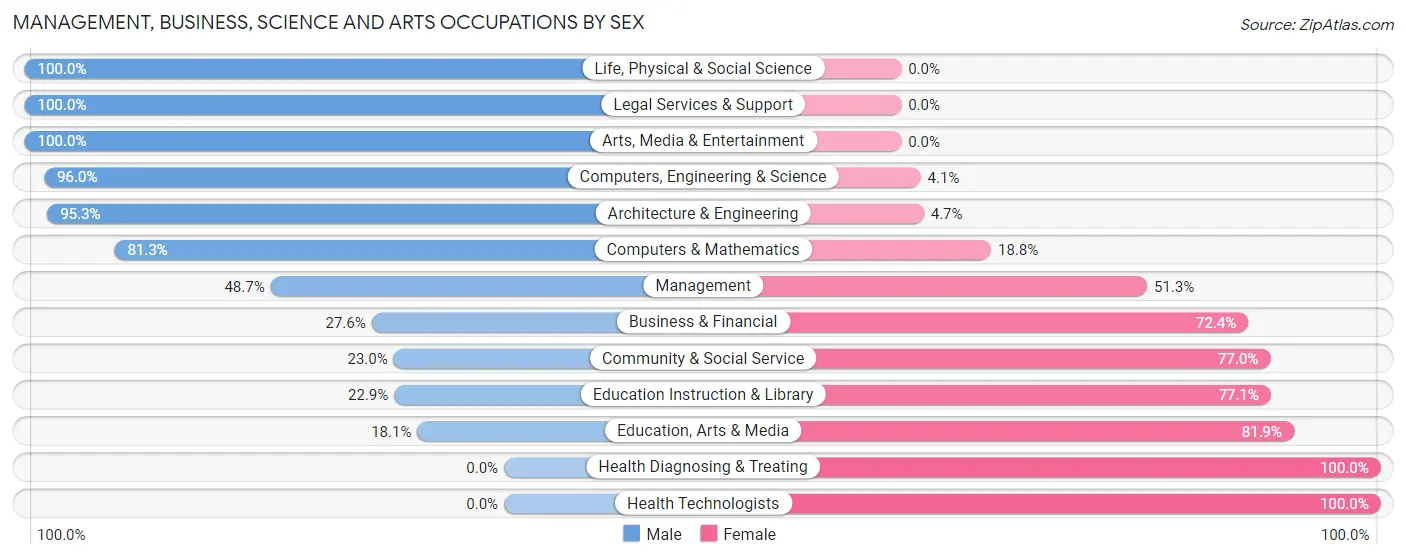
Management, Business, Science and Arts Occupations by Sex
Within the Management, Business, Science and Arts occupations in Borger, the most male-oriented occupations are Life, Physical & Social Science (100.0%), Legal Services & Support (100.0%), and Arts, Media & Entertainment (100.0%), while the most female-oriented occupations are Health Diagnosing & Treating (100.0%), Health Technologists (100.0%), and Education, Arts & Media (81.9%).
| Occupation | Male | Female |
| Management | 151 (48.7%) | 159 (51.3%) |
| Business & Financial | 21 (27.6%) | 55 (72.4%) |
| Computers, Engineering & Science | 213 (96.0%) | 9 (4.1%) |
| Computers & Mathematics | 13 (81.2%) | 3 (18.8%) |
| Architecture & Engineering | 121 (95.3%) | 6 (4.7%) |
| Life, Physical & Social Science | 79 (100.0%) | 0 (0.0%) |
| Community & Social Service | 179 (23.0%) | 598 (77.0%) |
| Education, Arts & Media | 34 (18.1%) | 154 (81.9%) |
| Legal Services & Support | 6 (100.0%) | 0 (0.0%) |
| Education Instruction & Library | 132 (22.9%) | 444 (77.1%) |
| Arts, Media & Entertainment | 7 (100.0%) | 0 (0.0%) |
| Health Diagnosing & Treating | 0 (0.0%) | 185 (100.0%) |
| Health Technologists | 0 (0.0%) | 73 (100.0%) |
| Total (Category) | 564 (35.9%) | 1,006 (64.1%) |
| Total (Overall) | 3,326 (56.6%) | 2,548 (43.4%) |
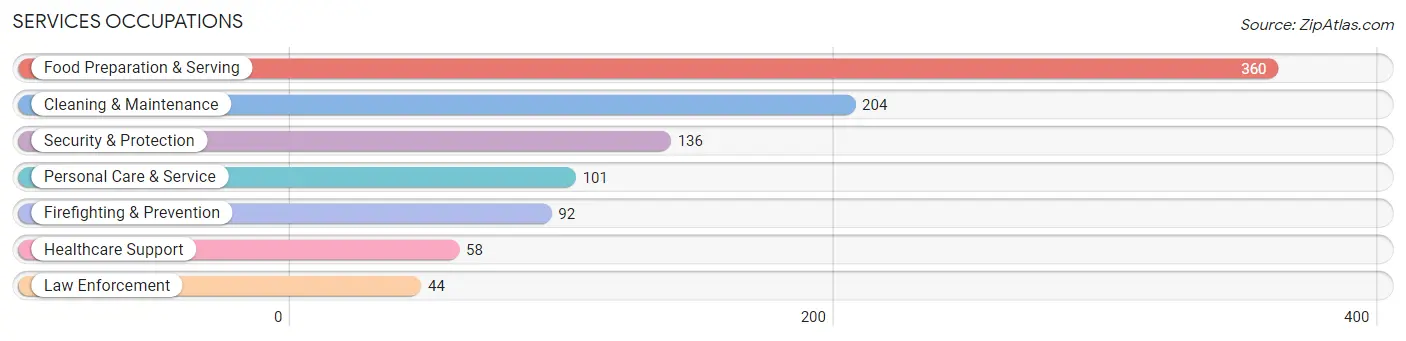
Services Occupations
The most common Services occupations in Borger are Food Preparation & Serving (360 | 6.1%), Cleaning & Maintenance (204 | 3.5%), Security & Protection (136 | 2.3%), Personal Care & Service (101 | 1.7%), and Firefighting & Prevention (92 | 1.6%).
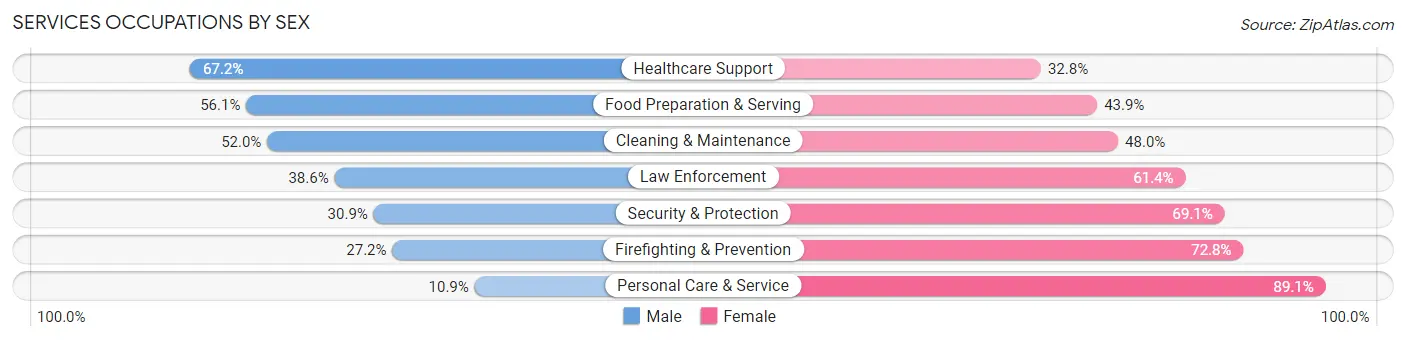
Services Occupations by Sex
Within the Services occupations in Borger, the most male-oriented occupations are Healthcare Support (67.2%), Food Preparation & Serving (56.1%), and Cleaning & Maintenance (52.0%), while the most female-oriented occupations are Personal Care & Service (89.1%), Firefighting & Prevention (72.8%), and Security & Protection (69.1%).
| Occupation | Male | Female |
| Healthcare Support | 39 (67.2%) | 19 (32.8%) |
| Security & Protection | 42 (30.9%) | 94 (69.1%) |
| Firefighting & Prevention | 25 (27.2%) | 67 (72.8%) |
| Law Enforcement | 17 (38.6%) | 27 (61.4%) |
| Food Preparation & Serving | 202 (56.1%) | 158 (43.9%) |
| Cleaning & Maintenance | 106 (52.0%) | 98 (48.0%) |
| Personal Care & Service | 11 (10.9%) | 90 (89.1%) |
| Total (Category) | 400 (46.6%) | 459 (53.4%) |
| Total (Overall) | 3,326 (56.6%) | 2,548 (43.4%) |
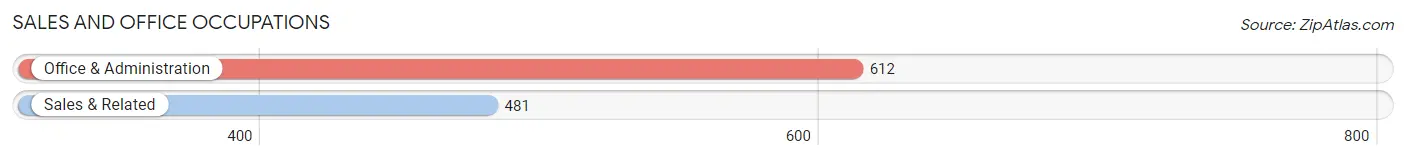
Sales and Office Occupations
The most common Sales and Office occupations in Borger are Office & Administration (612 | 10.4%), and Sales & Related (481 | 8.2%).
Sales and Office Occupations by Sex
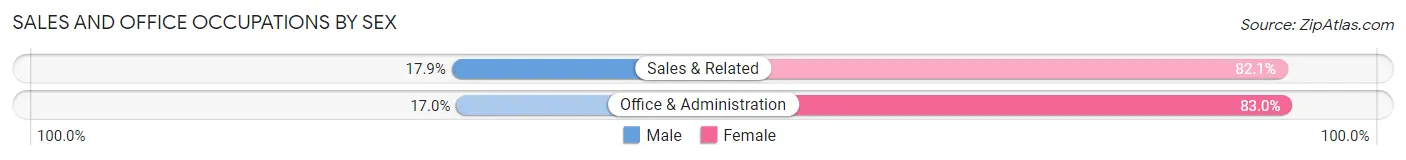
| Occupation | Male | Female |
| Sales & Related | 86 (17.9%) | 395 (82.1%) |
| Office & Administration | 104 (17.0%) | 508 (83.0%) |
| Total (Category) | 190 (17.4%) | 903 (82.6%) |
| Total (Overall) | 3,326 (56.6%) | 2,548 (43.4%) |
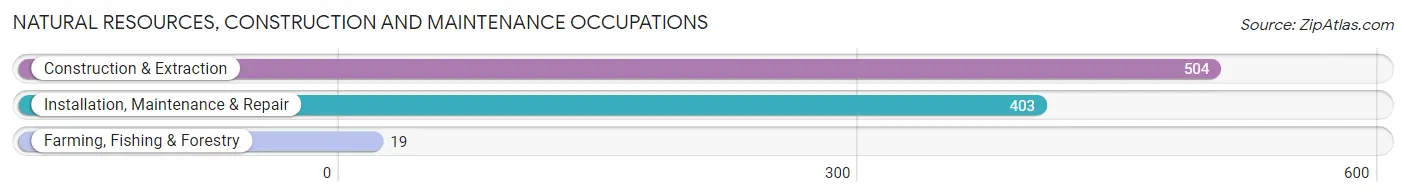
Natural Resources, Construction and Maintenance Occupations
The most common Natural Resources, Construction and Maintenance occupations in Borger are Construction & Extraction (504 | 8.6%), Installation, Maintenance & Repair (403 | 6.9%), and Farming, Fishing & Forestry (19 | 0.3%).
Natural Resources, Construction and Maintenance Occupations by Sex
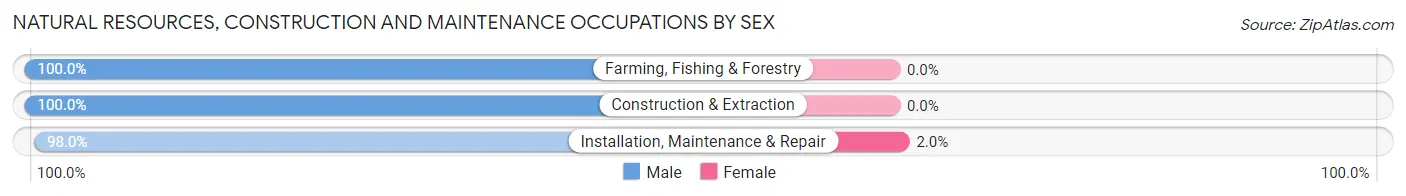
| Occupation | Male | Female |
| Farming, Fishing & Forestry | 19 (100.0%) | 0 (0.0%) |
| Construction & Extraction | 504 (100.0%) | 0 (0.0%) |
| Installation, Maintenance & Repair | 395 (98.0%) | 8 (2.0%) |
| Total (Category) | 918 (99.1%) | 8 (0.9%) |
| Total (Overall) | 3,326 (56.6%) | 2,548 (43.4%) |
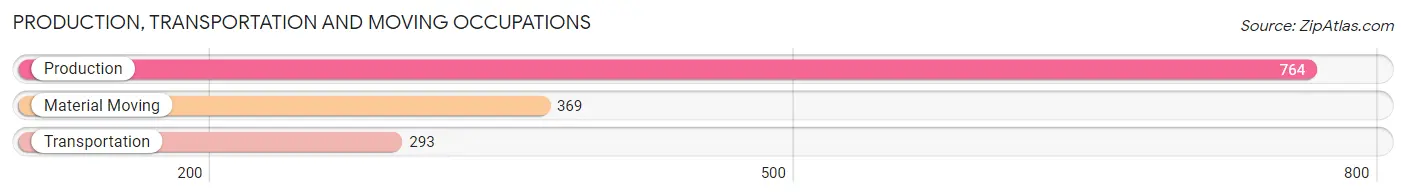
Production, Transportation and Moving Occupations
The most common Production, Transportation and Moving occupations in Borger are Production (764 | 13.0%), Material Moving (369 | 6.3%), and Transportation (293 | 5.0%).
Production, Transportation and Moving Occupations by Sex
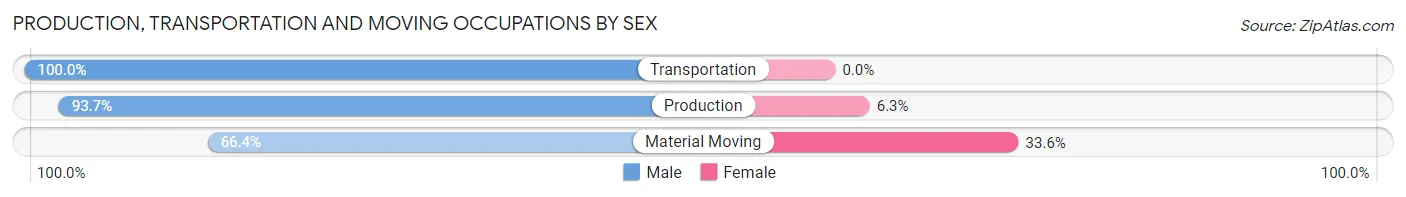
| Occupation | Male | Female |
| Production | 716 (93.7%) | 48 (6.3%) |
| Transportation | 293 (100.0%) | 0 (0.0%) |
| Material Moving | 245 (66.4%) | 124 (33.6%) |
| Total (Category) | 1,254 (87.9%) | 172 (12.1%) |
| Total (Overall) | 3,326 (56.6%) | 2,548 (43.4%) |
Employment Industries by Sex in Borger
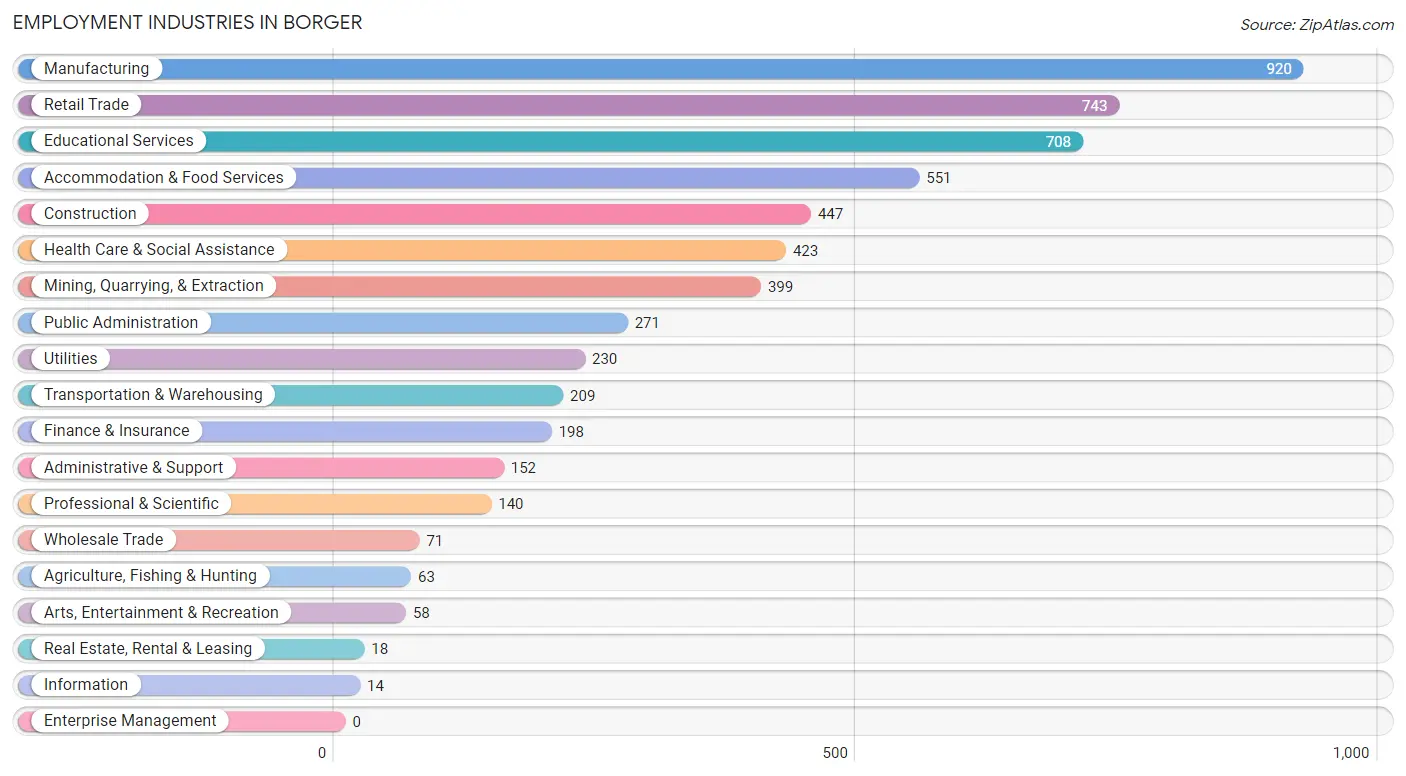
Employment Industries in Borger
The major employment industries in Borger include Manufacturing (920 | 15.7%), Retail Trade (743 | 12.7%), Educational Services (708 | 12.0%), Accommodation & Food Services (551 | 9.4%), and Construction (447 | 7.6%).
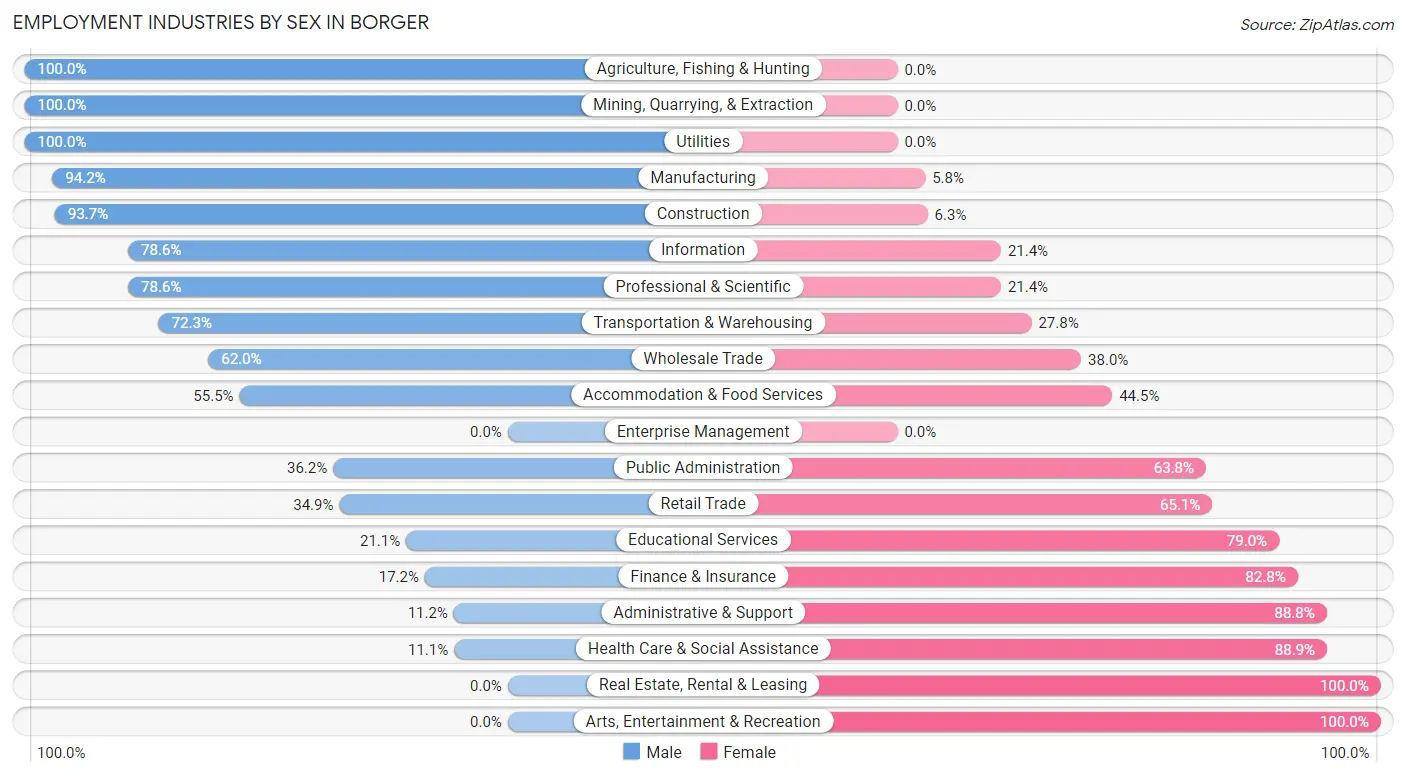
Employment Industries by Sex in Borger
The Borger industries that see more men than women are Agriculture, Fishing & Hunting (100.0%), Mining, Quarrying, & Extraction (100.0%), and Utilities (100.0%), whereas the industries that tend to have a higher number of women are Real Estate, Rental & Leasing (100.0%), Arts, Entertainment & Recreation (100.0%), and Health Care & Social Assistance (88.9%).
| Industry | Male | Female |
| Agriculture, Fishing & Hunting | 63 (100.0%) | 0 (0.0%) |
| Mining, Quarrying, & Extraction | 399 (100.0%) | 0 (0.0%) |
| Construction | 419 (93.7%) | 28 (6.3%) |
| Manufacturing | 867 (94.2%) | 53 (5.8%) |
| Wholesale Trade | 44 (62.0%) | 27 (38.0%) |
| Retail Trade | 259 (34.9%) | 484 (65.1%) |
| Transportation & Warehousing | 151 (72.3%) | 58 (27.8%) |
| Utilities | 230 (100.0%) | 0 (0.0%) |
| Information | 11 (78.6%) | 3 (21.4%) |
| Finance & Insurance | 34 (17.2%) | 164 (82.8%) |
| Real Estate, Rental & Leasing | 0 (0.0%) | 18 (100.0%) |
| Professional & Scientific | 110 (78.6%) | 30 (21.4%) |
| Enterprise Management | 0 (0.0%) | 0 (0.0%) |
| Administrative & Support | 17 (11.2%) | 135 (88.8%) |
| Educational Services | 149 (21.0%) | 559 (78.9%) |
| Health Care & Social Assistance | 47 (11.1%) | 376 (88.9%) |
| Arts, Entertainment & Recreation | 0 (0.0%) | 58 (100.0%) |
| Accommodation & Food Services | 306 (55.5%) | 245 (44.5%) |
| Public Administration | 98 (36.2%) | 173 (63.8%) |
| Total | 3,326 (56.6%) | 2,548 (43.4%) |
Education in Borger
School Enrollment in Borger
The most common levels of schooling among the 3,186 students in Borger are college / undergraduate (818 | 25.7%), elementary school (725 | 22.8%), and high school (724 | 22.7%).
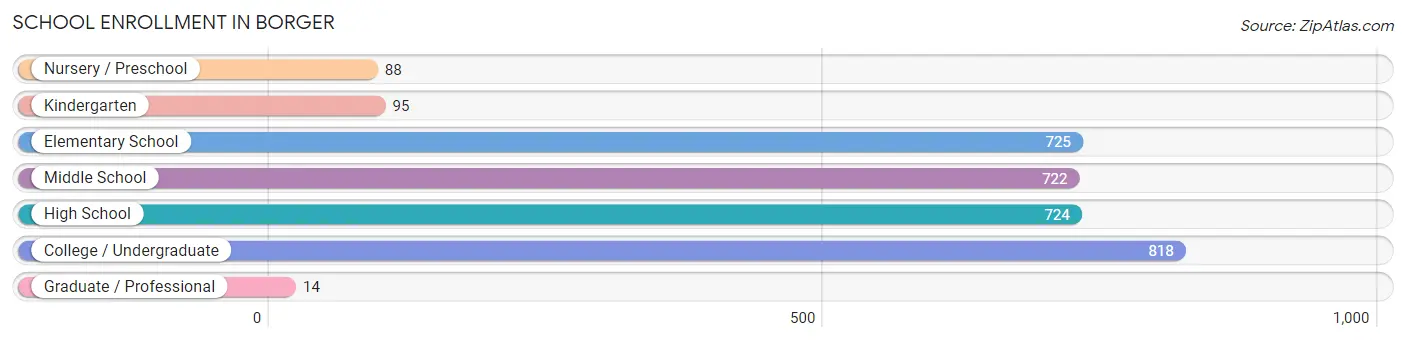
| School Level | # Students | % Students |
| Nursery / Preschool | 88 | 2.8% |
| Kindergarten | 95 | 3.0% |
| Elementary School | 725 | 22.8% |
| Middle School | 722 | 22.7% |
| High School | 724 | 22.7% |
| College / Undergraduate | 818 | 25.7% |
| Graduate / Professional | 14 | 0.4% |
| Total | 3,186 | 100.0% |
School Enrollment by Age by Funding Source in Borger
Out of a total of 3,186 students who are enrolled in schools in Borger, 299 (9.4%) attend a private institution, while the remaining 2,887 (90.6%) are enrolled in public schools. The age group of 3 to 4 year olds has the highest likelihood of being enrolled in private schools, with 28 (59.6% in the age bracket) enrolled. Conversely, the age group of 25 to 34 year olds has the lowest likelihood of being enrolled in a private school, with 61 (100.0% in the age bracket) attending a public institution.
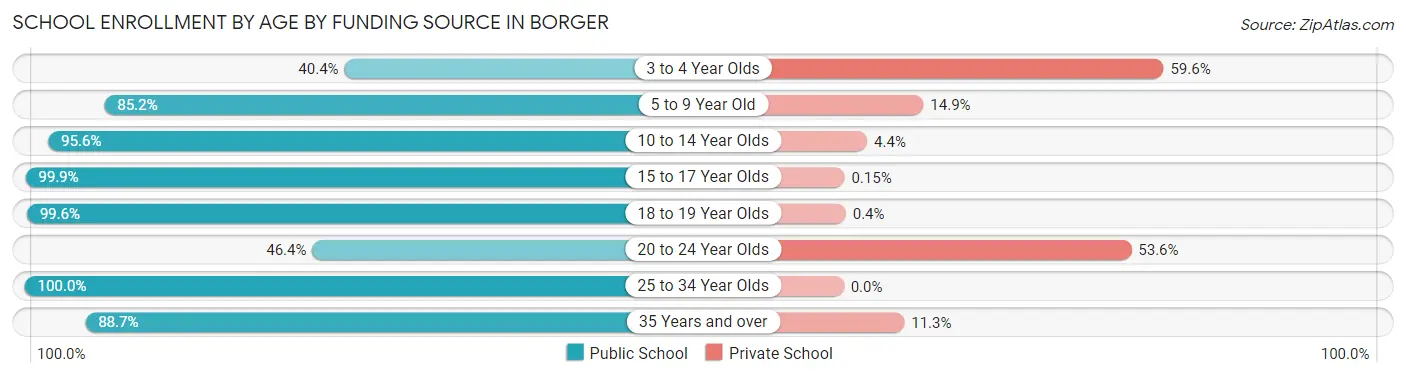
| Age Bracket | Public School | Private School |
| 3 to 4 Year Olds | 19 (40.4%) | 28 (59.6%) |
| 5 to 9 Year Old | 625 (85.2%) | 109 (14.8%) |
| 10 to 14 Year Olds | 851 (95.6%) | 39 (4.4%) |
| 15 to 17 Year Olds | 682 (99.9%) | 1 (0.2%) |
| 18 to 19 Year Olds | 498 (99.6%) | 2 (0.4%) |
| 20 to 24 Year Olds | 97 (46.4%) | 112 (53.6%) |
| 25 to 34 Year Olds | 61 (100.0%) | 0 (0.0%) |
| 35 Years and over | 55 (88.7%) | 7 (11.3%) |
| Total | 2,887 (90.6%) | 299 (9.4%) |
Educational Attainment by Field of Study in Borger
Business (244 | 13.9%), bio, nature & agricultural (240 | 13.7%), education (226 | 12.9%), literature & languages (195 | 11.1%), and science & technology (159 | 9.1%) are the most common fields of study among 1,753 individuals in Borger who have obtained a bachelor's degree or higher.
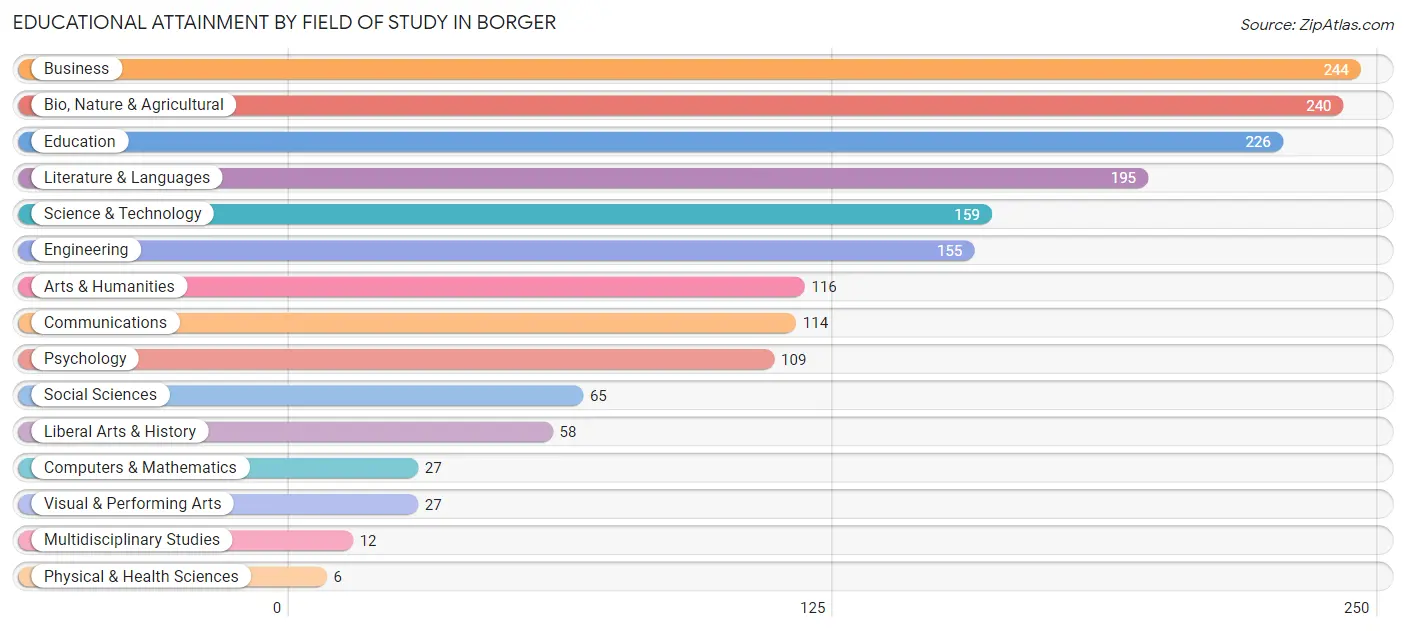
| Field of Study | # Graduates | % Graduates |
| Computers & Mathematics | 27 | 1.5% |
| Bio, Nature & Agricultural | 240 | 13.7% |
| Physical & Health Sciences | 6 | 0.3% |
| Psychology | 109 | 6.2% |
| Social Sciences | 65 | 3.7% |
| Engineering | 155 | 8.8% |
| Multidisciplinary Studies | 12 | 0.7% |
| Science & Technology | 159 | 9.1% |
| Business | 244 | 13.9% |
| Education | 226 | 12.9% |
| Literature & Languages | 195 | 11.1% |
| Liberal Arts & History | 58 | 3.3% |
| Visual & Performing Arts | 27 | 1.5% |
| Communications | 114 | 6.5% |
| Arts & Humanities | 116 | 6.6% |
| Total | 1,753 | 100.0% |
Transportation & Commute in Borger
Vehicle Availability by Sex in Borger
The most prevalent vehicle ownership categories in Borger are males with 2 vehicles (1,143, accounting for 35.7%) and females with 2 vehicles (875, making up 45.1%).
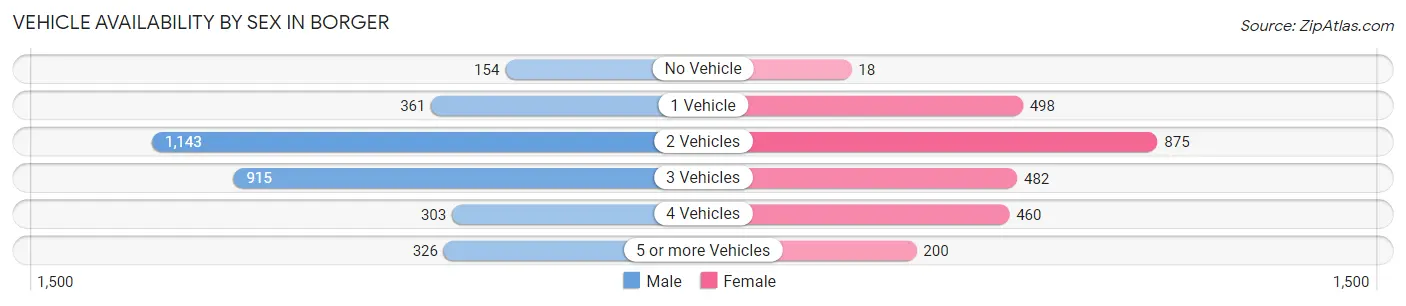
| Vehicles Available | Male | Female |
| No Vehicle | 154 (4.8%) | 18 (0.7%) |
| 1 Vehicle | 361 (11.3%) | 498 (19.7%) |
| 2 Vehicles | 1,143 (35.7%) | 875 (34.5%) |
| 3 Vehicles | 915 (28.6%) | 482 (19.0%) |
| 4 Vehicles | 303 (9.5%) | 460 (18.2%) |
| 5 or more Vehicles | 326 (10.2%) | 200 (7.9%) |
| Total | 3,202 (100.0%) | 2,533 (100.0%) |
Commute Time in Borger
The most frequently occuring commute durations in Borger are 5 to 9 minutes (1,919 commuters, 34.0%), 10 to 14 minutes (1,160 commuters, 20.6%), and 15 to 19 minutes (535 commuters, 9.5%).
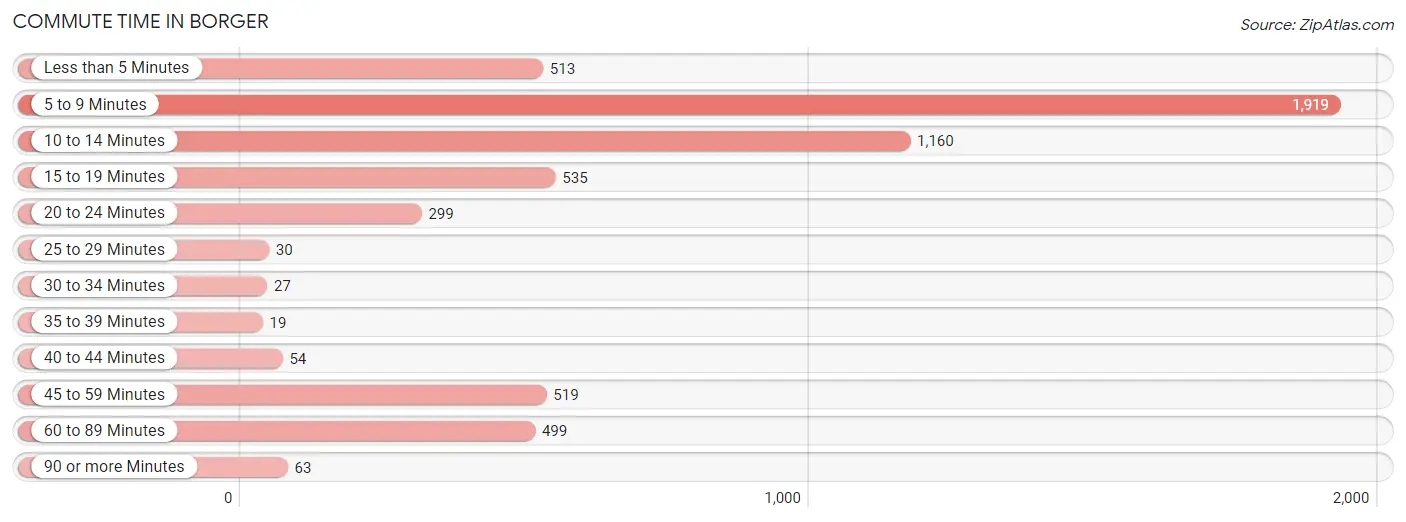
| Commute Time | # Commuters | % Commuters |
| Less than 5 Minutes | 513 | 9.1% |
| 5 to 9 Minutes | 1,919 | 34.0% |
| 10 to 14 Minutes | 1,160 | 20.6% |
| 15 to 19 Minutes | 535 | 9.5% |
| 20 to 24 Minutes | 299 | 5.3% |
| 25 to 29 Minutes | 30 | 0.5% |
| 30 to 34 Minutes | 27 | 0.5% |
| 35 to 39 Minutes | 19 | 0.3% |
| 40 to 44 Minutes | 54 | 1.0% |
| 45 to 59 Minutes | 519 | 9.2% |
| 60 to 89 Minutes | 499 | 8.8% |
| 90 or more Minutes | 63 | 1.1% |
Commute Time by Sex in Borger
The most common commute times in Borger are 5 to 9 minutes (936 commuters, 29.3%) for males and 5 to 9 minutes (983 commuters, 40.3%) for females.
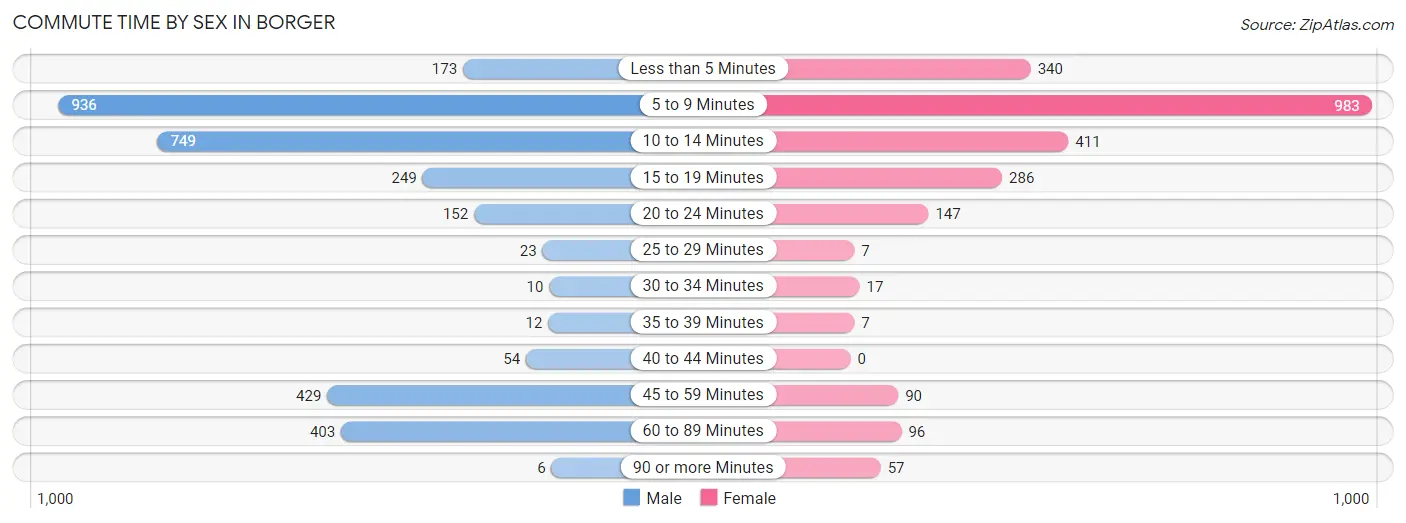
| Commute Time | Male | Female |
| Less than 5 Minutes | 173 (5.4%) | 340 (13.9%) |
| 5 to 9 Minutes | 936 (29.3%) | 983 (40.3%) |
| 10 to 14 Minutes | 749 (23.4%) | 411 (16.8%) |
| 15 to 19 Minutes | 249 (7.8%) | 286 (11.7%) |
| 20 to 24 Minutes | 152 (4.8%) | 147 (6.0%) |
| 25 to 29 Minutes | 23 (0.7%) | 7 (0.3%) |
| 30 to 34 Minutes | 10 (0.3%) | 17 (0.7%) |
| 35 to 39 Minutes | 12 (0.4%) | 7 (0.3%) |
| 40 to 44 Minutes | 54 (1.7%) | 0 (0.0%) |
| 45 to 59 Minutes | 429 (13.4%) | 90 (3.7%) |
| 60 to 89 Minutes | 403 (12.6%) | 96 (3.9%) |
| 90 or more Minutes | 6 (0.2%) | 57 (2.3%) |
Time of Departure to Work by Sex in Borger
The most frequent times of departure to work in Borger are 5:30 AM to 5:59 AM (529, 16.6%) for males and 7:00 AM to 7:29 AM (493, 20.2%) for females.
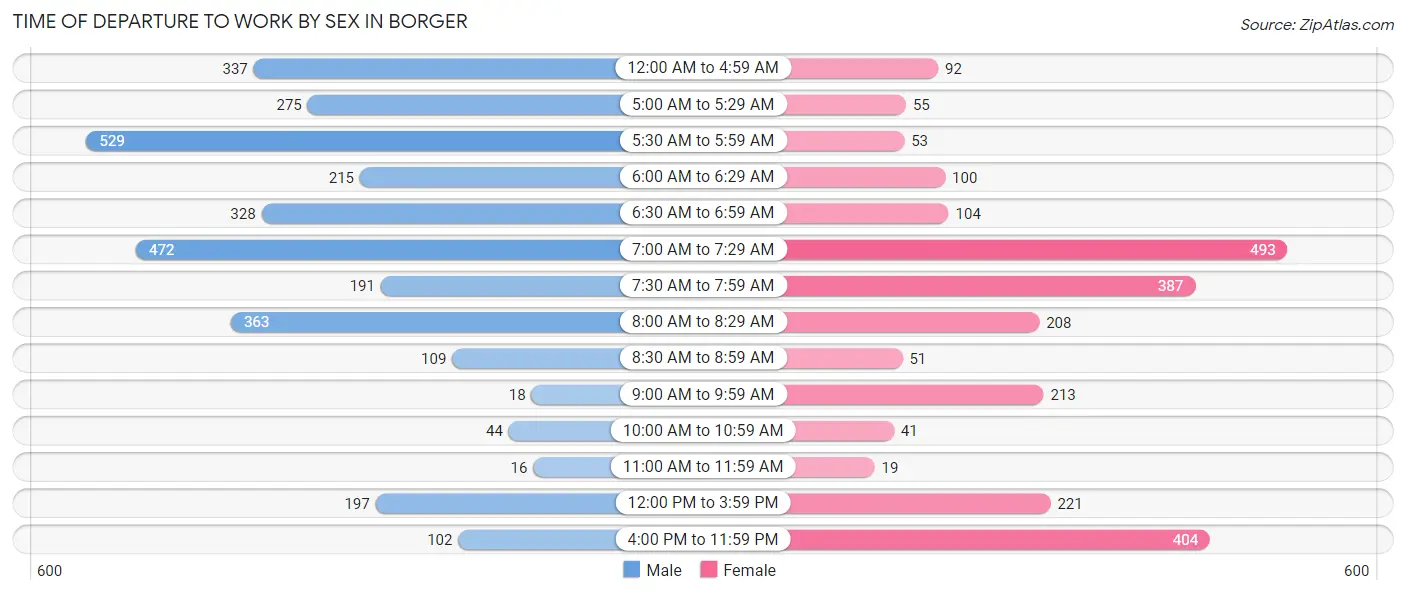
| Time of Departure | Male | Female |
| 12:00 AM to 4:59 AM | 337 (10.5%) | 92 (3.8%) |
| 5:00 AM to 5:29 AM | 275 (8.6%) | 55 (2.2%) |
| 5:30 AM to 5:59 AM | 529 (16.6%) | 53 (2.2%) |
| 6:00 AM to 6:29 AM | 215 (6.7%) | 100 (4.1%) |
| 6:30 AM to 6:59 AM | 328 (10.3%) | 104 (4.3%) |
| 7:00 AM to 7:29 AM | 472 (14.8%) | 493 (20.2%) |
| 7:30 AM to 7:59 AM | 191 (6.0%) | 387 (15.9%) |
| 8:00 AM to 8:29 AM | 363 (11.4%) | 208 (8.5%) |
| 8:30 AM to 8:59 AM | 109 (3.4%) | 51 (2.1%) |
| 9:00 AM to 9:59 AM | 18 (0.6%) | 213 (8.7%) |
| 10:00 AM to 10:59 AM | 44 (1.4%) | 41 (1.7%) |
| 11:00 AM to 11:59 AM | 16 (0.5%) | 19 (0.8%) |
| 12:00 PM to 3:59 PM | 197 (6.2%) | 221 (9.0%) |
| 4:00 PM to 11:59 PM | 102 (3.2%) | 404 (16.6%) |
| Total | 3,196 (100.0%) | 2,441 (100.0%) |
Housing Occupancy in Borger
Occupancy by Ownership in Borger
Of the total 4,068 dwellings in Borger, owner-occupied units account for 3,145 (77.3%), while renter-occupied units make up 923 (22.7%).
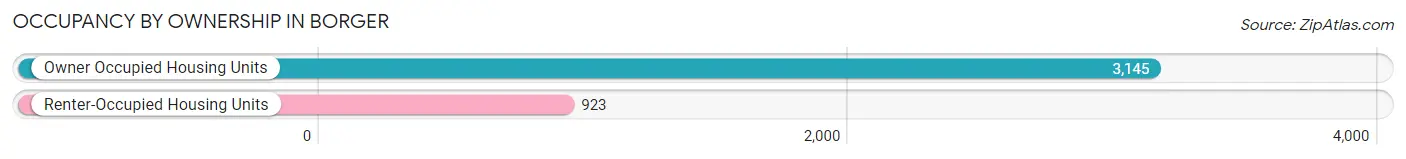
| Occupancy | # Housing Units | % Housing Units |
| Owner Occupied Housing Units | 3,145 | 77.3% |
| Renter-Occupied Housing Units | 923 | 22.7% |
| Total Occupied Housing Units | 4,068 | 100.0% |
Occupancy by Household Size in Borger
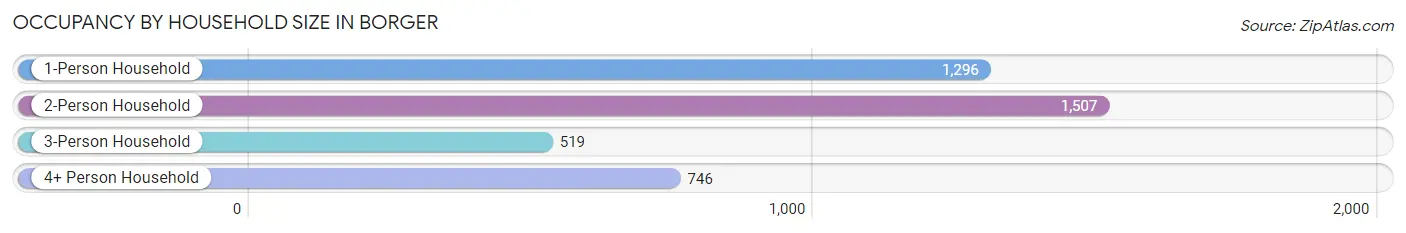
| Household Size | # Housing Units | % Housing Units |
| 1-Person Household | 1,296 | 31.9% |
| 2-Person Household | 1,507 | 37.0% |
| 3-Person Household | 519 | 12.8% |
| 4+ Person Household | 746 | 18.3% |
| Total Housing Units | 4,068 | 100.0% |
Occupancy by Ownership by Household Size in Borger
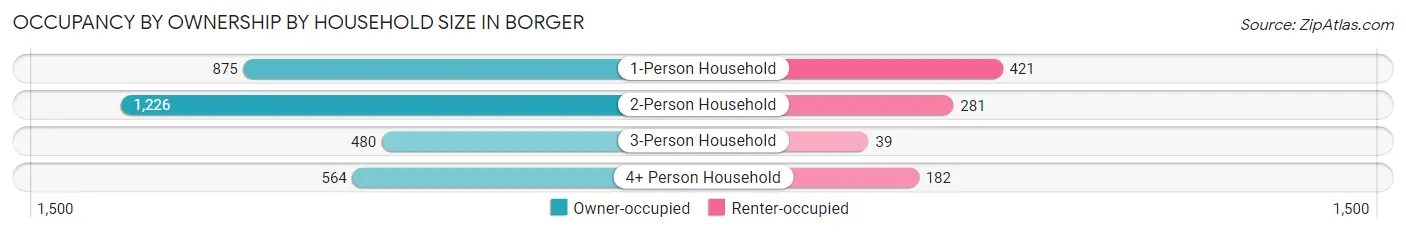
| Household Size | Owner-occupied | Renter-occupied |
| 1-Person Household | 875 (67.5%) | 421 (32.5%) |
| 2-Person Household | 1,226 (81.4%) | 281 (18.6%) |
| 3-Person Household | 480 (92.5%) | 39 (7.5%) |
| 4+ Person Household | 564 (75.6%) | 182 (24.4%) |
| Total Housing Units | 3,145 (77.3%) | 923 (22.7%) |
Occupancy by Educational Attainment in Borger
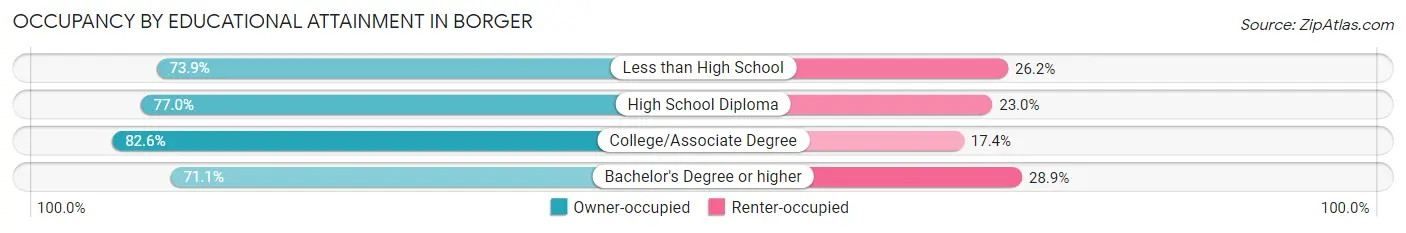
| Household Size | Owner-occupied | Renter-occupied |
| Less than High School | 483 (73.9%) | 171 (26.2%) |
| High School Diploma | 983 (77.0%) | 294 (23.0%) |
| College/Associate Degree | 1,146 (82.6%) | 241 (17.4%) |
| Bachelor's Degree or higher | 533 (71.1%) | 217 (28.9%) |
Occupancy by Age of Householder in Borger
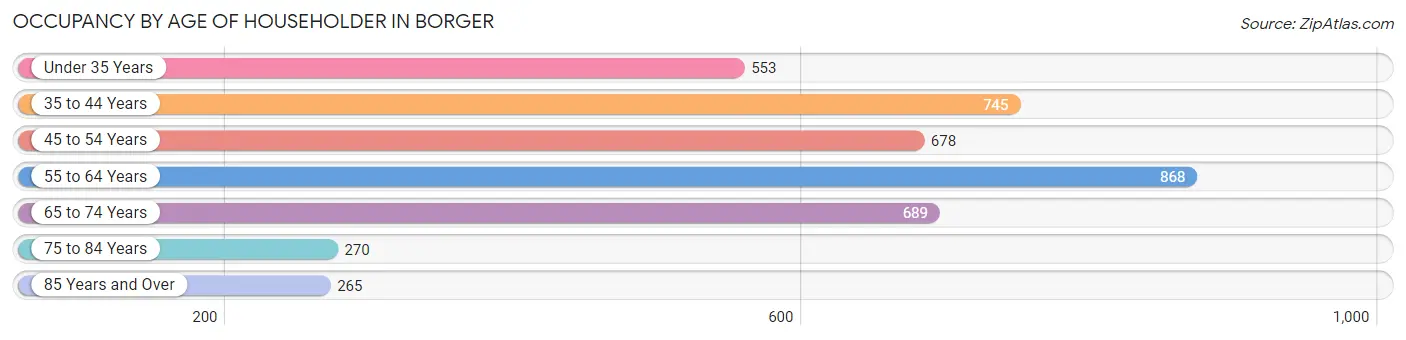
| Age Bracket | # Households | % Households |
| Under 35 Years | 553 | 13.6% |
| 35 to 44 Years | 745 | 18.3% |
| 45 to 54 Years | 678 | 16.7% |
| 55 to 64 Years | 868 | 21.3% |
| 65 to 74 Years | 689 | 16.9% |
| 75 to 84 Years | 270 | 6.6% |
| 85 Years and Over | 265 | 6.5% |
| Total | 4,068 | 100.0% |
Housing Finances in Borger
Median Income by Occupancy in Borger
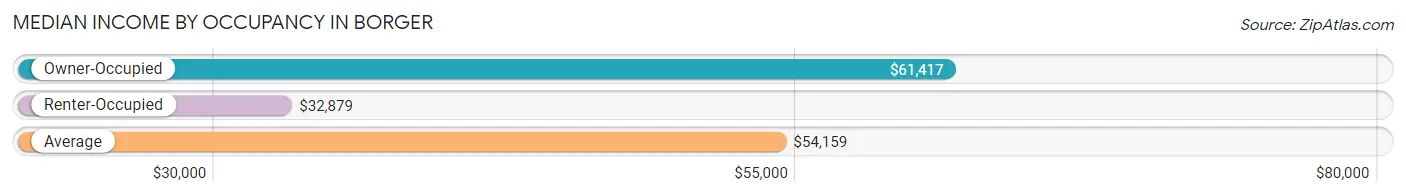
| Occupancy Type | # Households | Median Income |
| Owner-Occupied | 3,145 (77.3%) | $61,417 |
| Renter-Occupied | 923 (22.7%) | $32,879 |
| Average | 4,068 (100.0%) | $54,159 |
Occupancy by Householder Income Bracket in Borger
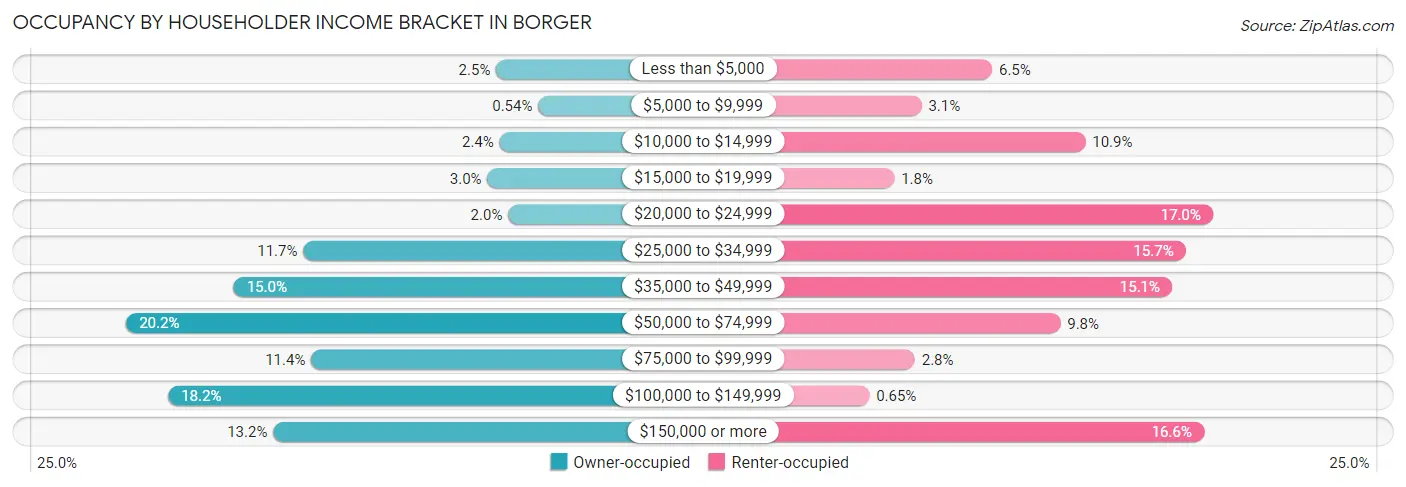
| Income Bracket | Owner-occupied | Renter-occupied |
| Less than $5,000 | 80 (2.5%) | 60 (6.5%) |
| $5,000 to $9,999 | 17 (0.5%) | 29 (3.1%) |
| $10,000 to $14,999 | 75 (2.4%) | 101 (10.9%) |
| $15,000 to $19,999 | 93 (3.0%) | 17 (1.8%) |
| $20,000 to $24,999 | 62 (2.0%) | 157 (17.0%) |
| $25,000 to $34,999 | 369 (11.7%) | 145 (15.7%) |
| $35,000 to $49,999 | 473 (15.0%) | 139 (15.1%) |
| $50,000 to $74,999 | 634 (20.2%) | 90 (9.8%) |
| $75,000 to $99,999 | 357 (11.4%) | 26 (2.8%) |
| $100,000 to $149,999 | 571 (18.2%) | 6 (0.6%) |
| $150,000 or more | 414 (13.2%) | 153 (16.6%) |
| Total | 3,145 (100.0%) | 923 (100.0%) |
Monthly Housing Cost Tiers in Borger
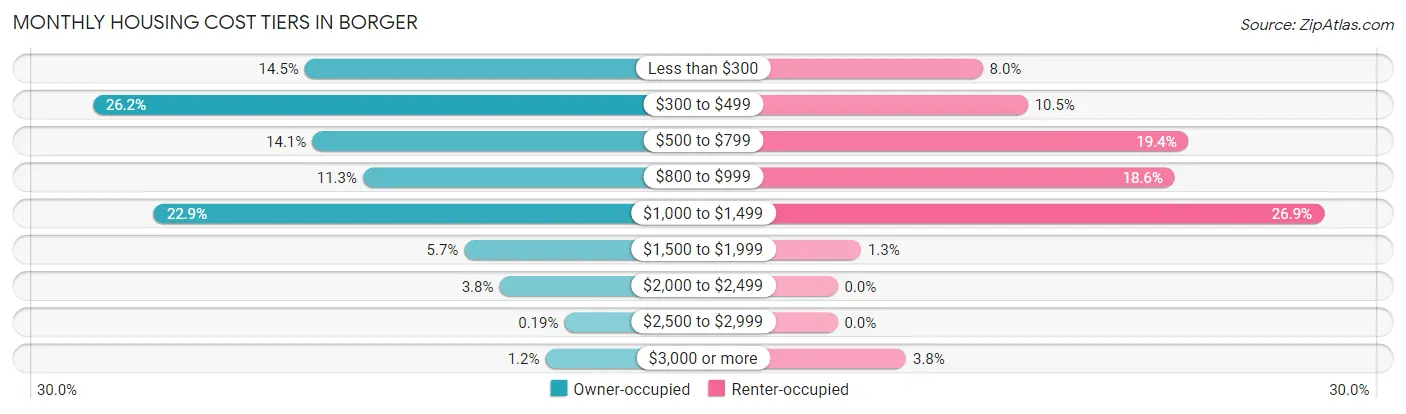
| Monthly Cost | Owner-occupied | Renter-occupied |
| Less than $300 | 457 (14.5%) | 74 (8.0%) |
| $300 to $499 | 825 (26.2%) | 97 (10.5%) |
| $500 to $799 | 444 (14.1%) | 179 (19.4%) |
| $800 to $999 | 356 (11.3%) | 172 (18.6%) |
| $1,000 to $1,499 | 719 (22.9%) | 248 (26.9%) |
| $1,500 to $1,999 | 180 (5.7%) | 12 (1.3%) |
| $2,000 to $2,499 | 119 (3.8%) | 0 (0.0%) |
| $2,500 to $2,999 | 6 (0.2%) | 0 (0.0%) |
| $3,000 or more | 39 (1.2%) | 35 (3.8%) |
| Total | 3,145 (100.0%) | 923 (100.0%) |
Physical Housing Characteristics in Borger
Housing Structures in Borger
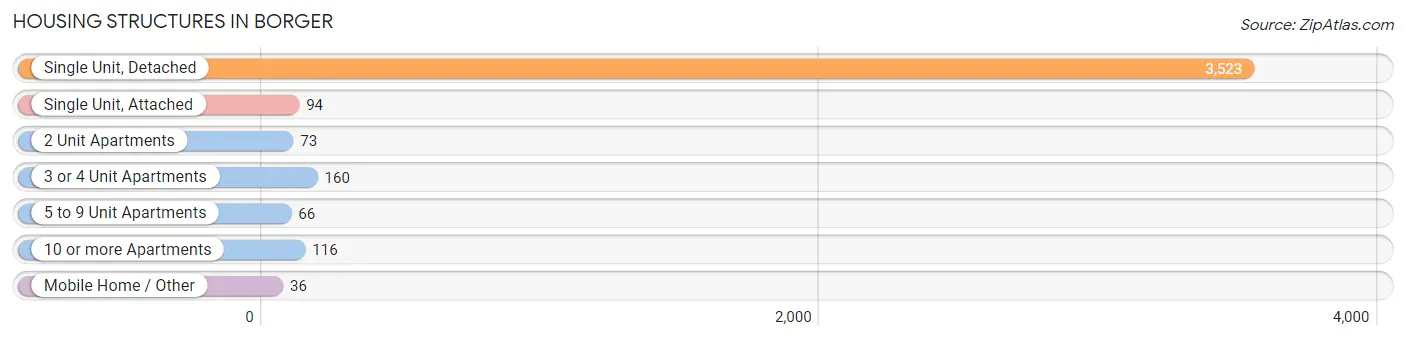
| Structure Type | # Housing Units | % Housing Units |
| Single Unit, Detached | 3,523 | 86.6% |
| Single Unit, Attached | 94 | 2.3% |
| 2 Unit Apartments | 73 | 1.8% |
| 3 or 4 Unit Apartments | 160 | 3.9% |
| 5 to 9 Unit Apartments | 66 | 1.6% |
| 10 or more Apartments | 116 | 2.9% |
| Mobile Home / Other | 36 | 0.9% |
| Total | 4,068 | 100.0% |
Housing Structures by Occupancy in Borger
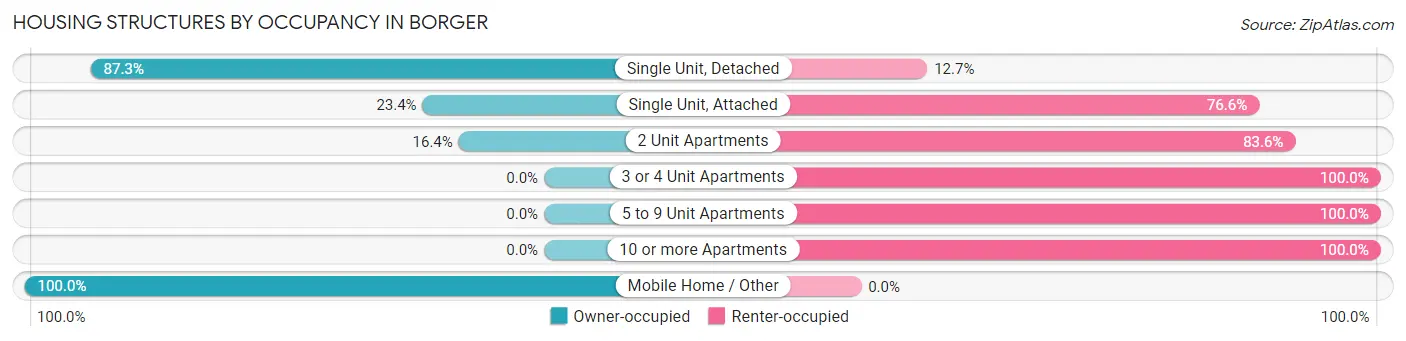
| Structure Type | Owner-occupied | Renter-occupied |
| Single Unit, Detached | 3,075 (87.3%) | 448 (12.7%) |
| Single Unit, Attached | 22 (23.4%) | 72 (76.6%) |
| 2 Unit Apartments | 12 (16.4%) | 61 (83.6%) |
| 3 or 4 Unit Apartments | 0 (0.0%) | 160 (100.0%) |
| 5 to 9 Unit Apartments | 0 (0.0%) | 66 (100.0%) |
| 10 or more Apartments | 0 (0.0%) | 116 (100.0%) |
| Mobile Home / Other | 36 (100.0%) | 0 (0.0%) |
| Total | 3,145 (77.3%) | 923 (22.7%) |
Housing Structures by Number of Rooms in Borger
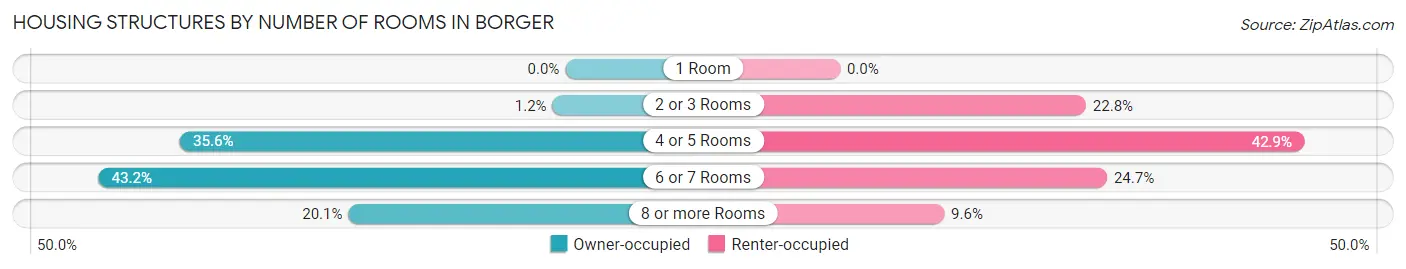
| Number of Rooms | Owner-occupied | Renter-occupied |
| 1 Room | 0 (0.0%) | 0 (0.0%) |
| 2 or 3 Rooms | 37 (1.2%) | 210 (22.8%) |
| 4 or 5 Rooms | 1,120 (35.6%) | 396 (42.9%) |
| 6 or 7 Rooms | 1,357 (43.1%) | 228 (24.7%) |
| 8 or more Rooms | 631 (20.1%) | 89 (9.6%) |
| Total | 3,145 (100.0%) | 923 (100.0%) |
Housing Structure by Heating Type in Borger
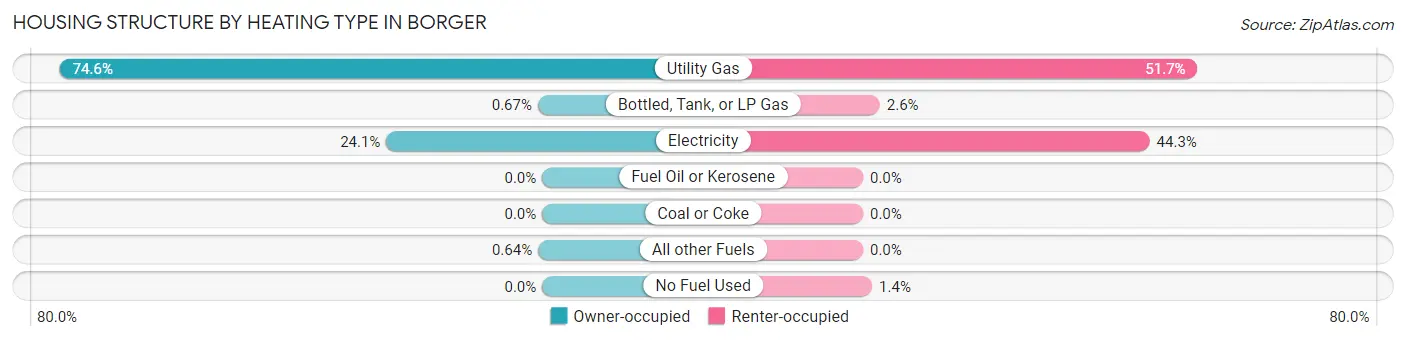
| Heating Type | Owner-occupied | Renter-occupied |
| Utility Gas | 2,346 (74.6%) | 477 (51.7%) |
| Bottled, Tank, or LP Gas | 21 (0.7%) | 24 (2.6%) |
| Electricity | 758 (24.1%) | 409 (44.3%) |
| Fuel Oil or Kerosene | 0 (0.0%) | 0 (0.0%) |
| Coal or Coke | 0 (0.0%) | 0 (0.0%) |
| All other Fuels | 20 (0.6%) | 0 (0.0%) |
| No Fuel Used | 0 (0.0%) | 13 (1.4%) |
| Total | 3,145 (100.0%) | 923 (100.0%) |
Household Vehicle Usage in Borger
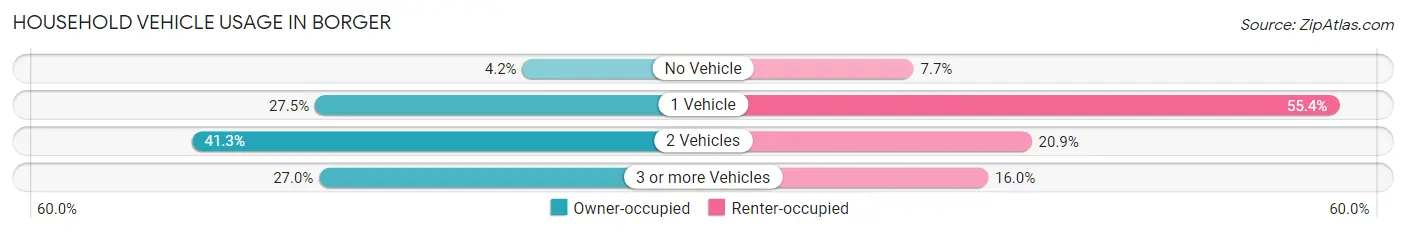
| Vehicles per Household | Owner-occupied | Renter-occupied |
| No Vehicle | 133 (4.2%) | 71 (7.7%) |
| 1 Vehicle | 864 (27.5%) | 511 (55.4%) |
| 2 Vehicles | 1,299 (41.3%) | 193 (20.9%) |
| 3 or more Vehicles | 849 (27.0%) | 148 (16.0%) |
| Total | 3,145 (100.0%) | 923 (100.0%) |
Real Estate & Mortgages in Borger
Real Estate and Mortgage Overview in Borger
| Characteristic | Without Mortgage | With Mortgage |
| Housing Units | 1,797 | 1,348 |
| Median Property Value | $79,500 | $111,400 |
| Median Household Income | $51,800 | $231 |
| Monthly Housing Costs | $391 | $39 |
| Real Estate Taxes | $1,120 | $56 |
Property Value by Mortgage Status in Borger
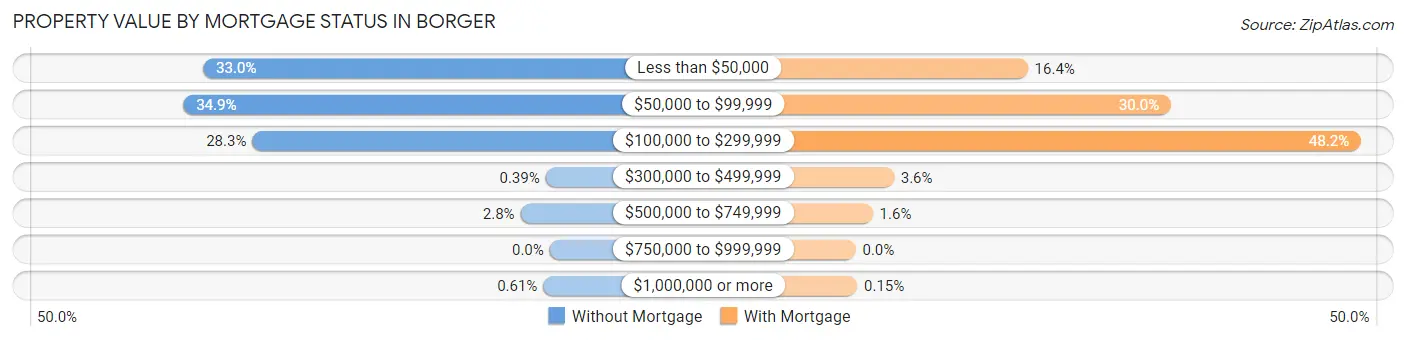
| Property Value | Without Mortgage | With Mortgage |
| Less than $50,000 | 593 (33.0%) | 221 (16.4%) |
| $50,000 to $99,999 | 627 (34.9%) | 405 (30.0%) |
| $100,000 to $299,999 | 509 (28.3%) | 649 (48.1%) |
| $300,000 to $499,999 | 7 (0.4%) | 49 (3.6%) |
| $500,000 to $749,999 | 50 (2.8%) | 22 (1.6%) |
| $750,000 to $999,999 | 0 (0.0%) | 0 (0.0%) |
| $1,000,000 or more | 11 (0.6%) | 2 (0.2%) |
| Total | 1,797 (100.0%) | 1,348 (100.0%) |
Household Income by Mortgage Status in Borger
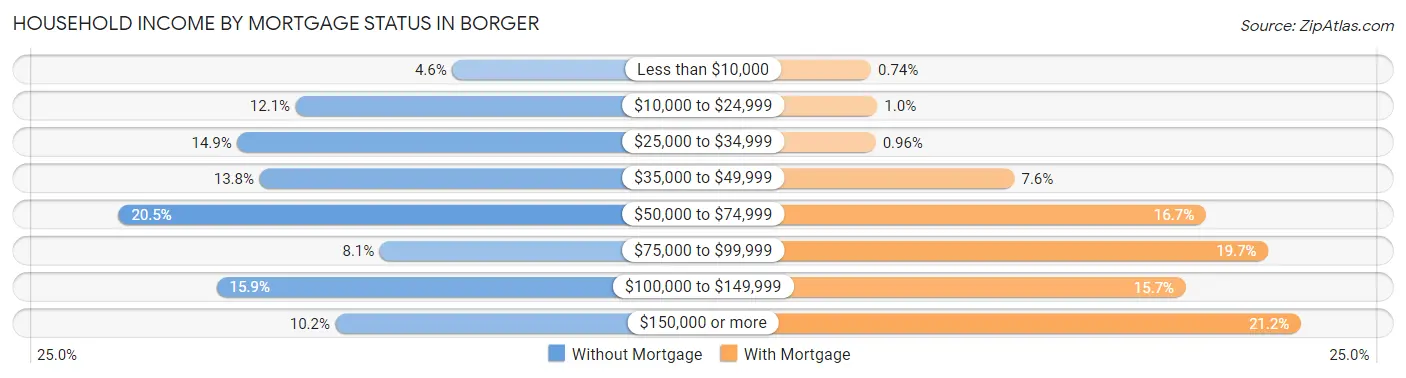
| Household Income | Without Mortgage | With Mortgage |
| Less than $10,000 | 83 (4.6%) | 10 (0.7%) |
| $10,000 to $24,999 | 217 (12.1%) | 14 (1.0%) |
| $25,000 to $34,999 | 267 (14.9%) | 13 (1.0%) |
| $35,000 to $49,999 | 248 (13.8%) | 102 (7.6%) |
| $50,000 to $74,999 | 369 (20.5%) | 225 (16.7%) |
| $75,000 to $99,999 | 145 (8.1%) | 265 (19.7%) |
| $100,000 to $149,999 | 285 (15.9%) | 212 (15.7%) |
| $150,000 or more | 183 (10.2%) | 286 (21.2%) |
| Total | 1,797 (100.0%) | 1,348 (100.0%) |
Property Value to Household Income Ratio in Borger
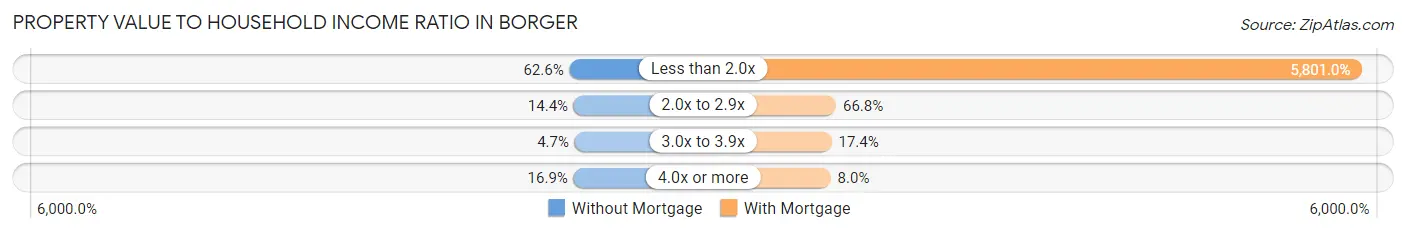
| Value-to-Income Ratio | Without Mortgage | With Mortgage |
| Less than 2.0x | 1,125 (62.6%) | 78,197 (5,801.0%) |
| 2.0x to 2.9x | 259 (14.4%) | 900 (66.8%) |
| 3.0x to 3.9x | 85 (4.7%) | 235 (17.4%) |
| 4.0x or more | 303 (16.9%) | 108 (8.0%) |
| Total | 1,797 (100.0%) | 1,348 (100.0%) |
Real Estate Taxes by Mortgage Status in Borger
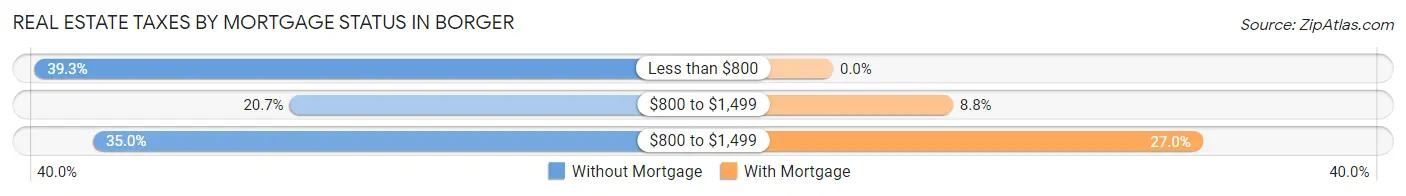
| Property Taxes | Without Mortgage | With Mortgage |
| Less than $800 | 706 (39.3%) | 0 (0.0%) |
| $800 to $1,499 | 371 (20.6%) | 118 (8.7%) |
| $800 to $1,499 | 629 (35.0%) | 364 (27.0%) |
| Total | 1,797 (100.0%) | 1,348 (100.0%) |
Health & Disability in Borger
Health Insurance Coverage by Age in Borger
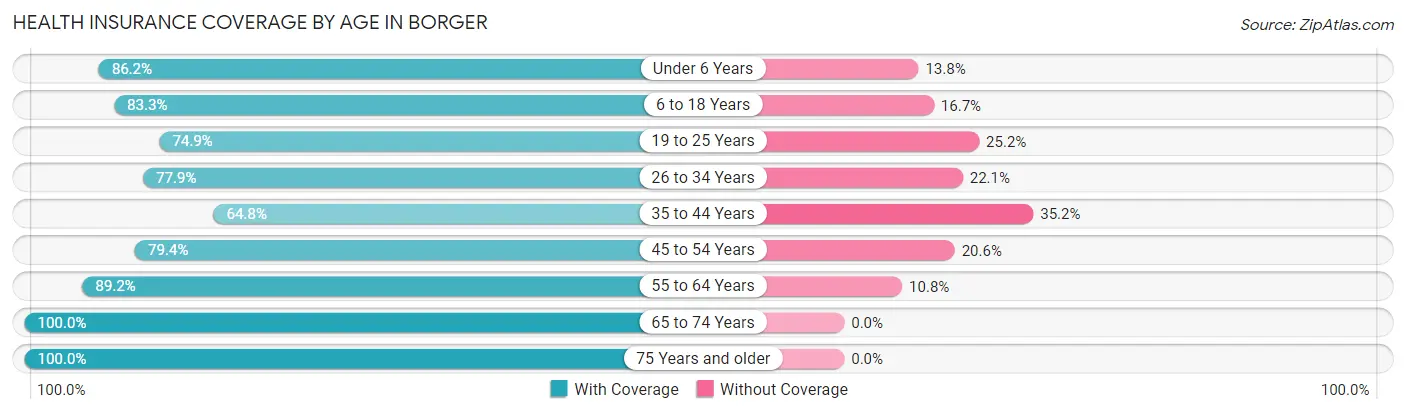
| Age Bracket | With Coverage | Without Coverage |
| Under 6 Years | 685 (86.2%) | 110 (13.8%) |
| 6 to 18 Years | 2,013 (83.3%) | 404 (16.7%) |
| 19 to 25 Years | 1,089 (74.9%) | 366 (25.2%) |
| 26 to 34 Years | 1,096 (77.9%) | 311 (22.1%) |
| 35 to 44 Years | 998 (64.8%) | 543 (35.2%) |
| 45 to 54 Years | 1,056 (79.4%) | 274 (20.6%) |
| 55 to 64 Years | 1,406 (89.2%) | 170 (10.8%) |
| 65 to 74 Years | 1,161 (100.0%) | 0 (0.0%) |
| 75 Years and older | 752 (100.0%) | 0 (0.0%) |
| Total | 10,256 (82.5%) | 2,178 (17.5%) |
Health Insurance Coverage by Citizenship Status in Borger
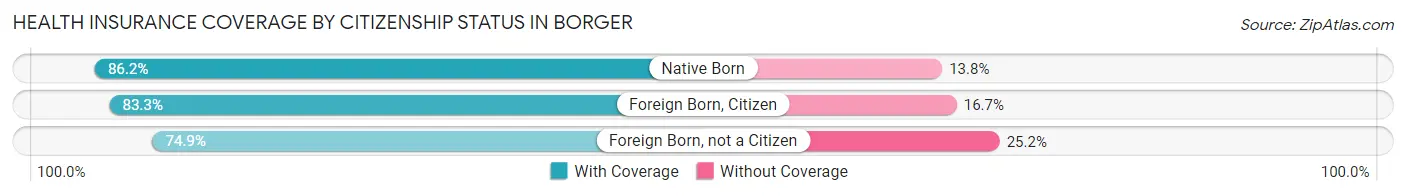
| Citizenship Status | With Coverage | Without Coverage |
| Native Born | 685 (86.2%) | 110 (13.8%) |
| Foreign Born, Citizen | 2,013 (83.3%) | 404 (16.7%) |
| Foreign Born, not a Citizen | 1,089 (74.9%) | 366 (25.2%) |
Health Insurance Coverage by Household Income in Borger
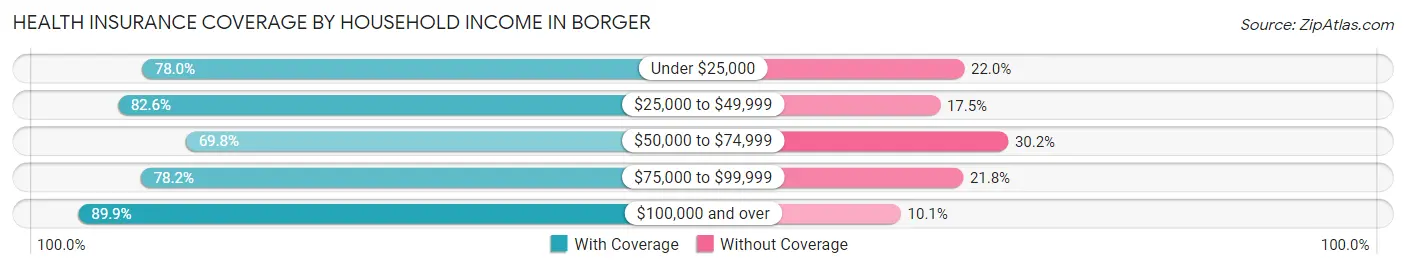
| Household Income | With Coverage | Without Coverage |
| Under $25,000 | 870 (78.0%) | 245 (22.0%) |
| $25,000 to $49,999 | 1,977 (82.6%) | 418 (17.4%) |
| $50,000 to $74,999 | 1,593 (69.8%) | 689 (30.2%) |
| $75,000 to $99,999 | 1,068 (78.2%) | 297 (21.8%) |
| $100,000 and over | 4,683 (89.9%) | 525 (10.1%) |
Public vs Private Health Insurance Coverage by Age in Borger
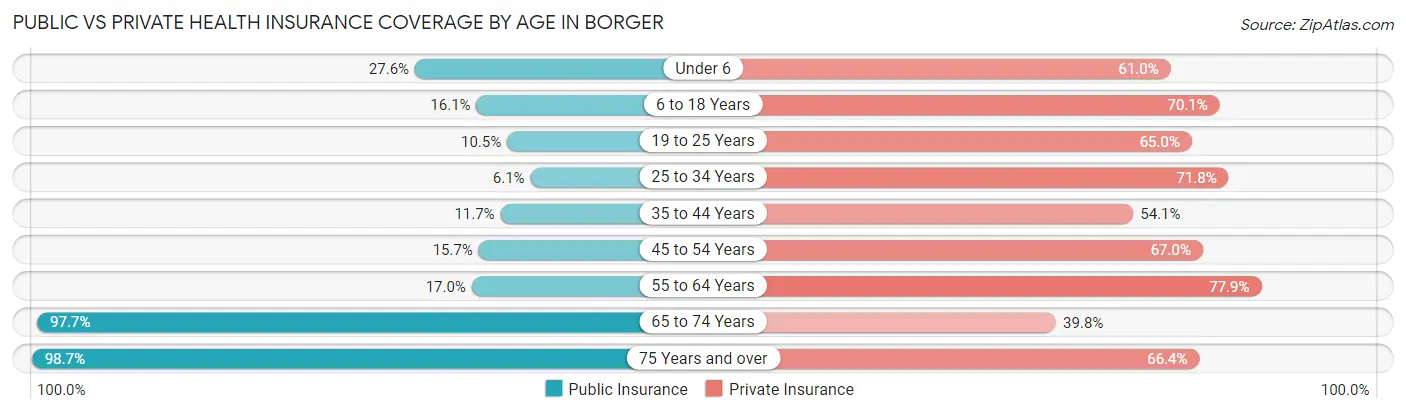
| Age Bracket | Public Insurance | Private Insurance |
| Under 6 | 219 (27.6%) | 485 (61.0%) |
| 6 to 18 Years | 390 (16.1%) | 1,695 (70.1%) |
| 19 to 25 Years | 152 (10.4%) | 945 (64.9%) |
| 25 to 34 Years | 86 (6.1%) | 1,010 (71.8%) |
| 35 to 44 Years | 180 (11.7%) | 834 (54.1%) |
| 45 to 54 Years | 209 (15.7%) | 891 (67.0%) |
| 55 to 64 Years | 268 (17.0%) | 1,227 (77.9%) |
| 65 to 74 Years | 1,134 (97.7%) | 462 (39.8%) |
| 75 Years and over | 742 (98.7%) | 499 (66.4%) |
| Total | 3,380 (27.2%) | 8,048 (64.7%) |
Disability Status by Sex by Age in Borger
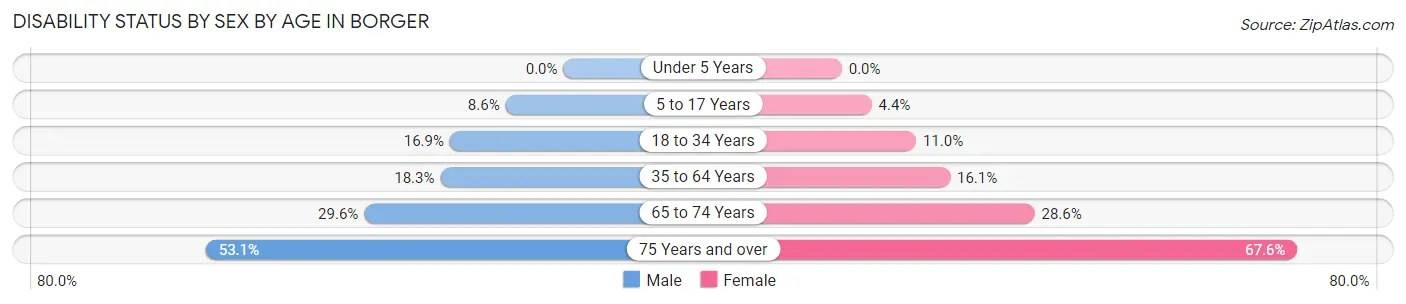
| Age Bracket | Male | Female |
| Under 5 Years | 0 (0.0%) | 0 (0.0%) |
| 5 to 17 Years | 111 (8.6%) | 48 (4.4%) |
| 18 to 34 Years | 283 (16.9%) | 144 (11.0%) |
| 35 to 64 Years | 393 (18.3%) | 369 (16.1%) |
| 65 to 74 Years | 176 (29.6%) | 162 (28.6%) |
| 75 Years and over | 163 (53.1%) | 301 (67.6%) |
Disability Class by Sex by Age in Borger
Disability Class: Hearing Difficulty
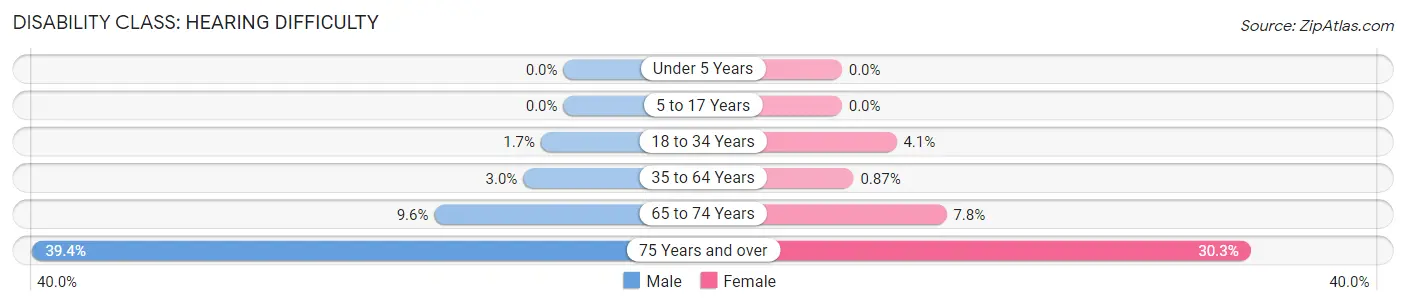
| Age Bracket | Male | Female |
| Under 5 Years | 0 (0.0%) | 0 (0.0%) |
| 5 to 17 Years | 0 (0.0%) | 0 (0.0%) |
| 18 to 34 Years | 28 (1.7%) | 53 (4.1%) |
| 35 to 64 Years | 64 (3.0%) | 20 (0.9%) |
| 65 to 74 Years | 57 (9.6%) | 44 (7.8%) |
| 75 Years and over | 121 (39.4%) | 135 (30.3%) |
Disability Class: Vision Difficulty
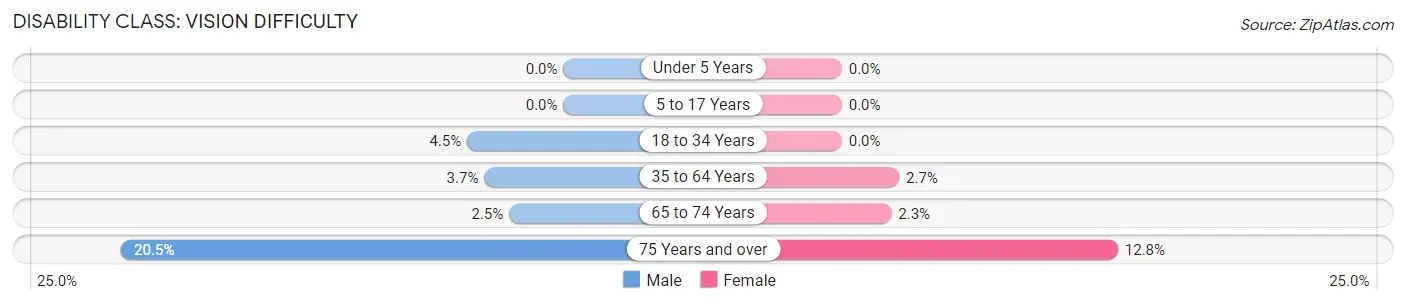
| Age Bracket | Male | Female |
| Under 5 Years | 0 (0.0%) | 0 (0.0%) |
| 5 to 17 Years | 0 (0.0%) | 0 (0.0%) |
| 18 to 34 Years | 75 (4.5%) | 0 (0.0%) |
| 35 to 64 Years | 79 (3.7%) | 61 (2.7%) |
| 65 to 74 Years | 15 (2.5%) | 13 (2.3%) |
| 75 Years and over | 63 (20.5%) | 57 (12.8%) |
Disability Class: Cognitive Difficulty
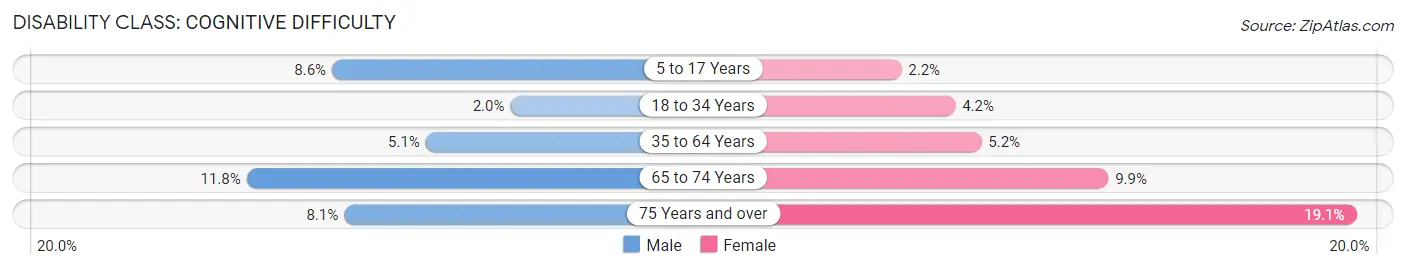
| Age Bracket | Male | Female |
| 5 to 17 Years | 111 (8.6%) | 24 (2.2%) |
| 18 to 34 Years | 33 (2.0%) | 55 (4.2%) |
| 35 to 64 Years | 110 (5.1%) | 119 (5.2%) |
| 65 to 74 Years | 70 (11.8%) | 56 (9.9%) |
| 75 Years and over | 25 (8.1%) | 85 (19.1%) |
Disability Class: Ambulatory Difficulty
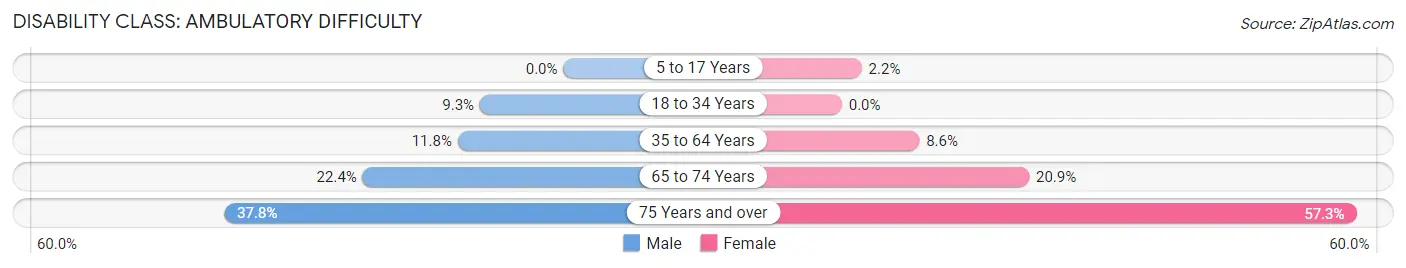
| Age Bracket | Male | Female |
| 5 to 17 Years | 0 (0.0%) | 24 (2.2%) |
| 18 to 34 Years | 156 (9.3%) | 0 (0.0%) |
| 35 to 64 Years | 253 (11.8%) | 198 (8.6%) |
| 65 to 74 Years | 133 (22.4%) | 118 (20.8%) |
| 75 Years and over | 116 (37.8%) | 255 (57.3%) |
Disability Class: Self-Care Difficulty
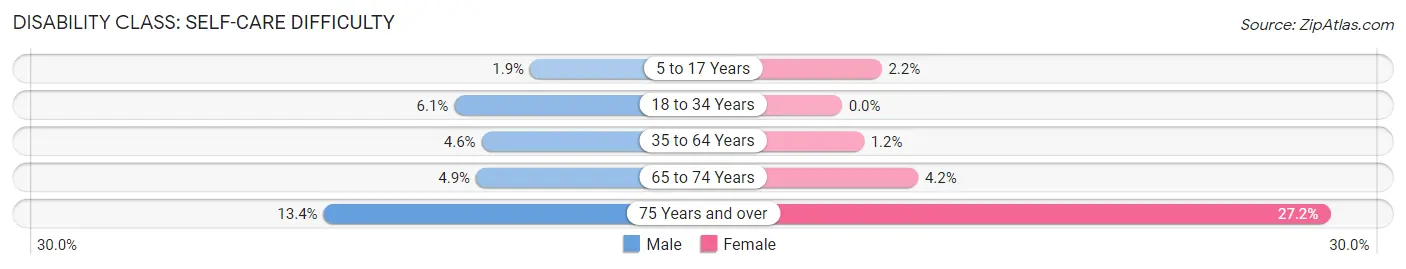
| Age Bracket | Male | Female |
| 5 to 17 Years | 24 (1.9%) | 24 (2.2%) |
| 18 to 34 Years | 102 (6.1%) | 0 (0.0%) |
| 35 to 64 Years | 98 (4.6%) | 28 (1.2%) |
| 65 to 74 Years | 29 (4.9%) | 24 (4.2%) |
| 75 Years and over | 41 (13.4%) | 121 (27.2%) |
Technology Access in Borger
Computing Device Access in Borger
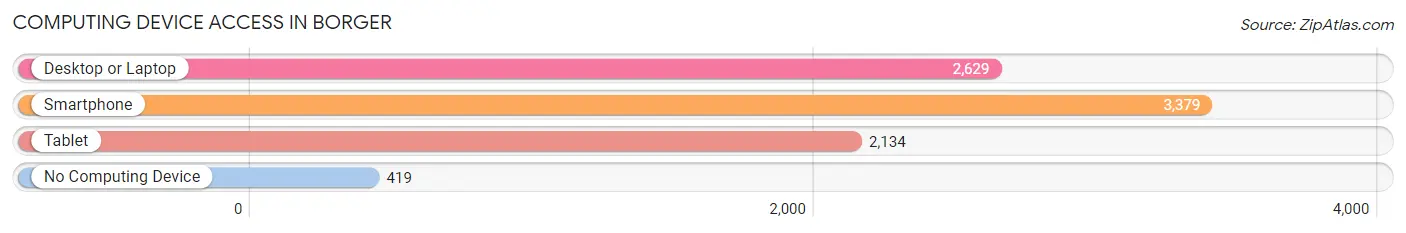
| Device Type | # Households | % Households |
| Desktop or Laptop | 2,629 | 64.6% |
| Smartphone | 3,379 | 83.1% |
| Tablet | 2,134 | 52.5% |
| No Computing Device | 419 | 10.3% |
| Total | 4,068 | 100.0% |
Internet Access in Borger
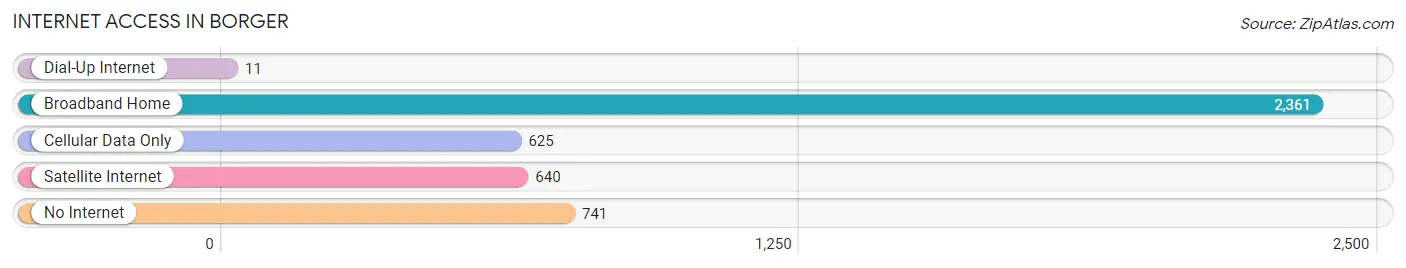
| Internet Type | # Households | % Households |
| Dial-Up Internet | 11 | 0.3% |
| Broadband Home | 2,361 | 58.0% |
| Cellular Data Only | 625 | 15.4% |
| Satellite Internet | 640 | 15.7% |
| No Internet | 741 | 18.2% |
| Total | 4,068 | 100.0% |
Borger Summary
Borger is a city located in Hutchinson County, Texas, United States. It is the county seat of Hutchinson County and is part of the Amarillo, Texas Metropolitan Statistical Area. As of the 2010 census, the city population was 13,251.
History
Borger was founded in 1926 by oilman and entrepreneur A.B. "Ace" Borger. He purchased the land from the Santa Fe Railroad and named the town after himself. The town quickly grew as a result of the oil boom in the area, and by 1930 the population had grown to over 10,000.
During World War II, Borger was home to a large military base, Camp Borger, which was used to train troops for the war effort. After the war, the base was closed and the population of Borger began to decline.
In the 1950s, Borger experienced a resurgence in population growth as the oil industry in the area continued to expand. The city was also home to a large chemical plant, which provided jobs for many of the city's residents.
Geography
Borger is located in the northern part of Hutchinson County, at the intersection of U.S. Route 287 and State Highway 152. It is about 30 miles northeast of Amarillo and about 70 miles south of the Oklahoma border.
The city is situated in the Texas Panhandle, a region of flat, semi-arid land. The landscape is characterized by rolling hills and grasslands. The Canadian River runs through the city, providing a source of water for the area.
Economy
The economy of Borger is largely based on the oil and gas industry. The city is home to several oil and gas companies, including Phillips 66, Chevron, and ConocoPhillips. The city is also home to a large chemical plant, which produces a variety of products, including fertilizers, plastics, and industrial chemicals.
In addition to the oil and gas industry, Borger is home to several other businesses, including a large retail center, a hospital, and several restaurants. The city is also home to a large number of manufacturing companies, including a steel mill and a paper mill.
Demographics
As of the 2010 census, the population of Borger was 13,251. The racial makeup of the city was 75.3% White, 1.3% African American, 0.9% Native American, 0.7% Asian, 0.1% Pacific Islander, 19.2% from other races, and 3.5% from two or more races. Hispanic or Latino of any race were 37.2% of the population.
The median household income in Borger was $37,945, and the median family income was $45,945. The per capita income for the city was $19,945. About 17.2% of families and 21.3% of the population were below the poverty line, including 28.3% of those under age 18 and 11.2% of those age 65 or over.
Common Questions
What is Per Capita Income in Borger?
Per Capita income in Borger is $29,278.
What is the Median Family Income in Borger?
Median Family Income in Borger is $70,405.
What is the Median Household income in Borger?
Median Household Income in Borger is $54,159.
What is Income or Wage Gap in Borger?
Income or Wage Gap in Borger is 45.0%.
Women in Borger earn 55.0 cents for every dollar earned by a man.
What is Family Income Deficit in Borger?
Family Income Deficit in Borger is $9,128.
Families that are below poverty line in Borger earn $9,128 less on average than the poverty threshold level.
What is Inequality or Gini Index in Borger?
Inequality or Gini Index in Borger is 0.44.
What is the Total Population of Borger?
Total Population of Borger is 12,505.
What is the Total Male Population of Borger?
Total Male Population of Borger is 6,422.
What is the Total Female Population of Borger?
Total Female Population of Borger is 6,083.
What is the Ratio of Males per 100 Females in Borger?
There are 105.57 Males per 100 Females in Borger.
What is the Ratio of Females per 100 Males in Borger?
There are 94.72 Females per 100 Males in Borger.
What is the Median Population Age in Borger?
Median Population Age in Borger is 36.2 Years.
What is the Average Family Size in Borger
Average Family Size in Borger is 3.9 People.
What is the Average Household Size in Borger
Average Household Size in Borger is 3.0 People.
How Large is the Labor Force in Borger?
There are 6,068 People in the Labor Forcein in Borger.
What is the Percentage of People in the Labor Force in Borger?
61.8% of People are in the Labor Force in Borger.
What is the Unemployment Rate in Borger?
Unemployment Rate in Borger is 3.1%.