Boerne, TX Map & Demographics
Boerne Map
Boerne Overview
$44,305
PER CAPITA INCOME
$98,142
AVG FAMILY INCOME
$82,982
AVG HOUSEHOLD INCOME
43.7%
WAGE / INCOME GAP [ % ]
56.3¢/ $1
WAGE / INCOME GAP [ $ ]
$16,863
FAMILY INCOME DEFICIT
0.46
INEQUALITY / GINI INDEX
18,475
TOTAL POPULATION
8,991
MALE POPULATION
9,484
FEMALE POPULATION
94.80
MALES / 100 FEMALES
105.48
FEMALES / 100 MALES
38.3
MEDIAN AGE
3.2
AVG FAMILY SIZE
2.6
AVG HOUSEHOLD SIZE
8,997
LABOR FORCE [ PEOPLE ]
63.0%
PERCENT IN LABOR FORCE
2.5%
UNEMPLOYMENT RATE
Boerne Area Codes
Income in Boerne
Income Overview in Boerne
Per Capita Income in Boerne is $44,305, while median incomes of families and households are $98,142 and $82,982 respectively.
| Characteristic | Number | Measure |
| Per Capita Income | 18,475 | $44,305 |
| Median Family Income | 4,706 | $98,142 |
| Mean Family Income | 4,706 | $136,792 |
| Median Household Income | 6,785 | $82,982 |
| Mean Household Income | 6,785 | $117,774 |
| Income Deficit | 4,706 | $16,863 |
| Wage / Income Gap (%) | 18,475 | 43.73% |
| Wage / Income Gap ($) | 18,475 | 56.27¢ per $1 |
| Gini / Inequality Index | 18,475 | 0.46 |
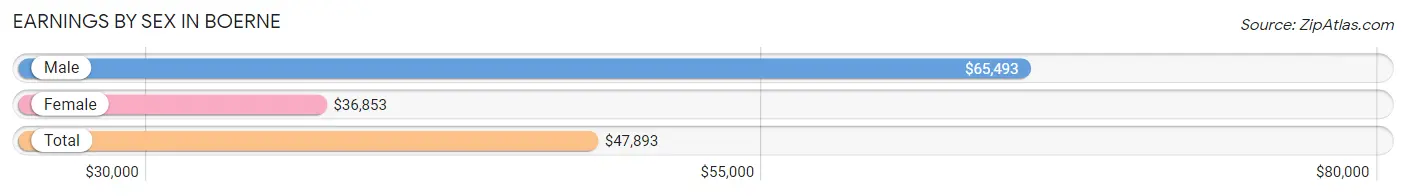
Earnings by Sex in Boerne
Average Earnings in Boerne are $47,893, $65,493 for men and $36,853 for women, a difference of 43.7%.
| Sex | Number | Average Earnings |
| Male | 4,845 (50.6%) | $65,493 |
| Female | 4,727 (49.4%) | $36,853 |
| Total | 9,572 (100.0%) | $47,893 |
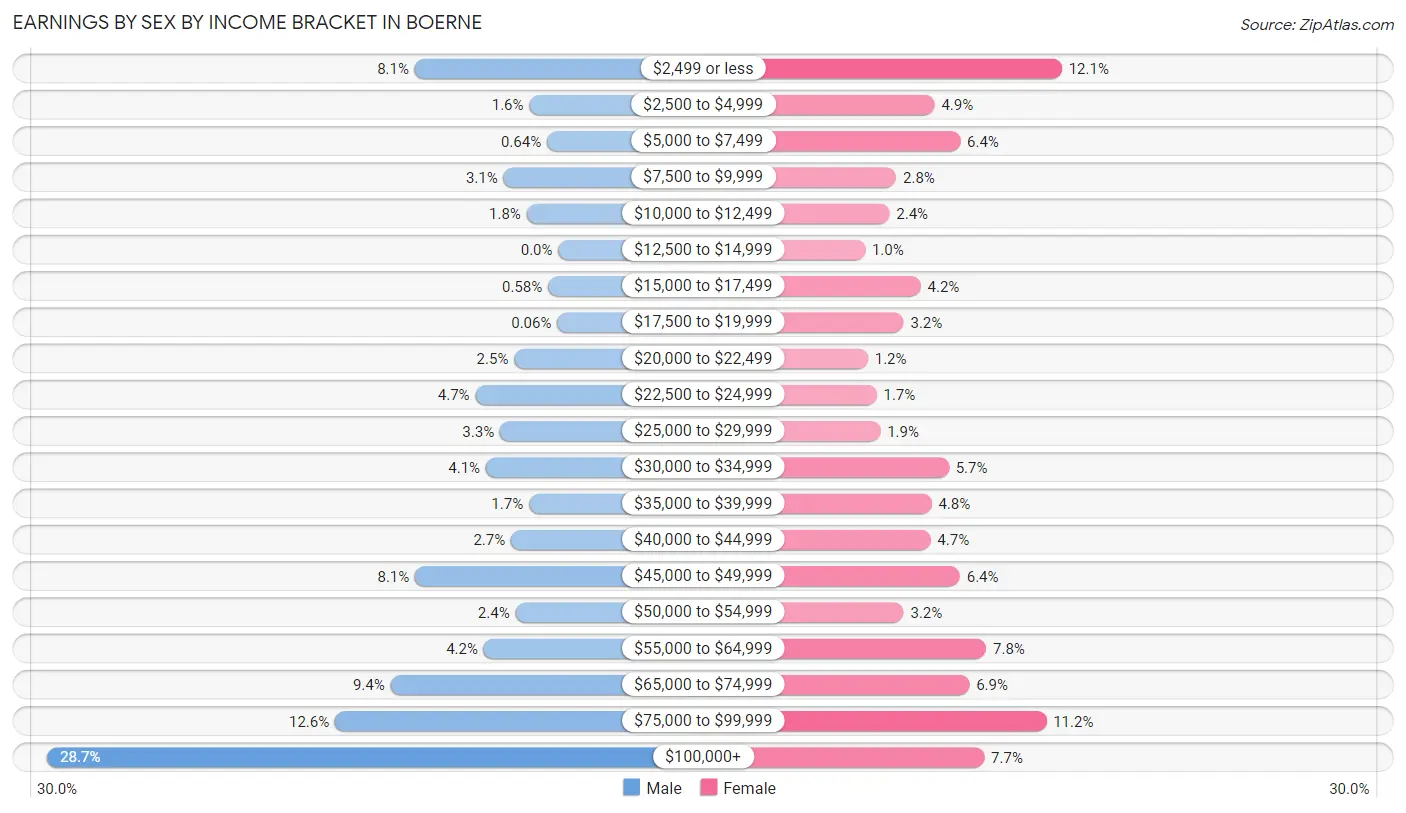
Earnings by Sex by Income Bracket in Boerne
The most common earnings brackets in Boerne are $100,000+ for men (1,392 | 28.7%) and $2,499 or less for women (571 | 12.1%).
| Income | Male | Female |
| $2,499 or less | 391 (8.1%) | 571 (12.1%) |
| $2,500 to $4,999 | 79 (1.6%) | 233 (4.9%) |
| $5,000 to $7,499 | 31 (0.6%) | 301 (6.4%) |
| $7,500 to $9,999 | 149 (3.1%) | 131 (2.8%) |
| $10,000 to $12,499 | 86 (1.8%) | 113 (2.4%) |
| $12,500 to $14,999 | 0 (0.0%) | 48 (1.0%) |
| $15,000 to $17,499 | 28 (0.6%) | 196 (4.2%) |
| $17,500 to $19,999 | 3 (0.1%) | 151 (3.2%) |
| $20,000 to $22,499 | 120 (2.5%) | 56 (1.2%) |
| $22,500 to $24,999 | 226 (4.7%) | 79 (1.7%) |
| $25,000 to $29,999 | 159 (3.3%) | 89 (1.9%) |
| $30,000 to $34,999 | 197 (4.1%) | 271 (5.7%) |
| $35,000 to $39,999 | 80 (1.7%) | 225 (4.8%) |
| $40,000 to $44,999 | 129 (2.7%) | 222 (4.7%) |
| $45,000 to $49,999 | 390 (8.1%) | 300 (6.4%) |
| $50,000 to $54,999 | 117 (2.4%) | 151 (3.2%) |
| $55,000 to $64,999 | 203 (4.2%) | 370 (7.8%) |
| $65,000 to $74,999 | 457 (9.4%) | 325 (6.9%) |
| $75,000 to $99,999 | 608 (12.6%) | 530 (11.2%) |
| $100,000+ | 1,392 (28.7%) | 365 (7.7%) |
| Total | 4,845 (100.0%) | 4,727 (100.0%) |
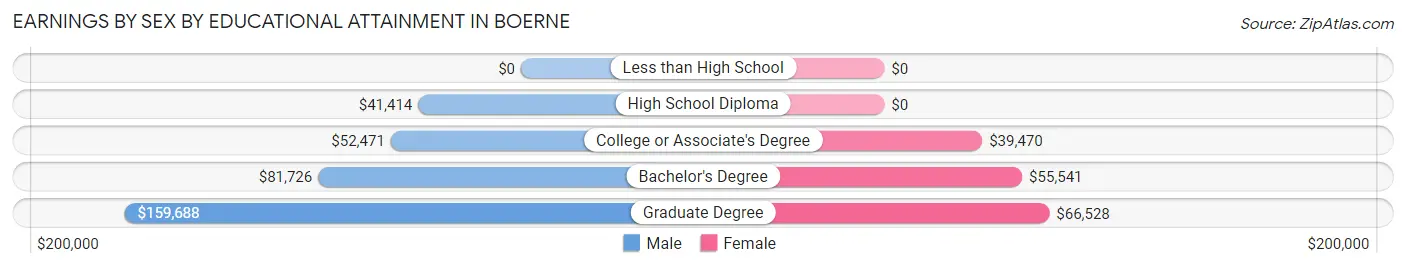
Earnings by Sex by Educational Attainment in Boerne
Average earnings in Boerne are $70,556 for men and $42,667 for women, a difference of 39.5%. Men with an educational attainment of graduate degree enjoy the highest average annual earnings of $159,688, while those with high school diploma education earn the least with $41,414. Women with an educational attainment of graduate degree earn the most with the average annual earnings of $66,528, while those with college or associate's degree education have the smallest earnings of $39,470.
| Educational Attainment | Male Income | Female Income |
| Less than High School | - | - |
| High School Diploma | $41,414 | $0 |
| College or Associate's Degree | $52,471 | $39,470 |
| Bachelor's Degree | $81,726 | $55,541 |
| Graduate Degree | $159,688 | $66,528 |
| Total | $70,556 | $42,667 |
Family Income in Boerne
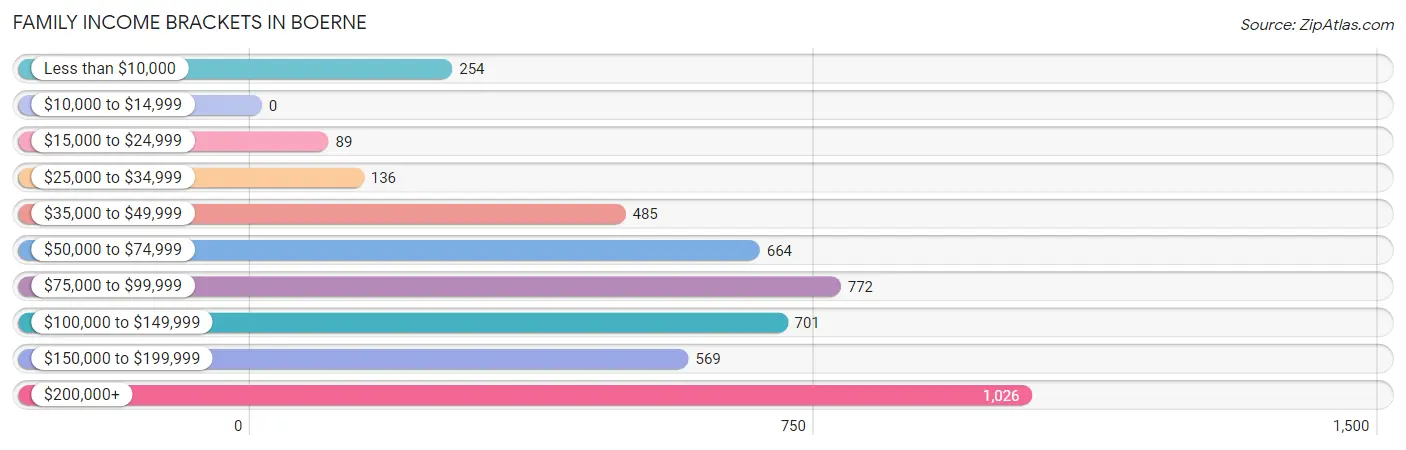
Family Income Brackets in Boerne
According to the Boerne family income data, there are 1,026 families falling into the $200,000+ income range, which is the most common income bracket and makes up 21.8% of all families.
| Income Bracket | # Families | % Families |
| Less than $10,000 | 254 | 5.4% |
| $10,000 to $14,999 | 0 | 0.0% |
| $15,000 to $24,999 | 89 | 1.9% |
| $25,000 to $34,999 | 136 | 2.9% |
| $35,000 to $49,999 | 485 | 10.3% |
| $50,000 to $74,999 | 664 | 14.1% |
| $75,000 to $99,999 | 772 | 16.4% |
| $100,000 to $149,999 | 701 | 14.9% |
| $150,000 to $199,999 | 569 | 12.1% |
| $200,000+ | 1,026 | 21.8% |
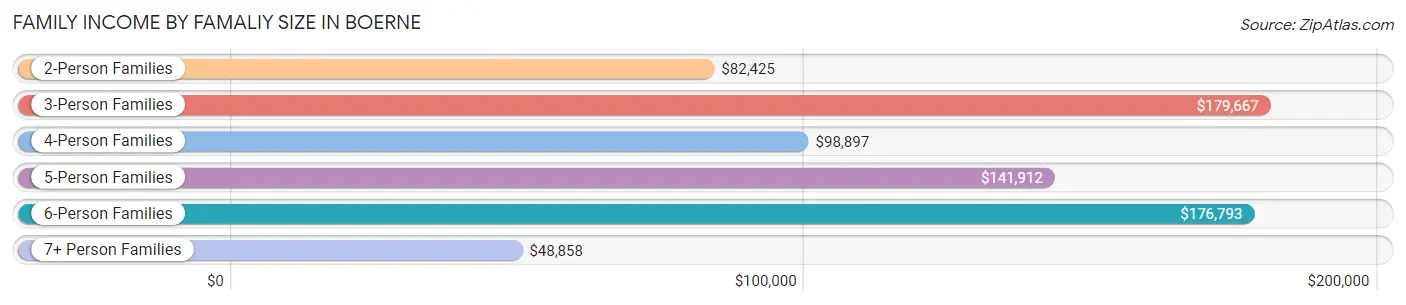
Family Income by Famaliy Size in Boerne
3-person families (710 | 15.1%) account for the highest median family income in Boerne with $179,667 per family, while 3-person families (710 | 15.1%) have the highest median income of $59,889 per family member.
| Income Bracket | # Families | Median Income |
| 2-Person Families | 2,231 (47.4%) | $82,425 |
| 3-Person Families | 710 (15.1%) | $179,667 |
| 4-Person Families | 1,030 (21.9%) | $98,897 |
| 5-Person Families | 438 (9.3%) | $141,912 |
| 6-Person Families | 160 (3.4%) | $176,793 |
| 7+ Person Families | 137 (2.9%) | $48,858 |
| Total | 4,706 (100.0%) | $98,142 |
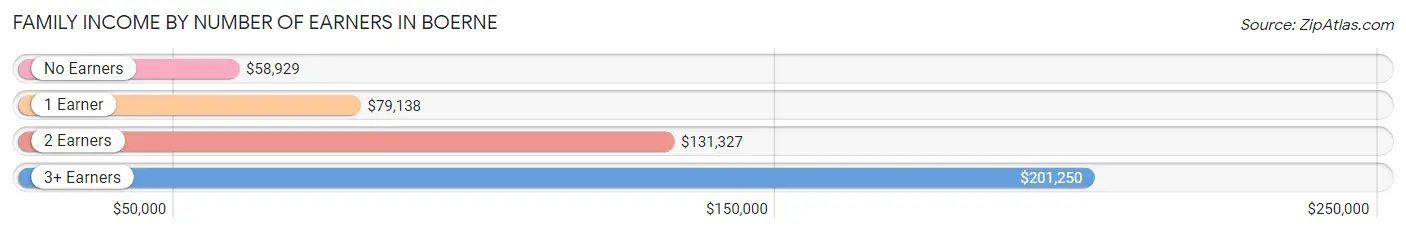
Family Income by Number of Earners in Boerne
The median family income in Boerne is $98,142, with families comprising 3+ earners (514) having the highest median family income of $201,250, while families with no earners (662) have the lowest median family income of $58,929, accounting for 10.9% and 14.1% of families, respectively.
| Number of Earners | # Families | Median Income |
| No Earners | 662 (14.1%) | $58,929 |
| 1 Earner | 1,358 (28.9%) | $79,138 |
| 2 Earners | 2,172 (46.2%) | $131,327 |
| 3+ Earners | 514 (10.9%) | $201,250 |
| Total | 4,706 (100.0%) | $98,142 |
Household Income in Boerne
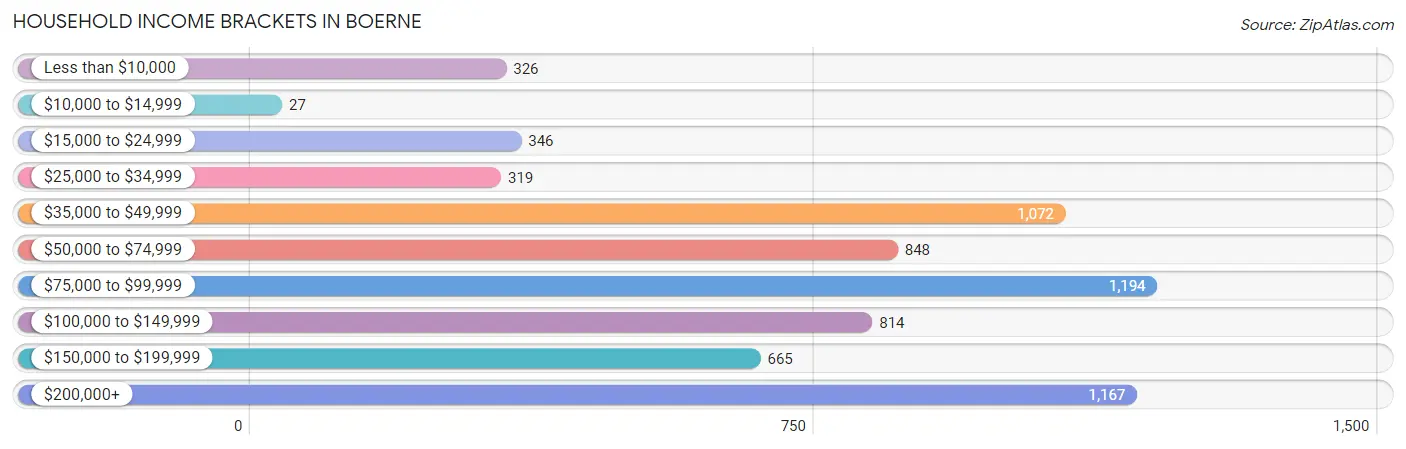
Household Income Brackets in Boerne
With 1,194 households falling in the category, the $75,000 to $99,999 income range is the most frequent in Boerne, accounting for 17.6% of all households. In contrast, only 27 households (0.4%) fall into the $10,000 to $14,999 income bracket, making it the least populous group.
| Income Bracket | # Households | % Households |
| Less than $10,000 | 326 | 4.8% |
| $10,000 to $14,999 | 27 | 0.4% |
| $15,000 to $24,999 | 346 | 5.1% |
| $25,000 to $34,999 | 319 | 4.7% |
| $35,000 to $49,999 | 1,072 | 15.8% |
| $50,000 to $74,999 | 848 | 12.5% |
| $75,000 to $99,999 | 1,194 | 17.6% |
| $100,000 to $149,999 | 814 | 12.0% |
| $150,000 to $199,999 | 665 | 9.8% |
| $200,000+ | 1,167 | 17.2% |
Household Income by Householder Age in Boerne
The median household income in Boerne is $82,982, with the highest median household income of $116,769 found in the 45 to 64 years age bracket for the primary householder. A total of 2,131 households (31.4%) fall into this category. Meanwhile, the 15 to 24 years age bracket for the primary householder has the lowest median household income of $0, with 68 households (1.0%) in this group.
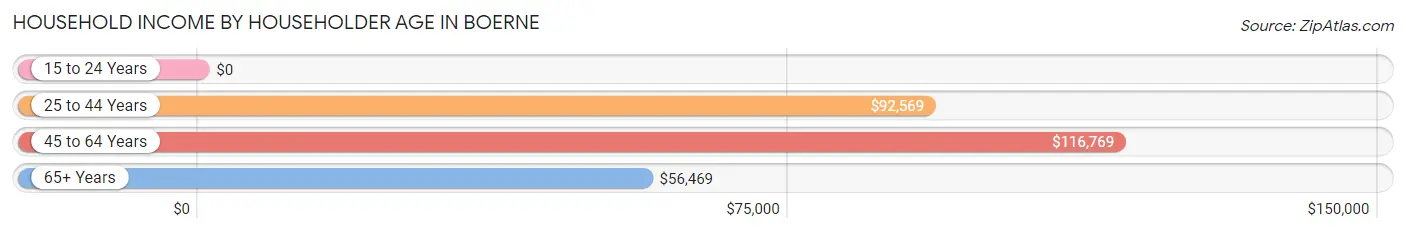
| Income Bracket | # Households | Median Income |
| 15 to 24 Years | 68 (1.0%) | $0 |
| 25 to 44 Years | 2,580 (38.0%) | $92,569 |
| 45 to 64 Years | 2,131 (31.4%) | $116,769 |
| 65+ Years | 2,006 (29.6%) | $56,469 |
| Total | 6,785 (100.0%) | $82,982 |
Poverty in Boerne
Income Below Poverty by Sex and Age in Boerne
With 6.9% poverty level for males and 8.3% for females among the residents of Boerne, 5 year old males and 15 year old females are the most vulnerable to poverty, with 64 males (49.2%) and 56 females (88.9%) in their respective age groups living below the poverty level.
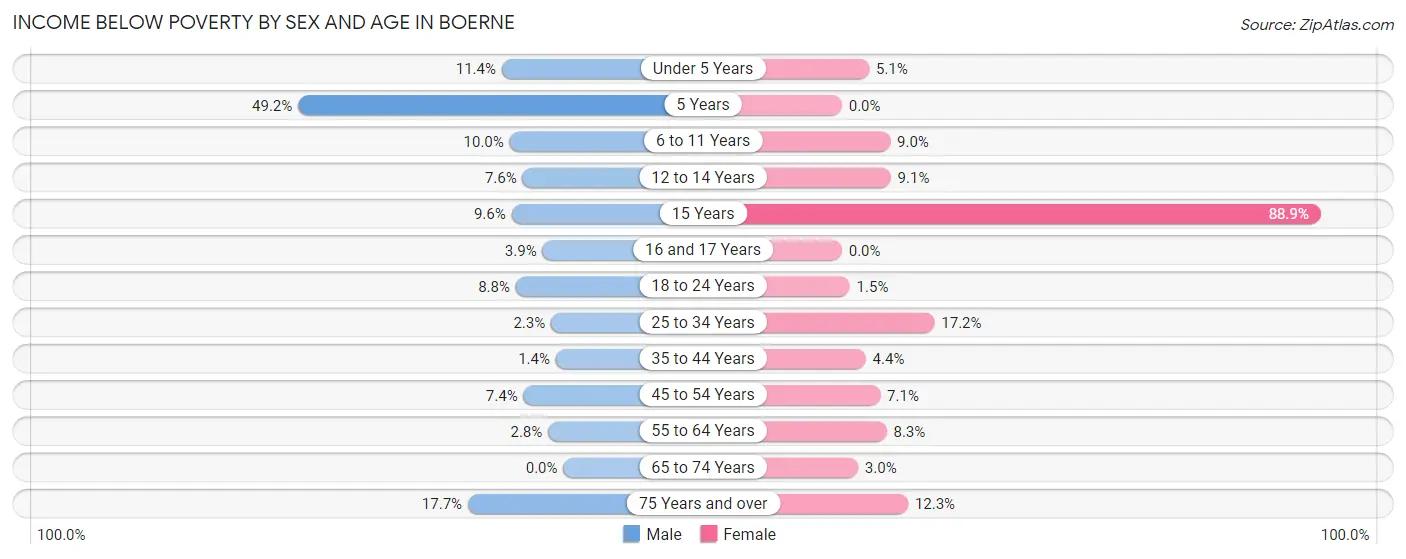
| Age Bracket | Male | Female |
| Under 5 Years | 81 (11.4%) | 20 (5.1%) |
| 5 Years | 64 (49.2%) | 0 (0.0%) |
| 6 to 11 Years | 69 (10.0%) | 79 (9.0%) |
| 12 to 14 Years | 40 (7.6%) | 36 (9.1%) |
| 15 Years | 20 (9.6%) | 56 (88.9%) |
| 16 and 17 Years | 14 (3.9%) | 0 (0.0%) |
| 18 to 24 Years | 56 (8.8%) | 11 (1.5%) |
| 25 to 34 Years | 22 (2.3%) | 206 (17.2%) |
| 35 to 44 Years | 18 (1.4%) | 68 (4.4%) |
| 45 to 54 Years | 91 (7.4%) | 65 (7.1%) |
| 55 to 64 Years | 23 (2.8%) | 84 (8.3%) |
| 65 to 74 Years | 0 (0.0%) | 25 (3.0%) |
| 75 Years and over | 109 (17.7%) | 114 (12.3%) |
| Total | 607 (6.9%) | 764 (8.3%) |
Income Above Poverty by Sex and Age in Boerne
According to the poverty statistics in Boerne, males aged 65 to 74 years and females aged 5 years are the age groups that are most secure financially, with 100.0% of males and 100.0% of females in these age groups living above the poverty line.
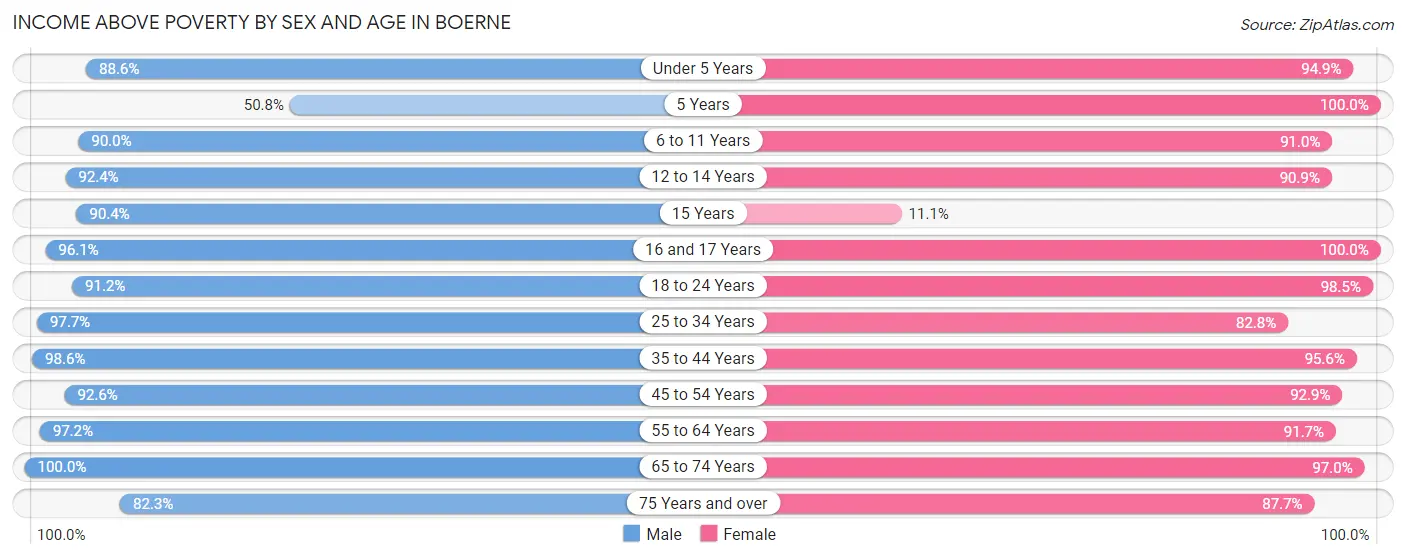
| Age Bracket | Male | Female |
| Under 5 Years | 628 (88.6%) | 375 (94.9%) |
| 5 Years | 66 (50.8%) | 91 (100.0%) |
| 6 to 11 Years | 623 (90.0%) | 802 (91.0%) |
| 12 to 14 Years | 488 (92.4%) | 361 (90.9%) |
| 15 Years | 188 (90.4%) | 7 (11.1%) |
| 16 and 17 Years | 348 (96.1%) | 169 (100.0%) |
| 18 to 24 Years | 578 (91.2%) | 741 (98.5%) |
| 25 to 34 Years | 937 (97.7%) | 993 (82.8%) |
| 35 to 44 Years | 1,262 (98.6%) | 1,467 (95.6%) |
| 45 to 54 Years | 1,139 (92.6%) | 848 (92.9%) |
| 55 to 64 Years | 789 (97.2%) | 928 (91.7%) |
| 65 to 74 Years | 606 (100.0%) | 812 (97.0%) |
| 75 Years and over | 506 (82.3%) | 814 (87.7%) |
| Total | 8,158 (93.1%) | 8,408 (91.7%) |
Income Below Poverty Among Married-Couple Families in Boerne
The poverty statistics for married-couple families in Boerne show that 4.2% or 156 of the total 3,733 families live below the poverty line. Families with 3 or 4 children have the highest poverty rate of 9.7%, comprising of 43 families. On the other hand, families with 5 or more children have the lowest poverty rate of 0.0%, which includes 0 families.
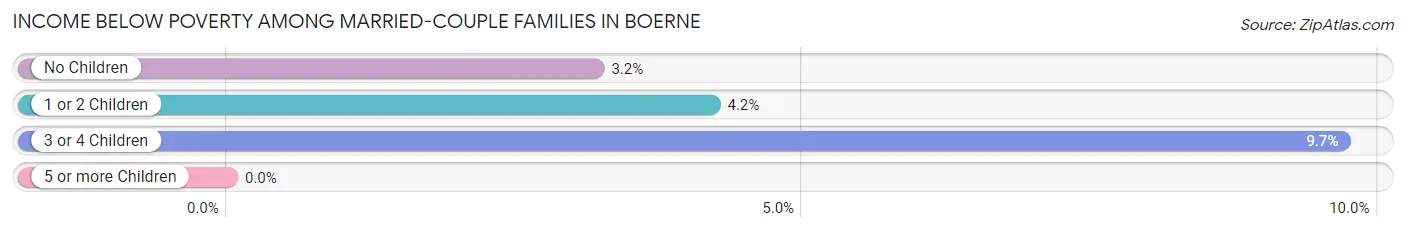
| Children | Above Poverty | Below Poverty |
| No Children | 1,945 (96.8%) | 64 (3.2%) |
| 1 or 2 Children | 1,119 (95.8%) | 49 (4.2%) |
| 3 or 4 Children | 401 (90.3%) | 43 (9.7%) |
| 5 or more Children | 112 (100.0%) | 0 (0.0%) |
| Total | 3,577 (95.8%) | 156 (4.2%) |
Income Below Poverty Among Single-Parent Households in Boerne
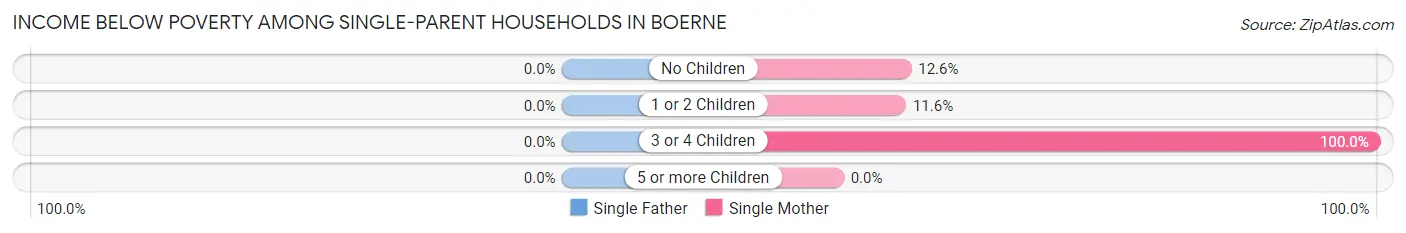
| Children | Single Father | Single Mother |
| No Children | 0 (0.0%) | 18 (12.6%) |
| 1 or 2 Children | 0 (0.0%) | 54 (11.6%) |
| 3 or 4 Children | 0 (0.0%) | 91 (100.0%) |
| 5 or more Children | 0 (0.0%) | 0 (0.0%) |
| Total | 0 (0.0%) | 163 (23.3%) |
Income Below Poverty Among Married-Couple vs Single-Parent Households in Boerne
The poverty data for Boerne shows that 156 of the married-couple family households (4.2%) and 163 of the single-parent households (16.8%) are living below the poverty level. Within the married-couple family households, those with 3 or 4 children have the highest poverty rate, with 43 households (9.7%) falling below the poverty line. Among the single-parent households, those with 3 or 4 children have the highest poverty rate, with 91 household (100.0%) living below poverty.
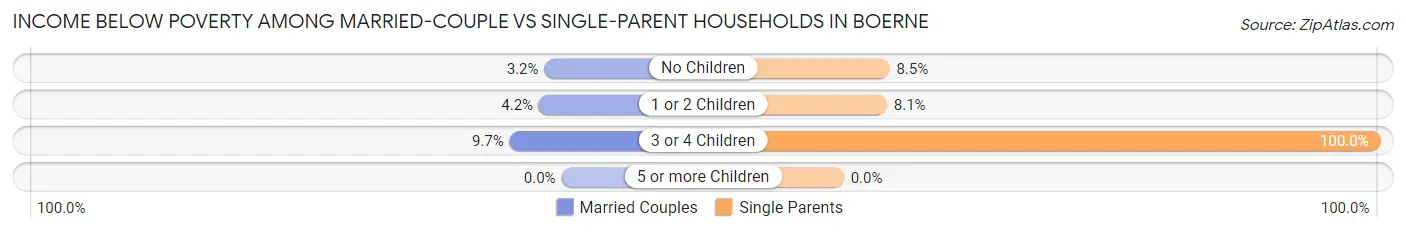
| Children | Married-Couple Families | Single-Parent Households |
| No Children | 64 (3.2%) | 18 (8.5%) |
| 1 or 2 Children | 49 (4.2%) | 54 (8.1%) |
| 3 or 4 Children | 43 (9.7%) | 91 (100.0%) |
| 5 or more Children | 0 (0.0%) | 0 (0.0%) |
| Total | 156 (4.2%) | 163 (16.8%) |
Race in Boerne
The most populous races in Boerne are White / Caucasian (14,741 | 79.8%), Hispanic or Latino (5,603 | 30.3%), and Two or more Races (2,272 | 12.3%).
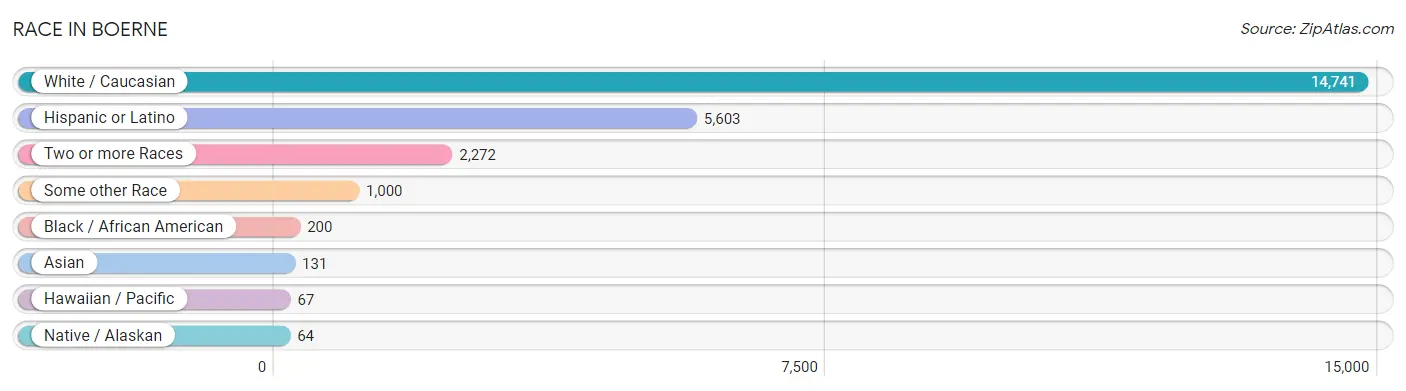
| Race | # Population | % Population |
| Asian | 131 | 0.7% |
| Black / African American | 200 | 1.1% |
| Hawaiian / Pacific | 67 | 0.4% |
| Hispanic or Latino | 5,603 | 30.3% |
| Native / Alaskan | 64 | 0.4% |
| White / Caucasian | 14,741 | 79.8% |
| Two or more Races | 2,272 | 12.3% |
| Some other Race | 1,000 | 5.4% |
| Total | 18,475 | 100.0% |
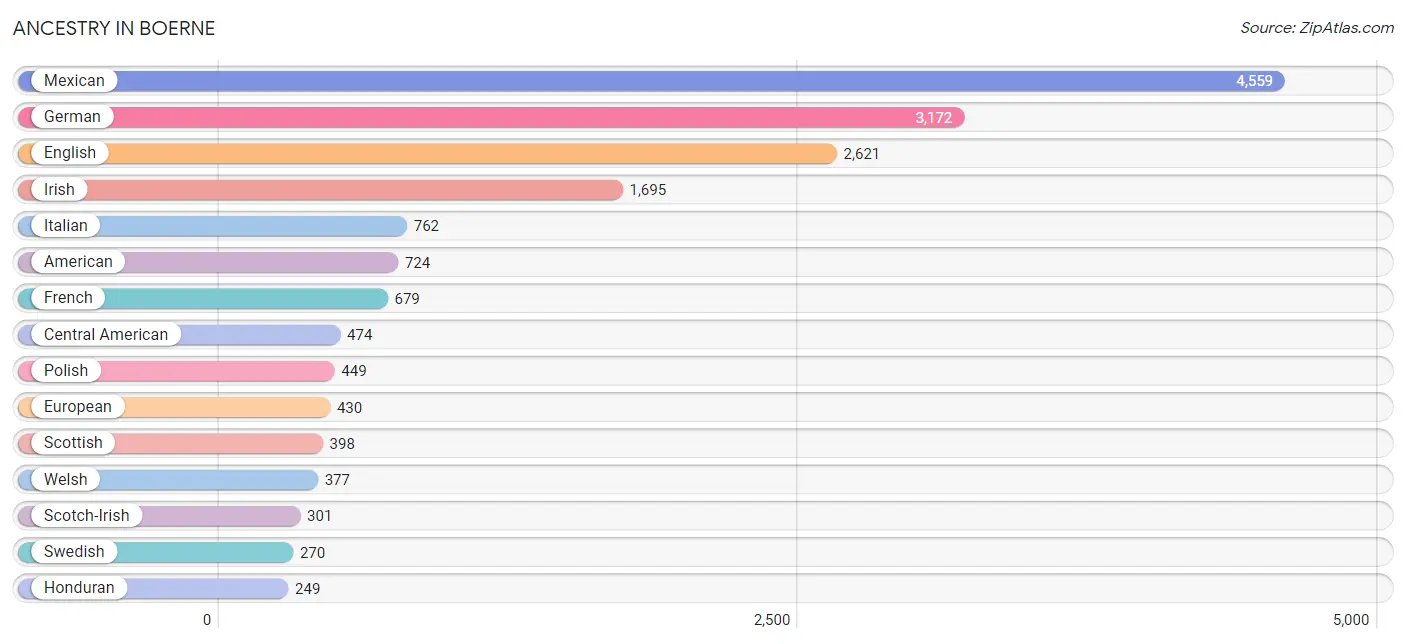
Ancestry in Boerne
The most populous ancestries reported in Boerne are Mexican (4,559 | 24.7%), German (3,172 | 17.2%), English (2,621 | 14.2%), Irish (1,695 | 9.2%), and Italian (762 | 4.1%), together accounting for 69.3% of all Boerne residents.
| Ancestry | # Population | % Population |
| African | 3 | 0.0% |
| American | 724 | 3.9% |
| Arab | 213 | 1.1% |
| Argentinean | 26 | 0.1% |
| Armenian | 12 | 0.1% |
| Belgian | 27 | 0.2% |
| British | 199 | 1.1% |
| Bulgarian | 17 | 0.1% |
| Burmese | 34 | 0.2% |
| Celtic | 54 | 0.3% |
| Central American | 474 | 2.6% |
| Central American Indian | 64 | 0.4% |
| Cherokee | 139 | 0.7% |
| Choctaw | 6 | 0.0% |
| Colombian | 8 | 0.0% |
| Croatian | 17 | 0.1% |
| Cuban | 53 | 0.3% |
| Czech | 118 | 0.6% |
| Czechoslovakian | 106 | 0.6% |
| Danish | 18 | 0.1% |
| Dutch | 96 | 0.5% |
| Eastern European | 187 | 1.0% |
| Ecuadorian | 31 | 0.2% |
| Egyptian | 49 | 0.3% |
| English | 2,621 | 14.2% |
| European | 430 | 2.3% |
| Finnish | 6 | 0.0% |
| French | 679 | 3.7% |
| French Canadian | 32 | 0.2% |
| German | 3,172 | 17.2% |
| Greek | 15 | 0.1% |
| Guatemalan | 3 | 0.0% |
| Honduran | 249 | 1.3% |
| Indian (Asian) | 194 | 1.1% |
| Irish | 1,695 | 9.2% |
| Italian | 762 | 4.1% |
| Jordanian | 58 | 0.3% |
| Korean | 59 | 0.3% |
| Lebanese | 13 | 0.1% |
| Lithuanian | 20 | 0.1% |
| Mexican | 4,559 | 24.7% |
| Native Hawaiian | 29 | 0.2% |
| Navajo | 25 | 0.1% |
| Nicaraguan | 19 | 0.1% |
| Nigerian | 14 | 0.1% |
| Northern European | 86 | 0.5% |
| Norwegian | 29 | 0.2% |
| Polish | 449 | 2.4% |
| Portuguese | 159 | 0.9% |
| Puerto Rican | 211 | 1.1% |
| Russian | 54 | 0.3% |
| Salvadoran | 203 | 1.1% |
| Samoan | 38 | 0.2% |
| Scandinavian | 23 | 0.1% |
| Scotch-Irish | 301 | 1.6% |
| Scottish | 398 | 2.1% |
| Slovak | 21 | 0.1% |
| South African | 50 | 0.3% |
| South American | 65 | 0.4% |
| Spaniard | 10 | 0.1% |
| Spanish | 57 | 0.3% |
| Sri Lankan | 10 | 0.1% |
| Subsaharan African | 67 | 0.4% |
| Swedish | 270 | 1.5% |
| Swiss | 150 | 0.8% |
| Syrian | 135 | 0.7% |
| Thai | 28 | 0.2% |
| Ukrainian | 114 | 0.6% |
| Welsh | 377 | 2.0% |
| West Indian | 3 | 0.0% |
| Yaqui | 10 | 0.1% | View All 71 Rows |
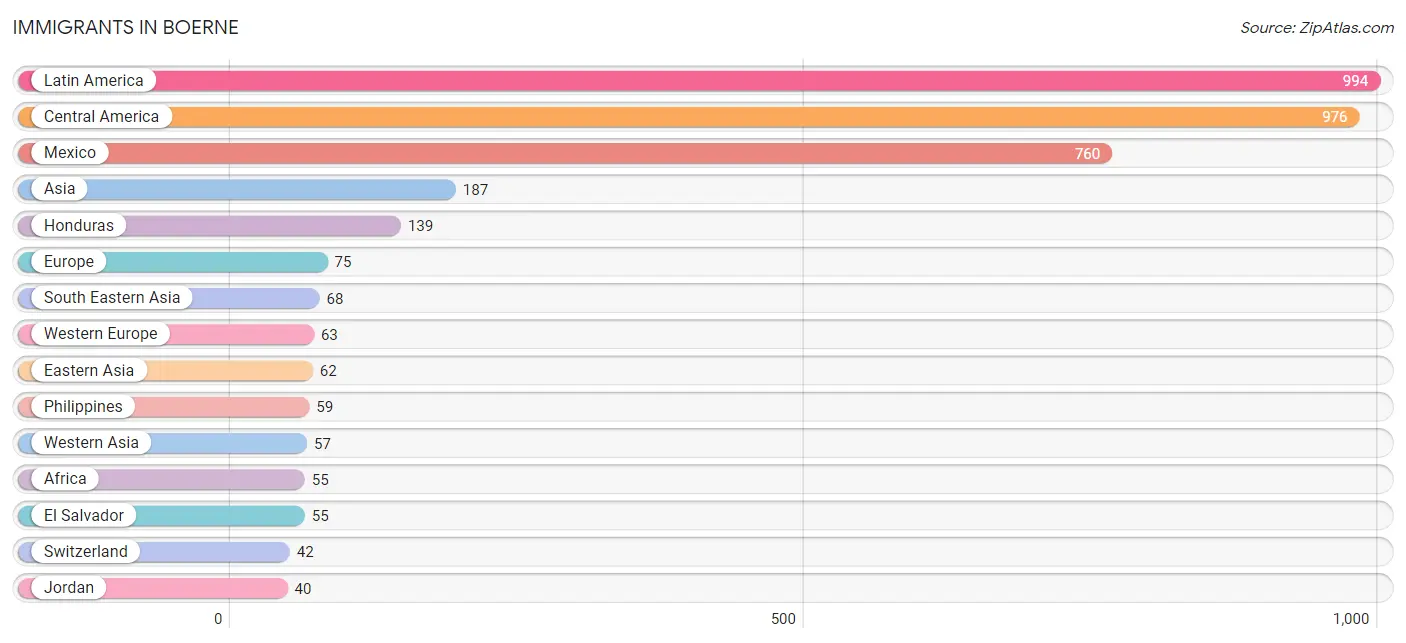
Immigrants in Boerne
The most numerous immigrant groups reported in Boerne came from Latin America (994 | 5.4%), Central America (976 | 5.3%), Mexico (760 | 4.1%), Asia (187 | 1.0%), and Honduras (139 | 0.7%), together accounting for 16.5% of all Boerne residents.
| Immigration Origin | # Population | % Population |
| Africa | 55 | 0.3% |
| Asia | 187 | 1.0% |
| Australia | 18 | 0.1% |
| Central America | 976 | 5.3% |
| China | 34 | 0.2% |
| Eastern Asia | 62 | 0.3% |
| Ecuador | 18 | 0.1% |
| Egypt | 7 | 0.0% |
| El Salvador | 55 | 0.3% |
| Europe | 75 | 0.4% |
| Germany | 21 | 0.1% |
| Guatemala | 3 | 0.0% |
| Honduras | 139 | 0.7% |
| Jordan | 40 | 0.2% |
| Korea | 28 | 0.2% |
| Latin America | 994 | 5.4% |
| Mexico | 760 | 4.1% |
| Nicaragua | 19 | 0.1% |
| Nigeria | 35 | 0.2% |
| Northern Africa | 7 | 0.0% |
| Northern Europe | 12 | 0.1% |
| Oceania | 18 | 0.1% |
| Philippines | 59 | 0.3% |
| South Africa | 13 | 0.1% |
| South America | 18 | 0.1% |
| South Eastern Asia | 68 | 0.4% |
| Switzerland | 42 | 0.2% |
| Syria | 17 | 0.1% |
| Vietnam | 9 | 0.1% |
| Western Africa | 35 | 0.2% |
| Western Asia | 57 | 0.3% |
| Western Europe | 63 | 0.3% | View All 32 Rows |
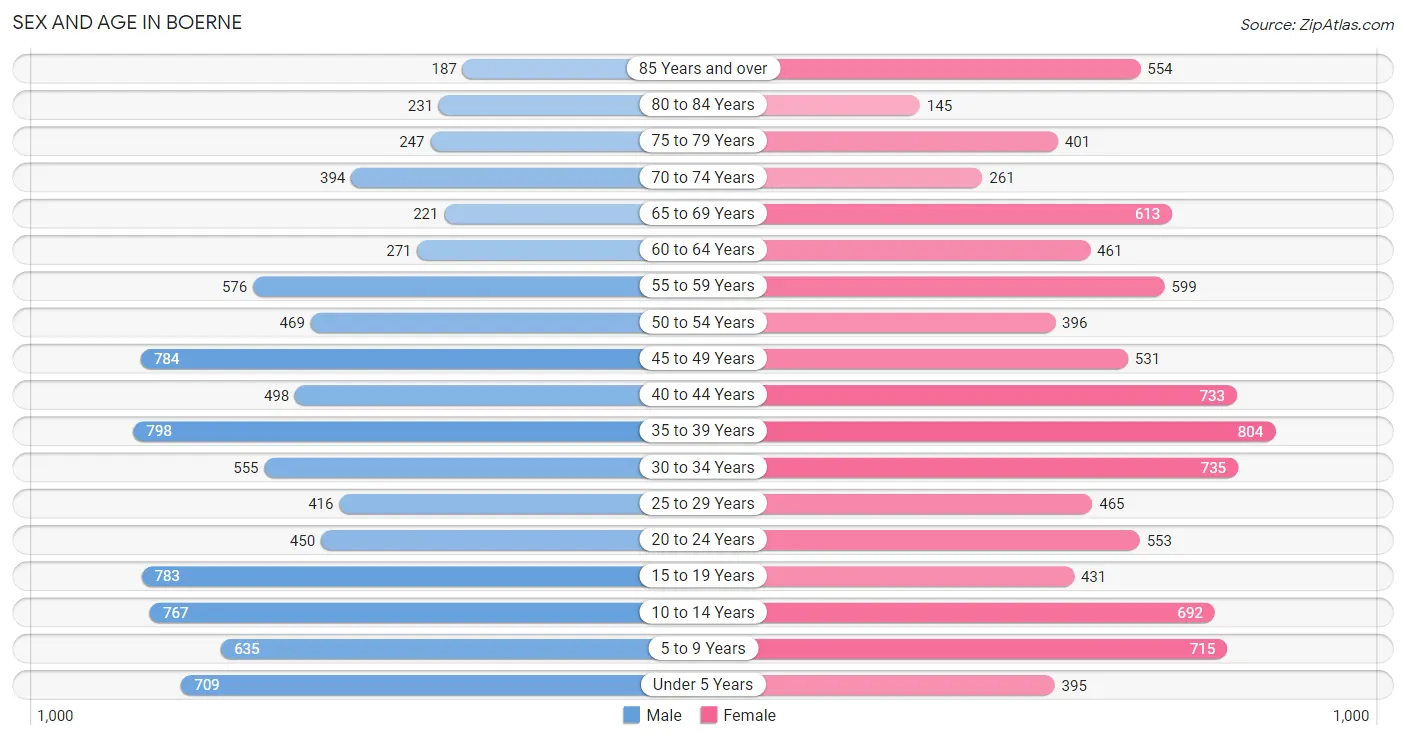
Sex and Age in Boerne
Sex and Age in Boerne
The most populous age groups in Boerne are 35 to 39 Years (798 | 8.9%) for men and 35 to 39 Years (804 | 8.5%) for women.
| Age Bracket | Male | Female |
| Under 5 Years | 709 (7.9%) | 395 (4.2%) |
| 5 to 9 Years | 635 (7.1%) | 715 (7.5%) |
| 10 to 14 Years | 767 (8.5%) | 692 (7.3%) |
| 15 to 19 Years | 783 (8.7%) | 431 (4.5%) |
| 20 to 24 Years | 450 (5.0%) | 553 (5.8%) |
| 25 to 29 Years | 416 (4.6%) | 465 (4.9%) |
| 30 to 34 Years | 555 (6.2%) | 735 (7.7%) |
| 35 to 39 Years | 798 (8.9%) | 804 (8.5%) |
| 40 to 44 Years | 498 (5.5%) | 733 (7.7%) |
| 45 to 49 Years | 784 (8.7%) | 531 (5.6%) |
| 50 to 54 Years | 469 (5.2%) | 396 (4.2%) |
| 55 to 59 Years | 576 (6.4%) | 599 (6.3%) |
| 60 to 64 Years | 271 (3.0%) | 461 (4.9%) |
| 65 to 69 Years | 221 (2.5%) | 613 (6.5%) |
| 70 to 74 Years | 394 (4.4%) | 261 (2.8%) |
| 75 to 79 Years | 247 (2.8%) | 401 (4.2%) |
| 80 to 84 Years | 231 (2.6%) | 145 (1.5%) |
| 85 Years and over | 187 (2.1%) | 554 (5.8%) |
| Total | 8,991 (100.0%) | 9,484 (100.0%) |
Families and Households in Boerne
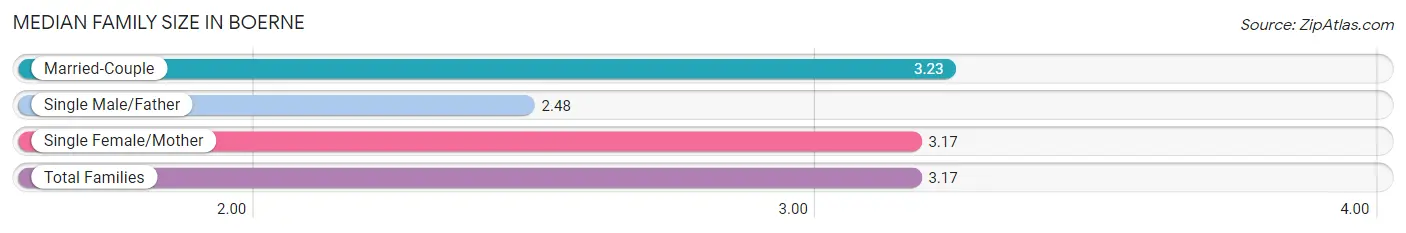
Median Family Size in Boerne
The median family size in Boerne is 3.17 persons per family, with married-couple families (3,733 | 79.3%) accounting for the largest median family size of 3.23 persons per family. On the other hand, single male/father families (274 | 5.8%) represent the smallest median family size with 2.48 persons per family.
| Family Type | # Families | Family Size |
| Married-Couple | 3,733 (79.3%) | 3.23 |
| Single Male/Father | 274 (5.8%) | 2.48 |
| Single Female/Mother | 699 (14.8%) | 3.17 |
| Total Families | 4,706 (100.0%) | 3.17 |
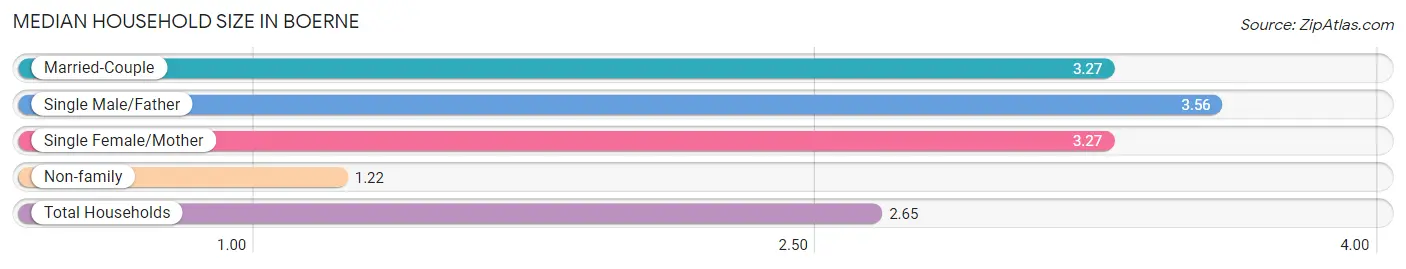
Median Household Size in Boerne
The median household size in Boerne is 2.65 persons per household, with single male/father households (274 | 4.0%) accounting for the largest median household size of 3.56 persons per household. non-family households (2,079 | 30.6%) represent the smallest median household size with 1.22 persons per household.
| Household Type | # Households | Household Size |
| Married-Couple | 3,733 (55.0%) | 3.27 |
| Single Male/Father | 274 (4.0%) | 3.56 |
| Single Female/Mother | 699 (10.3%) | 3.27 |
| Non-family | 2,079 (30.6%) | 1.22 |
| Total Households | 6,785 (100.0%) | 2.65 |
Household Size by Marriage Status in Boerne
Out of a total of 6,785 households in Boerne, 4,706 (69.4%) are family households, while 2,079 (30.6%) are nonfamily households. The most numerous type of family households are 2-person households, comprising 2,040, and the most common type of nonfamily households are 1-person households, comprising 1,813.
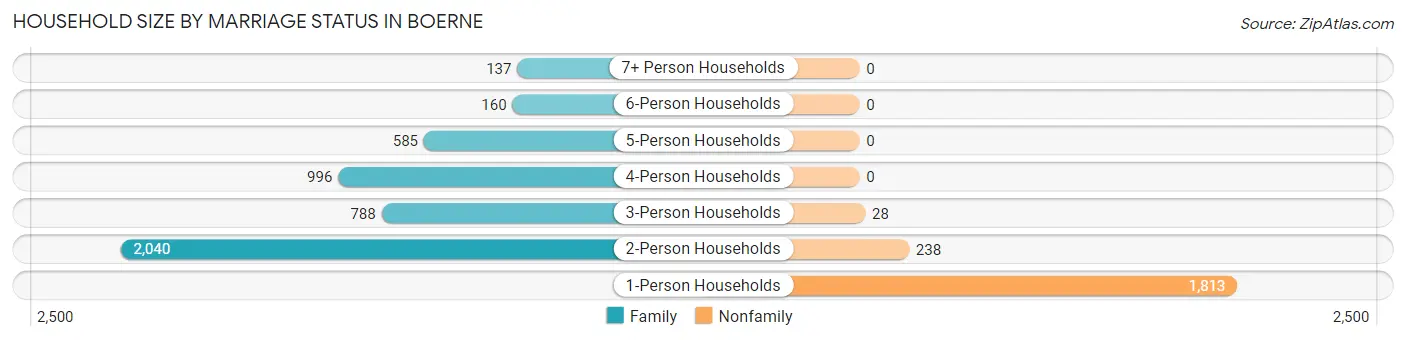
| Household Size | Family Households | Nonfamily Households |
| 1-Person Households | - | 1,813 (26.7%) |
| 2-Person Households | 2,040 (30.1%) | 238 (3.5%) |
| 3-Person Households | 788 (11.6%) | 28 (0.4%) |
| 4-Person Households | 996 (14.7%) | 0 (0.0%) |
| 5-Person Households | 585 (8.6%) | 0 (0.0%) |
| 6-Person Households | 160 (2.4%) | 0 (0.0%) |
| 7+ Person Households | 137 (2.0%) | 0 (0.0%) |
| Total | 4,706 (69.4%) | 2,079 (30.6%) |
Female Fertility in Boerne
Fertility by Age in Boerne
Average fertility rate in Boerne is 89.0 births per 1,000 women. Women in the age bracket of 20 to 34 years have the highest fertility rate with 156.0 births per 1,000 women. Women in the age bracket of 20 to 34 years acount for 70.7% of all women with births.
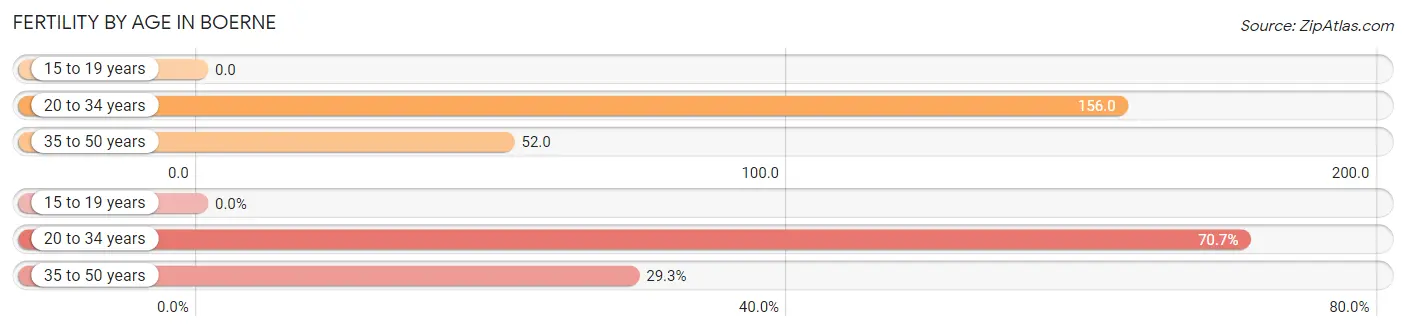
| Age Bracket | Women with Births | Births / 1,000 Women |
| 15 to 19 years | 0 (0.0%) | 0.0 |
| 20 to 34 years | 273 (70.7%) | 156.0 |
| 35 to 50 years | 113 (29.3%) | 52.0 |
| Total | 386 (100.0%) | 89.0 |
Fertility by Age by Marriage Status in Boerne
65.3% of women with births (386) in Boerne are married. The highest percentage of unmarried women with births falls into 20 to 34 years age bracket with 49.1% of them unmarried at the time of birth, while the lowest percentage of unmarried women with births belong to 35 to 50 years age bracket with 0.0% of them unmarried.
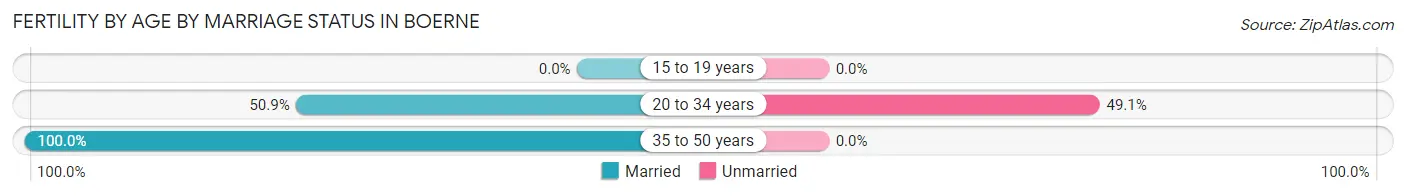
| Age Bracket | Married | Unmarried |
| 15 to 19 years | 0 (0.0%) | 0 (0.0%) |
| 20 to 34 years | 139 (50.9%) | 134 (49.1%) |
| 35 to 50 years | 113 (100.0%) | 0 (0.0%) |
| Total | 252 (65.3%) | 134 (34.7%) |
Fertility by Education in Boerne
Average fertility rate in Boerne is 89.0 births per 1,000 women. Women with the education attainment of high school diploma have the highest fertility rate of 203.0 births per 1,000 women, while women with the education attainment of less than high school have the lowest fertility at 61.0 births per 1,000 women. Women with the education attainment of college or associate's degree represent 28.8% of all women with births.
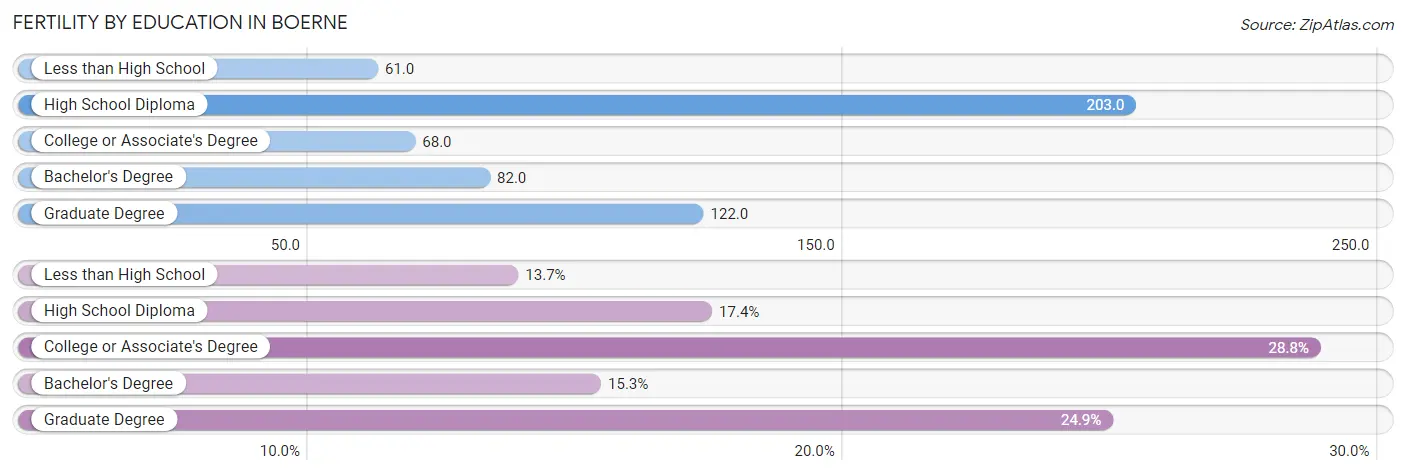
| Educational Attainment | Women with Births | Births / 1,000 Women |
| Less than High School | 53 (13.7%) | 61.0 |
| High School Diploma | 67 (17.4%) | 203.0 |
| College or Associate's Degree | 111 (28.8%) | 68.0 |
| Bachelor's Degree | 59 (15.3%) | 82.0 |
| Graduate Degree | 96 (24.9%) | 122.0 |
| Total | 386 (100.0%) | 89.0 |
Fertility by Education by Marriage Status in Boerne
34.7% of women with births in Boerne are unmarried. Women with the educational attainment of bachelor's degree are most likely to be married with 100.0% of them married at childbirth, while women with the educational attainment of less than high school are least likely to be married with 100.0% of them unmarried at childbirth.
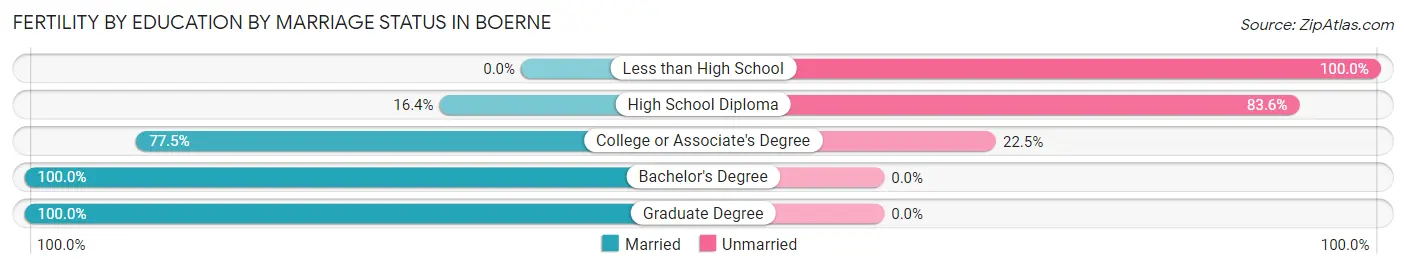
| Educational Attainment | Married | Unmarried |
| Less than High School | 0 (0.0%) | 53 (100.0%) |
| High School Diploma | 11 (16.4%) | 56 (83.6%) |
| College or Associate's Degree | 86 (77.5%) | 25 (22.5%) |
| Bachelor's Degree | 59 (100.0%) | 0 (0.0%) |
| Graduate Degree | 96 (100.0%) | 0 (0.0%) |
| Total | 252 (65.3%) | 134 (34.7%) |
Employment Characteristics in Boerne
Employment by Class of Employer in Boerne
Among the 8,612 employed individuals in Boerne, private company employees (5,030 | 58.4%), local government employees (869 | 10.1%), and self-employed (not incorporated) (796 | 9.2%) make up the most common classes of employment.
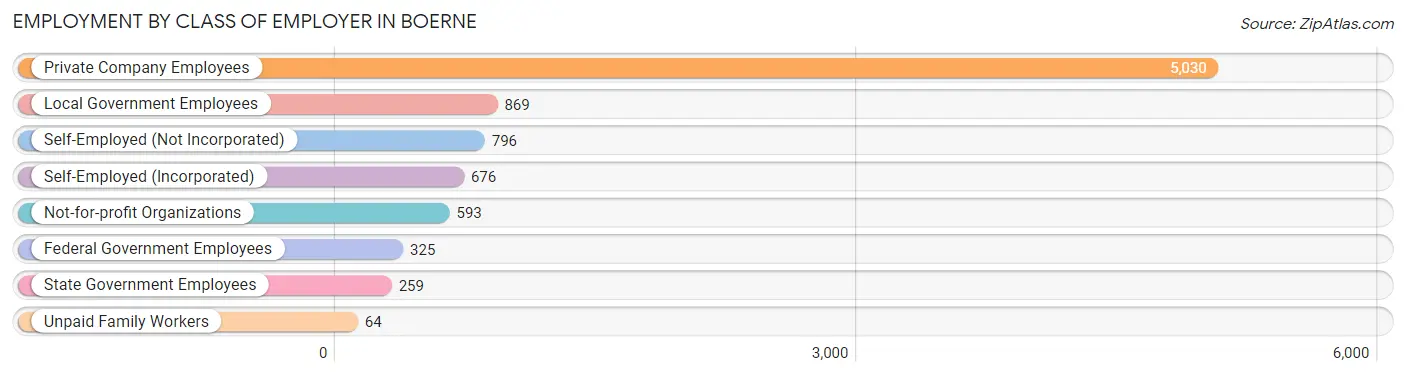
| Employer Class | # Employees | % Employees |
| Private Company Employees | 5,030 | 58.4% |
| Self-Employed (Incorporated) | 676 | 7.9% |
| Self-Employed (Not Incorporated) | 796 | 9.2% |
| Not-for-profit Organizations | 593 | 6.9% |
| Local Government Employees | 869 | 10.1% |
| State Government Employees | 259 | 3.0% |
| Federal Government Employees | 325 | 3.8% |
| Unpaid Family Workers | 64 | 0.7% |
| Total | 8,612 | 100.0% |
Employment Status by Age in Boerne
According to the labor force statistics for Boerne, out of the total population over 16 years of age (14,281), 63.0% or 8,997 individuals are in the labor force, with 2.5% or 225 of them unemployed. The age group with the highest labor force participation rate is 55 to 59 years, with 89.9% or 1,056 individuals in the labor force. Within the labor force, the 20 to 24 years age range has the highest percentage of unemployed individuals, with 18.0% or 107 of them being unemployed.
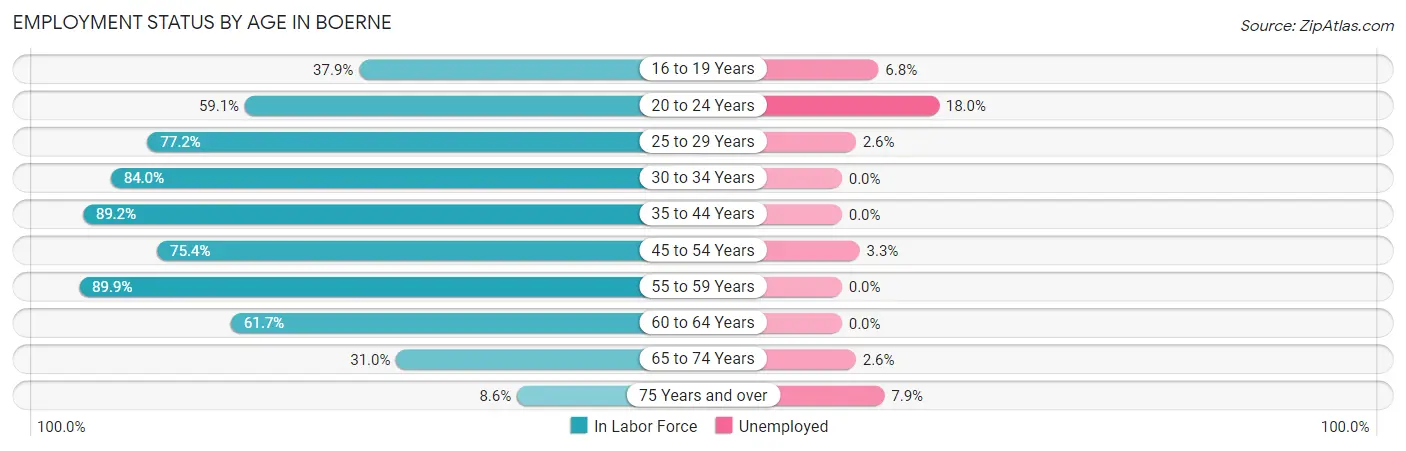
| Age Bracket | In Labor Force | Unemployed |
| 16 to 19 Years | 354 (37.9%) | 24 (6.8%) |
| 20 to 24 Years | 593 (59.1%) | 107 (18.0%) |
| 25 to 29 Years | 680 (77.2%) | 18 (2.6%) |
| 30 to 34 Years | 1,084 (84.0%) | 0 (0.0%) |
| 35 to 44 Years | 2,527 (89.2%) | 0 (0.0%) |
| 45 to 54 Years | 1,644 (75.4%) | 54 (3.3%) |
| 55 to 59 Years | 1,056 (89.9%) | 0 (0.0%) |
| 60 to 64 Years | 452 (61.7%) | 0 (0.0%) |
| 65 to 74 Years | 462 (31.0%) | 12 (2.6%) |
| 75 Years and over | 152 (8.6%) | 12 (7.9%) |
| Total | 8,997 (63.0%) | 225 (2.5%) |
Employment Status by Educational Attainment in Boerne
According to labor force statistics for Boerne, 81.9% of individuals (7,446) out of the total population between 25 and 64 years of age (9,091) are in the labor force, with 1.0% or 74 of them being unemployed. The group with the highest labor force participation rate are those with the educational attainment of bachelor's degree or higher, with 90.8% or 3,624 individuals in the labor force. Within the labor force, individuals with bachelor's degree or higher education have the highest percentage of unemployment, with 2.0% or 72 of them being unemployed.
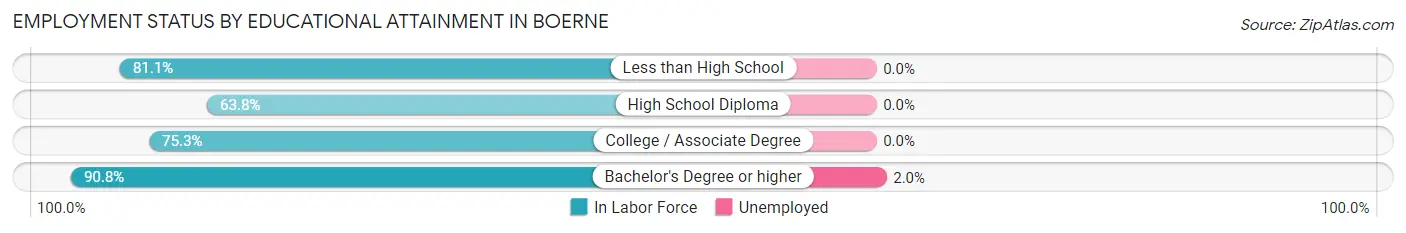
| Educational Attainment | In Labor Force | Unemployed |
| Less than High School | 1,008 (81.1%) | 0 (0.0%) |
| High School Diploma | 512 (63.8%) | 0 (0.0%) |
| College / Associate Degree | 2,300 (75.3%) | 0 (0.0%) |
| Bachelor's Degree or higher | 3,624 (90.8%) | 80 (2.0%) |
| Total | 7,446 (81.9%) | 91 (1.0%) |
Employment Occupations by Sex in Boerne
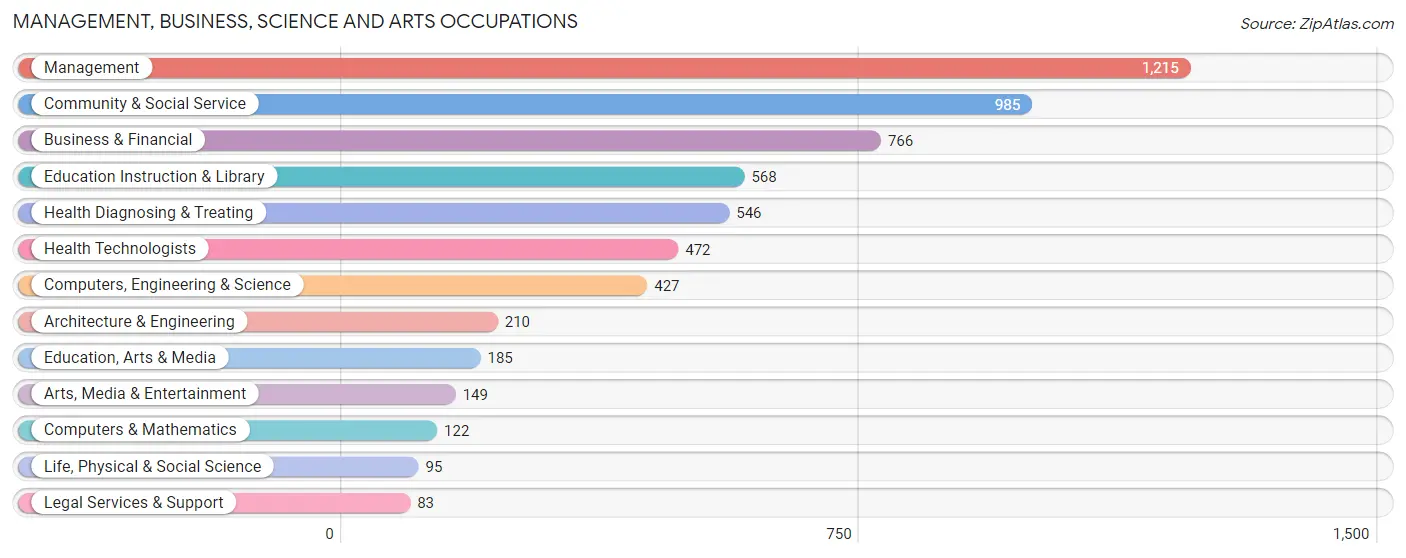
Management, Business, Science and Arts Occupations
The most common Management, Business, Science and Arts occupations in Boerne are Management (1,215 | 13.9%), Community & Social Service (985 | 11.3%), Business & Financial (766 | 8.7%), Education Instruction & Library (568 | 6.5%), and Health Diagnosing & Treating (546 | 6.2%).
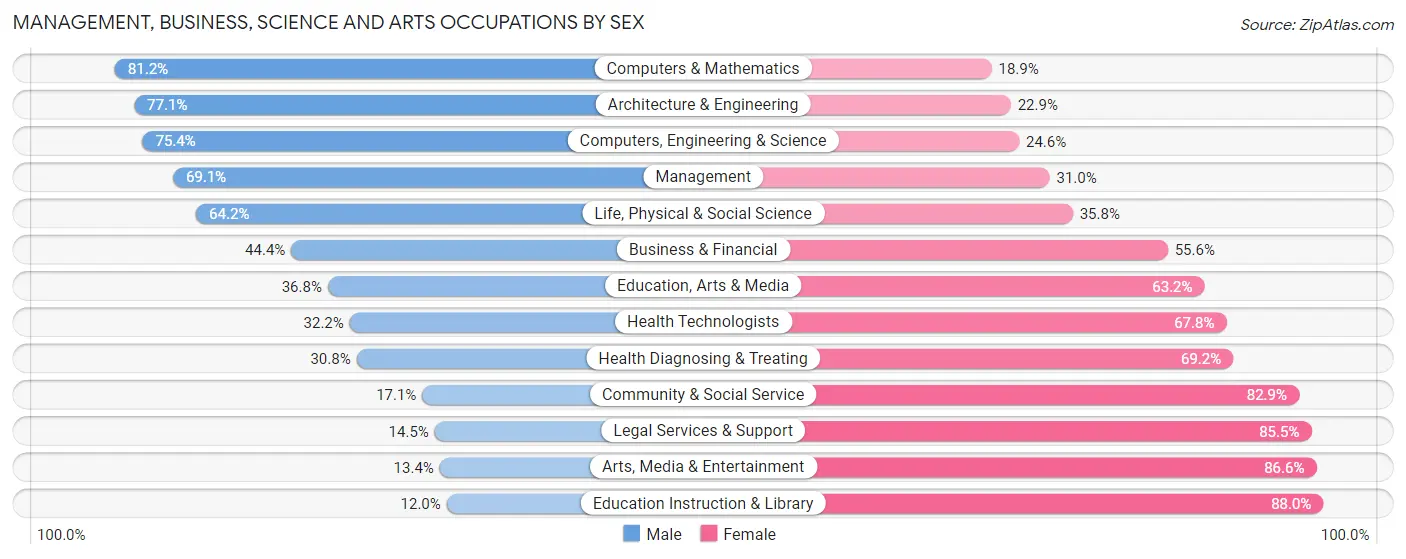
Management, Business, Science and Arts Occupations by Sex
Within the Management, Business, Science and Arts occupations in Boerne, the most male-oriented occupations are Computers & Mathematics (81.1%), Architecture & Engineering (77.1%), and Computers, Engineering & Science (75.4%), while the most female-oriented occupations are Education Instruction & Library (88.0%), Arts, Media & Entertainment (86.6%), and Legal Services & Support (85.5%).
| Occupation | Male | Female |
| Management | 839 (69.1%) | 376 (30.9%) |
| Business & Financial | 340 (44.4%) | 426 (55.6%) |
| Computers, Engineering & Science | 322 (75.4%) | 105 (24.6%) |
| Computers & Mathematics | 99 (81.1%) | 23 (18.9%) |
| Architecture & Engineering | 162 (77.1%) | 48 (22.9%) |
| Life, Physical & Social Science | 61 (64.2%) | 34 (35.8%) |
| Community & Social Service | 168 (17.1%) | 817 (82.9%) |
| Education, Arts & Media | 68 (36.8%) | 117 (63.2%) |
| Legal Services & Support | 12 (14.5%) | 71 (85.5%) |
| Education Instruction & Library | 68 (12.0%) | 500 (88.0%) |
| Arts, Media & Entertainment | 20 (13.4%) | 129 (86.6%) |
| Health Diagnosing & Treating | 168 (30.8%) | 378 (69.2%) |
| Health Technologists | 152 (32.2%) | 320 (67.8%) |
| Total (Category) | 1,837 (46.6%) | 2,102 (53.4%) |
| Total (Overall) | 4,469 (51.1%) | 4,283 (48.9%) |
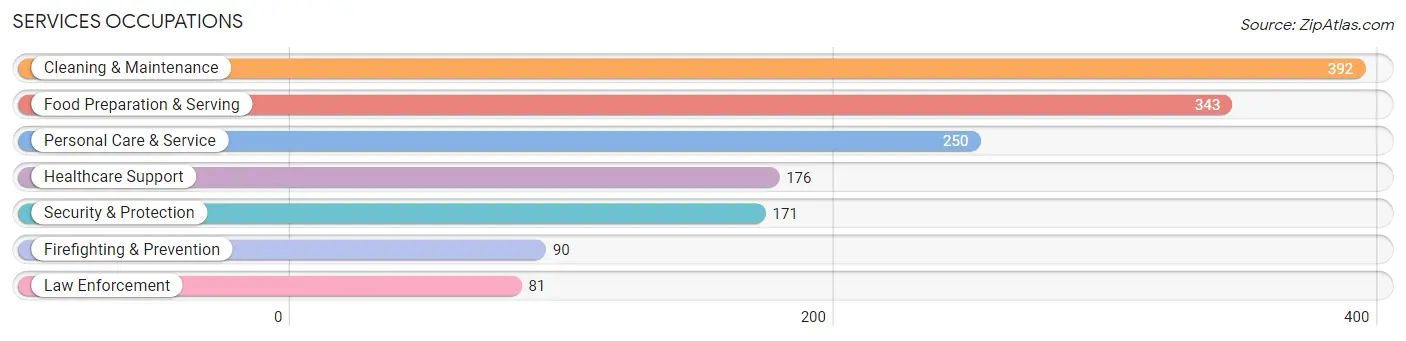
Services Occupations
The most common Services occupations in Boerne are Cleaning & Maintenance (392 | 4.5%), Food Preparation & Serving (343 | 3.9%), Personal Care & Service (250 | 2.9%), Healthcare Support (176 | 2.0%), and Security & Protection (171 | 1.9%).
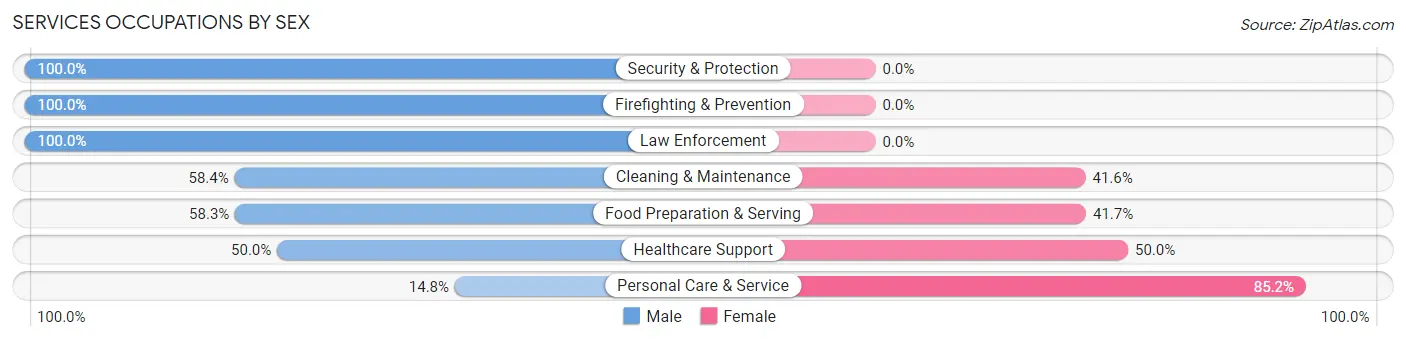
Services Occupations by Sex
Within the Services occupations in Boerne, the most male-oriented occupations are Security & Protection (100.0%), Firefighting & Prevention (100.0%), and Law Enforcement (100.0%), while the most female-oriented occupations are Personal Care & Service (85.2%), Healthcare Support (50.0%), and Food Preparation & Serving (41.7%).
| Occupation | Male | Female |
| Healthcare Support | 88 (50.0%) | 88 (50.0%) |
| Security & Protection | 171 (100.0%) | 0 (0.0%) |
| Firefighting & Prevention | 90 (100.0%) | 0 (0.0%) |
| Law Enforcement | 81 (100.0%) | 0 (0.0%) |
| Food Preparation & Serving | 200 (58.3%) | 143 (41.7%) |
| Cleaning & Maintenance | 229 (58.4%) | 163 (41.6%) |
| Personal Care & Service | 37 (14.8%) | 213 (85.2%) |
| Total (Category) | 725 (54.4%) | 607 (45.6%) |
| Total (Overall) | 4,469 (51.1%) | 4,283 (48.9%) |
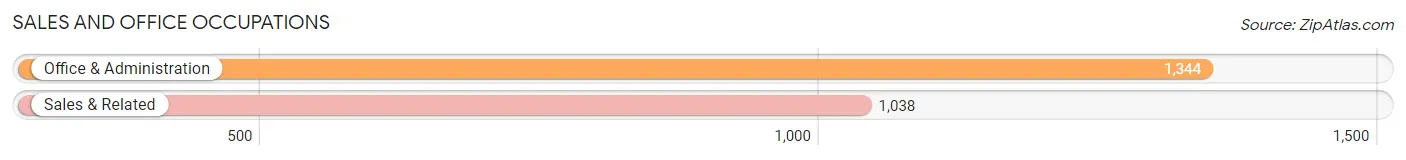
Sales and Office Occupations
The most common Sales and Office occupations in Boerne are Office & Administration (1,344 | 15.4%), and Sales & Related (1,038 | 11.9%).
Sales and Office Occupations by Sex
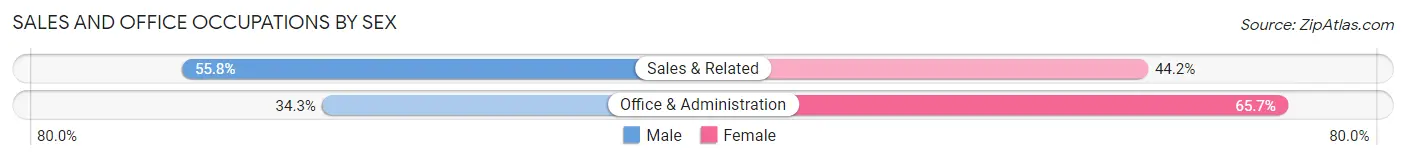
| Occupation | Male | Female |
| Sales & Related | 579 (55.8%) | 459 (44.2%) |
| Office & Administration | 461 (34.3%) | 883 (65.7%) |
| Total (Category) | 1,040 (43.7%) | 1,342 (56.3%) |
| Total (Overall) | 4,469 (51.1%) | 4,283 (48.9%) |
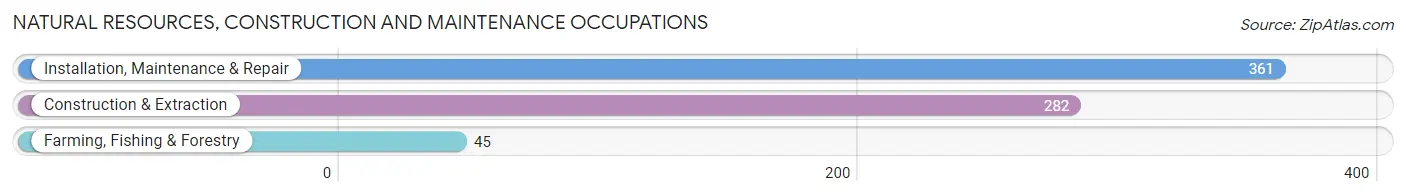
Natural Resources, Construction and Maintenance Occupations
The most common Natural Resources, Construction and Maintenance occupations in Boerne are Installation, Maintenance & Repair (361 | 4.1%), Construction & Extraction (282 | 3.2%), and Farming, Fishing & Forestry (45 | 0.5%).
Natural Resources, Construction and Maintenance Occupations by Sex
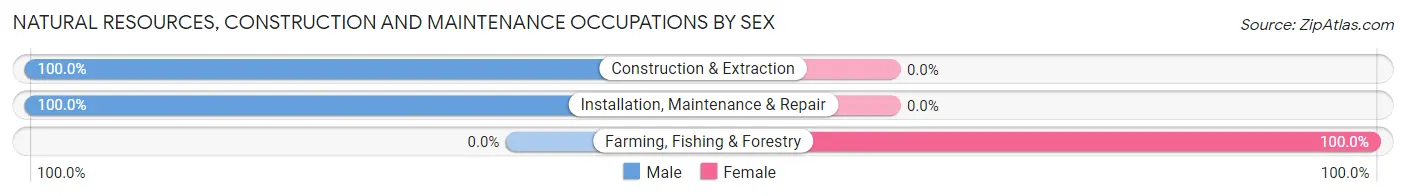
| Occupation | Male | Female |
| Farming, Fishing & Forestry | 0 (0.0%) | 45 (100.0%) |
| Construction & Extraction | 282 (100.0%) | 0 (0.0%) |
| Installation, Maintenance & Repair | 361 (100.0%) | 0 (0.0%) |
| Total (Category) | 643 (93.5%) | 45 (6.5%) |
| Total (Overall) | 4,469 (51.1%) | 4,283 (48.9%) |
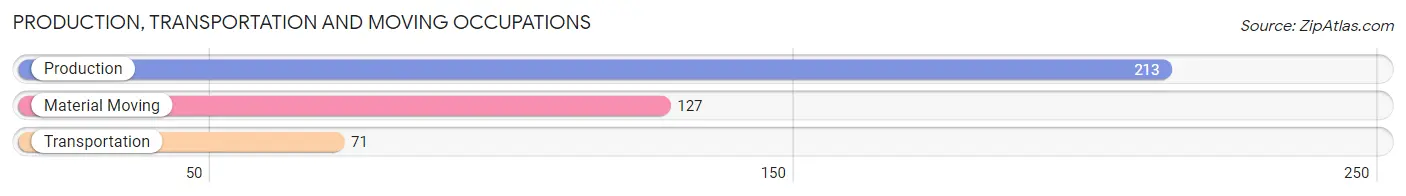
Production, Transportation and Moving Occupations
The most common Production, Transportation and Moving occupations in Boerne are Production (213 | 2.4%), Material Moving (127 | 1.5%), and Transportation (71 | 0.8%).
Production, Transportation and Moving Occupations by Sex
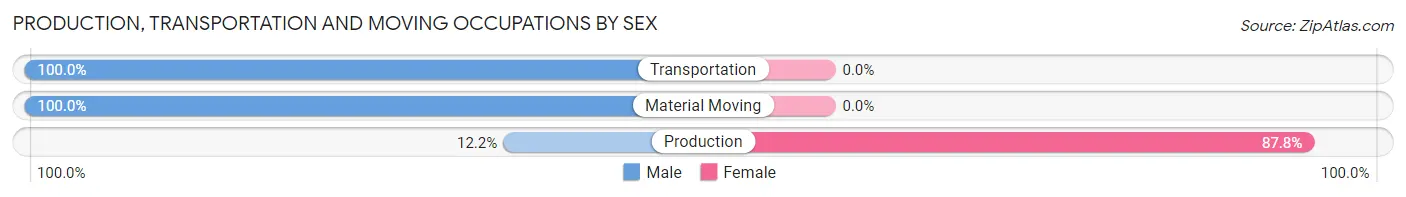
| Occupation | Male | Female |
| Production | 26 (12.2%) | 187 (87.8%) |
| Transportation | 71 (100.0%) | 0 (0.0%) |
| Material Moving | 127 (100.0%) | 0 (0.0%) |
| Total (Category) | 224 (54.5%) | 187 (45.5%) |
| Total (Overall) | 4,469 (51.1%) | 4,283 (48.9%) |
Employment Industries by Sex in Boerne
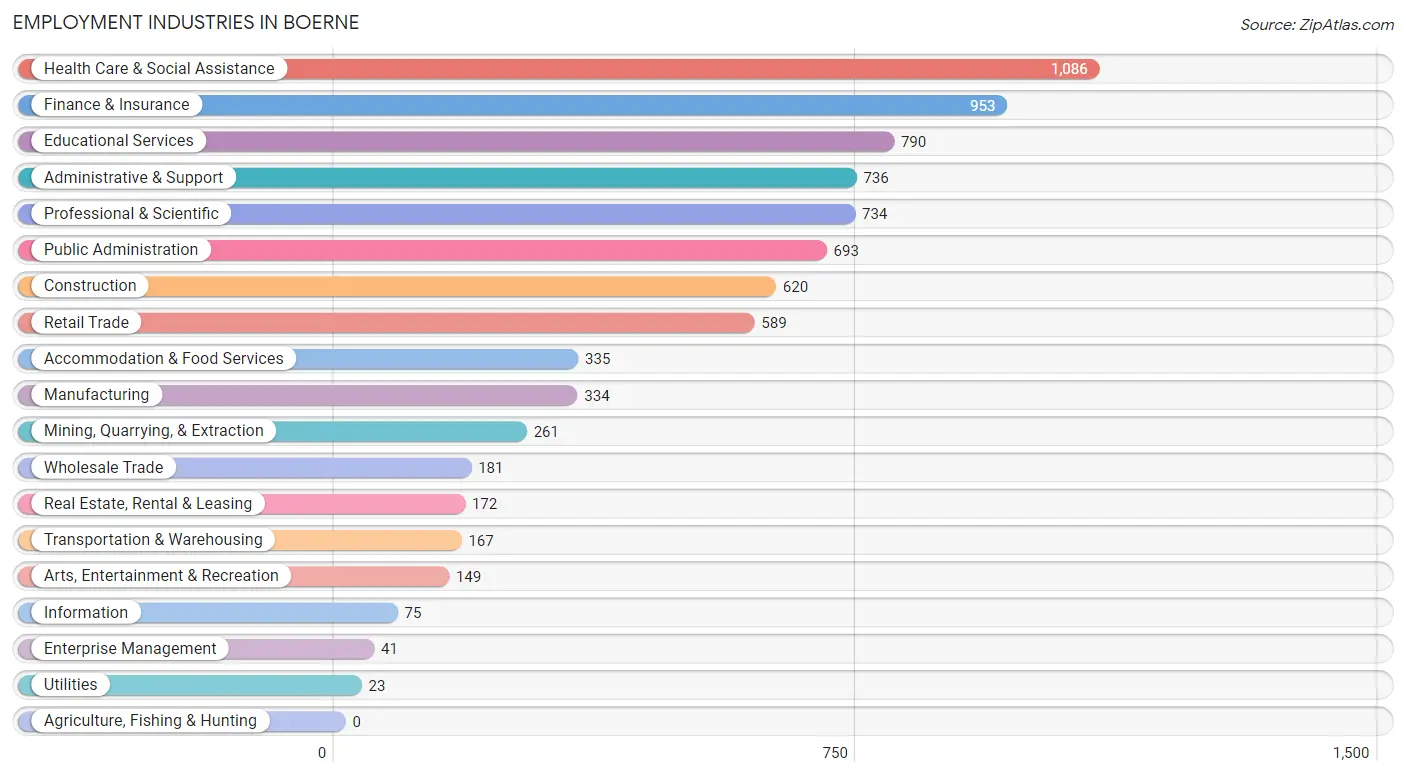
Employment Industries in Boerne
The major employment industries in Boerne include Health Care & Social Assistance (1,086 | 12.4%), Finance & Insurance (953 | 10.9%), Educational Services (790 | 9.0%), Administrative & Support (736 | 8.4%), and Professional & Scientific (734 | 8.4%).
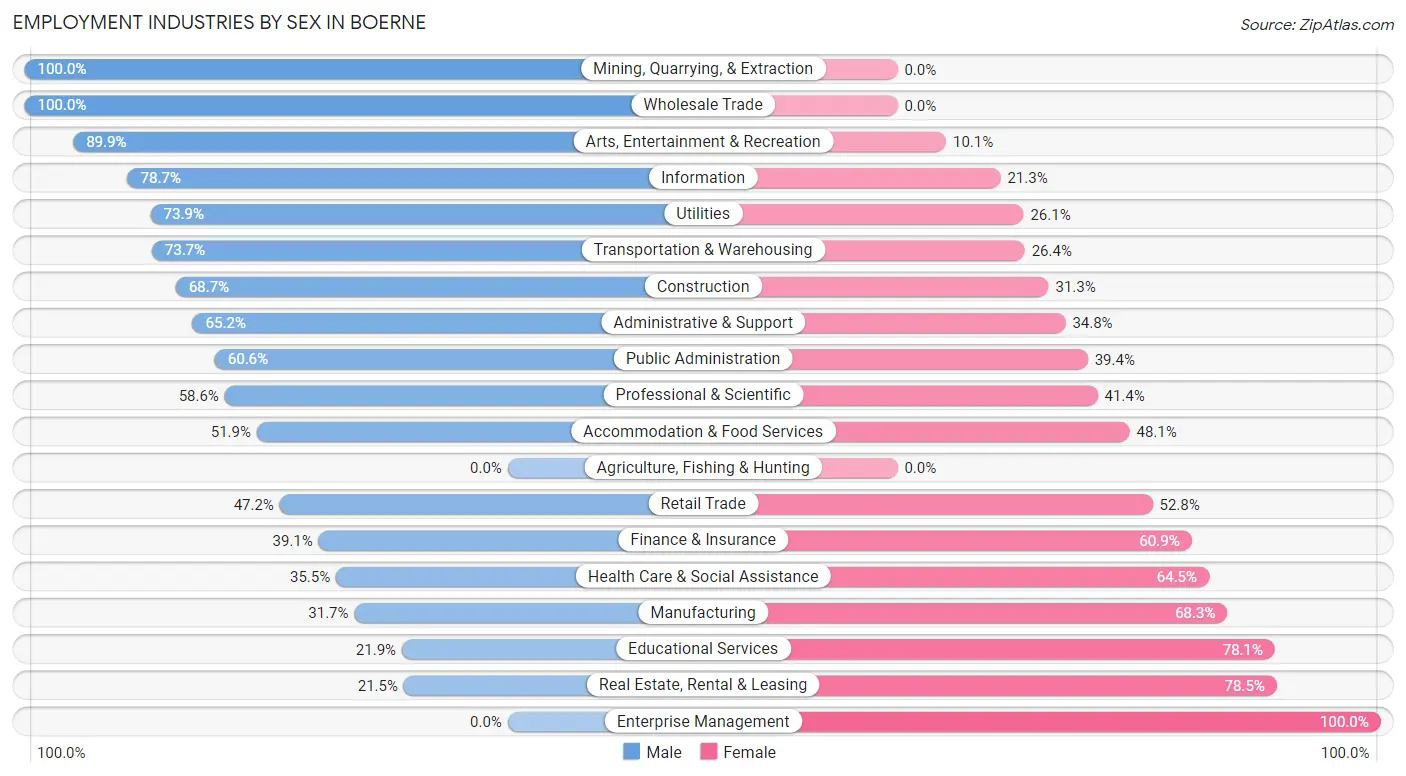
Employment Industries by Sex in Boerne
The Boerne industries that see more men than women are Mining, Quarrying, & Extraction (100.0%), Wholesale Trade (100.0%), and Arts, Entertainment & Recreation (89.9%), whereas the industries that tend to have a higher number of women are Enterprise Management (100.0%), Real Estate, Rental & Leasing (78.5%), and Educational Services (78.1%).
| Industry | Male | Female |
| Agriculture, Fishing & Hunting | 0 (0.0%) | 0 (0.0%) |
| Mining, Quarrying, & Extraction | 261 (100.0%) | 0 (0.0%) |
| Construction | 426 (68.7%) | 194 (31.3%) |
| Manufacturing | 106 (31.7%) | 228 (68.3%) |
| Wholesale Trade | 181 (100.0%) | 0 (0.0%) |
| Retail Trade | 278 (47.2%) | 311 (52.8%) |
| Transportation & Warehousing | 123 (73.7%) | 44 (26.4%) |
| Utilities | 17 (73.9%) | 6 (26.1%) |
| Information | 59 (78.7%) | 16 (21.3%) |
| Finance & Insurance | 373 (39.1%) | 580 (60.9%) |
| Real Estate, Rental & Leasing | 37 (21.5%) | 135 (78.5%) |
| Professional & Scientific | 430 (58.6%) | 304 (41.4%) |
| Enterprise Management | 0 (0.0%) | 41 (100.0%) |
| Administrative & Support | 480 (65.2%) | 256 (34.8%) |
| Educational Services | 173 (21.9%) | 617 (78.1%) |
| Health Care & Social Assistance | 386 (35.5%) | 700 (64.5%) |
| Arts, Entertainment & Recreation | 134 (89.9%) | 15 (10.1%) |
| Accommodation & Food Services | 174 (51.9%) | 161 (48.1%) |
| Public Administration | 420 (60.6%) | 273 (39.4%) |
| Total | 4,469 (51.1%) | 4,283 (48.9%) |
Education in Boerne
School Enrollment in Boerne
The most common levels of schooling among the 5,056 students in Boerne are middle school (1,363 | 27.0%), high school (1,079 | 21.3%), and elementary school (1,037 | 20.5%).
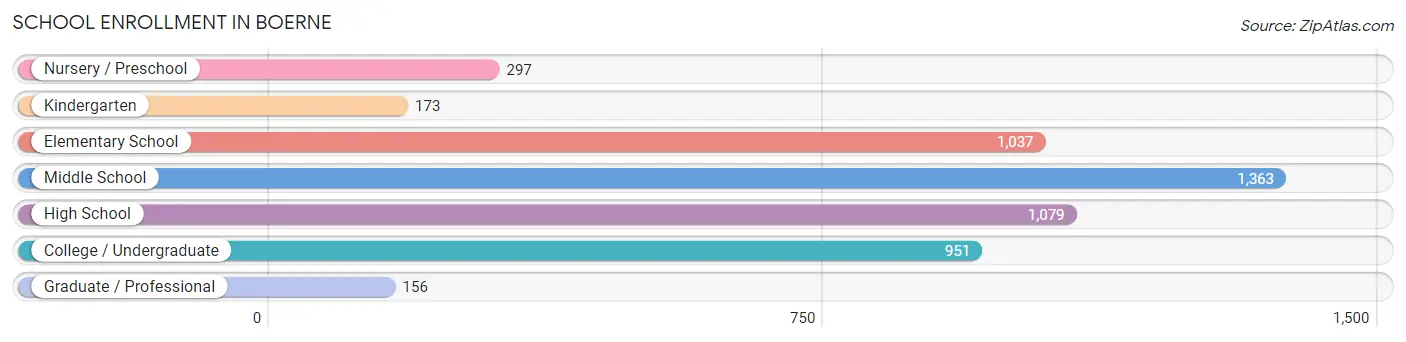
| School Level | # Students | % Students |
| Nursery / Preschool | 297 | 5.9% |
| Kindergarten | 173 | 3.4% |
| Elementary School | 1,037 | 20.5% |
| Middle School | 1,363 | 27.0% |
| High School | 1,079 | 21.3% |
| College / Undergraduate | 951 | 18.8% |
| Graduate / Professional | 156 | 3.1% |
| Total | 5,056 | 100.0% |
School Enrollment by Age by Funding Source in Boerne
Out of a total of 5,056 students who are enrolled in schools in Boerne, 571 (11.3%) attend a private institution, while the remaining 4,485 (88.7%) are enrolled in public schools. The age group of 20 to 24 year olds has the highest likelihood of being enrolled in private schools, with 172 (40.5% in the age bracket) enrolled. Conversely, the age group of 5 to 9 year old has the lowest likelihood of being enrolled in a private school, with 1,241 (96.3% in the age bracket) attending a public institution.
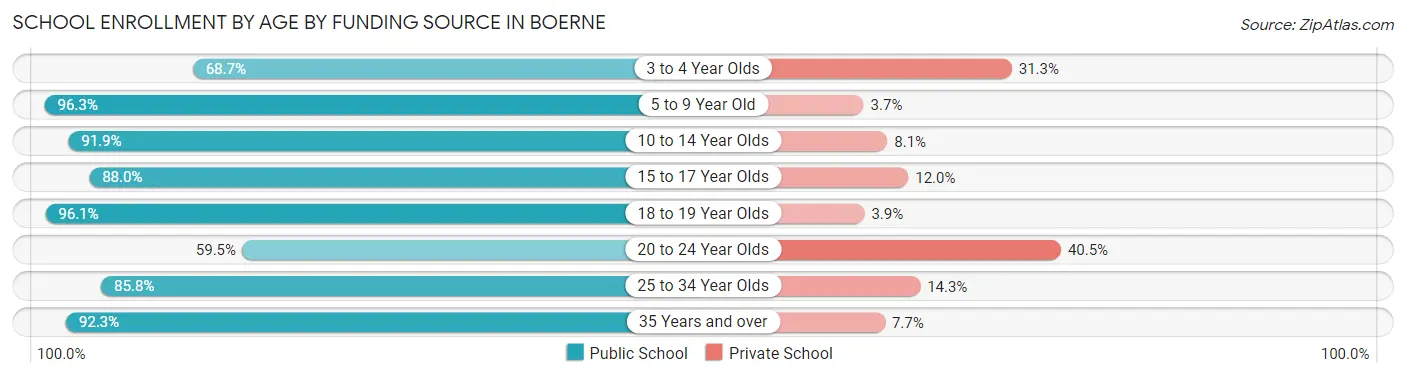
| Age Bracket | Public School | Private School |
| 3 to 4 Year Olds | 125 (68.7%) | 57 (31.3%) |
| 5 to 9 Year Old | 1,241 (96.3%) | 48 (3.7%) |
| 10 to 14 Year Olds | 1,331 (91.9%) | 118 (8.1%) |
| 15 to 17 Year Olds | 672 (88.0%) | 92 (12.0%) |
| 18 to 19 Year Olds | 323 (96.1%) | 13 (3.9%) |
| 20 to 24 Year Olds | 253 (59.5%) | 172 (40.5%) |
| 25 to 34 Year Olds | 301 (85.8%) | 50 (14.2%) |
| 35 Years and over | 240 (92.3%) | 20 (7.7%) |
| Total | 4,485 (88.7%) | 571 (11.3%) |
Educational Attainment by Field of Study in Boerne
Business (1,474 | 25.2%), education (705 | 12.1%), science & technology (629 | 10.8%), physical & health sciences (402 | 6.9%), and engineering (358 | 6.1%) are the most common fields of study among 5,847 individuals in Boerne who have obtained a bachelor's degree or higher.
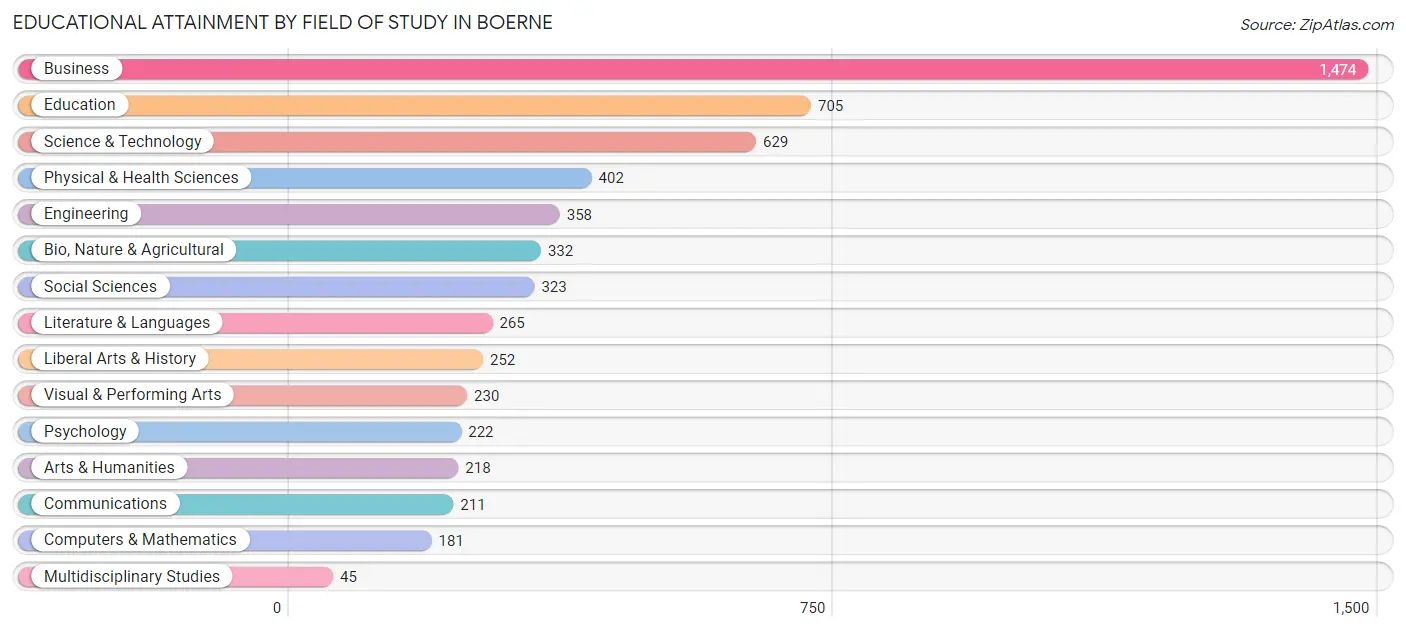
| Field of Study | # Graduates | % Graduates |
| Computers & Mathematics | 181 | 3.1% |
| Bio, Nature & Agricultural | 332 | 5.7% |
| Physical & Health Sciences | 402 | 6.9% |
| Psychology | 222 | 3.8% |
| Social Sciences | 323 | 5.5% |
| Engineering | 358 | 6.1% |
| Multidisciplinary Studies | 45 | 0.8% |
| Science & Technology | 629 | 10.8% |
| Business | 1,474 | 25.2% |
| Education | 705 | 12.1% |
| Literature & Languages | 265 | 4.5% |
| Liberal Arts & History | 252 | 4.3% |
| Visual & Performing Arts | 230 | 3.9% |
| Communications | 211 | 3.6% |
| Arts & Humanities | 218 | 3.7% |
| Total | 5,847 | 100.0% |
Transportation & Commute in Boerne
Vehicle Availability by Sex in Boerne
The most prevalent vehicle ownership categories in Boerne are males with 2 vehicles (2,191, accounting for 49.6%) and females with 2 vehicles (1,690, making up 52.2%).
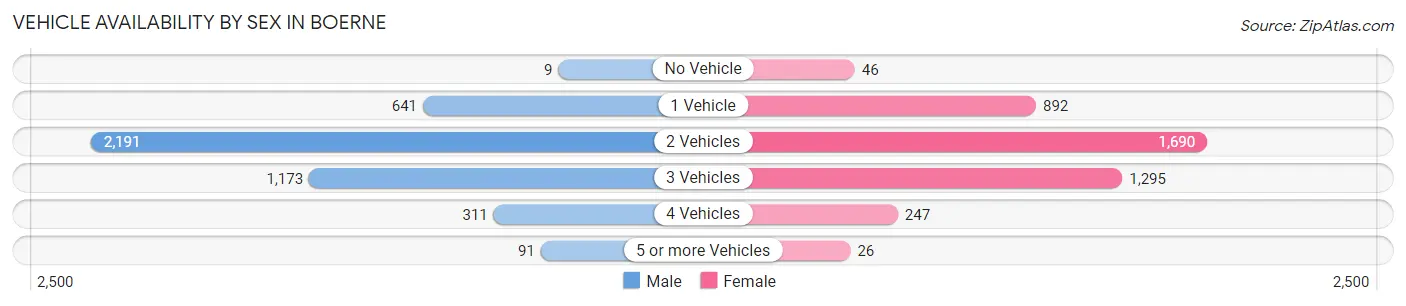
| Vehicles Available | Male | Female |
| No Vehicle | 9 (0.2%) | 46 (1.1%) |
| 1 Vehicle | 641 (14.5%) | 892 (21.3%) |
| 2 Vehicles | 2,191 (49.6%) | 1,690 (40.3%) |
| 3 Vehicles | 1,173 (26.6%) | 1,295 (30.9%) |
| 4 Vehicles | 311 (7.0%) | 247 (5.9%) |
| 5 or more Vehicles | 91 (2.1%) | 26 (0.6%) |
| Total | 4,416 (100.0%) | 4,196 (100.0%) |
Commute Time in Boerne
The most frequently occuring commute durations in Boerne are 5 to 9 minutes (1,581 commuters, 21.7%), 10 to 14 minutes (1,327 commuters, 18.2%), and 30 to 34 minutes (795 commuters, 10.9%).
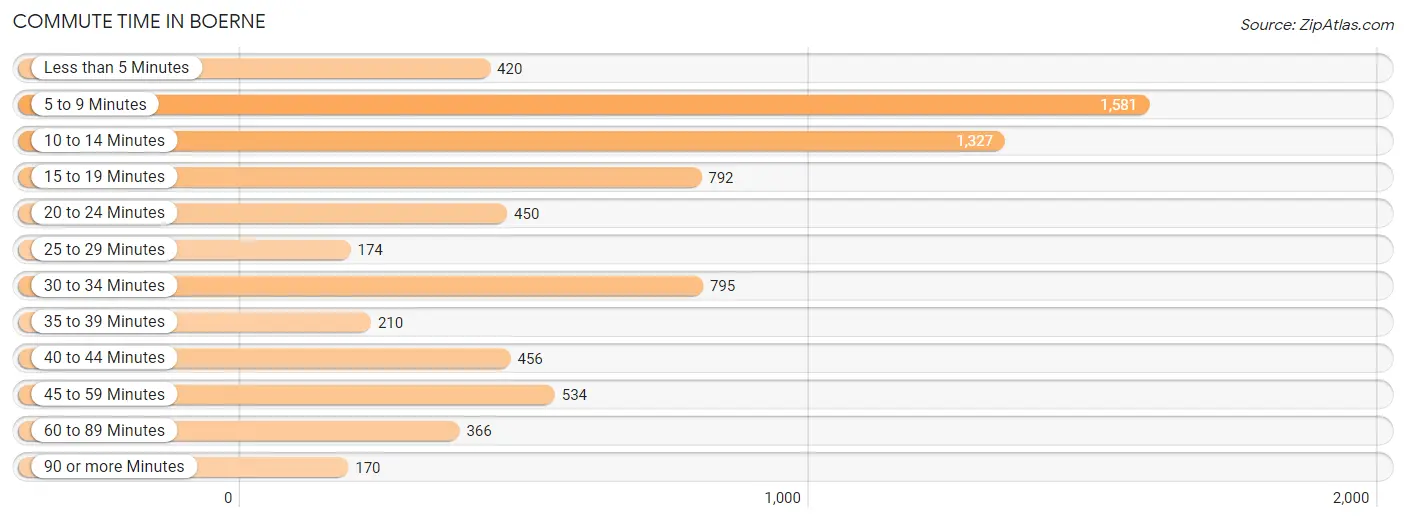
| Commute Time | # Commuters | % Commuters |
| Less than 5 Minutes | 420 | 5.8% |
| 5 to 9 Minutes | 1,581 | 21.7% |
| 10 to 14 Minutes | 1,327 | 18.2% |
| 15 to 19 Minutes | 792 | 10.9% |
| 20 to 24 Minutes | 450 | 6.2% |
| 25 to 29 Minutes | 174 | 2.4% |
| 30 to 34 Minutes | 795 | 10.9% |
| 35 to 39 Minutes | 210 | 2.9% |
| 40 to 44 Minutes | 456 | 6.3% |
| 45 to 59 Minutes | 534 | 7.3% |
| 60 to 89 Minutes | 366 | 5.0% |
| 90 or more Minutes | 170 | 2.3% |
Commute Time by Sex in Boerne
The most common commute times in Boerne are 5 to 9 minutes (770 commuters, 20.2%) for males and 10 to 14 minutes (847 commuters, 24.4%) for females.
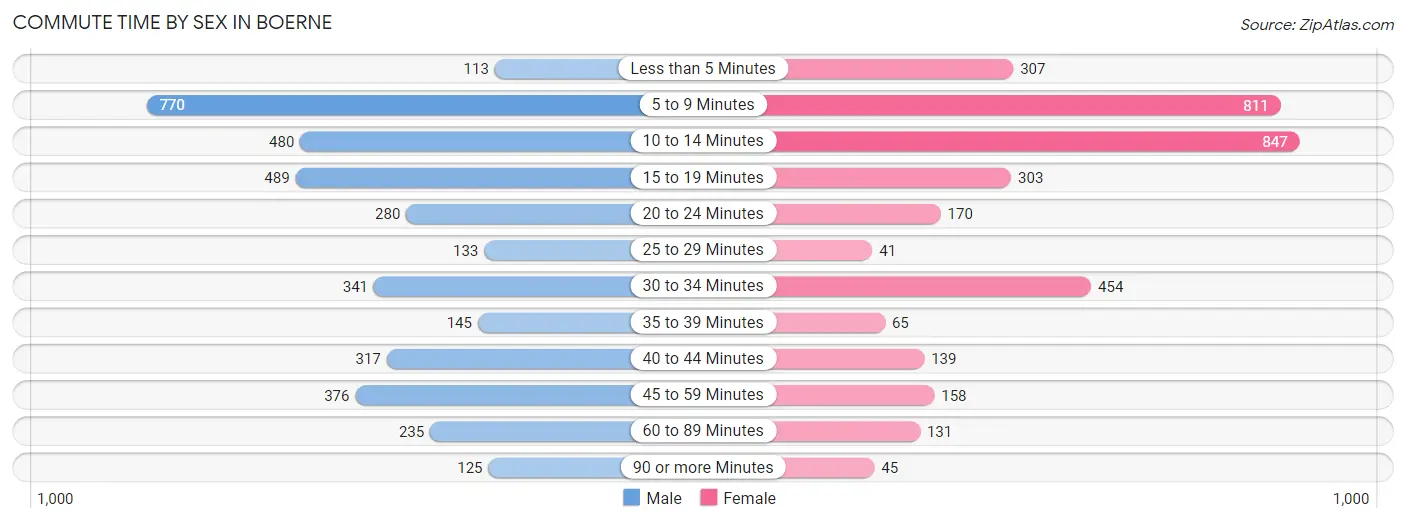
| Commute Time | Male | Female |
| Less than 5 Minutes | 113 (3.0%) | 307 (8.8%) |
| 5 to 9 Minutes | 770 (20.2%) | 811 (23.4%) |
| 10 to 14 Minutes | 480 (12.6%) | 847 (24.4%) |
| 15 to 19 Minutes | 489 (12.9%) | 303 (8.7%) |
| 20 to 24 Minutes | 280 (7.4%) | 170 (4.9%) |
| 25 to 29 Minutes | 133 (3.5%) | 41 (1.2%) |
| 30 to 34 Minutes | 341 (9.0%) | 454 (13.1%) |
| 35 to 39 Minutes | 145 (3.8%) | 65 (1.9%) |
| 40 to 44 Minutes | 317 (8.3%) | 139 (4.0%) |
| 45 to 59 Minutes | 376 (9.9%) | 158 (4.5%) |
| 60 to 89 Minutes | 235 (6.2%) | 131 (3.8%) |
| 90 or more Minutes | 125 (3.3%) | 45 (1.3%) |
Time of Departure to Work by Sex in Boerne
The most frequent times of departure to work in Boerne are 7:30 AM to 7:59 AM (642, 16.9%) for males and 7:00 AM to 7:29 AM (706, 20.3%) for females.
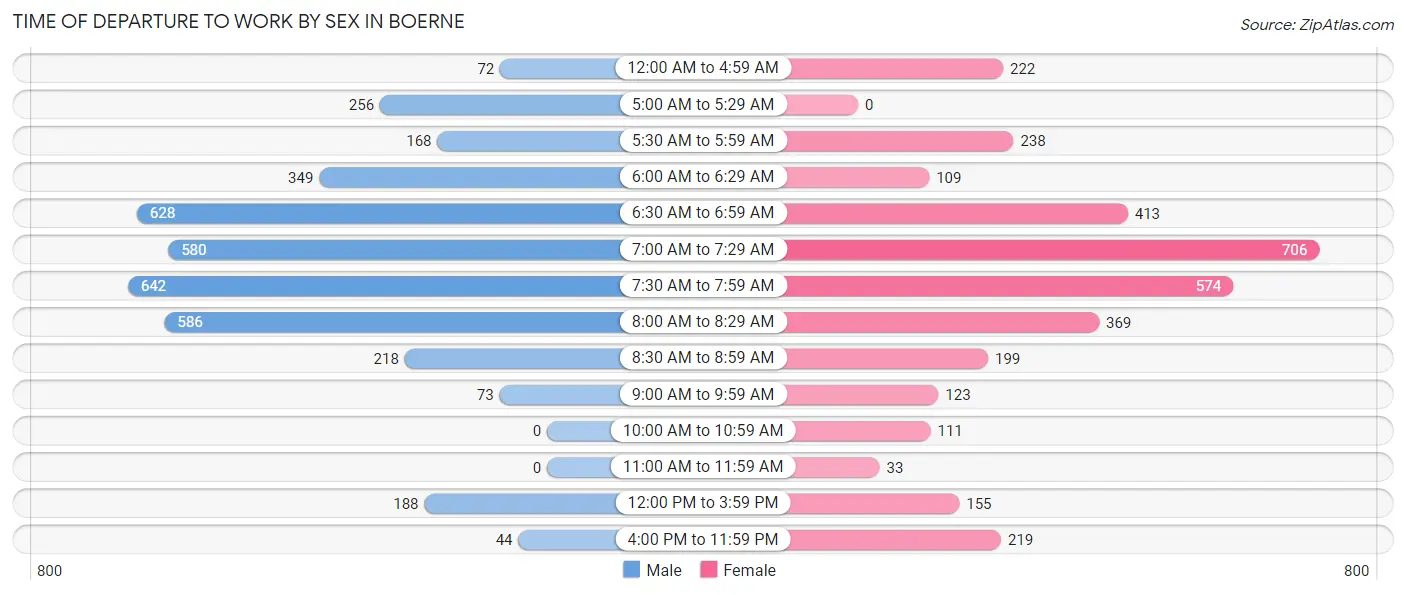
| Time of Departure | Male | Female |
| 12:00 AM to 4:59 AM | 72 (1.9%) | 222 (6.4%) |
| 5:00 AM to 5:29 AM | 256 (6.7%) | 0 (0.0%) |
| 5:30 AM to 5:59 AM | 168 (4.4%) | 238 (6.9%) |
| 6:00 AM to 6:29 AM | 349 (9.2%) | 109 (3.1%) |
| 6:30 AM to 6:59 AM | 628 (16.5%) | 413 (11.9%) |
| 7:00 AM to 7:29 AM | 580 (15.2%) | 706 (20.3%) |
| 7:30 AM to 7:59 AM | 642 (16.9%) | 574 (16.5%) |
| 8:00 AM to 8:29 AM | 586 (15.4%) | 369 (10.6%) |
| 8:30 AM to 8:59 AM | 218 (5.7%) | 199 (5.7%) |
| 9:00 AM to 9:59 AM | 73 (1.9%) | 123 (3.5%) |
| 10:00 AM to 10:59 AM | 0 (0.0%) | 111 (3.2%) |
| 11:00 AM to 11:59 AM | 0 (0.0%) | 33 (0.9%) |
| 12:00 PM to 3:59 PM | 188 (4.9%) | 155 (4.5%) |
| 4:00 PM to 11:59 PM | 44 (1.2%) | 219 (6.3%) |
| Total | 3,804 (100.0%) | 3,471 (100.0%) |
Housing Occupancy in Boerne
Occupancy by Ownership in Boerne
Of the total 6,785 dwellings in Boerne, owner-occupied units account for 4,029 (59.4%), while renter-occupied units make up 2,756 (40.6%).
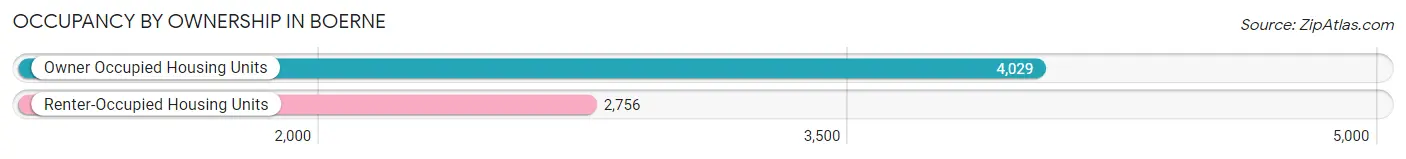
| Occupancy | # Housing Units | % Housing Units |
| Owner Occupied Housing Units | 4,029 | 59.4% |
| Renter-Occupied Housing Units | 2,756 | 40.6% |
| Total Occupied Housing Units | 6,785 | 100.0% |
Occupancy by Household Size in Boerne
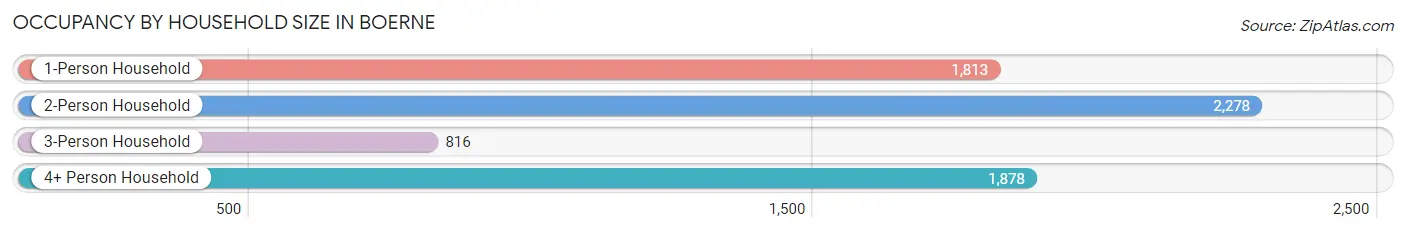
| Household Size | # Housing Units | % Housing Units |
| 1-Person Household | 1,813 | 26.7% |
| 2-Person Household | 2,278 | 33.6% |
| 3-Person Household | 816 | 12.0% |
| 4+ Person Household | 1,878 | 27.7% |
| Total Housing Units | 6,785 | 100.0% |
Occupancy by Ownership by Household Size in Boerne
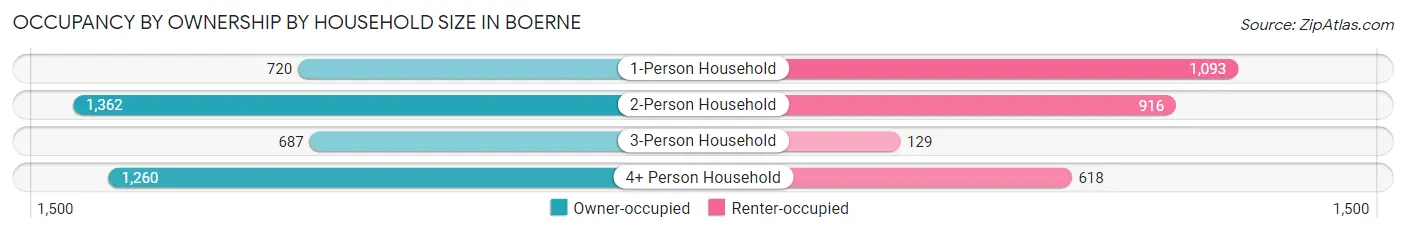
| Household Size | Owner-occupied | Renter-occupied |
| 1-Person Household | 720 (39.7%) | 1,093 (60.3%) |
| 2-Person Household | 1,362 (59.8%) | 916 (40.2%) |
| 3-Person Household | 687 (84.2%) | 129 (15.8%) |
| 4+ Person Household | 1,260 (67.1%) | 618 (32.9%) |
| Total Housing Units | 4,029 (59.4%) | 2,756 (40.6%) |
Occupancy by Educational Attainment in Boerne
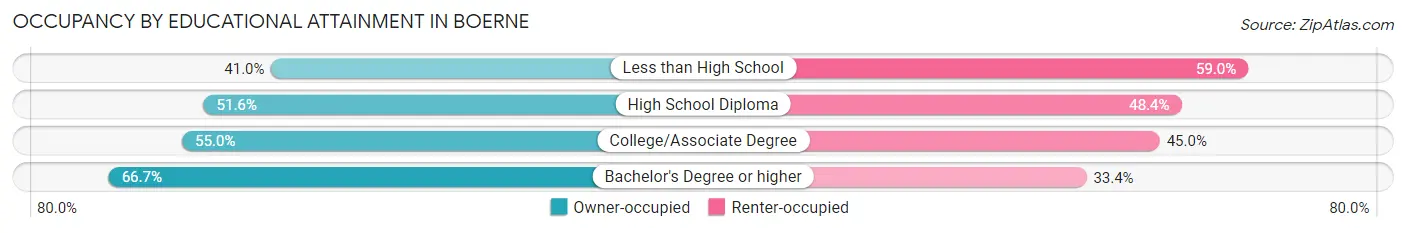
| Household Size | Owner-occupied | Renter-occupied |
| Less than High School | 169 (41.0%) | 243 (59.0%) |
| High School Diploma | 435 (51.6%) | 408 (48.4%) |
| College/Associate Degree | 1,233 (55.0%) | 1,008 (45.0%) |
| Bachelor's Degree or higher | 2,192 (66.6%) | 1,097 (33.4%) |
Occupancy by Age of Householder in Boerne
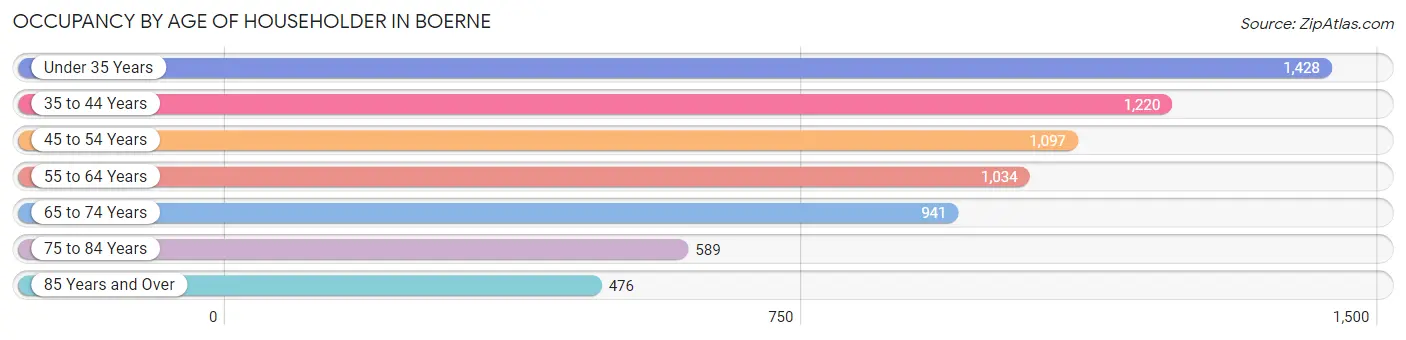
| Age Bracket | # Households | % Households |
| Under 35 Years | 1,428 | 21.0% |
| 35 to 44 Years | 1,220 | 18.0% |
| 45 to 54 Years | 1,097 | 16.2% |
| 55 to 64 Years | 1,034 | 15.2% |
| 65 to 74 Years | 941 | 13.9% |
| 75 to 84 Years | 589 | 8.7% |
| 85 Years and Over | 476 | 7.0% |
| Total | 6,785 | 100.0% |
Housing Finances in Boerne
Median Income by Occupancy in Boerne
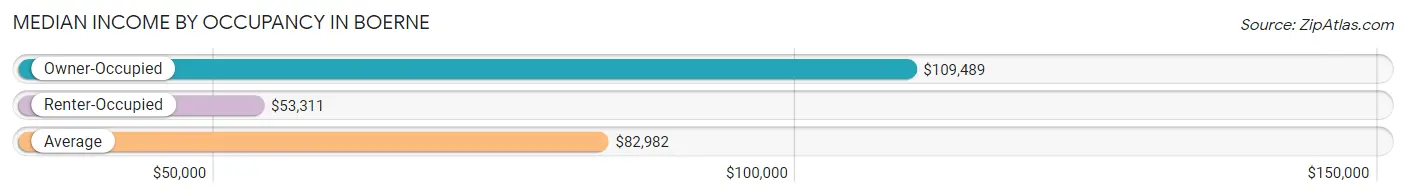
| Occupancy Type | # Households | Median Income |
| Owner-Occupied | 4,029 (59.4%) | $109,489 |
| Renter-Occupied | 2,756 (40.6%) | $53,311 |
| Average | 6,785 (100.0%) | $82,982 |
Occupancy by Householder Income Bracket in Boerne
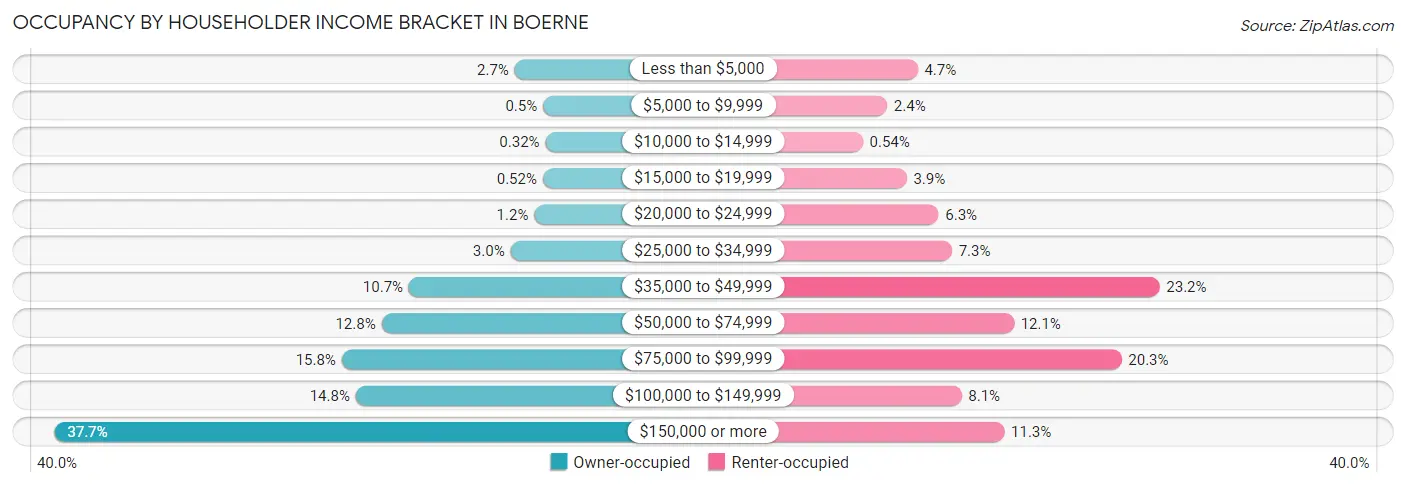
| Income Bracket | Owner-occupied | Renter-occupied |
| Less than $5,000 | 107 (2.7%) | 130 (4.7%) |
| $5,000 to $9,999 | 20 (0.5%) | 66 (2.4%) |
| $10,000 to $14,999 | 13 (0.3%) | 15 (0.5%) |
| $15,000 to $19,999 | 21 (0.5%) | 107 (3.9%) |
| $20,000 to $24,999 | 47 (1.2%) | 174 (6.3%) |
| $25,000 to $34,999 | 120 (3.0%) | 202 (7.3%) |
| $35,000 to $49,999 | 432 (10.7%) | 638 (23.2%) |
| $50,000 to $74,999 | 516 (12.8%) | 332 (12.0%) |
| $75,000 to $99,999 | 638 (15.8%) | 558 (20.3%) |
| $100,000 to $149,999 | 595 (14.8%) | 222 (8.1%) |
| $150,000 or more | 1,520 (37.7%) | 312 (11.3%) |
| Total | 4,029 (100.0%) | 2,756 (100.0%) |
Monthly Housing Cost Tiers in Boerne
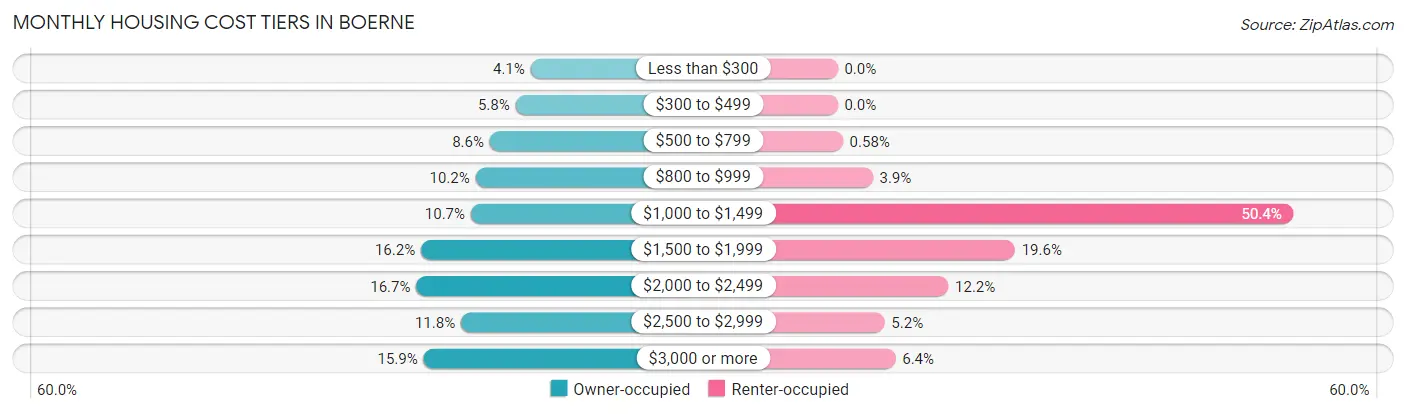
| Monthly Cost | Owner-occupied | Renter-occupied |
| Less than $300 | 165 (4.1%) | 0 (0.0%) |
| $300 to $499 | 232 (5.8%) | 0 (0.0%) |
| $500 to $799 | 347 (8.6%) | 16 (0.6%) |
| $800 to $999 | 410 (10.2%) | 107 (3.9%) |
| $1,000 to $1,499 | 431 (10.7%) | 1,389 (50.4%) |
| $1,500 to $1,999 | 653 (16.2%) | 540 (19.6%) |
| $2,000 to $2,499 | 674 (16.7%) | 337 (12.2%) |
| $2,500 to $2,999 | 475 (11.8%) | 143 (5.2%) |
| $3,000 or more | 642 (15.9%) | 176 (6.4%) |
| Total | 4,029 (100.0%) | 2,756 (100.0%) |
Physical Housing Characteristics in Boerne
Housing Structures in Boerne
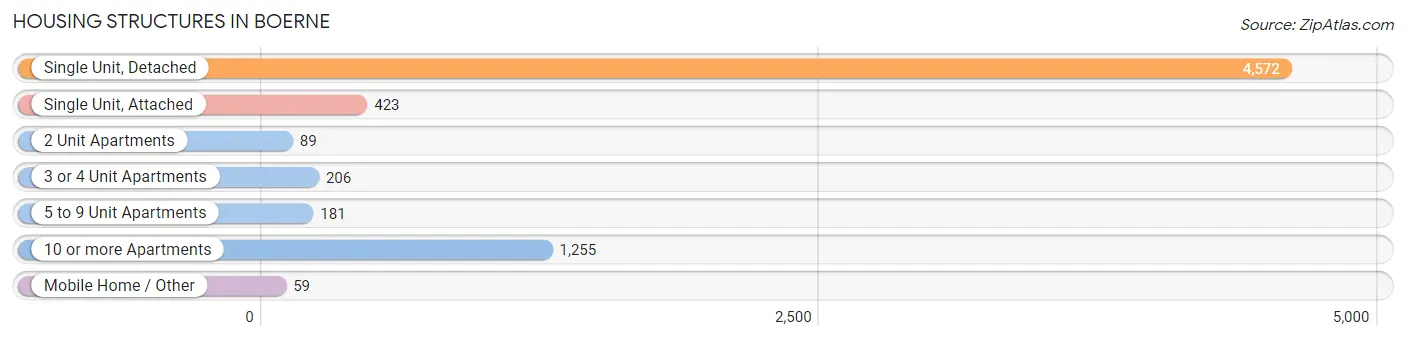
| Structure Type | # Housing Units | % Housing Units |
| Single Unit, Detached | 4,572 | 67.4% |
| Single Unit, Attached | 423 | 6.2% |
| 2 Unit Apartments | 89 | 1.3% |
| 3 or 4 Unit Apartments | 206 | 3.0% |
| 5 to 9 Unit Apartments | 181 | 2.7% |
| 10 or more Apartments | 1,255 | 18.5% |
| Mobile Home / Other | 59 | 0.9% |
| Total | 6,785 | 100.0% |
Housing Structures by Occupancy in Boerne
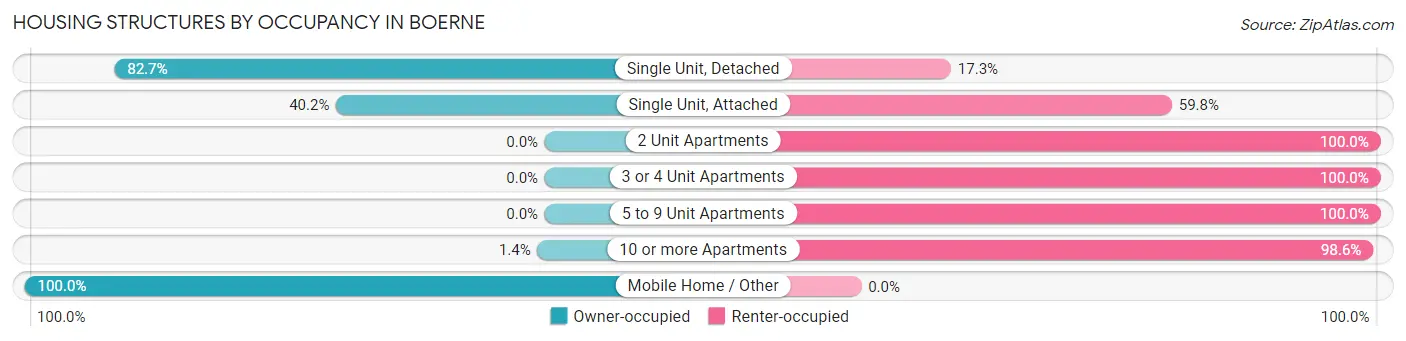
| Structure Type | Owner-occupied | Renter-occupied |
| Single Unit, Detached | 3,782 (82.7%) | 790 (17.3%) |
| Single Unit, Attached | 170 (40.2%) | 253 (59.8%) |
| 2 Unit Apartments | 0 (0.0%) | 89 (100.0%) |
| 3 or 4 Unit Apartments | 0 (0.0%) | 206 (100.0%) |
| 5 to 9 Unit Apartments | 0 (0.0%) | 181 (100.0%) |
| 10 or more Apartments | 18 (1.4%) | 1,237 (98.6%) |
| Mobile Home / Other | 59 (100.0%) | 0 (0.0%) |
| Total | 4,029 (59.4%) | 2,756 (40.6%) |
Housing Structures by Number of Rooms in Boerne
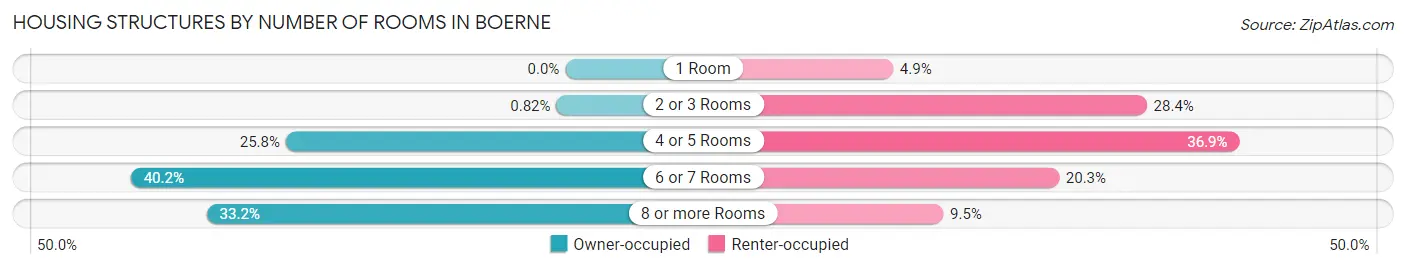
| Number of Rooms | Owner-occupied | Renter-occupied |
| 1 Room | 0 (0.0%) | 135 (4.9%) |
| 2 or 3 Rooms | 33 (0.8%) | 782 (28.4%) |
| 4 or 5 Rooms | 1,041 (25.8%) | 1,018 (36.9%) |
| 6 or 7 Rooms | 1,619 (40.2%) | 558 (20.3%) |
| 8 or more Rooms | 1,336 (33.2%) | 263 (9.5%) |
| Total | 4,029 (100.0%) | 2,756 (100.0%) |
Housing Structure by Heating Type in Boerne
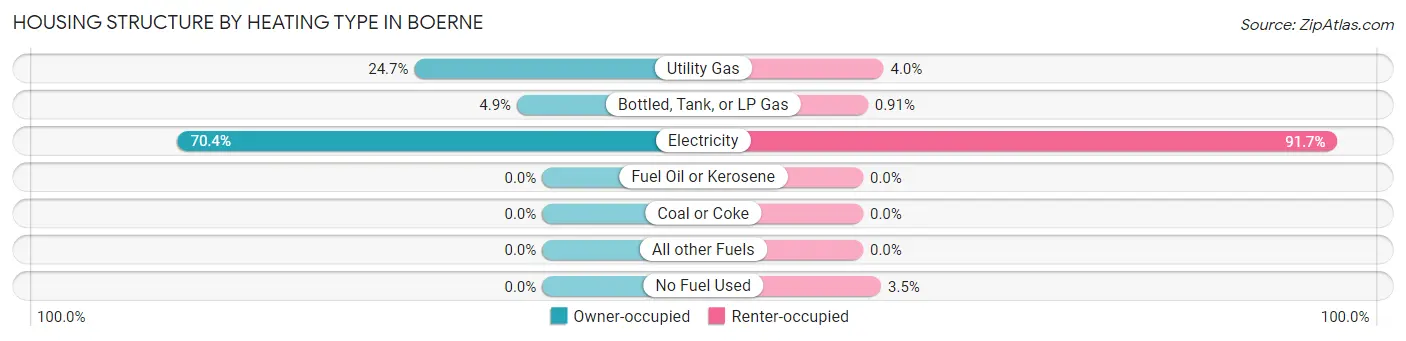
| Heating Type | Owner-occupied | Renter-occupied |
| Utility Gas | 995 (24.7%) | 109 (4.0%) |
| Bottled, Tank, or LP Gas | 196 (4.9%) | 25 (0.9%) |
| Electricity | 2,838 (70.4%) | 2,526 (91.6%) |
| Fuel Oil or Kerosene | 0 (0.0%) | 0 (0.0%) |
| Coal or Coke | 0 (0.0%) | 0 (0.0%) |
| All other Fuels | 0 (0.0%) | 0 (0.0%) |
| No Fuel Used | 0 (0.0%) | 96 (3.5%) |
| Total | 4,029 (100.0%) | 2,756 (100.0%) |
Household Vehicle Usage in Boerne
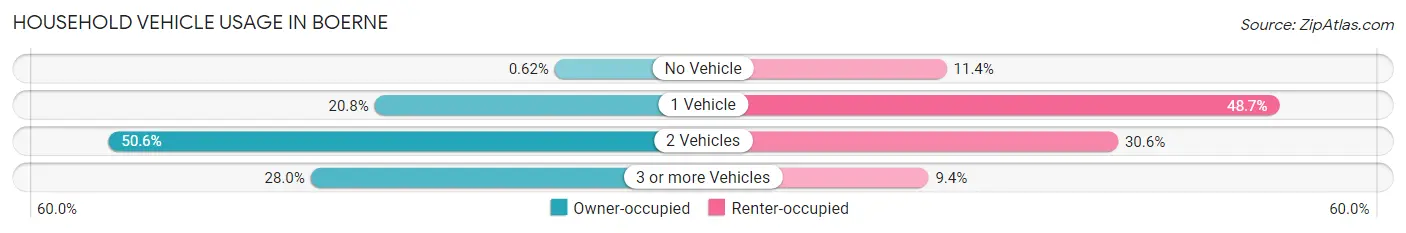
| Vehicles per Household | Owner-occupied | Renter-occupied |
| No Vehicle | 25 (0.6%) | 314 (11.4%) |
| 1 Vehicle | 838 (20.8%) | 1,341 (48.7%) |
| 2 Vehicles | 2,039 (50.6%) | 843 (30.6%) |
| 3 or more Vehicles | 1,127 (28.0%) | 258 (9.4%) |
| Total | 4,029 (100.0%) | 2,756 (100.0%) |
Real Estate & Mortgages in Boerne
Real Estate and Mortgage Overview in Boerne
| Characteristic | Without Mortgage | With Mortgage |
| Housing Units | 1,324 | 2,705 |
| Median Property Value | $413,700 | $392,100 |
| Median Household Income | $67,727 | $1,262 |
| Monthly Housing Costs | $826 | $629 |
| Real Estate Taxes | $4,523 | $118 |
Property Value by Mortgage Status in Boerne
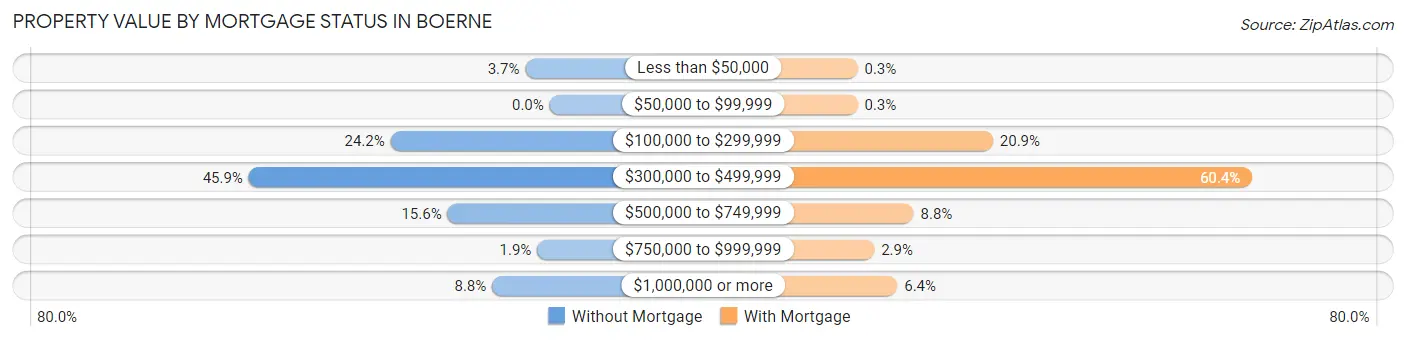
| Property Value | Without Mortgage | With Mortgage |
| Less than $50,000 | 49 (3.7%) | 8 (0.3%) |
| $50,000 to $99,999 | 0 (0.0%) | 8 (0.3%) |
| $100,000 to $299,999 | 321 (24.2%) | 566 (20.9%) |
| $300,000 to $499,999 | 607 (45.9%) | 1,635 (60.4%) |
| $500,000 to $749,999 | 206 (15.6%) | 239 (8.8%) |
| $750,000 to $999,999 | 25 (1.9%) | 77 (2.9%) |
| $1,000,000 or more | 116 (8.8%) | 172 (6.4%) |
| Total | 1,324 (100.0%) | 2,705 (100.0%) |
Household Income by Mortgage Status in Boerne
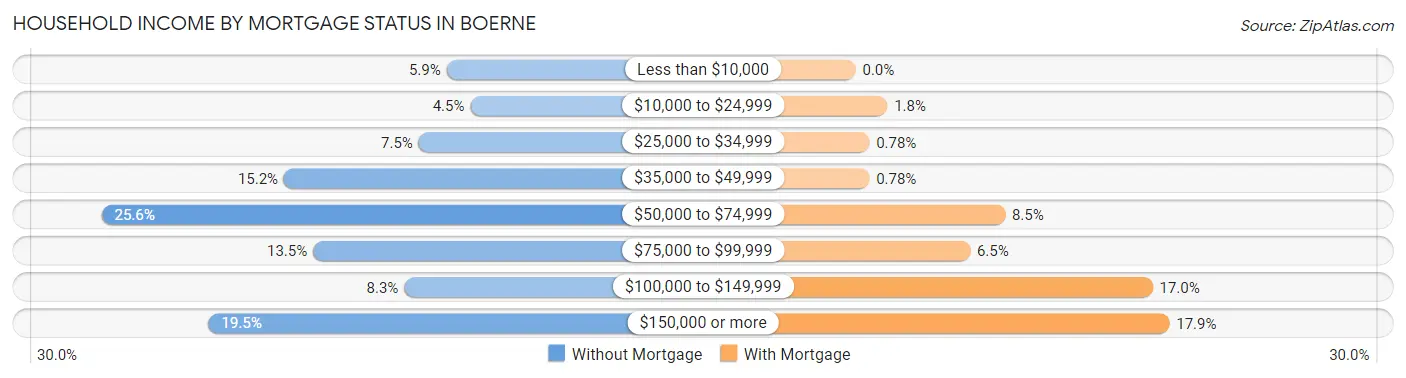
| Household Income | Without Mortgage | With Mortgage |
| Less than $10,000 | 78 (5.9%) | 0 (0.0%) |
| $10,000 to $24,999 | 60 (4.5%) | 49 (1.8%) |
| $25,000 to $34,999 | 99 (7.5%) | 21 (0.8%) |
| $35,000 to $49,999 | 201 (15.2%) | 21 (0.8%) |
| $50,000 to $74,999 | 339 (25.6%) | 231 (8.5%) |
| $75,000 to $99,999 | 179 (13.5%) | 177 (6.5%) |
| $100,000 to $149,999 | 110 (8.3%) | 459 (17.0%) |
| $150,000 or more | 258 (19.5%) | 485 (17.9%) |
| Total | 1,324 (100.0%) | 2,705 (100.0%) |
Property Value to Household Income Ratio in Boerne
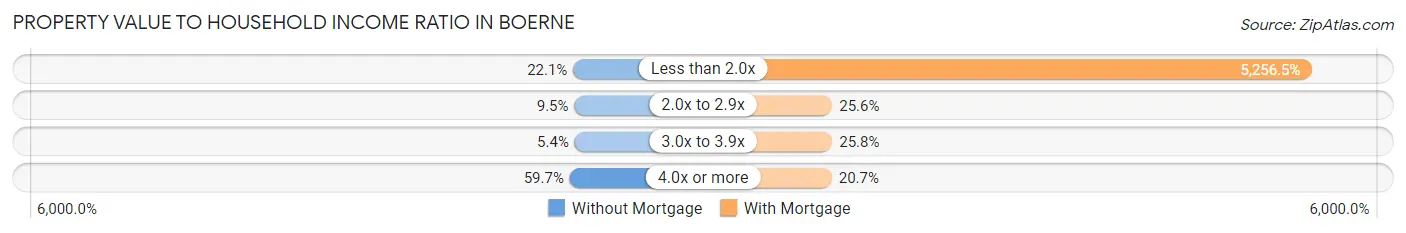
| Value-to-Income Ratio | Without Mortgage | With Mortgage |
| Less than 2.0x | 293 (22.1%) | 142,188 (5,256.5%) |
| 2.0x to 2.9x | 126 (9.5%) | 692 (25.6%) |
| 3.0x to 3.9x | 71 (5.4%) | 699 (25.8%) |
| 4.0x or more | 791 (59.7%) | 559 (20.7%) |
| Total | 1,324 (100.0%) | 2,705 (100.0%) |
Real Estate Taxes by Mortgage Status in Boerne
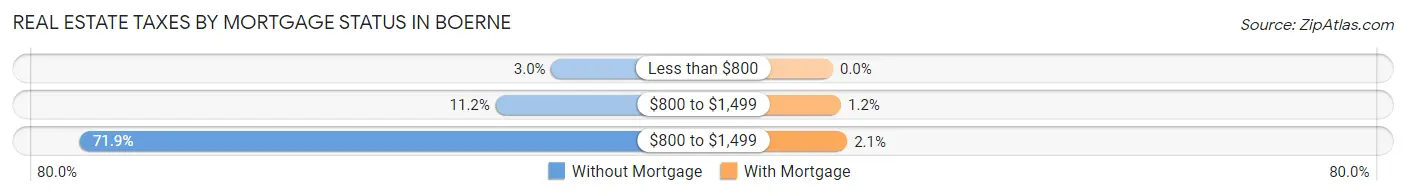
| Property Taxes | Without Mortgage | With Mortgage |
| Less than $800 | 40 (3.0%) | 0 (0.0%) |
| $800 to $1,499 | 148 (11.2%) | 32 (1.2%) |
| $800 to $1,499 | 952 (71.9%) | 56 (2.1%) |
| Total | 1,324 (100.0%) | 2,705 (100.0%) |
Health & Disability in Boerne
Health Insurance Coverage by Age in Boerne
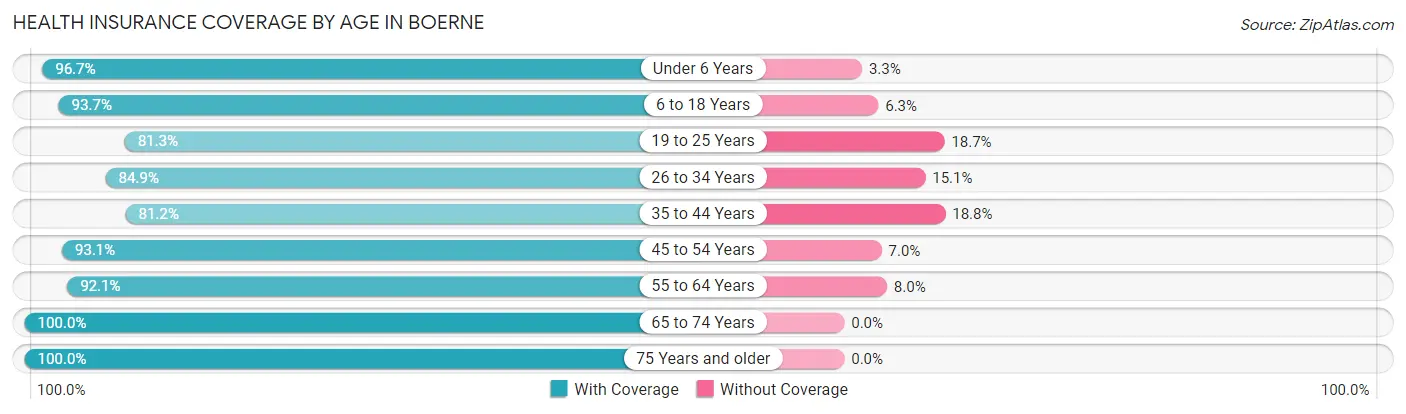
| Age Bracket | With Coverage | Without Coverage |
| Under 6 Years | 1,318 (96.7%) | 45 (3.3%) |
| 6 to 18 Years | 3,382 (93.7%) | 229 (6.3%) |
| 19 to 25 Years | 1,097 (81.3%) | 252 (18.7%) |
| 26 to 34 Years | 1,608 (84.9%) | 286 (15.1%) |
| 35 to 44 Years | 2,285 (81.2%) | 530 (18.8%) |
| 45 to 54 Years | 1,994 (93.0%) | 149 (7.0%) |
| 55 to 64 Years | 1,679 (92.0%) | 145 (8.0%) |
| 65 to 74 Years | 1,443 (100.0%) | 0 (0.0%) |
| 75 Years and older | 1,543 (100.0%) | 0 (0.0%) |
| Total | 16,349 (90.9%) | 1,636 (9.1%) |
Health Insurance Coverage by Citizenship Status in Boerne
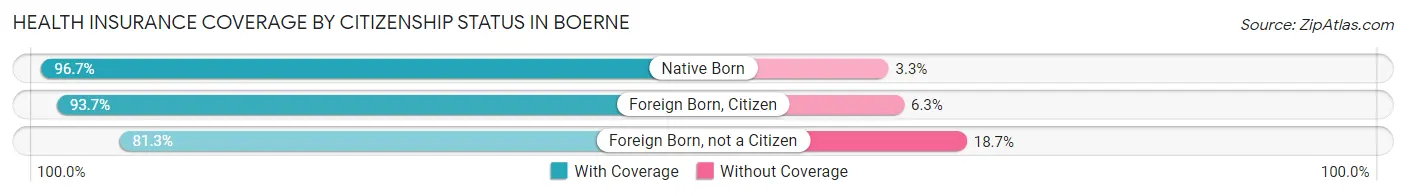
| Citizenship Status | With Coverage | Without Coverage |
| Native Born | 1,318 (96.7%) | 45 (3.3%) |
| Foreign Born, Citizen | 3,382 (93.7%) | 229 (6.3%) |
| Foreign Born, not a Citizen | 1,097 (81.3%) | 252 (18.7%) |
Health Insurance Coverage by Household Income in Boerne
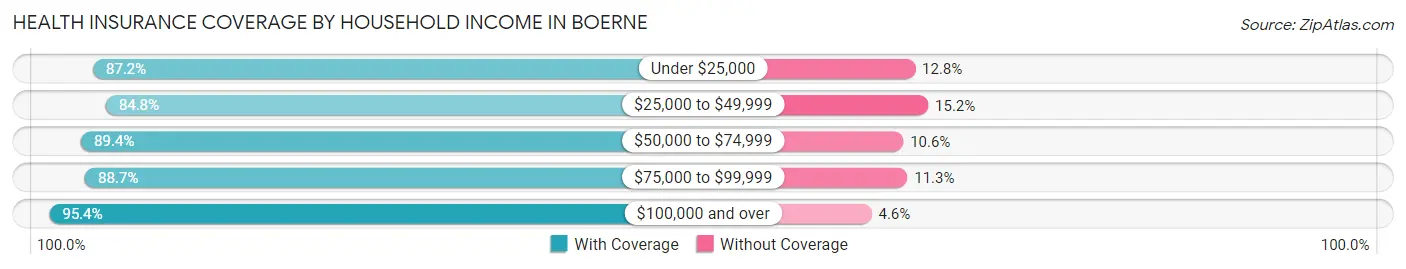
| Household Income | With Coverage | Without Coverage |
| Under $25,000 | 988 (87.2%) | 145 (12.8%) |
| $25,000 to $49,999 | 2,883 (84.8%) | 518 (15.2%) |
| $50,000 to $74,999 | 1,573 (89.4%) | 186 (10.6%) |
| $75,000 to $99,999 | 3,264 (88.7%) | 417 (11.3%) |
| $100,000 and over | 7,620 (95.4%) | 370 (4.6%) |
Public vs Private Health Insurance Coverage by Age in Boerne
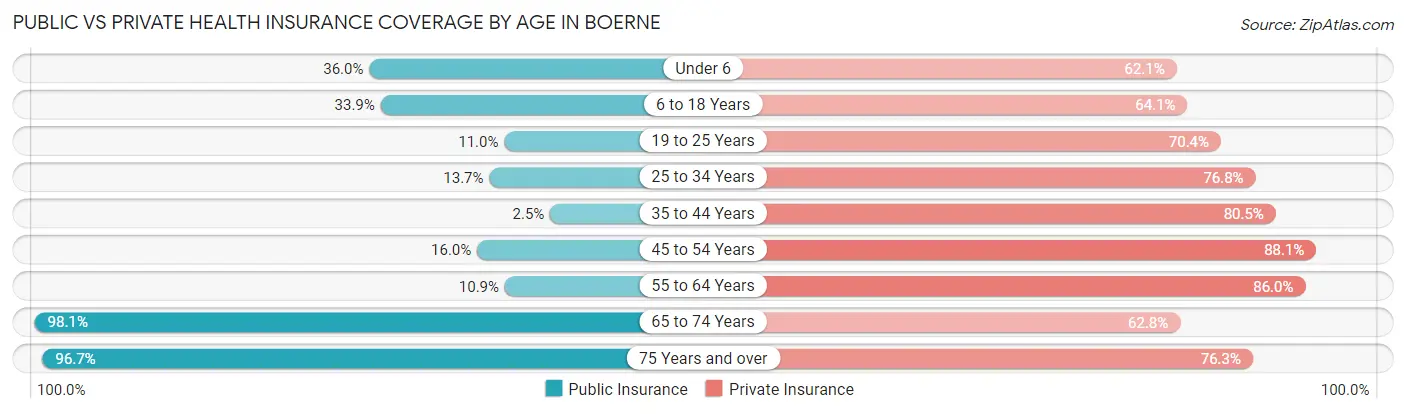
| Age Bracket | Public Insurance | Private Insurance |
| Under 6 | 491 (36.0%) | 847 (62.1%) |
| 6 to 18 Years | 1,225 (33.9%) | 2,316 (64.1%) |
| 19 to 25 Years | 148 (11.0%) | 949 (70.4%) |
| 25 to 34 Years | 260 (13.7%) | 1,454 (76.8%) |
| 35 to 44 Years | 69 (2.5%) | 2,267 (80.5%) |
| 45 to 54 Years | 343 (16.0%) | 1,887 (88.0%) |
| 55 to 64 Years | 198 (10.9%) | 1,569 (86.0%) |
| 65 to 74 Years | 1,416 (98.1%) | 906 (62.8%) |
| 75 Years and over | 1,492 (96.7%) | 1,177 (76.3%) |
| Total | 5,642 (31.4%) | 13,372 (74.4%) |
Disability Status by Sex by Age in Boerne
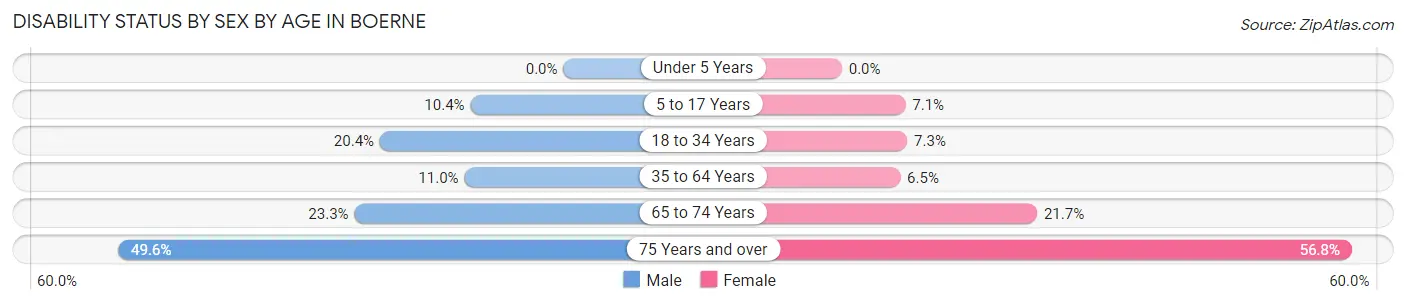
| Age Bracket | Male | Female |
| Under 5 Years | 0 (0.0%) | 0 (0.0%) |
| 5 to 17 Years | 202 (10.3%) | 116 (7.1%) |
| 18 to 34 Years | 321 (20.4%) | 142 (7.3%) |
| 35 to 64 Years | 366 (11.0%) | 225 (6.5%) |
| 65 to 74 Years | 141 (23.3%) | 182 (21.7%) |
| 75 Years and over | 305 (49.6%) | 527 (56.8%) |
Disability Class by Sex by Age in Boerne
Disability Class: Hearing Difficulty
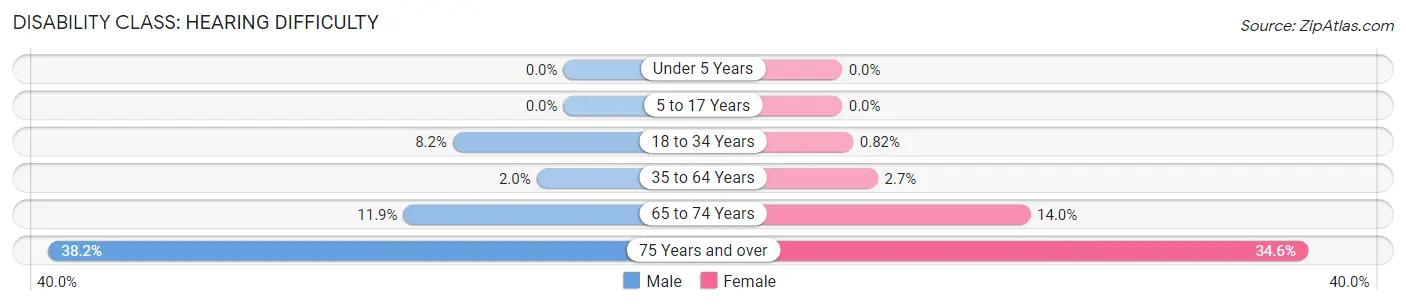
| Age Bracket | Male | Female |
| Under 5 Years | 0 (0.0%) | 0 (0.0%) |
| 5 to 17 Years | 0 (0.0%) | 0 (0.0%) |
| 18 to 34 Years | 129 (8.2%) | 16 (0.8%) |
| 35 to 64 Years | 66 (2.0%) | 92 (2.7%) |
| 65 to 74 Years | 72 (11.9%) | 117 (14.0%) |
| 75 Years and over | 235 (38.2%) | 321 (34.6%) |
Disability Class: Vision Difficulty
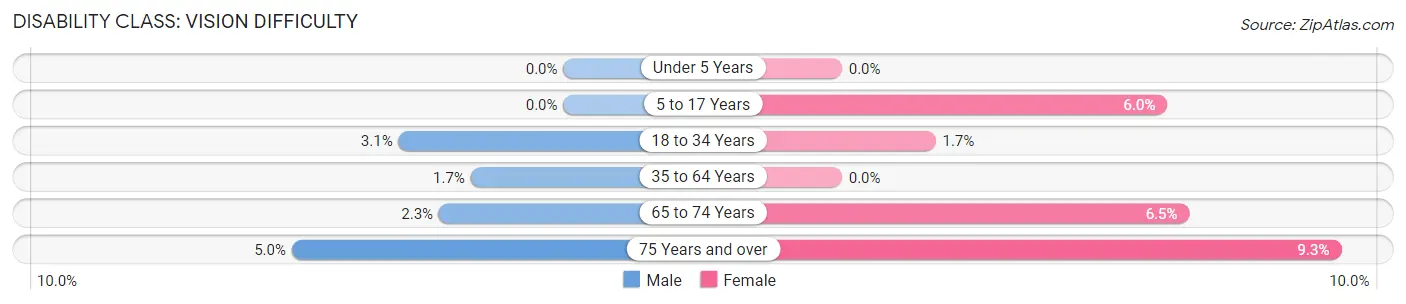
| Age Bracket | Male | Female |
| Under 5 Years | 0 (0.0%) | 0 (0.0%) |
| 5 to 17 Years | 0 (0.0%) | 99 (6.0%) |
| 18 to 34 Years | 48 (3.1%) | 34 (1.7%) |
| 35 to 64 Years | 57 (1.7%) | 0 (0.0%) |
| 65 to 74 Years | 14 (2.3%) | 54 (6.5%) |
| 75 Years and over | 31 (5.0%) | 86 (9.3%) |
Disability Class: Cognitive Difficulty
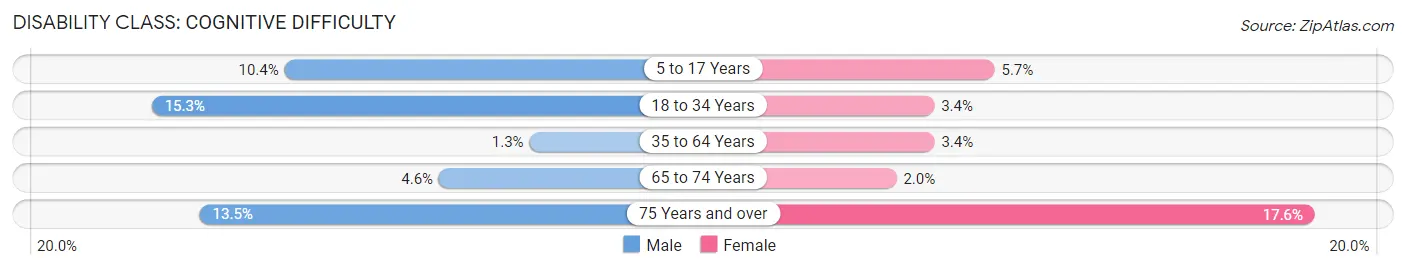
| Age Bracket | Male | Female |
| 5 to 17 Years | 202 (10.3%) | 93 (5.7%) |
| 18 to 34 Years | 240 (15.3%) | 67 (3.4%) |
| 35 to 64 Years | 42 (1.3%) | 119 (3.4%) |
| 65 to 74 Years | 28 (4.6%) | 17 (2.0%) |
| 75 Years and over | 83 (13.5%) | 163 (17.6%) |
Disability Class: Ambulatory Difficulty
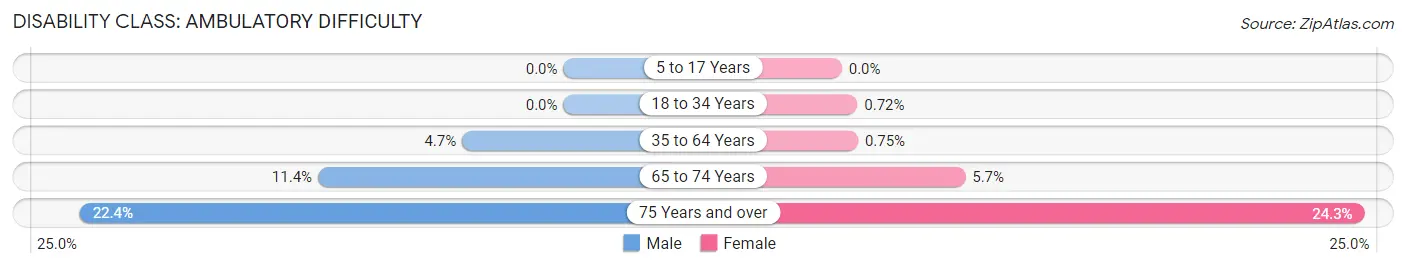
| Age Bracket | Male | Female |
| 5 to 17 Years | 0 (0.0%) | 0 (0.0%) |
| 18 to 34 Years | 0 (0.0%) | 14 (0.7%) |
| 35 to 64 Years | 156 (4.7%) | 26 (0.7%) |
| 65 to 74 Years | 69 (11.4%) | 48 (5.7%) |
| 75 Years and over | 138 (22.4%) | 225 (24.2%) |
Disability Class: Self-Care Difficulty
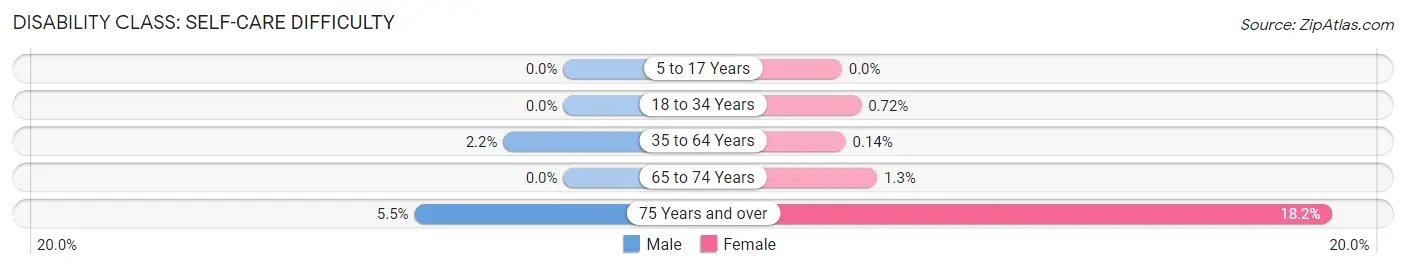
| Age Bracket | Male | Female |
| 5 to 17 Years | 0 (0.0%) | 0 (0.0%) |
| 18 to 34 Years | 0 (0.0%) | 14 (0.7%) |
| 35 to 64 Years | 74 (2.2%) | 5 (0.1%) |
| 65 to 74 Years | 0 (0.0%) | 11 (1.3%) |
| 75 Years and over | 34 (5.5%) | 169 (18.2%) |
Technology Access in Boerne
Computing Device Access in Boerne
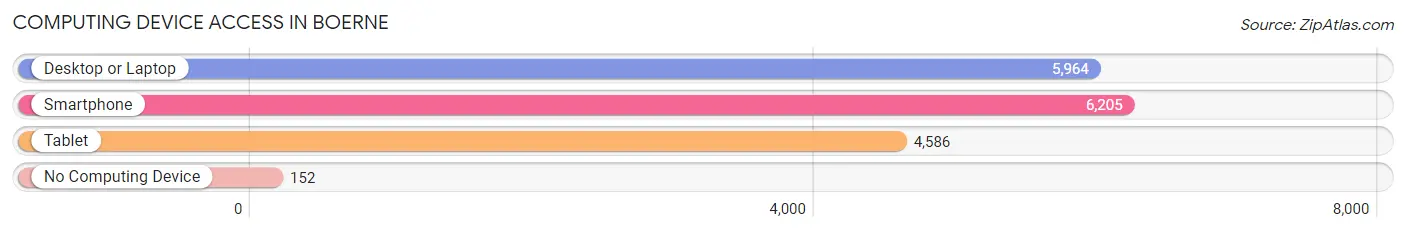
| Device Type | # Households | % Households |
| Desktop or Laptop | 5,964 | 87.9% |
| Smartphone | 6,205 | 91.4% |
| Tablet | 4,586 | 67.6% |
| No Computing Device | 152 | 2.2% |
| Total | 6,785 | 100.0% |
Internet Access in Boerne
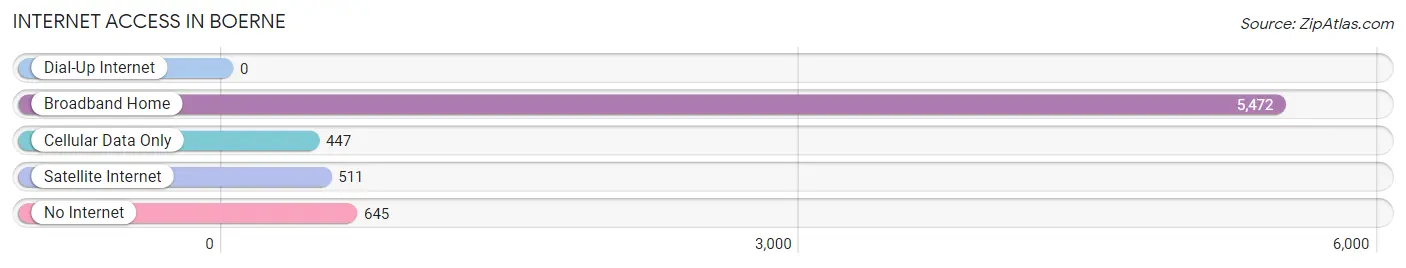
| Internet Type | # Households | % Households |
| Dial-Up Internet | 0 | 0.0% |
| Broadband Home | 5,472 | 80.6% |
| Cellular Data Only | 447 | 6.6% |
| Satellite Internet | 511 | 7.5% |
| No Internet | 645 | 9.5% |
| Total | 6,785 | 100.0% |
Boerne Summary
Boerne, Texas is a small city located in Kendall County, Texas, about 30 miles northwest of San Antonio. It is part of the San Antonio-New Braunfels Metropolitan Statistical Area. Boerne was founded in 1849 by German settlers, and the city’s name is derived from a German word meaning “hill” or “knoll.” Boerne is known for its historic downtown area, which is lined with shops, restaurants, and other businesses.
History
Boerne was founded in 1849 by German settlers, who were attracted to the area by its rolling hills and lush vegetation. The settlers named the town after a German word meaning “hill” or “knoll.” The town was originally called “Tusculum,” but the name was changed to Boerne in 1852.
The town quickly grew, and by the late 1800s, it had become a popular tourist destination. Boerne was known for its natural beauty, and visitors came to enjoy the area’s rolling hills, lush vegetation, and clear streams.
In the early 1900s, Boerne began to experience a period of growth and development. The town was incorporated in 1909, and the first public school was established in 1910. The city continued to grow throughout the 20th century, and by the 2000s, it had become a popular destination for tourists and retirees.
Geography
Boerne is located in Kendall County, Texas, about 30 miles northwest of San Antonio. The city is situated on the Balcones Escarpment, a geological formation that runs through Central Texas. The Balcones Escarpment is characterized by rolling hills and lush vegetation, and it provides a beautiful backdrop for the city of Boerne.
The city covers an area of 8.3 square miles, and it is bordered by the cities of Comfort, Fair Oaks Ranch, and Sisterdale. Boerne is located at the intersection of Interstate 10 and State Highway 46, and it is about an hour’s drive from San Antonio.
Economy
Boerne’s economy is largely driven by tourism and retail. The city is home to several popular tourist attractions, including the Cibolo Nature Center, the Boerne City Park, and the Boerne Visitor Center. The city also has a vibrant retail sector, with numerous shops, restaurants, and other businesses located in the historic downtown area.
In addition to tourism and retail, Boerne is also home to several manufacturing and technology companies. The city is home to the headquarters of several major companies, including Valero Energy Corporation, USAA, and Rackspace.
Demographics
As of the 2010 census, Boerne had a population of 10,471. The city’s population is predominantly white (86.3%), with smaller percentages of Hispanic (7.7%), African American (2.3%), and Asian (1.7%) residents. The median household income in Boerne is $68,845, and the median home value is $231,400. The city’s unemployment rate is 3.2%, which is lower than the national average.
Common Questions
What is Per Capita Income in Boerne?
Per Capita income in Boerne is $44,305.
What is the Median Family Income in Boerne?
Median Family Income in Boerne is $98,142.
What is the Median Household income in Boerne?
Median Household Income in Boerne is $82,982.
What is Income or Wage Gap in Boerne?
Income or Wage Gap in Boerne is 43.7%.
Women in Boerne earn 56.3 cents for every dollar earned by a man.
What is Family Income Deficit in Boerne?
Family Income Deficit in Boerne is $16,863.
Families that are below poverty line in Boerne earn $16,863 less on average than the poverty threshold level.
What is Inequality or Gini Index in Boerne?
Inequality or Gini Index in Boerne is 0.46.
What is the Total Population of Boerne?
Total Population of Boerne is 18,475.
What is the Total Male Population of Boerne?
Total Male Population of Boerne is 8,991.
What is the Total Female Population of Boerne?
Total Female Population of Boerne is 9,484.
What is the Ratio of Males per 100 Females in Boerne?
There are 94.80 Males per 100 Females in Boerne.
What is the Ratio of Females per 100 Males in Boerne?
There are 105.48 Females per 100 Males in Boerne.
What is the Median Population Age in Boerne?
Median Population Age in Boerne is 38.3 Years.
What is the Average Family Size in Boerne
Average Family Size in Boerne is 3.2 People.
What is the Average Household Size in Boerne
Average Household Size in Boerne is 2.6 People.
How Large is the Labor Force in Boerne?
There are 8,997 People in the Labor Forcein in Boerne.
What is the Percentage of People in the Labor Force in Boerne?
63.0% of People are in the Labor Force in Boerne.
What is the Unemployment Rate in Boerne?
Unemployment Rate in Boerne is 2.5%.