Blanco, TX Map & Demographics
Blanco Map
Blanco Overview
$31,702
PER CAPITA INCOME
$70,500
AVG FAMILY INCOME
$59,601
AVG HOUSEHOLD INCOME
27.0%
WAGE / INCOME GAP [ % ]
73.0¢/ $1
WAGE / INCOME GAP [ $ ]
0.42
INEQUALITY / GINI INDEX
2,147
TOTAL POPULATION
1,044
MALE POPULATION
1,103
FEMALE POPULATION
94.65
MALES / 100 FEMALES
105.65
FEMALES / 100 MALES
33.7
MEDIAN AGE
3.4
AVG FAMILY SIZE
2.5
AVG HOUSEHOLD SIZE
1,108
LABOR FORCE [ PEOPLE ]
64.1%
PERCENT IN LABOR FORCE
2.7%
UNEMPLOYMENT RATE
Blanco Zip Codes
Blanco Area Codes
Income in Blanco
Income Overview in Blanco
Per Capita Income in Blanco is $31,702, while median incomes of families and households are $70,500 and $59,601 respectively.
| Characteristic | Number | Measure |
| Per Capita Income | 2,147 | $31,702 |
| Median Family Income | 438 | $70,500 |
| Mean Family Income | 438 | $91,382 |
| Median Household Income | 861 | $59,601 |
| Mean Household Income | 861 | $81,284 |
| Income Deficit | 438 | $0 |
| Wage / Income Gap (%) | 2,147 | 26.98% |
| Wage / Income Gap ($) | 2,147 | 73.02¢ per $1 |
| Gini / Inequality Index | 2,147 | 0.42 |
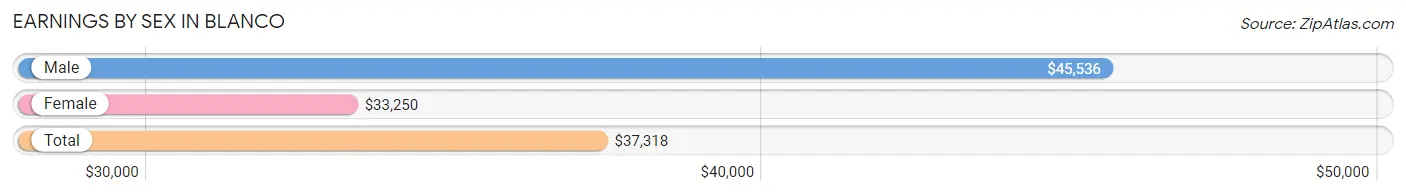
Earnings by Sex in Blanco
Average Earnings in Blanco are $37,318, $45,536 for men and $33,250 for women, a difference of 27.0%.
| Sex | Number | Average Earnings |
| Male | 617 (54.7%) | $45,536 |
| Female | 510 (45.3%) | $33,250 |
| Total | 1,127 (100.0%) | $37,318 |
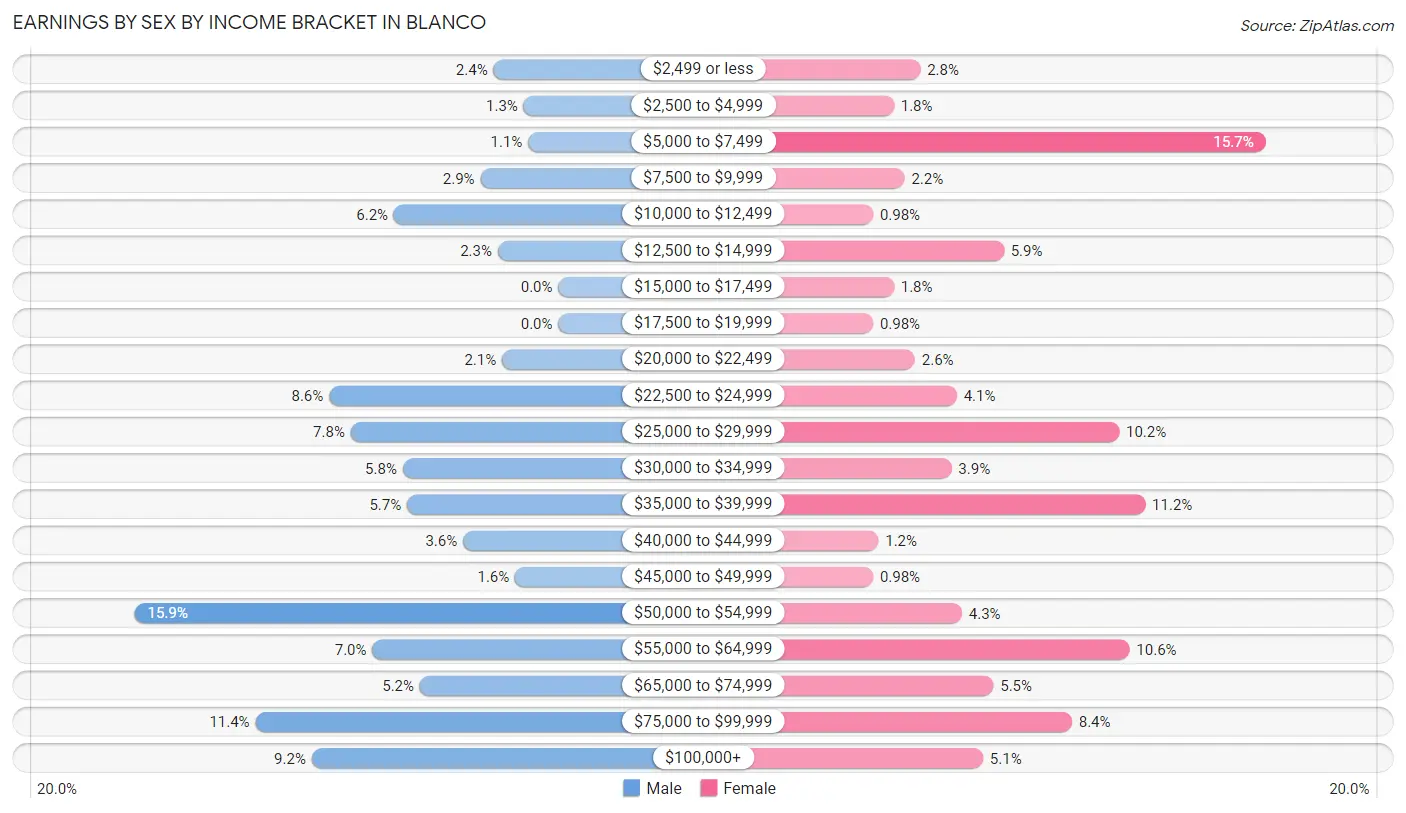
Earnings by Sex by Income Bracket in Blanco
The most common earnings brackets in Blanco are $50,000 to $54,999 for men (98 | 15.9%) and $5,000 to $7,499 for women (80 | 15.7%).
| Income | Male | Female |
| $2,499 or less | 15 (2.4%) | 14 (2.8%) |
| $2,500 to $4,999 | 8 (1.3%) | 9 (1.8%) |
| $5,000 to $7,499 | 7 (1.1%) | 80 (15.7%) |
| $7,500 to $9,999 | 18 (2.9%) | 11 (2.2%) |
| $10,000 to $12,499 | 38 (6.2%) | 5 (1.0%) |
| $12,500 to $14,999 | 14 (2.3%) | 30 (5.9%) |
| $15,000 to $17,499 | 0 (0.0%) | 9 (1.8%) |
| $17,500 to $19,999 | 0 (0.0%) | 5 (1.0%) |
| $20,000 to $22,499 | 13 (2.1%) | 13 (2.5%) |
| $22,500 to $24,999 | 53 (8.6%) | 21 (4.1%) |
| $25,000 to $29,999 | 48 (7.8%) | 52 (10.2%) |
| $30,000 to $34,999 | 36 (5.8%) | 20 (3.9%) |
| $35,000 to $39,999 | 35 (5.7%) | 57 (11.2%) |
| $40,000 to $44,999 | 22 (3.6%) | 6 (1.2%) |
| $45,000 to $49,999 | 10 (1.6%) | 5 (1.0%) |
| $50,000 to $54,999 | 98 (15.9%) | 22 (4.3%) |
| $55,000 to $64,999 | 43 (7.0%) | 54 (10.6%) |
| $65,000 to $74,999 | 32 (5.2%) | 28 (5.5%) |
| $75,000 to $99,999 | 70 (11.4%) | 43 (8.4%) |
| $100,000+ | 57 (9.2%) | 26 (5.1%) |
| Total | 617 (100.0%) | 510 (100.0%) |
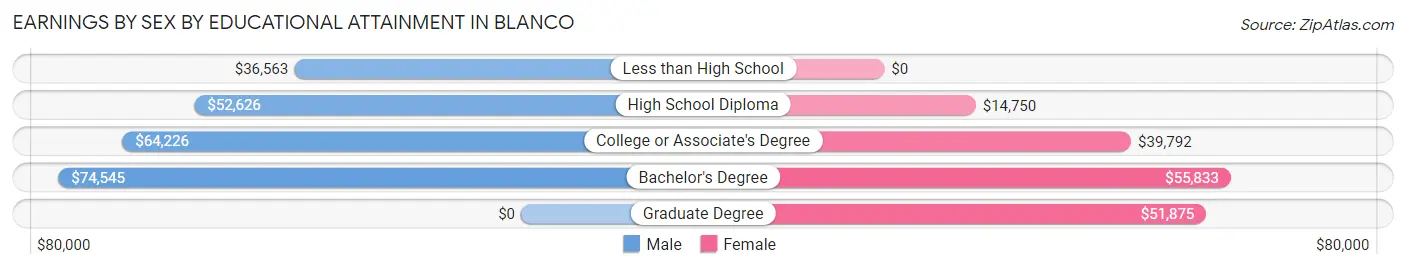
Earnings by Sex by Educational Attainment in Blanco
Average earnings in Blanco are $53,413 for men and $34,813 for women, a difference of 34.8%. Men with an educational attainment of bachelor's degree enjoy the highest average annual earnings of $74,545, while those with less than high school education earn the least with $36,563. Women with an educational attainment of bachelor's degree earn the most with the average annual earnings of $55,833, while those with high school diploma education have the smallest earnings of $14,750.
| Educational Attainment | Male Income | Female Income |
| Less than High School | $36,563 | $0 |
| High School Diploma | $52,626 | $14,750 |
| College or Associate's Degree | $64,226 | $39,792 |
| Bachelor's Degree | $74,545 | $55,833 |
| Graduate Degree | - | - |
| Total | $53,413 | $34,813 |
Family Income in Blanco
Family Income Brackets in Blanco
According to the Blanco family income data, there are 93 families falling into the $50,000 to $74,999 income range, which is the most common income bracket and makes up 21.2% of all families.
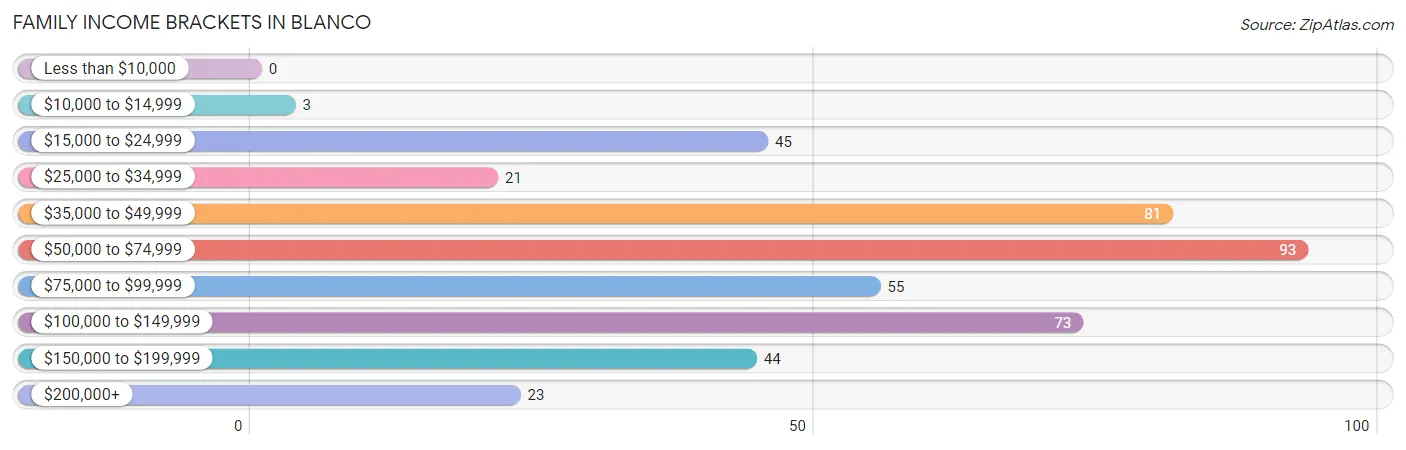
| Income Bracket | # Families | % Families |
| Less than $10,000 | 0 | 0.0% |
| $10,000 to $14,999 | 3 | 0.7% |
| $15,000 to $24,999 | 45 | 10.3% |
| $25,000 to $34,999 | 21 | 4.8% |
| $35,000 to $49,999 | 81 | 18.5% |
| $50,000 to $74,999 | 93 | 21.2% |
| $75,000 to $99,999 | 55 | 12.6% |
| $100,000 to $149,999 | 73 | 16.7% |
| $150,000 to $199,999 | 44 | 10.0% |
| $200,000+ | 23 | 5.3% |
Family Income by Famaliy Size in Blanco
4-person families (84 | 19.2%) account for the highest median family income in Blanco with $104,167 per family, while 2-person families (181 | 41.3%) have the highest median income of $34,598 per family member.
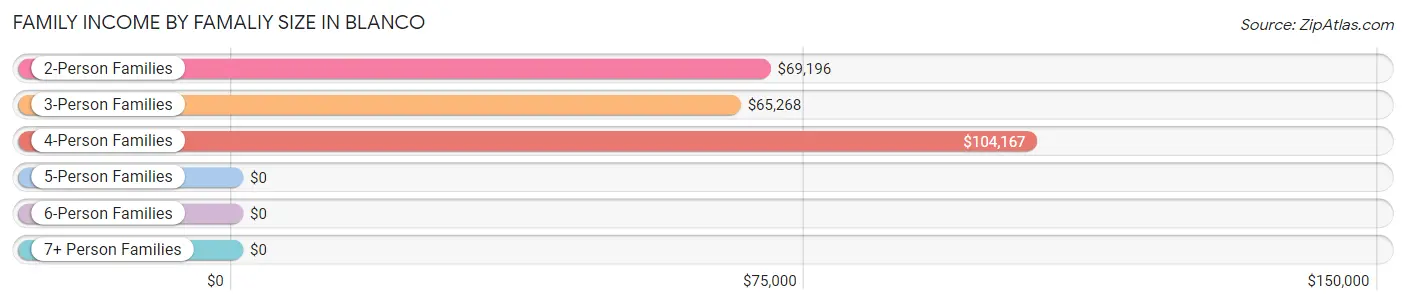
| Income Bracket | # Families | Median Income |
| 2-Person Families | 181 (41.3%) | $69,196 |
| 3-Person Families | 125 (28.5%) | $65,268 |
| 4-Person Families | 84 (19.2%) | $104,167 |
| 5-Person Families | 30 (6.9%) | $0 |
| 6-Person Families | 18 (4.1%) | $0 |
| 7+ Person Families | 0 (0.0%) | $0 |
| Total | 438 (100.0%) | $70,500 |
Family Income by Number of Earners in Blanco
The median family income in Blanco is $70,500, with families comprising 3+ earners (40) having the highest median family income of $185,833, while families with no earners (37) have the lowest median family income of $42,250, accounting for 9.1% and 8.5% of families, respectively.
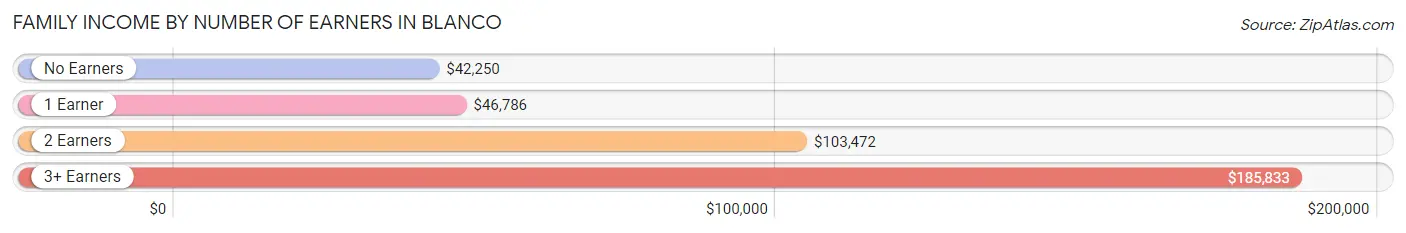
| Number of Earners | # Families | Median Income |
| No Earners | 37 (8.5%) | $42,250 |
| 1 Earner | 192 (43.8%) | $46,786 |
| 2 Earners | 169 (38.6%) | $103,472 |
| 3+ Earners | 40 (9.1%) | $185,833 |
| Total | 438 (100.0%) | $70,500 |
Household Income in Blanco
Household Income Brackets in Blanco
With 178 households falling in the category, the $50,000 to $74,999 income range is the most frequent in Blanco, accounting for 20.7% of all households. In contrast, only 5 households (0.6%) fall into the less than $10,000 income bracket, making it the least populous group.
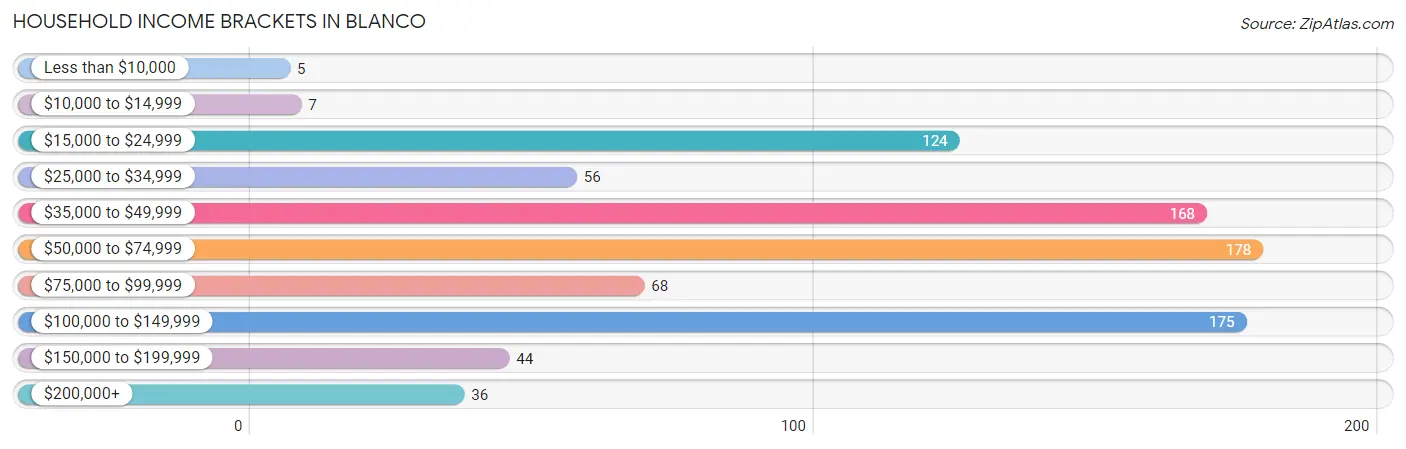
| Income Bracket | # Households | % Households |
| Less than $10,000 | 5 | 0.6% |
| $10,000 to $14,999 | 7 | 0.8% |
| $15,000 to $24,999 | 124 | 14.4% |
| $25,000 to $34,999 | 56 | 6.5% |
| $35,000 to $49,999 | 168 | 19.5% |
| $50,000 to $74,999 | 178 | 20.7% |
| $75,000 to $99,999 | 68 | 7.9% |
| $100,000 to $149,999 | 175 | 20.3% |
| $150,000 to $199,999 | 44 | 5.1% |
| $200,000+ | 36 | 4.2% |
Household Income by Householder Age in Blanco
The median household income in Blanco is $59,601, with the highest median household income of $108,750 found in the 25 to 44 years age bracket for the primary householder. A total of 299 households (34.7%) fall into this category. Meanwhile, the 65+ years age bracket for the primary householder has the lowest median household income of $26,250, with 235 households (27.3%) in this group.
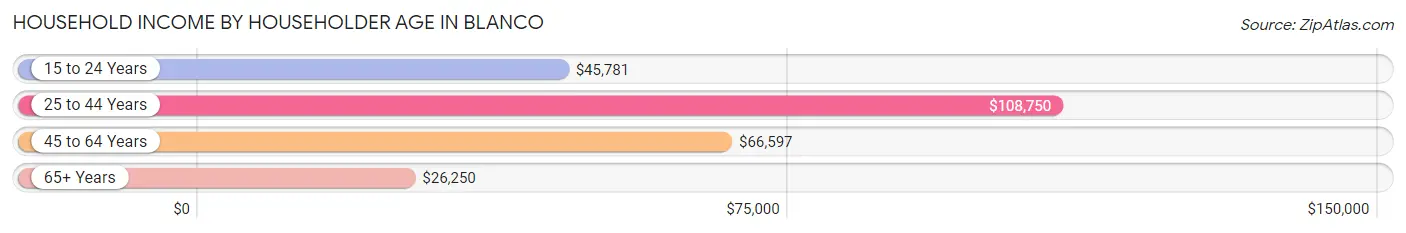
| Income Bracket | # Households | Median Income |
| 15 to 24 Years | 42 (4.9%) | $45,781 |
| 25 to 44 Years | 299 (34.7%) | $108,750 |
| 45 to 64 Years | 285 (33.1%) | $66,597 |
| 65+ Years | 235 (27.3%) | $26,250 |
| Total | 861 (100.0%) | $59,601 |
Poverty in Blanco
Income Below Poverty by Sex and Age in Blanco
With 6.6% poverty level for males and 14.6% for females among the residents of Blanco, 12 to 14 year old males and 5 year old females are the most vulnerable to poverty, with 24 males (42.9%) and 11 females (100.0%) in their respective age groups living below the poverty level.
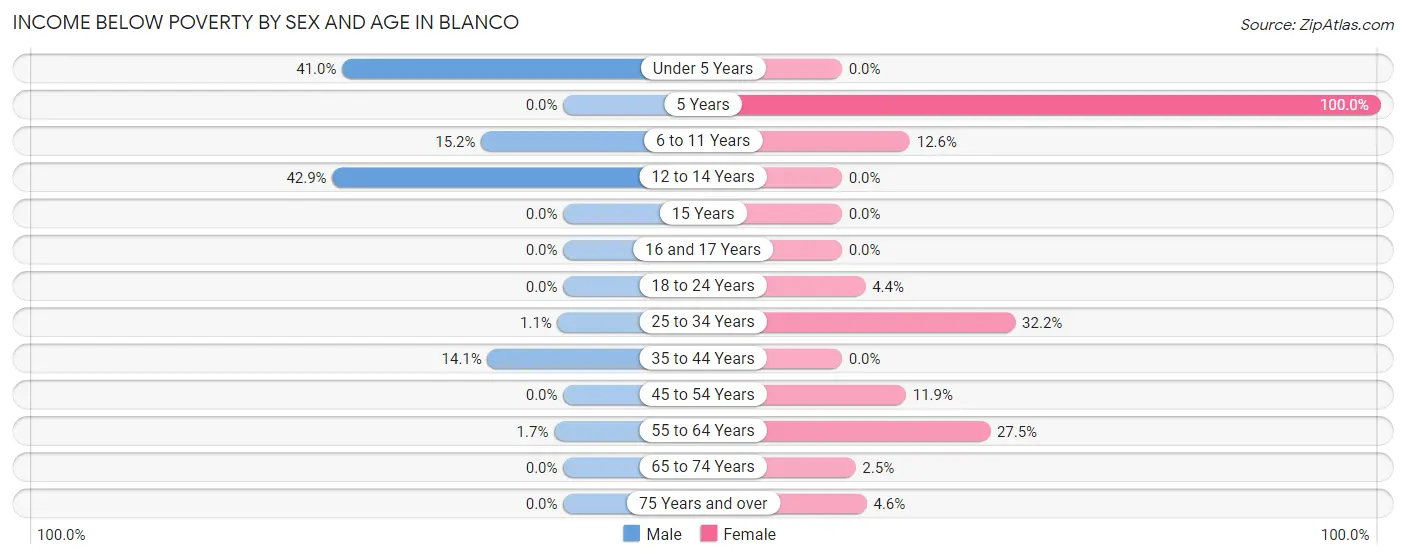
| Age Bracket | Male | Female |
| Under 5 Years | 16 (41.0%) | 0 (0.0%) |
| 5 Years | 0 (0.0%) | 11 (100.0%) |
| 6 to 11 Years | 14 (15.2%) | 12 (12.6%) |
| 12 to 14 Years | 24 (42.9%) | 0 (0.0%) |
| 15 Years | 0 (0.0%) | 0 (0.0%) |
| 16 and 17 Years | 0 (0.0%) | 0 (0.0%) |
| 18 to 24 Years | 0 (0.0%) | 4 (4.3%) |
| 25 to 34 Years | 2 (1.1%) | 65 (32.2%) |
| 35 to 44 Years | 9 (14.1%) | 0 (0.0%) |
| 45 to 54 Years | 0 (0.0%) | 12 (11.9%) |
| 55 to 64 Years | 3 (1.7%) | 44 (27.5%) |
| 65 to 74 Years | 0 (0.0%) | 2 (2.5%) |
| 75 Years and over | 0 (0.0%) | 5 (4.6%) |
| Total | 68 (6.6%) | 155 (14.6%) |
Income Above Poverty by Sex and Age in Blanco
According to the poverty statistics in Blanco, males aged 5 years and females aged under 5 years are the age groups that are most secure financially, with 100.0% of males and 100.0% of females in these age groups living above the poverty line.
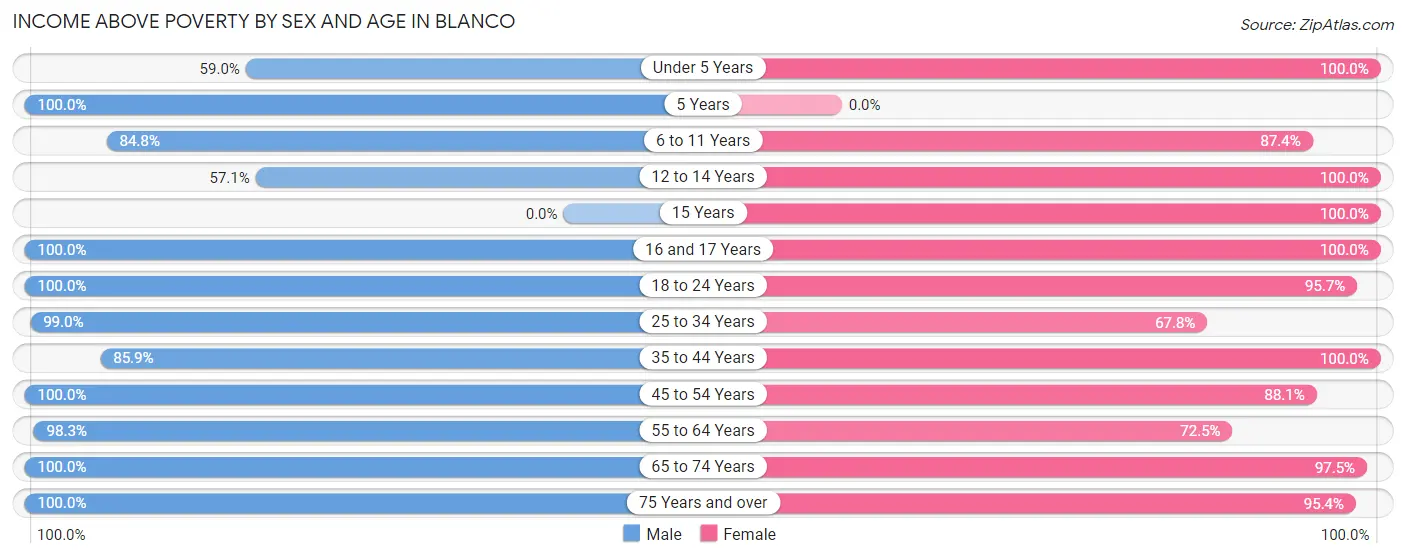
| Age Bracket | Male | Female |
| Under 5 Years | 23 (59.0%) | 17 (100.0%) |
| 5 Years | 29 (100.0%) | 0 (0.0%) |
| 6 to 11 Years | 78 (84.8%) | 83 (87.4%) |
| 12 to 14 Years | 32 (57.1%) | 53 (100.0%) |
| 15 Years | 0 (0.0%) | 8 (100.0%) |
| 16 and 17 Years | 31 (100.0%) | 21 (100.0%) |
| 18 to 24 Years | 141 (100.0%) | 88 (95.7%) |
| 25 to 34 Years | 189 (99.0%) | 137 (67.8%) |
| 35 to 44 Years | 55 (85.9%) | 113 (100.0%) |
| 45 to 54 Years | 96 (100.0%) | 89 (88.1%) |
| 55 to 64 Years | 174 (98.3%) | 116 (72.5%) |
| 65 to 74 Years | 95 (100.0%) | 77 (97.5%) |
| 75 Years and over | 23 (100.0%) | 104 (95.4%) |
| Total | 966 (93.4%) | 906 (85.4%) |
Income Below Poverty Among Married-Couple Families in Blanco
The poverty statistics for married-couple families in Blanco show that 3.1% or 9 of the total 289 families live below the poverty line. Families with 3 or 4 children have the highest poverty rate of 22.0%, comprising of 9 families. On the other hand, families with no children have the lowest poverty rate of 0.0%, which includes 0 families.
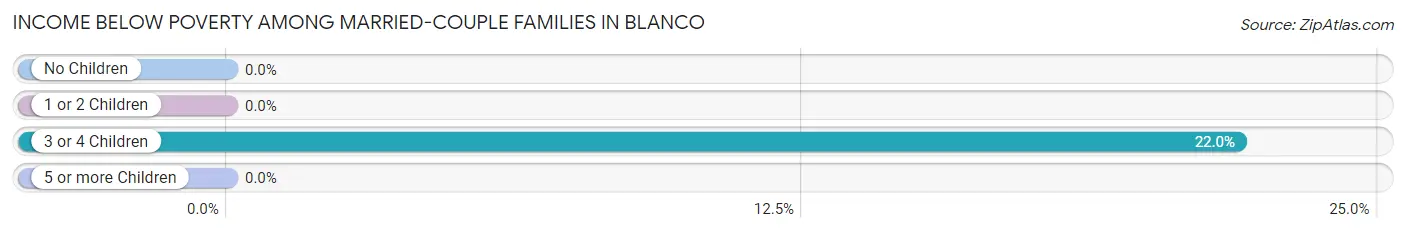
| Children | Above Poverty | Below Poverty |
| No Children | 171 (100.0%) | 0 (0.0%) |
| 1 or 2 Children | 77 (100.0%) | 0 (0.0%) |
| 3 or 4 Children | 32 (78.0%) | 9 (22.0%) |
| 5 or more Children | 0 (0.0%) | 0 (0.0%) |
| Total | 280 (96.9%) | 9 (3.1%) |
Income Below Poverty Among Single-Parent Households in Blanco
According to the poverty data in Blanco, 12.0% or 3 single-father households and 21.8% or 27 single-mother households are living below the poverty line. Among single-father households, those with no children have the highest poverty rate, with 3 households (50.0%) experiencing poverty. Likewise, among single-mother households, those with 3 or 4 children have the highest poverty rate, with 25 households (100.0%) falling below the poverty line.
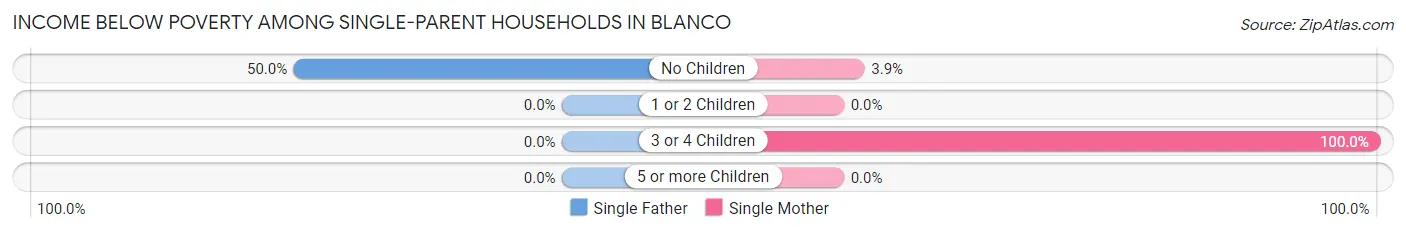
| Children | Single Father | Single Mother |
| No Children | 3 (50.0%) | 2 (3.8%) |
| 1 or 2 Children | 0 (0.0%) | 0 (0.0%) |
| 3 or 4 Children | 0 (0.0%) | 25 (100.0%) |
| 5 or more Children | 0 (0.0%) | 0 (0.0%) |
| Total | 3 (12.0%) | 27 (21.8%) |
Income Below Poverty Among Married-Couple vs Single-Parent Households in Blanco
The poverty data for Blanco shows that 9 of the married-couple family households (3.1%) and 30 of the single-parent households (20.1%) are living below the poverty level. Within the married-couple family households, those with 3 or 4 children have the highest poverty rate, with 9 households (22.0%) falling below the poverty line. Among the single-parent households, those with 3 or 4 children have the highest poverty rate, with 25 household (100.0%) living below poverty.
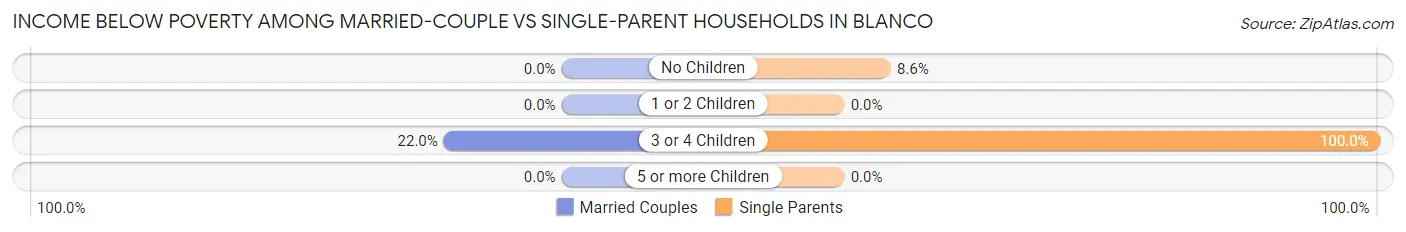
| Children | Married-Couple Families | Single-Parent Households |
| No Children | 0 (0.0%) | 5 (8.6%) |
| 1 or 2 Children | 0 (0.0%) | 0 (0.0%) |
| 3 or 4 Children | 9 (22.0%) | 25 (100.0%) |
| 5 or more Children | 0 (0.0%) | 0 (0.0%) |
| Total | 9 (3.1%) | 30 (20.1%) |
Race in Blanco
The most populous races in Blanco are White / Caucasian (1,689 | 78.7%), Hispanic or Latino (454 | 21.1%), and Two or more Races (357 | 16.6%).
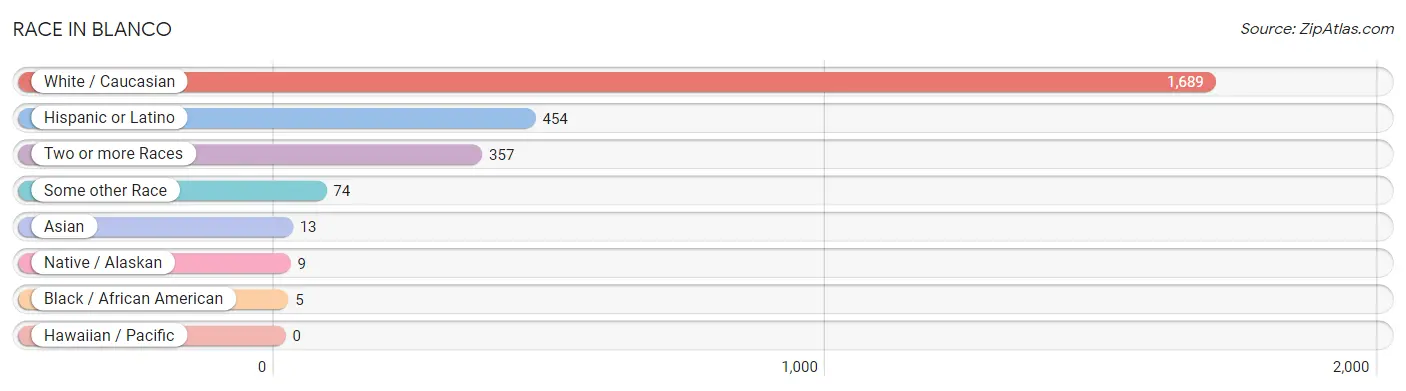
| Race | # Population | % Population |
| Asian | 13 | 0.6% |
| Black / African American | 5 | 0.2% |
| Hawaiian / Pacific | 0 | 0.0% |
| Hispanic or Latino | 454 | 21.1% |
| Native / Alaskan | 9 | 0.4% |
| White / Caucasian | 1,689 | 78.7% |
| Two or more Races | 357 | 16.6% |
| Some other Race | 74 | 3.5% |
| Total | 2,147 | 100.0% |
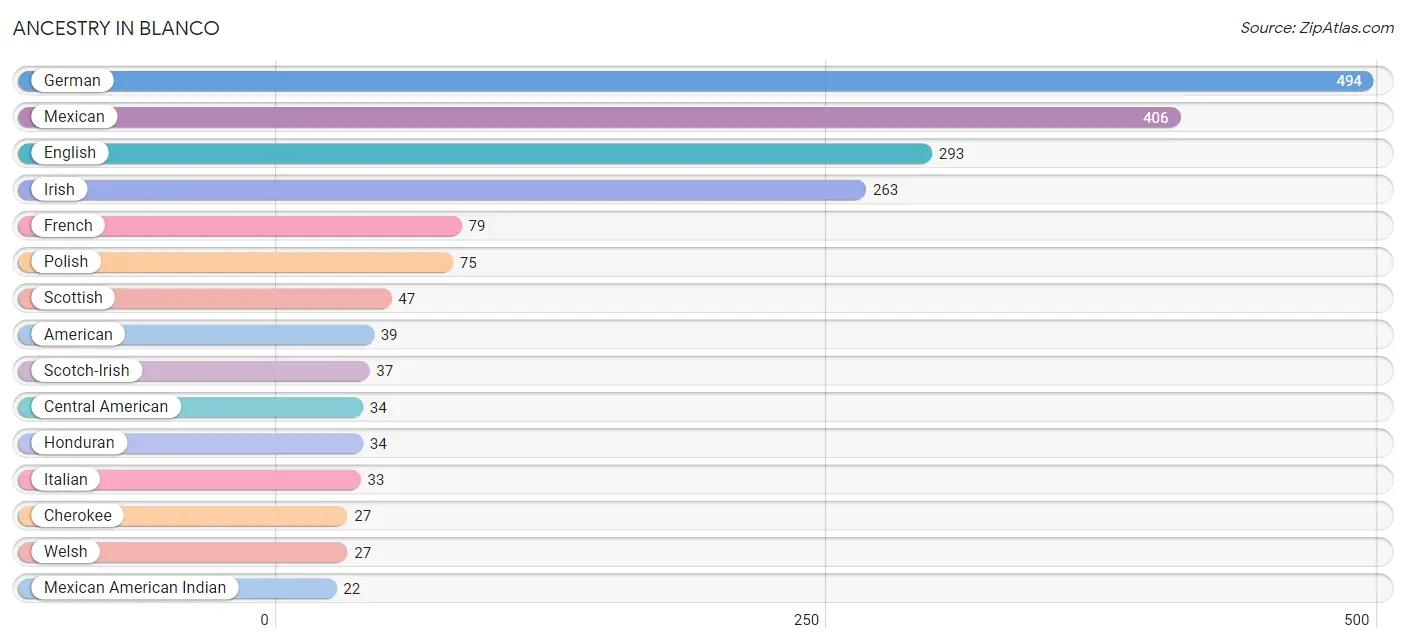
Ancestry in Blanco
The most populous ancestries reported in Blanco are German (494 | 23.0%), Mexican (406 | 18.9%), English (293 | 13.7%), Irish (263 | 12.2%), and French (79 | 3.7%), together accounting for 71.5% of all Blanco residents.
| Ancestry | # Population | % Population |
| American | 39 | 1.8% |
| Austrian | 7 | 0.3% |
| Brazilian | 16 | 0.7% |
| Central American | 34 | 1.6% |
| Cherokee | 27 | 1.3% |
| Crow | 6 | 0.3% |
| Cuban | 2 | 0.1% |
| Czech | 14 | 0.6% |
| Czechoslovakian | 13 | 0.6% |
| Dutch | 7 | 0.3% |
| English | 293 | 13.7% |
| European | 2 | 0.1% |
| French | 79 | 3.7% |
| French Canadian | 12 | 0.6% |
| German | 494 | 23.0% |
| Honduran | 34 | 1.6% |
| Indian (Asian) | 12 | 0.6% |
| Irish | 263 | 12.2% |
| Italian | 33 | 1.5% |
| Korean | 1 | 0.1% |
| Mexican | 406 | 18.9% |
| Mexican American Indian | 22 | 1.0% |
| Norwegian | 15 | 0.7% |
| Polish | 75 | 3.5% |
| Scandinavian | 2 | 0.1% |
| Scotch-Irish | 37 | 1.7% |
| Scottish | 47 | 2.2% |
| Spaniard | 6 | 0.3% |
| Swedish | 4 | 0.2% |
| Swiss | 2 | 0.1% |
| Welsh | 27 | 1.3% | View All 31 Rows |
Immigrants in Blanco
The most numerous immigrant groups reported in Blanco came from Central America (104 | 4.8%), Latin America (104 | 4.8%), Mexico (93 | 4.3%), Asia (12 | 0.6%), and China (12 | 0.6%), together accounting for 15.1% of all Blanco residents.
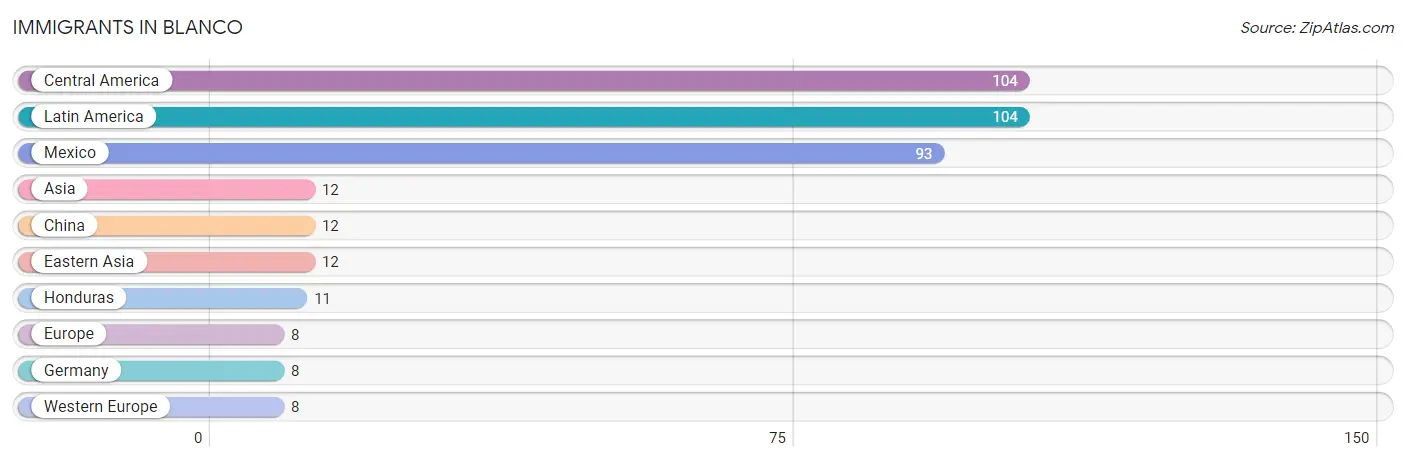
| Immigration Origin | # Population | % Population |
| Asia | 12 | 0.6% |
| Central America | 104 | 4.8% |
| China | 12 | 0.6% |
| Eastern Asia | 12 | 0.6% |
| Europe | 8 | 0.4% |
| Germany | 8 | 0.4% |
| Honduras | 11 | 0.5% |
| Latin America | 104 | 4.8% |
| Mexico | 93 | 4.3% |
| Western Europe | 8 | 0.4% | View All 10 Rows |
Sex and Age in Blanco
Sex and Age in Blanco
The most populous age groups in Blanco are 25 to 29 Years (152 | 14.6%) for men and 60 to 64 Years (103 | 9.3%) for women.
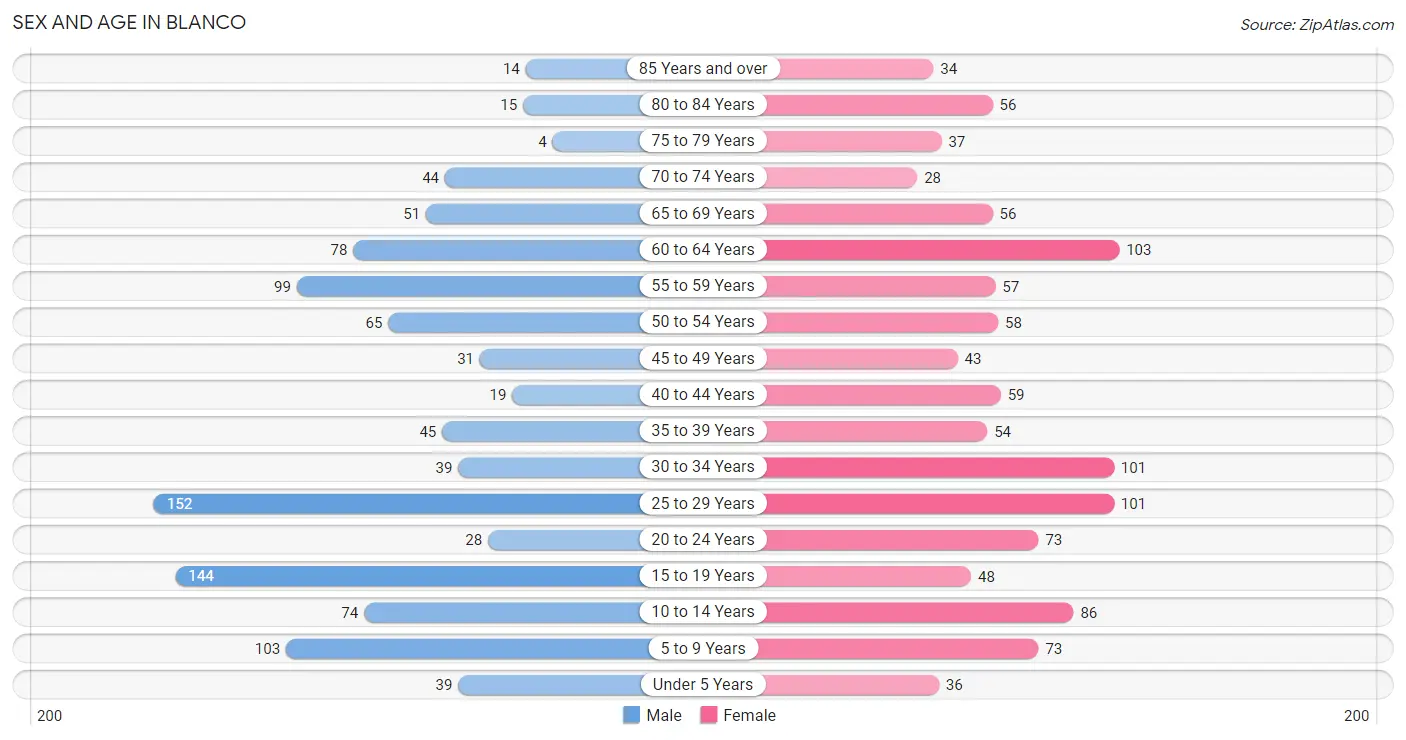
| Age Bracket | Male | Female |
| Under 5 Years | 39 (3.7%) | 36 (3.3%) |
| 5 to 9 Years | 103 (9.9%) | 73 (6.6%) |
| 10 to 14 Years | 74 (7.1%) | 86 (7.8%) |
| 15 to 19 Years | 144 (13.8%) | 48 (4.3%) |
| 20 to 24 Years | 28 (2.7%) | 73 (6.6%) |
| 25 to 29 Years | 152 (14.6%) | 101 (9.2%) |
| 30 to 34 Years | 39 (3.7%) | 101 (9.2%) |
| 35 to 39 Years | 45 (4.3%) | 54 (4.9%) |
| 40 to 44 Years | 19 (1.8%) | 59 (5.3%) |
| 45 to 49 Years | 31 (3.0%) | 43 (3.9%) |
| 50 to 54 Years | 65 (6.2%) | 58 (5.3%) |
| 55 to 59 Years | 99 (9.5%) | 57 (5.2%) |
| 60 to 64 Years | 78 (7.5%) | 103 (9.3%) |
| 65 to 69 Years | 51 (4.9%) | 56 (5.1%) |
| 70 to 74 Years | 44 (4.2%) | 28 (2.5%) |
| 75 to 79 Years | 4 (0.4%) | 37 (3.4%) |
| 80 to 84 Years | 15 (1.4%) | 56 (5.1%) |
| 85 Years and over | 14 (1.3%) | 34 (3.1%) |
| Total | 1,044 (100.0%) | 1,103 (100.0%) |
Families and Households in Blanco
Median Family Size in Blanco
The median family size in Blanco is 3.35 persons per family, with single male/father families (25 | 5.7%) accounting for the largest median family size of 3.92 persons per family. On the other hand, single female/mother families (124 | 28.3%) represent the smallest median family size with 2.74 persons per family.
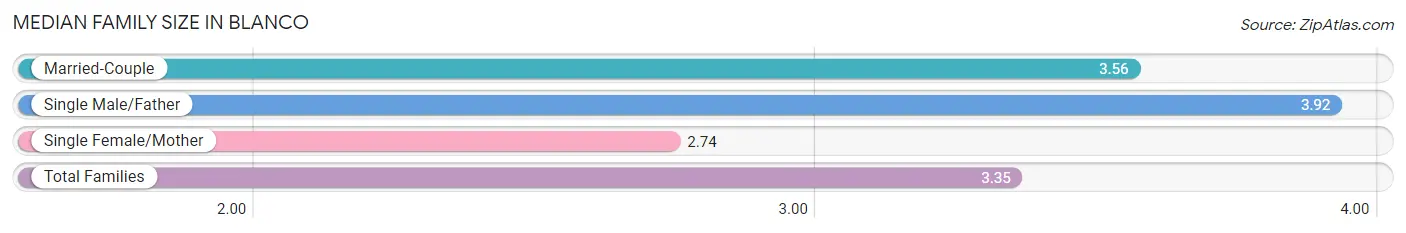
| Family Type | # Families | Family Size |
| Married-Couple | 289 (66.0%) | 3.56 |
| Single Male/Father | 25 (5.7%) | 3.92 |
| Single Female/Mother | 124 (28.3%) | 2.74 |
| Total Families | 438 (100.0%) | 3.35 |
Median Household Size in Blanco
The median household size in Blanco is 2.46 persons per household, with single male/father households (25 | 2.9%) accounting for the largest median household size of 4.24 persons per household. non-family households (423 | 49.1%) represent the smallest median household size with 1.39 persons per household.
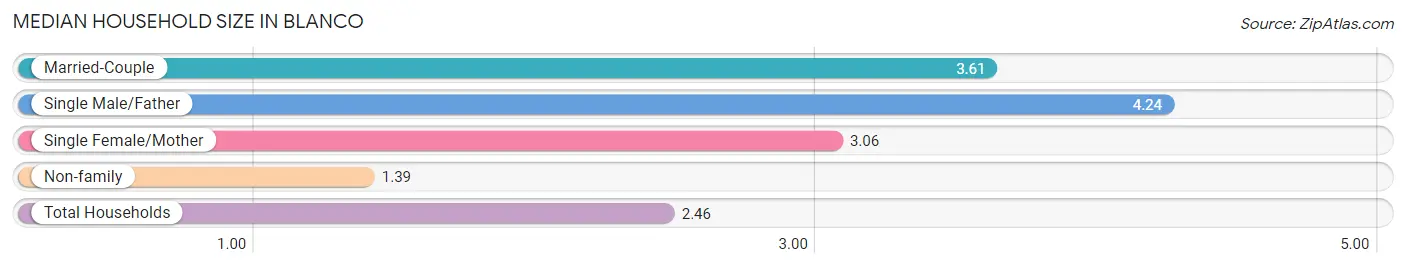
| Household Type | # Households | Household Size |
| Married-Couple | 289 (33.6%) | 3.61 |
| Single Male/Father | 25 (2.9%) | 4.24 |
| Single Female/Mother | 124 (14.4%) | 3.06 |
| Non-family | 423 (49.1%) | 1.39 |
| Total Households | 861 (100.0%) | 2.46 |
Household Size by Marriage Status in Blanco
Out of a total of 861 households in Blanco, 438 (50.9%) are family households, while 423 (49.1%) are nonfamily households. The most numerous type of family households are 2-person households, comprising 174, and the most common type of nonfamily households are 1-person households, comprising 231.
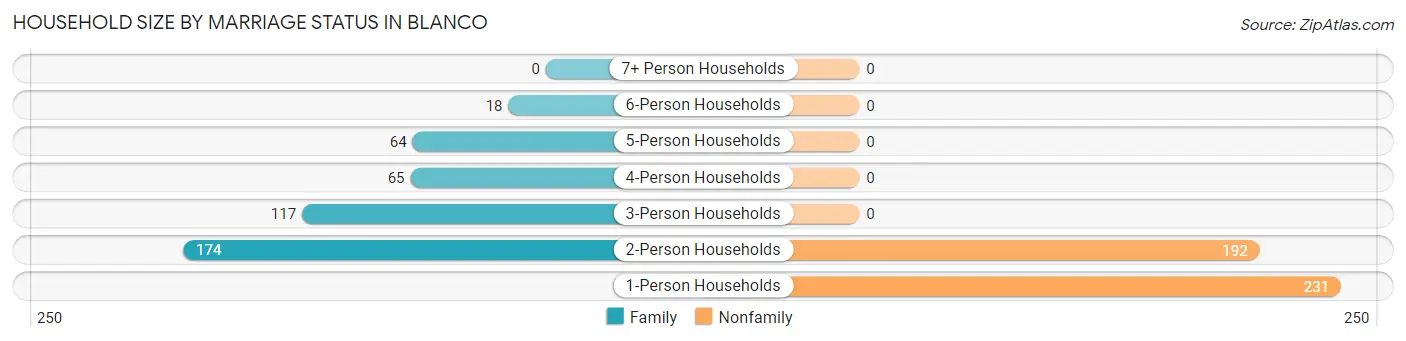
| Household Size | Family Households | Nonfamily Households |
| 1-Person Households | - | 231 (26.8%) |
| 2-Person Households | 174 (20.2%) | 192 (22.3%) |
| 3-Person Households | 117 (13.6%) | 0 (0.0%) |
| 4-Person Households | 65 (7.5%) | 0 (0.0%) |
| 5-Person Households | 64 (7.4%) | 0 (0.0%) |
| 6-Person Households | 18 (2.1%) | 0 (0.0%) |
| 7+ Person Households | 0 (0.0%) | 0 (0.0%) |
| Total | 438 (50.9%) | 423 (49.1%) |
Female Fertility in Blanco
Fertility by Age in Blanco
| Age Bracket | Women with Births | Births / 1,000 Women |
| 15 to 19 years | 0 (0.0%) | 0.0 |
| 20 to 34 years | 0 (0.0%) | 0.0 |
| 35 to 50 years | 0 (0.0%) | 0.0 |
| Total | 0 (0.0%) | 0.0 |
Fertility by Age by Marriage Status in Blanco
| Age Bracket | Married | Unmarried |
| 15 to 19 years | 0 (0.0%) | 0 (0.0%) |
| 20 to 34 years | 0 (0.0%) | 0 (0.0%) |
| 35 to 50 years | 0 (0.0%) | 0 (0.0%) |
| Total | 0 (0.0%) | 0 (0.0%) |
Fertility by Education in Blanco
| Educational Attainment | Women with Births | Births / 1,000 Women |
| Less than High School | 0 (0.0%) | 0.0 |
| High School Diploma | 0 (0.0%) | 0.0 |
| College or Associate's Degree | 0 (0.0%) | 0.0 |
| Bachelor's Degree | 0 (0.0%) | 0.0 |
| Graduate Degree | 0 (0.0%) | 0.0 |
| Total | 0 (0.0%) | 0.0 |
Fertility by Education by Marriage Status in Blanco
| Educational Attainment | Married | Unmarried |
| Less than High School | 0 (0.0%) | 0 (0.0%) |
| High School Diploma | 0 (0.0%) | 0 (0.0%) |
| College or Associate's Degree | 0 (0.0%) | 0 (0.0%) |
| Bachelor's Degree | 0 (0.0%) | 0 (0.0%) |
| Graduate Degree | 0 (0.0%) | 0 (0.0%) |
| Total | 0 (0.0%) | 0 (0.0%) |
Employment Characteristics in Blanco
Employment by Class of Employer in Blanco
Among the 1,017 employed individuals in Blanco, private company employees (724 | 71.2%), self-employed (not incorporated) (94 | 9.2%), and local government employees (94 | 9.2%) make up the most common classes of employment.
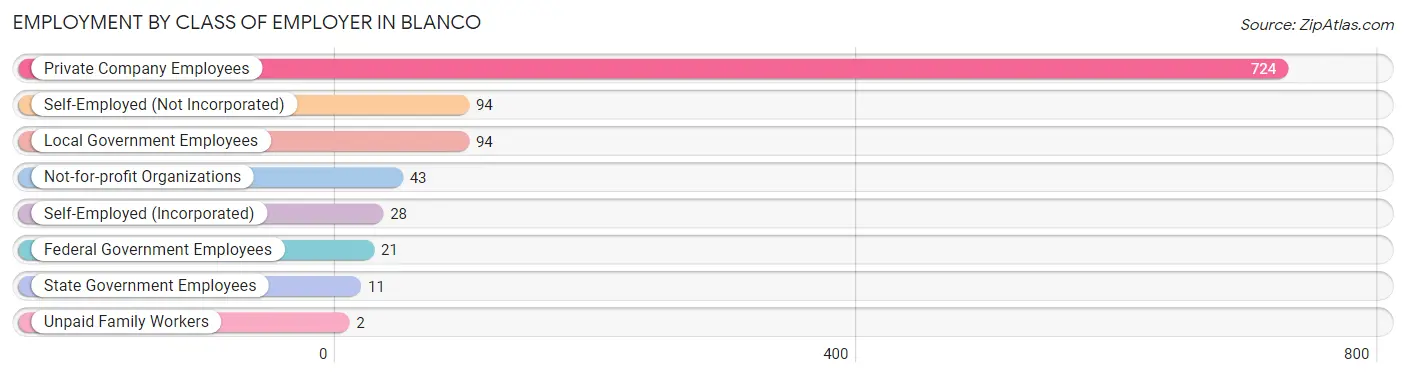
| Employer Class | # Employees | % Employees |
| Private Company Employees | 724 | 71.2% |
| Self-Employed (Incorporated) | 28 | 2.8% |
| Self-Employed (Not Incorporated) | 94 | 9.2% |
| Not-for-profit Organizations | 43 | 4.2% |
| Local Government Employees | 94 | 9.2% |
| State Government Employees | 11 | 1.1% |
| Federal Government Employees | 21 | 2.1% |
| Unpaid Family Workers | 2 | 0.2% |
| Total | 1,017 | 100.0% |
Employment Status by Age in Blanco
According to the labor force statistics for Blanco, out of the total population over 16 years of age (1,728), 64.1% or 1,108 individuals are in the labor force, with 2.7% or 30 of them unemployed. The age group with the highest labor force participation rate is 20 to 24 years, with 100.0% or 101 individuals in the labor force. Within the labor force, the 25 to 29 years age range has the highest percentage of unemployed individuals, with 11.9% or 28 of them being unemployed.
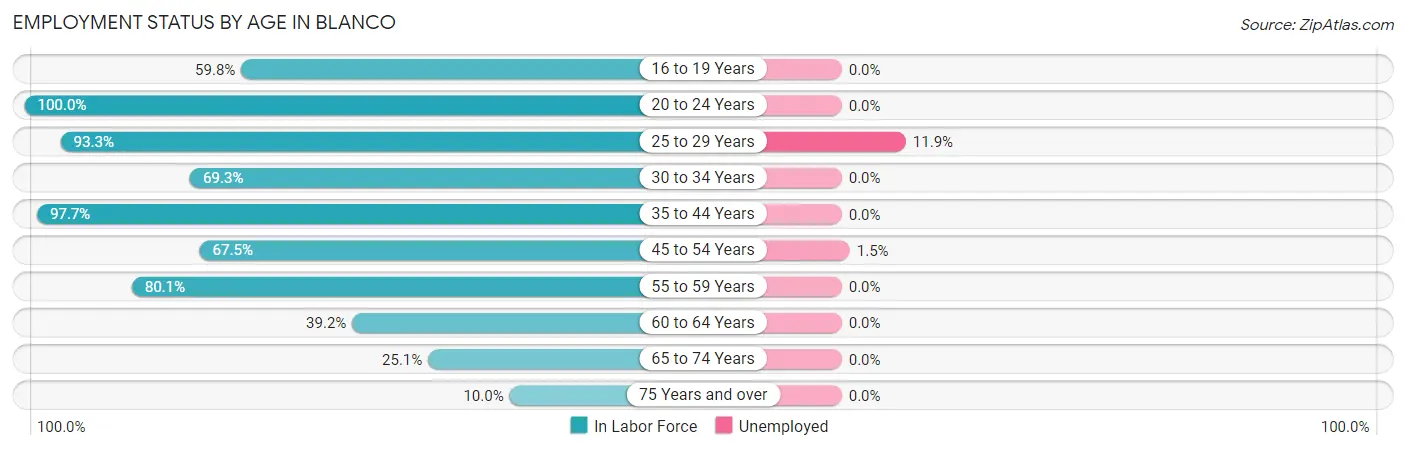
| Age Bracket | In Labor Force | Unemployed |
| 16 to 19 Years | 110 (59.8%) | 0 (0.0%) |
| 20 to 24 Years | 101 (100.0%) | 0 (0.0%) |
| 25 to 29 Years | 236 (93.3%) | 28 (11.9%) |
| 30 to 34 Years | 97 (69.3%) | 0 (0.0%) |
| 35 to 44 Years | 173 (97.7%) | 0 (0.0%) |
| 45 to 54 Years | 133 (67.5%) | 2 (1.5%) |
| 55 to 59 Years | 125 (80.1%) | 0 (0.0%) |
| 60 to 64 Years | 71 (39.2%) | 0 (0.0%) |
| 65 to 74 Years | 45 (25.1%) | 0 (0.0%) |
| 75 Years and over | 16 (10.0%) | 0 (0.0%) |
| Total | 1,108 (64.1%) | 30 (2.7%) |
Employment Status by Educational Attainment in Blanco
According to labor force statistics for Blanco, 75.6% of individuals (835) out of the total population between 25 and 64 years of age (1,104) are in the labor force, with 3.6% or 30 of them being unemployed. The group with the highest labor force participation rate are those with the educational attainment of high school diploma, with 88.3% or 379 individuals in the labor force. Within the labor force, individuals with high school diploma education have the highest percentage of unemployment, with 7.9% or 30 of them being unemployed.
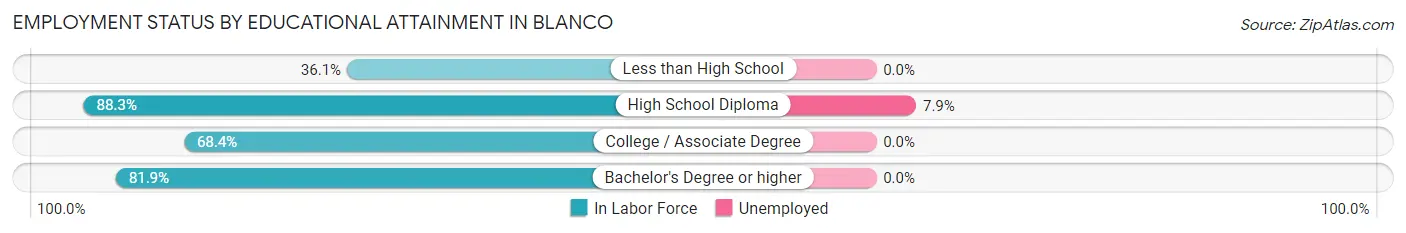
| Educational Attainment | In Labor Force | Unemployed |
| Less than High School | 44 (36.1%) | 0 (0.0%) |
| High School Diploma | 379 (88.3%) | 34 (7.9%) |
| College / Associate Degree | 208 (68.4%) | 0 (0.0%) |
| Bachelor's Degree or higher | 204 (81.9%) | 0 (0.0%) |
| Total | 835 (75.6%) | 40 (3.6%) |
Employment Occupations by Sex in Blanco
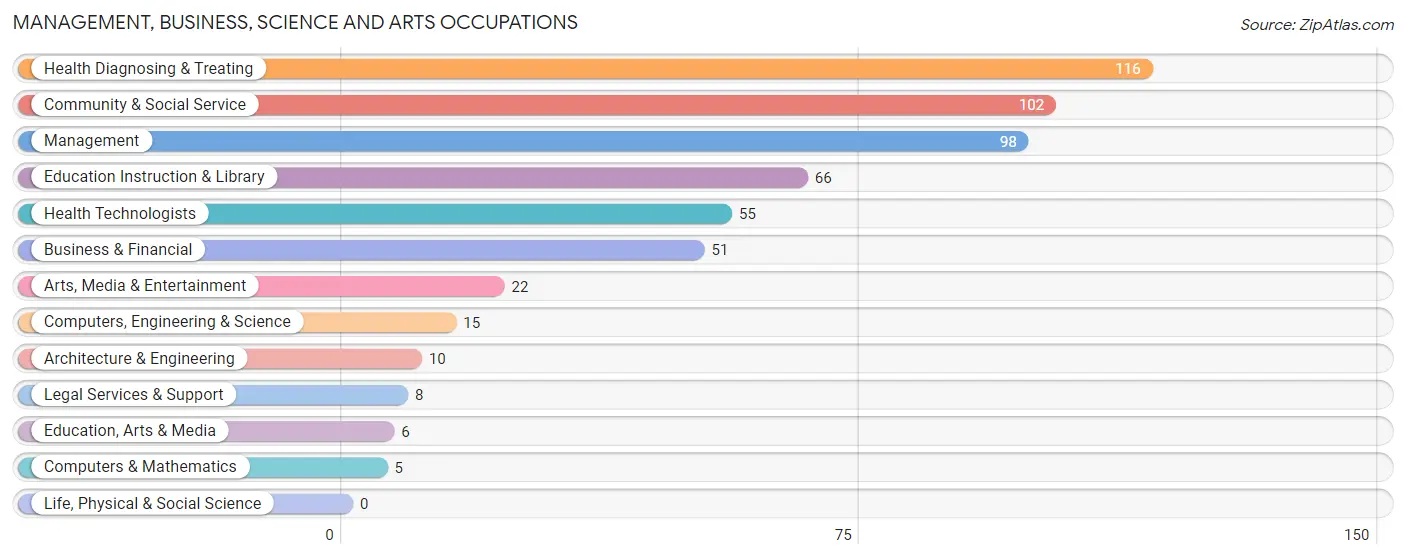
Management, Business, Science and Arts Occupations
The most common Management, Business, Science and Arts occupations in Blanco are Health Diagnosing & Treating (116 | 10.8%), Community & Social Service (102 | 9.5%), Management (98 | 9.1%), Education Instruction & Library (66 | 6.1%), and Health Technologists (55 | 5.1%).
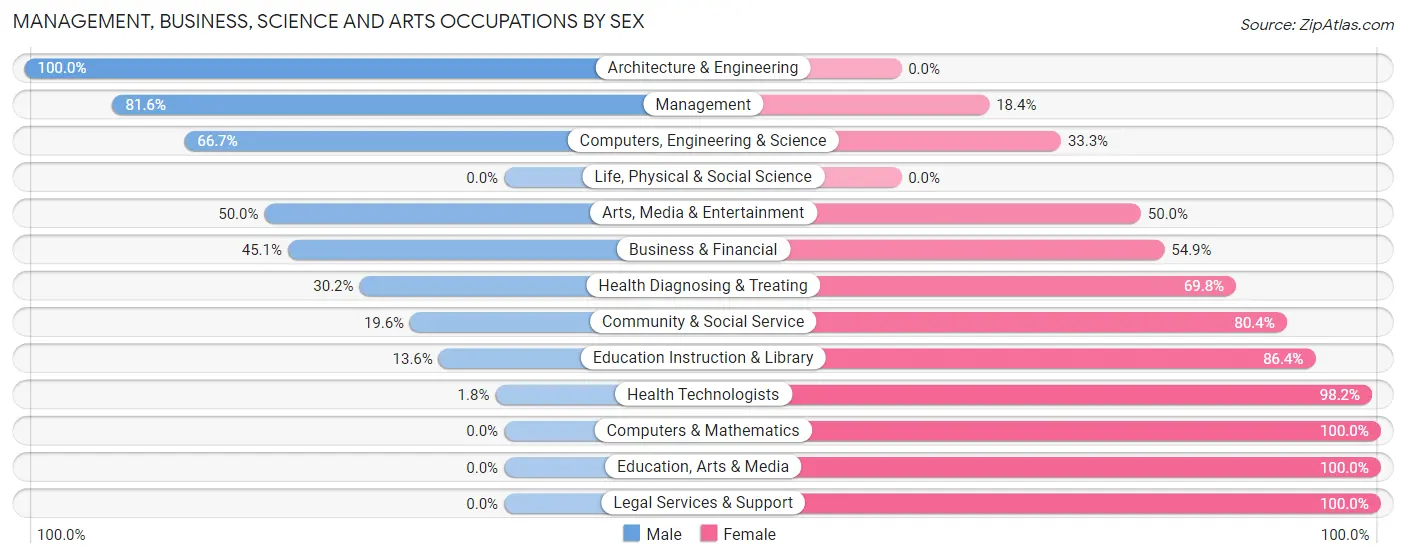
Management, Business, Science and Arts Occupations by Sex
Within the Management, Business, Science and Arts occupations in Blanco, the most male-oriented occupations are Architecture & Engineering (100.0%), Management (81.6%), and Computers, Engineering & Science (66.7%), while the most female-oriented occupations are Computers & Mathematics (100.0%), Education, Arts & Media (100.0%), and Legal Services & Support (100.0%).
| Occupation | Male | Female |
| Management | 80 (81.6%) | 18 (18.4%) |
| Business & Financial | 23 (45.1%) | 28 (54.9%) |
| Computers, Engineering & Science | 10 (66.7%) | 5 (33.3%) |
| Computers & Mathematics | 0 (0.0%) | 5 (100.0%) |
| Architecture & Engineering | 10 (100.0%) | 0 (0.0%) |
| Life, Physical & Social Science | 0 (0.0%) | 0 (0.0%) |
| Community & Social Service | 20 (19.6%) | 82 (80.4%) |
| Education, Arts & Media | 0 (0.0%) | 6 (100.0%) |
| Legal Services & Support | 0 (0.0%) | 8 (100.0%) |
| Education Instruction & Library | 9 (13.6%) | 57 (86.4%) |
| Arts, Media & Entertainment | 11 (50.0%) | 11 (50.0%) |
| Health Diagnosing & Treating | 35 (30.2%) | 81 (69.8%) |
| Health Technologists | 1 (1.8%) | 54 (98.2%) |
| Total (Category) | 168 (44.0%) | 214 (56.0%) |
| Total (Overall) | 592 (55.0%) | 485 (45.0%) |
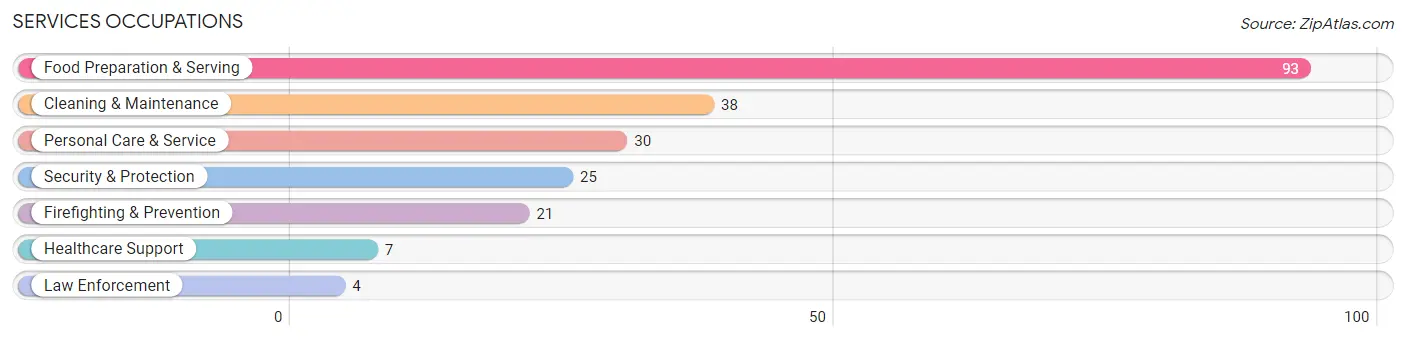
Services Occupations
The most common Services occupations in Blanco are Food Preparation & Serving (93 | 8.6%), Cleaning & Maintenance (38 | 3.5%), Personal Care & Service (30 | 2.8%), Security & Protection (25 | 2.3%), and Firefighting & Prevention (21 | 1.9%).
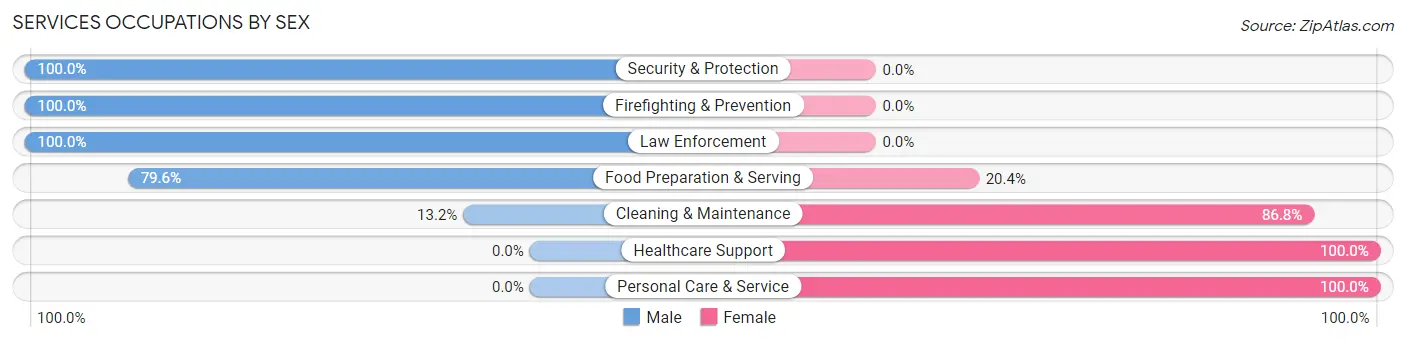
Services Occupations by Sex
Within the Services occupations in Blanco, the most male-oriented occupations are Security & Protection (100.0%), Firefighting & Prevention (100.0%), and Law Enforcement (100.0%), while the most female-oriented occupations are Healthcare Support (100.0%), Personal Care & Service (100.0%), and Cleaning & Maintenance (86.8%).
| Occupation | Male | Female |
| Healthcare Support | 0 (0.0%) | 7 (100.0%) |
| Security & Protection | 25 (100.0%) | 0 (0.0%) |
| Firefighting & Prevention | 21 (100.0%) | 0 (0.0%) |
| Law Enforcement | 4 (100.0%) | 0 (0.0%) |
| Food Preparation & Serving | 74 (79.6%) | 19 (20.4%) |
| Cleaning & Maintenance | 5 (13.2%) | 33 (86.8%) |
| Personal Care & Service | 0 (0.0%) | 30 (100.0%) |
| Total (Category) | 104 (53.9%) | 89 (46.1%) |
| Total (Overall) | 592 (55.0%) | 485 (45.0%) |
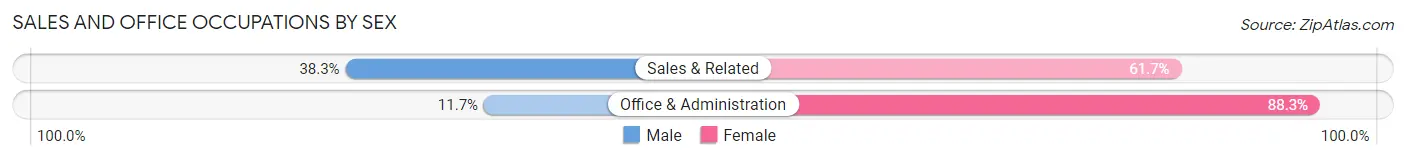
Sales and Office Occupations
The most common Sales and Office occupations in Blanco are Sales & Related (94 | 8.7%), and Office & Administration (60 | 5.6%).

Sales and Office Occupations by Sex
| Occupation | Male | Female |
| Sales & Related | 36 (38.3%) | 58 (61.7%) |
| Office & Administration | 7 (11.7%) | 53 (88.3%) |
| Total (Category) | 43 (27.9%) | 111 (72.1%) |
| Total (Overall) | 592 (55.0%) | 485 (45.0%) |
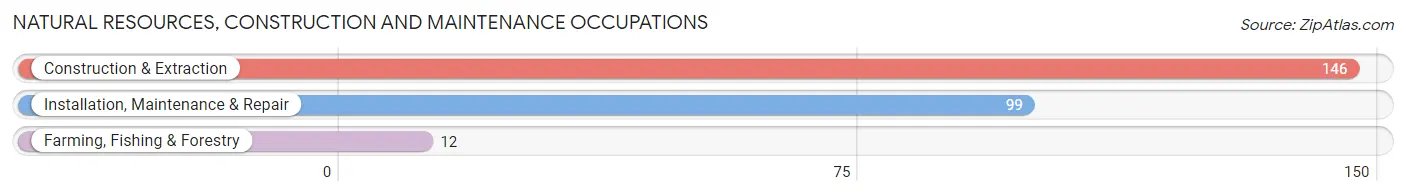
Natural Resources, Construction and Maintenance Occupations
The most common Natural Resources, Construction and Maintenance occupations in Blanco are Construction & Extraction (146 | 13.6%), Installation, Maintenance & Repair (99 | 9.2%), and Farming, Fishing & Forestry (12 | 1.1%).
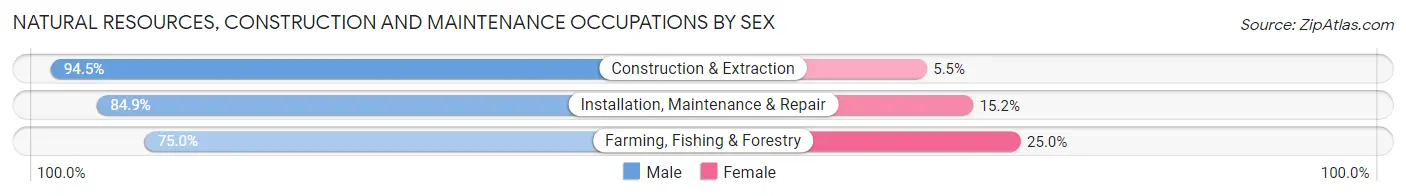
Natural Resources, Construction and Maintenance Occupations by Sex
| Occupation | Male | Female |
| Farming, Fishing & Forestry | 9 (75.0%) | 3 (25.0%) |
| Construction & Extraction | 138 (94.5%) | 8 (5.5%) |
| Installation, Maintenance & Repair | 84 (84.9%) | 15 (15.1%) |
| Total (Category) | 231 (89.9%) | 26 (10.1%) |
| Total (Overall) | 592 (55.0%) | 485 (45.0%) |
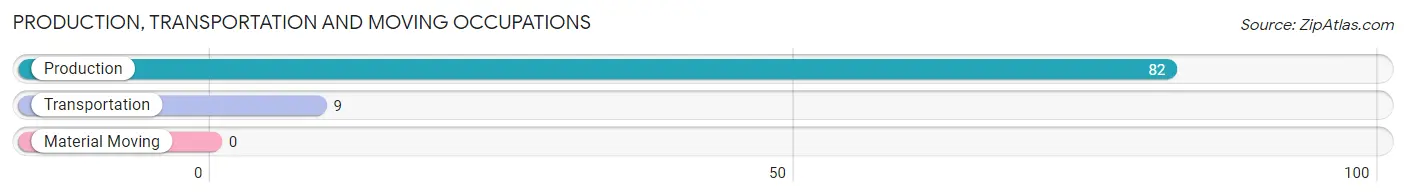
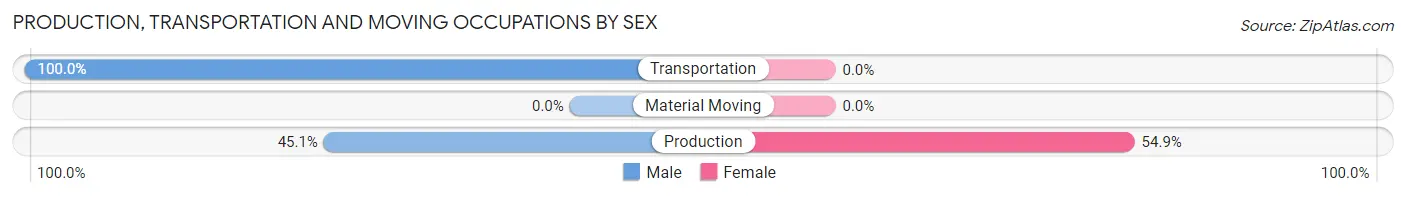
Production, Transportation and Moving Occupations
The most common Production, Transportation and Moving occupations in Blanco are Production (82 | 7.6%), and Transportation (9 | 0.8%).
Production, Transportation and Moving Occupations by Sex
| Occupation | Male | Female |
| Production | 37 (45.1%) | 45 (54.9%) |
| Transportation | 9 (100.0%) | 0 (0.0%) |
| Material Moving | 0 (0.0%) | 0 (0.0%) |
| Total (Category) | 46 (50.5%) | 45 (49.4%) |
| Total (Overall) | 592 (55.0%) | 485 (45.0%) |
Employment Industries by Sex in Blanco
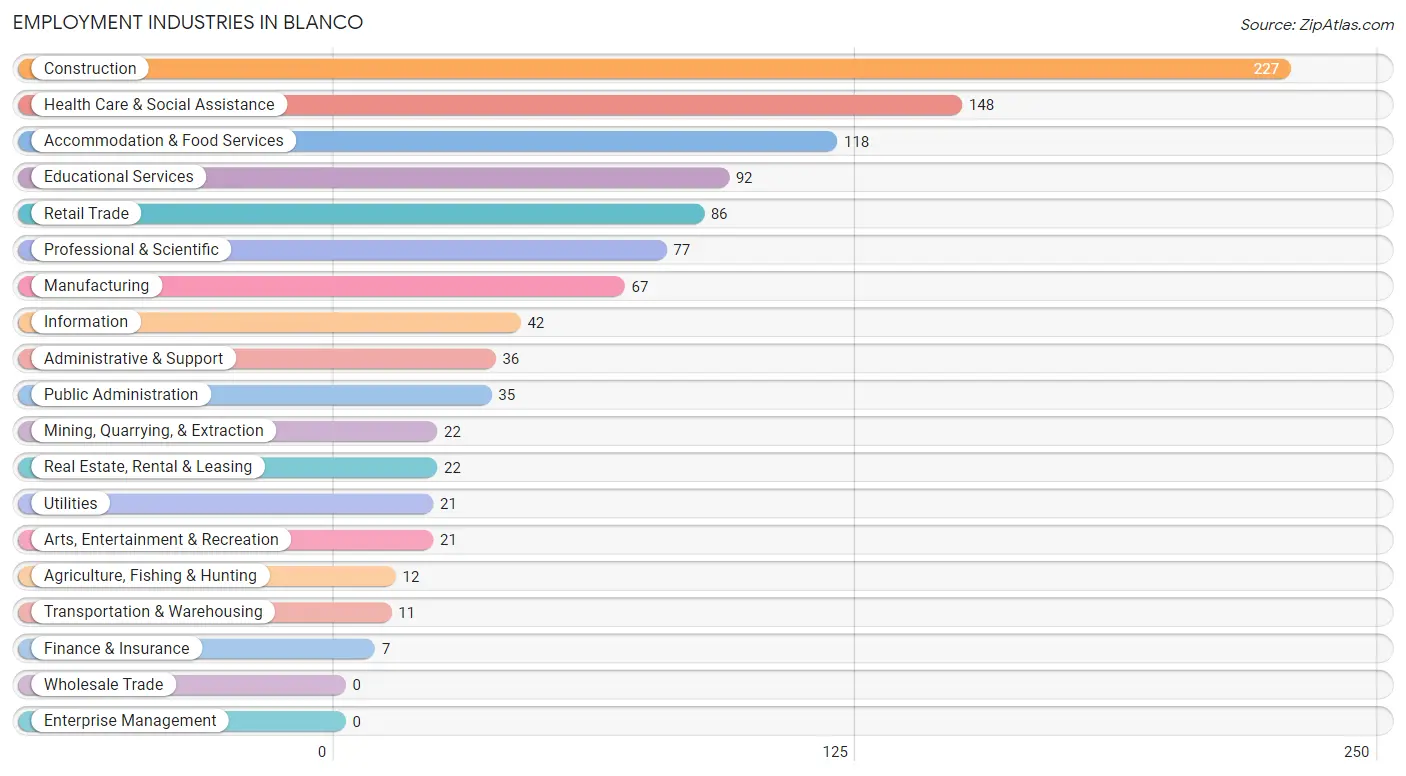
Employment Industries in Blanco
The major employment industries in Blanco include Construction (227 | 21.1%), Health Care & Social Assistance (148 | 13.7%), Accommodation & Food Services (118 | 11.0%), Educational Services (92 | 8.5%), and Retail Trade (86 | 8.0%).
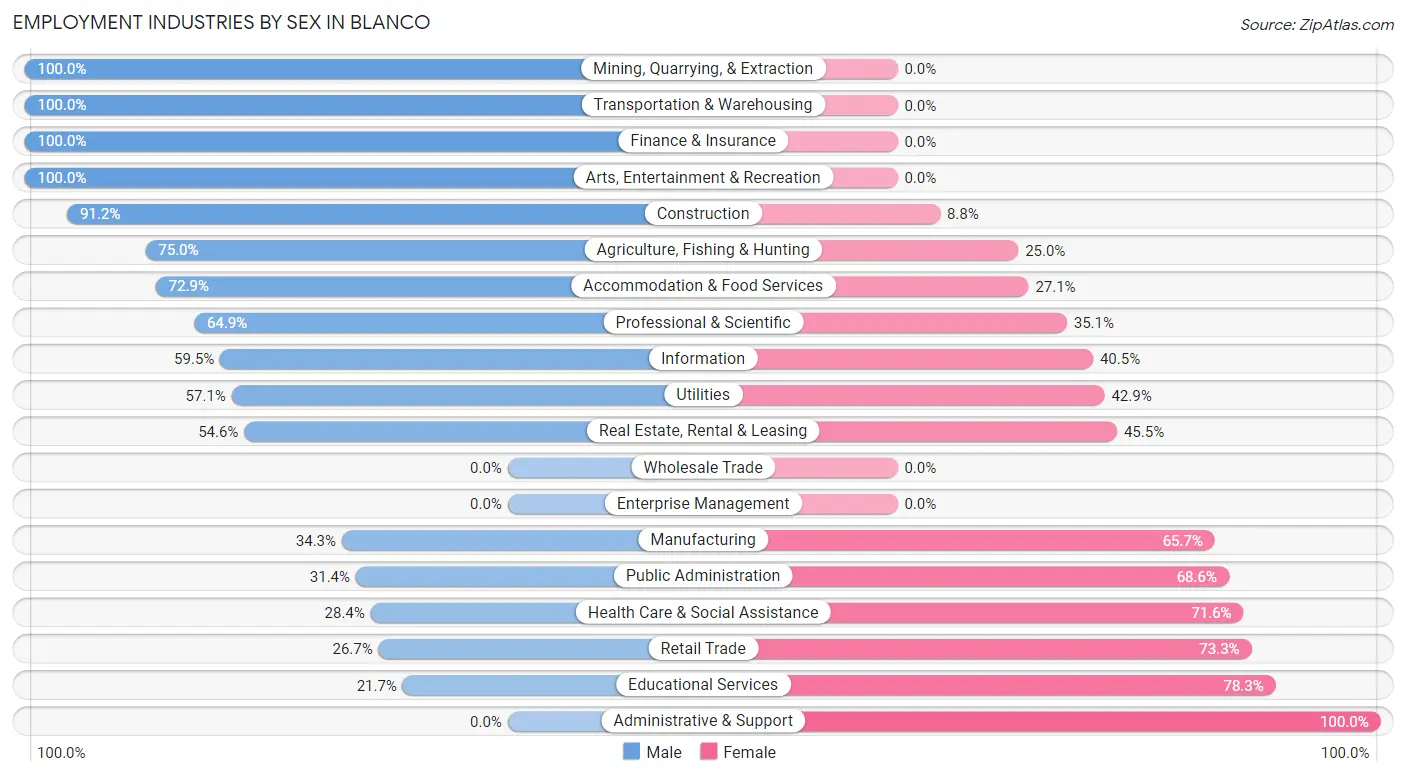
Employment Industries by Sex in Blanco
The Blanco industries that see more men than women are Mining, Quarrying, & Extraction (100.0%), Transportation & Warehousing (100.0%), and Finance & Insurance (100.0%), whereas the industries that tend to have a higher number of women are Administrative & Support (100.0%), Educational Services (78.3%), and Retail Trade (73.3%).
| Industry | Male | Female |
| Agriculture, Fishing & Hunting | 9 (75.0%) | 3 (25.0%) |
| Mining, Quarrying, & Extraction | 22 (100.0%) | 0 (0.0%) |
| Construction | 207 (91.2%) | 20 (8.8%) |
| Manufacturing | 23 (34.3%) | 44 (65.7%) |
| Wholesale Trade | 0 (0.0%) | 0 (0.0%) |
| Retail Trade | 23 (26.7%) | 63 (73.3%) |
| Transportation & Warehousing | 11 (100.0%) | 0 (0.0%) |
| Utilities | 12 (57.1%) | 9 (42.9%) |
| Information | 25 (59.5%) | 17 (40.5%) |
| Finance & Insurance | 7 (100.0%) | 0 (0.0%) |
| Real Estate, Rental & Leasing | 12 (54.5%) | 10 (45.5%) |
| Professional & Scientific | 50 (64.9%) | 27 (35.1%) |
| Enterprise Management | 0 (0.0%) | 0 (0.0%) |
| Administrative & Support | 0 (0.0%) | 36 (100.0%) |
| Educational Services | 20 (21.7%) | 72 (78.3%) |
| Health Care & Social Assistance | 42 (28.4%) | 106 (71.6%) |
| Arts, Entertainment & Recreation | 21 (100.0%) | 0 (0.0%) |
| Accommodation & Food Services | 86 (72.9%) | 32 (27.1%) |
| Public Administration | 11 (31.4%) | 24 (68.6%) |
| Total | 592 (55.0%) | 485 (45.0%) |
Education in Blanco
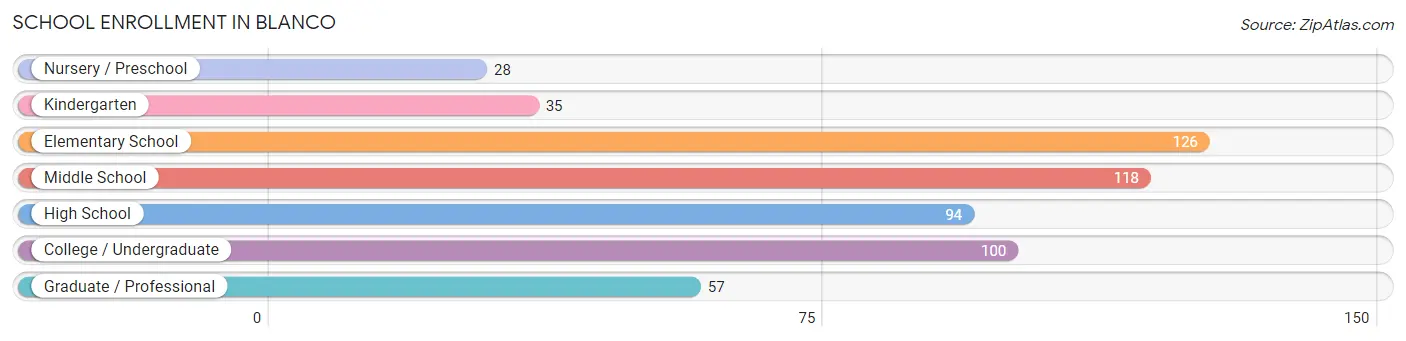
School Enrollment in Blanco
The most common levels of schooling among the 558 students in Blanco are elementary school (126 | 22.6%), middle school (118 | 21.1%), and college / undergraduate (100 | 17.9%).
| School Level | # Students | % Students |
| Nursery / Preschool | 28 | 5.0% |
| Kindergarten | 35 | 6.3% |
| Elementary School | 126 | 22.6% |
| Middle School | 118 | 21.1% |
| High School | 94 | 16.9% |
| College / Undergraduate | 100 | 17.9% |
| Graduate / Professional | 57 | 10.2% |
| Total | 558 | 100.0% |
School Enrollment by Age by Funding Source in Blanco
Out of a total of 558 students who are enrolled in schools in Blanco, 52 (9.3%) attend a private institution, while the remaining 506 (90.7%) are enrolled in public schools. The age group of 35 years and over has the highest likelihood of being enrolled in private schools, with 26 (50.0% in the age bracket) enrolled. Conversely, the age group of 3 to 4 year olds has the lowest likelihood of being enrolled in a private school, with 20 (100.0% in the age bracket) attending a public institution.
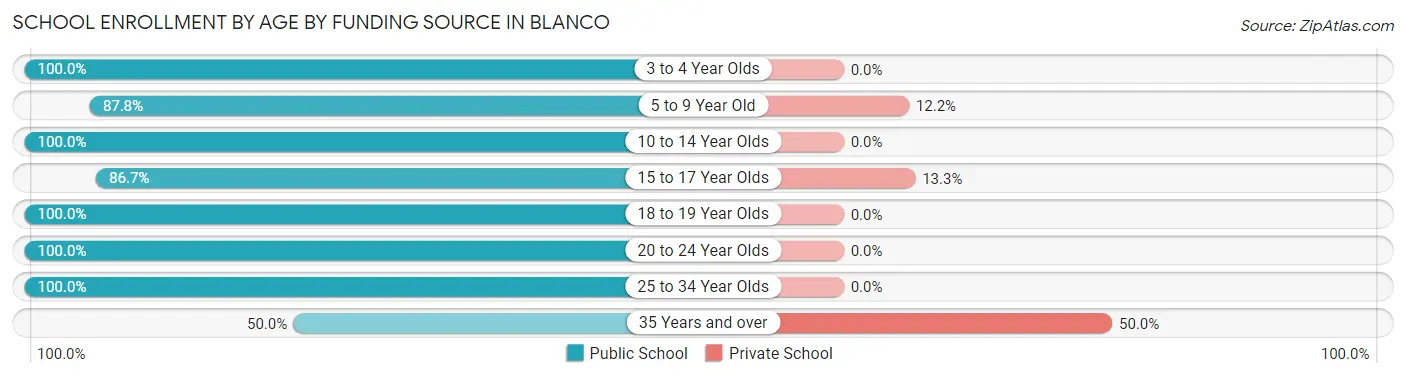
| Age Bracket | Public School | Private School |
| 3 to 4 Year Olds | 20 (100.0%) | 0 (0.0%) |
| 5 to 9 Year Old | 130 (87.8%) | 18 (12.2%) |
| 10 to 14 Year Olds | 145 (100.0%) | 0 (0.0%) |
| 15 to 17 Year Olds | 52 (86.7%) | 8 (13.3%) |
| 18 to 19 Year Olds | 80 (100.0%) | 0 (0.0%) |
| 20 to 24 Year Olds | 24 (100.0%) | 0 (0.0%) |
| 25 to 34 Year Olds | 29 (100.0%) | 0 (0.0%) |
| 35 Years and over | 26 (50.0%) | 26 (50.0%) |
| Total | 506 (90.7%) | 52 (9.3%) |
Educational Attainment by Field of Study in Blanco
Business (79 | 18.9%), education (56 | 13.4%), arts & humanities (40 | 9.6%), bio, nature & agricultural (34 | 8.1%), and social sciences (34 | 8.1%) are the most common fields of study among 419 individuals in Blanco who have obtained a bachelor's degree or higher.
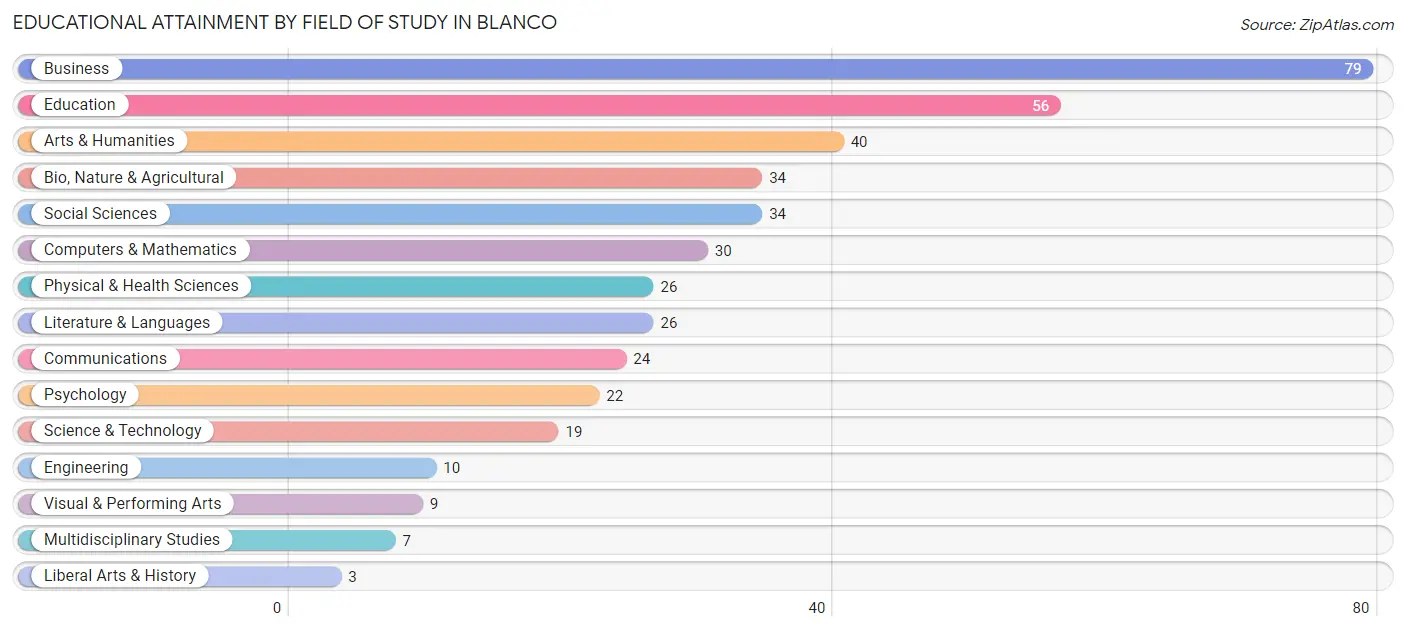
| Field of Study | # Graduates | % Graduates |
| Computers & Mathematics | 30 | 7.2% |
| Bio, Nature & Agricultural | 34 | 8.1% |
| Physical & Health Sciences | 26 | 6.2% |
| Psychology | 22 | 5.2% |
| Social Sciences | 34 | 8.1% |
| Engineering | 10 | 2.4% |
| Multidisciplinary Studies | 7 | 1.7% |
| Science & Technology | 19 | 4.5% |
| Business | 79 | 18.9% |
| Education | 56 | 13.4% |
| Literature & Languages | 26 | 6.2% |
| Liberal Arts & History | 3 | 0.7% |
| Visual & Performing Arts | 9 | 2.1% |
| Communications | 24 | 5.7% |
| Arts & Humanities | 40 | 9.6% |
| Total | 419 | 100.0% |
Transportation & Commute in Blanco
Vehicle Availability by Sex in Blanco
The most prevalent vehicle ownership categories in Blanco are males with 2 vehicles (322, accounting for 56.7%) and females with 2 vehicles (180, making up 71.7%).
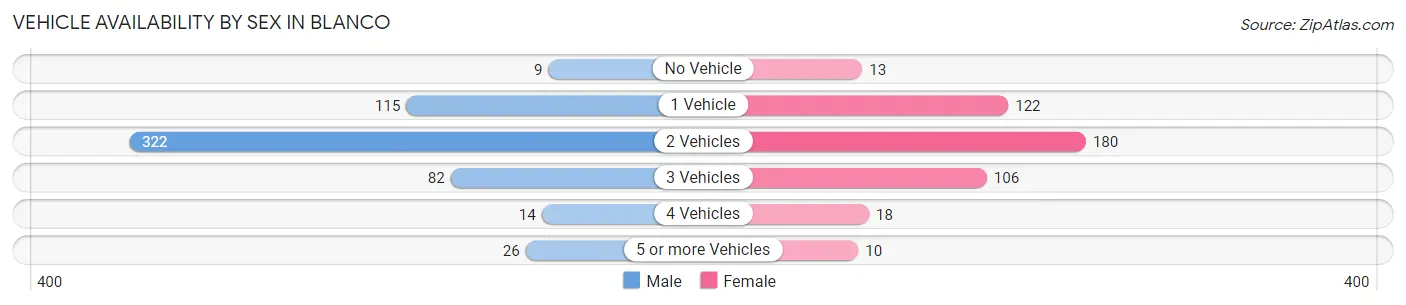
| Vehicles Available | Male | Female |
| No Vehicle | 9 (1.6%) | 13 (2.9%) |
| 1 Vehicle | 115 (20.3%) | 122 (27.2%) |
| 2 Vehicles | 322 (56.7%) | 180 (40.1%) |
| 3 Vehicles | 82 (14.4%) | 106 (23.6%) |
| 4 Vehicles | 14 (2.5%) | 18 (4.0%) |
| 5 or more Vehicles | 26 (4.6%) | 10 (2.2%) |
| Total | 568 (100.0%) | 449 (100.0%) |
Commute Time in Blanco
The most frequently occuring commute durations in Blanco are 30 to 34 minutes (188 commuters, 20.3%), 5 to 9 minutes (150 commuters, 16.2%), and 45 to 59 minutes (128 commuters, 13.9%).
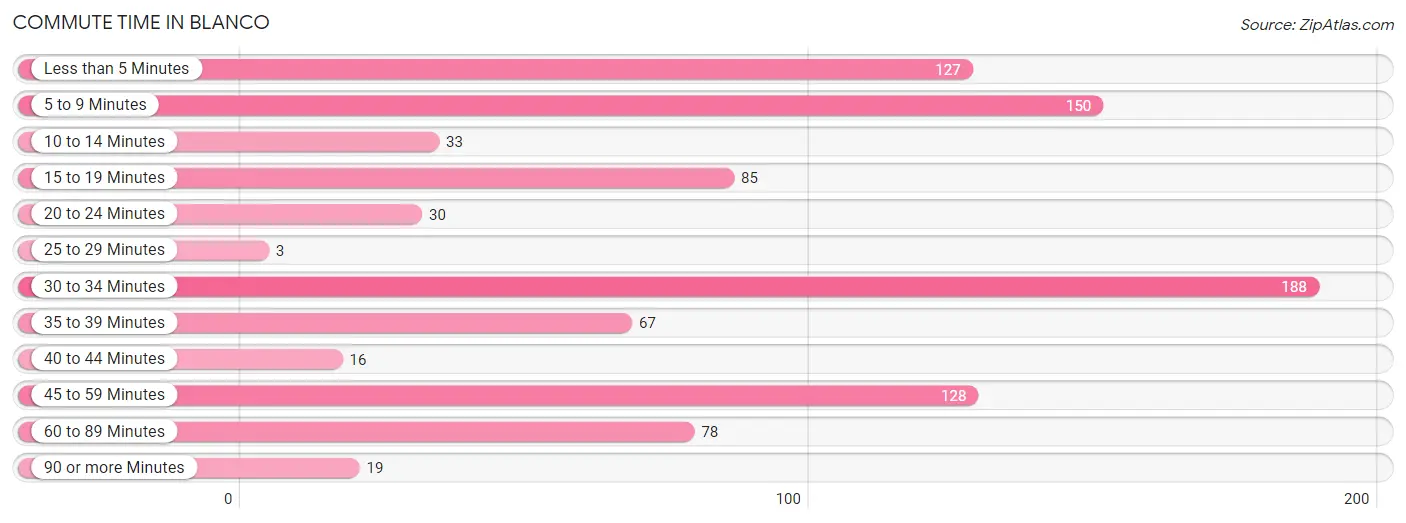
| Commute Time | # Commuters | % Commuters |
| Less than 5 Minutes | 127 | 13.7% |
| 5 to 9 Minutes | 150 | 16.2% |
| 10 to 14 Minutes | 33 | 3.6% |
| 15 to 19 Minutes | 85 | 9.2% |
| 20 to 24 Minutes | 30 | 3.3% |
| 25 to 29 Minutes | 3 | 0.3% |
| 30 to 34 Minutes | 188 | 20.3% |
| 35 to 39 Minutes | 67 | 7.2% |
| 40 to 44 Minutes | 16 | 1.7% |
| 45 to 59 Minutes | 128 | 13.9% |
| 60 to 89 Minutes | 78 | 8.4% |
| 90 or more Minutes | 19 | 2.1% |
Commute Time by Sex in Blanco
The most common commute times in Blanco are 30 to 34 minutes (145 commuters, 26.9%) for males and 45 to 59 minutes (79 commuters, 20.5%) for females.
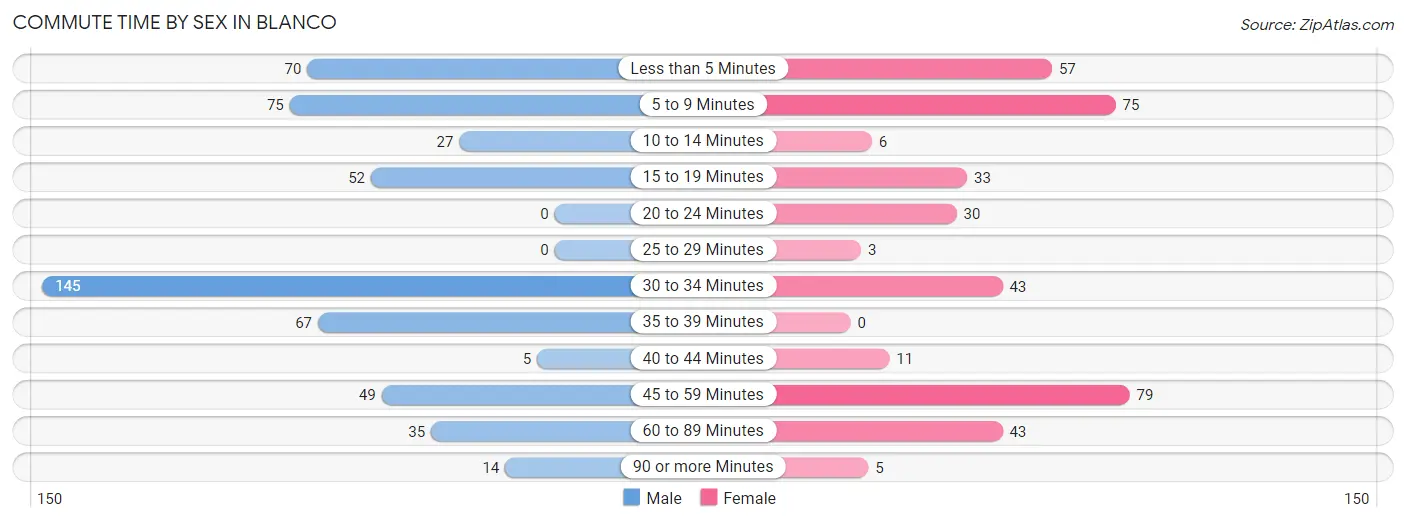
| Commute Time | Male | Female |
| Less than 5 Minutes | 70 (13.0%) | 57 (14.8%) |
| 5 to 9 Minutes | 75 (13.9%) | 75 (19.5%) |
| 10 to 14 Minutes | 27 (5.0%) | 6 (1.6%) |
| 15 to 19 Minutes | 52 (9.7%) | 33 (8.6%) |
| 20 to 24 Minutes | 0 (0.0%) | 30 (7.8%) |
| 25 to 29 Minutes | 0 (0.0%) | 3 (0.8%) |
| 30 to 34 Minutes | 145 (26.9%) | 43 (11.2%) |
| 35 to 39 Minutes | 67 (12.4%) | 0 (0.0%) |
| 40 to 44 Minutes | 5 (0.9%) | 11 (2.9%) |
| 45 to 59 Minutes | 49 (9.1%) | 79 (20.5%) |
| 60 to 89 Minutes | 35 (6.5%) | 43 (11.2%) |
| 90 or more Minutes | 14 (2.6%) | 5 (1.3%) |
Time of Departure to Work by Sex in Blanco
The most frequent times of departure to work in Blanco are 6:00 AM to 6:29 AM (110, 20.4%) for males and 7:30 AM to 7:59 AM (72, 18.7%) for females.
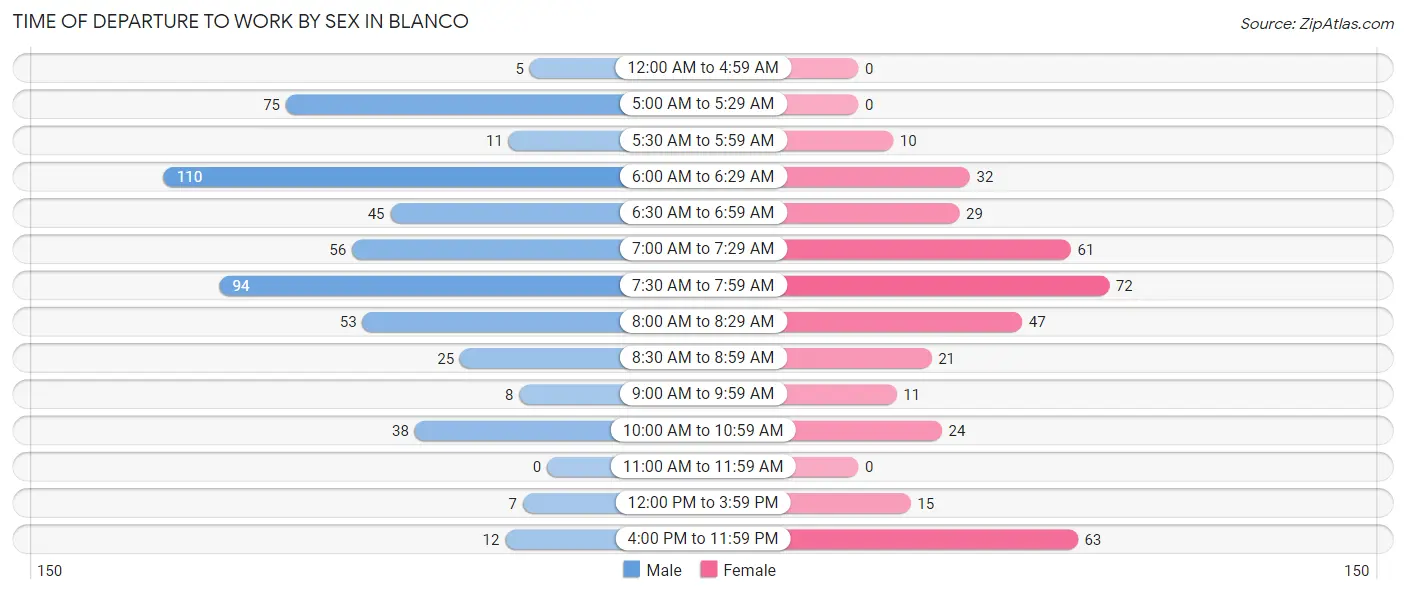
| Time of Departure | Male | Female |
| 12:00 AM to 4:59 AM | 5 (0.9%) | 0 (0.0%) |
| 5:00 AM to 5:29 AM | 75 (13.9%) | 0 (0.0%) |
| 5:30 AM to 5:59 AM | 11 (2.0%) | 10 (2.6%) |
| 6:00 AM to 6:29 AM | 110 (20.4%) | 32 (8.3%) |
| 6:30 AM to 6:59 AM | 45 (8.4%) | 29 (7.5%) |
| 7:00 AM to 7:29 AM | 56 (10.4%) | 61 (15.8%) |
| 7:30 AM to 7:59 AM | 94 (17.4%) | 72 (18.7%) |
| 8:00 AM to 8:29 AM | 53 (9.8%) | 47 (12.2%) |
| 8:30 AM to 8:59 AM | 25 (4.6%) | 21 (5.4%) |
| 9:00 AM to 9:59 AM | 8 (1.5%) | 11 (2.9%) |
| 10:00 AM to 10:59 AM | 38 (7.0%) | 24 (6.2%) |
| 11:00 AM to 11:59 AM | 0 (0.0%) | 0 (0.0%) |
| 12:00 PM to 3:59 PM | 7 (1.3%) | 15 (3.9%) |
| 4:00 PM to 11:59 PM | 12 (2.2%) | 63 (16.4%) |
| Total | 539 (100.0%) | 385 (100.0%) |
Housing Occupancy in Blanco
Occupancy by Ownership in Blanco
Of the total 861 dwellings in Blanco, owner-occupied units account for 460 (53.4%), while renter-occupied units make up 401 (46.6%).
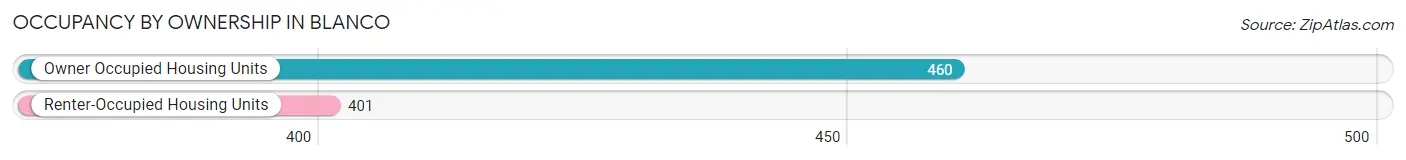
| Occupancy | # Housing Units | % Housing Units |
| Owner Occupied Housing Units | 460 | 53.4% |
| Renter-Occupied Housing Units | 401 | 46.6% |
| Total Occupied Housing Units | 861 | 100.0% |
Occupancy by Household Size in Blanco
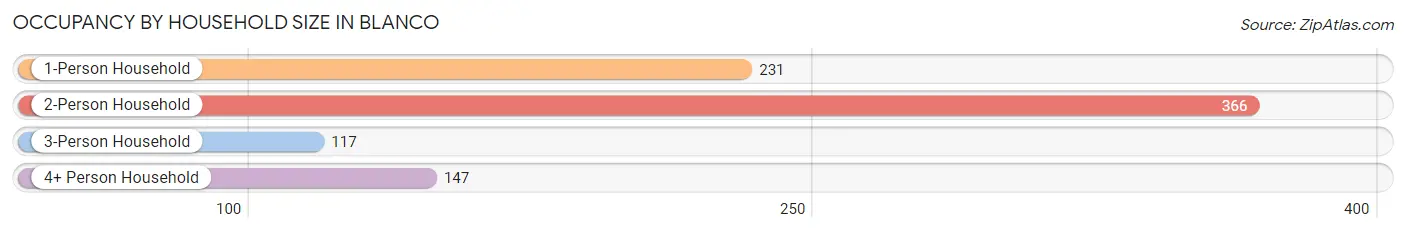
| Household Size | # Housing Units | % Housing Units |
| 1-Person Household | 231 | 26.8% |
| 2-Person Household | 366 | 42.5% |
| 3-Person Household | 117 | 13.6% |
| 4+ Person Household | 147 | 17.1% |
| Total Housing Units | 861 | 100.0% |
Occupancy by Ownership by Household Size in Blanco
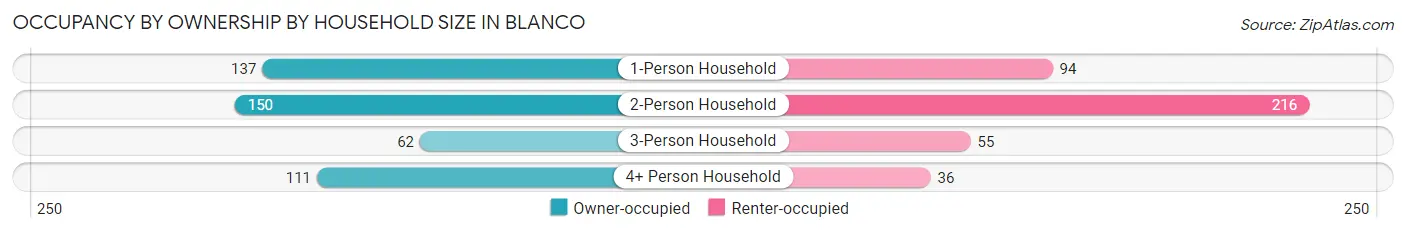
| Household Size | Owner-occupied | Renter-occupied |
| 1-Person Household | 137 (59.3%) | 94 (40.7%) |
| 2-Person Household | 150 (41.0%) | 216 (59.0%) |
| 3-Person Household | 62 (53.0%) | 55 (47.0%) |
| 4+ Person Household | 111 (75.5%) | 36 (24.5%) |
| Total Housing Units | 460 (53.4%) | 401 (46.6%) |
Occupancy by Educational Attainment in Blanco
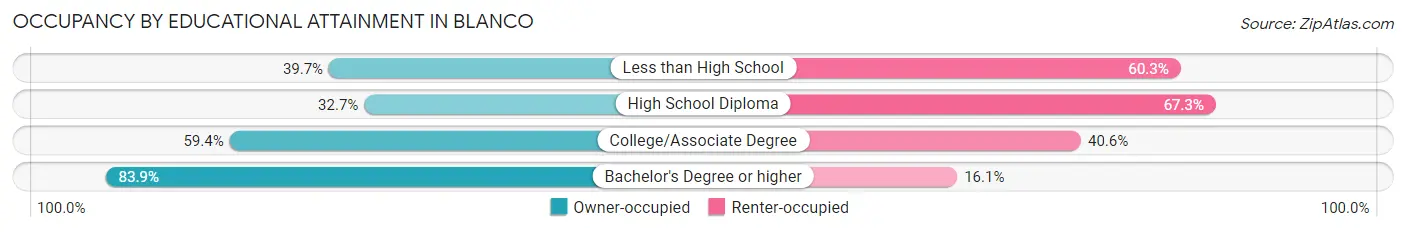
| Household Size | Owner-occupied | Renter-occupied |
| Less than High School | 23 (39.7%) | 35 (60.3%) |
| High School Diploma | 116 (32.7%) | 239 (67.3%) |
| College/Associate Degree | 133 (59.4%) | 91 (40.6%) |
| Bachelor's Degree or higher | 188 (83.9%) | 36 (16.1%) |
Occupancy by Age of Householder in Blanco
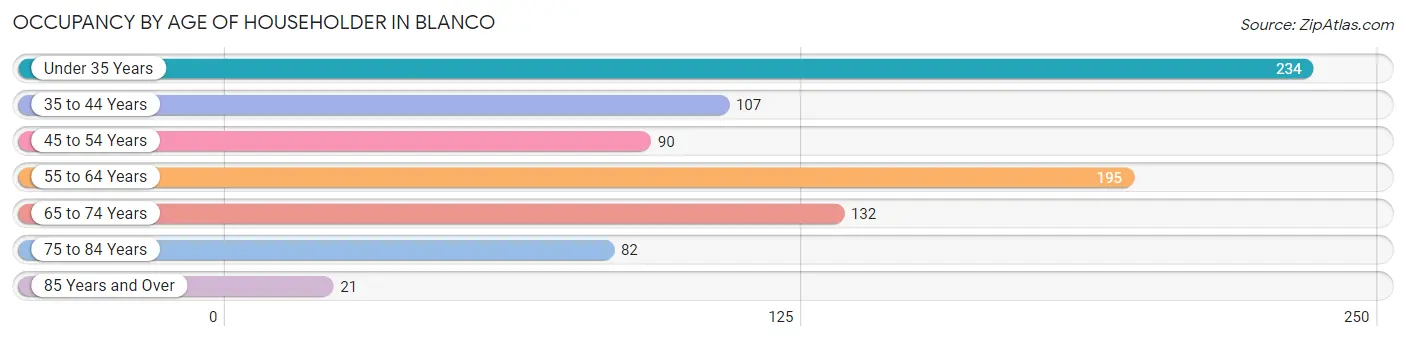
| Age Bracket | # Households | % Households |
| Under 35 Years | 234 | 27.2% |
| 35 to 44 Years | 107 | 12.4% |
| 45 to 54 Years | 90 | 10.4% |
| 55 to 64 Years | 195 | 22.7% |
| 65 to 74 Years | 132 | 15.3% |
| 75 to 84 Years | 82 | 9.5% |
| 85 Years and Over | 21 | 2.4% |
| Total | 861 | 100.0% |
Housing Finances in Blanco
Median Income by Occupancy in Blanco
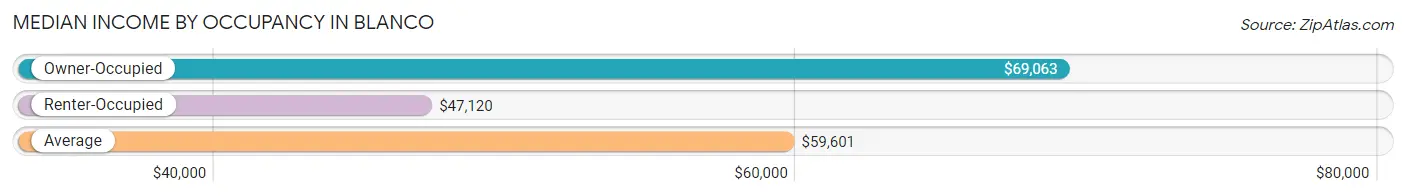
| Occupancy Type | # Households | Median Income |
| Owner-Occupied | 460 (53.4%) | $69,063 |
| Renter-Occupied | 401 (46.6%) | $47,120 |
| Average | 861 (100.0%) | $59,601 |
Occupancy by Householder Income Bracket in Blanco
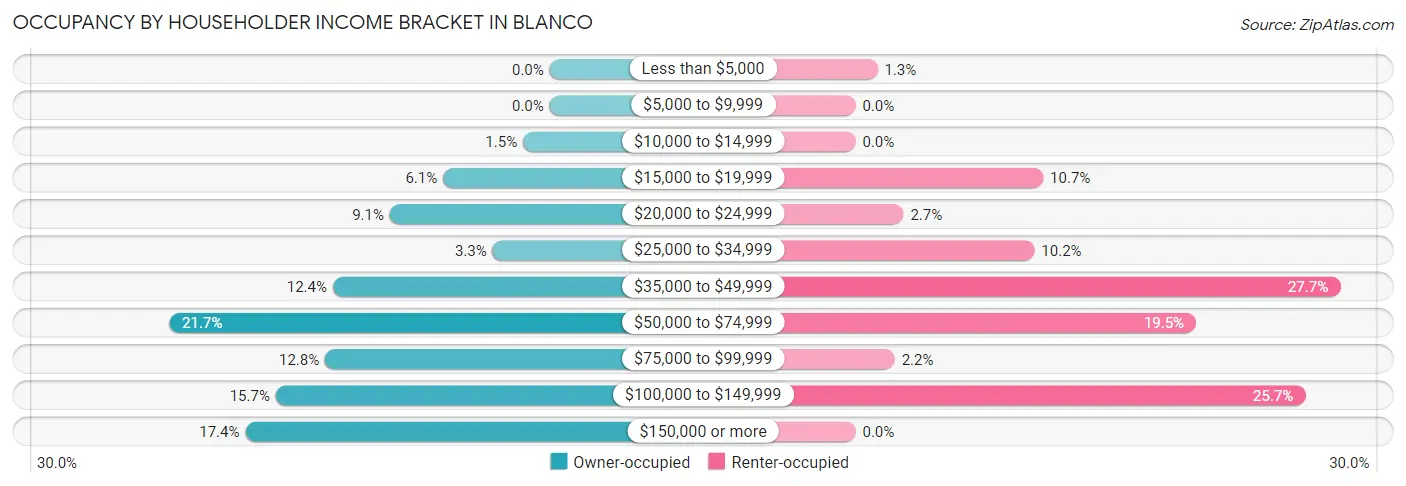
| Income Bracket | Owner-occupied | Renter-occupied |
| Less than $5,000 | 0 (0.0%) | 5 (1.3%) |
| $5,000 to $9,999 | 0 (0.0%) | 0 (0.0%) |
| $10,000 to $14,999 | 7 (1.5%) | 0 (0.0%) |
| $15,000 to $19,999 | 28 (6.1%) | 43 (10.7%) |
| $20,000 to $24,999 | 42 (9.1%) | 11 (2.7%) |
| $25,000 to $34,999 | 15 (3.3%) | 41 (10.2%) |
| $35,000 to $49,999 | 57 (12.4%) | 111 (27.7%) |
| $50,000 to $74,999 | 100 (21.7%) | 78 (19.5%) |
| $75,000 to $99,999 | 59 (12.8%) | 9 (2.2%) |
| $100,000 to $149,999 | 72 (15.7%) | 103 (25.7%) |
| $150,000 or more | 80 (17.4%) | 0 (0.0%) |
| Total | 460 (100.0%) | 401 (100.0%) |
Monthly Housing Cost Tiers in Blanco
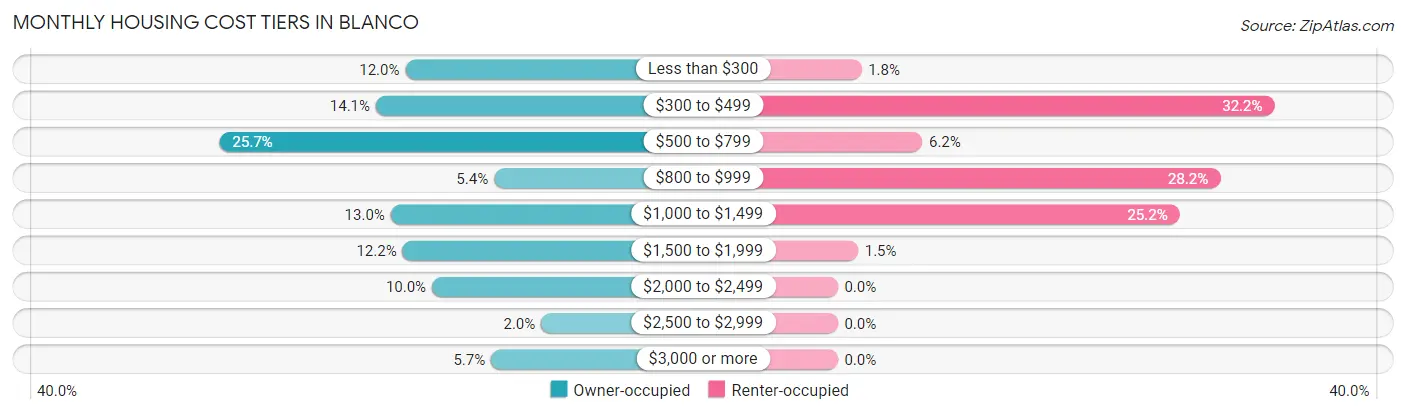
| Monthly Cost | Owner-occupied | Renter-occupied |
| Less than $300 | 55 (12.0%) | 7 (1.8%) |
| $300 to $499 | 65 (14.1%) | 129 (32.2%) |
| $500 to $799 | 118 (25.7%) | 25 (6.2%) |
| $800 to $999 | 25 (5.4%) | 113 (28.2%) |
| $1,000 to $1,499 | 60 (13.0%) | 101 (25.2%) |
| $1,500 to $1,999 | 56 (12.2%) | 6 (1.5%) |
| $2,000 to $2,499 | 46 (10.0%) | 0 (0.0%) |
| $2,500 to $2,999 | 9 (2.0%) | 0 (0.0%) |
| $3,000 or more | 26 (5.7%) | 0 (0.0%) |
| Total | 460 (100.0%) | 401 (100.0%) |
Physical Housing Characteristics in Blanco
Housing Structures in Blanco
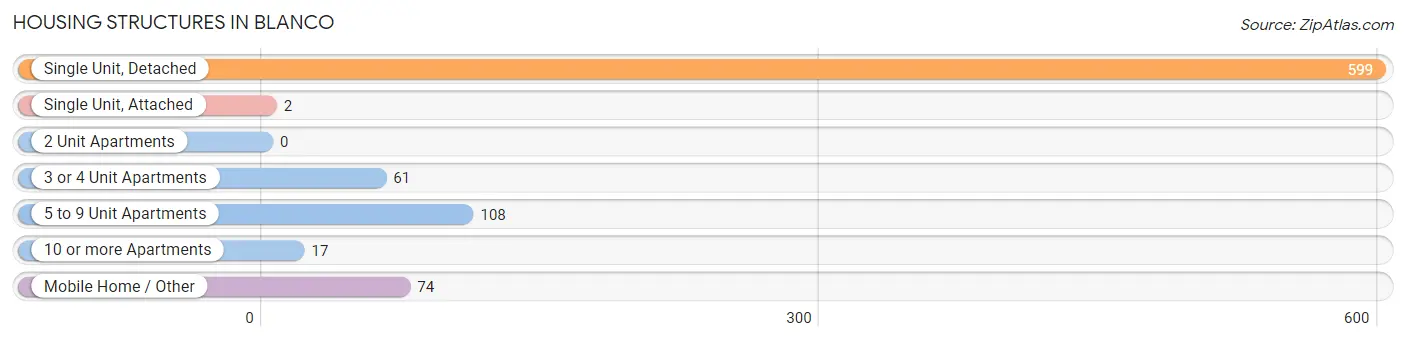
| Structure Type | # Housing Units | % Housing Units |
| Single Unit, Detached | 599 | 69.6% |
| Single Unit, Attached | 2 | 0.2% |
| 2 Unit Apartments | 0 | 0.0% |
| 3 or 4 Unit Apartments | 61 | 7.1% |
| 5 to 9 Unit Apartments | 108 | 12.5% |
| 10 or more Apartments | 17 | 2.0% |
| Mobile Home / Other | 74 | 8.6% |
| Total | 861 | 100.0% |
Housing Structures by Occupancy in Blanco
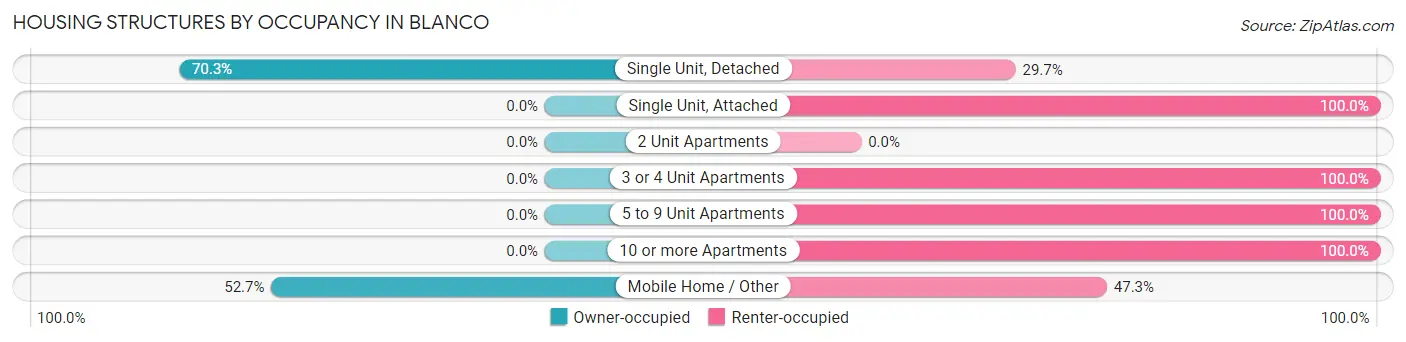
| Structure Type | Owner-occupied | Renter-occupied |
| Single Unit, Detached | 421 (70.3%) | 178 (29.7%) |
| Single Unit, Attached | 0 (0.0%) | 2 (100.0%) |
| 2 Unit Apartments | 0 (0.0%) | 0 (0.0%) |
| 3 or 4 Unit Apartments | 0 (0.0%) | 61 (100.0%) |
| 5 to 9 Unit Apartments | 0 (0.0%) | 108 (100.0%) |
| 10 or more Apartments | 0 (0.0%) | 17 (100.0%) |
| Mobile Home / Other | 39 (52.7%) | 35 (47.3%) |
| Total | 460 (53.4%) | 401 (46.6%) |
Housing Structures by Number of Rooms in Blanco
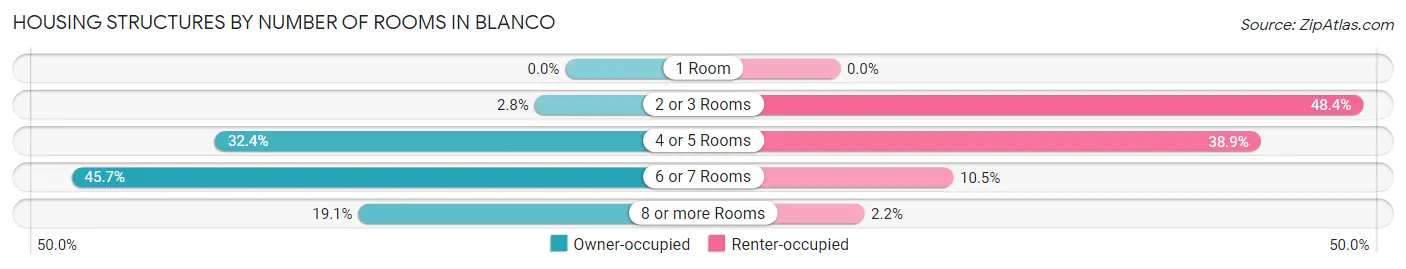
| Number of Rooms | Owner-occupied | Renter-occupied |
| 1 Room | 0 (0.0%) | 0 (0.0%) |
| 2 or 3 Rooms | 13 (2.8%) | 194 (48.4%) |
| 4 or 5 Rooms | 149 (32.4%) | 156 (38.9%) |
| 6 or 7 Rooms | 210 (45.7%) | 42 (10.5%) |
| 8 or more Rooms | 88 (19.1%) | 9 (2.2%) |
| Total | 460 (100.0%) | 401 (100.0%) |
Housing Structure by Heating Type in Blanco
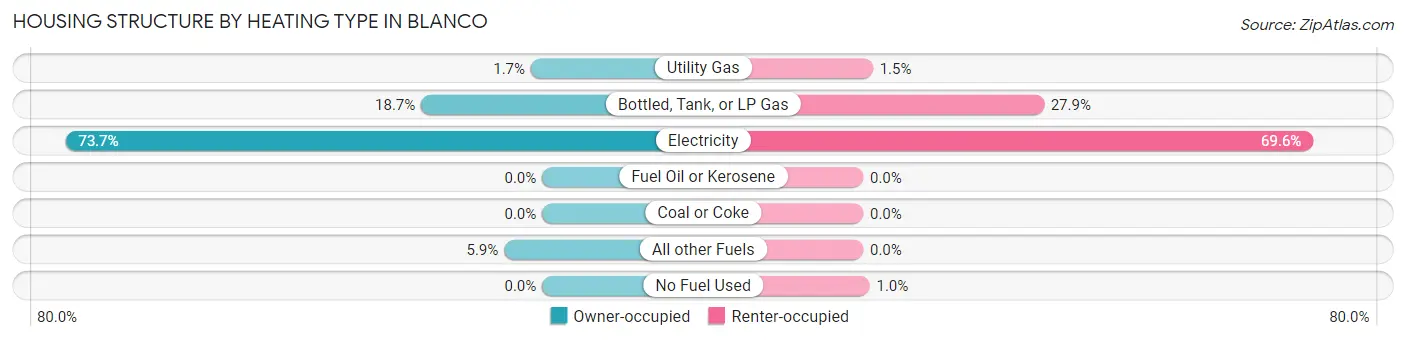
| Heating Type | Owner-occupied | Renter-occupied |
| Utility Gas | 8 (1.7%) | 6 (1.5%) |
| Bottled, Tank, or LP Gas | 86 (18.7%) | 112 (27.9%) |
| Electricity | 339 (73.7%) | 279 (69.6%) |
| Fuel Oil or Kerosene | 0 (0.0%) | 0 (0.0%) |
| Coal or Coke | 0 (0.0%) | 0 (0.0%) |
| All other Fuels | 27 (5.9%) | 0 (0.0%) |
| No Fuel Used | 0 (0.0%) | 4 (1.0%) |
| Total | 460 (100.0%) | 401 (100.0%) |
Household Vehicle Usage in Blanco
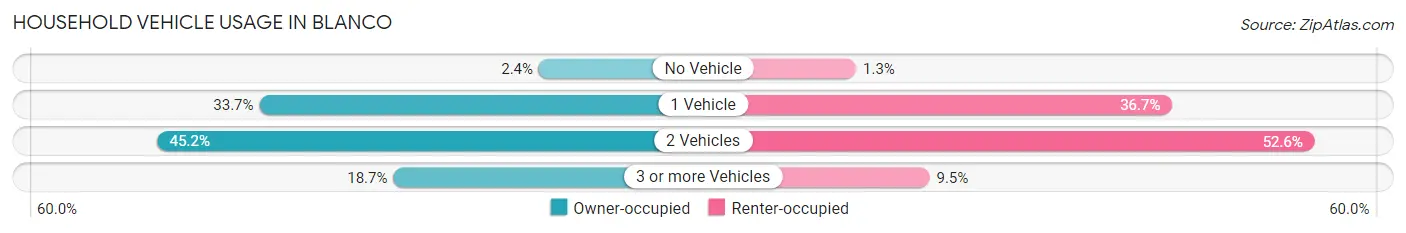
| Vehicles per Household | Owner-occupied | Renter-occupied |
| No Vehicle | 11 (2.4%) | 5 (1.3%) |
| 1 Vehicle | 155 (33.7%) | 147 (36.7%) |
| 2 Vehicles | 208 (45.2%) | 211 (52.6%) |
| 3 or more Vehicles | 86 (18.7%) | 38 (9.5%) |
| Total | 460 (100.0%) | 401 (100.0%) |
Real Estate & Mortgages in Blanco
Real Estate and Mortgage Overview in Blanco
| Characteristic | Without Mortgage | With Mortgage |
| Housing Units | 256 | 204 |
| Median Property Value | $154,800 | $312,100 |
| Median Household Income | $57,768 | $46 |
| Monthly Housing Costs | $547 | $26 |
| Real Estate Taxes | $1,759 | $11 |
Property Value by Mortgage Status in Blanco
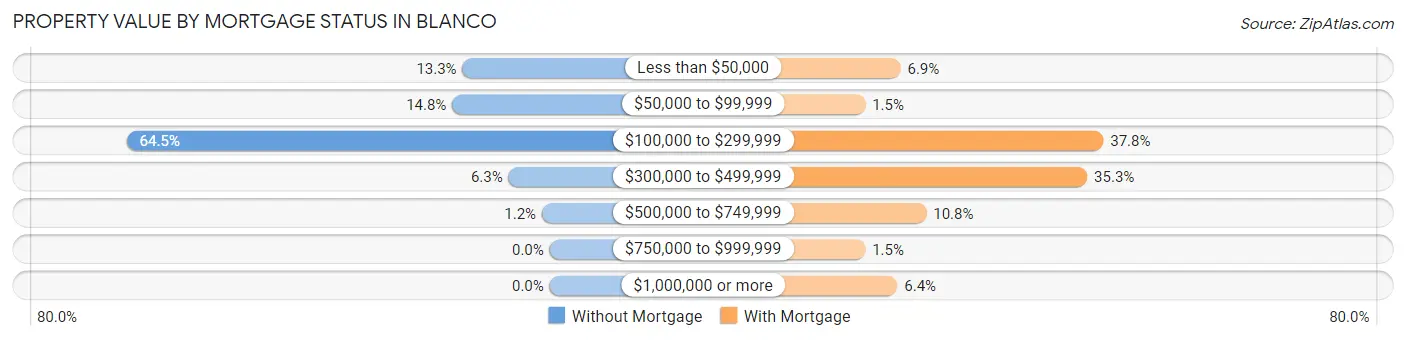
| Property Value | Without Mortgage | With Mortgage |
| Less than $50,000 | 34 (13.3%) | 14 (6.9%) |
| $50,000 to $99,999 | 38 (14.8%) | 3 (1.5%) |
| $100,000 to $299,999 | 165 (64.4%) | 77 (37.8%) |
| $300,000 to $499,999 | 16 (6.2%) | 72 (35.3%) |
| $500,000 to $749,999 | 3 (1.2%) | 22 (10.8%) |
| $750,000 to $999,999 | 0 (0.0%) | 3 (1.5%) |
| $1,000,000 or more | 0 (0.0%) | 13 (6.4%) |
| Total | 256 (100.0%) | 204 (100.0%) |
Household Income by Mortgage Status in Blanco
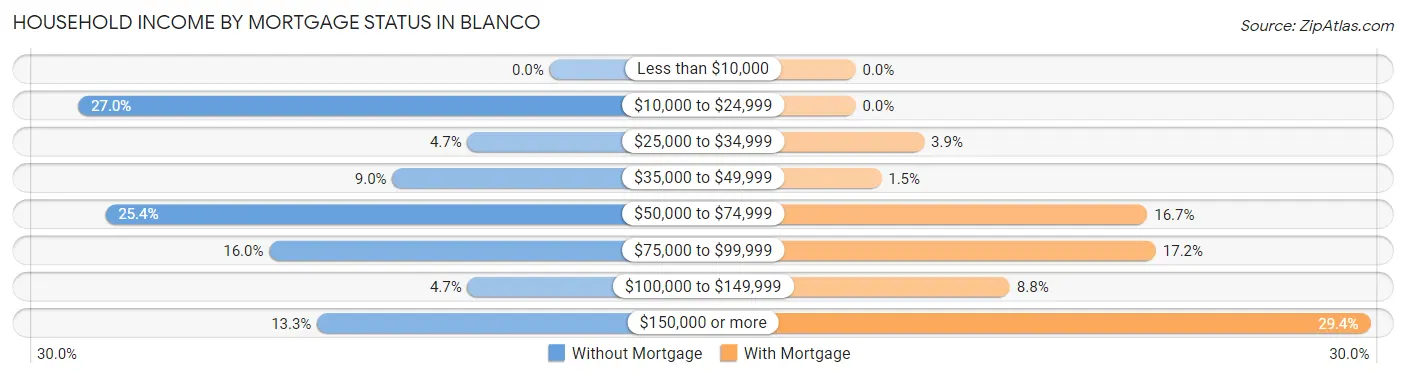
| Household Income | Without Mortgage | With Mortgage |
| Less than $10,000 | 0 (0.0%) | 0 (0.0%) |
| $10,000 to $24,999 | 69 (27.0%) | 0 (0.0%) |
| $25,000 to $34,999 | 12 (4.7%) | 8 (3.9%) |
| $35,000 to $49,999 | 23 (9.0%) | 3 (1.5%) |
| $50,000 to $74,999 | 65 (25.4%) | 34 (16.7%) |
| $75,000 to $99,999 | 41 (16.0%) | 35 (17.2%) |
| $100,000 to $149,999 | 12 (4.7%) | 18 (8.8%) |
| $150,000 or more | 34 (13.3%) | 60 (29.4%) |
| Total | 256 (100.0%) | 204 (100.0%) |
Property Value to Household Income Ratio in Blanco
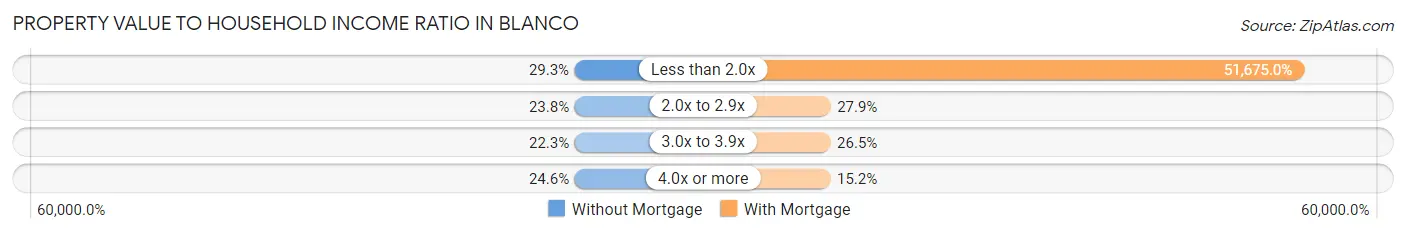
| Value-to-Income Ratio | Without Mortgage | With Mortgage |
| Less than 2.0x | 75 (29.3%) | 105,417 (51,675.0%) |
| 2.0x to 2.9x | 61 (23.8%) | 57 (27.9%) |
| 3.0x to 3.9x | 57 (22.3%) | 54 (26.5%) |
| 4.0x or more | 63 (24.6%) | 31 (15.2%) |
| Total | 256 (100.0%) | 204 (100.0%) |
Real Estate Taxes by Mortgage Status in Blanco
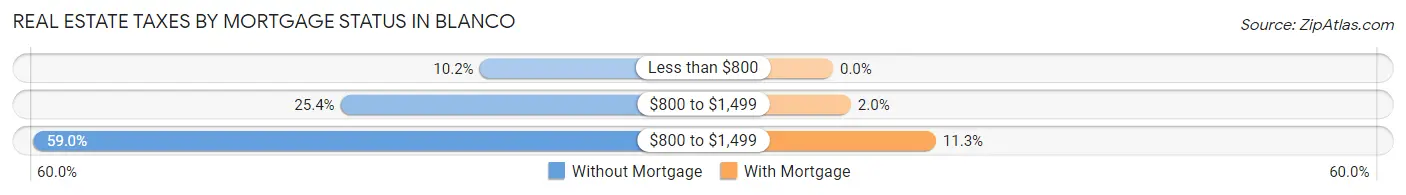
| Property Taxes | Without Mortgage | With Mortgage |
| Less than $800 | 26 (10.2%) | 0 (0.0%) |
| $800 to $1,499 | 65 (25.4%) | 4 (2.0%) |
| $800 to $1,499 | 151 (59.0%) | 23 (11.3%) |
| Total | 256 (100.0%) | 204 (100.0%) |
Health & Disability in Blanco
Health Insurance Coverage by Age in Blanco
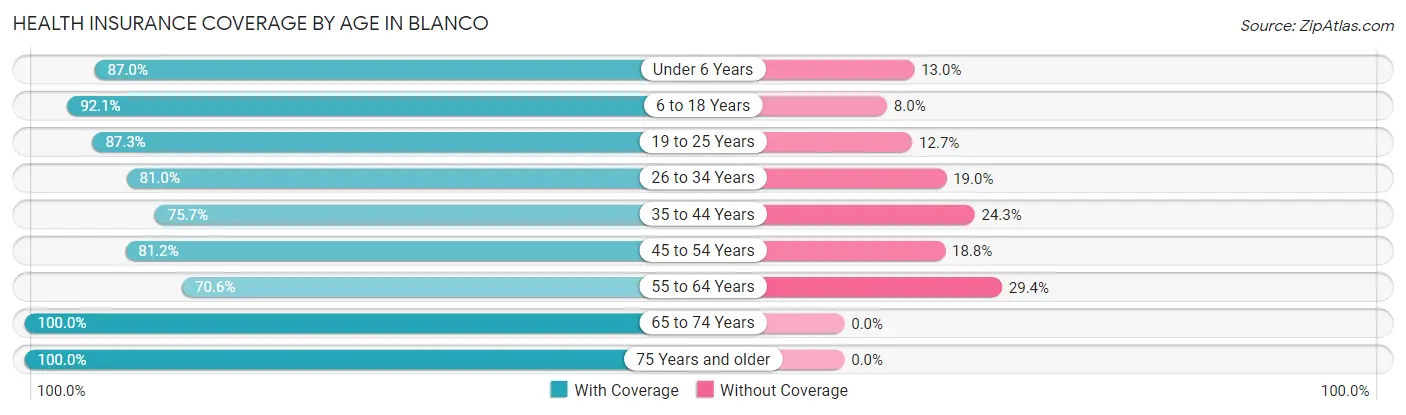
| Age Bracket | With Coverage | Without Coverage |
| Under 6 Years | 100 (87.0%) | 15 (13.0%) |
| 6 to 18 Years | 359 (92.0%) | 31 (8.0%) |
| 19 to 25 Years | 200 (87.3%) | 29 (12.7%) |
| 26 to 34 Years | 294 (81.0%) | 69 (19.0%) |
| 35 to 44 Years | 134 (75.7%) | 43 (24.3%) |
| 45 to 54 Years | 160 (81.2%) | 37 (18.8%) |
| 55 to 64 Years | 238 (70.6%) | 99 (29.4%) |
| 65 to 74 Years | 174 (100.0%) | 0 (0.0%) |
| 75 Years and older | 132 (100.0%) | 0 (0.0%) |
| Total | 1,791 (84.7%) | 323 (15.3%) |
Health Insurance Coverage by Citizenship Status in Blanco
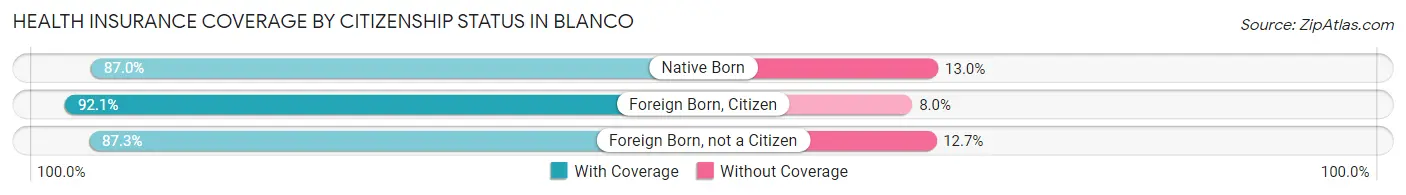
| Citizenship Status | With Coverage | Without Coverage |
| Native Born | 100 (87.0%) | 15 (13.0%) |
| Foreign Born, Citizen | 359 (92.0%) | 31 (8.0%) |
| Foreign Born, not a Citizen | 200 (87.3%) | 29 (12.7%) |
Health Insurance Coverage by Household Income in Blanco
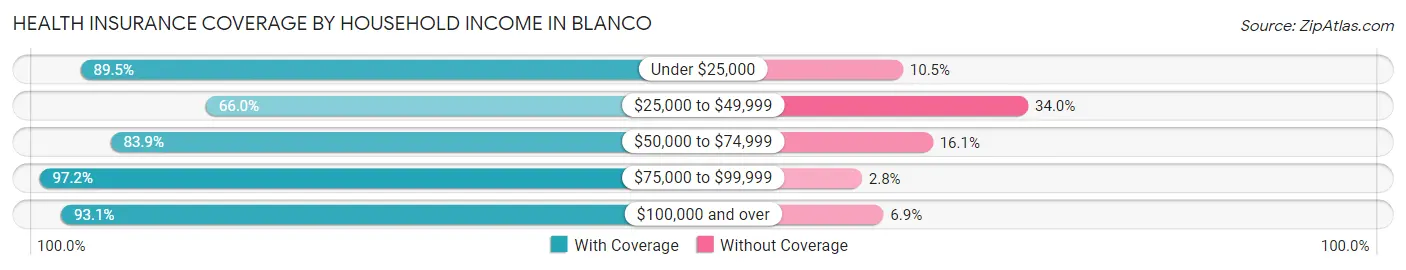
| Household Income | With Coverage | Without Coverage |
| Under $25,000 | 179 (89.5%) | 21 (10.5%) |
| $25,000 to $49,999 | 348 (66.0%) | 179 (34.0%) |
| $50,000 to $74,999 | 344 (83.9%) | 66 (16.1%) |
| $75,000 to $99,999 | 241 (97.2%) | 7 (2.8%) |
| $100,000 and over | 679 (93.1%) | 50 (6.9%) |
Public vs Private Health Insurance Coverage by Age in Blanco
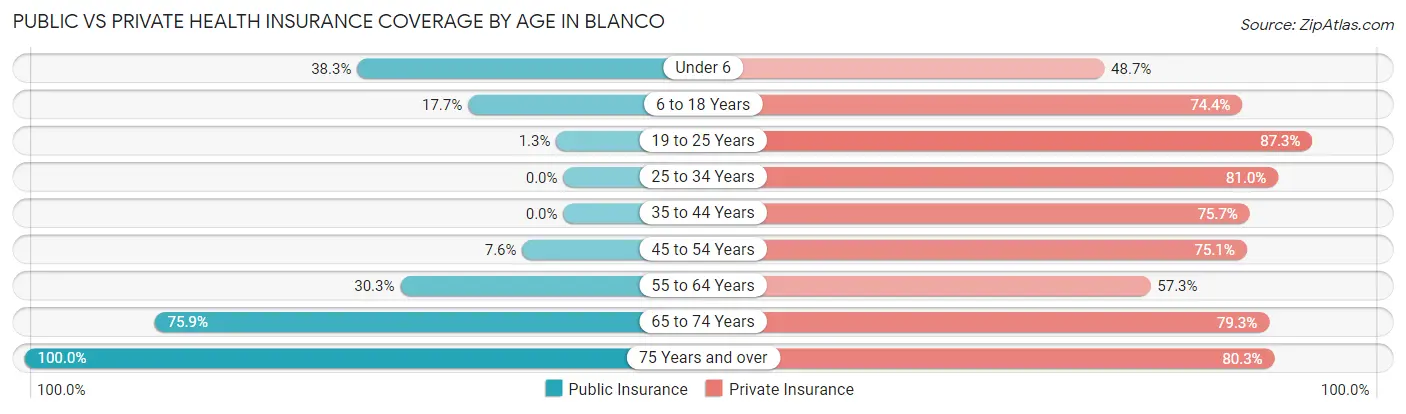
| Age Bracket | Public Insurance | Private Insurance |
| Under 6 | 44 (38.3%) | 56 (48.7%) |
| 6 to 18 Years | 69 (17.7%) | 290 (74.4%) |
| 19 to 25 Years | 3 (1.3%) | 200 (87.3%) |
| 25 to 34 Years | 0 (0.0%) | 294 (81.0%) |
| 35 to 44 Years | 0 (0.0%) | 134 (75.7%) |
| 45 to 54 Years | 15 (7.6%) | 148 (75.1%) |
| 55 to 64 Years | 102 (30.3%) | 193 (57.3%) |
| 65 to 74 Years | 132 (75.9%) | 138 (79.3%) |
| 75 Years and over | 132 (100.0%) | 106 (80.3%) |
| Total | 497 (23.5%) | 1,559 (73.8%) |
Disability Status by Sex by Age in Blanco
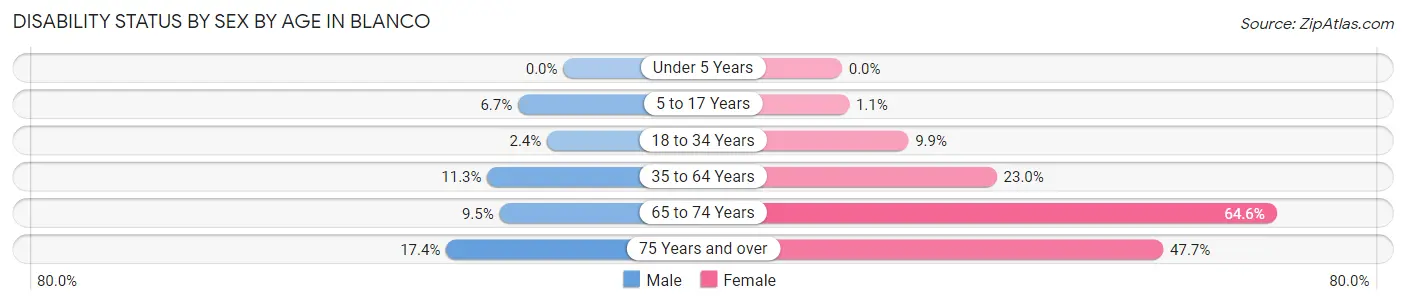
| Age Bracket | Male | Female |
| Under 5 Years | 0 (0.0%) | 0 (0.0%) |
| 5 to 17 Years | 14 (6.7%) | 2 (1.1%) |
| 18 to 34 Years | 8 (2.4%) | 29 (9.9%) |
| 35 to 64 Years | 38 (11.3%) | 86 (23.0%) |
| 65 to 74 Years | 9 (9.5%) | 51 (64.6%) |
| 75 Years and over | 4 (17.4%) | 52 (47.7%) |
Disability Class by Sex by Age in Blanco
Disability Class: Hearing Difficulty
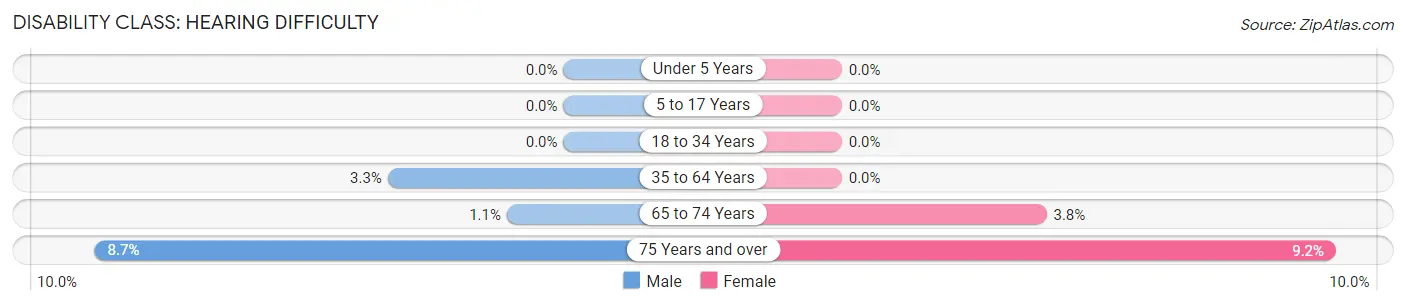
| Age Bracket | Male | Female |
| Under 5 Years | 0 (0.0%) | 0 (0.0%) |
| 5 to 17 Years | 0 (0.0%) | 0 (0.0%) |
| 18 to 34 Years | 0 (0.0%) | 0 (0.0%) |
| 35 to 64 Years | 11 (3.3%) | 0 (0.0%) |
| 65 to 74 Years | 1 (1.1%) | 3 (3.8%) |
| 75 Years and over | 2 (8.7%) | 10 (9.2%) |
Disability Class: Vision Difficulty
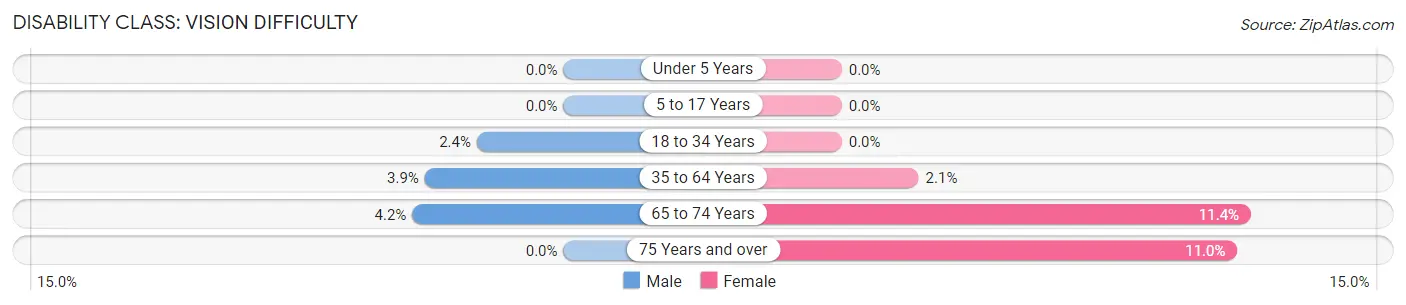
| Age Bracket | Male | Female |
| Under 5 Years | 0 (0.0%) | 0 (0.0%) |
| 5 to 17 Years | 0 (0.0%) | 0 (0.0%) |
| 18 to 34 Years | 8 (2.4%) | 0 (0.0%) |
| 35 to 64 Years | 13 (3.9%) | 8 (2.1%) |
| 65 to 74 Years | 4 (4.2%) | 9 (11.4%) |
| 75 Years and over | 0 (0.0%) | 12 (11.0%) |
Disability Class: Cognitive Difficulty
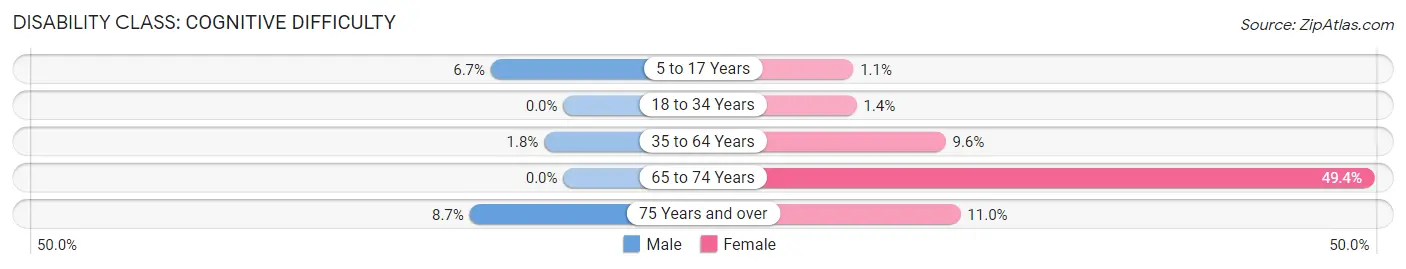
| Age Bracket | Male | Female |
| 5 to 17 Years | 14 (6.7%) | 2 (1.1%) |
| 18 to 34 Years | 0 (0.0%) | 4 (1.4%) |
| 35 to 64 Years | 6 (1.8%) | 36 (9.6%) |
| 65 to 74 Years | 0 (0.0%) | 39 (49.4%) |
| 75 Years and over | 2 (8.7%) | 12 (11.0%) |
Disability Class: Ambulatory Difficulty
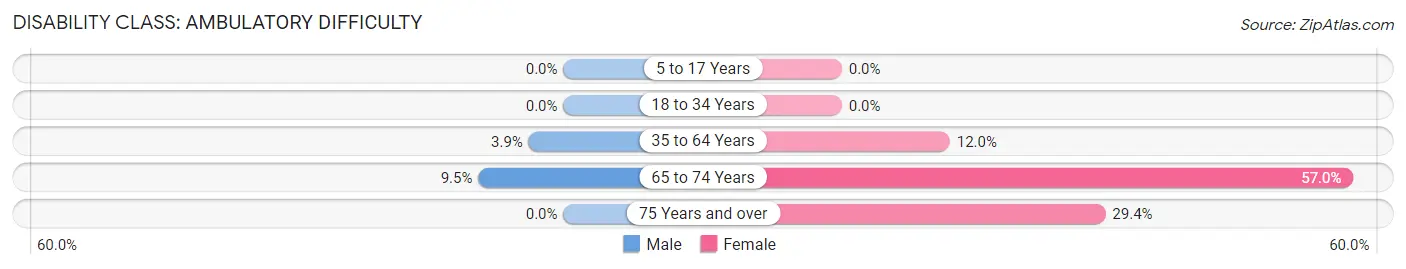
| Age Bracket | Male | Female |
| 5 to 17 Years | 0 (0.0%) | 0 (0.0%) |
| 18 to 34 Years | 0 (0.0%) | 0 (0.0%) |
| 35 to 64 Years | 13 (3.9%) | 45 (12.0%) |
| 65 to 74 Years | 9 (9.5%) | 45 (57.0%) |
| 75 Years and over | 0 (0.0%) | 32 (29.4%) |
Disability Class: Self-Care Difficulty
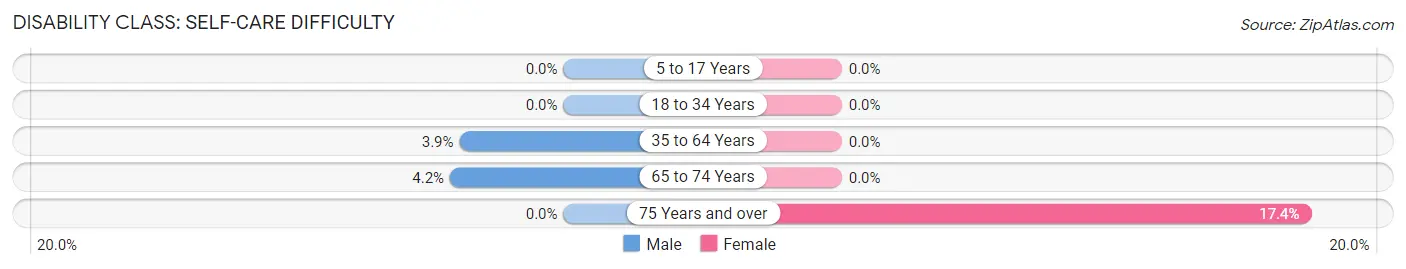
| Age Bracket | Male | Female |
| 5 to 17 Years | 0 (0.0%) | 0 (0.0%) |
| 18 to 34 Years | 0 (0.0%) | 0 (0.0%) |
| 35 to 64 Years | 13 (3.9%) | 0 (0.0%) |
| 65 to 74 Years | 4 (4.2%) | 0 (0.0%) |
| 75 Years and over | 0 (0.0%) | 19 (17.4%) |
Technology Access in Blanco
Computing Device Access in Blanco
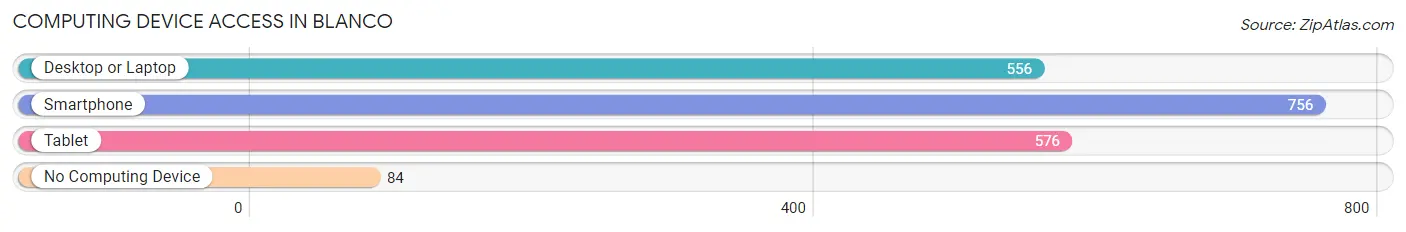
| Device Type | # Households | % Households |
| Desktop or Laptop | 556 | 64.6% |
| Smartphone | 756 | 87.8% |
| Tablet | 576 | 66.9% |
| No Computing Device | 84 | 9.8% |
| Total | 861 | 100.0% |
Internet Access in Blanco
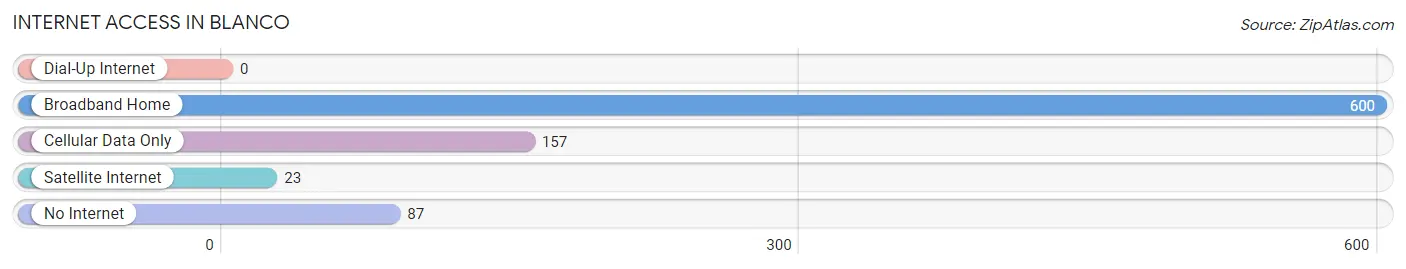
| Internet Type | # Households | % Households |
| Dial-Up Internet | 0 | 0.0% |
| Broadband Home | 600 | 69.7% |
| Cellular Data Only | 157 | 18.2% |
| Satellite Internet | 23 | 2.7% |
| No Internet | 87 | 10.1% |
| Total | 861 | 100.0% |
Blanco Summary
Blanco, Texas is a small town located in the heart of the Texas Hill Country. It is situated in Blanco County, which is part of the larger San Antonio-Austin-Round Rock Metropolitan Statistical Area. The town has a population of approximately 2,000 people and is known for its rural charm and natural beauty.
History
The area that is now Blanco was first settled in the early 1800s by German and Irish immigrants. The town was officially founded in 1853 and was named after the nearby Blanco River. The town quickly grew and by the late 1800s, it had become a thriving agricultural center. The town was also home to several businesses, including a cotton gin, a grist mill, and a blacksmith shop.
In the early 1900s, the town began to experience a decline in population as many of its residents moved away to larger cities. However, the town was able to remain a vibrant community thanks to its strong agricultural base. In the 1950s, the town experienced a resurgence in population as many people moved to the area to take advantage of the area’s natural beauty and rural charm.
Geography
Blanco is located in the heart of the Texas Hill Country, approximately 50 miles northwest of San Antonio. The town is situated on the banks of the Blanco River, which is a tributary of the Guadalupe River. The town is surrounded by rolling hills and lush vegetation, making it a popular destination for outdoor enthusiasts.
The climate in Blanco is generally mild and temperate. The average temperature in the summer is around 80 degrees Fahrenheit, while the average temperature in the winter is around 50 degrees Fahrenheit. The town receives an average of 33 inches of rain per year.
Economy
The economy of Blanco is largely based on agriculture and tourism. The town is home to several farms and ranches, which produce a variety of crops, including corn, cotton, and hay. The town is also home to several wineries, which attract visitors from all over the state.
In addition to agriculture and tourism, Blanco is home to several small businesses, including restaurants, shops, and galleries. The town is also home to a number of manufacturing companies, which produce a variety of products, including furniture, clothing, and electronics.
Demographics
As of the 2010 census, the population of Blanco was 2,039. The racial makeup of the town was 94.3% White, 0.7% African American, 0.3% Native American, 0.2% Asian, 0.1% Pacific Islander, 2.7% from other races, and 1.9% from two or more races. Hispanic or Latino of any race were 8.2% of the population.
The median household income in Blanco was $41,250, and the median family income was $45,938. The per capita income for the town was $20,945. About 11.2% of families and 13.3% of the population were below the poverty line, including 17.2% of those under age 18 and 8.2% of those age 65 or over.
Overall, Blanco is a small town with a rich history and a vibrant economy. The town is known for its rural charm and natural beauty, making it a popular destination for tourists and outdoor enthusiasts. The town is also home to a diverse population, with a variety of cultures and backgrounds.
Common Questions
What is Per Capita Income in Blanco?
Per Capita income in Blanco is $31,702.
What is the Median Family Income in Blanco?
Median Family Income in Blanco is $70,500.
What is the Median Household income in Blanco?
Median Household Income in Blanco is $59,601.
What is Income or Wage Gap in Blanco?
Income or Wage Gap in Blanco is 27.0%.
Women in Blanco earn 73.0 cents for every dollar earned by a man.
What is Inequality or Gini Index in Blanco?
Inequality or Gini Index in Blanco is 0.42.
What is the Total Population of Blanco?
Total Population of Blanco is 2,147.
What is the Total Male Population of Blanco?
Total Male Population of Blanco is 1,044.
What is the Total Female Population of Blanco?
Total Female Population of Blanco is 1,103.
What is the Ratio of Males per 100 Females in Blanco?
There are 94.65 Males per 100 Females in Blanco.
What is the Ratio of Females per 100 Males in Blanco?
There are 105.65 Females per 100 Males in Blanco.
What is the Median Population Age in Blanco?
Median Population Age in Blanco is 33.7 Years.
What is the Average Family Size in Blanco
Average Family Size in Blanco is 3.4 People.
What is the Average Household Size in Blanco
Average Household Size in Blanco is 2.5 People.
How Large is the Labor Force in Blanco?
There are 1,108 People in the Labor Forcein in Blanco.
What is the Percentage of People in the Labor Force in Blanco?
64.1% of People are in the Labor Force in Blanco.
What is the Unemployment Rate in Blanco?
Unemployment Rate in Blanco is 2.7%.