Big Wells, TX Map & Demographics
Big Wells Map
Big Wells Overview
$15,968
PER CAPITA INCOME
$29,375
AVG FAMILY INCOME
$30,156
AVG HOUSEHOLD INCOME
32.0%
WAGE / INCOME GAP [ % ]
68.0¢/ $1
WAGE / INCOME GAP [ $ ]
0.38
INEQUALITY / GINI INDEX
432
TOTAL POPULATION
163
MALE POPULATION
269
FEMALE POPULATION
60.59
MALES / 100 FEMALES
165.03
FEMALES / 100 MALES
40.3
MEDIAN AGE
3.4
AVG FAMILY SIZE
2.5
AVG HOUSEHOLD SIZE
145
LABOR FORCE [ PEOPLE ]
42.4%
PERCENT IN LABOR FORCE
15.9%
UNEMPLOYMENT RATE
Big Wells Zip Codes
Big Wells Area Codes
Income in Big Wells
Income Overview in Big Wells
Per Capita Income in Big Wells is $15,968, while median incomes of families and households are $29,375 and $30,156 respectively.
| Characteristic | Number | Measure |
| Per Capita Income | 432 | $15,968 |
| Median Family Income | 94 | $29,375 |
| Mean Family Income | 94 | $31,823 |
| Median Household Income | 171 | $30,156 |
| Mean Household Income | 171 | $37,029 |
| Income Deficit | 94 | $0 |
| Wage / Income Gap (%) | 432 | 32.03% |
| Wage / Income Gap ($) | 432 | 67.97¢ per $1 |
| Gini / Inequality Index | 432 | 0.38 |
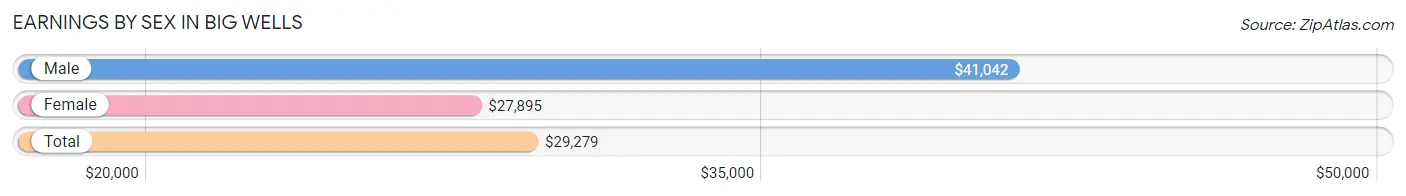
Earnings by Sex in Big Wells
Average Earnings in Big Wells are $29,279, $41,042 for men and $27,895 for women, a difference of 32.0%.
| Sex | Number | Average Earnings |
| Male | 47 (35.3%) | $41,042 |
| Female | 86 (64.7%) | $27,895 |
| Total | 133 (100.0%) | $29,279 |
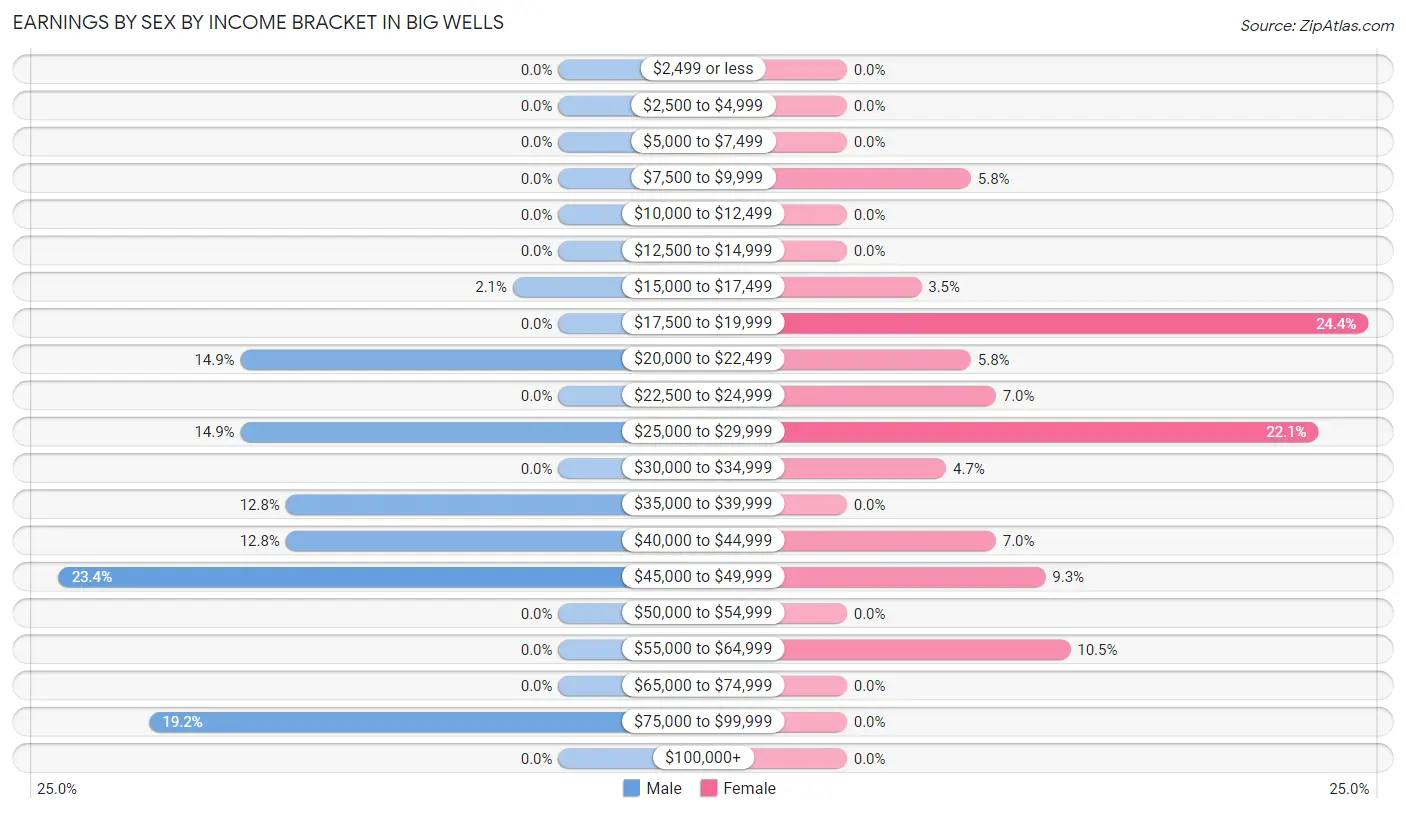
Earnings by Sex by Income Bracket in Big Wells
The most common earnings brackets in Big Wells are $45,000 to $49,999 for men (11 | 23.4%) and $17,500 to $19,999 for women (21 | 24.4%).
| Income | Male | Female |
| $2,499 or less | 0 (0.0%) | 0 (0.0%) |
| $2,500 to $4,999 | 0 (0.0%) | 0 (0.0%) |
| $5,000 to $7,499 | 0 (0.0%) | 0 (0.0%) |
| $7,500 to $9,999 | 0 (0.0%) | 5 (5.8%) |
| $10,000 to $12,499 | 0 (0.0%) | 0 (0.0%) |
| $12,500 to $14,999 | 0 (0.0%) | 0 (0.0%) |
| $15,000 to $17,499 | 1 (2.1%) | 3 (3.5%) |
| $17,500 to $19,999 | 0 (0.0%) | 21 (24.4%) |
| $20,000 to $22,499 | 7 (14.9%) | 5 (5.8%) |
| $22,500 to $24,999 | 0 (0.0%) | 6 (7.0%) |
| $25,000 to $29,999 | 7 (14.9%) | 19 (22.1%) |
| $30,000 to $34,999 | 0 (0.0%) | 4 (4.6%) |
| $35,000 to $39,999 | 6 (12.8%) | 0 (0.0%) |
| $40,000 to $44,999 | 6 (12.8%) | 6 (7.0%) |
| $45,000 to $49,999 | 11 (23.4%) | 8 (9.3%) |
| $50,000 to $54,999 | 0 (0.0%) | 0 (0.0%) |
| $55,000 to $64,999 | 0 (0.0%) | 9 (10.5%) |
| $65,000 to $74,999 | 0 (0.0%) | 0 (0.0%) |
| $75,000 to $99,999 | 9 (19.2%) | 0 (0.0%) |
| $100,000+ | 0 (0.0%) | 0 (0.0%) |
| Total | 47 (100.0%) | 86 (100.0%) |
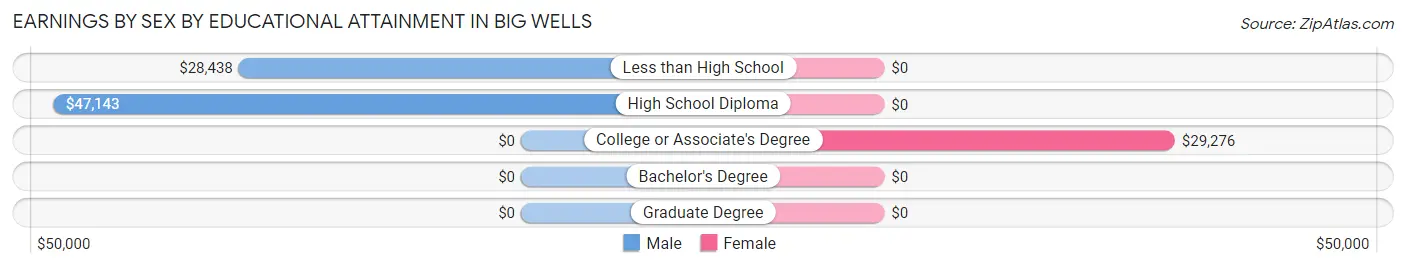
Earnings by Sex by Educational Attainment in Big Wells
Average earnings in Big Wells are $42,292 for men and $27,895 for women, a difference of 34.0%. Men with an educational attainment of high school diploma enjoy the highest average annual earnings of $47,143, while those with less than high school education earn the least with $28,438. Women with an educational attainment of college or associate's degree earn the most with the average annual earnings of $29,276, while those with college or associate's degree education have the smallest earnings of $29,276.
| Educational Attainment | Male Income | Female Income |
| Less than High School | $28,438 | $0 |
| High School Diploma | $47,143 | $0 |
| College or Associate's Degree | - | - |
| Bachelor's Degree | - | - |
| Graduate Degree | - | - |
| Total | $42,292 | $27,895 |
Family Income in Big Wells
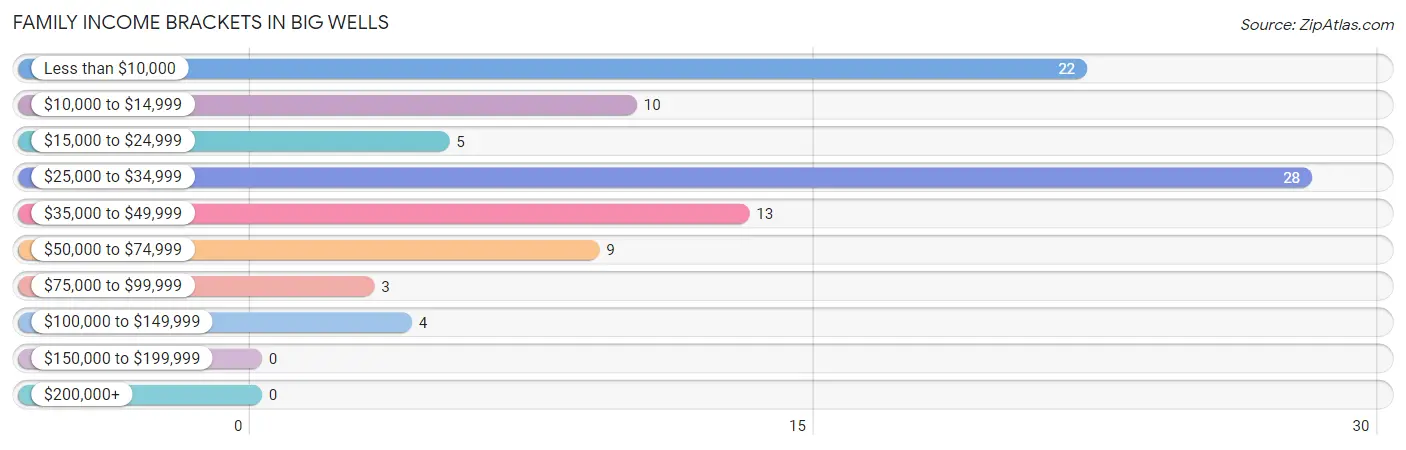
Family Income Brackets in Big Wells
According to the Big Wells family income data, there are 28 families falling into the $25,000 to $34,999 income range, which is the most common income bracket and makes up 29.8% of all families.
| Income Bracket | # Families | % Families |
| Less than $10,000 | 22 | 23.4% |
| $10,000 to $14,999 | 10 | 10.6% |
| $15,000 to $24,999 | 5 | 5.3% |
| $25,000 to $34,999 | 28 | 29.8% |
| $35,000 to $49,999 | 13 | 13.8% |
| $50,000 to $74,999 | 9 | 9.6% |
| $75,000 to $99,999 | 3 | 3.2% |
| $100,000 to $149,999 | 4 | 4.3% |
| $150,000 to $199,999 | 0 | 0.0% |
| $200,000+ | 0 | 0.0% |
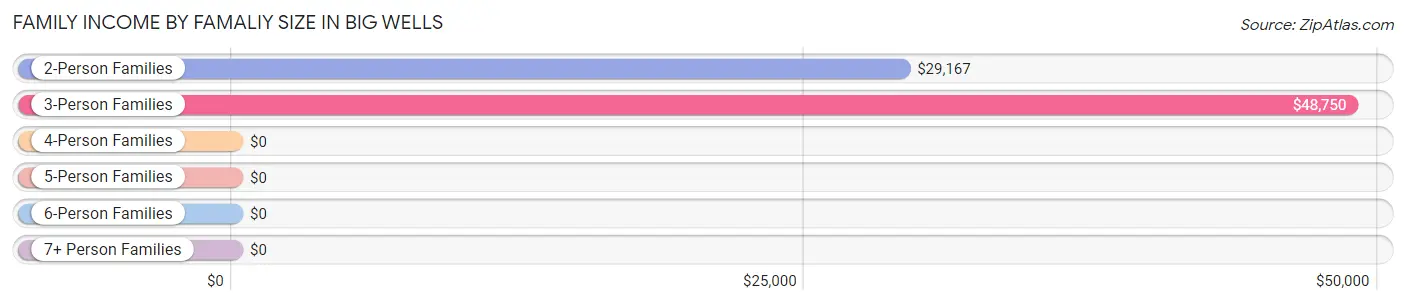
Family Income by Famaliy Size in Big Wells
3-person families (24 | 25.5%) account for the highest median family income in Big Wells with $48,750 per family, while 3-person families (24 | 25.5%) have the highest median income of $16,250 per family member.
| Income Bracket | # Families | Median Income |
| 2-Person Families | 50 (53.2%) | $29,167 |
| 3-Person Families | 24 (25.5%) | $48,750 |
| 4-Person Families | 15 (16.0%) | $0 |
| 5-Person Families | 0 (0.0%) | $0 |
| 6-Person Families | 0 (0.0%) | $0 |
| 7+ Person Families | 5 (5.3%) | $0 |
| Total | 94 (100.0%) | $29,375 |
Family Income by Number of Earners in Big Wells
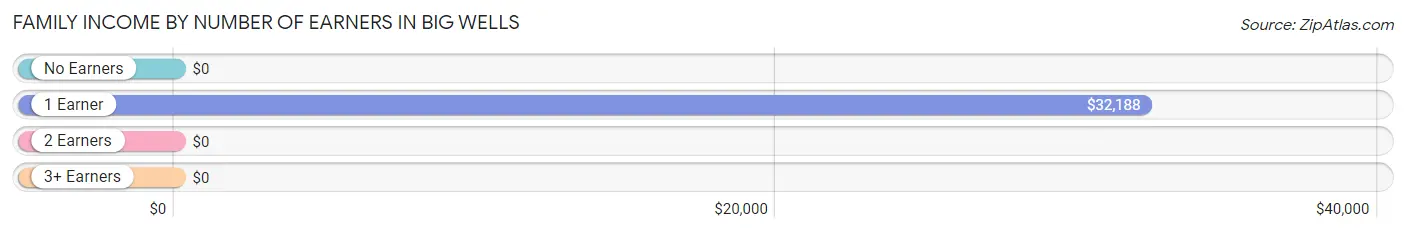
| Number of Earners | # Families | Median Income |
| No Earners | 40 (42.5%) | $0 |
| 1 Earner | 50 (53.2%) | $32,188 |
| 2 Earners | 4 (4.3%) | $0 |
| 3+ Earners | 0 (0.0%) | $0 |
| Total | 94 (100.0%) | $29,375 |
Household Income in Big Wells
Household Income Brackets in Big Wells
With 45 households falling in the category, the $25,000 to $34,999 income range is the most frequent in Big Wells, accounting for 26.3% of all households.
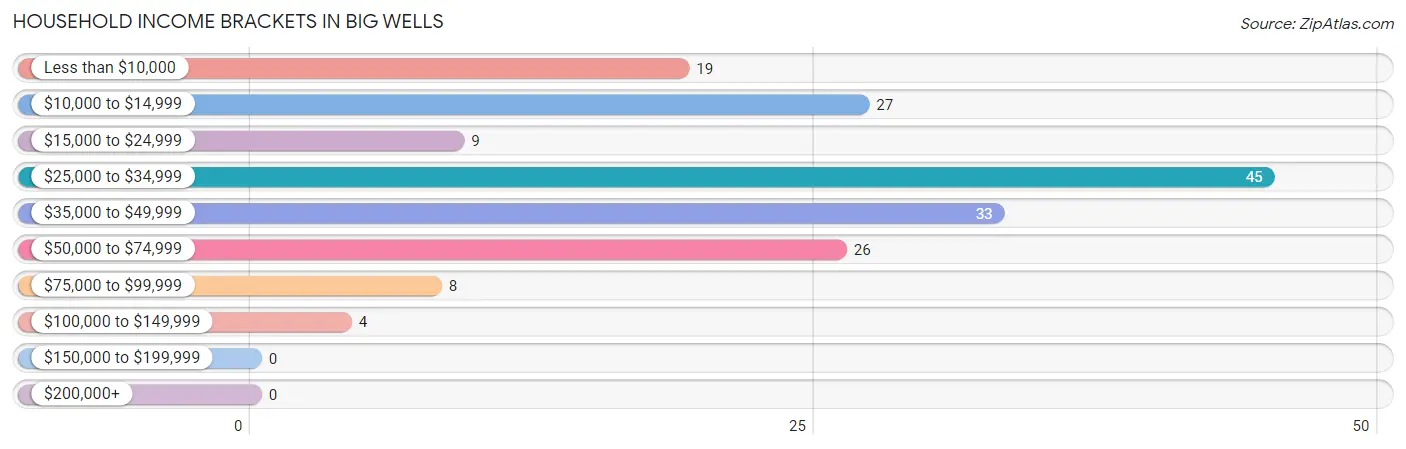
| Income Bracket | # Households | % Households |
| Less than $10,000 | 19 | 11.1% |
| $10,000 to $14,999 | 27 | 15.8% |
| $15,000 to $24,999 | 9 | 5.3% |
| $25,000 to $34,999 | 45 | 26.3% |
| $35,000 to $49,999 | 33 | 19.3% |
| $50,000 to $74,999 | 26 | 15.2% |
| $75,000 to $99,999 | 8 | 4.7% |
| $100,000 to $149,999 | 4 | 2.3% |
| $150,000 to $199,999 | 0 | 0.0% |
| $200,000+ | 0 | 0.0% |
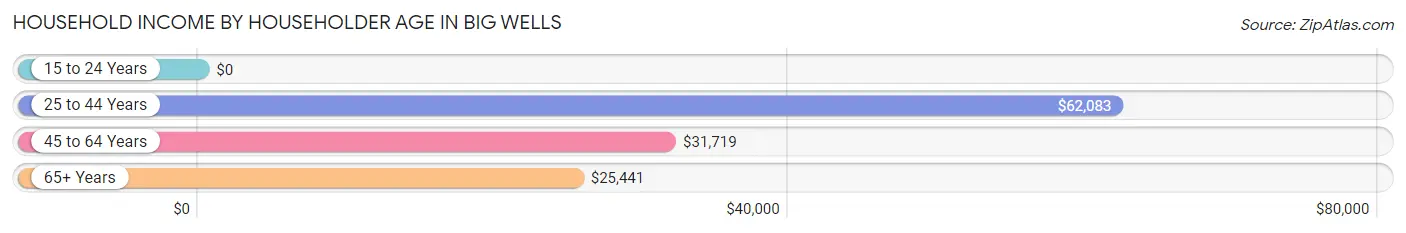
Household Income by Householder Age in Big Wells
The median household income in Big Wells is $30,156, with the highest median household income of $62,083 found in the 25 to 44 years age bracket for the primary householder. A total of 43 households (25.2%) fall into this category. Meanwhile, the 15 to 24 years age bracket for the primary householder has the lowest median household income of $0, with 5 households (2.9%) in this group.
| Income Bracket | # Households | Median Income |
| 15 to 24 Years | 5 (2.9%) | $0 |
| 25 to 44 Years | 43 (25.2%) | $62,083 |
| 45 to 64 Years | 39 (22.8%) | $31,719 |
| 65+ Years | 84 (49.1%) | $25,441 |
| Total | 171 (100.0%) | $30,156 |
Poverty in Big Wells
Income Below Poverty by Sex and Age in Big Wells
With 40.5% poverty level for males and 49.4% for females among the residents of Big Wells, under 5 year old males and under 5 year old females are the most vulnerable to poverty, with 11 males (100.0%) and 4 females (100.0%) in their respective age groups living below the poverty level.
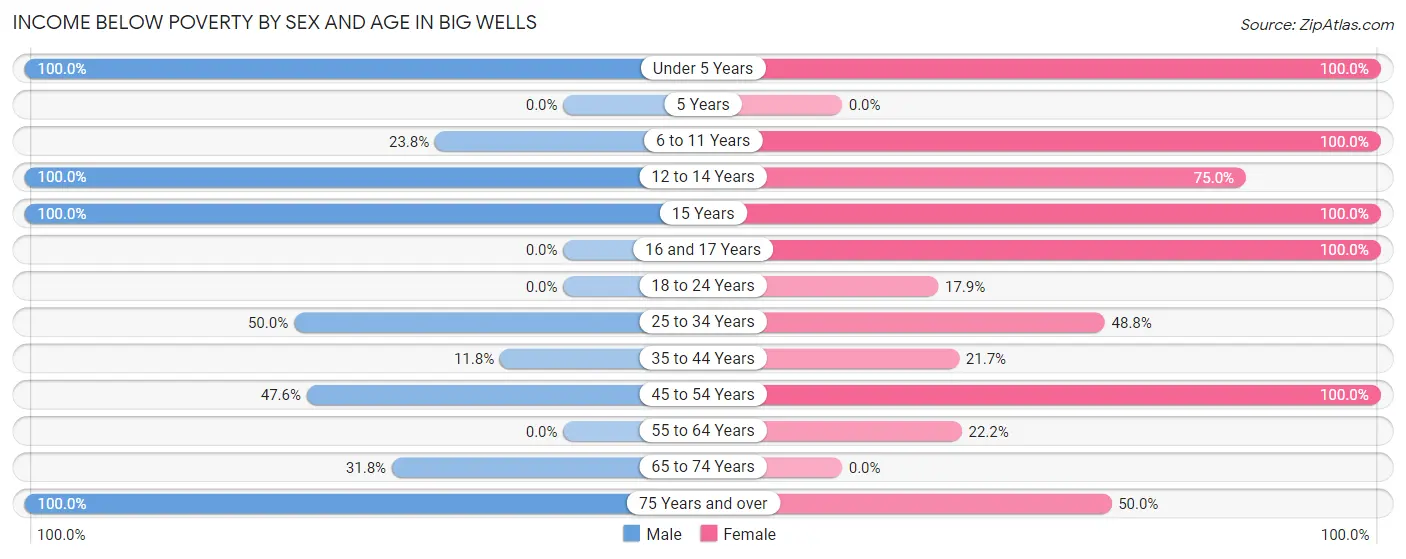
| Age Bracket | Male | Female |
| Under 5 Years | 11 (100.0%) | 4 (100.0%) |
| 5 Years | 0 (0.0%) | 0 (0.0%) |
| 6 to 11 Years | 5 (23.8%) | 18 (100.0%) |
| 12 to 14 Years | 9 (100.0%) | 15 (75.0%) |
| 15 Years | 2 (100.0%) | 5 (100.0%) |
| 16 and 17 Years | 0 (0.0%) | 11 (100.0%) |
| 18 to 24 Years | 0 (0.0%) | 5 (17.9%) |
| 25 to 34 Years | 7 (50.0%) | 20 (48.8%) |
| 35 to 44 Years | 2 (11.8%) | 5 (21.7%) |
| 45 to 54 Years | 10 (47.6%) | 28 (100.0%) |
| 55 to 64 Years | 0 (0.0%) | 6 (22.2%) |
| 65 to 74 Years | 14 (31.8%) | 0 (0.0%) |
| 75 Years and over | 6 (100.0%) | 16 (50.0%) |
| Total | 66 (40.5%) | 133 (49.4%) |
Income Above Poverty by Sex and Age in Big Wells
According to the poverty statistics in Big Wells, males aged 18 to 24 years and females aged 65 to 74 years are the age groups that are most secure financially, with 100.0% of males and 100.0% of females in these age groups living above the poverty line.
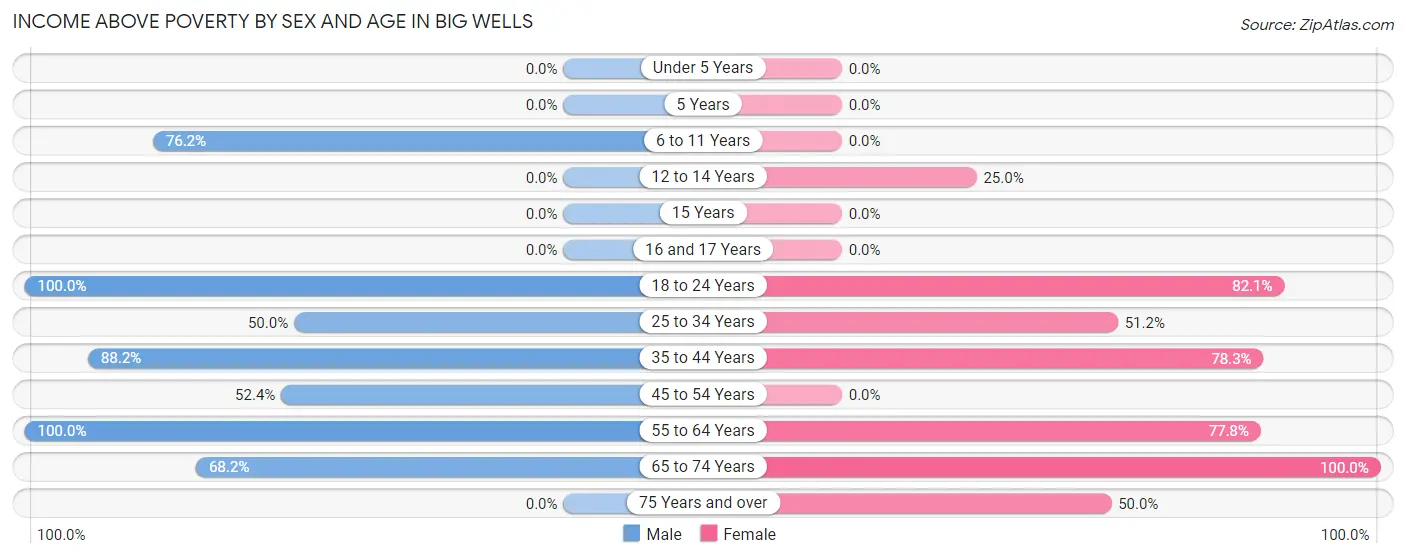
| Age Bracket | Male | Female |
| Under 5 Years | 0 (0.0%) | 0 (0.0%) |
| 5 Years | 0 (0.0%) | 0 (0.0%) |
| 6 to 11 Years | 16 (76.2%) | 0 (0.0%) |
| 12 to 14 Years | 0 (0.0%) | 5 (25.0%) |
| 15 Years | 0 (0.0%) | 0 (0.0%) |
| 16 and 17 Years | 0 (0.0%) | 0 (0.0%) |
| 18 to 24 Years | 13 (100.0%) | 23 (82.1%) |
| 25 to 34 Years | 7 (50.0%) | 21 (51.2%) |
| 35 to 44 Years | 15 (88.2%) | 18 (78.3%) |
| 45 to 54 Years | 11 (52.4%) | 0 (0.0%) |
| 55 to 64 Years | 5 (100.0%) | 21 (77.8%) |
| 65 to 74 Years | 30 (68.2%) | 32 (100.0%) |
| 75 Years and over | 0 (0.0%) | 16 (50.0%) |
| Total | 97 (59.5%) | 136 (50.6%) |
Income Below Poverty Among Married-Couple Families in Big Wells
The poverty statistics for married-couple families in Big Wells show that 30.6% or 11 of the total 36 families live below the poverty line. Families with 3 or 4 children have the highest poverty rate of 100.0%, comprising of 5 families. On the other hand, families with no children have the lowest poverty rate of 19.4%, which includes 6 families.
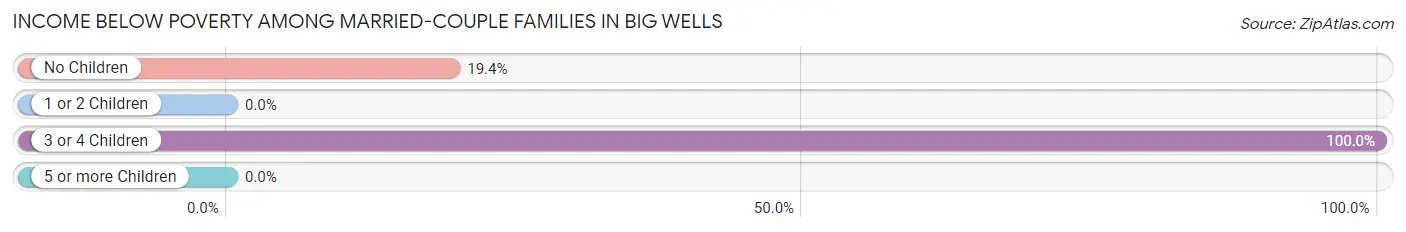
| Children | Above Poverty | Below Poverty |
| No Children | 25 (80.6%) | 6 (19.4%) |
| 1 or 2 Children | 0 (0.0%) | 0 (0.0%) |
| 3 or 4 Children | 0 (0.0%) | 5 (100.0%) |
| 5 or more Children | 0 (0.0%) | 0 (0.0%) |
| Total | 25 (69.4%) | 11 (30.6%) |
Income Below Poverty Among Single-Parent Households in Big Wells
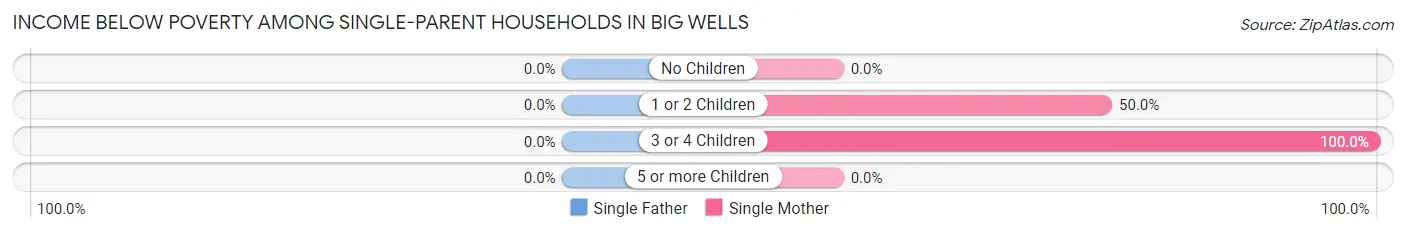
| Children | Single Father | Single Mother |
| No Children | 0 (0.0%) | 0 (0.0%) |
| 1 or 2 Children | 0 (0.0%) | 16 (50.0%) |
| 3 or 4 Children | 0 (0.0%) | 15 (100.0%) |
| 5 or more Children | 0 (0.0%) | 0 (0.0%) |
| Total | 0 (0.0%) | 31 (57.4%) |
Income Below Poverty Among Married-Couple vs Single-Parent Households in Big Wells
The poverty data for Big Wells shows that 11 of the married-couple family households (30.6%) and 31 of the single-parent households (53.4%) are living below the poverty level. Within the married-couple family households, those with 3 or 4 children have the highest poverty rate, with 5 households (100.0%) falling below the poverty line. Among the single-parent households, those with 3 or 4 children have the highest poverty rate, with 15 household (100.0%) living below poverty.
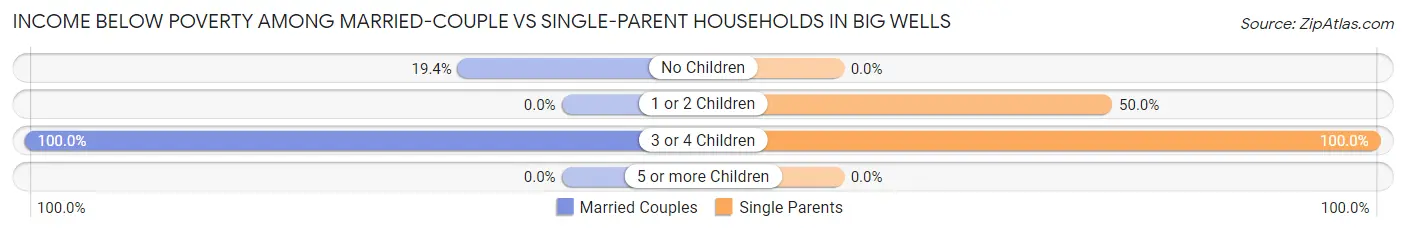
| Children | Married-Couple Families | Single-Parent Households |
| No Children | 6 (19.4%) | 0 (0.0%) |
| 1 or 2 Children | 0 (0.0%) | 16 (50.0%) |
| 3 or 4 Children | 5 (100.0%) | 15 (100.0%) |
| 5 or more Children | 0 (0.0%) | 0 (0.0%) |
| Total | 11 (30.6%) | 31 (53.4%) |
Race in Big Wells
The most populous races in Big Wells are Hispanic or Latino (414 | 95.8%), White / Caucasian (218 | 50.5%), and Two or more Races (185 | 42.8%).
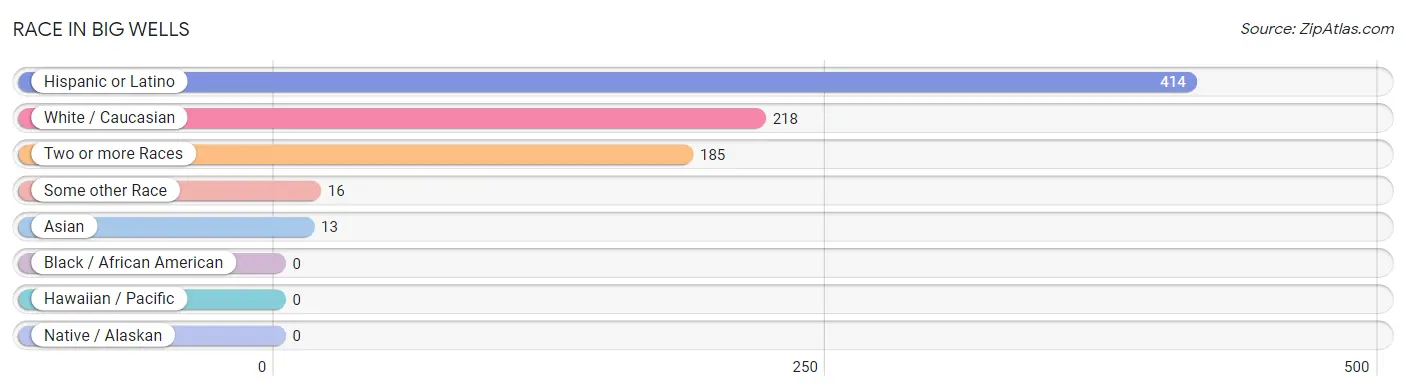
| Race | # Population | % Population |
| Asian | 13 | 3.0% |
| Black / African American | 0 | 0.0% |
| Hawaiian / Pacific | 0 | 0.0% |
| Hispanic or Latino | 414 | 95.8% |
| Native / Alaskan | 0 | 0.0% |
| White / Caucasian | 218 | 50.5% |
| Two or more Races | 185 | 42.8% |
| Some other Race | 16 | 3.7% |
| Total | 432 | 100.0% |
Ancestry in Big Wells
The most populous ancestries reported in Big Wells are Mexican (403 | 93.3%), American (14 | 3.2%), Sri Lankan (13 | 3.0%), Central American (7 | 1.6%), and Honduran (7 | 1.6%), together accounting for 102.8% of all Big Wells residents.
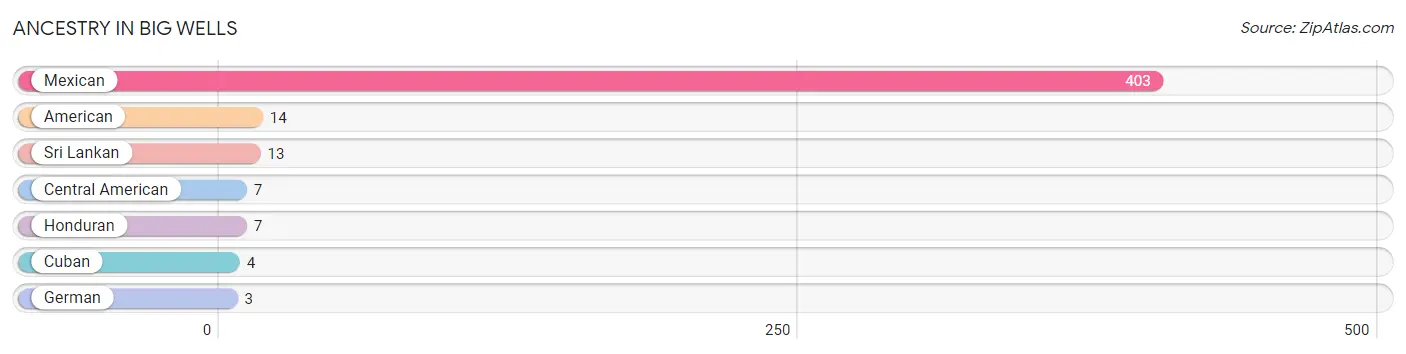
| Ancestry | # Population | % Population |
| American | 14 | 3.2% |
| Central American | 7 | 1.6% |
| Cuban | 4 | 0.9% |
| German | 3 | 0.7% |
| Honduran | 7 | 1.6% |
| Mexican | 403 | 93.3% |
| Sri Lankan | 13 | 3.0% | View All 7 Rows |
Immigrants in Big Wells
The most numerous immigrant groups reported in Big Wells came from Central America (15 | 3.5%), Latin America (15 | 3.5%), Mexico (15 | 3.5%), Asia (6 | 1.4%), and South Eastern Asia (6 | 1.4%), together accounting for 13.2% of all Big Wells residents.
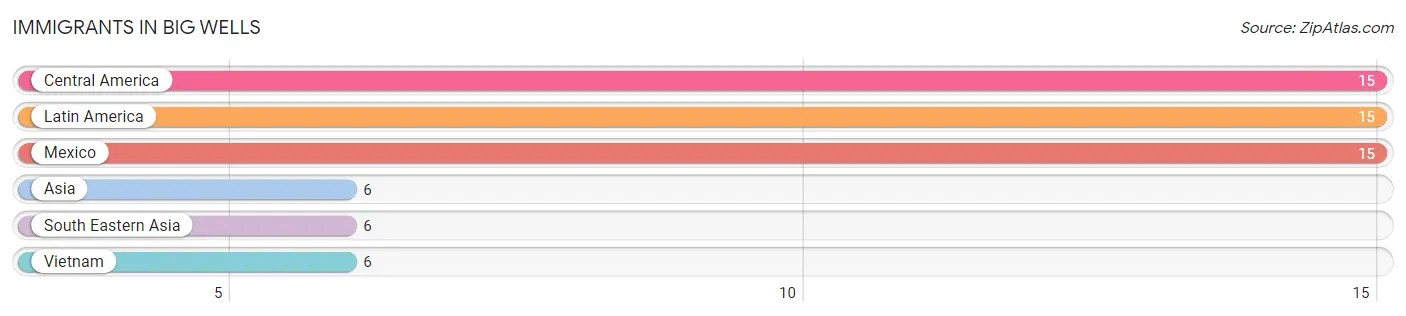
| Immigration Origin | # Population | % Population |
| Asia | 6 | 1.4% |
| Central America | 15 | 3.5% |
| Latin America | 15 | 3.5% |
| Mexico | 15 | 3.5% |
| South Eastern Asia | 6 | 1.4% |
| Vietnam | 6 | 1.4% | View All 6 Rows |
Sex and Age in Big Wells
Sex and Age in Big Wells
The most populous age groups in Big Wells are 65 to 69 Years (24 | 14.7%) for men and 15 to 19 Years (33 | 12.3%) for women.
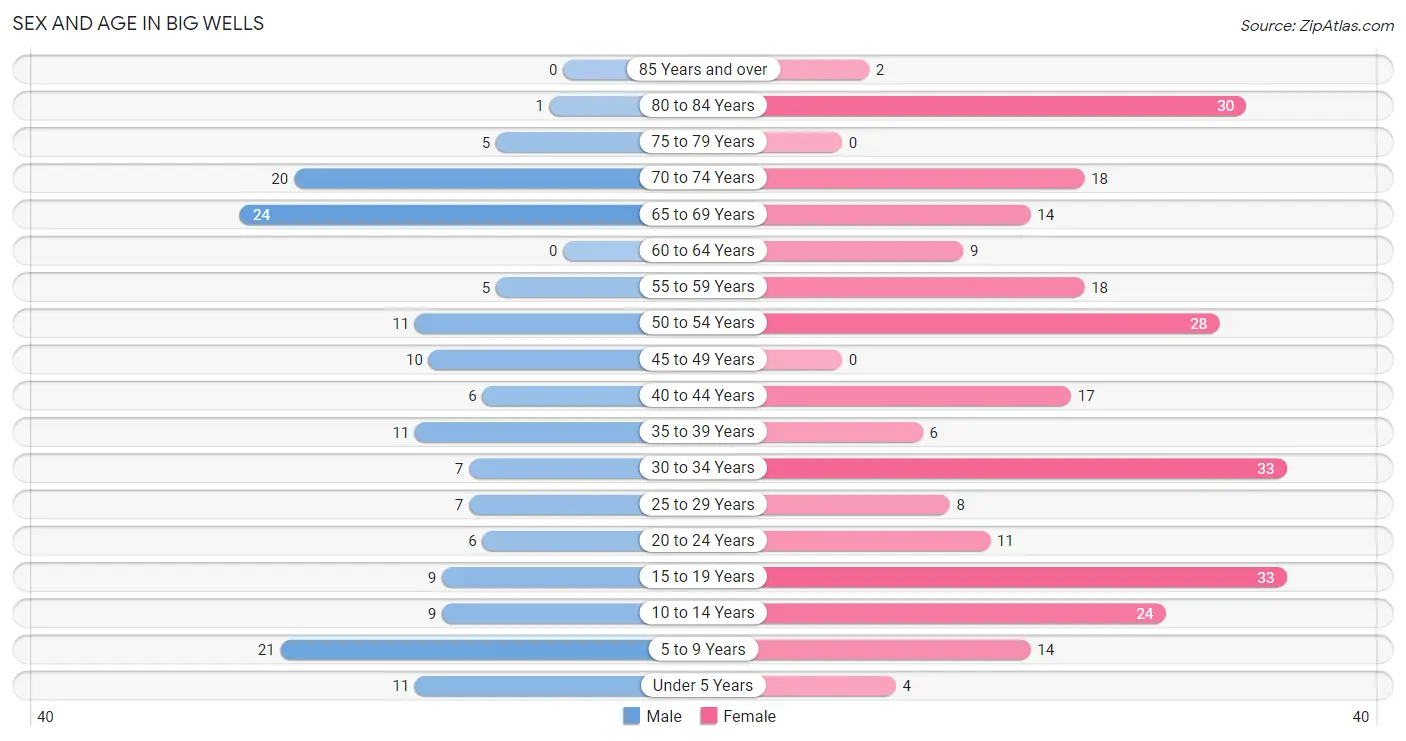
| Age Bracket | Male | Female |
| Under 5 Years | 11 (6.8%) | 4 (1.5%) |
| 5 to 9 Years | 21 (12.9%) | 14 (5.2%) |
| 10 to 14 Years | 9 (5.5%) | 24 (8.9%) |
| 15 to 19 Years | 9 (5.5%) | 33 (12.3%) |
| 20 to 24 Years | 6 (3.7%) | 11 (4.1%) |
| 25 to 29 Years | 7 (4.3%) | 8 (3.0%) |
| 30 to 34 Years | 7 (4.3%) | 33 (12.3%) |
| 35 to 39 Years | 11 (6.8%) | 6 (2.2%) |
| 40 to 44 Years | 6 (3.7%) | 17 (6.3%) |
| 45 to 49 Years | 10 (6.1%) | 0 (0.0%) |
| 50 to 54 Years | 11 (6.8%) | 28 (10.4%) |
| 55 to 59 Years | 5 (3.1%) | 18 (6.7%) |
| 60 to 64 Years | 0 (0.0%) | 9 (3.4%) |
| 65 to 69 Years | 24 (14.7%) | 14 (5.2%) |
| 70 to 74 Years | 20 (12.3%) | 18 (6.7%) |
| 75 to 79 Years | 5 (3.1%) | 0 (0.0%) |
| 80 to 84 Years | 1 (0.6%) | 30 (11.2%) |
| 85 Years and over | 0 (0.0%) | 2 (0.7%) |
| Total | 163 (100.0%) | 269 (100.0%) |
Families and Households in Big Wells
Median Family Size in Big Wells
The median family size in Big Wells is 3.36 persons per family, with single male/father families (4 | 4.3%) accounting for the largest median family size of 6.25 persons per family. On the other hand, single female/mother families (54 | 57.5%) represent the smallest median family size with 2.80 persons per family.
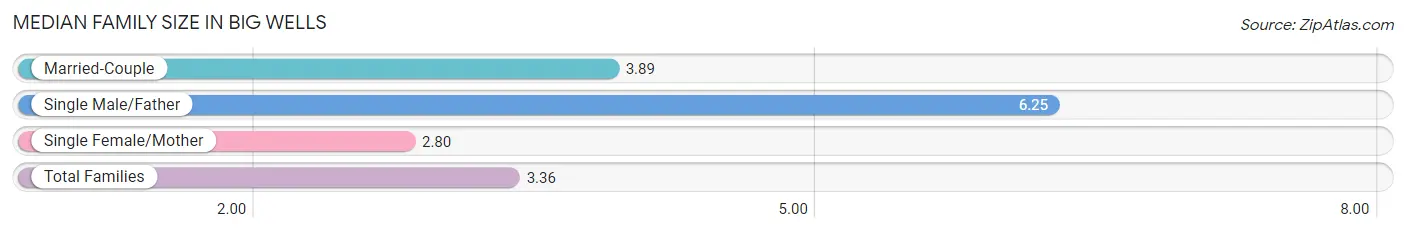
| Family Type | # Families | Family Size |
| Married-Couple | 36 (38.3%) | 3.89 |
| Single Male/Father | 4 (4.3%) | 6.25 |
| Single Female/Mother | 54 (57.5%) | 2.80 |
| Total Families | 94 (100.0%) | 3.36 |
Median Household Size in Big Wells
The median household size in Big Wells is 2.53 persons per household, with single male/father households (4 | 2.3%) accounting for the largest median household size of 6.25 persons per household. non-family households (77 | 45.0%) represent the smallest median household size with 1.26 persons per household.
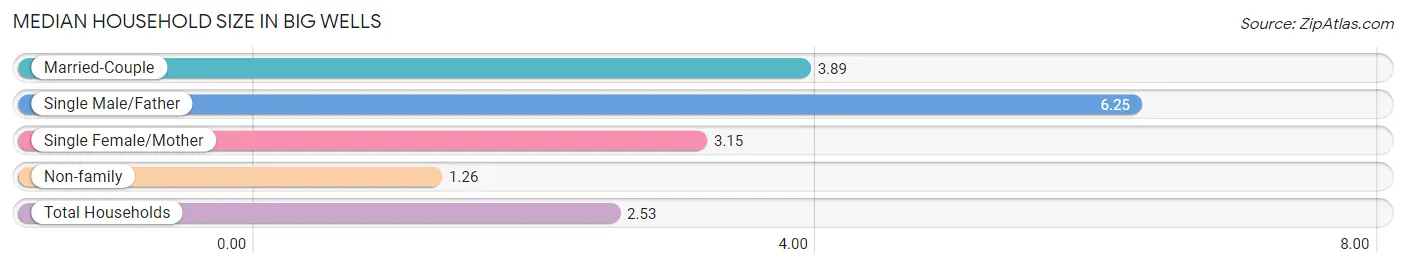
| Household Type | # Households | Household Size |
| Married-Couple | 36 (21.0%) | 3.89 |
| Single Male/Father | 4 (2.3%) | 6.25 |
| Single Female/Mother | 54 (31.6%) | 3.15 |
| Non-family | 77 (45.0%) | 1.26 |
| Total Households | 171 (100.0%) | 2.53 |
Household Size by Marriage Status in Big Wells
Out of a total of 171 households in Big Wells, 94 (55.0%) are family households, while 77 (45.0%) are nonfamily households. The most numerous type of family households are 2-person households, comprising 35, and the most common type of nonfamily households are 1-person households, comprising 70.
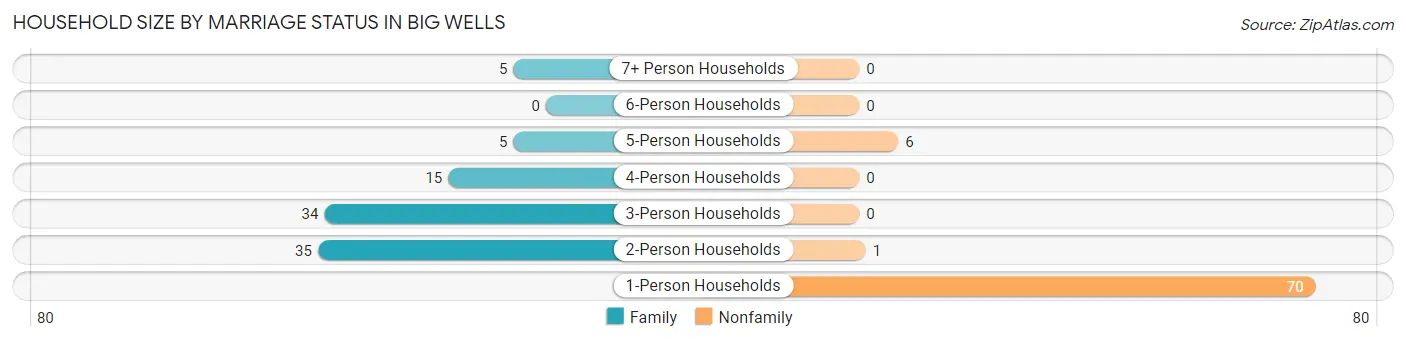
| Household Size | Family Households | Nonfamily Households |
| 1-Person Households | - | 70 (40.9%) |
| 2-Person Households | 35 (20.5%) | 1 (0.6%) |
| 3-Person Households | 34 (19.9%) | 0 (0.0%) |
| 4-Person Households | 15 (8.8%) | 0 (0.0%) |
| 5-Person Households | 5 (2.9%) | 6 (3.5%) |
| 6-Person Households | 0 (0.0%) | 0 (0.0%) |
| 7+ Person Households | 5 (2.9%) | 0 (0.0%) |
| Total | 94 (55.0%) | 77 (45.0%) |
Female Fertility in Big Wells
Fertility by Age in Big Wells
Average fertility rate in Big Wells is 139.0 births per 1,000 women. Women in the age bracket of 20 to 34 years have the highest fertility rate with 288.0 births per 1,000 women. Women in the age bracket of 20 to 34 years acount for 100.0% of all women with births.
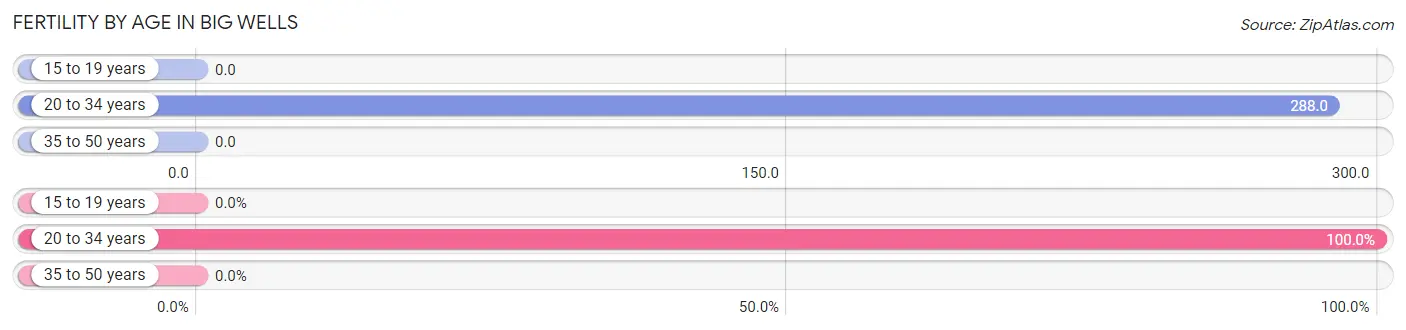
| Age Bracket | Women with Births | Births / 1,000 Women |
| 15 to 19 years | 0 (0.0%) | 0.0 |
| 20 to 34 years | 15 (100.0%) | 288.0 |
| 35 to 50 years | 0 (0.0%) | 0.0 |
| Total | 15 (100.0%) | 139.0 |
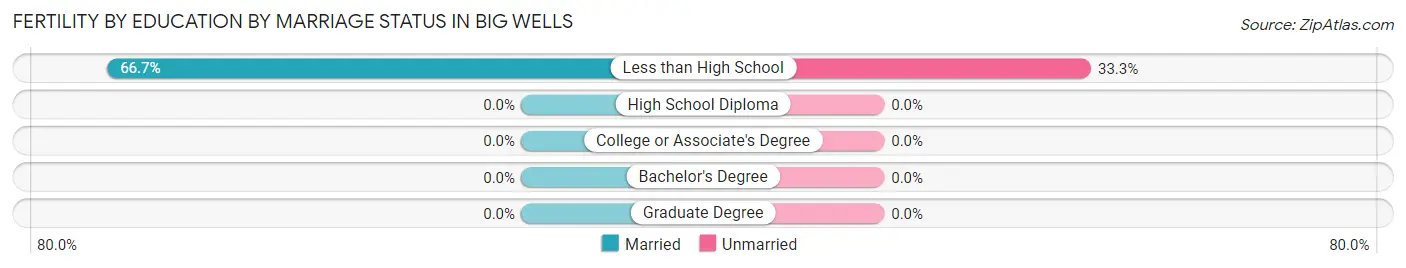
Fertility by Age by Marriage Status in Big Wells
66.7% of women with births (15) in Big Wells are married. The highest percentage of unmarried women with births falls into 20 to 34 years age bracket with 33.3% of them unmarried at the time of birth, while the lowest percentage of unmarried women with births belong to 20 to 34 years age bracket with 33.3% of them unmarried.
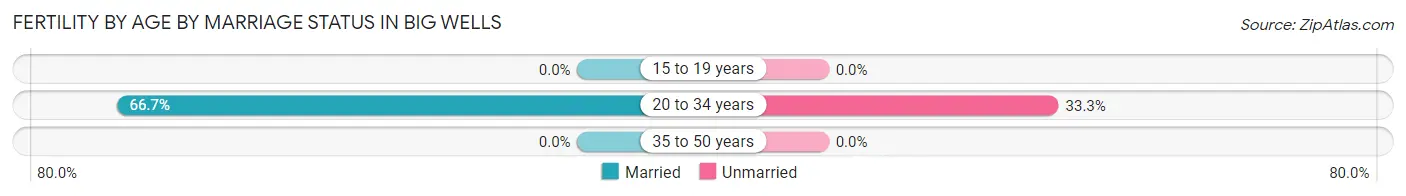
| Age Bracket | Married | Unmarried |
| 15 to 19 years | 0 (0.0%) | 0 (0.0%) |
| 20 to 34 years | 10 (66.7%) | 5 (33.3%) |
| 35 to 50 years | 0 (0.0%) | 0 (0.0%) |
| Total | 10 (66.7%) | 5 (33.3%) |
Fertility by Education in Big Wells
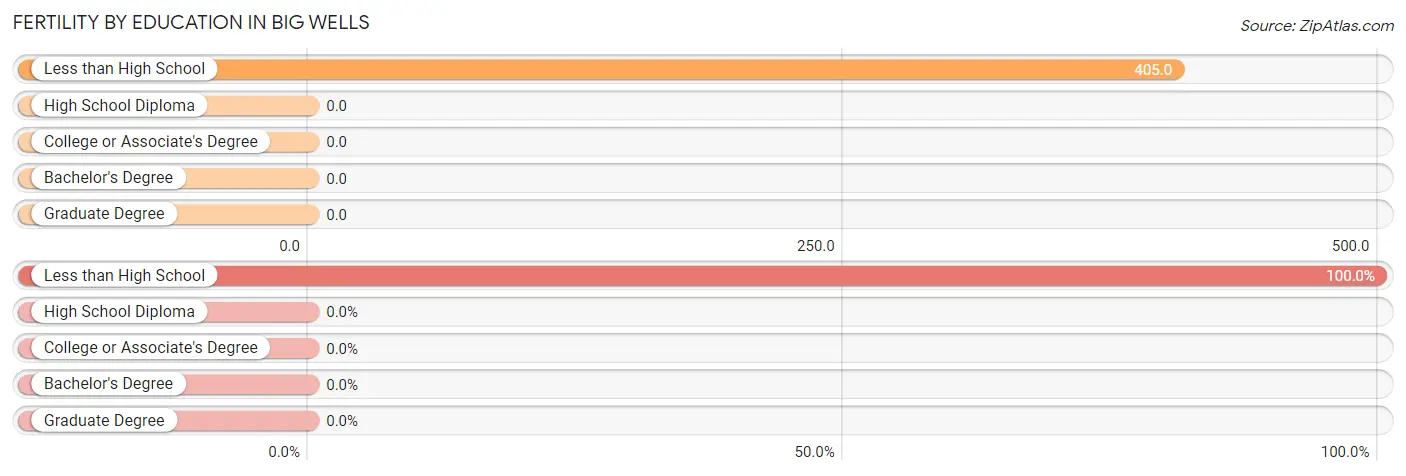
| Educational Attainment | Women with Births | Births / 1,000 Women |
| Less than High School | 15 (100.0%) | 405.0 |
| High School Diploma | 0 (0.0%) | 0.0 |
| College or Associate's Degree | 0 (0.0%) | 0.0 |
| Bachelor's Degree | 0 (0.0%) | 0.0 |
| Graduate Degree | 0 (0.0%) | 0.0 |
| Total | 15 (100.0%) | 139.0 |
Fertility by Education by Marriage Status in Big Wells
33.3% of women with births in Big Wells are unmarried. Women with the educational attainment of less than high school are most likely to be married with 66.7% of them married at childbirth, while women with the educational attainment of less than high school are least likely to be married with 33.3% of them unmarried at childbirth.
| Educational Attainment | Married | Unmarried |
| Less than High School | 10 (66.7%) | 5 (33.3%) |
| High School Diploma | 0 (0.0%) | 0 (0.0%) |
| College or Associate's Degree | 0 (0.0%) | 0 (0.0%) |
| Bachelor's Degree | 0 (0.0%) | 0 (0.0%) |
| Graduate Degree | 0 (0.0%) | 0 (0.0%) |
| Total | 10 (66.7%) | 5 (33.3%) |
Employment Characteristics in Big Wells
Employment by Class of Employer in Big Wells
Among the 122 employed individuals in Big Wells, private company employees (99 | 81.1%), local government employees (13 | 10.7%), and self-employed (not incorporated) (7 | 5.7%) make up the most common classes of employment.
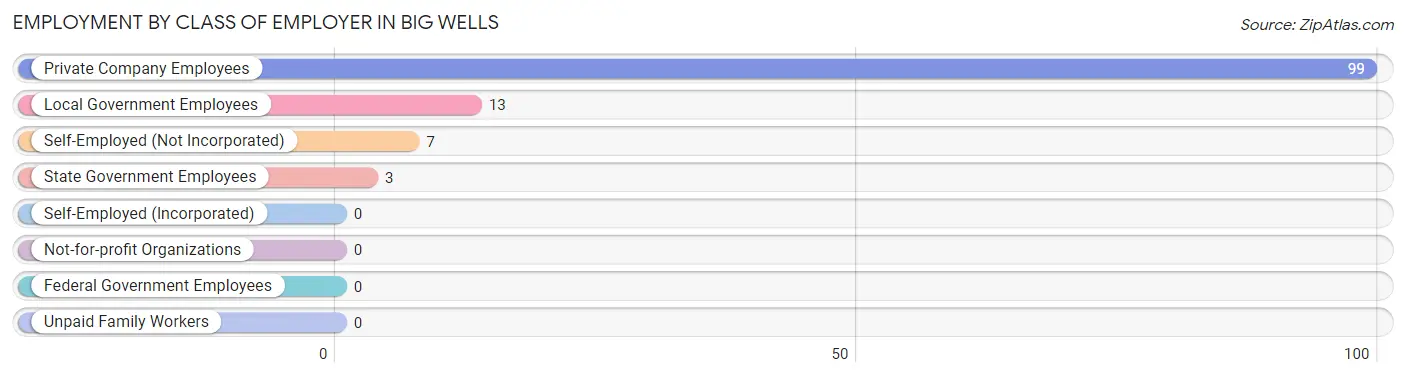
| Employer Class | # Employees | % Employees |
| Private Company Employees | 99 | 81.1% |
| Self-Employed (Incorporated) | 0 | 0.0% |
| Self-Employed (Not Incorporated) | 7 | 5.7% |
| Not-for-profit Organizations | 0 | 0.0% |
| Local Government Employees | 13 | 10.7% |
| State Government Employees | 3 | 2.5% |
| Federal Government Employees | 0 | 0.0% |
| Unpaid Family Workers | 0 | 0.0% |
| Total | 122 | 100.0% |
Employment Status by Age in Big Wells
According to the labor force statistics for Big Wells, out of the total population over 16 years of age (342), 42.4% or 145 individuals are in the labor force, with 15.9% or 23 of them unemployed. The age group with the highest labor force participation rate is 35 to 44 years, with 82.5% or 33 individuals in the labor force. Within the labor force, the 16 to 19 years age range has the highest percentage of unemployed individuals, with 100.0% or 17 of them being unemployed.
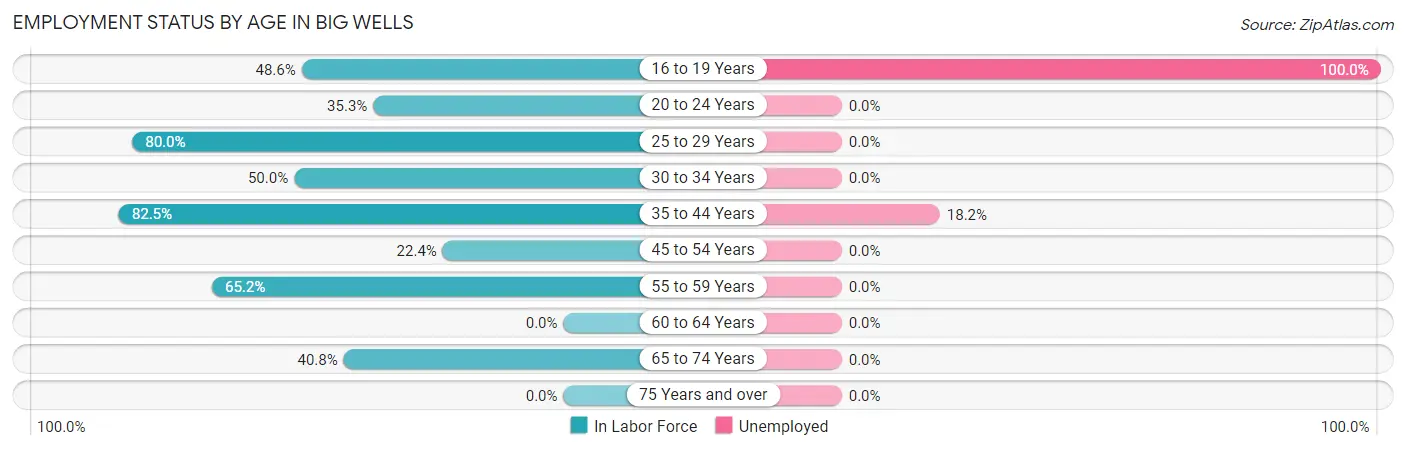
| Age Bracket | In Labor Force | Unemployed |
| 16 to 19 Years | 17 (48.6%) | 17 (100.0%) |
| 20 to 24 Years | 6 (35.3%) | 0 (0.0%) |
| 25 to 29 Years | 12 (80.0%) | 0 (0.0%) |
| 30 to 34 Years | 20 (50.0%) | 0 (0.0%) |
| 35 to 44 Years | 33 (82.5%) | 6 (18.2%) |
| 45 to 54 Years | 11 (22.4%) | 0 (0.0%) |
| 55 to 59 Years | 15 (65.2%) | 0 (0.0%) |
| 60 to 64 Years | 0 (0.0%) | 0 (0.0%) |
| 65 to 74 Years | 31 (40.8%) | 0 (0.0%) |
| 75 Years and over | 0 (0.0%) | 0 (0.0%) |
| Total | 145 (42.4%) | 23 (15.9%) |
Employment Status by Educational Attainment in Big Wells
According to labor force statistics for Big Wells, 51.7% of individuals (91) out of the total population between 25 and 64 years of age (176) are in the labor force, with 6.6% or 6 of them being unemployed. The group with the highest labor force participation rate are those with the educational attainment of college / associate degree, with 61.1% or 44 individuals in the labor force. Within the labor force, individuals with less than high school education have the highest percentage of unemployment, with 28.6% or 6 of them being unemployed.
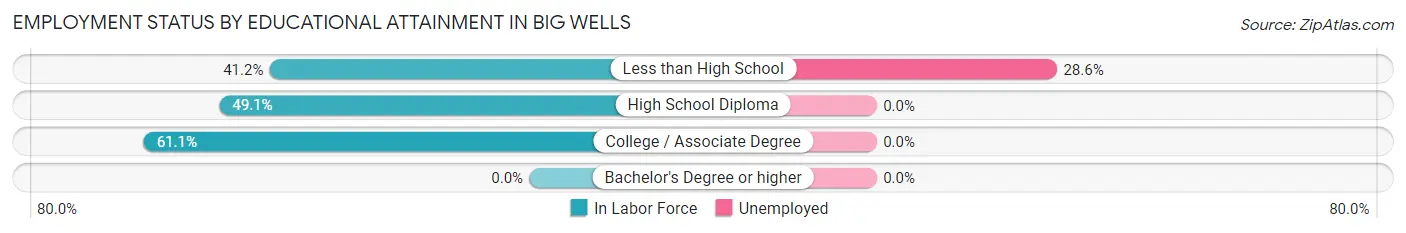
| Educational Attainment | In Labor Force | Unemployed |
| Less than High School | 21 (41.2%) | 15 (28.6%) |
| High School Diploma | 26 (49.1%) | 0 (0.0%) |
| College / Associate Degree | 44 (61.1%) | 0 (0.0%) |
| Bachelor's Degree or higher | 0 (0.0%) | 0 (0.0%) |
| Total | 91 (51.7%) | 12 (6.6%) |
Employment Occupations by Sex in Big Wells
Management, Business, Science and Arts Occupations
The most common Management, Business, Science and Arts occupations in Big Wells are Management (8 | 6.6%), and Health Diagnosing & Treating (6 | 4.9%).
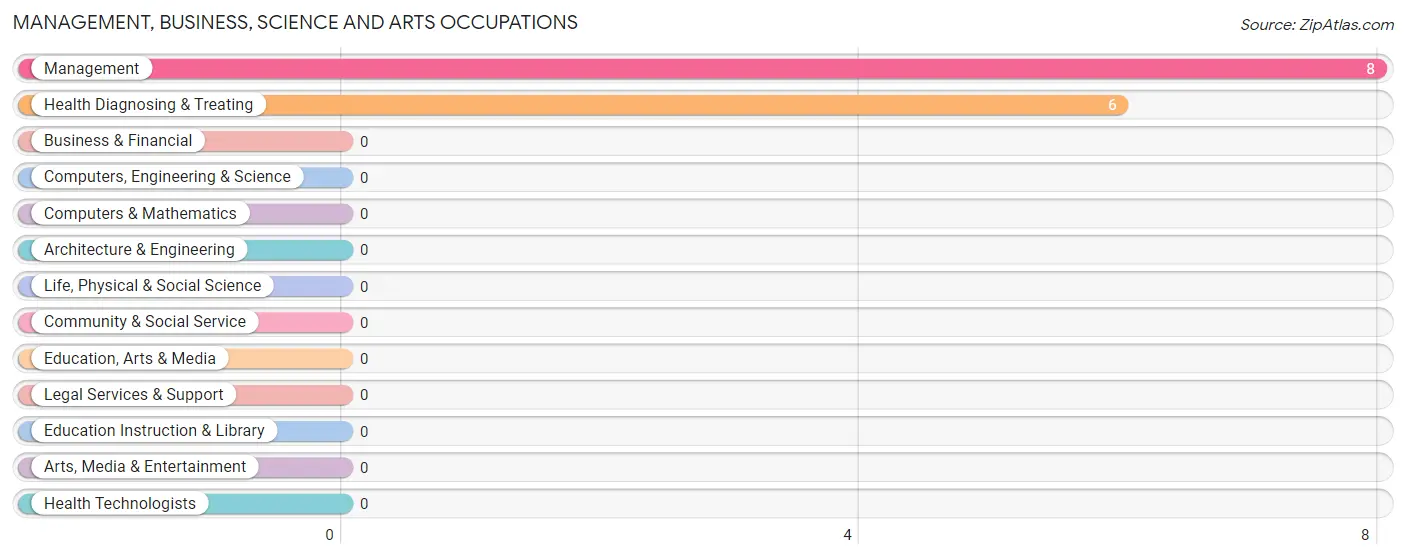
Management, Business, Science and Arts Occupations by Sex
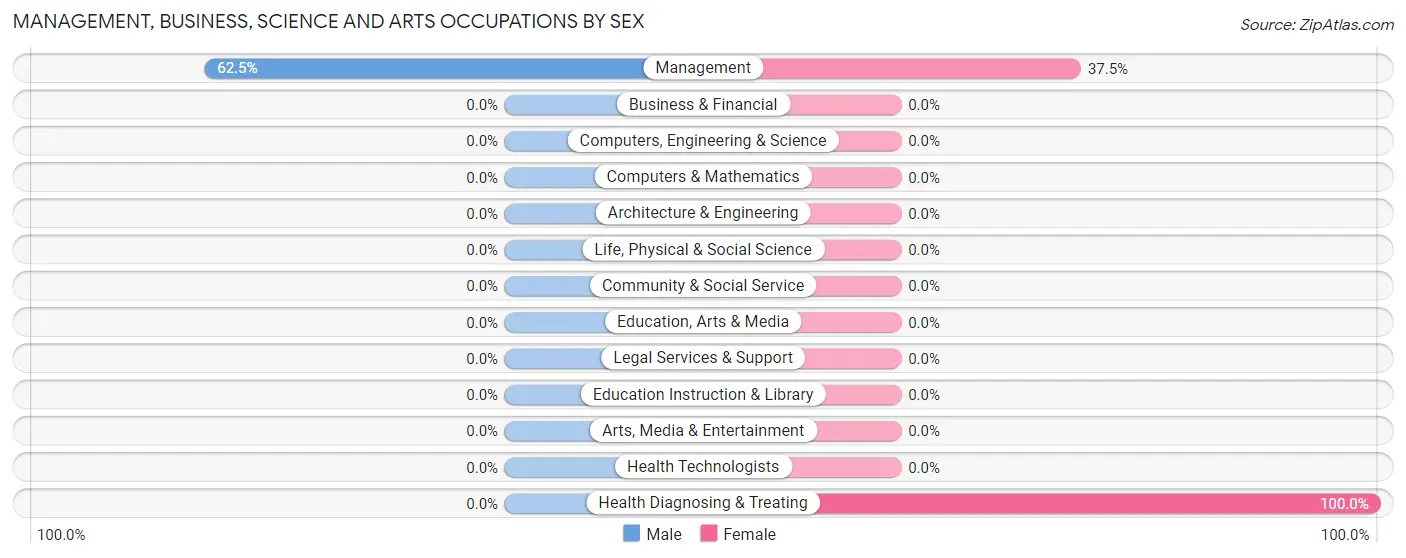
| Occupation | Male | Female |
| Management | 5 (62.5%) | 3 (37.5%) |
| Business & Financial | 0 (0.0%) | 0 (0.0%) |
| Computers, Engineering & Science | 0 (0.0%) | 0 (0.0%) |
| Computers & Mathematics | 0 (0.0%) | 0 (0.0%) |
| Architecture & Engineering | 0 (0.0%) | 0 (0.0%) |
| Life, Physical & Social Science | 0 (0.0%) | 0 (0.0%) |
| Community & Social Service | 0 (0.0%) | 0 (0.0%) |
| Education, Arts & Media | 0 (0.0%) | 0 (0.0%) |
| Legal Services & Support | 0 (0.0%) | 0 (0.0%) |
| Education Instruction & Library | 0 (0.0%) | 0 (0.0%) |
| Arts, Media & Entertainment | 0 (0.0%) | 0 (0.0%) |
| Health Diagnosing & Treating | 0 (0.0%) | 6 (100.0%) |
| Health Technologists | 0 (0.0%) | 0 (0.0%) |
| Total (Category) | 5 (35.7%) | 9 (64.3%) |
| Total (Overall) | 41 (33.6%) | 81 (66.4%) |
Services Occupations
The most common Services occupations in Big Wells are Healthcare Support (26 | 21.3%), Food Preparation & Serving (7 | 5.7%), Security & Protection (3 | 2.5%), Law Enforcement (3 | 2.5%), and Cleaning & Maintenance (1 | 0.8%).
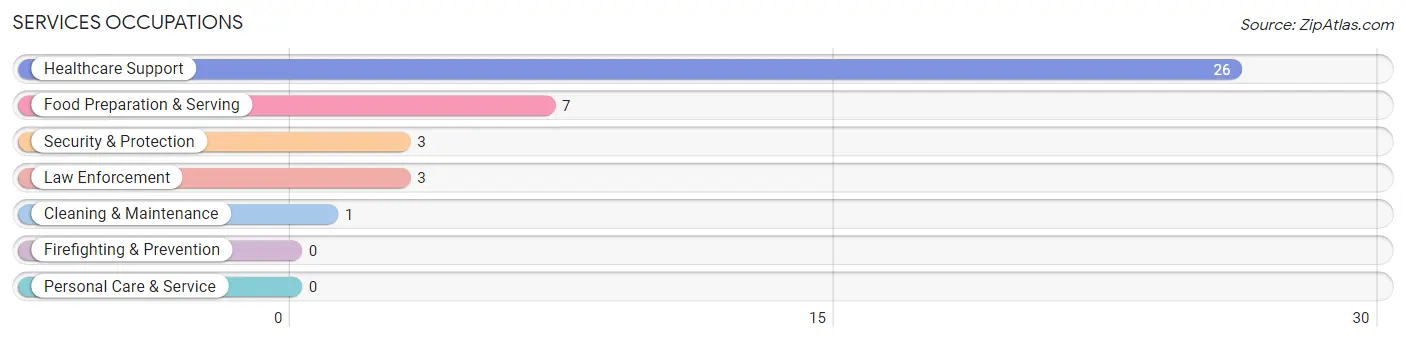
Services Occupations by Sex
Within the Services occupations in Big Wells, the most male-oriented occupations are Security & Protection (100.0%), Law Enforcement (100.0%), and Cleaning & Maintenance (100.0%), while the most female-oriented occupations are Healthcare Support (100.0%), and Food Preparation & Serving (100.0%).
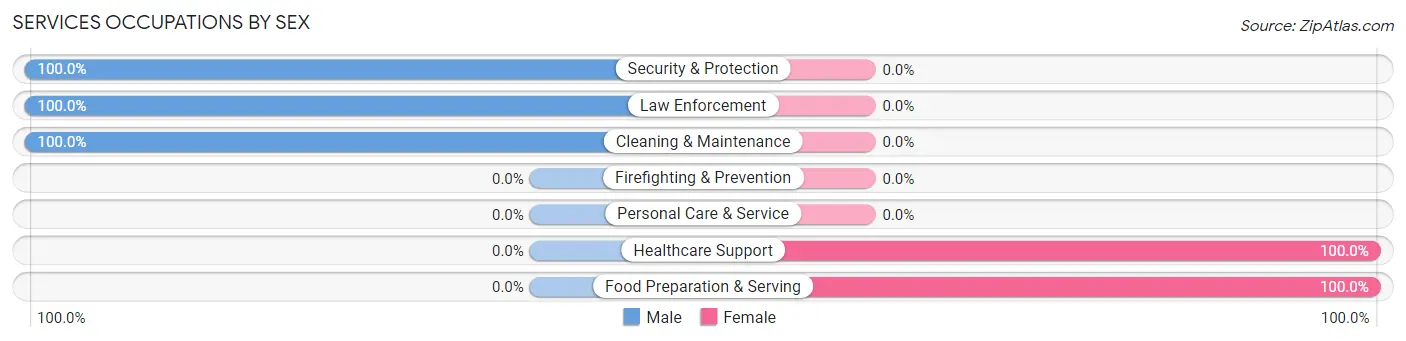
| Occupation | Male | Female |
| Healthcare Support | 0 (0.0%) | 26 (100.0%) |
| Security & Protection | 3 (100.0%) | 0 (0.0%) |
| Firefighting & Prevention | 0 (0.0%) | 0 (0.0%) |
| Law Enforcement | 3 (100.0%) | 0 (0.0%) |
| Food Preparation & Serving | 0 (0.0%) | 7 (100.0%) |
| Cleaning & Maintenance | 1 (100.0%) | 0 (0.0%) |
| Personal Care & Service | 0 (0.0%) | 0 (0.0%) |
| Total (Category) | 4 (10.8%) | 33 (89.2%) |
| Total (Overall) | 41 (33.6%) | 81 (66.4%) |
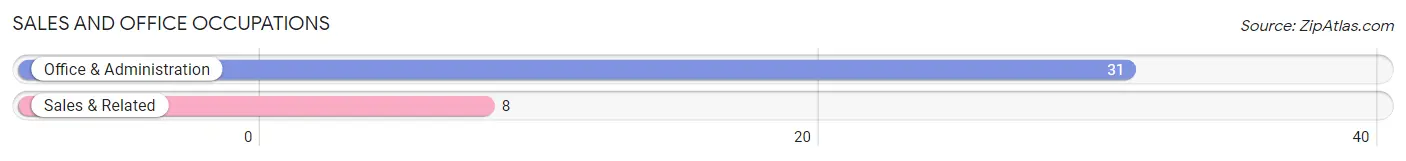
Sales and Office Occupations
The most common Sales and Office occupations in Big Wells are Office & Administration (31 | 25.4%), and Sales & Related (8 | 6.6%).
Sales and Office Occupations by Sex
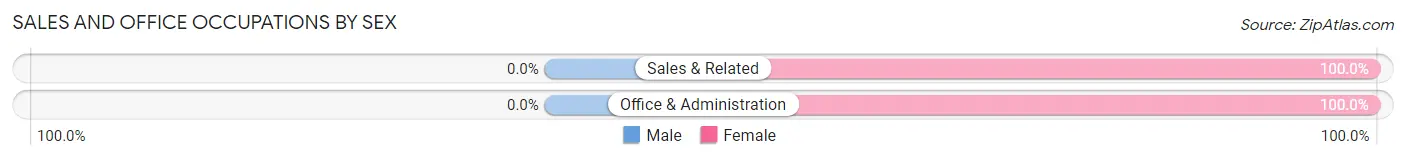
| Occupation | Male | Female |
| Sales & Related | 0 (0.0%) | 8 (100.0%) |
| Office & Administration | 0 (0.0%) | 31 (100.0%) |
| Total (Category) | 0 (0.0%) | 39 (100.0%) |
| Total (Overall) | 41 (33.6%) | 81 (66.4%) |
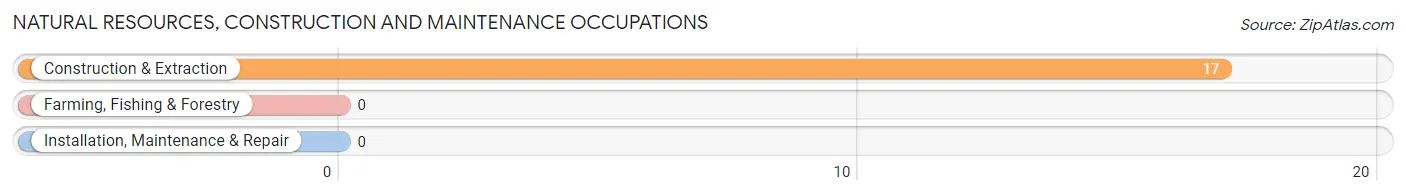
Natural Resources, Construction and Maintenance Occupations
The most common Natural Resources, Construction and Maintenance occupations in Big Wells are , and Construction & Extraction (17 | 13.9%).
Natural Resources, Construction and Maintenance Occupations by Sex
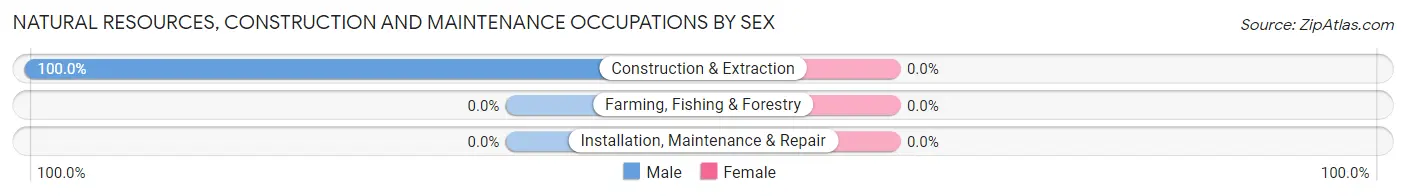
| Occupation | Male | Female |
| Farming, Fishing & Forestry | 0 (0.0%) | 0 (0.0%) |
| Construction & Extraction | 17 (100.0%) | 0 (0.0%) |
| Installation, Maintenance & Repair | 0 (0.0%) | 0 (0.0%) |
| Total (Category) | 17 (100.0%) | 0 (0.0%) |
| Total (Overall) | 41 (33.6%) | 81 (66.4%) |
Production, Transportation and Moving Occupations
The most common Production, Transportation and Moving occupations in Big Wells are Material Moving (7 | 5.7%), Production (4 | 3.3%), and Transportation (4 | 3.3%).
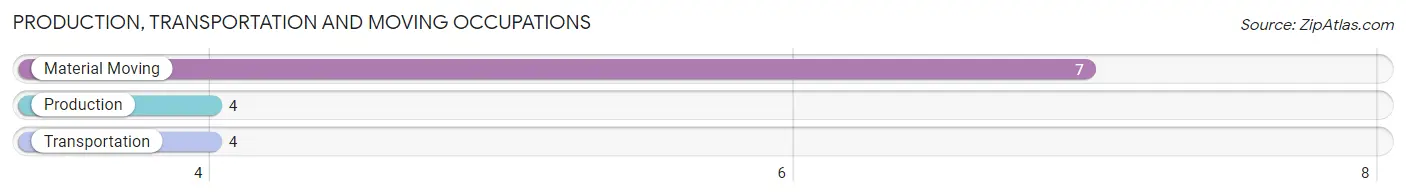
Production, Transportation and Moving Occupations by Sex
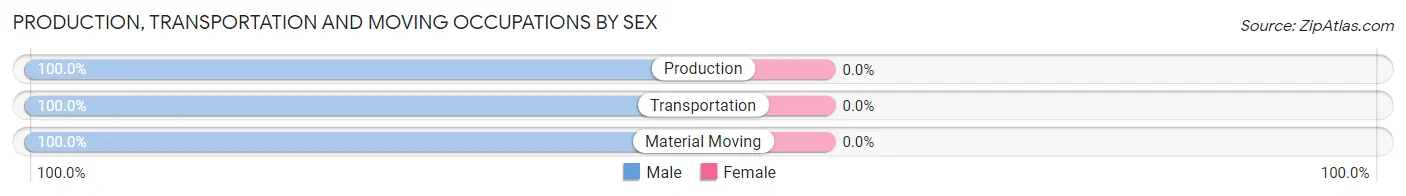
| Occupation | Male | Female |
| Production | 4 (100.0%) | 0 (0.0%) |
| Transportation | 4 (100.0%) | 0 (0.0%) |
| Material Moving | 7 (100.0%) | 0 (0.0%) |
| Total (Category) | 15 (100.0%) | 0 (0.0%) |
| Total (Overall) | 41 (33.6%) | 81 (66.4%) |
Employment Industries by Sex in Big Wells
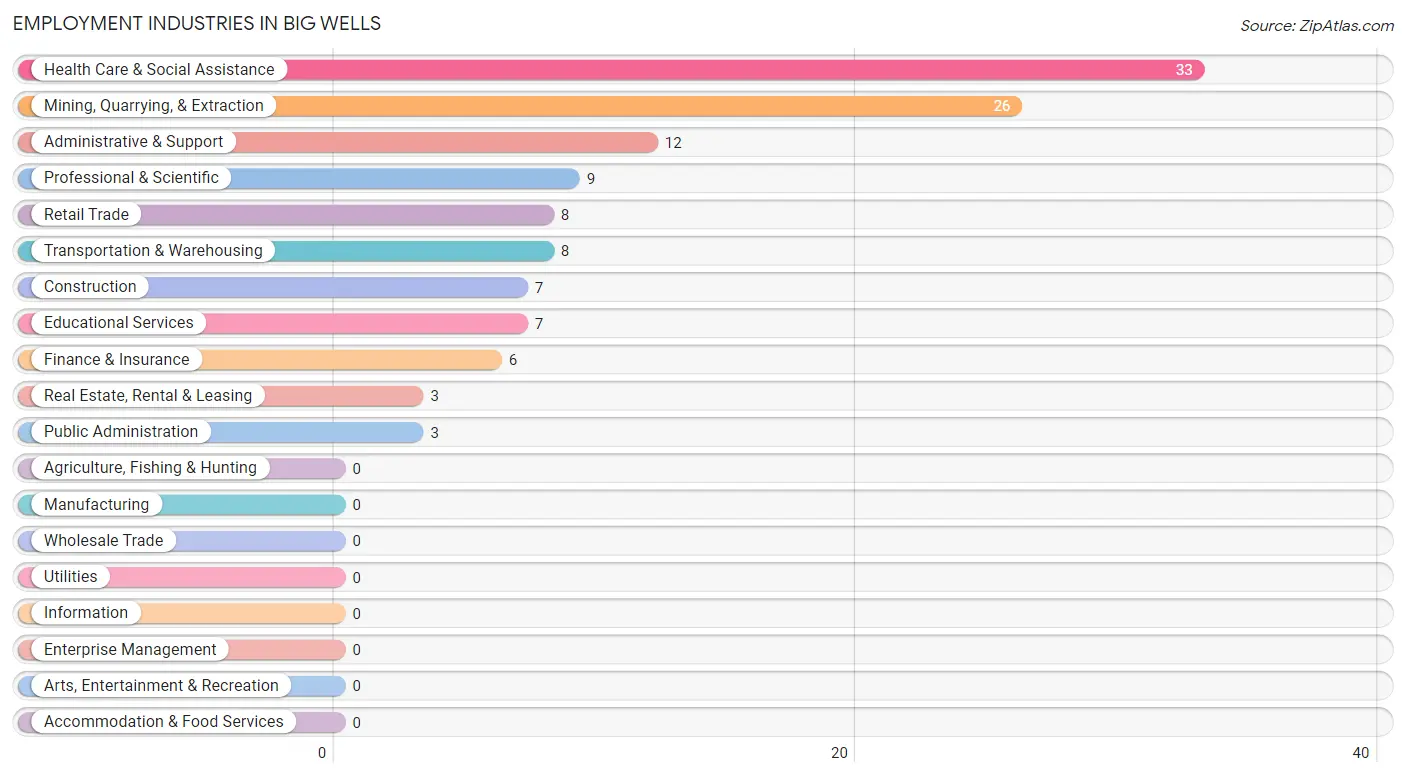
Employment Industries in Big Wells
The major employment industries in Big Wells include Health Care & Social Assistance (33 | 27.1%), Mining, Quarrying, & Extraction (26 | 21.3%), Administrative & Support (12 | 9.8%), Professional & Scientific (9 | 7.4%), and Retail Trade (8 | 6.6%).
Employment Industries by Sex in Big Wells
The Big Wells industries that see more men than women are Mining, Quarrying, & Extraction (100.0%), Construction (100.0%), and Public Administration (100.0%), whereas the industries that tend to have a higher number of women are Retail Trade (100.0%), Finance & Insurance (100.0%), and Real Estate, Rental & Leasing (100.0%).
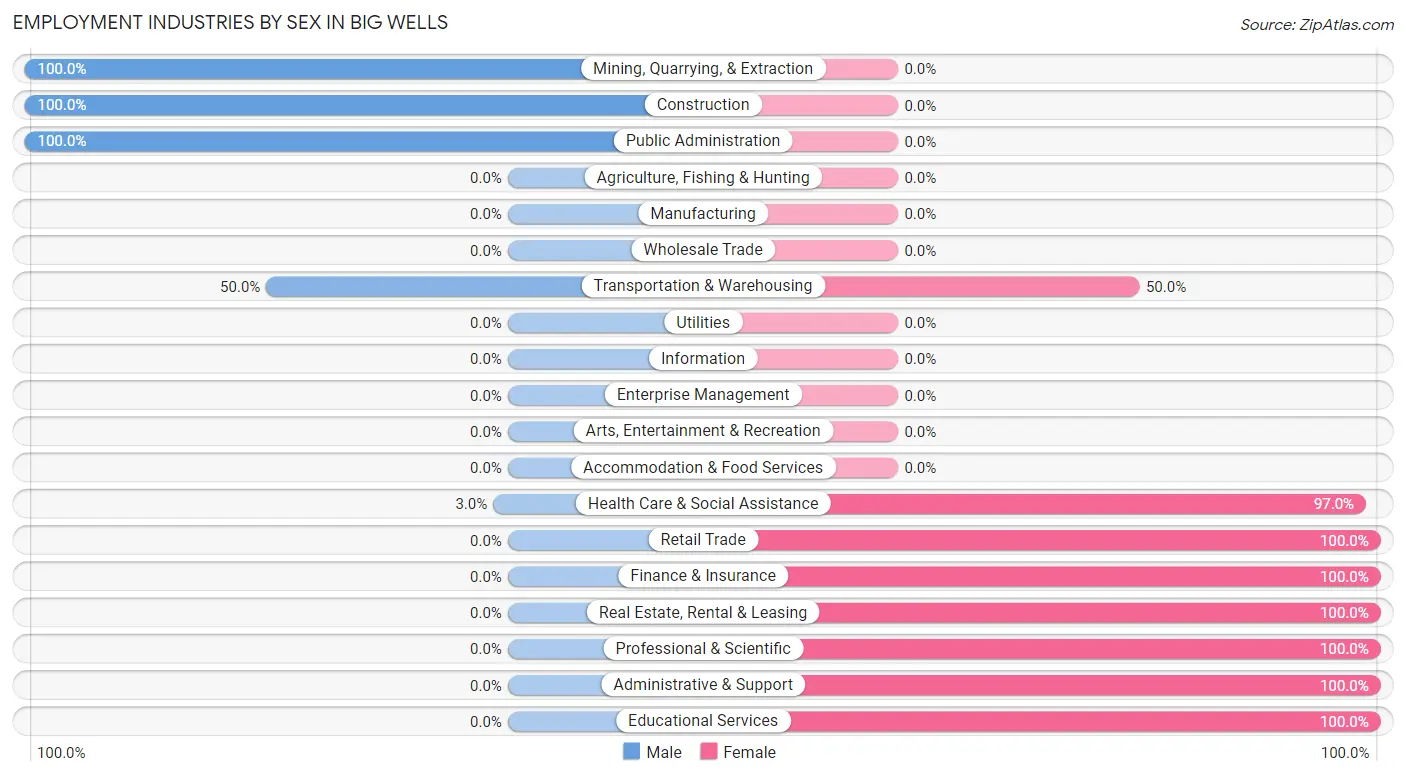
| Industry | Male | Female |
| Agriculture, Fishing & Hunting | 0 (0.0%) | 0 (0.0%) |
| Mining, Quarrying, & Extraction | 26 (100.0%) | 0 (0.0%) |
| Construction | 7 (100.0%) | 0 (0.0%) |
| Manufacturing | 0 (0.0%) | 0 (0.0%) |
| Wholesale Trade | 0 (0.0%) | 0 (0.0%) |
| Retail Trade | 0 (0.0%) | 8 (100.0%) |
| Transportation & Warehousing | 4 (50.0%) | 4 (50.0%) |
| Utilities | 0 (0.0%) | 0 (0.0%) |
| Information | 0 (0.0%) | 0 (0.0%) |
| Finance & Insurance | 0 (0.0%) | 6 (100.0%) |
| Real Estate, Rental & Leasing | 0 (0.0%) | 3 (100.0%) |
| Professional & Scientific | 0 (0.0%) | 9 (100.0%) |
| Enterprise Management | 0 (0.0%) | 0 (0.0%) |
| Administrative & Support | 0 (0.0%) | 12 (100.0%) |
| Educational Services | 0 (0.0%) | 7 (100.0%) |
| Health Care & Social Assistance | 1 (3.0%) | 32 (97.0%) |
| Arts, Entertainment & Recreation | 0 (0.0%) | 0 (0.0%) |
| Accommodation & Food Services | 0 (0.0%) | 0 (0.0%) |
| Public Administration | 3 (100.0%) | 0 (0.0%) |
| Total | 41 (33.6%) | 81 (66.4%) |
Education in Big Wells
School Enrollment in Big Wells
The most common levels of schooling among the 83 students in Big Wells are middle school (26 | 31.3%), elementary school (24 | 28.9%), and high school (15 | 18.1%).
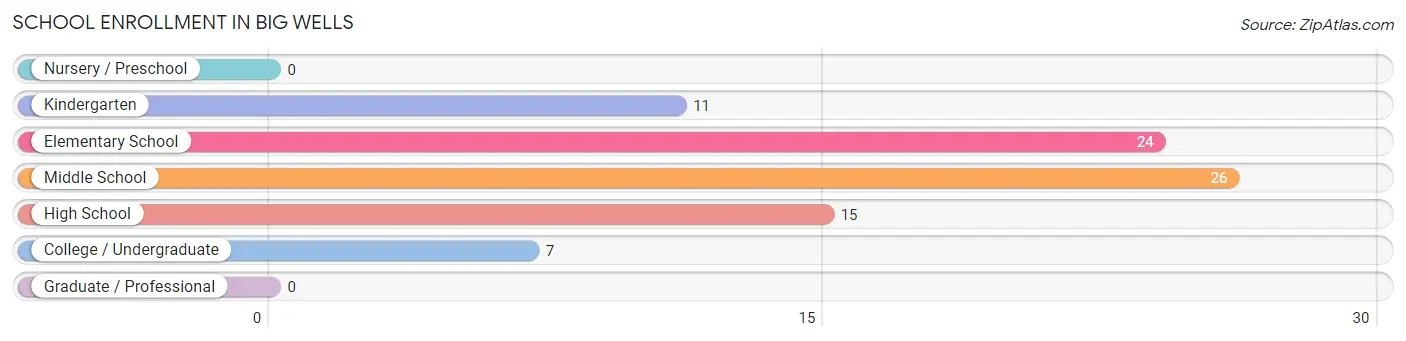
| School Level | # Students | % Students |
| Nursery / Preschool | 0 | 0.0% |
| Kindergarten | 11 | 13.3% |
| Elementary School | 24 | 28.9% |
| Middle School | 26 | 31.3% |
| High School | 15 | 18.1% |
| College / Undergraduate | 7 | 8.4% |
| Graduate / Professional | 0 | 0.0% |
| Total | 83 | 100.0% |
School Enrollment by Age by Funding Source in Big Wells
Out of a total of 83 students who are enrolled in schools in Big Wells, 7 (8.4%) attend a private institution, while the remaining 76 (91.6%) are enrolled in public schools. The age group of 18 to 19 year olds has the highest likelihood of being enrolled in private schools, with 7 (100.0% in the age bracket) enrolled. Conversely, the age group of 5 to 9 year old has the lowest likelihood of being enrolled in a private school, with 35 (100.0% in the age bracket) attending a public institution.
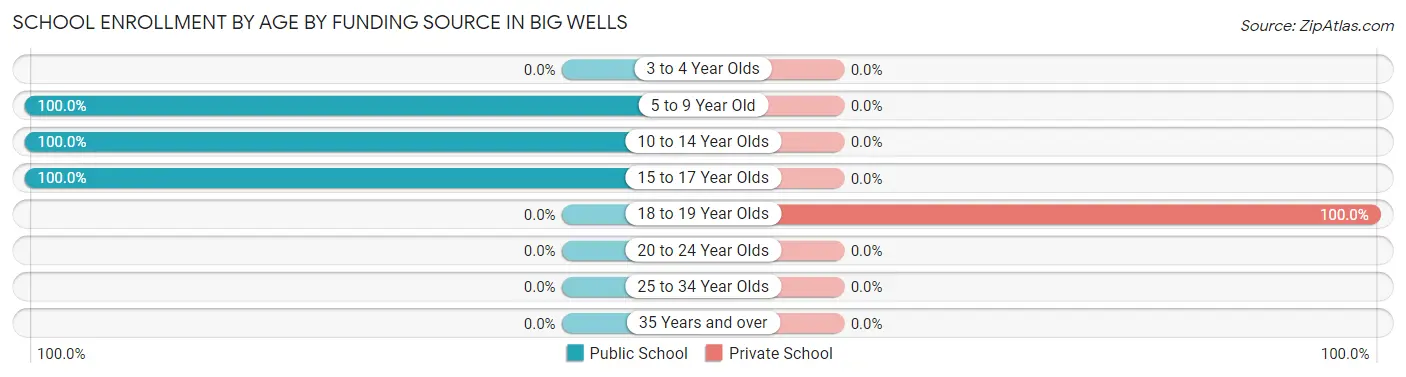
| Age Bracket | Public School | Private School |
| 3 to 4 Year Olds | 0 (0.0%) | 0 (0.0%) |
| 5 to 9 Year Old | 35 (100.0%) | 0 (0.0%) |
| 10 to 14 Year Olds | 29 (100.0%) | 0 (0.0%) |
| 15 to 17 Year Olds | 12 (100.0%) | 0 (0.0%) |
| 18 to 19 Year Olds | 0 (0.0%) | 7 (100.0%) |
| 20 to 24 Year Olds | 0 (0.0%) | 0 (0.0%) |
| 25 to 34 Year Olds | 0 (0.0%) | 0 (0.0%) |
| 35 Years and over | 0 (0.0%) | 0 (0.0%) |
| Total | 76 (91.6%) | 7 (8.4%) |
Educational Attainment by Field of Study in Big Wells
, and arts & humanities (13 | 100.0%) are the most common fields of study among 13 individuals in Big Wells who have obtained a bachelor's degree or higher.
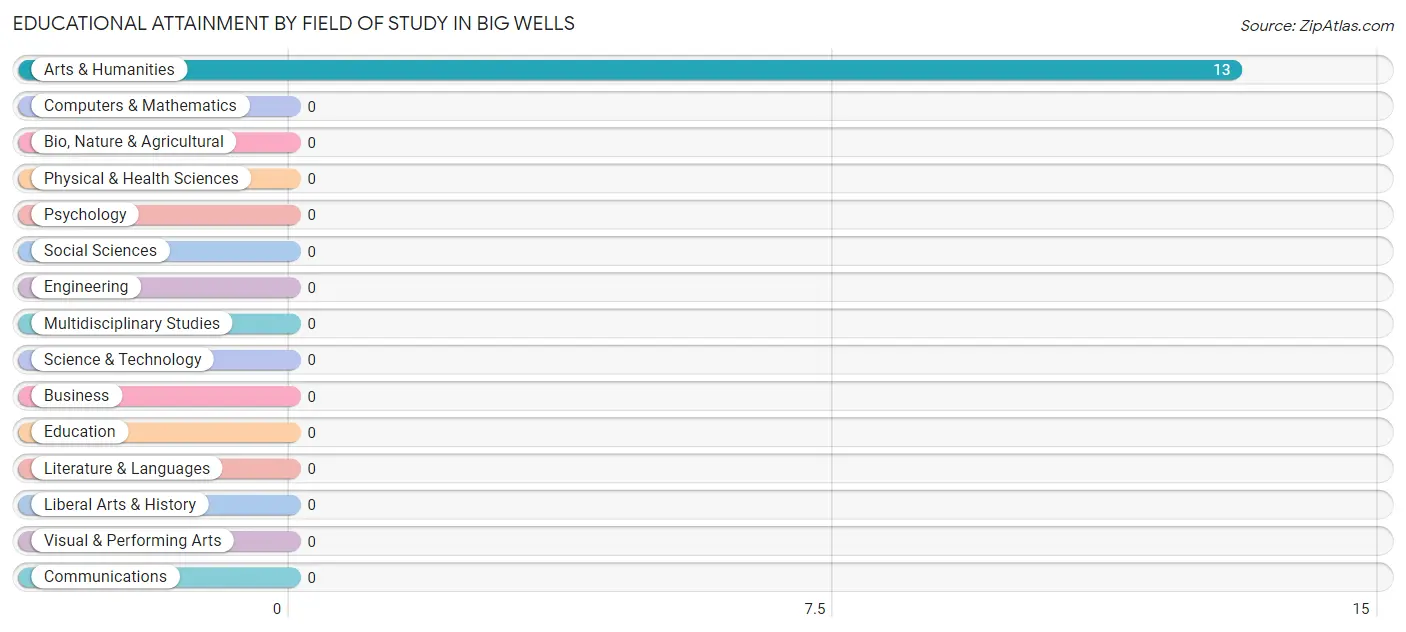
| Field of Study | # Graduates | % Graduates |
| Computers & Mathematics | 0 | 0.0% |
| Bio, Nature & Agricultural | 0 | 0.0% |
| Physical & Health Sciences | 0 | 0.0% |
| Psychology | 0 | 0.0% |
| Social Sciences | 0 | 0.0% |
| Engineering | 0 | 0.0% |
| Multidisciplinary Studies | 0 | 0.0% |
| Science & Technology | 0 | 0.0% |
| Business | 0 | 0.0% |
| Education | 0 | 0.0% |
| Literature & Languages | 0 | 0.0% |
| Liberal Arts & History | 0 | 0.0% |
| Visual & Performing Arts | 0 | 0.0% |
| Communications | 0 | 0.0% |
| Arts & Humanities | 13 | 100.0% |
| Total | 13 | 100.0% |
Transportation & Commute in Big Wells
Vehicle Availability by Sex in Big Wells
The most prevalent vehicle ownership categories in Big Wells are males with 1 vehicle (21, accounting for 51.2%) and females with 1 vehicle (60, making up 25.9%).
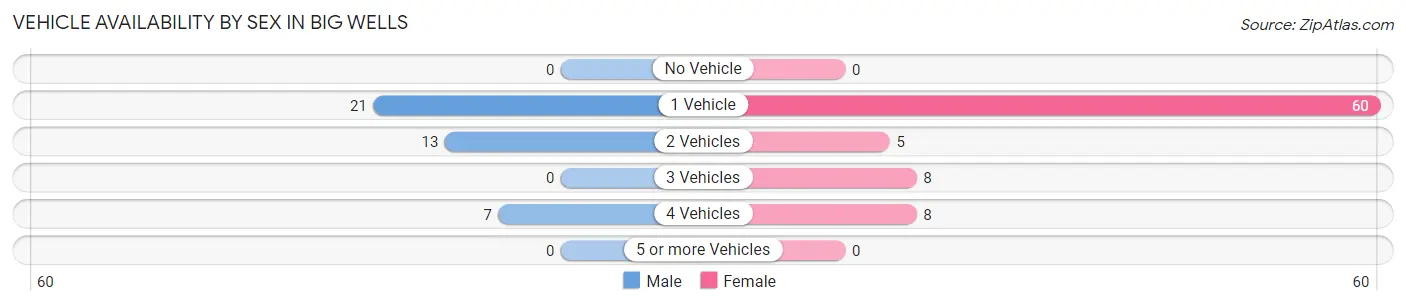
| Vehicles Available | Male | Female |
| No Vehicle | 0 (0.0%) | 0 (0.0%) |
| 1 Vehicle | 21 (51.2%) | 60 (74.1%) |
| 2 Vehicles | 13 (31.7%) | 5 (6.2%) |
| 3 Vehicles | 0 (0.0%) | 8 (9.9%) |
| 4 Vehicles | 7 (17.1%) | 8 (9.9%) |
| 5 or more Vehicles | 0 (0.0%) | 0 (0.0%) |
| Total | 41 (100.0%) | 81 (100.0%) |
Commute Time in Big Wells
The most frequently occuring commute durations in Big Wells are 5 to 9 minutes (39 commuters, 32.0%), 20 to 24 minutes (30 commuters, 24.6%), and 15 to 19 minutes (28 commuters, 23.0%).
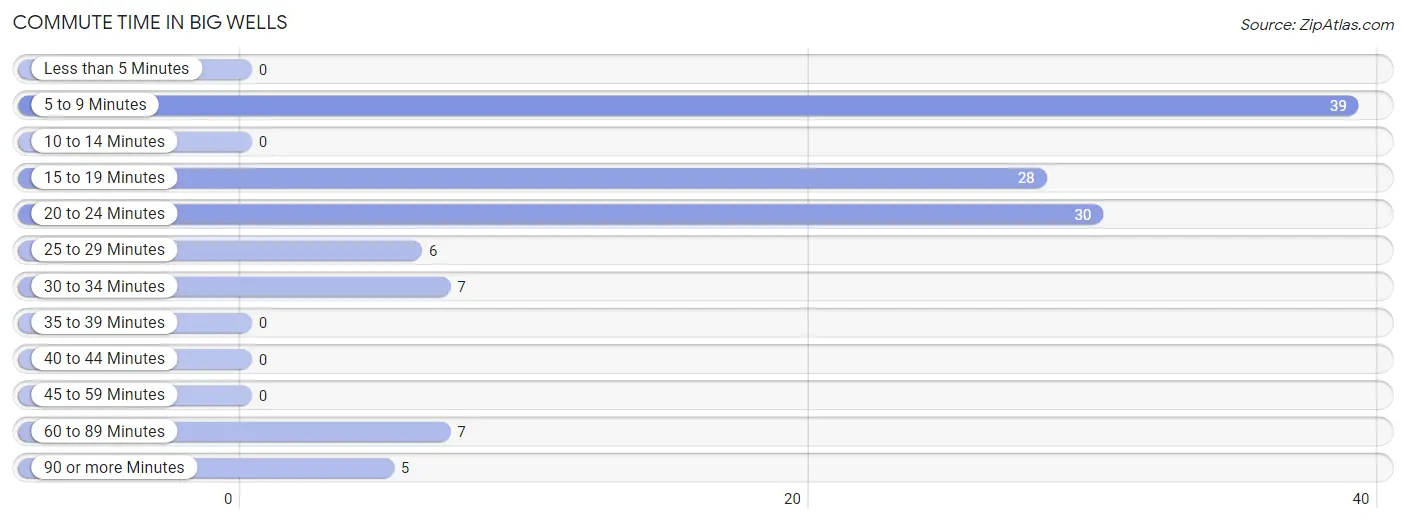
| Commute Time | # Commuters | % Commuters |
| Less than 5 Minutes | 0 | 0.0% |
| 5 to 9 Minutes | 39 | 32.0% |
| 10 to 14 Minutes | 0 | 0.0% |
| 15 to 19 Minutes | 28 | 23.0% |
| 20 to 24 Minutes | 30 | 24.6% |
| 25 to 29 Minutes | 6 | 4.9% |
| 30 to 34 Minutes | 7 | 5.7% |
| 35 to 39 Minutes | 0 | 0.0% |
| 40 to 44 Minutes | 0 | 0.0% |
| 45 to 59 Minutes | 0 | 0.0% |
| 60 to 89 Minutes | 7 | 5.7% |
| 90 or more Minutes | 5 | 4.1% |
Commute Time by Sex in Big Wells
The most common commute times in Big Wells are 5 to 9 minutes (11 commuters, 26.8%) for males and 5 to 9 minutes (28 commuters, 34.6%) for females.
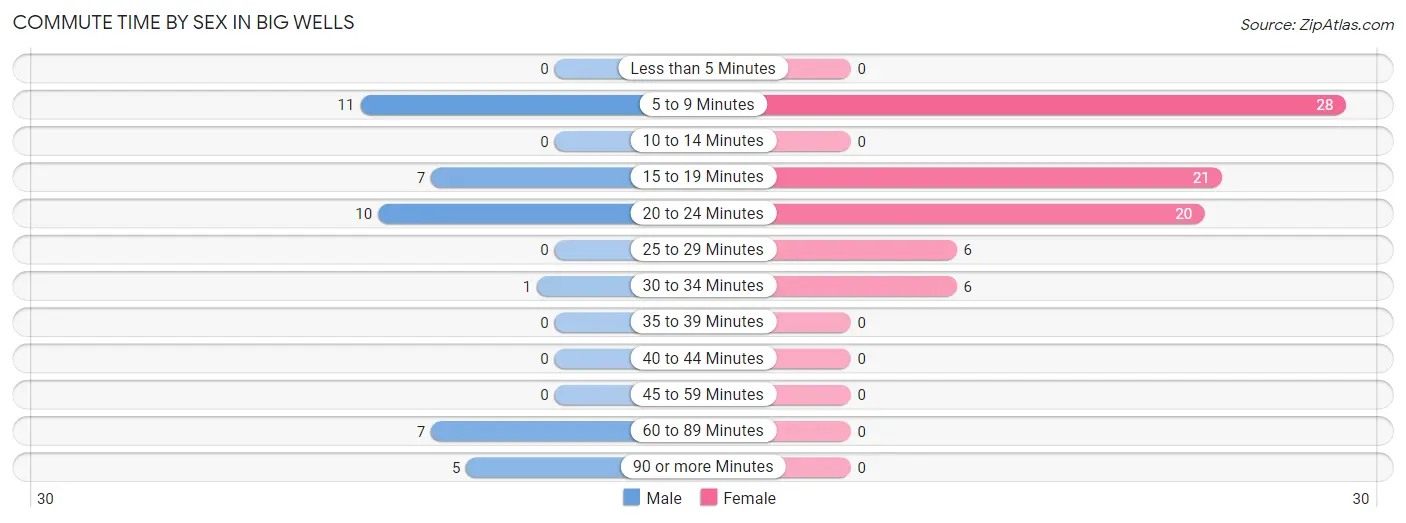
| Commute Time | Male | Female |
| Less than 5 Minutes | 0 (0.0%) | 0 (0.0%) |
| 5 to 9 Minutes | 11 (26.8%) | 28 (34.6%) |
| 10 to 14 Minutes | 0 (0.0%) | 0 (0.0%) |
| 15 to 19 Minutes | 7 (17.1%) | 21 (25.9%) |
| 20 to 24 Minutes | 10 (24.4%) | 20 (24.7%) |
| 25 to 29 Minutes | 0 (0.0%) | 6 (7.4%) |
| 30 to 34 Minutes | 1 (2.4%) | 6 (7.4%) |
| 35 to 39 Minutes | 0 (0.0%) | 0 (0.0%) |
| 40 to 44 Minutes | 0 (0.0%) | 0 (0.0%) |
| 45 to 59 Minutes | 0 (0.0%) | 0 (0.0%) |
| 60 to 89 Minutes | 7 (17.1%) | 0 (0.0%) |
| 90 or more Minutes | 5 (12.2%) | 0 (0.0%) |
Time of Departure to Work by Sex in Big Wells
The most frequent times of departure to work in Big Wells are 6:00 AM to 6:29 AM (15, 36.6%) for males and 7:00 AM to 7:29 AM (26, 32.1%) for females.
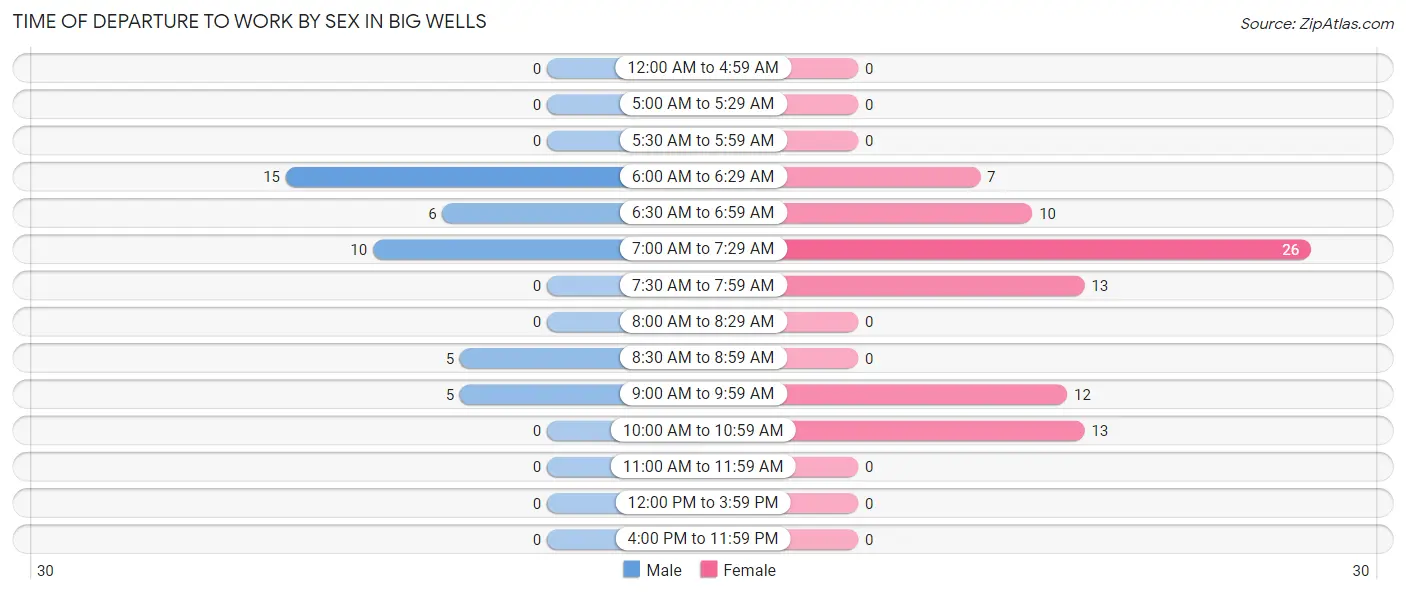
| Time of Departure | Male | Female |
| 12:00 AM to 4:59 AM | 0 (0.0%) | 0 (0.0%) |
| 5:00 AM to 5:29 AM | 0 (0.0%) | 0 (0.0%) |
| 5:30 AM to 5:59 AM | 0 (0.0%) | 0 (0.0%) |
| 6:00 AM to 6:29 AM | 15 (36.6%) | 7 (8.6%) |
| 6:30 AM to 6:59 AM | 6 (14.6%) | 10 (12.3%) |
| 7:00 AM to 7:29 AM | 10 (24.4%) | 26 (32.1%) |
| 7:30 AM to 7:59 AM | 0 (0.0%) | 13 (16.1%) |
| 8:00 AM to 8:29 AM | 0 (0.0%) | 0 (0.0%) |
| 8:30 AM to 8:59 AM | 5 (12.2%) | 0 (0.0%) |
| 9:00 AM to 9:59 AM | 5 (12.2%) | 12 (14.8%) |
| 10:00 AM to 10:59 AM | 0 (0.0%) | 13 (16.1%) |
| 11:00 AM to 11:59 AM | 0 (0.0%) | 0 (0.0%) |
| 12:00 PM to 3:59 PM | 0 (0.0%) | 0 (0.0%) |
| 4:00 PM to 11:59 PM | 0 (0.0%) | 0 (0.0%) |
| Total | 41 (100.0%) | 81 (100.0%) |
Housing Occupancy in Big Wells
Occupancy by Ownership in Big Wells
Of the total 171 dwellings in Big Wells, owner-occupied units account for 129 (75.4%), while renter-occupied units make up 42 (24.6%).
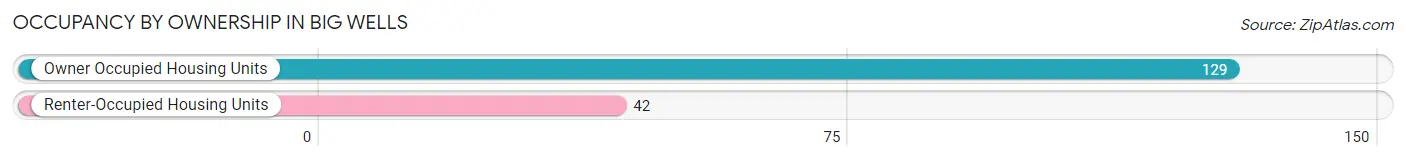
| Occupancy | # Housing Units | % Housing Units |
| Owner Occupied Housing Units | 129 | 75.4% |
| Renter-Occupied Housing Units | 42 | 24.6% |
| Total Occupied Housing Units | 171 | 100.0% |
Occupancy by Household Size in Big Wells
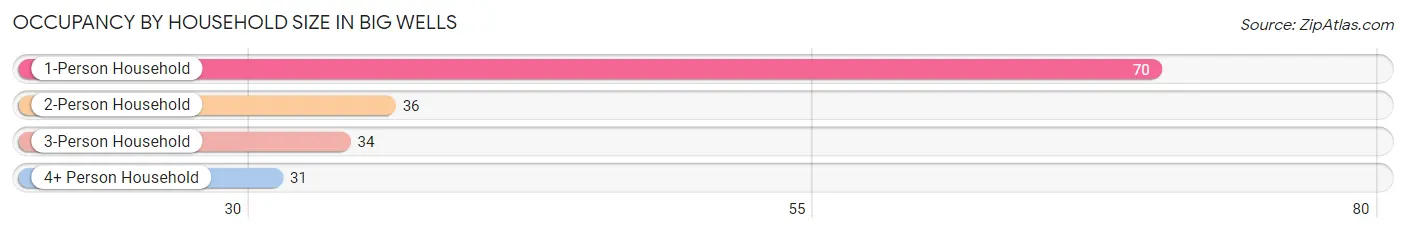
| Household Size | # Housing Units | % Housing Units |
| 1-Person Household | 70 | 40.9% |
| 2-Person Household | 36 | 21.0% |
| 3-Person Household | 34 | 19.9% |
| 4+ Person Household | 31 | 18.1% |
| Total Housing Units | 171 | 100.0% |
Occupancy by Ownership by Household Size in Big Wells
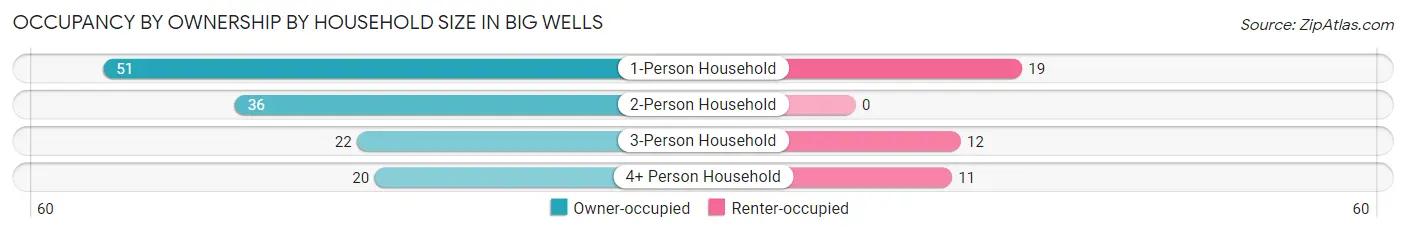
| Household Size | Owner-occupied | Renter-occupied |
| 1-Person Household | 51 (72.9%) | 19 (27.1%) |
| 2-Person Household | 36 (100.0%) | 0 (0.0%) |
| 3-Person Household | 22 (64.7%) | 12 (35.3%) |
| 4+ Person Household | 20 (64.5%) | 11 (35.5%) |
| Total Housing Units | 129 (75.4%) | 42 (24.6%) |
Occupancy by Educational Attainment in Big Wells
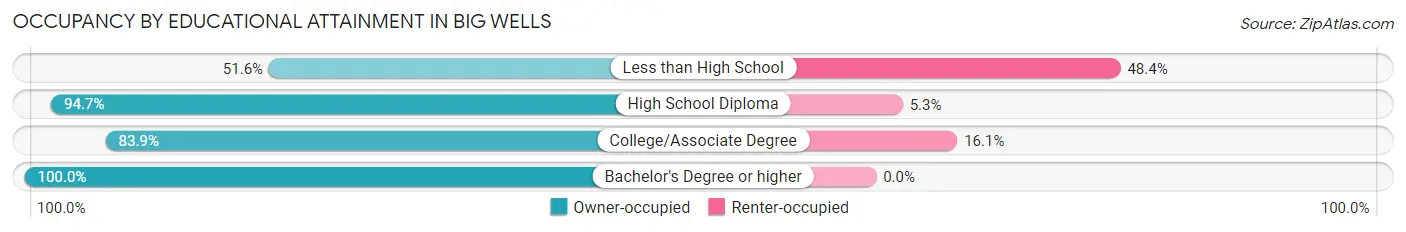
| Household Size | Owner-occupied | Renter-occupied |
| Less than High School | 33 (51.6%) | 31 (48.4%) |
| High School Diploma | 36 (94.7%) | 2 (5.3%) |
| College/Associate Degree | 47 (83.9%) | 9 (16.1%) |
| Bachelor's Degree or higher | 13 (100.0%) | 0 (0.0%) |
Occupancy by Age of Householder in Big Wells
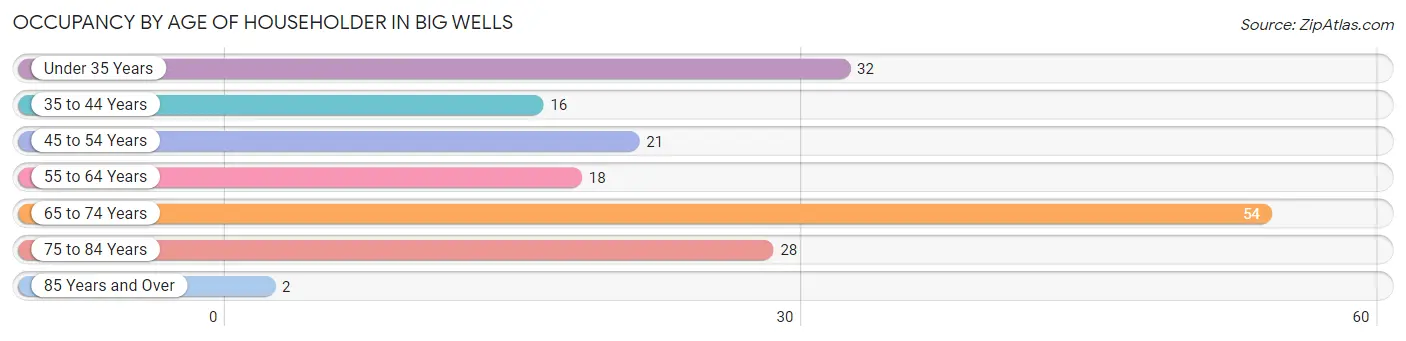
| Age Bracket | # Households | % Households |
| Under 35 Years | 32 | 18.7% |
| 35 to 44 Years | 16 | 9.4% |
| 45 to 54 Years | 21 | 12.3% |
| 55 to 64 Years | 18 | 10.5% |
| 65 to 74 Years | 54 | 31.6% |
| 75 to 84 Years | 28 | 16.4% |
| 85 Years and Over | 2 | 1.2% |
| Total | 171 | 100.0% |
Housing Finances in Big Wells
Median Income by Occupancy in Big Wells
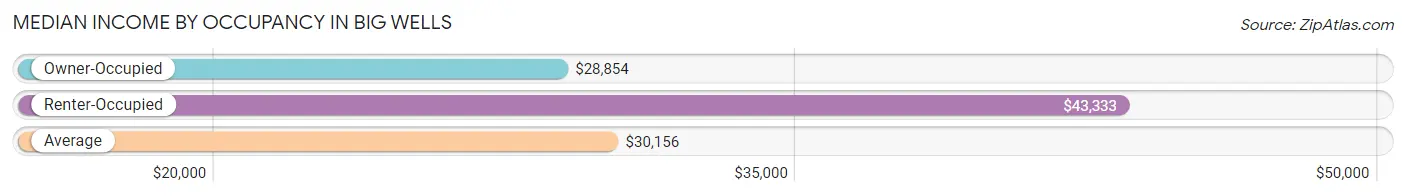
| Occupancy Type | # Households | Median Income |
| Owner-Occupied | 129 (75.4%) | $28,854 |
| Renter-Occupied | 42 (24.6%) | $43,333 |
| Average | 171 (100.0%) | $30,156 |
Occupancy by Householder Income Bracket in Big Wells
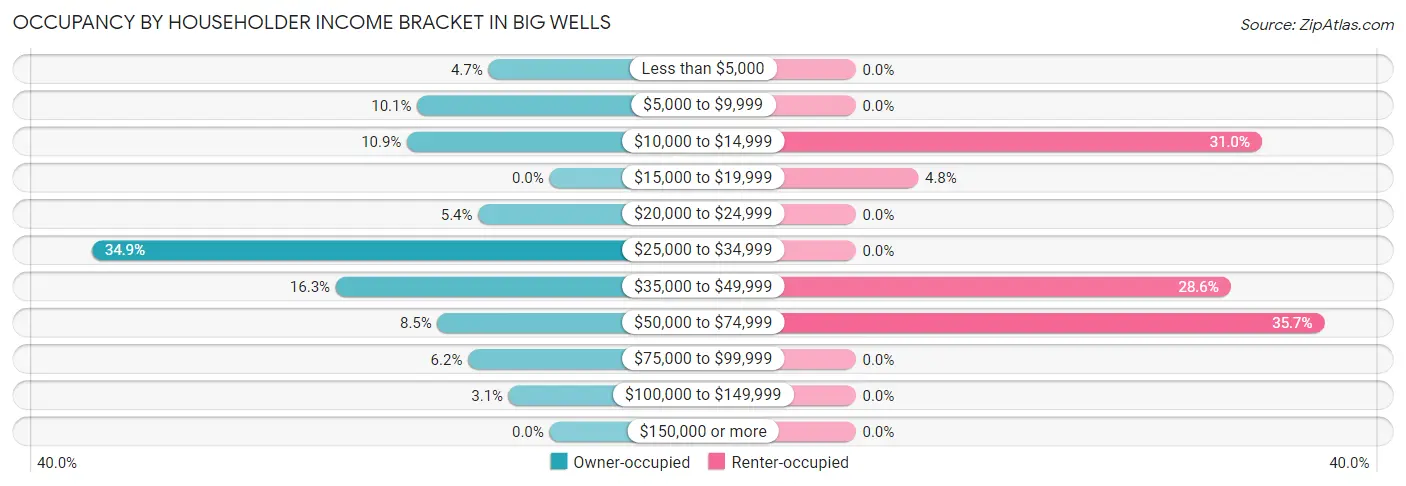
| Income Bracket | Owner-occupied | Renter-occupied |
| Less than $5,000 | 6 (4.6%) | 0 (0.0%) |
| $5,000 to $9,999 | 13 (10.1%) | 0 (0.0%) |
| $10,000 to $14,999 | 14 (10.8%) | 13 (30.9%) |
| $15,000 to $19,999 | 0 (0.0%) | 2 (4.8%) |
| $20,000 to $24,999 | 7 (5.4%) | 0 (0.0%) |
| $25,000 to $34,999 | 45 (34.9%) | 0 (0.0%) |
| $35,000 to $49,999 | 21 (16.3%) | 12 (28.6%) |
| $50,000 to $74,999 | 11 (8.5%) | 15 (35.7%) |
| $75,000 to $99,999 | 8 (6.2%) | 0 (0.0%) |
| $100,000 to $149,999 | 4 (3.1%) | 0 (0.0%) |
| $150,000 or more | 0 (0.0%) | 0 (0.0%) |
| Total | 129 (100.0%) | 42 (100.0%) |
Monthly Housing Cost Tiers in Big Wells
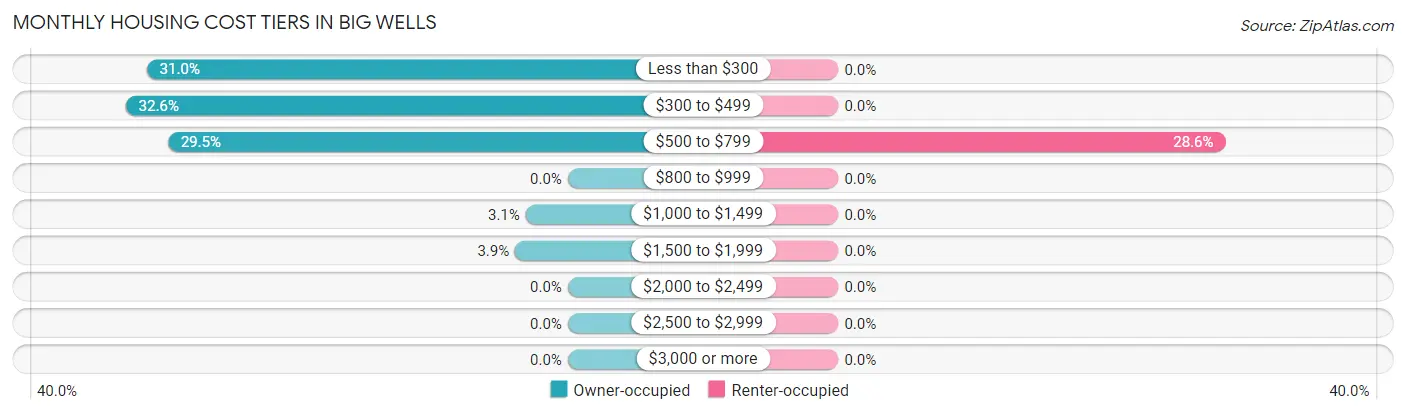
| Monthly Cost | Owner-occupied | Renter-occupied |
| Less than $300 | 40 (31.0%) | 0 (0.0%) |
| $300 to $499 | 42 (32.6%) | 0 (0.0%) |
| $500 to $799 | 38 (29.5%) | 12 (28.6%) |
| $800 to $999 | 0 (0.0%) | 0 (0.0%) |
| $1,000 to $1,499 | 4 (3.1%) | 0 (0.0%) |
| $1,500 to $1,999 | 5 (3.9%) | 0 (0.0%) |
| $2,000 to $2,499 | 0 (0.0%) | 0 (0.0%) |
| $2,500 to $2,999 | 0 (0.0%) | 0 (0.0%) |
| $3,000 or more | 0 (0.0%) | 0 (0.0%) |
| Total | 129 (100.0%) | 42 (100.0%) |
Physical Housing Characteristics in Big Wells
Housing Structures in Big Wells
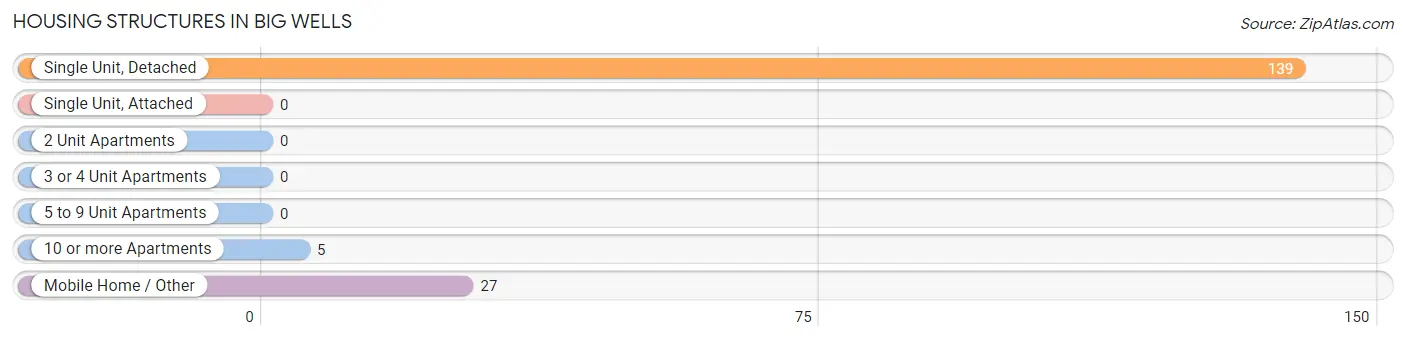
| Structure Type | # Housing Units | % Housing Units |
| Single Unit, Detached | 139 | 81.3% |
| Single Unit, Attached | 0 | 0.0% |
| 2 Unit Apartments | 0 | 0.0% |
| 3 or 4 Unit Apartments | 0 | 0.0% |
| 5 to 9 Unit Apartments | 0 | 0.0% |
| 10 or more Apartments | 5 | 2.9% |
| Mobile Home / Other | 27 | 15.8% |
| Total | 171 | 100.0% |
Housing Structures by Occupancy in Big Wells
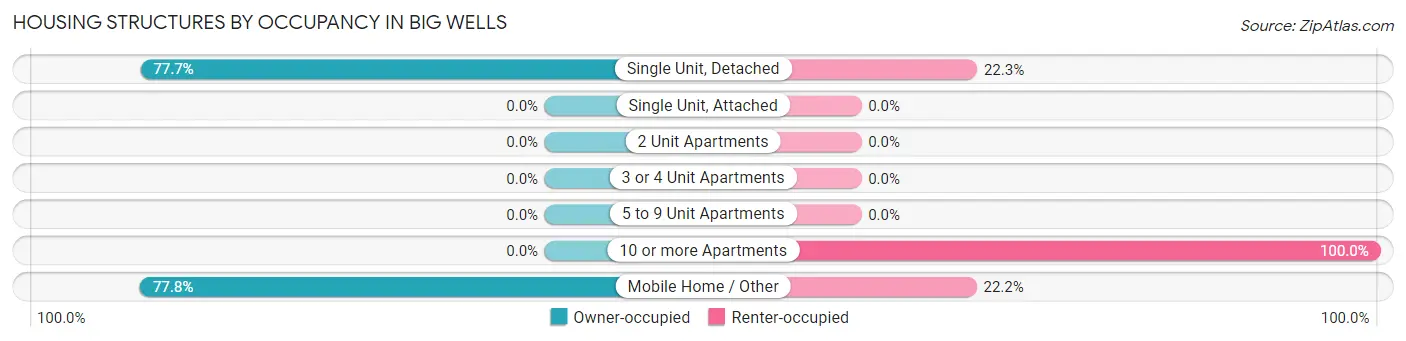
| Structure Type | Owner-occupied | Renter-occupied |
| Single Unit, Detached | 108 (77.7%) | 31 (22.3%) |
| Single Unit, Attached | 0 (0.0%) | 0 (0.0%) |
| 2 Unit Apartments | 0 (0.0%) | 0 (0.0%) |
| 3 or 4 Unit Apartments | 0 (0.0%) | 0 (0.0%) |
| 5 to 9 Unit Apartments | 0 (0.0%) | 0 (0.0%) |
| 10 or more Apartments | 0 (0.0%) | 5 (100.0%) |
| Mobile Home / Other | 21 (77.8%) | 6 (22.2%) |
| Total | 129 (75.4%) | 42 (24.6%) |
Housing Structures by Number of Rooms in Big Wells
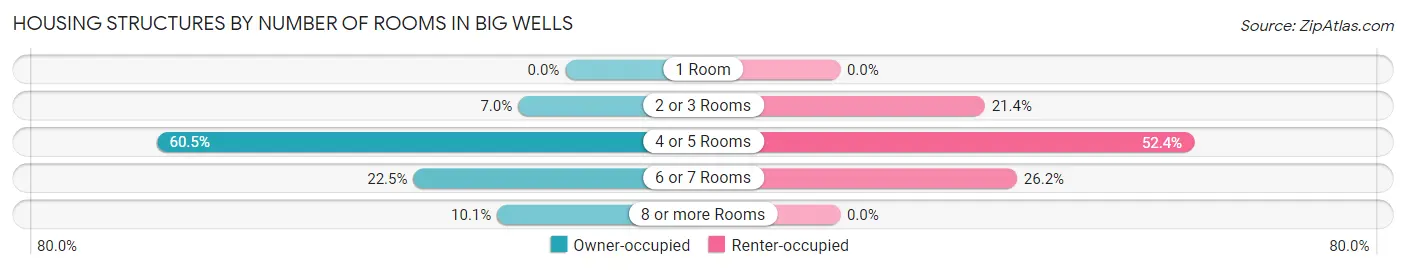
| Number of Rooms | Owner-occupied | Renter-occupied |
| 1 Room | 0 (0.0%) | 0 (0.0%) |
| 2 or 3 Rooms | 9 (7.0%) | 9 (21.4%) |
| 4 or 5 Rooms | 78 (60.5%) | 22 (52.4%) |
| 6 or 7 Rooms | 29 (22.5%) | 11 (26.2%) |
| 8 or more Rooms | 13 (10.1%) | 0 (0.0%) |
| Total | 129 (100.0%) | 42 (100.0%) |
Housing Structure by Heating Type in Big Wells
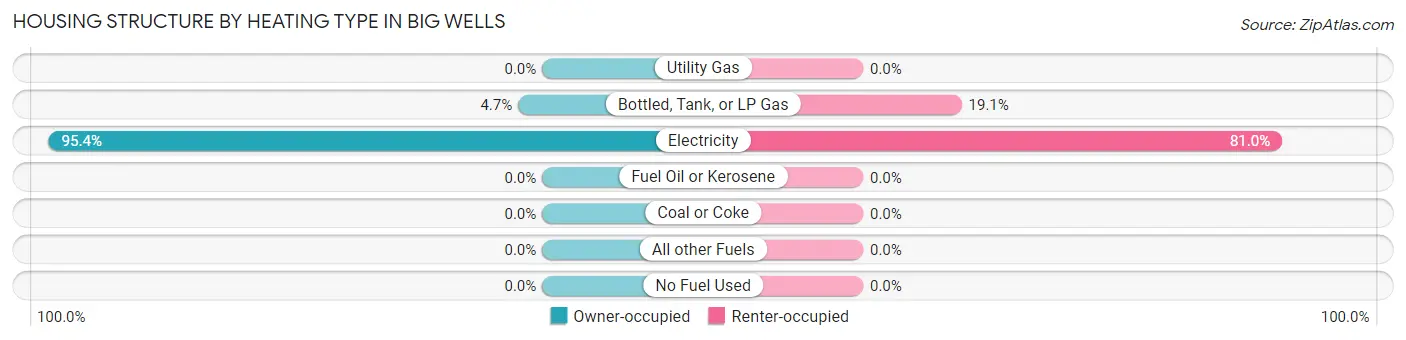
| Heating Type | Owner-occupied | Renter-occupied |
| Utility Gas | 0 (0.0%) | 0 (0.0%) |
| Bottled, Tank, or LP Gas | 6 (4.6%) | 8 (19.1%) |
| Electricity | 123 (95.4%) | 34 (80.9%) |
| Fuel Oil or Kerosene | 0 (0.0%) | 0 (0.0%) |
| Coal or Coke | 0 (0.0%) | 0 (0.0%) |
| All other Fuels | 0 (0.0%) | 0 (0.0%) |
| No Fuel Used | 0 (0.0%) | 0 (0.0%) |
| Total | 129 (100.0%) | 42 (100.0%) |
Household Vehicle Usage in Big Wells
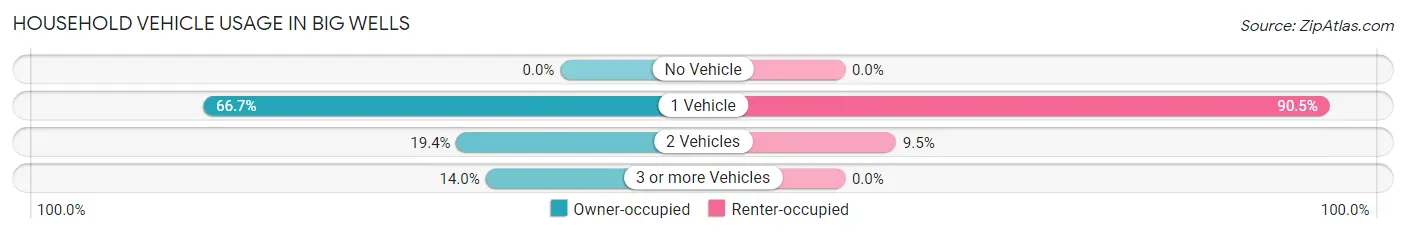
| Vehicles per Household | Owner-occupied | Renter-occupied |
| No Vehicle | 0 (0.0%) | 0 (0.0%) |
| 1 Vehicle | 86 (66.7%) | 38 (90.5%) |
| 2 Vehicles | 25 (19.4%) | 4 (9.5%) |
| 3 or more Vehicles | 18 (14.0%) | 0 (0.0%) |
| Total | 129 (100.0%) | 42 (100.0%) |
Real Estate & Mortgages in Big Wells
Real Estate and Mortgage Overview in Big Wells
| Characteristic | Without Mortgage | With Mortgage |
| Housing Units | 120 | 9 |
| Median Property Value | $58,200 | $0 |
| Median Household Income | $27,917 | $0 |
| Monthly Housing Costs | $338 | $0 |
| Real Estate Taxes | $667 | $0 |
Property Value by Mortgage Status in Big Wells

| Property Value | Without Mortgage | With Mortgage |
| Less than $50,000 | 51 (42.5%) | 0 (0.0%) |
| $50,000 to $99,999 | 44 (36.7%) | 4 (44.4%) |
| $100,000 to $299,999 | 25 (20.8%) | 5 (55.6%) |
| $300,000 to $499,999 | 0 (0.0%) | 0 (0.0%) |
| $500,000 to $749,999 | 0 (0.0%) | 0 (0.0%) |
| $750,000 to $999,999 | 0 (0.0%) | 0 (0.0%) |
| $1,000,000 or more | 0 (0.0%) | 0 (0.0%) |
| Total | 120 (100.0%) | 9 (100.0%) |
Household Income by Mortgage Status in Big Wells
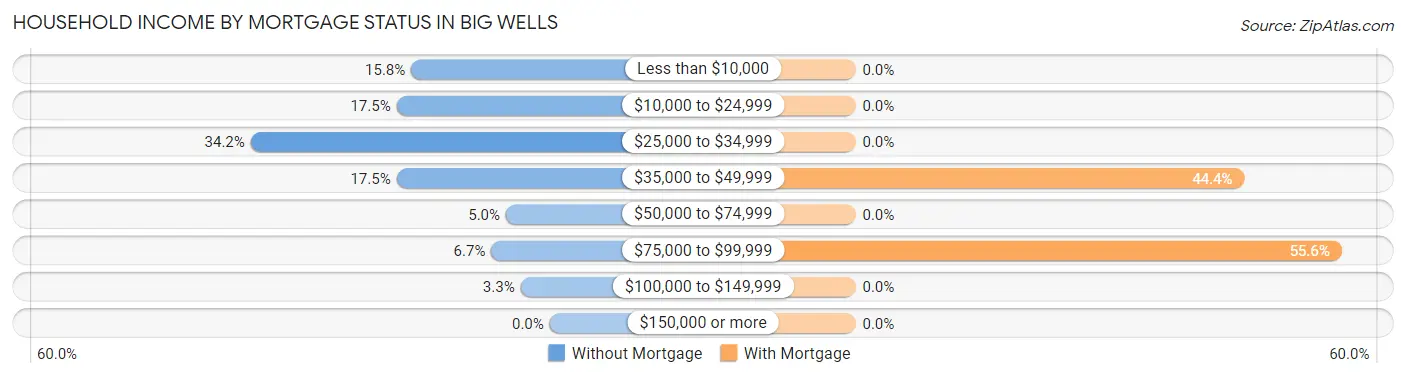
| Household Income | Without Mortgage | With Mortgage |
| Less than $10,000 | 19 (15.8%) | 0 (0.0%) |
| $10,000 to $24,999 | 21 (17.5%) | 0 (0.0%) |
| $25,000 to $34,999 | 41 (34.2%) | 0 (0.0%) |
| $35,000 to $49,999 | 21 (17.5%) | 4 (44.4%) |
| $50,000 to $74,999 | 6 (5.0%) | 0 (0.0%) |
| $75,000 to $99,999 | 8 (6.7%) | 5 (55.6%) |
| $100,000 to $149,999 | 4 (3.3%) | 0 (0.0%) |
| $150,000 or more | 0 (0.0%) | 0 (0.0%) |
| Total | 120 (100.0%) | 9 (100.0%) |
Property Value to Household Income Ratio in Big Wells
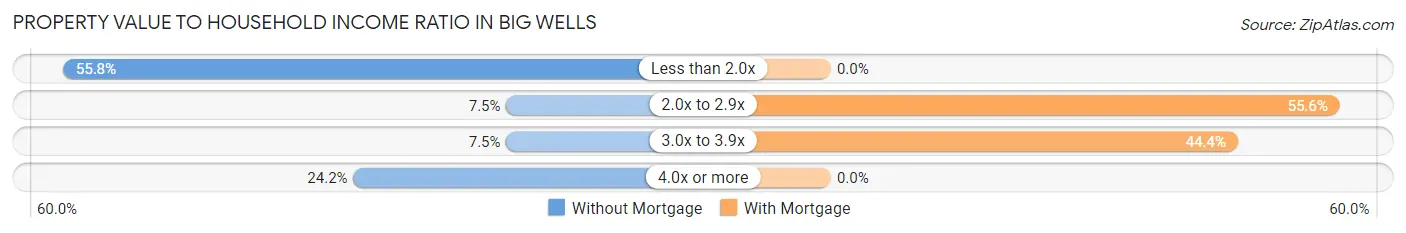
| Value-to-Income Ratio | Without Mortgage | With Mortgage |
| Less than 2.0x | 67 (55.8%) | 0 (0.0%) |
| 2.0x to 2.9x | 9 (7.5%) | 5 (55.6%) |
| 3.0x to 3.9x | 9 (7.5%) | 4 (44.4%) |
| 4.0x or more | 29 (24.2%) | 0 (0.0%) |
| Total | 120 (100.0%) | 9 (100.0%) |
Real Estate Taxes by Mortgage Status in Big Wells
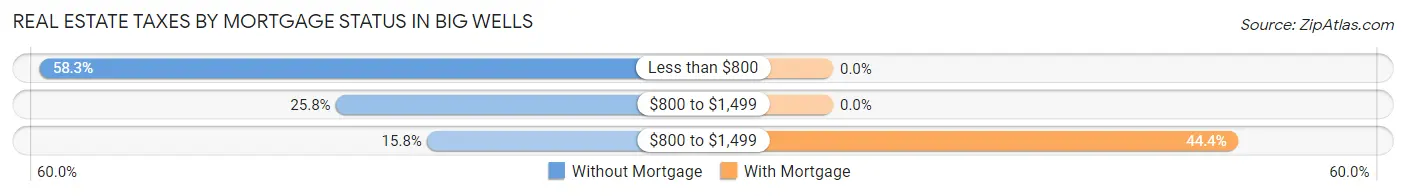
| Property Taxes | Without Mortgage | With Mortgage |
| Less than $800 | 70 (58.3%) | 0 (0.0%) |
| $800 to $1,499 | 31 (25.8%) | 0 (0.0%) |
| $800 to $1,499 | 19 (15.8%) | 4 (44.4%) |
| Total | 120 (100.0%) | 9 (100.0%) |
Health & Disability in Big Wells
Health Insurance Coverage by Age in Big Wells
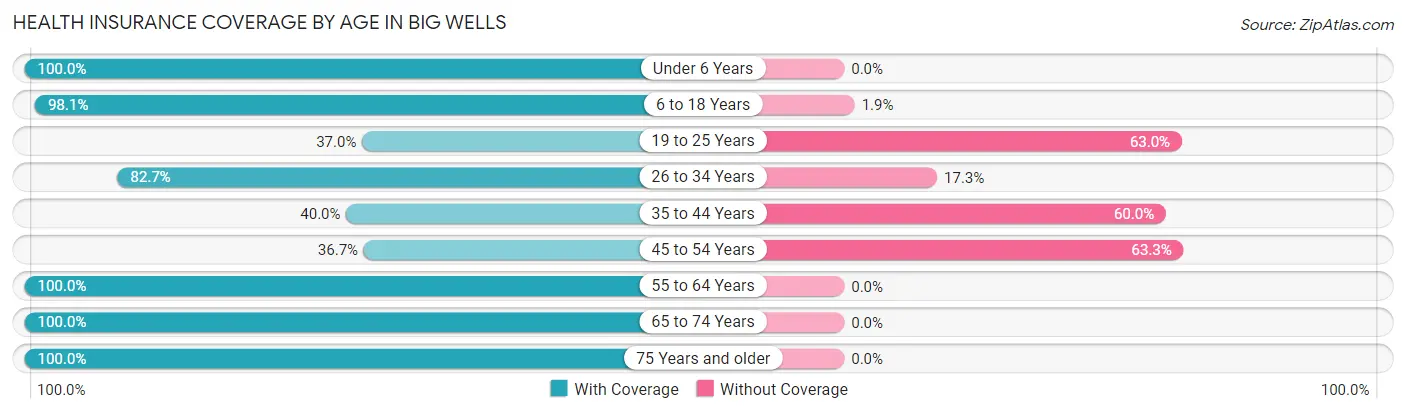
| Age Bracket | With Coverage | Without Coverage |
| Under 6 Years | 15 (100.0%) | 0 (0.0%) |
| 6 to 18 Years | 101 (98.1%) | 2 (1.9%) |
| 19 to 25 Years | 10 (37.0%) | 17 (63.0%) |
| 26 to 34 Years | 43 (82.7%) | 9 (17.3%) |
| 35 to 44 Years | 16 (40.0%) | 24 (60.0%) |
| 45 to 54 Years | 18 (36.7%) | 31 (63.3%) |
| 55 to 64 Years | 32 (100.0%) | 0 (0.0%) |
| 65 to 74 Years | 76 (100.0%) | 0 (0.0%) |
| 75 Years and older | 38 (100.0%) | 0 (0.0%) |
| Total | 349 (80.8%) | 83 (19.2%) |
Health Insurance Coverage by Citizenship Status in Big Wells
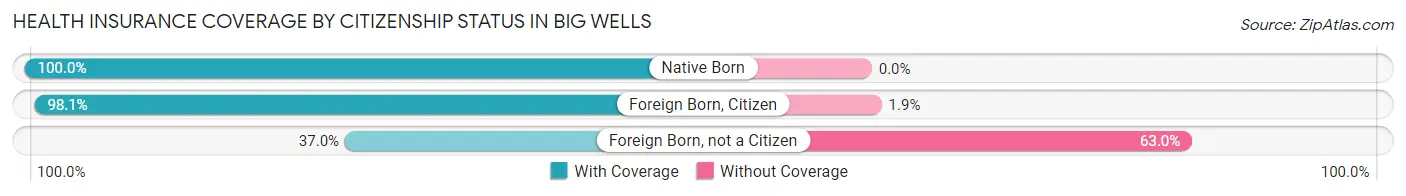
| Citizenship Status | With Coverage | Without Coverage |
| Native Born | 15 (100.0%) | 0 (0.0%) |
| Foreign Born, Citizen | 101 (98.1%) | 2 (1.9%) |
| Foreign Born, not a Citizen | 10 (37.0%) | 17 (63.0%) |
Health Insurance Coverage by Household Income in Big Wells
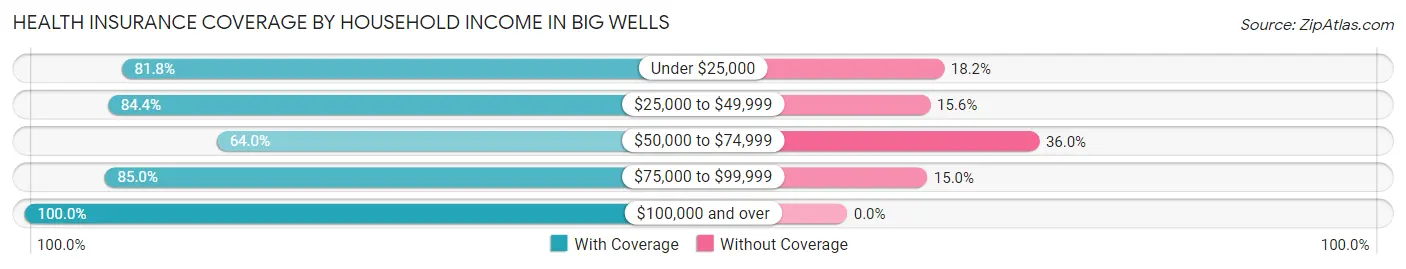
| Household Income | With Coverage | Without Coverage |
| Under $25,000 | 72 (81.8%) | 16 (18.2%) |
| $25,000 to $49,999 | 200 (84.4%) | 37 (15.6%) |
| $50,000 to $74,999 | 48 (64.0%) | 27 (36.0%) |
| $75,000 to $99,999 | 17 (85.0%) | 3 (15.0%) |
| $100,000 and over | 12 (100.0%) | 0 (0.0%) |
Public vs Private Health Insurance Coverage by Age in Big Wells
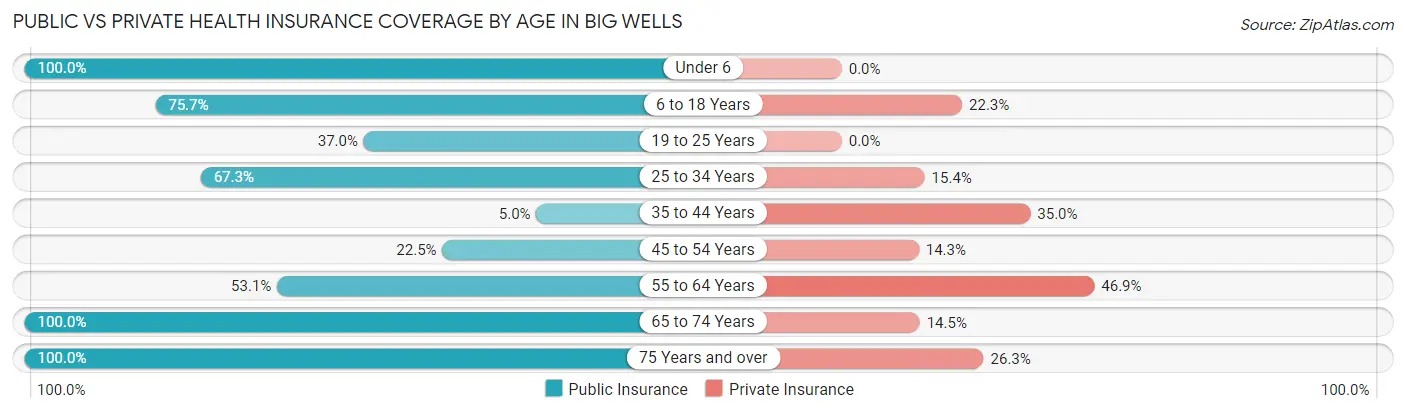
| Age Bracket | Public Insurance | Private Insurance |
| Under 6 | 15 (100.0%) | 0 (0.0%) |
| 6 to 18 Years | 78 (75.7%) | 23 (22.3%) |
| 19 to 25 Years | 10 (37.0%) | 0 (0.0%) |
| 25 to 34 Years | 35 (67.3%) | 8 (15.4%) |
| 35 to 44 Years | 2 (5.0%) | 14 (35.0%) |
| 45 to 54 Years | 11 (22.5%) | 7 (14.3%) |
| 55 to 64 Years | 17 (53.1%) | 15 (46.9%) |
| 65 to 74 Years | 76 (100.0%) | 11 (14.5%) |
| 75 Years and over | 38 (100.0%) | 10 (26.3%) |
| Total | 282 (65.3%) | 88 (20.4%) |
Disability Status by Sex by Age in Big Wells
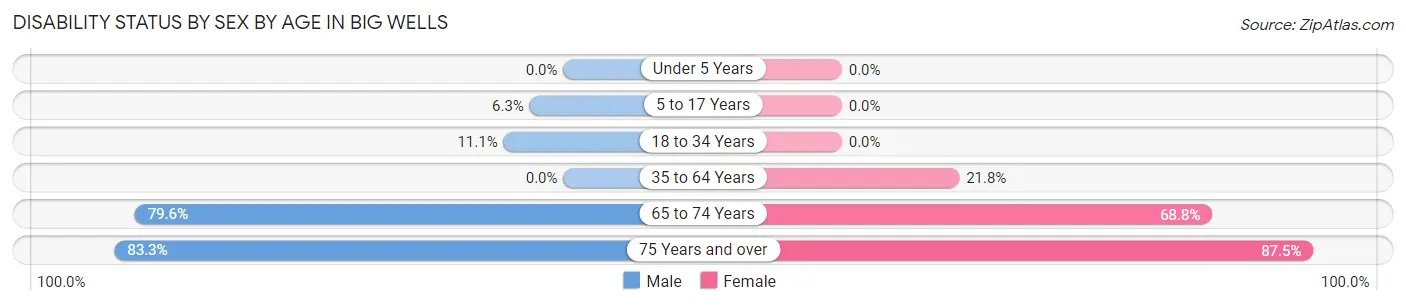
| Age Bracket | Male | Female |
| Under 5 Years | 0 (0.0%) | 0 (0.0%) |
| 5 to 17 Years | 2 (6.2%) | 0 (0.0%) |
| 18 to 34 Years | 3 (11.1%) | 0 (0.0%) |
| 35 to 64 Years | 0 (0.0%) | 17 (21.8%) |
| 65 to 74 Years | 35 (79.5%) | 22 (68.8%) |
| 75 Years and over | 5 (83.3%) | 28 (87.5%) |
Disability Class by Sex by Age in Big Wells
Disability Class: Hearing Difficulty
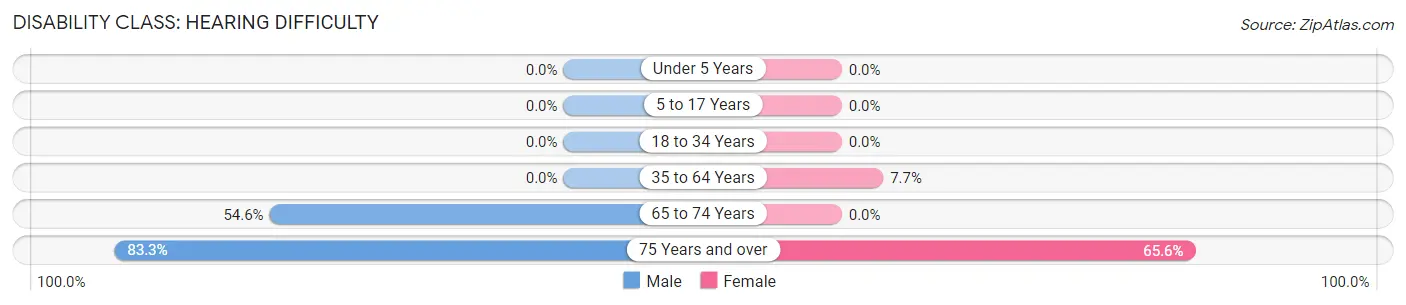
| Age Bracket | Male | Female |
| Under 5 Years | 0 (0.0%) | 0 (0.0%) |
| 5 to 17 Years | 0 (0.0%) | 0 (0.0%) |
| 18 to 34 Years | 0 (0.0%) | 0 (0.0%) |
| 35 to 64 Years | 0 (0.0%) | 6 (7.7%) |
| 65 to 74 Years | 24 (54.5%) | 0 (0.0%) |
| 75 Years and over | 5 (83.3%) | 21 (65.6%) |
Disability Class: Vision Difficulty
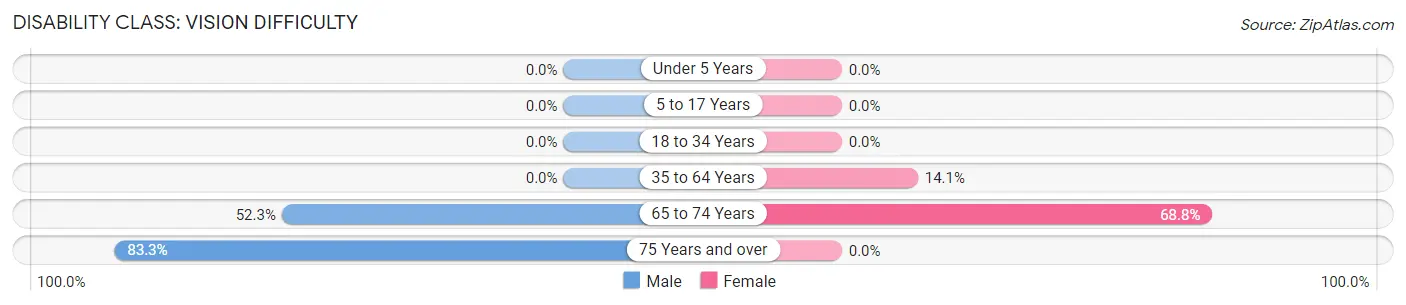
| Age Bracket | Male | Female |
| Under 5 Years | 0 (0.0%) | 0 (0.0%) |
| 5 to 17 Years | 0 (0.0%) | 0 (0.0%) |
| 18 to 34 Years | 0 (0.0%) | 0 (0.0%) |
| 35 to 64 Years | 0 (0.0%) | 11 (14.1%) |
| 65 to 74 Years | 23 (52.3%) | 22 (68.8%) |
| 75 Years and over | 5 (83.3%) | 0 (0.0%) |
Disability Class: Cognitive Difficulty
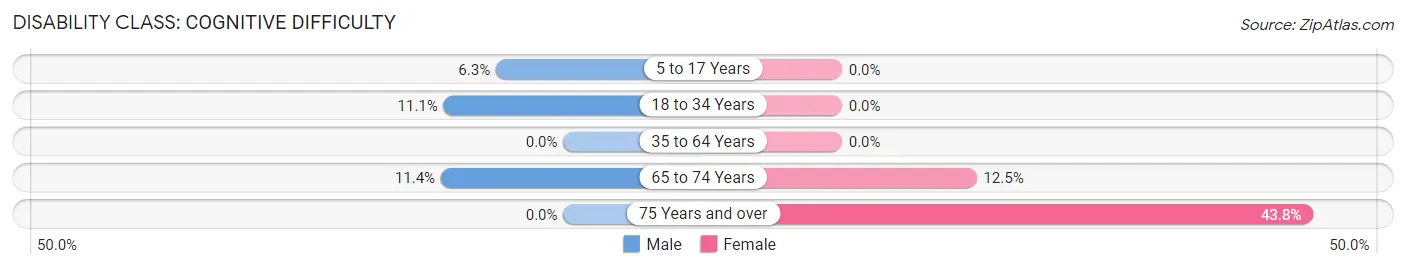
| Age Bracket | Male | Female |
| 5 to 17 Years | 2 (6.2%) | 0 (0.0%) |
| 18 to 34 Years | 3 (11.1%) | 0 (0.0%) |
| 35 to 64 Years | 0 (0.0%) | 0 (0.0%) |
| 65 to 74 Years | 5 (11.4%) | 4 (12.5%) |
| 75 Years and over | 0 (0.0%) | 14 (43.8%) |
Disability Class: Ambulatory Difficulty
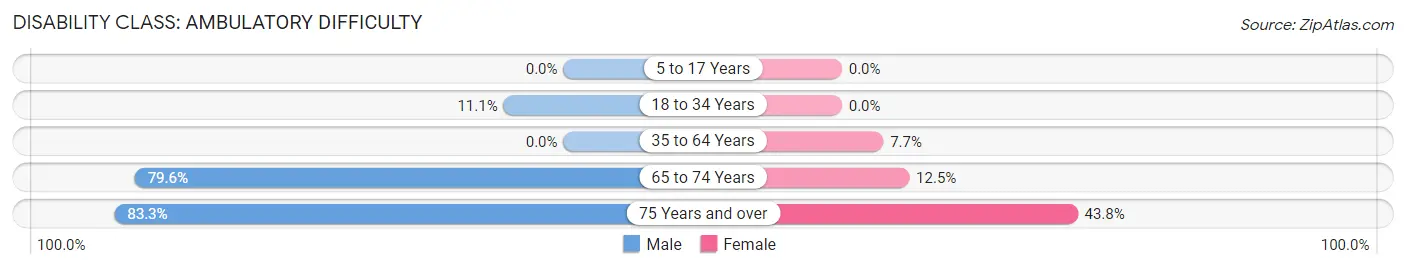
| Age Bracket | Male | Female |
| 5 to 17 Years | 0 (0.0%) | 0 (0.0%) |
| 18 to 34 Years | 3 (11.1%) | 0 (0.0%) |
| 35 to 64 Years | 0 (0.0%) | 6 (7.7%) |
| 65 to 74 Years | 35 (79.5%) | 4 (12.5%) |
| 75 Years and over | 5 (83.3%) | 14 (43.8%) |
Disability Class: Self-Care Difficulty
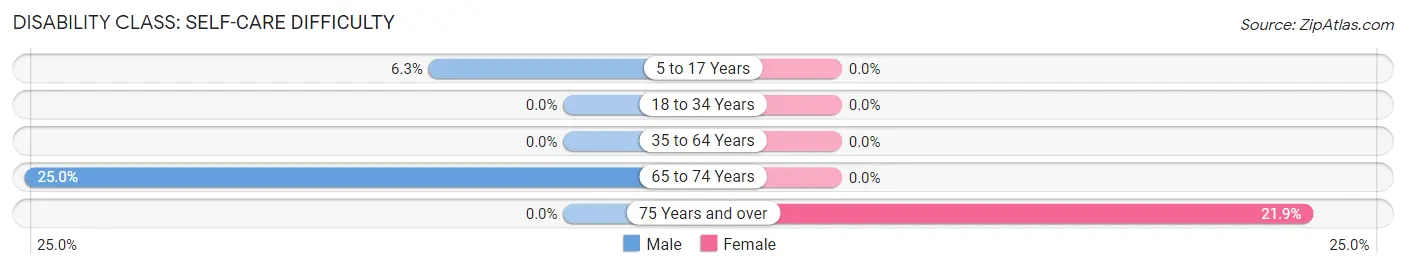
| Age Bracket | Male | Female |
| 5 to 17 Years | 2 (6.2%) | 0 (0.0%) |
| 18 to 34 Years | 0 (0.0%) | 0 (0.0%) |
| 35 to 64 Years | 0 (0.0%) | 0 (0.0%) |
| 65 to 74 Years | 11 (25.0%) | 0 (0.0%) |
| 75 Years and over | 0 (0.0%) | 7 (21.9%) |
Technology Access in Big Wells
Computing Device Access in Big Wells
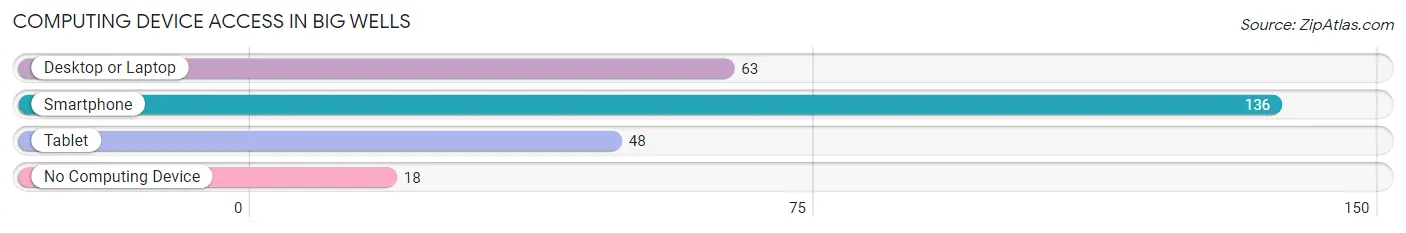
| Device Type | # Households | % Households |
| Desktop or Laptop | 63 | 36.8% |
| Smartphone | 136 | 79.5% |
| Tablet | 48 | 28.1% |
| No Computing Device | 18 | 10.5% |
| Total | 171 | 100.0% |
Internet Access in Big Wells
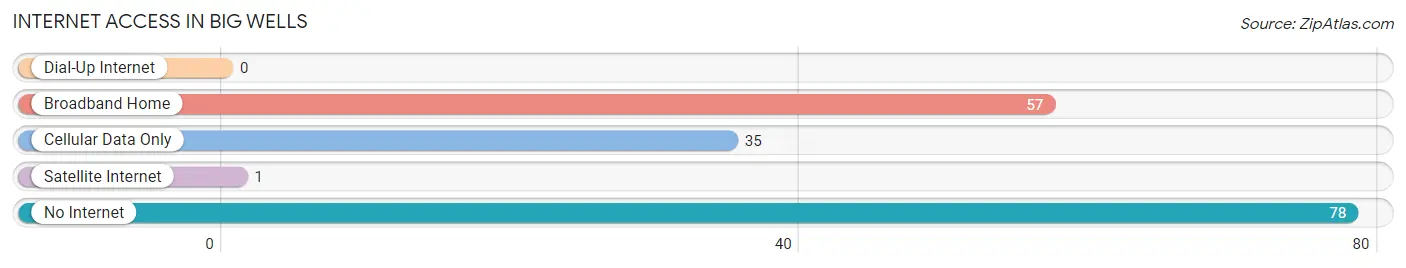
| Internet Type | # Households | % Households |
| Dial-Up Internet | 0 | 0.0% |
| Broadband Home | 57 | 33.3% |
| Cellular Data Only | 35 | 20.5% |
| Satellite Internet | 1 | 0.6% |
| No Internet | 78 | 45.6% |
| Total | 171 | 100.0% |
Big Wells Summary
Wells, Texas is a small town located in the western part of the state, in the heart of the Texas Hill Country. It is situated in the Edwards Plateau, and is part of the larger San Angelo metropolitan area. The town was founded in 1881, and has a population of just over 500 people.
History
The town of Wells was founded in 1881 by a group of settlers from the nearby town of San Angelo. The settlers were looking for a place to settle and start a new life, and they chose the area around Wells because of its abundance of natural resources. The town was named after the Wells family, who were among the first settlers.
The town quickly grew, and by the early 1900s, it had become a thriving community. The town was home to a variety of businesses, including a general store, a blacksmith shop, a hotel, and a saloon. The town also had a school, a post office, and a church.
In the early 1900s, the town was also home to a number of ranches, which provided the town with much of its economic activity. The town was also home to a number of oil wells, which provided the town with a steady source of income.
Geography
Wells is located in the western part of Texas, in the heart of the Texas Hill Country. The town is situated in the Edwards Plateau, and is part of the larger San Angelo metropolitan area. The town is located at an elevation of 1,845 feet, and is surrounded by rolling hills and grasslands.
The town is located near the Concho River, which provides the town with a steady source of water. The town is also located near a number of other rivers, including the Colorado, the Brazos, and the Pecos.
Economy
The economy of Wells is largely based on agriculture and ranching. The town is home to a number of ranches, which provide the town with much of its economic activity. The town is also home to a number of oil wells, which provide the town with a steady source of income.
The town is also home to a number of businesses, including a general store, a blacksmith shop, a hotel, and a saloon. The town also has a school, a post office, and a church.
Demographics
As of the 2010 census, the population of Wells was 514 people. The town is predominantly white, with a small Hispanic population. The median household income in Wells is $31,250, and the median age is 44.
Conclusion
Wells, Texas is a small town located in the western part of the state, in the heart of the Texas Hill Country. The town was founded in 1881, and has a population of just over 500 people. The town is largely based on agriculture and ranching, and is home to a number of businesses, including a general store, a blacksmith shop, a hotel, and a saloon. The town is predominantly white, with a small Hispanic population, and has a median household income of $31,250.
Common Questions
What is Per Capita Income in Big Wells?
Per Capita income in Big Wells is $15,968.
What is the Median Family Income in Big Wells?
Median Family Income in Big Wells is $29,375.
What is the Median Household income in Big Wells?
Median Household Income in Big Wells is $30,156.
What is Income or Wage Gap in Big Wells?
Income or Wage Gap in Big Wells is 32.0%.
Women in Big Wells earn 68.0 cents for every dollar earned by a man.
What is Inequality or Gini Index in Big Wells?
Inequality or Gini Index in Big Wells is 0.38.
What is the Total Population of Big Wells?
Total Population of Big Wells is 432.
What is the Total Male Population of Big Wells?
Total Male Population of Big Wells is 163.
What is the Total Female Population of Big Wells?
Total Female Population of Big Wells is 269.
What is the Ratio of Males per 100 Females in Big Wells?
There are 60.59 Males per 100 Females in Big Wells.
What is the Ratio of Females per 100 Males in Big Wells?
There are 165.03 Females per 100 Males in Big Wells.
What is the Median Population Age in Big Wells?
Median Population Age in Big Wells is 40.3 Years.
What is the Average Family Size in Big Wells
Average Family Size in Big Wells is 3.4 People.
What is the Average Household Size in Big Wells
Average Household Size in Big Wells is 2.5 People.
How Large is the Labor Force in Big Wells?
There are 145 People in the Labor Forcein in Big Wells.
What is the Percentage of People in the Labor Force in Big Wells?
42.4% of People are in the Labor Force in Big Wells.
What is the Unemployment Rate in Big Wells?
Unemployment Rate in Big Wells is 15.9%.