Bertram, TX Map & Demographics
Bertram Map

Bertram Overview
$30,660
PER CAPITA INCOME
$70,395
AVG FAMILY INCOME
$61,688
AVG HOUSEHOLD INCOME
45.8%
WAGE / INCOME GAP [ % ]
54.2¢/ $1
WAGE / INCOME GAP [ $ ]
0.39
INEQUALITY / GINI INDEX
1,832
TOTAL POPULATION
893
MALE POPULATION
939
FEMALE POPULATION
95.10
MALES / 100 FEMALES
105.15
FEMALES / 100 MALES
38.9
MEDIAN AGE
3.1
AVG FAMILY SIZE
2.6
AVG HOUSEHOLD SIZE
862
LABOR FORCE [ PEOPLE ]
58.3%
PERCENT IN LABOR FORCE
5.3%
UNEMPLOYMENT RATE
Bertram Zip Codes
Bertram Area Codes
Income in Bertram
Income Overview in Bertram
Per Capita Income in Bertram is $30,660, while median incomes of families and households are $70,395 and $61,688 respectively.
| Characteristic | Number | Measure |
| Per Capita Income | 1,832 | $30,660 |
| Median Family Income | 450 | $70,395 |
| Mean Family Income | 450 | $86,986 |
| Median Household Income | 679 | $61,688 |
| Mean Household Income | 679 | $78,934 |
| Income Deficit | 450 | $0 |
| Wage / Income Gap (%) | 1,832 | 45.78% |
| Wage / Income Gap ($) | 1,832 | 54.22¢ per $1 |
| Gini / Inequality Index | 1,832 | 0.39 |
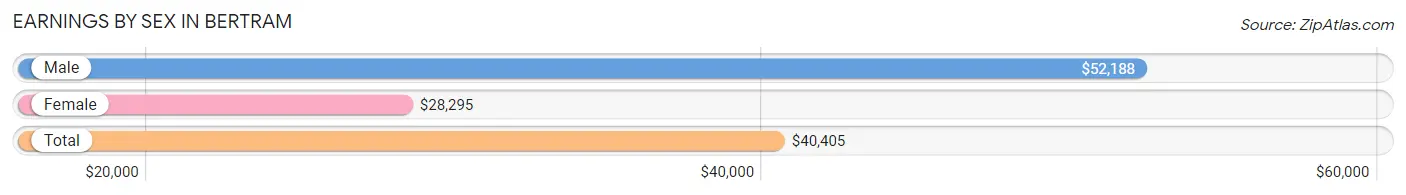
Earnings by Sex in Bertram
Average Earnings in Bertram are $40,405, $52,188 for men and $28,295 for women, a difference of 45.8%.
| Sex | Number | Average Earnings |
| Male | 479 (52.7%) | $52,188 |
| Female | 429 (47.2%) | $28,295 |
| Total | 908 (100.0%) | $40,405 |
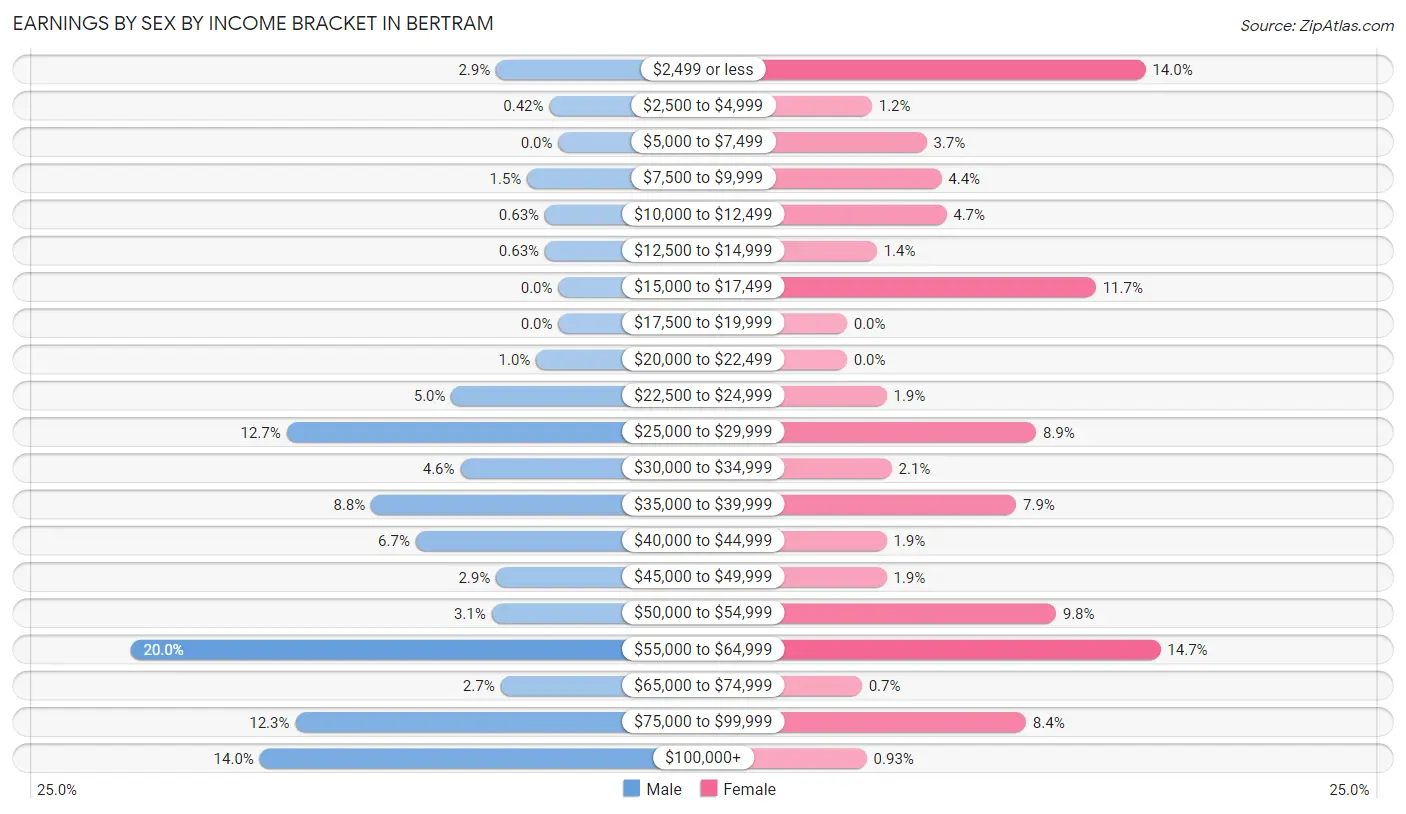
Earnings by Sex by Income Bracket in Bertram
The most common earnings brackets in Bertram are $55,000 to $64,999 for men (96 | 20.0%) and $55,000 to $64,999 for women (63 | 14.7%).
| Income | Male | Female |
| $2,499 or less | 14 (2.9%) | 60 (14.0%) |
| $2,500 to $4,999 | 2 (0.4%) | 5 (1.2%) |
| $5,000 to $7,499 | 0 (0.0%) | 16 (3.7%) |
| $7,500 to $9,999 | 7 (1.5%) | 19 (4.4%) |
| $10,000 to $12,499 | 3 (0.6%) | 20 (4.7%) |
| $12,500 to $14,999 | 3 (0.6%) | 6 (1.4%) |
| $15,000 to $17,499 | 0 (0.0%) | 50 (11.7%) |
| $17,500 to $19,999 | 0 (0.0%) | 0 (0.0%) |
| $20,000 to $22,499 | 5 (1.0%) | 0 (0.0%) |
| $22,500 to $24,999 | 24 (5.0%) | 8 (1.9%) |
| $25,000 to $29,999 | 61 (12.7%) | 38 (8.9%) |
| $30,000 to $34,999 | 22 (4.6%) | 9 (2.1%) |
| $35,000 to $39,999 | 42 (8.8%) | 34 (7.9%) |
| $40,000 to $44,999 | 32 (6.7%) | 8 (1.9%) |
| $45,000 to $49,999 | 14 (2.9%) | 8 (1.9%) |
| $50,000 to $54,999 | 15 (3.1%) | 42 (9.8%) |
| $55,000 to $64,999 | 96 (20.0%) | 63 (14.7%) |
| $65,000 to $74,999 | 13 (2.7%) | 3 (0.7%) |
| $75,000 to $99,999 | 59 (12.3%) | 36 (8.4%) |
| $100,000+ | 67 (14.0%) | 4 (0.9%) |
| Total | 479 (100.0%) | 429 (100.0%) |
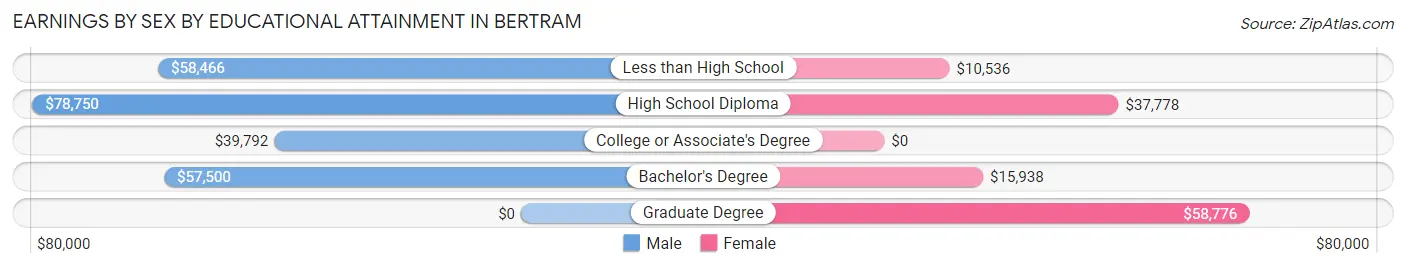
Earnings by Sex by Educational Attainment in Bertram
Average earnings in Bertram are $56,277 for men and $35,650 for women, a difference of 36.6%. Men with an educational attainment of high school diploma enjoy the highest average annual earnings of $78,750, while those with college or associate's degree education earn the least with $39,792. Women with an educational attainment of graduate degree earn the most with the average annual earnings of $58,776, while those with less than high school education have the smallest earnings of $10,536.
| Educational Attainment | Male Income | Female Income |
| Less than High School | $58,466 | $10,536 |
| High School Diploma | $78,750 | $37,778 |
| College or Associate's Degree | $39,792 | $0 |
| Bachelor's Degree | $57,500 | $15,938 |
| Graduate Degree | - | - |
| Total | $56,277 | $35,650 |
Family Income in Bertram
Family Income Brackets in Bertram
According to the Bertram family income data, there are 152 families falling into the $50,000 to $74,999 income range, which is the most common income bracket and makes up 33.8% of all families. Conversely, the $200,000+ income bracket is the least frequent group with only 3 families (0.7%) belonging to this category.

| Income Bracket | # Families | % Families |
| Less than $10,000 | 9 | 2.0% |
| $10,000 to $14,999 | 15 | 3.3% |
| $15,000 to $24,999 | 23 | 5.1% |
| $25,000 to $34,999 | 7 | 1.6% |
| $35,000 to $49,999 | 35 | 7.8% |
| $50,000 to $74,999 | 152 | 33.8% |
| $75,000 to $99,999 | 55 | 12.2% |
| $100,000 to $149,999 | 81 | 18.0% |
| $150,000 to $199,999 | 70 | 15.6% |
| $200,000+ | 3 | 0.7% |
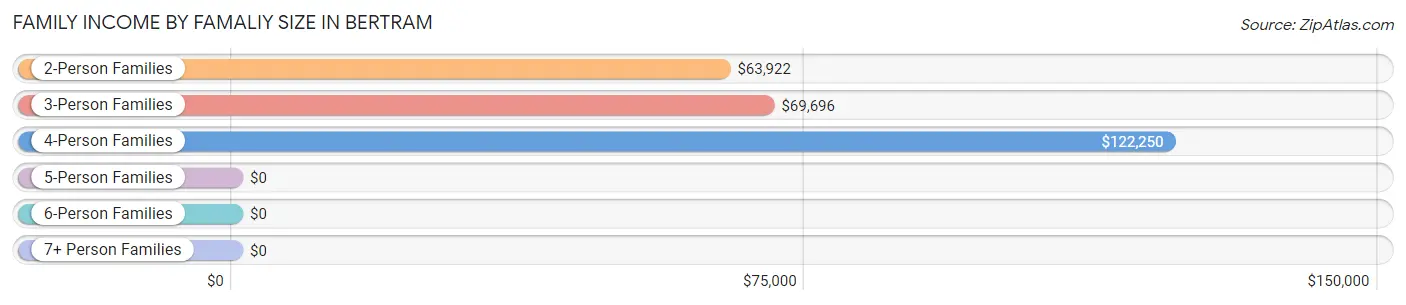
Family Income by Famaliy Size in Bertram
4-person families (57 | 12.7%) account for the highest median family income in Bertram with $122,250 per family, while 2-person families (249 | 55.3%) have the highest median income of $31,961 per family member.
| Income Bracket | # Families | Median Income |
| 2-Person Families | 249 (55.3%) | $63,922 |
| 3-Person Families | 75 (16.7%) | $69,696 |
| 4-Person Families | 57 (12.7%) | $122,250 |
| 5-Person Families | 48 (10.7%) | $0 |
| 6-Person Families | 0 (0.0%) | $0 |
| 7+ Person Families | 21 (4.7%) | $0 |
| Total | 450 (100.0%) | $70,395 |
Family Income by Number of Earners in Bertram
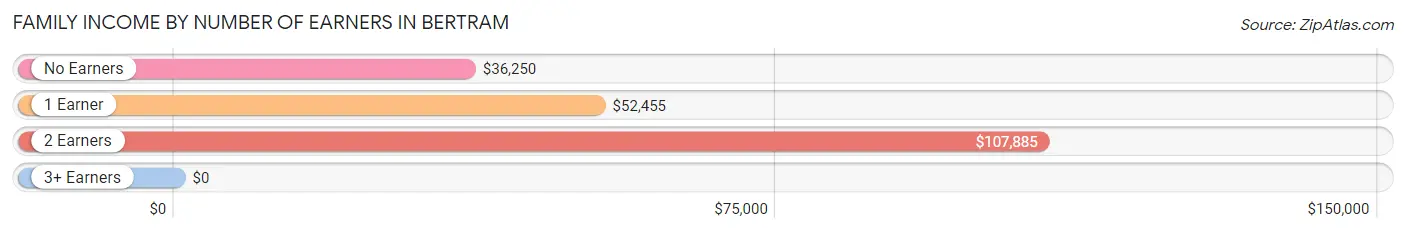
| Number of Earners | # Families | Median Income |
| No Earners | 81 (18.0%) | $36,250 |
| 1 Earner | 113 (25.1%) | $52,455 |
| 2 Earners | 220 (48.9%) | $107,885 |
| 3+ Earners | 36 (8.0%) | $0 |
| Total | 450 (100.0%) | $70,395 |
Household Income in Bertram
Household Income Brackets in Bertram
With 229 households falling in the category, the $50,000 to $74,999 income range is the most frequent in Bertram, accounting for 33.7% of all households. In contrast, only 15 households (2.2%) fall into the $10,000 to $14,999 income bracket, making it the least populous group.
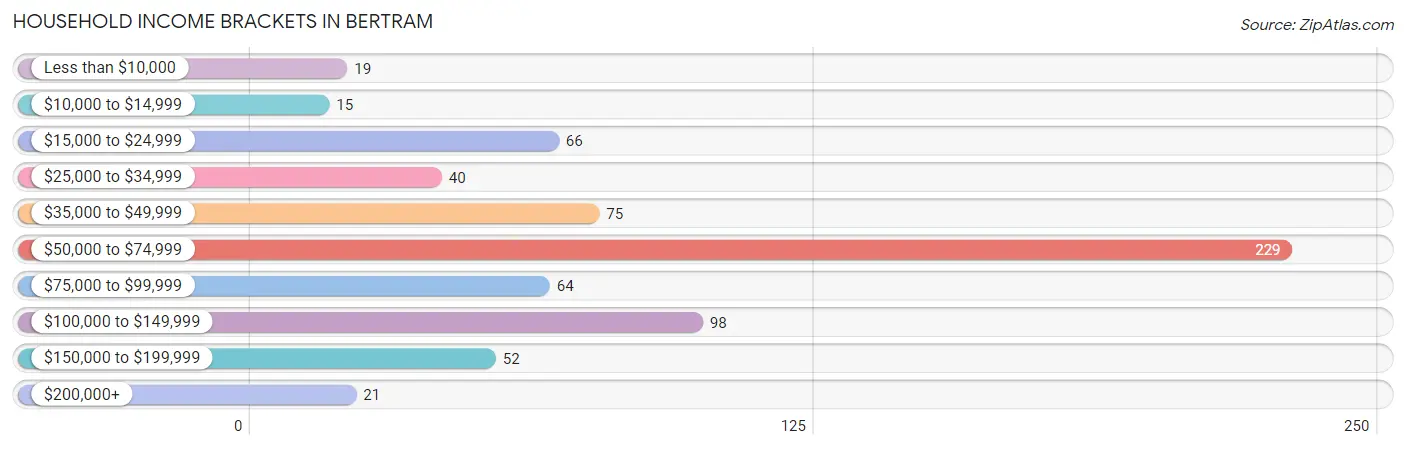
| Income Bracket | # Households | % Households |
| Less than $10,000 | 19 | 2.8% |
| $10,000 to $14,999 | 15 | 2.2% |
| $15,000 to $24,999 | 66 | 9.7% |
| $25,000 to $34,999 | 40 | 5.9% |
| $35,000 to $49,999 | 75 | 11.0% |
| $50,000 to $74,999 | 229 | 33.7% |
| $75,000 to $99,999 | 64 | 9.4% |
| $100,000 to $149,999 | 98 | 14.4% |
| $150,000 to $199,999 | 52 | 7.7% |
| $200,000+ | 21 | 3.1% |
Household Income by Householder Age in Bertram
The median household income in Bertram is $61,688, with the highest median household income of $81,964 found in the 25 to 44 years age bracket for the primary householder. A total of 179 households (26.4%) fall into this category. Meanwhile, the 65+ years age bracket for the primary householder has the lowest median household income of $51,071, with 216 households (31.8%) in this group.
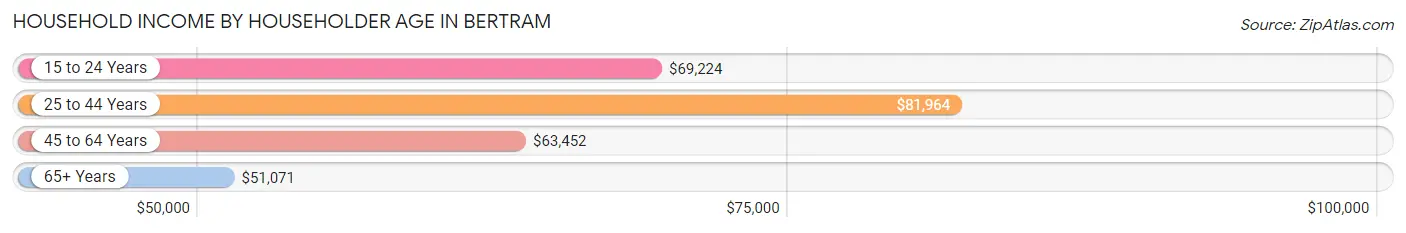
| Income Bracket | # Households | Median Income |
| 15 to 24 Years | 56 (8.3%) | $69,224 |
| 25 to 44 Years | 179 (26.4%) | $81,964 |
| 45 to 64 Years | 228 (33.6%) | $63,452 |
| 65+ Years | 216 (31.8%) | $51,071 |
| Total | 679 (100.0%) | $61,688 |
Poverty in Bertram
Income Below Poverty by Sex and Age in Bertram
With 12.1% poverty level for males and 18.9% for females among the residents of Bertram, 12 to 14 year old males and 15 year old females are the most vulnerable to poverty, with 63 males (73.3%) and 52 females (100.0%) in their respective age groups living below the poverty level.
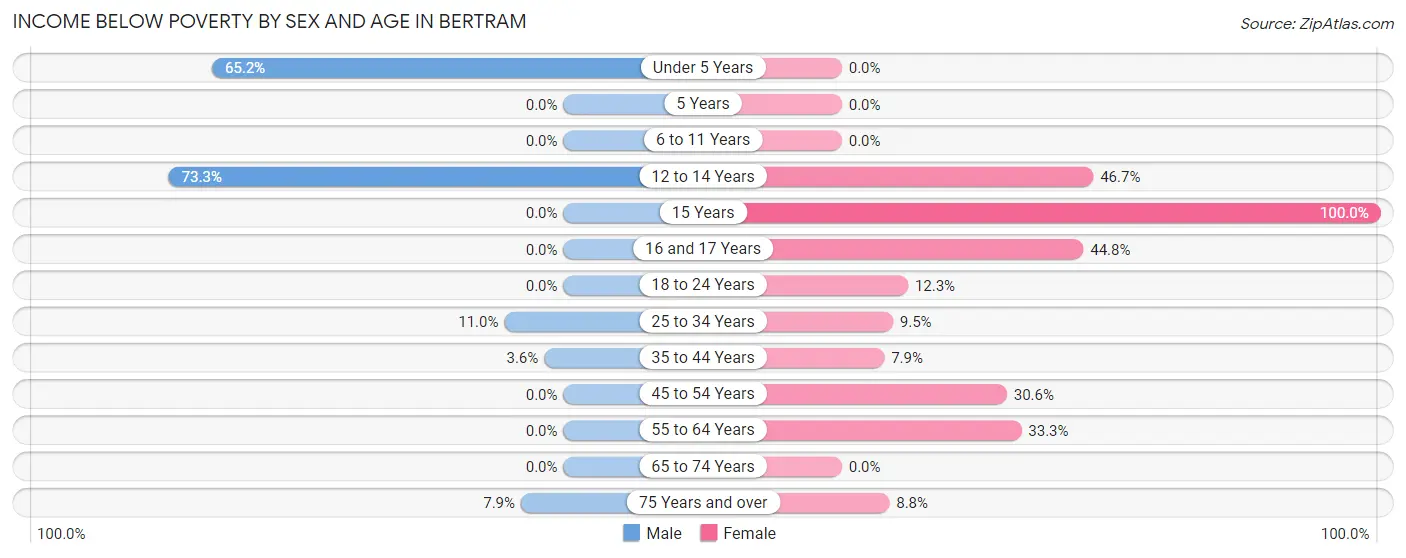
| Age Bracket | Male | Female |
| Under 5 Years | 15 (65.2%) | 0 (0.0%) |
| 5 Years | 0 (0.0%) | 0 (0.0%) |
| 6 to 11 Years | 0 (0.0%) | 0 (0.0%) |
| 12 to 14 Years | 63 (73.3%) | 7 (46.7%) |
| 15 Years | 0 (0.0%) | 52 (100.0%) |
| 16 and 17 Years | 0 (0.0%) | 13 (44.8%) |
| 18 to 24 Years | 0 (0.0%) | 7 (12.3%) |
| 25 to 34 Years | 17 (11.0%) | 9 (9.5%) |
| 35 to 44 Years | 6 (3.6%) | 10 (7.9%) |
| 45 to 54 Years | 0 (0.0%) | 34 (30.6%) |
| 55 to 64 Years | 0 (0.0%) | 30 (33.3%) |
| 65 to 74 Years | 0 (0.0%) | 0 (0.0%) |
| 75 Years and over | 3 (7.9%) | 6 (8.8%) |
| Total | 104 (12.1%) | 168 (18.9%) |
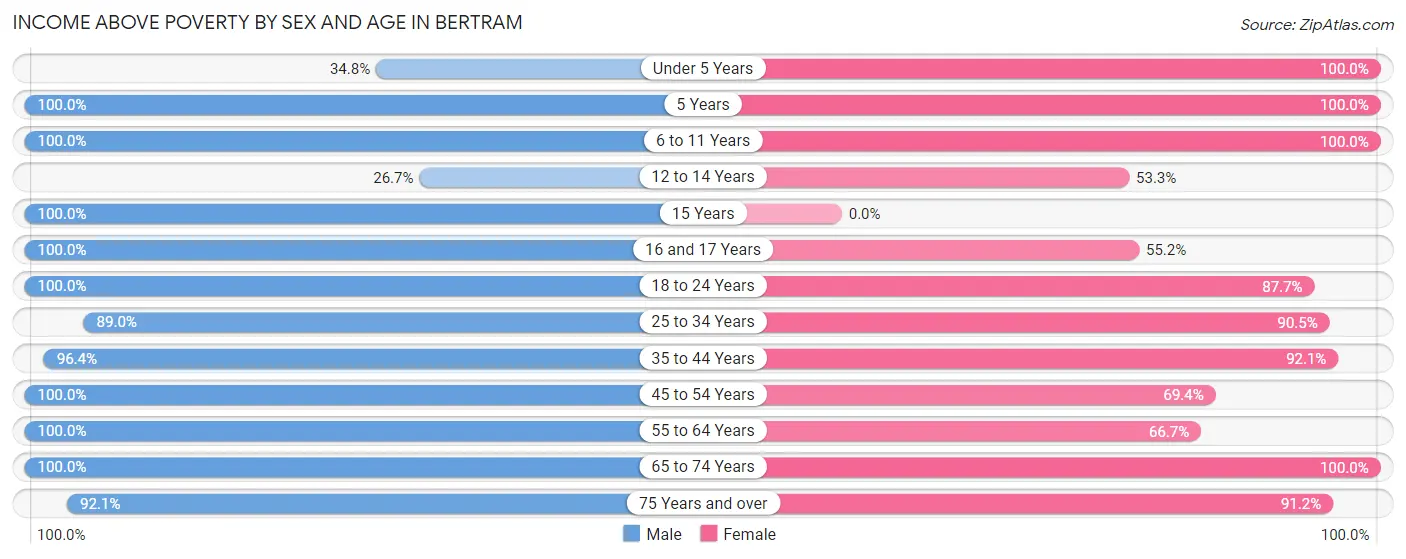
Income Above Poverty by Sex and Age in Bertram
According to the poverty statistics in Bertram, males aged 5 years and females aged under 5 years are the age groups that are most secure financially, with 100.0% of males and 100.0% of females in these age groups living above the poverty line.
| Age Bracket | Male | Female |
| Under 5 Years | 8 (34.8%) | 39 (100.0%) |
| 5 Years | 16 (100.0%) | 4 (100.0%) |
| 6 to 11 Years | 23 (100.0%) | 51 (100.0%) |
| 12 to 14 Years | 23 (26.7%) | 8 (53.3%) |
| 15 Years | 17 (100.0%) | 0 (0.0%) |
| 16 and 17 Years | 21 (100.0%) | 16 (55.2%) |
| 18 to 24 Years | 85 (100.0%) | 50 (87.7%) |
| 25 to 34 Years | 138 (89.0%) | 86 (90.5%) |
| 35 to 44 Years | 162 (96.4%) | 117 (92.1%) |
| 45 to 54 Years | 109 (100.0%) | 77 (69.4%) |
| 55 to 64 Years | 38 (100.0%) | 60 (66.7%) |
| 65 to 74 Years | 83 (100.0%) | 150 (100.0%) |
| 75 Years and over | 35 (92.1%) | 62 (91.2%) |
| Total | 758 (87.9%) | 720 (81.1%) |
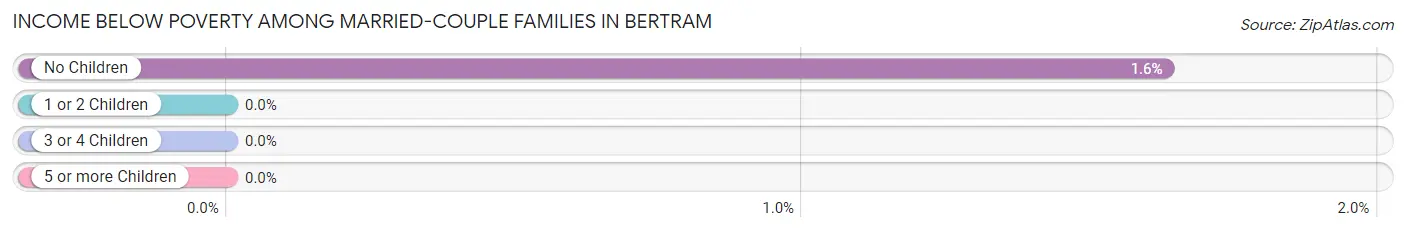
Income Below Poverty Among Married-Couple Families in Bertram
The poverty statistics for married-couple families in Bertram show that 1.0% or 3 of the total 300 families live below the poverty line. Families with no children have the highest poverty rate of 1.6%, comprising of 3 families. On the other hand, families with 1 or 2 children have the lowest poverty rate of 0.0%, which includes 0 families.
| Children | Above Poverty | Below Poverty |
| No Children | 181 (98.4%) | 3 (1.6%) |
| 1 or 2 Children | 92 (100.0%) | 0 (0.0%) |
| 3 or 4 Children | 24 (100.0%) | 0 (0.0%) |
| 5 or more Children | 0 (0.0%) | 0 (0.0%) |
| Total | 297 (99.0%) | 3 (1.0%) |
Income Below Poverty Among Single-Parent Households in Bertram
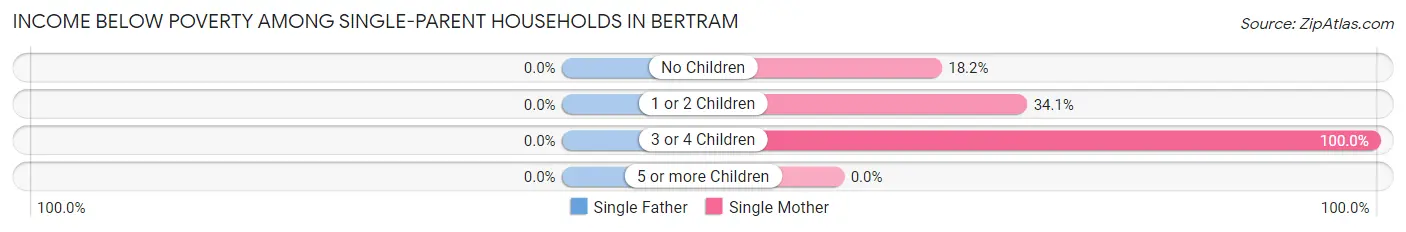
| Children | Single Father | Single Mother |
| No Children | 0 (0.0%) | 4 (18.2%) |
| 1 or 2 Children | 0 (0.0%) | 15 (34.1%) |
| 3 or 4 Children | 0 (0.0%) | 25 (100.0%) |
| 5 or more Children | 0 (0.0%) | 0 (0.0%) |
| Total | 0 (0.0%) | 44 (48.3%) |
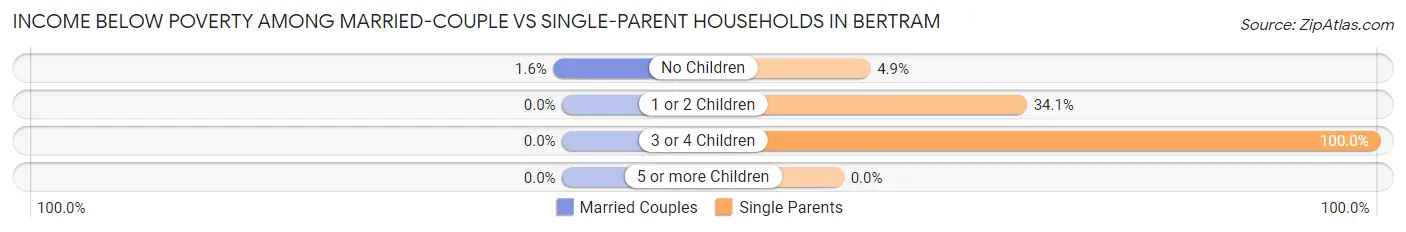
Income Below Poverty Among Married-Couple vs Single-Parent Households in Bertram
The poverty data for Bertram shows that 3 of the married-couple family households (1.0%) and 44 of the single-parent households (29.3%) are living below the poverty level. Within the married-couple family households, those with no children have the highest poverty rate, with 3 households (1.6%) falling below the poverty line. Among the single-parent households, those with 3 or 4 children have the highest poverty rate, with 25 household (100.0%) living below poverty.
| Children | Married-Couple Families | Single-Parent Households |
| No Children | 3 (1.6%) | 4 (4.9%) |
| 1 or 2 Children | 0 (0.0%) | 15 (34.1%) |
| 3 or 4 Children | 0 (0.0%) | 25 (100.0%) |
| 5 or more Children | 0 (0.0%) | 0 (0.0%) |
| Total | 3 (1.0%) | 44 (29.3%) |
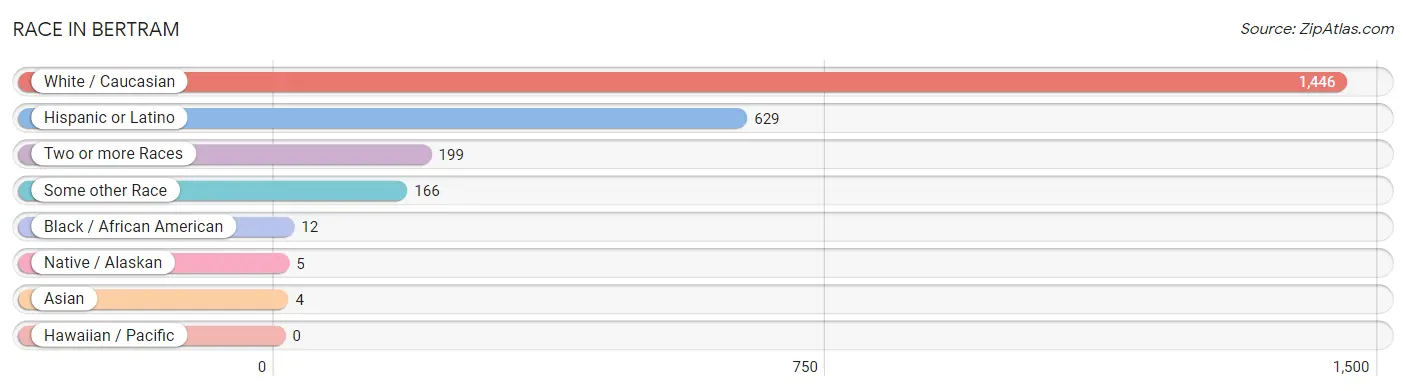
Race in Bertram
The most populous races in Bertram are White / Caucasian (1,446 | 78.9%), Hispanic or Latino (629 | 34.3%), and Two or more Races (199 | 10.9%).
| Race | # Population | % Population |
| Asian | 4 | 0.2% |
| Black / African American | 12 | 0.7% |
| Hawaiian / Pacific | 0 | 0.0% |
| Hispanic or Latino | 629 | 34.3% |
| Native / Alaskan | 5 | 0.3% |
| White / Caucasian | 1,446 | 78.9% |
| Two or more Races | 199 | 10.9% |
| Some other Race | 166 | 9.1% |
| Total | 1,832 | 100.0% |
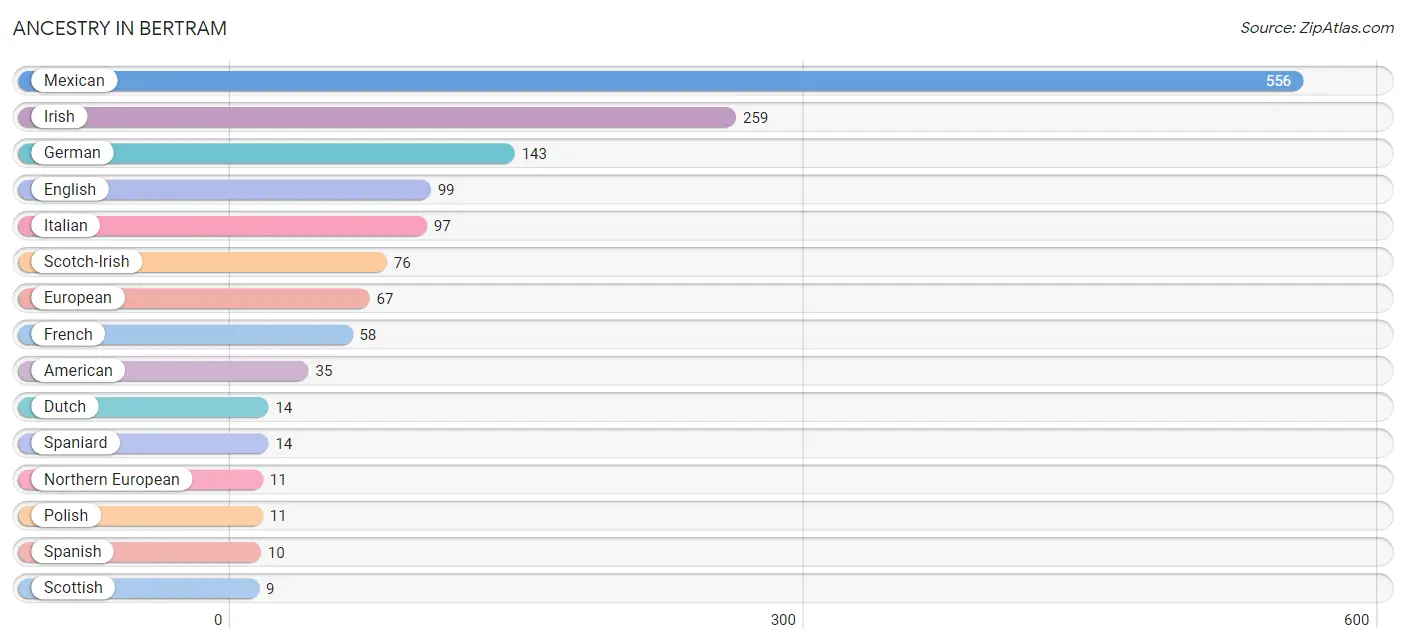
Ancestry in Bertram
The most populous ancestries reported in Bertram are Mexican (556 | 30.3%), Irish (259 | 14.1%), German (143 | 7.8%), English (99 | 5.4%), and Italian (97 | 5.3%), together accounting for 63.0% of all Bertram residents.
| Ancestry | # Population | % Population |
| American | 35 | 1.9% |
| Burmese | 4 | 0.2% |
| Cuban | 5 | 0.3% |
| Czech | 5 | 0.3% |
| Dutch | 14 | 0.8% |
| Eastern European | 3 | 0.2% |
| English | 99 | 5.4% |
| European | 67 | 3.7% |
| French | 58 | 3.2% |
| French Canadian | 3 | 0.2% |
| German | 143 | 7.8% |
| Greek | 3 | 0.2% |
| Hungarian | 3 | 0.2% |
| Irish | 259 | 14.1% |
| Italian | 97 | 5.3% |
| Mexican | 556 | 30.3% |
| Northern European | 11 | 0.6% |
| Norwegian | 2 | 0.1% |
| Polish | 11 | 0.6% |
| Scotch-Irish | 76 | 4.2% |
| Scottish | 9 | 0.5% |
| Slovak | 8 | 0.4% |
| Spaniard | 14 | 0.8% |
| Spanish | 10 | 0.5% |
| Spanish American | 2 | 0.1% |
| Swiss | 2 | 0.1% |
| Ukrainian | 5 | 0.3% |
| Welsh | 5 | 0.3% | View All 28 Rows |
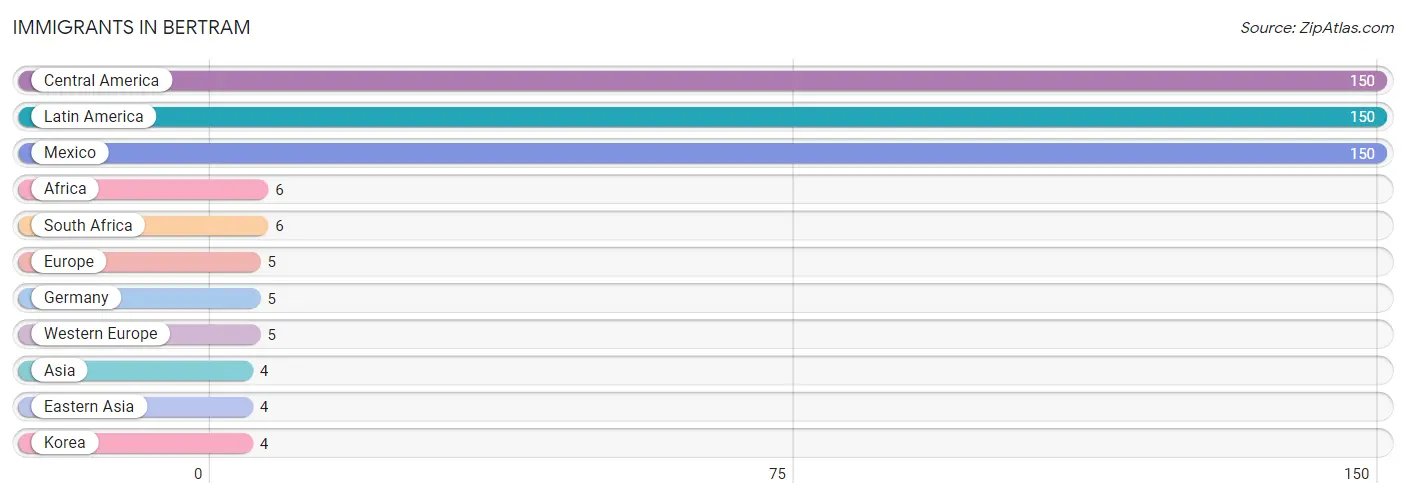
Immigrants in Bertram
The most numerous immigrant groups reported in Bertram came from Central America (150 | 8.2%), Latin America (150 | 8.2%), Mexico (150 | 8.2%), Africa (6 | 0.3%), and South Africa (6 | 0.3%), together accounting for 25.2% of all Bertram residents.
| Immigration Origin | # Population | % Population |
| Africa | 6 | 0.3% |
| Asia | 4 | 0.2% |
| Central America | 150 | 8.2% |
| Eastern Asia | 4 | 0.2% |
| Europe | 5 | 0.3% |
| Germany | 5 | 0.3% |
| Korea | 4 | 0.2% |
| Latin America | 150 | 8.2% |
| Mexico | 150 | 8.2% |
| South Africa | 6 | 0.3% |
| Western Europe | 5 | 0.3% | View All 11 Rows |
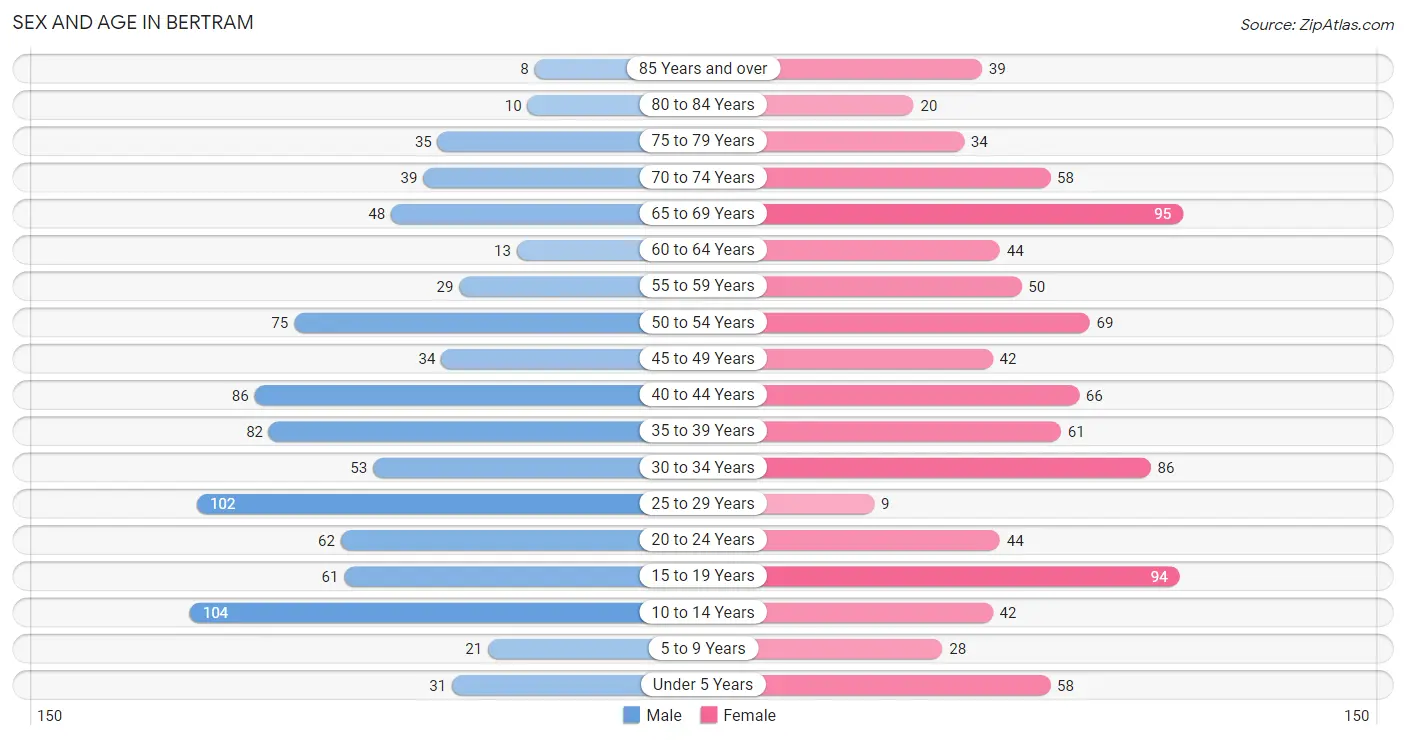
Sex and Age in Bertram
Sex and Age in Bertram
The most populous age groups in Bertram are 10 to 14 Years (104 | 11.7%) for men and 65 to 69 Years (95 | 10.1%) for women.
| Age Bracket | Male | Female |
| Under 5 Years | 31 (3.5%) | 58 (6.2%) |
| 5 to 9 Years | 21 (2.4%) | 28 (3.0%) |
| 10 to 14 Years | 104 (11.7%) | 42 (4.5%) |
| 15 to 19 Years | 61 (6.8%) | 94 (10.0%) |
| 20 to 24 Years | 62 (6.9%) | 44 (4.7%) |
| 25 to 29 Years | 102 (11.4%) | 9 (1.0%) |
| 30 to 34 Years | 53 (5.9%) | 86 (9.2%) |
| 35 to 39 Years | 82 (9.2%) | 61 (6.5%) |
| 40 to 44 Years | 86 (9.6%) | 66 (7.0%) |
| 45 to 49 Years | 34 (3.8%) | 42 (4.5%) |
| 50 to 54 Years | 75 (8.4%) | 69 (7.3%) |
| 55 to 59 Years | 29 (3.3%) | 50 (5.3%) |
| 60 to 64 Years | 13 (1.5%) | 44 (4.7%) |
| 65 to 69 Years | 48 (5.4%) | 95 (10.1%) |
| 70 to 74 Years | 39 (4.4%) | 58 (6.2%) |
| 75 to 79 Years | 35 (3.9%) | 34 (3.6%) |
| 80 to 84 Years | 10 (1.1%) | 20 (2.1%) |
| 85 Years and over | 8 (0.9%) | 39 (4.2%) |
| Total | 893 (100.0%) | 939 (100.0%) |
Families and Households in Bertram
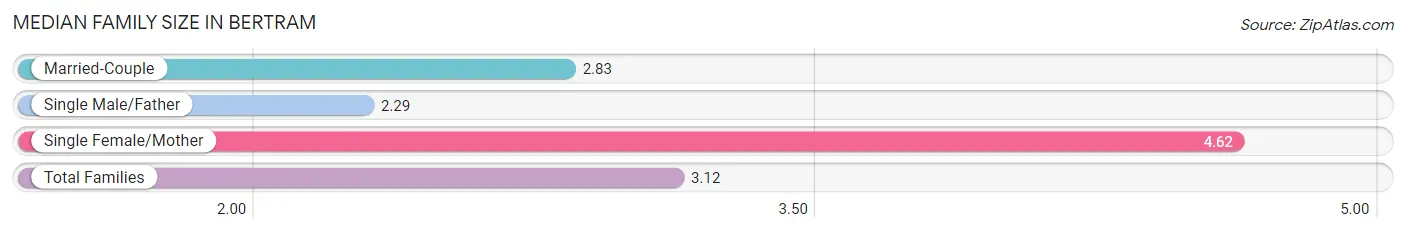
Median Family Size in Bertram
The median family size in Bertram is 3.12 persons per family, with single female/mother families (91 | 20.2%) accounting for the largest median family size of 4.62 persons per family. On the other hand, single male/father families (59 | 13.1%) represent the smallest median family size with 2.29 persons per family.
| Family Type | # Families | Family Size |
| Married-Couple | 300 (66.7%) | 2.83 |
| Single Male/Father | 59 (13.1%) | 2.29 |
| Single Female/Mother | 91 (20.2%) | 4.62 |
| Total Families | 450 (100.0%) | 3.12 |
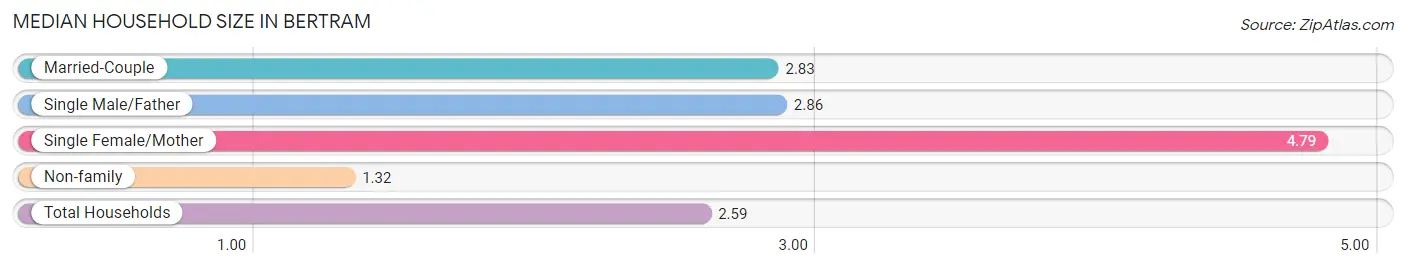
Median Household Size in Bertram
The median household size in Bertram is 2.59 persons per household, with single female/mother households (91 | 13.4%) accounting for the largest median household size of 4.79 persons per household. non-family households (229 | 33.7%) represent the smallest median household size with 1.32 persons per household.
| Household Type | # Households | Household Size |
| Married-Couple | 300 (44.2%) | 2.83 |
| Single Male/Father | 59 (8.7%) | 2.86 |
| Single Female/Mother | 91 (13.4%) | 4.79 |
| Non-family | 229 (33.7%) | 1.32 |
| Total Households | 679 (100.0%) | 2.59 |
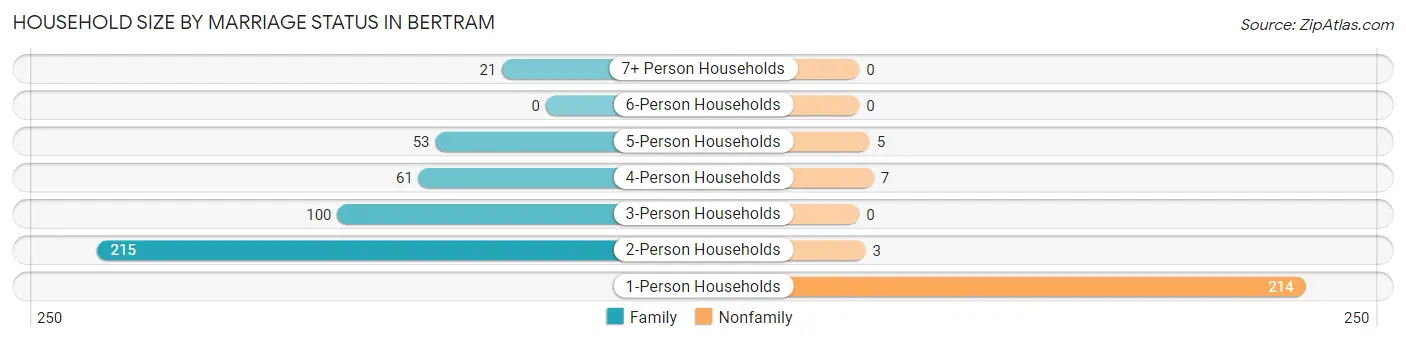
Household Size by Marriage Status in Bertram
Out of a total of 679 households in Bertram, 450 (66.3%) are family households, while 229 (33.7%) are nonfamily households. The most numerous type of family households are 2-person households, comprising 215, and the most common type of nonfamily households are 1-person households, comprising 214.
| Household Size | Family Households | Nonfamily Households |
| 1-Person Households | - | 214 (31.5%) |
| 2-Person Households | 215 (31.7%) | 3 (0.4%) |
| 3-Person Households | 100 (14.7%) | 0 (0.0%) |
| 4-Person Households | 61 (9.0%) | 7 (1.0%) |
| 5-Person Households | 53 (7.8%) | 5 (0.7%) |
| 6-Person Households | 0 (0.0%) | 0 (0.0%) |
| 7+ Person Households | 21 (3.1%) | 0 (0.0%) |
| Total | 450 (66.3%) | 229 (33.7%) |
Female Fertility in Bertram
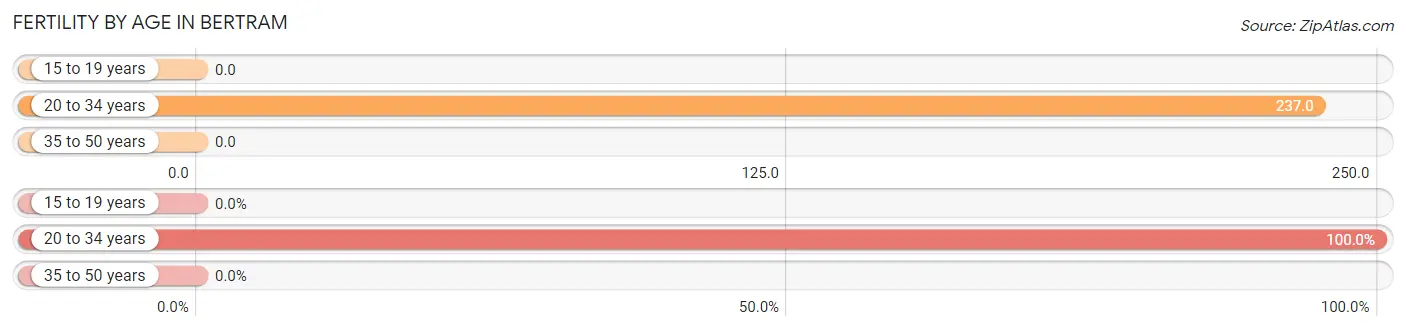
Fertility by Age in Bertram
Average fertility rate in Bertram is 79.0 births per 1,000 women. Women in the age bracket of 20 to 34 years have the highest fertility rate with 237.0 births per 1,000 women. Women in the age bracket of 20 to 34 years acount for 100.0% of all women with births.
| Age Bracket | Women with Births | Births / 1,000 Women |
| 15 to 19 years | 0 (0.0%) | 0.0 |
| 20 to 34 years | 33 (100.0%) | 237.0 |
| 35 to 50 years | 0 (0.0%) | 0.0 |
| Total | 33 (100.0%) | 79.0 |
Fertility by Age by Marriage Status in Bertram
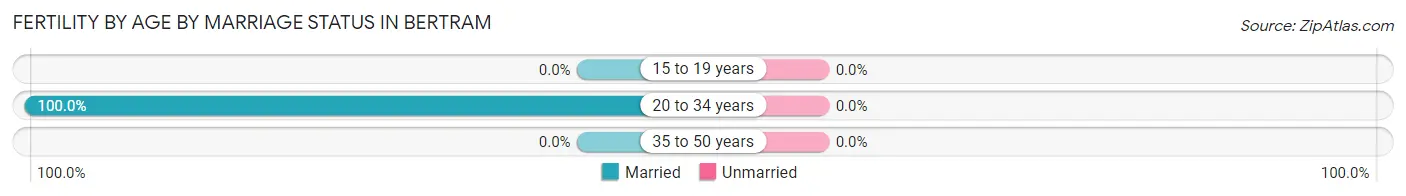
| Age Bracket | Married | Unmarried |
| 15 to 19 years | 0 (0.0%) | 0 (0.0%) |
| 20 to 34 years | 33 (100.0%) | 0 (0.0%) |
| 35 to 50 years | 0 (0.0%) | 0 (0.0%) |
| Total | 33 (100.0%) | 0 (0.0%) |
Fertility by Education in Bertram
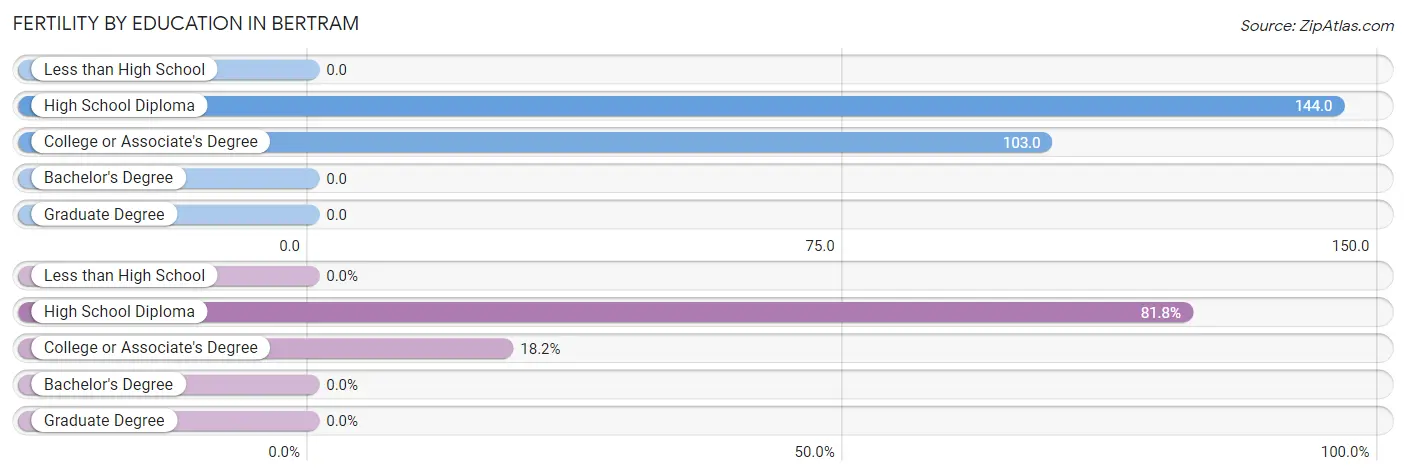
| Educational Attainment | Women with Births | Births / 1,000 Women |
| Less than High School | 0 (0.0%) | 0.0 |
| High School Diploma | 27 (81.8%) | 144.0 |
| College or Associate's Degree | 6 (18.2%) | 103.0 |
| Bachelor's Degree | 0 (0.0%) | 0.0 |
| Graduate Degree | 0 (0.0%) | 0.0 |
| Total | 33 (100.0%) | 79.0 |
Fertility by Education by Marriage Status in Bertram
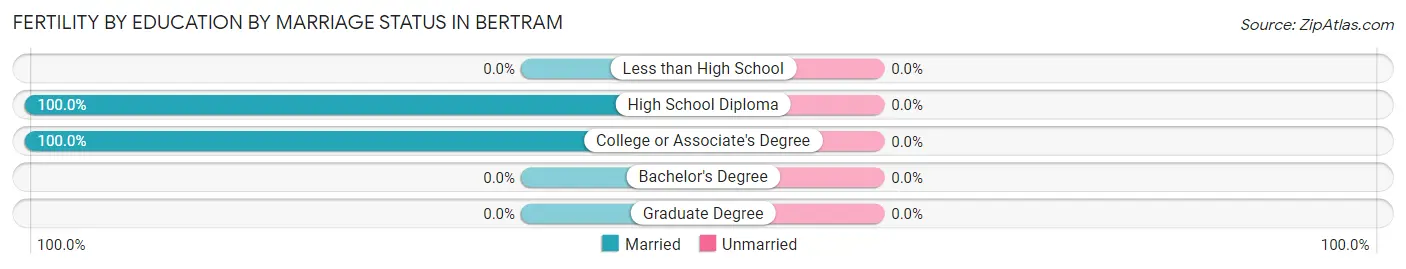
| Educational Attainment | Married | Unmarried |
| Less than High School | 0 (0.0%) | 0 (0.0%) |
| High School Diploma | 27 (100.0%) | 0 (0.0%) |
| College or Associate's Degree | 6 (100.0%) | 0 (0.0%) |
| Bachelor's Degree | 0 (0.0%) | 0 (0.0%) |
| Graduate Degree | 0 (0.0%) | 0 (0.0%) |
| Total | 33 (100.0%) | 0 (0.0%) |
Employment Characteristics in Bertram
Employment by Class of Employer in Bertram
Among the 798 employed individuals in Bertram, private company employees (499 | 62.5%), local government employees (120 | 15.0%), and self-employed (not incorporated) (72 | 9.0%) make up the most common classes of employment.
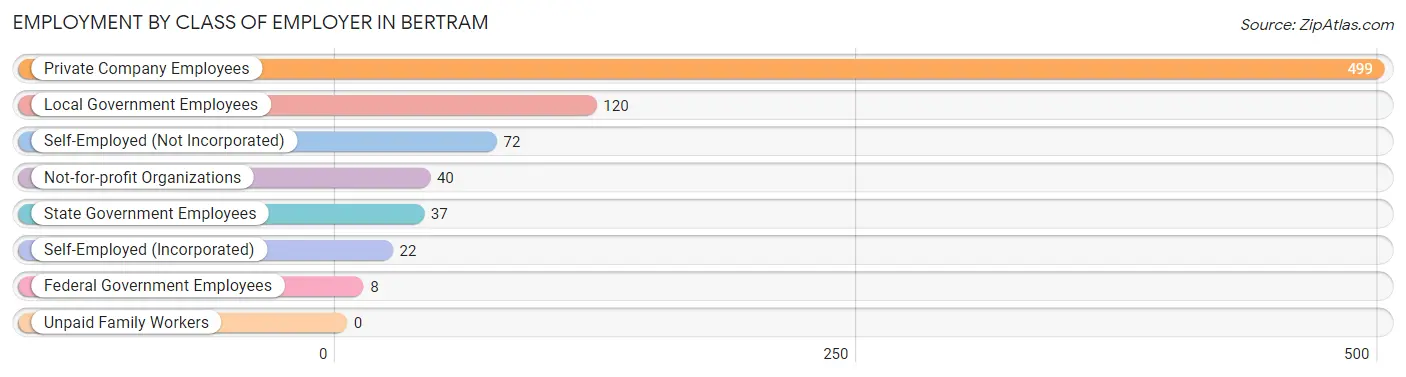
| Employer Class | # Employees | % Employees |
| Private Company Employees | 499 | 62.5% |
| Self-Employed (Incorporated) | 22 | 2.8% |
| Self-Employed (Not Incorporated) | 72 | 9.0% |
| Not-for-profit Organizations | 40 | 5.0% |
| Local Government Employees | 120 | 15.0% |
| State Government Employees | 37 | 4.6% |
| Federal Government Employees | 8 | 1.0% |
| Unpaid Family Workers | 0 | 0.0% |
| Total | 798 | 100.0% |
Employment Status by Age in Bertram
According to the labor force statistics for Bertram, out of the total population over 16 years of age (1,479), 58.3% or 862 individuals are in the labor force, with 5.3% or 46 of them unemployed. The age group with the highest labor force participation rate is 30 to 34 years, with 92.8% or 129 individuals in the labor force. Within the labor force, the 30 to 34 years age range has the highest percentage of unemployed individuals, with 14.7% or 19 of them being unemployed.
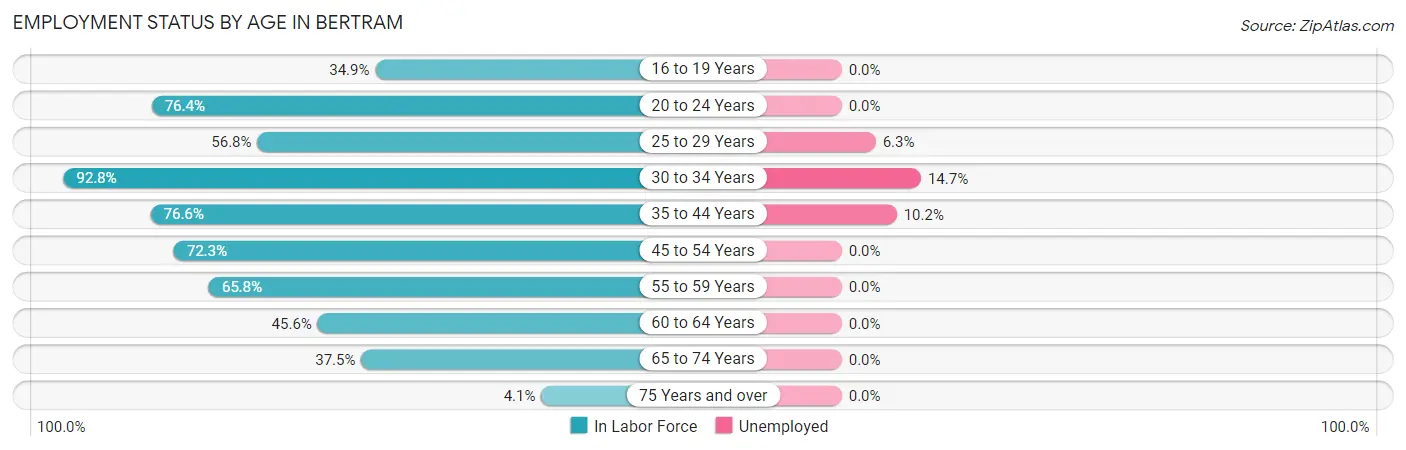
| Age Bracket | In Labor Force | Unemployed |
| 16 to 19 Years | 30 (34.9%) | 0 (0.0%) |
| 20 to 24 Years | 81 (76.4%) | 0 (0.0%) |
| 25 to 29 Years | 63 (56.8%) | 4 (6.3%) |
| 30 to 34 Years | 129 (92.8%) | 19 (14.7%) |
| 35 to 44 Years | 226 (76.6%) | 23 (10.2%) |
| 45 to 54 Years | 159 (72.3%) | 0 (0.0%) |
| 55 to 59 Years | 52 (65.8%) | 0 (0.0%) |
| 60 to 64 Years | 26 (45.6%) | 0 (0.0%) |
| 65 to 74 Years | 90 (37.5%) | 0 (0.0%) |
| 75 Years and over | 6 (4.1%) | 0 (0.0%) |
| Total | 862 (58.3%) | 46 (5.3%) |
Employment Status by Educational Attainment in Bertram
According to labor force statistics for Bertram, 72.7% of individuals (655) out of the total population between 25 and 64 years of age (901) are in the labor force, with 7.0% or 46 of them being unemployed. The group with the highest labor force participation rate are those with the educational attainment of bachelor's degree or higher, with 88.9% or 112 individuals in the labor force. Within the labor force, individuals with less than high school education have the highest percentage of unemployment, with 19.8% or 23 of them being unemployed.
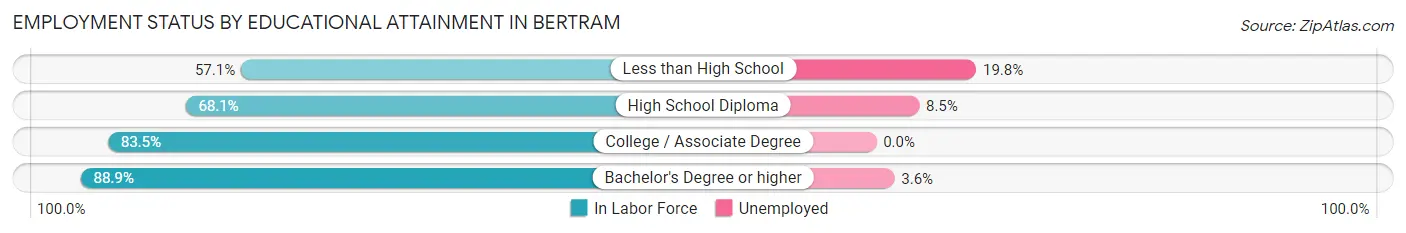
| Educational Attainment | In Labor Force | Unemployed |
| Less than High School | 116 (57.1%) | 40 (19.8%) |
| High School Diploma | 224 (68.1%) | 28 (8.5%) |
| College / Associate Degree | 203 (83.5%) | 0 (0.0%) |
| Bachelor's Degree or higher | 112 (88.9%) | 5 (3.6%) |
| Total | 655 (72.7%) | 63 (7.0%) |
Employment Occupations by Sex in Bertram
Management, Business, Science and Arts Occupations
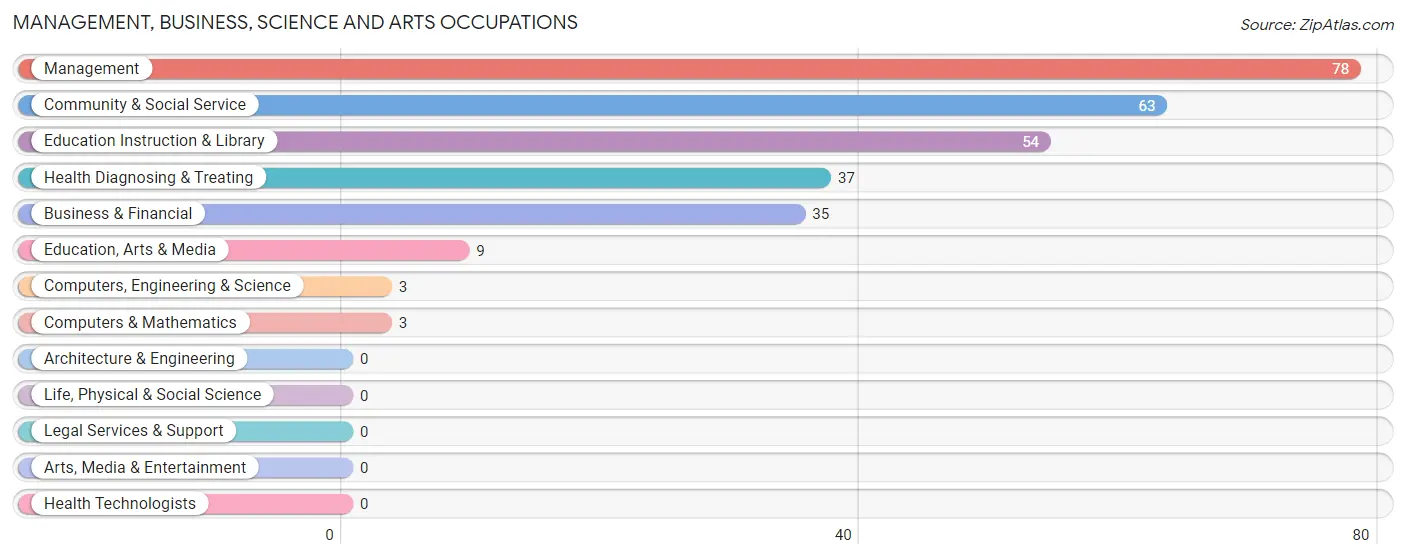
The most common Management, Business, Science and Arts occupations in Bertram are Management (78 | 9.6%), Community & Social Service (63 | 7.7%), Education Instruction & Library (54 | 6.6%), Health Diagnosing & Treating (37 | 4.5%), and Business & Financial (35 | 4.3%).
Management, Business, Science and Arts Occupations by Sex
Within the Management, Business, Science and Arts occupations in Bertram, the most male-oriented occupations are Computers, Engineering & Science (100.0%), Computers & Mathematics (100.0%), and Management (64.1%), while the most female-oriented occupations are Education, Arts & Media (100.0%), Health Diagnosing & Treating (100.0%), and Business & Financial (94.3%).
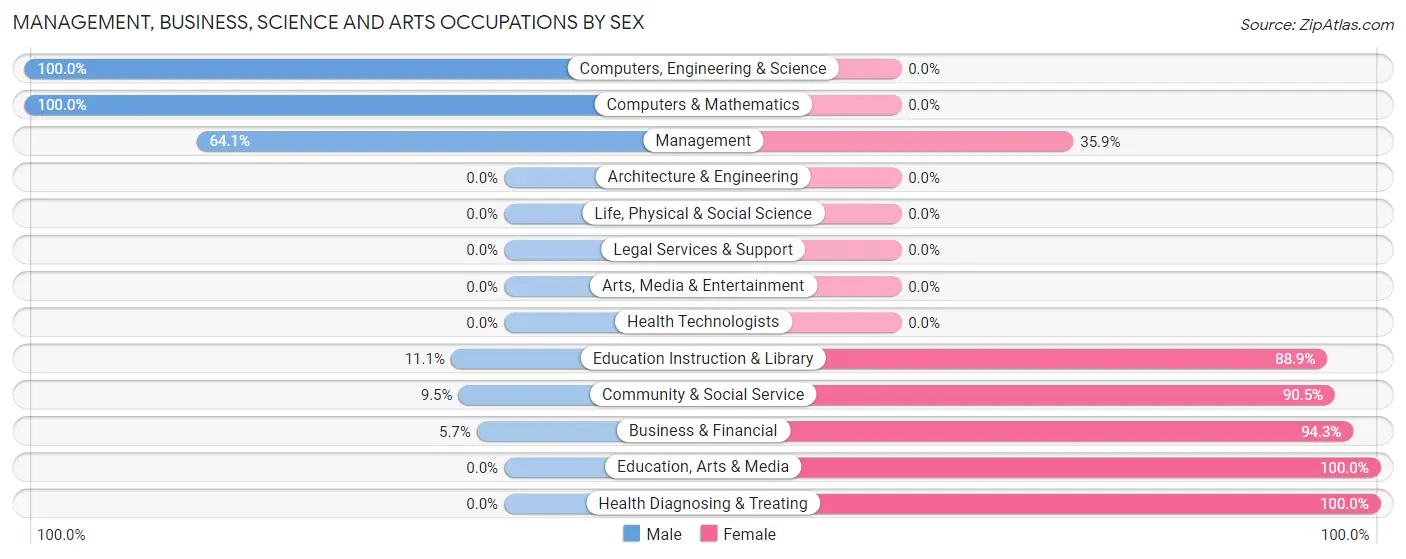
| Occupation | Male | Female |
| Management | 50 (64.1%) | 28 (35.9%) |
| Business & Financial | 2 (5.7%) | 33 (94.3%) |
| Computers, Engineering & Science | 3 (100.0%) | 0 (0.0%) |
| Computers & Mathematics | 3 (100.0%) | 0 (0.0%) |
| Architecture & Engineering | 0 (0.0%) | 0 (0.0%) |
| Life, Physical & Social Science | 0 (0.0%) | 0 (0.0%) |
| Community & Social Service | 6 (9.5%) | 57 (90.5%) |
| Education, Arts & Media | 0 (0.0%) | 9 (100.0%) |
| Legal Services & Support | 0 (0.0%) | 0 (0.0%) |
| Education Instruction & Library | 6 (11.1%) | 48 (88.9%) |
| Arts, Media & Entertainment | 0 (0.0%) | 0 (0.0%) |
| Health Diagnosing & Treating | 0 (0.0%) | 37 (100.0%) |
| Health Technologists | 0 (0.0%) | 0 (0.0%) |
| Total (Category) | 61 (28.2%) | 155 (71.8%) |
| Total (Overall) | 462 (56.6%) | 354 (43.4%) |
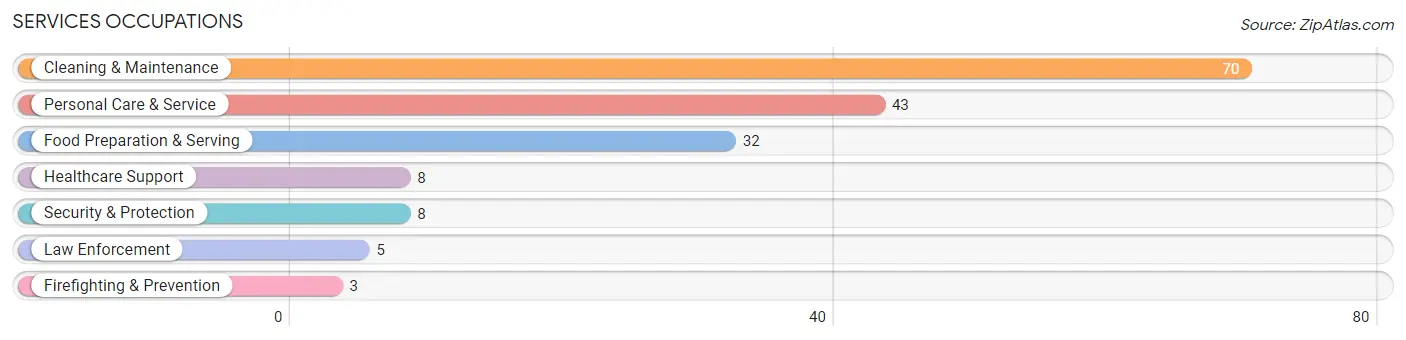
Services Occupations
The most common Services occupations in Bertram are Cleaning & Maintenance (70 | 8.6%), Personal Care & Service (43 | 5.3%), Food Preparation & Serving (32 | 3.9%), Healthcare Support (8 | 1.0%), and Security & Protection (8 | 1.0%).
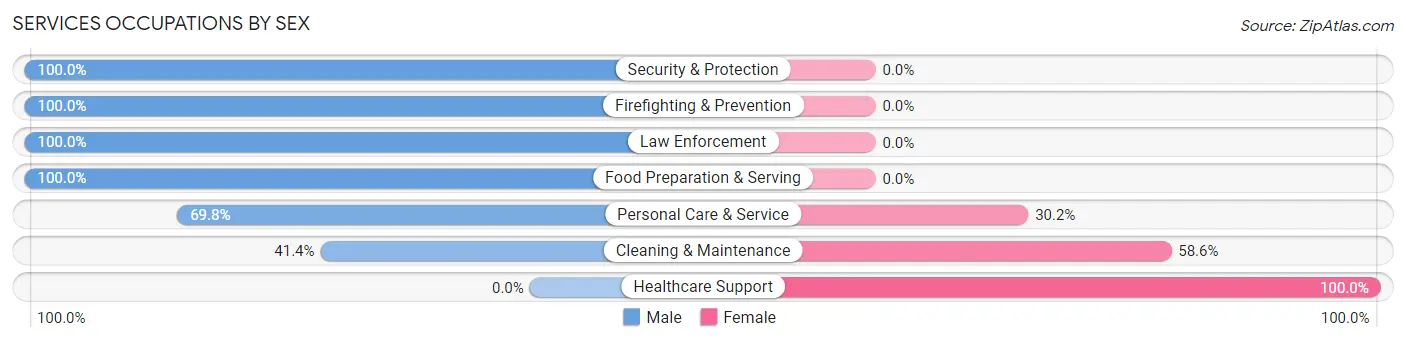
Services Occupations by Sex
Within the Services occupations in Bertram, the most male-oriented occupations are Security & Protection (100.0%), Firefighting & Prevention (100.0%), and Law Enforcement (100.0%), while the most female-oriented occupations are Healthcare Support (100.0%), Cleaning & Maintenance (58.6%), and Personal Care & Service (30.2%).
| Occupation | Male | Female |
| Healthcare Support | 0 (0.0%) | 8 (100.0%) |
| Security & Protection | 8 (100.0%) | 0 (0.0%) |
| Firefighting & Prevention | 3 (100.0%) | 0 (0.0%) |
| Law Enforcement | 5 (100.0%) | 0 (0.0%) |
| Food Preparation & Serving | 32 (100.0%) | 0 (0.0%) |
| Cleaning & Maintenance | 29 (41.4%) | 41 (58.6%) |
| Personal Care & Service | 30 (69.8%) | 13 (30.2%) |
| Total (Category) | 99 (61.5%) | 62 (38.5%) |
| Total (Overall) | 462 (56.6%) | 354 (43.4%) |
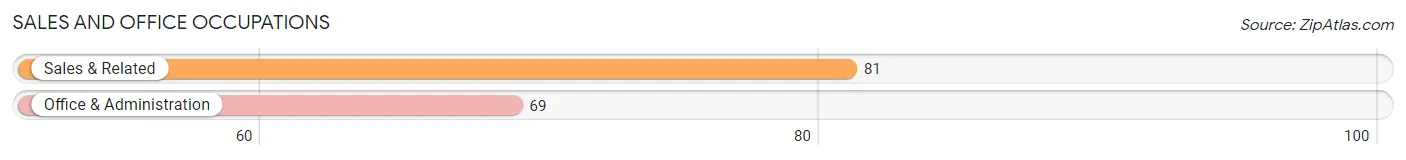
Sales and Office Occupations
The most common Sales and Office occupations in Bertram are Sales & Related (81 | 9.9%), and Office & Administration (69 | 8.5%).
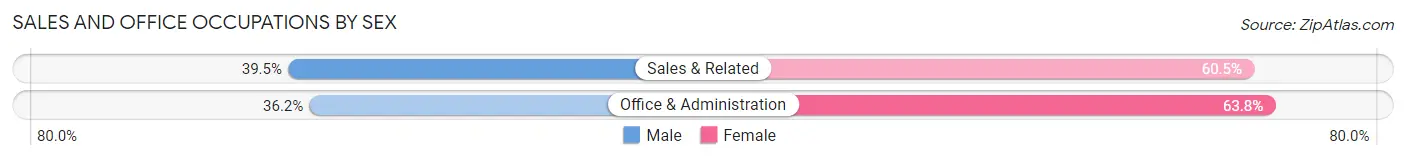
Sales and Office Occupations by Sex
| Occupation | Male | Female |
| Sales & Related | 32 (39.5%) | 49 (60.5%) |
| Office & Administration | 25 (36.2%) | 44 (63.8%) |
| Total (Category) | 57 (38.0%) | 93 (62.0%) |
| Total (Overall) | 462 (56.6%) | 354 (43.4%) |
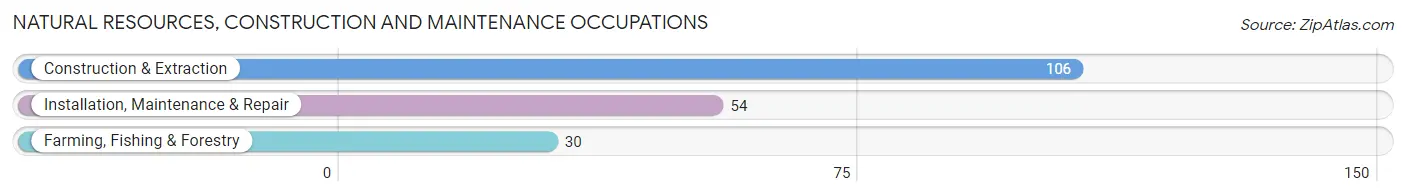
Natural Resources, Construction and Maintenance Occupations
The most common Natural Resources, Construction and Maintenance occupations in Bertram are Construction & Extraction (106 | 13.0%), Installation, Maintenance & Repair (54 | 6.6%), and Farming, Fishing & Forestry (30 | 3.7%).
Natural Resources, Construction and Maintenance Occupations by Sex
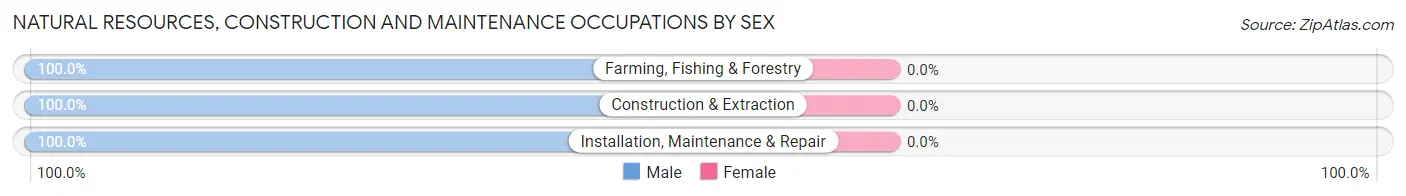
| Occupation | Male | Female |
| Farming, Fishing & Forestry | 30 (100.0%) | 0 (0.0%) |
| Construction & Extraction | 106 (100.0%) | 0 (0.0%) |
| Installation, Maintenance & Repair | 54 (100.0%) | 0 (0.0%) |
| Total (Category) | 190 (100.0%) | 0 (0.0%) |
| Total (Overall) | 462 (56.6%) | 354 (43.4%) |
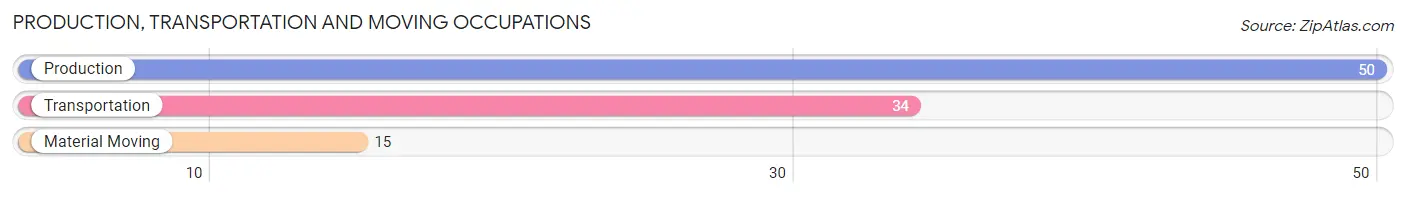
Production, Transportation and Moving Occupations
The most common Production, Transportation and Moving occupations in Bertram are Production (50 | 6.1%), Transportation (34 | 4.2%), and Material Moving (15 | 1.8%).
Production, Transportation and Moving Occupations by Sex
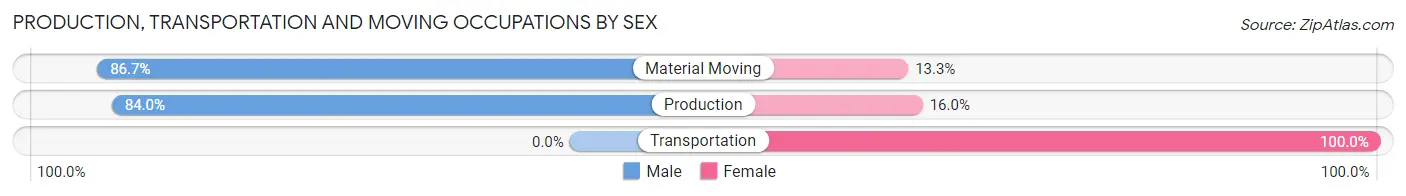
| Occupation | Male | Female |
| Production | 42 (84.0%) | 8 (16.0%) |
| Transportation | 0 (0.0%) | 34 (100.0%) |
| Material Moving | 13 (86.7%) | 2 (13.3%) |
| Total (Category) | 55 (55.6%) | 44 (44.4%) |
| Total (Overall) | 462 (56.6%) | 354 (43.4%) |
Employment Industries by Sex in Bertram
Employment Industries in Bertram
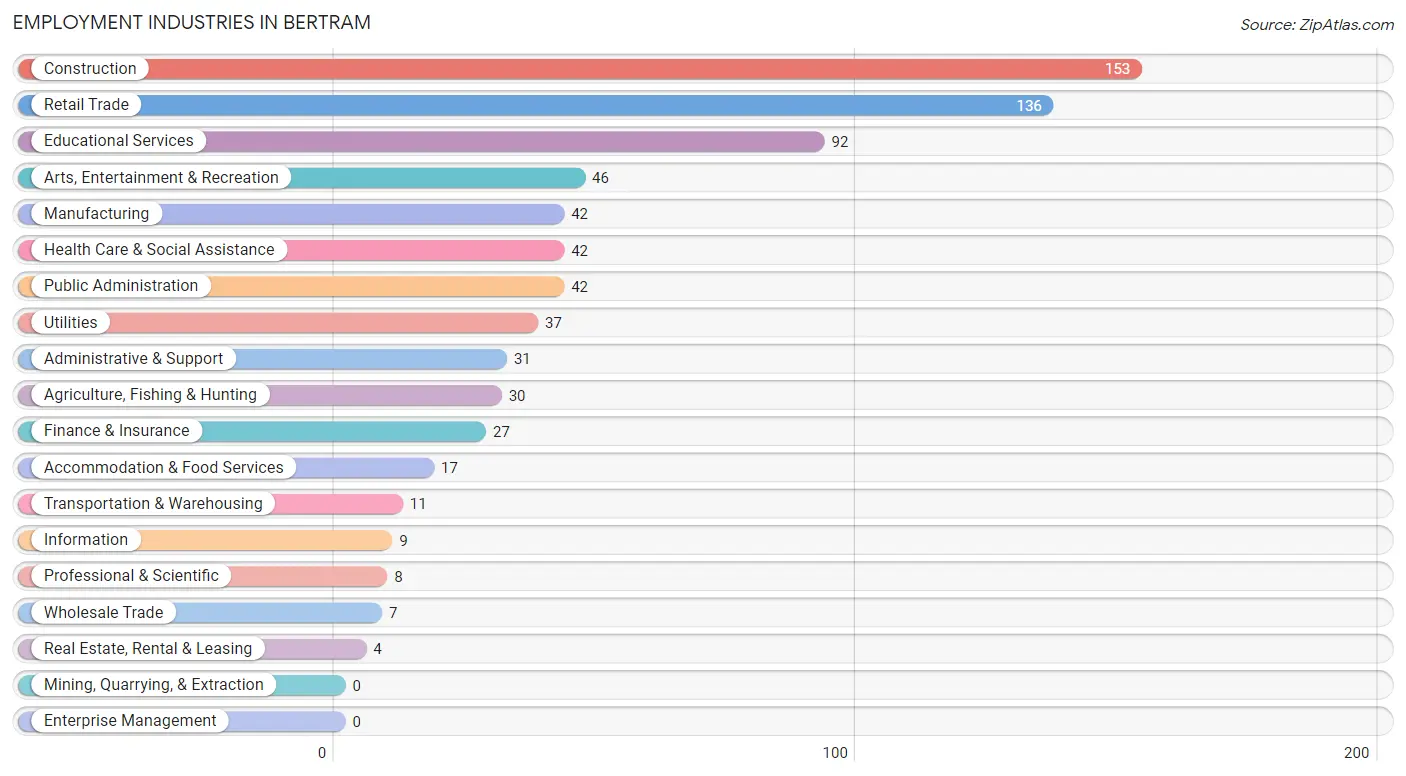
The major employment industries in Bertram include Construction (153 | 18.8%), Retail Trade (136 | 16.7%), Educational Services (92 | 11.3%), Arts, Entertainment & Recreation (46 | 5.6%), and Manufacturing (42 | 5.1%).
Employment Industries by Sex in Bertram
The Bertram industries that see more men than women are Agriculture, Fishing & Hunting (100.0%), Construction (98.7%), and Manufacturing (95.2%), whereas the industries that tend to have a higher number of women are Transportation & Warehousing (100.0%), Real Estate, Rental & Leasing (100.0%), and Professional & Scientific (100.0%).
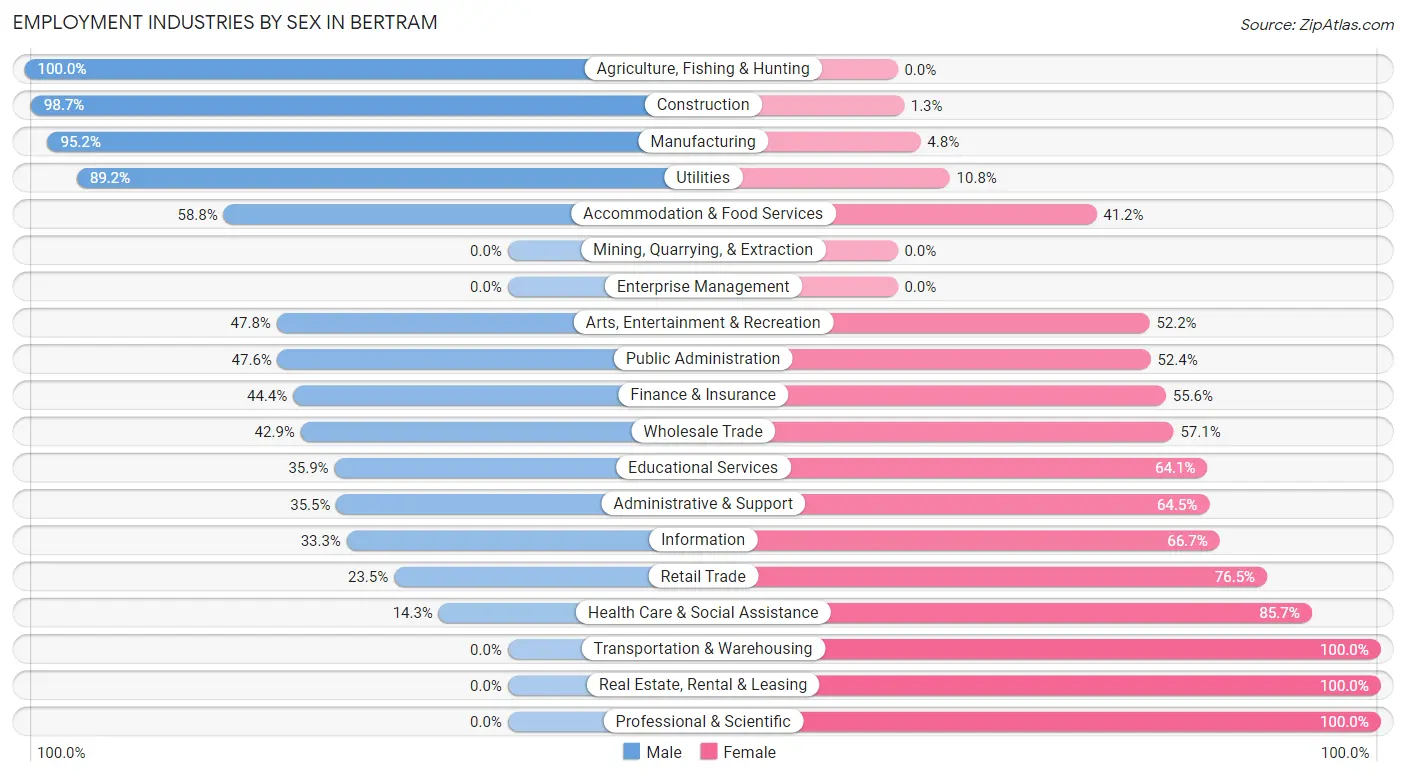
| Industry | Male | Female |
| Agriculture, Fishing & Hunting | 30 (100.0%) | 0 (0.0%) |
| Mining, Quarrying, & Extraction | 0 (0.0%) | 0 (0.0%) |
| Construction | 151 (98.7%) | 2 (1.3%) |
| Manufacturing | 40 (95.2%) | 2 (4.8%) |
| Wholesale Trade | 3 (42.9%) | 4 (57.1%) |
| Retail Trade | 32 (23.5%) | 104 (76.5%) |
| Transportation & Warehousing | 0 (0.0%) | 11 (100.0%) |
| Utilities | 33 (89.2%) | 4 (10.8%) |
| Information | 3 (33.3%) | 6 (66.7%) |
| Finance & Insurance | 12 (44.4%) | 15 (55.6%) |
| Real Estate, Rental & Leasing | 0 (0.0%) | 4 (100.0%) |
| Professional & Scientific | 0 (0.0%) | 8 (100.0%) |
| Enterprise Management | 0 (0.0%) | 0 (0.0%) |
| Administrative & Support | 11 (35.5%) | 20 (64.5%) |
| Educational Services | 33 (35.9%) | 59 (64.1%) |
| Health Care & Social Assistance | 6 (14.3%) | 36 (85.7%) |
| Arts, Entertainment & Recreation | 22 (47.8%) | 24 (52.2%) |
| Accommodation & Food Services | 10 (58.8%) | 7 (41.2%) |
| Public Administration | 20 (47.6%) | 22 (52.4%) |
| Total | 462 (56.6%) | 354 (43.4%) |
Education in Bertram
School Enrollment in Bertram
The most common levels of schooling among the 365 students in Bertram are middle school (159 | 43.6%), high school (82 | 22.5%), and elementary school (53 | 14.5%).
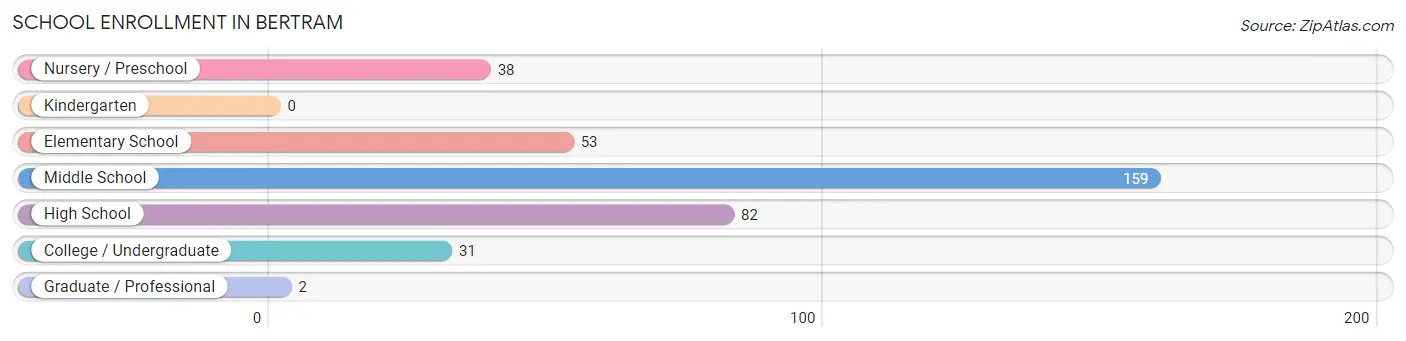
| School Level | # Students | % Students |
| Nursery / Preschool | 38 | 10.4% |
| Kindergarten | 0 | 0.0% |
| Elementary School | 53 | 14.5% |
| Middle School | 159 | 43.6% |
| High School | 82 | 22.5% |
| College / Undergraduate | 31 | 8.5% |
| Graduate / Professional | 2 | 0.5% |
| Total | 365 | 100.0% |
School Enrollment by Age by Funding Source in Bertram
Out of a total of 365 students who are enrolled in schools in Bertram, 10 (2.7%) attend a private institution, while the remaining 355 (97.3%) are enrolled in public schools. The age group of 20 to 24 year olds has the highest likelihood of being enrolled in private schools, with 5 (38.5% in the age bracket) enrolled. Conversely, the age group of 3 to 4 year olds has the lowest likelihood of being enrolled in a private school, with 18 (100.0% in the age bracket) attending a public institution.
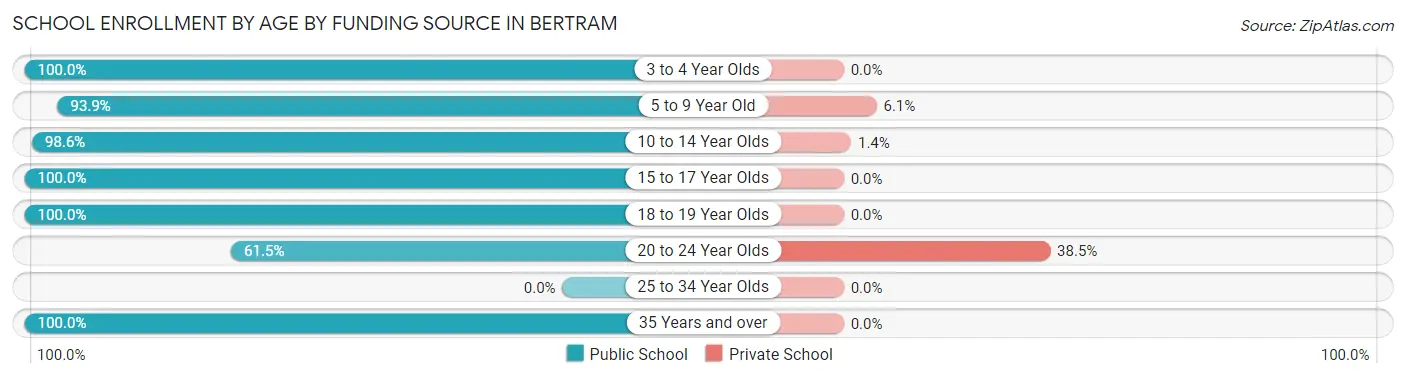
| Age Bracket | Public School | Private School |
| 3 to 4 Year Olds | 18 (100.0%) | 0 (0.0%) |
| 5 to 9 Year Old | 46 (93.9%) | 3 (6.1%) |
| 10 to 14 Year Olds | 144 (98.6%) | 2 (1.4%) |
| 15 to 17 Year Olds | 119 (100.0%) | 0 (0.0%) |
| 18 to 19 Year Olds | 14 (100.0%) | 0 (0.0%) |
| 20 to 24 Year Olds | 8 (61.5%) | 5 (38.5%) |
| 25 to 34 Year Olds | 0 (0.0%) | 0 (0.0%) |
| 35 Years and over | 6 (100.0%) | 0 (0.0%) |
| Total | 355 (97.3%) | 10 (2.7%) |
Educational Attainment by Field of Study in Bertram
Business (48 | 22.0%), education (44 | 20.2%), social sciences (25 | 11.5%), bio, nature & agricultural (23 | 10.5%), and arts & humanities (23 | 10.5%) are the most common fields of study among 218 individuals in Bertram who have obtained a bachelor's degree or higher.
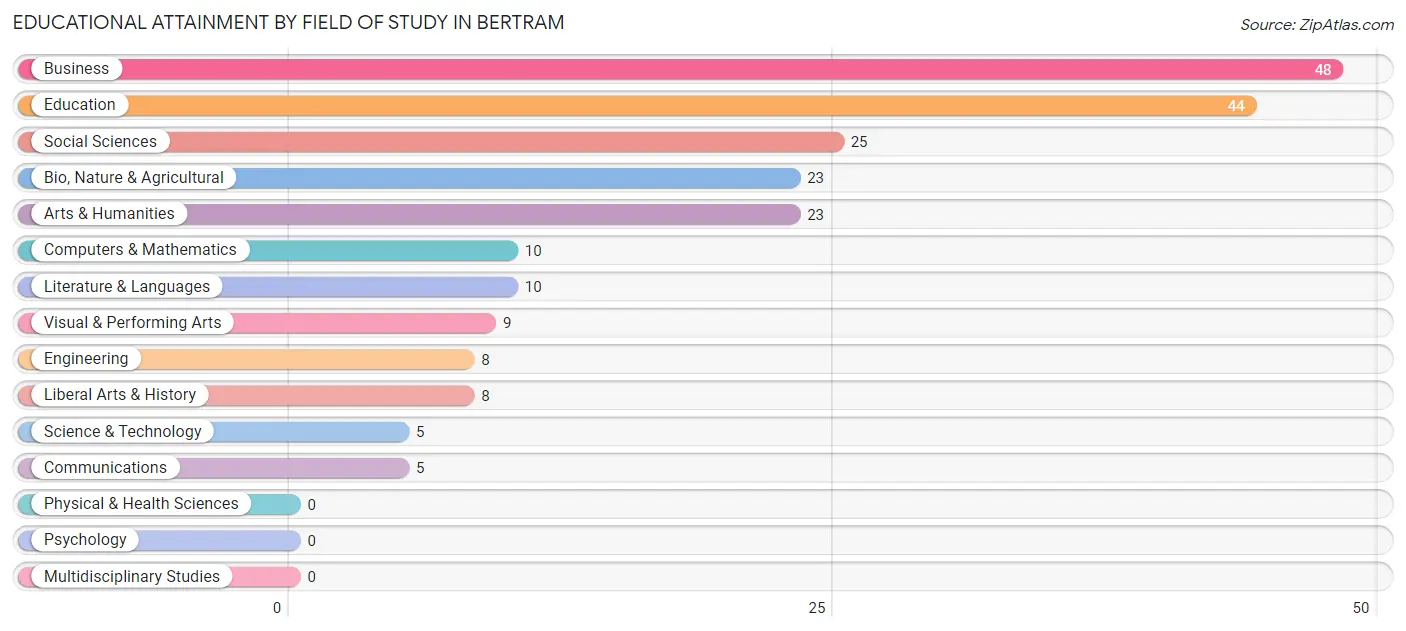
| Field of Study | # Graduates | % Graduates |
| Computers & Mathematics | 10 | 4.6% |
| Bio, Nature & Agricultural | 23 | 10.5% |
| Physical & Health Sciences | 0 | 0.0% |
| Psychology | 0 | 0.0% |
| Social Sciences | 25 | 11.5% |
| Engineering | 8 | 3.7% |
| Multidisciplinary Studies | 0 | 0.0% |
| Science & Technology | 5 | 2.3% |
| Business | 48 | 22.0% |
| Education | 44 | 20.2% |
| Literature & Languages | 10 | 4.6% |
| Liberal Arts & History | 8 | 3.7% |
| Visual & Performing Arts | 9 | 4.1% |
| Communications | 5 | 2.3% |
| Arts & Humanities | 23 | 10.5% |
| Total | 218 | 100.0% |
Transportation & Commute in Bertram
Vehicle Availability by Sex in Bertram
The most prevalent vehicle ownership categories in Bertram are males with 2 vehicles (154, accounting for 34.4%) and females with 2 vehicles (111, making up 44.0%).
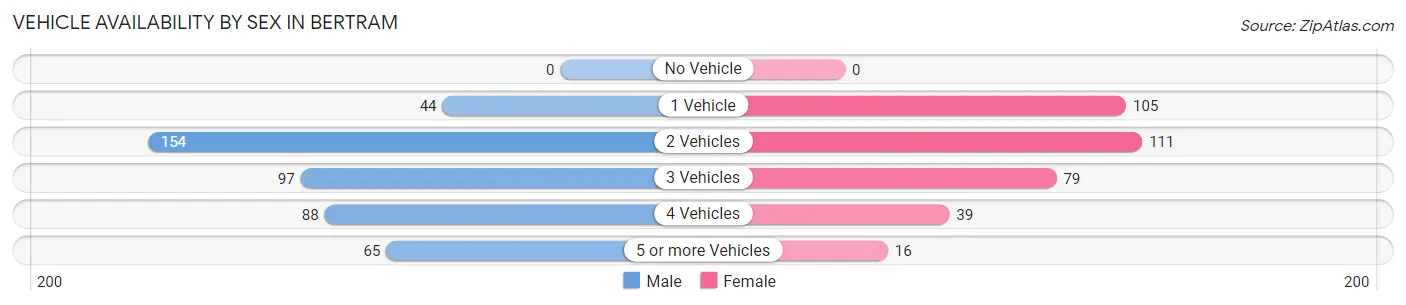
| Vehicles Available | Male | Female |
| No Vehicle | 0 (0.0%) | 0 (0.0%) |
| 1 Vehicle | 44 (9.8%) | 105 (30.0%) |
| 2 Vehicles | 154 (34.4%) | 111 (31.7%) |
| 3 Vehicles | 97 (21.6%) | 79 (22.6%) |
| 4 Vehicles | 88 (19.6%) | 39 (11.1%) |
| 5 or more Vehicles | 65 (14.5%) | 16 (4.6%) |
| Total | 448 (100.0%) | 350 (100.0%) |
Commute Time in Bertram
The most frequently occuring commute durations in Bertram are 45 to 59 minutes (167 commuters, 21.5%), 15 to 19 minutes (144 commuters, 18.6%), and 30 to 34 minutes (120 commuters, 15.5%).
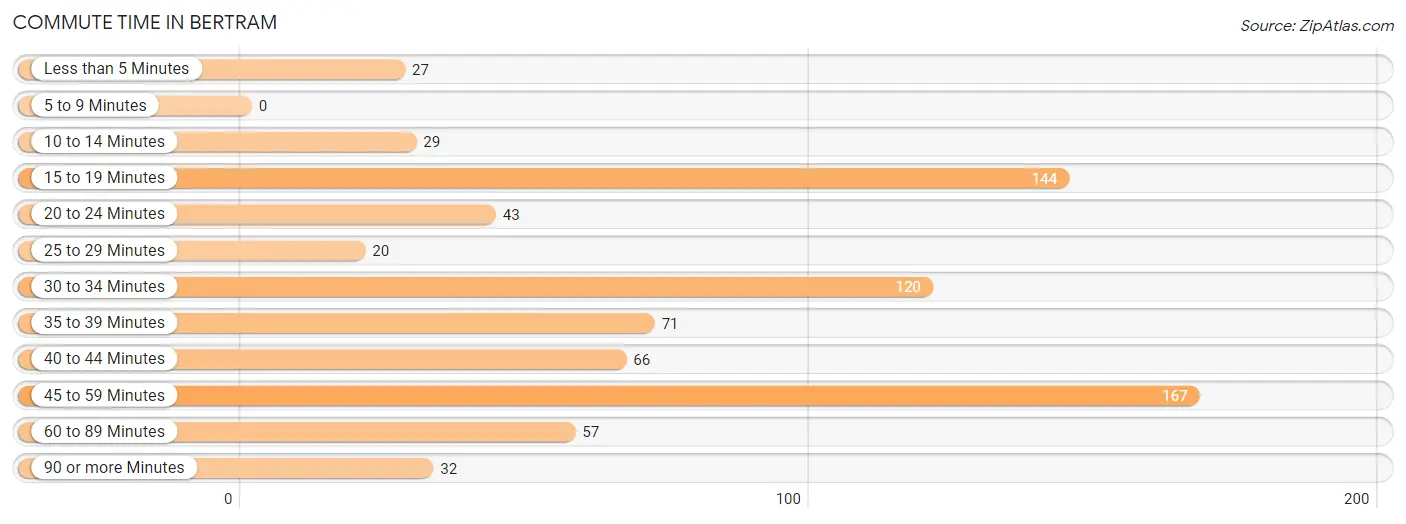
| Commute Time | # Commuters | % Commuters |
| Less than 5 Minutes | 27 | 3.5% |
| 5 to 9 Minutes | 0 | 0.0% |
| 10 to 14 Minutes | 29 | 3.7% |
| 15 to 19 Minutes | 144 | 18.6% |
| 20 to 24 Minutes | 43 | 5.5% |
| 25 to 29 Minutes | 20 | 2.6% |
| 30 to 34 Minutes | 120 | 15.5% |
| 35 to 39 Minutes | 71 | 9.1% |
| 40 to 44 Minutes | 66 | 8.5% |
| 45 to 59 Minutes | 167 | 21.5% |
| 60 to 89 Minutes | 57 | 7.3% |
| 90 or more Minutes | 32 | 4.1% |
Commute Time by Sex in Bertram
The most common commute times in Bertram are 15 to 19 minutes (86 commuters, 19.6%) for males and 45 to 59 minutes (82 commuters, 24.3%) for females.
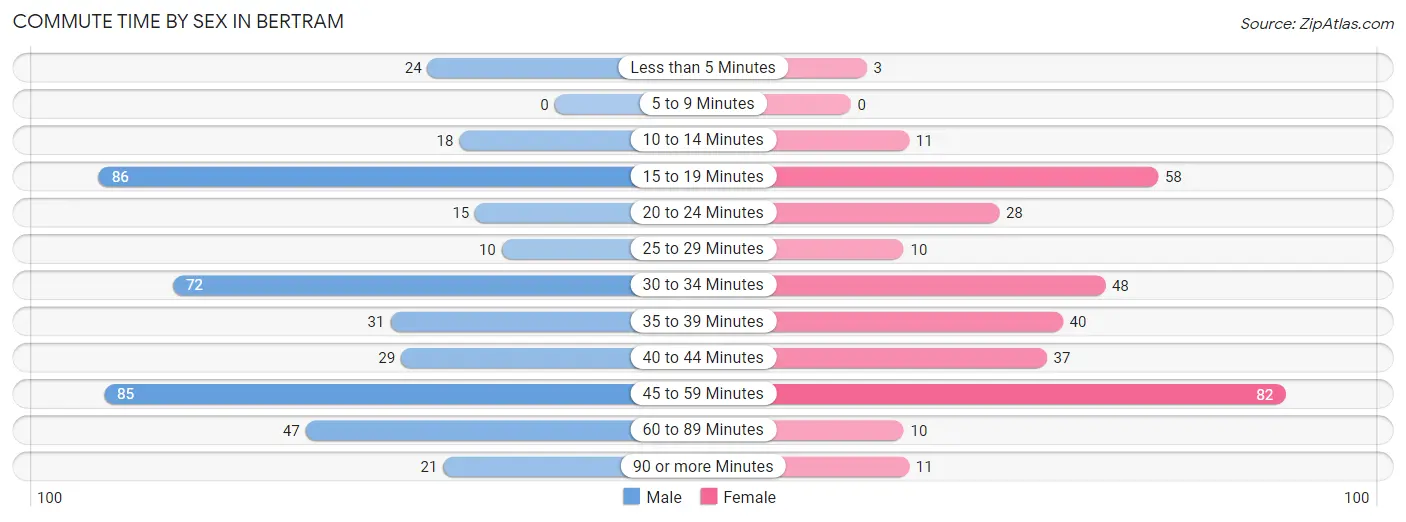
| Commute Time | Male | Female |
| Less than 5 Minutes | 24 (5.5%) | 3 (0.9%) |
| 5 to 9 Minutes | 0 (0.0%) | 0 (0.0%) |
| 10 to 14 Minutes | 18 (4.1%) | 11 (3.3%) |
| 15 to 19 Minutes | 86 (19.6%) | 58 (17.2%) |
| 20 to 24 Minutes | 15 (3.4%) | 28 (8.3%) |
| 25 to 29 Minutes | 10 (2.3%) | 10 (3.0%) |
| 30 to 34 Minutes | 72 (16.4%) | 48 (14.2%) |
| 35 to 39 Minutes | 31 (7.1%) | 40 (11.8%) |
| 40 to 44 Minutes | 29 (6.6%) | 37 (11.0%) |
| 45 to 59 Minutes | 85 (19.4%) | 82 (24.3%) |
| 60 to 89 Minutes | 47 (10.7%) | 10 (3.0%) |
| 90 or more Minutes | 21 (4.8%) | 11 (3.3%) |
Time of Departure to Work by Sex in Bertram
The most frequent times of departure to work in Bertram are 7:30 AM to 7:59 AM (79, 18.0%) for males and 9:00 AM to 9:59 AM (52, 15.4%) for females.
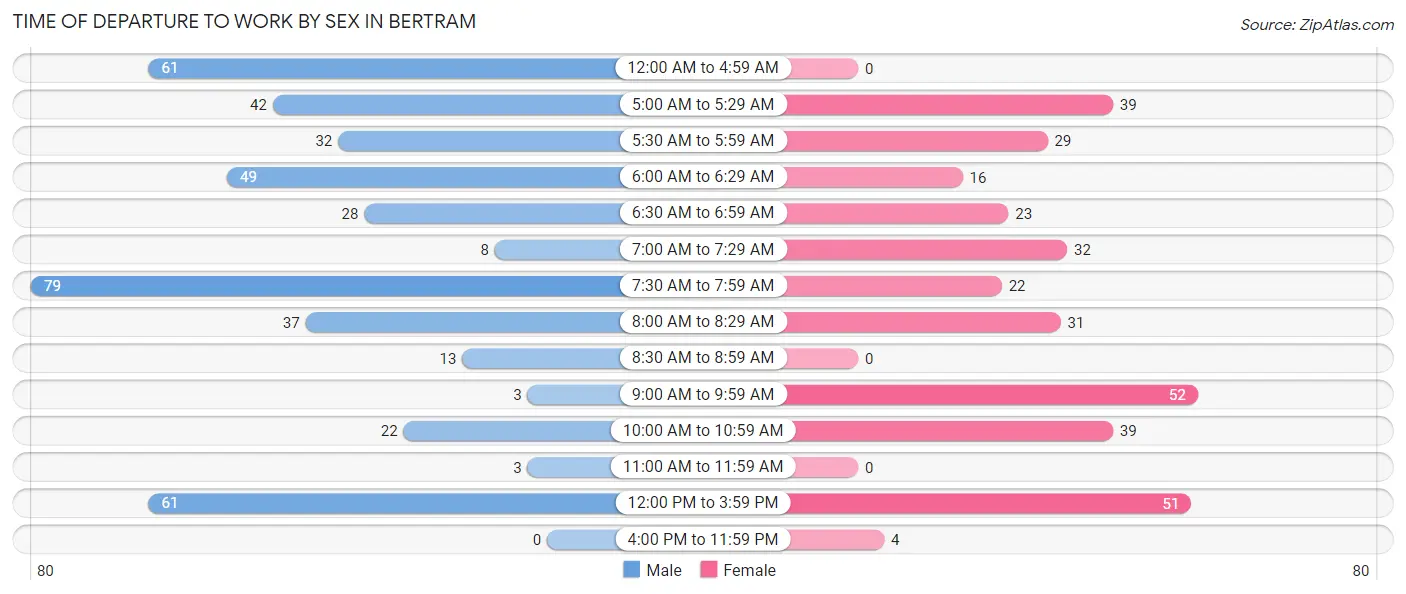
| Time of Departure | Male | Female |
| 12:00 AM to 4:59 AM | 61 (13.9%) | 0 (0.0%) |
| 5:00 AM to 5:29 AM | 42 (9.6%) | 39 (11.5%) |
| 5:30 AM to 5:59 AM | 32 (7.3%) | 29 (8.6%) |
| 6:00 AM to 6:29 AM | 49 (11.2%) | 16 (4.7%) |
| 6:30 AM to 6:59 AM | 28 (6.4%) | 23 (6.8%) |
| 7:00 AM to 7:29 AM | 8 (1.8%) | 32 (9.5%) |
| 7:30 AM to 7:59 AM | 79 (18.0%) | 22 (6.5%) |
| 8:00 AM to 8:29 AM | 37 (8.5%) | 31 (9.2%) |
| 8:30 AM to 8:59 AM | 13 (3.0%) | 0 (0.0%) |
| 9:00 AM to 9:59 AM | 3 (0.7%) | 52 (15.4%) |
| 10:00 AM to 10:59 AM | 22 (5.0%) | 39 (11.5%) |
| 11:00 AM to 11:59 AM | 3 (0.7%) | 0 (0.0%) |
| 12:00 PM to 3:59 PM | 61 (13.9%) | 51 (15.1%) |
| 4:00 PM to 11:59 PM | 0 (0.0%) | 4 (1.2%) |
| Total | 438 (100.0%) | 338 (100.0%) |
Housing Occupancy in Bertram
Occupancy by Ownership in Bertram
Of the total 679 dwellings in Bertram, owner-occupied units account for 538 (79.2%), while renter-occupied units make up 141 (20.8%).
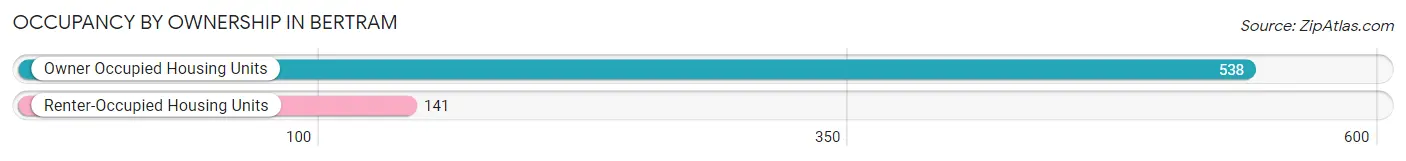
| Occupancy | # Housing Units | % Housing Units |
| Owner Occupied Housing Units | 538 | 79.2% |
| Renter-Occupied Housing Units | 141 | 20.8% |
| Total Occupied Housing Units | 679 | 100.0% |
Occupancy by Household Size in Bertram
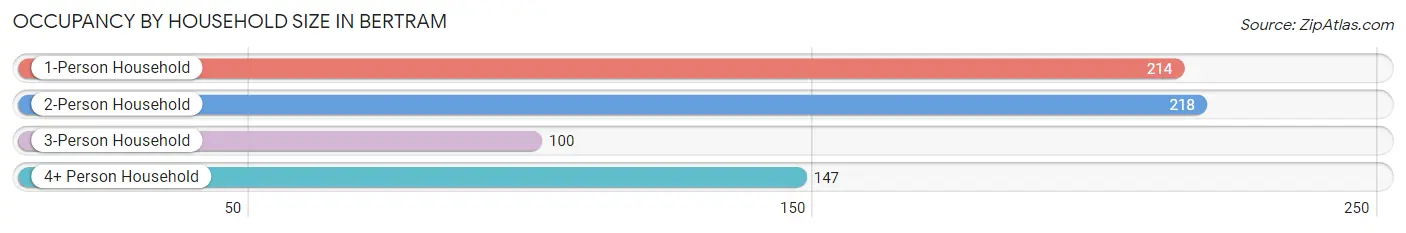
| Household Size | # Housing Units | % Housing Units |
| 1-Person Household | 214 | 31.5% |
| 2-Person Household | 218 | 32.1% |
| 3-Person Household | 100 | 14.7% |
| 4+ Person Household | 147 | 21.6% |
| Total Housing Units | 679 | 100.0% |
Occupancy by Ownership by Household Size in Bertram
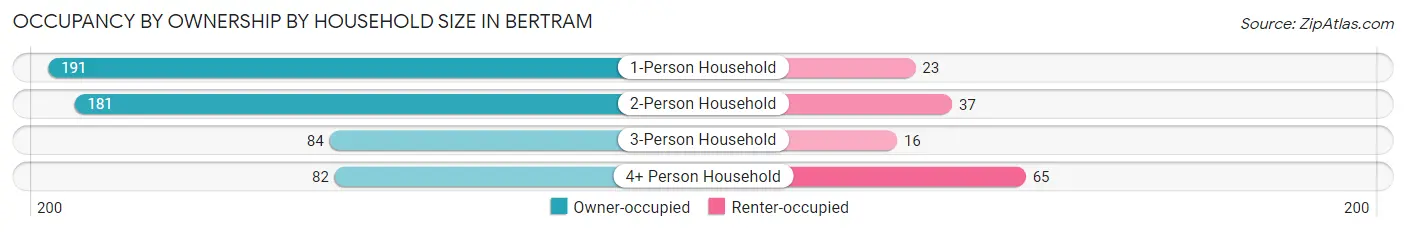
| Household Size | Owner-occupied | Renter-occupied |
| 1-Person Household | 191 (89.2%) | 23 (10.7%) |
| 2-Person Household | 181 (83.0%) | 37 (17.0%) |
| 3-Person Household | 84 (84.0%) | 16 (16.0%) |
| 4+ Person Household | 82 (55.8%) | 65 (44.2%) |
| Total Housing Units | 538 (79.2%) | 141 (20.8%) |
Occupancy by Educational Attainment in Bertram
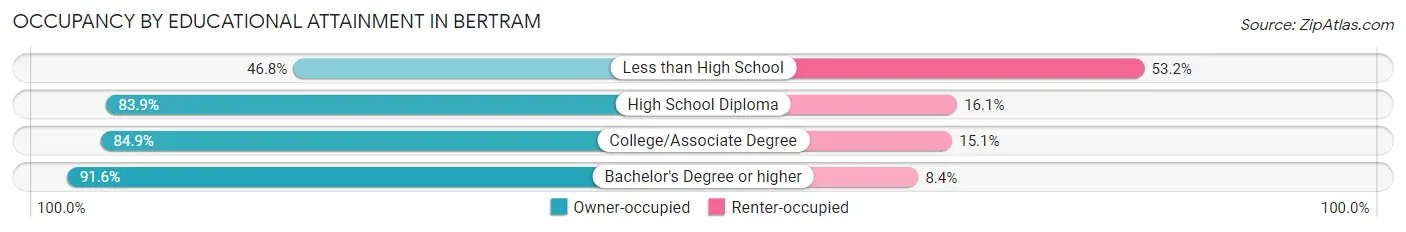
| Household Size | Owner-occupied | Renter-occupied |
| Less than High School | 58 (46.8%) | 66 (53.2%) |
| High School Diploma | 141 (83.9%) | 27 (16.1%) |
| College/Associate Degree | 197 (84.9%) | 35 (15.1%) |
| Bachelor's Degree or higher | 142 (91.6%) | 13 (8.4%) |
Occupancy by Age of Householder in Bertram
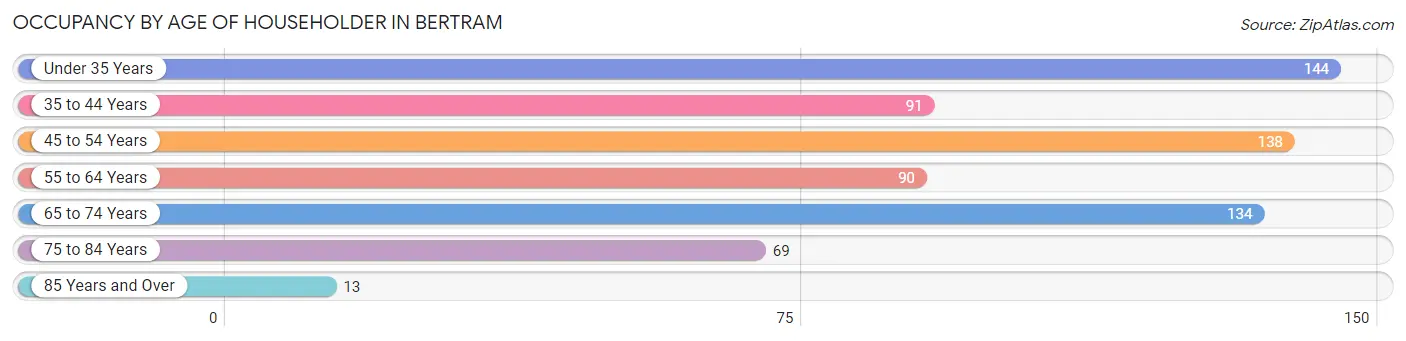
| Age Bracket | # Households | % Households |
| Under 35 Years | 144 | 21.2% |
| 35 to 44 Years | 91 | 13.4% |
| 45 to 54 Years | 138 | 20.3% |
| 55 to 64 Years | 90 | 13.3% |
| 65 to 74 Years | 134 | 19.7% |
| 75 to 84 Years | 69 | 10.2% |
| 85 Years and Over | 13 | 1.9% |
| Total | 679 | 100.0% |
Housing Finances in Bertram
Median Income by Occupancy in Bertram
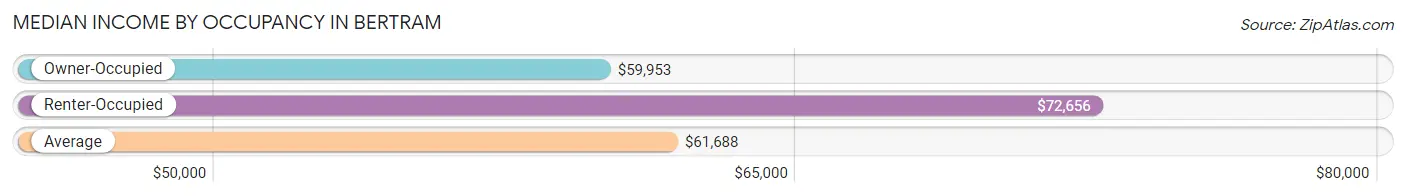
| Occupancy Type | # Households | Median Income |
| Owner-Occupied | 538 (79.2%) | $59,953 |
| Renter-Occupied | 141 (20.8%) | $72,656 |
| Average | 679 (100.0%) | $61,688 |
Occupancy by Householder Income Bracket in Bertram
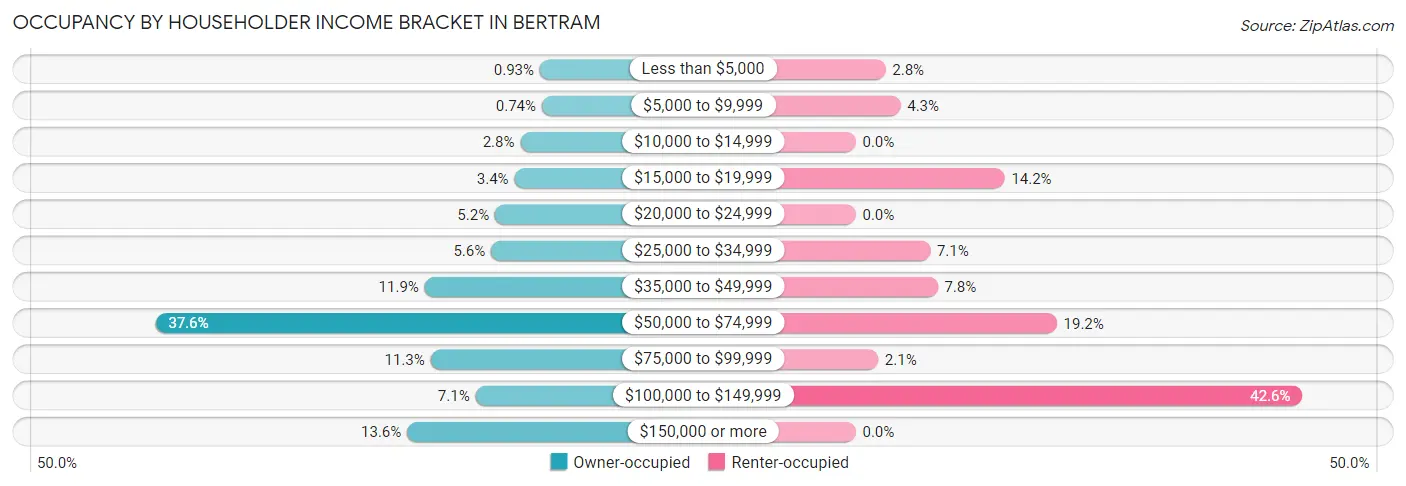
| Income Bracket | Owner-occupied | Renter-occupied |
| Less than $5,000 | 5 (0.9%) | 4 (2.8%) |
| $5,000 to $9,999 | 4 (0.7%) | 6 (4.3%) |
| $10,000 to $14,999 | 15 (2.8%) | 0 (0.0%) |
| $15,000 to $19,999 | 18 (3.4%) | 20 (14.2%) |
| $20,000 to $24,999 | 28 (5.2%) | 0 (0.0%) |
| $25,000 to $34,999 | 30 (5.6%) | 10 (7.1%) |
| $35,000 to $49,999 | 64 (11.9%) | 11 (7.8%) |
| $50,000 to $74,999 | 202 (37.6%) | 27 (19.2%) |
| $75,000 to $99,999 | 61 (11.3%) | 3 (2.1%) |
| $100,000 to $149,999 | 38 (7.1%) | 60 (42.5%) |
| $150,000 or more | 73 (13.6%) | 0 (0.0%) |
| Total | 538 (100.0%) | 141 (100.0%) |
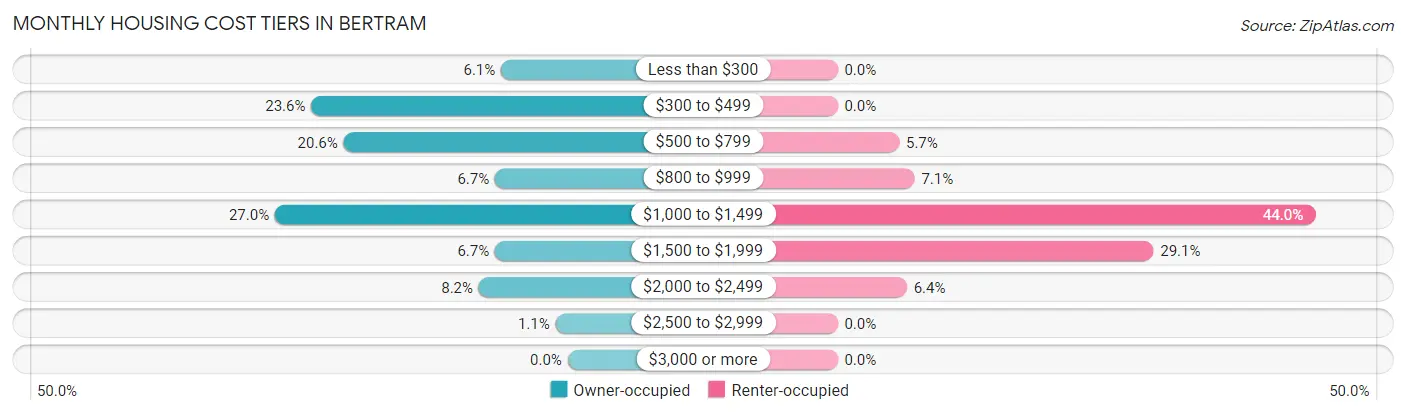
Monthly Housing Cost Tiers in Bertram
| Monthly Cost | Owner-occupied | Renter-occupied |
| Less than $300 | 33 (6.1%) | 0 (0.0%) |
| $300 to $499 | 127 (23.6%) | 0 (0.0%) |
| $500 to $799 | 111 (20.6%) | 8 (5.7%) |
| $800 to $999 | 36 (6.7%) | 10 (7.1%) |
| $1,000 to $1,499 | 145 (27.0%) | 62 (44.0%) |
| $1,500 to $1,999 | 36 (6.7%) | 41 (29.1%) |
| $2,000 to $2,499 | 44 (8.2%) | 9 (6.4%) |
| $2,500 to $2,999 | 6 (1.1%) | 0 (0.0%) |
| $3,000 or more | 0 (0.0%) | 0 (0.0%) |
| Total | 538 (100.0%) | 141 (100.0%) |
Physical Housing Characteristics in Bertram
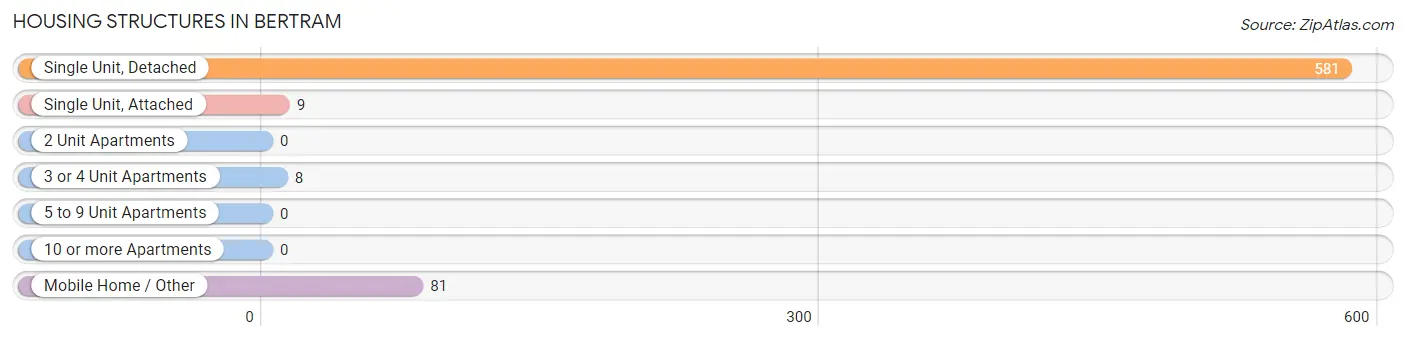
Housing Structures in Bertram
| Structure Type | # Housing Units | % Housing Units |
| Single Unit, Detached | 581 | 85.6% |
| Single Unit, Attached | 9 | 1.3% |
| 2 Unit Apartments | 0 | 0.0% |
| 3 or 4 Unit Apartments | 8 | 1.2% |
| 5 to 9 Unit Apartments | 0 | 0.0% |
| 10 or more Apartments | 0 | 0.0% |
| Mobile Home / Other | 81 | 11.9% |
| Total | 679 | 100.0% |
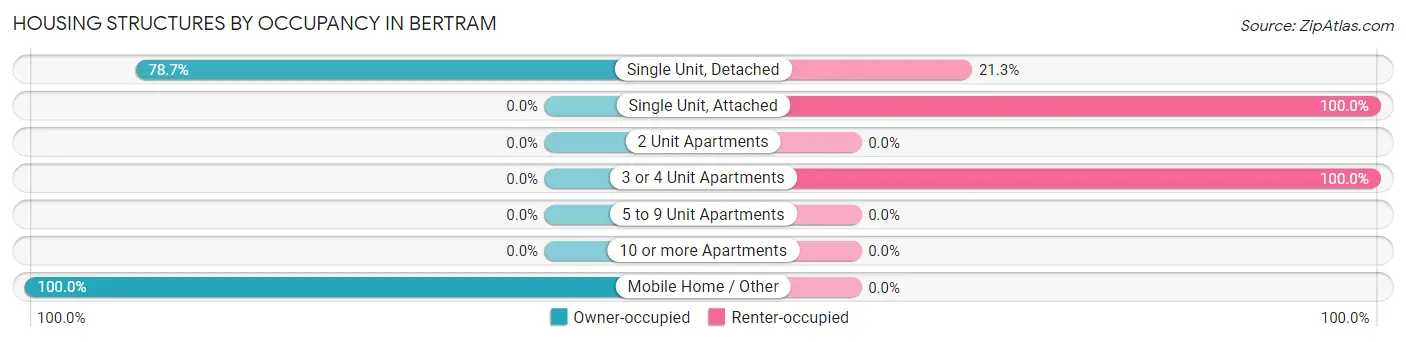
Housing Structures by Occupancy in Bertram
| Structure Type | Owner-occupied | Renter-occupied |
| Single Unit, Detached | 457 (78.7%) | 124 (21.3%) |
| Single Unit, Attached | 0 (0.0%) | 9 (100.0%) |
| 2 Unit Apartments | 0 (0.0%) | 0 (0.0%) |
| 3 or 4 Unit Apartments | 0 (0.0%) | 8 (100.0%) |
| 5 to 9 Unit Apartments | 0 (0.0%) | 0 (0.0%) |
| 10 or more Apartments | 0 (0.0%) | 0 (0.0%) |
| Mobile Home / Other | 81 (100.0%) | 0 (0.0%) |
| Total | 538 (79.2%) | 141 (20.8%) |
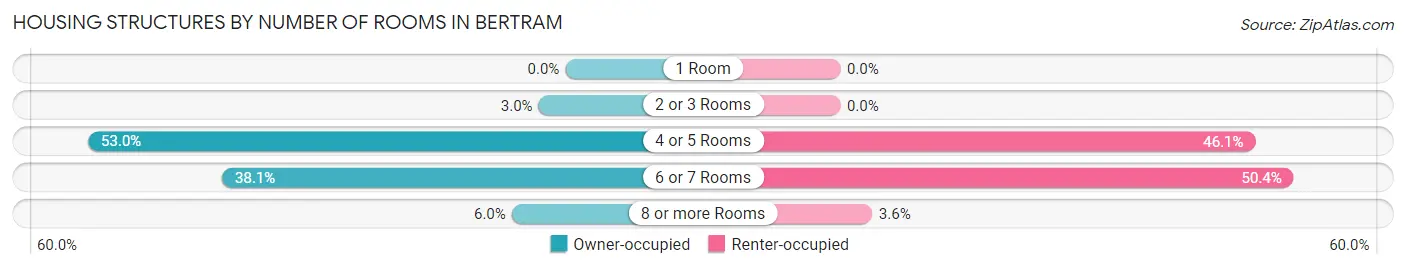
Housing Structures by Number of Rooms in Bertram
| Number of Rooms | Owner-occupied | Renter-occupied |
| 1 Room | 0 (0.0%) | 0 (0.0%) |
| 2 or 3 Rooms | 16 (3.0%) | 0 (0.0%) |
| 4 or 5 Rooms | 285 (53.0%) | 65 (46.1%) |
| 6 or 7 Rooms | 205 (38.1%) | 71 (50.3%) |
| 8 or more Rooms | 32 (5.9%) | 5 (3.5%) |
| Total | 538 (100.0%) | 141 (100.0%) |
Housing Structure by Heating Type in Bertram
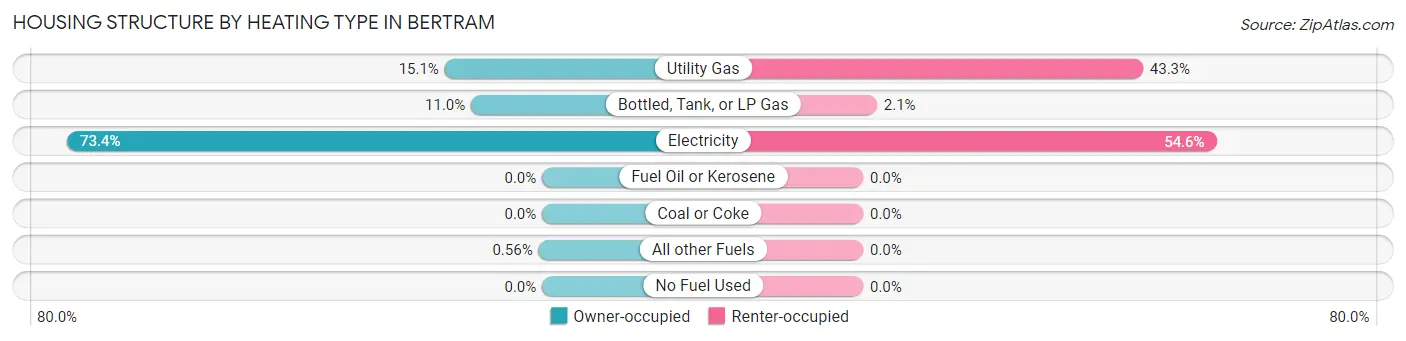
| Heating Type | Owner-occupied | Renter-occupied |
| Utility Gas | 81 (15.1%) | 61 (43.3%) |
| Bottled, Tank, or LP Gas | 59 (11.0%) | 3 (2.1%) |
| Electricity | 395 (73.4%) | 77 (54.6%) |
| Fuel Oil or Kerosene | 0 (0.0%) | 0 (0.0%) |
| Coal or Coke | 0 (0.0%) | 0 (0.0%) |
| All other Fuels | 3 (0.6%) | 0 (0.0%) |
| No Fuel Used | 0 (0.0%) | 0 (0.0%) |
| Total | 538 (100.0%) | 141 (100.0%) |
Household Vehicle Usage in Bertram
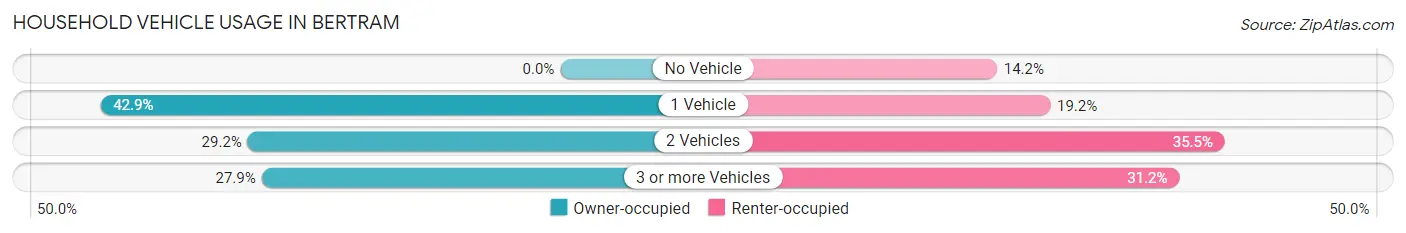
| Vehicles per Household | Owner-occupied | Renter-occupied |
| No Vehicle | 0 (0.0%) | 20 (14.2%) |
| 1 Vehicle | 231 (42.9%) | 27 (19.2%) |
| 2 Vehicles | 157 (29.2%) | 50 (35.5%) |
| 3 or more Vehicles | 150 (27.9%) | 44 (31.2%) |
| Total | 538 (100.0%) | 141 (100.0%) |
Real Estate & Mortgages in Bertram
Real Estate and Mortgage Overview in Bertram
| Characteristic | Without Mortgage | With Mortgage |
| Housing Units | 294 | 244 |
| Median Property Value | $172,200 | $190,000 |
| Median Household Income | $57,679 | $64 |
| Monthly Housing Costs | $482 | $0 |
| Real Estate Taxes | $1,292 | $12 |
Property Value by Mortgage Status in Bertram
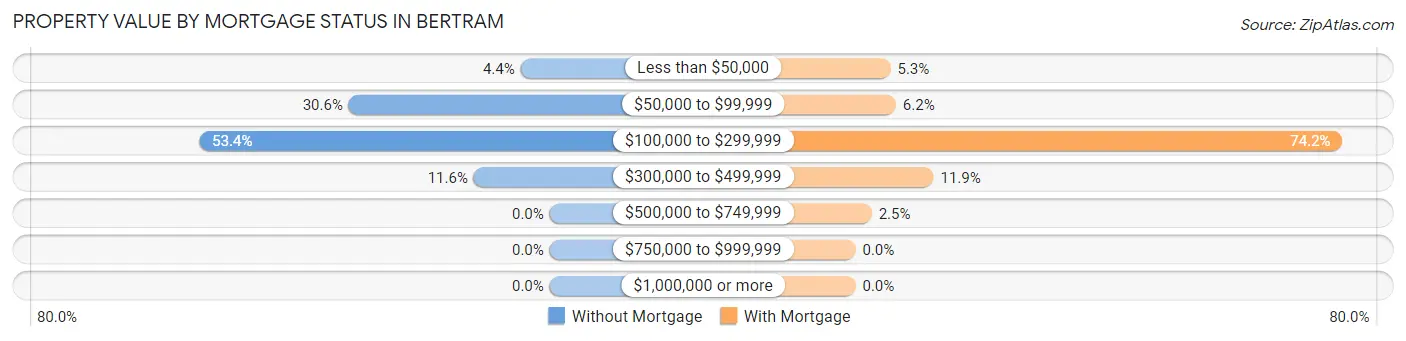
| Property Value | Without Mortgage | With Mortgage |
| Less than $50,000 | 13 (4.4%) | 13 (5.3%) |
| $50,000 to $99,999 | 90 (30.6%) | 15 (6.1%) |
| $100,000 to $299,999 | 157 (53.4%) | 181 (74.2%) |
| $300,000 to $499,999 | 34 (11.6%) | 29 (11.9%) |
| $500,000 to $749,999 | 0 (0.0%) | 6 (2.5%) |
| $750,000 to $999,999 | 0 (0.0%) | 0 (0.0%) |
| $1,000,000 or more | 0 (0.0%) | 0 (0.0%) |
| Total | 294 (100.0%) | 244 (100.0%) |
Household Income by Mortgage Status in Bertram
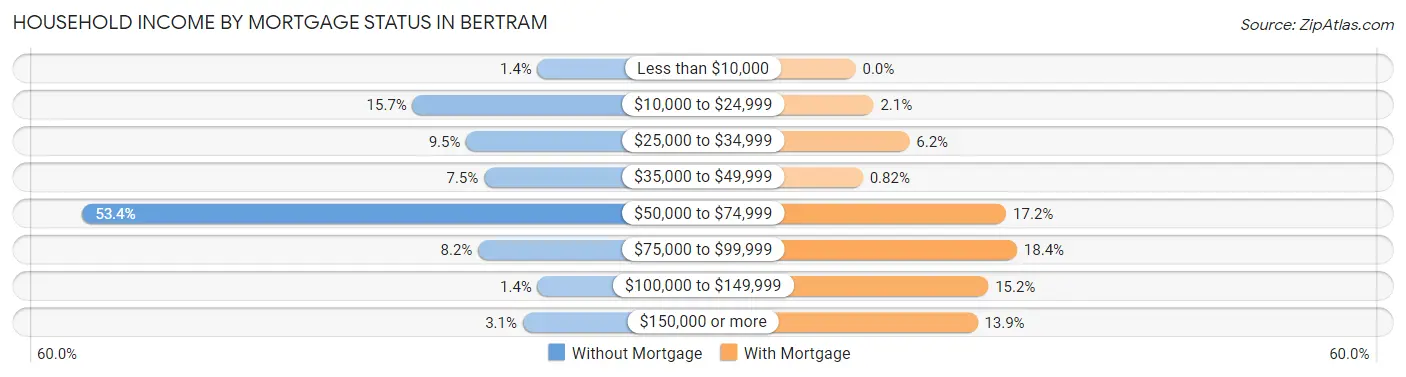
| Household Income | Without Mortgage | With Mortgage |
| Less than $10,000 | 4 (1.4%) | 0 (0.0%) |
| $10,000 to $24,999 | 46 (15.7%) | 5 (2.1%) |
| $25,000 to $34,999 | 28 (9.5%) | 15 (6.1%) |
| $35,000 to $49,999 | 22 (7.5%) | 2 (0.8%) |
| $50,000 to $74,999 | 157 (53.4%) | 42 (17.2%) |
| $75,000 to $99,999 | 24 (8.2%) | 45 (18.4%) |
| $100,000 to $149,999 | 4 (1.4%) | 37 (15.2%) |
| $150,000 or more | 9 (3.1%) | 34 (13.9%) |
| Total | 294 (100.0%) | 244 (100.0%) |
Property Value to Household Income Ratio in Bertram
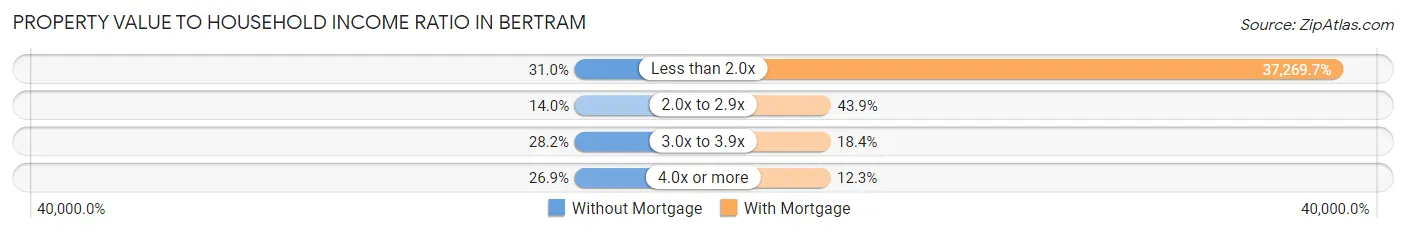
| Value-to-Income Ratio | Without Mortgage | With Mortgage |
| Less than 2.0x | 91 (30.9%) | 90,938 (37,269.7%) |
| 2.0x to 2.9x | 41 (14.0%) | 107 (43.9%) |
| 3.0x to 3.9x | 83 (28.2%) | 45 (18.4%) |
| 4.0x or more | 79 (26.9%) | 30 (12.3%) |
| Total | 294 (100.0%) | 244 (100.0%) |
Real Estate Taxes by Mortgage Status in Bertram
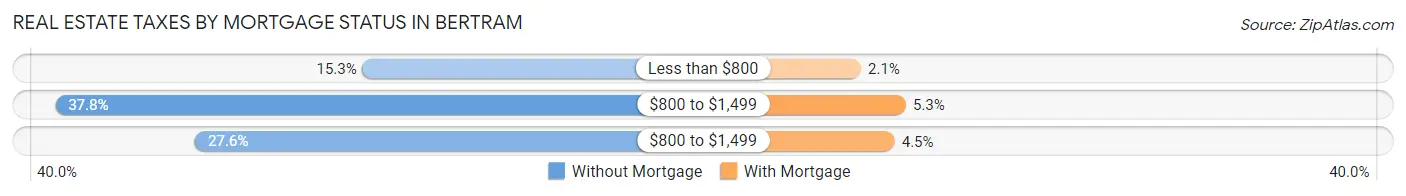
| Property Taxes | Without Mortgage | With Mortgage |
| Less than $800 | 45 (15.3%) | 5 (2.1%) |
| $800 to $1,499 | 111 (37.8%) | 13 (5.3%) |
| $800 to $1,499 | 81 (27.6%) | 11 (4.5%) |
| Total | 294 (100.0%) | 244 (100.0%) |
Health & Disability in Bertram
Health Insurance Coverage by Age in Bertram
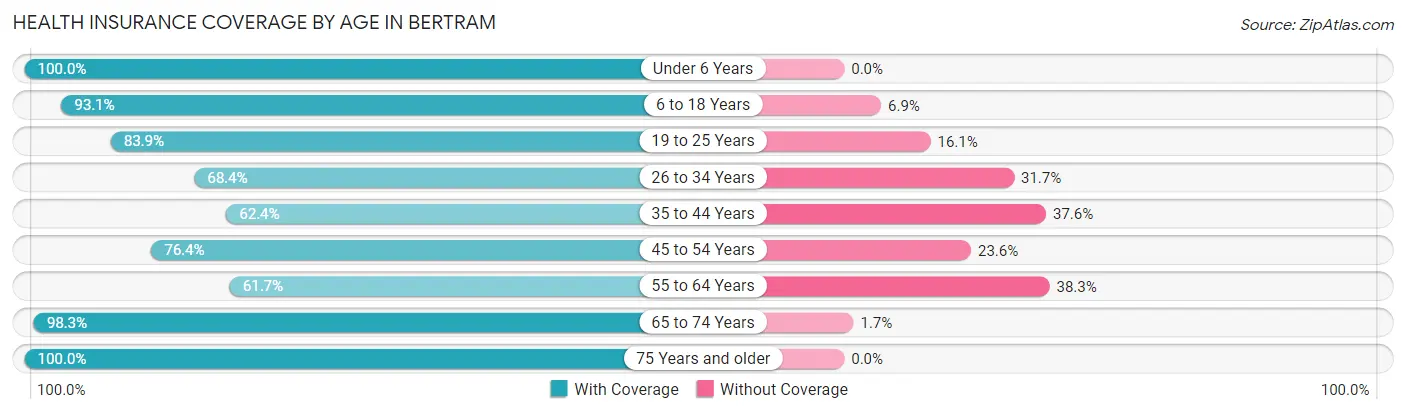
| Age Bracket | With Coverage | Without Coverage |
| Under 6 Years | 109 (100.0%) | 0 (0.0%) |
| 6 to 18 Years | 285 (93.1%) | 21 (6.9%) |
| 19 to 25 Years | 120 (83.9%) | 23 (16.1%) |
| 26 to 34 Years | 162 (68.3%) | 75 (31.7%) |
| 35 to 44 Years | 184 (62.4%) | 111 (37.6%) |
| 45 to 54 Years | 168 (76.4%) | 52 (23.6%) |
| 55 to 64 Years | 79 (61.7%) | 49 (38.3%) |
| 65 to 74 Years | 229 (98.3%) | 4 (1.7%) |
| 75 Years and older | 106 (100.0%) | 0 (0.0%) |
| Total | 1,442 (81.1%) | 335 (18.9%) |
Health Insurance Coverage by Citizenship Status in Bertram
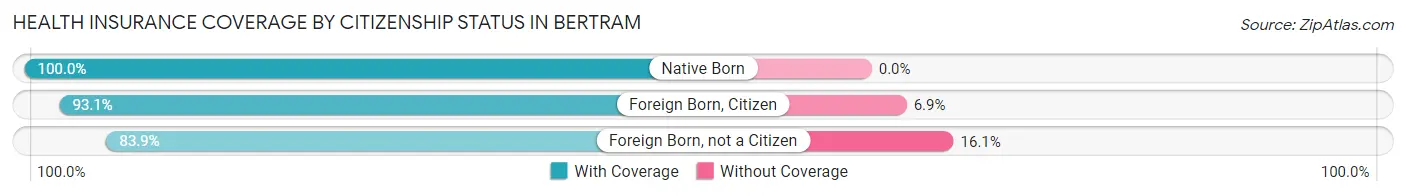
| Citizenship Status | With Coverage | Without Coverage |
| Native Born | 109 (100.0%) | 0 (0.0%) |
| Foreign Born, Citizen | 285 (93.1%) | 21 (6.9%) |
| Foreign Born, not a Citizen | 120 (83.9%) | 23 (16.1%) |
Health Insurance Coverage by Household Income in Bertram
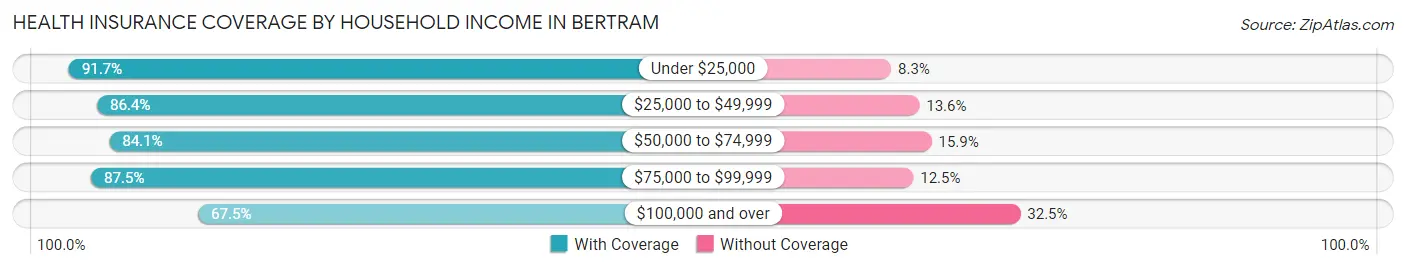
| Household Income | With Coverage | Without Coverage |
| Under $25,000 | 243 (91.7%) | 22 (8.3%) |
| $25,000 to $49,999 | 140 (86.4%) | 22 (13.6%) |
| $50,000 to $74,999 | 408 (84.1%) | 77 (15.9%) |
| $75,000 to $99,999 | 274 (87.5%) | 39 (12.5%) |
| $100,000 and over | 359 (67.5%) | 173 (32.5%) |
Public vs Private Health Insurance Coverage by Age in Bertram
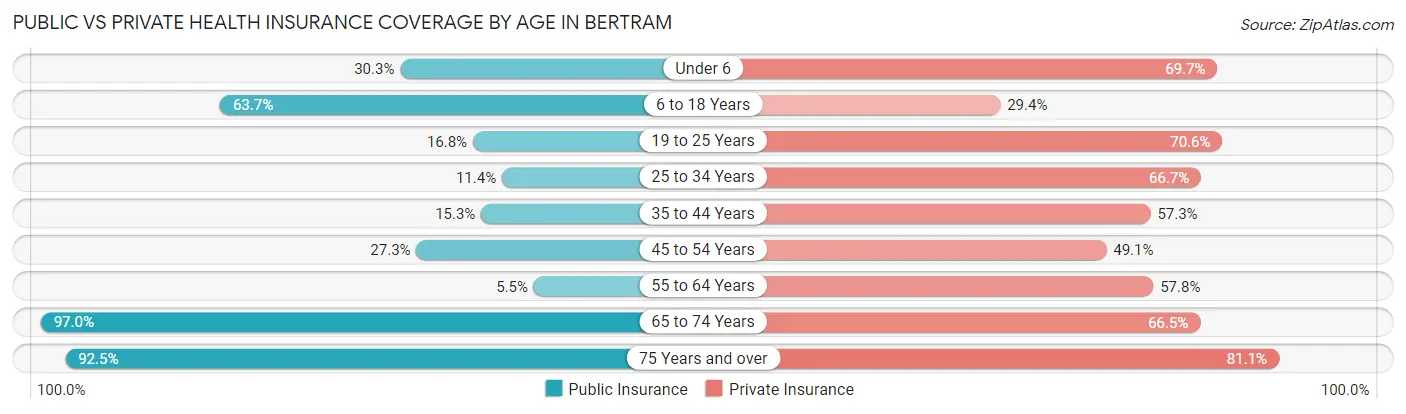
| Age Bracket | Public Insurance | Private Insurance |
| Under 6 | 33 (30.3%) | 76 (69.7%) |
| 6 to 18 Years | 195 (63.7%) | 90 (29.4%) |
| 19 to 25 Years | 24 (16.8%) | 101 (70.6%) |
| 25 to 34 Years | 27 (11.4%) | 158 (66.7%) |
| 35 to 44 Years | 45 (15.2%) | 169 (57.3%) |
| 45 to 54 Years | 60 (27.3%) | 108 (49.1%) |
| 55 to 64 Years | 7 (5.5%) | 74 (57.8%) |
| 65 to 74 Years | 226 (97.0%) | 155 (66.5%) |
| 75 Years and over | 98 (92.4%) | 86 (81.1%) |
| Total | 715 (40.2%) | 1,017 (57.2%) |
Disability Status by Sex by Age in Bertram
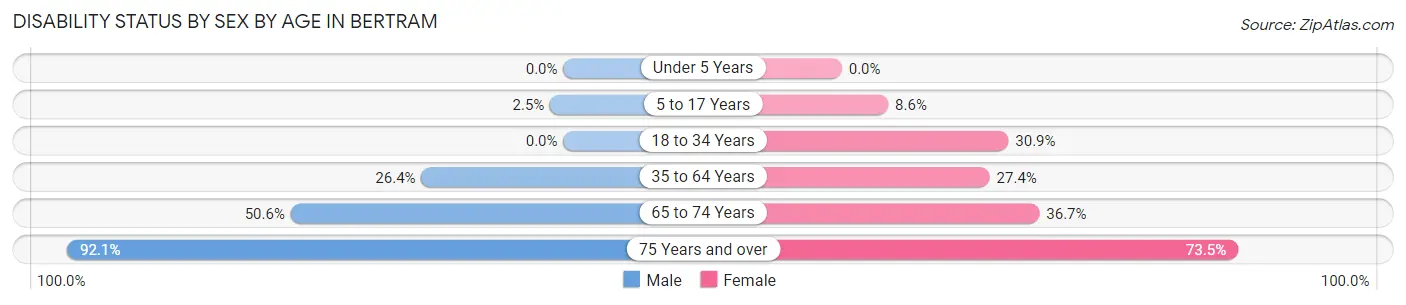
| Age Bracket | Male | Female |
| Under 5 Years | 0 (0.0%) | 0 (0.0%) |
| 5 to 17 Years | 4 (2.5%) | 13 (8.6%) |
| 18 to 34 Years | 0 (0.0%) | 47 (30.9%) |
| 35 to 64 Years | 83 (26.4%) | 90 (27.4%) |
| 65 to 74 Years | 42 (50.6%) | 55 (36.7%) |
| 75 Years and over | 35 (92.1%) | 50 (73.5%) |
Disability Class by Sex by Age in Bertram
Disability Class: Hearing Difficulty
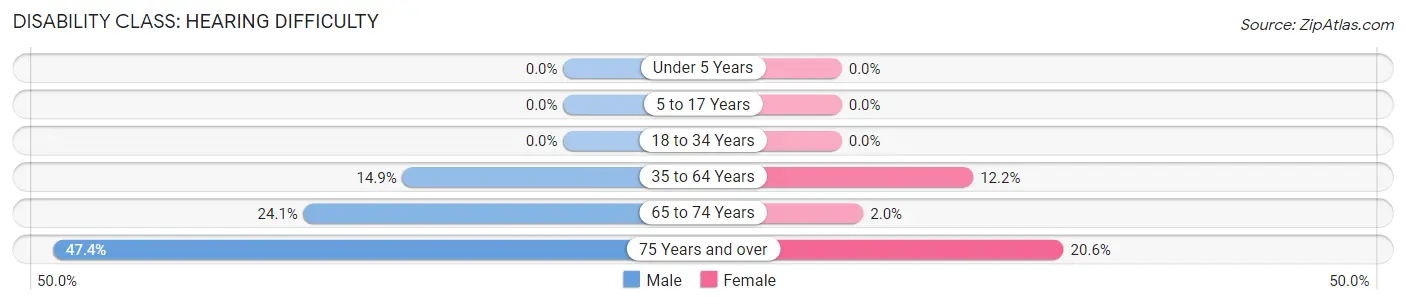
| Age Bracket | Male | Female |
| Under 5 Years | 0 (0.0%) | 0 (0.0%) |
| 5 to 17 Years | 0 (0.0%) | 0 (0.0%) |
| 18 to 34 Years | 0 (0.0%) | 0 (0.0%) |
| 35 to 64 Years | 47 (14.9%) | 40 (12.2%) |
| 65 to 74 Years | 20 (24.1%) | 3 (2.0%) |
| 75 Years and over | 18 (47.4%) | 14 (20.6%) |
Disability Class: Vision Difficulty
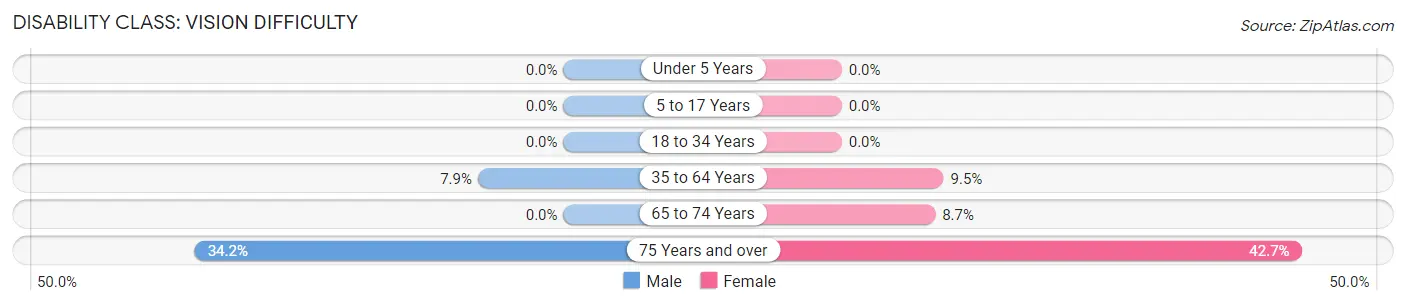
| Age Bracket | Male | Female |
| Under 5 Years | 0 (0.0%) | 0 (0.0%) |
| 5 to 17 Years | 0 (0.0%) | 0 (0.0%) |
| 18 to 34 Years | 0 (0.0%) | 0 (0.0%) |
| 35 to 64 Years | 25 (7.9%) | 31 (9.5%) |
| 65 to 74 Years | 0 (0.0%) | 13 (8.7%) |
| 75 Years and over | 13 (34.2%) | 29 (42.6%) |
Disability Class: Cognitive Difficulty
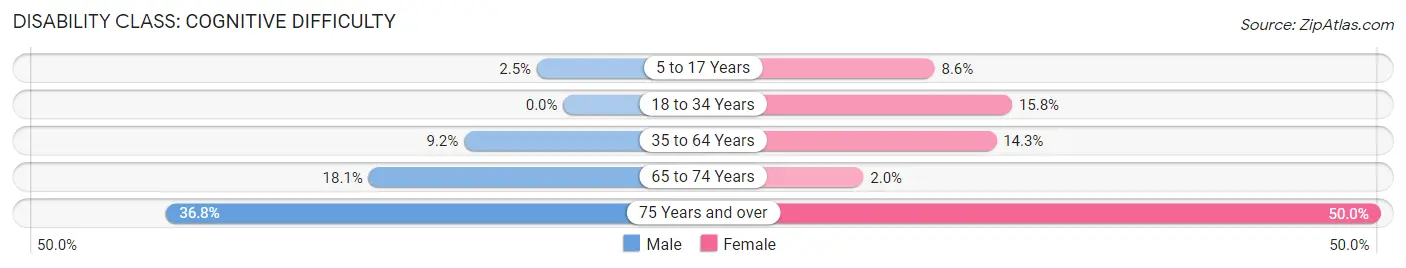
| Age Bracket | Male | Female |
| 5 to 17 Years | 4 (2.5%) | 13 (8.6%) |
| 18 to 34 Years | 0 (0.0%) | 24 (15.8%) |
| 35 to 64 Years | 29 (9.2%) | 47 (14.3%) |
| 65 to 74 Years | 15 (18.1%) | 3 (2.0%) |
| 75 Years and over | 14 (36.8%) | 34 (50.0%) |
Disability Class: Ambulatory Difficulty
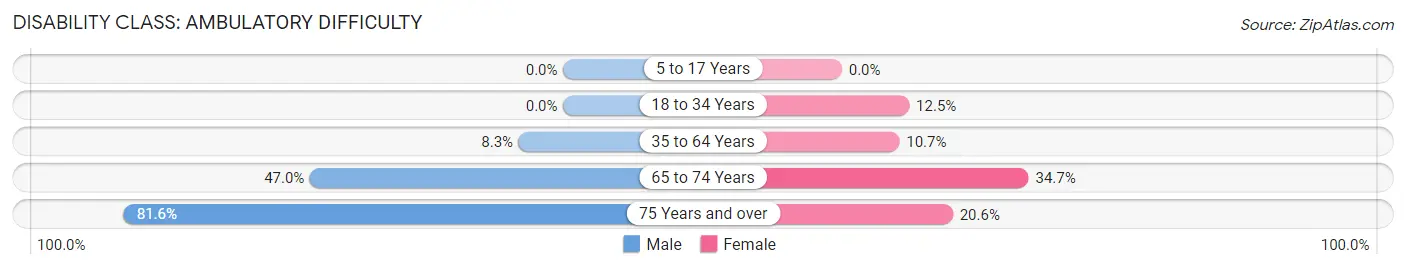
| Age Bracket | Male | Female |
| 5 to 17 Years | 0 (0.0%) | 0 (0.0%) |
| 18 to 34 Years | 0 (0.0%) | 19 (12.5%) |
| 35 to 64 Years | 26 (8.3%) | 35 (10.7%) |
| 65 to 74 Years | 39 (47.0%) | 52 (34.7%) |
| 75 Years and over | 31 (81.6%) | 14 (20.6%) |
Disability Class: Self-Care Difficulty
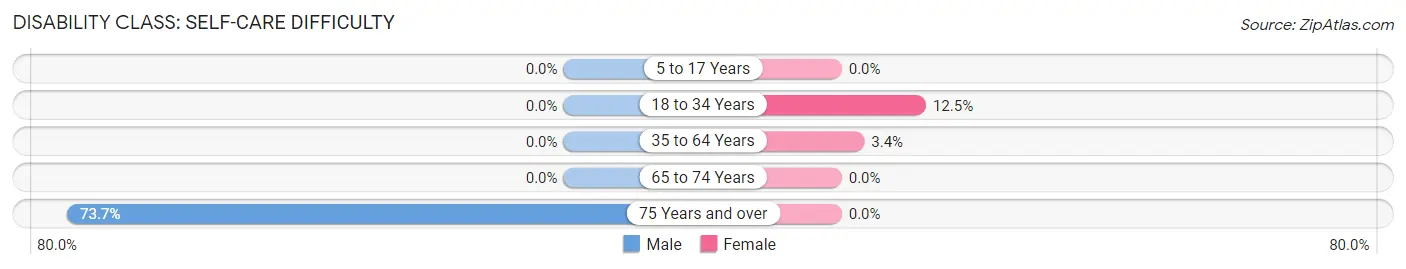
| Age Bracket | Male | Female |
| 5 to 17 Years | 0 (0.0%) | 0 (0.0%) |
| 18 to 34 Years | 0 (0.0%) | 19 (12.5%) |
| 35 to 64 Years | 0 (0.0%) | 11 (3.4%) |
| 65 to 74 Years | 0 (0.0%) | 0 (0.0%) |
| 75 Years and over | 28 (73.7%) | 0 (0.0%) |
Technology Access in Bertram
Computing Device Access in Bertram
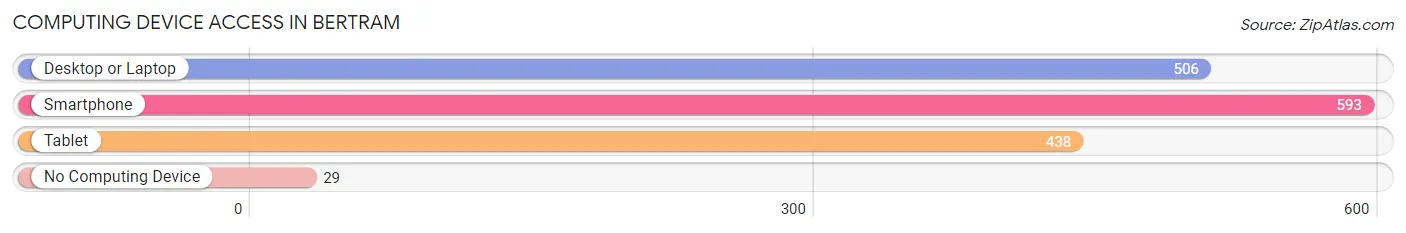
| Device Type | # Households | % Households |
| Desktop or Laptop | 506 | 74.5% |
| Smartphone | 593 | 87.3% |
| Tablet | 438 | 64.5% |
| No Computing Device | 29 | 4.3% |
| Total | 679 | 100.0% |
Internet Access in Bertram
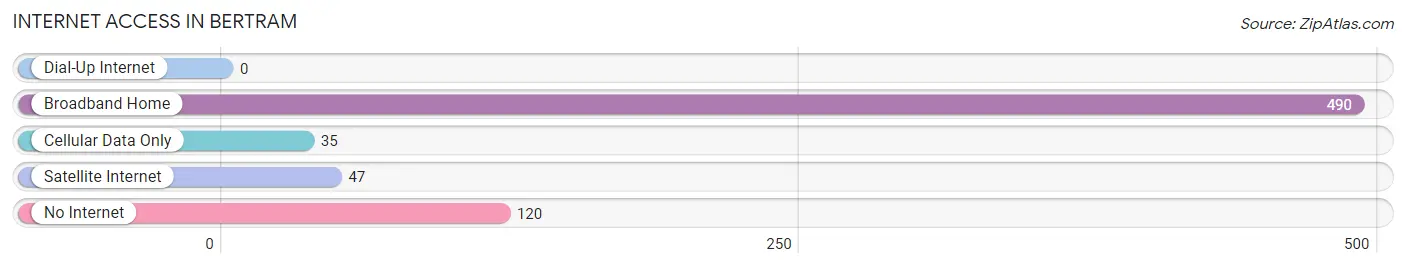
| Internet Type | # Households | % Households |
| Dial-Up Internet | 0 | 0.0% |
| Broadband Home | 490 | 72.2% |
| Cellular Data Only | 35 | 5.1% |
| Satellite Internet | 47 | 6.9% |
| No Internet | 120 | 17.7% |
| Total | 679 | 100.0% |
Bertram Summary
Bertram is a small town located in Burnet County, Texas, United States. It is situated about 40 miles northwest of Austin and is part of the Austin–Round Rock–San Marcos metropolitan area. The population of Bertram was 1,200 at the 2010 census.
History
The area that is now Bertram was first settled in the late 1850s by German immigrants. The town was originally called “Harmony” and was later renamed “Bertram” in honor of a local rancher, John Bertram. The town was officially incorporated in 1882.
In the early 1900s, Bertram was a thriving agricultural community, with cotton, corn, and wheat being the main crops. The town also had a number of businesses, including a bank, a hotel, a general store, and a blacksmith shop.
In the 1920s, the town began to decline as the agricultural industry shifted away from the area. The Great Depression further exacerbated the decline, and by the 1940s, the population had dropped to just over 500.
Geography
Bertram is located in central Burnet County at 30°45'25" North, 98°10'25" West (30.7569, -98.1737). It is situated on the eastern edge of the Texas Hill Country, about 40 miles northwest of Austin.
The town is situated on the banks of the Colorado River, which flows through the area. The terrain is mostly flat, with some rolling hills in the surrounding area.
Economy
The economy of Bertram is largely based on agriculture and tourism. The town is home to several farms, which produce a variety of crops, including cotton, corn, wheat, and hay.
The town is also a popular tourist destination, with visitors coming to enjoy the area’s natural beauty and recreational activities. The nearby Lake Buchanan and Inks Lake State Park offer a variety of outdoor activities, such as fishing, boating, and swimming.
Demographics
As of the 2010 census, the population of Bertram was 1,200. The racial makeup of the town was 94.2% White, 0.3% African American, 0.2% Native American, 0.2% Asian, 0.1% Pacific Islander, 3.3% from other races, and 1.8% from two or more races. Hispanic or Latino of any race were 8.3% of the population.
The median household income in Bertram was $41,250, and the median family income was $45,833. The per capita income was $19,945. About 11.2% of families and 13.2% of the population were below the poverty line, including 17.2% of those under age 18 and 8.3% of those age 65 or over.
Common Questions
What is Per Capita Income in Bertram?
Per Capita income in Bertram is $30,660.
What is the Median Family Income in Bertram?
Median Family Income in Bertram is $70,395.
What is the Median Household income in Bertram?
Median Household Income in Bertram is $61,688.
What is Income or Wage Gap in Bertram?
Income or Wage Gap in Bertram is 45.8%.
Women in Bertram earn 54.2 cents for every dollar earned by a man.
What is Inequality or Gini Index in Bertram?
Inequality or Gini Index in Bertram is 0.39.
What is the Total Population of Bertram?
Total Population of Bertram is 1,832.
What is the Total Male Population of Bertram?
Total Male Population of Bertram is 893.
What is the Total Female Population of Bertram?
Total Female Population of Bertram is 939.
What is the Ratio of Males per 100 Females in Bertram?
There are 95.10 Males per 100 Females in Bertram.
What is the Ratio of Females per 100 Males in Bertram?
There are 105.15 Females per 100 Males in Bertram.
What is the Median Population Age in Bertram?
Median Population Age in Bertram is 38.9 Years.
What is the Average Family Size in Bertram
Average Family Size in Bertram is 3.1 People.
What is the Average Household Size in Bertram
Average Household Size in Bertram is 2.6 People.
How Large is the Labor Force in Bertram?
There are 862 People in the Labor Forcein in Bertram.
What is the Percentage of People in the Labor Force in Bertram?
58.3% of People are in the Labor Force in Bertram.
What is the Unemployment Rate in Bertram?
Unemployment Rate in Bertram is 5.3%.