Bellevue, TX Map & Demographics
Bellevue Map
Bellevue Overview
$24,046
PER CAPITA INCOME
$66,250
AVG FAMILY INCOME
$65,662
AVG HOUSEHOLD INCOME
46.9%
WAGE / INCOME GAP [ % ]
53.1¢/ $1
WAGE / INCOME GAP [ $ ]
0.34
INEQUALITY / GINI INDEX
426
TOTAL POPULATION
228
MALE POPULATION
198
FEMALE POPULATION
115.15
MALES / 100 FEMALES
86.84
FEMALES / 100 MALES
39.1
MEDIAN AGE
3.0
AVG FAMILY SIZE
2.9
AVG HOUSEHOLD SIZE
192
LABOR FORCE [ PEOPLE ]
58.5%
PERCENT IN LABOR FORCE
4.2%
UNEMPLOYMENT RATE
Bellevue Zip Codes
Bellevue Area Codes
Income in Bellevue
Income Overview in Bellevue
Per Capita Income in Bellevue is $24,046, while median incomes of families and households are $66,250 and $65,662 respectively.
| Characteristic | Number | Measure |
| Per Capita Income | 426 | $24,046 |
| Median Family Income | 119 | $66,250 |
| Mean Family Income | 119 | $72,457 |
| Median Household Income | 145 | $65,662 |
| Mean Household Income | 145 | $68,754 |
| Income Deficit | 119 | $0 |
| Wage / Income Gap (%) | 426 | 46.85% |
| Wage / Income Gap ($) | 426 | 53.15¢ per $1 |
| Gini / Inequality Index | 426 | 0.34 |
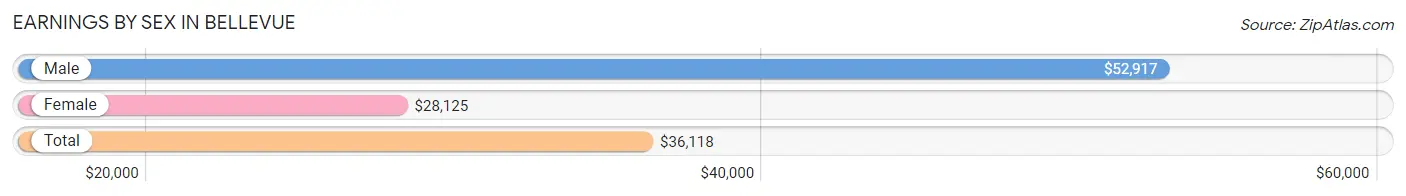
Earnings by Sex in Bellevue
Average Earnings in Bellevue are $36,118, $52,917 for men and $28,125 for women, a difference of 46.9%.
| Sex | Number | Average Earnings |
| Male | 99 (53.5%) | $52,917 |
| Female | 86 (46.5%) | $28,125 |
| Total | 185 (100.0%) | $36,118 |
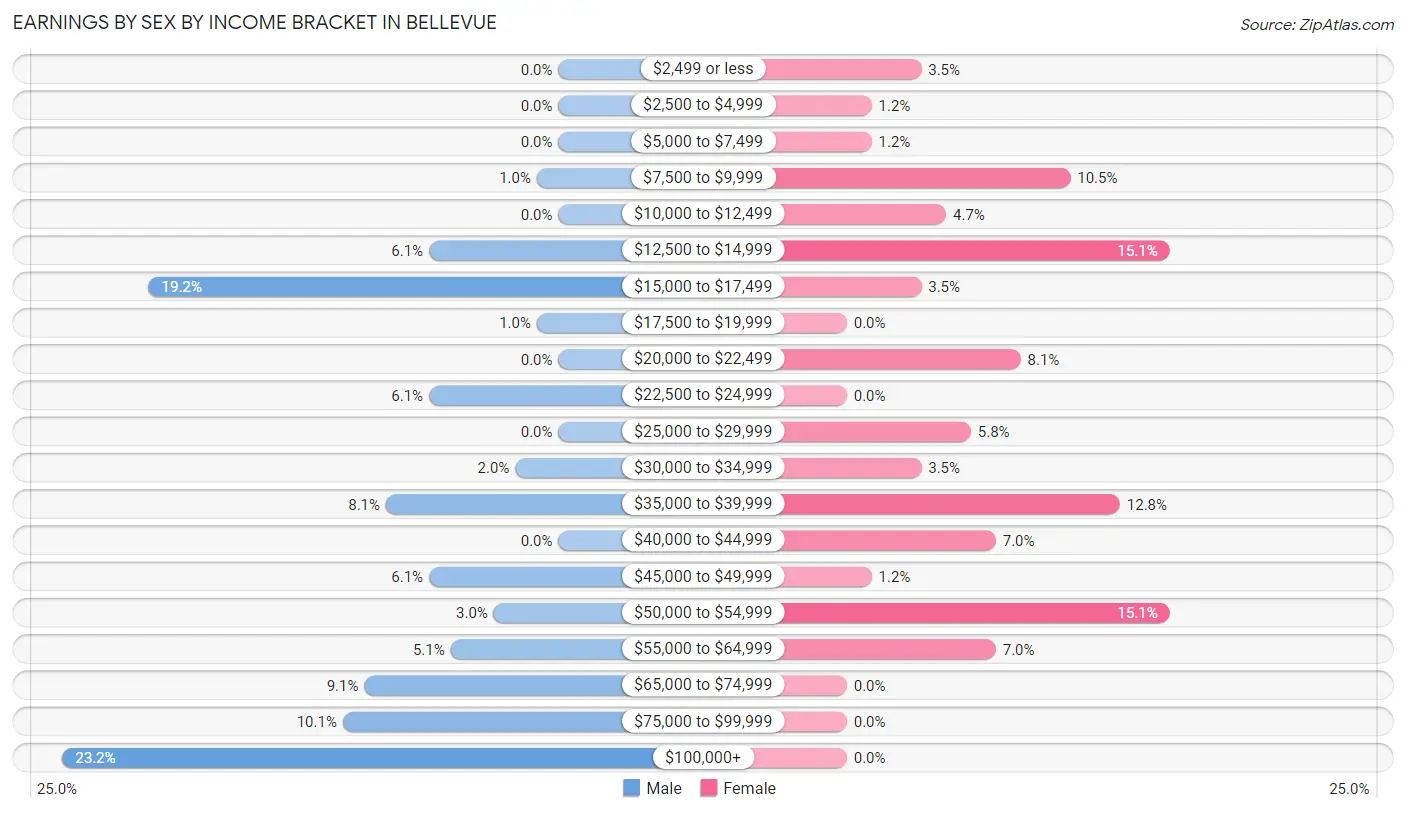
Earnings by Sex by Income Bracket in Bellevue
The most common earnings brackets in Bellevue are $100,000+ for men (23 | 23.2%) and $12,500 to $14,999 for women (13 | 15.1%).
| Income | Male | Female |
| $2,499 or less | 0 (0.0%) | 3 (3.5%) |
| $2,500 to $4,999 | 0 (0.0%) | 1 (1.2%) |
| $5,000 to $7,499 | 0 (0.0%) | 1 (1.2%) |
| $7,500 to $9,999 | 1 (1.0%) | 9 (10.5%) |
| $10,000 to $12,499 | 0 (0.0%) | 4 (4.6%) |
| $12,500 to $14,999 | 6 (6.1%) | 13 (15.1%) |
| $15,000 to $17,499 | 19 (19.2%) | 3 (3.5%) |
| $17,500 to $19,999 | 1 (1.0%) | 0 (0.0%) |
| $20,000 to $22,499 | 0 (0.0%) | 7 (8.1%) |
| $22,500 to $24,999 | 6 (6.1%) | 0 (0.0%) |
| $25,000 to $29,999 | 0 (0.0%) | 5 (5.8%) |
| $30,000 to $34,999 | 2 (2.0%) | 3 (3.5%) |
| $35,000 to $39,999 | 8 (8.1%) | 11 (12.8%) |
| $40,000 to $44,999 | 0 (0.0%) | 6 (7.0%) |
| $45,000 to $49,999 | 6 (6.1%) | 1 (1.2%) |
| $50,000 to $54,999 | 3 (3.0%) | 13 (15.1%) |
| $55,000 to $64,999 | 5 (5.1%) | 6 (7.0%) |
| $65,000 to $74,999 | 9 (9.1%) | 0 (0.0%) |
| $75,000 to $99,999 | 10 (10.1%) | 0 (0.0%) |
| $100,000+ | 23 (23.2%) | 0 (0.0%) |
| Total | 99 (100.0%) | 86 (100.0%) |
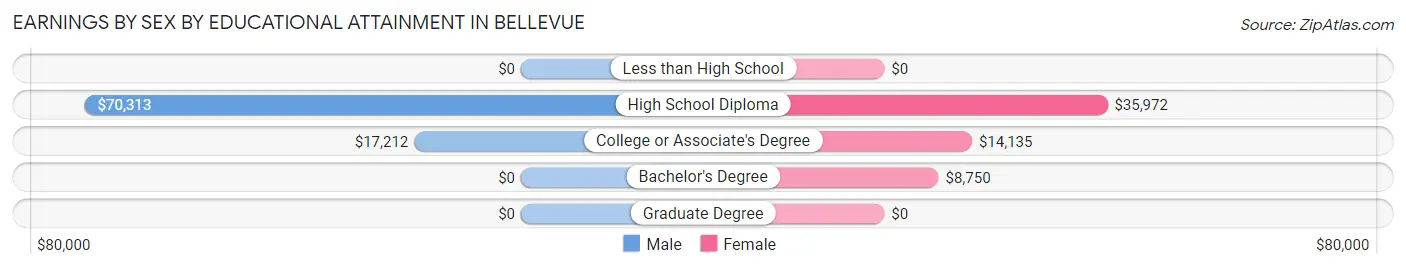
Earnings by Sex by Educational Attainment in Bellevue
Average earnings in Bellevue are $48,750 for men and $22,321 for women, a difference of 54.2%. Men with an educational attainment of high school diploma enjoy the highest average annual earnings of $70,313, while those with college or associate's degree education earn the least with $17,212. Women with an educational attainment of high school diploma earn the most with the average annual earnings of $35,972, while those with bachelor's degree education have the smallest earnings of $8,750.
| Educational Attainment | Male Income | Female Income |
| Less than High School | - | - |
| High School Diploma | $70,313 | $35,972 |
| College or Associate's Degree | $17,212 | $14,135 |
| Bachelor's Degree | - | - |
| Graduate Degree | - | - |
| Total | $48,750 | $22,321 |
Family Income in Bellevue
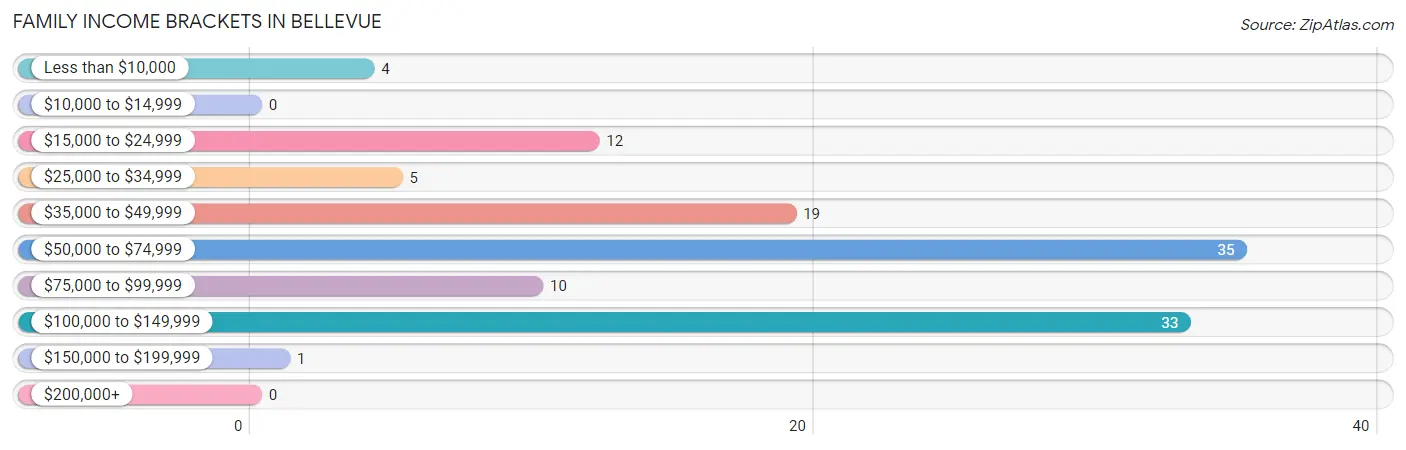
Family Income Brackets in Bellevue
According to the Bellevue family income data, there are 35 families falling into the $50,000 to $74,999 income range, which is the most common income bracket and makes up 29.4% of all families.
| Income Bracket | # Families | % Families |
| Less than $10,000 | 4 | 3.4% |
| $10,000 to $14,999 | 0 | 0.0% |
| $15,000 to $24,999 | 12 | 10.1% |
| $25,000 to $34,999 | 5 | 4.2% |
| $35,000 to $49,999 | 19 | 16.0% |
| $50,000 to $74,999 | 35 | 29.4% |
| $75,000 to $99,999 | 10 | 8.4% |
| $100,000 to $149,999 | 33 | 27.7% |
| $150,000 to $199,999 | 1 | 0.8% |
| $200,000+ | 0 | 0.0% |
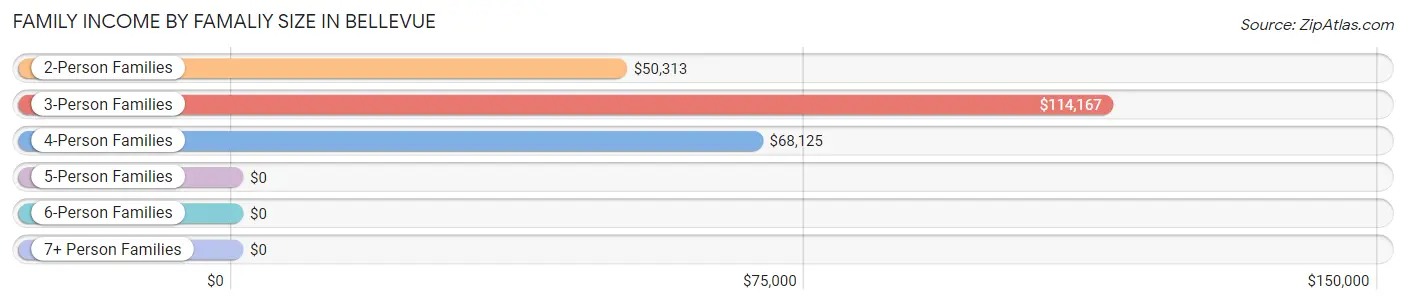
Family Income by Famaliy Size in Bellevue
3-person families (48 | 40.3%) account for the highest median family income in Bellevue with $114,167 per family, while 3-person families (48 | 40.3%) have the highest median income of $38,056 per family member.
| Income Bracket | # Families | Median Income |
| 2-Person Families | 39 (32.8%) | $50,313 |
| 3-Person Families | 48 (40.3%) | $114,167 |
| 4-Person Families | 15 (12.6%) | $68,125 |
| 5-Person Families | 12 (10.1%) | $0 |
| 6-Person Families | 5 (4.2%) | $0 |
| 7+ Person Families | 0 (0.0%) | $0 |
| Total | 119 (100.0%) | $66,250 |
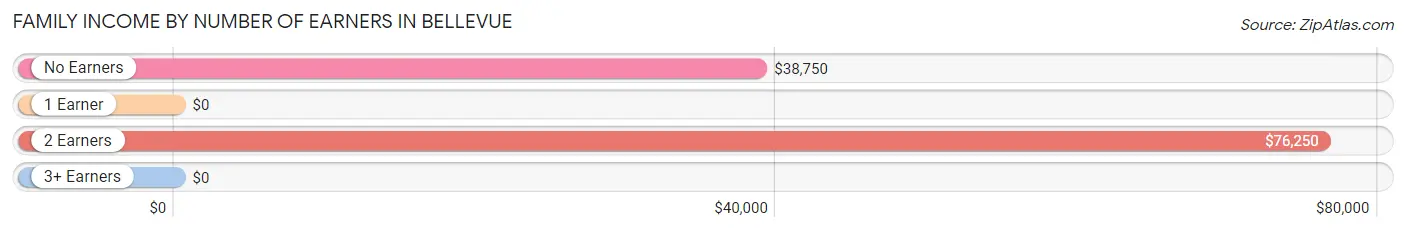
Family Income by Number of Earners in Bellevue
| Number of Earners | # Families | Median Income |
| No Earners | 16 (13.5%) | $38,750 |
| 1 Earner | 36 (30.2%) | $0 |
| 2 Earners | 64 (53.8%) | $76,250 |
| 3+ Earners | 3 (2.5%) | $0 |
| Total | 119 (100.0%) | $66,250 |
Household Income in Bellevue
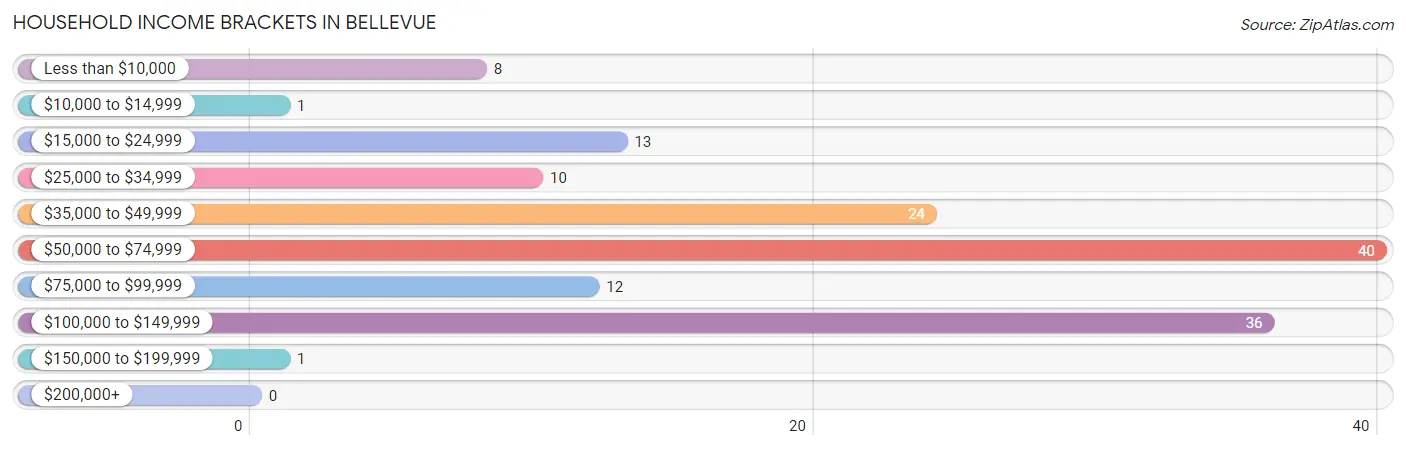
Household Income Brackets in Bellevue
With 40 households falling in the category, the $50,000 to $74,999 income range is the most frequent in Bellevue, accounting for 27.6% of all households.
| Income Bracket | # Households | % Households |
| Less than $10,000 | 8 | 5.5% |
| $10,000 to $14,999 | 1 | 0.7% |
| $15,000 to $24,999 | 13 | 9.0% |
| $25,000 to $34,999 | 10 | 6.9% |
| $35,000 to $49,999 | 24 | 16.6% |
| $50,000 to $74,999 | 40 | 27.6% |
| $75,000 to $99,999 | 12 | 8.3% |
| $100,000 to $149,999 | 36 | 24.8% |
| $150,000 to $199,999 | 1 | 0.7% |
| $200,000+ | 0 | 0.0% |
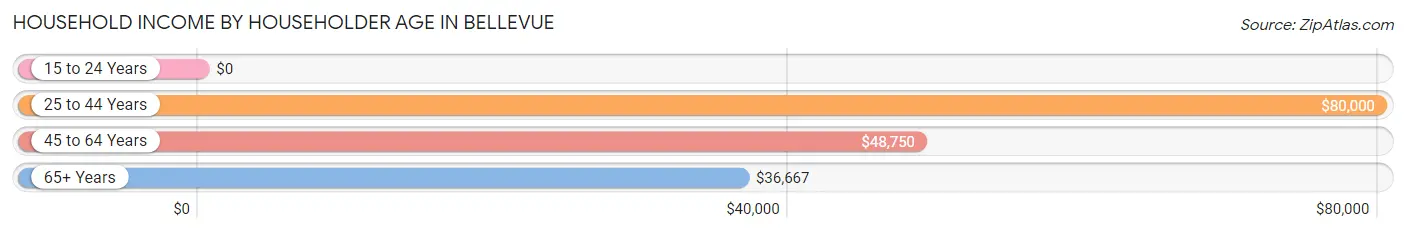
Household Income by Householder Age in Bellevue
The median household income in Bellevue is $65,662, with the highest median household income of $80,000 found in the 25 to 44 years age bracket for the primary householder. A total of 66 households (45.5%) fall into this category.
| Income Bracket | # Households | Median Income |
| 15 to 24 Years | 0 (0.0%) | $0 |
| 25 to 44 Years | 66 (45.5%) | $80,000 |
| 45 to 64 Years | 51 (35.2%) | $48,750 |
| 65+ Years | 28 (19.3%) | $36,667 |
| Total | 145 (100.0%) | $65,662 |
Poverty in Bellevue
Income Below Poverty by Sex and Age in Bellevue
With 17.5% poverty level for males and 20.2% for females among the residents of Bellevue, 15 year old males and 55 to 64 year old females are the most vulnerable to poverty, with 14 males (45.2%) and 16 females (55.2%) in their respective age groups living below the poverty level.
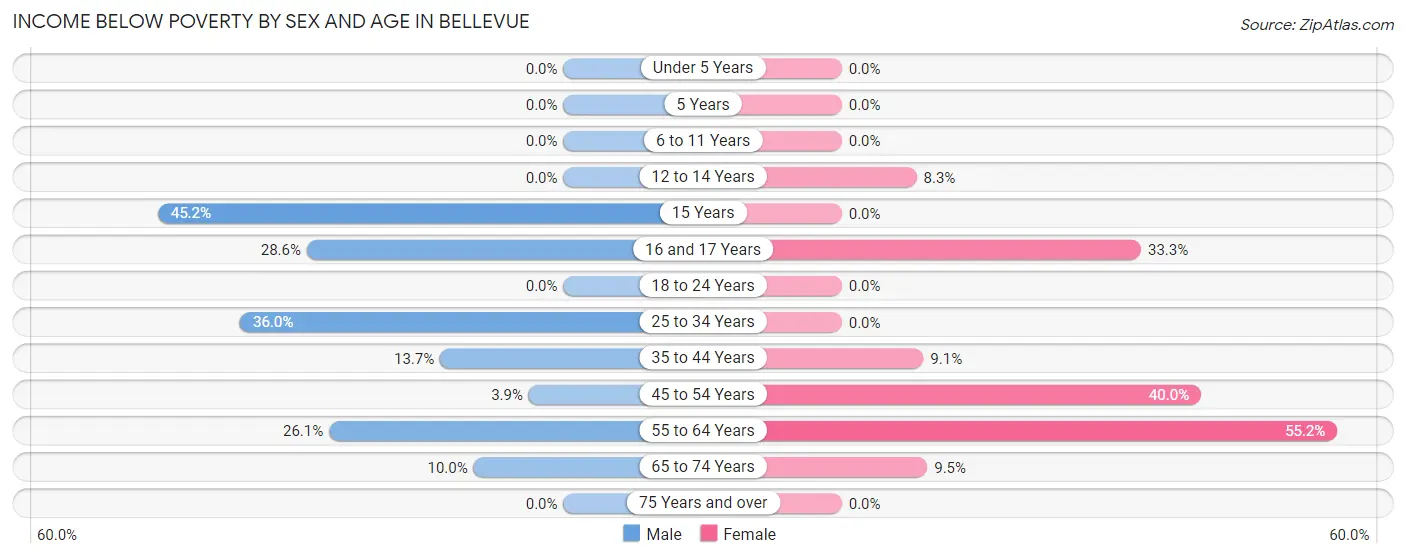
| Age Bracket | Male | Female |
| Under 5 Years | 0 (0.0%) | 0 (0.0%) |
| 5 Years | 0 (0.0%) | 0 (0.0%) |
| 6 to 11 Years | 0 (0.0%) | 0 (0.0%) |
| 12 to 14 Years | 0 (0.0%) | 1 (8.3%) |
| 15 Years | 14 (45.2%) | 0 (0.0%) |
| 16 and 17 Years | 2 (28.6%) | 9 (33.3%) |
| 18 to 24 Years | 0 (0.0%) | 0 (0.0%) |
| 25 to 34 Years | 9 (36.0%) | 0 (0.0%) |
| 35 to 44 Years | 7 (13.7%) | 4 (9.1%) |
| 45 to 54 Years | 1 (3.8%) | 8 (40.0%) |
| 55 to 64 Years | 6 (26.1%) | 16 (55.2%) |
| 65 to 74 Years | 1 (10.0%) | 2 (9.5%) |
| 75 Years and over | 0 (0.0%) | 0 (0.0%) |
| Total | 40 (17.5%) | 40 (20.2%) |
Income Above Poverty by Sex and Age in Bellevue
According to the poverty statistics in Bellevue, males aged under 5 years and females aged 5 years are the age groups that are most secure financially, with 100.0% of males and 100.0% of females in these age groups living above the poverty line.
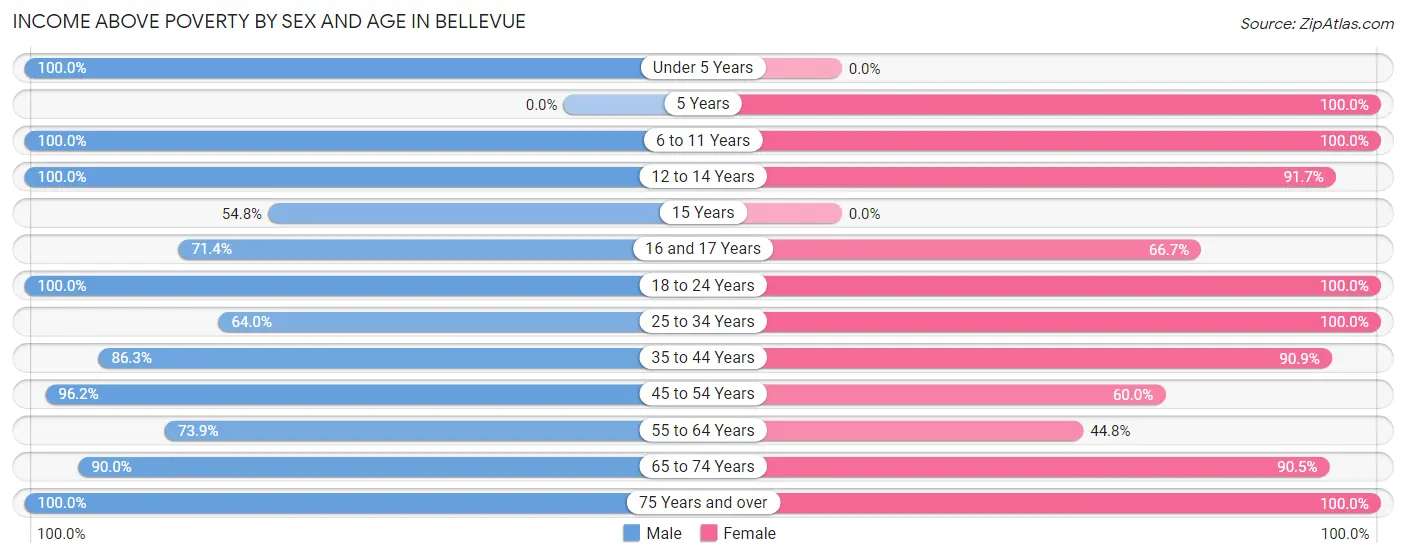
| Age Bracket | Male | Female |
| Under 5 Years | 14 (100.0%) | 0 (0.0%) |
| 5 Years | 0 (0.0%) | 6 (100.0%) |
| 6 to 11 Years | 16 (100.0%) | 5 (100.0%) |
| 12 to 14 Years | 14 (100.0%) | 11 (91.7%) |
| 15 Years | 17 (54.8%) | 0 (0.0%) |
| 16 and 17 Years | 5 (71.4%) | 18 (66.7%) |
| 18 to 24 Years | 7 (100.0%) | 11 (100.0%) |
| 25 to 34 Years | 16 (64.0%) | 18 (100.0%) |
| 35 to 44 Years | 44 (86.3%) | 40 (90.9%) |
| 45 to 54 Years | 25 (96.2%) | 12 (60.0%) |
| 55 to 64 Years | 17 (73.9%) | 13 (44.8%) |
| 65 to 74 Years | 9 (90.0%) | 19 (90.5%) |
| 75 Years and over | 4 (100.0%) | 5 (100.0%) |
| Total | 188 (82.5%) | 158 (79.8%) |
Income Below Poverty Among Married-Couple Families in Bellevue
The poverty statistics for married-couple families in Bellevue show that 2.0% or 2 of the total 98 families live below the poverty line. Families with no children have the highest poverty rate of 3.3%, comprising of 1 families. On the other hand, families with 3 or 4 children have the lowest poverty rate of 0.0%, which includes 0 families.
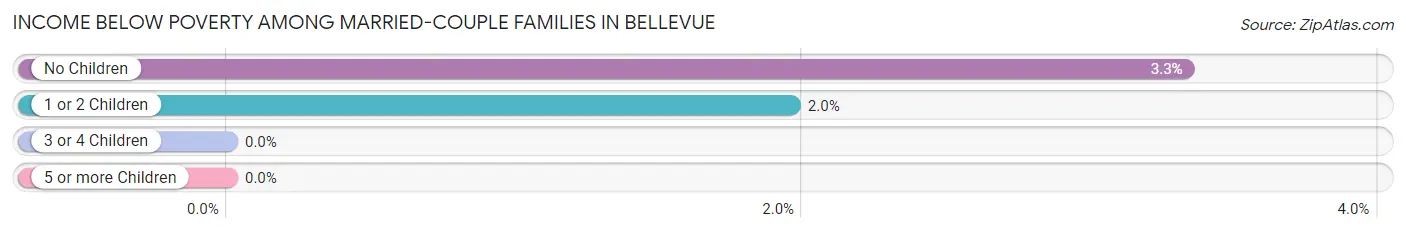
| Children | Above Poverty | Below Poverty |
| No Children | 29 (96.7%) | 1 (3.3%) |
| 1 or 2 Children | 50 (98.0%) | 1 (2.0%) |
| 3 or 4 Children | 17 (100.0%) | 0 (0.0%) |
| 5 or more Children | 0 (0.0%) | 0 (0.0%) |
| Total | 96 (98.0%) | 2 (2.0%) |
Income Below Poverty Among Single-Parent Households in Bellevue
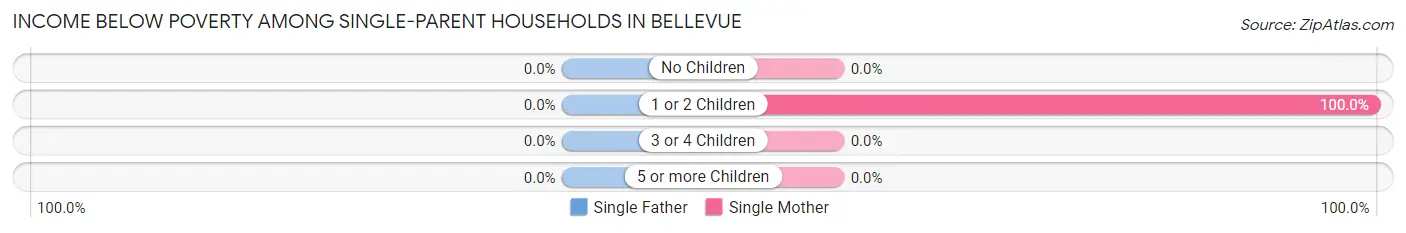
| Children | Single Father | Single Mother |
| No Children | 0 (0.0%) | 0 (0.0%) |
| 1 or 2 Children | 0 (0.0%) | 11 (100.0%) |
| 3 or 4 Children | 0 (0.0%) | 0 (0.0%) |
| 5 or more Children | 0 (0.0%) | 0 (0.0%) |
| Total | 0 (0.0%) | 11 (68.8%) |
Income Below Poverty Among Married-Couple vs Single-Parent Households in Bellevue
The poverty data for Bellevue shows that 2 of the married-couple family households (2.0%) and 11 of the single-parent households (52.4%) are living below the poverty level. Within the married-couple family households, those with no children have the highest poverty rate, with 1 households (3.3%) falling below the poverty line. Among the single-parent households, those with 1 or 2 children have the highest poverty rate, with 11 household (68.8%) living below poverty.
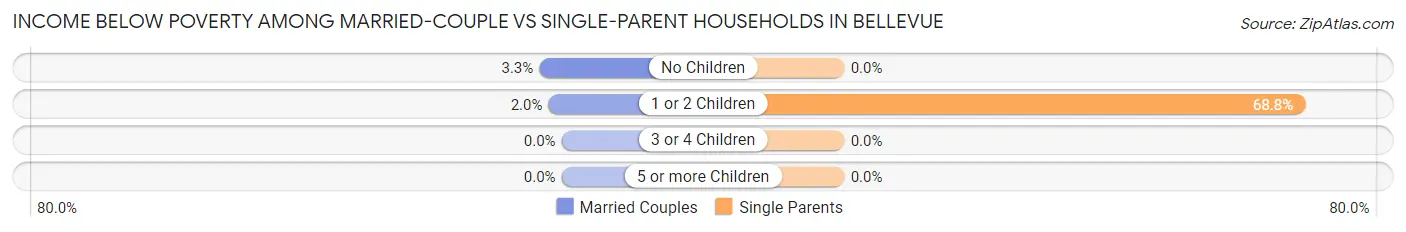
| Children | Married-Couple Families | Single-Parent Households |
| No Children | 1 (3.3%) | 0 (0.0%) |
| 1 or 2 Children | 1 (2.0%) | 11 (68.8%) |
| 3 or 4 Children | 0 (0.0%) | 0 (0.0%) |
| 5 or more Children | 0 (0.0%) | 0 (0.0%) |
| Total | 2 (2.0%) | 11 (52.4%) |
Race in Bellevue
The most populous races in Bellevue are White / Caucasian (401 | 94.1%), Native / Alaskan (12 | 2.8%), and Two or more Races (7 | 1.6%).
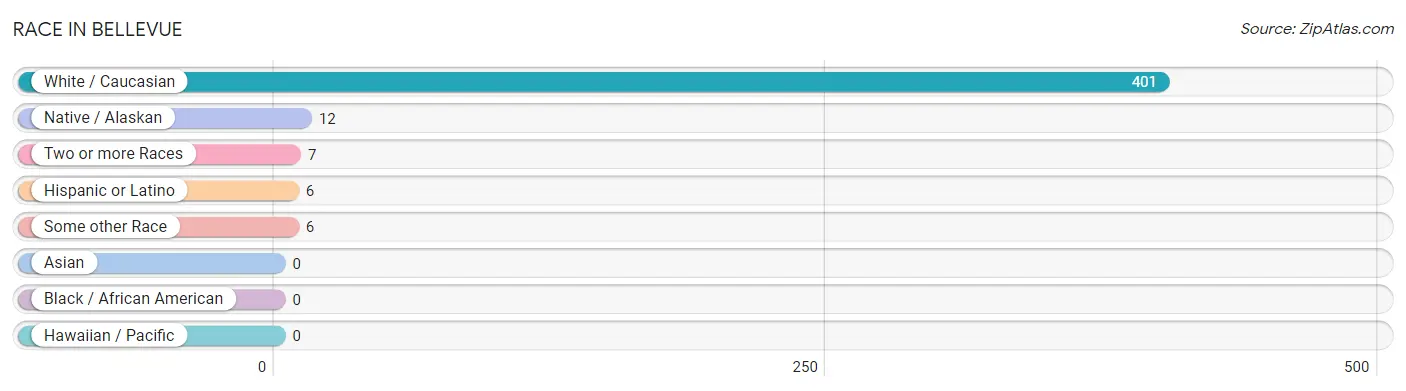
| Race | # Population | % Population |
| Asian | 0 | 0.0% |
| Black / African American | 0 | 0.0% |
| Hawaiian / Pacific | 0 | 0.0% |
| Hispanic or Latino | 6 | 1.4% |
| Native / Alaskan | 12 | 2.8% |
| White / Caucasian | 401 | 94.1% |
| Two or more Races | 7 | 1.6% |
| Some other Race | 6 | 1.4% |
| Total | 426 | 100.0% |
Ancestry in Bellevue
The most populous ancestries reported in Bellevue are German (26 | 6.1%), English (25 | 5.9%), Irish (15 | 3.5%), Choctaw (12 | 2.8%), and Dutch (8 | 1.9%), together accounting for 20.2% of all Bellevue residents.
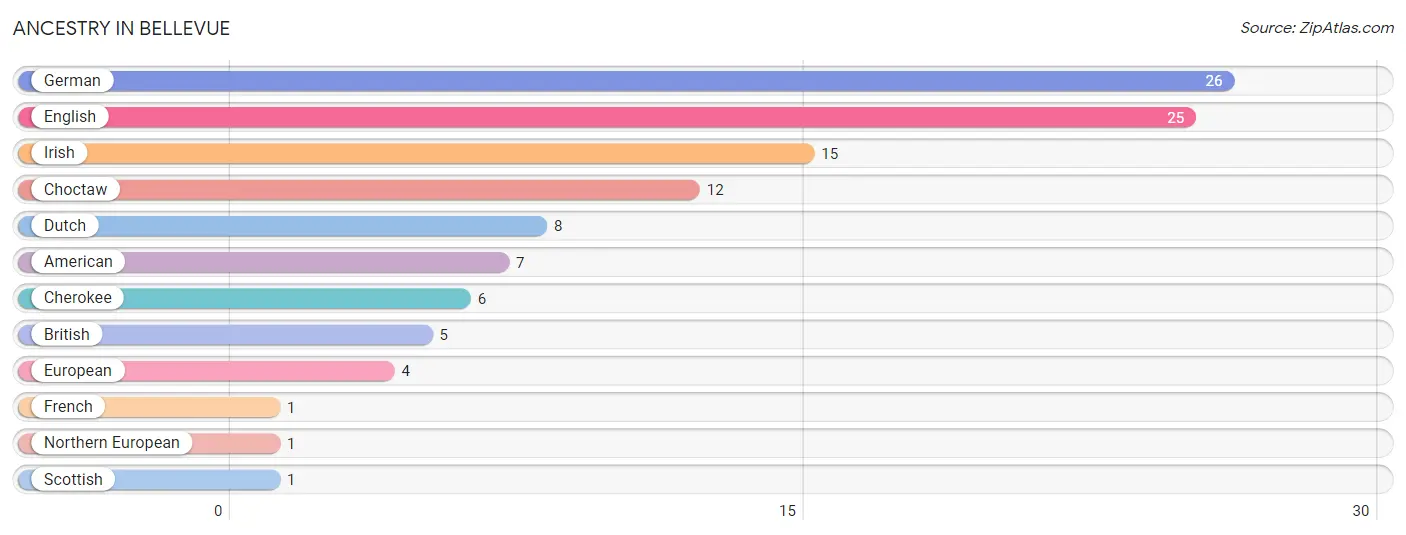
| Ancestry | # Population | % Population |
| American | 7 | 1.6% |
| British | 5 | 1.2% |
| Cherokee | 6 | 1.4% |
| Choctaw | 12 | 2.8% |
| Dutch | 8 | 1.9% |
| English | 25 | 5.9% |
| European | 4 | 0.9% |
| French | 1 | 0.2% |
| German | 26 | 6.1% |
| Irish | 15 | 3.5% |
| Northern European | 1 | 0.2% |
| Scottish | 1 | 0.2% | View All 12 Rows |
Immigrants in Bellevue
The most numerous immigrant groups reported in Bellevue came from Europe (6 | 1.4%), Northern Europe (5 | 1.2%), Germany (1 | 0.2%), and Western Europe (1 | 0.2%), together accounting for 3.0% of all Bellevue residents.
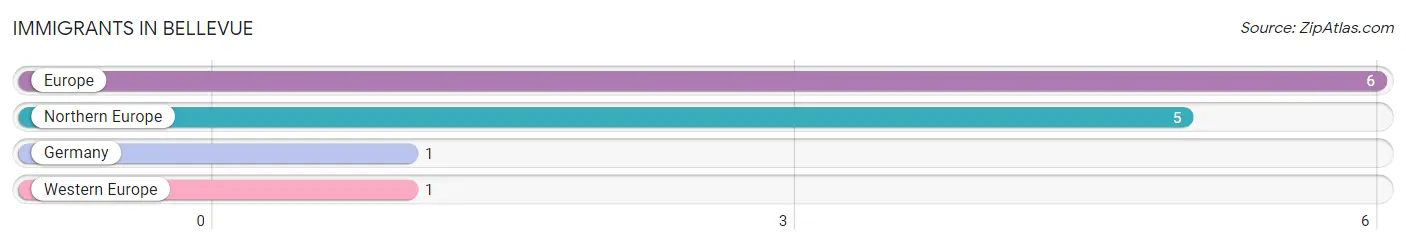
| Immigration Origin | # Population | % Population |
| Europe | 6 | 1.4% |
| Germany | 1 | 0.2% |
| Northern Europe | 5 | 1.2% |
| Western Europe | 1 | 0.2% | View All 4 Rows |
Sex and Age in Bellevue
Sex and Age in Bellevue
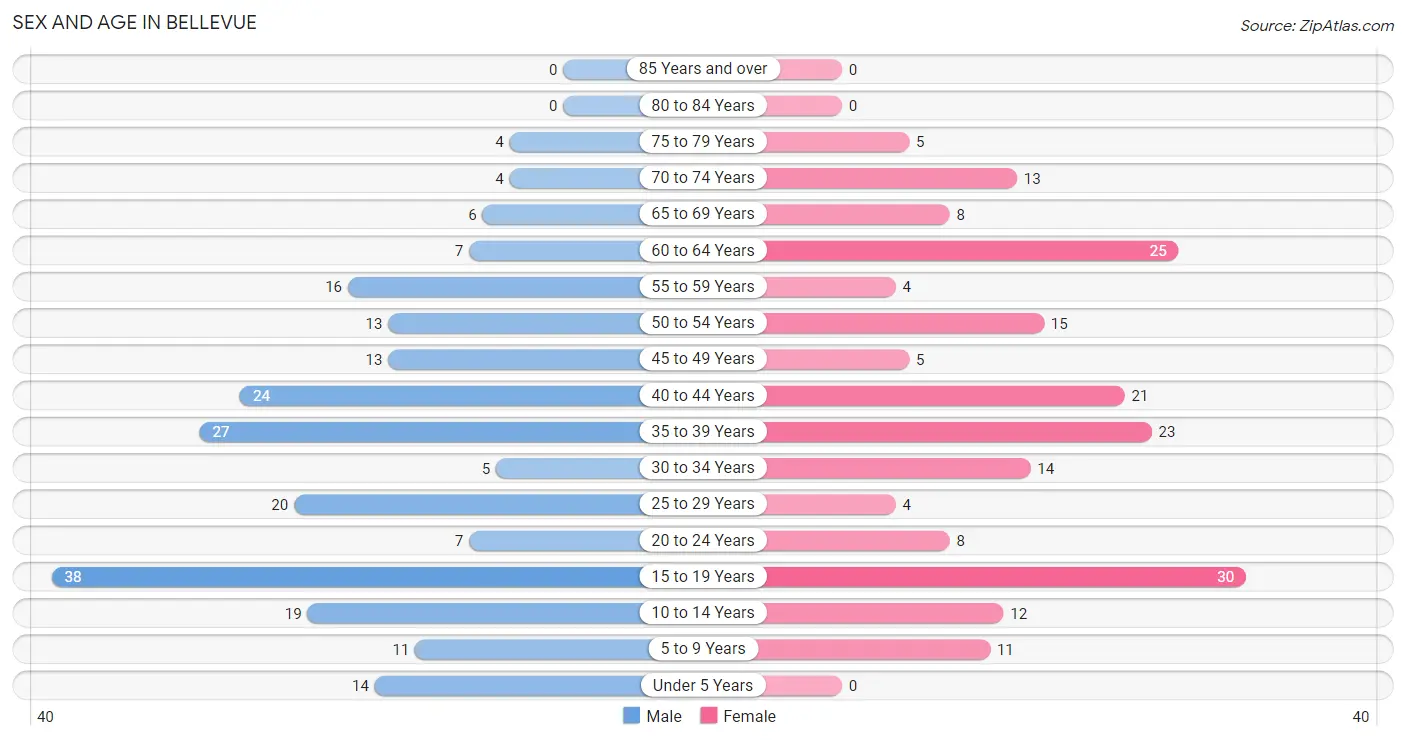
The most populous age groups in Bellevue are 15 to 19 Years (38 | 16.7%) for men and 15 to 19 Years (30 | 15.1%) for women.
| Age Bracket | Male | Female |
| Under 5 Years | 14 (6.1%) | 0 (0.0%) |
| 5 to 9 Years | 11 (4.8%) | 11 (5.6%) |
| 10 to 14 Years | 19 (8.3%) | 12 (6.1%) |
| 15 to 19 Years | 38 (16.7%) | 30 (15.1%) |
| 20 to 24 Years | 7 (3.1%) | 8 (4.0%) |
| 25 to 29 Years | 20 (8.8%) | 4 (2.0%) |
| 30 to 34 Years | 5 (2.2%) | 14 (7.1%) |
| 35 to 39 Years | 27 (11.8%) | 23 (11.6%) |
| 40 to 44 Years | 24 (10.5%) | 21 (10.6%) |
| 45 to 49 Years | 13 (5.7%) | 5 (2.5%) |
| 50 to 54 Years | 13 (5.7%) | 15 (7.6%) |
| 55 to 59 Years | 16 (7.0%) | 4 (2.0%) |
| 60 to 64 Years | 7 (3.1%) | 25 (12.6%) |
| 65 to 69 Years | 6 (2.6%) | 8 (4.0%) |
| 70 to 74 Years | 4 (1.8%) | 13 (6.6%) |
| 75 to 79 Years | 4 (1.8%) | 5 (2.5%) |
| 80 to 84 Years | 0 (0.0%) | 0 (0.0%) |
| 85 Years and over | 0 (0.0%) | 0 (0.0%) |
| Total | 228 (100.0%) | 198 (100.0%) |
Families and Households in Bellevue
Median Family Size in Bellevue
The median family size in Bellevue is 3.03 persons per family, with married-couple families (98 | 82.4%) accounting for the largest median family size of 3.09 persons per family. On the other hand, single male/father families (5 | 4.2%) represent the smallest median family size with 2.20 persons per family.
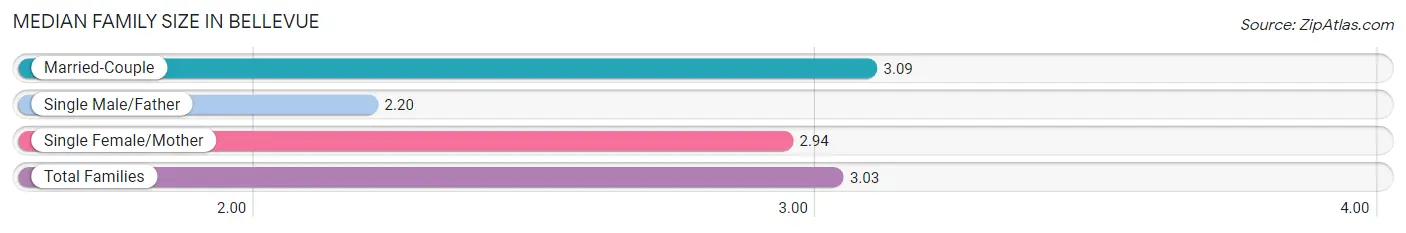
| Family Type | # Families | Family Size |
| Married-Couple | 98 (82.4%) | 3.09 |
| Single Male/Father | 5 (4.2%) | 2.20 |
| Single Female/Mother | 16 (13.5%) | 2.94 |
| Total Families | 119 (100.0%) | 3.03 |
Median Household Size in Bellevue
The median household size in Bellevue is 2.94 persons per household, with single female/mother households (16 | 11.0%) accounting for the largest median household size of 4.19 persons per household. non-family households (26 | 17.9%) represent the smallest median household size with 1.73 persons per household.
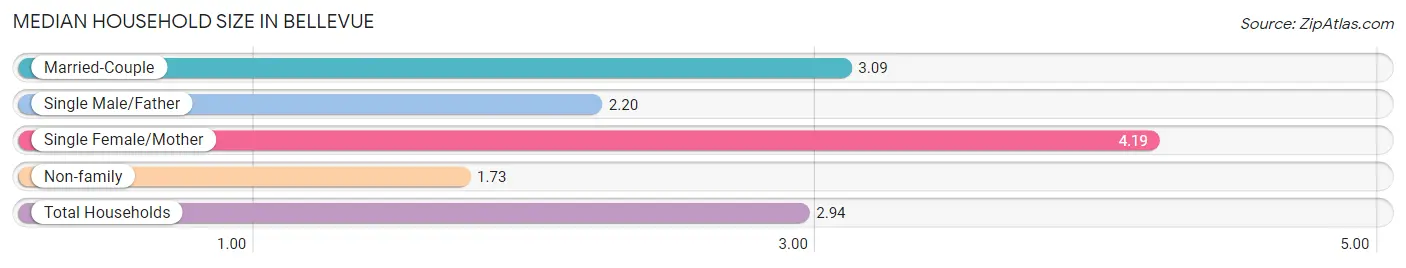
| Household Type | # Households | Household Size |
| Married-Couple | 98 (67.6%) | 3.09 |
| Single Male/Father | 5 (3.5%) | 2.20 |
| Single Female/Mother | 16 (11.0%) | 4.19 |
| Non-family | 26 (17.9%) | 1.73 |
| Total Households | 145 (100.0%) | 2.94 |
Household Size by Marriage Status in Bellevue
Out of a total of 145 households in Bellevue, 119 (82.1%) are family households, while 26 (17.9%) are nonfamily households. The most numerous type of family households are 3-person households, comprising 48, and the most common type of nonfamily households are 1-person households, comprising 21.
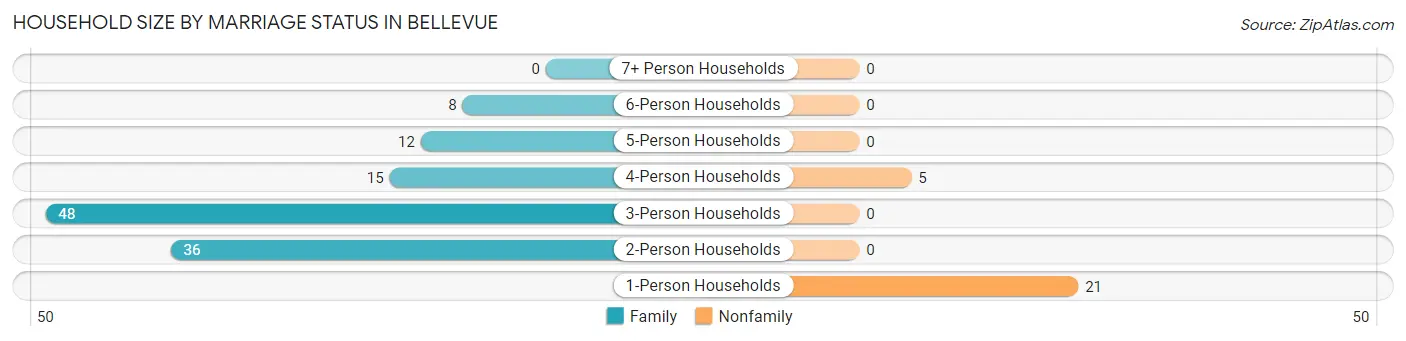
| Household Size | Family Households | Nonfamily Households |
| 1-Person Households | - | 21 (14.5%) |
| 2-Person Households | 36 (24.8%) | 0 (0.0%) |
| 3-Person Households | 48 (33.1%) | 0 (0.0%) |
| 4-Person Households | 15 (10.3%) | 5 (3.5%) |
| 5-Person Households | 12 (8.3%) | 0 (0.0%) |
| 6-Person Households | 8 (5.5%) | 0 (0.0%) |
| 7+ Person Households | 0 (0.0%) | 0 (0.0%) |
| Total | 119 (82.1%) | 26 (17.9%) |
Female Fertility in Bellevue
Fertility by Age in Bellevue
Average fertility rate in Bellevue is 142.0 births per 1,000 women. Women in the age bracket of 35 to 50 years have the highest fertility rate with 240.0 births per 1,000 women. Women in the age bracket of 35 to 50 years acount for 80.0% of all women with births.
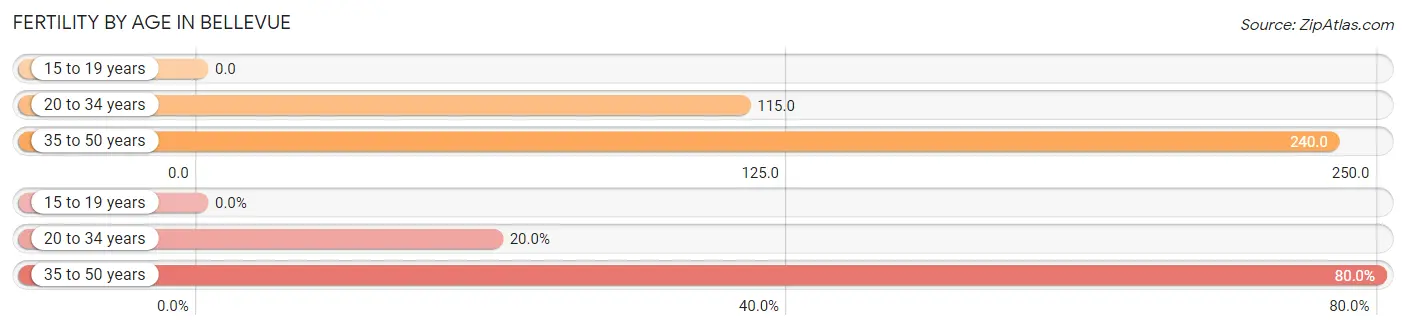
| Age Bracket | Women with Births | Births / 1,000 Women |
| 15 to 19 years | 0 (0.0%) | 0.0 |
| 20 to 34 years | 3 (20.0%) | 115.0 |
| 35 to 50 years | 12 (80.0%) | 240.0 |
| Total | 15 (100.0%) | 142.0 |
Fertility by Age by Marriage Status in Bellevue
80.0% of women with births (15) in Bellevue are married. The highest percentage of unmarried women with births falls into 20 to 34 years age bracket with 100.0% of them unmarried at the time of birth, while the lowest percentage of unmarried women with births belong to 35 to 50 years age bracket with 0.0% of them unmarried.
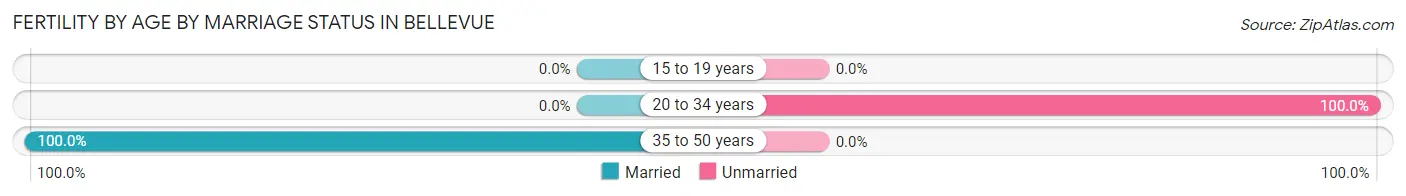
| Age Bracket | Married | Unmarried |
| 15 to 19 years | 0 (0.0%) | 0 (0.0%) |
| 20 to 34 years | 0 (0.0%) | 3 (100.0%) |
| 35 to 50 years | 12 (100.0%) | 0 (0.0%) |
| Total | 12 (80.0%) | 3 (20.0%) |
Fertility by Education in Bellevue
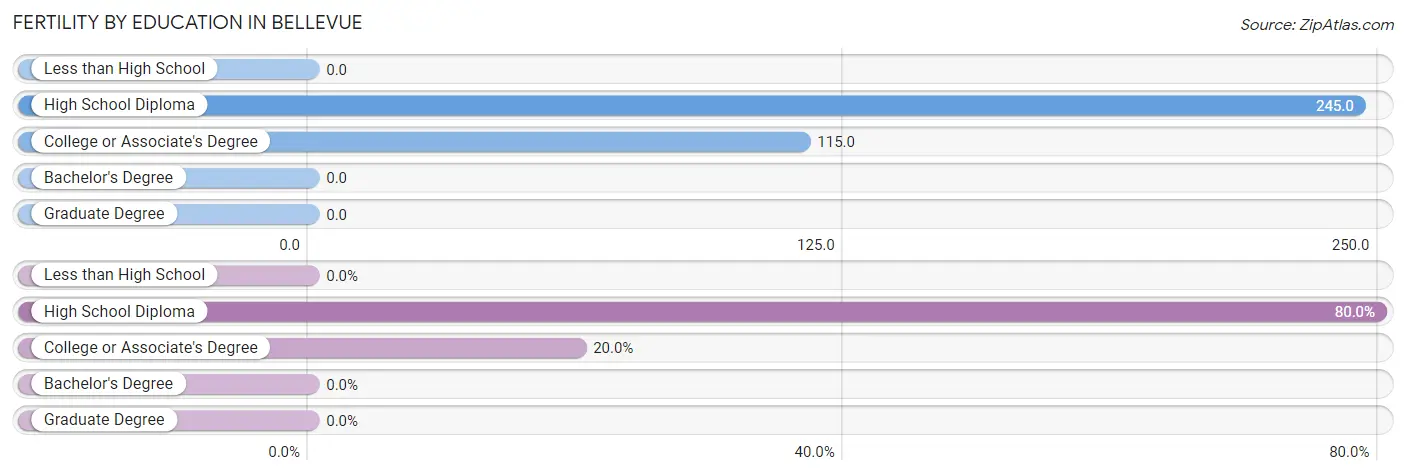
| Educational Attainment | Women with Births | Births / 1,000 Women |
| Less than High School | 0 (0.0%) | 0.0 |
| High School Diploma | 12 (80.0%) | 245.0 |
| College or Associate's Degree | 3 (20.0%) | 115.0 |
| Bachelor's Degree | 0 (0.0%) | 0.0 |
| Graduate Degree | 0 (0.0%) | 0.0 |
| Total | 15 (100.0%) | 142.0 |
Fertility by Education by Marriage Status in Bellevue
20.0% of women with births in Bellevue are unmarried. Women with the educational attainment of high school diploma are most likely to be married with 100.0% of them married at childbirth, while women with the educational attainment of college or associate's degree are least likely to be married with 100.0% of them unmarried at childbirth.
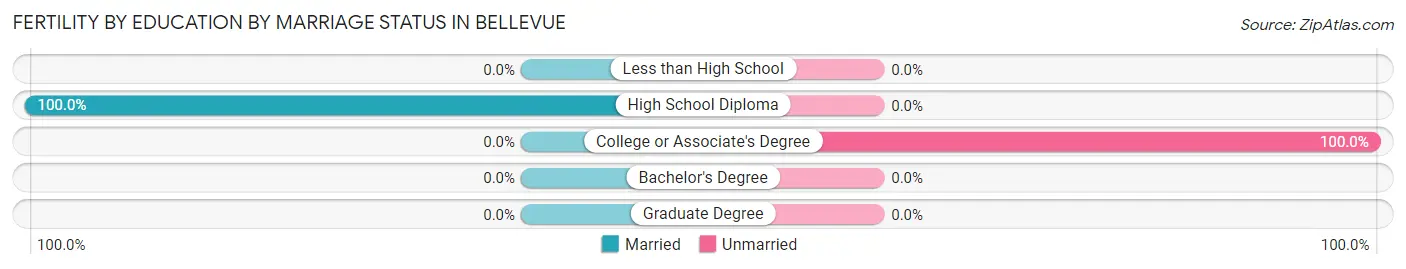
| Educational Attainment | Married | Unmarried |
| Less than High School | 0 (0.0%) | 0 (0.0%) |
| High School Diploma | 12 (100.0%) | 0 (0.0%) |
| College or Associate's Degree | 0 (0.0%) | 3 (100.0%) |
| Bachelor's Degree | 0 (0.0%) | 0 (0.0%) |
| Graduate Degree | 0 (0.0%) | 0 (0.0%) |
| Total | 12 (80.0%) | 3 (20.0%) |
Employment Characteristics in Bellevue
Employment by Class of Employer in Bellevue
Among the 182 employed individuals in Bellevue, private company employees (120 | 65.9%), local government employees (29 | 15.9%), and state government employees (18 | 9.9%) make up the most common classes of employment.
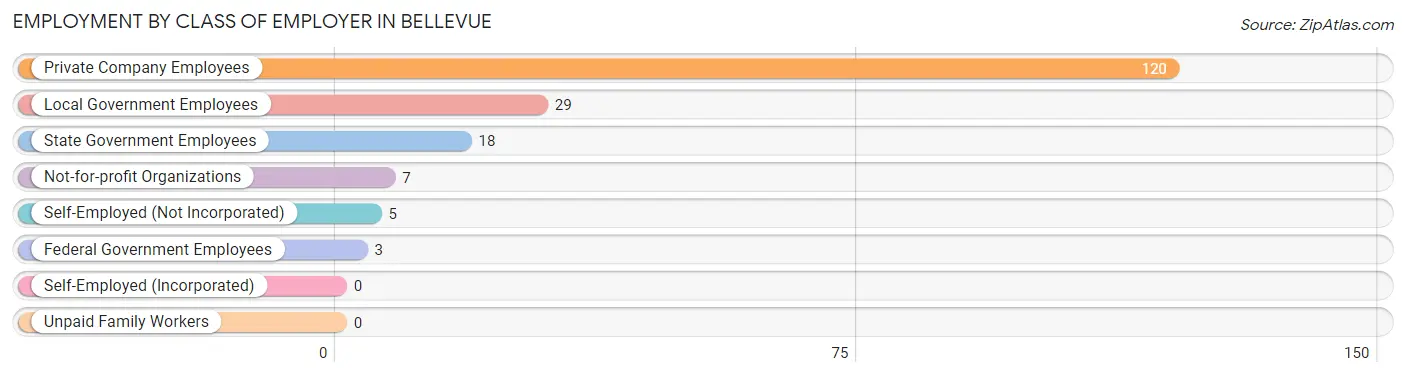
| Employer Class | # Employees | % Employees |
| Private Company Employees | 120 | 65.9% |
| Self-Employed (Incorporated) | 0 | 0.0% |
| Self-Employed (Not Incorporated) | 5 | 2.8% |
| Not-for-profit Organizations | 7 | 3.8% |
| Local Government Employees | 29 | 15.9% |
| State Government Employees | 18 | 9.9% |
| Federal Government Employees | 3 | 1.7% |
| Unpaid Family Workers | 0 | 0.0% |
| Total | 182 | 100.0% |
Employment Status by Age in Bellevue
According to the labor force statistics for Bellevue, out of the total population over 16 years of age (328), 58.5% or 192 individuals are in the labor force, with 4.2% or 8 of them unemployed. The age group with the highest labor force participation rate is 20 to 24 years, with 100.0% or 15 individuals in the labor force. Within the labor force, the 45 to 54 years age range has the highest percentage of unemployed individuals, with 10.7% or 3 of them being unemployed.
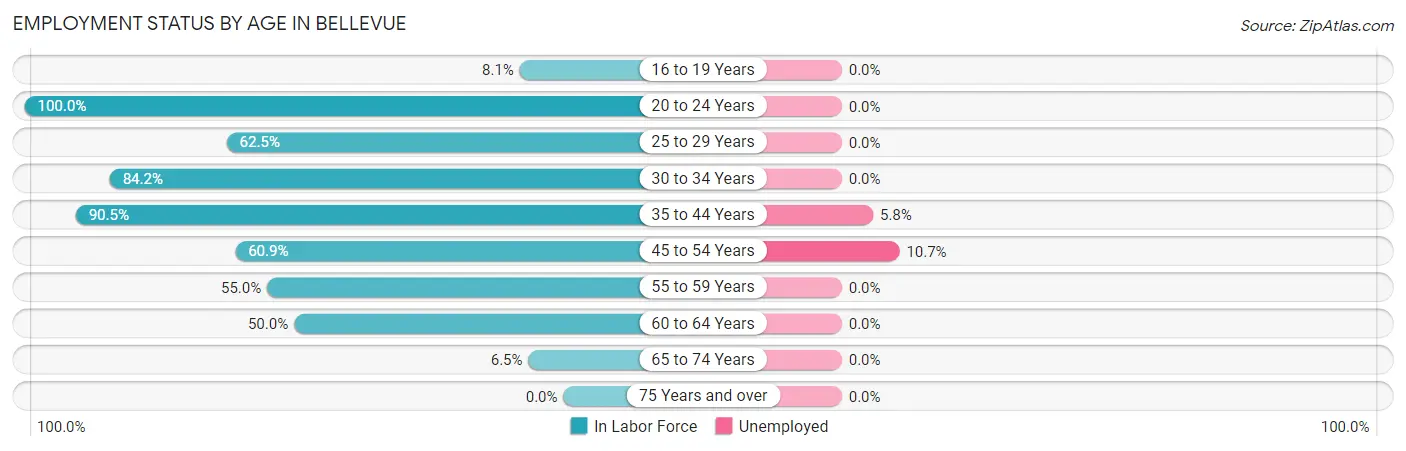
| Age Bracket | In Labor Force | Unemployed |
| 16 to 19 Years | 3 (8.1%) | 0 (0.0%) |
| 20 to 24 Years | 15 (100.0%) | 0 (0.0%) |
| 25 to 29 Years | 15 (62.5%) | 0 (0.0%) |
| 30 to 34 Years | 16 (84.2%) | 0 (0.0%) |
| 35 to 44 Years | 86 (90.5%) | 5 (5.8%) |
| 45 to 54 Years | 28 (60.9%) | 3 (10.7%) |
| 55 to 59 Years | 11 (55.0%) | 0 (0.0%) |
| 60 to 64 Years | 16 (50.0%) | 0 (0.0%) |
| 65 to 74 Years | 2 (6.5%) | 0 (0.0%) |
| 75 Years and over | 0 (0.0%) | 0 (0.0%) |
| Total | 192 (58.5%) | 8 (4.2%) |
Employment Status by Educational Attainment in Bellevue
According to labor force statistics for Bellevue, 72.9% of individuals (172) out of the total population between 25 and 64 years of age (236) are in the labor force, with 4.7% or 8 of them being unemployed. The group with the highest labor force participation rate are those with the educational attainment of high school diploma, with 91.2% or 93 individuals in the labor force. Within the labor force, individuals with less than high school education have the highest percentage of unemployment, with 55.6% or 5 of them being unemployed.
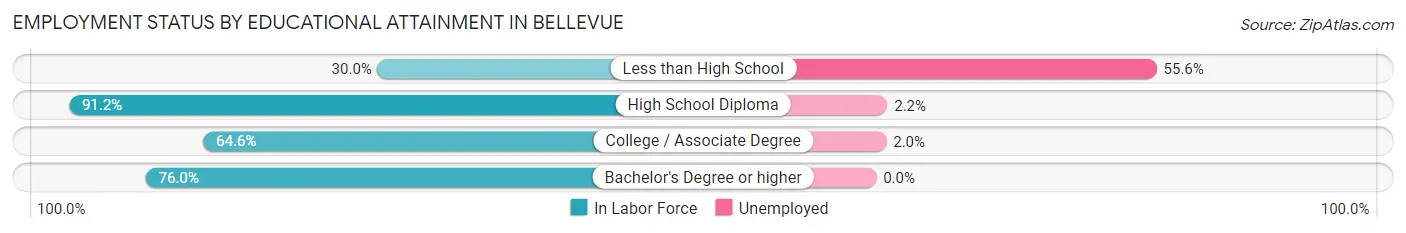
| Educational Attainment | In Labor Force | Unemployed |
| Less than High School | 9 (30.0%) | 17 (55.6%) |
| High School Diploma | 93 (91.2%) | 2 (2.2%) |
| College / Associate Degree | 51 (64.6%) | 2 (2.0%) |
| Bachelor's Degree or higher | 19 (76.0%) | 0 (0.0%) |
| Total | 172 (72.9%) | 11 (4.7%) |
Employment Occupations by Sex in Bellevue
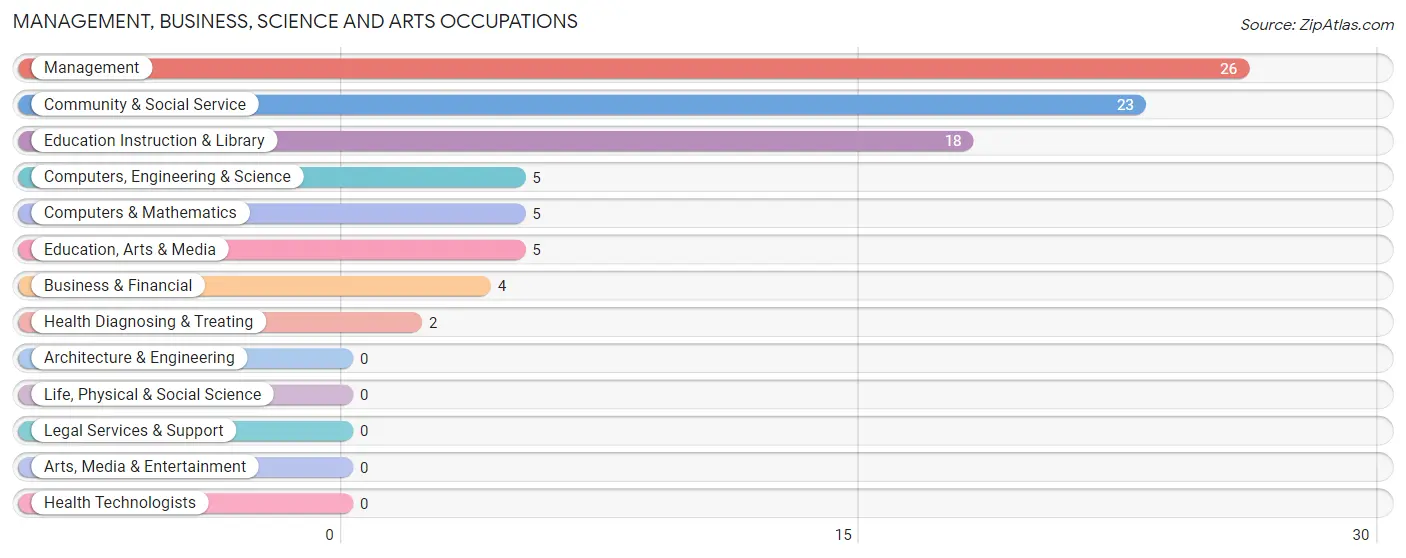
Management, Business, Science and Arts Occupations
The most common Management, Business, Science and Arts occupations in Bellevue are Management (26 | 14.1%), Community & Social Service (23 | 12.5%), Education Instruction & Library (18 | 9.8%), Computers, Engineering & Science (5 | 2.7%), and Computers & Mathematics (5 | 2.7%).
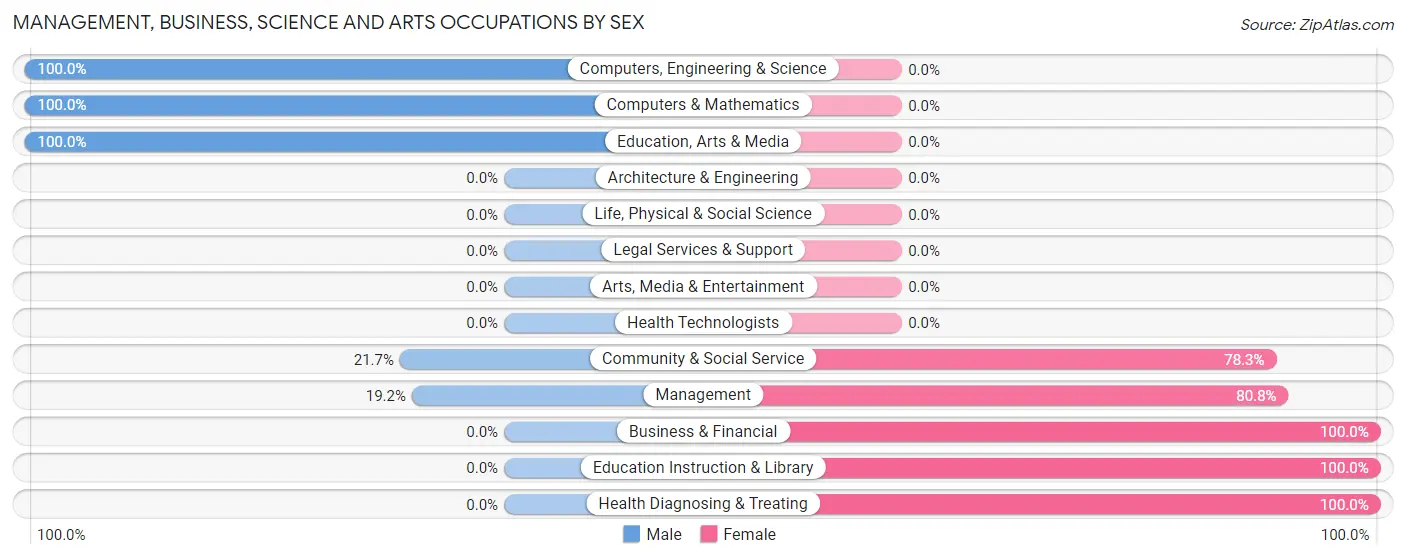
Management, Business, Science and Arts Occupations by Sex
Within the Management, Business, Science and Arts occupations in Bellevue, the most male-oriented occupations are Computers, Engineering & Science (100.0%), Computers & Mathematics (100.0%), and Education, Arts & Media (100.0%), while the most female-oriented occupations are Business & Financial (100.0%), Education Instruction & Library (100.0%), and Health Diagnosing & Treating (100.0%).
| Occupation | Male | Female |
| Management | 5 (19.2%) | 21 (80.8%) |
| Business & Financial | 0 (0.0%) | 4 (100.0%) |
| Computers, Engineering & Science | 5 (100.0%) | 0 (0.0%) |
| Computers & Mathematics | 5 (100.0%) | 0 (0.0%) |
| Architecture & Engineering | 0 (0.0%) | 0 (0.0%) |
| Life, Physical & Social Science | 0 (0.0%) | 0 (0.0%) |
| Community & Social Service | 5 (21.7%) | 18 (78.3%) |
| Education, Arts & Media | 5 (100.0%) | 0 (0.0%) |
| Legal Services & Support | 0 (0.0%) | 0 (0.0%) |
| Education Instruction & Library | 0 (0.0%) | 18 (100.0%) |
| Arts, Media & Entertainment | 0 (0.0%) | 0 (0.0%) |
| Health Diagnosing & Treating | 0 (0.0%) | 2 (100.0%) |
| Health Technologists | 0 (0.0%) | 0 (0.0%) |
| Total (Category) | 15 (25.0%) | 45 (75.0%) |
| Total (Overall) | 98 (53.3%) | 86 (46.7%) |
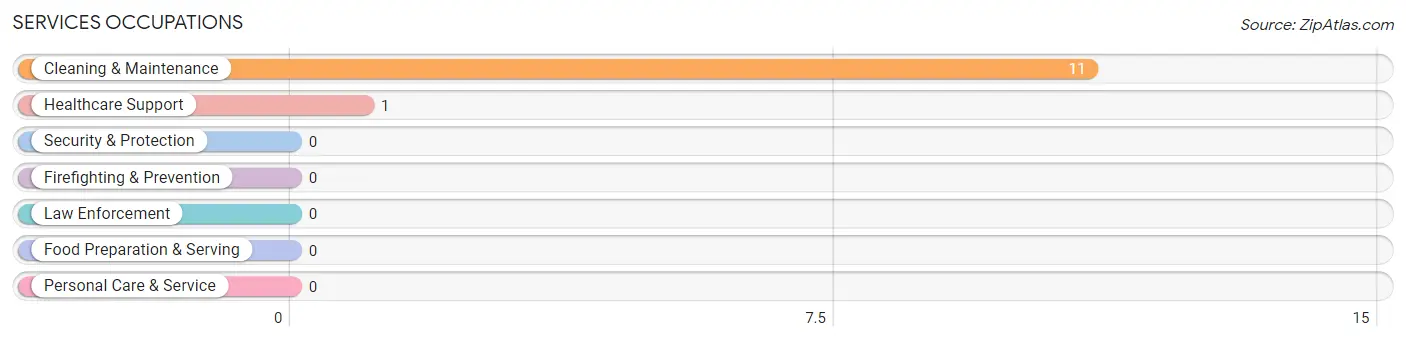
Services Occupations
The most common Services occupations in Bellevue are Cleaning & Maintenance (11 | 6.0%), and Healthcare Support (1 | 0.5%).
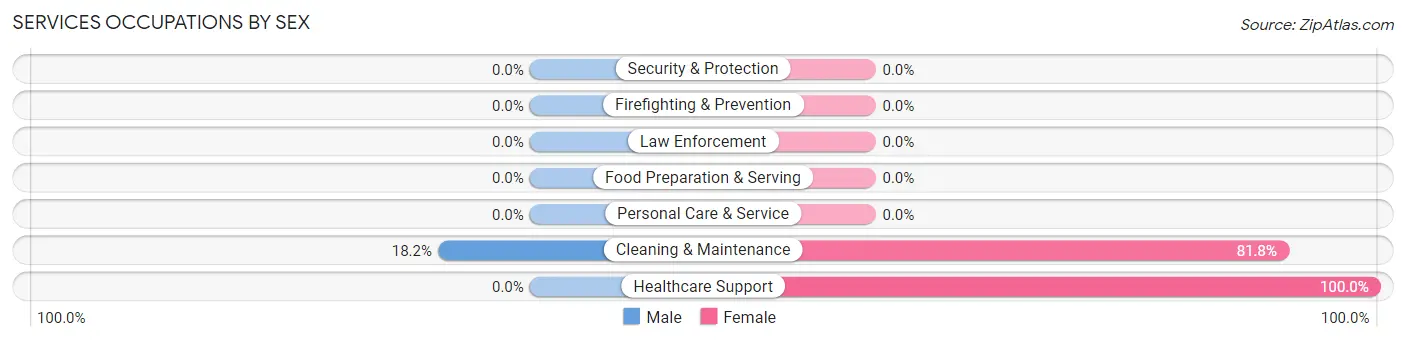
Services Occupations by Sex
| Occupation | Male | Female |
| Healthcare Support | 0 (0.0%) | 1 (100.0%) |
| Security & Protection | 0 (0.0%) | 0 (0.0%) |
| Firefighting & Prevention | 0 (0.0%) | 0 (0.0%) |
| Law Enforcement | 0 (0.0%) | 0 (0.0%) |
| Food Preparation & Serving | 0 (0.0%) | 0 (0.0%) |
| Cleaning & Maintenance | 2 (18.2%) | 9 (81.8%) |
| Personal Care & Service | 0 (0.0%) | 0 (0.0%) |
| Total (Category) | 2 (16.7%) | 10 (83.3%) |
| Total (Overall) | 98 (53.3%) | 86 (46.7%) |
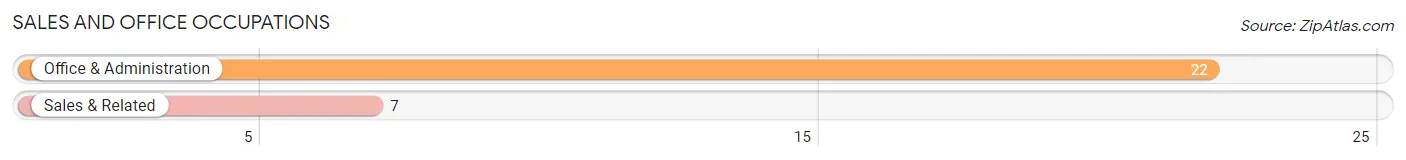
Sales and Office Occupations
The most common Sales and Office occupations in Bellevue are Office & Administration (22 | 12.0%), and Sales & Related (7 | 3.8%).
Sales and Office Occupations by Sex
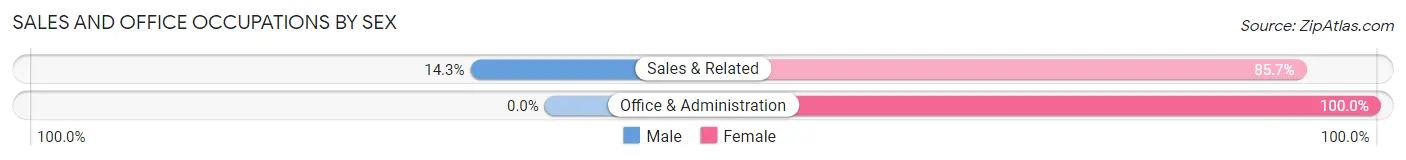
| Occupation | Male | Female |
| Sales & Related | 1 (14.3%) | 6 (85.7%) |
| Office & Administration | 0 (0.0%) | 22 (100.0%) |
| Total (Category) | 1 (3.5%) | 28 (96.6%) |
| Total (Overall) | 98 (53.3%) | 86 (46.7%) |
Natural Resources, Construction and Maintenance Occupations
The most common Natural Resources, Construction and Maintenance occupations in Bellevue are Installation, Maintenance & Repair (26 | 14.1%), Construction & Extraction (6 | 3.3%), and Farming, Fishing & Forestry (4 | 2.2%).

Natural Resources, Construction and Maintenance Occupations by Sex
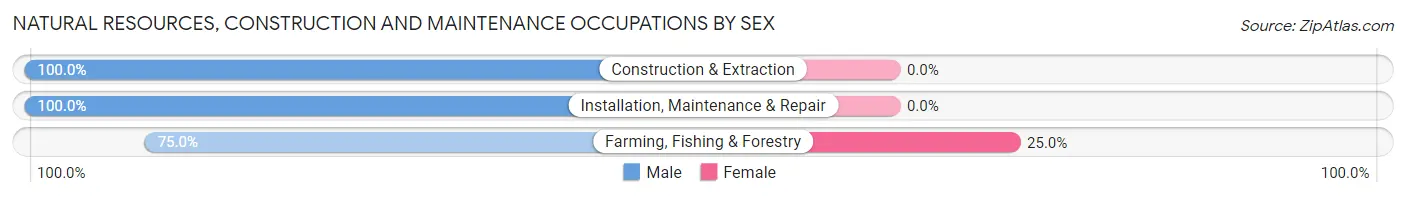
| Occupation | Male | Female |
| Farming, Fishing & Forestry | 3 (75.0%) | 1 (25.0%) |
| Construction & Extraction | 6 (100.0%) | 0 (0.0%) |
| Installation, Maintenance & Repair | 26 (100.0%) | 0 (0.0%) |
| Total (Category) | 35 (97.2%) | 1 (2.8%) |
| Total (Overall) | 98 (53.3%) | 86 (46.7%) |
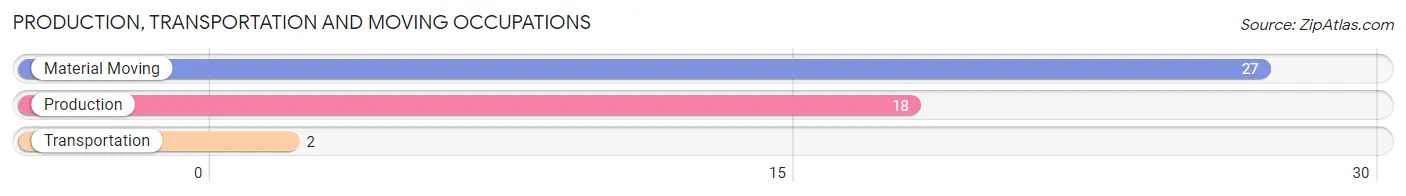
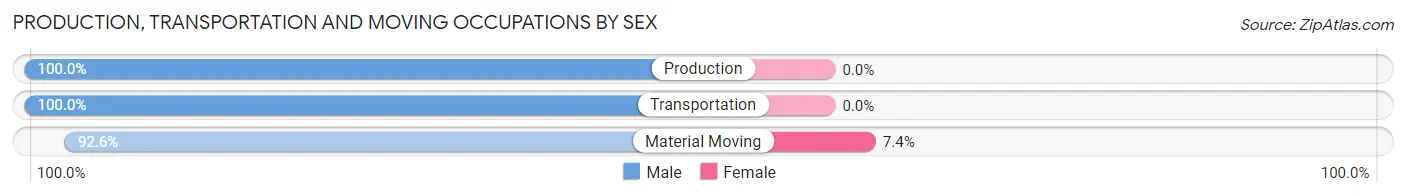
Production, Transportation and Moving Occupations
The most common Production, Transportation and Moving occupations in Bellevue are Material Moving (27 | 14.7%), Production (18 | 9.8%), and Transportation (2 | 1.1%).
Production, Transportation and Moving Occupations by Sex
| Occupation | Male | Female |
| Production | 18 (100.0%) | 0 (0.0%) |
| Transportation | 2 (100.0%) | 0 (0.0%) |
| Material Moving | 25 (92.6%) | 2 (7.4%) |
| Total (Category) | 45 (95.7%) | 2 (4.3%) |
| Total (Overall) | 98 (53.3%) | 86 (46.7%) |
Employment Industries by Sex in Bellevue
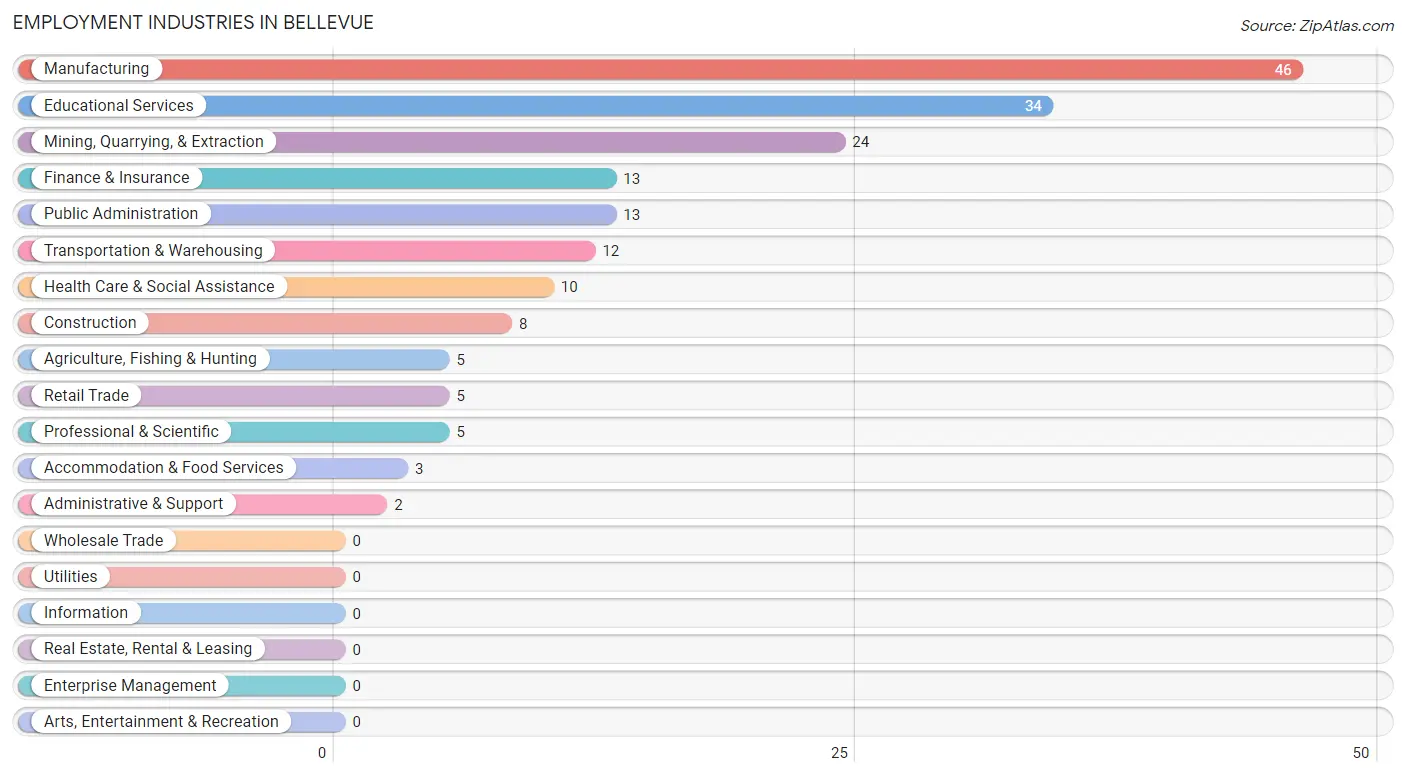
Employment Industries in Bellevue
The major employment industries in Bellevue include Manufacturing (46 | 25.0%), Educational Services (34 | 18.5%), Mining, Quarrying, & Extraction (24 | 13.0%), Finance & Insurance (13 | 7.1%), and Public Administration (13 | 7.1%).
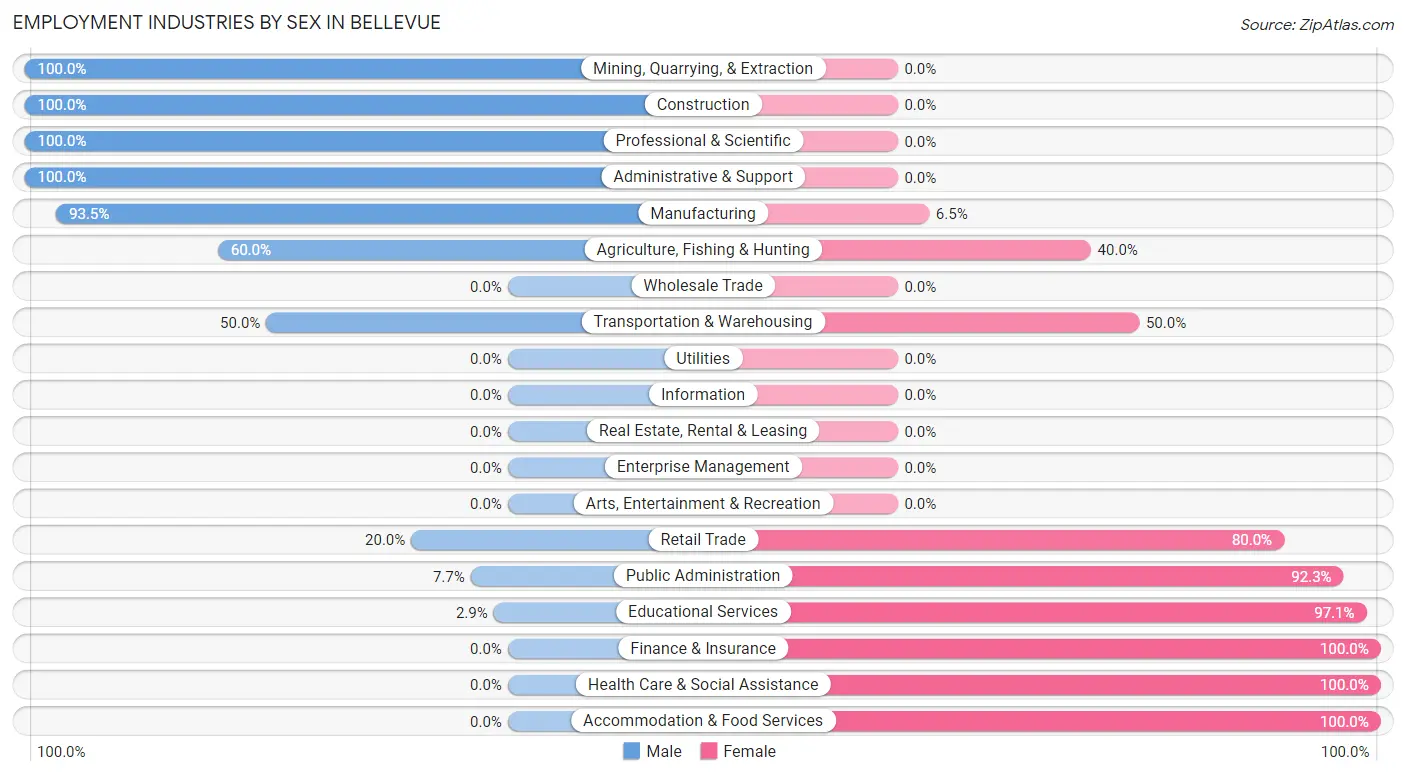
Employment Industries by Sex in Bellevue
The Bellevue industries that see more men than women are Mining, Quarrying, & Extraction (100.0%), Construction (100.0%), and Professional & Scientific (100.0%), whereas the industries that tend to have a higher number of women are Finance & Insurance (100.0%), Health Care & Social Assistance (100.0%), and Accommodation & Food Services (100.0%).
| Industry | Male | Female |
| Agriculture, Fishing & Hunting | 3 (60.0%) | 2 (40.0%) |
| Mining, Quarrying, & Extraction | 24 (100.0%) | 0 (0.0%) |
| Construction | 8 (100.0%) | 0 (0.0%) |
| Manufacturing | 43 (93.5%) | 3 (6.5%) |
| Wholesale Trade | 0 (0.0%) | 0 (0.0%) |
| Retail Trade | 1 (20.0%) | 4 (80.0%) |
| Transportation & Warehousing | 6 (50.0%) | 6 (50.0%) |
| Utilities | 0 (0.0%) | 0 (0.0%) |
| Information | 0 (0.0%) | 0 (0.0%) |
| Finance & Insurance | 0 (0.0%) | 13 (100.0%) |
| Real Estate, Rental & Leasing | 0 (0.0%) | 0 (0.0%) |
| Professional & Scientific | 5 (100.0%) | 0 (0.0%) |
| Enterprise Management | 0 (0.0%) | 0 (0.0%) |
| Administrative & Support | 2 (100.0%) | 0 (0.0%) |
| Educational Services | 1 (2.9%) | 33 (97.1%) |
| Health Care & Social Assistance | 0 (0.0%) | 10 (100.0%) |
| Arts, Entertainment & Recreation | 0 (0.0%) | 0 (0.0%) |
| Accommodation & Food Services | 0 (0.0%) | 3 (100.0%) |
| Public Administration | 1 (7.7%) | 12 (92.3%) |
| Total | 98 (53.3%) | 86 (46.7%) |
Education in Bellevue
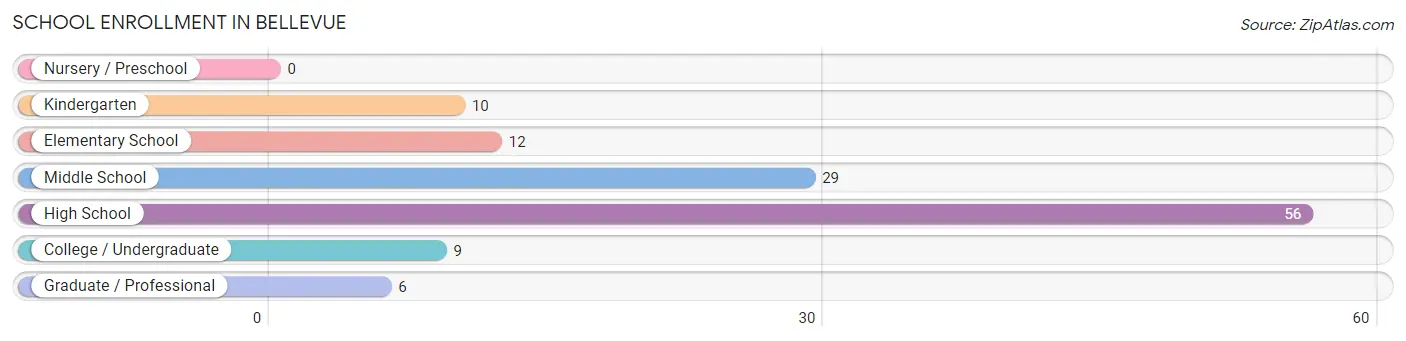
School Enrollment in Bellevue
The most common levels of schooling among the 122 students in Bellevue are high school (56 | 45.9%), middle school (29 | 23.8%), and elementary school (12 | 9.8%).
| School Level | # Students | % Students |
| Nursery / Preschool | 0 | 0.0% |
| Kindergarten | 10 | 8.2% |
| Elementary School | 12 | 9.8% |
| Middle School | 29 | 23.8% |
| High School | 56 | 45.9% |
| College / Undergraduate | 9 | 7.4% |
| Graduate / Professional | 6 | 4.9% |
| Total | 122 | 100.0% |
School Enrollment by Age by Funding Source in Bellevue
Out of a total of 122 students who are enrolled in schools in Bellevue, 13 (10.7%) attend a private institution, while the remaining 109 (89.3%) are enrolled in public schools. The age group of 15 to 17 year olds has the highest likelihood of being enrolled in private schools, with 13 (23.6% in the age bracket) enrolled. Conversely, the age group of 5 to 9 year old has the lowest likelihood of being enrolled in a private school, with 22 (100.0% in the age bracket) attending a public institution.
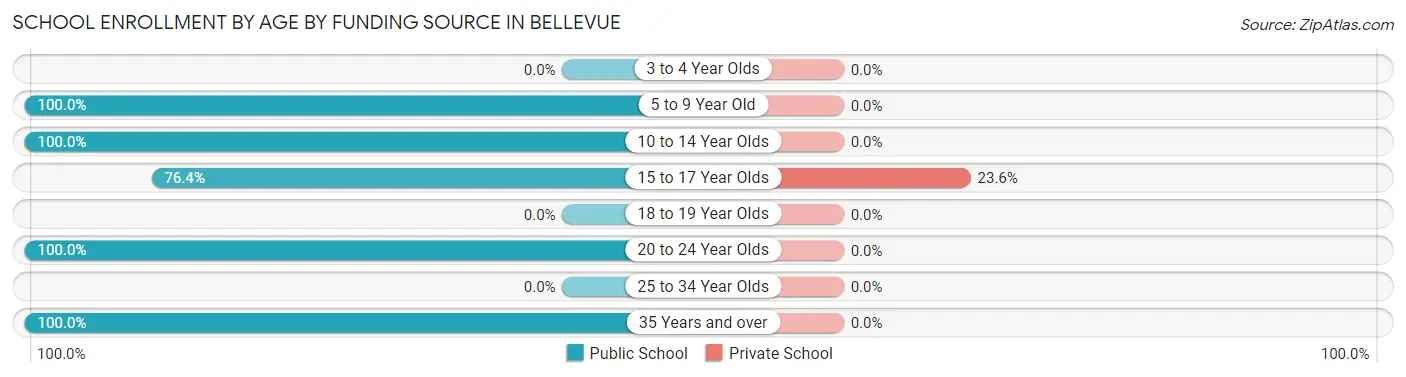
| Age Bracket | Public School | Private School |
| 3 to 4 Year Olds | 0 (0.0%) | 0 (0.0%) |
| 5 to 9 Year Old | 22 (100.0%) | 0 (0.0%) |
| 10 to 14 Year Olds | 30 (100.0%) | 0 (0.0%) |
| 15 to 17 Year Olds | 42 (76.4%) | 13 (23.6%) |
| 18 to 19 Year Olds | 0 (0.0%) | 0 (0.0%) |
| 20 to 24 Year Olds | 9 (100.0%) | 0 (0.0%) |
| 25 to 34 Year Olds | 0 (0.0%) | 0 (0.0%) |
| 35 Years and over | 6 (100.0%) | 0 (0.0%) |
| Total | 109 (89.3%) | 13 (10.7%) |
Educational Attainment by Field of Study in Bellevue
Liberal arts & history (9 | 36.0%), visual & performing arts (9 | 36.0%), business (6 | 24.0%), and education (1 | 4.0%) are the most common fields of study among 25 individuals in Bellevue who have obtained a bachelor's degree or higher.
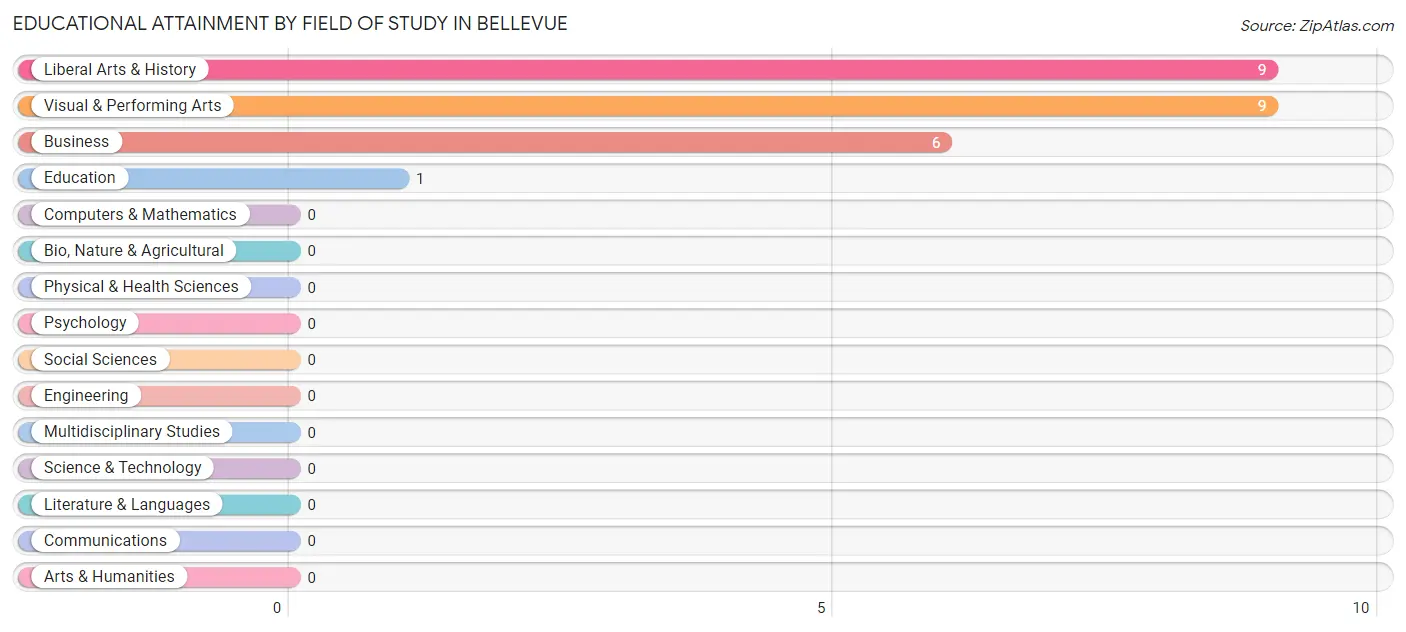
| Field of Study | # Graduates | % Graduates |
| Computers & Mathematics | 0 | 0.0% |
| Bio, Nature & Agricultural | 0 | 0.0% |
| Physical & Health Sciences | 0 | 0.0% |
| Psychology | 0 | 0.0% |
| Social Sciences | 0 | 0.0% |
| Engineering | 0 | 0.0% |
| Multidisciplinary Studies | 0 | 0.0% |
| Science & Technology | 0 | 0.0% |
| Business | 6 | 24.0% |
| Education | 1 | 4.0% |
| Literature & Languages | 0 | 0.0% |
| Liberal Arts & History | 9 | 36.0% |
| Visual & Performing Arts | 9 | 36.0% |
| Communications | 0 | 0.0% |
| Arts & Humanities | 0 | 0.0% |
| Total | 25 | 100.0% |
Transportation & Commute in Bellevue
Vehicle Availability by Sex in Bellevue
The most prevalent vehicle ownership categories in Bellevue are males with 2 vehicles (30, accounting for 30.6%) and females with 2 vehicles (29, making up 35.7%).
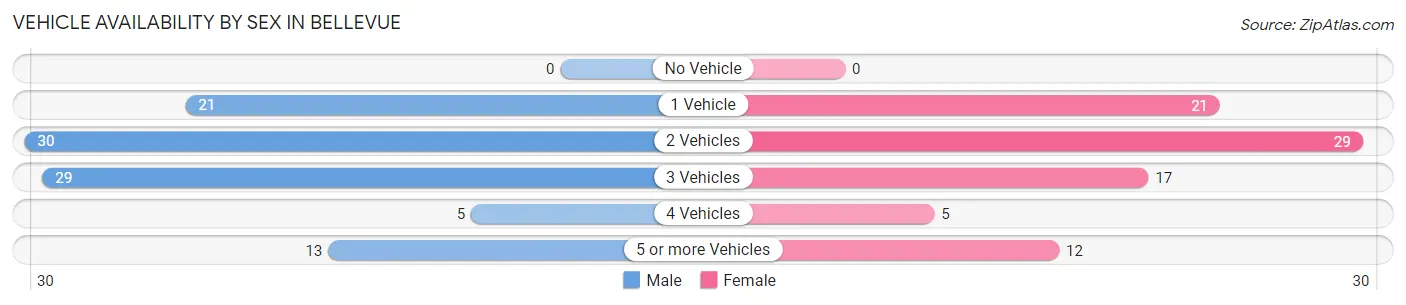
| Vehicles Available | Male | Female |
| No Vehicle | 0 (0.0%) | 0 (0.0%) |
| 1 Vehicle | 21 (21.4%) | 21 (25.0%) |
| 2 Vehicles | 30 (30.6%) | 29 (34.5%) |
| 3 Vehicles | 29 (29.6%) | 17 (20.2%) |
| 4 Vehicles | 5 (5.1%) | 5 (5.9%) |
| 5 or more Vehicles | 13 (13.3%) | 12 (14.3%) |
| Total | 98 (100.0%) | 84 (100.0%) |
Commute Time in Bellevue
The most frequently occuring commute durations in Bellevue are less than 5 minutes (32 commuters, 17.9%), 30 to 34 minutes (29 commuters, 16.2%), and 90 or more minutes (28 commuters, 15.6%).
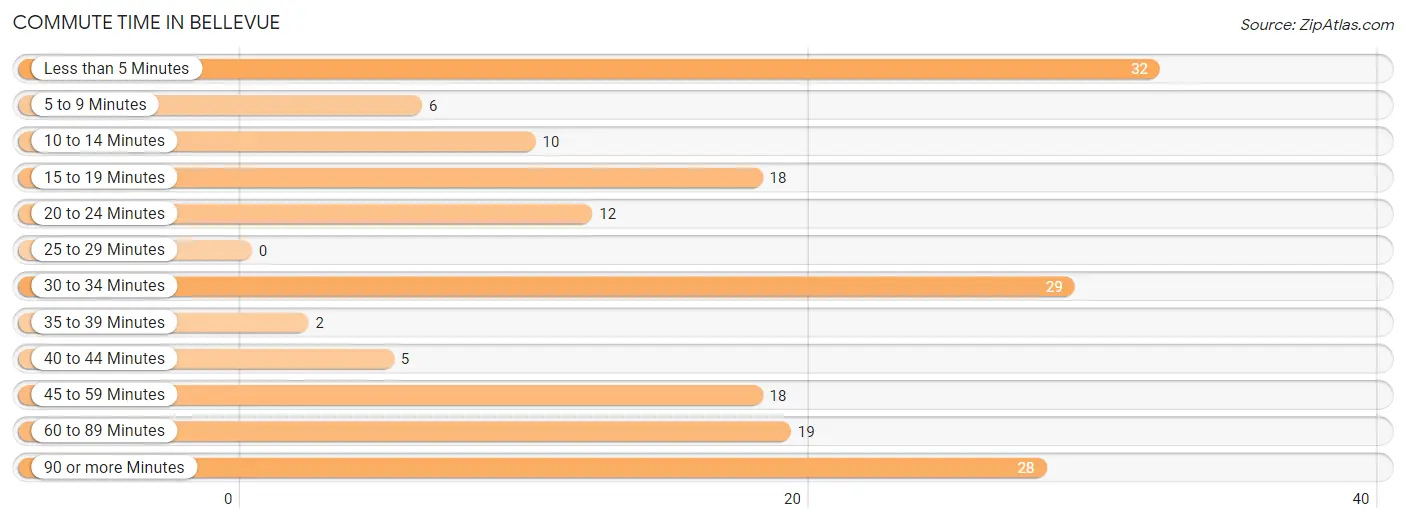
| Commute Time | # Commuters | % Commuters |
| Less than 5 Minutes | 32 | 17.9% |
| 5 to 9 Minutes | 6 | 3.4% |
| 10 to 14 Minutes | 10 | 5.6% |
| 15 to 19 Minutes | 18 | 10.1% |
| 20 to 24 Minutes | 12 | 6.7% |
| 25 to 29 Minutes | 0 | 0.0% |
| 30 to 34 Minutes | 29 | 16.2% |
| 35 to 39 Minutes | 2 | 1.1% |
| 40 to 44 Minutes | 5 | 2.8% |
| 45 to 59 Minutes | 18 | 10.1% |
| 60 to 89 Minutes | 19 | 10.6% |
| 90 or more Minutes | 28 | 15.6% |
Commute Time by Sex in Bellevue
The most common commute times in Bellevue are 90 or more minutes (28 commuters, 29.2%) for males and less than 5 minutes (24 commuters, 28.9%) for females.
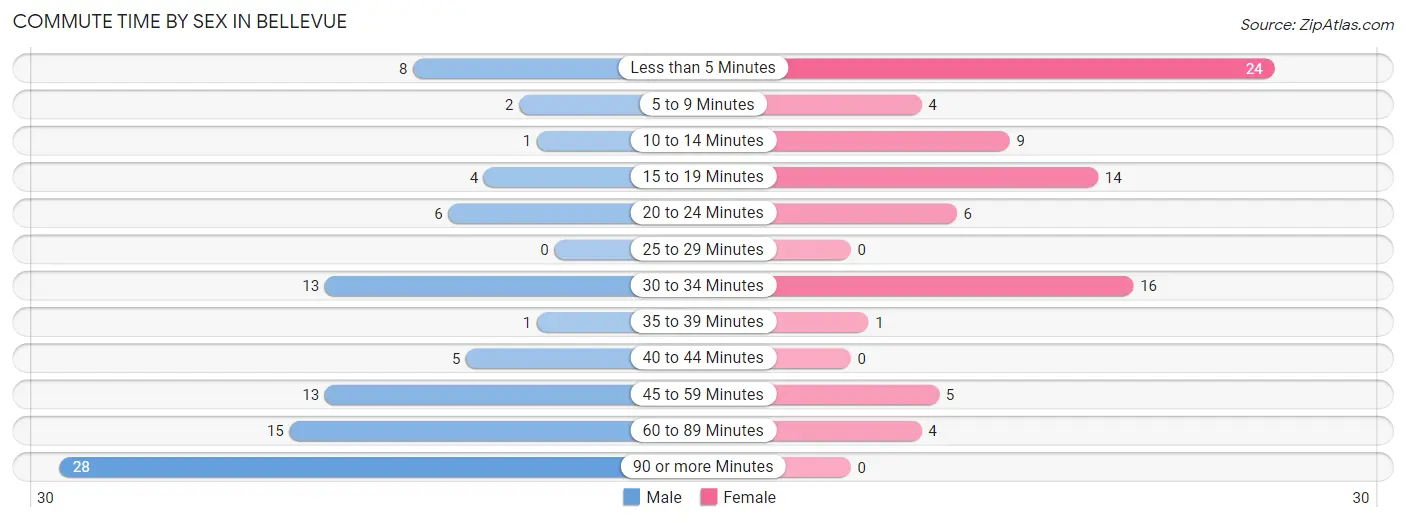
| Commute Time | Male | Female |
| Less than 5 Minutes | 8 (8.3%) | 24 (28.9%) |
| 5 to 9 Minutes | 2 (2.1%) | 4 (4.8%) |
| 10 to 14 Minutes | 1 (1.0%) | 9 (10.8%) |
| 15 to 19 Minutes | 4 (4.2%) | 14 (16.9%) |
| 20 to 24 Minutes | 6 (6.2%) | 6 (7.2%) |
| 25 to 29 Minutes | 0 (0.0%) | 0 (0.0%) |
| 30 to 34 Minutes | 13 (13.5%) | 16 (19.3%) |
| 35 to 39 Minutes | 1 (1.0%) | 1 (1.2%) |
| 40 to 44 Minutes | 5 (5.2%) | 0 (0.0%) |
| 45 to 59 Minutes | 13 (13.5%) | 5 (6.0%) |
| 60 to 89 Minutes | 15 (15.6%) | 4 (4.8%) |
| 90 or more Minutes | 28 (29.2%) | 0 (0.0%) |
Time of Departure to Work by Sex in Bellevue
The most frequent times of departure to work in Bellevue are 12:00 AM to 4:59 AM (30, 31.2%) for males and 7:00 AM to 7:29 AM (42, 50.6%) for females.
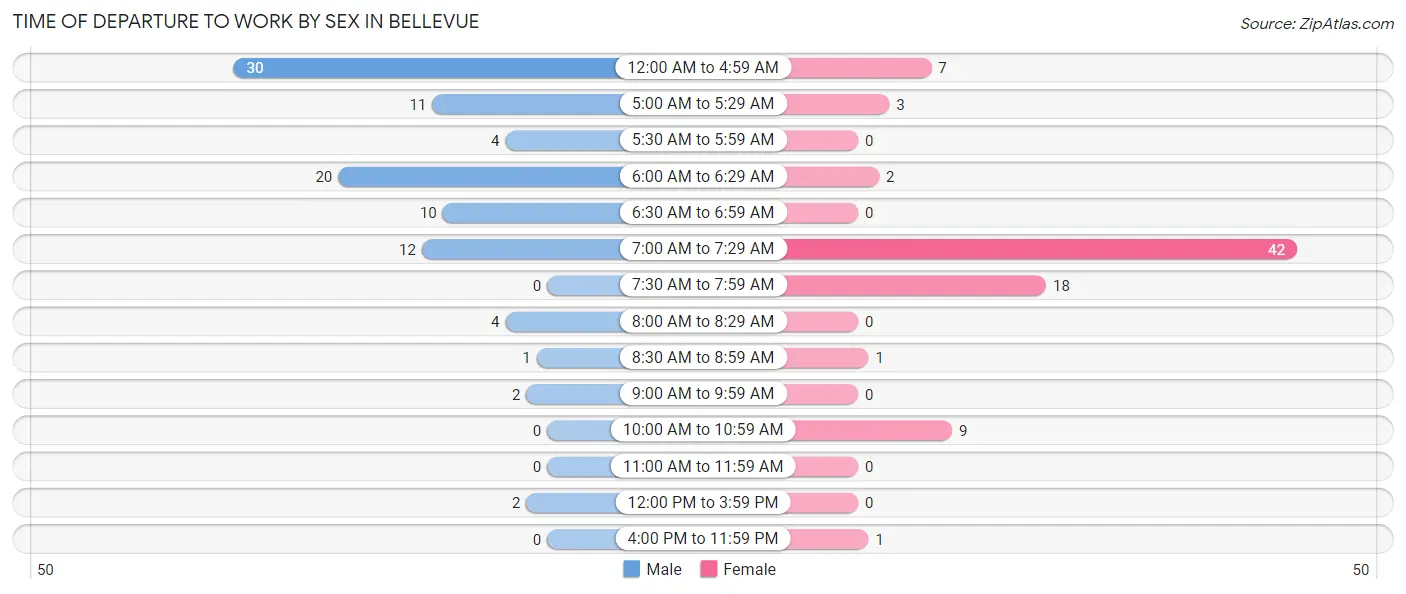
| Time of Departure | Male | Female |
| 12:00 AM to 4:59 AM | 30 (31.2%) | 7 (8.4%) |
| 5:00 AM to 5:29 AM | 11 (11.5%) | 3 (3.6%) |
| 5:30 AM to 5:59 AM | 4 (4.2%) | 0 (0.0%) |
| 6:00 AM to 6:29 AM | 20 (20.8%) | 2 (2.4%) |
| 6:30 AM to 6:59 AM | 10 (10.4%) | 0 (0.0%) |
| 7:00 AM to 7:29 AM | 12 (12.5%) | 42 (50.6%) |
| 7:30 AM to 7:59 AM | 0 (0.0%) | 18 (21.7%) |
| 8:00 AM to 8:29 AM | 4 (4.2%) | 0 (0.0%) |
| 8:30 AM to 8:59 AM | 1 (1.0%) | 1 (1.2%) |
| 9:00 AM to 9:59 AM | 2 (2.1%) | 0 (0.0%) |
| 10:00 AM to 10:59 AM | 0 (0.0%) | 9 (10.8%) |
| 11:00 AM to 11:59 AM | 0 (0.0%) | 0 (0.0%) |
| 12:00 PM to 3:59 PM | 2 (2.1%) | 0 (0.0%) |
| 4:00 PM to 11:59 PM | 0 (0.0%) | 1 (1.2%) |
| Total | 96 (100.0%) | 83 (100.0%) |
Housing Occupancy in Bellevue
Occupancy by Ownership in Bellevue
Of the total 145 dwellings in Bellevue, owner-occupied units account for 130 (89.7%), while renter-occupied units make up 15 (10.3%).
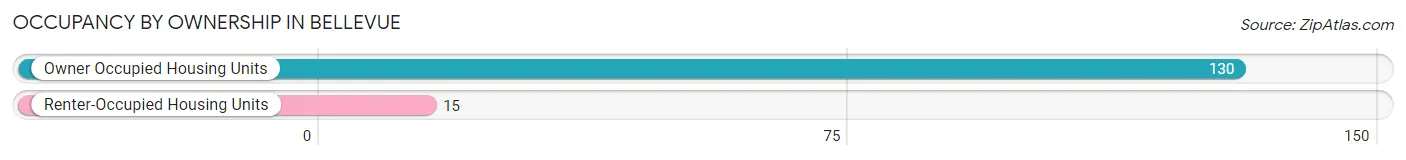
| Occupancy | # Housing Units | % Housing Units |
| Owner Occupied Housing Units | 130 | 89.7% |
| Renter-Occupied Housing Units | 15 | 10.3% |
| Total Occupied Housing Units | 145 | 100.0% |
Occupancy by Household Size in Bellevue
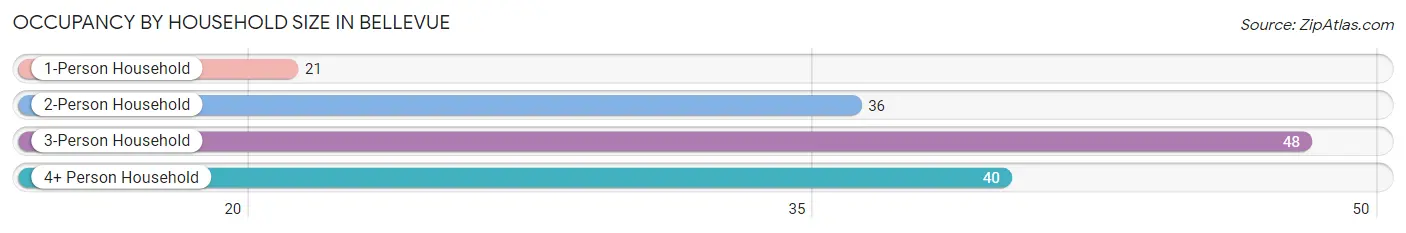
| Household Size | # Housing Units | % Housing Units |
| 1-Person Household | 21 | 14.5% |
| 2-Person Household | 36 | 24.8% |
| 3-Person Household | 48 | 33.1% |
| 4+ Person Household | 40 | 27.6% |
| Total Housing Units | 145 | 100.0% |
Occupancy by Ownership by Household Size in Bellevue
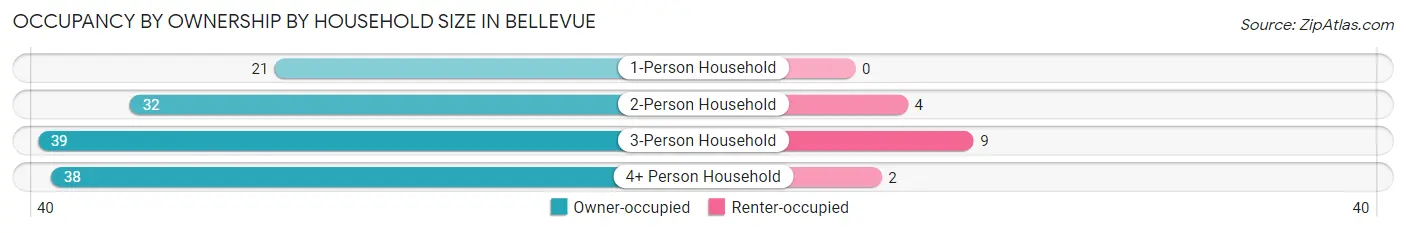
| Household Size | Owner-occupied | Renter-occupied |
| 1-Person Household | 21 (100.0%) | 0 (0.0%) |
| 2-Person Household | 32 (88.9%) | 4 (11.1%) |
| 3-Person Household | 39 (81.2%) | 9 (18.8%) |
| 4+ Person Household | 38 (95.0%) | 2 (5.0%) |
| Total Housing Units | 130 (89.7%) | 15 (10.3%) |
Occupancy by Educational Attainment in Bellevue
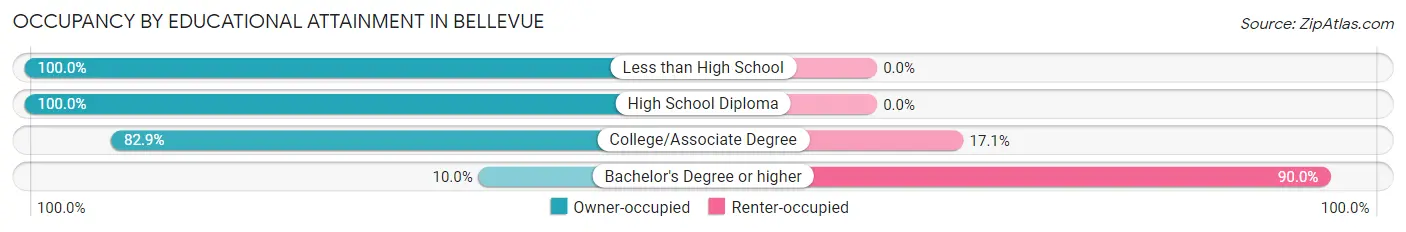
| Household Size | Owner-occupied | Renter-occupied |
| Less than High School | 9 (100.0%) | 0 (0.0%) |
| High School Diploma | 91 (100.0%) | 0 (0.0%) |
| College/Associate Degree | 29 (82.9%) | 6 (17.1%) |
| Bachelor's Degree or higher | 1 (10.0%) | 9 (90.0%) |
Occupancy by Age of Householder in Bellevue
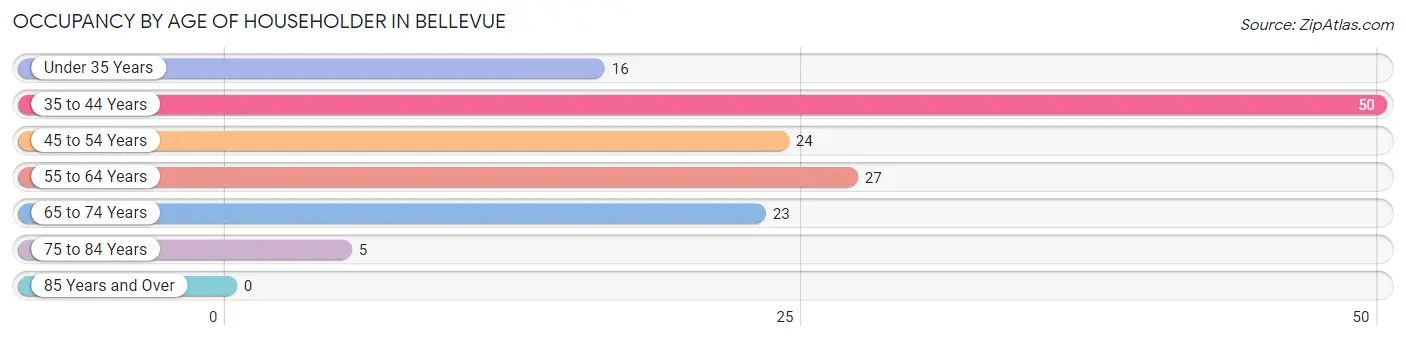
| Age Bracket | # Households | % Households |
| Under 35 Years | 16 | 11.0% |
| 35 to 44 Years | 50 | 34.5% |
| 45 to 54 Years | 24 | 16.6% |
| 55 to 64 Years | 27 | 18.6% |
| 65 to 74 Years | 23 | 15.9% |
| 75 to 84 Years | 5 | 3.5% |
| 85 Years and Over | 0 | 0.0% |
| Total | 145 | 100.0% |
Housing Finances in Bellevue
Median Income by Occupancy in Bellevue
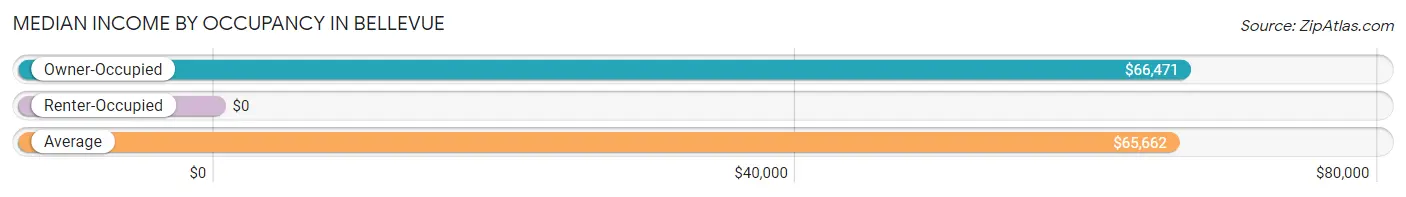
| Occupancy Type | # Households | Median Income |
| Owner-Occupied | 130 (89.7%) | $66,471 |
| Renter-Occupied | 15 (10.3%) | $0 |
| Average | 145 (100.0%) | $65,662 |
Occupancy by Householder Income Bracket in Bellevue
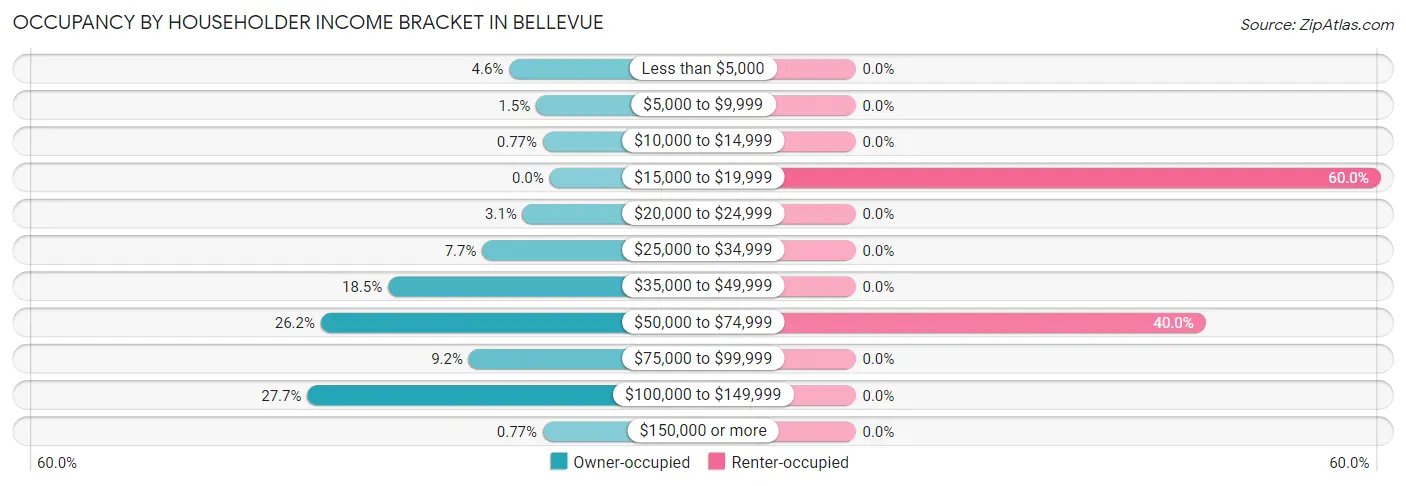
| Income Bracket | Owner-occupied | Renter-occupied |
| Less than $5,000 | 6 (4.6%) | 0 (0.0%) |
| $5,000 to $9,999 | 2 (1.5%) | 0 (0.0%) |
| $10,000 to $14,999 | 1 (0.8%) | 0 (0.0%) |
| $15,000 to $19,999 | 0 (0.0%) | 9 (60.0%) |
| $20,000 to $24,999 | 4 (3.1%) | 0 (0.0%) |
| $25,000 to $34,999 | 10 (7.7%) | 0 (0.0%) |
| $35,000 to $49,999 | 24 (18.5%) | 0 (0.0%) |
| $50,000 to $74,999 | 34 (26.2%) | 6 (40.0%) |
| $75,000 to $99,999 | 12 (9.2%) | 0 (0.0%) |
| $100,000 to $149,999 | 36 (27.7%) | 0 (0.0%) |
| $150,000 or more | 1 (0.8%) | 0 (0.0%) |
| Total | 130 (100.0%) | 15 (100.0%) |
Monthly Housing Cost Tiers in Bellevue
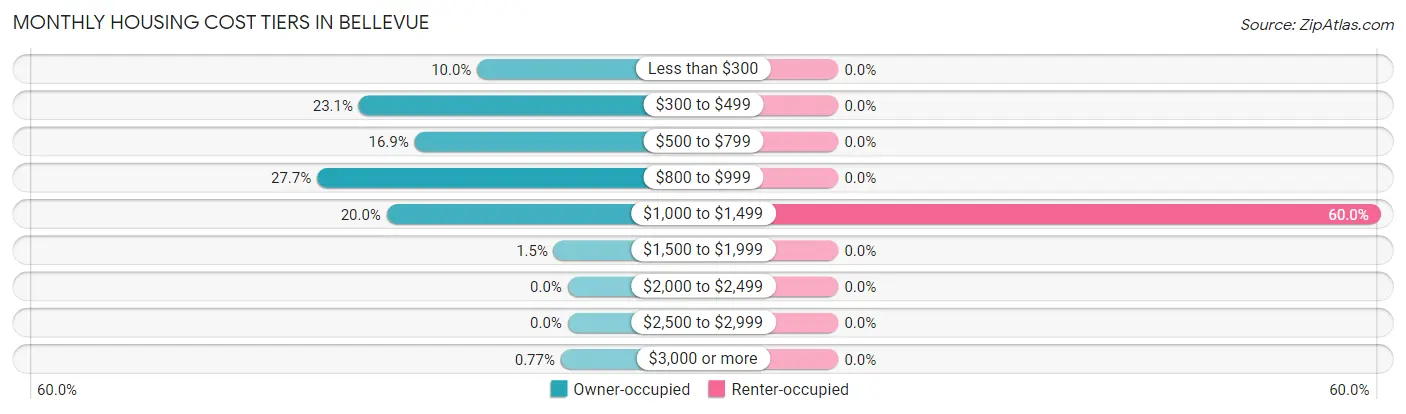
| Monthly Cost | Owner-occupied | Renter-occupied |
| Less than $300 | 13 (10.0%) | 0 (0.0%) |
| $300 to $499 | 30 (23.1%) | 0 (0.0%) |
| $500 to $799 | 22 (16.9%) | 0 (0.0%) |
| $800 to $999 | 36 (27.7%) | 0 (0.0%) |
| $1,000 to $1,499 | 26 (20.0%) | 9 (60.0%) |
| $1,500 to $1,999 | 2 (1.5%) | 0 (0.0%) |
| $2,000 to $2,499 | 0 (0.0%) | 0 (0.0%) |
| $2,500 to $2,999 | 0 (0.0%) | 0 (0.0%) |
| $3,000 or more | 1 (0.8%) | 0 (0.0%) |
| Total | 130 (100.0%) | 15 (100.0%) |
Physical Housing Characteristics in Bellevue
Housing Structures in Bellevue
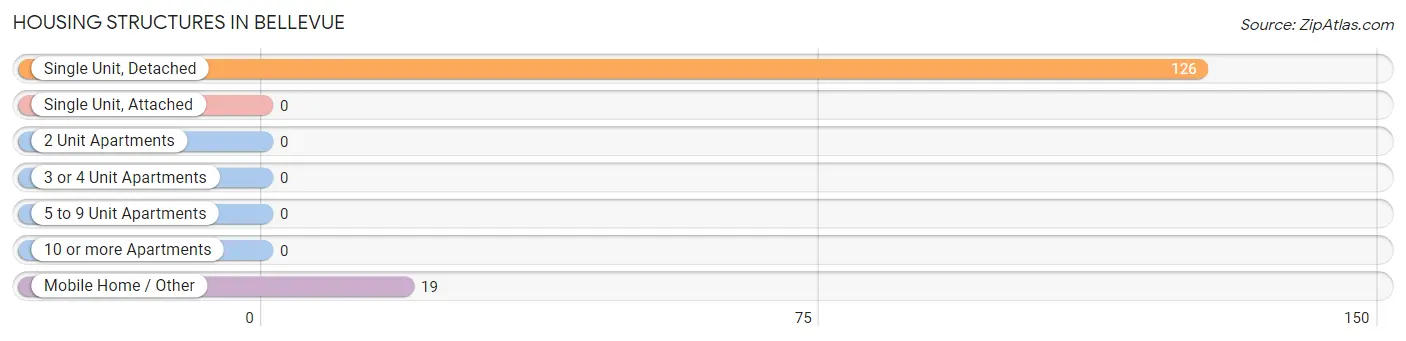
| Structure Type | # Housing Units | % Housing Units |
| Single Unit, Detached | 126 | 86.9% |
| Single Unit, Attached | 0 | 0.0% |
| 2 Unit Apartments | 0 | 0.0% |
| 3 or 4 Unit Apartments | 0 | 0.0% |
| 5 to 9 Unit Apartments | 0 | 0.0% |
| 10 or more Apartments | 0 | 0.0% |
| Mobile Home / Other | 19 | 13.1% |
| Total | 145 | 100.0% |
Housing Structures by Occupancy in Bellevue
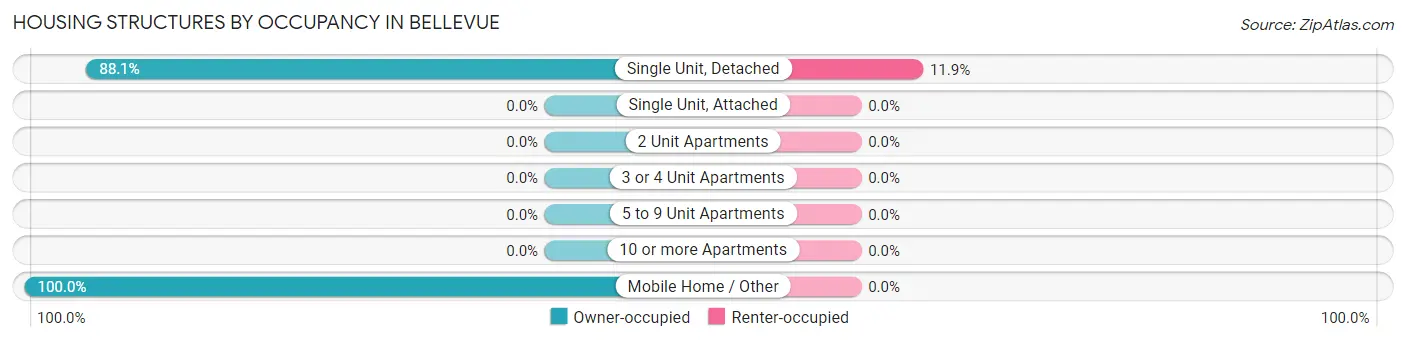
| Structure Type | Owner-occupied | Renter-occupied |
| Single Unit, Detached | 111 (88.1%) | 15 (11.9%) |
| Single Unit, Attached | 0 (0.0%) | 0 (0.0%) |
| 2 Unit Apartments | 0 (0.0%) | 0 (0.0%) |
| 3 or 4 Unit Apartments | 0 (0.0%) | 0 (0.0%) |
| 5 to 9 Unit Apartments | 0 (0.0%) | 0 (0.0%) |
| 10 or more Apartments | 0 (0.0%) | 0 (0.0%) |
| Mobile Home / Other | 19 (100.0%) | 0 (0.0%) |
| Total | 130 (89.7%) | 15 (10.3%) |
Housing Structures by Number of Rooms in Bellevue
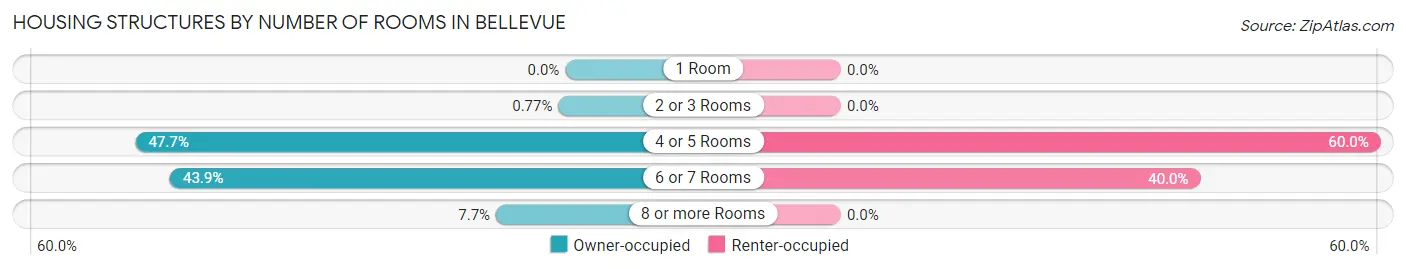
| Number of Rooms | Owner-occupied | Renter-occupied |
| 1 Room | 0 (0.0%) | 0 (0.0%) |
| 2 or 3 Rooms | 1 (0.8%) | 0 (0.0%) |
| 4 or 5 Rooms | 62 (47.7%) | 9 (60.0%) |
| 6 or 7 Rooms | 57 (43.9%) | 6 (40.0%) |
| 8 or more Rooms | 10 (7.7%) | 0 (0.0%) |
| Total | 130 (100.0%) | 15 (100.0%) |
Housing Structure by Heating Type in Bellevue
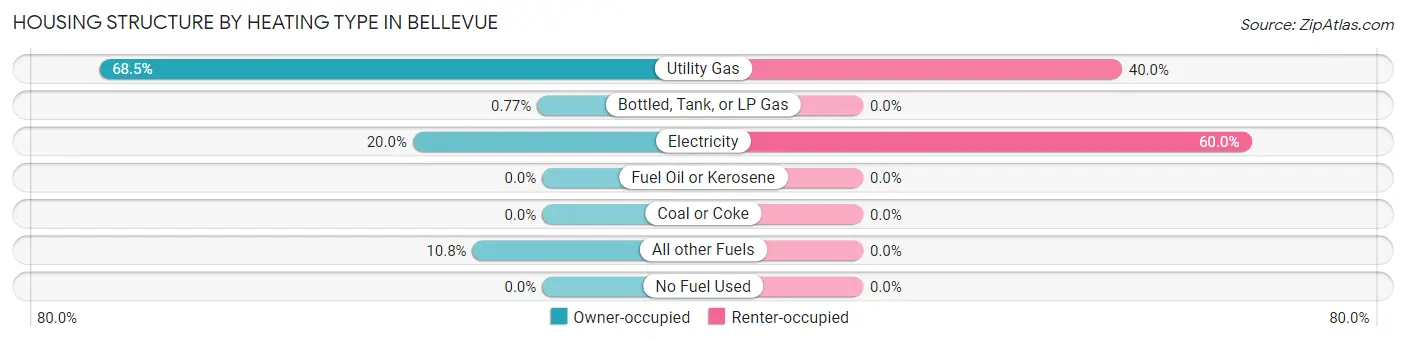
| Heating Type | Owner-occupied | Renter-occupied |
| Utility Gas | 89 (68.5%) | 6 (40.0%) |
| Bottled, Tank, or LP Gas | 1 (0.8%) | 0 (0.0%) |
| Electricity | 26 (20.0%) | 9 (60.0%) |
| Fuel Oil or Kerosene | 0 (0.0%) | 0 (0.0%) |
| Coal or Coke | 0 (0.0%) | 0 (0.0%) |
| All other Fuels | 14 (10.8%) | 0 (0.0%) |
| No Fuel Used | 0 (0.0%) | 0 (0.0%) |
| Total | 130 (100.0%) | 15 (100.0%) |
Household Vehicle Usage in Bellevue
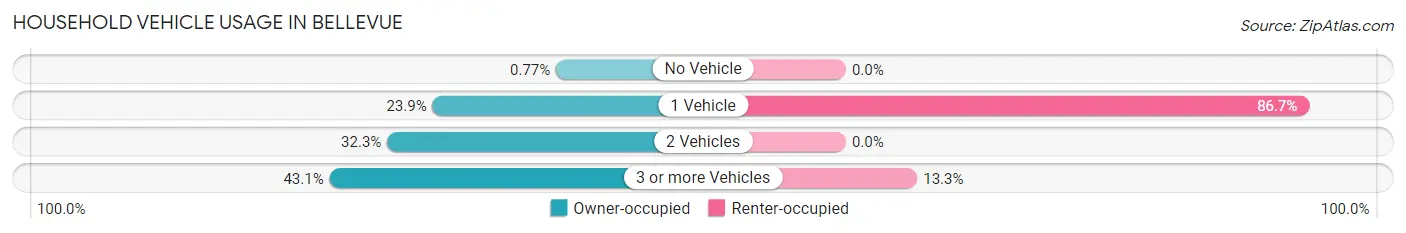
| Vehicles per Household | Owner-occupied | Renter-occupied |
| No Vehicle | 1 (0.8%) | 0 (0.0%) |
| 1 Vehicle | 31 (23.8%) | 13 (86.7%) |
| 2 Vehicles | 42 (32.3%) | 0 (0.0%) |
| 3 or more Vehicles | 56 (43.1%) | 2 (13.3%) |
| Total | 130 (100.0%) | 15 (100.0%) |
Real Estate & Mortgages in Bellevue
Real Estate and Mortgage Overview in Bellevue
| Characteristic | Without Mortgage | With Mortgage |
| Housing Units | 60 | 70 |
| Median Property Value | $67,500 | $77,500 |
| Median Household Income | $38,333 | $1 |
| Monthly Housing Costs | $367 | $1 |
| Real Estate Taxes | $517 | $3 |
Property Value by Mortgage Status in Bellevue
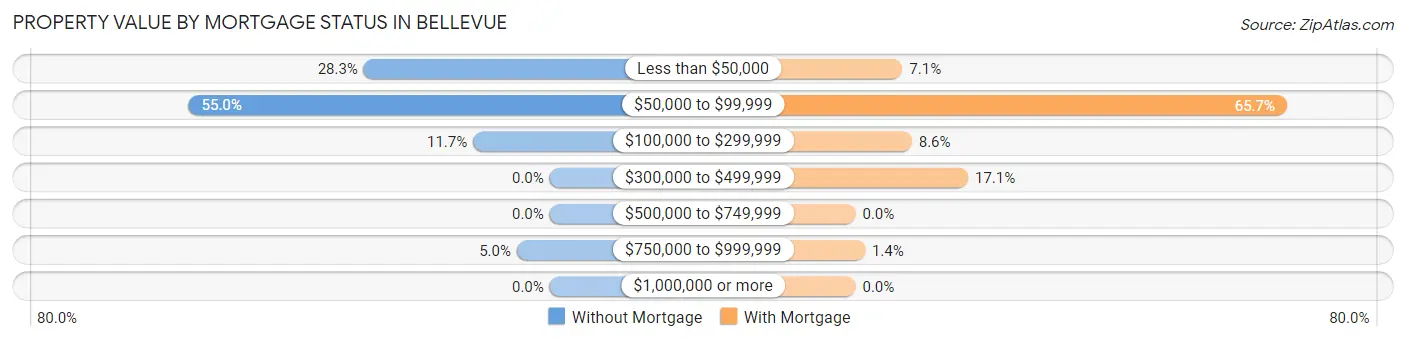
| Property Value | Without Mortgage | With Mortgage |
| Less than $50,000 | 17 (28.3%) | 5 (7.1%) |
| $50,000 to $99,999 | 33 (55.0%) | 46 (65.7%) |
| $100,000 to $299,999 | 7 (11.7%) | 6 (8.6%) |
| $300,000 to $499,999 | 0 (0.0%) | 12 (17.1%) |
| $500,000 to $749,999 | 0 (0.0%) | 0 (0.0%) |
| $750,000 to $999,999 | 3 (5.0%) | 1 (1.4%) |
| $1,000,000 or more | 0 (0.0%) | 0 (0.0%) |
| Total | 60 (100.0%) | 70 (100.0%) |
Household Income by Mortgage Status in Bellevue
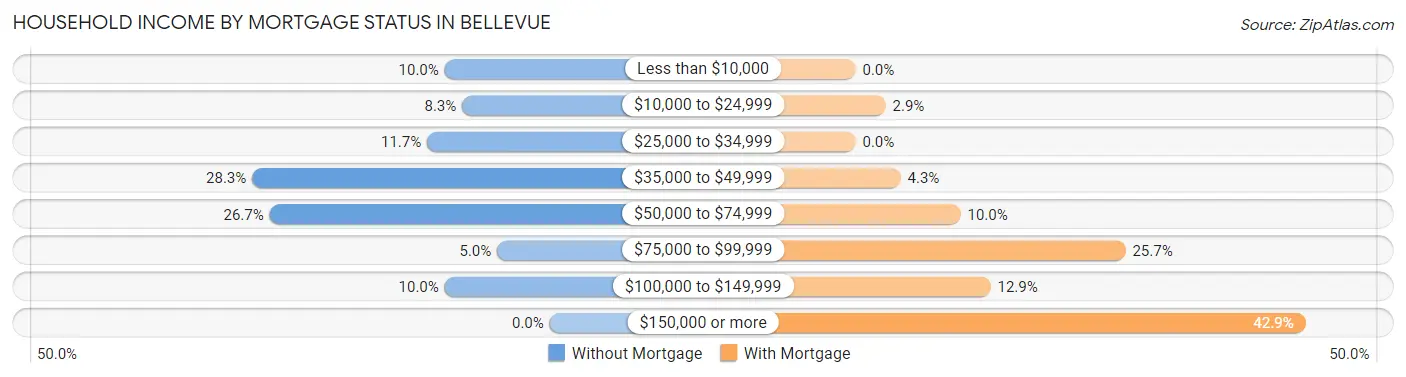
| Household Income | Without Mortgage | With Mortgage |
| Less than $10,000 | 6 (10.0%) | 0 (0.0%) |
| $10,000 to $24,999 | 5 (8.3%) | 2 (2.9%) |
| $25,000 to $34,999 | 7 (11.7%) | 0 (0.0%) |
| $35,000 to $49,999 | 17 (28.3%) | 3 (4.3%) |
| $50,000 to $74,999 | 16 (26.7%) | 7 (10.0%) |
| $75,000 to $99,999 | 3 (5.0%) | 18 (25.7%) |
| $100,000 to $149,999 | 6 (10.0%) | 9 (12.9%) |
| $150,000 or more | 0 (0.0%) | 30 (42.9%) |
| Total | 60 (100.0%) | 70 (100.0%) |
Property Value to Household Income Ratio in Bellevue
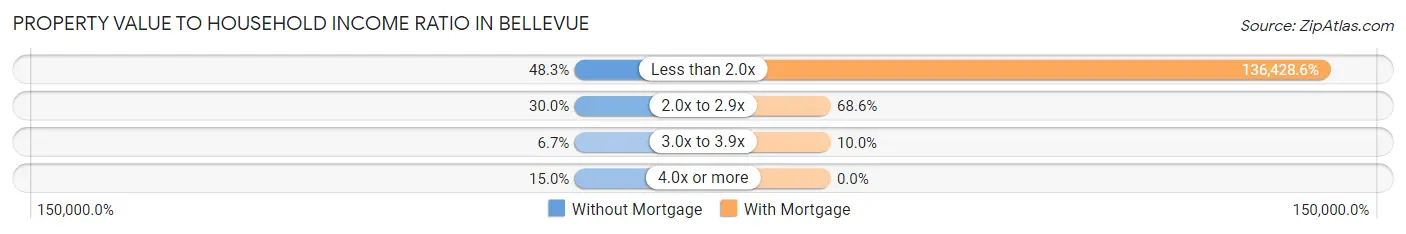
| Value-to-Income Ratio | Without Mortgage | With Mortgage |
| Less than 2.0x | 29 (48.3%) | 95,500 (136,428.6%) |
| 2.0x to 2.9x | 18 (30.0%) | 48 (68.6%) |
| 3.0x to 3.9x | 4 (6.7%) | 7 (10.0%) |
| 4.0x or more | 9 (15.0%) | 0 (0.0%) |
| Total | 60 (100.0%) | 70 (100.0%) |
Real Estate Taxes by Mortgage Status in Bellevue
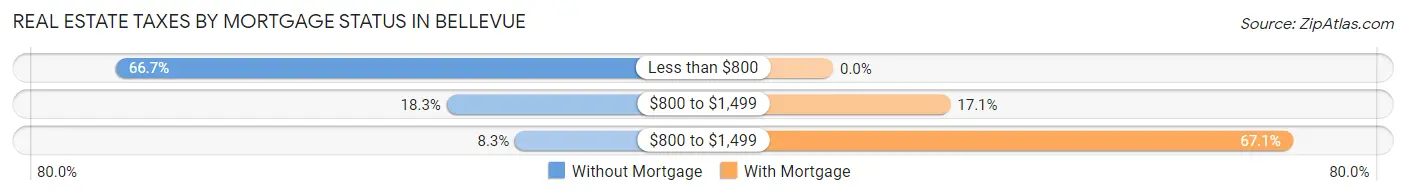
| Property Taxes | Without Mortgage | With Mortgage |
| Less than $800 | 40 (66.7%) | 0 (0.0%) |
| $800 to $1,499 | 11 (18.3%) | 12 (17.1%) |
| $800 to $1,499 | 5 (8.3%) | 47 (67.1%) |
| Total | 60 (100.0%) | 70 (100.0%) |
Health & Disability in Bellevue
Health Insurance Coverage by Age in Bellevue
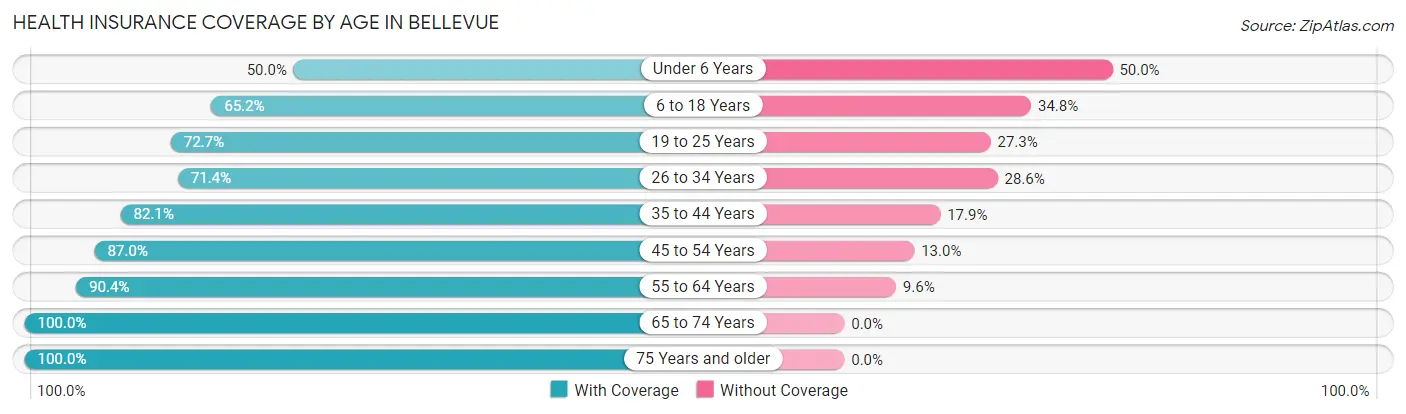
| Age Bracket | With Coverage | Without Coverage |
| Under 6 Years | 10 (50.0%) | 10 (50.0%) |
| 6 to 18 Years | 73 (65.2%) | 39 (34.8%) |
| 19 to 25 Years | 24 (72.7%) | 9 (27.3%) |
| 26 to 34 Years | 20 (71.4%) | 8 (28.6%) |
| 35 to 44 Years | 78 (82.1%) | 17 (17.9%) |
| 45 to 54 Years | 40 (87.0%) | 6 (13.0%) |
| 55 to 64 Years | 47 (90.4%) | 5 (9.6%) |
| 65 to 74 Years | 31 (100.0%) | 0 (0.0%) |
| 75 Years and older | 9 (100.0%) | 0 (0.0%) |
| Total | 332 (77.9%) | 94 (22.1%) |
Health Insurance Coverage by Citizenship Status in Bellevue
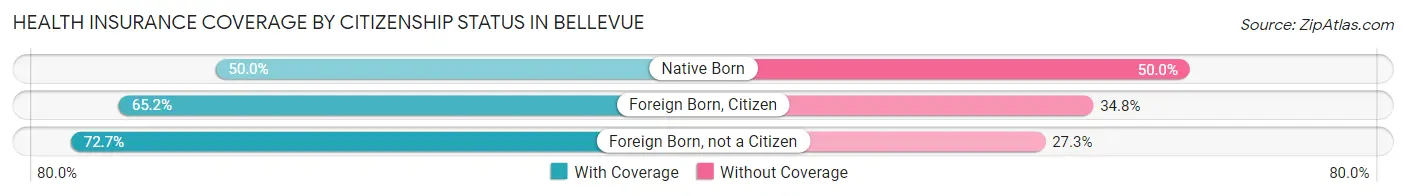
| Citizenship Status | With Coverage | Without Coverage |
| Native Born | 10 (50.0%) | 10 (50.0%) |
| Foreign Born, Citizen | 73 (65.2%) | 39 (34.8%) |
| Foreign Born, not a Citizen | 24 (72.7%) | 9 (27.3%) |
Health Insurance Coverage by Household Income in Bellevue
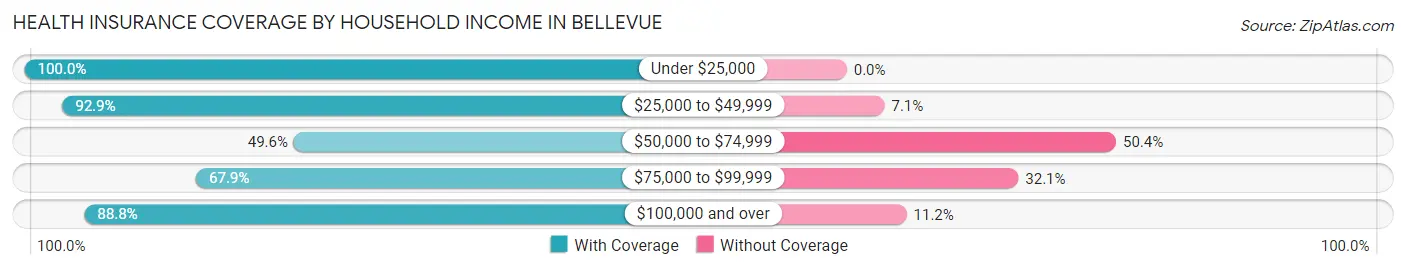
| Household Income | With Coverage | Without Coverage |
| Under $25,000 | 51 (100.0%) | 0 (0.0%) |
| $25,000 to $49,999 | 92 (92.9%) | 7 (7.1%) |
| $50,000 to $74,999 | 56 (49.6%) | 57 (50.4%) |
| $75,000 to $99,999 | 38 (67.9%) | 18 (32.1%) |
| $100,000 and over | 95 (88.8%) | 12 (11.2%) |
Public vs Private Health Insurance Coverage by Age in Bellevue
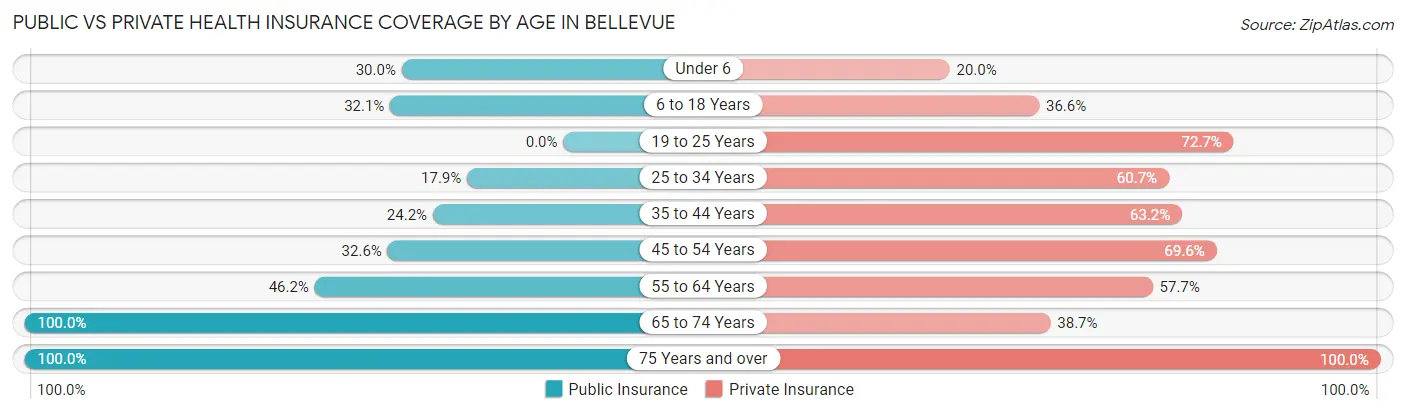
| Age Bracket | Public Insurance | Private Insurance |
| Under 6 | 6 (30.0%) | 4 (20.0%) |
| 6 to 18 Years | 36 (32.1%) | 41 (36.6%) |
| 19 to 25 Years | 0 (0.0%) | 24 (72.7%) |
| 25 to 34 Years | 5 (17.9%) | 17 (60.7%) |
| 35 to 44 Years | 23 (24.2%) | 60 (63.2%) |
| 45 to 54 Years | 15 (32.6%) | 32 (69.6%) |
| 55 to 64 Years | 24 (46.2%) | 30 (57.7%) |
| 65 to 74 Years | 31 (100.0%) | 12 (38.7%) |
| 75 Years and over | 9 (100.0%) | 9 (100.0%) |
| Total | 149 (35.0%) | 229 (53.8%) |
Disability Status by Sex by Age in Bellevue
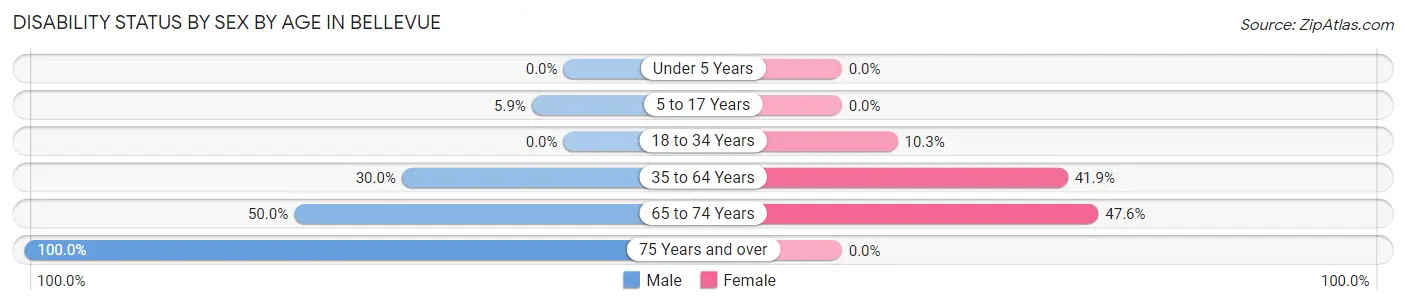
| Age Bracket | Male | Female |
| Under 5 Years | 0 (0.0%) | 0 (0.0%) |
| 5 to 17 Years | 4 (5.9%) | 0 (0.0%) |
| 18 to 34 Years | 0 (0.0%) | 3 (10.3%) |
| 35 to 64 Years | 30 (30.0%) | 39 (41.9%) |
| 65 to 74 Years | 5 (50.0%) | 10 (47.6%) |
| 75 Years and over | 4 (100.0%) | 0 (0.0%) |
Disability Class by Sex by Age in Bellevue
Disability Class: Hearing Difficulty
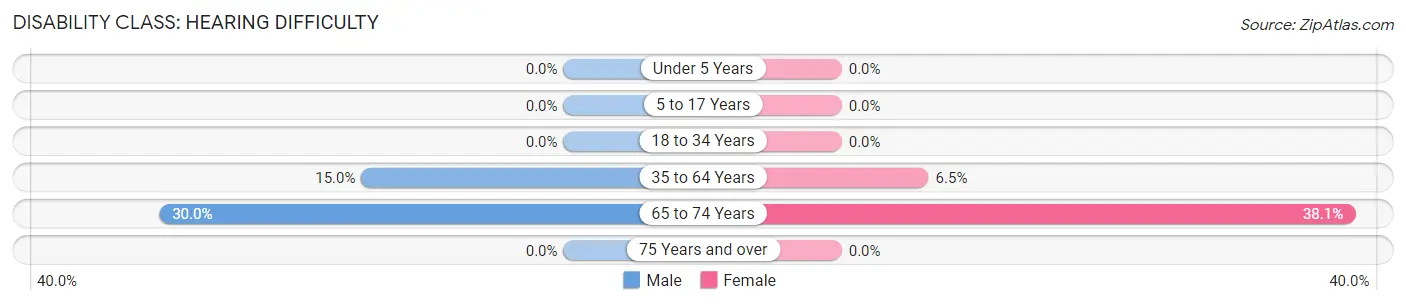
| Age Bracket | Male | Female |
| Under 5 Years | 0 (0.0%) | 0 (0.0%) |
| 5 to 17 Years | 0 (0.0%) | 0 (0.0%) |
| 18 to 34 Years | 0 (0.0%) | 0 (0.0%) |
| 35 to 64 Years | 15 (15.0%) | 6 (6.5%) |
| 65 to 74 Years | 3 (30.0%) | 8 (38.1%) |
| 75 Years and over | 0 (0.0%) | 0 (0.0%) |
Disability Class: Vision Difficulty
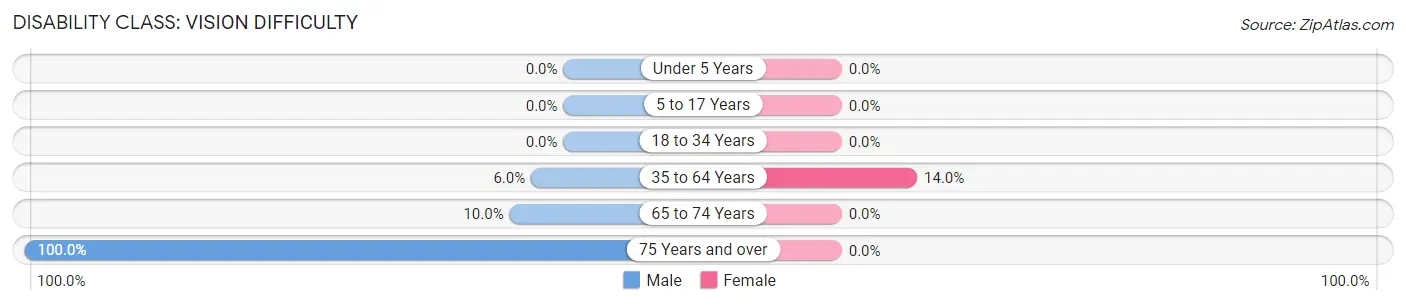
| Age Bracket | Male | Female |
| Under 5 Years | 0 (0.0%) | 0 (0.0%) |
| 5 to 17 Years | 0 (0.0%) | 0 (0.0%) |
| 18 to 34 Years | 0 (0.0%) | 0 (0.0%) |
| 35 to 64 Years | 6 (6.0%) | 13 (14.0%) |
| 65 to 74 Years | 1 (10.0%) | 0 (0.0%) |
| 75 Years and over | 4 (100.0%) | 0 (0.0%) |
Disability Class: Cognitive Difficulty
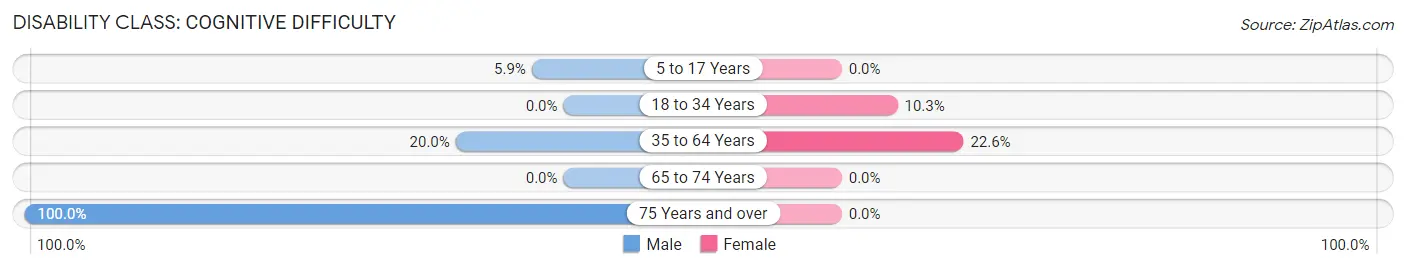
| Age Bracket | Male | Female |
| 5 to 17 Years | 4 (5.9%) | 0 (0.0%) |
| 18 to 34 Years | 0 (0.0%) | 3 (10.3%) |
| 35 to 64 Years | 20 (20.0%) | 21 (22.6%) |
| 65 to 74 Years | 0 (0.0%) | 0 (0.0%) |
| 75 Years and over | 4 (100.0%) | 0 (0.0%) |
Disability Class: Ambulatory Difficulty
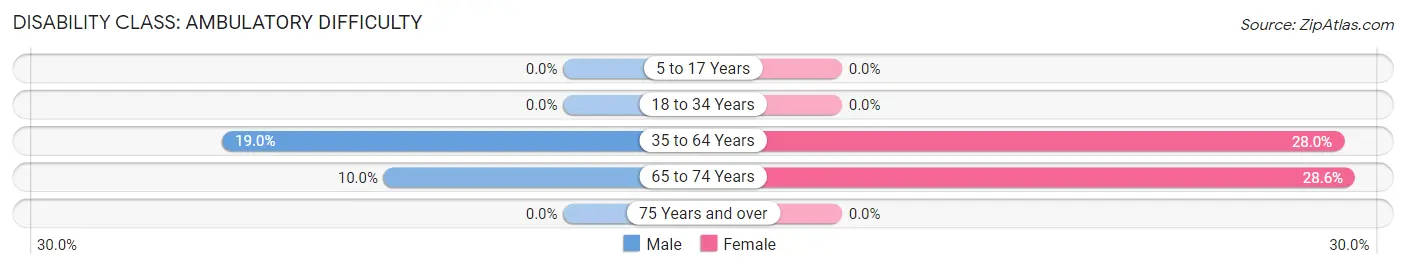
| Age Bracket | Male | Female |
| 5 to 17 Years | 0 (0.0%) | 0 (0.0%) |
| 18 to 34 Years | 0 (0.0%) | 0 (0.0%) |
| 35 to 64 Years | 19 (19.0%) | 26 (28.0%) |
| 65 to 74 Years | 1 (10.0%) | 6 (28.6%) |
| 75 Years and over | 0 (0.0%) | 0 (0.0%) |
Disability Class: Self-Care Difficulty
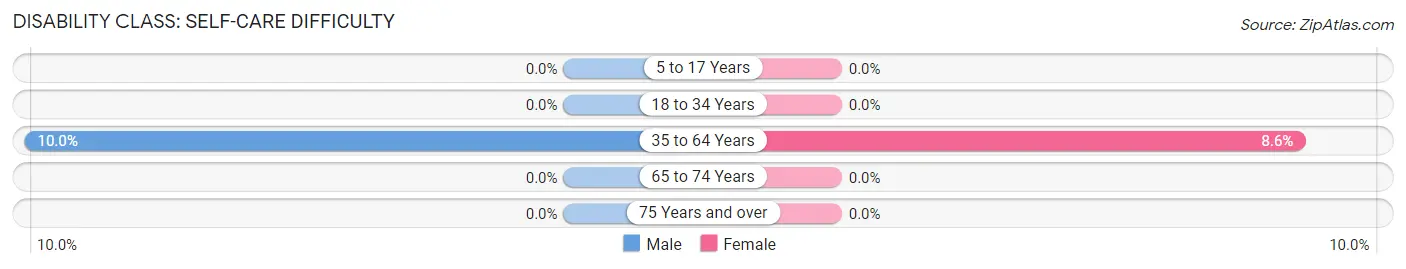
| Age Bracket | Male | Female |
| 5 to 17 Years | 0 (0.0%) | 0 (0.0%) |
| 18 to 34 Years | 0 (0.0%) | 0 (0.0%) |
| 35 to 64 Years | 10 (10.0%) | 8 (8.6%) |
| 65 to 74 Years | 0 (0.0%) | 0 (0.0%) |
| 75 Years and over | 0 (0.0%) | 0 (0.0%) |
Technology Access in Bellevue
Computing Device Access in Bellevue
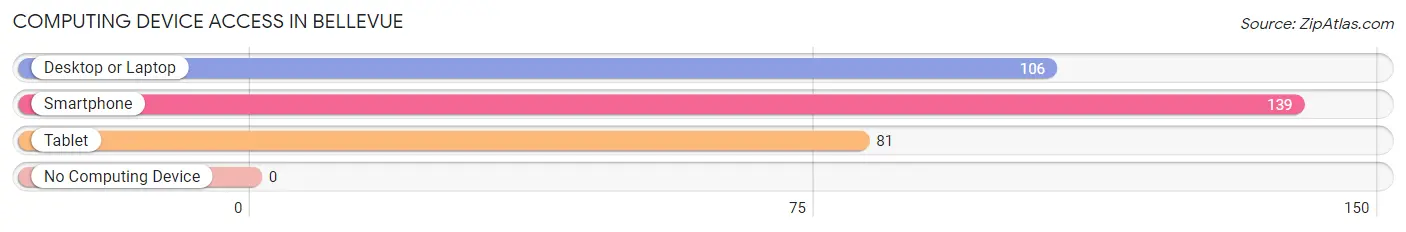
| Device Type | # Households | % Households |
| Desktop or Laptop | 106 | 73.1% |
| Smartphone | 139 | 95.9% |
| Tablet | 81 | 55.9% |
| No Computing Device | 0 | 0.0% |
| Total | 145 | 100.0% |
Internet Access in Bellevue
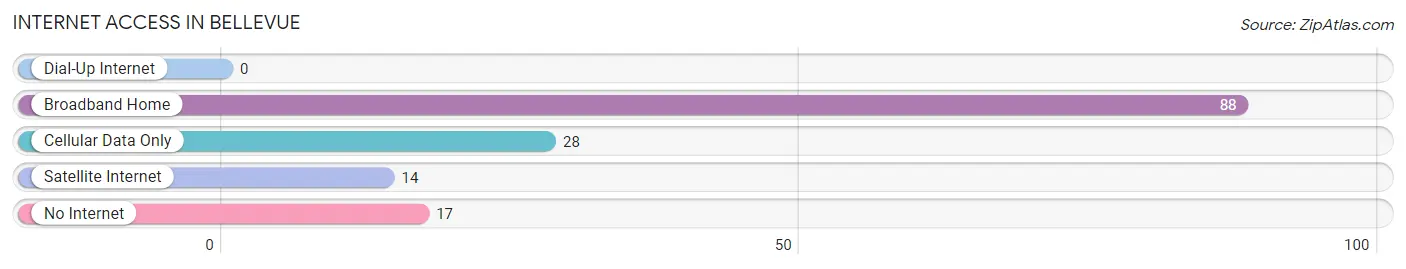
| Internet Type | # Households | % Households |
| Dial-Up Internet | 0 | 0.0% |
| Broadband Home | 88 | 60.7% |
| Cellular Data Only | 28 | 19.3% |
| Satellite Internet | 14 | 9.7% |
| No Internet | 17 | 11.7% |
| Total | 145 | 100.0% |
Bellevue Summary
Bellevue is a small town located in Clay County, Texas, United States. It is situated on the banks of the Red River, approximately 20 miles north of Wichita Falls. The population of Bellevue was estimated to be 545 in 2019.
History
Bellevue was founded in 1876 by a group of settlers from Missouri. The town was named after the French word for “beautiful view” due to its location on the banks of the Red River. The town was originally a farming community, but it soon became a trading center for the surrounding area.
In the early 1900s, Bellevue was a thriving community with a population of over 1,000. The town had several stores, a hotel, a bank, a post office, and a school. The town also had a cotton gin, a blacksmith shop, and a livery stable.
In the 1920s, the Great Depression hit Bellevue hard. Many of the businesses closed and the population declined. The town was able to survive, however, and by the 1940s it had recovered and was once again a thriving community.
Geography
Bellevue is located in Clay County, Texas, approximately 20 miles north of Wichita Falls. The town is situated on the banks of the Red River, which forms the border between Texas and Oklahoma. The town is surrounded by rolling hills and prairies.
The climate in Bellevue is semi-arid, with hot summers and mild winters. The average annual temperature is around 68°F (20°C). The average annual precipitation is around 28 inches (71 cm).
Economy
The economy of Bellevue is largely based on agriculture. The town is home to several farms, which produce cotton, wheat, corn, and other crops. The town also has several businesses, including a grocery store, a hardware store, and a restaurant.
The town is also home to a small manufacturing plant, which produces plastic products. The plant employs around 50 people.
Demographics
As of 2019, the population of Bellevue was estimated to be 545. The town is predominantly white, with around 90% of the population being Caucasian. The median household income is around $35,000.
Bellevue is a small, rural town with a close-knit community. The town is home to several churches, a library, and a museum. The town also has several parks and recreational areas, including a golf course and a swimming pool.
Common Questions
What is Per Capita Income in Bellevue?
Per Capita income in Bellevue is $24,046.
What is the Median Family Income in Bellevue?
Median Family Income in Bellevue is $66,250.
What is the Median Household income in Bellevue?
Median Household Income in Bellevue is $65,662.
What is Income or Wage Gap in Bellevue?
Income or Wage Gap in Bellevue is 46.9%.
Women in Bellevue earn 53.1 cents for every dollar earned by a man.
What is Inequality or Gini Index in Bellevue?
Inequality or Gini Index in Bellevue is 0.34.
What is the Total Population of Bellevue?
Total Population of Bellevue is 426.
What is the Total Male Population of Bellevue?
Total Male Population of Bellevue is 228.
What is the Total Female Population of Bellevue?
Total Female Population of Bellevue is 198.
What is the Ratio of Males per 100 Females in Bellevue?
There are 115.15 Males per 100 Females in Bellevue.
What is the Ratio of Females per 100 Males in Bellevue?
There are 86.84 Females per 100 Males in Bellevue.
What is the Median Population Age in Bellevue?
Median Population Age in Bellevue is 39.1 Years.
What is the Average Family Size in Bellevue
Average Family Size in Bellevue is 3.0 People.
What is the Average Household Size in Bellevue
Average Household Size in Bellevue is 2.9 People.
How Large is the Labor Force in Bellevue?
There are 192 People in the Labor Forcein in Bellevue.
What is the Percentage of People in the Labor Force in Bellevue?
58.5% of People are in the Labor Force in Bellevue.
What is the Unemployment Rate in Bellevue?
Unemployment Rate in Bellevue is 4.2%.